participatory monitoring and evaluation - UoN Repository
320
PARTICIPATORY MONITORING AND EVALUATION PROCESS, SCHOOL ENVIRONMENT AND PERFORMANCE OF LITERACY AND NUMERACY EDUCATIONAL PROGRAMME IN PUBLIC PRIMARY SCHOOLS IN NAIROBI COUNTY, KENYA KARIMI STELLA SILAS Thesis Submitted in Partial Fulfilment of the Requirements for the Award of the Degree of Doctor of Philosophy in Project Planning and Management of the University of Nairobi. 2020
-
Upload
khangminh22 -
Category
Documents
-
view
0 -
download
0
Transcript of participatory monitoring and evaluation - UoN Repository

PARTICIPATORY MONITORING AND EVALUATION
PROCESS, SCHOOL ENVIRONMENT AND
PERFORMANCE OF LITERACY AND NUMERACY
EDUCATIONAL PROGRAMME IN PUBLIC PRIMARY
SCHOOLS IN NAIROBI COUNTY, KENYA
KARIMI STELLA SILAS
Thesis Submitted in Partial Fulfilment of the Requirements for the
Award of the Degree of Doctor of Philosophy in Project Planning and
Management of the University of Nairobi.
2020

ii
DECLARATION
This thesis is my original work and has never been submitted for an academic award in
any other university.
Signature…………………………………. Date………………………………..
Karimi Stella Silas
L83/94291/2014
This thesis has been submitted for examination with our approval as the university
supervisors.
Signature…………………………………. Date………………………………..
Dr. Angelina Sabina Mulwa
School of Open and Distance Learning
University of Nairobi
Signature…………………………………. Date………………………………..
Prof. Dorothy Ndunge Kyalo
School of Open and Distance Learning
University of Nairobi

iii
DEDICATION
This thesis is dedicated to my husband Christopher Njui and our children Emmanuel
Mutwiri and Diana Gacheri for their invaluable support and great desire to see me
through my studies.

iv
ACKNOWLEDGEMENTS
I which to extend my sincere gratitude to all individuals and organizations who have
contributed to this study in one way or another. First and foremost to my supervisors
Dr. Angeline Sabina Mulwa and Professor Dorothy Ndunge Kyalo above all for their
invaluable outstanding and genuine guidance, relentless motivation, wisdom and
expertise.
Secondly University of Nairobi for enrolling and accept me to study in this extinguished
institution and particularly Odel E-Learning Campus on Distance Learning Programme.
The lecturers who took me through the course work and the staff members who have
really supported me in one way or another.
My sincere and special appreciation goes to Professor Charles Mallans Rambo who was
my mentor on this study cycle. I wish to acknowledge Dr Patrick Mburu Kamau from
African Nazarene University who encouraged me on so many ways during this journey
of education and persistence calls to check on me during thesis writing.
Special thanks go to Nairobi County director who gave me information of the public
primary schools, teachers and any other pertinent information related to education
which was required on this study. The ministry of education officers and Nairobi county
government for allowing me to collect data from public primary schools in Nairobi
County. Sub-county education officers also were very important on guiding about the
ongoing projects which made the basis of the study.
All the sampled Head Teachers and Lower Primary School teachers in Grade One to
Three classes who responded appropriately to the questionnaires and for their
invaluable contribution on the responses of quality information regarding the
performance literacy and numeracy educational programme.
Recognition goes to Dr Francis Njagi director of TUSOME project and Dr Dunston
Kwanyumba from Research Triangle International for accepting me to collect data from
their staff and giving me very vital information which I needed to accomplish this study.
Also my gratitude to the three Curriculum Support Officers who accepted me to
interview them and give very concrete information regarding the ongoing and
completed educational projects.

v
More gratitude goes to all research assistants and my data analyst Ephantus Mwangi
Mutitu Amref Health Africa who analyzed data process. He made the data information
to be a reality. Classmates Peter Gathuku and Charles Munyori whom we shared our
struggles and thoughts while critiquing scholarly and academic work.
Finally I am grateful to all members of my family through moral and financial support
their understanding and patience they accorded me during the challenging and
involving time during this study. Am indebted to my husband Christopher Njui Ikunyua
for accepting me to continue with my studies and accepting to finance at this level. His
sacrifice, inspirational encouragement and confidence in me made me to thrive higher
and work hard even when things were too tough.
Countless thanks to my siblings, parents, Silas Nkubua and Grace Nculubi who took
the pain of taking me to school and perpetually motivated and inspired me to rise up to
my full potential in life, though my Dad, father in-law and mother in-law never lived to
see the conclusion of this work. I am most grateful to God for the power, strength and
consecration that has seen me complete this endeavor. The blessings of God are upon
you all.

vi
TABLE OF CONTENT
Page No.
DECLARATION ..................................................................................................... ii
DEDICATION ........................................................................................................ iii
ACKNOWLEDGEMENTS .................................................................................... iv
LIST OF TABLES ................................................................................................. xii
LIST OF FIGURES ............................................................................................... xv
LIST OF ABBREVIATIONS AND ACRONYMS .............................................. xvi
ABTRACT ........................................................................................................... xvii
CHAPTER ONE: INTRODUCTION ..................................................................... 1
1.1 Background of the Study ...................................................................................... 1
1.1.1 Performance of Literacy and Numeracy Educational Programme ................... 9
1.1.2 Participatory Monitoring and Evaluation Process ......................................... 10
1.1.2.1 Stakeholder Engagement. ................................................................. 12
1.1.2.2 Stakeholder Capacity Building. ........................................................ 14
1.1.2.3 Data Collection ................................................................................. 16
1.1.2.4 Data Management............................................................................. 18
1.1.2.5 Implementing Change....................................................................... 19
1.1.3 School Environment ..................................................................................... 20
1.1.4 Performance of Literacy and Numeracy Educational Programme in Kenya .. 22
1.2 Statement of the Problem ................................................................................... 24
1.3 The purpose of the Study ................................................................................... 27
1.4 Objectives of the Study ...................................................................................... 28
1.5 Research Questions ............................................................................................ 28
1.6 Research Hypothesis .......................................................................................... 29
1.7 Significance of the Study ................................................................................... 30
1.8 Delimitation of the Study ................................................................................... 31
1.9 Limitations of the Study ..................................................................................... 32
1.10 Assumptions of the Study ................................................................................ 33
1.11 Definition of Significant Terms Used in the Study ........................................... 34
1.12 Organizational of the Study .............................................................................. 34

vii
CHAPTER TWO: LITERATURE REVIEW ...................................................... 36
2.1 Introduction ....................................................................................................... 36
2.2 Performance of Literacy and Numeracy Educational Programme ....................... 36
2.3 Participatory Monitoring and Evaluation Process ............................................... 49
2.4 Stakeholder Engagement and Performance of Literacy and Numeracy
Educational Programme ..................................................................................... 54
2.5 Stakeholder Capacity Building on Performance of literacy and numeracy
educational programme ...................................................................................... 59
2.6 Data Collection and Performance of Literacy and numeracy educational
programme ........................................................................................................ 63
2.7 Data Management and Performance of Literacy and Numeracy educational
programme ........................................................................................................ 67
2.8 Implementing Change and Performance of Literacy and numeracy educational
programme ........................................................................................................ 72
2.9 Participatory Monitoring and Evaluation Process, School Environment and
Performance of Literacy and Numeracy Educational Programme ....................... 74
2.10 Participatory Monitoring and Evaluation Process and Performance of Literacy
and Numeracy Educational programme ............................................................ 82
2.11 Theoretical Framework .................................................................................... 84
2.11.1 Stakeholder Theory .................................................................................... 85
2.11.2 Theory of Change ...................................................................................... 87
2.11.3 Multiple Literacies Theory (MTL) ............................................................. 89
2.12 Conceptual Framework .................................................................................... 91
2.13 Summary of Literature Review ........................................................................ 94
2.14 Knowledge gaps .............................................................................................. 97
CHAPTER THREE: RESEARCH METHODOLOGY .................................... 104
3.1 Introduction ..................................................................................................... 104
3.2 Research Paradigm .......................................................................................... 104
3.2.1 Research Design ........................................................................................ 105
3.3 Target Population ............................................................................................ 106
3.4 Sample Size and Sampling Procedure .............................................................. 107
3.4.1 Sample Size ............................................................................................... 107
3.4.2 Sampling Procedure ................................................................................... 108
3.5 Research Instruments ....................................................................................... 110

viii
3.5.1 Questionnaires for Head teachers and for Grade 1-3 Teachers .................... 110
3.5.2 Interview Guide for Curriculum Support Officers and Research Triangle
Officers ................................................................................................... 111
3.5.3 Pilot Testing of Research Instruments ........................................................ 112
3.5.4 Validity of the Research Instruments .......................................................... 113
3.5.5 Reliability of the Research Instruments ...................................................... 114
3.6 Data Collection Procedure ............................................................................... 117
3.7 Data Analysis Techniques ................................................................................ 118
3.7.1 Descriptive Statistics .................................................................................. 118
3.7.2 Inferential statistics .................................................................................... 119
3.7.3 Summary of Test of Hypothesis ................................................................. 125
3.8 Ethical Consideration ....................................................................................... 129
3.9 Operationalization of the Variables .................................................................. 129
CHAPTER FOUR: DATA ANALYSIS, PRESENTATION,
INTERPRETATION AND DISCUSSION .................................................. 134
4.1 Introduction ..................................................................................................... 134
4.2 Questionnaire Response Rate ........................................................................... 134
4.3 Background Information of Respondents ......................................................... 135
4.4 Basic Tests for Statistical Assumptions ............................................................ 141
4.4.1 Normality Tests ......................................................................................... 142
4.4.2 Test of linearity .......................................................................................... 145
4.4.3 Tests for Multicollinearity .......................................................................... 146
4.4.4 Homoscedasticity Test ............................................................................... 147
4.5 Performance of Literacy and Numeracy Educational Programme ..................... 148
4.6 Stakeholders engagement and Performance of Literacy and Numeracy
Educational ...................................................................................................... 157
4.6.1. Inferential analysis of Stakeholder’s Engagement and Performance of
Literacy and Numeracy Educational Programme ..................................... 165
4.6.2 Regression Analysis of Stakeholder Engagement and Performance of
Literacy and Numeracy Educational Programme ........................................... 166
4.6.3 Test of hypothesis 1 ................................................................................... 166
4.7 Stakeholders’ Capacity Building and Performance of Literacy and Numeracy
Educational Programme ................................................................................... 169

ix
4.7.1 Inferential Analysis of stakeholder capacity building of key stakeholders in
the programme ........................................................................................ 176
4.7.2 Correlation analyis of Stakeholder’s Capacity Building and Performance
of Literacy and Numeracy Educational Programme ................................... 177
4.7.3 Regression Analysis of Stakeholder’s Capacity Building and Performance
of Literacy and Numeracy and Educational Programme ............................. 178
4.7.4 Test for hypothesis 2 .................................................................................. 178
4.8 Data Collection and Performance of Literacy and Numeracy Educational
Programme ...................................................................................................... 181
4.8.1 Inferential Analysis of stakeholder capacity building of key stakeholders
in the programme .................................................................................... 187
4.8.2 Correlation analysis of Data collection and Performance of Literacy and
Numeracy Educational Programme ............................................................ 188
4.8.3 Regression Analysis for Data Collection and Performance of Literacy and
Numeracy Educational Programme ............................................................ 188
4.8.4 Test of Hypothesis 3 ..................................................................................... 189
4.9 Data Management and Performance of literacy and numeracy educational
programme ..................................................................................................... 192
4.9.1 Inferential Analysis of Data Management and Performance of Literacy and
Numeracy Educational Programme ......................................................... 201
4.9.2 Correlation analysis of Data Management and Performance of Literacy and
Numeracy Educational Programme ............................................................ 201
4.9.3 Regression Analysis for Data Management and Performance of Literacy
and Numeracy Educational Programme ...................................................... 202
4.9.4 Test of Hypothesis 4 ..................................................................................... 202
4.10 Implementing Change and Performance of literacy and numeracy
educational programme .................................................................................. 205
4.10.1 Inferential Analysis of Implementing Change and Performance of Literacy
and Numeracy Educational Programme ................................................... 215
4.10.2 Correlation analysis of Implementing Change for Monitoring and
Evaluation and Performance of Literacy and Numeracy Educational
Programme.............................................................................................. 216
4.10.3 Regression Analysis for Implementing Change and Performance of
Literacy and Numeracy Educational Programme ...................................... 216

x
4.11 Combined Participatory Monitoring and Evaluation Process and Performance
of Literacy and Numeracy Educational Programme ........................................ 220
4.11.1 Inferential Analysis of Combined Participatory Monitoring and Evaluation
Process, and Performance of Literacy and Numeracy Educational
Programme.............................................................................................. 222
4.11.2 Correlation Analysis for Combined Participatory Monitoring and Evaluation
Process and Performance of Literacy and Numeracy Educational
Programme.............................................................................................. 223
4.11.3 Regression Analysis for Combined Participatory Monitoring and Evaluation
Process, and Performance of Literacy and Numeracy Educational
Programme.............................................................................................. 224
4.11.4 Test of Hypothesis 6 ................................................................................... 224
4.12 Correlation Analysis for Combined Participatory Monitoring and Evaluation
Process and Performance of Literacy and Numeracy Educational
Programme.............................................................................................. 225
4.13 Moderating Influence of School Environment on the relationship between
Participatory Monitoring and Evaluation Process and Performance of Literacy
and Numeracy Educational Programme ........................................................ 228
4.13.1 Inferential Analysis of Moderating Influence of School Environment on
the Relationship between Participatory Monitoring and Evaluation
Process, and Performance of Literacy and Numeracy Educational
Programme.............................................................................................. 235
4.13.2 Correlational Analysis for School Environment and Performance of
Literacy and Numeracy Educational Programme ..................................... 236
4.13.3 Regression Analysis for moderating influence of School Environment on
the Relationship between Participatory Monitoring and Evaluation Process,
and Performance of Literacy and Numeracy Educational Programme ....... 236
4.13.4 Test of Hypothesis 7 ................................................................................... 237
CHAPTER FIVE: SUMMARY OF FINDINGS, CONCLUSIONS, AND
RECOMMENDATIONS ............................................................................. 246
5.1 Introduction ..................................................................................................... 246
5.2 Summary of Findings ....................................................................................... 246
5.2.1 Stakeholder Engagement and Performance of Literacy and Numeracy
Educational Programme .......................................................................... 246

xi
5.2.2 Stakeholder Capacity and Performance of Literacy and Numeracy
Educational Programme .......................................................................... 247
5.2.3 Data Collection and Performance of Literacy and Numeracy Educational
Programme.............................................................................................. 247
5.2.4 Data Management and Performance of Literacy and Numeracy Educational
Programme.............................................................................................. 248
5.2.5 Implementing Change and Performance of Literacy and Numeracy
Educational Programme .......................................................................... 248
5.2.6 Combined Participatory Monitoring and Evaluation Process, and
Performance of Literacy and Numeracy Educational Programme ............ 249
5.2.7 School Environment, Participatory Monitoring and Evaluation Process, and
performance of Literacy and Numeracy Educational Programme
Performance of Literacy and Numeracy Educational Programme ............ 250
5.3 Conclusions ..................................................................................................... 250
5.4 Contribution of the Study to the Body of Knowledge ....................................... 252
5.5 Recommendations............................................................................................ 253
5.5.1 Recommendations for Policy makers ......................................................... 253
5.5.2 Recommendations for Practice ................................................................... 253
5.6 Suggestions for Further Research ..................................................................... 254
REFERENCE ...................................................................................................... 255
APPENDICES ..................................................................................................... 288
Appendix I: Questionnaire for Head-Teachers and lower Primary School Teachers 288
Appendix II: Interview Guide for CSO’S and RTI International Officers ............... 297
Appendix III: Research Authorization from the Ministry Of Education .................. 301
Appendix IV: Research Authorization from NACOSTI ......................................... 302
Appendix V: Research Permit ................................................................................ 303
Appendix III Research Authorization from the Ministry of Education ................... 278
Appendix III: Research Authorization from Nacosti .............................................. 280
Appendix V: Research Permit ............................................................................... 281

xii
LIST OF TABLES
Table 2.1: Knowledge Gaps ..................................................................................... 98
Table 3.1: Target Population .................................................................................. 107
Table 3.2: Sample Size .......................................................................................... 108
Table 3.3: Sampling Procedure .............................................................................. 109
Table 3.4: Results for Reliability Test of the Study ................................................ 117
Table 3.5: Summary of Statistical Test of Hypothesis ............................................ 126
Table 3.6: Operationalization of Variables ............................................................. 130
Table 4.1: Questionnaire Return Rate .................................................................... 135
Table 4.2: Distribution of Respondents by Gender ................................................. 136
Table 4.3: Distribution of Respondents by key Stakeholders in the programme...... 137
Table 4.4: Distribution of Respondents by Age brackets ........................................ 139
Table 4.5: Distribution of Respondents by Highest Academic qualification ........... 140
Table 4.6: Distribution of Respondents by Work Duration ..................................... 141
Table 4.7 Results of Kolmogorov Smirnov and Shapiro Wilk Tests ....................... 143
Table 4.8: Test for linearity ................................................................................... 146
Table 4.9: Test for Collinearity .............................................................................. 147
Table 4.10: Correlation Matrix for Independent Variables ..................................... 148
Table 4.11: Performance of Literacy and Numeracy Educational Programme ........ 149
Table 4.12: Stakeholders Engagement and Performance of Literacy and Numeracy
Educational programme ...................................................................... 158
Table: 4.13: Correlations between Stakeholder’s engagements and Performance of
Literacy and Numeracy Educational Programme ................................. 165
Table 4.14: ANOVA for Stakeholder Engagement and Performance of Literacy
and Numeracy Educational Programme .............................................. 167
Table 4.15: Model Summary for Stakeholder’s Engagement and Performance of
Literacy and Numeracy Programme .................................................... 167
Table 4.16: Model Coefficients for Stakeholder’s Engagement and Performance of
Literacy and Numeracy Educational Programme ................................. 168
Table 4.17: Stakeholders’ Capacity Building and Performance of Literacy and
Numeracy Educational Programme ..................................................... 170
Table 4.18: Correlation between Stakeholder Capacity Building and Performance
of Literacy and Numeracy Educational Programme ............................ 177

xiii
Table 4.19: ANOVA for Stakeholder’s Capacity Building and Performance of
Literacy and Numeracy and Educational Programme .......................... 178
Table 4.20: Model Summary for Stakeholder’s Capacity Building and Performance
of Literacy and Numeracy Educational Program ................................. 179
Table 4.21: Model Coefficients for Stakeholder Capacity Building and Performance
of Literacy and Numeracy Educational Programme ............................ 179
Table 4.22 ..... : Data collection and Performance of literacy and numeracy educational
programme ............................................................................................ 182
Table 4.23: Correlation Analysis for Data Collection and Performance of Literacy
and Numeracy Educational Programme ................................................ 188
Table 4.24: ANOVA for Data Collection and Performance of Literacy and
Numeracy Educational Programme ...................................................... 189
Table 4.25: Model summary for Data Collection and Performance of Literacy and
Numeracy Educational Programme ...................................................... 190
Table 4.26: Model Coefficients for Data Collection and Performance of Literacy
and Numeracy Educational Programme ................................................ 190
Table 4.27: Data Management and performance of literacy and numeracy
Educational programme........................................................................ 193
Table 4.28: Correlation Analysis for Data Management and Performance of
Literacy and Numeracy Educational Programme ................................. 202
Table 4.29: ANOVA for Data Management and Performance of Literacy and
Numeracy Educational Programme ...................................................... 203
Table 4.30: Model Summary for Data Management and Performance of Literacy
and Numeracy Educational Programme .............................................. 203
Table 4.31: Model Summary for Data Management, and Performance of Literacy
and Numeracy Educational Programme .............................................. 204
Table 4.32 206Implementing change and Performance of Literacy and Numeracy
Educational Programme ...................................................................... 206
Table 4.33: Correlation analysis of Implementing Change and Performance of
Literacy and Numeracy Educational Programme .................................. 216
Table 4.34: ANOVA for implementing change and performance of literacy and
numeracy educational programme ........................................................ 217
Table 4.35: Model Summary for Implementing Change and Performance of Literacy
and Numeracy Educational Programme ................................................ 218

xiv
Table 4.36: Model Coefficients for Implementing Change and Performance of
Literacy and Numeracy Educational Programme .................................. 218
Table 4.37: Combined Participatory Monitoring and Evaluation Process and
Performance of Literacy and Numeracy Educational Programme ......... 221
Table 4.38: Correlation matrix of Combined Participatory Monitoring and Evaluation
Process and Performance of Literacy and Numeracy Educational
Programme ........................................................................................... 223
Table 4.39: ANOVA for Combined Participatory M&E Process and Performance
of Literacy and Numeracy Programme ................................................ 225
Table 4.40: Model Summary for Combined Participatory M&E Process and
Performance of Literacy and Numeracy Programme .......................... 225
Table 4.41: Model Coefficients Combined Participatory M&E Process and
Performance of Literacy and Numeracy Programme ........................... 226
Table 4.42: Moderating Influence of School environment on the relationship
between Participatory Monitoring and Evaluation Process and
Performance of Literacy and Numeracy Educational Programme ........ 229
Table 4.43: Correlation matrix for school environment and performance Numeracy
and Literacy Educational Programme ................................................ 236
Table 4.44: Model Summary for Moderating Influence of School Environment on
the Relationship between Participatory M&E Process and Performance
of Literacy and Numeracy Educational Programme ............................ 238
Table 4.45: ANOVA Model Summary for Moderating Influence of School
Environment on the Relationship between Participatory M&E Process
and Performance of Literacy and Numeracy Educational Programme . 239
Table 4.46: Model Coefficients for Moderating Influence of School Environment
on the Relationship between Participatory M&E Process and
Performance of Literacy and Numeracy Educational Programme ........ 240
Table 4.47: Summary of Results of Test of Hypothesis .......................................... 243
Table 5.1: Summary of contribution to the body of knowledge .............................. 252

xv
LIST OF FIGURES
Figure 1: Conceptual frame work of participatory of monitoring and evaluation
process, school environment and performance of literacy and numeracy
educational programme ............................................................................. 92
Figure 2: Conceptual and Statistical Models for Simple Moderation ...................... 121
Figure 3: Normal PP plot for Performance of literacy and numeracy educational
programme .............................................................................................. 144
Figure 4: Scatter plot ............................................................................................. 145

xvi
LIST OF ABBREVIATIONS AND ACRONYMS
BOM Board of Management
CSO Curriculum Support Officer
EdData 11 Education Data for Decision Making
EGMA Early Grading Mathematics Assessment
EGRA Early Grade Reading Assessment
KNEC Kenya National Examination Council
M&E Monitoring and Evaluation
PM&E Participatory monitoring and evaluation
MoEST Ministry of Education Science and Technology
NGOS Non- Government Organizations
PM&EP Participatory Monitoring and Evaluation Process
PRIEDE Primary Educational Developments Projects
PRIMR Primary Math and Reading Initiative
RTI Research Triangle Institute
SPSS Statistical Package for the Social Sciences
SSME Snap Shot of School Management Effectiveness
TUSOME Tusome Means Reading in Kiswahili
UNESCO United National Educational Scientific and Cultural Organization
UWEZO Ability, Capability, Power
SMART Specific, Measurable, Achievable, Realist and Timely
UNICEF United Nations International Children’s Emergency Fund
DFID Department for International Development

xvii
ABTRACT Education is an important element in human right, which helps in acquiring knowledge, and skills in developing
a person in holistic and integrated way. Kenya has a detailed way of selecting intervention educational projects
even though there is still questionable performance of these projects due to low learner’s academic performance.
Despite much efforts put by key stakeholders in education to improve learner’s outcomes little has been
achieved. This is through allocating enough finances so as to improve school facilities, ease access to education,
professional teachers and providing learning materials still students’ learning skill performance is low. The
purpose of the study is to establish the extent to which participatory Monitoring and Evaluation process, school
environment influence the performance of L&N educational programme in public primary schools in Nairobi
County, Kenya. The objectives were: to establish the extent to which stakeholders engagement influence the
performance of L&N educational programme; to determine how stakeholders capacity building influence
performance of L&N educational programme; to examine how data collection influence performance of L&N
educational programme; to determine the extent to which data management influence performance of Literacy
and numeracy educational programme; to assess how implementing change influence performance of Literacy
and numeracy educational programme; to establish how combined PM&E process influence performance of
Literacy and numeracy educational programme; to assess the moderating influence of school environment on
the relationships between Participatory Monitoring and Evaluation process and performance of Literacy and
numeracy educational programme in public primary schools in Nairobi county, Kenya. There were seven
hypotheses which were tested. The study was anchored on pragmatism paradigm. Descriptive research survey
design and correlation research designs were used in this study. Pilot study was carried out in Kiambu County
and the tool was found to be reliable and valid as verified by the supervisors and monitoring and evaluation
experts. Further, simple random sampling and purposive sampling technique was adopted for selection of the
participants in the study. A sample size of 335 was drawn from a target population of 2053. Hence, 281
questionnaires were returned represented by 86% of the total sample size. Questionnaires were used to collect
data from 33 head teachers and 291 grade one to three teachers. Interviews guide were administered to 3
Curriculum Support Officers and 5 Research Triangle Officers. Data was analyzed and presented in tables,
frequencies, arithmetic means, and standard deviation and overall composite mean was generated. Data analysis
techniques, descriptive statistical and inferential statistics were used in the study. Regression analysis were
performed at 5% level of significance. The null hypotheses were all rejected as per the following results: first
hypothesis, R2 = 0.480, β= 0.497, t=16.061, p=0.000<0.05; second hypothesis, R2 = 0.456, β= 0.490, t=15.280,
p=0.000<0.05; third hypothesis, R2 = 0.434, β= -0.137, t=14.689, p=0.000<0.05; fourth hypothesis, R2 = 0.288,
β=0.408, t=10.616, p=0.000<0.05, fifth hypothesis, R2 = 0.337, β=0.445, t=11.917, p=0.000<0.05;sixth
hypothesis, R2 = 0.568, F=71.453, p=0.000<0.05; finally, for the seventh hypothesis results for F-value showed
that statistical significance at {F (6,269) = 43.481, p=0.000<0.05}. In conclusion the study established that
improvement of literacy and numeracy skills wholly depends on involvement of all the stakeholders in
education sector, well-structured polices, capacity building, implementing change and conducive school
environment for better performance. It was established that, although literacy and numeracy skills are pertinent
to schools, teachers were a bit reluctant in embracing the new technology in delivering the content and opted
the traditional way of teacher centered methodology. However the pupil’s attitude in embracing the new
textbooks had s significant influence on the performance learnt skills. The study recommends that new policies
governing the implementation of the programme by the schools and other implementing partners should
consider mainstreaming participatory Monitoring and Evaluation process in order to acquire good results. The
schools, Research Triangle Institute International, Curriculum Support Officers and all other players in literacy
and numeracy educational programme in public primary schools in Nairobi County should review their
Monitoring and Evaluation practices based on the study findings that there are no proper trainings for M&E on
teachers and other stakeholders. The study is significant since it adds value to project management body of
knowledge by giving informative information on policy makers, curriculum developers, projects implementers
and monitoring and evaluation processes to review their monitoring and evaluation practices while involve all
the stakeholders in programme implementation. It is evident that participatory monitoring and evaluation
process is still weak within education sector but it can be realized fully through proper supervision which can
lead to an increase in performance of literacy and numeracy educational programme. There is need to improve
supervision and implementation of educational intervention projects especially literacy and numeracy. The
study recommends for other researchers to carry out the same study in other counties and also in private primary
schools.

1
CHAPTER ONE
INTRODUCTION
1.1 Background of the Study
Participatory M&E process has several steps in learning which guides in bringing
change to the desired outcomes in every learning institutions. In connection to
education is an important aspect to every human being and a right which needs to be
observed keenly. Education is a primary driver of sustainable growth UNESCO (2018)
though this can be made a reality if a predictive relationship between numeracy and
literacy skills in academic is clear and learners are able to get the learning concepts
well. In this case it means that for developing countries to achieve this goal intervention
programme must be implemented in a cohesive and integrated and synergistic manner
focusing interventions identified (Crouch and Destefano, 2017). This will enhance
improving classroom teaching, assessments on learner’s activities and address critical
elements in literacy and numeracy skills (Kim, Boyle, Zuilkowski and Nakamura,
2016).
Education helps in promoting accession of understanding, skillfulness, and a holistic
turn of events to an individual which helps one to acquire good morals and manners.
Education is also recognized as single drivers of growth and social evolution aspects.
Despite so much efforts made by key stakeholders in education, performance is still
low and specifically on literacy and numeracy which is the backbone of basic education.
Much resources like finances, human services and other materials have been put in
place to improve school infrastructure so as to assure that the child has friendly schools
environment in order to improve in there learning skills (Freudenberg and Davis 2017).
There are educators who exist having been coached on how to instruct learners in
schools and students have been able to access schools but the trend on students’
performance is still low and requires instant observation (Mulongo, 2013; Ohanyido,
2012).
Quality education needs potential collaborative practices from key education
stakeholders in order for any improvement to be experienced. Much emphasizes has
been put to every individual involved in learning process so as to acquire the desired
learning skills. International education literature highlights that there are desirability of

2
participation in implementing collaboration-based processes in the community
development which has proved to have very little success in trying to meet the required
standards (Conn 2017; McEwan, 2015; Murnane and Willett 2011). Also the combined
re-arrangement in teaching fraternity according to constitution of Kenya 2010 in trying
to meet the global competition in getting quality education that is sustainable for
development of holistic individual (Ministry of Education, 2013). In conjunction of
meeting the aim of achieving the set goals of making Kenya an industrialization country
by 2030. Although this can’t happen if there are precedents resources transferred to
schools which are undertaking primary education programme .this cannot work well in
over populated classrooms thus affecting teacher-pupil ratio and then compromising
the achievement of quality education (Kibukho and Jempkemei, 2015). This can only
be a reality if all the stakeholders are involved in the learning systems.
Stakeholder collaboration and involvement in trying to define, implement, checking the
measurement tools which are used in monitoring and evaluating projects is very vital.
There is an increase in the likelihood of policy formulation that are effectual in
gathering essentials information from various funders, community and beneficiaries of
the projects. In this case the stakeholders have fewer and intended sustainable goals to
be achieved as posited by (Galza 2005). Participatory approaches are in concurrence
with the democratic principles that the top-down movement of partnership models of
international development should be agreed upon for any benefits to occur and
improvement outcomes to be realized (Fullan 2016; Elmore, 2016) Education is
recognized as drivers of profitable and social national growth whereby primary
education lays foundation of individuals and helps one to get courage and confidence
in expressing themselves.
Globally, the development of pupils basic skills as contained in national curricula have
not been achieved, since 40 percent of primary school learners cannot comprehend
English word well as found by (Provost, 2014; Ohanyido, 2012; World Bank, 2003;
Colclough Al-Samarrai, Rose and Tembon, 2003). According to UNESCO (2014), an
estimated 250 million students are not able to understand simple arithmetic calculations
and reading simple words of their grades in both languages Kiswahili and English.
Further, UNESCO, (2014) points out that, many students are frequently a number of

3
classes behind the designed syllabus and they struggle interpreting Literacy and
Numeracy skills taught.
According to Global Campaign for Education (GCE, 2015), the problem could be worse
even in other classes but low little is done to curb the menace. The GCE, United States
Chapter points out that the full scale of the learning crisis is most likely under-estimated
since access to education is only part of what counts, yet what is learnt is not important
(GCE, 2015). Similarly UNESCO and UNICEF (2013) supports the GCE and
emphasize that what works for pupils enrolled in schools is more important than gaining
access to school and acquiring the right concepts. Therefore, efforts by the Global
Partnership Education (GPE) objective 3 focuses on increasing quantity of students in
schools may remain a myth. Mastery of contents taught on L&N skills in class 1to 3
may remain an illusion if gaps identified are not curbed (UNESCO, 2014). Built on this
circumstances, this study consequently focused on stakeholder engagement and
stakeholder capacity building and performance of L&N educational programme where
involvement of every stakeholder is key in learning situations.
Africa being on the line of working for education progress has continued to measure
the progress of continued facilitation and participation of key educationist, who are
more efficient with teaching methodologies to better learners’ production as put by
(Grosser, 2007). A similar result was confirmed by Sanyal (2013) who focused on
how Africa has been able to formulate good policies governing education. Therefore
trained professional teachers, sufficient resource supply for learning purposes and
proper learning structures in enhancing proper learning skills has been not left out in
the process of improving learning outcomes. Thus necessities for improving quality of
continuing education standards, advancement attempts have been done although
learning outcomes are still very low in sub-saharani region.
In Africa, Education participation is remarkably experienced in taking part towards the
extension and development of citizen’s economies. Many countries like Ethiopia,
Zambia, Tanzania, Uganda and Kenya are among other countries involved in literacy
and numeracy assessment programme to a large extent. These programme were
conducted by the funding agencies using data collected through EGRA tool. The
findings triggered the need for intervention programme started by USAID and DFID

4
under an organization named as Research Training Institute International (RTI
international 2014) which became the main funding agent to twenty five countries.
In Lesotho sharing of examination results is done by government but if teachers are not
involved in proper teaching of literacy low performance is experienced as was observed
by Tracy (2016) on sharing the looking glass: examination action research with early
literacy teachers in Lesotho. This is experienced in Botswana as argued by Mogapi
(2016) on examination negative wash back effects affecting curriculum presentations
are challenging and hinder successful implementation of curriculum hence poor
performance of end of year exams. One major challenge to literacy at Mountain
Kingdom Primary School was lack of literacy instructional materials in the learners’
native language, Sesotho and second language and English. This led to Literacy
instruction failure in addressing early literacy skills that are important to developing
reading early grades.
Mmasa (2016) in exploring teaching of learners in classroom set up, found that learning
was affected due to late enrolment of learners to schools, lack of learning materials and
teachers among many other problems. The same case applies to all developing countries
and learning of Phonological recognition, word identification, interactive reading
articulacy in writing were not spared either due to inadequacy of the instructional
materials. Methodology practices focused on teacher centered, instead of learner
centered learning hence led to low student engagement within the lessons and low
performance of results experienced. More emphasis on the same by (Dubcek and Gove
2015; Pretorius 2015; Sailors and Flores, 2014) showed that the learners had fewer
opportunities to advance high ranking of thinking skills and apply literacy to develop
reading and writing skills. From classroom observations and teacher interviews, several
important supports were identified that could be leveraged to improve instruction. First,
the teachers and learners valued literacy and felt need to better their skills and become
literate. Teachers are committed to academic achievement and are of the idea of
improving the learners’ literacy methodology of how to instruct the learners during
learning but did not have access to these instructional materials. Dubcek and Gove
2015; Pretorius 2015; Sailors and Flores, (2014) in their studies they have failed to
explain how literacy and numeracy skills is a problem in their Country. However there
is a positive attitude of wanting to learn but there are no resources. The study found out

5
that in Kenya, resources are also inadequate according to Curriculum Support Officers
and lower primary school teachers differed with the head teachers on the opinion that
there are enough materials.
On this view head teachers are fearing to be held accountable on the funds distributed
to schools and also three text books provided by RTI International, though not all
schools had the same feeling. Some have enough three text books but never used in the
classroom, they are kept in the cupboards. Many teachers responded that the concept
used in the books were hard for them to initialize so they kept the books and used the
old methods of teaching. For those who embraced the new concepts their learners had
improved drastically. Improvement on both languages Kiswahili and English had
greatly increased meeting the benchmark of 34-50% for English and 37-66% for
Kiswahili meaning there was a significant impact as determined by previous studies (
Piper and Zuilkowski 2015; Freudenberger and Davis 2017).
However some empirical study show that several education programme have brought
some encouraging results and slight improvement on early L&N end results. However
in underdeveloped nations, programme intervention plans have not resulted in better
ways since the methods used in evaluating and monitoring these programme have yield
little improvement on literacy and numeracy outcomes as argued by (Piper and
Zuilkowski, 2015). They continue to argue that identification of who is involved in the
projects and how and when remains a mystery. Policy makers experience inadequate
evidence as to how the programme should be implemented by teachers who are
professionals and have knowledge on the content to be implemented without
interference.
Hinnant-Crwaford (2016) on how teachers view themselves as educationists and policy
actors in constructing the instruments that measures their beliefs in advocating changes
in education policies asserts that. Overall teachers lack confident and ability to belief
that they are the implementers of change and not creators of education policy.
Trainings of teachers on new methodologies, learner’s resources allocations, and
technological information is required for the programme performance to be
experienced. Wanger (2012) posits that learning of literacy and numeracy skills in basic
education have been a thorn on the flesh for so many years and so something needs to

6
be done immediately. The study revealed that impact of literacy and numeracy
education programme are inadequately researched on hence need for more investigation
to help the policy makers in making proper planning on the activities of M&E. A study
conducted by UWEZO (2012) titled ‘Are our children learning’ in schools. They found
out that lack of mechanism to monitor progress have contributed to poor performance
of literacy and numeracy educational programme.
Hafner, Chik, and Jones (2015) on digital literacies and language learning as also been
an issue on learning literacy, in that exams done nationally does not factor in the digital
aspect leaving the teachers with no option but to think that digital learning is just an
add but not inclusive to the curriculum. Pronounced weak leadership in institutions and
poor instructional methodology used to deliver content in the classroom as posited
(Kiarie & Mugo, 2017). The role played by teachers in lower grades is significant in
promoting language and arithmetic skills mandatory to every person in order to handle
day to day activities in life.
Kenya has been on the lookout of how to improve literacy and numeracy skills in basic
education on lower grades. This has been made a reality by Programme undertaken by
different non-governmental organizations like CEMASTEA (Centre for Mathematics,
Science and Technology Education in Africa) and JICA, (Japan International
Cooperation Agency) who have really contributed to the wellbeing of education
intervention programme. Perusal to acquire knowledge in the programme being
executed at Ag Khan Foundation financed by the United States agency for international
development (USAID) and finally William and Flora Hewlett Foundation among many
organizations in the country have greatly been of help to the government. This
contributed to establishing displeasure according to end results of EGMA 2009 Early
Grade Mathematics Assessment (EGMA) in Malindi district by (Reuben and Kline
2009) and (MOEST) who joined hand in hand with USAID in assisting educators to
achieve good standards methodologies in teaching mathematics. Languages like
Kiswahili and English were not left out since they helped in communicating adequately.
Primary Math and Reading (PRIMR) were executed in seven Counties in the country
in 2011-2014 by USAID and UK Department for International Development (DFID) in
year 2012-2015. Their main objectives were to supply learners with learning materials

7
and teachers guides, while also taking them through trainings on the new instructional
materials.
Proper learning of languages and simple arithmetic in lower grade helps one be able to
conceptualize ideas according to (Glennerster, Kremer, Mbiti and Tvakavarasha,
2011).Kenya has a long history of many non-governmental organizations carrying out
piloting programme to intervene for education through the government to make sure
that they have citizens who are literate and can be able to express themselves.
Organizations focusing on educational projects and especially literacy and numeracy
have really been in increase lately, trying to intervene and assist where possible to make
necessary changes in all the sectors and education is one of the beneficiaries of these
projects. Recent developments have been depicted by many challenges encountered by
teachers and learners in lower primary school.
Grades one to three in public primary schools have been mostly hit by the challenges
Since the start of free primary schooling and many changes in curriculum programme
introduced in the country according to the assessment done by (Mulongo 2014).This
assessment was done on learners so as to measure quality education. One of these
organizations is TUSOME national programme which is funded by USAID, and a state-
level ascending up of foregoing Literacy and Numeracy programme to help in
formulating functional, simple mechanisms to track progress and give feedback of
performance against benchmark expectations. Learning institutions should swift away
from bureaucratic administration towards the development of managing relationships
that are coherent for learning instead of being rigid ( Pritchett 2015)
In Kenya the results for national examinations shows that some learners had low
learning outcomes according to the education planning documents GoK, (2010), with
low performance in learning skills in English and Kiswahili. This blame is believed to
have been attributed to low motivation in reading and arithmetic’s competences as
posited by GoK (2010) in their reports of what is happening in schools. This has led to
literacy and numeracy educational programme to be undertaken as the national
government intervention programme. Further, much effort has been put, but still
Kenya’s willingness to change education reform and attain the expected good
performance of Education for All (EFA) is lacking. prioritizing in ensuring that

8
governance and accountability in schools is observed, teachers empowerment to enable
them manage learners character and teachers’ capability is required to enhance
stakeholder capacity building, data collection and managing it in implementing change
where necessary so as improve performance of literacy and numeracy educational
programme (MOEST, 2015).
Kenya’s basic education has really been affected by many changes in the reforms of
education and many issues have been left out hence low performance in schools
(MOEST, 2015). Understaffing of teachers and resources allocations have hindered
progress in basic education in line with education policies which is fundamental human
right that obliges each youngster to access school and achieve quality education. In this
case it should help the Kenyan government to achieve what is intended in Vision 2030
in making sure that all the teachers receive the basic trainings so as to be acquainted
with the industrialization of community development of the country by 2030 (MoDP).
Nevertheless, Kenya National Examinations Council possess proof that displays
substandard pupils’ performance in secondary schools in final exams KNEC (2012),
which are consequences of substandard reading skills in bottom classes which is the
foundation of every subject in learning fraternity. The implementing NGO of literacy
education programme is TUSOME in conjunction with national government. The
objectives of TUSOME are to improve teacher’s capacity for effective delivery of the
curriculum and enhance access to appropriate textbooks and supplementary material,
provide enough staff to train on instructional supervision and have a successful M&E
systems. They also need to enhance capacity within departments in education to
sustainably improve literacy and numeracy outcomes in collaboration with partners.
Enhancement of ICT to support literacy and numeracy learning skills through teachers,
curriculum support officers, head teachers and all the stakeholders who are involved
in teaching fraternity.
Literacy and numeracy education programme are composed of several projects namely
EGRA (early grade reading assessment) which were tried in a few chosen a few public
primary schools in some selected counties in 2007-2009.The base-line and mid-line
report gave good results hence conception of PRIEDE (Primary Educational
Developments Projects), PRIMMR (Primary Math and Reading Initiative) and then
EGMA (early grade mathematics assessment). All these programme have been under

9
way but still a lot remains to be done since literacy and numeracy in the country remains
a menace in the lower grades (Piper and Zuilkowski, 2015).
1.1.1 Performance of Literacy and Numeracy Educational Programme
Performance of projects have been operationalized in different ways by different
authorities among them Kerzner (2003) who argued that project performance has to be
completed within planned time, specified level of performance, planned budget and
corporate culture. Performance in education can only be a reality if all the stakeholders
are involved in the project. These stakeholders are either involved directly or indirectly
in education system as argued by (Adebayo, 2013and Kufi, 2013). To achieve good
quality performance in education teachers are key stakeholders in producing quality
grades and ensuring effective teaching as was as well as meeting the market demands
of literate citizens examined by (Munirul, 2015; Thangeda, Baratiseng and Mompaty,
2016).
The main aim of literacy and numeracy educational programme was to meet the
specified indicators in trying to improve the literacy and numeracy skills. The
intervention programme needs funding and timeframe to be able to accomplish its goal.
So it was on this reference that performance of literacy and numeracy educational
programme in grade one, two and three learners were selected. Performance in this
case is reading learning skills. Simple arithmetic, letter recognition, beneficiaries’
satisfaction, proficiency skills in writing, listening and speaking and finally timely
acquisition of Literacy and Numeracy skills were also a major concern for this study.
All these indicators were to be acquired if the programme was to be completed within
the specified time, continued funding to enable trainings for the teachers to improve the
reading and arithmetic skills (Piper and Mugenda, 2012). In view of government
officers attention and time are sparse and competing with demands that statistically
significant making it impossible to achieve the desired results in this learning skills as
posited by (Gove et al 2017; piper et al 2018)
Worldwide, organizations are striving to put in place systems that are aimed at
improving project performance in sub-saharan Africa since literacy rates remain low
(UNESO, 2012). Performance of literacy and numeracy programme have been of major
concern in the world and specifically in Kenya where there is an outcry of mass failures

10
at end of national exams in primary and secondary levels due to language issues among
many others. Numerous projects have been initiated, majority of them focusing on pilot
studies and then later being implemented. After completion of these projects some are
never sustained according to (Wasanga, Ogle and Wambua, 2011). Failure of
sustainability of the projects is could be contributed to lack of proper supervision and
continued funding from the funders hence becoming difficulty to continue with the
projects.
Globally initiatives like result participatory monitoring and evaluation process,
increases customer awareness, guest for satisfaction, accountable leadership have
transformed the project management environment (Piper and Zuilkowski, 2015).
Literacy is being able to listen attentively, reading and communicating comfortably,
being able to write what one has understood and speak courageously and in comfortable
manner without fear. This allows effective communication and making sense to a
variety of words hence improvement on reading fluency. It is a unitary process with
two complementary aspects reading, writing and expanding ones knowledge in order
to develop ones thinking and learning for the purpose of understanding oneself and the
world. Numeracy is being able to read, reason and do simplest arithmetic’s concepts
like comprehending facts on mathematics like putting together, takeaway or minus,
repeated addition and sharing of items in division work. Numeracy compliments
reading which is also called mathematical literacy and they complement one another in
order to function entirely in the current situation in emerging changes in the world (Jodi
and Martinez, 2013). Performance of L&N education programme wholly rests at the
key stakeholders involved in education sector.
1.1.2 Participatory Monitoring and Evaluation Process
Participatory M&E is a procedure which shareholders are engaged in different levels
either evaluating or monitoring a programme, project, policy or contribute content of
results acquired during the process and identifying the corrective actions to be taken in
the programme (Hilhorst and Guijt, 2006).Evaluation is judging, determining and
appraising the worth of a programme (Beatrice, Allan and Emily, 2015). In education
evaluation is concerned on determining worthiness of teaching and learning process in
a participatory manner (Sim, 2014). PM&E focuses on tracking and giving feedback,

11
strengthening and deepening participation, valuing performance review and making
joint decisions on what has been achieved through teaching and trainings.
Through monitoring and evaluation critical decisions are made out of information
generated in drawing conclusions to have updated programme in terms of relevancy,
efficiency, effectiveness it sustainability (Anicet and Apphrodis, 2017). As an evolving
world different scholars like Estrella, Laurent,camplain, Gaventa, Guijit, Johnson, and
Ricafort,(2000) have come up to an agreement that PM&E process builds around
coming together and agreeing that the process builds up on the expected results and
making joint decisions. It still posits that, tracking progress, collecting vital data,
undertaking joint analysis (Guijt and Gaventa 1998; Otieno, 2018). Their definition
concurs with the four principles that PM&E process involves planning, collecting data,
data analysis and presentation. Documentation, report writing and sharing of
information.
PM&E state that engaging primary stakeholders who are ordinarily complicated in
PM&E and the customers of the project goods and facilities. Participatory M&E process
is essential in strengthening primary stakeholder’s involvement as active participants
in interventions which lead to tracking and analyzing the progress and the quality of
project success. As the projects become more complex to meet the demands of the
beneficiaries, this shift of results based project management required tracking project
performance (Kusek and Rist, 2004). The current study differ with these studies since
proper processes of participation are never followed as was observed in this study when
it was being carried out.
Participatory M&E process gives stakeholders means of gauging the outcome
guidelines given, helping them be responsible for their firmness and interventions
(Njuki, Kaaria, Colleta and Sanginga, 2006). It is envisaged that if people have power
they can agree and believe their wellbeing as addressed according to their expectations
and ensure their service delivery demands are met. In this case every single stakeholders
in L&N educational programme need to be involved in the participation of programme
activities so that they can be able to own the project. Identifying stakeholders and
engaging them in the programme is very vital especially when measuring changes

12
resulting from specific interventions, organizational strengthening and institutional
learning.
This directional requirement of participatory monitoring and evaluation process makes
it difficult when gauging influence of stakeholder capacity building and managing these
results in performance of projects. This is no difference in learning projects which
require a lot of keenness and proper engagement in public primary schools in Nairobi
County. It is hoped that every shareholder to perform well in projects which have
concern in PM&E process. Performance is key to projects based on traditional critics
rather than factors using the criteria of time, full participation of members, quality of
service delivery and managing what has been changed while the projects are underway
(Judd, Muller and Yzerbyt, 2005; Estella et al., 2000).
Despite the setting of critical standards of gauging the performance, different projects
have varied in sizes and complexities that proved an opportunity to assess unique
individual projects using criterion capacity building, gathering of information and
managing it to related dimensions. From the empirical study the influence of
participatory M&E process has been accepted in social development projects in health
and education (Okello and Mugambi, 2015). The same was supported by Steyn (2014)
that education has taken the lead on embracing the process. However the combined
influence of participatory M&E process namely the identification of stakeholders,
stakeholder capacity building, data collection, management of data gathered and
implement change in moderating school environment has not been established so the
study solicit to examine the influence of participatory M&E process in performance of
L&N educational programme in public primary schools Nairobi County.
1.1.2.1 Stakeholder Engagement.
Stakeholder engagement is a systemic and a continuous process by which institutions
and organizations establish a constructive dialogue which must have a fruitful
communication with all the stakeholders involved. The purpose of stakeholders being
involved is to convey a certain message, help in decisions-making, and provide input
to participatory process which becomes a guiding element for learning and change in
an organization (Donaldson and Lipsey, 2006); Olander, 2007).The stakeholders
involved in a project are either single persons, groups of people who have helped in

13
the programme and expecting good outcome from the performance of the project
dominating it either dismissively or positively (Newcombe, 2003; Freeman, 1984) he
continues to contend they might possibly be either extrinsic or intramural and everyone
anticipating assistance from the project. Olander (2007) says recognition and
understanding of key supporters actively involved in a project have concerns, needs of
management and purpose of involving all the stakeholders. Involvement of
stakeholders in education in the 21st century for academic excellence embraces the
involvement of parents, school committees among many other stakeholders
participating in making decisions (Gichohi 2015). On this point every organization
must have a need which needs to be achieved while engaging the stakeholders. When
involving stakeholders it helps in building trust relationship and improving the
strategies while identifying the areas of interest.
Stakeholder engagement in any discussion revolves around the question of what is
being done, in which manner is it done, time of the activity to be done and the reason
of it being done in order to promote wellbeing of participants in different teams
(Donaldson and Lipsey, 2006; ). Stakeholder participation is to empower development
of beneficiaries in terms of allocations and identifying the process of planning how to
facilitate in the activities of implementations of development initiatives (Chambers,
1997; Chitere, & Ireri 2004; Muiga, 2015).This process should be handled with
considerable supervision reason being, substantial participation of stakeholders can
lead to catastrophe while least involvement would lead to those involved in evaluation
taking control of the process and sidelining others (Patton, 2008).
During the identification process the relevant stakeholders who are affected or could
influence the project should be handled with integrity else mistakes can occur later. So
in this case a good methodology should be formulated to identify stakeholders who can
contribute to achieving the purpose of the engagement process and effects they have on
the end product of engaging them in the organization. Identification of all stakeholders
involved in project are crucial exercise, it needs a lot more time and being very keen on
who is to be involved and who is not (Olander, 2007). The stakeholders are identified
in a methodological and logical manner for example those who are incidentally not any
side the project, according to geographical location, organizationally and involving
them in all the project phases. Identification of stakeholders helps giving clear

14
communication during updates and change of staff in the progress of the phases of the
project which is very important in understanding effectiveness of addressing their
expectations and lack of these elements leads to poor performance of projects.
So there was need to examine ways of how beginners and educators can be engaged so
as yield good performance especially in L&N dexterity but results were that most
teachers are engaged in learning process but have totally refused to embrace the new
methods arguing they are lengthy procedure and consumes adequate time per lesson
though others say it is the best method. According to researcher’s point of view on the
findings, low achievers in education are the ones who found trouble in welcoming
change since it involved a lot of scrutiny and apprehension application which was a
scarcity to some of them.
1.1.2.2 Stakeholder Capacity Building.
Stakeholder capacity building in essences is contributing towards performance of
projects. Teacher’s capacity building in real essence is a phenomena by itself since it is
a continuous process of improvement. There are many problems underlying in this
phenomena especially when teachers are not ready to be committed on their work. Even
if government commitments itself on capacity building of teachers and they are not
ready to change then teaching professional adversely affects other efforts of
government. Robison, Myran, Strauss and Reed, 2014; Althauser, 2015; this could not
be the only problem since education systems face other constrains beyond the teachers
development and schools resources (Glewwe and Muralidharan, 2016 ; world bank
2017, 2018) .Efficacious implementation of M&E is attained on implementer’s
capability skills and stakeholders technical practitioners in the projects.
The staff tasked in monitoring and evaluation should be supported and motivated fully
so as to perform effectively in their duties as depicted by (Aquinas and Kraiger, 2009)
but this not in the case of education sector. Teachers need to be trained in monitoring
and evaluation skills so as to improve the performance of projects which are critical
and requires adequate time and people whom have proper knowledge while delivering
the content of these skills. To enhance delivery of project outcome, recruitment of
qualified and skilled monitoring and evaluation staff is mandatory of every
organizations intending to sustain quality projects performance (Midida, Gakure and

15
Orwa, 2013). For this to happen, clear roles and identification of people involved in the
process must be well informed and engaged fully in the programme so as achieve the
required performance of the programme.
In the current study stakeholder capacity building process examined the context of
training for M&E workshops, training for monitoring and evaluation seminars, aligning
trainings gaps identified, enhancing M&E awareness and skillfulness acquired as
predictor variables in influencing the performance of L&N educational programme. It
was therefore presumed that stakeholder capacity support or obstruct behavior and
views of those directly connected to produce performance of educational programme.
Lower Primary School Teachers have diverse professionalism which covers a wide
range of different specialization hence inadequate teacher professionalism and laxity in
teacher endeavor (Ganimian and Murnane, 2016). While engaging the stakeholders
there should be a link on how the two can be joined in capacity building and the
relationship they have on the influence of the learners.
To show how the two can be linked Kandie, (2014) focused on the connection linking
lower primary school educators’ mathematics self-assurance with the performance of
students in arithmetic’s in Kericho sub-county. This shows that the concept of
mathematics development is a fundamental skills in early years which forms a strong
layout for future math’s achievements. Bridging the aperture in Kadie ,(2014) study,
current study went deeper to establish the influence on performance of simple
arithmetic calculations by embracing new methodology of breaking apart which was
introduced by the intervention project in educational programme. How to relate on the
two the study still left a gap on how planning of teachers work, training of seminars and
workshops helped in the teaching of mathematics hence this study. This can also be
enhanced by involving Parents in their children learning process since it increases
learners performance in schools.
The parents involvement is very important to the young children since in their overall
development depends on them. As Clark, (2007) puts it that early literacy experiences
within natural settings for example home motivates the learner’s opportunities and
encourage parents to become more active partners of early childhood educators in their
child literacy development. This also coincides to Crystal, (2013) who focused on the

16
consequences of parental capability of reading and writing in the participation
youngster being interested on reading habits to enable growth of emerging skills
adapted by parents. It is explained in teaching statistical findings which are significant
and unique variances in students understanding skillfulness in communication
channels. In this case it agrees with (Andrews, Hood and Conlon, 2008) on their
outcome that reading a storybook at home environment exposes how much the learner
has been able to acquire in learning oral language skills.
Thus a gap was experienced in what manner parent’s participant in teaching the
youngsters which has yield emergent results in literacy skills on the alphabetical skill
and print knowledge on oral language skills. To measures how learning takes place in
a classroom while teaching literacy, class environment observations made are
insensitive or inadequate hence more elements for student’s emerging for the ability of
being able to read and write thus low performance. Teachers and parent’s involvement
strategies should be integrated to the learning of these young ones. Therefore this study
sought to establish the extent to which stakeholder capacity building influence the
performance of L&N educational programme in Nairobi County.
1.1.2.3 Data Collection
Data collection is a systematic approach which helps in generating and measuring
information from a wide area of interest so as to get required information on the basis
of accuracy and completeness. Many countries in the world have introduced the use of
data in education for decision making, accountability, performance management and
feedback for the learner’s results (Tine and Skedsmo, 2017). Data use is defined as the
activities that take place during the interaction of test scores, grades and other
assessment data related to school (work Spillane, 2012).
Little, (2012) argue that data become reliable when analysis and interpretations have
been carried out so that data can be of use. Through data collection an individual or an
organization can be able to ask relevant questions, make predications and analyze the
outcomes. Data collected for education purposes in schools assessment are used by
policy makers, administrators and teachers (Moller, 2015). To this an individual needs
to source quality characteristic that will test and measure, the importance of data
collected and how to use that data. Both methods of collecting data for example

17
quantitative and qualitative was applied in the current study. Data collection enables
researchers or teams to prepare, test working assumptions through a process of
developing useful facts that leads to the advancement of project performances while
educators draw a range of knowledge sources when deciding their instructional
strategies (Heitink, Van der Kleij,Veldkamp, Schildkamp, and Kippers,2016)
Many developed and developing countries have numerous projects in an attempt to
improve their education systems, infrastructure and health among many other projects
(UNESCO, 2018). Large sums of monies are put into activity which the organizations
expect to get value of it. Kenya is no exceptional, and many non-governmental
organizations have been met with growing concern about how to intervene for the
Country and especially in education sector where there is an outcry of low performance
in L&N programme.
Performance of any project which can be measured through the extent to which results
have been achieved is dependent on availability of resources and enough data collected
for making any learning changes. Learning institutions require systems which are
updated and can give transparency information to compete with the global economy as
posited by (Day, 2013). Allocation of resources to many organizations is an
accountability issues requiring a system to help measure the value for resources against
achievement of organizational goals and objectives. An effective system will help in
assisting to meet the demands by holding the employees accountable and address those
who are under performing ( Zbar, Marshall and Power 2007; Zatynski, 2012)
Implementation of an effective M&E system in education requires a participatory M&E
process in identifying key stakeholders and engaging them in the project cycle.
Data gathering is very important in any project. In this programme data is collected
through TANGARINE tool which is capable of acquiring enough and extensive span
of information from learners. This collection tool was formulated in USA to collect a
wide range of data from early grade children and give feedback immediately. The tablet
transmits the facts of read words per minute by the learner during class observation and
analysis it into percent immediately (RTI, MOEST, 2011). Formulation of data
collection instruments which is formulated during the planning stage. Data to be
collected needs to help in measuring and assessing the progress of the projects and the

18
mastery of content from teachers. Collection of data and monitoring of learning process
must be continuous in all learning institutions for both teachers and learners for
implementing change as required (Kimbui, 2012).The study found out that class
participation is essential and data collected through feedback information differed in
schools as posited by (Laursen and Hassi, 2012). However the study data collected
through exams and reading fluency in classrooms showed great improvement of the
intervention programme.
1.1.2.4 Data Management
Data analysis are procedures of assembling facts while interpreting it in a manner that
proper and adequate information can be drawn while making conclusions using
analytical and logical thinking in examining every item of the data provided. Analyzing
data and interpretation is very important in every organization and so these literacy and
numeracy educational programme are no exceptional (Angela, 2008, Barone; William
and Micklos, 2017). Data management and sharing effectively is a challenge as
acknowledged by many researcher that they dearth competency and encounters needed
to control and allocate data accordingly when required (Federer, Joubert, Welsh and
Brandys 2015; Tenopir, Sandusky, Allard and Birch, 2016). Similarly, Proudlock and
Ramalingam, (2008) observed that impact process of evaluating, analyzing, interpreting
results greatly improved participation of stakeholders in developing, making
corrective judgments of the programme.
Reading in lower grades has been and will remain the starting journey of an individual
in education progress, attitudes and behavior which are formed at this lower level has
was focused by (Parker, 2004). The study evaluated the learning of student in reading
attitudes and how it affects individual behavior. Prior studies suggest positive
correlation but according to the study by Parker, (2004) there is no correlation of the
two. This was as a result of experiments done on two sub-groups and it was found out
that no correlation between attitude and ability in reading skills hence no effect on
attitude to ability.
Parent involvement in children learning has been a myth since most parents take hold
of their children in learning institutions and expect the teacher to help their children in
everything that pertains education and life as observed by (Muir, 2009). He argued that

19
parental involvement on children learning while at home increased their learning
performance but parents were less interested in assisting their children full. A different
opinion that parent admire being involved in their children activities in schools hence
making tremendous impact on education (LIamas and Tuazon, 2016; Sapungan and
Sapungan 2014). Guardians are provided with results of their youngsters from the
teacher’s data base information stored in schools as well as class registers.
Study conducted by Gichohi, (2015) found that there were significant differences
between parent’s education and level of involvement in parenting, learning at home,
decision and communicating channels that involved parents in learning in 21st century.
However there are challenges encountered by learners, teachers and educators in
implementing the curriculum thus hindered good performance. The intervention
projects points out that parents should be given the right information about their
children so that they can give a hand back at home. Several approaches should be
applied to promote parents involvement in trainings involving education so as to
enhance the school and home environment as stated by (Desforge and Abouchaar, 2003;
Harris and Brown, 2014; Masombo, Muchopa and Kuoth, 2017). So that information
generated cab be used and then disseminated to parents about their children
performance.
1.1.2.5 Implementing Change
Implementation of change in any school depends heavily on teachers’ readiness and
willingness to adapt change and use integrative tools in utilizing new methods of
instructions which are very influential in enhancing learning outcome. Buchanan and
Fredrich, (2013). Learnt skills during trainings should be implemented at the specified
time and within the scope as it was anticipated during the planning time.
Utilization of Monitoring and Evaluation information for future use is very vital in any
organization especially in managing projects to deliver some outcomes which will add
value to the organization. The way of gathering and collecting this information is more
structured form of gauging the performance of projects (Raymond and Bergeron, 2008).
One way of collecting data is through instruments designed appropriately in generating
the right information needed for monitoring and evaluation so as to give the right report,
making any changes needed in the projects. Management of Monitoring and Evaluation

20
information is supposed to be consistent and participatory for it to be sustainable (Fadel
and Brown, 2010). The utilization and managing of M& E information is very vital to
project leaders, M&E staff, key stakeholders participating in projects for quality and
corrective measures, procedures of tracking information and making changes where
need be in the projects. This will enhance resources allocation and consistency in
monitoring and evaluation activities in project performance (Karim, 2011).
Implementation change has been noted to be an issue for most of the projects as posited
by (Nzweke, Olandenjo and Emoh, 2015). On evaluation of facts necessary for
accomplishing the implementation of project in Anambra state, Nigeria states. Factors
responsible for project success are numerous when there are good steps at correlation
between them in relation to data analysis and management. However demonstration of
extent to which implementing change happens projects was not clearly stated hence the
current study. Ouko, (2015) have emphasized that implementing change for PM&E has
revealed that pupil’s performance improved in the levels of numeracy than opposed to
literacy in schools where learners have started in pre-primary grades unlike those who
have started directly in grade one.
In Kenya it is not a prerequisite for a parent to take their children in pre-primary hence
compromising the quality of education. The study majored on entry of the learner in
grade one but did not show how they learnt these skills in preschool which helped in
grade one entry. Consequently impact it has on upper grades like grade one to three.
However the study did not show the extent of implementing change for PM&E and
performance of L&N educational programme hence need of carry out the study.
1.1.3 School Environment
The School environment is defined as facts influencing teaching and acquisition of
knowledge in having a relationship to one another (Nduta, 2014). These factors could
probably be school infrastructure, instructional materials for example text books for
these subjects, sanitation and water, the school compound to teach physical education
which is very vital to growth and development, ventilation of the classrooms, the toilets
and pit latrines among many other elements of the environment. The classrooms should
have appropriate learning materials according to the age of the learners and have an
enriched environmental support intervention among many other things which will

21
increase the outcome of the learners in conducive environment (Cantor, Osher, Berg,
Steyer and Rose, 2018).
The information should cater for learner’s interest and level so that they can capture so
that the lesson and be motivating and interesting to avoid boredom of the learner.
School environment provides appropriate learning facilities, well managed classrooms
among many other equipment’s. School environment determines the extent to which a
learner behaves and interacts with the others at the same time improves the learning
performance (Berkowitz, More, Astor and Benbensihty, 2017). Absence of conducive
environment leads to poor performance. The school environments tends to mound the
behavior of the learners so as to meet the demand of life either positively or negatively
and this can be categorized by many elements within the school environments. The
intensity of surrounding begins to affect the extension and evolution of a person’s right
from the mother’s uterus to the external forces after birth. At the same time teachers’-
learner relationship yields good performance within the school environment meaning
school environment has become important educational in most countries (Wang and
Degol, 2016).
Motivation is a good predicator of positive results if given to the culprit’s performing
the activity. Mugambi and Wang’eri, (2014) on squint instruction on predictor of
perusal motive and reading efforts amongst grade 2 students in Nairobi and Tharaka
Nithi county found out that peer teaching predicated reading motivation but did not
inform how this levels of teaching is done, who are the main participants hence a gap
since it is not addressing the problem fully on how each stakeholder in the learning
process are involved in learning activities. Therefore the investigation establishes the
extent to which participatory process involve all the stakeholders in the classroom
situation and teaching methodology used in teaching the skills. Another study by
Marima, (2015) preferred having technique used in educating literacy methodology
early year’s grades in Dagoretti and Wetlands divisions in Nairobi, identified
proficiency in reading being the main reliable indicators of how learners attain proper
knowledge achieve through academic process and make one suitable and active in
society.

22
The findings reveled that there was inadequate reading skills among learners and two
main teaching methods were phonics and whole word Approach which was missing to
most teachers teaching the subject. Most teachers 70% in pre-schools teachers accepted
the challenges in teaching the skills and 100% class three teachers said lack right
procedures in teaching the reading skills since what they learnt in college was the
repetition styles and reading orally. The study did not address the key facts on how a
teacher should address the phonetic teaching, at what level, the materials to be used, the
age group of these learners per class and teaching aids to be used. Therefore this study
solicit to establish the elements that influence the ability to read which is very vital and
a requirement to help one in communicating fluently and be able to address other
subjects in other disciplines.
An empirical study done by Chepkonga, (2017) on classroom habitant set up facilitation
in standard teaching in public pre-school centers in West Pokot is pathetic and teaching
effectively in the classroom is a major concern as it was found by other researchers that
there is an outcry of Teacher-Pupil ratio in the world Kenya inclusive Mackatian,
(2017) Student’s performance is determined by several factors within the school
environment as was explored by (Jepketer, Kisilu and Kyalo, 2015).Teachers’
classroom strategy for helping in achieving the learners Performance in Public
Secondary Schools in Nandi County has explained much on how performance is
acquired through involving all the stakeholders in learning and specifically the pupils
and teachers in classroom environment. Main emphasis being how teachers’ classroom
strategy enhances student outcomes and introduction of technology exposing the
learners into a wider range of interactions to practice real life experiences (Parvin and
Salam, 2015)
1.1.4 Performance of Literacy and Numeracy Educational Programme in Kenya
Performance of any project is measured by its potentiality for favorable outcome and
attainment of set objects, aims and involvement of stakeholders in the programme.
Many nations have begun large-scale academic interceding in responding to inadequate
literacy and numeracy instruction skills, evidence from information generated in piloted
programme which focused in enhancing outcome Whilst rigorously using assessment
and research designs (Murnane and Willett, 2011; Conn, 2017; McEwan, 2015; Piper,
Destefano, Kinyanjui and Ong’ele , (2018). Despite increased access and high

23
enrollment of learners in Kenyan primary schools, literacy rates are significantly lower
than expected and the government is seeking to improve learning outcomes.
This could be through developing materials that support multilingual literacy learning
and enhancing teacher training resources to curb barriers in implementing educational
programme. Teacher professional development is also another key area of improving
intervention literacy programme (Dubeck, Jukes, Brooker and Inyenga 2015).
Government to put into consideration of training teachers on development aspect which
is very crucial, absence of this leads to low performance of literacy and numeracy skills
Performance of literacy and numeracy in Kenya started way back in 2011 to 2014 on
piloted projects by PRIMR initiative. The implementing group started much later on
the basis of the weak areas in learning in 2015 by USAID and DFID which funded a
programme Tusome Early Grade Reading Activity ( TUSOME) meaning ‘let’s read’
in English . This was to help improve approximately 7 million Kenya Children in grade
1-3 in more than 22,600 public primary schools, 5,027 private schools and 1,500
alternate basic educations institutions in informal settlements in Kenya under the
leadership of MOEST, RTI and many other supporting organizations (Piper, Destefano,
Kinyanjui and Ong’ele, 2018).
In every project stakeholders have great expectations in every phase of the project
(Saleh, 2015). Projects have to meet set objective so as to meet the client’s prerequisites
and satisfaction (Turner, 2007). Performance of L&N educational programme in Kenya
and specifically Nairobi County was able to meet their expectations through collecting
data in classrooms using the Tangerine tool which allows stakeholders to gain
actionable insights about what is working for teachers and pupils however (Chrstia,
Czerwonko and Garofalo, 2014). However tablet-based interventions for children is
ineffectual way of measurement. Curriculum support officers are the ones who give
evaluation reports about the quality of the programme implementation and students
assessment from classroom observations of teachers.
In this case also Kerzner, (2003) confirms that operationalization of project
performance is determined by the duration taken to complete the project, how it is able
to stay in the range assigned finances, genuine performance stating level of project the
involvement of the stakeholders without disturbing the flow of the organization work

24
neither its culture. So with reference to the educational intervention programme in
Kenya the principle is to intensify the performance of L&N educational programme in
Kenya within the specified time, scope, quality and beneficiary satisfaction which
meets the criteria sued to determine project performance (Richardson, 2015).
The phenomena of varied forms of organizations and learning issues are ancient in
Africa. These organizations deal with education developments to make better learning
expertise among the students and capacity building to those involved in the programs.
In Kenya it is noted that teaching participation is a profitable development to individual
growth as a whole. There is need to check on what is really required of quality and
learning skills in the country. Dubcek and Gove;2015; Gove et al (2017) on the early
grade reading assessment (EGRA) found out that pilot programme do not take into
account the training and support of teachers in the classroom and the accountability of
what is being taught is not measured at the required time only when the results are
released. Crouch and Destefano, (2017) on wide spread improvement on learning and
determination of restriction used to inform education on programme implementation
and fundamental measures on literacy skills on the need of new starters readers in grade
one to three. The gaps on how literacy and numeracy skills have not been exhausted
fully by other researchers in grades 1-3 hence need for the study.
1.2 Statement of the Problem
PM&E process takes part in essential situations in ensuring that M&E undertakings
have attained project end results and ascertaining project performance cannot be
underrated. In spite of sundry attempt made by instructional stakeholders to accelerate
learner’s skill production, through supplementary fiscal benefits for making superior
schools infrastructure, to produce conducive studying domain, to surpass entrance to
education and qualified instructors, propensity of student’s performance is still low and
needs immediate scrutiny. Performance of L&N educational programme hangs on
absolutely on stakeholder engagement and if there is no proper engagement of teachers
who are principle executors of the programme then low performance will be
experienced. Similar observations have been made on an annual review the appraisal
report entitled ‘Are our children learning? (Mugo and Oleche (2015). As revealed by
some stakeholders who gave information on involvement of stakeholders such as
teachers attending school in Nairobi County has 58% which is alarming in comparison

25
to other Counties like Kiambu, Meru, and Mombasa which has above 85%. This means
that in one time or another a teacher is absent from school for one reason or another
hence low performance in this learning skills.
Stakeholder capacity building is very paramount in any corporation since it assists
personnel in obtaining new skills and acquire credence on anything they undertake. In
the case of schools where children are learning these skills could be missing for
example teachers might not be attending fresher courses to enhance their skills which
they learnt in their initial training. Kenya being in developing country there are so
many changes in education curriculum requiring the attention of teachers to be well
equipped in order to make necessary changes but this could be missing. Similarly no
idea of what is PM&E process as posited by (Piper and Mugenda, (2013).
There is need to investigate how teachers are trained on the emerging issues in teaching
literacy and numeracy skills teachers and the usage of new materials provided. Also if
the trainings helped in acquiring more knowledge on content delivery and mastery.
There are many other factors that can hinder learning literacy skills and effective
learning and implementation of this skills can only be attained by the implementers’
capacity skills (Glewwe and Muralidharan, 2016). However this study is out to show
the influence of stakeholders’ capacity building on performance of literacy and
numeracy educational programme in public primary schools in Nairobi County, Kenya.
Data collection is a key thing for giving back feedback but if not handled well by the
experts a problem occurs and that is what has been happening in these literacy and
numeracy education programme. Participatory monitoring and evaluation approaches
found out that data collection was a big problem since it was not made use neither
documented well leaving scanty information which cannot be relied on (Matonda et al,
2013). The need for the current study to investigate how data is collected in the
classroom and school level to the government offices and parents. Tools and methods
of collecting data, storage of data in the data base and retrieving for use was a major
concern hence need for this study to help bridge the gap. Parents were not able to get
the results of their children on timely basis after some time and specifically when a
learner goes on transfer to another school. Moller, (2015) posited that data collected for

26
education purposes is normally used by the educators, policy makers, administrators
and teachers but if the data was not handled well then can lead to misleading
information hence poor results for what it was intended to acquire.
Lack of proper data collection methods and storage leads to inadequate management
methods thus affecting the performance of L&N educational programme. It is believed
that if any institution lacks proper management productivity is low and L&N
educational programme are not exceptional to these problems. This was profound by
Bernard, (2015) on the influence of monitoring project performance and
implementation. There was need to bridge the gap on how literacy and numeracy
educational programme were handled key stakeholders who were the teachers,
curriculum support officers, officials from MOEST. Due to improperly methods of
collecting data and storing it well for future use in the classroom or at school level leads
to poor planning, inadequate feeding back information, lack of accountability and
proper documentation of important information needed by concerned parties ( Heitink,
Van der Kleij, Veldkamp, Schildkamp and Kippers, 2016). Sharing of data is also a big
problem more so to teachers who acknowledge that sharing data effectively is a
challenge due to lack of skills and experience needed to manage data adequately as
stated by (Federer, Juobert, Welsh and Brandys, 2015).
Implementing change is very critical to most programme and especially numeracy and
literacy educational programme. There has been an outcry that most programme do not
implement changes made, therefore carried on problem continues or becomes even
worse. Implementation Change of these process has been inadequate hence resulting
into failure to attain objectives of Literacy and Numeracy educational programme in
Kenya. At the same time it is important to implement the new skills learnt during the
trainings so as to enhance the delevry of the content (Buchanan and Fredrich, 2013).
Piloted intervention programme found many gaps which triggered other funders to
intervene but still there are gaps experienced which needs special attention. It is on the
basis of this background that study seeks to establish how participatory M&E process
influence the performance of L&N educational programme in public primary schools
in Nairobi County.

27
School leadership has been an issue for many decades in the country and the selection
of school administrators thus affecting the performance of L&N educational
programme. School infrastructures like ratio of pupil –teacher in classrooms is alarming
issue. Buildings which are conducive for learning environment could be a challenge
hence need for this study to investigate how these schools cope with the situation
without compromising the learner’s performance. School environments determines the
behavior of the learner while in school which influence the outcome of the learners
performance (Berkowitz, More, Astor and Benbensihty, 2017). The main phenomena
under investigations is how L&N education programme are supervised, funded and
implemented. The issue at hand being learners in grade one to three cannot be able to
read fluently and perform simple arithmetic calculations of a lower grade. Lack of
enough teachers per school are really affecting the learning of these skills since the
introduction of free primary education which saw swelling of enrollment and there was
no additional teachers to handle the learners hence compromising the learners learning
capability. So there is need to examine how these gaps are mitigated in order to have
quality education and learners being able to read, write, calculate simple arithmetic’s
and have confidence in speaking any language fluently
Generally leaning of literacy and numeracy educational skills has been comprised hence
need for intervention programme. So this study sought to establish how stakeholder
engagement, stakeholder capacity building, data collection, data management,
implementing change and school environment influence performance of literacy and
numeracy educational programme.
1.3 The purpose of the Study
The purpose of the study is to establish the extent to which participatory Monitoring
and Evaluation process, influence the performance of L&N of educational programs in
public primary schools in Nairobi County. It also sought to assess the moderating
influence of school environment on the relationships between participatory M&E
process and performance of L&N educational programs in public primary schools in
Nairobi County, Kenya

28
1.4 Objectives of the Study
The study achieved the following research objectives
1. To establish the extent to which stakeholders engagement influence performance
of literacy and numeracy educational programme in public primary schools in
Nairobi County, Kenya.
2. To determine how stakeholders capacity building influence performance of
literacy and numeracy educational programme in public primary schools in
Nairobi County, Kenya.
3. To examine how data collection influence performance of literacy and numeracy
educational programme in public primary schools in Nairobi County, Kenya.
4. To determine the extent to which data management influence performance of
literacy and numeracy educational programme in public primary schools in
Nairobi County, Kenya.
5. To assess how implementing change influence performance of literacy and
numeracy educational programme in public primary schools in Nairobi county,
Kenya.
6. To establish how combined participatory monitoring and evaluation process
influence performance of literacy and numeracy educational programme in public
primary schools in Nairobi County, Kenya.
7. To assess the moderating influence of school environment on the relationships
between participatory monitoring and evaluation process and performance of
literacy and numeracy educational programme in public primary schools in
Nairobi county, Kenya.
1.5 Research Questions
The study answered the following research questions;
1.To what extent does stakeholder’s engagement influence performance of literacy and
numeracy educational programme in public primary schools in Nairobi County,
Kenya?
2.How does stakeholder’s capacity building influence performance of literacy and
numeracy educational programme in public primary schools in Nairobi County,
Kenya?
3.How does data collection influence performance of literacy and numeracy
educational programme in public primary schools in Nairobi County, Kenya?

29
4.To what extent does data management influence performance of literacy and
numeracy educational programme in public primary schools in Nairobi County,
Kenya?
5.How does implementing change influence performance of literacy and numeracy
educational programs in public primary schools in Nairobi County, Kenya?
6.How does combined participatory monitoring and evaluation process influence
performance of literacy and numeracy educational programme in public primary
schools in Nairobi County, Kenya?
7.What is the moderating influence of school environment on the relationship between
participatory monitoring and evaluation process and performance of literacy and
numeracy educational programme in public primary schools in Nairobi County,
Kenya?
1.6 Research Hypothesis
The study tested the following Null hypothesis.
1. H0 There is no significant relationship between Stakeholders engagement and
performance of literacy and numeracy educational programme in public primary
schools in Nairobi County, Kenya.
1. H1 There is significant relationship between Stakeholders engagement and
performance of literacy and numeracy educational programme in public primary
schools in Nairobi County, Kenya.
2. H0 There is no significant relationship between Stakeholders capacity building and
performance of literacy and numeracy educational programme in public primary
schools in Nairobi County, Kenya.
2. H1 There is significant relationship between Stakeholders capacity building and
performance of literacy and numeracy educational programme in public primary
schools in Nairobi County, Kenya.
3. H0 There is no significant relationship between Data collection and performance of
literacy and numeracy educational programme in public primary schools in
Nairobi County, Kenya.
3. H1 There is significant relationship between Data collection and performance of
literacy and numeracy educational programme in public primary schools in
Nairobi County, Kenya
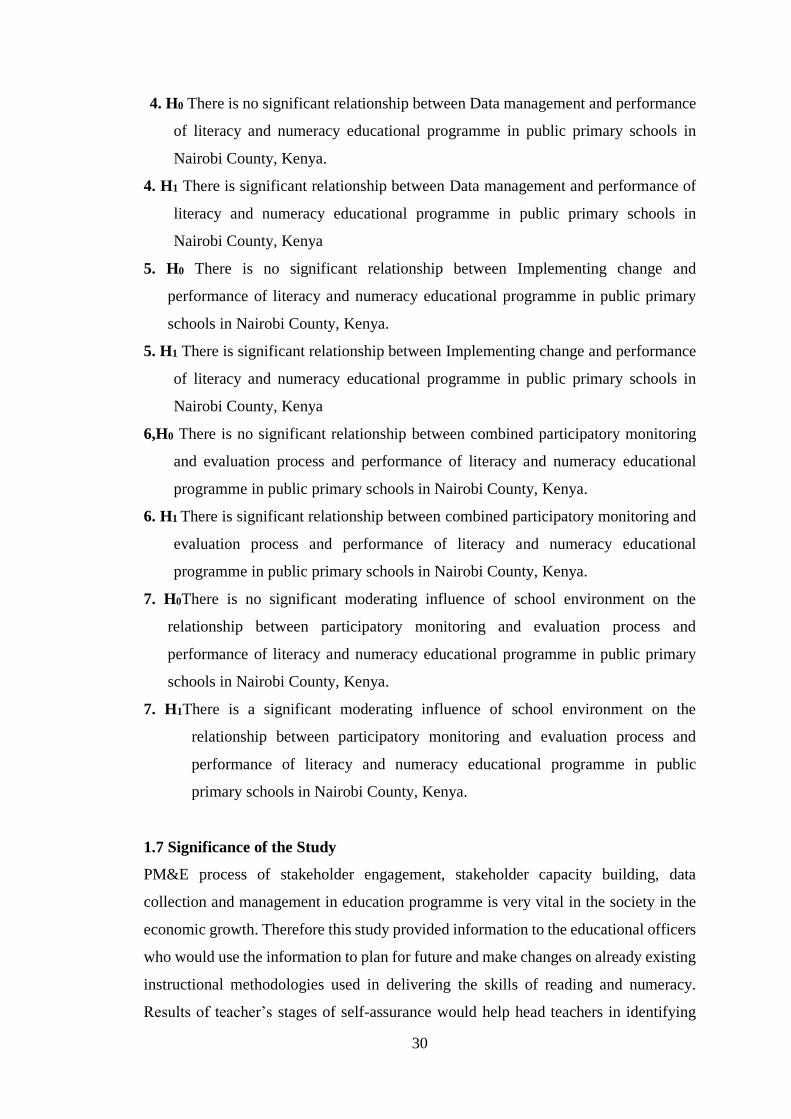
30
4. H0 There is no significant relationship between Data management and performance
of literacy and numeracy educational programme in public primary schools in
Nairobi County, Kenya.
4. H1 There is significant relationship between Data management and performance of
literacy and numeracy educational programme in public primary schools in
Nairobi County, Kenya
5. H0 There is no significant relationship between Implementing change and
performance of literacy and numeracy educational programme in public primary
schools in Nairobi County, Kenya.
5. H1 There is significant relationship between Implementing change and performance
of literacy and numeracy educational programme in public primary schools in
Nairobi County, Kenya
6,H0 There is no significant relationship between combined participatory monitoring
and evaluation process and performance of literacy and numeracy educational
programme in public primary schools in Nairobi County, Kenya.
6. H1 There is significant relationship between combined participatory monitoring and
evaluation process and performance of literacy and numeracy educational
programme in public primary schools in Nairobi County, Kenya.
7. H0There is no significant moderating influence of school environment on the
relationship between participatory monitoring and evaluation process and
performance of literacy and numeracy educational programme in public primary
schools in Nairobi County, Kenya.
7. H1There is a significant moderating influence of school environment on the
relationship between participatory monitoring and evaluation process and
performance of literacy and numeracy educational programme in public
primary schools in Nairobi County, Kenya.
1.7 Significance of the Study
PM&E process of stakeholder engagement, stakeholder capacity building, data
collection and management in education programme is very vital in the society in the
economic growth. Therefore this study provided information to the educational officers
who would use the information to plan for future and make changes on already existing
instructional methodologies used in delivering the skills of reading and numeracy.
Results of teacher’s stages of self-assurance would help head teachers in identifying

31
intrinsically motivated teachers for lower grades and particularly grade one where
identification and enhancement of learner’s competences is crucial.
It might be of help to teachers and the funding agencies who are the main implementers
in making changes on the learning strategies in formulating and re-planning the
programme. It is hoped that M&E projects staff will have enough information and
learning skills to help them interact directly with the learners and teachers. This will be
very vital since learners and teachers participation and engagement of all stakeholders
in the programme is crucial. It might be of help to the MoEST in getting actual ideas
occurring on the ground about primary institutions through information generated,
analyzed and stored in the database with the help of TAGARENE tool. The expected
outcome after the study may be of help to the government, researcher’s, monitoring and
evaluation officers who will acquire more knowledge through the information
collected.
1.8 Delimitation of the Study
The study was delimited in establishing the influence of PM&E process, on
performance of literacy and numeracy educational programme in public primary
schools in Nairobi County. The influences of these variables on performance of L&N
educational programme as moderated by school environment were deliberated on.
Further the study was built on descriptive research survey design and correlational
research design. Simple random sampling, systematic sampling, stratified sampling and
purposive sampling were used to get suitable sample for the study. Questionnaires and
in-depth interviews were used to collect data. The study focused on the financed
educational programme in Nairobi County. The Head Teachers, Lower Primary School
Teachers, Curriculum Support Officers’ and Research Triangle International officers
were targeted for the study.
The TUSOME and EGMA were the on-going projects which were considered in this
study. Those completed projects were excluded from the study since the influence of
PM&E process was measured in on-going projects. This study was part of a sample of
projects financed by TUSOME conjunction with government of Kenya. The results
were generalized to all other educational programme in Kenya. However there are other
numerous factors that can influence the performance of L&N educational programme,

32
so this study delimited itself to PM&E process steps which included stakeholder
engagement, stakeholder capacity building, data collection, data management,
implementing change and school environment on performance of L&N educational
programme.
1.9 Limitations of the Study
The study had some constraints. First the location of conducting the study Nairobi being
the biggest capital city of Kenya has its own challenges especially traffic jam in the
morning when going to collect data from Head Teachers who were available mostly in
the morning section. In solving this challenge research assistants settled on using
motorbikes when the traffic was much and walked where necessary. When traffic was
few they used the normal mode of transport for example the use of vehicles.
The study area was divided into sub-counties for example Lang’ata, Westland,
Kasarani, Njiru, Starehe, Kamukuji, Dagoreti, Makadara and Emabakasi. The
enumerators visited every sampled school in each sub-county and each time they
finished collecting data they cleaned, coded and verified the data for every day so as to
save time. By doing this it helped setting up schedules for data analysis and giving
feedback.
The second restriction was the existence of the necessary knowledge for example the
study endeavored to collect information on each variable for example stakeholder
engagement, stakeholder capacity building, data collection, data management,
implementation for change and school environment which included the allocation of
resources and classroom observation. Such information was considered sensitive by the
targeted groups especially the Head Teachers who their findings really differed with
the rest of the respondents especially on resource allocation. Confidentiality of the
information’s was really guaranteed and assurance of anonymity was given since
information was only met for scholarly intentions only.
Some respondents who were involved to this kind of research for the first time, like the
newly appointed Head Teachers took substantial time being elucidated on the
significance of being involved in the research and later accepted to participate in the
exercise after the assurance that the data is only used for academic work only.

33
The researchers herself interviewed the Curriculum Support Officers who really
assisted in very crucial information and this was due to the fact that the researcher had
comprehensive information about the area of study and has worked hand in hand with
the CSO’S in implementing the programme. Also the Research Triangle International
officers were helpful to the researcher, while on producing the required documents
through via email to the deputy director who seek authority from the director who
agreed and a confirmation call was made through the cell phone and the date was set
for the in- depth interview. There was a prolonged interview and tape recording for
verification later when coding the information incases the researcher forgot some
information. The study therefore has some valuable input that regards the subsist body
of knowledge on participatory M&E process, school environment and performance of
literacy and numeracy educational programme in Kenya.
1.10 Assumptions of the Study
It is therefore assumed that the stakeholder engagement, stakeholder capacity building,
data collection, data management and implementation change influences the
performance L&N education programme.
It was presumed that all respondents replied with honesty and objectivity to the
questions and that the variables not included in the current study did not affect the
relationship under investigation or were kept constant. It is assumed that the interviewer
interviewed the respondents well and they gave the right and truthful information on
the questions asked.
The assumptions were also based on normality, test of linearity, interval data,
muliticollinearity, homoscedasticity test and independence of residuals referring to
various aspects of how data is distributed in scores and the nature of the underlying
relationships between variables. The assumptions helped in analyzing the tests based
on parametric.

34
1.11 Definition of Significant Terms Used in the Study
Data collection is a structured proposition of collecting and measuring information
through proper methods of selecting M&E data instruments, sources of M&E in
collecting data information, schedules of M&E activities and collation of information
from a variety of sources to get a complete and accurate picture of the information
required.
Data management in this study is the procedure of identifying specific data analysis
methods, identifying staff responsible for data management, data analysis and
interpretation and M&E reports writing so as to enable the programme succeed.
Implementing change is any relatively permanent change in behavior that occurs as a
result of practices, experiences and incorporating the organizational tools that can be
made useful helping human being become competent personal with transformational
results in the adaption and actualization of change. In this study it will be realized
through reviewing collected data, number of transmitted reports, utilization of M&E
results and project intervention
Performance of literacy and numeracy educational programme is defined in this
study as reading, listening, speaking, writing skills which have been achieved, letter
recognition, simple arithmetic calculations, satisfaction of the beneficiaries in the
programme, transition rate and average class performance has improved. Timely
acquisition of L&N skills on educational programme have greatly improved.
School environment in this study school infrastructure for example classrooms.
materials in those classes which are appropriate to the learners age and level,
playgrounds and sanitation which have a great influence on teaching and learning
process. The learning materials like textbooks, writing materials, and teacher pupil-
ratio and school leadership have an influence on performance of L&N educational
programme.
1.12 Organizational of the Study
The analysis is composed of five chapters. Chapter one deals with background of the
study, statement of the problem, purpose of the study, research objectives, research
questions, research hypothesis, Significance of the Study, delimitations and limitations
of the study, assumptions of the study, definitions of significant terms and
organizational of the study.

35
Chapter two is the literature review which includes other scholars work based on the
study relevant topics, objectives and theoretical underpinnings, The study was guided
by independent variables namely stakeholder engagement, stakeholder capacity
building, data collection, data management and implementing change, moderating
variable as school environment while the dependent variable was performance of
literacy and numeracy educational programme, stakeholder theory, theory of change,
Multiple Literacies Theory (MTL) conceptual framework, summary of literature review
and knowledge gap.
Chapter three is the research methodology and focuses on the research paradigm,
research design, target population, sample size, sampling procedures, data collection
instruments, validity and reliability of the instruments, data collection procedures, data
analysis and techniques, ethical considerations and operationalization of the variables.
In Chapter four data presentation and analysis, interpretation and discussions have been
covered. This was captured through tables and figures. The data was analyzed using
SPSS version 25 and hypothesis were tested and the results were that the null hypothesis
were statistically rejected and alternate hypothesis was accepted hence there was
influence on performance of L&N educational programme in Public Primary School
Nairobi in County, Kenya.
Chapter five provides an overall summary of the findings, conclusions of the key areas
in the study and key recommendations emanating from the issues analyzed according
to the objectives and the variables under study. Finally further recommendations were
made on the knowledge gap on the areas which the current study did not address but
other researchers can carry out on them and make necessary contributions to the body
of knowledge.

36
CHAPTER TWO
LITERATURE REVIEW
2.1 Introduction
This chapter reviews literature to the study based on the following thematic and sub-
thematic areas: performance of literacy and numeracy educational programme, PM&E
process, stakeholder engagement and performance of Literacy and Numeracy
educational programme, stakeholder capacity building and performance of Literacy and
Numeracy educational programme, data collection and performance of Literacy and
Numeracy educational programme, data management and performance of Literacy and
Numeracy educational programme, implementing change and performance of Literacy
and Numeracy educational programme, Participatory Monitoring and Evaluation
process and school environment, Participatory Monitoring and Evaluation process
performance of Literacy and Numeracy educational programme, theories underpinning
the study, Theoretical framework, conceptual framework, summary of literature
reviewed and finally the knowledge gaps identified in the study.
2.2 Performance of Literacy and Numeracy Educational Programme
Performance is the ability of a company to achieve goals, meet expectations and
influence the results in an acceptable manner as stated (Gruning, 2002 and Okar, 2017)
The performance end results of basic education are based on evaluation by various
shareholders such as donors, customers, project funders and the community in
assessing the performance of project in recognition of alphabetical letters, proficiency
skills in reading, proficiency skills in speaking, proficiency skills in writing, proficiency
skills in listening, simple arithmetic calculation skills, beneficiaries satisfaction, timely
acquisition of Literacy and Numeracy skills, transition rate to the next class and class
average performance in trying to attain set goal and objectives of the programme. In
defining performance of Literacy and Numeracy educational programme, Performance
project is as a results of activities of an organization or investing over a given duration,
which is measured according to achievement of a assigned duty opposed to present
familiar quality of how accurate one is, speed of the completing and the cost incurred.
Though the completion of tasks depends on application of knowledge, skills and
abilities to perform a certain action, but Klagegg (2005) argues that there is a debate
going on, the measure activity of the project outcome and performance is still on since

37
there is no conclusion which has been agreed upon. However stakeholder should be
able to ascertain the project performance individually and get the feeling of owning the
project at their best. Another argument from Kamrul &Indra (2010) says that
completing any project within specified timeframe, cost, scope vary in dimensions that
should have improved as referred to by project management executives in the anatomy
of research. Thus performance of any project depends on the organizations objectives
and the stakeholders involved.
Performance of projects remains an issue of concern in project management globally
(Nzekwe and Emoh, 2015). This is so because projects involve defined objectives
which need to be achieved and resources allocated effectively to the concerned entities.
Performance of these projects is a concern because an assessment of how well the
projects teams have done in pursuit of specific project goals have not been fully
addressed and especially in participatory approach (Njuki et al., 2006). The goals of
these projects vary from project to project since each project has different goal but all
aiming at good performance hence great benefits to the beneficiaries. From a project
management perspective, performance of projects measurement is considered as
monitoring and controlling of projects on a regular starting points using specific
indicators to measure performance (Ika, 2012). Projects performance indicators are
related to identification and engagement of stakeholders, capacity building, school
environment and stakeholder’s satisfaction (Ochieng and Zoufa, 2014).
Performance of projects are influenced by various inter-related factors like leadership,
clear and realistic objectives, skilled and sufficient staff, realist schedules, and
involvement of key participants (Ngugi and Muhoro, 2014), project performance
aspects needs to receive proper attention from leaders to ensure good attainment of
project objectives. Teaching and learning out comes in the early grades are very low
according to the UNESCO (2011) report. Globally many going to school children have
access to school but student’s evaluation reports from developing countries shows that
many are not able to carry out reading activities (Kordia, Gove, and piper, 2017). Also
less than 10% of children in some countries have not been able to reach the government
bench mark according to their countries bench mark of 7%. Though most countries
have made improvement to the quality of education and formulating the policies, setting
goals and planning for future strategies, the results are still discouraging. Kordia, Gove,

38
and piper, (2017), profound that on scheming for scale –up throwbacks on round and
round on, reading and writing progress in Kenya and Liberia. TUSOME and PRIMR
programme took the initiative of implementing Literacy and Numeracy educational
programme in the country but still there are many challenges facing projects
performance hence government needs to strengthen the weak areas for better results
(Piper, Ralaingita, Akachand King 2016).
In Kenya there has been several researches focusing on implementing intervention
programme in improving learner’s outcomes and increasing school attendances as
profound by(Evans, Kremer and Ngatia 2014). However these studies were subjected
to geographical limitations and generalization of the results for the country. Similar
research results generated cannot be replicated to specific areas due to other factors
which are not found on others areas (Bold, Mwabu and Sandefur, 2013). Secondly the
piloting interventions only discussed large-scale education improvements programme
with mixed results which could not be relied on. That means the authors argument is
valid and needs to be taken into considerations and necessary measures taken to avoid
more programme coming on board and delivering very little compared to other
implementers or failing at all to meet the set goals.
Piloting so many programme at once and generating shortages has fewer educational
effects. Gaps experienced were unrealistic expectations on the basis of how
implementation of change will occur in a large scale of instructions, and many other
factors which were not put consideration during the piloting of those programme (Gove,
Poole and Piper, 2017). Confirmation of intercession impact on education in Liberia is
in short supply at both broad and minor scales at all stages. Davidson and Hobbs, (2013)
examined EGRA results and reading intervention, inadequate literature was observed
to show how studies conducted leading low-performance reading. Both countries had
similar characteristics and needed immediate interventions in literacy and numeracy
educational programme though Liberia suffered a big blow due to Ebola attack in the
country.
The government of Kenya together with USAID and other donor agencies came up with
an agreement to intervene for the learning skills in literacy and numeracy educational
programme situation in the Country after a report which was released after the piloting

39
study on EGRA and PRIMR assessment tools on reading skills and mathematics. The
report was released by MOEST and the research triangle institute RTI international
(RTI, 2014) which provided data on survey report from EdData 11, (2004). This was
carried out by experts stationed in state and county government levels, donors and
citizens to assess their education status in the country. The study found out that the
stakeholders were engaged in data collection, analysis and utilization of results in M&E
discoveries in L&N educational programme but some are not trained and others had no
idea of what is monitoring and evaluation, meaning that there were no desirable results.
Monitoring and Evaluation of any project either government or non-governmental
organization funded projects must be accountable and must yield good performance.
So it is an essential tool in managing both government and non-governmental
organizations developmental projects (Kamau and Mohammed, 2015). They asserts
that a project continues to become more complex as it progresses and project
beneficiaries demands their needs to be met. Although there is restricted details
concerning monitoring and evaluation performance in education projects, Mukuria,
Gakure and Kithae, (2013) on an assessment of elements influencing performance of
primary schools main focusing the underlying issues leading to low performance. The
study adapted a descriptive research design and questionnaire as a data collection tool
which was used to get original information from the respondents. The details were
examined and the findings were not encouraging due many schools having large
numbers and little access to the teacher in the classroom set up. This is an outcome of
free primary education introduced in the country hence compromising the behavior of
pupils leading to low performance in KCPE results and literacy and numeracy skills.
Support from education key stakeholders seems to be deemed necessary to enhance
school administrations’ programme in enhancing the skills in literacy and numeracy
programme. This study concurred with (Loveth, Dan, Ejiofor and chukwudi, 2019).
They profound that monitoring and evaluation has a positive effect on delivery of
improved academic performance but they differed with study on monitoring and
evaluation helping in building educational progamme, assess it in determining its
achievements and its effectiveness ( Disha 2017).
Similar results were found by Mbaki, Okoth and Matula. (2017) study argued that
discipline cases have little impact on performance but cautioned on how parents are

40
involved in the learner’s activities was discouraging. The study focused only on the
overall performance results but did not specifically indicate if it is performance of
literacy or numeracy or only the exams at different levels. There was no evidence if
there was any involvement of stakeholder’s and the process of implementing the
projects in question, both information was reported back on how monitoring and
evaluation was conveyed in tracking the progress of the programme. This study found
out that there was minimal collaboration of all stakeholders’ hence low performance of
the learnt skills. In developing countries piloted projects fail after scaled up to national
levels due to many factors. These factors include systems without data storage and
management to provide information about the school performance (Lepine 2015).
Kenya has become a very conducive environment for any testing of development
projects as found by Piper, Destefano, Kinyanjui, and Ong’ele (2018) examined
whether TUSOME’S programme rolled out implemented the required objectives to
enable government structures and officers to act swiftly in a new programme after the
other programme had finished their piloting. Piper et al (2018) found out that the project
clarified the expectation after the implementation and the subsequent results to be
acquired at the national level for both languages Kiswahili and English as it was being
communicated well at school level unlike before the intervention programme. Studies
by McCormick, Clark and Raines (2015); Killian and Bastas (2015) proved that
learning process involving learners actively increased the performance of results
outcome.
This analysis in Kenya showed a positive developed functional, accountability,
feedback mechanism in tracking the outcomes compared to the benchmark
expectations. However this could led to proper utilization of results which encouraged
greatly the stages of instructions supported in Kenya’s level of education structures to
have been really supported hence great improvement. Hilhosrt and Guijt, (2006) argued
that there are limitations found in TUSOME project which were unsuccessful in
exploiting the obtained classroom observation data to better instructional materials. The
program external outcome displayed that programme effects of 0.6-1.0 standard
deviations on English and Kiswahili studying end results.

41
TUSOME programme effected useful classroom observations results systems within
government systems though the usage of these systems differed greatly across the
country. Classroom visits were regular and never fall short of target rate of performance
though in some situations teachers were provided with information which were not
incoherence with their set target neither their relationship between teacher education
quality and learners learning and achievement ( Bourrke,, Ryan and Lloyd, 2016). This
results differ greatly with other scholars about classroom observations and the outcome
Hilhosrt and Guijt, (2006). The current study is going to investigate how implementing
can be made consistence in government systems, supervision and timely feedback in
literacy and numeracy educational programme.
In project management field over the years, the dimensions of project performance are
considered and applied to measure project performance and stakeholder’s satisfaction,
resource management, capacity building, data collection and analysis in accomplishing
project objectives. Importance of tracking project output levels are essential (Barclay
and Osei-Bryson, 2010). An analysis carried out on inclusion of many categories on
production and the progress of performance of literacy and numeracy are under way
(WI and Jung, 2010). Performance of Literacy and Numeracy educational programme
will be guarded using the conventional methods in terms of rate to complete project
within stipulated time, completion of project within the finances and bearable standards.
The study focused on team satisfaction basing the argument on a mixed method and
performance qualifications of stakeholder’s contentment (Toor and Ogunlana, 2010).
Additionally, basic education projects like literacy and numeracy in Kenya, main
stakeholders are teachers, learners, parents, government and the funding agencies who
are key in ensuring projects performance during the implementation period. Many
studies have been carried out on access to, quality and outcomes of learning but very
few have concentrated on participatory monitoring and evaluation process of involving
the key stakeholders in the operation of teaching skills hence need for study.
Reading capability of learners in primary level and specifically on comprehensive
problem solving is a predicament as stated by Cimmiyotti, (2013) on effect of
arithmetic calculations in lower grades. The results found out that relationship linking
reading and arithmetic’s problem solving are missing since the concept of literacy was
not well conceived making calculation of simple arithmetic not achieved. The study

42
analyzed the correlation between academic performance in reading and attainment
performance of math’s at the lowest stage. Data was collected from 95 students from
grade 1, 3, 4 and 5 basing argument on three assessments on a great scope, eloquence
and lexicon. Mathematics performance was conducted basing on summative
assessment performed at different intervals in the year 2011-2012 academic year. The
results proved that there was correlation that existed between reading and mathematics
performance at every level. This was found at grade three and four which yields similar
results that there was correlation that existed between the two subjects. Hughes, Powel
and Stevens, (2016) argued that y the end of grade one learners are supposed to have to
have understood the concept of literacy and numeracy well before proceeding to the
next class but this is not the case in most instances.
In grade two no relationship between reading and mathematics performance was found
since very little comprehension text are found in grade two and one. The study found
gaps that were not addressed, among them the methodologies used in teaching the
young learners and did not determine the directionality of the relationship of the two
subjects thus led to the current study. The strength of reading is experienced in other
grades like grade three, for, five whereby they have now developed an advanced
learning skill than in lower skill (Cromley’s, 2009). Still Vilenius-Tuohimaa, Aunola
and Nurmia, (2008,) in their study they found that out practical reading capability could
forecast a high of skillfulness at reading comprehension and mathematics issue solving
but Yumbya and Githinji, (2019) differ with their findings in that, reading and
calculation of arithmetic’s wholly depends on learners ability to reading activities like
sound, word, shape, fluency and color reading and not how one is really experienced.
The study further explained how to control practical reading, the covariance connecting
the word difficulty solving and reading comprehension was experienced. The
explanation goes on to proofreader having substandard decoding skills struggles with
reading the texts in a comprehension and usually they are never able to perform the
tasks which requires reasoned thinking and think rationally in well planned manner. So
in this case the study did not explain how the learner will be helped to get the concepts
hence the need for this study which showed the skills needed in teaching the subjects
so as the learners to acquire the skill.

43
Similarly, Piper, Ralaingitia, Akanch and King (2016) focused on making better
procedures and ideas of mathematics results: confirmation from disarrayed and
managed trials in Kenya. Their main aim was to better the teaching results through an
intervention called PRIMR. They found out that numeracy program intervention in
developing countries lacked support that help teachers in teaching and learning process,
modelling and teachers coaching skills were inadequate in learning institutions. They
cited an intervention program carried out by Research Triangle International officers
(2014) undertaken in two countries namely Uganda and Kenya (EAQEL) East African
Quality in Early Learning, to support educators to better standards of L&N guided
methodologies in grades one up to three. The assessment showed that there was no
effect neither in Uganda or Kenya upon the application of the intervention methodology
since the results remained low. PRIMR program was implemented in four Counties
both public and informal institutions in Nairobi County in year 2013. This program was
built the Kenya Institute of Curriculum (KICD) which has many elements applicable to
the basic primary outcomes but still there was low reading skills in literacy and
numeracy. Gove et al. (2017) on improving education literacy outcomes in Kenya needs
rigorous supervision and trainings in line with the new techniques in teaching skills
The findings of Piper, Ralaingitia, Akanch and King, (2016) found challenges
experienced, inadequate supervision of Curriculum Support Officers, inadequate
instructional support to teachers in the classrooms by government officials. This is
confirmed by a study undertaken by Piper and Zuilkowski, (2015) who found that the
participants of the program are the Curriculum Support Officers who have various roles
and limited time to perform their duties effectively. Trainings of teachers during
workshops took very few days specifically only seven days in a year meaning it was
very short time to acquire enough knowledge teach literacy and numeracy skills hence
low performance in delivering the content. Teacher training Colleges gives the initial
training and teacher developments depended wholly on teacher attitude at the same time
the knowledge and skills they acquire during their teacher education (Gregory and
Robert, 2017). These teaching syllabus in these colleges are in short of methodology
on Literacy and Numeracy skills hence need to investigating how capacity building on
teachers is done and the influence it has on the learners’ outcome.

44
Grimm, (2008) did a survey on early reading experts and developments in arithmetic’s
expertise and found out that the relationship in early skillfulness was different in
arithmetic’s as it was tested in wide-range. In trying to address these challenges data
was collected to help in interpretation of mathematical concepts and a longitudinal
approach was administered to third grade in reading comprehension and mathematical
concepts whereby a positive significant relationship of change was observed. Data was
collected from a very big Chicago public school with a number 46,373 grade three
learners and were administered with the standardization measure from IOWAS test for
basic skills. This was followed by formulating many models that were made to show
the correlations between performances of the same learners from third to eighth grade.
The study concludes that learners in third grade had different ways of understand and
solving simple mathematics calculations. This findings concurred with the study by
Rutherford-Becker and Vander wood, (2012) on the relationships linking reading and
mathematics performance. The findings were that early studying skills are significant
for victory in arithmetic’s, and other related subjects. The current study focused on how
literacy and numeracy influences the performance on educational programme. In this
case literacy walks hand in hand with numeracy though a thorough investigation needs
to be done on how mathematics concepts can be computed to enhance reading skills.
Also perusing understanding as studied by the maze take part in a more powerful
character in predicating relevant mathematics performance compared to spoken reading
articulacy. The study did not explain more on methodologies used in teaching the
subjects so as to yield better performance triggering the investigation of this study
(Rutherford-Becker and Vander wood, 2012).
Learning of mathematics has been an issue in schools (Shannon, (2014). He further
continues to argue that literacy instruction in math’s classes focused to address
problems on methods of teaching mathematics in order to produce positive results.
Secondary data was used to address the problem and 36 publications were used in the
study. They further divided the study into categories groups, the relationship of reading
and the reading performance to mathematic performance, the relationship of
comprehension of reading and the comprehension of mathematics problem, vocabulary
instruction in reading and mathematics and finally a specialized instruction in reading
and mathematics. The findings produced a number of results like the problem of the

45
relationship of literacy and numeracy has been researched for so many years and the
main problem being at the lower grade one to six.
The main finding proved some correlation between reading performance and
mathematics performance but no mathematics to reading relationship. In the case of
proficient reading performance there is a correlation which translates to mathematics
proficient, but no mathematics proficient performance translated to reading skills and
does not appear too directly correlate in reading skills. Though reading performance
and mathematic performance happens to have a common correlation on instructional
strategies of conducting thinking- aloud, providing direct instruction, modelling and
using graphic organizers that may appear or have a positive impact on both literacy and
mathematics learning hence good performance of the educational instructions.
Learning of languages in Kenya has been a concern for many years especially when the
national exam results are released and an outcry that, either Kiswahili or English has
been performed poorly concurring with an observation made by (Piper and Zuilkowski,
2015).
Literacy and numeracy education programme has very worrying results to the educators
and community at large as stated in one title, assessing reading eloquence in Kenya,
verbal or restrained assessment, found out that in the first years of implementation of
these programme there was a slight improvement on reading outcomes but the
participation of key stakeholders was absent hence poor performance of the skills (Piper
and Zuilkowski, 2015). However extensive dissimilarities in education involvement
have been noticed all over Kenya boundaries and Nairobi being one of them. This study
was supported (Mugo, Kaburu, Limboro and Kimutai (2011). In their study they argued
children can access school but what being is taught cannot be seen until the learners are
tested and test scores gives the outcome of learning. They found out that most children
could not read a lower class text fluently. They recommended that an M&E system
should be practical and not theoretical manner so that supervision and accountability in
the learning process can be made a reality. In their study they found out that most
classes were left unattended due to absenteeism of teachers. Mugo and Oleche (2016)
however concluded that lack of proper mechanism of supervision in education systems
was much pronounced and need immediate action.

46
However research continues to show that literacy interventions are impactful on the
reading ability of children but they have not been fully investigated on how they should
be cubed to end the menace (Miller,et al 2014; Siddiqui, Gorard and See, 2016) .
Literacy programme are implemented on a wide scale such as the Success for All in
New Zealand and the United States have recorded impacts up to a meaningful
information (Bowman, Kimberly, Chettleborough, Jeans, Rowlands, and Whitehead,
2015). Further, an impact evaluation of Reading Recovery programme among first
graders in the United States established the effect of size results as confirmed( May,
Gay, Sirinides, Goldsworthy, Armoj, Sam, Gillespiey & Tognatta,2013). A similar
literacy programme implemented in public schools in South America found a positive
effect of reading interventions on student achievement (Carnoy and Costa 2015).
Nationwide interventions in Jordan and Egypt have recorded comparable results
(Brombacher, Nordstrum, Cummiske, and Mulcahy (2014).Other African and Asian
countries had moderate to large impacts of literacy interventions compared to Kenyan
educational interventions.
The impact of the Literacy Boost programme implementing done in several countries
including Mozambique, Pakistan, Ethiopia, Nepal and Malawi found to be moderate to
large effect sizes of 0.27 to 1.21 by a study (Guajardo and Ochoa,2012).These results
show that reading interventions have been effective in improving the reading skills of
learners. However, there is a scarcity of factual proof on how improved reading ability
translates to outcomes in the performance of languages as academic subjects (Gao, Mo,
Shi, Wang, Kenny and Rozelle, 2018). Nairobi County is the head quarter of all
intervention projects but little has been achieved on performance of literacy and
numeracy educational programme in the County. For that reason this study establish
the extent to which PM&E process and school environment influence the performance
of learning skills, an appropriate approaches which will focus on the measures of
programme performance(Fortune and White 2006). This will go beyond the classroom
assessment, observation, stakeholder capacity building, data collection process and
utilization of results. The study focuses on how data is collected, analyzed, managed
and implementing change so as to make use of information gathered, well the projects
are ongoing.

47
On literacy and numeracy educational project intervention study conducted by Linda
(2013) on the use of intercessions on encouraging perusal growth amongst wrestling
students consisted two studies containing different intercessions. The main aim of the
intercession was to analyze both quantitative and qualitative feature of elucidating
intercessions methods encouraging pupils reading growth. One study used computer-
based method while the other applied both methods for example use of computer-based
method and training programs. One programme focused on phonology while the other
focused on reading comprehension.
The study targeted 25 pupils and 18 teachers, the results interviewed and showed a
positive and successful reading ability of learners and motivation to both learners and
teachers upon the completion of the intervention programme. In conclusion educational
technology-interference in reading instructions and stern substructures combined with
the individual participation with positive influence on the favorable interventions hence
good performance of the skills acquired. Performance of mathematics in most schools
is low according to the findings on educators interconnected elements influencing
students’ performance of arithmetic’s at Kenya certificate of primary education in
public schools in Likoni Sub County as observed by (Murungi, 2016). The educators
readiness was absent in the conveyance of mathematics information, teacher
methodologies and in-service trainings were inadequate and lack of motivation was
experienced by teachers as posited by (Piper and Mungenda 2014). Njaggah, (2003)
had similar results on influence of performance in arithmetic’s among public secondary
school students in Nairobi County which established the extent to which attitude of
students and Mathematics teachers motivate the performance of the subject. The
findings indicated that teachers do not motivate the learners since teachers are never
also motivated. Preparation of learning was inadequate and not in line with the
engagement plan of stakeholder plan. Both studies lacked the engagement process
which requires good planning, motivation of both learners and teachers hence low
outcomes. Proper engagement of stakeholders should take place in an organization such
as learning institutions whereby proper channels of communication, assessments,
resources and reporting should be given a priority so as to gain more benefits. To bridge
these gaps the current study sought to establish if stakeholder engagement influences
the performance of literacy and numeracy educational programme.

48
A study by Piper, Jepkemei and Kibukho (2015) on poverty-stricken areas (PRIMR)
surpassing early reading skillfulness to learners from humble background in Kenya are
endangered of having difficulties during schooling results complications, mostly in
writing and reading. Many learning areas connect substandard reading end results with
poor planning, assessing wrongly, and involving people who have no interest on
literacy and numeracy programme hence poor performance both in primary and
secondary schools. This poor attitude leads to very low inputs in the learning
institutions which greatly affects the society economically, hence leading to poverty,
when merged together exceedingly limits the educational opportunities for learners who
have a humble background. In this case PRIMR starters devised a way of supporting
studying boast in grade one, two students in the piloting schools in the country (RTI,
2015). The study used randomized controlled trail bespeak on literacy skills and
educational methods. To align this they tried to establish the results of intercessions
whereby it employed fundamental ability to read and write in choosing carefully rough
calculation of temporary consequences in learning to gain good grades in grade one and
two learners from humble background as also found by ( Crouch and DeStefano 2017)
. The study found out that PRIMR has efficiency in for pupils coming in poverty
stricken families whereby ability to read and write intervention will be applied in
improving the performance of literacy. So in this case all strategies applied were
advocated since they helped in improving the performance.
Teaching methods vary according to various methodologies as put by (Marima, and
Runo 2016). Instructional restrictions in educating of Readers in Early years grades in
Nairobi County focused on identifying proceeds towards teaching reading in early years
of learning and adapted the descriptive research design using the survey and
observation technique which was carried out in 20 schools. Methodology used in the
study was descriptive survey design, an in-depth interview, filling of questionnaires,
retrieving of information from the tablet which was the simplest and easiest gadget to
use in collecting data. This data was transmitted immediately after classroom
observation to M&E site and all the shareholders participating in the programme.
The findings were, lack of resources which was the greatest challenge, poor
methodology and techniques of teaching, lack of systematic techniques of reading and
children not going through nursery school preparation. The study lacked

49
comprehensive information of how it collected data, analyzed it and later how it came
into conclusions of the findings. There was a gap in explaining how literacy should be
taught since the content in the syllabus does not suggest ways of how to teach it
(Gathumbi, 2005). Marima (2014) support the findings that teaching literacy needs new
methodology of teaching sounds and letter recombination. There is a gap which needs
to be investigating by current study on how training of teachers can be improved on
teaching methodology of literacy and numeracy specifically reading skills and
arithmetic calculations in grade one, two and three respectively. The current study
sought to examine the extent to which project intervention help in cubing the menace
of poor reading and arithmetic calculations in public primary schools hence to avoid
poor performance in national exams as reported by (KNEC, 2012).
2.3 Participatory Monitoring and Evaluation Process
Participatory M&E process is concerned on hardening primary shareholders’
participation as energetic involvement in intercessions leading in tracing and inspecting
advancements together and give the outcomes and decide on the way forward so that
they can improve project performance (Kusek and Rist, 2004). This proposition play a
part in ways of pre-planning and decisiveness and worked upon ways of accountability,
with efficient way of channeling information and feedback loops in the programs and
agencies. Participatory M&E process is a procedure used in involving stakeholders at
levels and engaging them in M&E specific project, strategy, jurisdictions and
procedures on end results of M&E pursuits taking part in recognition remedial steps
(Guijt, 2009; Merlinna 2014).
The stakeholders who should decide on how progress should be measured must follow
certain points of references in deciding the utilization of results, use of corrective
textbooks and other necessities in education for better performance to be experienced
(Gaventa and Guijt, 1998; Piper and Mugenda, 2014). In this case the concern should
go beyond tracking progress by making use of data collected and analyzing it, while
giving feedback to the beneficiaries of the projects and making proper utilization of the
results gathered. PM&E process attempts an interior study procedures that authorizes
individuals to throwback over encounters, inspect present-day real life, reverts
objectives and expound later strategies by accepting separate shareholders' ideas and
arranging inherent divisive opinions and profits (Estrella et al 2000). In these processes

50
the stakeholders participate in developing to measures and gauging, in accumulating
and analyzing the data, taking corrective measures to modify pursuits learning and
implementation process. They are also supposed to develop ordinary comprehension of
PM&E concepts and goals same time identification of restricted lexicon and
expressions identical practical word, use of methods and tools that encourage
participation and the reason why it is important to their lives and the project (Merlinna,
2014).
A study by Sokol (2015) focused on executing of a participatory propositions to M&E;
publications reviewed and a case study appealing to revealed that wide involvement of
shareholders enhanced standard and acceptable M&E but did not explain much on the
level of involvement and how they are engaged in data collection and analysis thus the
inquiry is seeking to investing this aspect. Lucas, McEwan, Ngware, & Oketch, (2014)
posited that improving primary school quality across country is quite involving and so
all the stakeholders must have a hand on it.
A study carried out by Dubcek and Gove (2014) on the early grade reading assessment
(EGRA) and its hypothetical footing, determination on demerits which used to inform
education systems and programme on how to scurf fundamentals of literacy skills. For
students beginning to reading at lower level grade focused only on very few items
instead of showing how these projects are going to be monitored and by whom, when
and where. The findings showed that the increasing volume of particulars to suffuse
institutions is condemnatory to improve teaching students lacking fundamentals skills
(UNESCO, 2014; Wagner, 2011). Study lacked proper steps of participatory process
which is involved in learning so as to get the right results, therefore it is in this line that
the study investigated the steps of PM&E process and observed that the concerned
entities did not follow the right procedures in teaching methodology and lack of
motivation both to learners and teachers was very much pronounced to the extent that
teachers absented themselves from schools to do their own things which could give
them an extra income.
Low numeracy skills and how they are used in daily basis correlate as profound (Redder
2017). Frequency of numeracy usage practices appears applausive from a specific
context of economic constraints thus affecting adults who were not able to get the right

51
concept at lower grades hence more problems at advanced stage when one is a grown
up (Green 2017).Studies on literacy and numeracy educational programme have been
carried out among them Ouko (2015) on how to demonstrate grade one learners
educational attainment in literacy and numeracy. The effects of nursery school
educational involvement, and the effects on Literacy and Numeracy attainment which
was conducted in Gucha District. The study targeted public and private primary schools
in the District. Methodology applied was Purposive and stratified random sampling
techniques consisting 154 students and 8 educators. Descriptive and inferential
techniques methods was used to analyze data. Statistical Package for Social Sciences
(SPSS) was made use of in data analysis. Analysis of Variance (ANOVA) methodology
tested null hypotheses at 0.05 level of significance. Results disclosed that students
performed well in arithmetic’s in comparison to reading this is so since comprehension
is more connected to mathematics reasoning and word problem solving (Bjorn, Aunola
and Nurmi, 2016). Nursery school studying on occurrences of educators on self-
reliance, kind of school they went affected the student’s attainment in Literacy and
Numeracy. The study emphasized critical character in taking part in nursery school
involvement in upgrading educational attainment. Major commendation, were surpass
pupils‟ improvement on L&N, parents and head teachers must make sure that learners
qualify nursery school, have adequate school preparedness to grade one curriculum.
More emphasis on government to formulate policies and curriculum to be made
mandatory. This study emphasized on the entry of grade one but did not explain how
they are taught neither give the process of learning while in school. The gap widens on
how each participant was involved in the participation process of learning. The sought
to establish the extent to which preparedness of pre-school learners influence the
performance of grade one and in general the performance of literacy and numeracy
educational programme.
A study by Runo, Kabutha and Kamau (2013) focused on teachers, methodology and
resources exploring chances and predicaments in teaching to read in primary schools in
Kenya. Discrepancies aimed at ascertaining teacher’s capacity to teach reading,
utilization of materials and challenges experienced while teaching reading by teachers
are many but TUSOME programme slightly solved this problem by training teachers
on how to deliver quality instructions in literacy and numeracy (Dubeck, Jukes,
Brooker, Drake and Inyega 2015). A mixed method was used and a purposive sampling

52
of 8 urban schools in Nairobi and Nyeri, were sampled. They found that despite what
test score you get, you proceed to the next grade. They resulted in final decision that
several teachers neither taught reading nor knew methods to use in teaching reading.
A third of the teachers (31.1%) used phonetics, while the other group favored the
whole-word method. This automatically shows that lower grade teachers are ill-
equipped with methods of teaching reading, while remediation practice is hardly a
focus. It is necessary to introduce reading as a subject at the teacher training level and
designate reading time through the primary education course. This shows that there is
a gap in teaching methodology in delivering the content to the learner’s hence low
performance on literacy and numeracy experts. On this basis current study posits to
establish the extent to which teacher capacity who are the stakeholders can fully be
addressed so as to help these learners.
An empirical study by Kathomi (2015) sought to demonstrate a relation linking parental
participation in literacy evolution of preschool. The written work was reviewed and
discussed on the understanding of parental predication according to the research, the
position at institution parent’s participation, parental inclusiveness early years of
schooling and parent’s ability to read and write and growth concentrated on diverse
reading programme in separate countries. The investigation used a Correlational
Research Study Design to narrate in quantitative expressions at a level to which parents
participation in ability to read and write growth are interconnected. Stratified random
sampling was used to prevail a stratified random sample from public and private schools
in Langata Division.
The study demonstrated positive correlation linking parent’s participation and literacy
growth of pre-unit learners. This correlation is intensified by schools facilitating
parental involvement by use of unfold parent-educator connections and putting in order
institutions meetings bring together teacher and the parent together. In this regard of
the outcomes, the study advices a policy to be formulated on parental involvement in
the school program private and public. The study tried to bridge gap and only used
research design, and in this case both descriptive survey research design and
correlational research design will be used to bridge this gap. The current study sought
to investigate how parental involvement influence learning of pupils in lower grades.

53
An annual teaching evaluation report dubbed “Are our children learning?’ revealed that
engagement of stakeholders like teachers in school attendance in Nairobi County is
58% while the other Counties is above 85% hence most of the time learners are not
attended to (Mugo, Kaburu and Limboro, 2016). Further, the study demonstrated that
lack of reliable data indicating the number of children out of school, those who have
repeated, those who are not able to read and do simple mathematical calculations are
scanty and cannot be relied on hence need for this study to bridge this gap. Similarly a
study by Matonda et al , (2013) focused on quality, equity, access to and impacts thus
performance outcome is left out which might help in gauging up the learning process.
The study seek to establish whether quality assurance used in Kenyan education setup
is really a way of PM&E process or a practice.
The findings of Mugo, Kaburu and Limboro, (2016) indicate that it was indeed that if
it is quality assurance practiced or PM&E process though the officers concerned needed
to go through a peculiar instructions on PM&E. Setting up of institutionalized
framework to guide its operations is required so as to have formal trainings into practice
and hence the teachers who are promoted directly from the classroom level and
expected to generate inclusive reports without prior knowledge on the same. So this
gap affected the usability of the assessment reports especially when transmitting data
to the concerned offices. To some extent this study but failed to address the issues of
engaging all the stakeholders, how capacity building was addressed, and how each
stakeholder was involved in implementing the changes in education so as to yield good
performance. This needs to be addressed comprehensively in the current study which
is under investigation and the influence it has on the performance of literacy and
numeracy learning skills.
The role of PM&E programme including government corporations development
authority in Ewaso Ngiro as established by (Muriungi, 2015). He says there is an
increasing demand for organization to boost the results of the project, which has led to
several studies, although the take-up is small. The study method used was descriptive
research and the target group was 149, using 113 respondents with a non-probability
sampling. Data was collected using a questionnaire and analyzed using SPSS. The
results are inadequate M&E skills, lack of resources, finances, staff shortages, weak
infrastructure and lack of knowledge which hindered PM&E process, particularly in

54
line with the participatory method. Lack of accountability and involvement of
stakeholders in the process. Guijt and Hilhorst, (2006) in their work state that each
person or group of individual projects should participate entirely in all program
activities, or they would lose trust and project ownership.
2.4 Stakeholder Engagement and Performance of Literacy and Numeracy
Educational Programme
Identification of stakeholders is precondition for and participatory planning procedures
in PM&E process which have procedures through which partners at different levels take
part in discussing or evaluating a specific aspect in programme, follow-up procedures
to review and assess monitoring and assessment. According to Tzanakis (2013) the
PM&E process focuses on the diverse participation and involvement of important
stakeholders at different levels. In a study investigated by Ngatia (2016) on institutional
determinants of PM&E process system executing amongst members of projects in
Kibera slums Kenya, found out that resources allocation, institutional accountability,
management support, staff competency have a great influence on PM&E process
system in executing for any project to succeed. In support also in engagement of
stakeholders helps in solving project problems and can also help in getting more
funding or assets of the projects (Rodriguez-Melo and Mansouri, 2011; and
Greenwood, 2007).
Participation and engagement of TUSOME and EGMA projects are the ones currently
undertaking the process of literacy and arithmetic intervention skills in schools and
should try to see to it that they have involved stakeholders in acquisition of knowledge
and implementation of the same so as to cub the already existing menace on low levels
of performance on the projects (Piper and Mugenda, 2012; Piper and Spratt, 2013;
Brombacher Mulichhahny, Downs, Nordistrun, Scumuskey and Davidson 2014). By
doing this the stakeholders will solve a problem of who should have the skills required
so as to have effective communication, be innovative, proactive, and prioritization of
activities in the projects. The involvement of the stakeholders will help determine the
stakeholders concern and integrate them in designing and collaborating them in the
project development and communicating effectively among themselves (EL-Gohary,
Osman and ELDiraby 2006. The engagement procedure might be in another place at
separate levels according to the suitability project. The current study sought to examine

55
the extent to which engagement of stakeholders influence the performance of literacy
and numeracy educational programme.
Parental involvement in children learning process is very vital and makes the child have
courage in meeting the new challenges in life when they are coming out of home in the
first time as was posited by Kathuku (2013) on the elements affecting parents’
participation in youngster’s educational attainment in early years schooling in
Kathonzweni. Majority of the parents do not fully take part in early childhood education
as shown by the results generated on most parents are below poverty level, literacy
level, marital status and Cultural beliefs were significant in the way they participate in
early years of schooling. The study failed in explaining the level of involvement, even
if most of them are below the poverty line and more so explain how the cultures affects
the learning of literacy and numeracy hence the need for the current study.
A gap in this study is that lack of proper participation of all the participants yield poor
results and projects failure in implementation. Involvement of stakeholders needs to go
past usage or gift of free work and money commitments and reaches out to approach
choices. Individuals need to appreciate fundamental flexibilities in order to have the
capacity to openly convey what needs be and to build up their maximum capacity in
zones of their own decision. Long (2009) noted that acknowledgment and support for
more prominent association of nearby individuals points of view, learning needs and
aptitudes displays a contrasting option to benefactor driven and pariah drove
development. The findings were that failure to proper engagement of stakeholder’s
leads to failure of projects performance. PM&E process does not only mean using
participative skillfulness within a transmission of M&E set up but also critically
analysis the starters ideas and takes up the procedure, at the same time the beneficiaries
satisfaction (Guijit, 2006).
At the central part of PM&E process there are 4 big propositions. Participation-
methods which Wide up the blueprint of the procedure, to combine most rightly
pretentious, consenting to analyze data collectively; the incorporating Participatory
M&E process , requiring discussions, agreeing on methods of gathering data, the tools
used in gathering data and which methods were used in analyzing data. Criteria applied
to share information and action taken by different stakeholders hence leading to

56
teaching becoming basis of subsequent improving and taking correct action in
performance of projects which are ongoing. Finally the fourth step is the number of
stakeholders, their roles, skillfulness of shareholders, their outside surrounding, and
other elements changing as time goes on, to lead to suppleness of the team leaders which
is very essential in project performance.
Nationally and global education law makers have increased in focusing standards of
what children ought to undertake while in school and having in mind skills which are
helpful after leaving school (Wanger, 2012). The insistence are revealed on recently
developed suitable goals adapted in 2015, the fourth goal that safeguards inclusivity
and balancing standards of education promoting lifelong teaching targeting the highest
number by 2030 ensuring that all the youth and a substantial adult attain Literacy and
Numeracy education skills (United Nations, 2015; Piper, Zuilkowski, Kwayumba and
Oyango 2018). These assessment tools used in learning institutions are viewed to be
instrumental in education transformation and boosting positive productivity while
maintaining high performance in literacy and numeracy hence helping every individual
to acquire self-confidence and reliance (Hanusheck and Kimbo, 2000).
Stakeholder or multi-shareholder analysis is a way forward of approaching course of
action in obtaining comprehensive system through identifying the key players or
shareholders in the organization structures in evaluating irrespective of their likes in the
organizations (Grimble and Chan, 1995). These Stakeholders incorporate the particular
categories high-flown or those influenced by the strategies, resolutions, measures
methodology undertaken. Including key stakeholders in developing countries is critical
and prosperous for PM&E structures, combining distinct views from all citizens and
incorporating them into the project leads to ownership and possession. A stakeholder
investigation is another aspect of helping in identifying and engaging stakeholders in
any project activities (Rietbergen- and Narayan, 1998). Stakeholder’s identification
and their interests, their way of taking part and authority in the involvement strategy
which is a mandate for all of them to be part of the progress. Stakeholder investigation
makes certain stakeholders not be sidelined during PM&E process while also in sharing
duties in PM&E process which will ensure success of the projects.

57
A study by Njuki et al, (2006) focused on PM&E process at organization alignment,
separate stakeholders are incorporated in the research and evolution of projects
inclusive of bodies who also participant in explaining project intentions and pursuit, in
making decision of what to be monitored and evaluated. They take part in growth of
indicators in choosing carefully the attainment of objectives and the affluent of
completion of activities by key stakeholders hence project success. The findings were
that PM&E process is integral in all institutions whereby if there is lack of proper
learning will take place therefore low performance in any project being undertaken.
Also if key stakeholders participant in the project they require a lot of negations,
prioritization of things to be done first, and by who and at what level should they be
involved. For data collection process they found out that there should be specific
stakeholders to collect data so that key issues to be put under consideration for making
PM&E process well organized and successful. They were limited to the following while
undertaking the process for example they were supposed to promote issues of culture
reflections and learning, ascending of PM&E process and assessing the effects of
procures, integrating gender and equity into PM&E process, negotiating and sharing
roles and standardization and comparability. They also advocated ultimatum
experiences for formulating indicators, objectives and execution of Participatory M&E
structures. So the setting up of the systems should be very accurate so as to enhance the
technical process of developing results, collecting data, analyzing and interpreting it for
corrective measures and making decisions. There was another challenge of the process
being very expensive in terms of time, human capital, resources and sustaining the
Monitoring and Evaluation facilitation especially at the initial stages.
A study by Antill, (2013) focused on the accomplishment of early years on the ability
to read and write and growth in educational favorable outcome in the academic
formulation inferences instructive principal’s instructors and the implications of not
involving the key participants in learning. The study findings were, although early
childhood education programme have improved significantly early learning and
preparedness of learner’s for formal education, doesn't suit pupils; however learners
lack connectivity of home and school environment and the adoption of new things in a
new environment of schools and introduction of literacy and numeracy skills which are

58
mandatory for starters.Leaders governing education and teachers should prepare well
and face confrontations of making sure all learners, irrespective of educational
capability and literacy growth before going to school, acquire stipulated standards in
attainment of accepted grades. The execution of literacy intercessions should
collaborate with all the education directorate with crucial instructions to educators on
greatest application and execution of the syllabus, with the assistant of bringing up
encouraging relationship linking the school and home, to most prepare for the literacy
requirements of the learner (Fullan, and Quinn, 2015).
An investigation by Randall, (2011) focused on the effects of submissions of student’s
written works to understanding and behavior of both the classroom teachers and their
learners. Application of Title Recognition Test (TRT) and Reading Attitude Survey
(RAS), 3 hypotheses were correctly tested but they did not show any relationship
towards teaching attitude and learners reading habit or performance of the learnt skill.
A gap still exists since the study did not provide the way forward on how to handle this
menace of teaching reading skills. So there is no engagement of the teachers on the
learning skill of the children hence they need to engage themselves in learning for better
performance hence need for the current study.
Participatroy monitoring and evalaution process encourages the participation of all the
stakeholders in a project for better results as it was found by (Otieno, Munyua and
Olubandwa, 2016). The analysis of impact of PM&E on stakeholder analysis and
project expectations in the Local Authority Implementation Action Planning
(LASDAP) in Bondo Sub-County, Kenya,. The study adopted descriptive statistics
whereby analysis of data was conducted using frequencies, means, percentages and
standard deviations to control the alliances and tendecys in the relations of variables.
Findings of the study revealed that PM&E process changed the LASDAP procedure
particularly stakeholder relationships and the output of the project inrespective of
quality. Further, PM&E process was found to ehance good administation in terms of
increased accountability and transparency and timely responsiveness to the citizens’
needs. The study, however, would have adopted correlational examination to proof the
connection on strength of variables, thus current study.

59
2.5 Stakeholder Capacity Building on Performance of literacy and numeracy
educational programme
This process of stakeholder capacity building aims to develop a common understanding
of the conception of ideas and propositions of involvement, M&E indicators, and
application of diversify instruments and methodologies which include official study
groups, seminars and conferences on training different levels of evaluation. It engages
different techniques that urge involvement of single persons in the group. Building the
capacity requires several methodologies for example maturity of proper thinking and
involvement in PM&E process concepts and goals that will influence the performance
of literacy and numeracy projects (Estrella et al 2000). The team leaders should be able
to identify the restricted words that are equal to practical expressions for M&E,
involvement and measures in facilitation projects success.
Several definitions of training have been defined differently by different scholars who
have different views on what training is all about and what it entails. Nadeem and
Sujuit, (2012) defined training as the process of transmitting and receiving information.
Omo (2011) sees training as any process anxious with the extension and devolution of
aptitudes, skills and abilities of employees in performing certain specific job skills with
an aim of getting the desired results. Training is mainly met to improve the existing
skills and add more knowledge and help in becoming different in attitude and behavior
of the people attending trainings and in this case the teachers are the main culprits of
the training being introduced by the funding organization.
The use of methodologies and apparatus that coax involvement of single persons in
groups, like visuals, game-playing, class observations by the teachers and curriculum
support officers, learners and the project implementers from the programs in question,
planning and gathering information, analyzing it and managing to influence the
performance of projects. Conversations on PM&E process is significant to existence of
the people involved in the project is very vital because it changes the livelihoods
through learning process (Njuki et al 2016). Another study by Stephanie and Sabrina,
(2014) on stakeholder investigations and arrangements in projects on related outlooks
to stakeholder relationships ontologically focused on why projects fail and the findings
were unfitting communal interplay linking projects stakeholder and the project
implementer’s thus poor performance of the projects. The study focused only single

60
case which did generalization of the results and on a very minor section. This study will
involve several projects and aims to collect enough data to make proper judgment about
the projects under study.
Many reports concerning education in Kenya has brought lime light on what is to be
done in literacy and numeracy learning skills which are a menace in the Country. This
reports have helped in getting the baseline , mid-line and end-line information which
has really given green light on how to handle the issue and one of them was given by
Steering Group (2016) in Mombasa county on building capacity to address literacy
challenges and enhance democratic engagement in västernorrland and Mombasa
county. They encountered many myriads while undertaking the struggle to write report,
from secondary literature on government and organization reports, empirical studies,
and web articles on literacy and numeracy in Kenya .In spite of significant gains in
more extensive opportunities to primary schooling, existing facts in literacy and
numeracy outcomes in Kenya remains insufficiently ingredients. The findings in the
report were, little has been done in relation to literacy and numeracy outcomes in Kenya
and capacity building to inform better literacy outcomes thus the research gap
necessitated the investigation on the influence of stakeholder capacity building on
performance of literacy and numeracy skills in Nairobi Country.
Similar information was also given by UNESCO (2012) that although progress has been
made still low performance is found in recent cases, however entry to teaching, how to
read and write the output is at the bottom in most countries in sub-Saharan Africa.
Cvelich and Gove 2010; Uwezo (2013) observed that many countries in sub-Saharan
Africa has a big number of learners who do not attain useful information of literacy for
classes 1-3. Achieving early-grade literacy is consequently the global policy items, as
ascertained by several meetings to give initiatives of the way forward. The World
Literacy Summit guided by Oxford declaration (World Literacy Foundation, 2015),
requested for quintet fronts lines that needed strong evidence on the bases of why
universal literacy is paramount to oneself, country’s success strategies of practices that
have great effect to the economy of the Country.
Stakeholder capacity building is another area which the research gap remains unknown
and especially in offering trainings for monitoring and evaluation to officers (Amwayi,

61
2016; Makori, 2015). It is important to have trainings, regular reviews of what has been
learnt so that there could be better results. Implementation and training of stakeholders
in any programme is key since it is the only way of being able to select project
indicators, information from baseline, mid-line and end line information all put
together. It seems that if this area was well addressed a gap could not be experienced
in these literacy and numeracy educational programme. Despite the ongoing literacy
and numeracy intervention programme being implemented in Nairobi County, project
implementers still report poor performance of projects and more so on the learning skill
of reading and arithmetic in mathematics (Piper, Mugenda, Stephanie and Dubcek,
2014). Further, the study demonstrated that lack of reliable data indicating the number
of children out of school, those who have repeated, those who are not able to read and
do simple mathematical calculations are scanty and cannot be relied on hence need for
this study to bridge this gap. Similarly a study by Matonda, Odieki, Morara, and
Nyabienge, (2013) focused on quality, equity, access to and impacts thus performance
outcome is left out which might help in gauging up the learning process.
An empirical study by Dunston (2018) surveyed relations linking reading and improved
methods of carrying out language subjects being the main question, can reading be used
as a predictor of literacy outcomes? This can be directed at enhancing the quality of
education, interventions in literacy and more concentration on reading as a component
of literacy at the expense of listening, speaking and writing which are other measures
of literacy. The findings showed that reading cannot be taught in isolation from the
other three components of literacy and that reading is a good proxy for measurement of
literacy as also was profound by Juke, Turner, Dubeck, Halliday, Inyenga, Wolf and
Brooker, (2017) So the paper recommends that further empirical research to establish
the proportionate contribution of each of the four components of literacy on improved
performance in language subject. This is supported by studies on Reading in prolonged
time in classroom show that very low outcomes can be achieved in fluency and accuracy
facts (Piper, King and Mugenda, 2016). The study did not indicate the methodology
used or how the stakeholders are involved in the learning process hence need for current
study on stakeholder capacity building to enhance strategies on how to deliver the
content well in the classroom situations. (Steering Group, 2016) focused on building
capacity to address literacy challenges and enhance democratic engagement in
Vasternorrland and Mombasa County.

62
A study by Peter (2018) research on the opinions of teachers on primary school
performance evaluations in Benue State, Nigeria, examined opinions on primary school
teachers, evaluation on primary institutions performance A Quantitative analysis was
used in the study. 200 questionnaires were administered to teachers from the selected
primary schools using random sampling, but only 161 questionnaires were valid. The
data collected was analyzed by use of IBM SPSS version 21.0 and descriptive statistics
to measure teachers’ opinions on performance in primary schools using four variable.
Methodology used was inadequate and so did not give a comprehensive report on how
performance was gained or not.
According to Njuki et al, (2006) in their study on building capacity for interpreting
PM&E process, ideas and facts of participation of stakeholders in monitoring,
evaluating and developing indicators for any project they found out that, there are
several tools and methods which needs to be included. Through workshops and
seminars capacity building can really be enhanced and learning of new skills can help
improve the methods used in implementing the projects. In this workshops several
methods are employed that encourage involvement of key stakeholders in every
category formed. Capacity development involves several features like developing a
common understanding of concepts and goals or objectives set per that programme.
Helps in identifying appropriate language to be used, methods and tools to be used and
the importance of the stakeholders undertaking the trainings, the benefits they will
acquire after the workshop both individually and as a group. This encourages every
individual to participate in the workshops. This argument was supported by report on
Mombasa County Steering Group, 2016 on building capacity to address literacy
challenges and enhance democratic engagement in Vasternrrland and Mombasa
County. The reports indicated that insufficient capacity to address the rapid changes of
literacy proficiency of children and youth in the society was a menace. Lack of proper
knowledge for handling the subject, correct methodologies to increase literacy skills,
lack of proper collaboration and poor cooperation amongst stakeholders while
undertaking the program was experienced. There is lack of motivation for teachers and
learners at all levels hence poor results by the end of it all. Capacity building sessions
were not well addressed and there was lack of proper written information and also
participation of all the stakeholders was missing in action.

63
Similarly, in a study of the influence of PM&E on production of public secondary
schools in Mutomo Sub-County of Kenya, stakeholders did not take part in the
management of the schools’ projects since most of them had little knowledge on PM&E
as asserted by (Kathongo and Kamau, 2018). The study disclosed that most of the
respondents were in agreement that there was need for training in PM&E so that
organizational and institutional objectives are well achieved. In addition, the study
suggested that meetings, seminars and equally open forums, meetings and seminars
were key in ensuring that stakeholders get an atmosphere to express their views freely
which is lacking in education systems.
2.6 Data Collection and Performance of Literacy and numeracy educational
programme
Positioning data information, gathering and sharing of already analyzed data is key and
vital to every person involved in the project. Information of data collected is divided
simultaneously to stakeholders taking lead in teaching and changing activities methods
keeping documents of their best practices. Involving all stakeholders in data collection
is just half of the PM&E cycle which is very critical in sharing the information required
in the programme as argued by (Hagen, Duvendack, Mallet, Slater, Carpenter &
Tromme, 2012).Collection of data is very critical in tracking and assessment which
includes all participants at different levels in obtaining the results and seeing the
progress of the programme interventions. Looking at it as their own ideas and not an
imposed thing into their lives. In participatory Monitoring and evaluation process, PRA
Tools are used for collecting data from the field level to coding stages.
Data collection process helps in improving effort that provide accurate information
which helps formulating correct decisions all through plan- do- check- act- cycle. Data
collection authorizes a group to form and experiment work shouldering procedures in
developing details guiding advancement of quality characteristics to product or service.
In a classroom situation teachers normally draw upon a range of knowledge through
many sources like class observation, formal data on assessment results and informal
data on structured observation as argued by (Schildkamp and Kippers, 2016) .
In developing Countries an assessment tool called EGRA was widely used to measure
Literacy and numeracy skills, which was first developed in United States of America

64
and later used in these developing countries, which lack most necessities to acquire
these learning skills. The tool was administered in a few piloted areas whereby the
process yield fruits hence a conception of other programme among them PRIMR,
PRIEDE and which later became EGMA dealing with math. EGRA is an instrument
used to sample based national systems and directed to survey intermissions in reading
abilities amongst learners and to alert educationist in the ministry counterpart agencies
as regards to systems requirements to improve educator professionalism growth and
mainstreaming programme. EGRA has been used to addressing a big area of evaluation
on foregoing projects which included snapshots of performance built on an incidental
representative effect appraisal on classroom assessment purposes (Gove and
Waterberg, 2011).
Assessment of any performance should be in line with the required policies and
regulations on the assessment on learner’s fundamentals ability to read skills,
stakeholder law- makers, educationist and co-workers in organization addressed the
low levels of literacy acquisition (Wagner, Mullis, Martin, Kanyee, Gove, and Dond,
2012).The debate on the assessment of learning procedures is very important in
developing countries as argued in this study but the study did not fully exhaust which
are the right ways of teaching literacy and numeracy but instead it only assessed the
levels of timely acquisition hence low performance of the projects were experienced.
There were measurement instruments used for example early grade reading assessment
(EGRA), early grade mathematics assessment (EGMA) and SSME which helped for
full information of how data was collected forming the basis of this study.
Educational data collection helped in making decisions (EdData 11) main task is to
build on the measurement instrument developed and piloted under other EdData 11 in
order to collect, coordinate data, analyze and report on learning outcomes with specific
attention to early grade numeracy and conditions of learning as indicated by school
management effectiveness measures. After the assessment was administered the report
was not encouraging since the average analysis showed out that in urban- metropolitan
towns reading fluency spanned 20% of learners getting zero score and in rural areas
91% in grade 1-2. Reading comprehension was found to be very weak and math scores
were very weak especially on subtraction questions which took a pupil in grade three

65
15 seconds to solve a single problem. These are results from ten countries which study
was done and Kenya was among them. (RTI & MoEST, 2014)
Proitz, Mausethagen and Skedsmo, (2017) posit that data used by school authorities on
assessment of schools, classroom observations, and teacher and learner background is
crucial to critically assess and discuss the possible consequences of the progress of
education and particularly literacy and numeracy educational skills. Most countries
analysis revealed that there was weak attention by teachers to the foundations of
reading, little time to practice reading skill, ineffective and poorly distributed reading
materials, weak pupil’s feedback mechanisms, poor support for reading at home, very
weak emphasis on the teaching of reading skills in teacher training program (RTI &
MoEST, 2014).
In Kenya it is no exceptional because the report also gave similar reports from other
countries. Engagement of key stakeholders was missing in the study since it was only
the senior officers from the ministry of education were involved leaving out the other
stakeholders like teacher who are the main implementers of the project. When the
Kenyan government announced that it would launch a national reading programme, it
drew the attention of UASID who were the main financiers but later joined by DFID in
the initiatives as co financiers of (TUSOME Program). While this USAID AND DFID
were working together, regional NGO Uwezo was stirring up public interest in early
grade reading through its annual household reading assessment and its radio programs
on the results (RTI,2014) hence many people coming on board to give appropriate
information on education sector.
A survey was done in some countries like Kenya and Zimbabwe on how data
information was collected from different schools and was made useful for future use.
Collection of this data was through survey, whereby SAMEA gave good feedback on
how the programme progressed. Capacity building and scheming of execution studying
assessment was from the MOEST as depicted by (Godia, 2012). Data collecting if not
done well leads to poor performance of the projects and wrong decisions made. The
need to test, measure and monitor process learning for all EFA goals cannot be
underrated. It helps to guide the formulation of evidence –based policies and targeted
intervention. The Kenya EFA (education for all) reports has accepted the progress made

66
in EFA interventions since 2000, but there were impediments identified while
implementing the process which proposed the involvement of all stakeholders in the
education programme ( Nelson,2014 and Lyn and John, 2014). The study does not
concur that all stakeholders were collaborated in making decisions, formulation of
curriculum and other major concerns related to education on literacy and numeracy
programme (Godia, 2012).
Earlier on teachers have been teaching on self-centered methodology but after the
intervention programme it turned out that for any progress to be made teachers have a
great influence on the performance of the learners hence improvement on the
intervention programme. Learning instructional materials used by teachers largely
influence the performance of leaners when helping to collect data on materials which
are appropriate in leaners achievement (Mackatiani, 2017; Kang’ahi, Indoshi, Okwash,
and Osodo, 2012). As depicted by Mackatian 2017, Kang’ahi et al (2012) exam results
only does not measure the holistic achievement of the learners hence the current study
on literacy and numeracy learning skill.
A study by Mulongo (2014) on effect of teaching learning methodology on learner’s
involvement confirmed the persistency of connecting explanatory and inquisitive
teaching strategies. This should be embraced by both educators and learners in
classroom situation. The latter compared to teachers that had not followed the new
methods (54.5% against 25%) were low. For those learners who were fully involved in
the lesson and instructed by high level educators were at 90.1% and rated at 75%.
Students instructed by high level takers of educators could recall the session
information in comparison to those by low uptake educators. Therefore students
instructed by high uptake instructors had higher ranking proceeds in comparison to
those taken by low uptake educators. Overall, 82.7% students instructed by high uptake
educators in comparison to 68.8% have confident in themselves
An empirical study by Kiptum, Mandela, & Murira (2018) assessed how work
environment influences teachers’ satisfaction in Elgeyo Marakwet county. Providing a
conducive working environment for teachers is necessary to increase productivity as
well as satisfaction. The purpose of this investigation is to assess how work, influenced
teacher satisfaction, the study area was chosen owing to the high-stress levels due to

67
workload and other indicators of dissatisfaction experienced by school teachers
according to the data generated by other researchers on instructor fulfillment.
Individual instructive level watched that effect of fulfillment on bliss and prosperity is
verifiable (smith, Buchell, Melgar and Rossi, 2010). This study does not inform well
how data is collected in the classroom hence need for the current study to be undertaken.
Data collection has been noted to be an issue for most of the programme. This is
emphasized by the study carried out by Matonda et al, (2013) on the influence of PM&E
proceeds towards application of quality assurance in Kenya secondary schools. The
study adapted a survey research design and a mixed manner approaches to analyze data.
Despite the study adapting this methodology it did not establish the need for assurance
and quality participation in these schools hence need for this study. The gap in the study
experienced insufficient awareness data collection that influenced project performance.
The study did not address how data is managed after collection and analyzed hence the
need for the study. Participation of stakeholders in gathering and handling data analysis
was also discussed and urged key stakeholders to engage in fully improved outcomes
(Piper and Mungeda 2014).
Similarly, a study by Njuguna (2016) on elements affecting performance of M&E
structures in private organizations companies financed education projects in Muranga
found out budget allotment, stakeholder participation, teaching and sturdiness of the
monitoring group influence M&E structures. The research has historically had a strong
positive correlation between stakeholder involvement and a well measured form of
funding, a strong positive association between instruction frequency and teaching, so
the question of stakeholder participation in data analysis was not addressed well thus
Management, supervision and project assessments therefore need for this study.
2.7 Data Management and Performance of Literacy and Numeracy educational
programme
Data management has been an issue in learning institutions specifically on researchers
who need data for planning, documentation, backup procures and storage for future use
(Tenopir, Sandusky, Allard and Birch, 2014). The recent survey of how data is managed
in institutions, data collection instruments vary according to the intended use and

68
separate apparatus are used to gather information. Other means of collecting school
data are Class attendance, pupil’s records, journaling and rubrics. Stakeholders make
decision on instruments to generate details on which indicators, methods of samples to
use, those involved in collecting and analyze data to gauge, how often it can be done
and means and channels of sharing the details (RTI & MOEST, 2015). Data collection
information should be shared in a responsible manner amongst researchers, teachers,
project staff members and the implementing group, however careful measures must be
put to avoid one being overwhelmed with the data gathering process and lose the major
fact on the way (Piper, Destefano, Kinyanjui, Ong’ele, 2018).
Scaling up the information on the results of the data collected by Curriculum Sport
Officers who need to gather details in comparison to other scholar are supposed to be
given amongst all stakeholders details on how to distribute information to teachers’ and
likewise. An ordinary thinking procedure of collecting data information must reach all
Curriculum Sport Officers and the RTI group has assumed that formulated indicators
has a set objective in collecting data information. More often than not, the capacity of
Curriculum Sport Officers is inadequate meaning analyzing of data collected requires
more experts to come in and give a hand on the same. So in this case the RTI officers
should provide sheets for CSO’S to record the details collected from the teachers which
is appropriate according to the information needed (Piper, Destefano, Kinyanjui,
Ong’ele, 2018).
Data management has been noted to be an issue for most of the programme. For instance
an investigation done by Bernard (2015) on Influence of M&E on project performance,
a case of African virtual university. The study showed that M&E has a direct
proposition influence on performance of project and that monitoring and evaluation
planned events be included well planning for the projects so that good results can be
experienced but failure in doing that the performance of the project is compromised.
A study by Tavakoli, Jackson, Moneyham, Philips, Murdaugh & Meding, (2006) on
data management plans, activities, stages and components has emphasized that data
management has become so important to organizations and institutions to allow large
and more complex data to be set and analyzed with a lot of ease. They found out that
many investigators on data management don’t have formal trainings in management of

69
data sets especially those who are new in specific skills hence requires an expert to take
them through. The study applied longitudinal study where they described every
component and activities in the study. The findings were that data management is a
crucial exercise and if the procedural steps are not followed clearly multiple problems
may occur. In this study it lacked the strategies applied while collecting data,
respondents of the questions raised during data collection and how it was coded. The
need for the current study.
Better the data you know Erica (2014) in his study about data youth developments in
reading in institutions organized teaching atmosphere argued that we embrace in the
epoch whereby people don’t bother or make use of data either individually or at
institutional levels. In education sector and at individual level, usage of data remains
scarce since not many people know how to use it and for what intended purposes. In
school set up the study found out that the staff is not aware of data collection
methodologies, the purpose of that data and the benefits it has in the school. In the study
several issues were raised that youth in the community are never involved in projects
hence have little or no knowledge about data. The youth in this case are the students
leaving both primary and secondary without proper acquisition of literacy and
numeracy education skills hence need for the current study.
In learning institutions accessing data and managing it is very important since it helps
in giving out an outcome at the end of a certain exercise which has passed. In higher
learning data information is very vital since it gives a platform for librarians to get
access to research life span of pupils. So the meaning of data literacy as defined by
Prado and Marzil, (2013) is capability of communicating reading, creating data details
though these information have been met by challenges regarding the effectiveness of
common slants to data generated which does not enable people in using it in various
areas of their work. Lloyd, 2010 and Carson, (2015) were in support that data should
be used according to its purposes and be useful to the people who were targeted by the
information needed. In the current study data management is very important since it is
useful to the stakeholders who are the beneficiaries of the programme in one way or
another. The study failed to give light on how data was collected, by whom, to which
respondents and the methodologies used in the whole process up to managing that data.

70
The findings were all the staff members in an institution should be trained on data skills
for them to yield good results which is lacking too many institutions.
Data management is very vital in informed learning since it emphasis learning as an
outcome of an individual experiences (Bruce, 2008). His elaboration is in his several
studies that there are 3 truth which preside over knowledgeable elites whereby new
ways in handling context of any kind should be well managed so as to produce good
results in an organization. In schools being the organization at this juncture new
information is really needed so that the school administrators and the staff can be able
to make decisions which are required to improvement learning skills of languages and
arithmetic’s. Bruce and Hughes, 2010; Bruce, Somerville, Stoodley and Partridge, H.
(2012) argue that details in database should be used to the intended purposes and help
educational professionals in using it the right way. It is not only educational
professional who need the data information but also other stakeholders who are
involved in learning process require data information.
Management and analysis of Monitoring and evaluation information need to be
consistent and participatory for it to be sustainable, usable and useful to the
organization. In an organization data analysis is a proven way of gathering information
needed in making corrective measures and grow in production of performance of the
projects in an organization. For data management two methods must be used for
example data analysis must be either qualitative or quantitative so as to give right
orders, and having concept of data formation and structures (Wallace and Alkins, 2007).
Monitoring and evaluation systems have several components which when followed
well can give a comprehensive facts to guide the organizations and institutions as
explored by Njuguna, (2018) on elements affecting the performance of Monitoring and
Evaluation systems in non-governmental structures funding education projects in
Murang’a County . The study adapted a descriptive survey design and data collection
tool was an organized questionnaire and later data was analyzed using SPSS software.
Everybody, actually all the stakeholders were used in the study hence no sample size.
Data was descriptively analyzed, descriptive statistics and tables were presented. There
was a strong influence on budgetary allocation, training and involvement of
stakeholders in Monitoring and Evaluation systems. A strong positive correlation

71
between stakeholders and use of funds was prudent. There was also a strong positive
connection linking frequency of instruction and capability. However the study did not
address the issue of how and which level were they involved in data management and
positive correlation in terms of what and how, so need for the study. Mwangi,
Nyang’wara and Kulet, (2015) depict that monitoring and evaluation process is very
important and a necessary tool that is very relevant in ensuring that the set goals and
objectives have been achieved.
Moila, (2006) focused on technology in teaching mathematics in rural secondary
schools found out that there were no plans of using the technology in teaching the
subjects, there was inadequate educators who had trainings on how to use the gargets
in the lesson development hence low performance when it comes in embracing the
methodology. Collection of data using the tangerine tablet according to the current
study is very important in order to store information collected in the database (Elmore
2016). Most teachers in Nairobi County have no knowledge of how to use the garget
in collecting data, coding and later analyzing it. Though there is a disparity on usage of
laptops which is the government project in the Country and to some extent some
teachers in Nairobi County have been taught on how to use the Small gargets that have
no data storage option, that offers more details about how the learner has progressed in
lesson creation and allows potential comparison and for future use (RTI, 2014).
In general M&E is systematic techniques of collecting information, processing, data
interpretation, analyzing, storing and then managing it according to the intended
purposes. Due to high demand of accountability and transparency by the funding
organizations M&E has been made to be a management tool to show performance and
accountability to the stakeholders (Watson, 2006; Kusek et al, 2004). They continue
to argue that when evaluating performance in schools and other sectors in the country,
M&E was put into practice in the education sphere. During monitoring and evaluation
data gathered needs to be stored and then managed. The report writing should also be
accompanied in this process so as to give clear and well informed information about
the programme in question hence good performance.

72
2.8 Implementing Change and Performance of Literacy and numeracy
educational programme
Stakeholders start execution on PM&E process in evolving an ordinary creativity and
coming together on ways of measuring end results and procedures that require
monitoring and evaluating. The procedure of learning is an experience for participants
who are actively working in projects and are willing in making any corrections for
better performance in the projects. Much emphasis can be placed on identifying the
lessons learned that will assist the participants improve the programme implementation
and assess whether targets were achieved (Estrella et al 2000). This is a methodical
process for coming into being with the results that are applicable on end results,
production, operations and pursuits of projects. A number of activities play part in
producing output, which led to an outcome, and a number of outcomes influence on the
findings.
The collision shackles also incorporate procedures, such as structures, strategies, and
methods that are applicable to attaint findings, and describe the happening connecting
stakeholders as the project is ongoing on the implementation process hence project
performance. Having this procedures helps groups and the community to analyze what
is workable and what is not workable and give a report of why it is not working. Critical
thinking sends back on how members ought to progress in the project in attaining its
goals and recaps are necessary. Critical thinking is required in carrying out how result
will be accessed by every member, activities, procedures and its guidelines, squarely
that is being achieved through baseline, midline and end line reports of the piloting
projects which earlier on done indication the performances achieved and what was not
achieved. RTI (2015), as well as Njuki et al, (2006) emphasized on the same. Through
the data analysis and critical thinking on what has been attained details of information
collected by the evaluation staff from the implementing groups to the information
calculated, costs and profits from production activities to check whether any progress
has occurred. For this to happen better measures on participation in group activities
should clarify who to be involved and who not involved in group meetings, activities
and reflections made on analysis to enable the organization learn from the success or
failures and different factors that hinder or facilitate project performance (Karemesi,
2010; Aremu, 2000; Mayama, 2012).

73
According to Daly (2015) execution of a literacy intercession ‘Station Teaching’ in
baby institutions in Irish primary schools’, numerous tactics and methods were vital to
facilitate efficiency of educating in languages in nursery centers inclusive of phonology
understanding phonetics, complex new words, eloquence, compacting and scribbling
of new words. These tactics are performed in institutions where instruction take place.
Early intercessions of starter’s learners acquire languages correctly depending on the
instructors. The expertise of the teacher is key to improving the literacy attainment of
students though numerous and extensive instruction should be embraced in order to
equip educators who are the main executors of syllabus and allocation of mere resources
to schools so that program can go on. The study has not explained how teachers and
administrators implement the necessary and required skills hence need for this study to
be carried out. Teacher attitude can affect learning in the classroom as depicted by
(Dihaisat 2016)
A study by Forster (2009) focused on L&N diagnostic tools an evaluation, to produce
good results on L&N education, the Department of Education, Employment and
Workplace Relations (DEEWR) have at glace considered methods of designing of L&N
distinctive instruments to apply in Australian institutions. Exploring for possible
instruments to be applied in Australian schools differ so much on conceptualization
and intention, to hold up and bear the maintenance for educators in giving aid to all
teachers and have a common tool to use was not possible hence low performance of the
learning skills. Instruments used at bottom stages identifying ability comprising
framework which describe the stages of attainment in comparison with learner’s
judgment on report and monitoring. Instructors gather proof of pupils’ recognition and
strong points and drawn from conclusions from rear side stage of framework specified,
and assigned to different Levels of diagnostic powers.
By use of determined frames of power with each other in assessment methodology
pupils involvement eases, intercession sessions, channels of communicating to parents,
possibly recognizing the impediments in resources and details obtainable in education
structures and the must action to be taken so as to bridge the gaps identified (Asikhia
2010). Therefore there is need for this study to assess diversity instruments in
diagnosing authority and purposively get entry to L&N understanding, skillfulness and
studying of the learners. Also to seek how schools and teachers can be able to get

74
assistance in selecting apparatus of appropriate determined different motives and added
assets in order to have effectiveness in identification of information in the institutions,
classroom and single pupil stage. A study by Ercikan, (2009) on the assessment of the
literacy evaluation and monitoring program (LAMP) / UNESCO institute for statistics
(UIS) also emphasized the point on teacher diagnostic power but lacked more
information on teacher learner relationship hence need for the current study.
A study by Mege (2014) focused on influence of school environmental elements
instructing-teaching operations in public primary schools in lower Nyokal division, to
establish influence school environmental elements on the instructing-educating
operations the study adopted descriptive survey design. Questionnaires as a collection
tool was used giving details from educators and school leaders in focusing at
discussions in groups in guiding students learning issues. The results exhibited learning
institutions have insufficient substantial infrastructure, others totally unreachable and
guiding resources inadequate. Umar (2015) depict that school environment manifested
in classroom arrangement is very vital as also found by Hassan (2016) that books are
very essential in learning. Numerous institutions have many students per class which
most teachers are not comfortable with. To sum it all educators propose to have
accessible schools with closeness to sufficient social facilities and structures. Study
lacked to expound further how they learn and implement changes in their schools after
they try to manage the large numbers of children in the classrooms hence need for the
current study on school environment on performance of literacy and numeracy
educational programme.
2.9 Participatory Monitoring and Evaluation Process, School Environment and
Performance of Literacy and Numeracy Educational Programme
In learning institutions like schools PM&E process is a very basic tool which is used
for enhancing performance of educational programme and improving the effectiveness
and efficiency. Rossman (2015) assert that participatory process leads to learning
among all the participants leading to corrective action subsequent improvement of
programme which are well planned, well set goals and objectives, utilization of results,
data management and implementation. PM&E process enhances in developing new
ways which stakeholders participated monitoring and evaluation planning, developing
projects objectives and selection of leaders in schools environment so as to change the

75
performance of Literacy and Numeracy skills. It is in this learning process that creates
conducive environment for change action and offer evidence basing on selecting and
designing intervention developments that are effective in fostering good outcome
(White and Raitzer, 2017).
Jackson and Kassam,1998;Hilborst and Guijt 2006; Rossman, (2015), puts it in their
definition of PM&E process as a procedure of evaluation, acquisition of knowledge,
cumulative action of collecting information, the stakeholders progamme collectively
intervene and expound appraisals, collecting data and analyzing it. Finally when facts
are collected coded, then analyzed the action is taken on what they have learnt in the
process hence involvement of key stakeholders in programme. The study failed to
specify how this knowledge is transmitted to the learners in lower grades hence a gap
which the current study bridged by examining the extent it has influenced the
performance of literacy and numeracy educational programme. Participation of
teachers and parents in the warfare of the learners emphasized the point that the there
is good participation key stakeholders in projects. In Kenya, PM&E process is not
widely done due to a variety of factors for example inadequate knowledge on PM&E,
insufficient funds for this procedure, lack of training and understanding the value of
PM&E process among many other factors and education is part of this process hence
low outcomes (Jamaal, 2018; Sangole, Kaaria, Lewa and Mapila, 2014).
An investigation by Ogutu (2016) focused on the effects of free primary education on
instructing and educating learners in reading and writing in public primary schools in
Eldoret. He found out that Learning facilities were inadequate to undertake proper
teaching and learning hence needed Support from parents whereby there should be a
structured way of doing it, Educational and learning infrastructure should cater for the
inundation of students in these institutions due to FPE. The study adapted descriptive
survey as a research design and a targeted audience of 4200, respondents were
randomly selected. The study fails to address how it determined the sample size, the
formula to get the categories hence need for this study to empirically investigate how
sample size is determined and which method was used to give categories of sample
size. Dinham, 2013; Santoro and Kennedy, 2015; loghran and Hamilton, (2016,)
focused on the results of schools outcome. Their argument is on the teacher and learner
participation in bringing out the outcome which is conducive to every stakeholder in

76
the education sector which is lacking. Teachers are the biggest participants in school
for the achievement of learners’ outcome and could be lacking in many school hence
low performance of literacy and numeracy learning skills.
Kathogo and kamau, (2018 asserts that influence of PM&E process on performance of
public secondary schools in Mutomo sub-county had collaborated with stakeholders in
managing projects of the institutions. Stakeholders were not well trained during
seminars and workshops which are normally organized by the government and the
implementing organizations. Most of the stakeholders have no knowledge of what is
PM&E process is, how they can be involved in the school environment meaning that
they are not fully informed their roles and responsibilities in the school issues hence
low performance of literacy and numeracy skills in this schools.
Antill, (2013) in his study found out that for any project to be a success all the
stakeholders should be involved in setting up the missions and visions of the projects.
For this case of the implementing organization TUSOME and other NGO’S who have
been in the front line of intervening for the government on literacy and numeracy
programme are no exceptional thus they have really been working hard to see their
projects become a success. Despite them working so hard they have been met by many
challenges when implementing the projects hence leading to low improvement on their
efforts.
Bayer, (2002) points out that PM&E process is management tool which is used by
project managers in assessing if the objectives were achieved, how data was collected
and utilized in helping make decisions for future use. This process provides managers
with crucial information which is logically and timely according to the project which
enhances the performance of the programme and the ownership of the beneficiaries as
put by (Njuki et al, 2006).
The process of gathering information in most cases is not very well done as found by
Coupal,(2005) in his study on how information is collected for particular purpose, he
argues that participatory monitoring and evaluation process helps stakeholders acquire
new knowledge and guides on how to tell if the resources have been utilized in the right
way or not. He continues to argue that it helps the institutions in strengthening the

77
methods used in capacity building of stakeholders in order to help them undertake their
activities better in implementation of the projects. The study failed to explain who are
involved in participation of the projects and who are supposed to implement these
projects. The campaign for vision 2030 that education for all should be made a reality
must be taken into consideration by the government, through interventions by the
implementing organizations so that the programme in education and especially literacy
and numeracy can become a reality and all the citizens to be literate people who can be
able to express themselves in any field in their lives.
Nduta, (2014) on assessment of the use of PM&E approach: a case of constituency
developing funding programme Ndagoretti South sub-county Nairobi established that
shareholders are not adequately inclusively in M&E of the CDF projects and their
participation was very low in all the stages of PM&E process. It also found out that the
way information was documented and data managed was inadequate. The study did not
address the way data was collected, how projects were monitored and evaluated thus
failing of these projects due to lack of proper management (Behn 2003).
In other countries like Malawi a study was conducted on how to involve the
stakeholders in education programme among them parents, teachers, government
officials, local authorities and pupils who worked as a team and the results were
wholesome. There was participation of all the stakeholders in education and every
person had a role to play hence ownership of the programme. In Kenya a study by
Matonda et al, (2013) did a similar study on the participation and involvement of
stakeholders in the school environment specifically on engaging the parents, teachers,
pupils and local communities was a total failure since most of them were not fully
involved more so in giving their ideas as was the case in Malawi study meaning in
Kenya participatory monitoring and evaluation in schools is never embraced hence low
performance of literacy and numeracy skills.
Many scholars have conducted studies on M&E and not specifically on PM&E process
on literacy and numeracy educational programme and those who have done it have
examined other areas and not on literacy and numeracy educational skills (Campbell
2014). Argue that grouping learners in their ability makes learners perform better as
they are trying to cope in groups and mostly on sounds pronunciations. PM&E process

78
allows the participants to accept that their abilities, expectations, weakness and
availability of resources can allow the projects to progress in a better way according to
(Suarez-Herrera, J.C and Springelt. C.K 2009). This can be achieved through the
participants learning from their experiences and taking the correct actions for future
use. On a closer perspective other government bodies like teachers service commission
has not been so supportive on teacher’s deployment on schools which are understaffed,
supervision of school resources and the discipline of teachers. This lack of committee
leads to low participation of the major bodies of government officials like CSO’S and
other supervisory officers hence low performance of the programme which leads to
unsustainability of the projects when the implementing organizations had over to the
government.
A study by Moonga, (2016) an evaluation of the use of early literacy learning and
teaching materials by grade 1-4 teachers in selected schools of chikankata district of
Zambia established that the training of teachers on how to use the learning resources
was not very encouraging since the methodology used was not sufficient and effective.
Learners were not able to access learning materials hence low performance of literacy
and numeracy skills.
The school environment is explained representatives that influence the educational
learnings process and are linked together with one another meaning that each factor
affects the other and if one is withdrawn the other one is affected (Njuguna, 2016).
These factors could probably be school infrastructure, instructional materials, sanitation
and water, the school compound, ventilation of the classrooms, the toilets and pit
latrines among many other elements of the environment. It is a school environment
which is said to provide appropriate learning facilities, well managed classrooms
among many other equipment’s. School environment determines the extent to which a
learner behaves and interacts with the others. May be the absence of this kind of
environment leads to poor performance. Schools and educational authorities in
developed countries often lacked the skills and resources to systematic monitor,
evaluate, communicated and subsequently improve the quality of the education they
provide to children (UNESCO, 2015).

79
The school environments tend to mound the behavior of the learners so as to meet the
demand of life either positively or negatively and this can be categorized by many
elements within the school environments. The maintenance of the school environment
should be well monitored and repair done so as to avoid it causing problem to the
learners, though there should be clear participation guidelines. The intensity of
inhabitant begins influencing growing and developing of persons from mother’s womb
to the external forces after birth. Zimmerman and Wool, (2014) noted that external and
internal forces influence the learning performance. So the learning environment matters
a lot and it has an influence on the performance of every language learnt. A child learns
the first language from the mother since children are born with no language and this
has a connection with the mother’s environment when the child is born. Learning starts
from zero day to the last day in the tomb. Participation of the mother and the community
is very vital in helping learning of each youngster who is can access learning institution.
School infrastructures are very important in a school because they really help in smooth
learning and helping attaining good performance. Nyagah, (2016) focused on the
influence of school organizations and schooling production in public primary schools
in Ruiri location-Meru County, Kenya, the findings were that only one public primary
school has a library, inadequate study materials, overcrowded classrooms and poorly
maintained roofs. The study inquired on relations linking school underpinnings and the
studying of literacy, numeracy educational programme. A classroom that has a variety
of age-appropriate learning materials and teachers with early childhood education
training were closely associated with better performance both in reading and
mathematics tasks (Ouko, 2018). Therefore the achievement in literacy performance is
an index of a learner’s future in today’s world.
The methodology applied was descriptive survey research design and knowledge gap
was that most schools lacked enough teaching staff, inadequate basic resources, lack of
stakeholders’ involvement in decision making and inadequate classrooms. So this line
of study seek to explore how school environment influence the performance of literacy
and numeracy educational programme and ways of sourcing for enough resources to
enhance learning Another study on the influence of school managers applications in
classroom control, school environment, academic Underperformance noted that these
issues affected the performance on learning skill Morgan, (2015). Results were that

80
there was disconnect on leadership styles and teachers methods of teaching hence low
performance on the academic results. Based on this results the current study tries to
bridge the gap on how school environment influences performance of literacy and
numeracy educational programme.
A study by Muthusamy, (2015) focused on educator’s incidents with the overflowing
rooms in normal institutions explored different experiences of teachers on how they
handle the large numbers of learners in the classes. The study adopted a qualitative
research methodology where arranged questionnaire put into operation of collecting
data teachers who are the main implementers of teaching programme. The end results
were teachers are ever stressed by the overcrowded classrooms since there is no enough
space in the room, security issues among the learners due to small spaces left hence risk
to health hazards. With the overcrowded classes very low learning takes place since
some learners might be funny and the teacher cannot be able to see them. At the same
time teacher moves with the bright learners hence disadvantaging the low learners
whom the teacher has no extra time for them. The study used only one type of research
hence comprising the information gathered. The current study employed mixed method
and a descriptive research survey design which really helped in obtaining large data
about the study. Lack of enough classrooms has really affected the learning of literacy
and numeracy educational skills and education at large (Petro 2016). The found study
a reliable information on what is seen overflowing halls as educators look at the pupils
eyes who really affected by the outcomes hence failure in their teaching well.
Teachers Education in any country is viewed as monopoly drivers in growth
developments which cares for accession of understating, skillfulness and altitudes
important to every individual in this world (Gathumbi, Kanini and Maithya, 2017).
Influence of pupil-teacher ratio on performance in Kenya certificate of Primary
Education in Makueni County adapted descriptive survey design with the target
population of 196 sample size of 143. Questionnaires were used to gather information
and descriptive statistics analyzed data. Results indicated lack of enough teachers in
overflowing classes affected KCPE results, which is also a big debate in the whole
world over the class size differences between the teacher –pupil ratio and the
availability of learning materials in the classroom.

81
According to Kunje and Selemeni-Meke, (2009) did an inquiry of the effects of high
enrollment of pupil affected attainment of arithmetic’s, English and Chichewa. Exams
were administered in 3 themes to 6000 students in 100 primary schools and findings
indicated that there was poor attainment in English and Mathematics in town
institutions which had a teacher- pupil ratio of 70 learners in a class. High achievement
were on those leaners taught by trained teachers despite few resources they performed
better than those taught by untrained teachers. Other factors were the level of education
of mothers, children who had educated mothers had better results than those who their
mothers had low level of education. Lack of text books was also another issue though
those who had a few textbooks performed better than those who didn’t have any at all
despite the teachers having passed the training colleges. Overcrowded classrooms is
another challenge in many schools in the world. Countries have inadequate
infrastructure leading to low outcome of learning skills.
Marias, (2016) explored the effects of teachers who are on training specifically
challenges when teaching overcrowding class. An explanatory investigation design and
qualitative research methods became applicable and suitable method whereby facts
gathered meant non- committal writing arranged trainers in modules. Constructivist
learning theory and socio constructivist was applied theoretically framework. Several
impedes encountered teacher learner while teaching in overflow classrooms hence low
teacher pupil interaction in the class. The integration between the learner and the
teacher was very low meaning that most learners were not properly attended due to the
large numbers in the classroom. The recommended number in class is 40:1 according
to Motshekga(2012) while in Kenya is 50:1 though in the urban centers and especially
in non-formal settlement the class can swell up to120:1( MOEST, 2012)
An empirical study by Tuba (2017) focused on reading habit of environmental and
history of teachers in underdeveloped society, influenced families and learning
institutions. Educators’ role models in learning institutions and main stakeholder in
implementing the learning process, a mixed method tackled quantitative and qualitative
directions but how the target population was sampled remained a mystery, although
Beth (2015) concurred with the study by Tuba, (2017) since she had the same findings
in his study. The current study focused on how learning materials were distributed to

82
all learners and teachers to get guides to help deliver the content effectively and assess
the impediments associated with these scenarios.
2.10 Participatory Monitoring and Evaluation Process and Performance of
Literacy and Numeracy Educational programme
General background on PM&E process and performance of L&N education
background is a big phenomenon in most institutions and organizations which has
varied forms of organizations learning and termed as ancient issues in Africa. These
organizations deal with the education developments to improving learning experts
among the students in capacity building those involved in the programme. In Kenya it
is noted that education acts to be vital driver in profit developments in individual growth
as a whole. Though there is need to check on what is really required of quality and
learning skills in the country.
An empirical study carried out by (Dubcek and Gove, 2014) on the early grade reading
assessment (EGRA) and its theoretical footing, determination and restriction which
used to inform education systems and programme on how to gauge fundamentals of
literacy experts that scholars require for starters reading at lower level grade focused
only on very few items instead of showing how these project are going to be monitored
and by whom, when and where. The study did not fully tackle the issues of participatory
monitoring and evaluation process and explain which methods teachers use in teaching
reading, listening and calculating simple arithmetic in lesson progress.
The learning aspect of participatory monitoring and evaluation process requires
powerful prominences in order to have stability linking on how to focus execution and
incorporate teaching in participatory monitoring and evaluation process facts in
measuring correct and valuable decisions. Demonstrating a supportive participatory
monitoring and evaluation process systems is costly, in terms of scope, human and
material apparatus for starting and sustaining Monitoring and evaluation and due
intensive facilitation required in the startup levels. So organizations will require the
skills to support the procedures and be laid advance before takeoff. According to this
turn of events of different stakeholders being inclusive, there are proposals of
developing methods of incorporating all different stakeholders on board.

83
Nthenge, (2014) undertook a study to establish the influence of PM&E on production
on public private partnership projects in Nairobi County. In his study he aimed to seek
fundamental factors in achieving its objectives. Descriptive survey research design was
adapted. Facts were gathered by using questionnaire and analyzed qualitatively. Results
found, involvement of all the stakeholders with varied views strengthens the institutions
which is in consensus with participatory monitoring and evaluation which provides
better ways of bringing change to the already learnt experiences (Dubcek and Gove,
2014). So in finality the study concluded that the stakeholder’s perspective had the
greatest effect on the performance of public private partnership projects in Nairobi
County. Gap in the study is that it did not expound more on how stakeholders should
be integrated in collecting data managing it and finally implementing change of what
has been acquired (Piper and Mugenda, 2017).
PM&E process is a learning process which involves several steps and people. Those
main implementers of learning at school are the teachers. According to Kasiisa and
Bakaluba (2013) on teachers participation in learning process concluded that significant
relation on teacher’s qualifications and the pupil’s attainment achievement fully
determined by how the teachers expressed themselves and how they delivered the
information to the learners. Kosgei, Jairo, Odhiambo and Ayugi, (2013) who carried
out similar inquiry in Nandi County had a differing information of no relationship
connecting instructor quality of education and learners’ academic achievements but
they observed that the leaners achievements wholly depended on the teacher’s
experiences in teaching.
Participatory M&E process has many stages which needs to be followed in any
organization so as to succeed or any project to achieve its goals. In this line Nyonje,
Ndunge and Mulwa, (2012) outlined steps in M&E process as an indicator on
identification, setting of target for all selected indicators, Identification of performance
measurements, Comparison between measured results versus the earlier set standard.
Finally the flexibility of the organization itself. In this study the main issue is to
investigate how different stakeholders are involved in learning and the influence it has
on the performance of teaching literacy and numeracy educational programme in
Nairobi County.

84
Teacher participation in learning is very crucial according to Leigh and Mead, (2005)
which they argued teachers with enough understanding and experts tend to teach
learners effectively than the teachers who have low ability and experience in teaching
thus low achievements experienced. This is supported by Omo, 2011 and Goe, (2007)
maintaining that teachers quality of education has an influence on the performance of
learners achievement hence good results are experienced.
The emphasis on PM&E process as a learning process is fully explored by Gichuru,
(2016) on his study on the effects of instructor standards on students’ performance in
mathematics in class six state exam, a survey which was conducted in private primary
schools in Kigali Rwanda. The investigation only delimited itself on private schools,
leaving out the public schools which may be are the majority in the country hence
giving limiting information which cannot be fully relied on to give comprehensive
information to help make any decisions or get funding. The results were that teachers
with effective teaching practice had a big influence on the performance of the learner’s
achievement unlike those with ineffective teaching strategies and practice in teaching
and also communication skills were lacking to most teachers (Omo, 2011 and Goe,
2007. Most teachers in Nairobi County have the required qualifications but still
performance of literacy and numeracy skills is low meaning has no relationship linking
the qualification of educators and the scholarly attainment of learners. Since if this is
the case then learners in Nairobi County could the best in the Country in learning the
literacy and numeracy skills due to many educators having the highest grades in
education sector.
2.11 Theoretical Framework
Theoretical framework has a combination of different well organized ideas with a
purpose of breaking down of variables and investigating a certain phenomenon in a
particular area bringing up several variables together which are related to one another
(Kothari, 2004). Theoretical approach in this study was anchored on various theories
which has a relationship between the variables and acknowledges that there exists
interdependence between various variables during implementation of the projects.
Theories that guided this study were stakeholder theory, Theory of change and Multiple
Literacies Theory. The main theory crowning this study is stakeholder theory.

85
2.11.1 Stakeholder Theory
Stakeholder theory is grounded on the work of Barnard, but Freeman did his first
publication in 1984 in San Francisco. He is believed to be the father of stakeholder
theory based on strategic management, corporate planning, and systems and
organizational theories. Stakeholder theory is based on argument of Wood, Agley and
Mitchell (2007), which stated that an organization relation commitment involves more
than one party in engaging for service delivery on behalf of others in making corrective
advice to the authority. Stakeholder theory is a participatory theory which influences
collective actions on numerous person in decision formulation. Stakeholder
participation is influenced by theories promoting collection of facts which accepts the
logics that people will calculate the cost and profits before deciding the next action. The
participated end results will influence involvement of all in getting more funding.
Alternative expectations can be experienced form the findings acquired during the
course assessments and people can decide on what is best for them (Heikkila and
Gerlak, 2005). Reciprocals initiated developing of theory by Simmons and Birchal
(2005) suggest incentives organizations from socio-psychological and profit incentives
and misplacements are inevitable for participation to select rational involvement and be
able to inform theory group, steps and inspired usual profits Olson, (2000) socio
specification theory Rowley, (2017) participatory theory by Freeman in 1930. The
above concur with Simmons and Birchal, (2005) that participation is very important in
an organization, institution or a firm. Stakeholder theory is mainly concerned with
participation of every key participant in the project to give ideas and views about what
they intend to achieve and the outcomes of their activities and formulation of policies
and implementation of the set objectives and goals.
It is widely used by policy makers, developing agencies academics and practionnaiers
which has helped it become a key issue in management. Though diffused idea vary in
interpretation of separate shareholders. Stakeholder’s participation theory has a part to
play in developing policy-making and execution. The interpretation of participant’s
difference depends emphasized aspects. However adding information corrective means
and processes influences implementation and performance of the projects into tangible
inputs and outcomes that benefit the beneficiaries. The goals and missions of the experts

86
and deliberated shareholders involvement visualized and in all probability influence the
explanation of data collection hence generating constructive information.
The principle goal of stakeholder participatory approach is the methodology applied
and the service measures assessment stages in participating and empowering
stakeholders in project performance. The relationship of stakeholder theory and the
variables under study is that, there is full participation of stakeholders in the planning
process in PM&E process and performance the projects. Data collection, analysis and
explanation is also another aspects which bring a very close relationship in that the
stakeholders must involve M&N findings and implementing change as recommended
by the implementing groups in the project. Selection of M&N tools are measured
analyzed with help of this theory in that it is used for identification, initiatives and
utilization of the findings. Participation of stakeholders in different levels link up with
the theory in that when stakeholders are developing projects objectives and M&E plans
are stickily guided by the theory. Stakeholder capacity building is another area whereby
most of the stakeholders if not all are involved in trainings of workshops and seminars
which enlighten them the way forward in project hence good production.
During these seminars there are issues identified and the later dealt with according to
the results of the activities undertaken during the implementation of the project. A study
conducted by Makori and Oderi, (2013) found out that training and capacity on M&E
were very important because they helped in designing and developing project
indicators, reviewing the projects regularly and involving the stakeholders in all the
phases of projects was very vital in evaluating the trainings of secondary schools
principle and trained teachers who teach learners after they proceed to the next level. A
differing information from a study conducted by Njuki, et al, (2006) says apart from
participation there are tools and methodology required to make the trainings a success
and conception of new ideas and formulating SMART objective and goals which are
measurable and attainable in projects. So stakeholder theory based on different groups
of people coming together to make decisions then supports this study and helps it to
investigate further on the issues affecting the engagement of all the stakeholders in any
programme.

87
This stakeholders theory has a link with this study in that, when the assigned
stakeholders who are responsible in data collection and especially selection of
monitoring and evaluation of data instruments, collation of information, and schedules
of monitoring and evaluation activities fully participate in the activities which is the
main concern of the theory that it is participative in nature. Mulongo, (2013) and
Hagen’s et al (2012) concur with this theory that involving all the stakeholders is very
vital since most of the information is shared and tools sued are appropriate since they
designed by the same people. Though Kiptum, Mandela and Murira (2018) differ with
the earlier statement that involving stakeholders full yield good results. In their opinion
for any good to be realized there must be a conducive environments which will
influence the productivity and satisfaction of the activity performed in any level.
Stakeholder theory deals with the institutional management and ethics which deals with
moral and values affecting planning and management in schools directly or indirectly
on how the schools manages the relationships among the parents, learners, teachers,
policy makers in education and funding organizations according to Freeman et al
(2007). If this steps and activities are properly followed then the performance of the
projects is experienced and then theory of change is profound.
2.11.2 Theory of Change
It is thought to be a new approach but some experts traced it back to the late 1950s with
kirkpatrick’s four levels of learning evaluation model. There were other people
considerably to be involved in the body of theoretical and applied development in the
evaluation field like Huey Chen, Peter Rossi, Micheal Quinn, Pattorn and Carol Weiss
who are believed to have been focused on program theories to evaluation. A theory of
change explains how the activities were undertaken by an intervention such as projects,
program or policy and contribute to a chain of results that lead to the intended outcomes.
Theory of change is a central process by which change comes about to an individual, a
group and an organization in the community derived from formal research based on
theory and understanding of how things work in an institution. Theory of change helps
in linking up the project activities to the desired change that a projects is targeting to
change (Roger, 2000). The study solicit change of perception to stakeholder’s
involvement of project cycle participation in all the stages/ steps of PM&E process. For
this study, theory of change explains how the M&E will be implemented so as to meet

88
the set objectives of the projects which needs to bring changes in learning of literacy
and numeracy skills and enhancement of knowledge acquisition.
Theory of change helps in developing interventions aiming to achieve objectives and
pursuits accurately organized in readiness. In this research the objectives and activities
of the projects are already set at the begging when preparing the monitoring and
evaluation plan which helps in identifying the stakeholders, their roles, types of
stakeholders, and an in-depth of involvement preparations and execution of projects.
This allows room for change and adapts any emerging issues and accepting any
responses made by partners and other stakeholders focusing mainly efficiency and
effectiveness on peace building interventions in any projects. Theory of change
therefore specifies structures of preparations, participating formulas, evaluation and
monitoring for nonprofit making organizations and the government sectors which need
to promote social change.
The variables in the study concur with this theory in that the planning process,
conceptualization and operationalization which include a situation analysis in
identifying the nature and the extent of the problem or opportunities to be addressed is
fully investigated. Valters (2014) noted that Theory of change can define immediate,
intermediate, short-term, long-term and ultimate outcomes and shows the intended
outcomes and contributions to addressing the problems. It is a road maps that leads to
better planning and a detailed way of how activities are linked to one another and how
change happens. It helps in measuring progress towards achievements of long-term
goals even beyond the identification of program outputs, reviewing collected data,
number of transmitted reports, and dissemination of M&N findings of the project
intervention. For project intervention Morrell et al, (2014) found out that there were
improvement on literacy level and attendance of learners in marginalized schools and
the girls changed their attitude and their character upon the intervention programme.
Butt, Kratochvil, and Balakrishnan (2015) recognized the value of evaluation on theory
of change on stakeholder participation and knowledge management and social
identification and student commitments on the achievement of organizing the results
whereby (Blake and Ottoson, 2009) also agreed together that there elements that form
the variables understanding utilization are noted as three aspect namely, taking into

89
account awareness, use of understanding and meaning of multiple knowledge
utilization. The relationship of this theory and this study is that it helps in identifying
the problem under investigation and tries to look for solutions, planning and making
decisions on the projects objectives. So they have a relationship in that they try to bring
changes to individuals, groups involved in the project and institutions in general. The
opinion of the researcher is that, the theory is completely in line with the study under
investigation, since it is investigating on how change can come about in learning
projects and especially the reading skills which is the bone of contention in the Country.
2.11.3 Multiple Literacies Theory (MTL)
Multiple Literacies Theory (MLT) was first coined by a group of scholars from new
London who comprised ten academics from Great Britain, Australia and United States
in 1996. Their main aim was to shift from dormant print text to a more varied ways of
literacy in the new millennium and teaching through technology (Cope, Bill and Mary,
2015)
Multiple Literacies Theory (MTL) is influenced by philosophical work on literacy and
numeracy learning, it is a theoretical framework which has an influence on
philosophical work by Deleuz and Guattari, (1987) and the social theory of Gilles
Deleuze with Félix Guattari to footing of language ideas. In their combined work of
multiplicity in critical thinking of changing the nature of learning Deleuze and Guattari,
(1987) in their book they argue that Multiple Literacy Theory was conceived by a group
of people so as to put together things happening in the contemporary world about
literacy to quest community justness in cultural diversity contexts. Helps to curb the
issue of information about the process of literacy and bring a closer understanding of
how literacy is currently constructed. The idea and concept of literacy has really been
of concern to the educators and much debate has been liberated on, this is a synthetic
term that encompasses writing, speaking, listening and reading practices to
communication processes.
Multiple Literacy Theory posits the simplicity in explaining the conception of literacy
from the start of literacy communication to literacy development. According to
Annadale, Bindon, Handley, Johnston, Lockett and Lynch, (2004) they argue primary
growth takes a form of linear aspect in school curriculum and syllabuses which are used

90
in teaching separate work in listening, speaking, reading, writing, spelling and oral
language, yet it is known by educators that linear aspect of learning is just a myth. This
is because learners develop their learning skills at different levels depending on the
learning environments they are in per that time. Learners may be fully engaged in
classroom activities but they might find it boring hence no literacy skill acquired since
the learner was not interested in the lesson.
Deleuze and Guattari, (1987) in their combined work on the history of philosophy and
hypothetical settlements on differences and reiteration and science of thinking in new
ways of thinking approaches. Also understanding the process and practices involved in
learning environment which should be conducive to the leaner. Particular relations
connecting the learners, teachers, the institution and organization of the lesson
preparation and the way the school leaders handle the teachers at large.
The methodology of teaching literacy and numeracy is also another area which needs
to be taken care of as argued by Blikstad-Balas and Søvik (2014), empirically literacy
investigations profit the learners much in the classroom setup especially when learners
are encouraged and given an opportunity to explore the reading and writing aspect on
their own unlike when the teacher is theoretically teaching. The learning should be child
centered and not teacher centered but both are supposed to be interactive in the lesson
process.
This theory was chosen since it strives for an implementation of literacy that links the
school literacy to the real world from the informal learning at home to the school
environment. It is not restricted to one particular place, time or a certain style of
learning. Learners are able to apply the learnt skills in school in a collaborative manner
and handle issues in the community as directed by the intervening programme in their
learning new books which incorporates team work and service to the community.
The goal for this theory is to help students build an understanding of how multiple
literacies can affect their lives beyond school and how they can chose their careers in
future.

91
2.12 Conceptual Framework
This study is guided by the following conceptual framework. The conceptual
framework exemplifies presented relationships themes to be investigated. The
dependent variable is performance of literacy and numeracy of educational programme.
The indicators which will be used to measure performance of literacy and numeracy
educational performance include allocation of resources, stakeholder involvement and
accountability.
This is based on measurement on monitoring performance point of references in
projects (Barcklays and Osei, Bryson, 2010). This is traditionally affiliated to variable
of schedule, value and standards of what is being delivered on iron triangle.
Participatory monitoring and evaluation process and independent variable the study
which is studied in ways of stakeholder engagement, stakeholder capacity building,
data collection, data management and implement change and how they can influence
performance of literacy and numeracy educational programme. The moderating
variable in the current study is school environment whereby it is measured in terms of
school infrastructure, type of school leadership and the teacher – pupil ratio influencing
the performance of the programme in question.

92
3. H0
4. H0
5. H0
7. H0
1. H0
2. H0
6. H0
Figure 1: Conceptual frame work of participatory of monitoring and evaluation
process, school environment and performance of literacy and numeracy
educational programme
Stakeholder’s engagement
Identification of stakeholders
Stakeholders level of involvement
Developing of project objectives
Developing monitoring and evaluation plan
Stakeholder capacity building
Training for M&E workshops
Training for M&E seminars
Aligning training gaps identified
M&E knowledge and skills
Data Management
Identifying specific data analysis methods
Identifying staff responsible for data
management
Data analysis and interpretation
M&E reports writing
Performance of Literacy and
Numeracy Educational
Programme
Reading skills
Simple arithmetic
calculations skills
Letter recognition
Beneficiary Satisfaction
Proficiency skills in
listening of literacy and
numeracy skills
proficiency skills in
speaking of literacy and
numeracy skills,
proficiency skills and
writing
Timely Acquisition of
literacy and numeracy
skills
Transition rate improved
Class average performance
improved
Implementing change
Reviewing collected data
Number of transmitted reports
Utilization of M&E results
Project intervention
School environment
School infrastructure
Teacher pupil ratio
School leadership
Participatory monitoring and evaluation process
Independent variables
Dependent variable
Moderating variable
Data collection
Selection of M&E data instruments
M&E data collection and collation of
information
Sources of M&E information
Schedules of M&E activities

93
The variables in the conceptual framework had an influence and a relationship with
each other. For the first objective on stakeholder engagement had indicators such us
identification of stakeholders who were identified according to the programme for
example the main targets were the lower grades pupils from grade one to three which
is the foundation of learning in any country. There several stakeholders involved in the
programme and each of them had a role to play hence of lack of proper involvement of
them led to low performance of the skills. According to the current study it was
established that all stakeholders should be involved in the programme but gaps were
experienced in the areas which stakeholders were not fully involved thus low
performance of the learning skills experienced.
It was also noted that during the development project objectives and monitoring and
evaluation plans most stakeholders were not incorporated but later in the trainings and
the implementation stages then at least making a slight improvement in the programme.
In totality there was a relationship between stakeholder engagement for monitoring and
evaluation and performance of literacy and numeracy educational programme since
there was improvement in listening, speaking, and reading, writing and simple
arithmetic calculations.
Stakeholder capacity building was the second objective and had an influence on the
performance of the skills being implemented in the programme. The trainings for M&E
workshops and seminars largely influenced the performance of L&N skillfulness. This
was through help of gaps identified during trainings additional of new M&E knowledge
skills acquired during the training adding to the already existing one making all the
difference in the improvement of the teaching methodologies therefore great
improvement released in the average class performance.
Data collection was very important to the programme since it helped the organization
implementation the programme to be able to get the primary information ad especially
why the other programme were not able to fully be sustained and also have
improvement. The current study found out that there was scanty information on a few
piloted schools in the whole country hence inadequate information led to low
performance of the programme. There was relationship on how you collect data, the

94
instruments used, how information was collated, and source of information thus then
on how activities were managed also influenced the performance of the learning skills.
The fourth objective also influenced the performance of literacy and numeracy
educational programme which was on how data was managed precisely identification
of how data was analyzed and interpreted, the staff responsible for data management
and later writing the monitoring and evaluation reports for future use really had a great
influence for any successfully programme. There was improved on record keeping by
heads of schools, ministry of education since data was easily available in the data bases.
To bring the new changes in reality many stakeholders were furnished with the proper
data on the data bases which helped them in making decisions and correcting the
mistakes done, balance the staff according to the area of need and learning their
strengths in order to better them well. Timely acquisition of literacy and numeracy skills
were experienced and beneficiaries being satisfied by the outcome of implementing
changes in the programme meaning there was relationship and an influence on the
performance of programme.
School environment as moderating variable influenced the performance since learning
of any kind needs a comfortable and conducive environment. School infrastructure,
teacher pupil-ratio and school leadership were the indicators for the variable which
greatly influenced performance of educational programme which really relied on good
performance to be experienced. In the current study the findings were divisive since
most schools had enough staff while others had fewer, the number of teachers per class
and that of the learners was a major concern. Though there was an influence a lot needs
to be done to curb this menace of 120 pupils in one room where the space is a major
concern. In conclusion the variables related to one another and they had a relationship.
2.13 Summary of Literature Review
Main essence in literature review is to critique related work of other scholars and
examine how other factors could possibly influence on the problem being investigated
are interrelated. This chapter covers literature review, theoretical underpinnings of
the study and the conceptual framework. In empirical literature review, relevant
literatures on the variables under study will be reviewed. These will include literature
on performance of literacy and numeracy educational programme, participatory
monitoring and evaluation process, stakeholder engagement and performance of

95
literacy and numeracy educational programme, stakeholder capacity building and
performance of L&N educational programme, data collection and performance of L&N
educational programme, data management and performance of L&N educational
programme, Implementing change and performance of L&N educational programme.
Moderating influence of School environment on the relationship between PM&E
process and performance of literacy and numeracy educational programme in Nairobi
County
Performance of Literacy and numeracy educational programme according to the current
study there was improvement of reading skills. Simple calculation arithmetic which
most learners could not perform earlier on before the project intervention was
administered. Listening skill was enhanced and a slight improvement was experienced
though there is still a problem on pronunciation which is affected by mother tongue
challenges. Lack of proper pronunciation leads to poor writing since you write what
you pronounce. However, the performance of the programme improved on the aspect
of general class performance thus transition rate to the next level was experienced.
Generally the performance improved in all the categories but still there is room for more
practice on the areas where weak correlation was found.
Participatory M&E process being a procedure of learning taking place and bringing
change to the institutions and in this case the public primary schools in Nairobi County.
Therefore, stakeholders should be fully engaged up to the latter for better productivity
in any programme or organization. The current study showed a positive results
indicating fair participation of most stakeholders but in different levels. For this to be
realized adequate participation must be experienced and this was witnessed by many
responds agreeing that there was learning which took place. Consequently during
trainings knowledge was acquired which enhanced teaching methodologies.
Stakeholder’s engagement statistically influenced performance of literacy and
numeracy educational programme. Even though there was positive influence some
respondents had varied responses on how Stakeholder were identified. Identification
process was not carefully done and that there is need for improvement on this aspect if
at all performance has to be realized in literacy and numeracy educational programme
though the selection process of stakeholders was ensured on gender parity was adhered
to. This could be as a result of Kenyan constitution which emphasizes on a third of

96
opposite gender in every working place and mostly public institutions whereby equality
in selection process of stakeholders would lead to performance of literacy and
numeracy educational programme in Nairobi County.
Stakeholder capacity building results on plans for Monitoring and evaluation
workshops reveled that they were not well-planned hence they negatively influenced
the programme whereby there is need to review the content of workshops plans to help
improve the programme delivery. On the practices applied after these workshops do
not really have much influence on the performance of literacy and numeracy
educational programme since they are inadequately prepared and conducted. This may
also mean that workshops were handled in a hurry hence some stakeholders who are
the teachers were left an unequipped, specifically with the current methodology which
is required to improve the literacy and numeracy educational programme, hence the
need to restructure how these Monitoring and evaluation workshops ought to be
conducted and improve the performance of literacy and numeracy educational
programme. However there was positive results on how the experts handled the
trainings though much practice is required since there was no consistency on how the
workshops and seminars were conducted and there is need to have consistency so as
whatever is acquired can be put across all the schools in the country.
Data collection tools were designed to collect data are made readily available for
effective and efficient data collection processes among the stakeholders for the sake of
the programme success. Data collection had a significant influence on performance of
literacy and numeracy educational programme. Stakeholders who are not competently
trained in data coding should seek to be trained and also practice more to perfect the
skill to avoid current anomalies that are being experienced as far as proper coding is
concerned. Even though the data collection tools were not appropriately used for the
intended work M&E data collected was verified and analyzed accordingly hence
positively influenced the information required and informed the best practices. M&E
information collected came from the right respondents, meaning that engaging the right
people to give the required information would reflect true reflection of how the
programme is running and inform the best decision making process where necessary.
Data management methods used were appropriately identified, reliable and relevant
based on empirical evidence supported with reliable data and positively influenced
performance of L&N educational programme.

97
Implementing change and performance of L&N educational programme in Nairobi
County was also carried out and the findings were gotten. Report writing and counter
checking of TARGERINE reports to allow corrections and reliability before
transmission did not include all the participation that is the key stakeholders were
missing in action. Those who were identified through the transmitted reports had a
positive influencing performance of literacy and numeracy educational programme.
Number of transmitted reports indeed led to improvement of results and the quality of
project intervention in the programme. This means the use of TANGERINE tool yield
some positive results and should continuously be used in the programme
implementation but needs redesigning and prior planning done so as to acquire more
appropriate information and involve all the stakeholders.
Theories underpinning this study include stakeholder theory, theory of change and
Multiple Literacies Theory (MTL). Stakeholder theory is a participation theory
influencing collective action of many people coming together to make a certain
decision. Stakeholder involvement is influenced by theories underpinning collection
steps which accepts logical thinking of person’s calculations, cost and benefit of any
thoughtful way of doing things. They participated in giving out feed backs which
influence the participative decisions or get more funding or not. Theory of change can
define immediate, intermediate, short-term, long-term and ultimate outcomes and
shows the intended outcomes and contributions to addressing the problems. It is a road
maps that leads to better planning and a detailed way of how activities are linked to one
another and how change happens. It helps in measuring progress towards achievements
of long-term goals even beyond the identification of program outputs. Butt, Kratochvil
and Balakrishnan (2015) recognized the value of evaluation on theory of change on
stakeholder participation and knowledge management whereby (Blake and Ottoson
2009) also agreed together that there elements form variable awareness and utilization
of noted three aspect namely, adding up things to bring awareness, use of understanding
ideas and meaning of multiple knowledge utilization.
2.14 Knowledge gaps
In the current study several gaps were identified and assumptions were made according
to each thematic area. The summary is in the table below.

98
Table 2.1
Knowledge Gaps Variable Author
(year)
Title of the study Methodology Findings Knowledge gap
Stakeholder
engagement
Stephanie
and Sabrina
(2014)
Stakeholder analysis
and engagement in
projects; from
stakeholder relational
perspective to
stakeholder ontology
Research design was qualitative
longitudinal, data was collected
through interviews and observation
and analyzed using an ATLAST/Ti
software.
In appropriate social
interaction between project
stakeholders hence project
failure
There is a gap in the way the stakeholders are
involved in participating in project cycle. The
current study investigated how stakeholders
are identified and engaged in the project
phases
Llusweti,
(2014)
Assessing reading to
learn literacy
intervention of school
improvement
programme on lower
primary school
pupils‟ literacy skills
in Kwale district
The study adopted a cross-sectional
survey research design targeting all
the schools, teachers, head teachers,
pupils and School Improvement
Programme (SIP) officer
implementing, Reading to Learn
(RtL) programme in Kwale District.
The findings are likely to
assist in identifying
contingencies to be tackled in
literacy learning. This study
is likely to benefit NGOs in
their literacy interventions to
identify challenges and come
up with ways to improve the
programs
Gaps remain in Reading to learn literacy
intervention of lower primary school literacy
skills and how every participant in learning
process is involved in the process hence a
gap. So this study investigate how this gap
will be bridged so as to improve the learning
skills.
Kinyua
(2013)
Influence of
monitoring and
evaluation process on
teaching and learning
among public primary
schools in Gatanga
sub county, Murang’a
county, Kenya
The study adopted a Descriptive
Survey Research design. The target
population was 56 head teachers 336
panel heads 6 DQASOS
Teachers do not sign in
registers when they report or
leave work. Monitoring and
evaluation leads to effective
teaching and learning in all
schools but it is not the case
in Gatanga sub-county
therefore poor results of
managing these projects.
Proper and adequate funding should be
provided to aid activities of monitoring and
evaluation which is slagging behind. The gap
is no monitoring and evaluation systems are
put in order and if they are there they are not
fully exhausted. The study intends to bridge
the gap by identifying the key stakeholders
who will be involved in monitoring and
evaluating and observing the teachers work
hence program performance

99
Variable Author
(year)
Title of the study Methodology Findings Knowledge gap
Kathuku
(2013)
Factors influencing
parents’ involvement
in children’s
academic chievement
in early childhood
education in
Kathonzweni district
The data for this study was drawn
from respondents
through purposive, stratified and
simple
Random sampling procedures from
the entire population of ECE centers
in the district. The samples included
Head teachers, pre-school teachers,
parents and pre-school children.
The findings were majority
of the parents do not fully
take part in early childhood
education. It is evident from
the findings that, the parents’
poverty level, literacy level,
marital status and
Cultural beliefs were
significant in the way they
participate in early childhood
education.
Lack of participation of parents in early
schooling leads to poor performance in
literacy and numeracy. The study failed to
highlight how the parents needs to be
engaged in the learning process and how
target population was determined only
leaving a gap in the methodology hence need
for the study on stakeholder engagement and
the process of identifying the right way of
determining the target population and data
analysis for monitoring and evaluation
Stakeholder
capacity
building
Nyagah
(2016)
The influence of
numeracy and literacy
training program on
curriculum
implementation by
early grade teachers in
public
primary schools in
Mombasa county
The study used a descriptive survey
in obtaining information on the
influence of numeracy and literacy
training program for early grade
teachers. The target population was
the 15 public schools in the program.
The findings indicate that for
children to attain better
outcomes at exit level, strong
emphasis on attainment of
literacy and numeracy skills
should be placed at the
foundation stage and proper
supervision should be
observed and teachers be
taken to fresher courses on
the same.
The current study focuses on stakeholder
capacity building so as to hence proper
trainings have taken place in order to increase
the existing knowledge.
Makori
(2013)
Implementation of
Universal Primary
Education in Kenya:
An Analysis of its
Impact and Progress
towards Achieving
the EFA Goal in Kisii
District
The study employed a quantitative
research design and used purposeful
Sampling technique involving twenty
head teachers drawn from twenty
primary schools in Kisii district.
The analysis reveals that the
implementation of FPE
policy created a positive
outcome evidenced by
increased enrolment in
schools but there was,
increased enrolment which
had a number of setbacks, for
Studies links them to poor or lack of
planning, poor distribution of teachers
resulting in some schools having more
teachers than others therefore affecting the
teachers/ students ratio hence low
performance in learning process The study
will examine the methodology on stakeholder
capacity building in correcting poor methods

100
Variable Author
(year)
Title of the study Methodology Findings Knowledge gap
instance, high teacher pupil
ratio and inadequate physical
facilities was experienced in
almost all the schools in the
country.
of delivering the content and distribution of
human resources.
Data collection
Matonda
,Ondieki,
Morara, and
Nyabienge
(2013)
Influence of
participatory
monitoring and
evaluation approaches
on the practice of
quality assurance in
Kenya secondary
schools
The study adopted a survey research
design and a mixed mode approach
to data analysis. Officers need
undergo specialized
training in participatory monitoring
and evaluation
It was established that indeed
as practiced, quality
assurance in schools was a
form of participatory
monitoring and evaluation
and recommends that Quality
Assurance and Standards
lacked formal trainings in the
practice.
The study established that quality assurance
as opposed to monitoring and evaluation
lacked an institutionalized framework to
guide its operations. Quality assurance
officers lacked formal training in the practice
The study will examine how data collection
for monitoring and evaluation and trainings
will influence performance of literacy and
numeracy educational program
Data
management
Phiri (2015)
Influence of
monitoring and
evaluation on project
performance: a case
of African virtual
university, Kenya
A mixed research design of ex-post
facto and survey to determine a
possible monitoring and evaluation
project performance relationship
place if a positive influence of M&E
has to be seen.
The study has shown that
monitoring and evaluation
has a directly proportional
influence on project
performance and that an
M&E plan should be
included well planning for
the projects.
inadequate knowledge on the influence of
M&E on project performance a situation that
this study addresses The study sought to
establish the extent to which data analysis
and management can influence project
performance and bridge the gap of
monitoring and evaluation activities

101
Variable Author
(year)
Title of the study Methodology Findings Knowledge gap
Njuguna
( 2016)
Factors influencing
the performance of
monitoring
and evaluation
systems in
non-governmental
organizations funded
educational projects
in Murang’a county.
A descriptive survey design was used
for the study where structured
questionnaires were used to collect
data which was analyzed using SPSS.
No sampling was done as all the
M&E staff and project managers in
NGOs implementing educational
projects were to participate. Data was
analyzed descriptively using
descriptive statistics and tables as
appropriate.
The findings showed that
budgetary allocation,
stakeholder involvement,
training and strength of the
monitoring team influence
M&E systems. The study
also established that there is a
strong positive correlation
between the participation of
stakeholders and prudent use
of funds (r=0.643). There
was also a strong positive
relationship between
frequency of training and
competence
(r=0.617).
The gap in this study is that there should be
more involvement of the stakeholders in
planning, design, implementation, monitoring
and evaluation of projects. The project
implementer should ensure that stakeholders
meet regularly to be appraised on project
progress. Local communities should be
sensitized on the need for M&E and data
management.
Also there is need to empower the teams
carrying out M&E activities so that they can
give credible information. The study establish
that there is no adequate cohesion in these
teams. Though the teams are adequately
competent, there is little commitment and
teamwork. There is need for emphasis on
team building. In this case the study did not
address the issue of data management hence
the need for study.
Implementing
change
Nzweke,
Olandejo,
and Emoh
(2015)
Assessment of factors
responsible for
successful project
implementation in
Anambra state,
Nigeria
Used survey design, sample of 100
was obtained through random
sampling. Five Likert scale
questionnaire. SPSS was used for
analysis.
The factors responsible for
project success are numerous
but there is a good level of
correlation between them
There is need for more research to provide
enlightenment about the factors that may lead
to project success Participatory monitoring
and evaluation process and performance of
literacy and numeracy educational programs.
Ouko (2015) Determinants of
standard one pupils’
achievement in
literacy and numeracy
in Gucha district,
Kisii county Kenya
Purposive and stratified random
sampling techniques were employed,
descriptive and inferential techniques
were employed to analyses data, and
SPSS was utilized in data analysis.
The study underscored the crucial
role played by pre-primary school
The findings of the study
revealed that pupils‟
performed better in numeracy
compared to literacy. Pre-
primary school learning
experiences, teachers‟ self-
efficacy, and type of school
attended influenced pupils‟
When learning occurs there are positive
results and management change can influence
the performance of learning and proper
supervision can yield good results hence the
need for this study.

102
Variable Author
(year)
Title of the study Methodology Findings Knowledge gap
experiences in promoting academic
achievement.
achievement in literacy and
numeracy.
Participatory
monitoring and
evaluation
process
Muriungi
(2015)
The role of
participatory
monitoring and
evaluation programs
among government
corporations: a case of
Ewaso Ngi’ro north
development
The research used descriptive in that
it described the role, challenges and
strategies at ENNDA. The population
for this research included 149
ENNDA staff and 12 community
members
The study established that
lack of time, insufficient
monitoring and evaluation skills, poor pay lack of
enough funds, inadequate
staff, lack of skills,
technological challenges,
lack of awareness and poor
infrastructure hindered
Participatory Monitoring and
Evaluation
There need for more research on evaluating
the effectiveness of performance
measurement systems to enable efficient
allocation of increasing scarce resources.
Participatory monitoring and evaluation
process and performance of literacy and
numeracy educational program in
strengthening learning and accountability in
institutions
Nthenge
(2014)
Influence of
participatory
monitoring and
evaluation on
performance of public
private partnership
projects in Nairobi
county, Kenya
This study used descriptive survey
research design. The population of
this study was composed of various
stakeholders in the PPPs including
government totaling 252. A
combination of stratified sampling
and simple random sampling was
used Through simple random
sampling, 152 respondents were
picked from the population
The study concluded that
stakeholder perspectives had
the greatest effect on the
performance of
PPPs projects and also
institutional strengthening,
and facilitated negotiations,
while public accountability
had the least effect to the
performance of PPPs projects
Selection of appropriate indicators improving
the quality of the project, open
forums/meetings held which involve
stakeholders and selecting the appropriate
indicators in a PPP project has been difficult
due to stakeholders’ different preferences in
Nairobi County. So the current study will try
to apply Participatory monitoring and
evaluation process methodology in
identifying and engaging key stakeholders
whose power and interest can influence in
selecting the right indicators hence project
performance.

103
Variable Author
(year)
Title of the study Methodology Findings Knowledge gap
School
environment
Oyuga,
(2011)
Determinants of
adoption of
participatory
monitoring and
evaluation in
management of public
secondary schools in
kisumu east district,
kenya
The study adopted a descriptive
survey design. Purposive random
sampling techniques and analyzed
data by use of
The study found out that the
skills of principals and board
of governors influences
adoption of participatory
monitoring and evaluation in
public secondary schools
Other factors identified
included staff capacity,
availability of funds, attitude
of school managers, level of
involvement of stakeholders,
at politics and competence.
The current study seek to establish the extent
to which school environment influence
performance of literacy and numeracy
educational programme in Nairobi County on
the context of lower primary school classes
which involves learners from pre-primary
school. The main aim being how the learners
are involved in learning together with their
teachers
Parnwell
(2015)
Influence of school
infrastructure on
academic
performance in
public primary
schools in Ruiri
location-Meru
County, Kenya
The study adapted descriptive survey
research methods, purposive
sampling, data analyzed through
SPSS
The study finding indicates
that only one public primary
school
has a
Library, inadequate study
materials, overcrowded
classrooms and poor
maintained.
The current study seek to bridge the gap of
school environment on performance of
literacy and numeracy educational program.
Morgan
(2015)
The Influence of
School Leadership
Practices on
Classroom
Management, School
Environment, and
Academic
Underperformance
The School
Leadership, Environment, Classroom
Management Assessment
Questionnaire
(SLECMAQ) was developed for this
study and used to collect the data.
The findings will contribute
to a positive social change by
supporting policies to
implement leadership
frameworks at
underperforming primary
schools and thus improving
the quality of education in
Jamaica
The study ought to investigate the better ways
of handling school leadership styles hence
improved performance of literacy and
numeracy educational programs.

104
CHAPTER THREE
RESEARCH METHODOLOGY
3.1 Introduction
This chapter focused on research methodology that was used to conduct the study. They
include: research paradigm, research design, target population, sample size and sampling
procedure, research instruments, validity and reliability of research instruments, data
collection procedures, data analysis techniques, ethical considerations and
operationalization of variable.
3.2 Research Paradigm
The study adapted non-committal pragmatism model structures of philosophy which in
real life uses mixed methods in collecting data and analyzing it. In the current study the
mixed methods research provides a more comprehensive composite phenomena meaning
could not be accessed by any other methodology. This is so since the study captures both
qualitative and quantitative aspect of participatory monitoring and evaluation process and
performance of literacy and numeracy education programme hence pragmatism is the most
appropriate for this study (Creswell and Plano, 2011).
Similar findings were from Shannon B. 2015; Charles, Sanders, Peirce and Creswell,
(2003) argued that investigators question on how and what in solving a research problem.
This paradigm is chosen because it prepares fundamentals of theoretical substructures for
mixed-methods research according to (Tashakkori and Teddlie, (2009); Somekh and Lewin
(2005). In this case some mixed – methods researchers range themselves analytically with
the transformative paradigm as posited by (Mertens, 2005).The pragmatic paradigm put
research phenomena at a central place implying that proceeds towards choosing a better
way of giving perceptions into the queries with no philosophical faithfulness to no other
paradigm option (Creswell, 2003). For the research problem "key," methods of collecting
and analyzing data are chosen as the ones most likely to provide insights into the issue
without any methodological allegiance to any alternative paradigm. It uses mixed models
which includes both qualitative and quantitative methods and subsequently neutralizes or

105
cancels the limitations and biases inherent in any single method (Byrne et al 2007). The
advantage of this paradigm is the flexibility in the investigation techniques applied because
it allows the two methods to be used that is qualitative and quantitative techniques of
collecting data.
This study sought to perceive the stakeholders’ encounters and opinions on performance
of literacy and numeracy educational program in public primary schools Nairobi County.
Consequently, the study generated both qualitative and quantitate data which helped get a
broad-spectrum of enough facts in assisting to form opinions. Purposes of using
pragmatism is the beliefs on mixed methods understanding and the breaking down of the
pecking order connecting positivist and constructivist, methods of telling things in a proper
meaningful manner. Methodology applied here subsequent mixed method since it involved
two variety of methods qualitative and quantitative, design mixed methods provided
particular administration for processes in a research design (Creswell, 2012). Method used
was proper because the reality of the environment for the phenomena in participatory
monitoring and evaluation process and performance of literacy and numeracy educational
programme can be investigated in a subjective and objective manner.
3.2.1 Research Design
This study was guided by descriptive survey research design and correlation research
design. As posited by Cooper and Schindler (2003), a descriptive survey research design
study is anxious in discovering the how, what and where of occurrences. Descriptive
studies depicts parameters responding to who, what, and how inquiry. This method was
chosen because it is more accurate and correct in involving the explaining of happenings,
observation and explains the narratives statements in a carefully planned manner. This
research design also depicts the attributes of inhabitants fully, techniques and tools for
gathering facts on how that data is analyzed (Chandran, 2004). On the other hand
correlation research design was employed to depict the relationship between participatory
monitoring and evaluation process and performance of literacy and numeracy educational
programme .The study therefore generalized the findings to all the public primary schools
in Nairobi County with the help of this research design.

106
Furthermore in the current study, the influence of PM&E process, school environment
variables and performance of literacy and numeracy educational program were studied.
Therefore, both descriptive research survey design and correlation research design were
used in the study. Descriptive survey research design describes the problem while
correlation research design explains the relationship by use of simple and multiple
regression models. However the study adapted the grade design of mixed method whereby
data collected was analyzed on qualitative and quantitative propositions of instruments for
collecting data were questionnaires and interview schedules.
3.3 Target Population
The target population constitutes Head Teachers in 200 public primary school in Nairobi
County, lower grade primary school teachers in grade 1-3, Curriculum Support
Officers(CSO’S) and Research Triangle Institute International officers (RTI officers). The
unit of analysis are the on-going literacy and numeracy educational programme and public
primary schools and RTI international. This study comprised target population of 2053.
The literacy and numeracy educational programme is a national government programme
spread in the 47 Counties in the Country but the study was delimited in Nairobi.
According to Yurdusev (1993) target population restrains part of the body of team of
researcher involved in examining the problem. Therefore, the findings generalizes
population under investigation, since they all have common and significant traits in them.
Long (2002) argued it is better applied to big samples under normal circumstances and
where feasible and proper constrains are applied. The broad sample size is applicable in
this study.
National government literacy and numeracy educational intervention program, on- going
TUSOME programme in Kenya located in Nairobi but offering services to all the 47
counties, the 200 public primary schools in Nairobi County and a handful sample of
Curriculum Support officers from the County. Sampled participants in the on-going
program were studied. The participants were derived from lower public primary school
teachers who are involved in the program, the head teachers in the 200 primary schools

107
who attends the courses offered by the implementing NGO and the CSO’S from the
MOEST, and also the monitoring and evaluation officers from RTI were involved in the
study.
These officers from RTI international were monitoring and evaluation officers, directors
of the institute, deputy directors, project managers, project coordinators, ICT officers
involved in transmitting data collected during class observations and the field officers who
supervise the trainings of TUSOME when teachers and coaches are being trained Country
wide.
Table 3.1
Target Population
Category of target population Target population
Curriculum support officers 21
RTI staff members 32
Head Teachers 200
Lower grade teachers 1800
Total 2053
Source: MOEST (2018)
3.4 Sample Size and Sampling Procedure
Discussion of samples and sampling procedure were done in this section. Kothari (2007)
elucidates a sample size as numerous objects picked in the surrounding to add up to a
sample while sampling refers to the techniques used in choosing objects of sample.
3.4.1 Sample Size
The sample size used for the study was gotten using Yamane formula denoted by the
population size and the acceptable margin of error of 0.05 as designated in the formula
which was proposed by Alemenda et al. (2010). From the target population of 2053 using
formula for population proportion as suggested Yamane (1967) also supported by (Owino,
2013).

108
Sample Size (𝑛) = 𝑁
1+𝑁(𝑒)2
Where;
N = target population
e = Precision error at 95% confidence level = 0.05
n = Desired sample size where population is less than 10,000
e2 = (0.05)2
Therefore, at N = 2053 at 95% confidence level. The sample size for this study is computed
as shown below.
𝑛 = 2,053
1+2,053(0.05)2 = 2,053
1+2,053 (0.0025)= 334.773 This should be 335
≃ 335 respondents
Table 3.2
Sample Size
Categories Target population Sample size
Curriculum support officers 21 3
Research Triangle Institute 32 5
Head teachers 200 33
Lower primary teachers 1800 294
Total 2053 335
3.4.2 Sampling Procedure
The Sampling unit of study were literacy and numeracy educational program in Nairobi.
Sampling frame for schools implementing the projects was a normal list from education
county director which had the titles of the schools, number of teachers per school, and the
specific individual respondents from lower classes who were the main respondents in
giving the information required by the researcher. Simple random sampling was
appropriately selected since it is a subset of a statistical population in each member of the
subset has an equal probability of being chosen. There were 200 public primary schools
out of which 33 public primary schools were systematically randomly sampled. Purposive
sampling was employed to 33 Head Teachers since they had in-depth information

109
pertaining to study constructs, while 294 lower public primary school teachers were
selected through simple random sampling from the 1800 teachers. To be able to get the
sample size of lower teachers the researcher created a raffle from 1-1800 and folded them.
The papers were put in a hat and then mixed up whereby they were supposed to be picked
by the teachers without replacement. Those who picked from1-294 formed the sample size
of the lower primary school teachers. On the hand, out of 21 curriculum support officers
from Nairobi County 3 officers were purposively sampled. In addition 5 officers from the
implementing NGO (RTI) were purposively identified and participated in the in-depth
interviews during data collection process. All the respondents were systematically sampled
through simple random sampling procedure.
Simple random sampling methodology was used to Head teachers and lower primary
teachers, was preferred because they have been trained on TUSOME projects hence were
best suited to provide the information sought under this study. Creswell (2015) argues that
random sampling offers a practicable and effective alternatives and higher accuracy of
results than any other technique. Therefore, categories and sample size in the table below
were determined by calculations using Yamane formula (1967).
Table 3.3
Sampling Procedure
Categories Target
population
Sample size Sampling procedure
Curriculum support officers 21 3 Simple random sampling
Research Triangle Institute 32 5 Simple random sampling
Head teachers 200 33 Simple random sampling
Lower primary teachers 1800 294 Simple random sampling
Total 2053 335
With sample size determined, proportional allocation was adopted to distribute the
respondents among various categories shown as follows:
n1 = n.p1

110
n2 = n.p2
n3 = n.p3
Where;
n1 = Category sample size
n = Determined sample size above 335
p = Proportion of population in each category
Hence for curriculum support officer represented by;
n1 = 335 𝑥 21
2,053 = 3 respondents.
RTI Monitoring and evaluation officers represented by;
n2 = 335 X 32
2053 = 5 respondents
Head teachers represented by;
n3 = 335 𝑥 200
2,053 = 33 respondents.
While for lower primary teachers represented by;
n4 = 335 𝑥 1,800
2,053 = 294 respondents.
3.5 Research Instruments
Data was gotten by use of questionnaires and interview guide. Data collected in this study
entailed responses thematic including participatory M&E process, school environment and
performance of literacy and numeracy educational programme. The research instruments
were delivered by researcher and four research deputies to the right people under
investigation. For the Curriculum Support Officer’s and the Research Triangle
International officers an in-depth interview schedule was used to get the required facts.
3.5.1 Questionnaires for Head teachers and for Grade 1-3 Teachers
The study applied two research tools; questionnaires and interview guides to collect
information from the respondents. The questionnaires used had both open and closed
questions. According to (Bhaltacherjee, 2012) a research tool are composed of organized

111
queries deliberated apprehending responses from respondents in a systematics way. This
tool considered appropriate since it helps in gathering facts in a large numerous respondents
who are under investigation. Methodology selected was appropriate since it allows the
respondents to accept insignificance of the study since they followed the steps of PM&E
process, stakeholder engagement, school environment and the performance of literacy and
numeracy educational program. This allows the respondents to be fully active in being
involved in the learning and management process.
The respondents were enlighten about the determination of collecting facts before the
questionnaire were administered and they were guaranteed privacy of the information
given by them since they were only met for academic purposes. Respondents were
requested to select from a fixed list of answers whereby they were supposed to select any
one of the options given. This method facilitated coding and helped so much in quantifying
the answers to the questions. Part one of the questionnaire collected information regarding
the respondents’ demographic information. The purpose of this section is facilitate the
background information of the respondents while part two sought to acquire information
on participatory monitoring and evaluation process. Part three seek information inscribing
on stakeholder engagement, stakeholder capacity building, data collection, data
management, implementing change, school environment and performance of literacy and
numeracy educational programme. In this study respondents were requested to rate the
statements of every variable in a likert scale of 1-5, with 1 indicating “strongly disagree”.
2 disagree, 3 neutral 4 agree and 5 indicating strongly agree” in this way it helped the
respondents in responding to the research statement and getting the information in an
accurate manner with minimal assumptions.
3.5.2 Interview Guide for Curriculum Support Officers and Research Triangle
Officers
Interview guide was used to collect qualitative data from key informants who oversee the
programme, in the current study the key informants are the curriculum support officers
from the MoEST and officers from the Research Triangle International Institute commonly
referred as (RTI). These officers are monitoring and evaluation officers, directors of the

112
institute, deputy directors, project managers, project coordinators, ICT officers involved in
transmitting data collected during class observations and the field officers who supervise
the trainings of TUSOME when teachers and coaches are being trained Country wide.
Bhattacherje, (2012) says that, interviews are personalized form of data collection
methodology than questionnaires and are carried out by knowledgeable interviewers
applying research methodology agreements as questionnaires surveys for example
standardized set of queries. Bahattacherjie adds that in interviews, the interviewer has the
chance or shed light on any quarry lifted by the respondents or ask probing or follow-
questions.
The interview guide was divided into three parts. Part one to introduce interviewer to
generate affinity with interviewee and demographic information on respondents. The other
sections was guided by the questions based on the indicators for each variable in the study.
The interview took averagely 25-30 minutes at their respective offices. The interview
schedule was conducted from 12th November 2018 to 20th December 2018.The interview
schedule focused on the variables under study and as the interviews progresses the
interviewee elaborated more on the crucial information about the challenging issues in the
programme under study. Interview schedule was administered to curriculum support
officers who provided concrete information about the programme which was very
important to the study. The data collected necessitated every respondent on the study
themes including participatory monitoring and evaluation process, school environment and
the performance of literacy and numeracy educational programme.
3.5.3 Pilot Testing of Research Instruments
Tools used for piloting were tested in some selected public primary school in the
neighboring Kiambu County and the questionnaires were delivered to a few head teachers
and lower grade teachers who have similar characteristics and are also implementing the
same programme in the Country. The researcher administered 34 questionnaires to selected
school which was a sample from 335 to 34 using the Mugenda (2008) who posits that 10%
of the study sample is adequate for pilot study. The questionnaires were delivered through
hand delivery and left to be filled so that they could be collected later to an agreed date by

113
both the researcher and the respondents. The researcher found out that the questionnaires
were well filled, meaning that they were okay for data collection to the right respondents..
A pilot instrument which is a questionnaires should be clear, non- ambiguous, should
contain simple questions and straight to the point. The current study used questionnaire’s
to collect data and before embarking on the main data collection process 10% of the sample
size which was 327 was used in piloting at Kiambu County. Kiambu County was chosen
because it had similar characteristics with Nairobi County so it was ideal for selection. The
questionnaires were filled and any ambiguity and wrongly stated statements were corrected
and validated by the supervisors and the Monitoring and evaluation experts before
embarking on the major exercise. The instrument was found to be fit to collect the
information required by the researcher. The instrument was reliable at 0.094 meeting the
requirement of a god questionnaire. Interview guide was administered to one curriculum
support officers in the same county to test the validity of the instruments. According to
Priyanga (2017) the purpose of pilot study was to test the validity and reliability of research
instruments. A pilot study is generally done on persons of pertinent audiences (Hulley,
2007) though different from those of final sample to avoid influence on later behavior of
research subjects of already involved in the investigation.
3.5.4 Validity of the Research Instruments
A research is valid if it generally measures what is meant to measure and when data
collected directly and precisely representing the respondent’s opinions as stated by
(Creswell and miller 2000). Validity of research instrument was ensured in pilot testing to
help define the instruments. This was ensured through the institutions that had specific
individual who responded to the questions well in the questionnaire. Prior to pre-testing,
experts and peer opinion was sought on the representation and suitability of the questions.
Suggestions for improvement were made where necessary and amendments made.
Validity refers to the correctness and meanings of deductions which are found research
findings, in other words, validity is at the point of getting findings acquired from the
analysis represent phenomena under study (Mugenda and Mugenda, 2003). Thus validity

114
is a subject concerning what can be measured. An instrument is validated by proving that
items are representative of the characteristics that it is claimed to choose carefully (Otieno,
2003). Validity for interview guide was ensured through careful record keeping through
voice recording during the interviews and note taking. My supervisors and qualified experts
in this field were also used in assessing the authority of the data finally variables and ideas
carried, sufficiently reflected problem being examination.
Content validity as defined by Kothari (2007), as the extent to which a testing of tools
supply enough description of title under investigation. In the current study content validity
helped in validating the accuracy of the questions asked in the questionnaires and the
information which was required by the researcher for the study. In this case then the
research objectives were achieved and questions were answered according to the research
ideas. This was taken care of through operationalization of the research variables and
ensured that translation reflected the true meaning of the content. The supervisors validated
it to be correct and ready for intended use according to the objectives. Construct validity
encompasses operationalization of research variables and ensures that translation reflects
the true meaning of the construct. It also guides on how to frame questions, gives guidelines
and instructions on how information should be filled.
Zohrabi, (2013) postulated that construct validity is how the researcher translates or
transforms a concept or an idea into functional and operating reality. On the part of
construct validity, theoretical definitions of the variable and selected indicators covering
the domain and dimensions of each of the variables was provided This was measured by
the expert in of education that area and the supervisors in the university.
3.5.5 Reliability of the Research Instruments
Reliability is the extent to which end results are congruous and precise constituting of the
total population being probed and giving similar end results of the study even if they are
repeated severally using the same of different methodology and type of procedures for
collecting data and obtain the same information through different sources Bhattacherje (
2012), he continues to argue that the same results are acquired if the scale is used to

115
measure the same construct implying that even if it is done multiple times it will yield the
same results. Chakrabartty (2013) argues that reliability any tool of research is reliable if
able to measure consistently, precisely, repeatedly, trustworthy results.
This is supported by Mugenda and Mugenda, 2003) by stating that reliability being chosen
carefully the degree to which a researcher instrument yields consistent results after repeated
trials (Borg and Gall, 1989) note that an instrument is reliable if it is internally consistent
or stable over time. That is if it provides consistent results. Reliability was done by writing
all the questions for interview schedule down and administering it in a comprehensive
manner according to the questions as per the objectives while the quantitative data was
filtered through a questionnaire using a likert scale of 1-5. A likert scale was appropriate
because the study has a qualitative aspect in addition to seeking perceptions of the
respondents pertaining to the study variable.
Split half method was used by dividing instruments into two halves – odds and evens and
then Pearson’s correlation ® calculation was done between the scores of the two halves.
Split half method was used to pretest the reliability of the instruments by subjecting 33
items in the questionnaires which represented 10% of the study population. The Pilot
respondents were from Kiambu County public primary schools and then Cornbrash’s
Alpha was calculated. Correlation between the two computed scores were established using
Cronbach’s coefficient Alpha. As put by Haier et al. (2006), a scale is reliable if Cronbach’s
coefficient alpha of the scale is above 0.7.
Consequently Spearman- Brown formula was used to determine the reliability of the entire
test, where reliability:
𝑅𝑋 = 2𝑟
1 + 𝑟
R = denotes estimated reliability of the entire test
r= the correlation between the halves which are measured to be strictly parallel
RX is the estimated reliability of the entire test
Hence reliability was determined according to Frankel and Wallen (2010) and alpha above
0.7 is acceptable

116
𝑟 = √𝑁𝜀𝑥𝑦 − (𝜀𝑥)(𝜀𝑦)
[𝑁𝜀𝑥2 − 𝜀(𝑥)2] [𝜀𝑦2 − (𝜀𝑦)2]
Where;
N = number of pairs of scores
∑xy = sum of the products of paired scores
∑x = sum of x scores
∑y = sum of y scores
∑x2 = sum of squared x scores
∑y2 = sum of squared y scores
The split halves was transformed into an appropriate reliability estimates for the entire test
and Spearman – Brown prophecy formula was applied.
Where RX is the estimated reliability of the entire test and r is the Pearson correlation
between the two halves. Hence reliability was determined according to Frankel and Wallen
(2010) and alpha above 0.7 is acceptable. The current study had a composite reliability
value of 0.994 which was greater than 0.7 meaning that the research instrument was reliable
and appropriate for the study.
The results in Table 3.4 shows that all the themes were reliable since they had a Cronbach
alpha coefficient above 0.7 which is considered as sufficient in the study and being in
consistent with the propositions by orodho, (2009) which posited that a value of not less
than 0.7 is sufficient and acceptable. This was established through the variable components
used in the study and the performance of literacy and numeracy educational programme
was assumed to have acceptable level of reliability.

117
Table 3.4
Results for Reliability Test of the Study
Variable No of items Cronbach’s alpha
Coefficient (a)
Performance of literacy and numeracy 10 0.986
Stakeholder engagement 10 0.996
Stakeholder capacity building 12 0.995
Data collection 11 0.997
Data management 16 0.995
Implementing Change 18 0.996
school environment 13 0.993
Total 90 0.994
3.6 Data Collection Procedure
Prior to going on board to data collection process pertinent acceptances was obtained. First
an introductory letter from the University of Nairobi was obtained so as to facilitate in
getting the research permit from National Council for Science and Technology. In addition,
a letter from the employer was obtained to assist in collecting the information of public
primary schools and the number of teachers from County director’s office. An
authorization letter from the ministry of education to allow data collection from the
sampled schools was provided. An introductory letter for the research assistants to collect
data was also made available and they embarked on the exercise. Collection of primary
data was administered through questionnaires and interview schedules which were sampled
to a few respondents.
The two research assistants were instructed on research morals, research instruments
administrations, interview skillfulness and data coding. The researcher oversaw the whole
exercise; made spot checks to ensure conformity to standards and guidelines. A covering
letter stating the purpose of the study was attached guaranteeing respondents privacy.
Questionnaires were delivered through hand delivery and were picked later at an agreed
date by both the researchers and the respondents. Though in some cases some respondents

118
opted immediate feedback and gave out the questionnaires after filling them. On
completion of data collection, the tools were cross examined, cleaned information coded
ready for analysis.
3.7 Data Analysis Techniques
In this study descriptive and inferential statistics were utilized to analyze qualitative and
quantitative data. The data collected using questionnaires were checked for completeness
and was subjected to Normality test which examined visibility by use of plots, by
significant tests of comparing the sample distribution to a normal one as argued by Field
(2009). On the hand qualitative data was analyzed through content analysis thematic
themes derived from an in-depth interview schedule was meshed together with the
quantitative data to enrich the findings of the study.
3.7.1 Descriptive Statistics
Descriptive analysis was adapted in this study. Quantitative data was obtained and analyzed
appropriately through the use of a statistical package for social (SPSS) version 25,
instrument were used to capture descriptive and inferential statistics. By use of descriptive
data analysis, frequencies and percentages were obtained. In this study, arithmetic mean
was the measure of central tendency as a statistical tool which was used in the analysis also
Pearson’s Product Moment Correlation, multiple regression and linear Regression.
3.7.1.1. Quantitative analysis
According to Brymer and Cramer (2005), data is analyzed in order to fulfill research
objectives and give solutions to research questions. Descriptive data was analyzed by using
frequencies and percentages. Both the arithmetic mean and standard deviation were used
as statistical tools to measure central tendency and dispersion respectively. These statistical
tools are, according to Gakuu, Kidombo, Keiyoro (2018) ideal for the interval data. The
position about where items tend to cluster is indicated by the measure of central tendency
and it was considered the most representative statistics for the whole set of data. Validity
and reliability of data was triangulated to ensure that data collected from different
participants and different localities was actually reliable and valid according the

119
instruments administered. Data obtained was cross checked for consistency of specific and
factual data items which were recorded in the data collection instruments. Data was
triangulated using the information from the Head Teachers, lower primary school teachers
and information from the CSO’S and RTI international institute officers.
3.7.1.2. Qualitative analysis
According to Bodgdan and Biklen (2003) they argue that qualitative data analysis is
operating with data, breaking it into smaller units for ease in working with them, coding
that data must be coded and synthesis so that it can be researchable. This means when
searching you are able identify explain and search patterns links for facts collected. So,
qualitative data procedures involves analysis of transcripts, which help in identifying the
themes gathering information which needs to be put together as texts (Burnard et al, 2008).
A critical assessment of each response was performed as a result of interviews and analyzed
using thematic analysis in conjunction with the study key objectives and subsequently
presented with the report in narrative extracts. Stake (1995expalins this form of data
analysis by grouping it according to themes and definitions into categories.
3.7.2 Inferential statistics
The inferential analysis was performed by use of correlation and regression to show the
relationship, direction and strength of the independent variable and dependent variable.
3.7.2.1 Correlation analysis
Correlation analysis is a statistical method which is applied to give resolutions and find if
any connection existed a between themes Bluman (2009). Pearson’s product moment
correlation coefficient (r) is universally applied to social sciences as a measure of power in
liner dependence between two variables which have a strong relationships between
dependent and independent variables. In this case Pearson’s product moment correlation
coefficient (r) was adapted.

120
3.7.2.2 Regression Analysis
Regression analysis is a statistical measure which describes nature of relationships between
variables either negatively, positively, linear or nonlinear according to (Mugenda and
Mugenda, 2003). Whom continues to argue that any data acquired from area of raw data,
it is very hard to explain it unless it is cleaning, coding and key-punched in the computer
and then later analyzed for correct and accurate information required. Regression analysis
was used to analyze and influence the variables under investigation. Scatter diagrams were
plotted to indicate the linear relationship between the dependent and independent variables
and test the two-tail test which will either allow the positive or negative influence when
testing the hypothesis. The combined variables were analyzed by use of multiple regression
analysis for example participatory M&N process, performance of literacy and numeracy
educational programme. Based on this the study examined the existence of significant
association between respondents’ profile, participatory monitoring and evaluation process,
school environment and performance of literacy and numeracy educational programme.
Regression analysis (of the form, �̂� = 𝑎 + 𝑏𝑋 , where 𝑌 is an estimate of the average value
of Y corresponding to a given value of X. given that X is the definite value of the
independent variable, a- a constant that is an estimate of α, the y intercept of regression
line and b is an estimate of β, the slope of regression line – a constant. However, note that
the expression above implies a straight line, i.e. perfect relationship because this is never
the case in real research, we have an error term or residual denoted by𝜀𝑖. Therefore, Yi =
β0 + β1Xi + 𝜀𝑖 with β instead of b and a will be used to test hypothesis, to decide the
existence of significant relationship between variables under study.
Numbering of the Regression models developed for analysis and relationship of the themes
is done. When regressing, for this study conceptual and statistical models were adapted in
simple moderation as suggested Baron and Kenny, (1986) explaining moderator as a
qualitative for example gender, colour, status and quantitative as examples of levels in
rewards, variables that affect the strength and direction of the relationship linking an
independent or predictor variable and dependent criterion variable. The portrayed
conceptual and statistical models as shown in figure 2.

121
a
X- Predictor variable, m= moderator variable, Y= criterion variable, XM= interaction
term, path a, b, c= regression
a
b c
Source: Baron and Kenny (1986)
Figure 2: Conceptual and Statistical Models for Simple Moderation
Figure 2 indicates a conceptual model applied in this study, test of themes of moderator
influences the relationships linking the independent variable and the dependent variable at
the same time statistical model designates regression conveyed at ‘path a’ as the predicator
influence on Y, ‘path b’ as the moderator influencing on Y while ‘path c’ as interplay term
influencing on Y. the moderator hypothesis is assisted when interplay (path c) was
significant.
Dependent variable:
Y - Performance of literacy and numeracy educational programme
Indicators: Improved reading skills, letter recognition, listening skills, speaking skills,
writing skills, Simple arithmetic calculations, improved transition rate, Satisfaction of
programme beneficiaries, class average performance, timely acquisition of literacy and
numeracy skills.
Independent variables:
XI - stakeholder engagement
X2- stakeholders’ capacity building
X3 - data collection
X Y
M X
M
X M
m
Y
The conceptual model
The statistical model

122
X4 - data management
X5 - Implementing change
X6 - combined participatory monitoring and evaluation process
𝛽0 - Constant term
𝛽1 - Beta coefficient
ɛ - Error term.
Performance of literacy and numeracy education programme
Moderating variables:
X7 - school environment
Regression model of hypothesis one
In hypothesis one it was linear thus it guided the regression model in data analysis;
Model 1
Linear regression was used to test 1. H0: there is no significant relationship between
stakeholder’s engagement and performance of literacy and numeracy educational
programme as indicated in the equation
Y=f(X1, ɛ)
Y= 𝛽0+ 𝛽1 X1 + ɛ
Where ɛ is a random error
Regression Model for hypothesis Two
In hypothesis two linear regression model was used to test the data analysis;
Model 2
Linear regression was used to test 2. H0: there is no significant relationship between
stakeholder’s capacity building and performance of literacy and numeracy educational
programme as indicated in the equation.
Y = f(X2, ɛ)

123
Y = 𝛽0 + 𝛽2X2+ ɛ;
Where ɛ is a random error
Regression Model for hypothesis Three
Hypothesis three was linear regression hence the regression model was used to test the data
analysis;
Model 3
Also hypothesis three was linear regression thus the following regression model guided the
data analysis;
Linear was used to test 3.H0 there is no significant relationship between data collection and
performance of literacy and numeracy educational programme as indicated:
Y = f(X3, ɛ)
Y =𝛽0 + 𝛽3X3+ ɛ
Where ɛ is a random error
Regression Model for hypothesis Four
Model 4
Also fourth hypothesis is linear thus the following regression model guided the data
analysis;
Linear regression was used to test 4. H0 there is no significant relationship between data
management and performance of literacy and numeracy educational programme as
indicated in the equation.
Y= f(X4, ɛ)
Y=β0 + β4X4+ ɛ
Where ɛ is a random error
Regression Model for hypothesis Five
Model 5
In hypothesis five linear regression was used.5. H0 Implementing change has no
significance influence on performance of literacy and numeracy educational programme,

124
Y= f(X5, ɛ)
Y=β0 + β5X5 + ɛ
Where ɛ is a random error
Regression Model for hypothesis Six
Model 6
Hypothesis six was multiple regression so regression model guided the data for analysis;
Multiple regression was used to test 6. H0 the combined effect of PM&E process and
performance of literacy and numeracy educational programme, combined participatory
monitoring and evaluation process has no significant influence on performance of literacy
and numeracy educational programme.
Y=f(X1, x2, x3, x4, x5, ɛ)
Y=𝛽0+ 𝛽1XI + 𝛽2X2 + 𝛽3X3 + 𝛽4X4 + 𝛽5X5 + ɛ;
Where ɛ is a random error
Regression Model for hypothesis Seven
Model 7
Multiple regression was used to test the moderating influence between PM&E process and
performance of literacy and numeracy educational programme.
Y=f(X1, X2, X3, X4, X5, ɛ)
7.H0;Y=𝛽0+𝛽1XI+𝛽2X2+𝛽3X3+𝛽4X4+𝛽5X5+𝛽6X6+𝛽0X1M+𝛽8X2M+𝛽9X3M+𝛽10X4M+
𝛽11X5M there is no significant moderating influence of school environment on the
relationship between PM&E process and performance of literacy and numeracy
educational program, multiple regression was used. Qualitative data was analyzed through
content analysis, which Bryman (2012) defines as a proposition of investigation in records
texts seeking to quantify content in terms of prearranged classification in a systematical
and duplicable manner. Field notes were used to summarize the information collected
during the day’s activities on participatory monitoring and evaluation processes, school

125
environment, project leadership and performance of literacy and numeracy projects, and
the emerging themes put together on aggregate basis for systematic analysis of data.
3.7.3 Summary of Test of Hypothesis
Various hypotheses were tested in line with the objectives of the study. Table 3.5 illustrates
the summary of the research objectives, null hypothesis, Model of testing hypothesis, the
analysis and results were interpreted.

126
Table 3.5
Summary of Statistical Test of Hypothesis
Objective Null hypothesis Model of testing hypothesis Type of
analysis
Interpretation
of the results
1. To establish the extent
to which stakeholders
engagement influence
performance of literacy
and numeracy
educational programme
in public primary schools
in Nairobi County.
1. H0 There is no significant
relationship between Stakeholders
engagement and performance of
literacy and numeracy educational
programme in public primary
schools in Nairobi County, Kenya.
Using a linear regression analysis
Y= βO + β1X1+£
Y=Performance of literacy and numeracy
educational programs
βO= constant term
β1= Beta Coefficient
X1= Stakeholder engagement for
monitoring and evaluation
£= error term
Simple
Linear
regression
If the P-Value is
≤ 0.05, 1.HO is
rejected and
H1is accepted
2. To determine how
stakeholders capacity
influence performance of
literacy and numeracy
educational programme
in public primary schools
in Nairobi County,
Kenya.
2. H0 There is no significant
relationship between Stakeholders
engagement and Stakeholders
capacity building and performance
of literacy and numeracy
educational programme in public
primary schools in Nairobi County,
Kenya.
Using a linear regression analysis
Y= βO + β2X2+£
Y=Performance of literacy and numeracy
educational programs
βO= constant term
β2= Beta Coefficient
X2= stakeholder capacity building for
monitoring and evaluation
£= error term
Simple
Linear
regression
If the P-Value is
≤ 0.05, 1.HO is
rejected and
H1is accepted
3. To examine how data
influence performance of
literacy and numeracy
educational programme
in public primary schools
in Nairobi County,
Kenya.
3. H0 There is no significant
relationship between Data
collection and performance of
literacy and numeracy educational
programme in public primary
schools in Nairobi County, Kenya.
Using a linear regression analysis
Y= βO + β3X3+£
Y=Performance of literacy and numeracy
educational programme
βO= constant term
β3= Beta Coefficient
X3= data collection for monitoring and
evaluation;
£= error term
Simple
Linear
regression
If the P-Value is
≤ 0.05, 1.HO is
rejected and
H1is accepted

127
Objective Null hypothesis Model of testing hypothesis Type of
analysis
Interpretation
of the results
4.To determine the extent
to which data
management influence
performance of literacy
and numeracy
educational
4.H0 There is no significant
relationship between Data
management and performance of
literacy and numeracy educational
programme in public primary
schools in Nairobi County, Kenya
Using a linear regression analysis
Y= βO + β4X4+£
Y=Performance of literacy and numeracy
educational programme
βO = constant term
β4= Beta Coefficient
X4= data management for monitoring and
evaluation
£= error term
Simple
Linear
regression
If the P-Value is
≤ 0.05, 1.HO is
rejected and
H1is accepted
5. To assess how
implementing change
influence performance of
literacy and numeracy
educational programme
in public primary schools
in Nairobi county, Kenya
5. H0 There is no significant
relationship between Implementing
change and performance of literacy
and numeracy educational
programme in public primary
schools in Nairobi County, Kenya.
Using a linear regression analysis
Y= βO + β5X5+£
Y= Performance of literacy and
numeracy educational programme
βO= constant term
β5= Beta Coefficient
X5= implementing change for monitoring
and evaluation
£= error term
Simple
Linear
regression
If the P-Value is
≤ 0.05, 1.HO is
rejected and
H1is accepted
6. To establish how
combined participatory
monitoring and
evaluation process
influence performance of
literacy and numeracy
educational programme
in public primary schools
in Nairobi County,
Kenya.
6. H0 There is no significant
relationship between Combined
participatory monitoring and
evaluation process and performance
of literacy and numeracy
educational programme in public
primary schools in Nairobi County,
Kenya.
Using a Multiple regression
Y=βO+β1X1+β2X2+ β3X3+ β4X4+ β5X5 +£
Y=Performance of literacy and numeracy
educational programme
βO= constant term
β1,=stakeholders engagement for
monitoring and evaluation β2,=stakeholders capacity building for
monitoring and evaluation
β3= data collection for monitoring
and evaluation
Multiple
regression
If the P-Value is
≤ 0.05, 1.HO is
rejected and
H1is accepted

128
Objective Null hypothesis Model of testing hypothesis Type of
analysis
Interpretation
of the results
,β4= data management for monitoring and
evaluation β5= implementing change for monitoring
and evaluation
£= error term
7.To assess the
moderating influence of
school environment on
the relationships between
participatory monitoring
and evaluation process
and performance of
literacy and numeracy
educational programme
in public primary schools
in Nairobi county,
Kenya.
7. H0 There is no significant
moderating influence of school
environment on the relationship
between participatory monitoring
and evaluation process and
performance of literacy and
numeracy educational programme
in public primary schools in
Nairobi County, Kenya.
Using a Multiple regression
Y= βO + β1X1+£ β2X2+ β3X3 β4X4+ β5X5+
β6M+ β7XIM+ β8X2M+ β8X3M β8X4M
β8X5M
Y= Performance of literacy and
numeracy educational programme
βO= constant term
β1,=stakeholders engagement for
monitoring and evaluation β2,=stakeholders capacity building for
monitoring and evaluation
β3= data collection for monitoring
and evaluation
,β4= data management for monitoring and
evaluation β5= implementing change for monitoring
and evaluation
M=School environment
£= error term
Multiple
regression
If the P-Value is
≤ 0.05, 1.HO is
rejected and
H1is accepted

129
3.8 Ethical Consideration
Throughout the research processes ethical issues were observed and basic aspects of social
research were considered. Written communication seeking authority to collect data was done from
National Council for Science, Technology and innovation (NACOSTI), also wrote an introduction
letter to RTI International offices for approval to visit their offices and lastly to education county
director Nairobi. The two letters were provided hence commencing of the data collection which
finally led data analysis and reporting.
A transmittal letter to be allowed to collect data from the respondents was written explaining to
the importance of their participation at the same time giving truthful information to this study. An
in depth interview schedule was carried out and comprehensive information was acquired. All the
time the researcher adhered to ethical issues for example being honest, have confidentiality ethics,
disclosure, check on cultural sensitivity, do voluntary participation and be sensitive on security.
When data was being analyzed the researcher observed acceptable practices for writing a good
report.
3.9 Operationalization of the Variables
Operationalization involves description of operations which are used in measuring the study
variables (Mugenda and Mugenda, 2003). In this study the independent variables or explanatory
variables includes; participatory monitoring and evaluation process, PM&E reporting and
participatory dissemination of M&N results; moderating variable as school environment with
indicators of school leadership, teacher-pupil ratio infrastructure while the dependent variable is
performance of literacy and numeracy educational programme. Operationalization of variables in
this study are presented in Table 3.5.

130
Table 3.6
Operationalization of Variables
Objectives Variables Indicators Measurement Measurement
Scale
Tools of Data
Analysis
Data
Analysis
Techniques
1. To establish the extent to
which stakeholders
engagement influence
performance of literacy and
numeracy educational
programme in public primary
schools in Nairobi County,
Kenya
Stakeholders
Engagement Identification of
stakeholders
Stakeholders’’ level of
involvement
Developing of project
objectives
Developing monitoring
and evaluation plan
Stakeholders analysis
list with areas of
interest of each one of
them
Existence of developed
objectives
Existence of
stakeholders’
management plan.
Interval
Frequencies
Percentage
Mean score
Standard
Deviation
Correlation
Anova
Coefficient
Simple linear
Regression
Descriptive
statistics
Inferential
Analysis
2. To determine how
stakeholders capacity
building influence
performance of literacy and
numeracy educational
programme in public primary
schools in Nairobi County,
Kenya
Stakeholders’
capacity
building
Trainings for
monitoring and
evaluation workshops
Trainings for
monitoring and
evaluation seminars
Aligning training gaps
identified
M&E knowledge and
skills
Baseline plan
Mid-line plan
End-line plan
Seminar / workshop
review meetings
Monitoring and
evaluations practices
Interval
Frequencies
Percentage
Mean score
Standard
Deviation
Correlation
Anova
Coefficient
Simple linear
Regression
Descriptive
statistics
Inferential
Analysis
3. To examine how data
collection influence
performance of literacy and
numeracy educational
programme in public primary
schools in Nairobi County,
Kenya
Data collection
Selection of monitoring
and evaluation data
instruments
M&E data collection
and collation of
information methods
Existence of
TANGARINE tablet
M & E documents
Ministry of Education
reports
Existences of Gantt
chart
Interval
Frequencies
Percentage
Mean score
Standard
Deviation
Correlation
Anova
Coefficient
Descriptive
statistics
Inferential
Analysis

131
Sources of monitoring
and evaluation
information
Schedules of monitoring
and evaluation activities
Simple linear
Regression
4. To determine the extent to
which data management
influence performance of
literacy and numeracy
educational programme in
public primary schools in
Nairobi County, Kenya
Data
management Identifying specific data
analysis methods
Identify staff
responsible for data
management
Data analysis and
interpretation
Establishment of M&E
database
M & E reports writing
M & E documents
Existence of
responsibility matrix
monitoring and
evaluation documents
monitoring and
evaluation system
monitoring and
evaluation documents
Interval
Frequencies
Percentage
Mean score
Standard
Deviation
Correlation
Anova
Coefficient
Simple linear
Regression
Descriptive
statistics
Inferential
Analysis
5. To assess how
implementation of change
influence performance of
literacy and numeracy
educational programme in
public primary schools in
Nairobi County, Kenya
Implementing
change Reviewing collected
data
Number of transmitted
reports
Utilization of
monitoring and
evaluation results
Project intervention
monitoring and
evaluation document
monitoring and
evaluation reports
Closure reports of
monitoring and
evaluation results in
implementation
Interval
Frequencies
Percentage
Mean score
Standard
Deviation
Correlation
Anova
Coefficient
Simple linear
Regression
Descriptive
statistics
Inferential
Analysis
6. To assess how the
combined participatory
monitoring and evaluation
process influence
performance of literacy and
numeracy educational
programme in public primary
Participatory
monitoring and
evaluation
process
Stakeholder
engagement
Stakeholder capacity
building
Data collection
Data management
Implementing change
Level of stakeholder
involvement
Training works
Identification of tools
Data records
Utilization of M&E
results
Interval
Frequencies
Percentage
Mean score
Standard
Deviation
Correlation
Anova
Descriptive
statistics
Inferential
Analysis

132
schools in Nairobi County,
Kenya.
Coefficient
Multiple linear
Regression
7. To assess how the
moderating influence of
school environment on the
relationships between
participatory monitoring and
evaluation process and
performance of literacy and
numeracy educational
programme
School
environment
Participatory
monitoring and
evaluation
process
School infrastructure
Allocation of resources
Teacher/pupil ratio
School leadership
Identification of
stakeholders
Stakeholders’’ level of
involvement
Trainings for monitoring
and evaluation workshops
M&E data collection and
collation of information
methods
Identify staff responsible
for data management
Utilization of monitoring
and evaluation results
Availability of resources
Project sustainability
Data reliability
Existence of physical
facilities
Availability of learning
materials
Teacher/pupil ratio
School leadership
Stakeholders analysis list
with areas of interest
Existence of developed
objectives
Baseline plan
Mid-line plan
End-line plan
M & E documents
Ministry of Education
reports
Existence of
responsibility matrix
M&E reports
Continued funding by
donors
Ratio of resources
allocation
Interval
Interval
Frequencies
Percentage
Mean score
Standard
Deviation
Correlation
Anova
Coefficient
Multiple linear
Regression
Frequencies
Percentage
Mean score
Standard
Deviation
Correlation
Anova
Coefficient
Multiple linear
Regression
Descriptive
statistics
Inferential
Analysis
Descriptive
statistics
Inferential
Analysis

133
Performance of
literacy and
numeracy
educational
programme
Reading skills
Writing skills
Proficiency skills
Class average performance
Timely acquisition
Proficiency in speaking
skill
Letter recognition
Simple arithmetic
calculations
Beneficiaries satisfaction
Transitional rate improved
Learning materials
Trainings of workshops
Trainings of seminars
Employment of more
Teachers
Learning skills in
proficiency improved
Academic performance
improved
Interval Frequencies
Percentage
Mean score
Standard
Deviation
Correlation
Anova
Coefficient
Multiple linear
Regression
Descriptive
statistics
Inferential
Analysis

134
CHAPTER FOUR
DATA ANALYSIS, PRESENTATION, INTERPRETATION AND DISCUSSION
4.1 Introduction
This chapter presents the study results and how data was analyzed based on the themes drawn
from the study objectives. The variables include: questionnaires return rate; background
information of the respondents; basic statistical assumptions; engagement of stakeholders for
Monitoring and Evaluation and performance of Literacy and numeracy educational programme;
stakeholders capacity building and performance of Literacy and numeracy educational
programme; data collection and performance of Literacy and numeracy educational programme;
data management and performance of Literacy and numeracy educational programme;
implementing change and performance of Literacy and numeracy educational programme;
school environment and performance of Literacy and numeracy educational programme; and
moderating influence of school environment on the relationship between PM&E process and
performance of Literacy and numeracy educational programme.
4.2 Questionnaire Response Rate
The study administered 327 questionnaires to respondents comprising 33 head teachers and 294
lower primary teachers. In this study, an interviews schedule was conducted to 3 Curriculum
Support Officers (CSO, S) and 5 Research Triangle Institute International officers (RTI). The
study, therefore, comprised a total of 327 respondents. Out of these, 281 questionnaires were
correctly filled and returned, while all the 8 interviews were completed. In total, the study
attracted 281 out of the possible 327 responses; representing a response rate of 86% and
purposive Curiculum Support Officers and RTI Officers which was higher than 70% as
recommended by Mugenda (2008). The return rate was higher because there was direct
involvement with the concerned teachers and the Head Teachers who were available in the
sampled schools. The results of the questionnaires return rate are presented in Table 4.1.

135
Table 4.1
Questionnaire Return Rate
Response Frequency Percentage
Filled Questionnaires 281 86
Unfilled Questionnaires 46 14
Total 327 100
The return rate on the Table 4.1 is in line with cooper and schindler, (2006
); Nachmias and Nachmias, (2005, 1996) who argues that a response rate of 75% is achievable
for data analysis. Babbie, (2010) posits that 70% and above is deemed to be adequate enough
for any study. For this study it was within range as 84% was and above 75% making it possible
for the study to proceed. Others such as Saunders, Lewis, and Thornhill (2003) argue that 30-
50% response rate offers high information for statistical generalization that are acceptable in any
valid information for data analysis in any empirical study.
4.3 Background Information of Respondents
Background information about the respondents are an important part in social research since it
informs the nature of responses obtained. Age of the respondents, for instance, is deemed
important in attempt to understand their views about a phenomenon. Gender is also a major
consideration in understanding the dynamics about the respondents. The level of education of
the respondents also played a critical part in deciding of nature of responses obtained from a
study since it determines the manner in which the educationally diverse respondents express
opinions about a research problem. Level of experience is equally deemed important since it
determines the quality of responses, in terms of the validity of the responses obtained. 4.3.1
These are discussed in the sub-sequent sub-themes;
4.3.1 Distribution of Respondents by Gender
The study was interested to understand the gender of the respondents given its dynamics.
Therefore the respondents were asked to state their gender. The results are presented in Table
4.2

136
Table 4.2
Distribution of Respondents by Gender
The results shown in Table 4.2 revealed that out of 281 respondents who were involved in the
study 83(29.5%) of the respondents were male while 198(70.5%) were female. The data
indicated that both genders participated in responding to their views about how literacy and
numeracy educational programme being implemented. It was also necessary to offset biasness
that could have accrued as a result of different gender viewing the issues in different ways. Since
the number of female participants was more than twice the number of their male counterparts, it
can be concluded that the teaching profession and particularly the literacy and numeracy
educational programme was dominated by female gender which was okay in line with the
constitution 2010 that requires one third of either gender should be involved in the allocation of
jobs in the country.
Female participants were more in the study because according to the data given by the county
director’s office there were more females than males in the Nairobi County. This is so because
many women follow their husbands who work in Nairobi, at the same time many of them have
upgraded themselves to higher levels and especially in education programme and literacy and
numeracy being one of them unlike their male counter parts. They have also undertaken trainings
on literacy and numeracy programme organized by the MOEST of education in conjunction with
the implementing organizations. Also most teachers who teach lower primary in grade one to
three classes are female’s teachers. This is so because most of the public Primary Schools in
Nairobi County the biggest number are the females whereby in a school you might find one male
teacher who is the Head Teacher meaning that the majority are the females teaching those grades
and also fully involved in TUSOME trainings. In this case, there is a gap in gender distribution
which does not conform to the Kenyan constitution that the ratio of 2/3 in the job allocation.
Categories of gender values frequency percent
Gender Male 83 29.5
Female 198 70.5
Total 281 100

137
Also the grade one to three teachers were able to dominate the study since most female teachers
tend to be motherly to these young one who are still very young and so many schools find it
appropriate to give female teachers the classes rather than giving the male teachers. They are
characterized by being quick and sensitive to make a decision concerning a young child hence
they rarely consult on the warfare of the child at this stage unless the issue persists. In this case
they help the learner to understand the concepts of learning faster hence positive contribution to
the performance of literacy and numeracy educational programme.
The implication of this findings to the study given that female gender were almost twice the male
counter parts, is the female participated more in the programme hence giving them more
opportunity to learn more new skills than the male teachers who are few and not really interested
in teaching these young ones whom they claim it is the work of women to do that forgetting that
is why they employed in the first place. In this case, they have very little influence on the
performance in teaching these grades but they only influence on allocating teachers who are to
be trained and provide funds to be used by teachers during the trainings either in workshops or
seminars.
4.3.2 Distribution of Respondents by key stakeholders in the programme
The respondents were asked to state the stakeholders group they belong to in the programme.
The results are presented in Table 4.3
Table 4.3
Distribution of Respondents by key Stakeholders in the programme
Table 4.3 shows that majority of the respondents were grades 1-3 teachers, 240(85.4%),
followed by head teachers, 33(11.7%), and Curriculum Support Officers (CSO) workers,
Categories of key stakeholders’
in the programme frequency percent
Head Teachers 33 11.7
Lower Primary School Teachers
(grade 1-3) 240 85.4
Curriculum Support Officers 3 1,1
RTI Officers 5 1.8
Total 281 100

138
5(1.8%), and Research Triangle Institute International (RTI) workers, 3(1.1%), respectively.
This distribution of participants was equitable with respect to the sample size. The dominance of
the lower primary schools teachers in grades 1-3 is also due to the fact that they are normally at
the core of the implementation of the literacy and numeracy educational programme. The number
of head teachers was 33(11.7%), meaning that they were very few in the programme compared
to female teachers which actually brings a very great disparity in the study. For Head Teachers
there is actually very low chance of contributing significantly to the performance of the
programme directly in teaching from the classroom area but they can contribute to other factors
within the school environment which actually can lead to good performance of literacy and
numeracy educational programme Main contribution of Head Teachers is the distribution of
learning materials as given by the funding project through the MOEST.
The category of Curriculum Support Officers (CSO’S) is very vital because they are the agents
of the ministry of education directly in supervising and training of teachers and the Head
Teachers in the schools. There are 21 Curriculum Support Officers (CSO’S) in Nairobi County.
The ones sampled in the study included all the categories 1.1%. The number of CSO’S to
supervise schools is too small in comparison to number of primary schools in the county hence
need for more officers in order to give information required on timely bases.
The RTI International officers was another category which was interviewed and they comprised
3(1.1%). This is the implementing organization which have joined hands with the ministry of
education to foresee the programme come to reality and at least minimize the outcry of learners
finishing primary school education unable to write and read in both languages either English or
Kiswahili languages and simple arithmetic calculations as it is the cases today in our public
primary schools, (Uwezo 2012) group ‘that are our children learning’? RTI International has
been very instrumental in literacy and numeracy education programme since its inception and
piloting stages until the time it is going to hand over to the government to continue with the
program which has already been rolled out in all the primary schools in the Country. They funded
the programme from day one and helped the ministry of education to come out with strategies in
cubing the menace of reading in both Kiswahili and English and arithmetic calculations at
Country. They also provided reliable information in their database which they normally share to

139
all the parties participated at program also provided teaching materials for example the text books
for the three subjects in curriculum based competency (CBC) for the new education system in
the country.
4.3.3 Distribution of Respondents by Age brackets
The study sought to establish age of respondents according to their age groups since it was
considered an important factor. The respondents were, therefore, requested to indicate their age
groups. The results are presented in Table4.4
Table 4.4
Distribution of Respondents by Age brackets
Categories of Age bracket frequency percent
30 years and below 23 8.2
31 to 35 years 13 4.6
36 to 40 years 53 18.9
41 to 45 years 63 22.4
45 to 50 years 75 26.7
51 to 55 years 34 12.1
56 years and above 20 7.1
Total 281 100
The results in Table 4.4 showed that majority of the respondents, 75(26.7%) were between the
age 46 to 50 years, 63(22.4%) were between 41 to 45 years, 53(18.9%) who were between 36 to
40 years, 34(12.1%) were between 51 to 55 years, 23(8.2%) were 30 years, below, 20(7.1%)
were 56 years and above, and 13(4.6%) were between 31 to 35 years of age, in that order.
Majority of the respondents were of the age bracket 46 to 50 years this is shows that grade one
to three classes are taught by mature and experienced teachers in the profession due to delicacy
of the young learner in these classes. At the same time they are the ones who have attended the
trainings and seminars organized by the implementing organization so they have enough
knowledge on literacy and numeracy programme. Also some of these teachers have been
involved in training of other teachers during support trainers in the programme, during seminars
and workshops hence becoming experts on literacy and numeracy programme. Based on this
information many respondents are in the age bracket of (41-50) a total of 191(68%) respectively.
This is a very prime age whereby one is very productive in terms of performance and willingness

140
to be part and parcel of the work performed hence good results are experienced at the end of the
programme.
4.3.4 Distribution of Respondents by Highest Academic Qualification
The study sought to establish the highest academic qualification of the participants according to
their age groups since it was considered an important factor. The respondents were, therefore,
asked to indicate their level of education. The results are presented in Table. 4.5
Table 4.5
Distribution of Respondents by Highest Academic qualification
Categories of Highest Academic
qualification frequency percent
Certificate 7 2.5
Diploma 103 36.7
Bachelor 149 53.0
Masters 18 6.4
Others 4 1.4
Total 281 100
Table 4.5 showed that majority of the respondents 149(53.0%) had bachelor’s degree, while
diploma were 103(36.7%). The other category was master’s degree holders 18(6.4%) and those
with certificates were 7(2.5%). Those who had other qualifications were 4(1.4%) respectively.
These included different fields outside education but were participating in L&N educational
programme. Therefore numerical dominance of the bachelor’s degree could be attributed to the
education explosion in Kenya, and probably because educational qualification was an important
factor considered for the teachers to be involved in the literacy and numeracy educational
programme hence good performance of the programme. Based on the information from the
respondents many teachers have acquired a higher qualification other than the one they got from
the teachers colleges which was PI. P2, P3 (P represents primary teacher) and others as untrained
teachers.
In summary most teachers have the right qualifications which is required by the government
especially the diploma in management which has been made a must for every teacher teaching
in the country and for promotion purposes among many other requirements. The implication of
this results to the focus of the study is that, since most teachers have the right qualification they

141
stand a better chance of understanding the concept required in teaching these skills in literacy
and numeracy hence good performance of the programme. It is assumed that the higher the
qualification in learning the better skills earned and mastery of content is experienced.
4.3.5 Distribution of Respondents by Work Duration
The study sought to establish the period worked by the respondents in the current organization,
sub-county and school this was deemed important because the length of service was a measure
of conversance with the thematic areas under investigation. The participants were, therefore,
asked to state their length of service. The results are presented in Table 4.6
Table 4.6
Distribution of Respondents by Work Duration
Table 4.6 shows that majority of the participant had worked for a period of 16 years and above,
97(34.5%); followed by those who had worked for between 12 to 15 years, 74(26.3%); those
who had worked for between 8 to 11 years 62(22.1%); those who had worked for 4 to 7 years,
28(10.0%). Those who had worked for 3 years and below were 20(7.1). The findings indicate
that majority of the participants had worked in the current station for more than 15 years,
implying that they were conversant with the issues under investigation in the study, hence could
provide valid data. The length of service was also an indicator of the level of experience, hence
the numerical dominance of those with 16 years and above and which actually facilitated the
success of the programme since they had acquired the right knowledge and skills on the same
from piloting stages to the implementation time.
4.4 Basic Tests for Statistical Assumptions
This section presents analysis of various tests for linear and multiple regression assumptions.
Tests for statistical assumptions were done to ensure that basics for parameters were observed.
Categories of Work Duration frequency percent
3 years and below 20 7.1
4 to 7 years 28 10.1
8 to 11 years 62 22.1
12 to 15 years 74 26.3
16 years and above 97 34.5
Total 281 100

142
This typical assumptions and analysis were found to be necessary whereby they included
normality, linearity, and muliticollinearity and homoscedasticity test. These are further discussed
in the sub-sequent sub-themes.
4.4.1 Normality Tests
The study used Shapiro-Wilk test (SW-test) as opposed to Kolmogorov-Smirnov (KS-test)
ascertain that data was normally distributed since this is one of the assumptions of linear
regression analysis. This test for normality was introduced by Shapiro and Wilk (1965) for a
complete sample. According to Razali and Wah (2011), normal distribution of data is a key
assumption of many statistical procedures including t-tests, and linear regression analysis,
discriminant analysis, as well as the analysis of variance.
The most commonly used tests for normality include graphical methods (histograms, box plots,
quartile-quartile); numerical methods (skewness and kurtosis indices); and the formal normality
tests. There are four formal tests for normality, namely: Shapiro-Wilk test, Kolmogorov Smirnov
test, Lillierfors test, and Anderson Darling test. The Shapiro-Wilk test is the most powerful,
followed by Anderson-Darling test, Lillierfors test, and Kolmogorov-Smirnov test. Nevertheless,
all the four formal tests for normal distribution of data are not robust to small samples. For
example, Tabachnick and Fidell (1996) opines that Skeweness and Kurtosis are not appropriate
for establishing normality when the sample size is above 150 because no much difference would
be expected or revealed. The concept of normality has been argued to be important when
applying most statistical techniques. In this regard, many statistical operations such as
correlation, regression, analysis of variance, and other parametric tests assume that the
population from which the sample was drawn displays normal distribution of characteristics.
The normality assumption should be taken seriously; otherwise, it would be difficult to draw an
accurate and reliable conclusion about reality. Shapiro Wilk test gives values referred to as W
statistics. It is recommended that Shapiro Wilks to be used for small samples above 200. This
current study qualified Shapiro Wilk since n=281. According to Bonini, Hausman and Beirman
(1997), this is to mean that when W statistics is near or is equal to one (1) then it is assumed that
data presented is perfectly normal. Therefore the value of W statistics for the variable in this

143
study ranged from 0.906 and 0.969. as result to this it implies that data used in this study was
closer to normal as the values were not far from one ( 1). At this point it could be noted in normal
circumstances and real life situations data may not be perfect normally distributed. The results
of Kolmogorov-Smirnov and Shapiro- Wilk tests are shown in table 4.7
Table 4.7 Results of Kolmogorov Smirnov and Shapiro Wilk Tests
Variables Kolmogorov-Smirnova Shapiro-Wilk
Statistic df Sig. Statistic df Sig.
Stakeholder engagement 0.111 280 0.000 0.963 280 0.000
Stakeholders’ capacity
building 0.148 280 0.000 0.947 280 0.000
Data collection 0.112 280 0.000 0.906 280 0.000
Data management 0.131 280 0.000 0.969 280 0.002
Implementing change 0.122 280 0.000 0.926 280 0.000
School environment 0.170 280 0.000 0.957 280 0.000
The results in Table 4.7 reveal that stakeholder engagement, stakeholders’ capacity building,
data collection, data management, implementing change, and school environment were normally
distributed. This is because all the W Statistics Values were closer to 1.
Test of compliance to normal, linear, homogeneity by data collected, scatter plot diagram and
plot of residuals which were standardized against predicated dependent values were used in the
study. According to Razali and Wah (2011), normal distribution of data is a key assumption of
many statistical procedures including t-tests, and linear regression analysis, discriminant
analysis, as well as the analysis of variance.
They further argue that validity and reliability of statistical inferences are greatly compromised
when normality assumption is violated. The concept of normality has been argued to be
important when applying most statistical techniques. In this regard, many statistical operations
such as correlation, regression, analysis of variance, and other parametric tests assumed that the
population from which the sample was drawn displays normal distribution of characteristics. The

144
normality assumption should be taken seriously otherwise, it would be difficult to draw an
accurate and reliable conclusion about reality.
On the residual values as demonstrated in a distributed pattern which formed a cluster around
the straight line in a probability plot which confirmed normality assumptions. In this case the
results helped in verifying the normality assumptions for all the points on the normal P-P plot on
average spread in a linear as indicated in Figure 3.
Figure 3: Normal PP plot for Performance of literacy and numeracy educational
programme
Data collected was demonstrated and compiled to normality test for the residual values of
normality test for the values of the study variables, which was standardized and concentrated
around the center along Zero (0) point. This had an implication that there was no violation of the
assumptions of normality, linearity and homoscedasticity test. This supported by Hair et al
(1998) who argues that random and even distribution of residuals values thought the scatter plot
mean that the linearity assumptions had been met as illustrated in figure 4.

145
Figure 4: Scatter plot
4.4.2 Test of linearity
Regression analysis assumes that there is a linear relationship between the independent and
dependent variables (r>0). In this study the linearity of relationship was done using scatter plots.
For this end, performance of literacy and numeracy of educational programme was treated as the
dependent variable while stakeholder engagement, stakeholder capacity building, data
collection, data management, and implementing change and combined PM&E process and
school environment were independent variables. The test established that there was liner
relationship between the independent and dependent variables thereby make a good justification
of the use of linear regression. The Table 4.8 shows the results.

146
Table 4.8: Test for linearity
Variables Sum of Squares df Mean Square F Sig.
Performance * Stakeholder
engagement
Between Groups
(Combined) 141.889 109 1.302 4.021 0.000 Linearity 99.560 1 99.560 307.552 0.000
Deviation from Linearity 42.329 108 .392 1. 211 0.132
Within Groups 55.356 171 .324
Total 197.245 280
Sum of Squares df Mean Square F Sig.
Performance * Stakeholders capacity
building
Between Groups
(Combined) 140.025 107 1.309 3.368 0.000
Linearity 94.415 1 94.415 242.990 0.000
Deviation from Linearity 45.609 106 .430 1.107 0.274 Within Groups 67.220 173 .389
Total 207.245 280
Sum of Squares df Mean Square F Sig.
Performance * Data
collection
Between Groups
(Combined) 134.223 103 1.303 3.159 0.000
Linearity 90.382 1 90.382 219.078 0.000
Deviation from Linearity 43.8409 102 .430 1.042 0.402 Within Groups 73.022 177 .413
Total 207.245 280
Sum of Squares df Mean Square F Sig.
Performance * Data
management
Between Groups
(Combined) 127.080 116 1.096 2.241 0.000
Linearity 59.627 1 59.627 121.983 0.000 Deviation from Linearity 67.453 115 .587 1.200 0.142
Within Groups 80.165 164 .489
Total 207.245 280
Sum of
Squares df Mean Square F Sig.
Performance *
Implementing Change
Between
Groups
(Combined) 97.740 59 1.657 3.679 0.000
Linearity 69.905 1 69.905 155.259 0.000
Deviation from Linearity 27.835 58 .480 1.066 0.364
Within Groups 99.505 221 .450 Total 197.245 280
4.4.3 Tests for Multicollinearity
When two or more predicator variables in a multiple regression model are highly correlated a
Muliticollinearity occur as argued by Bickel, Ritov, & Tsybakov (2009). Multicollinearity is a
statistical phenomenon whereby more than two predicator variables are highly correlated
according to Gujarat and Porter (2009) which is caused by inter-correlation among the
explanatory variables. They also argue that the most logical way to test for mutlicollinearity
problem is to obtain correlation coefficients between pairs of explanatory variables. It is a
situation whereby the predictors correlate strongly amongst themselves. Regression analysis
technique assumes that there is no multicollinearity .O’Brien, (2007) gave suggestion that
tolerance of less than 0.20 and a VIF of 5or 10 or higher indicates that a multicollinearinty
problem has been experienced. In this study, both correlation coefficients (through correlation

147
matrix), and variance inflation factors (VIFs) were examined for significant multicollinearity
problem. Any VIF values exceeding 10 are usually indicator of significant multicollinearity.
Otherwise, multicollinearity problem is insignificant. The results were as shown in Table 4.9.
Table 4.9
Test for Collinearity
Variable Collinearity Statistics
Tolerance Significant VIF
Stakeholder engagement 0.661 1.513
Stakeholders capacity building 0.635 1.575
Data collection 0.532 1.880
Data management 0.532 1.881
Implementing Change 0.539 1.856
The results in table 4.9 for collinearity statistics testing were above 0.2 thus did not meet the
muliticolliniearity testing. In this case all the values did not exceed 10 meaning that they did not
meet the muliticollinearity test.
4.4.4 Homoscedasticity Test
Since there was approval of compliance to test on normality using normal and scatter plots,
homogeneity test was approved. This was so because there was existence of homoscedastic state
on the links between the study variables. The results are presented in Table 4.10
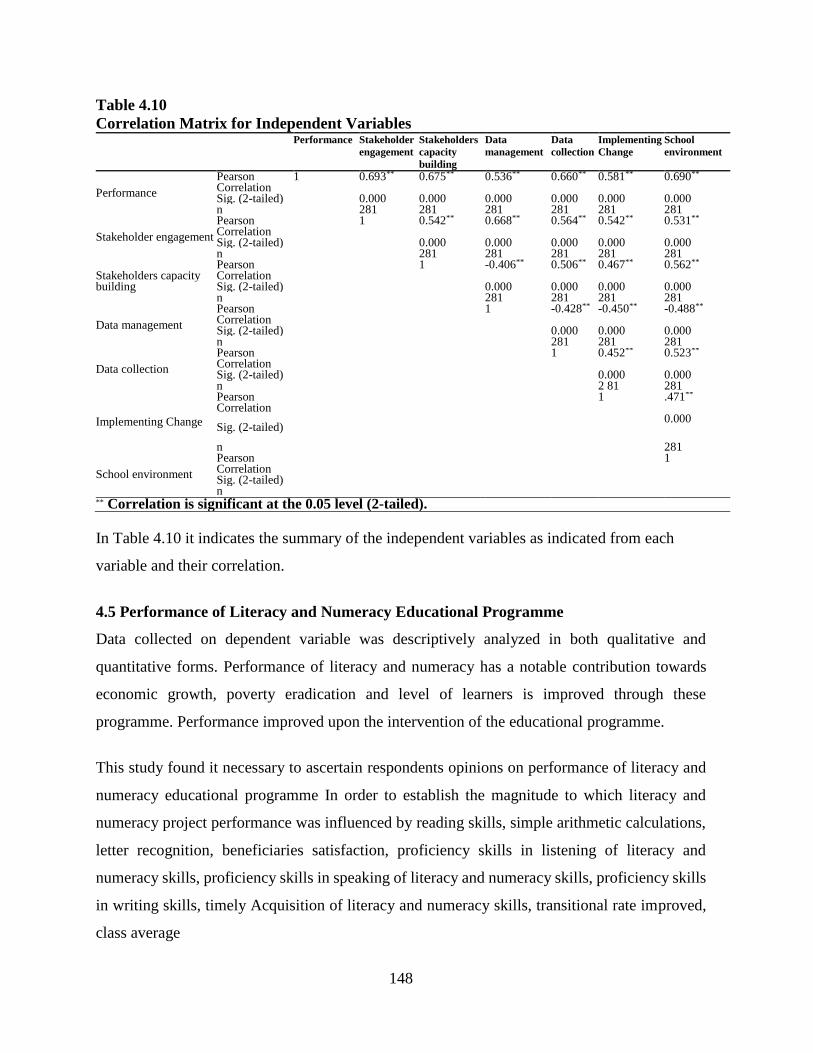
148
Table 4.10
Correlation Matrix for Independent Variables Performance Stakeholder
engagement
Stakeholders
capacity
building
Data
management
Data
collection
Implementing
Change
School
environment
Performance
Pearson Correlation
1 0.693** 0.675** 0.536** 0.660** 0.581** 0.690**
Sig. (2-tailed) 0.000 0.000 0.000 0.000 0.000 0.000 n 281 281 281 281 281 281
Stakeholder engagement
Pearson Correlation
1 0.542** 0.668** 0.564** 0.542** 0.531**
Sig. (2-tailed) 0.000 0.000 0.000 0.000 0.000 n 281 281 281 281 281
Stakeholders capacity building
Pearson Correlation
1 -0.406** 0.506** 0.467** 0.562**
Sig. (2-tailed) 0.000 0.000 0.000 0.000 n 281 281 281 281
Data management
Pearson Correlation
1 -0.428** -0.450** -0.488**
Sig. (2-tailed) 0.000 0.000 0.000 n 281 281 281
Data collection
Pearson Correlation
1 0.452** 0.523**
Sig. (2-tailed) 0.000 0.000 n 2 81 281
Implementing Change
Pearson Correlation
1 .471**
Sig. (2-tailed) 0.000
n 281
School environment
Pearson Correlation
1
Sig. (2-tailed) n
** Correlation is significant at the 0.05 level (2-tailed).
In Table 4.10 it indicates the summary of the independent variables as indicated from each
variable and their correlation.
4.5 Performance of Literacy and Numeracy Educational Programme
Data collected on dependent variable was descriptively analyzed in both qualitative and
quantitative forms. Performance of literacy and numeracy has a notable contribution towards
economic growth, poverty eradication and level of learners is improved through these
programme. Performance improved upon the intervention of the educational programme.
This study found it necessary to ascertain respondents opinions on performance of literacy and
numeracy educational programme In order to establish the magnitude to which literacy and
numeracy project performance was influenced by reading skills, simple arithmetic calculations,
letter recognition, beneficiaries satisfaction, proficiency skills in listening of literacy and
numeracy skills, proficiency skills in speaking of literacy and numeracy skills, proficiency skills
in writing skills, timely Acquisition of literacy and numeracy skills, transitional rate improved,
class average

149
The respondents were subjected to several statements asking their opinion on their level of
agreements or disagreements using a likert scale of 1-5 whereby; Strongly disagree(SD)=1,
Disagree(D)=2,Neutral(N)=3,Agree(A)=4 and Strongly Agree(SA)=5. Line mean score and
standard deviation of each of the opinions was compared with the respective composite scores
for interpretation. The results are presented in Table 4.11.
Table 4.11
Performance of Literacy and Numeracy Educational Programme
Statements
SD
F
(%)
D
F
(%)
N
F
(%)
A
F
(%)
SA
F
(%) Mean
Std.
Deviation
1.There is improvement in
reading learning skills of the
pupils due to the operation of
this programme
4
(1.4%)
65
(23.2%)
27
(9.6%)
136
(48.4%)
49
(17.4%)
3.57 1.070
2.There is improvement in
simple arithmetic calculations
skills of the pupils due to the
operation of this programme
4 (1.4%)
63 (22.4%)
32 (11.4%)
117
(41.6%)
65
(23.2%) 3.63 1.111
3.Learners improved in
recognition of alphabet letters
due to the operation of this
programme
4
(1.4%)
57
(20.3%)
40
(14.2%)
126
(44.8%)
54
(19.3%) 3.60 1.058
4.Programme beneficiaries are
satisfied with the benefits
2
(0.7%)
59
(21.0%)
44
(15.7%)
104
(37.0%)
72
(25.6%) 3.66 1.097
5.Listening learning skills was
enhanced through the operation
of the programme
7 (2.5%)
48 (17.1%)
58 (20.6%)
161 (57.3%)
7 (2.5%)
3.40 0.886
6.Speaking learning skills was
enhanced through the operation
of the programme
2
(0.8%)
53
(18.6%)
52
(18.6%)
168
(59.9%)
6
(2.1%)
3.44
0.843
7.Writing learning skills was
enhanced through the operation
of the programme
4 (1.4%)
51 (18.1%)
50
(17.8%)
169 (60.1%)
7 (2.6%)
3.44 0.865
8.Transition rate of learners
has increased
15
(5.3%)
54
(19.2%)
23
(8.2%)
47
(16.7%)
142
(50.6%)
3.88 1.352
9.The class average
performance has improved 19
(6.8%)
50
(17.8%)
20
(7.1%)
143
(50.9%)
49
(17.4%)
3.54 1.168
10.Acquisition of literacy and
numeracy within times was
experienced while undertaking
the programme
2 (0.7%)
52 (18.5%)
40 (14.2%)
176 (62.7%)
11 (3.9%)
3.50 0.859
Composite Mean and SD 3.56 0.995

150
As shown in Table 4.11, the overall composite mean was 3.56 and the standard deviation was 0.095.
In Table 4.11, on the first statement, there is improvement in reading learning skills of the pupils
due to the operation of numeracy and literacy educational program, the results showed that
4(1.4%) of the respondents strongly disagreed and 65(23.1%) disagreed meaning that a total of
70(24.6%) did not agree with the statement. Those who were neutral were 27(9.6%). Those who
agreed were 136(48.4%) and strongly agree were 49(17.4), indicating that a total of 185(65.8%)
were in agreement. This had a line item mean score of 3.57 and standard deviation of 1.070
which was above the total mean score of 3.56 and standard deviation of 0.995. The implication
here is that there was improvement in reading learning skills to the pupils due to the operation
of this programme. This further implies that the great improvement upon the operationalization
of the programme and the intervention has significantly helped the learners who were involved
in the program and teachers who were trained on the new methodology. Therefore there was
need for the skill to be applied to other learners in the future. Thomas and Collier, (2002) argue
that children learn more while using their mother tongue more than the second language.
There was a project in Nigeria known as Ife was conducted by Fafunwa, Macauley and Sokoya
(1989); and Ani, (2017) demonstrated that using the Nigerian language learners yield good
academic performance while also in Zambia a study by Williams, (1996) had the same findings.
In Mali a study by Fomba and Diarra, (2003) on assessment learning skills had differing
information the other two Countries Nigeria and Zambia. According to Heugh, Benson, Bogale
and Yohannes, (2007) form Ethiopia agreed on the use mother tongue as a means of teaching
produces better results unlike the second language which is introduced immediately after
entering the PP1 grade hence confusing the learner. In Kenya the government has really tried to
introduce the teaching of mother tongue in public schools but it has not always been received
well by the implementers thus they end up teaching either Kiswahili or English during literacy
lesson. Also books for mother tongue are written in Kiswahili or English leaving the Kenyan
teacher in a state of confusion of what to teach during mother tongue lesson. Still teachers
teaching those grade most of them have no knowledge of how to teach the language since it is
never taught in teachers training colleges especially the blending of word sounds.

151
On the second statement there is improvement in simple arithmetic calculations skills of the
pupils due to the operation of the numeracy and literacy programme. About 4(1.4%) of the
respondents strongly disagreed and 63(22.4%) disagreed meaning that those in disagreement
were 67(23.8). On the same line item 32(11.4%) were neutral. Similarly, 117(41.6%) agreed and
65(23.1%) strongly agreed representing 182(64.8%) of the respondents who agreed with the
statement. This statement produced a mean score of 3.63 and standard deviation of 1.111
compared to the composite mean score of 3.56 and standard deviation of 0.995 which indicates
that opinions were divergent. This implies that that there was improvement in simple arithmetic
calculations skills of the pupils due to the operation of this program. Hence, this shows that the
programme helped the learning skills of the learners at an advanced stage something that need
to be materialized in policy for the benefit of both private and public schools.
On the third statement, learners improved in recognition of alphabetical letters due to the
operationalization of the program. In this respect, 4(1.4%) of the respondents strongly disagreed,
57(20.3%) disagreed meaning that 61(21.7%) out of 281 disagreed with the statement. The other
respondents were 40(14.2%) who remained neutral and may be they had no idea of the program.
On the same statement, 126 (44.8%) agreed and 54(19.3%) strongly agreed. This indicates that
180(64.1%) of the respondents agreed with the statement. This statement had a line item mean
score of 3.60 and standard deviation of 1.058 which was higher than the composite mean score
of 3.56 and standard deviation of 0.995. This implies that although opinions were divergent,
improvement in alphabetical letter recognition skills of the pupils was achieved. This outcome
influence performance of literacy and numeracy educational programme positively.
This results concurs with Piper and Zulshwoki (2015) and Mugenda, (2014) results that there
was improvement in alphabetical letter recognition skills hence this influenced the performance
of literacy and numeracy educational programme after the intervention projects was undertaken.
On the contrary Mugo, Kaburu, Limboro and Kimutai (2011) argued that even though the
intervention project helped in getting some improvement, still the quality of learning in early
primary school remains low. Wasanga, Ogle and Wambua (2010) state that evidence of low
reading achievement was reflected in household surveys and the government’s National
Assessment for Monitoring Learning Achievement (NASMLA). Though the learners were able
to at least recognize alphabetical letters still some learners in grade three could not recognize

152
some letters in lower grade, for example in grade two Mugo et al, (2011). Even though there is
some improvement, still the performance has not achieved the government’s bench mark 7% of
every learner in the country, for example every learner have good ability well in grades they are.
So there still exists a gap on who to curb this menace in the country although the current study
has found out that there is improvement but though much is needed to cub the menace and able
to meet the required benchmark with the other countries in the world.
The fourth statement based on whether programme beneficiaries were satisfied with the benefits
accrued while undertaking the programme were achieved or not was undertaken and the results
indicates that, in the first category 2(0.7%) of the respondents strongly disagreed while
59(21.0%) disagree, making a total of 61(21.7%) who were in disagreement with the statement.
However, 104(37.0%) agreed and 72(25.6%) strongly agreed. In total, those who agreed were
176(62.6%). Those who held neutral opinion were 44(15.7%). This statement had a line item
mean score of 3.66 and standard deviation of 1.097 which were above the composite mean score
of 3.56 and standard deviation of 0.995. This implies that programme beneficiaries were satisfied
with the benefits since it has brought a slight change in their learners learning process although
there was divergence in opinions shared. This goes in line with a study done by Evans and
Popova, (2015) who argued that several educational projects in Kenya’s educational systems
have been relatively well researched on and most of them have been implemented focusing on
improving students outcomes or increasing school attendance but still there exists a problem of
their performances on the levels they are in and even lower than the ones they have passed.
Although the current study found out that there was slight improvement due to the program, a
lot still needs to be done to have good performance in future.
On the fifth statement, the study sought to examine how listening learning skill were enhanced
through operation of the program. The findings indicated 7(2.5%) respondents strongly
disagreed while 48(17.1%) disagreed, in that case a total of 55(19.6%) were in disagreement.
Those in agreement were 161(57.3%) agreed and 7(2.5%) strongly agreed. Overally, 168(64.4%)
of the respondents agreed with the statement. At the other hand, 58(20.6%) was neutral. A mean
score of 3.40 against a composite mean of 3.56 was generated which implies that proficiency
skills like listening, was negatively influenced through the operation of the programme and many
learners were not able to listen attentively and respond well even though the programme was

153
undertaken. The line item had a standard deviation of 0.886 lower than the composite standard
deviation of 0.995 was indicated that opinions were diverse. Findings further revealed that some
pupils could not comprehend what they have heard hence low performance in arithmetic
calculation which needs a bit of critical thinking and application of the knowledge acquired. This
also means that if the learners are not able to comprehend what they have read then simple
calculation would be a problem. The implication of the results is even if learners have slightly
improved still learners speaking fluently is a problem according to the findings of this study.
Similarly, they could be okay with listening but have a problem in speaking fluently as was found
by Piper and Trudell (2016) who argued that many programme fail because they only emphasis
the point of training and pay little attention on teaching methodology, which need teaching
results and reflections with other educators and implementing the change in teaching
methodology which is followed in teaching alphabetical sounds used in speaking skill. Though
Schroeder and Trudell (2016) in their study on oral reading fluency and comprehension in Kenya
found out that pupils attain minimal or reading fluency in English and only moderately
comprehension skills in their languages since Kenya’s national language policy or mother tongue
as a medium of instruction in the early primary grades is consistently ignored in practice. The
current study concur with Piper and Trudell (2016) but differ with Runo,Kabutha and Kamau
(2013) on their studies that there was improvement of the skill on the application of the
programme in the teachers methodology and enough equipment’s to teach the reading skill. The
findings of the current study are that the skill influenced the performance of literacy and
numeracy educational programme negatively hence very low improvement was experienced
since half of teachers neither taught reading nor knew methods to use in teaching reading learning
skill.
Based on this point pupils become confused when trying to learn the second language in the class
and differentiate it from the language spoken at home at the same time trying to get the
pronunciations from the teacher orally. In his study on listening skills that the current study found
out that teachers continue using the old method of teaching content rather than embrace the new
instructional change process model of organized letter work, word attack activities, vocabulary
reading story, perform activities of ‘I DO’, ‘YOU DO’ and ‘WE DO’ so as to improve the
proficiency skills in listening, in the lesson development hence good performance.

154
On the sixth statement, speaking learning skill was enhanced through the operation of the
program. The results showed that 2(0.7%) of the respondents strongly disagreed while
53(18.5%) disagreed, in that case a total of 55(19.2%) were in disagreement. Others who were
in agreement were 168(59.8%) agreed and 6(2.1%) strongly agreed. Overally, 174(61.9%) of the
respondents agreed with the statement. On the other hand, 52(18.5%) remained neutral. A mean
score of 3.44 against a composite mean of 3.56 was generated which implies that proficiency
skills like speaking was not enhanced through the operation of the programme and many learners
were not able to speak fluently and pronounce the letter sounds correctly with the help of the
teacher due to mix up of the first language and the second language. This supports (Rose 2016)
on the study about how the first language which is the mother tongue is affected by second
language. The findings from Kwanyumba, (2018) study had similar information that there is a
great interference with the first language to the second language. However the current study
differ investigated only on the second language English and Kiswahili which are the medium of
instruction in schools. However still, the findings study results and opinions were diverging. The
line item standard deviation of 0.843 below the composite standard deviation of 0.995 was an
opinions convergence.
On the seventh statement, based on writing learning skill was enhanced through the operation of
the programme. The results showed that those who strongly disagreed were 4(1.4%), and
51(18.1%) disagreed with the statement, hence a total of 55(19.5%) disagreed. Results obtained
also showed that 169(60.1%) agreed with the statement and 7(2.5%) strongly agreed. Therefore
participants who agreed were 176(62.6%) in total. Those who expressed their neutral opinions
were 50(17.8%). A mean score of 3.44 and standard deviation of 0.865 which was less than the
composite mean of 3.56 and standard deviation of 0.0995 were obtained.
This implied that writing skills was not enhanced through the operation of the programme.
According to Wallace and Alkins, (2007) learners need to practice varied kinds of writing
learning skills though the main determinant of what kind of writing to be acquired well by leaners
depends wholly on the teacher guiding the learner. This enhances language achievement as
learners experiment what they have learned through writing, words simple sentences to
communicate their ideas and vocabulary they learned in class. Reading alone does not necessitate
that learning is going on but also recognizing letters and coding words needs to be constructed

155
well and give a meaning through written text inform of alphabetical letters, this position has been
supported by Dednam, (2011) and Mugo and Limboro, (2016). The current study support Mugo
and Limboro, (2016) with the results that even though there is improvement in writing learning
still, the learners have not been fully able to exploit their potentials.
The eighth statement, that transition rate has increased due to the programme was responded by
the participants. The results showed that 15(5.3%) of the respondents strongly disagreed while
54(19.2%) disagreed, in that case a total of 69(24.5%) were in disagreement. Others who were
really in agreement were 47(16.7%) agreed and 142(50.5%) strongly agreed. Overally,
189(67.2%) of the respondents agreed with the statement. On the other hand, 23(8.2%) remained
neutral. A mean score of 3.88 and a standard deviation of 1.352 which was very high against a
composite mean of 3.56 and standard deviation of 0.995 was realized. Findings shows that
transition from one level to another has improved. The implication is that in the implementing
programme no learner should repeat a class hence all learners should proceed to the next grade
despite their performance in the previous grade according to government directive. A lower
composite SD than line SD shows divergence opinion or views
On the ninth statement, the class average performance has improved through the intervention of
the programme. The results showed that 19(6.8%) of the respondents strongly disagreed while
50(17.8%) disagreed, in that case a total of 59(24.6%) were in disagreement. Others who were
really in agreement were 143(50.9%) and 49(17.4%) strongly agreed. Overally, 192(68.3%) of
the respondents agreed with the statement. On the other hand, 20(7.1%) remained neutral. A
mean score of 3.54 and a standard deviation of 1.168 against a composite mean of 3.56 and a
standard deviation of 0.995. The implication of this line item is that there was no improvement
of performance of learners upon application of the new methodologies from the programme
intervention, so still more ideas re welcomed to cub the menace. Due to the introduction of the
new methods and additional of resources for example textbooks and other reading materials have
not contributed to great improvement of some learners learning skills whereby an average
performance was experienced.
Lastly, the tenth statement acquisition of literacy and numeracy within time was experienced
while undertaking the program. The results showed that those who strongly disagreed were

156
2(.7%), and 52(18.5%) disagreed with the statement, hence a total of 54(19.2%) disagreed.
Results obtained also showed that 176(62.7%) agreed with the statement and 11(3.9%) strongly
agreed. Therefore participants who agreed were 187(66.6%) in total. Those who expressed their
neutral opinions were 40(14.2%). A mean of 3.51 and standard deviation of 0.886 which was
less than the composite mean of 3.56 and standard deviation of 0.995 were obtained. This implied
that acquisition of literacy and numeracy within time did not influence performance of literacy
and numeracy educational program. This also means that if the learners are not able to
comprehend what they have read then simple calculation would be a problem hence low
performance on literacy and numeracy educational learning skills.
Results of the interviews with the curriculum support officers indicated that there was slight
improvement on literacy and numeracy learning skills upon application of intervention
programme. The results of the interviews were consistent with the quantitative data. These are
some of the responses from the key informants who are the curriculum support officers:
Most learners who were not able to attend school in regular basis can now
attend classes without interference since most of them have been provided with
text books and writing material by the government and the implementing
organization. Curriculum support officer Embakasi sub-county.( CSO, 2018)
Listening, speaking and writing skills has been enhanced since many learners
have their own text books and can be able to at least do some practice of the work
taught in the absences of the teacher. Curriculum support officer Langata sub-
County.
Results of interviews with the RTI officials indicated that there was great improvement on
literacy and numeracy learning skills and the intervention programme has really been of
beneficial to the beneficiaries and the education sector at large.
More materials like textbooks for both learners and teachers guides which have
been distributed to schools have really helped in improving the learning skills
but more emphasis should be put into the usage of methodology. Research
triangle monitoring and evaluation officer

157
Some Teachers have ignored the usage of new textbooks hence follows the old
methodology of self-centered instead of learner centered. Frequent visits to
classroom should be embraced so as to encourage the teachers to adapt new
teachers guide given by TUSOME which has the new methodologies of teaching
these skills. Research Triangle monitoring and evaluation officer.( RTI, 2018)
4.6 Stakeholders engagement and Performance of Literacy and Numeracy Educational
Programme
This section presents both descriptive and correlational analysis of Stakeholders engagement and
Performance of Literacy and Numeracy Educational Programme. This was the first objective
in the study. The views of respondents on dimensional of Stakeholder’s engagement were
identification of Stakeholders’, stakeholders’ level of involvement, developing of project
objectives and developing monitoring and evaluation plan which are very vital in any project.
The respondents were subjected to several asking their opinions on their level of agreement or
disagreement using a likert scale of 1-5 whereby; Strongly disagree(SD)=1,
Disagree(D)=2,Neutral(N)=3,Agree(A)=4 and Strongly Agree(SA)=5. Line mean score and
standard deviation of each of the opinions were computed with the respective composite mean
score and interpreted. The responses are presented in Table 4.12.

158
Table 4.12
Stakeholders Engagement and Performance of Literacy and Numeracy Educational
programme
Statements
SD
F
(%)
D
F
(%)
N
F
(%)
A
F
(%)
SA
F
(%) Mean
Std.
Deviation
Stakeholder identification
1.Stakeholders are carefully
identified and listed
5
(1.8%)
63
(22.4%)
33
(11.7%)
131
(46.6%)
49
(17.5%) 3.56 1.075
2.Based on gender parity
stakeholders were carefully
selected
10
(3.6%)
59
(21.0%)
32
(11.4%)
99
(35.2%)
81
(28.8%) 3.65 1.201
3. Needs assessments was
conducted to involve the views
and areas of interest of key
stakeholders.
6
(2.1%)
65
(23.1%)
25
(8.9%)
131
(46.6%)
54
(19.3%) 3.58 1.106
Stakeholder level of involvement
4.Stakeholders were involved
in the development of
curriculum development
7
(2.5%)
63
(22.4%)
29
(10.3%)
122
(43.4%)
60
(21.4%) 3.59 1.128
5.The government officials
from the MOEST were
involved in supervising
teachers
10
(3.6%)
61
(21.7%)
21
(7.5%)
129
(45.9%)
60
(21.3%) 3.60 1.149
6.RTI International officers
participated in funding and
training the stakeholders
involved in the programme
7
(2.5%)
60
(21.4%)
30
(10.7%)
137
(48.8%)
47
(16.6%) 3.56 1.078
Developing of project objectives 7.stakeholders participated in
setting objectives which are
SMART
5
(1.8%)
60
(21.4%)
39
(13.9%)
130
(46.3%)
47
(16.6%) 3.55 1.058
8.The objectives set were
SMART and according to the
programme
10
(3.6%)
55
(19.5%)
34
(12.1%)
136
(48.3%)
47
(16.5%) 3.54 1.088
Developing M&E Plans
9.M&E plans were developed
by all the stakeholders in the
program
5
(1.8%)
50
(17.7%)
44
(15.7%)
139
(49.5%)
43
(15.3%) 3.59 1.007
10.We involved all the
stakeholders in literacy and
numeracy programme
5
(1.8%)
56
(19.9%)
38
(13.5%)
110
(39.1%)
72
(25.7%) 3.67 1.115
Composite mean and SD 3.59 1.102

159
As shown in Table 4.12, the overall composite mean was 3.59 and the standard deviation was 1.102.
From Table 4.12, on the first statements stakeholder were carefully identified and listed. In this
respect, 63(22.4%) disagreed and 5(1.8%) strongly disagreed while 131(46.6%) and 49(17.4%)
agreed and strongly disagreed with the statement respectively. Neutral opinions were 33(11.7%)
of the respondents. In total 180(64.0%) respondents were in agreement. Obtained on this line
item was a mean score of 3.56 and standard deviation of 1.075 which were both slightly below
the composite mean of 3.59 and standard deviation of 1.102. This implies that opinions gathered
were converging. It also implies that the process of stakeholder identification is not carefully
done and that there is need for improvement on this aspect if at all performance has to be realized
in literacy and numeracy educational programme. The findings, however, contradict on other
researchers who assert that for the programme to be a success, monitoring and supervision is
required, public primary schools in Nairobi County may be lacking monitoring and supervision
of teachers hence low performance. Lack of enough interaction with the teachers involved in the
programme hence low performance in the outcome because most teachers needs guidance where
necessary from the officers.
Lack of frequent supervisor from the ministry has made has made
teachers to have laxity hence low performance. This has been
contributed to few officers who are already overwhelmed by too
much administrative responsibilities. Research triangle officer.
In the Second statement, based on gender parity, stakeholders were carefully selected. The results
showed that 10(3.6%) strongly disagreed and 59(21.0%) disagreed hence an aggregate of
69(24.6%) disagreed. However respondents who strongly agreed were 81(28.8%) and those that
agreed were 99(35.2%) bringing to a total of 180(64.0%) in agreement with the statement. A few
of the respondents 32(11.4%) were neutral in their views. Generated from this statement was a
mean score of 3.65 and standard deviation of 1.201 this was above the overall composite mean
of 3.59 and standard deviation of 1.102. It is clear from this results that that selection of
stakeholders ensured that gender parity was adhered to. This could be as a result of Kenyan
constitution which emphasize on a third of opposite gender in every working place in mostly
public institutions. The opinions were however divergent. Based on the SD and Composite SD.

160
This therefore implies that equality in selection process of stakeholders would lead to
performance of literacy and numeracy educational programme in Nairobi County.
On the third item, the study sought to establish whether needs assessment was conducted to
involve the views of key stakeholders. The participants who strongly disagreed were 6(2.1%)
and those who disagreed were 65(23.1%) hence in total 71(25.2%) disagreed with the statement.
On the other hand, 131(46.6%) strongly agreed while 54(19.3%) agreed bringing to a sum total
of 185(65.9) of views on agreement. On this statement, 25(8.9%) had neutral views. Yielded
from the statement was a line item mean score of 3.58 and standard deviation of 1.106, against
the composite mean of 3.59 and standard deviation of 1.102. The opinions were quite divergent
although the results suggested that needs assessment was moderately done by involving the
views of the key stakeholders. Lack or inadequate assessment of needs is likely to lead to mis-
prioritization of goals and hence poor performance of the programme. Scholars like Walker,
Shelly and Bourne (2008) hold the view that stakeholders should be fully involved in the project
and conduct needs assessment meaning they also concurred with the current study that all
stakeholders are supposed to participate needs assessment procedure.
The fourth statement was that stakeholders were involved in the development of curriculum
revealed that 7(2.5%) strongly disagreed and 63(22.4%) disagreed. That is to mean that
69(24.9%) disagreed with the statement. The results showed that 60(21.4) strongly agreed and
122(43.4%) agreed. This resulted to a total of 182(64.8%) who in agreement. However,
29(10.3%) of respondents maintained a neutral position. The mean score of obtained on this
statement was 3.59 and standard deviation of 1.128 same as the composite mean of 3.59 and
standard deviation of 1.102, implying that development of curriculum development involves the
stakeholders. However, this mean also would mean that the level at which the stakeholders and
more specifically the teachers, are engaged is quite scanty and needs more improvement for
program to achieve its main objectives or goals. The views from the respondents appeared to
have been divergent given a higher standard deviation of 1.128 than composite SD of 1.102
standard deviation. The qualitative data collected from CSO through interviews had this to say.

161
Integration of teachers in curriculum development has really enhanced the
involvement of all the stakeholders in the formulation of the content of what
is required in every level of learning with the right materials and
information. Curriculum support officer Langata sub-county. (CSO, 2018)
A fifth statement sought from the respondents that government officials from MoEST involved
in supervising teachers strongly disagree 10(3.6%), disagreed were 61(21.4%). These combined
showed that 71(25%) disagreed, 21(7.5%) remained neutral, 129(45.9%) agreed, whereas those
who strongly agreed were 60(21.4%). In line of this a total of 189(67.3%) agreed with the
statement. The mean score for this line item was 3.60 against a composite mean score of 3.59
implying that supervision of teachers during implementation of the program involved
government officials from the ministry of education. Standard deviation was 1.149 above the
composite standard deviation of 1.102 indicating that opinions were rather divergent. It is evident
that good performance is associated with proper supervision which should be encouraged in all
stages of implementing educational programme to yield better results. This implies that MOEST
supervision of teachers influence performance of literacy and numeracy educational programme
positively.
The sixth statement sought from the respondents whether RTI international officers participated
in funding and training the stakeholders involved in the programme. The responses received
showed that 7(2.5%) disagreed while 60(21.4%) strongly disagreed making a total of 67(23.9%)
of those who disagreed. Neutral opinions were held by 30(10.7%). On the other hand 137(48.8%)
agreed and 47(16.6%) strongly agreed with this statement suggesting that 184(5.4%) were in
agreement. Obtained from this statement was a mean score 3.56 which was below the composite
mean of 3.59. Based on this mean results, RTI officers does not influence performance of literacy
and numeracy educational programme. This might also mean that although RTI may have
participated in funding, the aspect of training could have somehow been ignored and hence need
to observe this aspect in the future. Standard deviation of 1.078 which was below the composite
standard deviation of 1.102 was an indication that opinions gathered attracted divergence.

162
Training of the Head Teachers, Lower Primary School Teachers has a
big impact on the learner’s progress. Teachers were asked if they are
happy with the workshops and trainings offered by the research triangle
officers and they said that they are okay but they should be reschedule
to normal school learning time instead of having them during the
holidays. A statement from Curriculum support officer west lands sub-
county. (CSO, 2018)
On the seventh statement, stakeholders were involved in setting objectives which were SMART.
Various opinions revealed that 5(1.8%) disagreed and 60(21.4) strongly disagreed, meaning that
in total 65(23.2%) disagreed while those with neutral opinions were 39(13.9%). Also,
130(46.3%) agreed and those who strongly agreed were 47(16.6%) summing up to 177(62.9%)
of respondents who agreed with the statement. The mean for this statement was 3.55 against a
composite which read 3.59 suggesting that stakeholders never got chance to participate in setting
SMART objectives hence they did not influence the performance of literacy and numeracy
educational programme. This informs us that any deviation or challenges being experienced in
the performance of literacy and numeracy program could be as a result of objectives that do not
reflect the opinions of the majority stakeholders. Therefore, there is need to ensure full
involvement of all stakeholders in planning and designing of objectives so as to improve on the
implementation of the educational programme. Witnessed from this result was also a much lower
standard deviation of 1.058 against 1.083 indicating that opinions were convergence.
On the eighth statement, the objectives set were SMART and measurable according to the
programme. Based on this statement participants gave their views whereby several opinions were
revealed. So various opinions revealed that 10(3.6%) disagreed and 55(19.6) strongly disagreed,
meaning that in total 65(23.2%) disagreed while those with neutral opinions were 34(12.1%).
Also, 136(48.4%) agreed and those who strongly agreed were 46(16.4%) summing up to
182(64.8%) of respondents who agreed with the statement. The mean score for this line item was
3.54 and standard deviation of 1.088 against a composite 3.59 and standard deviation of 1.083
suggesting that set objectives did not influence the performance of literacy and numeracy
educational programme. Given that line mean score of 3.54 was lower than composite mean of
3.59 lower than composite SD shows convergence views
163
On the ninth statement that all the stakeholders were involved in developing M&E plans 5(1.8%)
strongly disagreed and 50(17.8%) disagreed, meaning that 55(19.6%) were in disagreement.
Neutral opinions were represented by 44(15.7%). Those agreed were 139(49.5%) while
43(15.3%) strongly agreed. A mean score of 3.59 and standard deviation of 1.007 was obtained
which matched the composite mean 3.59 and standard deviation of 1.102. This implied that
averagely the program encouraged all stakeholders to participate in developing plans for M&E
influence performance of literacy and numeracy educational programme. A lower standard
deviation of 1.007 against a composite standard deviation of 1.102 was obtained suggesting
opinions remained convergent.
The tenth and last statement that we involved all the stakeholders in the programme. Opinions
received indicated that 5(1.8%) strongly disagreed and 56(19.9%) disagreed, meaning that
61(21.7%) were in disagreement. Those who held neutral views were 38(13.5%). Further,
110(39.1%) agreed and 72(25.7%) strongly agreed. In total, 182 (64.8%) were in agreement. A
higher mean score of 3.67 was computed against 3.59 composite mean. Thus, all stakeholders
got involved in the literacy and numeracy programme and standard deviation of 1.115. A
standard deviation of 1.115 was obtained against 1.102 implying that opinions were inconsistent.
This shows that for any program to be fully supported and smoothly implemented there is need
to put all on board stakeholders concerned planning so as promote the principle of ownership
among the same group of people. This implies that involvement of all the stakeholders in the
literacy and numeracy educational programme influences its performance positively.
All in all the results of the variable indicated that Stakeholder identification was not carefully
done and that there is need for improvement on this aspect if at all performance has to be realized
in literacy and numeracy educational programs though the selection process of stakeholders was
ensured in that gender parity was adhered to. This could be as a result of Kenyan constitution
which emphasizes on a third of opposite gender in every working place and mostly public
institutions whereby equality in selection process of stakeholders would lead to performance of
literacy and numeracy educational programme in Nairobi County. The level of how stakeholders
and specifically teachers were engaged is quite scanty and needs improvement for programme

164
to achieve its objectives. Supervision of teachers during implementation of the programme
should involve all the participants in order to yield better results.
Most stakeholders never got chance to participate in setting SMART objectives. Hence the
deviation or challenges being experienced in the performance of literacy and numeracy
programme could be as a result of objectives that do not reflect the opinions of the majority
stakeholders. Therefore, there is need to ensure full participation stakeholders planning and
designing of objectives so as to improve on the implementation of the educational programme.
Stakeholders got involved in the literacy and numeracy programme this shows that for any
program to be fully supported and smoothly implemented there is need stakeholders concerned
in planning so as promote the principle of ownership among the same group of people.
The results of the interviews with key informants showed that stakeholder engagement
influenced performance of literacy and numeracy educational program. The results of the
interviews were, therefore, consistent with the quantitative data. The following are key
responses obtained from the key informants who are the sampled CSO’S from Nairobi County.
“The stakeholders had no choice of agreeing if to be involved or not but they had to
give in since it was a government requirement and He was the employer. During
supervision most teachers are tensed and were never confident on themselves since
they lacked motivation in the career hence fear and frustration can be read on their
faces. These teachers despite going back to school to pursue their education, no
promotion is given to them neither any kind of motivation. They have remained in one
grade for so many years and frustration could be felt as they talk. Those who were
promoted were faced with another challenge of delocalization hence several lost their
lives and others deserted duty due to the transfers. Others were interdicted when they
applied for early retirement. In shock they were served with interdiction letters which
frustrated them the more. The program was good and beneficial, only that no
accountability and responsibility of those who mismanage the funds and resources
hence nobody is accountable of any offence committed. The advice is that the
government should put on monitoring and evaluation systems which are workable
and not theoretical so as to get the culprits”. A statement from Curriculum support
officer Lanagata sub-county. ( CSO, 2018)

165
4.6.1. Inferential analysis of Stakeholder’s Engagement and Performance of Literacy and
Numeracy Educational Programme
The inferential analysis was performed by use of correlation and regression to show the
relationship, strength and direction of independent and dependent variables. It was based on
the first objective to establish the extent to which stakeholders’ engagement influence
performance of literacy and numeracy educational programme in public primary schools in
Nairobi, County. The dimensions of stakeholder engagement modeled in the study were:
Identification of stakeholders, Stakeholders level of involvement, developing of project
objectives and developing monitoring and evaluation plan.
The data was correlated using Pearson’s Product Moment techniques done to establish the
relationship between Stakeholder’s engagement and performance of literacy and numeracy
educational programme. The results for the effect of Stakeholder’s engagement and performance
of literacy and numeracy educational programme obtained from the correlation analysis ranged
between , +1 indicated a positive perfect correlation, 0.001 – 0.250 weak correlation, 0.251 –
0.500 a semi strong correlation, 0.501 – 0.750 strong correlation and finally 0.751 – 1.000 a very
strong correlation. The results were presented in Table 4.13.
Table: 4.13
Correlations between Stakeholder’s engagements and Performance of Literacy and
Numeracy Educational Programme
Variables Performance of literacy and numeracy
educational programme
Stakeholder
engagement
Performance of
literacy and
numeracy educational
programme
Pearson Correlation 1 0.693**
Sig. (2-tailed) 0.000
n 281 281
Stakeholder engagement
Pearson Correlation 0.693** 1
Sig. (2-tailed) 0.000
n 281 281 ** Correlation is significant at the 0.05 level (2-tailed).
In Table 4.13, the output indicates that Stakeholder’s engagement had a strong positive
significant relationship with performance of literacy and numeracy educational programme in
public primary schools in Nairobi County, Kenya. (P-value=<0.000). Given a Pearson
correlation of 0.693, a strong positive relationship between stakeholder engagement and

166
performance of literacy and numeracy educational programme existed. Thus (r=.0.693, p-
value=0<0.05).
4.6.2 Regression Analysis of Stakeholder Engagement and Performance of Literacy and
Numeracy Educational Programme
The first objective of the study was to establish the extent to which stakeholder engagement
influence performance of literacy and numeracy educational programme in public primary
schools in Nairobi County, Kenya. The indicators for stakeholders’ engagement variable
included stakeholder identification, stakeholder level of involvement, developing of project
objectives and developing of M&E plan. The indicators for performance were reading learning
skills, simple arithmetic calculations skills, letter recognition, beneficiary satisfaction,
proficiency skills in listening, proficiency skills in speaking, proficiency skills in writing, timely
acquisition of literacy and numeracy skills, transition rate improved and class average
performance improved.
4.6.3 Test of hypothesis 1
The following hypothesis were tested using linear regression model to satisfy objective’s
requirements of the first objective on this study:
1: H0 Stakeholders engagement has no significant influence on performance of literacy and
numeracy educational programme in public primary schools in Nairobi County, Kenya.
H1 Stakeholders engagement has significant influence on performance of literacy and
numeracy educational programme in public primary schools in Nairobi County, Kenya.
The null hypothesis (HO) was tested using the linear regression model:
y = a + 𝛽1X1 + 𝜀
Where:
y - Performance of literacy and numeracy educational programme
X1 - Stakeholder engagement
b1 - Regression coefficient
a - Regression constant
𝜀 - Error term
The results are shown on table 4.14

167
Table 4.14
ANOVA for Stakeholder Engagement and Performance of Literacy and Numeracy
Educational Programme
Model Sum of
Squares
Df Mean Square F Sig.
1 Regression 99.560 1 99.560 257.946 0.000b
Residual 107.685 279 0.386
Total 207.245 280
a. Dependent Variable: Performance
b. Predictors: (Constant), Stakeholder engagement
The overall F-statistic is 257.949 with a p-value of 0.000b<0.05 which implies that there was a
statistically significant relationship between stakeholder engagement and performance of
literacy and numeracy educational programme. The goodness of fit of the model was achieved
when the critical value obtained was 0.386 less than the F value (257.949).
Table 4.15
Model Summary for Stakeholder’s Engagement and Performance of Literacy and
Numeracy Programme
Model R R Square Adjusted R Square Std. Error of the
Estimate
1 0.693a 0.480 0.479 0.62326
a. Predictors: (Constant),
b. Stakeholder engagement for monitoring and evaluation
Table 4.15 shows that the R=0.693 and R-squared is 0.480. The degree and nature of correlation
between stakeholder engagement on performance of literacy and numeracy educational
programme was determined by the “R”. This demonstrates that stakeholder engagement strongly
influenced performance of literacy and numeracy educational programme by 0.480. Whereas the
R2 revealed that stakeholder engagement was able to explain 48 % variations in the performance
of literacy and numeracy educational programme in public primary schools in Nairobi County,
Kenya. There are other factors which could influence the performance of literacy and numeracy
educational programme which are explained by the remaining percentage 52%.
From Table 4.15, a positive beta coefficient for Stakeholder engagement is 0.497 suggesting a
direct relationship exists as per the model. Probability of t-statistic which is 16.061 for β
coefficient has a less value compared to significance level of 0.05. Based on the research

168
findings, we reject the null hypothesis and conclude that stakeholder engagement has significant
influence on performance of literacy and numeracy educational programme.
Table 4.16
Model Coefficients for Stakeholder’s Engagement and Performance of Literacy and
Numeracy Educational Programme
Model Unstandardized Coefficients Standardized
Coefficients
t Sig.
B Std. Error Beta
1
(Constant) -0.133 0.037 -3.571 0.000
Stakeholder
engagement
0.497 0.031 0.693 16.061 0.000
Model: (β= 0.497, t=16.061, p=0.000<0.05)
Predictor Variable: Stakeholder Engagement
Dependent Variable: Performance of Literacy and Numeracy Educational Programme
The results in Table 4.16 indicate that stakeholder’s engagement has statistically significant
influence on performance of literacy and numeracy educational programme (β= 0.497, t=16.091,
p=0.000<0.05) implying that stakeholder engagement had a significant influence on
performance of literacy and numeracy educational programme supported by TUSOME
programme in Nairobi County. The regression equation obtained from this output was thus
substituted:
Y= 𝛽0+ 𝛽1 X1 + ɛ
Y = -0.133+0.497X1 +e
Where:
y - Performance of literacy and numeracy educational programme
X1 - Stakeholder engagement for M&E
𝜀 - error term
The results were as shown in Tables 4.15and 4.16.
The findings of the study indicate a statistical significance correlation between stakeholder
engagement and performance of literacy and numeracy educational programme. This findings
concur with Stephanie and Sabrina (2014) who focused on stakeholder analysis and engagement
in projects, from stakeholder relational perception to stakeholder ontology. It determined that

169
inappropriate social interaction between project stakeholders caused project failures. This was
also supported by Celine, Natecho, Victor and Llusweti (2014) who assessed literacy
intervention of school improvement programme on lower primary school pupils. The study
determined that stakeholder engagement has significant influence on performance of literacy and
numeracy educational programme. This was also supported by the current study.
The current study found out that TUSOME and PRIMR projects involved all the stakeholders in
education sector at different levels as the programme was on going. This involvement helped in
learner’s improvement in their literacy and numeracy learning skills as echoed by (Piper and
Mugenda, 2014). The current study supports (Piper and Mugenda, 2014) since many respondents
were in agreement that there was improvement of literacy and numeracy learning skills upon the
intervention programme was undertaken. This has an implication that involvement of key
stakeholders in educational programme is very crucial.
The current study differ with the study conducted by Antilla, (2013) and Randall, A. (2011) who
only argued about school leaders as the only ones who can influence the stakeholder engagement
in performance of literacy and numeracy skills. The findings of this study were that every
stakeholder in learning has a role to play and therefore they can all influence the performance of
Literacy and Numeracy educational programme.
Relations of foregoing comparable studies, current study has adduced empirical evidence in
support of their earlier findings, despite no similar studies have been conducted in Nairobi
County, Kenya. Therefore it is very essential to note that the significant relationship between
stakeholder engagement and performance of literacy and numeracy educational progamme is
important hence need to establish strong bases on stakeholders’ engagement for good yields in
education sector.
4.7 Stakeholders’ Capacity Building and Performance of Literacy and Numeracy
Educational Programme
This section presents descriptive and correlational analysis of Stakeholders’ Capacity Building
and performance of literacy and numeracy educational programme.

170
The need to build the knowledge and skills of engaging stakeholder in any programme is very
important. This is to enable the various stakeholders to be able to capture information in a
required manner. The study found out that it is complex to undertake stakeholders’ trainings and
how they influence the performance of literacy and numeracy learning skills. The study therefore
sought opinion of participants on various statements about stakeholder capacity building. The
respondents were subjected to several statements asking their opinions in the level of agreement
or disagreement on a likert scale of 1-5 whereby; Strongly disagree(SD)=1,
Disagree(D)=2,Neutral(N)=3,Agree(A)=4 and Strongly Agree(SA)=5. Line mean score and
standard deviation of each of the opinions was compared with the respective composite mean
scores for interpretation. They are presented in Table 4.17.
Table 4.17
Stakeholders’ Capacity Building and Performance of Literacy and Numeracy
Educational Programme
Statements
SD
F
(%)
D
F
(%)
N
F
(%)
A
F
(%)
SA
F
(%) Mean
Std.
Deviation
Training for M&E
workshops There are plans indicating
when M&E workshops will be
done
5
(1.8%)
41
(14.6%)
43
(15.3%)
149
(53.0%)
43
(15.3%) 3.65 0.966
Adequate M&E workshops are
conducted to inform exchange
of best practices for knowledge
management
6
(2.1%)
41
(14.6%)
48
(17.1%)
143
(50.9%)
43
(15.3%) 3.63 0.982
Workshops have led to
exchange of best practices for
knowledge management
7
(2.5%)
39
(13.9%)
44
(15.7%)
149
(53.0%)
42
(14.9%) 3.64 0.980
Training for M&E seminars Adequate M&E seminars are
conducted to inform exchange
of best practices for knowledge
management
4
(1.4%)
45
(16.0%)
34
(12.1%)
113
(40.2%)
85
(30.3%) 3.82 1.079
Seminars have led to exchange
of best practices for knowledge
management
5
(1.8%)
35
(12.5%)
42
(14.9%)
114
(40.6%)
85
(30.2%) 3.85 1.045
Aligning training gaps
identified Feedback from the workshops
and seminars helped us to
identify gaps in literacy and
numeracy educational program
3
(1.1%)
43
(15.3%)
45
(16.0%)
138
(49.1%)
52
(18.5%) 3.69 0.979

171
Statements
SD
F
(%)
D
F
(%)
N
F
(%)
A
F
(%)
SA
F
(%) Mean
Std.
Deviation
The feedback from the
workshops and seminars were
well identified
4
(1.4%)
42
(14.9%)
45
(16.0%)
130
(46.3%)
60
(21.4%) 3.71 1.010
The process of identifying
gaps was done in a
participatory manner from
M&E perspective
3
(1.1%)
47
(16.7%)
40
(14.2%)
121
(43.1%)
70
(24.9%) 3.74 1.045
M&E knowledge and skills Acquisition of M&E
knowledge and skills was well
developed
2
(.7)
40
(14.%1)
41
(14.7%)
102
(36.3%)
96
(34.2%) 3.89 1.055
Stakeholders M&E knowledge
and skills was enhanced by
trainings that were undertaken
4
(1.4%)
37
(13.2%)
41
(14.6%)
103
(36.7%)
96
(34.1%) 3.89 1.065
Technical experts undertaking
M&E trainings led to proper
practices of knowledge and
skills
3
(1.1%)
39
(13.8%)
41
(14.6%)
102
(36.3%)
96
(34.2%) 3.89 1.063
M&E activities were well
achieved through trainings and
setting of objectives
3
(1.1%)
42
(14.9%)
39
(13.9%)
101
(35.9%)
96
(34.2%) 3.87 1.078
Composite Mean and SD 3.77 1.033
As shown in Table 4.17, the overall composite mean was 3.77 and the standard deviation was
1.033. From Table 4.17, the first line item, the study sought from the respondents whether there
are plans were indicating when M&E workshops will be done. Out of 281 respondents who
participated on the study 5(1.8%) strongly disagreed, 41(14.6%) disagreed in total 46(16.4%)
were in disagreement while 43(15.3%) were neutral, 149(53.0%) agreed and 43(15.3%) strongly
agreed. Overally, 192(68.3%) of the respondents agreed and 46(16.4%) disagreed. The mean
score obtained was 3.65 lower compared to the composite mean of 3.77 and standard deviation
of 1.033. This may also imply that plans were not there on M&E workshops which negatively
influenced the program. Therefore there is need to review the content of workshops to help
improvement in the programme delivery. Although gotten from this statement was a standard
deviation of 0.996 against 1.033 which meant that opinions tended to converge.
On the second statement, adequate M&E workshops conducted to inform the exchange of best
practices for knowledge management, 6(2.1%) of the respondents strongly disagreed, 41(14.6%)
disagreed in total those who were in disagreement were 47(16.7%) while 48(17.1%) were
neutral, 143(50.9%) agreed and 43(15.3%) strongly agreed. Although in overall 186(66.2%)

172
agreed with the statement, a mean score of 3.63 and standard deviation of 0.982 which was below
the composite mean of 3.77 and standard deviation of 1.033. implying practices applied after
these workshops do not influence on the performance of literacy and numeracy educational
programme since they are inadequately prepared and conducted. This may also mean that
workshops were handled in a hurry hence some stakeholders who are the teachers were left an
unequipped, specifically with the current methodology which is required to improve the literacy
and numeracy educational programme, hence the need to restructure how these M&E workshops
ought to be conducted. With a standard deviation of 0.982 against composite standard deviation
of 1.033, it can be concluded that opinions were consistent.
Thirdly, workshops yielded any positive results in terms of exchange of best practices, the
participants views revealed that 7(2.5%) strongly disagreed, 39(13.9%) disagreed meaning that
46(16.4) were in disagreement while 44(15.7%) were neutral, 149(53.0%) agreed and 42(14.9%)
strongly agreed. A mean score of 3.64 and standard deviation of 0.980 against a higher composite
mean of 3.77 and standard deviation of 1.033 implied that workshops did not yield much results
as far as best practices are concerned. Hence, best practices such handling three subjects in class
and also having M&E officers on the ground to collect data from the teachers would be helpful
since many Head Teachers are unable to advice the grade one to three teachers on the areas they
did not understand well in the trainings. A standard deviation of 0.980 which is below the overall
composite standard deviation of 1.033 points out that opinions converged.
Fourthly, the statement that adequate M&E seminars were conducted to inform the exchange of
best practices for knowledge management. The results showed that 4(1.4%) strongly disagreed,
45(16.0%) disagreed, 34(12.1%) were neutral, 113(40.2%) agreed and 85(30.2%) strongly
agreed. A total of 198(70.4%) were in agreement that adequate seminars were conducted to
inform the exchange of best practices for knowledge. This was further supported by a mean score
of 3.82 and standard deviation of 1.079 which was higher than the composite mean of 3.77 and
standard deviation of 1.033 indicating that indeed M&E seminars were adequately conducted
and influenced performance of literacy and numeracy educational programme. A standard
deviation of 1.079 compared to 1.033 the composite standard deviation showed that opinions

173
diverged. There is therefore need to engage in more seminars to compliment workshops which
the study has revealed are not adequately conducted.
Further, on the fifth statement the seminars had led exchange of best practices for knowledge
management. The results showed that 5(1.8%) of the respondents who strongly disagreed,
35(12.5%) disagreed, 42(14.9%) were neutral, 114(40.6%) agreed and 85(30.2%) strongly
agreed. A total of 199(70.8%) were in agreement that best practices are being exchanged as a
result of seminars. A line item mean score of 3.85 and standard deviation of 1.045 which was
higher as compared to composite mean score of 3.77 and standard deviation of 1.033. This
implies that seminars led to exchange of best practices for knowledge management and
positively influence performance of literacy and numeracy programs. A standard deviation of
1.045 against composite standard deviation of 1.033 demonstrated opinions were inconsistent.
Due to the nature of seminars, it is likely the forum provides more room for learning as compared
to normal workshops, hence need to invest more in the seminars to have more experiences shared
among the stakeholders.
On the sixth statement, feedback from both the workshops and seminars helped in identification
of gaps in literacy and numeracy educational programme. The results showed that 3(1.1%) of
the respondents strongly disagreed, 43(15.3%) disagreed, 45(16.0%) were neutral, 138(49.1%)
agreed and 52(18.5%) strongly agreed. A total of 190(64.4%) were in agreement with the
statement. This line item had a mean score of 3.69 and standard deviation of 0.979 which was
below the composite mean score of 3.77 and standard deviation of 1.033 suggesting that
feedback from the attended workshops and seminars could not help in identifying the gaps in the
program. This implies that stakeholders need to attend more workshops so as to acquire the
necessary skills. Opinions received were converging given a standard deviation of 0.979 against
the overall standard deviation of 1.033.
The seventh statement sought to establish if feedback from the workshops and seminars were
properly identified. Out of 281 respondents who participated 4(1.4%) of the respondents strongly
disagreed, 42(14.9%) disagree. Hence in total 46(16.3%) were in disagreement with the
statement. Results also showed that 45(16.0%) were neutral views. Further, 130(46.3%) agreed
and 60(21.4%) strongly agreed. A total of 190(67.7%) were therefore in agreement with the same

174
statement. A line item mean score of 3.71 and SD of 1.010 against a composite mean of 3.77 and
standard deviation of 1.033. This implied that feedback from seminars and workshops were not
identified in a proper manner. This could therefore mean (as per findings on the sixth statement)
gaps in literacy and numeracy are still glaring. Hence, need to capitalize on maximization of the
seminars and workshops for better results in the course of program implementation and further
enhancement of program performance. A standard deviation of 1.010 obtained against a
composite standard deviation of 1.033 implies that the opinions remained consistent.
The eighth statement sought the process of identifying the gaps was done in participatory manner
in line of monitoring and evaluation guidelines. Thus, 3(1.1%) of the respondents strongly
disagreed, 47(16.7%) disagree, 40(14.2%) were neutral. The analysis also showed that
121(43.1%) agreed and 70(24.9%) strongly agreed. The line item mean score was 3.74 and
standard deviation of 1.045. This was lower than composite mean score of 3.77 and standard
deviation of 1.033, meaning that the line item was not positively influencing performance of
literacy and numeracy educational programme. With a standard deviation of 1.045 against an
overall composite standard deviation of 1.033 it could mean the opinions were not converging.
On the ninth statement, acquisition of M&E knowledge and skills were well developed. Out of
281 respondents, 2(.7%) of the respondents strongly disagreed, 40(14.1 %) disagree. This gave
a total of 42(14.8%) who disagreed in opinion, 41(14.7%) were neutral. Further, 102(36.3%)
agreed and 96(34.3%) strongly agreed. In total, 198(68.0%) were in agreement that the
acquisition of M&E knowledge and skills was well developed and influenced the performance
literacy and numeracy educational programme. A mean score of 3.89 and standard deviation of
1.055 which was obtained was higher than the composite mean of 3.77and standard deviation of
1.033. A standard deviation generated was of 1.055 above the composite standard deviation of
1.033 which demonstrated that opinions gathered did not converge. This implies that the line
item influences the performance of literacy and numeracy educational programme positively.
There is need to maintain the same standards for sustainability.
The tenth statement, stakeholders’ M&E knowledge and skills was enhanced by the trainings
that were undertaken for this programme. The results revealed that 4(1.4%) of the respondents

175
strongly disagreed, 37(13.2%) disagreed, 41(14.6%) were neutral while 103(36.7%) agreed and
96(34.2%) strongly agreed. Overally, 199(70.9%) and 41(14.6%) agreed and disagreed;
respectively. Those with neutral opinions accounted for 41(14.6%). A line item mean score of
3.89 and standard deviation of 1.065 which is higher compared to a composite of 3.77 and
standard deviation of 1.033 proved that trainings enhanced M&E knowledge and skills of the
stakeholders. A higher standard deviation of 1.065 against 1.033 indicated that views from the
respondents diverged. This implies that the line item influences the performance of literacy and
numeracy educational programme positively.
The eleventh statement that technical experts taking M&E trainings led to proper practices of
knowledge. Out of 281 respondents who took part in the study 3(1.1%) strongly disagreed,
39(13.9%) disagreed, 41(14.6%) were neutral, 102(36.3%) agreed and 96(34.2%) strongly
agreed. In overall, the statement was supported by 198(70.5%) of the respondents who agreed.
Similarly, 39(13.9%) disagreed in total and 41(14.6%) held neutral views. This had a mean score
of 3.89 and standard deviation of 1.063 which was above 3.77 and standard deviation of 1.033.
This therefore implied that the trainings by the technical experts resulted to good practices of
knowledge and skills. This therefore calls for consistency in trainings conducted by the experts
to assure performance of the programme across in all schools on board. A higher standard
deviation of 1.063 against 1.033 was obtained implying that respondents’ opinions remained
divergent.
Twelfth was the last statement of stakeholder capacity building which sought from the
respondents whether M&E activities achieved by the trainings conducted and setting of
program’s objectives. Out of 281 respondents 3(1.1%) strongly disagreed and 42(14.9%)
disagreed with the statement while 39(13.9%) were neutral. Similarly, 101(35.9%) agreed and
96(34.2%) strongly agreed. In overall, 197(70.4%) of the respondents agreed and 42(14.9%)
disagreed. This had a line item mean score of 3.87 and standard deviation of 1.078 which were
both higher than composite mean score of 3.77 and standard deviation of 1.033 respectively.
From the mean point of view, Monitoring and evaluation activities were well achieved through
trainings and setting of objectives and this had an influence on the performance of literacy and
numeracy educational program. The opinions were however divergent.

176
Results of interviews with key informants showed that stakeholder capacity building influenced
performance of literacy and numeracy educational programme. The results of the interviews
were, therefore, consistent with the quantitative data. The following are key responses obtained
from RTI International Officers:
“Lack of adequate finances made the trainings boring and not
encouraging at all only that it was mandatory for everyone to attend.
We don’t need it since it is not adding any value to their constrained
pay slip, if anything it is making them suffer psychologically. This is
as a result of those trainings which are under taken during the
holidays when the other teachers are on leave.” Statements from some
teachers, CSOs and officers from RTI International. (CSO and RTI,
2018)
Results from the curriculum support officers indicated that stakeholder capacity building
influenced greatly influenced performance of literacy and numeracy education programme. The
results were therefore consistent with the quantitative data. The following are the responses from
the key informants:
Training of Coaches, Head Teachers and then Lower Primary School
Teachers was not easy task due to many factors hindering the process
to be a success. CSOs and officers from RTI International. Trainings
were met to equip Head Teachers and Lower Primary Teachers with
adequate additional of knowledge and teaching methodology on how
to use the new instructional materials. These materials and knowledge
acquirement were vital in content delivery in the class for better
results in literacy and numeracy learning skill. (CSO and RTI, 2018)
4.7.1 Inferential Analysis of stakeholder capacity building of key stakeholders in the
programme
The inferential analysis was performed by use of correlation and regression to show the
relationship, strength and direction of independent and dependent variables. It was based on the
second objective to determine how stakeholders’ capacity building influence performance of
literacy and numeracy educational programme in public primary schools in Nairobi County,
Kenya. The variable stakeholder capacity building was operationalized using the following
indicators: training for M&E workshops, training for M&E seminars, aligning training gaps

177
identified and M&E knowledge and skills and performance indicators were : Reading skills,
Simple arithmetic calculations skills, Letter recognition, beneficiary Satisfaction, proficiency
skills in listening of literacy and numeracy skills, proficiency skills in speaking of literacy and
numeracy skills, proficiency skills and writing, Timely Acquisition of literacy and numeracy
skills, transition rate improved and class average performance improved
4.7.2 Correlation analysis of Stakeholder’s Capacity Building and Performance of
Literacy and Numeracy Educational Programme
The relationship between stakeholder’s capacity building and performance was determined by
Pearson Correlation coefficient. According to the analysis, +1 signaled a positive perfect
correlation, 0.001 – 0.250 a weak correlation, 0.251 – 0.500 semi but strong correlation, 0.501 –
0.750 strong correlation and lastly 0.751 – 1.000 very strong correlation. Table 4.18 summarizes
the results.
Table 4.18
Correlation between Stakeholder Capacity Building and Performance of Literacy and
Numeracy Educational Programme
Variables Performance Stakeholders capacity
building
Performance
Pearson Correlation 1 0.675**
Sig. (2-tailed) 0.000
n 281 281
Stakeholders
capacity building
Pearson Correlation 0.675** 1
Sig. (2-tailed) 0.000
n 281 281 ** Correlation is significant at the 0.05 level (2-tailed).
In Table 4.18, the output indicates that Stakeholders’ capacity building had a strong positive
significant relationship with performance of literacy and numeracy educational programme in
public primary schools in Nairobi County.( r=0.675) . According to the foregoing continuum of
correlation strength, there was a strong positive correlation between Stakeholders’ capacity
building and performance of literacy and numeracy educational programme since the coefficient
was 0.675.

178
4.7.3 Regression Analysis of Stakeholder’s Capacity Building and Performance of
Literacy and Numeracy and Educational Programme
The second objective of the study was to determine how stakeholder capacity building influence
performance of literacy and numeracy educational programme in public primary schools in
Nairobi County, Kenya. The following hypothesis were tested using linear regression model to
satisfy the requirements of the second objective in this study:
4.7.4 Test for hypothesis 2
A linear regression was used to test the hypothesis to satisfy the requirements for the second
objective of the study:
2. H0 Stakeholders capacity building has no significant influence on performance of literacy
and numeracy educational programme in public primary schools in Nairobi County,
Kenya.
H1 Stakeholders capacity building has significant influence on performance of literacy and
numeracy educational programme in public primary schools in Nairobi County, Kenya.
The null hypothesis was tested using the linear regression model:
y = a + b2X2 + 𝜖
Where:
y - Performance of literacy and numeracy educational programme
X2 - Stakeholder capacity building
b2 - Regression Coefficient
a - Regression constant
𝜀 - Error term
The results are presented in Table 4.19and 4.20.
Table 4.19
ANOVA for Stakeholder’s Capacity Building and Performance of Literacy and
Numeracy and Educational Programme
Model Sum of
Squares
df Mean Square F Sig.
1
Regression 94.415 1 94.415 233.466 0.000b
Residual 112.830 279 .412
Total 207.245 280
a. Dependent Variable: Performance
b. Predictors: (Constant), Stakeholders capacity building

179
Table 4.19 presents the results of Anova that established the fit of good fitness of the regression
model. Thus the overall F-statistic is 233.466 with a (P-value of 0.000<0.05) which implies that
there was a statistically significant relationship between stakeholder capacity building and
performance of literacy and numeracy educational programme. The critical value obtained for
this model was 3.875 less than the F value thus the model goodness of fit was achieved.
Table 4.20
Model Summary for Stakeholder’s Capacity Building and Performance of Literacy and
Numeracy Educational Program
Model R R Square Adjusted R Square Std. Error of the Estimate
1 0.675a 0.456 0.454 0.63593
a. Predictors: (Constant), Stakeholders capacity building
The results in Table 4.20 shows that R=0.675 and R-squared = 0.456. The “R” was used to
determine degree and nature of correlation between stakeholder capacity building and
performance of literacy and numeracy educational programme. This demonstrates that
stakeholder capacity building strongly influenced performance of literacy and numeracy
educational programme by 0.675. On the other hand the R2 showed that stakeholder capacity
building explained 45.6% variations in the performance of literacy and numeracy educational
programme. Thus, other factors not found or covered under this model account for the rest of
54.4%.
Table 4.21
Model Coefficients for Stakeholder Capacity Building and Performance of Literacy and
Numeracy Educational Programme
Model Unstandardized
Coefficients
Standardized
Coefficients
t Sig.
B Std. Error Beta
1
(Constant) -0.134 0.038 -3.523 0.000
Stakeholders capacity
building
0.490 0.032 0.675 15.280 0.000
Model: (β= 0.490, t=15.280, p=0.000<0.05)
Predictor Variable: Stakeholder Capacity Building
Dependent Variable: Performance of Literacy and Numeracy Educational Programme

180
The results in Table 4.21 show that stakeholder capacity building has statistically significant
influence on performance of literacy and numeracy educational program (β= 0.490, t=15.280,
p=0.000<0.05). Using the statistical findings, the regression model can be substituted as follows:
Y = 𝛽0 + 𝛽2X2+ ɛ;
y = -0.134+0.490X2+ 0.032
Where:
y - Performance of literacy and numeracy educational program
X2 - Stakeholder’s capacity building
𝜀 - Error term
From Table 4.20, a positive beta coefficient for Stakeholder capacity building is 0.490 suggesting
a direct relationship exists based on this model. Probability of t-statistic 15.280 for β coefficient
has less value as would be compared to significance level which is 0.05. These findings led to
the rejection of the null hypothesis and conclusion drawn was that stakeholder capacity building
has significant influence on performance of literacy and numeracy educational programme.
The study findings indicates a statistical significance correlation between stakeholder capacity
building and performance of literacy and numeracy educational programme. The study is in line
with (Piper and Mugenda, 2014) who found out that teachers who had trained on literacy and
numeracy learning skills had significant influence on their learners performance unlike those
who had not undergone the training. Therefore it was established that without trainings on the
new methodologies little is achieved.
Piper et al (2016) on previous studies that when teachers undergo through trainings the outcomes
of learning skills are improved drastically. The findings of this study found that not only training
of workshops and seminars improved the learning skills but also pedagogical, content knowledge
in critical technical areas that have a high impact on learners’ reading development and
instructional quality, such as phonemic awareness, reading comprehension, lesson planning, and
curriculum coverage (USAID, 2017).

181
Head Teachers need to be trained in line with lower teachers so as provide instructional
leadership in schools and be able to manage utilization, maintenance, acquisition of the newly
acquired cores in the new instructional materials. Teachers training and supervision was
conducted by curriculum support officers, Coaches and the RTI officials. So the findings of the
second objective were linked to the previous empirical investigations that had earlier been
reviewed. A study by Nyagah (2016) determined that stakeholder’s capacity building for
Monitoring and Evaluation significantly influenced performance of literacy and numeracy
educational programme. Similar results were found by Makori (2013). The second objective was,
therefore, supported by data since stakeholder’s capacity building was found to significantly
influence performance of literacy and numeracy educational programme. In relation to the
foregoing comparable studies, the current study has adduced empirical evidence in support of
their earlier findings, even though no similar study had been done in Nairobi County, Kenya and
specifically addressing the lower grades one to three in public primary schools. Other studies
have dealt with the performance of exams at the national level for example the KCPE
performance but not literacy and numeracy which is the major component in addressing all the
subjects concerned in the exams.
The study found out that apart from engaging stakeholders and involving them in the programme
at different levels, they were supposed also to be trained on what they were supposed to carry
out so that they yield better results. In this case most statement which were raised and responded
to by the respondents showed that even though the workshops and seminars were carried out,
most responses from the statements were below the overall composite mean, meaning that there
are still gaps which needs to be addressed. Those which were above the overall composite mean
showed a positive influence which helped in improving the performance of the programme but
to a very low extent since there are still gaps which affected the performance of the learning
skills.
4.8 Data Collection and Performance of Literacy and Numeracy Educational Programme
For this section it represents the results of descriptive and correlation analysis of data collection
and performance of literacy and numeracy educational programme. Collection of data activities
is key to inform any party involved in programme implementation to understand the progress

182
and any deviation arising from a programme. This study sought opinion of participants on the
state of various parameters of data collection in light of the performance of literacy and numeracy
educational programme. The opinion was measured using a 5-point likert-scale whereby:
Strongly disagree (SD)=1, Disagree (D)=2, Neutral (N)=3, Agree(A)=4 and Strongly Agree
(SA)=5. Line mean score and standard deviation of each of the opinions was compared with the
respective composite mean score and interpreted. The results are presented in Table 4.22.
Table 4.22
Data collection and Performance of literacy and numeracy educational programme
Statements
SD F
(%)
D F
(%)
N F
(%)
A F
(%)
SA F
(%) Mean Std.
Deviation Selection of M&E data instruments 1.M&E data collection instruments were appropriate for the designed work
7 (2.5%)
49 (17.4%)
53 (18.9%)
93 (33.1%)
79 (28.1%)
3.67 1.134
2.There was available M&E data collection tool
6 (2.1%)
50 (17.8%)
53 (18.9%)
93 (33.1%)
79 (28.1%) 3.67 1.127
3.The M&E data collection methods used suited the information required 5
(1.8%) 51
(18.1%) 49
(17.4%) 96
(34.2%) 80
(28.5%) 3.69 1.121
M&E data collection and collation of information
4.M&E data collected was sorted and stored in the data base 6
(2.1%) 49
(17.4%) 56
(19.9%) 97
(34.5%) 73
(26.1%) 3.65 1.109
5.M&E data collation was coded in the systems and filled for future use
15 (5.3%)
40 (14.2%)
54 (19.2%)
91 (32.5%)
81 (28.8%) 3.65 1.189
6. The M&E data collected was verified and analyzed. 16
(5.7%) 30
(10.7%) 56
(19.9%) 97
(34.5%) 82
(29.2%) 3.71 1.162
Sources of M&E information
7.The sources of M&E information collected was reliable and trust worthy
6 (2.1%)
50 (17.8%)
61 (21.7%)
92 (32.7%)
72 (25.7%)
3.62 1.112
8.Data collected for M&E was from the right respondents 4
(1.4%) 30
(10.7%) 36
(12.8%) 91
(32.4%) 120
(42.7%) 4.04 1.055
Schedules of M&E activities
9.Proper coordination for M&E activities was well planned
9 (3.2%)
53 (18.9%)
60 (21.4%)
110 (39.1%)
49 (17.4%)
3.49 1.083
10.Schedules existed that displayed how M&E activities were carried out
10 (3.6%)
70 (24.9%)
30 (10.7%)
72 (25.6%)
99 (35.2%) 3.64 1.285
11. Assigning of M&E responsibilities were properly fulfilled by those assigned to carry out the task.
5 (1.8%)
60 (21.4%)
35 (12.5%)
81 (28.8%)
100 (35.5%) 3.75 1.199
Composite Mean and SD 3.69 1.015

183
As shown in Table 4.22, the overall analysis on composite mean was 3.69 and the standard
deviation was 1.015.
From Table 4.22, the first statement was that M&E data collection instruments were appropriate
for the designed work. Out of 281 respondents who participated 7(2.5%) of the respondents
strongly disagreed, 49(17.4%) disagreed, 53(18.9%) were neutral, 93(33.1%) agreed and
79(28.1%) strongly agreed. Overally, 172(61.2%) agreed with the statement compared to
56(19.9%) who disagreed. Neutral opinions were collected from 53(18.9%). This had a line item
mean score of 3.67 and standard deviation of 1.134 against a composite mean of 3.69 and
standard deviation of 1.015. This implies that data collection tools are used although not
appropriately done for the intended work. There is need to improve the current data collection
instruments to enhance objectivity in collection of required data as regards programme. Where
help is needed, M&E experts among the stakeholders may be called upon to make corrections
where necessary. A standard deviation of 1.134 above the composite of 1.015 indicated the
opinions did not converge.
Second statement that there was availability of data collection tools for M&E. Subsequently,
6(2.1%) strongly disagreed; 50(17.8%) disagreed, 53(18.9%) were neutral, 93(33.1%) agreed
and 79(28.1%) strongly agreed. Overally, 172(89.3%) agreed that data collection tools were
made available as opposed 56(19.9%) who disagreed. A mean score of 3.67 derived on this
statement compared to a composite mean of 3.69 and standard deviation of 1.127 which was
lower than the composite mean of 3.69 and standard deviation of 1.015.this implies that data
collection tools may have been done but not circulated for the respective team to make use of
them. Hence, there is imperative need to ensure all the M&E data collection tools are made
readily available for effective and efficient data collection processes among the stakeholders for
the sake of the program. Standard deviation of 1.127 was above the composite 1.015 meaning
that opinions were inconsistent.
Thirdly, statement that M&E data collection methods were suitable for information required.
Subsequently, 5(1.8%) strongly disagreed, 51(18.1%) disagreed, 49(17.4%) were neutral,
96(34.2%) agreed and 80(28.5%) strongly agreed. Overally, 176(62.7%) of the respondents
agreed M&E data collection methods were made available as opposed to 56(19.9%) who

184
disagreed; and 53(18.9%) who were neutral. According to the analysis a line item mean was
same as the composite mean score of 3.69 Standard deviation 1.121 implied that data collection
selected were averagely suitable and positively influenced the programme. A standard deviation
of 1.122 against 1.015 showed divergence in opinions.
Fourthly, statement that monitoring and evaluation on data collection was sorted and stored in
the right database, out of 281 respondents 6(2.1%) strongly disagreed, 49(17.4%) disagreed
while those who were neutral were 56(19.9%). Further, 97(34.5%) agreed and 73(26.1%)
strongly agreed. In overall 170(60.6%) agreed with the statement higher that those who disagreed
at 56(19.9%) who disagreed. A mean score of 3.65 was obtained for the line item and Standard
deviation1.109 which was lower than the composite mean of 3.69 and Standard deviation1p
1.105. This implies that the process of sorting and storing collected data was not being handled
properly and hence it negatively influenced the program. This suggests that competence of skills
should be strengthened around data sorting and storage so as to improve on the quality control
measure for the data collecting to inform meaningful change. However, with a standard deviation
of 1.189 against 1.015 opinions did not converge.
Fifthly, respondents shared their reactions on the statement that the collected data for M&E was
appropriately coded and filled in the system for utilization in the future. Responses received were
that 15(5.3%) strongly disagreed, 40(14.2%) disagreed, 55(19.5%) were neutral, 91(32.5%)
agreed and 81(28.8%) strongly agreed. Overally, 172(61.3%) of the respondents agreed and
56(19.9%) disagreed. This had a mean score of 3.65 and a Standard deviation1of 1.189 which
was lower than composite mean of 3.69 and Standard deviation of 1.015. This implies that the
line item influences performance of literacy and numeracy educational programme negatively
This suggests that stakeholders who are not competently trained in data coding should seek to
be trained and also practice more to perfect the skill to avoid current anomalies that are being
experienced as far as proper coding is concerned. A higher standard deviation of 1.189 proved
that onions recorded lacked consistency.
On the sixth statement, that M&E data collected was verified and analyzed. The results showed
that 16(5.7%) of the respondents strongly disagreed, 30(10.7%) disagreed thus a total of

185
46(16.4%) disagreed while 56(19.9%) were neutral. Those who agreed were 97(34.5%) and
82(29.2%) strongly agreed. In overall, 179(63.7%) agreed with this statement. This had a mean
score of 3.71 Standard deviation1of 1.62 which was high than the compos mean 3.69 and
Standard deviation1 of 1.015. This implies that M&E data collected was verified and analyzed
accordingly and hence positively influenced the information required and informed the best
practices. Further, this would positively influence performance of the programme. A standard
deviation of 1.162, quite above the composite mean of 1.015 which indicated divergence in
opinions shared by the participants in the study.
On the seventh statement that sources of Monitoring and evaluation information collected was
reliable and trust worthy. Results showed that 6(2.1%) of the respondents strongly disagreed,
50(17.8%) disagreed, thus a total of 56(19.9%) disagreed. Similarly, 61(21.7%) remained
neutral. Results also showed that 92(32.7%) agreed and 72(25.6%) strongly agreed. Thus, this
added up to 164(58.3%) of the respondents who agreed with the statement. A line item mean
score was 3.62 with Standard deviation1of 1.112 which was below the composite mean of 3.69
and Standard deviation of 1.015 which implies that sources of M&E information collected were
not reliable and could not be trusted. Thus the line item influenced performance of literacy and
numeracy educational programme negatively. Thus, it is important to involve all the stakeholders
at every stage of the program implementation to contribute towards assessment of sources of
information be utilized at this program. A high standard deviation of 1.112 was recorded against
1.015 which suggested that opinions did not converge on this statement.
On the eighth statement, that data collected for M&E was from the right respondents. Results
showed that 4(1.4%) of the respondents strongly disagreed, 30(10.7%) disagreed, meaning a
total of 34(12.1%) disagreed. Similarly, 36(12.8%) remained neutral. Results also showed that
91(32.4%) agreed and 120(42.7%) strongly agreed. Thus, a total of 211(75.1%) of the
respondents agreed. A line item mean score obtained was 4.04 and Standard deviation of 1.055
which was above the composite mean of 3.69 and Standard deviation of 1.015 implying that
M&E information collected came from the right respondents. This influences performance of
literacy and numeracy educational programme positively. This implies that engaging the right
people to give the required information would reflect true reflection of how the programme is
running and inform the best decision making process where necessary.

186
On the ninth statement, that proper coordination of M&E activities was well planned. Findings
showed that 9(3.2%) of the respondents strongly disagreed, 53(18.9%) disagreed, meaning a
total of 62(22.1%) disagreed. Similarly, 60(21.4%) remained neutral. Results also showed that
110(39.1%) agreed and 49(17.4%) strongly agreed. Thus, a total of 159(56.5%) of the
respondents agreed with the statement. A line item was a mean score 3.49 Standard deviation of
1.083 which was lower than a composite mean score of 3.69 and Standard deviation implying
that the line item does not influence the performance of literacy and numeracy educational
programme positively. This also implied that proper coordination lacked for M&E activities and
that planning was not well. This further calls for proper delegation of assignments of who is
supposed to do what and what point in time. A higher standard deviation of 1.083 was obtained
against 1.015 which indicated that opinions did not converge.
The tenth statement, stated that schedules existed that displayed how M&E activities were
carried out. Results showed that 10(3.6%) of the respondents strongly disagreed, 70(24.9%)
disagreed, meaning a total of 80(28.5%) disagreed. Similarly, 30(10.7%) remained neutral.
Results also showed that 72(25.6%) agreed and 99(35.2%) strongly agreed. In total 171(60.8%)
of the respondents were in agreement with the statement. From this statement, a mean score 3.64
and standard deviation of 1.285 which was lower than the composite mean of 3.69 and standard
deviation of 1.015 implying that schedules were not being carried out correctly to display
Monitoring and evaluation activities. Hence, there is need to develop schedules using Gantt chart
to avoid overlaps of activities and even time overruns during implementation of the program. A
standard deviation of 1.285 against composite standard deviation of 1.015 obtained on this
statement states that opinions did not converge.
The eleventh and the last statement that assigning of M&E responsibilities were properly
fulfilled by those assigned to carry out the task. Results showed that 5(1.8%) of the respondents
strongly disagreed, 60(21.4%) disagreed, meaning a total of 65(23.2%) disagreed. Similarly,
35(12.5%) remained neutral. Results also showed that 81(28.8%) agreed and 100(35.5%)
strongly agreed. In total 181(64.3%) of the respondents were in agreement with the statement.
From this statement, a line mean score 3.75 and standard deviation which was higher than the
composite mean of 3.69 and standard deviation of 1.015 implying assigning responsibilities
was properly executed by those who had been assigned to conduct the task.

187
Subsequently, in the case where tasks are not executed it could therefore either mean those
assigned the task may not be aware on how to execute the tasks given to them or they lack time
or even morale for to do the job required of them. It is therefore critical for follow up meetings
to be conducted to ensure the assigned responsibilities are done to the latter. A standard deviation
of 1.199 arrived at statement implied that opinions were not converging.
Results of interviews with key informants showed that data collection for M&E influenced
performance of literacy and numeracy educational program. The results of the interviews were,
therefore, consistent with the quantitative data. The following are key responses obtained from
the key informants:
“The same data should be shared with all the stakeholders for better use; the information is
only vital if it is stored and used appropriately, and only to the concerned officers. Data is
shared only on demand and no initiative experienced in sharing the data. We need more
data collection tools and also incorporation of the Teachers Performance Appraisal and
Development (TPAD) for assessing teachers’ progress in the teaching endeavor. If the
Ministry wants the latest information about the programme they must first consult the RTI
Directors first and then get what they require; the MoEST has no records of Private Schools
in the country yet they are the ones responsible for basic education. Information is shared
to all the concerned parties but it is never fully utilized, hence low performance on most
programme in the MoEST”. Statements from Curriculum Support Officer West land sub-
county. ( CSO, 2018)
4.8.1 Inferential Analysis of stakeholder capacity building of key stakeholders in the
programme
The inferential analysis was performed by use of correlation and regression to show the
relationship, strength and direction of independent and dependent variables. It was based on the
third objective to examine how data collection influence performance of literacy and numeracy
educational programme in public primary schools in Nairobi County, Kenya.
The variable data collection was operationalized using the following indicators Selection of
M&E data instruments, M&E data collection and collation of information, Sources of M&E
information and Schedules of M&E activities. Performance of literacy and numeracy indicators
were : Reading skills, Simple arithmetic calculations skills, Letter recognition, beneficiary

188
Satisfaction, proficiency skills in listening of literacy and numeracy skills, proficiency skills in
speaking of literacy and numeracy skills, proficiency skills and writing, Timely Acquisition of
literacy and numeracy skills, transition rate improved and class average performance improved
4.8.2 Correlation analysis of Data collection and Performance of Literacy and
Numeracy Educational Programme
The relationship between data collection and performance was determined by Pearson
Correlation coefficient. According to the analysis, +1 signaled a positive perfect correlation,
0.001 – 0.250 a weak correlation, 0.251 – 0.500 semi but strong correlation, 0.501 – 0.750 strong
correlation and lastly 0.751 – 1.000 very strong correlation. Table 4.23 summarizes the results.
Table 4.23
Correlation Analysis for Data Collection and Performance of Literacy and Numeracy
Educational Programme
Performance of literacy and
numeracy educational program
Data collection
Performance
Pearson Correlation 1 0.660**
Sig. (2-tailed) 0.000
n 281 281
Data collection
Pearson Correlation 0.660** 1
Sig. (2-tailed) 0.000
n 281 281 ** Correlation is significant at the 0.05 level (2-tailed).
In Table 4.23, the output indicates that data collection had a strong significant positive
relationship with performance of literacy and numeracy educational programs in public primary
schools in Nairobi County, Kenya. (P-value of 0.000<0.05). Given a Pearson correlation of (r=
0.660), a strong positive relationship emerged between data collection and performance of
literacy and numeracy educational programme.
4.8.3 Regression Analysis for Data Collection and Performance of Literacy and
Numeracy Educational Programme
The third objective was to examine how data collection influence performance of literacy and
numeracy educational programme in public primary schools in Nairobi County, Kenya. The
indicators for data collection for comprised of selection of M&E data instruments, data collection

189
and collation, sources of M&E information, schedules of M&E activities. The indicators for
performance were reading learning skills, simple arithmetic calculations skills, letter recognition,
beneficiary satisfaction, proficiency skills in listening, proficiency skills in speaking, proficiency
skills in writing, timely acquisition of literacy and numeracy skills, transition rate improved and
class average performance improved.
4.8.4 Test of Hypothesis 3
A linear regression was used to test the hypothesis to satisfy the requirements for the third
objective of the study:
H0 Data collection has no significant influence on performance of literacy and numeracy
educational programme in public primary schools in Nairobi County, Kenya.
H1 Data collection has significant influence on performance of literacy and numeracy
educational programme in public primary schools in Nairobi County, Kenya
The null hypothesis was tested using the below linear regression model:
y = a + b3X3 + 𝜀
Where:
y - Performance of literacy and numeracy educational program
X3 - Data collection
a - Regression constant
𝜀 - Error term
The results are presented in Table 4.24 and 4.25.
Table 4.24
ANOVA for Data Collection and Performance of Literacy and Numeracy Educational
Programme
Model Sum of
Squares
df Mean
Square
F Sig.
1
Regression 90.382 1 90.382 215.779 0.000b
Residual 116.863 279 0.419
Total 207.245 280
a. Dependent Variable: Performance
c Predictors: (Constant), Data collection
From the Table 4.24 revealed that regression model’s goodness of fit. The overall F-statistic is
215.779 with a p-value of 0.000<0.05 which implies that there was a statistically significant

190
relationship between data collection and performance of literacy and numeracy educational
programme. The critical value was 3.875. This value was less than the calculate F value which
is 215.779 thus concluding that the model is fit. Thus the model was significant
Table 4.25
Model summary for Data Collection and Performance of Literacy and Numeracy
Educational Programme
Model R R Square Adjusted R
Square
Std. Error of the
Estimate
1 0.660a 0.436 0.434 0.64720
a. Predictors: (Constant), Data collection
The results in Table 4.25 show that R=0.660 and R-squared = 0.436. The “R” was used to
determine degree and nature of correlation between data collection for monitoring and evaluation
and performance of literacy and numeracy educational programme. This shows that data
collection for Monitoring and Evaluation strongly influenced performance of literacy and
numeracy educational programme by 0.660. On the other hand the R2 showed that data collection
explained 43.6% variations in the performance of literacy and numeracy educational programme.
Hence, there could be other factors not featured under this model that account for the rest of
56.4% and they are not under this study.
Table 4.26
Model Coefficients for Data Collection and Performance of Literacy and Numeracy
Educational Programme
Model Unstandardized
Coefficients
Standardized
Coefficients
t Sig.
B Std. Error Beta
1 (Constant) -0.137 0.039 -3.538 0.000
Data collection 0.479 0.033 0.660 14.689 0.000
Model: (β= -0.137, t=14.689, p=0.000<0.05)
Predictor Variable: Data Collection
Dependent Variable: Performance of Literacy and Numeracy Educational Programme
The results in Table 4.26 indicate that that data collection has statistically significant influence
on performance of literacy and numeracy educational programme (β= -0.137, t=14.689,
p=0.000<0.05). Using the statistical findings, the regression model can be substituted as follows:

191
Y= 𝛽0 + 𝛽3X3+ ɛ
y = -0.137+0.479X3+ 0.033
Where:
y - Performance of literacy and numeracy educational programme
X2 - Data Collection
𝜀 - Error term
From Table 4.26, a positive beta coefficient for data collection is 0.479 indicating a direct
relationship exists in this model. Probability of t-statistic is 14.689 for β coefficient has less value
comparable to significance level which is 0.05. The findings led to the rejection of the null
hypothesis and hence concluded that data collection has significant influence on performance of
literacy and numeracy educational programme.
The findings of the third objective were linked to the previous empirical investigations that had
earlier been reviewed. The model was deemed significant and relationship between the two
variables was correlated. Data collection influenced performance of literacy and numeracy
educational programme. So it is in this connection that the current study show that data collection
in a programme like TUSOME and PRIMR had significant influence on performance of literacy
and numeracy learning skills. The study agree with the findings of Tine and Skedsmo, (2017) on
good feedback of learners results. Data collected about the learners’ progress by teachers and
administrators in the school helps in future use as it was found in the current study whereby
many respondents agreed data collection is an important measure of giving feedback.
Data collected for education purposes in schools assessment are used by policy makers,
administrators and teachers to provide the parents with the results of their children and also guide
the implementing organization on the best action to take when doing corrective measures Moller,
(2015). The current study differed with this argument since this not the only way of getting data
but agreed with (Piper et al 2016; RTI, 2014) who developed a Targerine for collecting data and
giving analyzed data on the sport. The study found it crucial on this type of garget collecting
data since it was only the curriculum support officers and the coaches who had the tool leaving
out the key implementer who is the teacher out. There is a weakness on how data is collected for

192
this to be curbed the study established that there is need to get more ways of collecting data from
teachers, learners and all the stakeholders involved in the programme.
A study by Matonda, et al (2013) determined that significant relationship between data
collection and performance of literacy and numeracy educational programme. The study results,
therefore, supports the previous studies that data collection has influences on performance of
literacy and numeracy educational program. In relation to the foregoing comparable studies, the
current study has adduced empirical evidence in support of their earlier findings, even though no
similar study had been done in Nairobi County, Kenya and specifically on literacy and numeracy
educational programme.
4.9 Data Management and Performance of literacy and numeracy educational
programme
This section presents descriptive and correlation analysis on data management of key
stakeholders. Data management is very vital when putting into consideration of measuring
literacy and numeracy learning skills. This study determined the extent to which data
management influenced performance of literacy and numeracy educational programme Data
management in any organization is essential for any good yields to occur. This must be done
with a lot of integrity and honesty so as to avoid biasness when giving out the results required.
The views of the respondents on data management were assessed and measured using a 5-point
likert-scale whereby; strongly disagree (SD) =1, Disagree (D) =2 Neutral (N) =3
Agree (A) =4 and Strongly Agree (SA) =5. Line mean score and standard deviation of each of
the opinions was compared with the respective composite scores for both interpretation and
conclusion purposes. The results are presented in Table 4.27.

193
Table 4.27
Data Management and performance of literacy and numeracy Educational programme
Statements
SD
F
(%)
D
F
(%)
N
F
(%)
A
F
(%)
SA
F
(%) Mean
Std.
Deviation
Identifying specific data
analysis methods
1.Data analysis methods used were
relevant and reliable 5
(1.8%)
50
17.8%)
56
(19.9%)
94
(33.5%)
76
(27.0%) 3.66 1.110
2.he process of identifying specific data
analysis methods used was appropriate 5
(1.8%)
53
(18.9%)
53
(18.9%)
90
(32.0%)
80
(28.4%) 3.67 1.132
3.Methods of specifying data analysis
process was strictly followed 21
(7.5%)
50
(17.8%)
40
(14.2%)
120
(42.7%)
50
(17.8%) 3.46 1.189
Identifying staff for data
management
4.Responsibility matrix which depicted
staff responsible for data management
existed
7
(2.1%)
45
(16.1%)
59
(21.1%)
99
(35.3%)
71
(25.4%) 3.66 1.089
5.Staff responsible for data management
were experts and knowledgeable 9
(3.2%)
42
(14.9%)
50
(17.8%)
109
(38.8%)
71
(25.3%) 3.68 1.104
6.The staff knowledge and skills for
M&E led to proper data management
information
11
(3.9%)
40
(14.2%)
59
(21.0%)
121
(43.1%)
50
(17.8%) 3.57 1.061
Data analysis and interpretation
7.Data interpretation was based on the
information analyzed 9
(3.2%)
46
(16.4%)
58
(20.6%)
100
(35.6%)
68
(24.2%) 3.61 1.116
8.M&E data had been established to
screen and store relevant information for
quick retrieval and feedback to all the
stakeholders
9
(3.2%)
46
(16.4%)
50
(17.8%)
108
(38.4%)
68
(24.2%) 3.64 1.113
9.The plan for data analysis and
interpretation was clear and to the point 9
(3.2%)
44
(15.7%)
52
(18.5%)
105
(37.4%)
71
(25.2%) 3.66 1.114
10.Stakeholders were actively involved
in data analysis and interpretation 11
(3.9%)
43
(15.3%)
49
(17.4%)
107
(38.1%)
71
(25.3%) 3.65 1.130
11.Analysis and interpretation of M&E
data was properly utilized and stored in
the data bases
10
(3.6%)
33
(11.7%)
60
(21.4%)
97
(34.5%)
81
(28.8%) 3.73 1.107
M&E report writing
12.After data collection, analysis and
interpretation, M&E report writing was
done
2
(0.7%)
52
(18.5%)
56
(19.9%)
124
(44.2%)
47
(16.7%)
3.58
0.998
13.M&E report was useful in improving
the M&E activities and decision making 5
(1.8%)
49
(17.4%)
51
(18.1%)
133
(47.4%)
43
(15.3%) 3.57 1.005
14.Stakeholders were actively involved
in the utilization of M&E results 2
(0.7%)
58
(20.7%)
50
(17.8%)
120
(42.7%)
51
(18.1%) 3.57 1.033
15.M&E reports helped in making
concrete and decisive decisions 10
(3.6%)
50
(17.8%)
45
(16.0%)
125
(44.5%)
51
(18.1%) 3.56 1.088
16.M&E reports were written and shared
to all stakeholders for dissemination
purposes
7
(2.5%)
46
(16.4%)
61
(21.7%)
76
(27.0%)
91
(32.4%) 3.70 1.156
Composite Mean and SD 3.62 1.098

194
As shown in Table 4.27, the overall composite mean was 3.62 and the standard deviation of
1.098.
On the first statement that data analysis methods used were relevant and reliable. The results
indicated that 5(1.8%) strongly disagreed, 50(17.8%) disagreed. In overall, 55(19.6%) were in
disagreement. The respondents who held neutral opinion accounted for 56(19.9%). Those who
agreed and strongly agreed were 94(33.5%) and 76(27.0%) respectively. This means 170(60.5%)
were in agreement with the statement that data analysis methods used were relevant and reliable.
This line item had a mean score of 3.66 and standard deviation of 1.110 which was above the
composite mean of 3.62 and standard deviation of 1.098. This implies that analysis methods used
in the program were more relevant and reliable. This should be a continuous exercise to ensure
information shared is based on empirical evidence supported with reliable data. It could however
be noted that opinions were divergent given a higher standard deviation of 1.110 against the
composite standard deviation of 1.098.thsi line item influences performance of literacy and
numeracy educational programme positively.
Secondly, a statement the process of identifying specific data analysis methods used was
appropriate. The results indicated that 5(1.8%) strongly disagreed and 53(18.9%) disagreed
adding up to a total of 58(20.7%) with disagreeing opinions. Neutral opinions were given by
53(18.9%). The respondents who agreed were 90(32.0%) and 80(28.4%) who strongly agreed.
This analysis indicated the majority 170(60.4%) were in agreement with the statement. A mean
score of 3.67 and standard deviation of 1.132 above the composite mean of 3.62 and standard
deviation of 1.098 was recorded which implied that data analysis methods were appropriately
identified and the line item influences performance of literacy and numeracy educational
programme. It should be noted that proper methods of analyzing data in a program or project are
very vital to ensure data generated gives an output of true reflection of what is happening on the
ground. This could further aid in eliminating any obstacles that might be of a challenge to
effective implementation of the program. With a standard deviation of 1.132, the opinions on the
statement were not consistent.

195
Thirdly, the statement that the methods of specifying data analysis process were adhered to
strictly, 21(7.5%) strongly disagreed, 50(17.8%) disagreed totaling 71(25.3%) of those who
disagreed. Neutral opinions were received from 40(14.2%). 120(42.7%) agreed and 50(17.8%)
strongly agreed, meaning that majority 170(60.5%) were in agreement. This line item had mean
score of 3.46 and standard deviation of 1.189which was lower than the composite mean of 3.62
and standard deviation of 1.098. This implies that the line item moderately influenced
performance of literacy and numeracy educational programme.
Fourthly, statement that responsibility matrix which depicted staff responsible for data
management existed. The results shows that 6(2.1%) strongly disagreed, 45(16.1%) disagreed
hence a total 51(18.2%) in disagreement. The neutral opinion were given by 59(21.1%), while
99(35.3%) agreed and 71 (25.4%) strongly agreed, thus in total 170(60.7%) were in agreement.
This had a mean score of 3.66 and standard deviation of 1.089 which is bigger than the composite
mean of 3.62 and standard deviation of 1.098. This implied that responsibility matrix existed for
staff involved in data management. This had a positive influence on performance of literacy and
numeracy educational programme on those involved in data management and not only help in
getting to know who is the right person to pursue for what information at a given time in the
course of the programme implementation but also flow of information is easily facilitated.
Similarly, a lower standard deviation of 1.089 greater against the composite of 1.098 indicated
the opinions converged.
Fifthly, the statement that staff responsible for data management were experts and
knowledgeable. The results showed that 9(3.2%) strongly agreed, 42(14.9%) disagreed, and in
total 51(18.1%) disagreed. Respondents with neutral views accounted for 50(17.8%) while
109(38.8%) agreed and 71(25.3%) strongly agreed. It appears majority 180(64.1%) were in
agreement. This was further supported by a higher mean score of 3.68 and standard deviation of
1.194 which was above composite mean of 3.62 and standard deviation of 1.098. This means the
line item positively influences management of the literacy and numeracy programme, data
manageable are well trained and hence experts. Although this is the case, this outcome should
also cascade to other areas where expertise is dire and if possible individuals involved in data
management could be supported through training and refresher courses. With a lower standard

196
deviation of 1.104 against the composite mean of 1.098 that the respondents’ opinions
converged.
On the sixth statement, that the staff knowledge and skills for M&E led to proper data
management information. The results showed that 11(3.9%) strongly disagreed, 40(14.2%)
disagreed on the same item, hence in total 51(18.1%) were in disagreement while 59(21.0%)
were neutral. Also, 121(43.1%) agreed and 50(17.8%) strongly agreed resulting to a total of
171(60.9%) of those in agreement. This had mean score of 3.57 and standard deviation of 1.061
which was lower than the composite mean of 3.62 and standard deviation of 1.098. This means
that the line item negatively influences performance of literacy and numeracy educational
programme. Also this means that proper data management was not influenced by the knowledge
and skills possessed by staff in M&E. This would mean that the data management might be in
place and that all involved in the program are aware of its utilization and not necessarily does it
require much skills and knowledge. A standard deviation of 1.061 below the composite 1.098
implied that opinions converged.
On the seventh statement that data interpretation was based on the information analyzed. From
the results recorded, it was revealed that 9(3.2%) strongly disagreed, while 46(16.4%) disagreed
meaning that 55(19.6%) were in disagreement. Neutral opinions gathered indicated that
58(20.6%) took part in the study. Still on the same statement, 100(35.6%) agreed and 68(24.2%)
strongly agreed, thus in total 168(59.8%) were in agreement. The statement had mean score of
3.61 and standard deviation of 1.116 almost the overall mean of 3.62 and standard deviation of
1.098. This implies the findings presented information was more reliable as far as the programme
is concerned since the information analyzed proper data interpretation. This results shows that
the line item influences the performance of literacy and numeracy educational programme
moderately to a moderate extent. A standard deviation of 1.116 was above the composite
meaning that opinions diverged.
The analysis results from the eighth statement that M&E data had been established to screen and
store relevant information for quick retrieval and feedback to all the stakeholders indicated that
9(3.2%) strongly disagreed, 46(16.4%) disagreed, 50(17.8%) were neutral, 108(38.4%) agreed

197
and 68(24.2%) strongly agreed with the statement. In total, 55(68.6%) were in disagreement as
opposed to 176(62.6%) in agreement. A mean score of 3.64 and standard deviation of 1.113 and
a mean score of 3.62 and standard deviation of 1.098. This means the line item influences the
performance of literacy and numeracy educational programme positively. With the above
composite mean it was a clear indication that M&E data had prior been established, Screened
stored and relevant information enabling faster retrieval and feedback was available. A standard
deviation of 1.113 above the recorded composite of 1.098 indicates divergence in opinions from
the respondents.
The ninth statement that plan for data analysis and interpretation was clear and to the point
showed that 9(3.2%) strongly disagreed and 44(15.7%) disagreed. In total 53(18.9%) disagreed
and 52(18.5%) held neutral views. The study also showed that 105(37.4%) agreed and 71(25.2%)
strongly agreed hence in total 176(62.6%) were in agreement. A mean score of 3.66 and standard
deviation of 1.114 which was over and above the composite mean of 3.62 and standard deviation
of 1.098 indicated clearly that data analysis and interpretation plans were clear. This should be
emphasized at all stages to ensure information generated would be relied upon for effective
implementation of the programme. A standard deviation of 1.114 was realized above the 1.098
above the composite suggesting divergence in opinions from the respondents.
The tenth statement that stakeholders were actively involved in data analysis and interpretation
as such, 9(3.2%) of the respondents strongly disagreed, 44(15.7%) disagreed and in total
54(19.2%) of the study participants disagreed. Those with neutral opinions were 49(17.4%).
Those who agreed were 107(38.1%) and 71(25.3%) strongly agreed hence in total 178(63.4%)
were in agreement. A mean score of 3.65 and standard deviation of 1.130 which was above the
composite mean of 3.62 and standard deviation of 1.098. This means that the line item influences
the performance of literacy and numeracy educational programme positively and stakeholders
were active participants in data analysis and interpretation. A standard deviation of 1.130 above
1.098 indicated divergence in opinions.
On the eleventh statement that analysis and interpretation of M&E data was properly utilized
and stored in the data base. Thus the results showed that 10(3.6%) strongly disagreed and

198
33(11.7%) disagreed. In total, 43(15.3%) were in disagreement. Neutral opinions were held by
60(21.4%). Those who agreed were 97(34.5%) and 81(28.8%) strongly agreed and hence
178(63.3%) were in agreement. A mean score of 3.73 and standard deviation of 1.107 was above
the composite of 3.62 and standard deviation of 1.098 meaning that the line item had a positive
influence on the performance of literacy and numeracy educational programme. This implies
that data was properly used and also stored in the right data base. Proper storage of data is vital
and is considered one of the quality control measures in safe guarding the integrity of information
in program or project management. However this was observed as influencing performance of
literacy and numeracy educational programme, given a higher standard deviation of 1.107 it
could be deduced there was divergence of in views.
On the twelfth statement and interpretation data collection, analysis after, monitoring and
evaluation writing report was done the results were disseminated to all the stakeholders. Those
who strongly disagreed were 2(0.7%) and 52(18.5%) disagreed thus, 54(19.2%) were in
disagreement whereas 56(19.2%) held neutral opinion. Those who agreed and strongly agreed
were 124(44.2%) and 47(16.7%) respectively and hence totaling to 171(60.9%) of those in
agreement. A mean score of 3.58 and standard deviation of 0.998 was quite below the composite
mean of 3.62 and standard deviation of 1.098. The line item had a negative influence on
performance of literacy and numeracy educational programme since it was below the composite
mean. This implies that data collection, analysis and M&E report writing was not done properly.
This could be a retrogressive move whereby the gains may not be available for sharing among
the stakeholders for improvement of the program and knowledge sharing. A higher standard
deviation of 0.998 than the composite signified opinions were rather divergent.
From the thirteen statement, Monitoring and evaluation report was useful in improving the
Monitoring and evaluation activities and decision making showed that 5(1.8%) strongly
disagreed and 49(17.4%) disagreed hence, 54(19.2%) were in disagreement. Neutral opinions
were shared by 51(18.1%). Those who agreed were 133(47.4%) and 43(15.3%) strongly agreed
with the resulting to a total of 176(62.7%) in agreement. A mean score of 3.57 and standard
deviation of 1.005 for the line item which was composite mean 3.62 and standard deviation of
1.098. This implies that the line item was below the composite mean meaning that it influences

199
performance of literacy and numeracy of educational programme negatively thus M&E reports
were not useful. It could be noted that from the twelfth statement reports were not done and this
could be one of the reasons respondents failed to state the usefulness of the M&E reports in
programme implementation. There is need to emphasize on report writing for benching marking.
Fourteenth, this statement state that stakeholder were actively utilization of monitoring involved
in evaluation results utilization of monitoring and. This were revealed by 2(0.7%) who strongly
agreed and 58(20.7%) disagreed totaling to 60(21.7%) of those in disagreement. Neutral
opinions were rather held by 50(17.8%). On the other hand, 120(42.7%) agreed and 51(18.1%)
strongly agreed resulting to an overall of 171(60.8%) in agreement. A mean score of 3.57 and
standard deviation of 1.033 which was below the composite mean of 3.62 and standard deviation
of 1.098. This implied that utilization of M&E results ignored active participation of the
stakeholders. Whether stakeholders are involved in every other stage of the programme
implementation and are essentially left out during result utilization stage, then it would remain
baseless and in most cases lessons cannot be transferred. Obtained on this statement standard
deviation of 1.033 which was below the composite suggesting opinions converged.
On the fifteenth statement, Monitoring and evaluation reports helped in making decisive
decisions. 10(3.6%) strongly disagreed, 50(17.8%) disagreed hence a total of 60(21.4%) in
disagreement. Responses of 45(16.0%) were neutral. Analysis also showed that both 125(44.5%)
and 51(18.1%) agreed and strongly agreed respectively, giving a total of 176(62.6%) of those in
agreement. A mean score of 3.56 and standard deviation of 1.088 which was below the
composite mean of 3.62 and standard deviation of 1.098 implying that reports never helped in
critical decision making process. This could be an alarming issue that need to be looked into
otherwise such a wonderful programme and many others to come are bound to fail for lack of
information to inform decision that would contribute to proper planning and improvement of the
programme among other issues of programme or project management and standard deviation of
1.088. This was lower than the overall composite mean. It could be deduced that opinions
converged given a lower standard deviation of 1.088 against overall standard deviation of 1.098.

200
On the last statement, Monitoring and evaluation reports were written and shared was among the
stakeholders. Results showed that 7(2.5%) strongly disagreed, 46(16.4%) disagreed, hence
53(18.9%) were in disagreement. Those of neutral views were 61(21.7%). Similarly, 76(27.0%)
agreed and 91(32.4%) strongly agreed resulting to 176(62.6%) in agreement. A mean score of
3.70 and standard deviation of 1.156 obtained was slightly above the composite mean of 3.62
and standard deviation of 1.098 showing that M&E reports were adequately disseminated. The
line item had a positive influence on performance of literacy and numeracy educational
programme. However, going by the previous views, the Monitoring and evaluation reports might
have been shared but the stakeholders may have found them not useful for they were not involved
and also could not help in decision making. Therefore, the quality of such reports should not
only be checked in the current programme of literacy and numeracy but also future programme
with similar characteristics. Given 1.156 as the standard deviation for this statement, it could be
concluded that opinions were inconsistent.
Results of interviews with key informants showed that data management for M&N influenced
performance of literacy and numeracy educational programme. The results of the interviews
were, therefore, consistent with the quantitative data. The following are key responses obtained
from the key informants:
“Data is collected in the classroom when the teacher is being observed while
teaching. Learners are guided on which words to read at a set time in the
TAGARINE tablet. They are supposed to read a certain number of words in a
specified time upon which when the set time lapses the tablet closes down but
gives the number of words read at what speed and the percentage. The response
was data is collected from several stakeholders through either questionnaires,
tablet or documents from the heads of the institutions data is transmitted through
the use of tablets wherever you are and the moment it is keyed in it reflects to all
the systems which are connected to the gadget. It is later cleaned and analyzed
by the RTI officers who later share it to the respective groups who require this
information. To manage data is not any easy thing but when called upon there
is need to do so simply because it is a necessity to the organization. After all
when the implementing organizations hands over the project to the government
it is assumed that it will be sustainable.” Statements from Embakasi sub-county.
(CSO, 2018)
Results of the interviews from the RTI officers agreed on the importance of embracing the new
technology for giving immediate feedback from the classroom teaching and also as an additional
learning material to the teachers in delivering the instructional content RTI officers

201
“The Tangerine tool was designed by RTI international as a tablet-based
instructional support program for collecting data from the learners while the
teacher is teaching in the classroom being observed by the curriculum support
officer. The tablet is meant to deepen the quality of instruction but not a
punishment as seen by some teachers”. (RTI, 2018)
4.9.1 Inferential Analysis of Data Management and Performance of Literacy and
Numeracy Educational Programme
The inferential analysis was performed by use of correlation and regression to show the
relationship, strength and direction of independent and dependent variables. It was based on the
third objective to examine how data management influence performance of literacy and
numeracy educational programme in public primary schools in Nairobi County, Kenya.
The variable of data management was operationalized using the following indicators identifying
specific data analysis methods, identifying staff responsible for data management, data analysis
and interpretation and M&E reports writing. Performance of literacy and numeracy indicators
were: Reading skills, Simple arithmetic calculations skills, Letter recognition, beneficiary
Satisfaction, proficiency skills in listening of literacy and numeracy skills, proficiency skills in
speaking of literacy and numeracy skills, proficiency skills and writing, Timely Acquisition of
literacy and numeracy skills, transition rate improved and class average performance improved.
4.9.2 Correlation analysis of Data Management and Performance of Literacy and
Numeracy Educational Programme
The relationship between data management and performance was determined by Pearson
Correlation coefficient. According to the analysis, +1 signaled a positive perfect correlation,
0.001 – 0.250 a weak correlation, 0.251 – 0.500 semi but strong correlation, 0.501 – 0.750 strong
correlation and lastly 0.751 – 1.000 very strong correlation. Table 4.28 summarizes the results.

202
Table 4.28
Correlation Analysis for Data Management and Performance of Literacy and Numeracy
Educational Programme
Performance Data Management
Performance
Pearson Correlation 1 0.536**
Sig. (2-tailed) 0.000
n 281 281
Data Management
Pearson Correlation 0.536** 1
Sig. (2-tailed) 0.000
n 281 281
**. Correlation is significant at the 0.05 level (2-tailed).
In Table 4.28, the output results show that data management had a strong positive relationship
with performance of literacy and numeracy educational programme in public primary schools in
Nairobi County, Kenya. (P-value of 0.000<0.05). Given a Pearson correlation of (r= 0.536), a
strong positive relationship emerged between data management and performance of literacy and
numeracy educational programme.
4.9.3 Regression Analysis for Data Management and Performance of Literacy and
Numeracy Educational Programme
The fourth objective was to determine the extent to which data management influence
performance of literacy and numeracy educational programme. The hypothesis was tested using
linear regression model.
4.9.4 Test of Hypothesis 4
A linear regression was used to test the hypothesis to satisfy the requirements for the fourth
objective of the study:
H0 Implementing change has no significant influence on performance of literacy and numeracy
educational programme in public primary schools in Nairobi County, Kenya.
H1 Implementing change has significant influence on performance of literacy and numeracy
educational programme in public primary schools in Nairobi County, Kenya
The null hypothesis was tested using the below linear regression model:
y = a + b4X4 + 𝜖

203
Where:
y - Performance of literacy and numeracy educational programme
X4 - Data management
a - Regression constant
𝜀 - Error term
The results are presented in Table 4.29 and 4.30
Table 4.29
ANOVA for Data Management and Performance of Literacy and Numeracy Educational
Programme
Model Sum of
Squares
df Mean
Square
F Sig.
1
Regression 59.627 1 59.627 112.695 0.000b
Residual 147.618 279 0.529
Total 207.245 280
a. Dependent Variable: Performance
b. Predictors: (Constant), Data Management
The overall F-statistic is 112.695 with a p-value of 0.000<0.05 which implies that there was a
statistically significant relationship between data management and performance of literacy and
numeracy educational programme. The calculated critical value gave a value of 3.875 which is
less than the F value of 112.695 thus the model goodness of fit was achieved
Table 4.30
Model Summary for Data Management and Performance of Literacy and Numeracy
Educational Programme
Model R R Square Adjusted R Square Std. Error of the
Estimate
1 0.536a 0.288 0.285 0.72739
a. Predictors: (Constant), data management
From Table 4.30, the coefficient of correlation (R) was 0.536 which implied a weak positive
correlation between data management and performance of literacy and numeracy educational
programme. The R-squared was 0.288, meaning that 28.8 % of variation in performance of
literacy and numeracy educational programme was explained by variation in data management.
The remaining 71.2% variation in performance of literacy and numeracy educational programme
was as a result of other factors not included in the model.

204
Table 4.31
Model Summary for Data Management, and Performance of Literacy and Numeracy
Educational Programme
Model Unstandardized
Coefficients
Standardized
Coefficients
t Sig.
B Std. Error Beta
1 (Constant) -0.120 0.044 -2.751 0.006
Data Management 0.408 0.038 0.536 10.616 0.000
Model: (β=0.408, t=10.616, p=0.000<0.05).
Predictor Variable: Data Management
Dependent Variable: Performance of Literacy and Numeracy Educational Programme
The results in Table 4.31 indicate that data management has statistically significant influence on
performance of literacy and numeracy educational programme (β=0.408, t=10.616,
p=0.000<0.05). Using the statistical findings, the regression model can be substituted as follows:
Y=β0 + β4X4+ ɛ
y = -0.120+0.408X4+ 0.038
Where:
y - Performance of literacy and numeracy educational programme
X2 - Data Collection
𝜀 - Error term
From Table 4.31, a positive beta coefficient for data management is 0.408 indicating a direct
relationship exists in this model. Probability of t-statistic is 10.616 for β coefficient has less value
when comparing with significance level which is 0.05. The findings led to the rejection of the
null hypothesis and hence concluded that data management has significant influence on
performance of literacy and numeracy educational programme.
The findings of this study shows that data management was statistically significant and has a
relationship with performance of literacy and numeracy educational programme. The overall
composite mean was 3.62 which above compared to line items composite mean which were

205
below it. This implies that data management guarantees performance of literacy and numeracy
learning skills after using the information which was stored in the data base for easy access when
in need of it. This study does not concur with (Tenopir, Sandusky, Allard and Birch 2016) on
their opinion that sharing of managed data is not effective as acknowledged by many researcher.
However they differ (Federer, Joubert, Welsh and Brandys 2015) on their opinion that data
management lack people with technical skills and experience of how to manage and retrieve data
for easy sharing and giving feedback.
The current study refute the claims of (Federer, Joubert, Welsh and Brandys 2015) who argue
that training of teachers and other stakeholders in literacy and numeracy programme were well
performed by experts from RTI officers and MOEST officials on how to analyze and manage
data after class observations. According to this study this was not done for example training of
data analysis.
So this objective is in support of data management which was found to be significantly
influencing performance of literacy and numeracy educational programme. Therefore data
management influences performance of literacy and numeracy educational programme
4.10 Implementing Change and Performance of literacy and numeracy educational
programme
Descriptive and correlational analysis are presented in this section for implementing change.
Implementing change results is a crucial process which involves analysis, interpretation of data
and implementing change found while undertaking the process. This means that every relevant
information and experiences gathered from those who are directly affected increases the
accountability of the participants who have a direct interest in implementation of the programme.
In a bid to arrive at the realization of this process the fifth objective of the study examined the
extent to which implementing change was achieved and the influence it had on the performance
of literacy and numeracy educational programme in public primary schools Nairobi, county
Kenya. The dimensions of implementing change were drawn from the following indicators:
reviewing collected data, number of transmitted reports, utilization of M&E results and project
intervention

206
The views of the respondents on implementing change were assessed and measured using a 5-
point likert-scale whereby: Strongly disagree (SD)=1, Disagree (D)=2, Neutral(N)=3,
Agree(A)=4 and Strongly Agree (SA)=5. Line mean score and standard deviation of each of the
opinions was compared with the respective composite scores for both interpretation and
conclusion purposes. The results are presented in Table 4.32.
Table 4.32
Implementing change and Performance of Literacy and Numeracy Educational
Programme
statements
SD
F
(%)
D
F
(%)
N
F
(%)
A
F
(%)
SA
F
(%) Mean
Std.
Deviation
Reviewing collected data
1.All stakeholders counter checked the
number of TARGERINE transmitted
reports for correction and reliability
6
(2.1%)
31
(11.0%)
91
(32.4%)
62
(22.1%)
91
(32.4%) 3.72 1.097
2.TARGERINE tool facilitated for
accurate and adequate information for
the program
7
(2.5%)
30
(10.6%)
89
(31.7%)
68
(24.2%)
87
(31.0%) 3.70 1.093
3.TARGERINE tool helped improve the
implementation of the project activities
such as collection of data during class
observation
17
(6.1%)
20
(7.1%)
82
(29.2%)
74
(26.3%)
88
(31.3%) 3.70 1.161
4.The information collected improved
the process of involving the stakeholders
in transmitting reliable reports
15
(5.3%)
32
(11.4%)
50
(17.8%)
82
(29.2%)
102
(36.3%) 3.80 1.200
5.Stakeholders reviewed data collected
and made changes to the identified gaps
in the reports
15
(5.3%)
22
(7.8%)
60
(21.4%)
94
(33.5%)
90
(32.0%) 3.79 1.135
Number of transmitted reports
6.Data collected from the
TARGERINE report was reviewed and
analyzed
6
(2.1%)
33
(11.7%)
89
(31.7%)
87
(31.0%)
66
(23.5%) 3.62 1.036
7.The number of transmitted report lead
to improved results and the quality of
project intervention in literacy and
numeracy educational lessons
9
(3.2%)
30
(10.7%)
90
(32.0%)
65
(23.1%)
87
(31.0%) 3.68 1.117
8.Shared transmitted reports led to
identifying areas with large number of
participants and with less participants
19
(6.8%)
20
(7.1%)
50
(17.8%)
85
(30.2%)
107
(38.1%) 3.86 1.199
9.Transmitted report improved the
allocation of resources for example the
areas which needed more personnel’s for
supervising literacy and numeracy
programme
31
(11.0%)
8
(2.8%)
45
(16.0%)
90
(32.0%)
107
(38.1%) 3.83 1.275
Utilization of M&E results
10.M&E results were used to improve
projects activities such as allocation of
resources
7
(2.5%)
35
(12.5%)
89
(31.7%)
52
(18.5%)
98
(34.8%) 3.71 1.143

207
statements
SD
F
(%)
D
F
(%)
N
F
(%)
A
F
(%)
SA
F
(%) Mean
Std.
Deviation
11.The M&E results obtained from the
programme excises were disseminated
for utilization by all the stakeholders in
order to better the results of literacy and
numeracy educational program
11
(3.9%)
33
(11.7%)
80
(28.5%)
60
(21.4%)
97
(34.5%) 3.71 1.171
12.M&E results improved the quality of
program intervention such as literacy and
numeracy
10
(3.6%)
43
(15.3%)
71
(25.3%)
49
(17.4%)
108
(38.4%) 3.72 1.223
13.M&E results improved the use of
financial and resource allocation 13
(4.6%)
46
(16.4%)
64
(22.8%)
48
(17.1%)
110
(39.1%) 3.70 1.267
14.M&E results improved the designs
and performance of literacy and
numeracy educational programme
13
(4.6%)
40
(14.2%)
70
(24.9%)
46
(16.4%)
112
(39.9%) 3.73 1.251
Project intervention
15.The intended participants for the
intervention were carefully identified and
possible settings to each participants in
the programme was done
23
(8.2%)
30
(10.7%)
60
(21.4%)
56
(19.9%)
112
(39.8%) 3.73 1.306
16. M&E activities for intervention were
developed and materials gathered
appropriately
28
(10.0%)
25
(8.9%)
46
(16.3%)
77
(27.4%)
105
(37.4%) 3.73 1.313
17.M&E resources for intervention were
clearly specified and located 20
(7.1%)
33
(11.7%)
39
(13.9%)
77
(27.4%)
112
(39.9%) 3.81 1.272
18.Progress for intervention activities
were well monitored and evaluated for
the success of the program 19
(6.8%)
30
(10.7%)
43
(15.3%)
70
(24.9%)
119
(42.3%) 3.85 1.264
Composite Mean and SD 3.74 1.198
As indicated in Table 4.32, the composite mean was 3.74 and the standard deviation 1.198 for
the study variable, implementing change.
In Table 4.32, the first statement that stakeholders counter-check the number of TANGERINE
reports transmitted for corrections and reliability. Results showed that 6(2.1%) strongly
disagreed, 31(11.0%) disagreed, 91(32.4%) were neutral, 62(22.1%) agreed and 91(32.4%)
strongly agreed. In overall, 36 (12.1%) disagreed and 153(54.5%) agreed. The line item mean
score was 3.72 and standard deviation of 1.198 which was slightly below the composite mean
3.74 and standard deviation of 1.198 implying that somehow counter checking of TARGERINE
reports to allow corrections and reliability before transmission did not have participation of all
the stakeholders. This means that it did not positively influence the performance of literacy and

208
numeracy educational programme. This may need to be corrected or relooked at in the future to
ensure data collected is not cooked for the purpose of satisfying the interests of the few
stakeholders at the expense of the beneficiary of the programme. A standard deviation of 1.097
was below the composite a 3.74 and standard deviation of 1.198 show that opinions converged.
The second statement that TANGARINE tool facilitated for accurate and adequate information
for literacy and numeracy programme, the findings showed that 7(2.5%) strongly disagreed,
30(10.6%) disagreed, 89(31.7%) remained neutral, 87(31.0%) agreed and 68(24.1%) strongly
agreed. In overall, 155(55.1%) of the respondents agreed with the statement as compared to
37(13.1%) who disagreed. This had a line item mean score of 3.70 and standard deviation of
1.093 which was below the composite mean of 3.74 and standard deviation of 1.198 implying
that the accuracy and adequacy of information was not facilitated by the TANGERINE tool. This
would mean that TANGERINE as a tool is not sufficiently utilized and therefore need for follow
up to ensure all the stakeholders get to understand the importance of such a tool in
implementation of the literacy and numeracy programme. A standard deviation of 1.093 against
1.198 indicated that respondents’ opinions were more consistent with one another.
Third, on the statement that TANGARINE tool helped in improving the implementing of the
project activities such as collecting data during class observations showed that 17(6.1%)
strongly disagreed, 20(7.1%) disagreed, 82(29.2%) were neutral, 74(26.3%) agreed and
88(31.3%) strongly agreed. The overall totals show that 162(57.6%) were in agreement and
55(19.6%) in disagreement. A line item of mean score of 3.70 and standard deviation of 1.161
was realized which fell below the composite mean of 3.74 and standard deviation of 1.198. This
means that TANGERINE tool did not help in improving the implementation of the project
activities such as collection of data during the classroom observation meaning that it had a
negative influence on the performance of literacy and numeracy educational programme. It
would be important if the tool would be redesigned for easy use and also more stakeholders
should be encouraged to use it. A lower standard deviation of 1.161 against the composite 1.198
was an indication that the views converged.

209
Fourth, on statement that information collected improved the process of involving the
stakeholders in transmitting more reliable reports, 15(5.3%) strongly disagreed, 32 (11.4%)
disagreed, 50(17.8%) were neutral, whereas 82(29.2%) agreed and 102(36.3%) strongly agreed.
Thus in overall, 184(65.5%) were in agreement and 47 (16.7%) who disagreed. A line item mean
score was obtained 3.80 and standard deviation of 1.200 which was higher than 3.74 and standard
deviation of 1.198. The results means that the line item influences the performance of literacy
and numeracy educational programme positively. A standard deviation of 1.200 was lower than
the composite 1.198 hence opinions were inconsistent.
Fifth, on statement that stakeholders reviewed data collected and made changes to the identified
gaps in the reports, 15(5.3%) strongly agreed, 22 (7.8%) disagreed, hence 47(16.7%) were in
disagreement. Neutral opinions totaled to 60(21.4%). Those who agreed were 94(35.5%) and
90(32.0%) strongly agreed, as a result, majority 184(67.5%) were in agreement. The line item
had a mean score 3.79 and standard deviation of 1.135 with composite mean of 3.74 and standard
deviation of 1.198 implying that data collected was reviewed by the stakeholders and changes
made to gaps identified in the reports. This had positive influence of performance of literacy and
numeracy of educational programme. It is also important to accord the stakeholder a second
chance to review the reports to ensure the information being disseminated is more reliable for
use across board. A standard deviation of 1.135 below the composite 1.198 implied that opinions
converged.
Sixth, statement that data collected from TARGERINE report was reviewed and analyzed,
6(2.1%) strongly disagreed, 33 (11.7%) disagreed. Thus in total, 39(13.8%) were in
disagreement. However 89(31.7%) were neutral, whereas 87(31.5%) agreed and 66(23.5%)
strongly agreed. It is evident that majority 153(55.0%) were in agreement. A line item mean
score of 3.62 and standard deviation of 1.036 was obtained which was lower than the composite
mean of 3.74 and standard deviation of 1.198, implying that reviewing and analysis done was
not appropriate and this could be as a result either weak skills or lack of proper facilitations
during workshops and seminar trainings. These two aspects must be checked and corrected to
ensure smooth implementation of the programme. A lower standard deviation of 1.036 against
1.198 confirmed that opinions converged.

210
Seventh, statement that number of transmitted reports led to improved results and the quality of
project intervention in literacy and numeracy educational program, 9(3.2%) strongly disagreed
3010.7%) disagreed, 90(32.0%) were neutral, 65(23.1%) agreed and 87(31.0%) strongly agreed.
In overall, majority of respondents 152(54.1%) agreed as opposed to 39 (13.9%) who disagreed.
A line item mean score of 3.68 and standard deviation of 1.117 was obtained. This was below
the composite mean of 3.74 standard deviation of 1.198 implying that number of transmitted
reports did not lead to improved results and the quality of project intervention in literacy and
numeracy educational program. This could mean the quality of reports might have been
compromised or reports were not delivered in time to deduce the best practices and make changes
where necessary hence the need to observe some of these procedures in the future for good
performance of the program. A lower standard deviation of 1.117 indicated that opinions were
consistent to this statement.
Eighth, statement of shared transmitted reports led to identifying area with large number of
participants and with less participants. Results showed that 19(6.8%) strongly disagreed,
20(7.1%) disagreed bringing to a total 39(13.9%) of those in disagreement. Another group of
50(17.8%) were neutral, while 85(30.2%) agreed and 107(38.1%) strongly agreed hence,
192(68.3%) were in agreement. A higher mean was subsequently obtained which was 3.86 and
standard deviation of 1.199 which was greater than the composite implying that the number of
participants, either large or small (small), were identified through the transmitted reports
meaning that it was influencing performance of literacy and numeracy educational programme
positively With standard deviation of 1.199 against 1.198 the composite, the opinions appeared
to have diverged.
Ninth, statement that reports approved the allocation of resources for the areas which needed
more personnel’s for supervising the literacy and numeracy educational program, 31(11.0%)
strongly disagreed, 8(2.8%) disagreed, 45(16.0%) were neutral, 90(32.1%) agreed and
107(38.1%) strongly agreed. In that case 197(70.2%) of the respondents were in agreement as
opposed to 39(13.9%) who disagreed. Obtained on this statement was a mean score of 3.83 and
standard deviation of 1.275 which was higher than the composite mean of 3.74 and standard
deviation of 1.198 implying that number of transmitted reports indeed led to improvement of

211
results and the quality of project intervention in the programme. This means the use of
TANGERINE tool is yielding results and should continuously be used in the program
implementation to the latter. A standard deviation of 1.275 was above the composite hence
opinions diverged.
Tenth, on monitoring and evaluation results were utilized in improving the projects’ activities
such as allocation of resources to facilitate class work, 7(2.5%) strongly disagreed, 35(12.5%)
disagreed with the same statement and added that project activities like class observations did
not facilitate the success of the program, in this case then it means that this responding group
differed with the statement. In total those who disagreed were 42(15.0%), 89(31.7%) were
neutral, 52(18.5%) agreed and 98(34.8%) strongly agreed. Hence, total of 150(53.8%) of the
respondents were in agreement as opposed 42 (15.0%) in disagreement. The statement had a
mean score of 3.71 and standard deviation of 1.143 which was lower than the composite mean
3.74 and standard deviation of 1.198 implying that Monitoring and Evaluation results were not
used in improving class activities such resource allocation. It also means that the line item
negatively influences performance of literacy and numeracy educational programme and is
there need to fully make use of any information gathered through M&E for it is part of
programme implementation and it can inform the best and reliable decision making process. A
lower standard deviation of 1.143 against 1.198 indicated that opinions lacked consistency.
Eleventh, on monitoring and evaluation results obtained from the program exercises were
disseminated for utilization by all the stakeholders in order to better the literacy and numeracy
educational program, 11(3.9%) strongly disagreed, 33 (11.7%) disagreed hence an aggregate
total of 44(15.6%) respondents disagreed. Neutral opinions were expressed by 80(28.5%). Those
who agreed were 80(28.5%) and 97(34.5%) strongly agreed thus resulting an overall of
192(70.2%) of the respondents who were in agreement. A mean score of 3.71 and standard
deviation of 1,143 which was the composite mean of 3.74 and standard deviation of 1.198 which
implied that Monitoring and Evaluation results developed from program’s activities were not
disseminated. It should be noted that missing to disseminate vital Monitoring and Evaluation
information developed from the program’s implementation exercises can influence the program

212
negatively. A standard deviation of 1.171 below the composite standard deviation of 1.171
indicated that opinions converged.
Twelfth, statement on M&E results improved the quality of programme intervention such as
literacy and numeracy skills, 10(3.6%) strongly disagreed, 43 (15.3%) disagreed. In total those
who disagreed were 53(18.9%). On the contrary, 71(25.3%) were neutral. Further the analysis
revealed that (17.4%) agreed and 108(38.4%) strongly agreed. This suggests that a total of
157(55.8%) respondents were in agreement. This had a line item mean score of 3.72 and standard
deviation of 1.233 below the composite mean of 3.74 and standard deviation of 1.198 hence
programme intervention were not improved by Monitoring and Evaluation results. The line item
influences performance of literacy and numeracy educational programme negatively. There is
still need, therefore, to train the stakeholders more on the importance of M&E results and part
of implementing the program to reap extra benefits and enhance performance of literacy and
numeracy program. A higher standard deviation of 1.223 against the composite mean of 1.198
meaning that opinions did not converge on this statement.
Thirteenth, statement that M&E results improved the use of financial and resource allocation
13(4.6%) strongly disagreed, 46 (16.4%) disagreed, making a total of 59(21.0%) in disagreement
while 64(22.8%) remained neutral. Also from the analysis, 48(17.1%) agreed and 110(39.1%)
strongly agreed. In that case 158(72.9%) were in agreement. This had a line item mean score of
3.70 and standard deviation of 1.267 which was lower than the composite mean of 3.74 and
standard deviation of 1.198 which implies that it influence the performance of literacy and
numeracy educational programme negatively and also results of monitoring and evaluation did
not improve the quality of programme intervention in literacy and numeracy skills and this could
have had a significant negative impact to both the implementers and the beneficiaries. With a
higher standard deviation of 1.267 against the composite mean of 1.198, it could be noted that
divergence was reported in the opinions.
Fourteenth, the study examined whether M&E results improved the curriculum designs and
performance of program. Analysis showed that 13(4.6%) strongly disagreed, 40 (14.2%)
disagreed making a total of 53(18.8%) who were in disagreement with the statement. Neutral

213
opinions were gathered from a group of 70(24.9%). Further, 46(16.4%) agreed and 112(39.9%)
strongly agreed with the statement making 158(56.3%) of the respondents were in agreement. A
mean score of 3.73 and standard deviation of 1.251 which was below the composite mean of
3.74 and standard deviation of 1.198. The line item influences performance of literacy and
numeracy educational programme negatively which implies that M&E results did not contribute
in improving the designs of the program. This would mean a lot still is pending in terms of
extracting the best practices from the M&E results. It also means M&E is still undervalued and
there is urgency for its institutionalization in the literacy and numeracy program. A standard
deviation of 1.251 which was above the composite score of 1.198 is indicative that opinions
diverged.
Fifteenth, the statement sought from the respondents whether identification of both intended
participants for the intervention program and proper settings for the program were well done.
The results showed 23(8.2%) agreed, 30(10.7%) disagreed, adding up to a sum total of
53(18.9%) of those in disagreement. Neutral opinions were collected from 60(21.4%), while
56(19.9%) agreed and 112(39.8%) strongly agreed resulting to an overall of 168(59.7%) of
respondents in agreement. The mean score of 3.73 and standard deviation of 1.306 slightly below
the composite mean of 3.74 and standard deviation of 1.198. The line item influences
performance of literacy and numeracy educational programme negatively implying that the
process of arriving at the intended participants for this intervention was wrongly done. Perhaps
in the future there would be need to carry out needs assessment to avoid similar anomalies. With
a higher standard deviation of 1.306 against 1,198 the opinions definitely did not converge.
Sixteenth, a statement on whether M&E activities for intervention were developed and if the
materials gathered were appropriate, 28(10.0%) strongly disagreed, 25(8.9%) disagreed, hence
53(18.9%) were in disagreement. Neutral pinions were received from 46(16.3%). However,
77(27.4%) agreed with the statement and 105(37.4%) strongly agreed resulting to a total of
182(64.8%) respondents in agreement. A line mean score 3.73 and standard deviation of 1.313
slightly below composite mean of 3.74 and standard deviation of 1.198 which implies that
Monitoring and Evaluation activities for intervention were not properly developed and the
materials gathered were not appropriate in the implementation of the program. This begs the

214
question whether stakeholders were genuinely involved and if so, if their full participation was
well sought or incorporated, hence need for improvement. A standard deviation of 1.313 was
way above the composite and standard deviation of 1.198 indicated that there were
inconsistencies opinions from the participants in the study.
On the seventeenth statement, that Monitoring and Evaluation resources for intervention were
clearly specified and located, revealed that 33 (11.7%) of the respondents disagreed, 53(18.8%)
strongly disagreed, 39(13.9%) were neutral, 77(27.4%) agreed and 112(39.9%) strongly agreed.
In overall 189(67.3%) were in agreement 53 (18.8%) in disagreement. A higher mean score of
3.81 and standard deviation of 1.272 which was higher than composite mean of 3.74 and standard
deviation of 1.198 which implies that the programme had been well planned with Monitoring
and Evaluation resources. Although resources may be located and even specified for Monitoring
and Evaluation work or activities, if the plan is not clearly outlining how these activities ought
to be conducted, then it remains a challenge and hence myriad issues may start arising that would
directly or indirectly affect implementation of the programme. A higher standard deviation of
1.272 against 1.198 indicative opinions diverged.
The last eighteenth statement, that progress for intervention activities were monitored and
evaluated for the success of the program. In this respect, 19(6.8%) strongly disagreed, 30(10.7%)
disagreed, hence a total of 49(17.5%) were in disagreement. Those who were neutral totaled to
43(15.3%). Further, 70(24.9%) agreed while 119(42.3%) strongly agreed resulting to a total of
189(67.2%) respondents in agreement. This had mean score of 3.85 and standard deviation of
1.264, this would imply that progress for intervention activities was well monitored and
evaluated for the success of the program hence a positive influence on the performance of literacy
and numeracy educational programme. It was however noted that opinions diverged given a
higher standard of 1.264 against the composite of 1.198 on this statement.
Results of interviews with key informants showed that implementing change for Monitoring and
Evaluation influenced performance of literacy and numeracy educational programme. The
results of the interviews were, therefore, consistent with the quantitative data. The following are
key responses obtained from the key informants:

215
“Since the implementing programme started there was great change
and tremendous improvement on literacy and numeracy educational
programme although, there a few challenges here and there on the
implementation process. Leaners are able to read and calculate
simple arithmetic.” Statements from West lands sub-count.(
CSO,2018)
Results of interviews with RTI officers indicated that the overall implementing change had a
great influence on performance of literacy and numeracy educational programme. That is the
results of interviews were consistent with quantitative data. The information below was from the
key informant from RTI International Officers:
Teachers’ competency is key in teaching literacy and numeracy
skills in grade one to three grades. Teachers need to adapt the
new methodology and embrace using the new teachers’ guides
formulated by the TUSOME organization for better yields.
Learners needs to be encouraged to learn on their own especially
the homework activities in their workbooks so as to sharpen their
learning skills. Frequent supervision by the ministry officials is
highly recommended to check if what has been changed is being
implemented well in the classroom. (RTI, 2018)
4.10.1 Inferential Analysis of Implementing Change and Performance of Literacy and
Numeracy Educational Programme
The inferential analysis was performed by use of correlation and regression to show the
relationship, strength and direction of independent and dependent variables. It was based on the
third objective to examine how implementing change influence performance of literacy and
numeracy educational programme in public primary schools in Nairobi County, Kenya.
The variable implementing change was operationalized using the following indicators reviewing
collected data, number of transmitted reports, utilization of M&E results and project intervention
. Performance of literacy and numeracy indicators were: Reading skills, Simple arithmetic
calculations skills, Letter recognition, beneficiary Satisfaction, proficiency skills in listening of
literacy and numeracy skills, proficiency skills in speaking of literacy and numeracy skills,
proficiency skills and writing, Timely Acquisition of literacy and numeracy skills, transition rate
improved and class average performance improved.

216
4.10.2 Correlation analysis of Implementing Change for Monitoring and Evaluation and
Performance of Literacy and Numeracy Educational Programme
The relationship between implementing change for M&E and performance of literacy, and
numeracy educational program was determined by Pearson Correlation coefficient. According
to the analysis, +1 signaled a positive perfect correlation, 0.001 – 0.250 a weak correlation, 0.251
– 0.500 semi but strong correlation, 0.501 – 0.750 strong correlation and lastly 0.751 – 1.000
very strong correlation. Table 4.33 summarizes the results.
Table 4.33
Correlation analysis of Implementing Change and Performance of Literacy and
Numeracy Educational Programme
Variables Performance Implementing
Change
Performance of
literacy and numeracy
educational
programme
Pearson Correlation 1 0.581**
Sig. (2-tailed) 0.000
n 281 281
Implementing Change
Pearson Correlation 0.581** 1
Sig. (2-tailed) 0.000
n 281 281 **. Correlation is significant at the 0.05 level (2-tailed).
In Table 4.33, the output results show that implementing change has a strong positive
relationship with performance of literacy and numeracy educational programme in public
primary schools in Nairobi County, Kenya. (P-value0.000<0.05). Given a Pearson correlation
of(r= 0.581), a strong positive relationship emerged between implementing change and
performance of literacy and numeracy educational programme.
4.10.3 Regression Analysis for Implementing Change and Performance of Literacy and
Numeracy Educational Programme
The following hypothesis was tested linear regression was used to test the hypothesis to satisfy
the requirements for the fifth objective of the study.

217
4.10.4 Test of Hypothesis 5
A linear regression was used to test the hypothesis to satisfy the requirements for the fifth
objective of the study:
H0 Implementing change has no significant influence on performance of literacy and
numeracy educational programs in public primary schools in Nairobi County, Kenya.
H1 Implementing change has significant influence on performance of literacy and numeracy
educational programme in public primary schools in Nairobi County, Kenya
The null hypothesis was tested using the below linear regression model:
y = a + β5X5+e
Where:
y - Performance of literacy and numeracy educational programme
X5 - Implementing change
a - Regression constant
𝜀 - Error term
The results are shown in Table 4.34 and Table 4.35
Table 4.34
ANOVA for implementing change and performance of literacy and numeracy
educational programme
Model Sum of
Squares
df Mean
Square
F Sig.
1
Regression 69.905 1 69.905 142.010 0.000b
Residual 137.340 279 0.492
Total 207.245 280
a. Dependent Variable: Performance
b. Predictors: (Constant), Implementing Change
The overall F-statistic is 142.010 with a p-value of 0.000<0.05 which implies that there was a
statistically significant relationship between implementing change and performance of literacy
and numeracy educational programme. The calculated critical value was 3.875 less than the F
value of 142.010 thus the model was fit.

218
Table 4.35
Model Summary for Implementing Change and Performance of Literacy and Numeracy
Educational Programme
Model R R Square Adjusted R Square Std. Error of the Estimate
1 0.581a 0.337 0.335 0.70161
a. Predictors: (Constant), Implementing Change
From Table 4.35, the coefficient of correlation (R) was 0.581 which implied a weak positive
correlation between implementing change and performance of literacy and numeracy educational
programme. The R-squared was 0.337, meaning that 33.7% of the variation in performance of
literacy and numeracy educational programme was explained by variation in implementing
change. The remaining 66.3% variation in performance of literacy and numeracy educational
programme was as a result of other factors not included in the model.
Table 4.36
Model Coefficients for Implementing Change and Performance of Literacy and
Numeracy Educational Programme
Model Unstandardized
Coefficients
Standardized
Coefficients
t Sig.
B Std. Error Beta
1 (Constant) -0.151 0.042 -3.576 0.000
Implementing Change 0.445 0.038 0.581 11.917 0.000
Model: (β=0.445, t=11.917, p=0.000<0.05)
Predictor Variable: Implementing Change
Dependent Variable: Performance of Literacy and Numeracy Educational Programme
The results in Table 4.36 indicate that implementing change has statistically significant influence
on performance of literacy and numeracy educational programme (β=0.445, t=11.917,
p=0.000<0.05). Using the statistical findings, the regression model was to be substituted as
follows:
Y=β0 + β5X5 + ɛ
y = -0.151+0.445X5 + 0.038
Where:
y - Performance of literacy and numeracy educational program
X5 - Implementing change

219
From Table 4.36 the results were that, a positive beta coefficient for implementing change is
0.445 indicating a direct relationship exists in this model. Probability of t-statistic is 11.917 for β
coefficient has less value to significance level which is 0.05. The findings led to the rejection of
the null hypothesis and hence concluded that implementing change has significant influence on
performance of literacy and numeracy educational programme.
The current study findings from deceptive analysis of the variable outcome found out that even
if improvement of literacy and numeracy learning skills has improved (statement on the sixth
line has a mean of 3.62 against 3.74 the composite mean), checking of TARGERINE reports to
allow corrections and reliability before transmission did not have participation of all the
stakeholders. This means that involvement of stakeholders was limited hence low performance
of educational programme. This may need to be corrected or relooked at in the future to ensure
data collected is not cooked for the purpose of satisfying the interests of the few stakeholders at
the expense of the beneficiary of the programme and changes must be incorporated as advised
by the implementing team of the programme. Number of transmitted reports led to improved
results and the quality of project intervention in literacy and numeracy skills, however the line
item mean of 3.68 against 3.74 the composite mean meaning that the quality of reports might
have been compromised or delivered late hence deducing the best practices of timely reports.
The findings support the study by Piper, Destefano, Kinyanjui and Ong’ele (2018) who
examined the impact on learning cost-effectiveness of training and the use of new materials
provided meaning change of teaching strategies was implemented. This was to be realized
through regularly monitoring teacher adoption of the practices and pupils results. Nzweke et al,
(2015) determined that there was significant relationship between implementing change and
performance of literacy and numeracy educational programme also in agreement were Ouko
(2015), Nthenge (2014), and Muriungi (2015) arrived at similar conclusions but advised that
more supervision needs to be followed, there was improvement in the way things were done in
teaching methodology which has brought some improvement although teacher –pupil ratio is
alarming. The current study is for the opinion that even though there was improvement in reading
and numeracy skills, still a lot needs to be done especially in classroom teaching. Teachers needs
to be monitored frequently in order to acquire enough information on how teachers are using the
new teachers guide mode of subject delivery since the performance is still low. Implementing

220
change was found to significantly influence performance of literacy and numeracy educational
programme.
The current study established that for change to occur in a desired manner teachers need to be
supported through frequent coaching in specific instruction techniques and how to use the new
instruction materials. The study found out that there is need to define education systems that
should swift away from bureaucratic administration and focus on conducting rapid cycles of
planning, communicating expectations, monitoring and accountability and agreeing meeting
those expectations while intervening to assist learners and schools which are struggling and need
support Crouch and DesStefano, (2017). The intervening project TUSOME used the findings
from piloted programme to scale up through the government systems but since education sector
is the largest social sector did not decentralize financial controls making it hard and complex to
implement change on educational programme that attempt to work at scale Bold et al (2013).
Therefore learning of literacy skills remains at the hands of the national government to foresee
what is better and especially now with the implementation of Curriculum based education.
4.11 Combined Participatory Monitoring and Evaluation Process and Performance of
Literacy and Numeracy Educational Programme
Descriptive and correlation analysis of the combined Participatory Monitoring and Evaluation
Process and Performance of Literacy and Numeracy Educational Programme.
The study sought to determine the influence of combined PM&E process on performance of
literacy and numeracy educational programme. The dimensions of participatory Monitoring and
Evaluation process investigated were: stakeholder engagement; stakeholder capacity building;
data collection; data management and implementing change. Correlation and inferential analyses
were done to determine the influence of combined participatory Monitoring and Evaluation
process on performance of literacy and numeracy educational programme. The composite means
for the independent and dependent variables were presented in Table 4.37.

221
Table 4.37
Combined Participatory Monitoring and Evaluation Process and Performance of
Literacy and Numeracy Educational Programme
Variable n Mean Std.
Deviation
Stakeholder engagement 281 3.59 1.102
Stakeholder capacity building 281 3.77 1.033
Data collection 281 3.69 1.015
Data management 281 3.62 1.098
Implementing change 281 3.74 1.198
Composite Mean and Standard Deviation 3.68 1.089
In Table 4.37., the highest composite mean score was on the stakeholder capacity building with
a score of 3.77; followed by implementing change, with mean score 3.74; data collection with
mean score of 3.69; and data management, with a mean score of 3.62 and finally, stakeholder
engagement. The composite mean score for dependent variable (performance of literacy and
numeracy educational programme) was 3.56. Consistent scores were on data management, with
least standard deviation which was 1.015.
The influence of the combined variable of participatory Monitoring and Evaluation process and
performance of literacy and numeracy educational programme was established by computing the
composite mean. Meaning that overall PM&E process was 3.68 and standard deviation of 1.089
whereby the most consistent scores were on stakeholder capacity building with a mean of 3.77
and SD of 1.033 against the composite mean of 3.66 and SD of 1.073. The second variable was
implementing change with a mean of 3.74 and SD of 1.198 against overall composite men of
3.66 and SD of 1.073. The third was data collection with a mean of 3.69 and SD of 1.015 against
the composite mean of 3.66 and SD of 1.073. The fourth was data management with a mean of
3.62 and SD of 1.098 against the composite mean of 3.66 and SD of 1.073.lastly, stakeholder
engagement had a mean of 3.59 and SD of 1.102 against the composite mean of 3.66 and SD of
1.073 There is need for combined effort on participatory Monitoring and Evaluation process
which has five steps in this study and every step in teaching has a significant influence on
performance of literacy and numeracy skills. Therefore there is need for more participation and
involvement of all stakeholders in teaching fraternity and mostly on lower grades which are
normally neglected.

222
The results of the interviews with Curriculum support officers indicated that the overall on
Participatory Monitoring and Evaluation Process influence the performance of literacy and
numeracy educational programme at a great extent. The following were the key responses of the
officers:
“Engaging all the stakeholders in a programme is very vital but if all are not
involved a gap is experienced hence low performance of the learning skills in
these subjects. Teachers being the main implementers of the programme
should be involved in all the phase of the progamme so as to yield better
results in literacy and numeracy learning skills”.(CSO.2018)
Results of the interviews from the RTI International officers indicated that the overall
Participatory Monitoring and Evaluation Process influence the performance of literacy and
numeracy educational programme at a great extent
“Learning skills in literacy and numeracy should be able to mitigate
the issues in lower grades for not being able to read, write or
comprehend what they have learnt. Stakeholder capacity building is
very important in improving the performance of literacy and numeracy
learning skills since training sharpens and adds knowledge to the
concerned clients. All the combined variables are beneficial to
learning and should be factored when formulating education policies
and curriculum development”. (RTI, 2018)
4.11.1 Inferential Analysis of Combined Participatory Monitoring and Evaluation
Process, and Performance of Literacy and Numeracy Educational Programme
The inferential analysis was performed by use of correlation and regression so as to show the
relationship, strength and direction of independent and dependent variables. It was based on the
sixth objective of how does combined participatory monitoring and evaluation process influence
performance of literacy and numeracy educational programme in public primary schools in
Nairobi County, Kenya? The combined variable was operationalized using the following
indicators stakeholder engagement; stakeholder capacity building; data collection; data
management and implementing change while Performance of literacy and numeracy indicators
were: Reading skills, Simple arithmetic calculations skills, Letter recognition, beneficiary

223
Satisfaction, proficiency skills in listening of literacy and numeracy skills, proficiency skills in
speaking of literacy and numeracy skills, proficiency skills and writing, Timely Acquisition of
literacy and numeracy skills, transition rate improved and class average performance improved.
4.11.2 Correlation Analysis for Combined Participatory Monitoring and Evaluation
Process and Performance of Literacy and Numeracy Educational Programme
The relationship between combined participatory M&E process and performance of literacy and
numeracy educational programme was determined by Pearson Correlation coefficient. Table
4.38 shows the results. The analysis was based on sixth objective of the study to sought how
does combined PM&E process influence performance of L&N educational programme
Table 4.38: Correlation matrix of Combined Participatory Monitoring and Evaluation
Process and Performance of Literacy and Numeracy Educational Programme
**. Correlation is significant at the 0.05 level (2-tailed).
The results of the correlation matrix in Table 4.38 show that all the dimensions of participatory
Monitoring and Evaluation process combined had statistically significant and strong positive
relationship with performance of literacy and numeracy educational programme ( R=0.754,
p<0.05). This means that combined PM&E process had statistically significant and strong
positive relationship with performance of literacy and numeracy educational programme. This
is so because stakeholder engagement, stakeholder capacity building and data collection had
p<0.05 and a strong positive correlation with performance of L&N educational programme
(R=0.693, R=0.675 and R=0.660 respectively).While data management and implementing
change had moderate correlation with performance of L&N educational programme (R=0.581
and R=0.536, respectively).
Variable Combined
PM&E
Process
Stakeholder
engagement
Stakeholders
capacity
building
Data
collection
Data
management
Implementing
Change
Performance
of literacy
and numeracy
educational
programme
Pearson
Correlation
0.754
0.693* 0.675** 0.660* 0.536** 0.581**
Sig. (2-tailed) 0.000 0.000 0.000 0.000 0.000 0.000
n 281 281 281 281 281 281

224
4.11.3 Regression Analysis for Combined Participatory Monitoring and Evaluation
Process, and Performance of Literacy and Numeracy Educational Programme
The following hypothesis were tested using multiple regression model to satisfy the requirements
of the sixth objective.
4.11.4 Test of Hypothesis 6
H0: Combined participatory monitoring and evaluation process has no significant influence
performance of literacy and numeracy educational programme in public primary schools
in Nairobi County, Kenya.
H1: Combined participatory monitoring and evaluation process significantly influence
performance of literacy and numeracy educational programme in public primary schools
in Nairobi County, Kenya.
The null hypothesis was tested using the following multiple regression model:
y=a+ 𝛽1X1+ 𝛽2X2+ 𝛽3X3+ 𝛽 4X4+ 𝛽5X5+e
Where:
Y - Performance of literacy and numeracy educational programme
X1 - Stakeholder engagement
X2 - Stakeholder capacity building
X3 - Data collection
X4 - Data management
X5 - Implementing change
a - Regression constant
𝜀 - error term
From the combined model analysis, all the variables that is stakeholder engagement, stakeholder
capacity building, data collection, data management and implementing change are significantly
at 5%, which influences performance of literacy and numeracy educational programme as
described by R2 = 0.568 which is 56.8%. The results were as shown in the Table 4.39 and 4.40:

225
Table 4.39
ANOVA for Combined Participatory M&E Process and Performance of Literacy and
Numeracy Programme
Model
Sum of
Squares df
Mean
Square F Sig.
1 Regression 117.812 5 23.562 72.453 0.000b
Residual 89.433 275 0.325
Total 207.245 280
a. Dependent Variable: Performance
b. Predictors: (Constant), Implementing Change, Stakeholder engagement, Stakeholders
capacity building, Data collection, Data management
From Table 4.39, the calculated critical value of this model was 2.247 less than the F value of
72.453 implying that the model goodness of fit was met. So the model was considered
significant.
Table 4.40:
Model Summary for Combined Participatory M&E Process and Performance of Literacy
and Numeracy Programme
Model R R Square Adjusted R
Square
Std. Error of the
Estimate
1 0.754a 0.568 0.561 0.57027
a. Predictors: (Constant), , Stakeholder engagement, Stakeholders capacity building, Data
collection, Data management and Implementing Change
b. Dependent Variable. performance of literacy and numeracy educational programme
From Table 4.40, the coefficient of correlation (R) was 0.754 which implied a strong positive
correlation between combined participatory Monitoring and evaluation process and performance
of literacy and numeracy educational program. The adjusted R-squared was 0.568, meaning that
56.8% of the variation in performance of literacy and numeracy educational programme was
explained by variation in combined participatory Monitoring and evaluation process. The
remaining 43.2% variation in performance of literacy and numeracy educational programme was
as a result of other factors not included in the model.
4.12 Correlation Analysis for Combined Participatory Monitoring and Evaluation
Process and Performance of Literacy and Numeracy Educational Programme
The relationship between combined participatory M&E process and performance of literacy and
numeracy educational programme was determined by Pearson Correlation coefficient. Table
4.41 shows the results.

226
Table 4.41
Model Coefficients Combined Participatory M&E Process and Performance of Literacy
and Numeracy Programme
Model Unstandardized
Coefficients
Standardized
Coefficients
t Sig.
B Std. Error Beta
(Constant) -0.154 0.034 -4.477 0.000
Stakeholder engagement 0.215 0.050 0.238 4.326 0.000
Stakeholders capacity
building
0.212 0.049 0.174 4.367 0.000
Data collection 0.175 0.051 0.198 3.368 0.001
Data management 0.127 0.054 0.179 2.526 0.019
Implementing Change 0.123 0.049 0.099 2.540 0.012
a. Dependent Variable: Performance of literacy and numeracy educational programme
The results in Table 4.41 indicate that combined participatory Monitoring and Evaluation
process has statistically significant influence on performance of literacy and numeracy
educational programme since all the component dimensions were statistically significant at 5%
level of significance.
The Table 4.41 shows that the beta (β) coefficients for the indicators were as follows: stakeholder
engagement, 0.238; stakeholder capacity building, 0.174; data collection, 0.198; data
management, 0.179; and implementing change, 0.099. These values indicate that a unit increase
in performance of literacy and numeracy educational programme corresponded to 23.8%
increase in stakeholder engagement: 17.4% increase in stakeholder capacity building; 19.8%
increase in data collection; 17.9% increase in data management and 9.9% increase in
implementing change. The null hypothesis (H0) which was stated that the combined participatory
Monitoring and Evaluation process does not significantly influence performance of literacy and
numeracy educational programme was rejected since all the P-Values were less than 0.05.
Therefore an alternate hypothesis (Ha) stated combined participatory Monitoring and Evaluation
process significantly influence performance of literacy and numeracy educational programme
was accepted.
Using the statistical findings, the regression model can be substituted as follows:
Y=𝛽0+ 𝛽1XI + 𝛽2X2 + 𝛽3X3 + 𝛽4X4 + 𝛽5X5 + ɛ;
y=-0.154+0.238X1+0.174X2+0.198X3+0.179X4+0.099X5 + e

227
Where:
y - Performance of literacy and numeracy educational programme
X1 - Stakeholder engagement
X2 - Stakeholder Capacity building
X3 - Data collection
X4 - Data Management
X5- Implementing change
b - Regression coefficient
𝜀 - error term
Based on current study findings null hypothesis was rejected and concluded that combined
participatory monitoring and evaluation process has a strong positive significant relationship
with performance of literacy and numeracy educational programme in public primary schools in
Nairobi County, Kenya. The findings support (Piper and Zuilkowski 2015) who pointed out that
fully participation of teachers could lead to increased learning outcome if only the existing
infrastructure can support new learning materials. However the current study differ with (Piper
et al 2017) on the expansion and accountability of participation and monitoring of the programme
since implementation of the programme still requires a lot of improvement on the side of teacher
supervision, resource allocation, curriculum support officers and sub county directors
accountability on data uploading which was not consistent and meeting expectations of the
programme.
The findings of this study were compared to other prior empirical studies. Studies by Ouko
(2018); Phiri (2015); Nzweke, et al (2015), and Njuguna (2016) differed on combined
participatory M&E process and the influence it had on performance of literacy and numeracy
educational programme. Hypothesis six was, therefore, supported by data since combined
participatory Monitoring and evaluation process was found to have strong positive statistic
significant relationship with performance of literacy and numeracy educational programme. The
current study has demonstrated that assessing teachers is important to improve the model of
assessment at arriving at the right competent teacher for future performance of L&N learning
skills but this component is missing in teacher training capacities. This study resonate with the

228
findings of Piper, Zuilkowski, Dubeck, Jepkemei and King, (2018) posited that literacy and
numeracy programme are not designed to evaluate which intervention ingredient is most
essential to improve literacy and numeracy outcomes thus a gap in competency in delivering the
content. So it in this line the policy makers lack evidence on whether the teacher professional
development, instructional materials, learner materials, community support and use of
technology are required to enhance programme performance and full participatory monitoring
and evaluation process.
4.13 Moderating Influence of School Environment on the relationship between
Participatory Monitoring and Evaluation Process and Performance of Literacy
and Numeracy Educational Programme
This section presents descriptive and correlation analysis of school environment as a moderator
on the independent and dependent variable
The study sought to determine the moderating influence of school environment on the
relationship between participatory Monitoring and evaluation process and performance of
literacy and numeracy educational programme. The views of the respondents were assessed and
measured using a 5-point likert-scale whereby: Strongly disagree (SD)=1, Disagree (D)=2,
Neutral(N)=3, Agree (A)=4 and Strongly Agree (SA)=5. Line mean and standard deviation of
each of the opinions was compared with the respective composite scores for both interpretation
and conclusion purposes. The results are presented in Table 4.42.

229
Table 4.42
Moderating Influence of School environment on the relationship between Participatory
Monitoring and Evaluation Process and Performance of Literacy and Numeracy
Educational Programme
Statements
SD
F
(%)
D
F
(%)
N
F
(%)
A
F
(%)
SA
F
(%) Mean
Std.
Deviation
School infrastructure
1.We have enough infrastructure to
support the programme
23
(8.2%)
103
(36.7%)
56
(19.9%)
84
(29.9%)
15
(5.3%) 2.88 1.093
2.We are supplied with enough
stationeries such as pencils, exercise
books, text books rubbers and
sharpeners to facilities our teaching
in class
21
(7.5%)
99
(35.2%)
58
(20.6%)
83
(29.5%)
20
(7.2%) 2.94 1.110
3.We have enough playgrounds in
our schools to support the
programme
26
(9.3%)
100
(35.6%)
52
(18.5%)
80
(28.5%)
23
(8.1%)
2.91
1.155
4.The security in schools is adequate
to facilitate smooth learning
27
(9.6%)
89
(31.7%)
60
(21.4%)
80
(28.5%)
25
(8.8%) 2.95 1.159
5.The available infrastructure is
properly maintained and kept in
good condition to support
programme
26
(9.3%)
85
(30.2%)
65
(23.1%)
75
(26.7%)
30
(10.7%) 2.99 1.171
Teacher-pupil ratio 6.The teacher-pupil ratio in our
schools is as recommended by the
7.Ministry of Education
77
(27.4%)
60
(21.4%)
69
(24.6%)
63
(22.4%)
12
(4.2%) 2.55 1.227
The number of classrooms are
adequate for all learners
80
(28.5%)
77
(27.4%)
40
(14.2%)
63
(22.4%)
21
(7.5%) 2.53 1.312
8.The resources allocated for
teaching are adequate both for the
learners and the teacher
87
(31.1%)
42
(15.0%)
67
(23.9%)
60
(21.4%)
25
(8.6%) 2.61 1.345
School leadership 9.I believe our school has supportive
leadership
61
(21.7%)
104
(37.0%)
53
(18.9%)
18
(6.4%)
45
(16.0%) 2.58 1.332
10.Our schools administrative
frequently observe teachers teaching
in the classrooms
65
(23.1%)
100
(35.6%)
43
(15.3%)
30
(10.7%)
43
(15.3%) 2.59 1.357
11.There is common planning time,
peer observation and focused cross-
grade meetings in schools to
improve the program
50
(17.8%)
110
(39.1%)
43
(15.3%)
28
(10.0%)
50
(17.8%) 2.71 1.355
12.The school leaders motivate both
teachers and learners for the success
of the projects
52
(18.5%)
110
(39.1%)
41
(14.6%)
30
(10.7%)
48
(17.1%) 2.69 1.353
13.School culture and ethical
leaderships facilities school
improvements and allows teachers,
parents and learners to trust the
school environment
60
(21.4%)
120
(42.7%)
40
(14.2%)
40
(14.2%)
21
(7.5%) 2.44 1.188
Composite mean and SD 2.72 1.258
Table 4.42 the composite mean was 2.72 and the standard deviation 1.258 for the study
moderating variable, school environment.

230
From Table 4.42, on the first statement, opinions were sought from the respondents whether
schools had adequate infrastructure whereby 23(8.2%) strongly disagreed, 103(36.7%)
disagreed, 56(19.9%) remained neutral. Similarly, 84(29.9%) agreed and 15(5.3%) strongly
agreed. In overall, majority of the respondents 126(44.8%) disagreed as opposed to 99(35.2%)
who agreed, and 56(19.9%) held neutral opinions. A mean score of 2.88 and standard deviation
of 1.093 above the composite mean of 2.72 and standard deviation of 1.258 indicated that
adequate infrastructure was available in the schools to support the programme. Opinions
converged since the line standard deviation of 1.093 was below the composite mean of 1.258.
The implication of the line item is many respondents agreed that the infrastructure was enough
to support the programme hence improvement was experienced though not to satisfaction
according to the beneficiaries’ expectations.
On the second statement, we are supplied with enough stationery as pencils, exercise books,
textbooks, rubbers and sharpeners were provided to facilitate teaching in class. The results
pointed out that 21(7.5%) strongly disagreed, 99(35.2%) disagreed, 58(20.6%) remained neutral,
83(29.5%) agreed and 20(7.2%) strongly agreed. In overall, 120(42.3%) of the respondents
disagreed and 103(36.7%) agreed. A mean score of 2.94 and standard deviation of 1.110 was
high and above composite mean of 2.72 and standard deviation of 1.258 concluded that enough
stationery was provided to support learning. However, there is need to keep constant supply of
these stationery to avoid stagnation of programme. A standard deviation of 1.110 suggested
convergence of opinions. The implication of the findings is that there might be enough materials
in the classrooms but how they are distributed to the learners and how they are used as
demonstrated by the teacher matters a lot. Proper guidance is required so as to help the learners
use the materials appropriately.
The third statement we have enough playgrounds in schools to support the programme. The
responses gathered showed that 26(9.3%) strongly disagreed, 100(35.6%) disagreed, 52(18.5%)
were neutral, 80(28.5%) agreed and 23(8.1%) strongly agreed. In overall, 126(44.9%) of the
respondents disagreed and 103(36.7%) agreed. A mean score of 2.91 surpassed the composite
mean of 2.72 implying that enough playing grounds were available to fully support the
programme. The role of the playing grounds is to give the children time to refresh their brains

231
after learning to ensure absorption levels are increased. A playground in school is very important
because it helps learners explore their talents which is also equivalent to other learning subjects.
Most schools in Nairobi County have play grounds though not adequate enough for all the leaners
to use at the same time. In some schools like Olympic Primary School which has the highest
population in the Country among public primary schools children have alternate time tables to
go for play, meaning that even if the playgrounds are their they are not sufficient enough for the
leaners. A standard deviation of 1.155 tended to be lower than 1.258 the composite mean
implying that opinions converged.
Fourthly, the statement the security in schools is adequate to facilitate smooth learning. Result
showed that 27(9.6%) strongly disagreed, 89 (28.5%) disagreed, 60(21.4%) were neutral,
80(28.5%) agreed and 25(8.8%) strongly agreed. In overall, 116(38.1%) disagreed and
105(37.3%) agreed. The line item had a mean score of 2.95 and standard deviation of 1.159
which was above the overall composite mean of 2.72 and standard deviation of 1.258. This
implied that security was adequate in schools and pupils were safe from any danger within the
school compound. However there is need to mobilize resources to maintain the security and
safety of children among themselves in the absences of teachers and on their way home. A lower
standard deviation of 1.159 meant opinions converged.
The fifth statement examined whether the available infrastructure was properly maintained and
exist in good condition. The results showed that 26(9.3%) of respondents who participated in the
study strongly disagreed, 85(30.2%) disagreed, 65(23.1%) were neutral, 75(26.7%) agreed and
30(10.7%) strongly agreed. In overall, 111(30.2%) disagreed 105(37.4%) agreed. The mean
score of 2.99 and standard deviation of 1.171 was rather high implying that infrastructure was
properly maintained. Moreover, a standard deviation of 1.171 was below the composite hence
opinions converged.
The sixth statement examined whether teacher to pupil ratio was observed in schools as
recommended by the Ministry of Education. Results showed that 77(27.4%) strongly disagreed,
60(21.4%) disagreed, 69(24.6%) were neutral, 63(22.4%) agreed and 12(4.2%) strongly agreed.
In overall, 137(48.8%) disagreed while 75(26.6%) agreed. The line item had a mean score of

232
2.95 and standard deviation of 1.159 compared to composite mean of 2.27 and standard deviation
of 1.258 which was lower meaning the opinions converged. A standard deviation of 1.227 was
below the composite of 1.258 suggesting that opinions from this statement were convergent. The
implication is that many schools might have enough classrooms but the number of leaners per
class might be very high for any teacher to manage it well hence low concentration of learners
and finally low performance in literacy and numeracy skills. The learning environment is
seriously compromised when learners are congested for example a teacher handling 100 pupils
in a class, a report from the Nairobi County director’s office.
The seventh statement that number of the classrooms available was adequate for all learners. The
results were that 80(28.5%) strongly disagreed, 77 (27.4%) disagreed, 40(14.2%) were neutral,
63(22.4%) agreed and 21(7.5%) strongly agreed. In overall, 157(55.9%) disagreed and
84(29.9%) agreed. This statement had a lower mean score of 2.53 and standard deviation of
1.312 implying that the number of classrooms were not adequate. This is true since most of
public primary schools are still underdeveloped to support the overwhelming numbers of
enrollment and hence this could have adverse effects on the implementation the program. A
standard deviation for this item was recorded as 1.312 against 2.72 which indicated that the
opinions were highly inconsistent.
On the eighth statement, that resources allocated to for teaching are adequate for both the learners
and the teachers. The findings revealed that 87(31.8%) strongly disagreed, 42(15.0%) disagreed,
67(23.9%) were neutral, 60(21.4%) agreed and 25(8.6%) strongly agreed. In general,
157(55.9%) disagreed and 84(29.9%) agreed. A mean score of 2.61 suggested that resource
allocation for teachers and pupils were still inadequate. However, the PTA could come up with
resource mobilization strategies that would help schools rise against this kind of challenge to
ensure learning is well supported and does not hinder access by all learners. Obtained was a
standard deviation of 1.345 which was higher than the composite 1.258 meaning that opinions
diverged.
The ninth statement I believe our schools has supportive leadership. In this respect, 61(21.7%)
strongly disagreed, 104 (37.0%) disagreed, 53(18.9%) were neutral, 18(6.4%) agreed and

233
45(16.0%) strongly agreed. Generally, 165(58.7%) were in disagreement while 71(22.4%) were
in agreement. A lower mean score of 2.58 implied that the leadership in schools was not
supportive. Lack of supportive leadership is likely to lead to lack of morale among the teaching
staff and eventually that would cascade to poor delivery of the program hence poor results. Poor
leadership or lack leaders all altogether would be addressed through short courses in
management and leadership and through regular conversation among the stakeholders. The line
item had a mean score of 2.58 and standard deviation of 1.332, which was lower than the
composite mean of 2.72 and standard deviation of 1.258, thus, opinions did not converge
meaning it influences performance of literacy and numeracy educational programme negatively.
The implication here is that proper leadership must be exercised in all the institutions so as to
manage any challenges experienced while teaching process is taking place.
Tenth statement that our schools administration frequently observed the teachers teaching in the
classroom. Opinions received showed that 65(23.1%) strongly disagreed, 100 (35.6%) disagreed,
43(15.3%) were neutral, 30(10.7%) agreed and 43(15.3%) strongly agreed. Opinions were
further summed as; 165(58.7%) in disagreement and 73(30.6%) in agreement. The line item had
recorded a lower mean score of 2.59 and a standard deviation of 1.357 compared to the composite
mean of 2.72. The statement recorded a lower mean score of 2.59 and standard deviation of 1.357
compared to a composite mean of 2.27 and standard deviation of 1.258 implying that teachers
were not frequently observed while teaching in the classrooms. As part of assessment and
effective way to oversee implementation of the programme, there is need to have teachers
observed to ensure the curriculum is carried out accordingly. This did not happen simply because
there is shortage of field officers from the ministry and delocalization of most experienced
teachers were transferred to other counties hence making supervision in Nairobi County a
problem.
On the eleventh statements there was common planning time, peer observation and focused
cross-grade meetings in schools to improve the performance of the program. The results recorded
showed that 50(17.8%) strongly disagreed, 110 (39.1%) disagreed, 43(15.3%) remained neutral,
28(10.0%) agreed and 50(17.8%) strongly agreed. The general output was that 165(58.7%) were
in disagreement while 73(30.6%) were in agreement. Generated was 2.71 mean score against the
234
composite of 2.72 which implied that common planning and aspects of peer observation were
missing. Thus, peer observation should be encouraged for it is easy and not reprimanding. A
higher standard deviation of 1.355 clearly demonstrated that opinions did not converge. Common
planning and observation should be encouraged in order to achieve the required desired results
in literacy and numeracy skills.
On the twelfth statement that the school leaders motivate both teachers and learners for the
success of the programme. Analysis revealed that 52(18.5%) strongly disagreed, 110 (39.1%)
disagreed, 41(14.6%) were neutral while 30(10.7%) agreed and 48(17.1%) strongly agreed.
Thus, 162(57.6%) were in disagreement and 78(25.3%) in agreement. The line item had a lower
mean score of 2.69 and standard deviation of 1.353 which meant that school leaders were not
motivating both teachers and learners. This could therefore further imply success of the literacy
and numeracy programme cannot be easily achieved if the working environment is not
motivating. A standard deviation of 1.353 implied that opinions failed to converge. The
composite mean was 2.72 and standard deviation of 1.258 which was higher than want was
gotten from the line item.
The thirteenth statement that the school culture and ethical leadership play some role in
facilitating school improvements and if it allows teachers, parents and also learners in trusting
the school environment. Analysis revealed 60(21.4%) strongly disagreed, 110 (39.1%)
disagreed, 41(14.6%) remained neutral, 30(10.7%) agreed and 48(17.1%) strongly agreed. In
general, 162(57.6%) disagreed and 78(25.3%) agreed. The line item had a mean scored of 2.44
against 2.72 implying that the environment in which learning took place was not appreciated by
teachers, parents and even learners. This could particularly adversely affect attitudes of the
learners and impact performance of the program. There is therefore need to put in place the right
school culture that would propagate good performance among the learners and teachers by
rewarding the performers. A lower standard deviation of 1.188 against 1.258 the composite mean
implied that majority of the opinions were more converging. There is need for all stakeholders
take part in ensuring that the school environment is conducive for the learners.

235
Therefore, there is need to put in place the right school culture that would propagate good
performance among the learners and teachers by rewarding the performers
“Implementing change to any organization or institution has been a
challenge.one of the curriculum support officer from Embakasi, said that
school leaders were not ready for the workshops and the training since
they are not going to teach in any of the concerned classes. Some of them
could not even see the sense of sending and paying for their teachers to
attend the workshops until they are forced to by the CSO’S and other
senior officers in the ministry of education.
Results of the interviews with RTI officers indicated that school environment has strong positive
relationship between PM&E process and performance of L&N educational programme. The
results of the interviews were consistent with the quantitative data and key responses obtained
from the RTI officers were:
Teachers’ professional development, teacher support and coaching,
structured teacher lesson plans added to text books, revised textbooks
ratio of 1:1 and revised literacy and numeracy textbooks had statically
significant positive impact on learners’ outcome. The advice given to the
policy makers is to analyze the ingredients for literacy and numeracy
which will lead to more effective designed and implementing interventions
to improve learning outcome which are generally low performed in lower
grades. (RTI, 2018)
4.13.1 Inferential Analysis of Moderating Influence of School Environment on the
Relationship between Participatory Monitoring and Evaluation Process, and
Performance of Literacy and Numeracy Educational Programme
The inferential analysis was performed by use of correlation and regression to show the
relationship, strength and direction of independent and dependent variables. It was based on the
seventh objective moderating influence of school environment on the relationship between
participatory monitoring and evaluation process and performance of literacy and numeracy
educational programme in Nairobi County, Kenya. The indicators for school environment were
school infrastructure, teacher-pupil ratio and school leadership. Performance of literacy and

236
numeracy indicators were: Reading skills, Simple arithmetic calculations skills, Letter
recognition, beneficiary Satisfaction, proficiency skills in listening of literacy and numeracy
skills, proficiency skills in speaking of literacy and numeracy skills, proficiency skills and
writing, Timely Acquisition of literacy and numeracy skills, transition rate improved and class
average performance improved
4.13.2 Correlational Analysis for School Environment and Performance of Literacy and
Numeracy Educational Programme
The relationship between school environment and performance of literacy and numeracy
educational programme was determined by Pearson Correlation coefficient. Table 4.43 shows
the results.
Table 4.43
Correlation matrix for school environment and performance Numeracy and Literacy
Educational Programme
Variable Performance School environment
Performance
Pearson Correlation 1 0.690**
Sig. (2-tailed) 0.000
n 281 281
School
environment
Pearson Correlation 0.690** 1
Sig. (2-tailed) 0.000
n 281 281 **. Correlation is significant at the 0.05 level (2-tailed).
The results of Table 4.43 indicates that school environment positively moderates the relationship
between performance of literacy and numeracy educational programme and participatory
monitoring and evaluation process, (r=0.690, p<0.05).
4.13.3 Regression Analysis for moderating influence of School Environment on the
Relationship between Participatory Monitoring and Evaluation Process, and
Performance of Literacy and Numeracy Educational Programme
The following hypothesis was tested using multiple regression to satisfy the seventh objective
requirements

237
4.13.4 Test of Hypothesis 7
H0 There is no significant moderating influence of school environment on the relationship
between participatory monitoring and evaluation process and performance of literacy and
numeracy educational programs in public primary schools in Nairobi County, Kenya.
Ha school environment significantly moderates the relationship between participatory
monitoring and evaluation process and performance of literacy and numeracy educational
programme in public primary schools in Nairobi County, Kenya
The null hypothesis was tested using the regression equation below:
Y=𝛽0+𝛽1XI+𝛽2X2+𝛽3X3+𝛽4X4+𝛽5X5+𝛽6X6+𝛽0X1M+𝛽8X2M+𝛽9X3M+𝛽10X4M+𝛽11X5M
Y= Performance of literacy and numeracy educational programme
βO= constant term
β1, =stakeholders engagement
β2, =stakeholders capacity building
β3= data collection
β4= data management
β5= implementing change
M=School environment
£= error term
The results are presented in Table 4.44 and 4.45.
Hypothesis seven was tested using multiple regression model. In this operation, influence of
combined participatory monitoring and evaluation process (stakeholder engagement, stakeholder
capacity building, data collection, data management and implementing change) on performance
of literacy and numeracy educational programme was tested in step one, after which moderating
variable (school environment) was introduced in step two. Moderations assumed to take place
if the influence of the interaction between independent and moderating variables is significant.
As put by Baron and Kenny (1986) a moderator is any qualitative and quantitative variable which
affects the strength and direction of the relationship between independent and dependent
variable.

238
Step 1: influence of combined participatory monitoring and evaluation process on
performance of literacy and numeracy educational programme
In this step, participatory monitoring and evaluation process was regressed on performance of
literacy and numeracy educational programme. The results are presented in Table 4.44
Step 2: influence of combined participatory monitoring and evaluation process on
performance of literacy and numeracy educational programme
In step two the influence of moderator (school environment) was introduced on the relationship
between participatory monitoring and evaluation process and performance of literacy and
numeracy educational programme. The results are presented on Table 4.44
Table 4.44
Model Summary for Moderating Influence of School Environment on the Relationship
between Participatory M&E Process and Performance of Literacy and Numeracy
Educational Programme
Model R R
Square
Adjusted
R Square
Std. Error
of the
Estimate
Change Statistics
R Square
Change
F
Change
df1 df2 Sig. F
Change
1 0.754a 0.568 0.561 0.57027 0.568 72.453 5 275 0.000
2 0.868b 0.755 0.745 0.43481 0.186 34.005 6 269 0.000
Model: {F (5,275) =71.400, p=000<0.05}
a. Predictors: (Constant), Implementing Change, Stakeholder engagement, Stakeholders
capacity building, Data collection, Data management
b. Predictors: (Constant), Implementing Change, Stakeholder engagement, Stakeholders
capacity building, Data collection, Data management, School environment.
c) dependent variable: performance of literacy and numeracy educational programme
The Table 4.44, the results shows that in step one, the combined participatory M&E process
(Adjusted R Square 0.561) explained 56.1% of performance of literacy and numeracy
educational programme. This implies that school environment significantly influences the
relationship between participatory Monitoring and Evaluation process and performance of
literacy and numeracy educational programme. In step two, the adjusted R squared 0.745
explained 74.5% whereby the remaining 25.5% is influenced by other factors which are not
explained in this model. Therefore, since step 2 has the highest adjusted R, this implies that

239
school environment can only moderate the relationship between participatory Monitoring and
Evaluation process and of performance of literacy and numeracy educational programme up to
74.5% while the other factors are catered with the remaining percentage.
Table 4.45
ANOVA Model Summary for Moderating Influence of School Environment on the
Relationship between Participatory M&E Process and Performance of Literacy and
Numeracy Educational Programme
Model Sum of
Squares
df Mean
Square
F Sig.
1
Regression 117.812 5 23.562 72.453 0.000b
Residual 89.433 275 0.325
Total 207.245 280
2
Regression 156.387 11 14.217 75.197 0.000c
Residual 50.858 269 0.189
Total 207.245 280
a. Dependent Variable: Performance
b. Predictors: (Constant), Implementing Change, Stakeholder engagement, Stakeholders capacity
building, Data collection, Data management
c. Predictors: (Constant), Implementing Change, Stakeholder engagement, Stakeholders capacity
building, Data collection, Data management, School environment
From Table 4.45, it is evident that, in step one (1), the F value was statistically significant with
(F = 72.453, P=0.000<0.05. In step two (2), the F = 75.197, P=0.000<0.05) indicating that the
model was fit. The Anova Table was used in the study for establishing the models significance
or the model goodness of fit. In both steps the results showed that the calculated F were 75.197
and 72.453 significantly implying that the model was significant.

240
Table 4.46
Model Coefficients for Moderating Influence of School Environment on the Relationship
between Participatory M&E Process and Performance of Literacy and Numeracy
Educational Programme Model Unstandardized
Coefficients
Standardized
Coefficients
t Sig.
B Std. Error Beta
1
(Constant) -0.154 0.034 -4.447 0.000
Stakeholder engagement 0.215 0.050 0.238 4.326 0.000
Stakeholders capacity
building
0.212 0.049 0.174 4.367 0.000
Data collection 0.175 0.051 0.198 3.368 0.001
Data management 0.127 0.053 0.179 2.526 0.019
Implementing Change 0.123 0.049 0.099 2.540 0.012
2
(Constant) -0.309 0.031 -10.108 0.000
Stakeholder engagement 0.171 0.038 0.238 4.452 0.000
Stakeholders capacity
building
0.126 0.039 0.174 3.245 0.001
Data collection 0.144 0.040 0.198 3.619 0.000
Data management 0.136 0.041 0.179 3.299 0.001
Implementing Change 0.076 0.038 0.099 2.006 0.046
School environment 0.281 0.029 0.375 9.725 0.000
a. Dependent Variable: Performance of literacy and numeracy educational programme.
Using the statistical findings presented in Table 4.45, the regression model in step one can be
substituted as follows:
Y=𝛽0+𝛽1XI+𝛽2X2+𝛽3X3+𝛽4X4+𝛽5X5+ e
Y=-0.154+0.238X1+0.174X2+0.198X3+0.179X4+0.099X5 + e
Where y= Performance of literacy and numeracy educational programme
X1= Stakeholder engagement
X2= Capacity building
X3= Data collection
X4= Data management
X5= Implementing change
In step 2, the influence of moderating variable (school environment) was introduced on the
relationship between participatory M&E process and performance of literacy and numeracy
educational program.

241
The results in the Table 4.46 demonstrate that upon introduction of the moderating variable
(school environment) in the second model (2), the value of adjusted R2 increased by 0.745. This
implies that participatory M&E process and school environment (together) explain 74.5% of
performance of literacy and numeracy educational program. The F-value was still statistically
significant whereby the critical value obtained was 1.831 less than the F-value of 75.197 {F
(11,269) = 1.831 <75.197, p=0.000<0.05}.
Y=Using the statistical findings in step two (Table 4.46), the following regression equation was
obtained:
Y=𝛽0+𝛽1XI+𝛽2X2+𝛽3X3+𝛽4X4+𝛽5X5+𝛽6X6+ 𝛽7𝑀 + 𝛽8 𝑀 (X1.X2.X3.X4X5) + e
Y=-0.309+0.238X1+0.174X2+0.198X3+0.179X4+0.099X5+0.375X6 + e
Where y= Performance of literacy and numeracy educational programme
X1= Stakeholder engagement
X2= Capacity building
X3= Data collection
X4= Data management
X5= Implementing change
X6= School environment
From the moderating model equation analysis all variables are below 5% level of significant. P-
value of 0.05 are significant, which means that school environment has significant moderating
relationship between participatory monitoring and evaluation process and performance of
literacy and numeracy educational programme. Accordingly we reject the null hypothesis (H0),
which stated influence of school environment does not significantly moderate the relationship
between participatory monitoring and evaluation process and performance of literacy and
numeracy educational programme. Therefore the conclusion is that the strength of relationship
between participatory monitoring and evaluation process and performance of literacy and
numeracy educational programme depends on school environment. So then we use the alternate
hypothesis (Ha) to state: school environment significantly moderate the relationship between
participatory monitoring and evaluation process and performance of literacy and numeracy
educational programme.

242
The current study found out that even if school environment favors the implementation of
literacy and numeracy programme on specific issues like supplying of learning and teaching
materials, development of teacher professionalism and allocation of learning materials ratio of
1.1 still learning of literacy and numeracy skills performance is still low. The study findings
reverberate the findings of Piper and Zuilkowski, (2017) on how teachers’ education on three
years of postsecondary education can support in developing critical teacher skill. The study
revealed that in achieving consistent improvement in literacy and numeracy assessment on
reading should be administered regularly to enhance quality of education in the Country.
Further findings of the study, as shown in Table 4.46, the beta (β) coefficients, in step two (2),
were as follows: stakeholder engagement, 0.238; stakeholder capacity building, 0.174; data
collection, 0.198; data management, 0.179; implementing change, 0.099 and school
environment, 0.375. These values indicate that a unit increase in performance of literacy and
numeracy educational programme corresponded to 23.8% increase in stakeholder engagement
17.4% increase in stakeholder capacity building; 19.8% increase in data collection 17.9%
increase in data management; 9.9% increase in implementing change and 37.5% increase in
school environment.
It can, therefore, be concluded that school environment significantly moderates the relationship
between participatory M&E process and performance of literacy and numeracy educational
programme. Accordingly, we reject the null hypothesis, which stated that the strength of
relationship between participatory M&E process and performance of literacy and numeracy
educational programme does not depend on school environment, then we accept the alternative
hypothesis (Ha). We conclude that the strength of relationship between participatory M&E
process and performance of literacy and numeracy educational programme depends on school
environment.
The study found out that even if many stakeholders believe that conducive school environment
contributes a lot in learner’s performance there are many other factors which contribute to their
success in learning. School learning materials and infrastructures alone cannot be a measure of
giving excellent results even though they are inadequate to so many schools meaning this is a

243
weak observation and the government needs to take corrective measures as echoed by the
findings of the study were compared to prior empirical investigations earlier discussed. A study
by Nthenge (2014) determined that the strength of relationship between participatory M&E
process and performance of literacy and numeracy educational program depends on school
environment. Others such as Oyuga (2011); Parnwell (2015); Morgan (2015) also arrived at
similar conclusions. Hypothesis 7 was supported by data, hence the strength of relationship
between participatory M&E process and performance of literacy and numeracy educational
program depends on school environment. Considering the foregoing previous studies, the study
has adduced empirical evidence in support of their findings.
Table 4.47
Summary of Results of Test of Hypothesis
Objective Hypothesis Regression
model
Results Decision as results
of empirical
evidence 0bjective 1. To establish the extent to which
stakeholder engagement influence
performance of literacy and
numeracy educational program in
public primary schools in Nairobi
County
1.H0:There is no significant
relationship between
Stakeholders engagement
and performance of literacy
and numeracy educational
program in public primary
schools in Nairobi County
Linear regression
model
Y =𝛽0 + 𝛽1X1+ ɛ
{R=0.480,R2=
0.479,B=497,
t=16,091, F(257,949,
P=0.000<0.05}
Null hypothesis was
rejected and the alternate
hypothesis accepted.
Objective 2 To determine how stakeholder
capacity for monitoring and
evaluation influence performance
of literacy and numeracy
educational program in public
primary schools in Nairobi
County
2.H0:There is no
relationship between
Stakeholders capacity
building and
Performance of literacy
and numeracy
educational programme
in public primary
schools in Nairobi
County
Linear regression
model
Y =𝛽0 + 𝛽2X2+ ɛ
{R=0.675,R2=
0.456,B=490,
t=15,280, F(233,466,
P=0.000<0.05
Null hypothesis was
rejected and the alternate
hypothesis accepted.
Objective 3 To examine how data collection
influence performance of literacy
and numeracy educational
program in public primary
schools in Nairobi County
3.H0:There is no
relationship between Data
collection and
performance of literacy and
numeracy educational
programme in public
Linear regression
model
Y =𝛽0 + 𝛽3X3+ ɛ
R=0.660,R2=
0.434,B=479,
t=14,689, F(215,779,
P=0.000<0.05
Null hypothesis was
rejected and the alternate
hypothesis accepted.

244
primary schools in Nairobi
County
Objective 4
To determine the extent to
which data management
influence performance of
literacy and numeracy
educational program in public
primary schools in Nairobi
County
4.H0:There is no
relationship between data
management and
performance of literacy
and numeracy
educational programme
in public primary
schools in Nairobi
County
Linear regression
model
Y =𝛽0 + 𝛽4X4+ ɛ
R=0.536,R2=
0.228,B=408,
t=10,616, F(112,695,
P=0.000<0.05
Null hypothesis was
rejected and the alternate
hypothesis accepted.
Objective 5
To assess how implementing
change influence performance
of literacy and numeracy
educational program in public
primary schools in Nairobi
County
5.H0:There is no
relationship between
implementing and
influence performance
of literacy and numeracy
educational programme
in public primary
schools in Nairobi
County
Linear regression
model
Y =𝛽0 + 𝛽5X5+
ɛ
R=0.581,R2=
0.337,B=445,
t=11,917, F(142,010,
P=0.000<0.05
Null hypothesis was
rejected and the alternate
hypothesis accepted.
Objective 6
To establish how combined
participatory monitoring and
evaluation process influence
performance of literacy and
numeracy educational
program in public primary
schools in Nairobi County
6.H0: There is no
relationship between
Combined participatory
monitoring and
evaluation process and
performance of literacy
and numeracy
educational programme
in public primary
schools in Nairobi
County
Y=𝛽0+ 𝛽1XI +
𝛽2X2 + 𝛽3X3 +
𝛽4X4 + 𝛽5X5 +
ɛ;
R=0.754,R2=
0.568,B=238,
B=0.174,B=0.198,
B=0.179,B=0.099, t=-
4.477,t=4.326, =4.367,
t=3.368,t=2.526,
t=2.540, F(72,453,
All the p-values for
predicator variable
were less than 0.05
P=0.000<0.05
Null hypothesis was
rejected and the alternate
hypothesis accepted.
To assess how the moderating
influence of school
environment on the
relationship between
participatory monitoring and
evaluation process and
7.H0 There is no
significant moderating
influence of school
environment on the
relationship between
participatory monitoring
Y=𝛽0+𝛽1XI+𝛽2
X2+𝛽3X3+𝛽4X4
+𝛽5X5+𝛽6X6+𝛽0
X1M+𝛽8X2M+
Step1:
R=0.754,adjusted
R2=0.561
F(72.453,
P=0.000<0.05
Null hypothesis was
rejected and the alternate
hypothesis accepted.

245
performance of literacy and
numeracy educational
program in public primary
schools in Nairobi County
and evaluation process
and performance of
literacy and numeracy
educational programme
in public primary
schools in Nairobi
County
𝛽9X3M+𝛽10X4
M+𝛽11X5M
therefore statistically
significant
Step2:
R=0.755,adjusted
R2=0.745
F(34,005,
P=0.000<0.05
therefore statistically
significant

246
CHAPTER FIVE
SUMMARY OF FINDINGS, CONCLUSIONS, AND RECOMMENDATIONS
5.1 Introduction
This chapter presents summary of the findings, conclusions, recommendations contribution of
body of knowledge, and suggestions for further research.
5.2 Summary of Findings
This section presents summary of findings based on the following thematic areas as per the
objectives themes; hypothesis were tested using linear regression model to determine the
relationships of each independent variable.
5.2.1 Stakeholder Engagement and Performance of Literacy and Numeracy Educational
Programme
The first objective of the study was to establish the extent to which stakeholder engagement
influence performance of literacy and numeracy educational programme in public primary
schools in Nairobi County. The corresponding hypothesis was stated. Stakeholder engagement
was estimated using four indicators namely; identification of stakeholders, stakeholder’s level
of involvement, developing of project objectives whereby developing Monitoring and evaluation
plans was inclusive as the fourth indicator. The study revealed that for each indicator, had several
statements which were extracted from the variable and then statically tested where it was found
that, there was a positive influence on the performance of L&N educational programme. So the
foregoing null hypothesis was tested and the findings were determined: R=0.693, R2=0.480, 𝛽=
0.497,t=16,091, F(257,949), p=0.000<0.05.
Each variable had several statements derived from the objectives and results were analyzed,
frequencies, percentages, means and standard deviations were computed. The overall composite
mean were computed and comparisons were made according to the line items.
The composite mean score for stakeholder engagement was 3.59, while the standard deviation
was 1.102. This means that stakeholder engagement moderately statically influenced
performance of literacy and numeracy educational programme.

247
The null hypothesis stated that there is no significant influence of stakeholder engagement for
M&E on performance of literacy and numeracy educational programme. The null hypothesis
was tested and the following results found: (R2 = 0.480, β= 0.497, t=16.061, p=0.000<0.05). The
null hypothesis was thus rejected it was concluded that stakeholder engagement has a strong
positive statistic significant relationship on performance of L&N educational programme. It was
established that stakeholder engagement explained 48% of performance of L&N educational
programme.
5.2.2 Stakeholder Capacity and Performance of Literacy and Numeracy Educational
Programme
The second objective of the study was to determine the influence of stakeholder capacity building
and performance of literacy and numeracy educational program. The corresponding null
hypothesis was that there is no significant influence of stakeholder capacity building and
performance of literacy and numeracy educational program. The null hypothesis was tested and
the following results found: (R=0.675, R2 = 0.456, β= 0.490, t=15.280, p=0.000<0.05).
The null hypothesis was thus rejected and was concluded that stakeholder capacity building has
a strong positive statistic significant relationship on performance of L&N educational
programme. The composite mean score for stakeholder capacity building was 3.77, while the
standard deviation was 1.033. This means that stakeholder capacity building has a moderate
positive relationship on performance of literacy and numeracy educational programme. It was
established that stakeholder capacity building explained 46% of performance of literacy and
numeracy educational programme.
5.2.3 Data Collection and Performance of Literacy and Numeracy Educational
Programme
The third objective of the study was to determine the influence of data collection and
performance of literacy and numeracy educational programme. The corresponding null
hypothesis was that there is no significant influence of data collection for Monitoring and
evaluation on performance of literacy and numeracy educational programme. The null
hypothesis was tested and the following results found: (R=0.660, R2 = 0.436, β= -0.137,
t=14,689, p=0.000<0.05).

248
The null hypothesis was thus rejected and results were data collection has moderate positive
statistic significant relationship on performance of literacy and numeracy educational
programme. The composite mean score for data collection n was 3.69, while the standard
deviation was 1.015. This means that data collection has a positive moderate relationship with
performance of literacy and numeracy educational programme. The results shows that data
collection explained 44% of performance of literacy and numeracy educational programme. The
percentage clearly explains a moderate relationship which actually cannot point much on the
performance of literacy and numeracy educational programme.
5.2.4 Data Management and Performance of Literacy and Numeracy Educational
Programme
The fourth objective of the study was to determine the influence of data management and
performance of literacy and numeracy educational programme. The corresponding null
hypothesis was that there is no significant influence of data management and performance of
literacy and numeracy educational programme. The null hypothesis was tested and the following
results found: (R=0.536, R2 = 0.028, β=0.408, t=10.616, p=0.000<0.05).
The null hypothesis was thus rejected and it was concluded that there was weak statistic
significant relationship on performance of literacy and numeracy educational programme. The
composite mean score for data management was 3.62, while the standard deviation was 1.098.
This means that data management had a very weak relationship on performance of literacy and
numeracy educational programme. The results shows that data management explained 29% on
performance of literacy and numeracy educational programme. The percentage clearly explains
that data management has weak relationship on performance of literacy and numeracy
educational programme.
5.2.5 Implementing Change and Performance of Literacy and Numeracy Educational
Programme
The fifth objective of the study was to determine the influence of implementing and on
performance of literacy and numeracy educational programme. The corresponding null
hypothesis was that there is no significant influence of implementing change for Monitoring and

249
evaluation on performance of literacy and numeracy educational programme. The null
hypothesis was tested and the following results found: (R=0.581, R2 = 0.337, β=0.445 t=11.917,
p=0.000<0.05).
The null hypothesis was thus rejected. The findings concluded that implementing change has a
weak statistical significant relationship on performance of literacy and numeracy educational
programme. The composite mean score for implementing change was 3.74, while the standard
deviation was 1.198. This means that implementing change has a weak relationship on
performance of literacy and numeracy educational programme. The results shows that
implementing change explained 38% on performance of literacy and numeracy educational
programme. The percentage clearly explains that implementing change has moderate
relationship on performance of literacy and numeracy educational programme.
5.2.6 Combined Participatory Monitoring and Evaluation Process, and Performance of
Literacy and Numeracy Educational Programme
The sixth objective of the study was to determine the influence of combined participatory
Monitoring and evaluation process on performance of literacy and numeracy educational
programme. The corresponding null hypothesis was that there is no significant influence of
combined participatory Monitoring and evaluation process on performance of literacy and
numeracy educational programme. The null hypothesis was tested and the following results
found: the overall results in the model were: R=0.754, (R2 = 0.568, adjusted R2= 0.561,
F=72.453, p=0.000<0.05). The null hypothesis was thus rejected. Results from model
coefficient Table indicated that all the p-values for predicator variables {stakeholder engagement
(p=0.000<0.05), stakeholder capacity building (p=0.000<0.05), data collection (p=0.000<0.05),
data management (p=0.000<0.05) and implementing change (p=0.000<0.05)} were less than
0.05. The null hypothesis was rejected based on the results and conclusion was combined
participatory Monitoring and evaluation process significantly influenced performance of literacy
and numeracy educational programme. It was shown clearly that combined participatory
Monitoring and evaluation process explained 57% of performance of literacy and numeracy
educational programme.

250
5.2.7 School Environment, Participatory Monitoring and Evaluation Process, and
performance of Literacy and Numeracy Educational Programme Performance of
Literacy and Numeracy Educational Programme
The seventh objective of the study was to determine the moderating influence of school
environment on the relationship between participatory Monitoring and evaluation process and
performance of literacy and numeracy educational programme. The corresponding null
hypothesis was that there is no significant moderation influence of school environment on the
relationship between participatory Monitoring and evaluation process and performance of
literacy and numeracy educational programme. The null hypothesis was tested and the following
results found: upon introduction of the moderating variable (school environment) to the model
in step two, the value of adjusted R2 increased by 0.184 (from 0.561 to 0.745). This implies that
participatory Monitoring and evaluation process and school environment (together) explain
74.5% of performance of literacy and numeracy educational programme. The F-value was still
statistically significant {F (1,269) = 42.503, p=0.000<0.05}. The composite mean score for
school environment was 2.72, while the standard deviation was 1.258. This implies that the
overall opinion of the respondents on school environment was adverse. Therefore it affected the
relationship between participatory monitoring and performance of literacy and numeracy
programme. This signifies the need and the importance to streamline various aspects of school
environment to ensure maximum performance in the performance literacy and numeracy
programme.
5.3 Conclusions
This section presents the conclusions made in regard to the study objectives and hypotheses. The
first objective of the study was to determine the influence of stakeholder engagement on
performance of literacy and numeracy educational program. The study determined that majority
of the respondents agreed that stakeholder engagement was prevalent in the literacy and
numeracy educational program. It was also determined that stakeholder engagement
significantly influenced performance of literacy and numeracy educational programme.
The second objective of the study was to determine the influence of stakeholder capacity building
on performance of literacy and numeracy educational program. The study determined that

251
majority of the respondents agreed that stakeholder capacity building was prevalent in the
literacy and numeracy educational program. It was also determined that stakeholder capacity
building significantly influenced performance of literacy and numeracy educational programme.
The third objective of the study was to determine the influence of data collection on performance
of literacy and numeracy educational program. The study determined that majority of the
respondents agreed that data collection was prevalent in the literacy and numeracy educational
program. It was also determined that data collection significantly influenced performance of
literacy and numeracy educational programme.
The fourth objective of the study was to determine the influence of data management on
performance of literacy and numeracy educational program. The study determined that majority
of the respondents agreed that data management was prevalent in the literacy and numeracy
educational program. It was also determined that data management significantly influenced
performance of literacy and numeracy educational programme.
The fifth objective of the study was to determine the influence of implementing change on
performance of literacy and numeracy educational program. The study determined that majority
of the respondents agreed that implementing change was prevalent in the literacy and numeracy
educational programme. It was also determined that implementing change significantly
influenced performance of literacy and numeracy educational programme.
The sixth objective of the study was to determine the influence of combined participatory
Monitoring and evaluation process on performance of literacy and numeracy educational
program. The study established that combined participatory Monitoring and evaluation process
significantly influenced performance of literacy and numeracy educational programme.
The seventh objective of the study was to determine the moderating influence of school
environment on the relationship between participatory Monitoring and evaluation process and
performance of literacy and numeracy educational programme. Majority of the respondents
disagreed on all the three parameters of school environment, hence the conclusion that the school
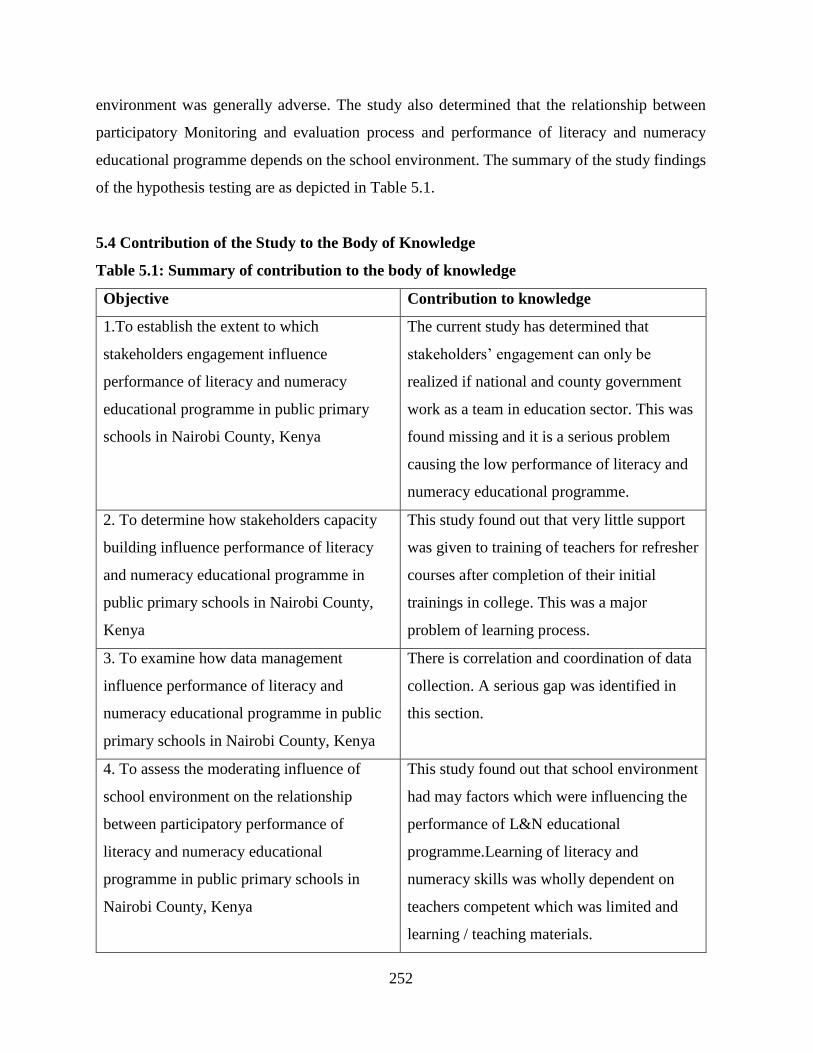
252
environment was generally adverse. The study also determined that the relationship between
participatory Monitoring and evaluation process and performance of literacy and numeracy
educational programme depends on the school environment. The summary of the study findings
of the hypothesis testing are as depicted in Table 5.1.
5.4 Contribution of the Study to the Body of Knowledge
Table 5.1: Summary of contribution to the body of knowledge
Objective Contribution to knowledge
1.To establish the extent to which
stakeholders engagement influence
performance of literacy and numeracy
educational programme in public primary
schools in Nairobi County, Kenya
The current study has determined that
stakeholders’ engagement can only be
realized if national and county government
work as a team in education sector. This was
found missing and it is a serious problem
causing the low performance of literacy and
numeracy educational programme.
2. To determine how stakeholders capacity
building influence performance of literacy
and numeracy educational programme in
public primary schools in Nairobi County,
Kenya
This study found out that very little support
was given to training of teachers for refresher
courses after completion of their initial
trainings in college. This was a major
problem of learning process.
3. To examine how data management
influence performance of literacy and
numeracy educational programme in public
primary schools in Nairobi County, Kenya
There is correlation and coordination of data
collection. A serious gap was identified in
this section.
4. To assess the moderating influence of
school environment on the relationship
between participatory performance of
literacy and numeracy educational
programme in public primary schools in
Nairobi County, Kenya
This study found out that school environment
had may factors which were influencing the
performance of L&N educational
programme.Learning of literacy and
numeracy skills was wholly dependent on
teachers competent which was limited and
learning / teaching materials.

253
5.5 Recommendations
This section comprises recommendations of the study based on the findings. The
recommendations are in light of policy and practice.
5.5.1 Recommendations for Policy makers
The recommendations for policy are as follows:
1. It was established that participatory Monitoring and Evaluation process significantly
influences performance of literacy and numeracy educational programme. This implies
that more policies governing the implementation of the programme by the schools and
other implementing partners should consider mainstreaming participatory M&E process
in order to achieve better performance results.
2. It was revealed in the study that school environment significantly influences the
relationship between PM&E process and specifically performance of literacy and
numeracy educational programme in the country. This means that not only should
policies governing the implementation of the programme by the schools and other
implementing partners be reviewed, but they should also enhance the school environment
to yield better performance.
3. The study demonstrated that each of the individual variables examined had significant
influence on performance of literacy and numeracy educational programme. This implies
that the variables ought to be given policy attention as a strategy to enhance the success
of such programme in Nairobi County. Resource allocation in the Monitoring and
evaluation programme and projects should, therefore, be guided by the findings of this
study.
5.5.2 Recommendations for Practice
The recommendations for practice are as follows:
1. The schools, RTI, CSOs, and all other players in the literacy and numeracy educational
programme in public primary schools in Nairobi County should review their Monitoring
and evaluation practices based on the study findings. They should more so integrate
participatory Monitoring and evaluation in the programme. The study revealed that
school environment significantly influences the relationship between PM&E process and

254
performance of literacy and numeracy educational programme. This means that the
relevant regulatory bodies and other institutions charged with project oversight
responsibilities such as the Ministry of Education should commit significant time and
resources to the participatory Monitoring and evaluation process.
2. The study recommends that stakeholder capacity building in these programme is an issue
hence needs frequent organizations so that they can help the teachers who have little
knowledge of M&E skills for example data collection, data coding, analysis and
management in the data bases to be properly acquitted with the challenging skills.
3. The study recommends ministry of education should develop professional learning
communities focusing on either individual, small groups or large groups of teachers in
reviewing and interpreting data for the purpose of improving student’s achievements.
4. Leaders must be trained on management skills and be prepared to give guidance in the
process of data investigation and induct new teachers into a data-based decision-making
culture by linking them to already learned and experienced teachers in the field in using
data collected so has to enhance learners achievement.
5.6 Suggestions for Further Research
Suggestions for further research are as follows:
1. The current study focused on literacy and numeracy programme in public primary
schools. Other researchers can focus in private schools.
2. The current study focused on Nairobi County, Kenya. Other researchers may consider
focusing on the examining the same phenomenon in other counties; especially the rural
counties.
3. The current study used cross sectional survey design. Longitudinal surveys are often
more powerful in determination of cause-effect relationships, therefore other researchers
may consider examining the same phenomenon using longitudinal survey design.

255
REFERENCE
Abbas S. Tavakoli, Kirby Jackson, Linda Moneyham, Kenneth D. Phillips, Carolyn Murdaugh
Gene Meding,( 2006) Data Management Plans: Stages, Components, and Activities.
Althauser, K.2015. “Job-Embedded Professional Development: It’s Impact on Teacher Self
Efficacy and Student Performance. “Teacher Development19 (2): 210–225.
doi:10.1080/13664530.2015.1011346.
Amber Gove and Anna Wetterberg 2011, the Early Grade Reading Assessment Research
Triangle Institute. RTI International is a trade name of Research Triangle Institute.
Amwayi H. N. (2016) the influence of numeracy and literacy training program on curriculum
implementation by early grade teachers in public primary schools in Mombasa County
University of Nairobi. Analysis 5th Ed. Upper Saddle River, NJ: Prentice Hall
International.
Andrew F. Hayes (2009): Beyond Baron and Kenny: Statistical Mediation Analysis in the New
Millennium, Communication Monographs, 76:4, 408-420
Angela Marie Randall 2011, influence of exposure to children’s literature on teachers’ and
students’ knowledge of and attitudes toward reading Auburn University
Ani, E. I, (2017) Debating the Roots of Poor Academic Performance in the West African Sub
region: The Perspective of a Philosopher AGE Open April-June 2017: 1 –11© The
Author(s) 2017DOI: 10.1177/2158244017707795journals.sagepub.com/home/sgo
Anicet, K., & Aphrodis, N. (2017). The role of monitoring and evaluation on assessing VVOB Rwanda projects
paradigm in improving the school management and leadership. International journal of education,
138-165.
Annadale, K., Bindon, R., Handley, K., Johnston, A., Lockett, L., & Lynch, P. (2004). Reading
map of development – Second edition addressing current literacy challenges. Port
Melbourne: Reed International Books Australia Pty.
Antill, Julie A, (2013). The effects of early literacy development on academic success in the
educational setting and implications for educational leaders and teacher Michigan
University.
Antilla, J. A (2013) the effects of early literacy development on academic success in the
educational setting and implications for educational leaders and teachers implications
of early literacy development Applications and Applied Mathematics (AAM): An
International Journal Vol. 1, Issue 2.
Aquinas, H & Kraiger, K. (2009); Benefits of training and development for individuals and
teams, organizations, and society. Annual Review of Psychology, 60,451-474.

256
Aremu, A.O. (2000). Impact of home, school and government on primary school pupils’
academic performance. Journal of Exceptional Child, 5(1), 106-110
Asikhia, O. A. (2010). Students and Teachers’ Perception on the Causes of Poor performance in
Ogun state secondary schools (Nigeria) Implication for Counseling for National
Development. In the European Journal of Social Sciences 13 (2), 229-242.
Aurangzeab Butta, Marja Naaranojab, Jussi Savolainenc 2016). Project change stakeholder
communication. Finlandwww.elsevier.com/locate/ijproman international project
management journal 34
Babbie, E.R. (2010). the Practice of Social Research. (25th edition). California: Wadsworth-
Cengage Learning.
Barclay, C. & Osei, B. (2010). Project performance development framework: An approach for
information systems, (15) projects: International Journal of Production Economics,
124(1), 272-292.
Baron, R. M., &Kenny, D. A. (1986). The moderator-mediator variable distinction in social
psychological research: Conceptual, strategic and statistical considerations. Journal of
Personality and Social Psychology, 51, 1173-1182.
Bayer, W. and 2002.Participatory Monitoring and Evaluation with Pastoralist, a Review of
Experience & Annotated Bibliography, GTZ
Beatrice, N. W., Allan, G., & Emily, B. J. (2015). Influence of monitoring and evaluation on effective teaching
and learning in public secondary school in githunguri district. Journal of education and practice,
10-17
Berkowitz, R., Moore, H., Astor, R. A., & Benbenishty, R. (2017). A research synthesis of the
associations between socioeco-nomic background, inequality, school climate, and
academic achievement. Review of Educational Research, 87, 425–469.
doi:10.3102/0034654316669821
Bernard Phiri (2015). Influence of monitoring and evaluation on project performance: a case of
African virtual university, Kenya
Bhattacherje, A. (2012). Social Science Research: Principles, Methods, and Practices.
2ndEdition. Global Text Project, Jacobas Foundation, Zurich, Switzerland.
Bhattecherjee. A. (2012). Social science research: principles, methods and procedures (1st Ed)
Tampala Bay scholar commons, university of south Florida.
Bickel, P. J., Y. Ritov, and A. B. Tsybakov. 2009. Simultaneous Analysisof Lasso and Dantzig
Selector.The Annals of Statistics37 (4):1705–1732.http:/doi.org/10.1214/08-AOS620

257
Bjorn, P. M., Aunola, K., and Nurmi, J. E. (2016). Primary school text comprehension predicts
mathematical word problem skills in secondary school. Educ. Psychol. 36, 362–377. doi:
10.1080/01443410.2014.992392
Blake,S.C and Ottoson J M. J.M. Ottoson and P. Hawe, 2009). (eds).Knowledge Utilization,
Diffusion, Implementation, Transfer, andTranslation: Implications for Evaluation, New
Directions for Evaluation, No124. Jossey‐ Bass: SanFrancisco, CA: 21‐ 34
Bluman A. G (2009). Elementary statistical: a step by step approach (7th ed). New York:
McGrwa Hill Higher Education.
Bodgdan, R. C., & Biklen, S. K. (2003). Qualitative Research of Education: An Introductive to
Theories and Methods (4th ed.). Boston: Allyn and Bacon.
Bold, T., M. Kimenyi, G. Mwabu, A. Ng’ang’a & J. Sandefur, (2016), Interventions and
Institutions: Experimental Evidence on Scaling Up Education Reforms in Kenya,
Working Paper, IIES, and Stockholm University.
Borg, W. R., and Gall, M. D. (1989). “Educational Research: An Introduction”, New York:
Bowman, Kimberly, John Chettleborough, Helen Jeans, Jo Rowlands, and James Whitehead.
2015. “Systems Thinking: An Introduction for Oxfam Programme Staff. “Oxfam, Oxford,
U.K.
Brittany Marie Crowle (2015). The Effects of Problem-Based Learning on Mathematics
Achievement of Elementary Students across Time Western Kentucky University,
Brombacher, A., Batchelder, K., Mulcahy-Dunn, A., Dick, A., Downs, P., Nordstrum,L., King,
S.Cummiskey, C.and Davidson, M.(2014) Assessment of School Quality for Education
and WASH in three regions of Mainland Tanzania namely Mbeya, Iringa, and Njombe. A
report prepared by RTI International for UNICEF, Tanzania.
Brombacher, A., J. Stern, L. Nordstrum, C. Cummiske, and A. Mulcahy Dunn. (2014).National
earlygrade literacy and numeracy survey -Jordan, intervention impact analysis report.
Amman, JO: USAID/Jordan.
Bruce, C. S. &Hughes, H. (2010). Informed learning: A pedagogical construct attending
simultaneously to information use and learning. Library and Information Science
Research, 32(4), pp. A2-A8. https://doi.org/10.1016/j.lisr.2010.07.013
Bruce, C. S., Hughes, H., &Somerville, M. M. (2012). Supporting informed learners in the 21st
century. Library Trends, 60(3), pp. 522-545. https://doi.org/10.1353/lib.2012.000
Bryman A .and Cramer, D. (1994) qualitative data analysis for social scientists. Roultledge
London.

258
Bryman, A. (2012). Integrating quantitative and qualitative research: How is it done?
Qualitative Research, 6, 97-113. http://dx.doi.org/10.1177/1468794106058877.
Brymer, A., and Cramer, D. (2005). Quantitative Data Analysis with SPSS 12 and 13: A Guide
for Social Scientists, Taylor & Francis Group, London, UK.
Bryson, C., & Hand, L. (2007). The role of engagement in inspiring teaching and learning.
Innovations in Education and Teaching International, 44, 349-62.
Bucheli, M; Melgar, N; Rossi and Smith, T (2010).Job satisfaction and the individual
educational level, re-assessing their relationship. Center for Advanced Study Fellow,
University of Illinois, Illinois, USA.
Burnard, P., Gill, P., Stewart, K., Treasure, E., & Chadwick, B. (2008).Analysing and presenting
qualitative data, Brit. Dent. J., 204,429–432, doi:10.1038/sj.bdj.2008.292.
Byrne, David. 2015. “Prices for Data Storage Equipment and the State of IT Innovation.” FEDS
Notes, July. http://www.federalreserve.gov/econresdata/notes/feds-notes/2015/prices-
for-data-storage-equipment-and-the-state-of-it- innovation-20150701.html
Caleb B. C. (2013). Impact of Reading Ability on Academic Performance at the Primary Level.
Campbell, T. (2014). Stratified at seven: In-class ability grouping and the relative age
Campell. E. 2008. Review of literature: the ethics of teaching as a moral profession curriculum
Inquiry, 38(4), 357-385. Doi;10.1111/j:1467-873x.2008.00414.x
Cantor, P., Osher, D., Berg, J., Steyer, L., & Rose, T. (2018).Malleability, plasticity, and
individuality: How children learn and develop in context. Applied Developmental Science,
1. doi:10.1080/10888691.2017.1398649
Carnoy, M. & Leandro, O. C. (2015). The Effectiveness of an Early-Grade Literacy Intervention
on the Cognitive Achievement of Brazilian Students Stanford University
Carson, E. A. (2015). Prisoners in 2014. Washington, DC: Bureau of Justice Statistics
Celine Natecho Victory Lusweti (2014). Assessing reading to learn literacy intervention of
school improvement programme on lower primary school pupils‟ literacy skills in Kwale
district
Chakrabartty, S.N. (2013).Best Split-Half and Maximum Reliability. IOSR Journal of Research
& Method in Education, 3(1), 1-8.
Chambers, R (1997). Who’s Reality Counts: Putting the Last First? Intermediate Technology
Publications

259
Chandran, C., (2004). “Research Methods with illustrations from Christian Ministries”. Star
bright Services limited
Charles G. Kamau, Humam Bin Mohamed (2015). Efficacy of Monitoring and Evaluation
Function in Achieving Project Success in Kenya: A Conceptual Framework Science
Journal of Business and Management. Vol. 3, No. 3, 2015, pp. 82-94. doi:
10.11648/j.sjbm.20150303.14
Chepkonga, M. (2017). Relationship between Outdoor Classroom Environment and Provision
of Quality Education in Public ECDE Centres in West Pokot County, Kenya IOSR.
Journal of Research & Method in Education (IOSR-JRME) e-ISSN: 2320–7388, p-ISSN:
2320–737X Volume 7, Issue 2 Ver. II (Mar. - Apr. 2017), PP 85-91 www.iosrjournals.org
DOI.
Chitere, O.P & Ireri, O.N (2004). District Focus for Rural Development in Kenya: It’s
Limitations as a Decentralization and participatory planning strategy and prospects for the
future. Nairobi: Institute for Policy Analysis and Research.
Christia, J., Czerwonko, A., & Garofalo, P. (2014). Does technology in schools affect repetition,
dropout and enrollment? Evidence from Peru. Journal of Applied Econometrics, 17(1),
89–111. https ://doi.org/10.1016/s1514 -0326(14)60004 -0.
Chukwu, C. M. Dan, U, Ejiofor &Okpoebo, Casmir Chukwudi (2019).Monitoring and
Evaluation on Effective Delivery of Social Studies for Improved Academic Performance
Review of European Studies; Vol. 11, No. 1;2019ISSN 1918-7173E-ISSN 1918-7181
Published by Canadian Center of Science and Education
Cimmiyotti, C. (2013). Impact of Reading Ability on Academic Performance at the Primary
Level. School of Education Dominican University
Clark, C. (2007). Why it is Important to Involve Parents in their Children’s Literacy
Development. Retrieved on, from174
Colclough, C., A-Samarrai, S., Rose, P. & Tembo, M. (2003). Achieving schooling for all in
Africa. Ashgate: Burlington.
Conn, K. M. (2017). Identifying effective education interventions in sub-Saharan Africa: A
meta-analysis of impact evaluations. Review of Educational Research, 87(5), 863–898.
https ://doi.org/10.3102/00346 54317 71202 5
Conn, K. M. (2017). Identifying effective education interventions in sub-Saharan Africa: A
meta-analysis of impact evaluations. Review of Educational Research, 87(5), 863–898.
https ://doi.org/10.3102/00346 54317 71202 5
Cooper, D. & Schindler, P. (2010). Business research methods (11th Ed.) New York: McGraw.

260
Cooper, D. R., & Schindler, P. S. (2006). Business Research Methods (9thedition).
USA:McGraw-Hill
Cope, Bill; Kalantzis, Mary (2015). "'The Things You Do to Know: An Introduction to the
Pedagogy of Multiliteracies.' pp.1-36 in A Pedagogy of Multiliteracies: Learning By
Design, edited by B. Cope and M. Kalantzis" (PDF). London: Palgrave
Coupal, F. (2005). Results-based Participatory Monitoring & Evaluation, CIDA's Performance
Review. Ottawa, K2A 2A8, Canada: Mosaic Net International.
Creswell, J. W, & Plano Clark, V. L (2011). Designing and Conducting Mixed Methods Research
(2nd ed.). London: Sage Publications Ltd.
Creswell, J. W. & Miller, D. L. (2000). Determining validity in qualitative inquiry. Theory into
Practice, 39(3), 124-131.
Creswell, J. W. (2003). Research Design: Qualitative, Quantitative and Mixed Methods
Approaches (2nd ed.). London: Sage Publications Ltd.
Creswell, J. W. (2012). Educational research; planning conducting and evaluating. Qualitative
and quantitative research, upper saddle River, N: Prentice Hall.
Creswell, J. W. (2014). Research Design: Qualitative, Quantitative and Mixed Methods
Approaches (4th ed.). London: Sage Publications Ltd.
Creswell, John W. (2015). Educational research: Planning, conducting, and evaluating
quantitative and qualitative research (5th ed.). Boston, MA: Pearson.
Cromley, J. (2009). Reading achievement and science proficiency: International comparisons
from the programme on international student assessment. Reading Psychology, 30, 89-
118
Crouch, L. & DeStefano, J. (2017). Doing Reform Differently: Combining Rigor and
Practicality in Implementation and Evaluation of System Reforms. International
Development Working aper, No.2017-01. RTI International.
Crystal J. C. (2013). The Effects of Parental Literacy Involvement and Child Reading Interest
on the Development of Emergent Literacy Skill University of Wisconsin-Milwaukee
Cvelich, P.K. & Gove, A. (2010). Early Reading: Igniting Education for All. A report by the
Early Grade Learning Community of Practice. RTI International.
www.rti.org/publications;
Cynthia T. P. (2004). An evaluation of student reading attitudes: does ability affect attitudes?
University of North Carolina at wilmigton

261
Daly. T (2015) Digital Literacy: Access, Participation and Communication for the 'Non-Literate'
in the New Digital Age. Journal of the Irish Learning Support Association, Vol. 3, 2015,
115-137]
Davidson, M. & Hobbs, J. (2013). ‘Delivering Reading Intervention to the Poorest Children: The
Case of Liberia and EGRA-Plus, a Primary Grade Reading Assessment and Intervention.’
In: International Journal of Educational Development (33): 283-293.
Day, C. (2013).The new lives of teachers. In C. Craig,P. Meijer.,& J. Broeckmans (Eds.),From
teacher thinking to teachers and teaching: The evolution of a research
community(advances in research on teaching)(pp.357-377). Retrieved 25 October, 2014,
fromhttp://dx.doi.org/10.1108/S1479-3687 (2013)0000019020
Dednam, A., 2011, 'First language difficulties in spoken language', in E. Landsberg, D. Krüger
& E. Swart (eds.), Addressing barriers to learning: A South African perspective, 2nd edn.,
pp. 126-141, Van Schaik, Pretoria.
Deleuze, G., & Guattari, F. (1987). A thousand plateaus: Capitalism and schizophrenia Part II
(B. Massumi, Trans.). London: Athlone Press.
Desforges, C. & Abouchaar, A. (2003). The impact of parental involvement, parental support
and family education on pupil achievement and adjustment: A literature review.
Nottingham, UK: Queen‟s Printer
Dihaisat, F. (2016). Impact of Classroom Environment on Jordanian Secondary School Students.
Unpublished MA Thesis, Islamic University.
Dinham, S. (2013). The quality teaching movement in Australia encounters difficult terrain: a
personal perspective. Australian Journal of Education, 57(2), 91-106.
https://doi.org/10.1177/0004944113485840
Disha, M. (2017). Evaluation in teaching and learning process/education. Retrieved
fromwww.yourarticlelibrary.com/static-2/evaluation-in-teachingandlearning-process-
education/92476/
Donald R. U. (2014). Challenges to Stakeholder Participation in Coastal Resource Management:
Allen, Northern Samar, Philippines Oregon State University
Donaldson, S. I., & Lipsey, M. W. (2006). Roles for theory in contemporary evaluation practice:
Developing practical knowledge. The handbook of evaluation: Policies, programs, and
practices, 56-75.
Dubeck, M Jukes, M & Okello, G. (2012). Early Primary Literacy Instruction in Kenya, In
Comparative Education Review, Vol.56, No. 1. February 2012

262
Dubeck, M. M., Jukes, M. C., Brooker, S. J., Drake, T. L. & Inyega, H. N. 2015. Designing a
program of teacher professional development to support beginning reading acquisition in
coastal Kenya. International journal of educational development, 41, 88-96.
Dubeck, M., & Gove, A. (2015). The early grade reading assessment (EGRA): Its theoretical
foundation, purpose, and limitations. International Journal of Educational Development,
40, 315-322. https://doi.org/10.1016/j.ijedudev.2014.11.004
Dunston, L. K. (2018). Can reading be used as a predictor of literacy outcomes? a literature
review international journal of education and research vol. 6
Dympna, D. (2015). The Implementation of a literacy intervention ‘Station Teaching’ in Infant
classes in Irish primary schools University College of cork, Ireland.
El-Gohary, N, Osman H and El-Diraby, T (2006) Stakeholder management for Public Private
Partnerships. “International Journal of Project Management”, 24(7), 595-604.
Elmore, R. F. (2016). “Getting to scale...” It seemed like a good idea at the time. Journal of
Educational Change, 17(4), 529–537. https ://doi.org/10.1007/s1083 3-016-9290-8.
Ercikan, K., & W.-‐ M. Roth (2009). Generalizing from educational research: Beyond
qualitative and quantitative polarization. New York, NY: Routledge.
Erica Deahl, (2007) Better the Data You Know: Developing Youth Data Literacy
in Schools and Informal Learning Environments. A. Art, Yale University
Estrella, M., Blauert, J., Campilan, D., Gaventa, J., Gonslaves, J., Guijt, I., Johnson, D and
Ricafort, R. (2000). Learning from Change: Issues and experiences in participatory
monitoring and evaluation. Intermediate Technology publications: London
Evans, D. K., & Popova, A. (2015). Cost-effectiveness measurement in development:
Accounting for local costs and noisy impacts (World Bank Policy Research Working
Paper No. 7027). Washington, DC: World Bank.
Evans, D.K., Kremer, M., & Ngatia, M. (2014). Schooling costs, school participation, and long-
run outcomes: Evidence from Kenya. Unpublished working paper. Explore school
literacies’, Literacy, vol. 49, no. 3, pp. 140–148.
Fadel, K. J., & Brown, S. A. (2010). Information systems appraisal and coping: The role of use
perceptions. Communications of AIS, 26(6), 107-126
Fafunwa, B., Macauley, J. I., & Sokoya, F. J. A. (1989). Education in mother tongue: The Ife
Primary Education Research Project. Ibadan, Nigeria: University Press

263
Federer L, Lu Y, Joubert D, Welsh J, Brandys B (2015) Biomedical data sharing andreuse:
Attitudes and practices of clinical and scientific research staff. PLOS ONE 10
(6):e0129506. https://doi.org/10.1371/journal.pone.0129506
Fomba, C. O. and Diarra, M. F. 2003. Évaluation de l’impact des formations des contractuels de
l’éducation sur leurs pratiques de classes Impact evaluation of the training of contract staff
in education on their classroom practicesfambo
Forster, M. (2009). Literacy and numeracy diagnostic tools an evaluation Australian Council
for Educational Research (ACER).
Fortune, J., & White, D. (2006). Framing of project critical success factors by a
system model, International Journal of Project Management, 24(I), 53-65
Fowler, F. J. (2002). Survey research methods (3rd Ed.). Thousand Oaks, CA: Sage Publications.
Fraenkel, J., R., & Wallen, N., E. (2010). How to design and evaluate research in education.
(7th,ed.).McGrawHill,NewYork:NY.Retrievedfromhttp://doha.ac.mu/ebooks/Research%
20Methods/DesigningAndEvaluatingResearchInEducation.pdf
Freeman, R. E. (1984). Strategic Management: A stakeholder approach. Marshfield, MA:
Pitman Books.
Freeman, R. E., & Daniel R. G., Jr. (2007). Corporate Strategy and the Search for Ethics
(Englewood Cliffs, N.J.: Prentice-Hall)
Freudenberg, E., & Davis, J. (2017). Tusome external evaluation—Midline report. Prepared for
the Ministry of Education of Kenya, USAID/Kenya, and the UK DFID under contract no.
AID-615-TO-16–00012. MSI, A Tetra Tech Company, Washington, DC. Retrieved June
18, 2018 from http://pdf.usaid .gov/pdf_docs/PA00M S6J.pdf.
Fullan, M. (2016). The elusive nature of whole system improvement in education. Journal of
Educational Change, 17(4), 539–544. https ://doi.org/10.1007/s1083 3-016-9289-1
Fullan, M., & Quinn, J. (2015). Coherence: The right drivers in action for schools, districts, and
systems. Corwin Press.
Gakure, R. W., Mukuria, P. & Kithae, P.P. (2013). An evaluation of factors that affect
performance of primary schools in Kenya: A case study of Gatanga district Vol. 8(13),
pp. 927-937, 10 July, 2013 DOI: 10.5897/ERR2013.1466 ISSN 1990-3839.Academic
Journals. http://www.academicjournals.org/ERR
Galza V. 2005social-ecological resilience and social conflict: institutions and strategic adaption
in Swedish water management. AMBIO 34 (7), 567-572

264
Ganimian, Alejandro J., and Richard J. Murnane, (2016) “Improving Education in De-veloping
Countries: Lessons from Rigorous Impact Evaluations, “Review of Educational Research,
86 (2016), 719–755
Gao, Q., Wang, H., Mo, D., Shi, Y., Kenny, K., & Rozelle, S. (2018). Can reading programs
improve reading skills and academic performance in rural China? China Economic
Review, 52, 111-125.
Gathumbi A. M, Kanini N. & Maithya R. (2017). Influence of Pupil-teacher Ratio on
Performance in Kenya Certificate of Primary Education in Makueni County, Kenya
International Journal of Humanities and Social Science Inventions’ (Online): 2319 –7722,
ISSN (Print): 2319 –7714www.ijhssi.org ||Volume 6 Issue 1||January. 2017 || PP.50-54
Gathumbi, A. W & Masembe S.C. (2005).Principles and Techniques of Language Teaching: A
Text for Teacher Educators, Teachers and Pre-Service Teachers. Nairobi: Jomo Kenyatta
Foundation
GCE (2015).Global Campaign For Education United States Chapter.(2015). Total reach, total
learning: education beyond 2015. Washington, D.C. Available from www.gce.us.org
Gichohi. G.W (2015) Stakeholder involvement in Schools in 21stCentury for Academic
Excellence International Journal of Education and Research
Gichuru, L. M., (2016). Effect of teacher quality on student performance in mathematics in
primary 6 national examination: a survey of private primary schools in Gasabo District,
Kigali city, Rwanda International Journal of Education and Research Vol. 4
Glennerster, R., Kremer, M., Mbiti, I., & Takavarasha, K. (2011). Access and quality in the
Kenyan education system: A review of the progress, challenges and potential solutions. A
report prepared for Office of the Prime Minister of Kenya. Retrieved November 6, 2014,
from http://www. povertyactionlab.org/publication/ access-and-quality-kenyan-
education-system.
Glewwe, P., and K. Muralidharan, “Improving Education Outcomes in Developing Countries:
Evidence, Knowledge Gaps, and Policy Implications,” Handbook of the Economics of
Education, vol. 5, Eric A. Hanushek, Stephen Machin,Ludger Woessmann, eds.
(Amsterdam: Elsevier, 2016), 653–743
Godfrey Mulongo (2014). Debating International Learner Assessments as a Proxy Measure of
Quality of Education in the Context of EFA-A Review Essay. World Journal of Education
Vol. 4, No. 1; (2014) Published by Sciedu Press 35 ISSN1925-0746 E-ISSN 1925-0754.
Godia, G. (2012). Kenya, a nation in transition opportunities and constraints, alignment of the
Education sector to the new Constitution; paper presented at Bowling Green University,
Ohio, USA.
Goe, L. (2007). The Link between Teacher Quality and Student Outcomes: A Research Synthesis.

265
GOK (2010). Kenya national strategic plan. Ministry of planning and national development and
vision 2030. Nairobi, Kenya: Government Printer
Gove A, & Dubeck. M. (2014). The early grade reading assessment (EGRA): Its theoretical
foundation, purpose, and limitations. International Journal of Educational Development.
http://www.elsevier.com/locate/ijedudev
Gove, A., & Wetterberg, A. (2011). The early grade reading assessment: An introduction.
Chapter 1. In the early grade reading assessment: Applications and interventions to
improve basic literacy, ed. A. Gove and A. Wetterberg, 1–38). Research Triangle Park,
North Carolina, USA: RTI Press.
Gove, A., Korda, Poole, M. & Piper, B. 2017. Designing for scale: Reflections on rolling out
reading improvement in Kenya and Liberia. New directions for child and adolescent
development, 2017, 77-95.
Green, A. (2017). The crisis for young people: Generational inequalities in education, work,
housing and welfare. Cham, Switzerland: Springer. Retrieved from https://link.springer
.com/book/10.1007%2F978-3-319-58547-5
Greenwood, M. (2007). Stakeholder Engagement: Beyond the Myth of Corporate
Responsibility, Journal of Business Ethics, 74, 315-327
Gregory, A., & Roberts, G. (2017). Teacher beliefs and the over-representation of Black students
in classroom discipline. Theory into Practice, (online).
https://doi.org/10.1080/00405841.2017.1336035
Grimble, R. & Chan, M.K. (1995). Stakeholder analysis for natural resource management in
developing countries: Some practical guidelines for making management more
participatory and effective," Vol 19 no. 2: 113-124.
Grimm, Kelvin J., 2008, longitudinal associations between reading and mathematics
achievement Volume 33, 2008 – journal, Issue 3: Mathematics Ability, Performance, and
Achievement
Grosser, M. (2007). Effective Teaching: Linking teaching to Learning Functions. South African
Journal of Education, 27(1), 37-52
sajournalofeducation.co.za/index.php/saje/article/view/49 Retrieved 10.09.2013
Grüning M (2002) Performance-measurement-system –Messung und Steuerung von Unterneh-
mensleistung. Dissertation, Technische Universität Dresden
Guajardo, J., & Ochoa, C. (2012). Literacy Boost: Lessons from assessment and community.
Presentation at the All Children Reading Workshop, July, Rwanda

266
Guijt, I. (2009). Participatory Monitoring and Evaluation for natural resource management and
research. Socio-economic Methodologies for Natural Resources Research. Chatham, UK:
Natural Resources Institute
Guijt, I., & Gaventa, J. (1998). Participatory Monitoring & Evaluation. Institute of Development
Studies (IDS) Policy Briefing Issue 12.
Gujarati, D and Porte (2009). Multicolonearity: what happens if the Regression are correlated?
Basic Econometrics (4th ed.) New Delhi: McGraw-Hill.
Hagen-Zanker J, Duvendack M, Mallett R, Slater R, Carpenter S, Tromme M: Making
systematic reviews work for international development. SecureLivelihoods Research
Consortium Briefing Paper 1.London: Overseas Development Institute; 2012
Hair, J. F., Anderson, R. E., Tatham, R. L., & Black, W.C. (1998). Multivariate Data
Hanushek, Eric A., and Dennis D. Kimko. 2000. "Schooling, labor force quality, and the growth
of nations." American Economic Review 90, no. 5 (December):1184-1208.
Harris, R. L and. Brown, L. T (2014). The future of self-assessment in classroom practice:
Reframing self-assessment as a core competency Frontline Learning Research 3 (2014)
22-30
Hassan, D. (2016). Technology in Language Teaching. M.A Thesis. University of Gezira.
Heikkila, T. and Gerlak, A. K. (2005). The formation of large-scale collaborative resource
management institutions: clarifying the roles of stakeholders, science, and institutions.
The Policy Studies Journal, 3 (4), pp. 583-612
Heitink, M. C., Van der Kleij, F. M., Veldkamp, B. P.,Schildkamp, K., & Kippers, W. B. (2016).
A systematic review of prerequisites for implementing assessment for learning in
classroom practice. Educational Research Review, 17,50–62.
doi:10.1016/j.edurev.2015.12.002
Heugh, K., Benson, C., Bogale, B and Gebre Yohannes, M.A. 2007. Final report: Study on
medium of instruction in primary schools in Ethiopia. Commissioned by the Ministry of
Education, Ethiopia. September to December 2006. (Commissioned by UN Development
Programme in conjunction with Pooled Donor Consortium including DfID, Irish Aid,
Royal Netherlands Embassy, and FINNIDA.)
http://www.hsrc.ac.za/research/output/outputDocuments/4379_Heugh_Studyonmedium
ofinstruction.pdf
Hilhorst, T., & Guijt, I. (2006). Using Participatory Monitoring and Evaluation to Strengthen
Local Governance.Amsterdam: Royal Tropical Institute.

267
Hinnant-Crawford B, 2016 Education Policy Influence Efficacy: Teacher Beliefs in their Ability
to Change Education Policy International Journal of Teacher Leadership Western
Carolina University, USA
Hood, M., Conlon, E., & Andrews, G. (2008). Preschool home literacy practices and children’s
literacy development: A longitudinal analysis. Journal of Educational Psychology, 100,
252–271. doi:10.1037/0022-0663.100.2.252
Hughes, E. M., Powell, S. R., &Stevens, E. A. (2016). Supporting clear and concise mathematics
language. Teaching Exceptional Children, 49(1), 7-17.
Hulley, S.B. et al. (2007). Designing Clinical Research. 2nded. Philadelphia, PA: Lippincott
Williams & Wilkins.
Ika, L.A (2012). Project management for development: In Africa why projects are failing and
what can be done about it. Project Management Journal, 43 (4), 27-41.
Jackson, E. T., & Kassam, Y. (1998). Knowledge Shared: Participatory Evaluation in
Development Cooperation. Ottawa: International Development Research Centre.
Jamaal, N. (2018)effects of participatory monitoring and evaluation on project performance at
Kenya marine and fisheries research institute, Mombasa, Kenya international Academic
Journal of Information Sciences and Project Management (IAJISPM) | ISSN 2519-7711
Jepketer, A., Kisilu K., Ndunge, D. K. (2015). Teachers’ Classroom Strategy for Enhancing
Students’ Performance in Public Secondary Schools in Nandi County, Kenya IOSR
Journal of Humanities and Social Science (IOSR-JHSS) Volume 20, Issue 7, Ver. II (July
2015), PP 61-73 e-ISSN: 2279-0837, p-ISSN: 2279-0845.
Jodi Pilgrim & Elda E. Martinez, 2013. Defining Literacy in the 21stCentury: A Guide to
Terminology and Skills University of Mary Hardin-Baylo, University of the Incarnate
Word Texas Journal of Literacy Education Volume 1, Issue 1
Jose Carlos Suarez-Herrera, Jane Springett & Carolyn Kagan. 2009).Critical Connections
between Participatory Evaluation, Organizational Learning and Intentional Change in
Pluralistic Organizations
Jossey-Bass. Rogers, P. J. (2004) ‘Logic Models’, in S. Mathison (ed.) Encyclopedia of
Evaluation, pp. 232–4. Newbury Park, CA: SAGE
Judd, C. M. Muller, D. & Yzerbyt, V. Y. (2005). When moderation is mediated and mediation
is moderated. Journal of Personality and Social Psychology, 89 (6) 852-863
Kamrul A. & Indra G. (2010). Analysis of cost and schedule performance of international
development projects a department of management, faculty of business, auckland
university of technology, private bag 92006, auckland 1142, new Zealand b department

268
of mechanical and manufacturing engineering, auckland university of technology, private
bag 92006, auckland 1142, new Zealand
Kandie F. J (2014). Relationship between lower primary school teachers’ mathematics self-
efficacy and their pupils’ performance in mathematics in Kericho sub-county, Kenya.
Kang'ahi, M., et al (2012). Teaching Styles and Learners' Achievement. International Journal of
Academic
Karemesi, J. (2010). Universalizing primary education in Kenya, Is it sustainable? Surfing the
Web: http://usbec.wordpress.com Retrieved 14/11/2012.
Karim, J. A. (2011). Project management information systems (PMIS) factors; an empirical
study of their impact on project management decision making (PMDM) performance.
Research Journal of Economics Business and ICT 2, 22-27.
Kasiisa.F.&Tamale.B. (2013).Effect of Teacher’s Qualification on The Pupils Performance in
Primary School Social Studies: Implication on Teacher Quality in Uganda. International
Journalof Innovative Education Research.1 (3) 69-75.
Kathogo, S. M. & Kamau, L. (2018). Influence of Participatory Monitoring and Evaluation on
Performance of Public Secondary Schools Projects in Mutomo Sub-County, Kenya.
International Journal of Scientific Research and Management, 6(3): 154-168.
Kathuku, R. M (2013) factors influencing parents’ involvement in children’s academic
achievement in early childhood education in kathonzweni district University of Nairobi
Publication
Kerlinger, F.N. (1986). Foundations of Behavioral Research, 3rdEd. Holt Rinehart and Winston
Kerzner, H. (2003). Project management workbook (8th ed.). Wiley, London
Kiarie, J.T & Mugo, W. J, (2017), Pre-school teachers’ attitude influencing their preparation of
teaching instruments in uasin gishu county, Kenya. European Journal of Education
Studies ISSN: 2501 -1111ISSN-L: 2501 -1111.Available on-line at: www.oapub.org/ed
Kim, Y.-S. G., Boyle, H. N., Zuilkowski, S. S., & Nakamura, P. (2016). Landscape Report on
Early Grade Literacy. Washington, D.C.: USAID
Kimbui, C. (2012, 20th June). Eastern Region assured of governments resolute to education,
Kibwezi KNUT boss calls for quality education News, pp. 10, 9.
Kiptum J. K., Rubai, M. O. & Murira, F. N. (2018). An Assessment of How Work Environment
Influence Teachers’ Satisfaction in Elgeyo Marakwet County

269
Klagegg, O. J., Samset, K., & Magnussen, O. M., (2005). Improving Success in Public
Investment Projects: Lessons from Government Initiative in Norway to Improve Quality
at Entry. Paper presented at the 19th IPMA World Congress
Klakegg, O.J., Williams, T., Magnussen, O.M., (2009).Governance Frameworks for Public
Project Development and Estimation. Project Management Institute, Inc, Newton Square,
PA, USA
KNEC, (2012). The Year 2011: Kenya National Examination Council Report. Nairobi: Kenya
National Examination Council.
Kordia M., Gove, A. & Piper, (2017). Designing for scale: reflect out reading improvement in
Kenya and Liberia. In A. Gove, A. Mora, (Eds.), New directions for child and Adolescents
development: no155. Literate world: early reading interventions in low and middle-
income 77-95) San Francisco, CA: Jossey -bass. https://doi.org/10.1002/cad.
Kosgei, Anita, Mise, Jairo Kirwa, Odera, Odhiambo, Ayugi, & Mary Evelyn (2013). Influence
of teacher characteristics on students' academic achievement among secondary schools
Journal of Education and Practice, 4 (3). pp. 76-82. ISSN 2222-1735
Kothari, C. R. (2004). Research Methodology-Methods and Techniques. New Delhi: New age
international (p) limited publishers.
Kothari, C.R. (2007). Research methodology; methods and techniques. 2nd ed. New Delhi: New
Age.
Kraiger, K. (2013). Benefits of training and development for individuals and teams,
organizations, and society. Annual review of psychology, 60, 451-474.
Kraiger, K., Ford, J. K., & Salas, E. (2014). Application of cognitive, skill-based, and affective
theories of learning outcomes to new methods of training evaluation. Journal of applied
psychology, 78(2), 311.
Kristal Miller, Maura McdAdam & Rodney McdAdam, 2014) the changing university business
model: a stakeholder perspective volume 3 business model innovation Wiley online
library
Kunje D. & Meke, E.S. (2009). An Investigation of the Relationship between School and Pupil
Characteristics and Achievement at the Basic Education Level in Malawi University of
MalawiKeiichi OgawaKobe University, Japan.
Kusek, J. & Rist R. (2004). Ten steps to a results-based monitoring and evaluation system.
Washington: The World Bank.

270
Kusek, Jody Zall & Rist, Ray C. (2004). A Handbook for Development Practitioners: The Steps
to A Result-Based Monitoring and Evaluation System. The World Bank, Washington,
D.C.
Laursen, S., & Hassi, M.L. (2012). Outcomes of inquiry-based learning for pre-service teachers:
A multi-site study. In (Eds.) S. Brown, S. Larsen, K. Marrongelle, and 147M. Oehrtman,
Proceedings of the 15th Annual Conference on Research in Undergraduate Mathematics
Education, p. 88-94, Portland, Oregon
Leigh, A. & Mead, S. (2005). Lifting Teacher Performance. Retrieved on 27th June, 2015.
Lepine, A. (2015).School Reputation and School Choice in Brazil: a Regression Discontinuity
Design. Department of Economics FEA-USP, Working Paper No.2015-
38.www.repec.eae.fea.usp.br/documentos/AndreaLepine_38WP.pdf
Linda, F. (2013).The use of interventions for promoting reading development among struggling
readers Linnaeus University Dissertations No 123/2013. ISBN: 978-91-87427-13-8.
Written in English.
Little, J. W. (2012). Understanding data use practice among teachers: The contribution of micro-
process studies. American Journal of Education, 118(2), 143–166.doi:10.1086/663271
Llamas, A.V. & Tuazon, A. P. 2016. School practices in parental involvement, its expected
results and barriers in public secondary schools: International Journal of Educational
Science and Research, 6(1):69-78.
Lloyd, A. (2010). Information literacy landscapes: Information literacy in
education, workplace and everyday contexts. Oxford: Chandos.London:
IIED.
Long, R. (2009). Research methodology: A step by step for beginners. London: Sage publication.
Lorenzen, M. (2001). Active learning and library instruction. Retrieved March 7, 2008, from
http://www.libraryinstruction.com/active/html
Loughran, J., & Hamilton, M. (2016). Developing an understanding of teacher education. In J.
Loughran & M. Hamilton (Eds.), International Handbook of Teacher Education Volume
1(pp. 3-22). Dordrechdt: Springer.https://doi.org/10.1007/978-981-10-0366-0_1
Lucas, A. M., McEwan, P. J., Ngware, M., & Oketch, M. (2014). Improving primary school
quality across countries: Experimental evidence from Kenya and Uganda.
Lydia. Mbaki, Musau, Urisulla Okoth, & Phylisters Matula, 2017) Impact of Students’ Exposure
to Electronic Media Facilities in Their Homes on Parental Involvement in Management
of Students’ Discipline in Public Day Secondary Schools in Kenya European Scientific
Journal · November 2017

271
Lyn, S.L. and John, A.O. (2014), “Influence of Kenya vision 2030’s education policy on quality
education in public secondary schools in Nakuru district, Kenya”, Journal of Education
and Practice, Vol. 5No. 13, pp. 69-80.
Mackatiani. C. I (2017) Influence of Examinations Oriented Approaches on Quality Education
in Primary Schools in Kenya Journal of Education and Practice ISSN 2222-1735 (Paper)
ISSN 2222-288X
Mackatiani. I.C, (2017) Influence of Examinations Oriented Approaches on Quality Education
in Primary Schools in Kenya Journal of Education and Practice ISSN 2222-1735 (Paper)
ISSN 2222-288X (Online)
Makori A. & Onderi, H. (2013). Evaluation of Secondary School Principals’ Views on the Use
of Untrained Teachers in Lesson Delivery in a Free Secondary Education System Era in
Kenya Journal of Education and Practice www.iiste.orgISSN 2222-1735 (Paper) ISSN
2222-288X (Online)Vol.4, No.24,
Makori, A. (2013) Implementation of Universal Primary Education in Kenya: An Analysis of its
Impact and Progress towards Achieving the EFA Goal in Kisii District
Makori, J. O & Wanyoike, D. (2015). Assessment of result based monitoring and evaluation on
performance of donor funded value chain projects in Kenya. International Journal of
Economics, Commerce and Management United Kingdom Vol. III, Issue 6, June 2015
Marangu S.K. (2015). Parental involvement and the literacy development of preschoolers in
langata division:
Marias, P. (2016). We can’t believe what we see”: Overcrowded classrooms through the eyes of
student teachers Department of Early Childhood Education and Development, School of
Teacher Education, University of South Africa, South Africa South African. Journal of
Education, Volume 36, Number 2, May 2016.
Marie, A. R. (2011). Influence of Exposure to Children’s Literature on Teachers’ and Students’
Knowledge of and Attitudes toward Reading Auburn, Alabama University.
Marima E. W. (2014). Preferred methods of teaching reading in early childhood classes in
Dagoretti and Westlands divisions in Nairobi County, Kenya.
Marima, E. W. & Kang’ethe R.W. & Mary N. Run (2016). Instructional Constraints in Teaching
of Reading in Early Childhood Classes in Nairobi County, Kenya. Journal of Education
and Practice Vol.7, No.30, 2016 www.iiste.org ISSN 2222-1735 (Paper) ISSN 2222-
288X (Online
Marima, E.W. (2015). Approaches used to teach reading in Early Childhood in Dagoretti and
Westlands division in Nairobi. A Published PhD Thesis, Kenyatta University.

272
Masabo.P. L, Muchopa. D.E&. Kuoth B.G (2017) Parental Involvement in School Activities in
Kibondo District, Tanzania: Challenges and Remedies International Journal of Education
and Research
Matonda, Ondieki, George, M., & Emmah, N. (2013). Influence of Participatory Monitoring and
Evaluation Approaches on the Practice of Quality Assurance in Kenya Secondary
schools,. Interdisciplinary. Journal of Contemporary Research in Business, 5(3).
Mayama, L. (2012). Effects of proprietor Interests on Quality of Education in private secondary
schools in Bungoma South District in Kenya. Unpublished M.Ed. Thesis, Masinde Muliro
University of Science and Technology.
McEwan, P. J. (2015). Improving learning in primary schools of developing countries: A meta-
analy-sis of randomized experiments. Review of Educational Research, 85(3), 353–394.
https ://doi.org/10.3102/00346 54314 55312 7
McKenna, MC& Kear, DJ (1990). ‘Measuring attitude toward reading: A new tool for teachers’,
The Reading Teacher, 43(9): 626-639
Mege, C.A. (2014). Influence of school environmental factors on teaching-learning process in
public primary schools in lower Nyokal division,Hhoma-bay district, Kenya
Merriam. S. B. (2009). Qualitative research: A guide to design and implementation. San
Francisco, CA: John Wiley.
Mertens, D.M. (2005). Research methods in education and psychology: Integrating diversity
with quantitative and qualitative approaches. (2nd ed.) Thousand Oaks: Sage.
Mertins, D.M (2005). Research methods in education and psychology: integrating diversity with
quantitative and qualitative approaches 2nd ed. Thousand Oaks; Sage. Metropolis in
Nigeria, Ozean Journal of Social Science, 4(3)163- 175
Midida, P.K., Gakure, R. N. & Orwa. G. O. (2013). Effects of organization leadership on
adaption of integrated human resources management information systems for service
delivery in the civil service. A case of civil service in Nairobi international version Journal
of Social Sciences and Entrepreneurship.
Ministry of Devolution and Planning, (2013).Nandi County Development Profile,
(2013)..Ministry of Devolution and Planning. Nairobi: The Government Printer.
Ministry of Education Science and Technology,(2010). Delivering Quality Equitable and
Training to all Kenyans, Kenya Education Sector Support Programme 2005-2010.Nairobi:
Mitchell, R. K., Agle, B. R., & Wood, D. J. (1997). Toward a theory of stakeholder identification
and salience: Defining the principle of who and what really counts. Academy of
Management Review, 22(4), 853-886.http://dx.doi.org/10.5465/AMR.1997.9711022105.

273
Mkutano, S. M. & Sang, P. (2018). Project management practices and performance of non-
governmental organizations projects in Nairobi City County, Kenya. International
Academic Journal of Information Sciences and Project Management, 3(3), 1-22
MOEST (2013) Basic Education Act Nairobi: Government Printers.
Mogapi, M (2016). Examinations Wash Back Effects: Challenges to the Criterion Referenced
Assessment Model. Journal of Education and e-Learning Research, 3(3): 75-86.
Moila, M. (2006). “The Use of Educational Technology in Mathematics Teaching and Learning:
An Investigation of a South African Rural Secondary School”. Doctoral Dissertation,
University of Pretoria.
Møller, J. (2015). Norway: Researching Norwegian princi-pals. In H. Arlestig, C. Day, & O.
Johansson (Eds.), Adecade of research on school principals cases from 24 coun-tries,
series: Studies in educational leadership(Vol. 21, pp.77–101). Switzerland: Springer
international Publishing.
Monique Seneschal (2006) Testing the Home Literacy Model: Parent Involvement in
Kindergarten Is Differentially Related to Grade 4 Reading Comprehension, Fluency,
Article in Scientific Studies of Reading · January 2006 DOI:
10.1207/s1532799xssr1001_4.
Moonga B.G, (2016) an evaluation of the use of early literacy learning and teaching materials
by grade 1-4 teachers in selected schools of chikankata district of zambia.
Morgan .P.F, (2015) “A brief History of current Reemergence of contemplative Education,”
Journal of transformative education 3(3):197-218.
Morgan, D. (2007). Paradigms lost &pragmatism regained: methodology implications of
combining qualitative and quantitative methods. Journal of Mixed Methods, 1(1), 48-76.
Motshekga A. (2012). Pupil teacher ratio at 30.4:1. Politics web, 12 September. Available
athttp://www.politicsweb.co.za/party/pupil-teacher-ratio-at-3041--angie-motshekga.
Accessed 5 December2014
Mugambi D. & Wang’eri, T. (2014). Peer Teaching As a Predictor of Reading Motivation and
Literacy Achievement among Standard Two Pupils in Nairobi and Tharaka – Nithi
Counties, Kenya. Journal of Educational Policy and Entrepreneurial Research (JEPER).
ISSN: 2408-6231 Vol.1, N0.4, December 2014. Pp 128-139
Mugenda, O. M., & Mugenda, A. G. (2008).Social Science. Applied Research & Training
Services. Nairobi: Kenya
Mugenda, O., & Mugenda, A. (2003). Research Methods; Quantitative and qualitative
Approaches. (2nd Ed). Nairobi: Acts Press.

274
Mugo, J. K, Mwoma, T.B & Limboro, C.M. (2011).Teaching for Improved Learning. A
Classroom Observation and communication Study Report of a WERK/World Bank Study,
November 2011
Muir, T. (2009). At home with numeracy: Empowering parents to be active participants in their
child‟s numeracy development. In R. Hunter, B. Bicknell & T. Burgess (Eds.), Crossing
divides (Proceedings of the 32nd annual conference of the Mathematics Education
Research Group of Australasia, pp. 395-402). Wellington, NZ: MERGA.
Mulongo, G. (2013). Effects of active learning teaching methodology on learner participation.
A Journal of Education and Practice. ISSN 2222-1735.
Muriithi J. Muiga (2015) Factors influencing the use of monitoring and evaluation systems of
public projects in Nakuru county, university of Nairobi.
Muriungi, M 2015). The role of participatory monitoring and evaluation programs among
government corporations: a case of Ewaso ngi’ro north development authority.
International Academic Journal of Social Sciences and Education | Volume 1, Issue 4, pp.
53-76.
Murnane, R. J., & Willett, J. B. (2011). Methods matter: Improving causal inference in
educational and social science research. New York: Oxford University Press
Murungi C. G. (2013). Reasons for low enrolment in Early Childhood Education in Kenya:
Parental perspective. International Journal of 106 Education and Research Vol.1 No.5
May 2013. Retrieved on 12th may 2014from:
https://www.google.com/?gws_rd=ssl#q=study+by+catherine+gakii+mu
Musyoka, L. (2013). Influence of provisions of school physical infrastructure on students‟
performance in Kenya Certificate of Secondary Education in Mwingi Central District,
Kenya. Unpublished M. Ed. Project, University of Nairobi.
Muthusamy, N., (2015) teachers’ experiences with overcrowded classrooms in a mainstream
school Educational Psychology, School of Education, University of KwaZulu-Natal
Mwagi, J. K., Nyang’wara, B. M., & Kulet. (2015). Factors affecting the effectiveness of
monitoring and evaluation of constituency development fund projects in Kenya: a case
study of Laikipia West constituency. In Journal of Economics and Finance, 6(1), Ver 1.
Retrieved from www.iosrjournals.org
Nachmias CF, Nachmias,D.(1996). Research Methods in The social Sciences (5th ed). London:
St. Martin’s Press Inc
Naido, L. A. (2011). The role of M&E IN Promoting good governance in S.A. A case of the
department of social development (Doctoral Dissertation University of Witwatersrand)

275
Nderitu, E.N. (2014). School-contextual factors influencing grade two pupils’ acquisition of
reading skills in laikipia county, Kenya Kenyatta University.
Nduta J. N, (2014). Factors influencing integration of human rights education in Public
secondary school curriculum in Kasarani sub county, Nairobi city County Kenya
Nelson, J. (2014), “Input-output relationship and the quality of education in day secondary
schools in Kenya”, International Journal of Community and Cooperative Studies, Vol. 1
No. 2, pp. 42-50.
Newcombe, R. (2003). From client to project stakeholders: a stakeholder mapping approach.
Construction Management and Economics, 21: 841-848.
Ngatia, C. (2016). Institutional determinants of participatory monitoring and evaluation systems
implementation among community based development projects in Kibera slum, Kenya.
Ngugi, J. Muigai, S. & Muhoro, S. (2014). Transforming agriculture through contracted
extension service delivery systems: The case of Kenya’s agricultural productivity and
agribusiness project. African Crop Science Journal, 22(4), 905-915
Nimo Jamaa 2018,Effects of participatory monitoring and evaluation on project performance at
Kenya marine and fisheries research institute, Mombasa, Kenya International Academic
Journal of Information Sciences and Project Management (IAJISPM) | ISSN 2519-7711
Njaggah, M. N., (2003). Factors influencing the performance of mathematics among public
secondary school students in Nairobi province.
Njenga E. M. (2016). Teacher related factors influencing pupils’ performance of mathematics at
kenya certificate of primary education in public schools in likoni sub-county, Kenya.
Njogu, E.M. (2016). Influence of stakeholder’s involvement on project performance: A case of
Nema automobile emission control project in Nairobi county, Kenya University of
Nairobi.
Njuguna G. N. (2018). Determinants for adoption of quality management system in project
implementation: a case of Nyandarua county government construction projects, Kenya
university of Nairobi.
Njuguna, P K. (2016). Factors influencing the performance of monitoring and evaluation systems
in non-governmental organizations funded educational projects in Murang’a County,
Kenya.
Njuki, J., Kaaria, S., Colletah, C. & Sanginga, P. (2006). Participatory monitoring and
evaluation for stakeholder engagement, assessment of project impacts, and for
institutional and community learning and change enabling rural innovation in Africa,
CIAT-Africa.

276
Nthenge, N. P. (2014). Influence of Participatory Monitoring and Evaluation on Performance
of Public Private Partnership Projects in Nairobi County, Kenya. Unpublished Master of
Arts in Project Planning and Management Thesis: University of Nairobi.
Nturibi, P. (2015). Influence of school infrastructure on academic performance in public primary
schools in Ruiri location-Meru County, Kenya.
Nyabuto P. N. (2014). Influence of participatory monitoring and evaluation on performance of
public private partnership projects in Nairobi County, Kenya University of Nairobi
Nyonje, R. O., Ndunge, K. D. & Mulwa, A. S. (2012). Monitoring and Evaluation of Projects
and Programs - A Handbook for Students and Practitioners. Nairobi, Kenya: Aura
Publishers.
Nzweke, J. O., Ladejo, E. P. Emoh, F. (2015). Assessment of factors responsible for successful
Project Implementation in Anambah State. Nigeria Civil environment Research, 7(8)
2224-5790.
O’Brien R. M (2007) A caution regarding rules of thumb for variance inflation factors. Quality
and Quantity Springer 41: 673-690.
Ochieng E. G. & Zuofa, T., (2014). Project failure: The way forward and panacea for
development. International Journal of Business and Management, 9(11), 59-71
Ogutu O. M. (2016).Influence of free primary education on teaching and learning of the English
language in public primary schools, Eldoret municipality, Kenya Kenyatta university.
Ohanyido, C. (2012). The pivotal role of education in Africa’s development. Global education
conference. Connecting educators and organization worldwide.
Okello, O. L. & Mugambi, F. (2015). Determinants of effective M E systems of public health
programs. A case study of school-based hand washing program in Kwale County, Kenya.
International journal of Economics, Finance Management sciences 3(3) 235-251
Olander, S., (2007). Stakeholder impact analysis in construction project management.
Construction Management and Economics. Vol. 25(3), 277-287. Doi: 10.1080/
0144190600879125
Olson, J and Platt, J. (2000). The Instructional Cycle. Teaching Children and Adolescents with
Special Needs. Upper Saddle River, NJ: Prentice-Hall, Inc.
Olson, Mancur (2000).Power and Prosperity: Outgrowing Communist and Capitalist
Dictatorship New York: Basic Books
Omo, A. (2011). Quality of Teachers and Performance: Evidence from Schools in Ibadan

277
Ong’ang’a, H. & Ouko, M. (2015). Determinants of standard one pupil’s achievements in
Learning and Numeracy in Gucha district, Kisii, County. (Kenyatta University
Orodho, J.A. (2009).Elements of educational and social science researchmethods. Second
edition. Maseno. Kanzja publishers.
Otieno R O, 2018.Participatory Monitoring and Evaluation: An Overview of Guiding
Pedagogical Principles and Implications on Development International Journal of Novel
Research in Humanity and Social Sciences Vol. 5, Issue 4, pp: (428-433), Month: July -
August 2018, Available at: www.noveltyjournals.com
Otieno, J.K.O., Munyua, C.N. & Olubandwa, A. (2016). Effects of Participatory Monitoring and
Evaluation on Stakeholder Relationships and Project Quality in the Local Authority
Service Delivery Action Planning (LASDAP) Process in Bondo Sub-County in Siaya
County, Kenya. Developing Country Studies, 6(4), 82-86.
Otieno, S. (2003). Kenya: A top achiever of universal education. The East African Standard.
Retrieved October, 23rd 2004 from http:www.eaststandard.net
Ouko O.H. (2018) Early Learning Experiences and Teacher-Efficacy As Predictors of Pupils
“Competencies in Early Primary School Grades in Rural Kenya World Journal of
Innovative Research (WJIR) ISSN: 2454-8236, Volume-5, Issue-4, October 2018 Pages
33-40
Owino, E.O. (2013). The influence of service quality and corporate image on customer
satisfaction among university students in Kenya university of Nairobi.
Parker, T. C. (2004). An evaluation of students reading attitudes: Does ability affect attitudes)
university of North California at Washington.
Parnwell R N, (2015) influence of school infrastructure on academic performance in public
primary schools in Ruiri location-Meru County, Kenya. A Published Masters’ thesis
University of Nairobi.
Parvin, R. H., & Salam, S. F. (2015). The effectiveness of using technology in English language
classrooms in government primary schools in Bangladesh. FIRE: Forum for International
Research in Education, 2(1), 47-59. http://preserve.lehigh.edu/fire/vol2/iss1/5
Patton, M. Q. (2008). Utilization-focused evaluation (4th ed.). Thousand Oaks, CA: Sage.
Peter Liljedahl, 2015) Numeracy task design: a case of changing mathematics teaching
Petro M. (2016). “We can’t believe what we see”: Overcrowded classrooms through the eyes of
student teachers South African Journal of Education, Volume 36, Number 2, and May
2016.

278
Philip K. N. (2016). Factors influencing the performance of monitoring and evaluation systems
in non-governmental organizations funded educational projects in Murang’a County,
Kenya
Piper, B, Schroeder, L & Trudell, B.( 2016)Oral reading fluency and comprehension in Kenya:
reading acquisition in a multilingual environment Journal of Research in Reading, ISSN
0141-0423DOI:10.1111/1467-9817.12052Volume 39, Issue 2, 2016, pp 133–152
Piper, B. & A. Mugenda (2013). The Primary Math and Reading (PRIMR) Initiative: Midterm
impact evaluation. Prepared for USAID/Kenya under the education data for decision
making (EdData II) project, task order no. AID-623-M-11-00001. Research Triangle
Park, North Carolina, USA: RTI International.
Piper, B. & Mugenda. (2012). the primary math and reading initiative: baseline report. Prepared
for USAID/Kenya under the education data for decision making (EdData II) project, task
order no. AID-623-M-11-00001. Research Triangle Park, North Carolina, USA: RTI
International.
Piper, B. Ralaingita, W, Akacha, L. and King, S. (2016). Improving procedural and conceptual
mathematics outcomes: evidence from a randomized controlled trial in Kenya
Piper, B., & Mugenda (2014). The Primary Math and Reading (PRIMR) Initiative: Endline
impact evaluation. Prepared under the USAID EdData II project, Task Order No. AID-
623-M-11-00001 (RTI Task 13). Research Triangle Park, NC: RTI International.
http://pdf.usaid.gov/pdf_docs/pa00k27s.pdf.
Piper, B., & Zuilkowski, S. S. (2015). “Teacher coaching in Kenya: Examining instructional
support in public and non-formal schools.” teaching and teacher education 47: 173–183.
doi:10.1016/j.tate.2015.01.001.
Piper, B., & Zuilkowski, S. S. (2015). Assessing reading fluency in Kenya: Oral or silent
assessment? International Review of Education, 61(2), 153–171
Piper, B., Jepkemei, E., Kwayumba, D., & Kibukho, K. (2015). Kenya’s ICT policy in practice:
The effectiveness of tablets and e-readers in improving student outcomes .FIRE: Forum
for International Research in Education, 2(1).Retrieved
fromhttp://preserve.lehigh.edu/cgi/viewcontent.cgi?articleD1025&contextDfire
Piper, B., Ralaingita, W., Akach, L. & King, S. 2016a. Improving procedural and conceptual
mathematics outcomes: Evidence from a randomized controlled trial in Kenya. Journal of
Development Effectiveness, 8, 404-422
Piper, B., S. Simmons Zuilkowski, & Mugenda (2014). Improving reading outcomes in Kenya:
First-year effects of the PRIMR Initiative. International Journal of Educational
Development 37, 11–21. Available at: http://dx.doi.org/10.1016/j.ijedudev.2014.02.006
(accessed 13 March 2015).

279
Piper,B., Destefano, J. · Kinyanjui, M.E. & Ong’ele, S. (2018) scaling up successfully: Lessons
from Kenya’s Tusome national literacy program Journal of Educational Change 19:293–
321https://doi.org/10.1007/s10833-018-9325-41.
Piper. B., Jepkemei, E. & Kibukh, K. (2015). Pro-poor primr: improving early literacy skills for
children from low-income families in Kenya journal Africa education review volume 12,
2015 – issue.
Piper.M, Destefano. J, Kinyanjui. E M & Ong’ele .S (2018) scaling up successfully: Lessons
from Kenya’s Tusome national literacy program journal of Educational Change (2018)
19:293–321https://doi.org/10.1007/s10833-018-9325-4
Practice ZDM Mathematics Education (2015) 47:625–637 DOI 10.1007/s11858-015-0703-6
Prado, J. C., & Marzal, M. Á. (2013). Incorporating data literacy into information
literacy programs: Core competencies and contents. Libri, 63(2), 123–134.
Pretorius, E. J. (2015). Failure to launch: Matching language policy with literacy
accomplishment in South African schools. International Journal for the Sociology of
Language, 234, 47–76.
Pritchett, L. (2015). Creating education systems coherent for learning outcomes: Making the
transition from schooling to learning RISE [Research on Improving Systems of Education]
working paper 15/005, Center for Global Development, Washington, DC. Retrieved June
18, 2018 from https: //www.risep rogra mme.org/sites /www.riseprogra mme.org/files
/inlin e-files /RISE_WP-005_Pritchett_1.pdf.
Priyanga, P. & A.R.Nadira Banu Kamal, 2017) Methods of Mining the Data from Big Data and
Social Networks Based on Recommender System International Journal of Advanced
Networking & Applications (IJANA) Volume: 08, Issue: 05 Pages: 55-60
Prøitz, T. S., Mausethagen, S., & Skedsmo, G. (2017).Investigative modes in research on data
use in education. Nordic Journal of Studies in Educational Policy, 2016(1).
Proudlock, K. and Ramalingam, B. (2008). ‘Re-thinking the impact of humanitarian aid:
background paper for the 24th ALNAP Biannul. London: ALNAP
Provost, C.(2014). Oneinfour young people in developing countries unable to read, saysUN.
Gurdian Global development The Guardian, Thursday 21 August (2008) BBC News IUKI
Education Poor Basic Skills Mar Progress.
Purcell, K., Buchanan, J., & Friedrich, L. (2013). The impact of digital tools on student writing
and how writing is taught in schools. Retrieved June 16, 2016 from
http://www.pewinternet.org/files/old-
media/Files/Reports/2013/PIP_NWP%20Writing%20and%20Tech.pd

280
Ralaingita, W., & Wetterberg, A. (2011). Gauging program effectiveness with EGRA: Impact
evaluations in South Africa and Mali. Chapter 3 in A. Gove and A. Wetterberg (eds.), the
Early Grade Reading Assessment, (83–112). Research Triangle Park, North Carolina,
USA: RTI Press.
Raymond, L. & Bergeron, F. (2008). Project management information system: An empirical
study of their impact on project manager’s project & performance. International Journal
of Project Management 26(2), 213-220.
Reder, S. (2017). Adults’ engagement in reading, writing and numeracy practices. Retrieved
from http://pdxscholar.library.pdx.edu/ling_fac/22
Richardson, G. (2015). Project management theory and practice. Taylor & Francis Group,
Boca Raton. Research Approaches to the Study of Literacy, Learning, and Technology
Rietbergen-McCracken, J. & Narayan, D. (1998). Participation and social assessment: tools and
techniques. Washington, DC, the World Bank.
Robert D. Behn, 2003 Why Measure Performance? Different Purposes Require Different
Measures Harvard University
Robinson, J. P., Winthrop, R., & McGivney, E. (2016). Millions learning: Scaling up quality
education in developing countries. Washington, DC: The Brookings Institution.
Robinson, J., S. Myran, R. Strauss, and W. Reed.2014. “The Impact of an
Alternative Professional Development Model on Teacher Practices in
Formative Assessment and Student Learning. “Teacher Development18
(2): 141–162. doi:10.1080/13664530.2014.900516
Rodriguez-Melo, A., & Mansouri, S. A. (2011). Stakeholder engagement: Defining strategic
advantage for sustainable construction. Business Strategy and the Environment, 20(8),
539-552.
Rogers, P. J. (2000) ‘Causal Models in Program Theory Evaluation’, in P. J.
ogers, A. J. Petrosino, T. Hacsi and T. A. Huebner (eds) Program Theory
Evaluation: Challenges and Opportunities,pp. 47–55, New Directions in
Evaluation series. San Francisco, CA: Jossey-Bass.
Rossman, G. B. (2015). Participatory Monitoring & Evaluation. Amherst: The Center for
International Education, University of Massachesetts
Rowley, T. J. The Power of and in Stakeholder Networks. In: Wasieleski, D. M.; Weber, J. (Eds).
Stakeholder Management. Series Business and Society 360. Emerald Publishing Limited,
2017. p. 101-122

281
RTI International. (2014). Early grade mathematics (EGMA) toolkit. Research Triangle Park,
NC: RTI. Retrieved June 18, 2018, from https: //share d.rti.org/conte nt/early -grade -
mathe matic s-asses sment-egma-toolk it.
RTI International. (2014). Education Data for Decision Making (EdData II): National early
grade literacy and numeracy survey–Jordan. Intervention impact analysis report. Final
report. Prepared for USAID under EdData II Task Order AID278-BC-00019 (RTI Task
16). Research Triangle Park, NC: RTI.
https://www.eddataglobal.org/math/index.cfm?fuseac tion=pubDetail&ID=794.
RTI International. (2015). The Primary Math and Reading (PRIMR) Initiative, DFID/Kenya
Rural Expansion Programme: Bungoma and Machakos endline study. Prepared under
DFID Component Code 202657-108, Purchase Order 40064649. Research Triangle Park,
NC: RTI International. https://www.eddataglobal.org/countries/index.cfm?fuseac
tion=pubDetail&ID=806.
RTI International. (2016). The Early Grade Reading Assessment toolkit, second edition.
Prepared for USAID under the Education Data for Decision Making (EdData II) project,
task order no. AIDOAA-12-BC-00003 (RTI Task 20), USAID, Washington, DC.
Retrieved June 18, 2018 from http://
Runo, M. N, Mugo, J.K & Karugu, G.K. (2013). Teachers, Methods and Materials: Exploring
Opportunities and Challenges in Learning to Read in Primary Schools in two Kenyan
Contexts. Journal of Special Needs and Disabilities Studies. Vol No.1.
Rutherford-Becker & Vander W. (2012). evaluation of the Relationship Between literacy and
Mathematics skills As Assessed By Curriculum-Based Measures University of California,
Riverside World Literacy Foundation. The Oxford Declaration. Retrieved
fromhttp://www.oxforddeclaration.org/
Sailors, M., & Flores, M. (2014). Cost effectiveness of a complementary reading program.
Journal of Education and Human Development, 3(4), 1–20.
https://doi.org/10.15640/jehd.v3n4a1
Saleh, A. (2015) Developing a performance measurement framework for municipal construction
projects in Saudi Arabia Edinburgh Napier University.
Sangole, N., Kaaria, S., Jemimah, N., Lewa, K., &Mapila, M. A. (2014). Community based
participatory monitoring and evaluation: Impacts on farmer organization functioning,
social capital and accountability.Journal of Rural and Community Development,9(2).
Santoro, N., & Kennedy, A. (2015). How is cultural diversity positioned in teacher professional
standards? An international analysis. Asia-Pacific Journal of Teacher Education, 44(3),
208-223. https://doi.org/10.1080/1359866X.2015.1081674

282
Sanyal, B.C., (2013). Quality Assurance of Teacher Education in Africa: Fundamentals of
Teacher Education Development 5. Addis Ababa. UNESCO-International Institute for
Capacity Building in Africa
Sapungan, G.M. & Sapungan, R. M. 2014. Parental Involvement in Child’s Education:
Importance, Barriers and Benefits. Asian Journal of Management Sciences and Education,
3(2): 42-48.
Saunders, M., Lewis, P., & Thorn hill, A. (2009). Research Methods for Business Students
(5thed.). Harlow: Pearson Education Limited.
Schildkamp, K., Karbautzki, L., & Vanhoof, J. (2014).Exploring data use practices around
Europe: Identifying enablers and barriers. Studies in Educational Evaluation, 42, 15–24.
doi:10.1016/j.stueduc.2013.10.007
Şengül B. T. (1990). A study on reading habits of social studies and history teachers in Turkey
Vol. 12(10), pp. 569-582, 23 May, 2017 DOI: 10.5897/ERR2017.3245 Article Number:
467E87F64521 ISSN 1990-3839.
Şengül Bircan Tuba, 2017. A study on reading habits of social studies and history teachers in
Turkey. Karatekin University, Turkey. Vol. 12(10), pp. 569-582, 23 May, 2017DOI:
10.5897/ERR2017.3245Article Number: 467E87F64521ISSN 1990-3839 Copyright ©
2017Author(s) retain the copyright of this articlehttp://www.academicjournals.org/ERR
Shannon M. (2014). Literacy instruction in math classes State University of New York at
Fredonia, New York.
Siddiqui, N., Gorard, S. & See, B.H, (2015) Accelerated Reader as a literacy catch-up
intervention during primary to secondary school transition phase. Journal on Research
gate education
Sim, V. (2014). Educational measurement and evaluation. Journal of educational research
Simmons, R., & Birchall, J. A. (2005). Joined-up Approach to User Participation in Public
Services: Strengthening the Participation Chain“. Social Policy & Administration, 39(3),
260-283.
Simons, R. (2010). Performance Measurement and Control Systems for Implementing Strategy:
Text and Cases, Upper Saddle River, New York: Prentice-Hall
Sirinides, P., May, H., Gray, A., Goldsworthy, H., Armijo, M., Sam, C., Gillespie, J.N., &
Tognatta, N. (2015). Year one results from the multisite randomized evaluation of the i3
scale-up of Reading Recovery. American Educational Research Journal, 52(3), 547-581.

283
Snyder, P. A., Hemmeter, M. L., & Fox, L. (2015). Supporting implementation of evidence-
based practices through practice-based coaching. Topics in Early Childhood Special
Education, 35(3), 133–143.
Sokol-Oxman, L. (2015). Implementation of a Participatory Approach to Monitoring and
Evaluation: Literature Review & Case Study Application. Washington, DC: Capstone
Collection.
Somekh, B. & Lewin, C. (2005) Research Methods in Social Sciences, sage publication, Inc.,
Thousand Oaks, CA.
Spillane, J. P. (2012). Data in practice: Conceptualizing the data-based decision-making
phenomena. American Journal of Education, 118(2), 113–141.
Spratt, J., Simon King, and Jennie Bulat. (2013). “Inde-pendent Evaluation of the Effectiveness
of Institute pour education Popularizer’s ‘Read-Learn-Lead’ (RLL) Program in Mali: End
line Report.” Research Triangle Institute, Research Triangle Park, NC
Stephanie Missonier & Sabrina Loufrani-Fedida (2014). Stakeholder analysis and engagement
in projects: From stakeholder relational perspective to stakeholder relational ontology
HEC Lausanne-UNIL, Faculty of Business and Economics, Dorigny ISI, Bat Internef 131,
1015 Lausanne, Switzerland University of Nice-Sophia Antipolis, Research Center
GREDEG UMR 7321 UNS-CNRS, 250 rue Albert Einstein, 06560 Sophia-Antipolis,
France.
Stephanus Gert Pretorius (2013). Teacher Effectiveness in the South African Context: First Steps
towards a Comprehensive Definition J Soc Sci, 36(3): 235-246.
Steyn, G.M. (2014). Implementing result-based management in the public sector of developing
countries what should be considered? Mediterranean Journal of Social Sciences, 5(20).
Sujuit S &Nadem T., (2012). Determinants of Academic Performance of University Students
Pakistan Journal of Psychological Research 27
Survey of 704 NSF principal investigators. PLOS Computational Biology 13 (10):e1005755.
https://doi.org/10.1371/journal.pcbi.1005755
Teddlie, C., & Tashakkori, A. (2009). Foundations of mixed methods research: Integrating
quantitative and qualitative approaches in the social and behavioral sciences. Los Angeles,
CA: Sage.
Tenopir C, Allard S, Sinha P, Pollock D, Newman J, Dalton E, Frame M, Baird L (2016) Data
management education from the perspective of science educators. International Journal
of Digital Curation 11 (1): 232‑ 251. https://doi.org/10.2218/ijdc.v11i1.389

284
Tenopir C, Sandusky R, Allard S, Birch B (2014) Research data management services in
academic research libraries and perceptions of librarians. Library & Information Science
Research 36 (2): 84‑ 90. https://doi.org/10.1016/j.lisr.2013.11.003
Tine S. Prøitz, Sølvi Mausethagen & Guri Skedsmo (2017) Data use in education: alluring
attributes and productive processes, Nordic Journal of Studies in Educational Policy, 3:1,
1-5, DOI: 10.1080/20020317.2017.1328873
Toor, S. R., Ogunlana, S. O. (2010). Beyond the iron triangle; stakeholder perception of key
performance indicators (KPIs) for large- scale public sector development project.
International Journal of project management; 28(3), 228-236.
Tracy Hough, B.A., M.a (2016) sharing the looking glass: examining action research with early
literacy teachers in Lesotho, Africa
Turner, J.R & Muller, R. (2007). Matching the project manager’s leadership style to project type.
International Journal of Project Management. 25 (1), 21–32.
Tzanakis, M. (2013). Social capital in Bourdieu's, Coleman's and Putnam's theory: empirical
evidence and emergent measurement issues. Educate, 13(2), 2-23.
Umar, A. (2015). Use of Mind maps in Teaching Reading for ESP Students: A Case Study of the
Preparatory Students at UQU
UNESCO (2008). Global Literacy Challenge: A Profile of Youth and Adult Literacy at the Mid-
Point of the United Nations Literacy Decade 2003-2013. Paris, UNESCO.
UNESCO (2014). Teaching and Learning: Achieving Quality for All. EFA global monitoring
report 2013/4. Paris: UNESCO. http://unesco.nl/sites/default/files/dossier/ gmr_2013-
4.pdf? Download=1.
UNESCO (2014b). Lifelong learning. UNESCO Education Sector Technical Note. Available at
http://www.unesco.org/new/en/education/themes/strengthening-education-
systems/quality-framework/technical-notes/[accessed 8 May 2015].
UNESCO (2014c). Teaching and Learning: Achieving quality for all.EFA Global Monitoring
Report 2013/4.Paris:
UNESCO. (2012). Education for All Global Monitoring Report. Retrieved from http://en.unesco.
org/gem-report/sites/gem-
report/files/EDUCATION_IN_KENYA_A_FACT_SHEET.pdf
UNESCO. 2011. Financing Education in Sub-Saharan Africa Meeting the Challenges of
Expansion, Equity and Quality. UNESCO Institute of Statistics, Montreal.

285
UNESCO. 2018. Global Education Meeting 2018: Brussels Declaration.
https://unesdoc.unesco.org/ark:/48223/pf0000366394
UNESCO.UNESCO (2015). Education for All 2000–2015: Achievements and challenges. EFA
Global Monitoring Report 2015.Paris: UNESCO.
UNESCO-UNICEF (2013). Making education a priority in the post -2015 development agenda.
Report of the global thematic consultation on education in the post-2015 development
agenda. The World We Want
USAID (2014). Tusome Baseline Study. Kenya support programme, Nairobi. Available at:
http://pdf.usaid.gov/pdf_docs/PA00K1HN.pdf. Accessed on 9/03/2016.
Uwezo (2013). Are our children learning? Literacy and numeracy across East Africa 2013.
Nairobi, Kenya: Uwezo East Africa at Twaweza.
http://www.twaweza.org/uploads/files/2013%20Annual%20Report%20Final%20Web%
20version.pdf.
Uwezo, (2012). Are our children learning? Literacy and numeracy across East Africa Nairobi,
Kenya: Uwezo East Africa at Twaweza. Available at http//www.uwezo.net/wp-
content/uploads/2012/09/Ro2012uwezo East Africa, 1(8), 1-14
Valters, C. (2014). ‘Theories of Change in International Development: Communication,
Learning or Accountability?’ JSRP Paper 17. London: JSRP and the Asia Foundation.
Retrieved March
2,2018fromhttp://www.lse.ac.uk/internationalDevelopment/research/JSRP/downloads/J
SRP17.Valters.pd
Vilenius-Tuohimaa, P., Aunola, K., & Nurmi, J. (2008). The association between mathematical
word problems and reading comprehension. Educational Psychology, 28(4), 409-426.
Wagner, D. A. (2011). Smaller, quicker, cheaper: Improving learning assessments for
developing countries. Paris: IIEP.
Wagner, D., Lockheed, M., Mullis, L., Martin, O., Kanyee, A., Gove, A. & Dond, A.J. (2012).
The debate on learning assessment in developing countries; compare: A journal of
comparative & international Education 42(3), 509-545.
Wallace, T.L., &Alkin, M.C. (2007).Identifying critical processes and outcomes across
evaluation approaches .Paper presented at the annual conference of the American
Evaluation Association
Wang, M. T., & Degol, J. L. (2016). School climate: A review of the con-struct, measurement,
and impact on student outcomes. Educational Psychology Review, 28, 315–352.
doi:10.1007/s10648-015-9319-1

286
Wasanga, P.M., Ogle, M.A., &Wamabua, R.M (2011a). The SACMEQ III Project in Kenya: A
study of conditions of schooling and quality of education. Paris. UNESCO. ------------
(2011b).Report of the Monitoring of Learners Achievements in Standard3 in Kenya.
Kenya National Examinations Council, KNEC. Nairobi. Kenya.
Watson, D. 2006. Monitoring and evaluation of capacity and capacity development. In: ECDPM
(Ed.), Capacity, Change and Performance. Maastricht: ECDPM.
Wetterberg, A. & Amber, G. (2011). The early grade reading assessment: application &
interventions to improve basic literacy: RTI press.
White, H., & Raitzer, D. A. (2017). Impact Evaluation of Development Interventions: A Practical
Guide. Metro Manila: Asian Development Bank.
Wi, H., & Jung, m. (2010). Modeling and analysis of Project Performance Factors in an extended
Project-oriented virtual organization (Provo). Expert Systems with Applications, 37(2),
114 3 -1151.
Wilkins, S., Butt, M.M., Kratochvil, D., and Balakrishnan, M.S. (2015), The effects of social
identification and organizational identification on student commitment, achievement and
satisfaction in higher education. Studies in Higher Education, published online 20th April
2015, DOI: 10.1080/03075079.2015.1034258.
World Bank (2003). Lifelong Learning in the Global Knowledge Economy: Challenges for
Developing Countries. World Bank Report. Washington, D, C: World Bank.
World Bank (2011) Learning for All: investing in people’s knowledge and skills to promote
development. World Bank Group Education Strategy 2020. Washington, DC:
International Bank for Reconstruction and Development/World Bank.
http://siteresources.worldbank.org/EDUCATION/Resources/ESSU/Education_Strategy_
4_12_2011.pdf
World Bank “Education Statistics (EdStats),” 2017. Data retrieved
from,http://datatopics.worldbank.org/education/wDashboard/dqexpenditures
World Bank. (2017). World development report 2018: Learning to realize education’s promise.
Washington, DC: World Bank
World Literacy Foundation, (2015). Worldliteracyfoundation.org. | Building A Global
Community through Literacy and Education. Retrieved 28 July 2015, from
http://worldliteracyfoundation.org
Yamane, Taro.1967.Statistics, an Introductory Analysis, 2nd Ed., New York: Harper and Row.

287
Yumbya, K. J. Githinji, 1, W (2019) Influence of reading activities on performance in reading
English among grade one pupils in primary schools in Nairobi county, Kenya. European
Journal of Education Studies ISSN: 2501 -1111ISSN-L: 2501 -1111
Yurdusev, A.N. (1993). Level of Analysis and Unit of Analysis: A Case for Distinction,
Millennium: Journal of International Studies,
Zatynski, M. (2012). Revamping teacher evaluation. Principal, 91(5), 22-57.
Zbar, V., Marshall, G., & Power, P. (2007). Better schools, better teachers, and better results: A
handbook for improved performance management in your school. Melbourne, Vic.:
Australian Council for Educational Research
Zimmerman, E. & Woolf, S H, (2014) Understanding the Relationship between Education and
Health Virginia Commonwealth University
Zohrabi, M. (2013).Mixed Method Research: Instruments, Validity, Reliability and Reporting
Findings. Theory and Practice in Language Studies, 3(2), 254-262.
Zuilkowski S. & Serpell, R. (2016). The role of timing in assessing oral reading fluency and
comprehension in Kenya3University of Zambia, Lusaka, Zambia.
Zuilkowski, S. S., & Piper, B. (2017). Instructional coaching in Kenya: Supporting teachers to
improve literacy outcomes. In M. Akiba & G. K. LeTendre (Eds.), International handbook
of teacher quality and policy (pp. 505–516). New York, NY: Routledge.

288
APPENDICES
Appendix I: Questionnaire for Head-Teachers and lower Primary School Teachers
Instructions: Please tick in the relevant boxes and fill in blank spaces of the questionnaire as
honestly as possible. Do not write your name on the questionnaire in order to keep
confidentiality.
Section A: Personal information
1) What is your gender?
i) Male ( )
ii) Female ( )
2) Category of key stakeholders in implementing the programme
i. Head Teachers ( )
ii. Lower Primary Teachers ( )
iii. CSO’S Workers ( )
iv. RTI Workers ( )
3) What is your age bracket?
i) 30 years and below ( )
ii) 31 years - 35 years ( )
iii) 36 years - 40 years ( )
iv) 41 years - 45 years ( )
v) 46 years - 50 years ( )
vi) 51 years - 55 years ( )
vii) 56 years and above ( )
4) What is your highest academic qualification?
i) Certificate ( )
ii) Diploma ( )
iii) Degree ( )
iv) Masters ( )
v) Others; please specify______________________________________________
5) Duration of work
i) 3 years and below ( )

289
ii 4 to 7 years ( )
iii 8 to 11 years ( )
iv 12 to 15 years ( )
v 16 years and above ( )
Section B: Performance of literacy and numeracy educational programme
Please tick (√) to indicate your level of agreement with the following statements regarding
performance of literacy and numeracy educational program. You are required to give your
opinion on the level of disagreement or disagreement with the statement in the table below using
a likert scale of 1-5 Where SD=strongly disagree; D=disagree; N=neutral; A=agree;
SA=strongly agree.
SN Statements SD D N A SA
1 There is improvement in reading learning skills of
the pupils due to the operation of this programme
2 There is improvement in simple arithmetic
calculations skills of the pupils due to the operation
of this programme
3 Learners improved in recognition of alphabetical
letters due to the operation of this programme
4 Program beneficiaries are satisfied with the benefits
5 Listening skill was enhanced through the operation
of the programme
6 Speaking, enhanced through the operation of the
programme
7 Writing skill was enhanced through the operation of
the programme
8 Transition rate has increased through the operation
of the programme
9 the class average performance has improved
10 Acquisition of literacy and numeracy within times
was experienced while undertaking the programme

290
Section C: Stakeholders engagement
Please tick (√) to indicate your level of agreement with the following statements on
identification and engagement of stakeholders. Where: SD=strongly disagree; D=disagree;
N=neutral; A=agree; SA=strongly agree.
SN Statements (stakeholder engagement) SD D N A SA
1 Stakeholders are carefully identified and listed
2 Based on gender parity stakeholders were carefully
selected
3 Needs assessments was conducted to involve the
views and areas of interest of key stakeholders
Stakeholder level of involvement
4 Stakeholders were involved in the development of
curriculum development
5 The government officials from the MOEST were
involved in supervising teachers
6 RTI international officers participated in funding and
training the stakeholders in involved in the
programme
Developing of project objectives
7 All stakeholders participated in setting objectives
which are SMART
8 The objectives set were SMART
Developing M&E Plans
9 M&E plans were developed by all the stakeholders
in the program
10 We involved all the stakeholders in literacy and
numeracy programme
In your opinion, how has engagement of stakeholders’ impacted performance of literacy and
numeracy educational program? (Kindly explain)……………………………….......

291
Section D: Stakeholders’ capacity building
Please tick (√) to indicate your level of agreement with the following statements regarding
stakeholders’ capacity building. Where: SD=strongly disagree; D=disagree; N=neutral;
A=agree; SA=strongly agree.
SN Statements (Stakeholders’ capacity building) SD D N A SA
1 There are plans indicating when M&E workshops
and seminars will be done
2 Adequate M&E workshops are conducted to inform
exchange of best practices for knowledge
3 Workshops have led to exchange of best practices for
knowledge management
Planning for M&E seminars
4 Adequate M&E seminars are conducted to inform
exchange of best practices for knowledge
5 Seminars have led to exchange of best practices for
knowledge management
Aligning training gaps identified
6 Feedback from the workshops and seminars helped
us to identify haps in the literacy and numeracy
educational programme
7 The feedback from the workshops and seminars were
well identified
8 The process of identifying gaps was done in a
participatory manner form M&E
M&E knowledge and skills
9 Acquisition of M&E knowledge and skills was well
developed
10 Stakeholders M&E knowledge and skills was
enhanced by trainings that were undertaken
11 Technical experts undertaking M&E trainings led to
proper practices of knowledge and skills
12 M&E activities were well achieved through
trainings and setting of objectives was realized
In your opinion, how has stakeholders’ capacity building for M&E impacted performance of
literacy and numeracy educational program? (Kindly explain)……………………………….

292
Section E: Data collection
Please tick (√) to indicate your level of agreement with the following statements regarding data
collection. Where: SD=strongly disagree; D=disagree; N=neutral; A=agree; SA=strongly
agree.
SN Statements (Data collection) SD D N A SA
1 M& E data collection instruments were appropriate
for the designed work
2 There was available M&E data collection tool
3 The M&E data collection methods used suited the
information required
M&E data collection and collation of information
4 M&E data collected was defined and stored in the
data base
5 M&E data collation information was coded in the
systems and filled for future use.
6 The M&E data collected was verified and analyzed.
Sources of M&E information
7 The sources of M&E information collected were
reliable and trust worthy
8 Data collected for M&E was from the right
respondents
Schedules of M&E activities
9 Proper coordination for M&E activates was well
planned
10 Schedules existed that displayed how M&E activates
were carried out
11 Assigning of M&E responsibilities were properly
fulfilled by those assigned to carry out the task.
In your opinion, how has data collection for M&E impacted performance of literacy and
numeracy educational program? (Kindly explain)………………………………....................

293
Section F: Data management
Please tick (√) to indicate your level of agreement with the following statements regarding
data analysis and management. Where: SD=strongly disagree; D=disagree; N=neutral;
A=agree; SA=strongly agree
SN Statements (Data management) SD D N A SA
1 Data analysis methods used were relevant and
reliable.
2 The process of identifying specific data analysis
methods used was appropriate
3
Methods of specifying data analysis process was
strictly followed
Identifying staff for data management
4 Responsibility matrix which depicted staff responsible
for data management existed
5 Staff responsible for data management were experts
and knowledgeable
6 The staff knowledge and skills for M&E led to
proper data management information
Data analysis and interpretation
7 Data interpretation was based on the information
analyzed
8 M&E data had been established to screen and store
relevant information for quick retrieval and feedback
to all the stakeholders
9 The plan for data analysis and interpretation was clear
and to the point
10 Stakeholders were actively involved in data analysis
and interpretation
11 Analysis and interpretation of M&E data was properly
utilized and stored in the data bases
M&E report writing
12 After data collection, analysis and interpretation,
M&E report writing was done
13 M&E report was useful in improving the M&E
activities and decision making
14 Stakeholders were actively involved in the utilization
of M&E results

294
15 M&E reports helped in making concrete and decisive
decisions
16 M&E were written and shared to all stakeholders for
dissemination purposes
In your opinion, how has data management for M&E impacted performance of literacy and
numeracy educational program? (Kindly explain)………………………………......................
Section G: Implementing change
Please tick (√) to indicate your level of agreement with the following statements regarding
learning and implementing change. Where: SD=strongly disagree; D=disagree; N=neutral;
A=agree; SA=strongly agree.
SN Statements (Implementing change) SD D N A SA
1 All stakeholders counter checked the number of
TARGERINE transmitted reports for correction and
reliability
2 TARGERINE tool facilitated for accurate and
adequate information for the program
3 TARGERINE tool helped improve the
implementation of the project activities such as
collection of data during class observation
4 The information collected improved the process of
involving the stakeholders in transmitting reliable
reports
5 Stakeholders reviewed data collected and made
changes to the identified gaps in the reports
Number of transmitted reports
5 Data collected from the TARGERINE report was
reviewed and analyzed
6 The number of transmitted report lead to improved
results and the quality of project intervention in
literacy and numeracy educational lessons
7 Shared transmitted reports led to identifying areas
with large number of participants and with less
participants
8 Transmitted report improved the allocation of
resources for example the areas which needed more
personnel’s for supervising literacy and numeracy
programme

295
Utilization of M&E results
9 M&E results were used to improve the utilization of
the projects activities such as class observation and
allocation of resources to facilitates the programme
10 The M&E results obtained from the programme
excises were disseminated for utilization by all the
stakeholders in order to better the results of L&N
educational programme
11 M&E results improved the quality of programme
intervention such as literacy and numeracy
12 M&E results improved the use of financial and
resource allocation
13 M&E results improved the designs and performance
of literacy and numeracy educational programme
Project intervention
14 The intended participants for the intervention were
carefully identified and possible settings to each
participants in the program was done
15 M&E activities for intervention were developed and
materials gathered appropriately
16 M&E resources for intervention were clearly
specified and located
17 Progress for intervention activities were well
monitored and evaluated for the success of the
programme
In your opinion, how has implementing change for M&E impacted performance of literacy and
numeracy educational program? (Kindly explain)………………………………..........................

296
Section H: School environment
Please tick (√) to indicate your level of agreement with the following statements regarding
school environment. Where: SD=strongly disagree; D=disagree; N=neutral; A=agree;
SA=strongly agree
SN Statements(School environment) SD D N A SA
1 We have enough infrastructure to support the program
2 We are supplied with enough stationaries such as
pencils, exercise books, text books rubbers and
sharpeners to facilities our teaching in class
3 We have enough playgrounds in our schools to
support the programme
4 The security in schools is adequate to facilitate
smooth learning
5 We have enough classrooms, toilets, furniture, water
supply, storerooms, paths, fences and proper
ventilation to support literacy and numeracy
educational programme
Teacher-pupil ratio
6 The teacher-pupil ratio in our schools is as
recommended by the Ministry of Education
7 The size of the classroom is adequate for both learners
and the teacher
8 The resources allocated for teaching are adequate both
for the learners and the teacher
School leadership
9 I believe our school has supportive leadership
10 Our schools administrative frequently observe
teachers teaching in the classrooms
11 There is common planning time, peer observation and
focused cross-grade meetings in schools to improve
the programme
12 The school leaders motivate both teachers and
learners for the success of the projects
13 School culture and ethical leaderships facilities school
improvements and allows teachers, parents and
learners to trust the school environment
THANK YOU FOR PARTICIPATING

297
Appendix II: Interview Guide for CSO’S and RTI International Officers
Instructions
The aim of the interview guide is to gather information on the influence of participatory
monitoring and evaluation process, school environment and performance of literacy and
numeracy educational programme intervened by RTI International in conjunction with the
ministry of education science and technology. The knowledge obtained will only be used for
academic purposes and the results from the study are expected to make a major contribution to
improving the efficiency of the educational programme. You were chosen to be interviewed
because you are involved in implementing the intervention programme and also working in
county of Nairobi. There are no incorrect answers but differences of opinion. Please let us share
your opinions. The comments must remain confidential and there will be no names attached to
any remarks made during the discussions.
As per the study objectives, the emphasis will be on key thematic areas:
Section A: Demographic information
1) Gender (observe on gender and record) Male /Female
2) What is your professional qualification?
3) What is your age bracket? )
30 years and below
ii) 31 years - 35 years
iii) 36 years - 40 years
iv) 41 years - 45 years
v) 46 years - 50 years
vi) 51 years - 55 years
vii) 56 years and above
4) How long have you worked in the county?
SECTION B: information on specific variables of study
1. Theme 1: Performance of literacy and numeracy educational programme
(i) How would you rate the Performance of literacy and numeracy educational
programme pubic primary schools in Nairobi County, Kenya?

298
(ii) Is there any improvement of literacy and numeracy learning skills since the
intervention programme was started in pubic primary schools in Nairobi County,
Kenya?
(iii) Generally what is your opinion on performance of literacy and numeracy
educational programme in pubic primary schools in Nairobi County, Kenya?
2. Theme 2: stakeholder engagement
(i) How were the stakeholder engaged involved in performance of literacy and
numeracy educational programme in pubic primary schools in Nairobi County,
Kenya?
(ii) To what extent were the stakeholders involved in developing M&E plans of
educational programme in pubic primary schools in Nairobi County, Kenya?
(iii) To what extent were the stakeholders involved in developing project objectives of
educational programme in pubic primary schools in Nairobi County, Kenya?
3. Theme 3: stakeholder capacity building
(i) Does planning for monitoring and evaluation workshops influence performance of
literacy and numeracy educational programme in pubic primary schools in Nairobi
County, Kenya?
(ii) Does planning for monitoring and evaluation seminars influence performance of
literacy and numeracy educational programme in pubic primary schools in Nairobi
County, Kenya?
(iii) How were gaps identified during trainings helped in decision making for influence
performance of literacy and numeracy educational programme in pubic primary
schools in Nairobi County, Kenya?

299
4. Theme 4: Data collection
(i) How did data collection instrument influence performance of literacy and
numeracy educational programme in pubic primary schools in Nairobi County,
Kenya?
(ii) How did data collection and collation of information influence performance of
literacy and numeracy educational programme in pubic primary schools in Nairobi
County, Kenya?
(iii) To what extent does schedules for monitoring and evaluation activities influence
performance of literacy and numeracy educational programme in pubic primary
schools in Nairobi County, Kenya?
5. Theme 5: Data management
(i) How does identifying specific data analysis methods influence performance of literacy
and numeracy educational programme in pubic primary schools in Nairobi County,
Kenya?
(ii) How does identifying staff for data management influence performance of literacy and
numeracy educational programme in pubic primary schools in Nairobi County,
Kenya?
(iii) To what extent does data analysis and interpretation influence performance of literacy
and numeracy educational programme in pubic primary schools in Nairobi County,
Kenya?
(iv) To what extent does monitoring and evaluation reporting influence performance of
literacy and numeracy educational programme in pubic primary schools in Nairobi
County, Kenya?

300
6. Theme 6: Implementing change
(i) How was data reviewed and the influence it had on performance of literacy and
numeracy educational programme in pubic primary schools in Nairobi County,
Kenya?
(ii) To what extent does number of transmitted reports influence performance of literacy
and numeracy educational programme in pubic primary schools in Nairobi County,
Kenya?
(iii) To what extent does utilization of monitoring and evaluation results influence
performance of literacy and numeracy educational programme in pubic primary
schools in Nairobi County, Kenya?
(iv) How was does project intervention influence performance of literacy and numeracy
educational programme in pubic primary schools in Nairobi County, Kenya?
7. Theme 7: School environment
(i) How was does school infrastructure the influence performance of literacy and
numeracy educational programme in pubic primary schools in Nairobi County,
Kenya?
(ii) To what extent does teacher –pupil ratio performance of literacy and numeracy
educational programme in pubic primary schools in Nairobi County, Kenya?
(iii) To what extent to which school leadership influence performance of literacy and
numeracy educational programme in pubic primary schools in Nairobi County,
Kenya?
Thank you for taking the time to respond.

301
Appendix III: Research Authorization from the Ministry Of Education

302
Appendix IV: Research Authorization from NACOSTI

303
Appendix V: Research Permit