MARKETING IN KENYA - UoN Repository
136
GIN DNTJ.: A CASB S!UDY OF THE FUBCTIONS OF RURAL MARKETS IN USUMU DISTRICT I BY LBI.I ACHIEIIG' _ ! taeaia auDaittea im part for the ie&ree of Maetera •t Busiaess and Ad.ainistratioD. iu tae UaiTersitJ ef Bairo•i. Septealter, 1 g12. OF N . UB 0
-
Upload
khangminh22 -
Category
Documents
-
view
4 -
download
0
Transcript of MARKETING IN KENYA - UoN Repository
GIN DNTJ.:
A CASB S!UDY OF THE FUBCTIONS OF RURAL MARKETS IN
USUMU DISTRICT I
BY
LBI.I ACHIEIIG' ~ _
! taeaia auDaittea im part f~filLaent for the ie&ree of Maetera •t Busiaess and Ad.ainistratioD. iu tae UaiTersitJ ef Bairo•i.
Septealter, 1 g12.
IJNIVER~ OF N . UB
0

Tbia tae ia ia ~ oriciaal work and has not been ,reseate& for a iecree 1a aay other UniTersitT.
Leah Achieac' Mlllla
Tla.ia taeaia has 'Dee• subllittea for examietion with
my approTal aa U•iTersity SuperTis~r.
Dr. :Fraaci• X:i •era

TABL OF OCJfTiNTS
PAGE
List of Tables.................................. iii List of icurea.................................. iT Ackaowlei,eaeat.................................. v
A stract•·••••••••••••••••••••••••••••••••••••••• Ti
CBAP.rBR I
IBTRODU~l rf ObjectiTel of the present reaearch............... 3 Ratioaale for the reaearoh objectives....... • ••• 4 The researea aettia&•·······················~· - ~· 5 }.Jttj.ci tea coatributiona of the atuf.y......... • • 8 Plan of .aterial 1• suisequeat chaptera ••••••• ~.. '
ClU.PrER II THEORET! CAL FRA.Jt1EWOR.i: ON RURAL MARKETS Market Clasaificatio••••••••••••••••••••••••••••••• 10 Functional AaalJa1••••••••••••••••••••••••••••••••• 12 Ooace~taal _,~etheaea.............................. 18
CHAPTIR III iHB RJSB!RCH DBSIGI Data collectiea Iastruaents........................ 19 Pretest~ tAe Q•estieaaaire....................... 20 Saa~lin& Proceiure................................. 21 Methods of Data Aaalyais........................... 26 o,erational HyJet&esia............................. 28
1 1
CHAPrBR IV
DATA ANALYSIS - ORGANIZATION OF TR!DI PAGB
Distri~ution of Ma.rkete...................... . . • 31 Ki•is of Markets................................ 35 AsaGrt•eat of coo~s offere( for sale............ 38 Relationship ~etween inco•es and .arket atte•tance •• 45 B~era ••••••••••••••••••••••••••••.•.•••••••••.•••• 4e Testinc hy~otaeses ••••••••••••••••••••••••••••••••• 55
CHAPI'ER V
SUMMARY I CONCLUSION .AND IMPLICATIONS
S'JW'IIary..................................... . . . . . . 6!
COllclusioas....................................... 70
Direction for future research ••.•••••••••••••••••• 72
J APPRNDICES ••• •.•• •·•·•·•·• •.•• · ~ · ..... • • • ... • • ...... •.• • • • • • • • • 74
BI~LIOGR!PliT.... ... • • • • • • • • • • • • • •.• • • • • • • • • • • • • • • • 121

LIST OF TABL.F:J
TABLES
i 1 i
1 Lis t o! Market Na.es Accerdi to DiTiBi&• ••••
2 Sample size iaterTiewei •••••••••••••••••••••••••
3 Markets in Relatio to Pepalation and the size
23
25
of the locations iB Kisua• District............ 31
4 Bublocatione, Markets and t eir ''palati •
5
6
totals and te•sit.T········~··•••••••••••••••·••
Classif ication of ketp ••••••••••••••••••••••
Assortment of co dB and markets attendance •••••
7. The assortment of coode in a ~rket ant
34
37
39
distance in kilcaetree froa Kisuau •••• ~........ 46
8 Sources of coods offerei for sale in r.ral
9
10
1 1
12
13
14
15
1
17
11a.rkets •••.•••••••••.••••••••••• , • • • • • • • • • • • . • • 44
Responients A ual I coae ••••••••••••••••••••••
ATerace ann.al iacoaee and aartet atteniaace ••••
How aarket income earuei ~1 traiere ie spent ••••
Sex coapositio Gf buyers •••••••••••••••••••••••
Occ JQtion of •uyer•••••••••••••••••••••••••••••
!teas purckase~ in other aarketa ••••••••••••••••
Buyers= Purchases and an.ual iacoae •••••••••••••
Lecation sizes and the aua~er of aarkete •••••••••
Conelusio.a ••••••••••••••••••••••••••••••••••••••
47
47
48
4!
50
51
53
54
70

1 T
LIST OF FIGURES
FIGURES
1 Supply routes of prot•ce to Kieuau rwral aarkete •. 43
2 Recreeeioa Line of Pepalatie• Density o• Market atteadaace.•.•••••••••••••••••••••••••••••••••·•• 56
3 Recreae1•• L~e ef the aua,er ef .. rkete oa tke
5
size ef tae pepalatio••••••••••••••••••••••••••• 5' ReJreesioa LiBe ef the •u.~er of aarkete •• paptlation ef the 1 catio•••••••••••• ,....... 61
Recreeeion L~e of the aesertaeat of c ••• and distance ~rQa a .ajor town ••••••••••••••••
6 Recreeeion Liae of aeaertaeat of co ia oa
7
aar ket size••••••••••••••••••••••••••••••••••• 65
Recres~ion Line of aarket attendance on aTerace aaawal incoae of the taaa-itaate •••••••••••••• '7

T
ACX:BO'iLIDGKMINT
I a cratef'ul to the followi.Js& persoas an4.
rcaaizations for their aelp and assistance toward.e
the co•pletion of this tkeeie:
To Vr. Francis Ki)era• wao iatr 4•cet •e to
the discipline of aarketiq. His cuid.ance durin&
the foraulatioa. ani writiDc f thia thesis is also
ki&hlJ appreciatet.
To the Uaitei Ratione - Bcoaoaio Oe~eeioa
for Africa {I.C .A.) for its Scll•larehip wi thollt
which I u.y not laaTe ea)arket •• tae M.B.A.
To Kieua Cooty CoUicil. for -k1Jic a..-ailable
a list of aarkets iB Kia~• District and to tneir
aarket officers' co-operation iurin& the fiel s work
which inTolTed Tieitia& Tarious rural ~keta.
To ~ huemant, Luke, for his constant encourace
ael1t to see me throuch the exercise.
To JJ:1 childre Caroline, Ja.aee, Andrew and John ·
who nssed the co•JlS.!lY and the loTiJl& care of their
•otller while I Wlterteek t1t.ia procra•e.
last Dut not least to -.q sister Jane w o typed.
this taesia.

Vi
AB TRACT
This esi examinee the functions of rural markets in a ection of Kenya - Kisumu Di trict. It de cribes ~nd naly s he ellers ' and buyer ' behaviour . It also e~cribes the economic significance of these rural markets . The author hopes that such an analysis and descri tion will bring to record the important aspects ty ical of a rural ~rket , and how its trade can be improved for the benefit of traders and consumers who interact in these rur 1 markets.
ut of the 107 markets in the district, 10 were randomly selected for the purpose of the study . The ten markets were then stratified into two eroups , buyers and ellers, from which samples were drawn. A total of 586
successful interviews were carried out. As for data collection, this was done through interviewa from structured questionnaires, direct observation and census counts. By interviewing the traders and consumers it was possible to collect information on consumer behaviour and tr der character istics. Three basic items have been examined in this study; First, the functional role of markets has been discussed. It was found the markets act· as Economic Institutions as well as social institutions. As economic institutions, markets can be classified as Retail markets , hoe ale market or oth Wholesale and Retail .
Markets also act as a social gatherin venue, where young men and women usually meet for courtship and v'llaee elders meet to discuss their homestead problems. Therefore , markets serve multifunctional roles. They are both n economic and social institu-tions where relatives and friends meet and gossip in ' a relaxed atmosphere.

Tii
The seconi featwre analysea is the rket traders' and 06lnsuaere' -ehaTiour-' the study reTealed t at there are two types of sellers - part tiae sellers who indicated. that aarket eellin& was
eeconciary to their .ain eccupatien and. full till8 sellers who are prefeesional traders. T e part tiae trader usually Tisi te o e G>r tw aarketa which are nearer to hie aoaeeteai while the profeeeioaal traier Tisita as aany as fo er fiTe aarkets iB a week. The profess! nal trader earns hie incoae throuch the aarket traie.
On the other hafti f r coaauaers the study reTealed that ~uyers are Bot villinl to traTel to many aarkete to buy. That is consuaera teni to Tisit the home market to purchase faod.stuffa. H weTer, they visit other distant BIB.rkete to purchase manufaature .. aooa.s each as Clothes, plates and furniture.
Thiri, it also ieecri~e• the ee noaio sicnificaace of taeae .arkets aainly iA teras of cash ceneratei froa thea, empi yaent fferei, and their role a• communicatien centres. Sellers interviewei statei that they Talue the market because it is a source of cash which they can use to pay school fees, •uy clothinc, and fooi. Markets also offer self eaployment to uaeaployei.
Various b7petaese1 were also teetet. The tests reTealei that:
( i) There is a a1p.ifio8lllt relatioaahip ~etweea populatio• ieasity of tke locatioa and the aa.rtet size.

Tiii
(ii) The aua~er ef Mrkets ia net relate« to the JAySioal size of the locaticaa.
(iii) There is sip.ifioant relatioashiJ •etween the nualter of aarkets in a lecatien and the J pulation of the location.
(iT) There is ne sitniticant relationship between the aseort.ent of coois in a aarket and the distance of the ~~arket fro• a aajor town.
( T ) The size of the -.rket is rela tea to the leTel of incoaes of the ,eeJle in the surround.i.D area.
(Ti) There is a sicnificaat relatio skip ltetweeD the aesortaent of coois iiSJlaye in the .market and mrket size in teras of atteDiance.

1
CllAflER 1
INTRODUCTICif:
Market place systeas are co TeRtioaal features of rural econoaic orcanizatio•a thr hout uch of conte•porary Africa. "By aarket place is aeant a a ecific usually authorise( site where -.uyers an sellers aeet at re&U].ar atenals for tke J7UTpose of exchBnce'! 1
These rural rkets serTe as nodal points for the distribution of a wide range of local and iaported eoods and services. Their aecesai ility ie quite ia ertant for inclicenous traders, faraere, herd.aae ancl artisans who d.epeai on the market for their income.
Despite the importance of rural .arkets, Geo ra bers, Sociolocists, and EcGnoaiste haTe cenerally shown little interest in this fiela of marketin« in deYelopinc countries. As Moyer and Bollallier assert, "It was either i~•red., with attentioa shiftinc to production, £inamce and other activitie• presume( to oontri•~te aore towards ieTelopment or it is attackei as a araaitic fuaotion not only cGntributinc nothin& to the eoonoaic systea hut drainin& its vitality as wel1". 2
1 Good, C .M., Rural Markets & Traie in Bast Africa.
2
UniTersity ef Chicace, Research Paper Ho. 128,1'7 P6.
Moyer R. and H•llaaier S. (B a.)., Markets and Marketin& in DeTelepinc Bconoa1ea: (AMA) fto•ewo i:
ILLDWIS, 1968 P41.

2
o r, so contributio s have b n ma e on
t hi fi 1 r c ntly rticul rly i e t ii fricto. . .n exa p e of this kin o writing is Bohannan and Val ton 3
hich sti ulated this activity. Other important writer include H1114 and Hodder and Uk:'Wu5 . These riters ot a r at contr at bet een the development o ~rket
structur a in aet and est Africa, for example Hil l refer to th&se contrasts as "the greatest geographical dichotomies of frica 6• ince this statement was made writers have inquired into this dichotomy and although the contrast remains somewhat valid, it has to some degree been reduced. That is, some literature is now available on rural markets in ~ast Africa . Contributions huve een ruude by 1 ood7 , Good8 , dyau9, which provide valuable insights int o the market structure of various districts in ~ast Africa •
. Inspite of these contributions there i s still
a general lack of attention to local sy~tem of , exc~e in this part of the world whi oh ight l ead to an
assumption tha. t market places ar of
3
4
5
6
7
8
9
Bohannan • an alton G. (Eds.) f.1arkets in .frica . vanston& 1ortb Western University Preas, 1962.
Hill • ' arkets in Africa ', Journal of l·to ern African tudies 1 o.4 (1963).
Hodder B. • and Ukwu U .I. - arkets in .est Ibadan : igeria, Ibadan University I ress.
Hill P. ' arkete in Africa ', Journal of ''!odern African utudies 1 o. 4 (1963) P.443.
Wood L.J., Rural arkets in Kenya : rian Geographical Journal, Vol.17 (1974).

urcinal iaportance to the econoaic structures of at Africa. Local tra e in rural rket places is
noraally net recoraea althouch it is sicnificant in the rural areas for 1ar1e amount of cash is &enerated froa this tra e. Rural .s.rkets are also sipificant aecause they act aa exchance pointa, distribution points for various imported and locally produced commo ities and lastly Dut by no aeans the least, they act as centres for dissemination of information. For most eople in Kenya and Africa at large, it is through these local markets that Acricultural pro ucts, first enter the exohance econo~. For example, maize, Horticultural crops, beans, sweet potatoes an fish are exchaa&ed for cash in rural markets. It is also throuch the same market places that soae of the imported or locally aanufactured goods reach the coneuaers. For imstance, iaported Chiaa Tea Sets, cookin& pans, pena, baay sheets, napkins and clothes are sold in the open aarket places. Ienyan .anti act urei eoods such as soap, salt, deter&ents, plates, iasins, cups and foaa aat*resses are also sold in the market place. Thus, an attem~t to analyse trade in Kenya without s ecifio reference to local markets would ignore the institutions and processes which are of great concern to the majority gf the population.
Oajectivee of the Present Research: ...
The research repQrted here is conducted with three oajectives in mind. First, the author attempts to descriae and evaluate the functional role of aarket places as ele.ents of exchance and distribution in Kisuau District - a lar&e administrative and cultural unit in estern Kenya.
The second oajective of the study will be to highli&ht the contri utions of rural aarkets to the economic and sGoial life of the Luos in Nyanza Province. This oajective will aainly iepict the economic

4
sicnificance of these aarkete as will ie stutie4 iy interTiewin~ the local inhaiitante who attend the rural .arkets. •
The thir objective is an atte pt to classify markets in teras of their sizea and periodicity. This classification will indicate the relative importance of each rket within the District in teras of attendance, its period of operation and the linea of ~oods it offers to the .arket attendants. The classification in terms of size or attendance, will hopefully facilitate ective Jlanninc of the market --'Dy Kisumu County Council. Pro_per expnsion of the market sites, construction of adequate toilets to be used by traders and buyers and provision of licences to hoteliers who will be feetinc the market .attentants will all ie facilitate•. A brief descriJtion will also be includet to explain the factors coverninc the size and market attendance.
Rationale for the Retearca OijectiTee:
The rat~onale for settinc the above research objectives is partly aecause the studies reportei in the Literature have ieen centre• in West Africa and partlt iecause the studies are mainlY ieecriJtiTe. None of the studies attempted to be analytical.
In terms of scope the majority of studies have concentrated only on the aarketine activity within the market place, the exchan&e function and the role of the market women. HoweTer, they fell short of includin~ the econoaic sicnificance of these markets to the lecal indi~enous people.
Little interest has ieen shown on these rural markets by social scientists. These rural markets are quite sicnificant because they act as exchance
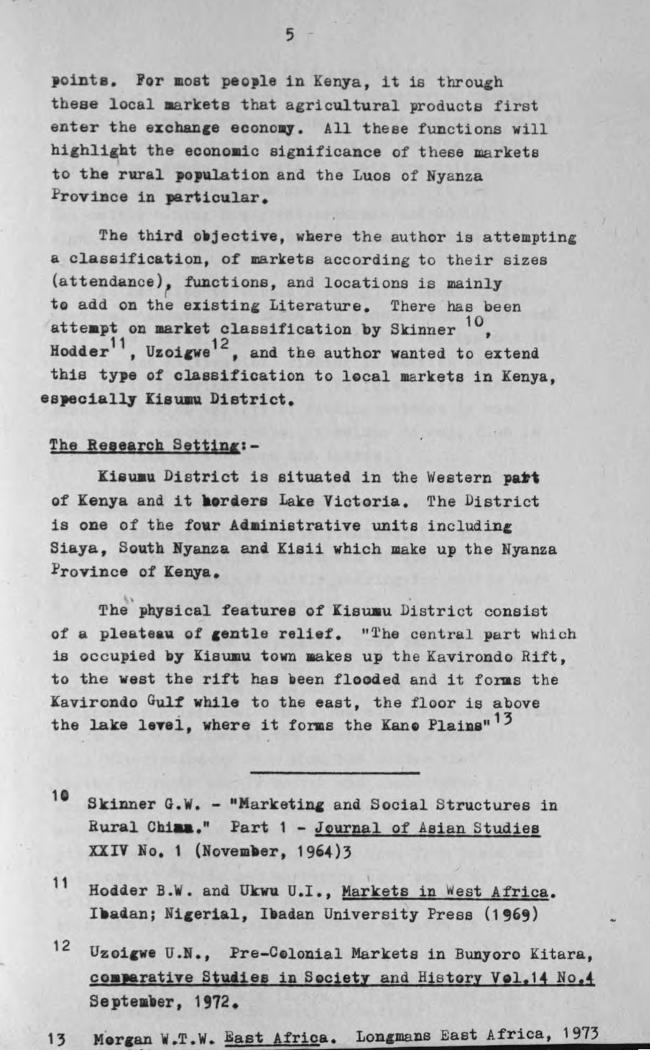
5
oint • Jor most p ople in Kenya, it is throuch these local rkets that a ricultural product first enter the exobance econo~. All these functions will hi hlicht the eoonoaic significance of these rkets to the rural population and the Luos of Nyanza rovince in particular.
The third oijective, here the author is attemptini a classification, of markets according to their sizes (attend nee) functions, and locations is mainly to add on the existin& Literature. There has been atteapt on aarket classification by Skinner 10,
11 12 Hodder , Uzoi,we , and the author wanted to extend this type of classification to lgcal aarkets in Kenya, a,ecially liaUIIll District.
The Retearoh Setttpc:-
Iiauau District is situated in the estern p&»t of Kenya and it keraera Lake Victoria. The District is one of the fo r A ainistrative units includinc Siaya, South liyanza an Kisii which make up the Nyanza Province of ~enya.
The physical features of ~isuau District consist of ple te \1 of centle relief. "1'he central part which
is occupied 'by Kisumu town aakes up the Kavirondo Rift, to the west the rift has een flooded and it forms the Xavirondo Gul~ while to the east, the floor is above the lake leTei, where it forms the ~Q Plain&" 1 3
1
11
12
Skinner G •• - "Marketin& and Social tructures in Rural Cbiu." Part 1 - J9urnal of Asian Studies XXIV No. 1 (Novemaer, 1964)3
Ho der B. • and Ukwu U .I., Markets in est Africa. Iaaaan; Nicerial, Iiadan University Press (1'6')
Uzoicwe U.N., Pre-Celonial Markets in Bunyoro itara, ooap.rati Te Sjuiet in S oo1ety and His tory Vel, 14 No,! Se pteaier, 1 '72.
13 Meraan .T.W. ast Africa. Lon&mans East Africa, 1973

6
The annual rainfall in Kisu:.u District is rather lew, about 1134 • which is well distrib~ted throughout the year. The Tecetation found in the recion is called the Lake-shore Savanna which prov14e crazinc crouni for cattle, sheep and ~oats. Cattle are quite iaportant althouch ehee and co te are also kept. T the Luo cattle owninc has reat econoaic and social sicnificance. That ie, the ore cows you have the richer you are.
In aidition to cattle keepin& the Luoe ou1t1Tate sorghua, cassava, ancl maize .for conauaption. For cash they crow cotton, eqaroane and rice. Besides cattle rearinc and cultiT&tion, fishin& is carried out. Fishin& is ia~ertant 8oth in the lake, rivers and swamps. A wide variety of fishinc aethods is used includin& e1auorate traps. Neetless to say, fish is a major food of the Luos and L~ae.
Evolution of the Rural Boonolf in IiBU!% District:
At the beginninc of the twentieth Century, the Luos were both cattle keepers and agriculturalists. The ho men emphasized cattle rearin« for cattle were a syaltol of stuatus and wealth.
Besides cattle keepinc and cro~ farminc interclan trade was carried out. The aeeting places for trade were or anize• 8y adjacent clan elders or 8y adjacent war leaders. There was also intra-clan trade whica was or anized 8y the elders. This point is well illuatratecl iy Were when she states that " the syste of trade was by barter and commolities for exchange were groundnuts, siasim, sor hum, peas, papyrus,
ts, beans, &rase woven iow ls(Ocudu), pots, clay pipes, baskets, iron iankles and hoes froa Saaia and Kaksin ri." 14Trade and marketinc were ased on villa e life of a ai::xe econoJQ' systea. This was the econoaic eet up when the Burope9.J111 arri Te' in 1 '00.
14 Were P. (Mrs) " The oricill and Growth of Iron Industry and Trade in Sana (Kenya)", (Unpu8lished B.A. Dissertation, University of Nairobi), 1973 P .51

7
Bo eTer, the Buropeana wished to establish an expert eeono.,.- that would. .ake their oee ,atioa of the lant pay and they aeeire4 to i tereet the Luoe in eonewaer coode eo that the new rupee evreac7 would circulate in the countryside.
The Buro,eans, therefore, ~troduce4 cotton in Kano, Kajulu, Seme, Aleco, and Kanyada locatioaa ietween 190e an 1'2e. Su•sequentlJ cinneries were installed at Ki•os and Kamito. HoweTer, the Luoe were not enthusiastic. On euisistence aide there was little iaprovement in the farainc aethoda of the Luos, except for the puchase of Eqlieh hoe and the wheel plouch. Therefore, cash econo~ iy 1'30 maie ainiaal impact on the life of an ordinary aa.n in the Luo land. Thus there was not much chan&e notioeaile in the consuaer behaTiour of the rural people in the 1'308. On consumer side, life was still essentially simple. HoweTer, one discernible deTelopment vas the increase of African bicycle permit holders (Jorin&i) who broucht fish fro• the lake shore, sa ke4 it and then CJcled oTer fifty kiloaetres to sell them at the rural aarkete.
After .1,40 Tarious iaproveaenta were oiserTei. For example, peraanent market places were establishe4. The African District Council of Kisuma was given responsiDility of fencin& the market, collect!~ the m ket fees, and keepin& the market tidy. After the establishment of the permanent aarket places, local residents began to acquire plots throuch the African District Council and constructed peraanent and semipermanent shops in a reotancular .anner surroundinc the ~~arket lace. It is therefore usual to :find a
a rectancular line of eho)N5 eurrounclinc a fencecl o en ground which is the market ~lace, in any rura1 shoppiO« centre such as Ahero, Sonio, Xaaieleo and Kiltoewa.

e Anticipated Contribution of the Stu4f:
Owi to lac of information on Kenya's rural r eta, first the author believes that by un er-
taking this research, the findincs will increase an understandin of the importance of rket laces in Kenya by economists, anthropolo~iste, geographers, an students of Business Administration .
Secondly, for academicians, the thesis is expected to stimulate those who are interested in learning more about rural markets to carry out research in other parte of Kenya and compare their findings ith those of the present author.
Third, the research will help the local county council to evaluate the market distributions and how they allocate the days of market operation.
Fourth, the study will, it is hoped De of great help to those who are actually concerned with local marketing, that is to traders in the various market places. They will, it is hoped, ie able to identify the forces ~hich determine the economic conditione of the markets.
Another anticipated contribution is that the findings of the present research will encourage research in other areas, for example, on rural African run shops or businesses, the role of aarket places as service centres and the economies and diseconomies of marketing institutions.
It is also anticipated that the research findin wi ll prov helpful to the Central Government which is committed to the development of rural areas in the current Development Plan. It will show them that the growth poles or growth centres shoul be the market places for it is thro~h the market places that information can be disseminated to the rural population and it is through the same centres of local trade that new products and practices can be introducei to the rural population.

' P1an of Materials in su•seguent Chapters:-
The remainin~ materials reported here are diTided into four chapters. Chapter II contains the theoretical framework of the rural markets. Thi diacuesion is centred around market classification and functional analysis. The subheadings in this chapter are market typology, functions of rural markets, market distribution and conceptual hypotheses. Hence it is in this chapter that the bulk of the releTant literature is re iewed.
Chapter III contains the Research Desi~n for the study. In this chapter, Data Collection Instruaent is discussed, end pretestinc of q eationnaire, eamplin« desi~ and methode of data analyses are delineated.
Chapter IV analyses the data on market sellers and trade organization. The results of the study are examined with respect to types of market sellers~ the or anization of trade and supply and sale of goods.
The final chapter deals with summary and conclusions. It discusses the research findings and the implications of the research findings to various groups.

10
CHAPl'BR II
THEORET !CAL FRAMEWORK ON RURAL MARKETS
Market Classification:-
Rural markets are nodes of economic and social activity for a lar~e portion of Africa's population. It is often the sole point of contact an African individual has with the national economic structure. Yet very little has been written on the functions and characteristics of these rural markets. However, some writers have contributed to this aspect and some literature is now available and is reviewed next.
Hodder stresses the sicnificance of these rural markets by stating that, "it is through these markets that &oods from abroad are absorbed and it is throu~h these same markets that most local product~, a~ricultural and cottage industrial products enter the econom• s." 1
He further attempts a classification of markets on the basis of functions for instance, retail, wholesale and distributive chain. However, this classification is not complete since a market can function both as a retail and wholesale institution. Hodder reviews his classification and attempts to classify markets according to locations and periodicity.
Thus he classified the Yoruba markets as:
1. The urban daily markets, which take place everyday and are characteristic of larce towns like Ibadan.
2. The urban nightly market which is held every evening, be~inning soon after dark and continues about ten ~Tc1ock.
3. The rural night market, which is held at regular interTals as at Ikereku.
1 Hodder B .w., "The Yoruba Rural Market" in Bohannan and Dalton (Eds.) Evanson University Press, 1962.

11
4. The rural daily market, which often is priae.ril.y for providine fresh eat.
5. The rural markets which take place at regular intervals of several days at Ak~ele.
AHoth r study on market classification was made by Skinner in China . She identified a hierarchical set of marketing system com~rising standard, intermediate and central marketing systems in ascending order. According to Skinner these Chinese rural markets can be classified as 'minor', standard, interaediate and central. These terms refer to the location of settlements. To Skinner a "minor market specializes in the horinzontal exchange of peasant produced goode" 2 A standard market on the other hand is a rural market which meets all the trade needs of the peasant household. whiie a 'central' market is normally situated at a stratecic site in the transportation network and has important wholeealin~ functions. Skinner noted that, "market systems •••••••• are discrete only at basic level and each lower level system is typically oriented to two or three syste•s at each ascend .-ing level. As a result, marketing structures ••• take the form of interlocking networks." 3
Uzoigwe4 also attempts a market classification o-f Bpny oro-Ki tara. What Skinner calls a 'minor' market and/or ' standard' market, Uzoi&We identified them as a local market. This served a village or a group of villages. Here peasant produced «oods were horizontally excban ed, but it was also a retail for salt and other commodities. A ' local • 118.rket was usually owned by
2 Skinner G.W. Marketing and Social Structure in Rural Cbi.Ba, art 1 - Jourpal of Asian Studies XXIV No. 1 (November, 1 '64 )3.
3 Skinner G.W., Op. Cit.P.68
4 Uzoigwe, U.N. , " Precolonial Markets in Bunyoro Kitara", Coaparati ve Studies in Society and His tori,, Vol.14 No. 4 September, 1972.

12
the Saza chief and not iJ tbe coa.unity aa in the Ieoland. There were some JIB.rketa in Bunyoro whi.ch he calls the 'royal' rkets. Individuals were dram from 118JlY p:l.rts of the empire to trade in such a market. These markets were established by royal sanction near the palace. To trade in a royal market was tantamount to trading near the source of ower •••
Uzoicwe5 refers to some markets as 'specialized' markets. By specialized, he did not mean that suoh markets sold only specialized iteiiS iut that they were situated in a locality of certain goods auoh as iron implements, (hoes, knives, mats and so forth). Under this cate cry he includes the riverain markets which arose in response to the trade in fish. Such markets were owned by a community as a who1e and they have no equivalent in Skinner 1 a classification.
The next category of aarkets in .,.,oro he calls 'frontier' markets which served different re&ions of a given political authority or two different re«ions of a given political authority or two different olitical authorities. Like Skinner's 'central' market, a frontier market was normally situated at a strate&ic site in the transportation network. These markets were owned by the ruler.
Uzoi~e's final catecory of markets are 'satelite' markets. These were markets established ay the rulers of Kitara outside the boundaries of the empire and effeoti-. vely controlled ey thea. He refers to thea as • sa tell te' aecause these rulers (Aeaka~ must have exercised some sort of influence in these parts to be able to establish markets in them and to control t~eir operations.
Functional Analysis:
. The second important aspect which many writers have dealt with is the functional analYsis of markets.
5 Uzoicwe, U.N., Op Cit. P .37
I
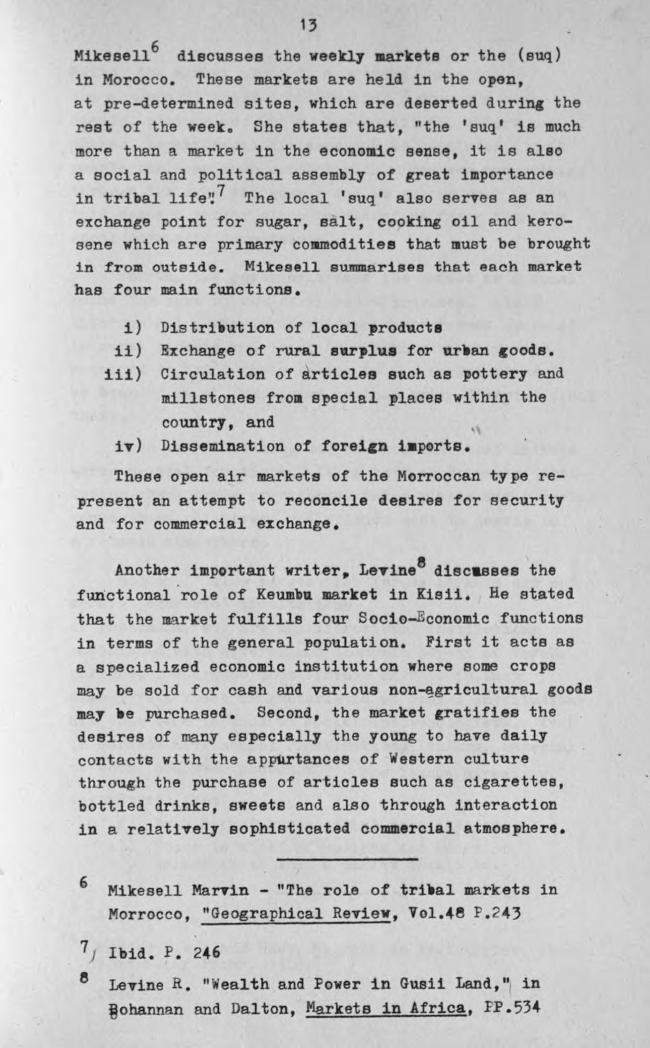
1' Mikeeeu6 discusses the weekly aarkete or the (suq)
in Morocco. These markets are held in the open,
at pre-determined sites, which are deserted during the
rest of the week. She states that, "the 'suq • is much
more than a market in the econo~c sense, it is also
a social and political assembly of great importance
in tribal life~ 7 The local 'suq' also serves as an
exchan«e point for sugar, salt, cooking oil and kerosene which are primary coamoditiee that must be brought in ~rom outside. Mikesell summarises that each market has four main functions.
i) Distriiution of local ~roducte ii) Exchange of rural ev~1u• for urian coods.
iii) Circulation of articles such as pottery and
millstones from special laces within the
country, and
iT) Dissemination o! foreicn iaporte.
These open air markets of the Morroccan type re
present an attempt to reconcile dee ires for security and for commercial exchange.
Another important writer. LeTine8 discuses the
functional role of Keumbu. JDB.rket in Kisii. He stated
that the rket fulfills four Socio conomic functions
in terms of the general population. First it acta as
a specialized economic institution where some crops
may be sold for cash and various non~gricultural goods may ie purchased. Second, the market cratifies the
desires of many especially the young to have daily contacts with the appU.rtances of Western culture through the purchase of articles such ae ci«arettes,
bottled drinks, sweets and also through interaction
in a relatively sophisticated commercial atmosphere.
6 Mikesell MarTin - "The role of triial markets in
Marrocco, "Geographical Review, Vol.4e P.243
7/ Ibid. P. 246
Levine R. '' ea1 th and Power in Gusii Land, 111 in
~ohannan and Dalton, Markets in Africa, FP.534

14 _place
Third, the rket place is a meetinc/where in the absence of traditional feeling concerning homesteads, priTacy and inter-clan hostility, elders may gather, hererosexual 11aisone may ae i~tiated, local pe~ple can come into contact with those who are passing throU&h the area and ossip 118.1 De passed on."~ ' In this sense a market place is Tiewed as freer than the local community homesteads.
Fourth,. the covernment uses the market as a focal point for some of the services it provides. Adult literacy and community development programmes operated in rural markets and local inhabitants usually were required to ering their cattle to the market place to ae branded as a theft.
safecuard against inter-aistrict stock
From these studies, one can conclude that markets serve several functions. It is both an &conomic institution where trade or exchange takes places and a social venue where relatives, and friends meet to gossip in a relaxed atmosphere.
Hodder .10 also acrees that Yoruaa markets are not merely 'economic' institutions or pheno ena, Dut are multifunctional institutions associated with several non-economic aspect of Yoruba culture. He argues that "Yoruaa rkete in fact demonstrate those characteristic of social institutions and that term is used by social anthropolb ista. That is markets have social organizations, values, material objects, and even eequence"! 1 The Yoruba markets m
demonstrate that: i) Bach market has a social orcanization.
ii) There is a set of notions and ideas or values about what a market should be.
Levine, R., Op Cit .P .535 10 Hodder B.W.L and Ukwu, Markets in West Africa, Ibadan
Unive•sity l'rese, 1969. 11 Ibid. P.40

15 iii) Centerin« on each IIIB.rltet there is a set of
eTents which follow one another in a recular and predictable pattern, and
iv) Material objects are exchan«ed in the market. I
Hodder continues to illustrate that "tre dominant economic function of periodic markets is bulk-•uilding as well as bulk-Dreaking of local food products and local craft industrial products." 12. The market also act as distributing points of &ooda imported from other parts of the same country and froa airoad.
In addition to the functional analysis and classification of the markets some writers like Wood13 have contributed towards consumer behaTiour in rural market centres. Wood states that in the rural areas of developed countries consumers are usuallf within a range of a number of centres each of which offere a partic~ar
mix of goods and s erTi ces. On the other hand, in the rural areas of developing countries markets are important service centres and other factors may influence the market visiting decisions. For instances, people frequently have to sell before the.y can buy. Thus the market which they choose to visit must offer a f avourable opportunity for eell1118 goode since many centres only offer marketing facilities periodically. Therefore rural residents are placed in a situation where t hey must weigh the merits of visiting a distant market today or waiting two days to visit a close market.
To summarise, markets act as b.llk buildill8 centres, dis tribution point s, exchange institutions and as a social gathering ineti tution.
12
13
Hodder B. W. and Uloru U .I., "Markets in West Africa" • P.46
Wood L.J., "Spatial Interaction and Partitions of Rural Market S ace", Journal of Economic and Social Geography, Vol.65, 1974.

(
16
Some writers discussed the relationship between arket Distribution and population, as well as
market size and population . Several research studies tend to reveal that there does not exist any form of relationship between population and market places. For example , Hodder says that in Yorubaland, Western Nigeria, the distribution of periodic markets show little correspondence either with the distribution size of hieara.rchy or rural or urban settlement , .••.•• " 14. Mikesell also agrees with Hodder's finding that "in rural rorrocco where towns are virtually non-existing the bulk of the population.lives.far away f rom the actual market site ••••••••• " 15.
ood on the other hand , found that the larger markets in f.1eru District occur in the areas of highest population density . He sta tea that " the largest markets in e. ch Tigania, Igembe, Makinduri and Maua occur in areas of highest population density which are in effect the traditional homelands of two sub groups" 1 6
Both fl1aua and f.tak induri were early nodes of infrastructural development and both are accessible to a l a rge portion of the Meru population. Rural markets are usually located in the centre of trading centres .
orne writers like Good 17 have proposed that the existence of many shops in a trading centre with almost empty helves shows clearly uneconomic use of l abour .
14
15
16
17
Hodder , B . • Op Cit • 51
l·ikesell , 'The role of Tribal Markets in Marrocco, n Boh nn n nd Dalton, Narkets in Africa ~ " P.494.
ood L. J ., "Spatial Interaction and Farti tiona of Rural T1arket Space ." Journal of Economic and Socia l Geographers, Vol. 65 f o .1 , 1 974, P . 24
Good, C.M. Op Cit. PP .48.

17
Bauer 1e, on the other hand, ar,uee that the "Multiplicity of petty tradin concerns which is a conspicuous feature of many contemporary African economies represent a highly productive use of redundant resources (labour) in a situation of ca ital scarcity." cod found that there is a fairly regular decrease in m.rket size along the main road from Meru town to the farthest range reflecting higher leTels of market activity in areas close to town. His other findin& shows that the smallest markets are those which lie either near the terminals of re1ular motorable tracks or away from the road network altogether. Hie findings confirm that there is some relationship between markets and means of communication.
SeTeral writers have contributed on the role of women on market trade. Since the majority of market attendants are women the author decided to assess their importance as delienated in the literature.
Melville states that "the energy these women expend in carrying out the market activities express the importance of their effort both for themselves and for the economy as a whole." 1' Hodder20 also !Tee some indication of the distances traTersed by women in the course of their trading actiTitiee. He estimates that in a typical case, a woman who walks nine miles to various markets will cover some, "fifty miles or more a week ••••• usually more with a \asket or calabash of goode on her head ••••• ", Thus in West Africa the high degree to which women participate in the distributiTa ocese also reflects the longeTity of market institutions in that region.
19
20
Bauer, P.T., West African Trade, London Routledge Kegan Paul, 1963.
Mel Tille, J .H,, Markets in Africa, Bohannan and Dalton (Ede.), PP.xi.
Hodder B .w. "The Yoruaa Rural Markets" in Bohannan
and Dalton (Eds.), Markets in Africa, BTaneon University Press, 1'62 PP. 1 '·

18
Conceptual b!pothesep:
As per the objectives set and the discussion presented the author now states the conceptual hypotheses.
These hypotheses are that:
1. There is a high relationship between · o ul tin size of the location and the market size.
2.a. The numBer of market& in a location is hi&hly related to the ~eocraphic size of that location.
b. The numoer of markets in a location is bighlT
related to the population of the location.
3.a. The assortment of coode sold in a market piace is related to the d~etance of that market
I
place from the bi~gest town in the region.
b. The assortment of goode sold in each market
is hi~hly related to the market size in terms of attendance.
~. The size of the market is related to the level of the incomes of the people in the surroundin~ areas.

THE RBSEARCH D SIGJ:
In the previous cha,ter it has ieen stated that Kieumu District is fairly larce with various economic activities seen during the rural m.rket day. This chapter focuses attention on data collection/ instru.enta, sampling design and methode of data analysis all of which ilend into the Research Desi&n•
In this section arief mention is made of various techniques of collectin« priaaary data in order to justify preference to the one adopted in this survey. Important methods are interviewing throuch questionnaires, census counts and direct o8servation.
Data Collection Instruaepta
Interviewin& through questionnaire•
This involves administering a prepared questionnaire to respondents chosen in a market place. Tnis technique was applied in this study. Its positive attr18utes include t~e high pro•aiility of elicitinc response. This technique is also quite adaptable toprevailinc circumstances. Sometimes the buyers and sellers are too suspicious of or too sensitive to interviews especially when these hin«e on such personal characteristics as name, age, sex and number of children. However, this interviewing usin~ questionnaires has its own bias. For inStance, the tendency for respondents to answer incorrectly in order to dispose of Lnterviewers who might be interferin~ with their Dusineseea. On the other hand, the technique enables the research assistants to pro•e into questions that are vacua to respondents, to spot
and to re-interview dou•ttul cases as well as oompletinc inadequate information. It is for the latter set of reasons that interviewinc usin& administered questionnaire was considered superior to other data collection instruments. This primary source of data was a most vital supplement to secondary sources such as the County Council records,
20
library r search d other public tiona.
Direct bseryation. This was employed to count the number of p o le
entering through the market gate ar1d tlt~ number 01 1 t rue diapl yed in th m&rket for sal • ~'ir t, tl e 1 &rket attendants were recorded o sheet of paper by m<.:.rkin a tally on the paper whenever one e t rs the market . For larger markets which operated a whole day , it us carried out till three o'clock after whict ie noticed that ~rket population was reducing for th~ majority of traders were packi to leave . ior maller ~rketa which operated between two and six o'clock, the counting was done until half-past five. The second feature was the recording by the observers. esearch assistants were asked to list down all the items displayed in the market place. Through this method the author was able to compile a list of goods or items dispLayed in all the rural markets in the sample.
Oepsus Coypta:
The 1979 census data made a useful contribution to this study. The census data was u.eed as a ba sis of compar!ng relationship between population of a location and market attendance or with the number of markets in a location.
Pretesting 9uestioppa1re; Before the ctual survey took off, it aa im ortant
to make a few pre-survey arran ement w ich w~1 v·tal for the success of the research. irst, a visit was made to the Kisumu County Council o f i ces hobe offic ls provided a list of markets in th di~trict ,
t heir days an time of operation.
eoondly, a visit was made to variou markets specifically to teat the questions in different market

21
within the sam le ou • This a aimed at a eee in r ond nt under tandin of uestions, dur tion of interviewing the uyers and sel ere, hether they would be patient in the main study or not, , repercuseione of some questions which appeared too earching and likely to antagonize respondents.
' Experience gained in this pre-testing period revealed certain weaknesses of the questionnaire and it also revealed some fear on the part of respondents. Therefore, in the main survey research assistants were instructe to explain to the selected respondents the purposes of .c research to dispel this fear. retesting al o dispelled one major fear namely, the possibility of the survey failing to satisfy ita main objectives .
ampling Design:
The procedure adopted in this study is probability sampling. This refers to "a formal procedure for selecting one or more samples from the population in such~ manner. that each individual or sampling unit has a known ch nee of appearing in the sample" 1, All sampling methode were critically considered but only three proved useful in the present study.
'I he more commonly used eampltilg methods include imple r andom, stratified random, systematic, cluster
and quota . Here only area sampling combined with multi-stage sampling were used.
Harvey D. Explanations in Geograpby, ~ondon, udward J.rnold, 1969 , P.361

22
Area Sa.mplip.c
Kisumu District is divided into five Administrative Divisions. So markets were selected froa each Division. This method was used matn17 to aToid selecting all markets from the Division nearer to Kisuau Town.
This technique was favoured because of various reasons. Firat, its administratiTe convenience facilitated supervision of samp11n& units which · comprise each stratum, in the context of mJ research these unite were markets found within each Division. This made the selection of saaple markets Yary from markets in fertile areas, as well as markets in lees fertile areas - both have equal chances of beinc selected.
Com-.ine Multi-Stace SampliJlc:
After the stratification of the study area into various administrative Divisions, each Division had a nu.m'Der of markets under it and from each Division two markets were selected using the lottery method. There are 107 markets in the District out of which ten were selected randomly using the 'lotterr• 2 method. These markets acted as the framework on which various analyses were baaed.
2 lottery - All the market names were printed on the papers, after which two markets were picked from each Division in a box.

23
TABLE 1 : LIST OF MARKET lA S ACCORDIHG TO DIVISICitS:
1 • MASENO DIVISION
1 • Kombewa '· Sigoti 17. koliech
2. Kondik 1 • Paw A che * 1 e. Kitmikayi
3. Reru 11 • Kaluore 1 '·
Kaaim\a
4. Maeeno 12. M&n11fanda 20. Chulaimbo
5. Awach 1 3. Mirier! 21 • Rata
6. Lela 14. ~·arot
7. Ncere 15. Bodi
e. Urudi 16. Kaon.je.
II. }tiNAM DIVIS!~
1 • Rabuor 1 o. Nyanc'ande 1 • Korowe
2. l't1g1n~o 11 • Mauo~eo * 1 '·
Daraja Mbili
3. Kiboswa * 12. Da1o 20. Sinyolo
4. Nyamware 13. Orinde 21 • Kaloka
5. Apoko 14. Nyakonco 22. Gari
6. Keyo 15. Ober Jowi 23. Kanaeia
7. Kafei 1 6. ~op 24. Kanyamlori
8. N~ahera 17. Kamarara 25. Wathor 0
'· Ong' eche
III . nUHORJ>NI DIVISION
1 • r•luhoroni 7. Jllaeo~o * 12. Nyaguda
2. lamu j e. Cheaelil 13. Bwanda
3. '· Nyarindi 14. 01ando oru
4. Songhor 10. Ramula Daraj a Mbili.
5. Ki igori 11 • Kango
6. God Abuor · I

24
IV. NYANDO DIVIS IQI
1 • Ahero • e. Awaoh 14. Alalr:anyadhi
2. Awasi '· LUD8a 15. Kaeee ..e
3. Onjiko 1 o. Apoko 16. Holo Oruoho
•• Miwani 11 • Keyo 17. Tawo
5. Kibos 12. Ogenya 1 e. Nya.ngeta
6. Rabuor 13. Kango J 1 '·
Ranjira
7. Okana 20. Ka1Kt1a.
v. NYAKACR DIVISIOI
1 • Sondu/Atela • 1 o. Katito 18. Pap Ondit1 •
2. Kuea 1 1 • Okanwaoh 19. Nyamarimba
3. Nyakwere 12. Oboch 20. Bod1 (Nyakaoh)
4. ~!igot 13. Ramul.a 21 • Ondonga
5. Onyuonco 14. Kokelo 22. Gapsarok
6. Nyamroka 15. Reru 23. .i:iuma
1. Andinc'o 16. Store-Pam8a 24. Tura
a. One no 17. ak1 25. Bunde
9. Olute.
* Markets included in the sample.

25
ampling Frame :
In order to draw samples the research requires some sort of sam ling frame which locates the indivi uals in the po ul tion .
The sample frame which was used was a list of m rket author· zed by Kisumu County Council. On the list there are 107 markets out of which 10 were selected randomly. This is a small sample but due to limited finance, high cost of transport and limited time, the author had no alternative but to use it.
\ After selection of markets, the interviewers were
in t ructed to interview the sellers, they came acrose and to interview one seller per item sold. The interviewers were also instructed to interview any buyer they came across in the market.
Out of the selected ten markets, a total of 586 successful interviews were carried out and only 18 refusals by buyers.
TABLE · 2: SAJ.- LE SIZ& IN TERVIE ·IED .
URKET N/lfv1E NUMBER INTi!iRVIEWED PERCENT
Rabuor 100 1 9.5 11amboleo 41 5.1 Kiboswa 78 8.2 A hero 105 10
f.Ias ogo 32 5.3 Kombewa 41 9.1 Paw Akuche/Holo 46 9.5 Daraj a f1bili 49 15.2 Sondu/ A tela 58 5.9 Pap Onditi 36 8.6
Total 586
-

26
Interviewers: Interviewin was a vital eta e subsequent to the
samplin desibn• Interviewers were selected, trained nd equipped for the survey work immedi~ ly before
the actual survey began. In all four m . interviewers were se ected on the b sis of knowledge of isumu Di trict, ability to speak Luo, Kiewahili and En lish fluently, d a successful attempt to translate the English questionnaire into Luo and Kiswahili . Luo is the language of the predominant tribal group in ieumu District . Swru1ili was also necessary particularly when enumer ora met the Bantu group in the markets near ·.estern Province such as Kiboswa and Mambo leo. The interviewers had to translate the questionnaire into the three languages, English , Luo and Kiewahili (Appen ix A -1 ) • Interviewers were instructed to spe k in Luo mles9 one tells them that she/he does not underst nd Luo . For con latency sake, all the resronses we marked in the ~n lish translation of the questionnaire . 'l' rainin eriod lasted for two days after which markets were visited to pre-test the questionnaire.
METH D OF DATA ANALYSIS:
This section considers data processing procedure as well as uantitative methode of analysis used in reaching objective conclusions. Data lrocessing :
"Three stages are involved in data processing namely , edit in , coding and tabulation"2. All the e stages were followed by the author manually.
2 ~oser , C.A. and Kalton, _ Survey Methode in Social Investigation, London English Language Book Society, 1971, pp .410-438.

27
BditW:
Research assistants returned the completed questionnaires every eTening between 6.30 and 7.30 p.m. In the process quick editing of data resulted. Each night, the author made further editing of questionnaire as to their completeness, accurac1 and uniformity. Doubtful cases were usually discussed further with the interviewer concerned and remedJ sought.
CodiD.c:
The concept of coding is lar1ely " a process of translating word classification into numiers so that !t is feasible to transfer information o~ the questionnaire to a card or other recor4 for tabu.l.a.tion." 3•
In this study since the whole data processin~ was done manually, coding involved trans:fering of
information to records rather than the card. Two se rate systems of coding were adopted. In the first place, questions were pre-coded by indicating all the possible response next to the corresponding question. These were numbered A to B or F. This facilitated fairly quick interviews. Later when the surTey had been completed, another coding procedure was used in order to identifJ variables that were used in tab ulating and other analysis • This sta,;e of data (
proces ing required much keenness and for concentration so as to check consistency and proper interpretation of questions and r~spondents.
Tabulations:
It was necessary to execute some jud1ement in
the number of tabulations. Naturally tables which were finally adopted were selected froa an immense
assemilage of simple tabulations of a total of twenty
eight vatiabl.es. Whereas most of the tables present
3 "United States "..ISditing and Codin " Atlanti Unit VI Bureau of Census, Department of Sommeftce, faem: g1:oft.• n. c. 1

28
the results of the surTey and aae eically descriptive a few of them are highly analy tical.
The first set of tabulations show frequencies and percentages of single varia•les. The second set is prepared from computation of correlation coefficient (r) reeression analysis. Electronic calculator was used for compilin& the tables .
9.U.ABTITATIVB METHODS :
Data in this study have been analysed •1 statistical methods which are both descriptive and inferential. The form of inferential statistic used in this study is the correlation eoefficient and regression aaalysis. These involved the examination of two variables and assessing the extent to which they are related. This relationship can be shown through scatter «raph, regression lines and coefficient of correlation. "The knowledge of relationship enables us to predict and to be able to control certain events." 4• If we know there is a relationship between population and num-er of market attendance, the County Council can either enlarge a market as a result of increase population or even increase the number of markets in a densely populated area.
The hypotheses were tested by using simple Linear regression and the correlation ooef11oient model. These hypotheses reinforce conclusions made in
distribution of markets or their econoaio significance.
The operational Hypotheses:
On the basis of what has been discussed thus far, both in the previous chapter and present chapter it is possible to state the conceptual hypotheses.
4 Harper, W.M. Statistic! (Macdonald and Evans Ltd., 8 John Street London W.C.I.) 1~71. PP. 120.

laueibiliti of ijypothes1e
In relation to market attendance the author wanted to know why some markets have higher attendance and others have a low attendance. The variables likely to influence the market attendance are population density of a location and sublocation in which the market is situated, the average income of the people in the surrounding area and the availability of goods on that particular market. The hypothesis is expected to reveal that the amount and Tariety of goode received by a market and displayed strengthen the position of that market.
Hypothesis 1 There is a si«nificant relationship ~etween population
density of the su~-1ocation and the market size.
The null hypothesis to be te•~ed . here is:
Ho: High and low population density sub-locations have
markets of equal sizes.
aypothesie 2 (a)
The number of markets is highly related to the size of the location.
The null hypothesis to be tested here is:
Ho: Large and small locations have equal number of markets.
HJpothesie 2(b) The number of markets in a location is highly related to
the population of the location.
The null hypothesis to be tested here ie: High and low population areas have equal number of markets

H.tpothe sis 3 (a) The assortment5 of «ood8 sold in market places
are related to the distance in kilometres from the biggest town in the region.
The null hypothesis to be tested here is: ·larkets near and far from the major town have
the same assortment of goode.
Hypothesis 3(b)
The assortment of gqods sold in each market is related to the market size6 in terms of attendance.
The null hypothesis to be tested here is: The attendance in markets with few goods or
many goode is the same.
Hypothesis 4
The market size is related to the leTel of the incomes of the people in the surrounding areas.
The null hypothesis to be tested here is: High income and low income· areas haTe markets of
equal sizes.
5
6
Assortment - This means the different items displayed for sale in the market place. For example salt is an item as well as maize. millet, onions, drumhead rice, eu.&arcane ~nd ladies dresseQ. All these it~ms combined are what the author rerers to as the assortment of goods.
Jla.rket Size: Market size is a term used to refer to the number of people attending the market place but not the physical size of the market.

31 CBAPrBR IV:
DATA ANALYSIS : ORGANIZATION OF TRADi. Chapter III presented the research design and
statistical analysis used in the study. This chapter will discuss the distribution of markets and the author goes further to discuss the assortment of goods offered for sale and the income of the market attendants.
Distribution of Markets in Kisumu District The contemporary distribution of markets in
Kisumu District tend to correspond generally with the overall distribution of population. The highest number of markets is found in East Kisumu, Kajulu, North Nyakach, East and West Seme and West Kano locations. The population density of the a-ove locations range from 198 to 252 people per square kilometre.
TABLE 3 MARKETS IN RELATION TO POPULATION AND SIZE OF LOCATIONS IN KISUMU DISTRICT
LOC/ITIONS ~OPULATION DENSITY NUMBER OF SQUARB KM. tJqot_. SQUA.RB IMARKETS _.EER __MAB_K_ET_ r-·
West Seme 202 1 13.5 Bast Seme 219 ' 16 Kisumu East 311 15 7.2 Kaju1u 352 6 6 Miwani-Kibos 7' 6 20 North-East Kano 1 '2 ' 24 . West Kano 1 '8 11 15 South-East Kano 142 12 21 . Chemelil Location 156 a 18 Koru-Fort Tennan '3 • 23 f.luhoroni 10! 3 27 South Nya .tach 273 7 13
' ·~

32
In addition to the above, table 05-1 and 05-2 of the appendix illustrate the population of various sub-locations in which the markets surveyed are located. The sub-locations noted with high population totals are Kabodho East, East Ka4ianga and Kakola.
n the other hand, locations which are noted for low population totals are Kit Mikaye , Songhor West and Kombewa (Table C5 -1 and 05-2).
Tables 3, C5-1 and 05-2 contain the data for testing hypotheses 1 and 2. Table C5-2 shows the population of the locations in Kisumu District and the number of markets. For example, Kisu.mu East has a popUlation of 33,685 persons, and in it are located fifteen markets, on the bther hand Muhoroni location with a population of 10,263 has only four markets.
\
Table 4 below shows the sub-location size and density per square kilometre. This table was utilized to test hypothesis 1 which asserts that whether a market is located in a sparsely or a densely populated area, its attendance (size) will be the same. The statistics of coefficient of correlation (r) was used to measure the strength of linear relationship between population and market attendance. If r is close to o, the fit is poor and one can say that the relationship is weak or non-existent , if r is close to + 1 or -1 ,
one can say that there is a strong correlation. The formula used was derived from Richardson and it is shown below. 1 From the computation of ron table 4, it shows that there is some 1inear relationship between population density of a sub-location and market a~ndance, since r is 0.6
1 Richardson , O.H., An in~duction to Statistical Ana],.ysis,(New York, Harcourt , Brace, 1944) Chapter 8
r = - n.L x;y; i~ - (~xi)

33
TABLE 4 SUBLOCATIONl 'MARKETS AND THEIR FOPOLA.TION TOTALS AND DENSITY •
Market ~ublocation Size ot Population :Denai ty Market ~ubloca tion
l=>erx..2 Populatio• .A.tt. x2 if2
Km.2 Densityi..n 1D'00-Y ~ •oo-x
Kombewa ~ombewa 22 5,042 229 2.29 4.52 5.29 20 .43 n0.35
Paw A.kuche ~t mikayi 1e 3,727 207 2.09 4.e7 4.2e ~3-72 10.05
DaraJa llbili ~on~or West 21 1,92e 92 • 92 3.23 o.e5 10.43 2.9?
Kiboswa i;:rahera 16 6,205 ~ 3.44 "j.')7 11.l!53 rJ1.5l!5 ~2.92
llalRDoleo V"athere~o 11 5,3oU ~7 4.e? 7.9e 23.72 ~3.oe ~·e6
Rabuor ~ochien~' 29 5,17e 1?e 1.7e 5.13 3·17 26.32 9e'f15
Ahero ~kola 33 9,066 274 2.74 10.50 7-51 M10. 25 2e.77
Sondu ~st hdia-.;a 30 110,393 346 ;.4t> 9.e3 11.9( ~.63 ~.01
llaso~o ~bar . ~4- l5,709 302 3.02 5.99 13.10 ,5.~ ~1.be
-,_
Pap Ondi.ti rabodho East 36 10,192 2e3 2.~3 4.1? ~.01 17.39 11.~0
T 0 T L 2e.o2 b').'/'j O'j.b ~' b.~1 ~vv.':>?
.

34 /
To test the sitn~ficance of the relationship ve compute the t 2-test statistic, and at ~ of 0.05, it leads us to believe that some relat~onship exists between population and market attendance.
2. · t = r

35
ft r a rief di c eion on mark t ~ i Iituti n an relationship betwe n market attendance n opu-1 ion density, the author no attempts t o class i f y th13 markets in terms of. their functions, s i ze ru1d erio o op r ation. he market p1aces are rura l econo ·c in t itut ions in terms of distribution an functional r ol • However they differ in terms of att~ndance , t iming (daily or periodic), and the nature of goods an services. The author attempted a classification first on the total number of viSitors received by each market.
(i) Markets with lees than 450 peopl e ·Ter e regarded as small markets. These are Daraja- ·lbili, ap Ondi ti and Komb ewa.
(ii) Markets with attendance of over 450 up ~o 800 people were classified as medium s i ze markets . These are Rabuor, amboleo, aw kuche an
(iii)
· Masogo.
kets with over 800 people attending were classified as large markets. These ar e ondu, Ahero and Kiboswa.
The cut off points were done arbitrarily on the volume of trading actvitt taking place in the ·rket.
or example, small size markets had scanty t t·uC1i ctivi t y and r latively few people participating . Ho· ever the medi um size markets bad moderate market inc ac t ivity &nd tie
rket a are not utilized fully. n the oth r hand l ar -e rkets were fully utilized and t he market s er e Iull
of people while some trading activity took lace out-side t he market because of shortage of space .
In addition to the above classification by attendQ ~e ,
the author attempted a functional classific tion. However t e researcher found it impossible to clas ify the rket a as etail or olesale as markets like on u, Kibosw and Ahero are famous for wholesaling, but r etail trade i s also qUite significant in these markets. Tr ader s f r om other smaller markets onverge into these market s t o purchase foods to be sold in other smaller markets or to be taken to Kisumu urban markets while other

,, ller kets like sogo, Daraja ili, ombe
d faw Akuche are specifically retail markets.
The second classification which the present reaearcher ttempted as in terms of periodicity and orientation.
The author found out that the rket centres in Kisumu Di trict e ibit varying degree of central importance and attr ct different numbers and categories of people from within and without the District. In periodicity and orientation four types of dist n ui hed. These are linear roadside periodic one day weekly markets, t o days
d rural daily markets
oadside J.la.rkets
terms of markets can be dally rkets,
eekly markets
The e are qUite dispersed and small and most of hem opera te on a daily basis. Many of the roadside rketa tend to locate on major routes or roads that
lead to major rkets, and due to the big markets ull the roadside markets also realize an increase in ttendance an sales on that day that the big market
on whose rou~es they are located meet. Some roadside markets are ho,ever, not located along big market routes but at other strategic points for trade. Favourite
ositions are road junctions and public vehicle stages. Ch acteristic lly , the commodities sold in these markets are ble items that villagers buy in small quantities
s may be needed . · ashing soap , cooking oil, paraffin, food items (like ripe bananas, s arcane, fruits and eweets
nd other commodities that can be split d sold in small quantities) are sold .
It is difficult to locate the positions of these
rket precisely because of their great number and unpredictable nature . There are only a few of them that have permanent locations, most of them change positions
circumst nces permit and as ellers of t e co odities deem necessary.

37
eeklt Marteta:
The writer classified eo e markets as weekly markets. These markets operate roughly between two O'clock and six O'clock except !hero and Mamboleo which operate from eight a.m. to five or six Ohloct in the afternoon. They are larger than roadside markets and
' are more permanent in the location. The weekly markets which meet at two p.m. are Kombewa, SonAhor, Daraja Mbili, Maeogo,Paw Akuche (Rolo), Rabuor and Pap Onditi.
(Table 5).
TABLE 5 CLA5SIFICATION OF MARKETS
(i) Claeeifieation according .to Market Attendance:
Size Population Markets
A -Small markets lees than 45 Daraja Mbi.li,
Pap Onditi, Kom\ewa
B - Medium Markets over 45 Rabuor, Mamholeo, up to eoo Paw Akuche,
Masogo.
c - Large Markets Over eoo S ondu, A hero, Kiboswa.
(ii) Classification According to Periodicity
I•A - Weekly Markets Ahero, MamDoleo, Komiewa, · Maso~d Paw Akuche, Rabuor, Pap iti.
B - Two-day a week Markets Kiboswa, Sondu, Daraja Mbili
These markets have an advantage in that their time of meeting does not co~cide with farmers working hours. The roadside markets, however, serTe transit clientele.

38
The weekly markets be&innill8 at ei«ht 0' clock
in the morning like Mamboleo and Ahero attracts large attendance by both buyers and sellers. Traders from
far distant markets travel to these markets to sell
th ir roduce and to re-purchase some goode to take
back to their home markets. For example, some traders
interTieved at !hero came from Oyugis in South Nyanza
and some came from Kisii.
The last classification coapriees the Two-da;r
a week markets. The two-day a week markets tend to locate
where the population is dense and consequently a
demand for a second meeting day is high or relatively
more people are engaged in soae kind of t$ade.
Assortment of goods offered for sale:
The range of food crops found in various locational
markets are shown on Appendix !fJ-4. They are ranked
according to the percentages of consumers who reported
making purchases of them in the survey markets. The percentages are quite low - a pattern which emphasizes
the point about self sufficiency of food in Kisumu
District.
One tends to find that mrkets which usually offer a higher variety of goods tend to experience
a higher market attendance.

TABLE 6: ASSORTMENT OF GOODS AND MARKET ATTBND4NCB
Market Assortment Number of people Place of Goode attending
Sondu 143 983 Pap Onditi 47 417 A hero 182 1 58 Rabuor 67 513 Kiboswa 123 !'57 Holo 85 487 Daraja 1' ili 73 323 Mambo leo 8' 7,8 l~asogo 62 599 L
I•
For instance, Ahero displayed about 182 different items for sale and the average attendance was 1050 people. On the other hand Pap Onditi experienced a low market attendance as it offered a few items for sale.
While discussing the assortment of goods displayed for sale, tne author found it appropriate to include the distance factor into the analysis. One expects to find that as you move further from the town, the more items one would expect to find because many potential buyers would find it difficult to travel to the major town. However, as observed from Table, 7, it ehbws that distance does not influence the number of items displayed since markets which are nearer the major town displayed a larger number of items.
I
I
. .

TABLE 7 Tim ASSORTMENT OF GOODS IN A MARKR'r AND
DISTANCE IN KILOMETRES FROM KISUMU:
Market Pietance from Kieumu Assortment of (Kilometres) goode or
Sonde 52 143 Pap Onditi 4' 47 A hero 25 182 Rabuor 14 67 Kiboewa 16 12, Kombewa 53 78 Holo 47 65 Songhor Daraja Mbili 51 73 Mambo leo 13 ,. ,, Masogo 37 62
From tables 6 and 7 it can be o served that the market size in terms of attendance tend to influence , the number of items displayed as sellers would prefer to bring their goods only where there is a higher probability of their goode being sold.
A correlation and regression analysis was computed on the relationship between goode sold in a market and the distance from a bigger town and the statistic r of 0.1 led the author to conclude that there mieht be no linear relationship between the two variables.
items

41
The computation is shown below:
r
Market Distance fro11 Assortment of Kisumu goode
X Sondu 52 143 3025
Pap Onditi 4! 47 24 1 22 ' A hero 25 112 625 33124
Rabuor 14 67 1 ,, 44 '
K.iboswa 16 123 256 1512, Kombewa 53 78 211! 6 84 Ro1o 47 85 22 ' 7225 Songhor (Daraja Mbili) 51 73 2' 1 532,
Mamboleo 13 ' 69 7!21
:lasogo 37 62 1 ,,, 3844
36 !4, 40160 873!8
Usine the equation 3, below r is 0.1 and a significance test 4 was computed, we conclude that the assortment of oods and distance from a major town are not linearly related.
The author also attempted to compute a regression analysis and correlation coefficient on Assosrtment of eoods and market size.
3. r = - n~ xiyi
j n. ~xi -(~xd
4. t = r
(~_vi) f;1
~65 2303 4545
!38 1 '6e 4134
39!5
3723
1157
2294
322!7

42
Market Assortment Market of goods Attendance
X t x2 y2 XI
Sondo 143 983 2e44~ ~6628! , . ...,,, Pa p Onditi 47 417 220~ 17388! 1~5~! A hero 182 105 33124 1102500 1 911 Rabuor 67 513 448~ 26316! 34371 K.i oswa 123 !57 1512! g1514! 117711 Kombewa 7 452 6084 2043 35266 Paw Akuche 85 487 7225 23716! 413!i Daraja Mbili 73 323 5,2, 1 32! 2357! Mambo leo 6! 7!! 7!21 636104 71 22 Jasogo 62 5!! 3144 35!801 3713
Total 94! '57! 873!8 4!63103 71174
The formula used was derived from Richardeon 5(see J8~e 41). The si nificance teet reTealed that the relationship is str ong at ~ = 0,05 significance level with r:0.7 this might lead t he aut hor to conclude that there is a relatively strong relationship between assortment of goods and market attendance.
Source of goods:
Figure 1 depicts the various channel& through which far m produce may pass while from the place o! production to the market place.
5 Richardson, C.H., An Introduction to Statistical Analysis, New York, Harcourt, Brace 1944 Chapter 6.

FI G. 1 SUI>PLY ROUTES OF PRODUCE TO KISUMU MARKETS .
eller '
Private Seller
PLA~
--------------------~Plow of Produce.
' '
Intermediate traders
Co-operative Societies e.g. Horticultural Co-op. Society
Mem•ers of Co-operative Society

44
The Co-operative Society features the least important ~ink in the chain of supply in terms of the roduce which finally reaches the rural market. Some of the products which the co-operative societies buy from their members is finally disposed through re-sale to consumers in a market place. The food items produced through co-operative societies are onions, tomatoes, cabba~es, English potatoes and sweet pananas. For instance, the Horticul~l Co-operative Society has a branch in Kisumu - and it sells the above named foodstuffs to traders who eventually resell them in the market place. Fish is also sold through
)
co-operative societies.
Analysis of the data on the origins and sources of produce indicate that twenty four per cent'bf sellers were marketing foodstuffs grown on their own farm. Another twenty seven per cent reported they had obtained their goods from other villagers.
TABLE 8 SOURCE OF GOODS OFFBR.BD FOR SALE IN RURAL MARKETS
~·
Source ~umber of Percent lrraders
Other villagers 16 5 Other Traders/Fishermen 94 27 . Own farm/Homestead 84 24 Kisumu Town 95 27 Other ~larkete 62 18
The Survey market 15 4 South Nyanza 1 1
For example farmers may in order to save time and labour, choose to sell some of all of their marketable supply to middlemen (who might pay slightly lower than the market price) before they arrive at the market. Some middlemen visit many wholesale or cheaper markets to collect bulk supplies to go and re-sell
.

45
n urban centr a d to rural market l ere o · 1·tic lrt ·oduce carce. heae tr ders usually take produce such as 1:-e,
b ana, mill t, groundnuts and peas to i umu to n or other rural markets to re-sell to traders who would sell again to consumers. However, greater quantity of food crop ich ~.: tar rur l markets is produced and sold directly by the farmer
slf.
In general, the kinde and quantities of foodcrops tend . to vary a little :from market to market . 'or instance, maize gra:ln as sold in a two kilogramme container .for K. hs .B at aw Akuche, hero, ~lamboleo and araja-~ bilL
The principle of supply and demand operates to rui~e or lower the real money price paid in a market lace f r a J similar quantity of maize, beans and potatoes . But market conditions are reflected during the exchange becaqse the quantity actually sold for a fixed price is i ncreased and decreased proportionately. When supplies ar e limit ed the sellers may use smaller indented containers or put in smaller heaps of foodstuffs, but when supplies are a un ant especially during harvesting time, sellers may u e larger containers or bigger heaps. This same observation was rmd by iraole6 .•
Relationship betweep ipoomes and Market Attendance:
In addition to the discussion on various items offered for sale and market attendance, the author tries to fin o~t
if relationship exists between t he income of the surroun inc population and the market attendance. 'he author hy othesi~es that in areas of relatively high income th population will attend markets in larger numbers as t h y ve extra ca h to dispose of. On the other hand in regions of
6 .M. ''The frioan Trade in the Copperbelt 11
,
Me. Bohannan and Dal t9n , orth Western University ress , 1962.
I
I

46
low per capita incomes, market attendance was expected to be low as they do not have requisite purchasing power . Table 9 gives an overview of respondents' annual income. The table indicates that 65~ earn less than I<' .Shs .6,000 per annum, while 25% earn above K.Shs.6,000 per annum, and 10% did not state their income. This suggests that a higher percentage of rural population in Kisumu fall within the low income bracket in Kenya. This infoimation is based on current wage level which states that the min mum pay in Kenya urban centres is KShs.473/per month. As a result of this low income, their purchasing power is also very low which contributes to the majority of traders with goods worthK.Shs.10/- or 20/- displayed for sale and he/he might earn a pro fit between K.Shs.2/- and 5/- .
The author studied the income of the surrounding people who attended the market and the market attendance. Table 1 0 shm~s a general pattern found in the surveyed markets . It depicts the average income of market attendants in various markets including the number of people who attended that particular market. Sondu, Ahero and Kiboewa which recorded the highest number of attendants, the annual income of the respondents is over KS hs. 6, 000/- per annum.
vhen the author computes the correlation of coefficient (r) she gets an r = o. 5. After t eating the significance of r the author finds that r is not significant at d- = 0.05, and therefore concludes that income 7 of the surrounding population does not
7 The income of the inhabitants in Kisumu rural markets was derived through trading, employment by gove n .n or self employment and by sale of cash crops 1own.

47
TABLE 9: RESPCI'fDENTS ANNUAL INCOME
SHS . BUYERS SBLLERS TOTAL NO. % NO. " NO. " Under 1. 000 9 1.5 14 2.4 23 3.9
. 1. 000 - 2,000 18 3.1 50 8.5 68 11.6
2 ' 001 - 3, 000 27 4.7 57 e.4 76 13.0
3,001 - 4,000 23 3.9 40 8.2 71 12.1
4,001 - 5,000 29 4.9 66 11 .3 95 16.2
5,001 - 6,000 20 3.4 22 3.8 42 7.2
Over 6,000 69 11 .e 79 13.5 148 25.3
No income ' stated 36 6.1 27 4.5 63 1 o, 7
Total 231 39.4 355 60.6 586 1 oo.o
determine the market size 1n terms of attendance. Probably this is due to the fact that some people visit the market for social reasons, that is some boys and girls meet in the market for co~hip.
TABLE 10: AVERAGE ANNUAL INCOMES A!fD MARKET ATTENDANCE
Market Market size {No. of Average annual 1 attendants both income (She.) of buyers and sellers) buyers and sellers
. " Kiboswa '57 1
6671 . ' Kombewa 452 4e21
Mambo leo 7!Je 3773 Rabuor 513 5778 Paw A1ruche/Ho1o 4e7 42e5 Pap Onditi 417 3032 Sondo/Atela 983 7311 Songhor/Daraja Mbili 323 5284 A hero 1050 6403 Maeogo 59! 5254

!raders in the market were specifically asked how they use their income and Table 11 gives a breakdown of the allocation of market 1.noome.
TA.BLB 11 : HOW MARKET INCOME EA.RBBD BY TRADERS IS SPENT
Use Reported Frequency Percent Traders
To purchase food 270 76 Family maintenance and home affaire 166 47 To purchase cloth/ clothing 122 34 To pay fees 54 15
To buy more goode for re-sale 36 10
To pay taxes 11 3 To save 5 -To buy land 2 6
'l:o buy livestock 1 4 Not reported ' 8
of
The information obtained generally suggest the
motive for market selling. The most frequent uses recorded were to purchase food (7~) and to purchase
clothing •
.Bu.yerg:
In the preceding section attention was directed to various types of traders, the range of goods which they offer and the relationship between incomes and market attendance. The researcher then examined the buyers and their behaviour. Extensive
-

49
interview of buyers was undertaken in the ten markets t o find out their visiting patterns, the reason why they attend markets and the role the market played in their lives.
The author started by analysie of th sex characteristic of the buyers. The female-male proportion is not a product of vigorous selection forroular but the general result approached a fair approximation of reality which is women dominance in the rural market place . As pointed out earlier according to the Luo tradition, it is a woman's duty to purchase foodstuffs, a maried man doee~~&rchaee foodetatte. The few men who came to the market mainly bought cattle or some clothing for their family. Therefore, it is common to find females dominating the market except in
the cattle markets (Table 12).
TABLE 12: SEX COMPOSITION OF BUYERS:
Markets Female Ma1e No. ~ No. %
Rabuor 42 1 e.2 3 1 .3 Kiboswa 20 6.7 e 3.5 l'aw Akuche/Holo 16 6.9 3 1 • 3. Sondo/ A tela 17 7.4 3 1 .3 A hero 30 13.0 9 3.9 •lamb oleo 11 4.e 3 1 • 3 Pap Onditi 14 6.1 2 0.9 Songhor/Daraja Mbili 15 6.5 6 2.6 Kombewa 10 4.3 ' 1 ·' Mae ogo 12 5.2 4 - 1. 7
187 81 .o 44 19.0 N = 231
, •

50
In ad ition to the sex composition of the rural market he principal occupation of buyers was al o obtained. As anticipated with the exception of the p -urban markets the occupational structure features a narrow base (Table 13). The majority of the buyers are housewives (4~), while farmers formed the next sizeable category (31 %) traders (~) and students (7%).
It was found during the survey that buyers usually travel to a market with one or two specific purchases already in mind. Although larger markets, for instance, Sondo, Ahero and Kiboswa offer a relatively wide and attractive range of goode , only a few buyers in Kieumu rural markets can afford the luxury of buying on impulse since they have relatively limited amount of cash. However, this may have to be subjected to empirical study.
TABLE 13 OCCUPATION OF BUYERS
Occupation Frequency ~ercent
Housewife 110 47 Farmer 72 31 Trader 16 7 Student 15 7 Teacher 6 3 Others: Preacher/Pastor 2 1
Fisherman 1 0.4 Office ~lessenger 1 0.4 Civil Servant
I 1 0.4
BUilder 1 0.4 Driller 1 0.4 Tailor 1 0.4

51
ost purchases are made quite selectively and are finalized by the consumer only after he has invested considerable time and energy in comparing the prices and quality of identical or similar goode through out the market. The buyers tend to visit the 'home' market for goods purchased frequently but visit other markets to purchase clothes, plates and cups. Buyers were asked what they usually purchase in other markets (Table 14 • The research revealed that buyers are willing to travel to other markets to purchase items such as clothes, shoes, cooking utensils and lamps.
T BLE 14: ITEf.1S PURCHASED IN OTHER MARKETS
I TEM NUMBER OF :ERC.E T
BUYERS PURCHASING .. ' ---Vegetables 72 31 Clothes 61 26 Fish 50 22 r.~ ize F our 26 1 1 Shoes 15 7 Sugar 15 7 Maize grain 15 7 Meat / 14 6 Bana nas 12 5 Cooking Utensils ! 4 Cows 6 3 Chicken 6 3 Salt 6 3 Be aBe 5 2 Lams 5 2
-

52
_The author was also interested in the comparison of income and various purchases do·na. One would expect to find buyers with relatively high income purchase more goode than buyers with low income. ~able 15 ives a breakdown of the income and the amount of goods purchased in Kenya hillinge. About seventy eight (78%) percent of the buyers purchased goode worth less than KShs.20.00. This is probably due to very low rural incomes. It may be as a result of these limited trading activities that rural markets have been neglected and are not of great interest to commercial organizations. As no one has shown interest in these markets traders, the sellers themselves requested that the government should organize some credit facilities and finance in form of 1 ana to help them increase their stocks to1hich would eventually lead to in reased profits. Trader inverviewed said that they obtain from other middlemen but would li~e to purchase through credit terms.
Location sizes and the number of markets:
The writer tried to find out if in case of a bi er locations, the number of markets would be higher because of its mere size.
In case of smaller locationa, the number of markets were expected to be smaller. Table 16 howe the locations, their sizes and the number of markets. From the table it cen be observed that locations such as North-Bast Kano has only 9 markets but £ts size
t is 21 ,600 square kilometres while Kajulu s size is 3 .600 square kilometres but it has 6 markets.

53 !ABLE 15 BUYERS : PORCH.A.SES .AND .ABNU.A.L INCOME
ANJIDJ.L lli ... .JIOSB IN .KEI'fU SHILLINGS
Purchases in Leas thu ~000-200C 2001-3000 ~001-4000 ~1-500( 5001-600( OYer 6000 o Inc Total X.Sha. 1000 ~
1Dd. y . Le•• tha.Jl 10/- 3 5 5 10 7 6 22 21 ?9
10-20 4 9 14 15 9 12 23 15 101
21-30 1 1 1 - 3 2 10 1 19
31-40 - 1 - .. 4 - 2 1 - 5
41-50 - 1 - - 2 - 2 2 ?
51..-100 1 - 2 - 1 2 7 1 ""'"
~er 100 - - 2 1 - - 3 - 5
TOTAL 9 1? 24 2? 22 24 67 40 230
·····-------------------····-=K--··----··::aa•a•asc·~--------- ·-·····-·----·-····--------···········----·

54
TALE 16 LOCATION SIZES AND THE NUMBER OF MARKETS
11 ! Location Locati~n size Bo. of x2 y2 in Km.
kets XY I
X y !
West Seme 13.5 10 U~2 .25 tOO 135.0 East Seme 14.7 9 216.09 61 132.3 Kisumu East 1 o.e 15 116.~ 225 162.0 Kajulu 3.7 6 13.69 36 22.0 Miwan1-K1bos 11.9 6 14,1.61 36 71.4 North-East Kano 21.6 ' 466.56 81 194.4
est Kano 16.2 11 262.44 121 178.2 S .E. Kano 25.7 12 660.49 144 306.4 I
Chemelil 13.4 e 179.56 64 107.2 North Nyakach 15.9 9 252.81 81 143.1 West Nyakach 10.5 6 110.25 36 63.0 Koru Fort Tennan 9.2 5 84.64 25 46.0 Muhoroni 9.4 4 88.36 16 37.6 South Nyakach 8.8 7 77.44 49 61 .6
. ~ I
Total 185.3 117 1662.4 2e52.a3 10,5 ! , ~
I I
. • . .
.
,
I

55
Testing the Hypotheses:
The results of this research in the previous section are now used to test the null hypotheses which were outlined at the end of Chapter III.
Hypothesis 1
The null hypotheses to be tested here is: High nd low opulation density sub-locations have markets of equal sizes.
The above hypothesis was der·ved from literature review in Chapter II which also proposes that population density of a sublocation affects the market attendance, The hypothesis asserts that whether a market is located in a sparsely or densely populated area its attendance (size) will be the same.
The statistic r was computed and the correlation coefficient is 0.6. This might lead us to believe that some relationship may exist between population density and market attendance,
To teet the significance of the relationship we compute the t 8 test, and t is equal to 2,21413. A
two tailed .test was computed and since 2,214 is greater than 1.85, the critic 1 value oft for 8 degree of freedom and c:><_ = 0.05 (two sided test), Ho is rejected and we conclude that population density and market attendance are linearly related,
The second statistic computed to support the above finding is the linear regression equation. The line of the best fit was y = 2.4 + 1,5x9 (Fig.2).
8
9
t =
J~ 2 2 r
This formula was used to compute the teet
The formulae used follows:
b = n {£xiyi~ n{ xi2
a - f-yi - b, f-.xt n
to arrive at the answer
statistic,
are as

- 56
11111 mmr mu 1ll UU Hli!IUUiilllU IIi II Hit IIIII m !!!!: n ~Iii Iii ; rm ~uuHJ 11 mJ
jri IW. Jittt;i: I! Ill .. ~~~ f! 1a;, fll"~ l:: ""r.~ ~~ t im~ ~~ · u. iilim li ~~~ fc1 r:L
II il
a 1U ill II Il l !' II I ~ 1
i~ %.i
~:unmt:~;:~ ~~ ~~Hm1HHtHTHHiiP.IIiiiiHtHtHittmttt1ittt !IUMmillHHIHHH1fHHffiHtHHHHHHIItHHHHttttttttttiffttttfftffimlttttffiittm1 HI
lllltl 1!111111
II!
ft 1:1
!Ill
!i
r.'i 1 I I
I: 1111111111111111!111111 U! 111111111111111
1: H 11 ~IIH' I~fHttttt ll
!II
n~m~~~~HtliHHtmtil~[U!millilllUllii~W~~~~~~~~~~lliM~~~~1 H~ ~

57
To teet the statistical significance of coefficient of b, a t teet etitietic e computed using the formulae shown below 10, 11, 12. (See computation Appendix F - 1 ) •
The coefficient of b is statistically significant ae revealed by the t - teet and we reject the hypothesis.
Since 5.6 ie greater than 1.85 the upper critical value oft for a two aided teet with e degrees of freedom and e>(_ = 0.05. Therefore we conclude that J is not 0 and there is a linear relationship between
population density and market attendance and since b
ie positive, the author concludes that the relationship
is direct rather than inverse. The Hypothesis ie null.
10
12
To compute
Sy.x
t
Sy2/ X
= ~ £;....__:-l-_---:-·--~-Y -_b_.:fj __ x_y_
= s;. x
~12
= b - po sh
<£xi)2 -n

58
Hxpotheeie 2a
The second hypothesis to be tested is that the
number of markets in a location is highly related to the size of the location.
The null hypothesis to be. tested here is: Large and small locations have equal numb .. ·of markets.
This hypothesis was stated with the assumption that in order to minimize distance travelled by market attendan1. , there will be more markets in larger locations than in smaller locations (in square kilometres).
The computation of correlation coefficient revealed a t of 1.6621. Since 1.6621 is leas than 1.7823, the critical value oft for 12 degrees of freedom and~= 0.05. Ho is not rejected and we conclude that the size of the location does not determine the number of markets in a
location. The Talue of r = 0.5 in Appendix E-2.
However the findings might have been influenced
by the sample size which was small. If the sample size were larger the t test would have been significant.
Using another statistical analysis as before, a
regression analysis line was found to be y = 4.4 + 0.3x (Fig.3). The same formula vas used to find a and bas in
hypothesis 1 •
The teet statistic to find the significance of b
revealed at= 0.1. Since 0.1 is lees than 1.78 the critical value oft for a two sided test with 12 degrees of freedom and c::><- = 0.05. Therefore we conclude that) = 0 and there is no linear relationship between the size of the location and the number of markets in that location.
The author concludes from the above finding that the location size does not determine the number of markets~ Therefore the number of markets in a location is not
highlY related to the size of the location.


60
B:rpotheait ?b.
The number o~ markets 1n a location is highly related to the population of the location.
!he null nypothesis to be tested here ie: Bi&h and low population areas have equal number ot IBl'keta.
This hypothesi~ was derived from the literature reYiev that population of a location controls the number of markets but not necessarily the size of the location. The result of correlation analysis revealed an r : o.a which might lead us to bel~eve strongly that population size does determine the number of markets in a location.
The author tested the s~ficance of the relationship b computing the t test. The t test revealed a t = 4.50 which is greater than 2.2 the critical value for t for 12 degrees of freedom and ~= 0.5 (two sided test). Ho is tber tore rejected and it i eo ~lu ed thut population of a location and number of markets are l~e rly related. This shows that the population size intluencee· the number of markets which a local authority e tablished within a given location.
A regression analysis was computed an t e e uation revealed that y = 28.57 + 0.2x (Fig.4). The signi£icance of b was tested, the author rejects the hypothesis since 7.97 is greater than 2.2. the upper critical value oft for a two sided test with 12 degrees of freedom and oL.... = 0.05. Therefore we conclude that B is not 0 and there ie a linear relationship between population size and the number of markets in a location. Since b is ositive, the author concludes that the relationship is direct rather tlian inverse.

61
:Hffi ii• W! u 1mtlml~~~~ I!II m1 IIlii; I 'lilllli I! I i)lll!!!l· II l !i I!!!! ' ~I ii lii"!lll! ! 'I Ill '" ~cr: 1!!1
::1 ~ ·til!i, I; m II j 1<,1 ulltqu i'i ~~i
~~ :r.lltot ~pniml " ~;ll~ l.ll ~ ~~~ ~ : !1 If u u l: ! bJ ~ ~~ ~~~ ~ ~\,; ~ _i~~. ~~ l c! (ijy;~M~ ~
I I' . II hi It ; p 1!. . ~
~~ ~~ u II ~ m
' :J:!
!I ·Y~
' ~~
!HHHHR !IHH
it
ll '': !!
In it HI .
II i!
1:1 1: t;
II' .~ 'H :1 lH
If! It at
I! :H l il~f ii: ~~ H ' fj I• I
I! I I f~ r; i ;ill II 11
I:J ~:t: ~ 11i'ti ~~ i!1 lP· ..
H ~ ~. ~liJ1 ~ I~ : :, fltttl
Ia It ,IT w I~ 11 . liT
H 1': 11 L I~ n 1r li
!~ (I 11:1 . . i: ! ll w m
Ill
~ :nttH 'tttJ
ti if u il

62
Hxpothesie 3a The assort ent of goods sold in a aarket place
i related to the distance from the biggest town in the reaion.
The null hypothesis to be tested here is:
rketa near and far from th the same asso .rtment of goods.
jor town have
The above hypothesis tested was postulated by the author who assumed that the farther you are from the major town, the more items one would expect to find because many potential buyers would find it difficult to travel to a major town.
ith an r of-0.1, the author might be led to believe that there is no linear relationship between the assortment of goode displayed in the market place and the distance to a major town.
The student t distribution test was also computed. The teat statistic revealed that t = 0.40. ' ince 0.4 is leas than 2 .306, the critical value of t for 8 degrees of freedom and ex( = 0.05 (two aided test). Ho is therefore not rejected and we conclude that the assortment of goods and distance from a major town are not linearly related.
Using another statistical analysis as before, a regression analysis line was found to be y = 95.2 -.007x. The same formula was used to find a and b as in hypothesis 1 •
The teat statistic computed to find the significance of b revealed a t = - 16.6. The author therefore accepts the hypothesis since 16.6 is less than 2.306, the upper critical value of t for a two sided test with 8 degrees of freedom and c:::><- = 0.05. Therefore we conclude that ~ = 0 and there is no linear relationship between the assortment of goode sold in a market and the distance from the biggest town in the region.

63 wmwll~m»t~lffiOOlrn m IU u U Hllill
!II Ill
m~~ f!Ri!ia~iTIIiml ft II Ill "" nruuUntl111utlllmmJ:IIIIIlutlft.~Uttnnutml liillil!l " l !!' 1!1 lh n II II fHHI
Ul llilll
li H WI! Ill
if lllllli Iii If. IIH :If
ll il I Eli! u L': 1111
II
ill II fH It Ul
[I ~~ -!!
~~'' I II
It Ill
~ lil~ I ll Ill IJ I! II
II II
n II
mmttHHittttmrn!Hllll II
~~~~ !I li Ill ll :II II: m
11 li l1 II U! !!II
H

64
Hypothesis 311
The assortment of goods, sold in each market is related to the market size in terms of attendance.
he null hypothesis to ~e tested here is: Attendance in markets with few goods or many goods is the same.
The above hypothesis is a corollary to hypothes 3a. The author felt that markets offering a larger number of items should have a higher attendance than markets offering fewer items.
The computation of correlation coefficient revealed an r = 0.7. This might lead us to believe that there is a relatively strong relationship between assortment of goods and market attendance. Buyers and sellers prefer to visit markets with a larger variety of goods and select whatever they need. · On the other hand sellers prefer to attend markets with larger attendance to get a chance of a higher potential sale for their goods. Hence the direotion of causation cannot be determined in th.i s case •
The student t distribution test was also computed. The test statistic revealed a t = 2.56. Since 2.56 is greater than 2.31 the critical value oft for 8 degrees of freedom and ~=0.05 (two sided test) the author might be led to conclude that market attendance may be linearly related to the nun1ber of £,:Oods or i t~ms
di played at the market place.
The regression line equation was also computed from the data and it is y = 621.2 .33x ( ig.6). A test for significance of b was carried out and it revea1ed at = 0.9. Since 0.9 is less than 2.31 the

b) -ll'1 1
11m Ill! i~; ill~ IHII!Iil !:ff. : • ~n !HH
J I! !Wiii!l lli r11 :~: .1• ~ll[ll!!
r:;: m ~· ! ~ ·~ . ~~~~~·~ ~· ~:Pi~ Hill! liil 11 ,, I• i! :: :!
~s~~~~ ~~ o raA~n~ if ;n t1 ii T ~~
m l(i t': t'i I H~P,nHK IS ~~ if\ .~ i!f il ~:ll!il t;t II
l'!lt !!!! ~~ II 'llli l!
:: lii !It
B
ln ft 1::
1:
I II ~
• r 1111 ii H
'" ~~ II
lt ; r.
If . It II
1: II It [I ~ :;i II! l!
..
lf ill .. iill llf
~ ~ I~
~ !! It It 'ii II !! I~ Ill r.1 I! lt hitl 1
! :~ .,;l jf i"i'i"l ff IIJ :.~~e 'l l ]ill Ill II ~~~ ;~ !q :t l! ·~ ~g i . J~~ ~:ijl :: . )ij
If! 11.' :i. il'i ~ ' . "' .i ! !fi ' ~ liT+ i w ~ :~ itl ~~~
~ Iii :n . ::
It tri f~ [tl ~~ ~ fP. !i
fi; fl
m Ill It 1m~ m
Jm I! ~! m
·i -If! (f
' lfi ,
II
·lli li ll I ~ It

66
cri tica.l valu of t for 8 degrees of free om b t •
cx.~o.os (two aided te t). 'l' e aut or might be
led to believe that there is no linear relation hi
betwe n assortment of goods &nd market attend· ce. This test revealed that b is not statistically sig
nificant, therefore we accept the hypothesis as null.
Hypothesis 4
The size o~ the market is related to the 1 vel of the incomes of the people in the surrounding areas.
Ho : Hieh income and low incom~ areas hDve mbrkets of equal Sizes.
In the above hypothesis the author assumed that the
higher the income the greater the market attendance.
Or on the other hand, the lower the income the smaller
the market attendance.
The computation of correlation coefficient reveale
an r = 0 . 516 . This might lead us to believe that there
may be some linear relationship.
To teet the significance of the relationship , we
compute the student t distribution test. The test statistic revealed that t = 1 .65. Since 1 . 65 is less than 1 .85, the critical value of t for 8 degrees of freedom and CX:..... = 0.05 (two sided test), it is not
rejected and we may conclude that income of the
surrounding population does not determine the market size in terms of attendance. This might be as a
result that some people attend the market for social reasons.
The regression line equation was also computed from the data and it is y = 31.1 + 3 .3x, (Fig.?).


68
A significance teat of b was computed which
revealed a t = 23.3. e therefore reject Ho , since 23.3. is greater than 1.85 the critical value oft for a two sided teat with 8 degrees of freedom and ~ = 0.05. Therefore we conclude that J is not an there is a linear relationship between income and market attendance. Since b is positive, we conclu e that the relationship is direct rat er than inverse.

69
CHA TBR V
SUMMARY. CONCLUSION AND IMPLICATIONS
UMMARY
The main purpose of the study was to describe and evaluate the functional role of market places as institutions of exchange an distribution in Kisumu !strict as well as their contribution to the economic
and social life of the rural population in Nyanza rovinoe.
Iarket places have been found to be multi-functional institutions both in the literature and in the present • study.
Secondly , research design or research methodology was discussed in chapter III. Once the data was obtained, it was analyzed by means of descriptive statistics such as frequency distribution tables, regression analysis, correlation coefficient and the students at distribution test in chapter four. A descriptive analysi is also carried out on buyers, sellers and the different goods offered for sale and their source of supply.
The conclusions of this analysis are now presented next.
Conclusions
The main conclusions of the study are presented on Table 17.

70 17 s
1 • There is aignifioant r = The result of r an relationship between sigirdficance test support population density that population density of a sublocation and market size are and market size. somewhat linearly related,
at significance level of 0.05.
2a. The number of markets r = 0.5 There is no linear in a location is relationship between the highly related to the size of the location and size of the popula- the number of markets in tion. that location at signi-
finance level of 0.05 . b. The number of markets The test of r and in a location is significance test supports highly related to r = 0.8 the hypothesis that the the population of population ~f a location the location. is somewhat linearly
related to the number of markets - significance level of 0 .05.
3a. The assortment of r = 0.1 There is linear rel~tion-goods sold in a ship between the assortment market place is of goode in a market and related ~ the the distance from a major distance from the town at significance level biggest town in of 0.05. the region.
b. The assortment of The computation of r and goods sold in each r c 0.7 the significance test market is related revealed tha' there is to the market size a relatively strong in terms of linear relationship attendance. between assoertment
of goods and market attendance at significance level of 0.05.
4. The size of the The result of r and the market is related significance test of b to the incomes of y = 0.52 shows that the incomes of the people in the the surrounding people surrounding areas. determines the numbet of
people attending a market.

71
From the conclusions stated in' able 17, we ee t bt the variables controlling the market attendance are populHtion density of a location or sub-location in which the m&rket is situated and the availability of the goods on that particular
market .
These research findings reveal that the amount and variety of goods received by a market an displayed strengthens the position of that market. Therefore, the size of a rural market in terms of a~tendance depend, first on the availability
of local produce which are mainly agricultural products. econdly the population of the region where the market is
located for example, a market in a densely populated area will usually experience a higher attendance than a market in H low
density area.
The income of the surrounding population has an impact
on the market attendance as revealed by th correlation coefficient and the significance test for b. Thehigher the
income of the sunounding population, the higher will be th
market attendance.
The author also found out that the number of markets in a location is linearly related to the population of the
location . In view of the importance of markets as economic
and social institutions, one of the pre-conditions of market expansion is a relatively high density of population
as observed above. Hodder 1 found out in Yoruba, that there is a critical figure of about fifty people per square
mile below which markets do not occur. The author 's
findings in Kisumu
1 Hodder, B.W. Some comments on origins of Traditional markets FP. 103.

72
District also supports this. The population den ity o ntrols the number of market attendance a d the popu tion of a location has a direct influence on the number of markets in a location. or example, this
tudy has revealed that there is a linear relationship between population of a location an the numb r of markets in that particular locations.
Directions for Future Research:
The author recommends that some specific stu ies be carried out, covering the whole of Kenya , for instance a study could be mounted on the problems of marketin~ perishable commodities in the Kenyan rural markets . These studies will reveal specific problems encountered when marketing a particular commodity and this information might benefit the rural market traders who sell these commodities.
A study could also be mounted on the Historical Development of markets. ' his study will reveal some knowledge on how markets originate, their location and its rate of expansion. The study of this market development migh reveal some information and opportunities in non-agricultural employment and new sources of income.
uring the present research, the writer met certain difficulties which should be noted by future researc era on this field. irst of all finance was a big constraint, funds were inadequate for travelling expen ea to many rural markets . As a result, only ten markets were surveyed an each market was only visited twice.
Secondly , getting reliable information rom rural population was another problem . In cases of interviews held in the market, some individuals particularly men and young women were not willing to give information as they were suspicious, respondents believed that the research and the assistants were government agents

commissioned to find out the traders overcharging their commodities due to the 1980 food shortages caused by proloJ18ed drought in 1 979.
Last, but not least, although the researcher used a number of people attending a market for classification purposes and to test the hypotheses, the number of market attendants could not be determined accurately as some traders walk in the market, then walk out and eventually re-enter the market again. So although physical counts w'ere conducted at the market gates, the author is aware of some double counting which might have occurred as the people do not enter the market in a single stream.
This thesis provides a descriptive an analytical study of rural markets of Kisumu District. A comparative research could be carried out in other rural and urban uarkets in Kenya.
The author thinks that these traders who sell in rural markets warrant som.e government support because the demand for additional goods will continue throll8h the rural market places.
r

74
APPENDICES
A - ENGLISH QUBBTIONNAIRE AND CORRESPONDING LUO
UBSTIC!iNAIRE.
..

75
UNIVERSITY OF NAIROBI
PAC~Y OF COMMERCE
RKBTING IN KENYA - SURVERY OF Tllli FUNC'l' NS :E'
RURAL MARKETS IN KISUMU DI TRI CT.
Interviewers's ame : ••••••••.••••..•••••••••
Market Name : ........................ Date of Visit: ........................
APRIL/MAY 1 980 I

76
1
Gee mora~ A:tterll • I Tening
y ame ia... • • • • • • • • • • • • • • • • • • • • • • • an I am carryiag eut a SurTey • markets and h w t h e w atteDa 'feel' abeut them. I w uld, t ere re, be
swer the follo>tring grateful if ye oaa take time t queetiena.
PART A. - ASK ALL BUYERS AND S LLERB. (T~ck apprepriately).
' • 1 • Hew 41 yeu come to the market?
A ••••••••••••••••••••••••••• Bus B ••••••••••••••••••••••••••• car C ••••••••••••••••••••••••••• Walked D ••••••••••••••••••••••••••• Uther
(Go to .3) ~~-~ (specify) ••• /..
.2. How much fate did y u pay?
A •••••••••••••••••••••••••• Nothing
B •••••••••••••••••••••••••• Less than 5/c •••••••••••••••••••••••• -•• 5/- to 10/D. • • • • • • • • • • • • • • • • • • • • • • • • • Over 1 0/-•
• 3. by did yeu c me to the market?
1 •
2. 3. 4.
A........................ . Sell B. • • • • • • • • • • • • • • • • • • • • • • • • • Bey (Go to .21 ) c ••••••••••••••••••••.•.••• To meet friends and
relatiYea (G to B part).
D •••••••••••••••••••••••••• Other (specify)
hat are you selling today? (List the items)
• ••••••••••••••••••••••• 6 •••••••••••••••••••••••• • ••••••••••••••••••••••• 7 •••••••••••••••••••••••• •••••••••••••••••••••••• 8 • . .. , ................. . •••••••••••••••••••••••• 9 . .................... .

77
.5. Per ow much are you selli•g each unit of tl e item?
Selling Unit rice
1 •••••••••••••••••• • •••••••••••••••••• • •••••••••••• 2 •••••••••••••••••• • •••••••••••••••••• . ...... . . . 3 •••••••••••••••••• . ................. ' ••••••••••••• 4 .................. . • •••••••••••••••••• • •••••••••••• 5 •••••••••••••••••• • •••••••••••••••••• • •••••••••••• 6 •••••••••••••••••• • • • • • • • • • • • • • • • • • • •••••••••••• 7 •••••••••••••••••• • •••••••••••••••••• • •••••••••••• a •••••••••••••••••• . . . . . . . . . . . . . . . . • •••••••••••• 9 •••••••••••••••••• • •••••••••••••••••• • ••••••••••••
10 •••••••••••••••••• • •••••••••••••••••• . .......... . • 6.
.7.
Hew do yeu determine the (Yeu c~ tick more than
aell1ng price •e i tea).
of yeur product?
A • • • • • • • • • • • • • • • • • • • • • • •
B • ••••••••••••••••••••••
c. ...... ~ .............. .
According to the price charged by etllera ia the market (competitora). Accer~iag t the cost of preductioa
!ccerdillg t the cost of transpert
D ••••••••••••••••••••••• Otller (specify) •••••••••••••••••••
Frea where i4 yeu get the product you are selling?
A • B •
••••••••••••••••••••••• •••••••••••••••••••••••
c •• D •• B ••
• • • • • • • • • • • • • • • • • • • • • • • • • • • • • • • • • • • • • • • • • • • • • • • • • • • • • • • • • • • • • • • • • •
Other Tillage• Own !araVhomestead Fro• Kisumu Tewa
From other marketa Other specify) •••• • ••••••••••••
• a. How much aaaey do yQu usually eara in an aTerage .arket day (Tick nly oae).
A •• • • • • • • • • • • • • • • • • • • • • • • • • 0 -B •••••••••••••••••••••••••• 51/c •••••••.••••..••••••••.•• 101/-D.. • • • • • • • • • • • • • • • • • • • • • • OYer
50/-te 1 OQ( te 200/-
200/-.

.1 o.
• 11 •
78
a there any ifference ia earni ga betvee rket dap?
Yea
N (go to .11 ).
different
by do you earn more on one market day than another? (Y u can tick more tha one).
A •••••••••••••••••••••••••••• The day is more popular
B •••••••••••••••••••••••••••• Rural teachers haTe received their pay
c •...•..••••.•.•..•.....•..•• Rural population has received m ey from working relatiTes.
D •••••••••••••••••••••••••••• Other (specify) ••••••••••••••
by is the market impertant for you~ (You can tick more than one).
A •••••••••••••••••••••••• Aa a aource of cash(selling)
B ••••••••••••••••••••••• sa venueof meeting frien s and relatives.
c ••..••.••.....••.....• To purchase food
D •••••••••••••••••••••• To pay taxes
E •••••••••••••••••••••• other (specify) •••••••••••..••
• 12. How do you pla to use the cash obtained from market sales? {You can tick more than one).
A •••••••••••••••••••••••••• To purchase cloth/clothing
B • • • • • •. • • • • • • • • • • • • • • • • • •
c •......•....••••.......•. D ••••••••••• • • • •••••• • ••••
• • • • • • • • • • • • • • • • • • • • • • • • •
To pay school fees To purchase food To pay taxes Other (specify) ••••••••••
• 13. How often to you Tisit a market?
••••••••••••••••••••••••• Regularly Call market days)
• 14.
B • • •• • • • • • • • • • ••••••••••• •
c ••.....•.•.•............• • • • • • • • • • • • • • • • • • • • • • • • • •
Often but not always ccasionally
Seldom • hich other markets do you vi ~ it apart from thi one?
A • • • • • • • • • • • • • • • • • • • • • • • •
B • • • • • • • • • •• • • • •• • •• • • • • • c .•......••.............• D • • • • •. • • • • • • • • • • • • • • • • • •

79
.15 How often do you visit the aboTe named market?
Market
1 ••••••••••••••
2 •••••••••••••• ' ............. . 4 • .....•••....• 5 •••••••••••••• 6 •••••••••••••• 7 • ....••..•...•
a •............. 9 • ............•
10 •••••• ••••••••
RegularlY A
,
Often B
Occaaiona111 0
Seldom D
Q.16. What is the aTerage income you get from he abaTe markets?
Lis t down the name of market visited.
1 •••••••••••.••••
2 •••••••••••••••• 3 • ............. · ..• 4 •••••••••••..•.• 5 ••••••••••....•• 6 ••••••••••••••••
Amount of cash earned 1 the 0-100
A
1 01 -200 201 300
B c
each market 301 400
D
'-l · 1 7. Do you have other occupation apart from selling?
Yes No (Go to .20)
• 18. What else to you do?
1 •••••••••••••••••••••••••••••••
2 •••••••••••••••••••••••••••••••
3 •••••••••••••••••••••••••••••••
Are they more important than selling?
Yes
No
I dont know.
Over 4r>

. 20 .
fA B.~ :a: . 21.
• 22 .
• 23 .
. 24 .
80
Ho long have you been elling in t is · rket ?
A • • • ............ . . . . . •• Lea than one yefJ.r B • • • .... . . ..... . . . . . . . • 1 to 3 years c ••• ... . . . . . . . . . ... . . . 4 to 5 years
D • • • .... • • • • • • • •• . . . 6 to 8 years
••• • • • • • • • • • • • • • • • • • • Over 8 years (Go to . 29) .
- A ax :StJYBIUl Ql:I.LI·
Which produce have you come to buy?
1 ••••••••••••••••••••••• 6 •••••••••••••••.•.••.••
2 ••••••••••••••••••••••• 7 • ••••••••...••... . .. 3 ••••••••••••••••••••.•• 8 • ......................
4 . ..........••.......... 9 •••••••••••••••••••••••
5 ••••••••••••••••••••••• 1 0 •••••••••••••••••••••.•
by do you come to this market to purchase the ab ove products? A •••••••••••••••••••• It istnearer·home than any other
ma.rke •
B • •
c •. ................. .................
Variety of products available roducts are relatively cheap
(lower prices) •
. . . . . . . . . . . . . . . . . . . Uthers (specify) •••••••••.•..•
How often do you visit this market?
A '• ••••••••••••••••••• Regu:larly (all market days)
B • • • •. • • • • • • • • • • • • •• • • c .. D • •
•••••••••••••••••••
•••••••••••••••••••
Often but not ccasionally
Seldom
always
hich other markets do you vis it apart from this one?
.1\ •••• ••••••••••••.••••••.••••
2 •••••••••••••••••••••••••••••
3 •••••••••••••••••••••••••••••
•••••••••••••••••••••••••••••• 5 •••••••••••••••••••••••••••••

81
25 . How often do you visit the above named market? (Name the market and tick :visit ina pattern).
Name of market visited
1 ••••••••••••••• .
2 ••••••••••••••
3 ••••••••••••••
4 ••••••••••••••
5 ••••••••••••••
Regu1arlY 0 Occas1onal1l
1
Q. 26 . hich products do you buy from the above markets?
u~me of market visited
1 ••••• ·'· ••••••
2 • • • • • • • • • • •
4 ••••••••••••••
5 ••••••••••••••
Foodstiiffs
••••••••••• ••••••••••• •••••••••••
••••••••••• • ••••••••••
• • • • • • • • • • •
••••••••••• • • • • • • • • • • • • • • • • • • • • •
••••••••••• • • • • • • • •••
• • • • • • • • • • •
Comm~ities bought Others Manu actured epecitv
• ••••••••• • • • • • • • • • • •••••••••••• • •••••••••• • • • • • • • • ••• •••••••• •
• • • • • • • • • • • • • •••••••••• • ••••••••••• • •••••••••• • • • • • • • • • • • • • • • • • • • • • •
•••••••••••• • •••••••• • • • • • • •
• ••••••••••• • •••••••
•• ••••• • •••••••• • •••••••••• • •••••••• •••••••••• ••••••••••

.27.
• 28.
82
hat is your occupation?
A.. . • • • • • • • • • • • • • • • . . . . . . • • armer B •••••••••••••••••••••.•••• Teacher C... • • • • . • • • • . . • . • • . . • . . . • • Housewife
D • • • • • • • • • • • • • • • • • • •...•• c.:yudent
E • • • • • • • • • • • • • • • • • • • • • • • • • • Others (s pecify) ••••••.
Are you buying the product } .......................... . B • • • • • • • • • • • • • • • • • • • • • • • • • c ... ..................... . .........................
fo1 .. . •....••... Own use
To re-sell
To give to a relative (specify) ••..•••• t ers
hat 'things ' in your market do you feel that the government should impr ov ?
A • • ••• • • • • • • • • • • • • • • • • • • •
B • • • • • • • • • • • • • • • • • • • • • . • • c .. ..................... . ........................
water supply
Transportation means Reduce market fees Build stalls
•••
. .....
• • • • • • • • • • • • • • • • • • • • • • • • Other (specify) ••••.•...•••
CLAS IPICATION DATA:
1 • Npe ••• ••••••••••••••••••••••.•..•.••
2 , Location •••••••••••••••••••••••••••.•
3 . Sub-locat ion ••••••••••••••••••••.••••
4. Village . ...•.••............•.........
s. Sex ••• •••••••••••••••••••••••••••••••
6. ~~rital Status
Married
r--iJ.ale
c=JFemale
ingle (Go to Q. 8)
idowed
Uther (specify) . ........... . .

83
7. u.mb r in amily (Hus hn , ·it' C:tl arried c il re
~ o. f male II 0. o1· female
a. ~hat is the occupation o th c ie i come eazner? •••••••••••••••••••••••••••••••••••••••••••••••• . . . . . . . . . . . . . . . . . . . . . . . . . . . . . . . . . . . . . . . . . . . . . . . .
9. Age: •••••••••••••••••••. Years. 10. hat is your annual income?
K. hs • • • • • • • • • • • • • • • • • • • • • • •• 11. Do you have a farm?
Yes
No (terminate interview
12. hat is the aize? ••••••••••••••••• ~acres 13. hich type of cash crop do you grow in your farm?
~--------~~Cotton Coffee .._ _____ __.
I
~sugarcane O::flower
ri1 t---r---
others specify •
• 14. How many acres are under cash crops mentioned above
Cotton •.. ......................... acres Sugarcane ••••••••••••••••••••••••• acres Rice •••••••••••••••••••••••••••.• S un.flower • •.••..•...•........... Others (specify) •• · •••••••••••••• • • • • • • • • • • • • • • • • • • • • • • • • • • • • • • • •
acres cres
acres acres •

A 2
LUO TR}.N LATION 0 l,lUESTIONNAIR •
yavore/osavore/oimore. yinga en •••••••••••••••••.••••• kendo atimo tiegruok
Juom chirni mantie risaf, kendo kaka jomadhiye chirni go nenogi. Akvayi ni ka iyie to mondo iduoknae penjo moko manok.
PART A
.1. Ne ibiro e chiro ka nade?
A Bus
B ~ltoka mat in c Lori D iwuotho gitiendi (dhie • 3) B moro (vachi) ••••••••••...••••
Q.2. Ne ichulo pes a adi?
A no no B mat in ni 'h.5/-c 5/- nyaka 1 o/-D mohewo 10/-.
Q.3. Ne ibiro e chiro nango?
A 1oko
B ng'iewo (dhie Q.21) C romo kod oaiepe gi vedena(dhie .13). D mor B moro ( wachi ) •••••••••••••••••.•••
P&NJ JOLOKO DNPB:
.4. Ango ma iloko kawuono?
1 • • • • • • • • • • • • • • • • • • • • • • • 6 ..................... .. 2.. • • • • • • • • • • • • • • • • • • • • • 7 ••••••••.••••...•••.•.• 3... • • • • • • • • • • • • . . . . • . . . • I ••••••................• 4.. • • • • • • • • • • • • • . • • • • . • • • 9 •••••••••••••••.....•.• 5. • • • • • • • • • • • • • • . • . • . • • . • 1 0 •••••••••••••••••••••••

.5 Gigiko iuao pesa Gima iloko
1 ••••••••••••••• • • 2 ••••••••••••••••••
3 •• 4 •• 5 •• 6 ••
. . . . . . . . . . . . . • • • . . . . . . . . . . . . . • • • • • • • • • • • • • • • • • • • • • • • • • • • • • • • • • • •
7 •••••••••••••••••• 8 ••••••••••••••••••
9 •••.••••••••••••••
85
adi kaka gin no? Kaka iketo
, ............ . • •••••••••••••
• • • • • • • • • • • • • • . .... •.• ...... . . ..... . . . . . . . ....... . • •
• • • • • • • • • • • • • • • ••••• t l •••••••
• • • • • • • • • • • • • •
engo
• •••••••••••••••• . . . . . . . . ...... . . ..... . . . . . . . . • •• . ..... . . . . . . . . .... ••• • • • . ........ . • • . ............. . . ............... .
. .. . ........ . 1 o •••.••••••.•••••.• • ••••••••••••• . ............... .
• 6. re kaka ike to nengo gik ma ilokogo?
~.7.
A ka.ka j ochungo wadwa: keto B kaka luwore gi nengo wero c kaka luwore gi nengo wuoth D moro (wachi) ••••••••••••••••
Gima ilokono ne igole kanye?
_h
A
B
c D
E j'
jo gwengwa e puotha/e dalana kuom JOhala moko, risumu bema
kuom chirni moko moro (wachi) •••.••
jolupo,kata jotheth
........... • 8. Peea adi m iyudoga chieng' chiro moro amora?
,
A
B
c D
nyaka 0 - 50/-
51/-100/-
100/-
200/-. nyaka mobewo Shs.200/-.

86
.9. Bende nitie pogruok e yuto e ndalo chiro
.1 0
Nitie onge (dhie .11)
nco molliJO iyudo ma.ngeny chiang chiro machielo moloJO moko?
~ chieng'no ji ohero ahinya
B j opuoJlj osechamo msara C jodala oseyudo pesa kuom wedegi matiyo
D moro (wachi) •••••••••••.•.•••••••
Q. 11 • Ango moai70 igeno chironi 7
en kara ma ayude pesa mar konyruok en kama aromoe kod osiepe gi wede en kama ayude chiemo ni jooda moro ( wachi) ••••••••• , ••••••• · •••
re?
Q.12 . Bre kaka ichano mar tio kod peaa ma iyudo e ohandi?
adhi ng'iewo go lewni adhi chulo go skul fees aritogo jooda gi gik dala angiewogo chiemo achulogo osuru moro (wac hi) •••••••.•.•••.••••••
Q.13. Ibiro ga e chiro ka nade? Pile kose.
A pile (chiang chiro duto) B kadichiel - ajabiro to ok pile 0 samoro D ok ahiny biro
• 14. Chirni mage ma ilimo ma ok ma?
1 •••••••••••••••••••••••••••••••••
2 ••••••••••••••••••••••••••••
3. • •••••••••••••••••••••••••••
4. • •••••••••••••••••••••••••••

.1 5. !biro ga e Chiro
1 ••••••••••••••••• 2 ••••••••••••••••
' ················ 4 ••••••.•••..•••• 5 •••.••••••••••••
chirni ile
..L.
87
ma Ji-wachogo achie1
B
nade?
Sam oro c
Ok ahity D
iro
.1 6. Peea adi ma iyudogae chirni ma mokogo ma iwacho ni idhiye?
Chiro
1 •••••••••••••••
2 ••••••••••• '~ •• 3 ••• .••••••••••••
4 ••••••••••••••• 5 •••••••••••••••
0-100/A
101-200 B
201-300 c
Q.17 . In tie kod tich machielo ma ok loko?
nitie onge (dhie penjo 20)
.18. AD80 mac hie 1o ma 1 t imo?
1 ••••••••••••••••••••••••••••• 2 ••••••••••••••••••••••••••••• 3 •••••••••••••••••••••••••••••
.1 9. Igeno gi moloyo loko?
.A
B a
kamano ok kamano ok angeyo
301-400 D
ohewo 40< E

88
.20. Iaebedo ka iloko maromo nade?
A matin ni higa achiel B
hi a achiel ny ka dek c hi i angwen nyaka abich
D moloyo higini a par (dhie penjo 29) B. J JOHGIEWO KE.NBB:
.21. An£o ma ibiro ngiewo kawuono? 1 • • • • • • • • • • • • • • • • • • • • • • • 6 ••••••••••••••••••••• 2 ••••••••••••••••••••••• ? ••...•......•........ 3... • • • • . . • • . . • . . . . . . . • • 8 ••••••••••••••••••••• 4;.... . • . . • • • • • . . . • . • • • • 9 .•.....•............• 5.. . • • . . . . • . . . . . . • • . • . . • 1 o •••••••••••••••••••••
• 22. Ango ma omiyo ibiro a chironi mondo ingiew gik ma iwachogo? ,.--~--,
A. nikech ochiegni gi dala moloyo chirni moko B. nitie gik mangeny ahinya ma iyiero c. gik moko nengo gi yot D, moro (wachi) ••••••••••••••••••••••••
• 23. !biro ga a chironi nade?
' A. pile (chieng' chiro moro amora) B. kadichiel C. samoro - kapore D. ok ahiny biro •
• 24. Chirni mage ma ilimo ma ok ma?
1 •.•••••..••......•..•.•.. 2 ••••••••••••••••••••••••• 3 ••.••••••••••••••••••••••
4 ....••..•..•............• 5 •••••••••••••••••••••••••

89
. 25 . lbiroga e
Chiro
chirni me. ivachogo nade?
1 •• • • • • • • • • • • • • • • • • • • • 2 •••••••••••••••••••••
3 •• • • • • • • • • • • • • • • • • • • •
4 •• • • • • • • • • • • • • • • • • • • •
5 •• • • • • • • • • • • • • • • • • • • •
• 26. Ango ma biro
inyiewoga e
Chiemo
1. ••••••• • • • • • • • • • • • • • • • • • • • • • •
2 • ••••••••••••••• • • • • • • • a •••••••••••••• • • • • • • •
• • • • • • • • • • • • • •
3 •••••••••••••• • • • • • • • • • • • • • • • • • • • • •
4 •••••••••••••••• • • • • • • • • • • • • • •
• • • • • • •
5. • • • • • • • • • • • • • • • ••••••
• • • • • • • • • • • • • •
~ Ka.dichiel
chirni ma iwach o'!
Gikmoko Gik ma thedhi
• • • • • • • • • • • • . . . . . . . . . . . . • • • • • • • • • • • • • • • • • • • • • • • • . . . . . . . . . . . . • •••••••••••
. . . . . . . . • • . . . . . . . . . . . .
. . . . . . . . . . . . • •••••••••••
• •••••••••
• • • • • • • • • • • •
• ••••••• . . • •••••••••••
• • • • • • • • • • • •
!:>a oro
oko (wac i)
. .......... .
. .......... . . .......... . . ........... . . .......... . . .......... .
. ....... . . .. . ..... • • . . • ••••••••••• . ........ . • •••••••••••
• • • • . ... . ... . ..... • • • • • • • • • • • •

• 27. .neo A. B. c. D.
•
ma
90
itiyo? japur japuonj min ot ny thi skul mora ( wachi) •........................
• 28. Gi.ma inyiewono en ma: .
A. B.
c. D.
mari iwuon midhi tiyogo idok loke
idli rniyo watni
moro ( wachi} •.........•.........•......•• C .1' J JOLOKO KO
.29 . Ango ma diher mondo sirikal olosnu e chiro ka?
A. B. c.
• JS.
pi Kaka iwuoth- yore ·kod mtokni duoko nengo juogo piny
geDochiro gi stall ma oumore moro Cwachi) •••••••••••••••••••.•
CLASSIFICATION DATA:
1 • Nyingi ••••••••••••••••••••••••••••••• 2. Location •••••• , •••••••••••••••••••••••• 3. ub-.l.ocation •..................... .... 4. GWSDBU • ................................. 5. Nyako koso wuoyi.
6. Kend:
B uoyi
Nyako.
Asekendo kata osekenda
od ka akendo/pod ka Okenda {dhie penjo 8 ) chuora otho/chiega otho
moro ( wachi) ••••••••••.••••••••••••

91
7. 11 ma nitie e ot- dichwo , ha·o kod nyithin o ma pod ka onr om ken 0 po ka okendo) .
~a mba ..,__ ___ '""tyawuoyi
Namba r----~~yir i
a. Ngat ma otelo e ot ma kelo pesa timo ango? • ••••••••
9. Hiki ••••••••••••••••••••••••••••••••• 10. Pesa ma iyudo e biga achiel nyalo romo na e?
K .She • ..••...••....••.••.. · ...
11 • Bende intie kod puodho?
~-------~~ :~:~ 8 (we penjo koro) .
12. uodhi no romo nade?
••••••••••••••••••••••• acres
13. Ango ma ipidbo e puothi?
amba Niang
1-----t Mchale
1------4
Kabawa
Mafua. 1-----1
Moko (wac hi) •••••••••••••••••• t-__.
14. Eka adi ma ipidhe gigo ma iwacho na go?
Pamba • ••••••••••••••••.••• eka N ian.g . ••••.•......•......• II
chele •••••••••.•••••••••• II
Ka.ha.wa • •••••••••••••••••• II
joro ( wachi) ••••••••••..• II

AP DII B
B 1
B 2
B 3
B 4
B 5
B 6
B 7
B 8 (1)
(11)
B - 10
DBr
RES
92
Respondent'ij Age
IC A A t T l '
Respondent's Annual Income
Respondent 's Occupation Other than tradi ~ or selling.
amily Size
espondent's farm size in acres
Respondent's Sex
Sex composition of market places in Kisumu District (sellers an buyers).
Traders means of travelling to market
Kisumu Traders : Length of expereince in market trade.
Names of other markets traders attend
P.tices an measures f goo s at Ahero market ( isumu District) April 1980.

93
- 1 R.hSP
AGE GROUP BUYHRS S IJ.£fiS TOTAL IN YEARS
Number % Number % Number 'u Under 20 45 7. 7. 36 6.1 81 13.8
21 - 30 years 93 5.9 125 21 • 3 218 37.2
31 - 40 years 55 9.4 91 15.5 146 24 .9
41 - 50 years 17 2.9 38 6. 5 55 9.4
51 .- 60 years 6 1 .o 27 4.6 33 5.6 .
Over 60 years 4 10.7 i
15 2.6 19 3.3
Non Respondents 11 1.9 23 ) .9 34 5.8 .
~~OTAL 231 39 .4 3. ~ 60 .6 586 100.0 '

94
B - 3 - RESPO l :.:~Wr 'S tOC JIA!·Io u· HER THAN TRAD .G R SELLING
! BUYERS SELLERS TOTAL l
Number % Number % Number %
Job- orking 1 1 1. 9 2 o.~ 13 2.2
Farmin g 75 12.8 135 23.0 210 35.8
Hou ewife 94 16.0 - - 94 1 6.0
Student 17 2.9 - - 17 2.9 -
Others 4 0.7 1 0.2 5 0.9 I 1

95
B - IBD CHILDREN
N111BER OF UNMARRIBD BUYERS SELLERS TOTAL CHILDREN Number % Numb ex % Number %
1 - 2 60 10.2 75 12.8 135 23 \
3 - 4 56 9.6 97 16.6 153 26.2
5 6 . 42 7.2 62 10.6 104 17.8 --
Over 6 28 4 .a 82 14.0 110 18.8
T 0 T A·L 186 31.7 316 53 •• 502 85.6

96
B - 5 - RESP T'S FARM
!
SIZ IN ACRES BUYER SELLER TOTAL l Number % Number % Number ~ J
2 and under 104 17.7 185 31 .o 289 4 9.3
3 - 4 52 8.9 82 14.0 134 22 .9
5 - 6 17 2.9 24 4.1 41 7.0
Ov r 6 11 1 • 9 18 3.1 29 ?.0
r o T A L 184 31 .4 309 52 .7 493 84.2 =========== ==:=;===~--=~=====~:==~-==-=================
..

97
TABLE B - 6 - RESPONDENT ' S SEX
Market Female Percent Number Percent Total ~cent Number Number
1 . Rabuor 92 15.7 8 1 .4 100 17.1
2. Kiboawa 44 7.5 34 5.8 78 13.3
3. Paw Akucbe/Holo 33 5.6 13 2.2 46 7.8
4 . Sondo 47 8.0 1 1 1 • 9 58 9.9
5. Ahero 85 14 .s 20 3.4 105 17.9 -
6. f-lamboleo 28 4.8 13 2.2 41 7.0
7. ap Onditi 29 s.o 7 1 .2 36 6.2
- -8. Daraja Mbili 40 6.8 9 1 .5 49 8.3
9. Kombewa 29 s.o 12 2.1 41 7.1
1 o. Masogo 26 4.4 6 1 .o 32 5 .4 - '
T 0 T A L 453 77.3 133 22.7 586 1 oo.o
I

98
- 7 - SEX C ITI0!1 KET UCt H lu .U I ~Tit C
. Market eroent ercent
b a lale emale
Rabuor 8 92
Paw Akuche 28 72
Kiboeva 44 56 . Sando 19 . 81
Ahero 20 80
Mambo leo 24 76
Pap Onditi 15 85 I'-
Dll:llja Mbili 19 81
Kombew 30 70
Maaogo 20 80
a. Figures show that the ma.j ority of market attendants in rural markets are women, as it is the res pon~ibility of a woman to purchase food for the family.
b. elatively few men attend market, it is only iboswa which is largely a w oleaalera m·. rk t o we fin 44 ~ of total population being male.

99
ANS OF T VELLING 1'
-teane of Full time Part Time Total All Transport Traders Traders Traders
No. " No. % No. %
alked 132 62 118 81 250 70 . Car 118 9 9 6 27 8 • atatu• 27 13 8 5 35 10
us 25 12 8 5 33 9 tLorry 1 1 . - - 1 0.5
!Bicycle 6 3 3 3 9 2.5
B - 8 ii - KISUMU TRADERS: LENGTH Olt' .EXPERI NC IN · RKET TRADE:
Years · Full Time Part Time Total Traders Traders All Sellers
No. " No. " Ko. %
Less th8il 1 year 46 22 43 30 89 25
1 - 3 7•ar• 58 27 32 22 90 25 4 - 5 years 18 9 15 10 33 9
6 - 10 7ears 34 1 6 18 12 52 15
Oyer 10 years 53 26 38 26 91 26
r.r 0 T A L 209 100 146 100 355 100

100
B - 9 - NAMES OF OTHER MARKETS TRADERS ATTENDED
M kete Names Full Time Part Time All Traders Traders Traders
No. ~ No. ~ No. ~
No other Market 144 54.6 95 65.0 209 58.9 Kib~e 14 6.7 12 8.2 26 7.3 A hero 16 7.7 • 2.7 20 5.6 Sondo/ A tela 13 6.2 6 4.1 19 5.4 Kiboswa 10 4.8 4 2.7 14 3.9 Luanda 10 4.8 4 1.7 ,, 3.9 Mambo~eo 12 5.7 1 0.7 13 3.7 Paw Akuche/Holo 9 4.3 2 1 .4 11 3.1 Kaitito 6 2.9 3 2.1 9 2.5 ~Thero(Kiaumu Municipal market) . 5 2.4 2 1 .4 7 2.0 bale 2 0.9 2 1 .4 5 1 .4
Serem 2 099 3 2 01 5 1 .4 A kala 2 0.9 3 2.1 5 1 .4 Rabuor 3 1 .4 2 1 .4 5 1 .4
uhoroni 2 0.9 2 1 .4 4 1 .4 Awa 1 2 0.9 2 1 .4 4 1 • 1 Dago 2 0.9 2 1 .4 4 . 1 01 Manyatta Flamingo 2 0.9 2 1 .4 4 1 • 1 Daraja I bili 4 1 • 9 - - 4 1 • 1 Oyugis 3 1 .4 - - I Oo8 ligori 3 1 .4 - - 3 0.8
Koru 3 1 .4 - - 3 . 0.8
T o t a 1 209 146 355 '

101
- 10 - Prices and f.teaeures of Goods at Ahero Market (~isumu District) April, 1980
Commodity
l 1 Bananas ( lantain)
2 Sweet Bananas
3 rooms ooden S poone
5 Charcoal Stove(jiko) 6 Sweet potatoes 7 Maize
II
II
8 Onions 9 Vegetables (Kale)
10 Fish-Dry Tilapia
" " ile perch 11 aize Flour 12 alt
13 ~icahornate of Soda
1 5 r anilla bags
1 6 Onions - buib 17 ineapple
18 Eggs 19 Oranges
20 English potatoes 21 frican tobacco 22 Lemons
23 Sugar cane 24 Beane 2f Sor hum 26 Cassava Dry
Price
8/--11/
=/50 =/50 1/-
12/--15/-2/-8/-
200/-
57/=/50 =/10
3/-7/-5/-751..
-/30
3/50 -/50 3/50 -/70 -/20
1/-/50 1/-/10
1/-10/-
3/-
Measure
1 big bunch
1 small bunch 1 each
each 1 each a buno':: of five 2 Kg tin of Kimbo 90 Kg be.g
20 Kg tin of paraffin 6 sticks
20 leaves 1 each
each 1 Kg tin of Kimbo 1 email blue band til
1 " " 1 each
3 balls 1 each
1 each 1 each
a bunch of six 6 inch piece a bunch of ten 6 inch piece ·
II "
500 gm blue band· tin 2 Kg Kimbo tin 2 Kg Cowboy tin.

102
TABLE C 1 - How Sellers Determine the Price of Goode/Commodities
Reason No.
1 According to price charged by others in the market (competitors). 1 51
2 According to production and transport cost 12S
3 According to intersity of demand 37
4 According to purchasing price 29
5 According to Government control price 11
6 According to ones own will (a eement between buyer and seller). 5
7 According to weight of the commodity 5
8 According to prices fixed by Bata Shoe Company 3
" 43
36
10
8
3
1
1• .
8

103
T 1E C - 2 - Craft Goods Offered for ale in Kisumu Rurvey ~ r ets {z pril - ay 1980)
C ornmodi ty :
F 1m le ve carpets
innowine Tray
Basket
:Bl3eket
Cooking pot nets
Broom
Clay pot
II II
II II
v ooden a poon
Clay pot
Hats
Hoe h dle
Grindstones
Tin ca n vlick lamp
Calabash
Knife
and are of
ine weave of grass made in Kisumu Location mainly, used for eparatine; chaff ·from rains.
Grass weave and reeds - Height about 1 ft. - 2ft. It is used for carrying grains from fields, or from and to the ms.rket.
eave of palm leaves and it is V -shaped. Used by women for daily foodstuff shopping.
Used for keeping foodstuffs -it i a usually hB.nged from the roof, to avoid food being eaten by rats and doge.
lade from pe.1m leaves and grass.
Made from claY and used for cooking vecetab1es and meat.
Made from clay and used for storinB water.
Made from clay and used for cookiilg fish.
Made from wood and used for cooking 'ugali' •
~de from clay and used for cooking 'posho' ,or 'ugali'.
Hats made from palm leaves.
Wooden about 3-4ft. long
Made from big stone and used for grinding millet with cassava.
Faraf:tin burning candle.
Gourd for drinking porridge and drawing water from a river.
Made out of eerfp metal but has wooden handle.

Commodity
Ho s
Hoes
K rais
Kn.rais
lish baskets
urner charcoal
I a te
f bles Chairs
hoe
Local brew sieve
Cookinf mat
104
Description
mde out of crap iron for digging.
d used
Made out of crap iron and used for weeding,
Made from sorap metal an used for bathing nd wa hing clothes.
Oval shaped with two handles. Used for cooking 'ugali', •msndazi', pancakes and deep frying of fish.
Used for Jcatching fish in swampy areas. Made out of papyrus reeds and couch gr~es.
Made out of scrap iron and it is u d for cooking .
Made out of papyrus reeds - for drying grains, e.g. DE.ize, millet etc., and for sleep~.
ade out of wood. Folding chairs made out of weed.
Made out of motor-car tyre.
1 de out of pal.Jp leaves, used for sieving local beer (busaa).
Put underheath clay pot while cooking fresh fish eo that it does not stick on the pot.

105
_ABLE C: 3 - PRINCIPAL FOODSTUFFS BOUGHT IN 1 0 URVEY f<lARKETS
Commodity % of Consumers
Vegetable,s 46.7 Fish 29 folaize Meal 20.3 ftlaize grain 12
. Onions 12 s ar 9.5 Bananas 9.5 Tomatoes 8.6 Sweet potatoes 8.2 Salt 6.5 Sugarcane 5.2 Heat 4.8 Cassava 4.8 Bean 4 Milk 4 English .potatoes 3 Chicken 3 Oranges 3 Hinor products:-Tea leaves 1 • 7 Eggs 1 .3 Drop Scot nee 1. 7 Bicarbonate of soda 1 .3 .Peas 1 • 3
.

106
C: - Shows the goods urchased by the buyers in Kisumu rural markets
C: 4 - oods purchased in Kisumu markets (excluding Food crops).
N = 231 •
Item umber Percent
Paraffin 25 10.8 Sugar 22 9.5 alt 15 6.5
Bread 11 4.8 Ba*hing soap 10 4 Clothes 10 4 Omo detergent 8 3.5 Broome 5 2 Jaggery 5 2
Tea leaves 4 1 • 7
•latch box 3 1 .3 Soda bicarponate 3 1 .3 Mate 3 1 • 3 Charcoal 3 1 .3 Tablets 3 1 .3 f.1inor items: Firewood 2 0.9 Basket 2 0.9 Manilla bag 2 I 0 .9 Cattle 2 0.9

107
C: 5 - 1 - SUB-LOCATIONS, MARKETS A D THE POPULATION OF TJffi SUB-LOCATIONS
Market SU.b-location opulation
Kombewa Kombewa 5,042 91 Akuche Kit Mikaye 3;727
Daraja Mbili S onghor West 1,928 Kiboswa Nyahera 6,205 Mambo leo athorego 5,360 Rabuor Kochl.eng' 5,178 Ahero Kakola 9,066 M.asogo Kabar 8,709 Sondu East Kadiang 'a 1 o, 393 Fap Onditi Kabodho East 1 o, 192.
C: 5 - II - POPULATION OF THE LOCATIONS AND THE NUMBER OF MARKETS
Location Population Number of Markets
·est Seme 27,268 10 'ast Seme 32,113 9
Kisumu East 33,685 15 Kajulu 13,038 6 1• iwani-Kibos 9441 6 W. Kano 32,095 S.E. Kano 36,412 12 Chemelil 20,891 8 N. Nyakach 33,959 8 N.E. Kano 41,579 9 Koru-Fort Tennan 8,535 5 Muhoroni 10,263 4 s. Nyakach 24,056 7 W. Nyakach 19.0~8 6
Total 342,373 10 7
I
I
I

108
. pendJx D - 1 - KISUMU TRADERS : EXPERIENCE I ARS IN ft1ARKET TRADB
Years Full time Part time All Sellers traders Traders
Frequency % Frequency % Frequency
Less than 1 1 year 46 22 43 29 89
1 - 3 years 58 27 32 22 90
4 - 5 years 18 9 15 1' 10 33
6 - 10 years 34 16 18 12 52
Over 1 0 years 53 25 38 26 91
' he ma.rket traders were asked to recall the length of experience in market trade in terms of years. Table D - 1 shows this information.
I
%
26
25
9
15
26
I •

109
pendix D - 2 - Number of Other Markets Traders Attend:
Number Full time traders Part time traders All traders Frequency " Frequency % Frequency
il-no other market 114 55 95 65 209
I
1 - 2 markets 74 35 43 30 117
3 - 4 markets 18 • 8 5 26
5 - 6 markets 3 1 - - 3
~
Total 209 100 146 100 / 355
The traders were asked to enumerate and name the markets which they usually attend. The professional traders do attend a number of markets in order to remain in business.
the other hand the frequency distribution for the part time trader is more 'in line with reality beca~se the majority are primarily farmers and therefore tend to frequent the markets nearest to their village.
%
59
33
7
1
100

110
D - 3 - Buyers Frequency of Visiting the Survey Markets
Frequency Number Percent
Regularly 122 53 Oft en but not always 43 19 Occae ionally 36 15 Seldom 30 13
Total 231 100 . 0
D - 4 - Buyers - Frequency of Visiting the •Other' markets
Freq\l,ency Number Percent i
Regularly 88 38 Often but not always 31 13 Occasionally 54 23 Seldom 35 15
Total 231 1 <>a.J'

111
Hypothesis 1 ~x = 28.02~ = 65.79 x
2 = 89.68 2 = 496.31, y = 200.57
r2 = (£x,y -£x.0)2 n
n n
= 0.3719
r = 0.6
Figures used in the above computation are raw scores. o test the significance of the relationship we compute
the t teat.
t = 0.6 10 - 2 1 -0.3719
= 2.2143
APPENDIX E - 2 !!fpotheeie 2a
Figures used in the computation are raw scores.
r2 = (Z.xz -~x. JJ2 n
{{_x2 _ r£x )2 ( f_y2 - (£y \2 -n
r 2 = (162.4 - 185.3 x 117)2
14
n

112
( 2852.83 - (185.~ (1095- !11)2
r 2 = 12955.318 (400.252)(117. 2143)
r 2 = 0,276143
r = 0,5.
It 14
To test the significance of the relationship we compute the teet teet.
14 - 2 1 - 0,2761 = 1.6621
A PENDIX E - 3 •
Hypothesis 2b
The foraula used is
r = N{zxy - ( ~x} (g )
\)[!Hz~~- @:xJ2J [B'(~ j'2 - (ay) 2_]
N = 14 ; ;[xy = 3205. 1 ; Z.x = 342.373; .Z:S = 117 ·
~x2 = 9979.3;~x2 = (342.373} 2
;£_y2 = 1095; {£y) 2 = (117) 2
(
Substituting: We get:
r = 44871.4- 40057,614
J [! 3971 ~2 - 117219.2i] E? 330 - 136~ = 4813.786
v 36907616 = 4813 6o75 .1639
= o. 792. = 0.8

Al ernative:
113
n
(zx2 _ (£_ _> 2 (Z_y2- C'f* )2 n
r 2= (3205.1 - 342.373 x 117)2
1,4
( 9979.3 - (342.373)(1095 (117) 2
,~ 14
r 2 = 118,225,88 (1603.495(117.21429)
r2 = 0,629199
r =Jo.629199 r = 0. 7931 078 I
r = 8 To test the significance of the
relationship we compute t~ test.
f"=r
j,_n-
1
---2,_
- -y-1
t = o.a ,_. ------1 14 - 2 v 1 - 0.6292 t=4.5027

PpDIX B - 4
H.Ypotheeis 3a
114
Formula used:- 2 r = (£x;y -&J8)2
AFFEBDIX E - 5
(40860- (360)~ (87398 - (949) 2
= 1 i~~169 7 2590
r 2 = 0.02 60
r = 0.144
10 w
Hypothesis 3b Computation:
Formula used:-
£_;A = 949:-.a = 6579;£X2
= 4963103;
7 XY = 711.740
r 2= (711,740}- 949 x 6579) 2
1o
( 87398 - (949)2(496.310 - 6579) 2
10 1o
r 2 = 7637u9.9 c: 0.5419652 1689 52
r = 0.451965 = 0.67 r = 0.7

11 5
APPENDIX E - 6 Brpotheeis 4 Computation: Formula used:
r 2 = (z_xy -~x. &)2
(Zx2
- {2_~ )2
(z.,y2 _ ( )2
-n
2 j!;_X = 65.79;2 = 528,20;~ = 496.31
2 z_y = 25318.91; z..rr = 3684.a r2= (3684-65.79x528i
1o
r2
= 43669,38
{496.31-(65.79) 2(25318.&1 : 1o
(528.2) 2
10
(496.31 - 432.832)(2518.91 - 27899 .5)
t 2 = 0.266576
r = 0,516.

116
! EBDIX F
.r.ST G THE SIGNIFICANCE OF b ON HYFOTHESES:
he test statistic used in computing the significance of
oefficient b is illustrated below.
he test statistic when (fY2/x is known is
z = b - Bo
(Jb But when Cl§!x is unknown, the jest statistic is
t = b - J3o >
sb
Where Sb is the estimator of (Jb. he associated degrees of freedom are n - 2. To
obtain Sb we must first estimate An un-
biased estimator of this parameter is given by
s2y/x = ? (Yi - Yc)2
n - 2 or an uhbiased estimator of Ub2 then is
S2b = s 2y/x
.;E. (xi - i )2
The f~llowing.is a computationally convenient formula
used.
s2b = s2~/x
2 z- xi - (;£xi) -n
F - 1 Testing the significance of b on nypotheeis 1 :
Regression equation Population Density
X
2.29 2.07
.92 3.44 4.87 1.78 2.74 3 .4 6 3.62 2,83
28.02
= Yc = 2.4 + 1 .5x
Yc 5.8 5.5. 3.78 7.56 9.7 5.07 6.5 7.6 7.8 6.6
65.9

117
omputa tion: n = 10,~Xi = 28.62;~yi = 65.79
~x12 = 89.68;~xiyi = 200.57 2 2 Sy /x = (65.79 • 65.9) = ¥
s2y/x = 0.0015125
Sb = 0.00113
t = b - Bo Sb
t=1,5-0 0.00113
t = 13.5 Hypothesis 2a Regression line=Yc = 4.4. + 0.3x
~ xi= 185.3;<= i = 117;~i2 = 2852.83;~i = 1095
~iyi = 1662.4; n = 14
Sy/x2 = 41 97.8
Sb = 3.23
t = b - ~0 b
t = 033 - 0 .23 = 0.1
Since 0.1 is less than 1 .78, the critical value of t
for 12 degrees of freedom and~0.05. Ho is not rejected and still conclude that the size of the location does not influence the number of markets.
Hypothesis 2b Y = 28.6 + 0.2x ~ 1 = 342.373 ;Zyi = 117 ; c:'::: 2 = 9979.3 ;&2
= 1095 ~xy = 3205.1 t
n = 14.
X 27 .268 32. 113 )3.685 13.038
9.441 11.579 32.095 36.412
Yc 34.053 35.0226 35.337 31 .2076 30.4882 30.9158 35.019 35.882

I
20,891 33 .957 a.635
10, 263 24 . 056 19.038
118
Yo
32.778 15.3914 30.307 30.653 33.4112 32.4076
S f/x = z_ Yi - Yc) 2
SB
t
t
n- 2
= (117- 462,87) 2 = 9968.838 12.
= 2.391
= ~0 = 0,2 Sb 2,39
= 0,0689
Hypothesis 3a
Regression line = YC = 95.2 - ,007x
z xi = 360;&:_Yi = 949 2:xi2
= 40860
2 z= y = 87398; z xiyi = 32297 n = 10
X
52 49 25 14 16 53 47 51 13
3Fo-
II 94.a 94.1 95.0 95.1 95.1 94.8 94 .a 94 .a 95.1
9£§:~

11 9
= z(Yi - Yo)2
= n - 2
2 = SY/ x 2 z_xi2 - (~xi)
n
0 b = 0.00042 = - 0,001
2 {949 - 949.2) =~ = 0.005 8 8
0. 00042 = 16.6
Hypothesis 3b.
Yc = 621 .2 + .33x Z:xi = 949;.~yi = 65.79;2_.x12 = 87398;8
2 = 4963103
~y = 711740; n = 10
__&
143 47
182 67
123 78 85 73 89
____§£
949
I£ 668.39 636.71 681 ,26 643.31 661.79 646.94 649.25 645.29 650.57 641 166
6525.3
SY2/x
s2b
= z (Yi - Yc)2 = 6579 - 6525.3 360 5 8 = •
= 2 Syfx
2 2 _1(1 - ( ~1)
n
Sb = 0 .37 t = b - po
sb7
t = 0.9
= 360,5
-2662.1 = 0.135

120
i y pothesis 4
Re s ·on line - YC = 31.1 + 3.3x
xi - 65 . 79;~i = 528 .20 ; ~xi2 = 496.31~i2 = 25318.91;
Z..xiyi = 3684 .eo
n = 10.
~ I1
9.57 62,681 4.52 46.016 7. 98 57 .434 5. 13 48.029 4 . 87 4 7,171 9. 83 44,861 3. 23 63 . 539
10.50 41 • 759 5 , 99 65 .750
65 . 79 528 .1 07
2 = ~(yi-Yc) 2 Sy /x = 528,2g- 528 .1 07 = 0 ,11 625
n- 2 s2b = SY2Lx 2
~ xi2 - z._xi) = 0,11 62f n 496.3 - 432.8 = 0 ,11625
SB = .04278 t = b - llo Sb •
t = 2....2. = 23 .375 .04278

1 21
IX G - LI TICT
1 • uhoroni 26 . An oro 51. y 0
2. I-I no 27 . Alakan.yadhi 52 . Rata 3. Kibi ori 28 . Awach(Seme) 53. af18 'arot 4. A hero 29 . Bop 54. Nyamware
Tamu 30 . Oduwo 55. Orinda 6. Naeo o 31 • l.famboleo 56 . Ramula (Nyakach) 1. Koru 32 . Kapaei 57 . Okan - wach a. RamUl.a ( ano) 33 . Miwani 58. Kaeeee 9. Aka do 34. Chemelll 59. Holo N e e
1 o. Kondik 35. Ate la ( S ond u) 60. Holo Onucho 1 1 • Onyinge 36. Kombewa 61, Kaloka 1 2. f-1anywanda 37. Rabuor 62. Magwar 1 3. Koliech 38. Paw Akuche 63. Mariwa 14. Gari 39. Awaei 64. Mariwa 1 5. Keyo 40. Kibigori 65. Lung'a 1 6. Kibo o 41. DIIJ2ia Mbili(Kie) 66 . Kuea 1 7. Kaluore 42 . Otonglo 67 . Lela 18 . A wach (Kane) 43. Nyangande 68. Pap Onditi 1 9. Ober Jowi 44. Nyalolere 69. Reru 20 . Kanaeia 45. Kaonje 70. Oboch 21. Ang ' ogoremo 46. Kiboswa 71 • Bodi(Nyakach) 22 . Olute 47. Kokelo 72. Ny erimba 23 . Nyakongo 48. Chulaimbo 73. Katito 24 . Osuome 49. Gopsarok 74. Ang'oga 25 . Bar 1-lgege 50. !1 riwa 75. Burna 76 . l gere 84. Okana 92. Bodi (S eme) 77. irieri 85. Sinyolo 93. Kayo 78 . y indi 86. Nyamaroka 94. Ogenya 79. Andin 'o 87. Ondoga 95. Kanyamlor1 80 . Nyakongo 88. Onyuongo 96. yang eta 81. Sango-rota 89. Kango 97. Ranjira 82 . Migere 90. Onjiko 98. Olando 83. Nyarindi 91 • Korowe 99. Store Pamba
1 oo. Bwanda 106. Tura 11 2 • Ki tmikayi 10\ Songhor Daraja Mbili 107. One no 113. Olute 102 . Kamarara 108. Kabege 114. lliaingo 103. yah era 109. God Abuoro 115. Ong' eche 104. Sigoti 11 o. Naki 11 6. Kagimba
105. Olembo 111. Jiatt Bunde 117. Nyaguda
-r ll vc s (t . ) ffice
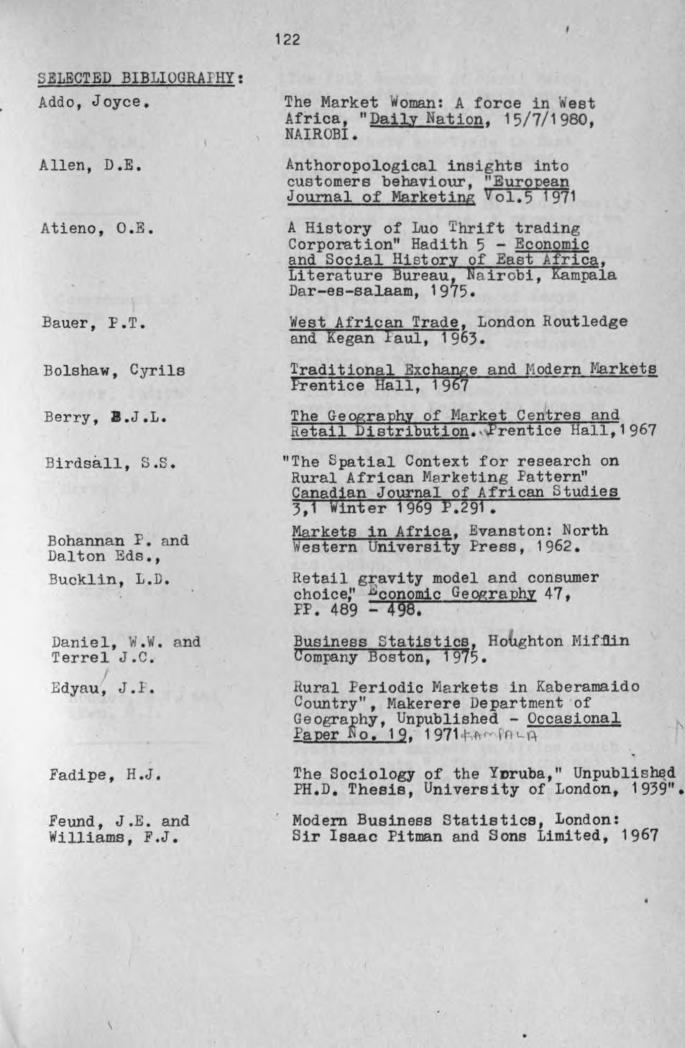
LECTED BIBLIOGRA HY: Addo , Joyce.
Allen, D .E.
Atieno, O.E.
Bauer, F . T.
Belshaw , Cyrile
Berry, B.J.L.
Birdsall, s .s .
Bohannan P. and Dalton Eds ., Bucklin, L.D.
Daniel, " . • nd Terrel J .C.
Edyau, J .1.
Fadipe , H.J.
Feund, J .E. and Williams , F .J.
122
The Market oman: A force in eat Africa, "Daily ation, 15/7/1980, NAIR BI.
Anthoropological insights into customers behaviour, "European Journal of Marketing Vol.5 1971
A History of Luo Thrift trading Corporation" Hadi th 5 - Econ?mio and Social History of East A rica, Literature Bureaut. Na irobi, Kampala Dar-es-salaam, 19r5.
West African Trade, London Routledge and Kegan laul, 1963.
Traditional Exc~e and 1·1 odern l1arkete Prentice Hall, 9
The Ge~raph.y of Market Centres and Hetail istribution, Prentice Hall,1967
"The Spatial Context for research on Rural African Marketing Pattern" Canadian Journal of African Studies 3,1 Winter 1969 P.291. Markets in Africa, Evanston : North estern University Press, 1962.
Retail gravity model and consumer choice;' conomic Geography 47, FP. 489 - 498: Business Statistics, Ho hton Miffiin Company Boston, 1975.
ural eriodic Markets in Kaberamaido Country" , Makerere Department of Geography , Unpublished - Occasional a per No, 1 9, 1 971 1· • { n l.,
The Sociology of the YDruba," Unpublis~d PH.D. Thesis, University of London, 1939".
Modern Business Statistics, London: Sir Isaac Pitman and Sons Limited, 1967

Foster, N.C.
Good, C.M.
Government of enya
Heyer , Judith
Harvey D.
Hance, ., ' . .
r rper, N . 1. .
Ho wkins, H.C.G.
Hodder, B.W. and Ukwu , U. I .
123
"The Folk Economy of Rural Mexco, special reference to marketing," Journal of 1arketina XIII, 1948
Rural p;larkets and Trade in ast Africa, University of Chicago, Research aper No. 129.
u Market Development in Traditionally marketless societies, A persepeotive on East Africa" • Ohio Centre for Intern tional Studies, frlcan Series
o. 12, Africa .f rogramme, 1971 •
1969 population census of Kenya Vol.IV Economic Characteristics of Local Councils, Regions and Total Country, Nairobi Government Printers, 1970.
" The Marketing System, Agricultural Development in Kenya " An Economic Assessment, Eds. by fieyer, J. [aitha J.K. Sega, W.M. Nairobi xford University Press, 1978.
Explanation in Geograph,y, London: ldward Arnold, 1969.
The Ge'ograph;y of Modern Africa. Qolumbia University Frese, New fork and London, 1969. Statistics , MacDonald and Evans Ltd ., London, 1 971 •
riholesale and Retail trade in Tanganyika , New York: F.A. Praeger 1965.
Markets in West Africa, Ibadan, Nigeria: Ibadan University Preas, 1969. "Some comments on the Origins of Traditional markets in Africa South of the Sahara ," Transactions and a pers, Institute of British ·-
Geoeraphere, No. 36 1965, EF , 97-105.

Kluckhohn , Richard
Kracmar , J .z.
Levine , Robert
Lc we on , R • 1.
r• obo unje A .L.
I· elville , J . Herkvi tta,
Harris, P .
l>'likesell, Harvin
I.fi ra c 1 e , r-· • I ' •
124
"Distribution of m rkets in Yorubalan " Scotti h Geogra cal ~a£azine, April 1967 p . 98-110
"Harketa in Africa ," Journal of modern Afric n ' tudiea 1 o . 4 1963 pp . 441 - 53 .
"The KolJ.8o Economy of Southern Ethipia," Markets in Africa, de. by Bohannan and Dalton. ~vanston North-western University Press, 1962, pp.409-428.
arketing Research in Developing Countries, Praeger Publishers, New York, 1 971.
"Wealth and Jower in Ouaiiland ." ~~rkete in Africa, Eds. by Bohannan
nd Dalton Evanston Northwestern Universi y F ees, 1962.
"Inflation in the consumer market in Ghana: Report of the commission of 'nquiry into Trade Maltipr ctices in Ghana11
• Economic Bulletin of Ghana X, No.1, 1966 , pp. 38-51. The Yoruba Market omen, Ibadana No . 9, 1959
Markets in Africa , i de. by Bohannan and Dalto~, Evanston: orth-weetern Frese University Freas , 1962 .
"The Social Barriers to African Enterpreneurehipe," Journal of Development tudiee V, No. 1, October, 1968, pp.29-38.
"The role of Trikbal markets in f11orrocco, Geographical Review XLVIII, October, 1958, pp.494-511
"The 1 frican Trade in the Copper Bel t 11 .Markets. in Africa , .bde., Bohannan and Dalton Evanston : North-western University Iress 1962.

·1ntz , S.W.,
.or an, W. T. W.
o er , C.A. and Kalton
Marvil , Richard .,
ioyer r R. · nd Hollander, ~ .c. Eds .
got , B . A.
Irinele, J . W. ,
R h rd . on C • J • ,
Skinner, G ••
Smith , R . · . T., and Hill, F.
c olomon , I·i .
Taylor, D. H.,
125
"Peasant DBrket places nd Economic Development in Latin America," larkets and Marketinp: in Developin~ Economies, Zda. ~oyer R. and=nollander , A~ Homewood Illinois: Richard D. Irwin Inc. 1 968.
East Africa, Longmans ~ast Africa 1973
Survey Methods in Social Investieation, London: English Lan ua e Book Society, 1 971 •
The Spatial Organization of Society, Duxbury frees, A Division Wadsworth Publishing Co., Inc. 1970
Markets and I1arketing in Developing Economies, Homewood Illinois : Richard D. Irvin Inc for American 11arketing Association 1 968.
History of the Southern Luo Vol.1 igration and Settlement 1500-1900
East African l ubliehi e. Hou 1 966 .
"~lith the railway survey of Victoria Nyanza," Geographical J ournaJ.. 2 , 1 893 •
"Marketing am Social Structure in Rural China," art 1 Journal of Asian Studies XXIV No. i, November , 1 964.
"The Spatial and temporal ynchro- _ nization of periodic markets evidence from four emirates in Northern Nigeria , " Lconomic GeograRU¥ 48, 1972, pp . 346-347
" The Structure of the market in underdeveloped Economies ." Quarterly Journal of Economics Vol.42,1948 pp . 519- 537 .
"The Internal trade of' Fort Hall Kenya," Canadian Journal of /frican ' tuJ iea, 1 No .2\ November 1 967 , pp . 111-1 22 .
D81VER t'T"T'l) OF NAilttiJII "'"1)-A ..

T ple, 1 a 1. ,
i ed · atea ,
Un e wood, J . \ · .
Uzoigwe , U.N.,
\· ere, 1 • ,
iood , L . J.
1 ood , L . J .,
Yuill , R.S.
126
2
.Jditing and Coding: Atlantida Unit VII, Bureau of Census, Dep r o•n o 0ommerce , Washin ton D.C., 19 66
"Tl m rketing system in Feasant Haiti ," Yale Uni ver i y I lie t10ns in Anthrop< gy No . 60 , 1960.
Precolonial markets in BunyoroKi tara," Hadi th 5 - Econom;l.c and Social History of East Africa , Ed . by Bethwel Ogot , Historical Association of Kenya , E. African Literature Bureau, NaH obi , Kampala , Dar-es-sal om .
The Origin and Growth of Iron Industry and Trade in Samia r enya , Unpublished B • fl • Dissertation , University of cirobi , 1973.
Rural r. rkete in "enya , igerian Geographical Journal Vol . XV . 1973
1-te.rket Origin and Development j n East tfrica , Occa sionnl ~aper llo. 7 De rtment of Geograt-hY ~akerere University , 1974 .
The temporal Efficiency of the I uro.l Market System j_n Kenya , E. African Geo;raphical Review No • 11 , I :S.y 1 9 3 pp . 6 5-71
"Spatial interaction and partitions of rural market space" Journal of Economic d ocial Geogrnphy_, Vol.65 1974.
"The unctional structure of a Rural 11a.rket System, Geografiska Annaler , Vol . 57 , Ser . B, 1976
Spatial Behaviour of Retail Customers Geografiska Annaler , Vol.49, Ser .B 1967.