Factors Influencing Recombinant Adeno-Associated Virus Production
Upload
khangminh22Category
view
0download
0
FACTORS INFLUENCING COFFEE PRODUCTION BY SMALL
SCALE FARMERS IN BUSULANI SUBCOUNTY AND BUDADIRI TOWN COUNCIL IN
SIRONKO DISTRICT
BY
MADANDA BENARD
1153-05194-02059
A RESEARCH REPORT SUBMITTED TO THE’COLLEGE OF ECONOMICS AND
MANAGEMENT IN PARTIAL FULFILLMENT FOR THE REQUIREMENTS
OF THE BACHELOR’S DEGREE iN STATISTICS OF
KAMPALA INTERNATIONAL
UNIVERSITY
AUGUST, 2018

DECLARATION
This Research Report is my own work and has not been presented for award of
Degree in any other university iSignature....~~~ Date.. ~Madanda Benard
1 153-05194-02059

DEDICATION
This Research Report is dedicated to my family members, daddy Wasukira Lawrence and
manimy, Wasukira Helen for their endless effort in my studies from ~rimary to University. It is
also dedicated to my spiritual family of Miracle of Faith Ministries International and Holy ghost
Christian Centre for their endless support.
ABREVIATIONS AND ACRONYMS
SATAAS Agricultural Technology and Agiibusiness Advisory Services
BoU Bank of Uganda
CBD Coffee Berry Disease
FDI Foreign Direct Investment
GoU Government of Uganda
ICO International Coffee Organization
MAAIF Ministry ofAgriculture, Animal Industry and Fisheries
MFPED Ministry of Finance, Planning and Economic Development
NAADS National Agricultural Advisory Services
NaCORI National Coffee Research Institute
NPA National Planning Authority
NUCAFE National Union of Coffee Agribusinesses and Farm Enterprises
UBOS Uganda Bureau of Statistics
UCDA Uganda Coffee Development Authority
UCF Uganda Coffee Federation
UCFA Uganda Coffee Farmers Alliance
UGX Uganda Shillings
UNBS Uganda National Bureau of Standards
USAID United States Agency for International Development
GDP Growth Domestic Product
SLG Sironko Local Government
iv
TABLE OFCONTENTS
Contents
DECLARATION
DEDICATION
ACKNOWLEDGEMENT
ABREVIATIONS AND ACRONYMS iv
LIST OF TABLES viii
ABSTRACT
CHAPTER ONE 1
1.0 Background to the Study 1
1.1 Statement to the Problem 10
1.2 Purpose of the Study 11
1.3 Specific Objectives 11
1.4 Research Questions 11
1.5 Significance of the Study 12
1.6 Scope of the Study 12
1.6.1 Content Scope 12
1 .6.2Geographical Scope 12
1.6.3Time Scope 12
1.7 Basic Assumptions of the Study 13
1.8 Definitions of Significant Terms 13
1.9 Organization of the study 14
CHAPTER TWO 15
LITERATURE REVIEW 15
2.0 Intr~duction 15
2.1 Overview of Coffee Production in Uganda 15
2.2 The concept of cooperatives 16
2.3 Literature Review on Independent Factors of the Study 17
2.3.1 Social factors affecting small scale coffee production 17
V
2.3.2 Adoption of production techniques .19
2.3.3 Cooperative Governance 21
2.3.4 Coffee value addition 23
2.4 Thebretical Framework 24
2.5 Conceptual Framework of the Study 25
2.6 Conceptual framework 26
2.7 Related Literature Review on production of Coffee 27
CHAPTER THREE 29
RESEARCH METHODOLOGY 29
3.0 Introduction 29
3.1 Research Design .~ 29
3.2 Target Population 29
3.3 Sample size and sampling procedure 30
3.4 Data Collection Methods 30
3.5 Validity of Instruments 30
3.6 Reliability of the Instruments 31
3.6.1 Pilot testing 31
3.7 Data Collection Procedures 31
3.8 Data Analysis Techniques 32
3.9 Ethical Considerations 32
3.9.1 Operational definition of variables 33
CHAPTER FOUR 37
DATA ANALYSIS, PRESENTATION AND INTERPRETATION 37
4.0 Introduction 37
4.1 Questionnaire Return Rate 37
4.2 Social Composition of the Respondent 37
4.3.4 Adoption of Improved Cultivars 42
4~3.5 Inorganic Fertilizer Adoption Rate 42
Application of fertilizer to coffee trees 42
4.3.6 Inorganic Fertilizer Usage 43
vi
4.4 Influence of Cooperative Society Management on Coffee yield 43
4.4.1 Satisfaction of Farmers with Governance of Coffee Cooperative Cocieties 44
4.5 Input Utilization Rate 48
4.5.1 Domestic coff~e consumption., 49
CHAPTER FIVE 50
SUMMARY OF FINDINGS, DISCUSSION, CONCLUSIONS AND 50
RECOMMENDATIONS 50
5.1 Introduction 50
5.2 Discussion 50
5.2.1 Influence of Social Factors 50
5.2.2 Influence of Agricultural Technique Adoption 51
5.2.3 Influence of Cooperative Society Management 51
5.2.4 Influence of Coffee Value Addition 52
5.3 Conclusions 52
5.4 Recommendations 52
5.6 Suggestions for Further Research 53
References ~4.
AP1~ENDICES 57
APPENDIX 1: TRANSMITfAL LETFER FOR RESPONDENTS 57
APPENDIX 2: HOUSEHOLD QUESTIONNAIRE FOR SMALL SCALE COFFEE FARMERS 58
APPENDIX 3: COOPERATIVE SOCIETY MANAGEMENT STAFF QUESTIONAIRE 62
APPENDIX 4: INTERVIEW SCHEDULE FOR COFFEE STAKEHOLDERS 64
vI~
LIST OF TABLESTable 3.1 Operational definition of Variables 33
Table 4.2.1 Social Composition of the Respondent by Gender and Age 37
Table 4.2.2 Respondents Marital Status 38
Table 4.2.3 Composition of Respondents by Level ofEducation 38
Table 4.3.1 Influence of Coffee Production Techniques on Coffee Yield 39
Table 4.3.2 Ranking of technological factors affecting coffee production 40
Table 4.3.4 shows number of tree varieties 42
Table 4.3.5 : Inorganic fertilizer adoption rate 42
Tab4.4.2 The manager calling for farmer’s ,meetings 44
Tab4.4.6 The cooperative society is more robust in hiring staff 46
Tab4.4.7 The cooperative society officers trains us on best method of managing coffee 47
Table 4.5.2: Domestic coffee consumption 49
Table 4.5.3: Utilization of coffee by- products 49
VIII
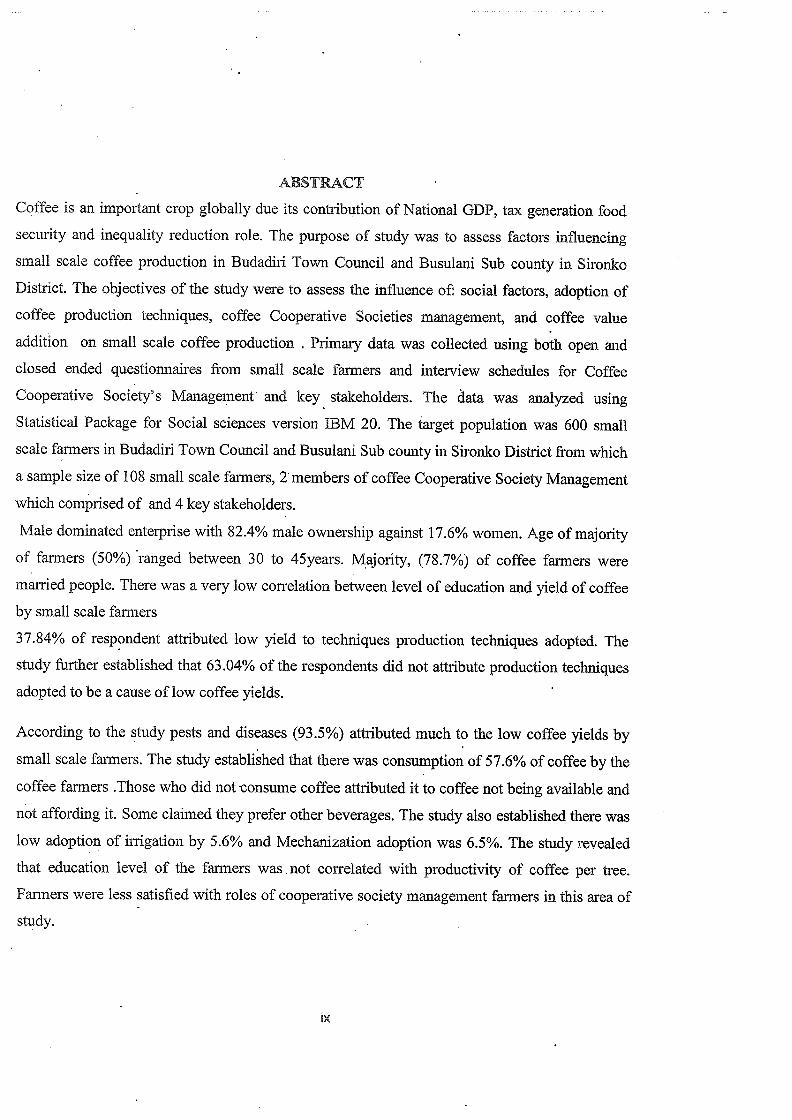
ABSTRACT
Coffee is an important crop globally due its contribution of National GDP, tax generation food
security and inequality reduction role. The purpose of study was to assess factors influencing
small scale coffee production in Budadiri Town Council and Busulani Sub county in Sironko
District. The objectives of the study were to assess the influence of: social factors, adoption of
coffee production techniques, coffee Cooperative Societies management, and coffee value
addition on small scale coffee production . Primary data was collected using both open and
closed ended questionnaires from small scale farmers and interview schedules for Coffee
Cooperative Society’s Management and key stakeholders. The data was analyzed using
Statistical Package for Social sciences version IBM 20. The target population was 600 small
scale farmers in Budadiri Town Council and Busulani Sub county in Sironko District from which
a sample size of 108 small scale farmers, 2 members of coffee Cooperative Society Management
which comprised of and 4 key stakeholders.
Male dominated enterprise with 82.4% male ownership against 17.6% women. Age of majority
of farmers (50%) ~ranged between 30 to 45years. Majority, (78.7%) of coffee farmers were
married people. There was a very low correlation between level of education and yield of coffee
by small scale farmers
37.84% of respondent attributed low yield to techniques production techniques adopted. The
study further established that 63 .04% of the respondents did not attribute production techniques
adopted to be a cause of low coffee yields,
According to the study pests and diseases (93.5%) attributed much to the low coffee yields by
small scale farmers. The study established that there was consumption of 57.6% of coffee by the
coffee farmers .Those who did not consume coffee attributed it to coffee not being available and
not affording it. Some claimed they prefer other beverages. The study also established there was
low adoption of irrigation by 5.6% and Mechanization adoption was 6.5%. The study revealed
that education level of the farmers was not correlated with productivity of coffee per tree.
Farmers were less satisfied with roles of cooperative society management farmers in this area of
study.
CHAPTER ONE
1.0 Background to the Study
Coffee is one of the most important cash crops across the world and a major source of export
earnings. It is second only to crude oil as the most important internationally traded commodity in
monetary value (EAO, 2004). In spite of high export earnings from coffee globally, coffee
produced in most African countries fetch low prices ãompared to coffee from other continents
due to relatively lower quality coffee (Bibangambah, 1989).
As a result, most coffee farmers get lower incomes from coffee sales, which make very little
difference in helping them out of poverty. Coffee is also the world’s widely traded tropical
agricultural commodity accounting for exports worth estimated US$ 15.4 billion i~i 2009/2010
when 93.4 bags were shipped (ICO, 2013),Coffee production by small scale farmers support
about 25 million people around the world (Waston and Achineli, 2008)
Coffee is produced in more than 70 countries of the world (ICO, 2013). Countries that dominate
the world’s coffee production are found in South America, Africa, and Southeast Asia (Indonesia
Investment, 2014).The top coffee producing countries in the world are, Brazil, Colombia, coata
Rica, Dominican Republic, Ecuador, El Salvador, Ethiopia, Guatemala, Honduras ,Jndia
,Jndonesia ,Java, Ivory Coast, Mexico, Nicaragua, Papua New Guinea, Peru, Tanzania ,Thalland,
Uganda, Vietnam, Angola, Cameroon, Cuba, and Democratic Republic of Congo.
Globally , like in Brazil Coffee production is responsible for about a third of all coffee,
making Brazil by far the world’s largest producer, a position the country has held for the last 150
years. Coffee plantations, covering some 27,000 km2(10,000 sq miles), are mainly located in the
southeastern states of Minas Gerals, São Paulo and Paraná where the environment and climate
provide ideal growing conditions.
Brazil has been the world’s largest prOducer of coffee for the last 150 ~years, currently producing
about a third of all coffee. In 201 J Brazil was the world leader in production of green coffee,
followed by Vietnam, Indonesia and Colombia. The country is unrivaled in total production of
green coffee, arabica coffee and instant coffee. In 2011, total production was 2.7 million tones,
more than twice the amount of Vietnam, the second largest producer. Some 3.5 million people
are involved in the industry, mostly in rural areas.
I
There are about 220,000 coffee farms involved in the industry, with plantations covering
about 27,000 km2 (10,000 sq miles) of the country. Plantations are mainly located in the
southeastern states of Minas Gerais, SàoPaulo and Paraná whei~e the environment and climate
provide ideal growing conditions. Minas Gerais alone accounts for about half of the country’s
production. Most plantations are harvested in the dry seasons of June through September, usually
in one huge annual crop when most berries are ripe. All coffee in Brazil is processed using the
dry process (also called unwashed or natural coffee). The entire cherries are cleaned and placed
in the sun to dry for 8—10 days (or up to four weeks during unfavorable conditions). The outer
layer of the dried berry is then removed in a hulling process before the beans are sorted, graded
and packed in 60 kg bags.
Several species in the coffee genus, Coffea, can be grown for their beans, but two
species, arabica and robusta, account for virtually all production. Arabica dominates both Brazil
and the world as a whole with about 85% of the production; robusta accounts for the remaining
30%. In Brazil, arabica production is located in the main coffee-growing cluster of states led by
Rio where arabica is produced almost exclusively, Robusta is . primarily grown in the
northwestern much smaller state of Espirito’ Santo where about 80% of the coffee is
robusta. More recently, the northwestern state of Rondônia entered the market and produces
large shares of robusta.
The processing industry is divided in two distinct groups, ground/roasted coffee and instant
coffee. The groundlroasted coffee market is highly competitive.. Brazil is the world’s largest
exporter of instant.coffee, with instant coffee constituting 10—20% of total coffee exports. Both
types of coffee are mainly exported to the US, the world’s largest coffee consumer.
In Venezuela coffee production began in the late eighteenth and early nineteenth centuries in the
premontane forest region of the Andes Mountains. José Gumilla, a Jesuit priest, is credited with
introducing coffee into Venezuela, in 1732. Its, production is attributed to the large demand for
the product, coupled with cheap labor and low land costs. It was first exported to &azil. Coffee
production in Venezuela led to the “complex migration” of people to this region in the late
nineteenth century. Coffee production occurs in the Coast Range and the western Andean region
with the only requirements being sufficient top ~oil and moisture. The coffee production system
followed in the Andes region, which is the premontane moist forest, is a multilayered system (3
to 4 laS’ered canopies) in which there is multi-species of plants. In this system, trees provide the
2
shade needed for growth of coffee. This region is a part in the three geographical regions of
Venezuela namely, the Mountains and Caribbean Coastal region, the Lianos region, and
the River Delta region, and the Guayana region.
The plantations are generally in the altitudinal range of 1,000—5,000 feet (300—1,520 m),
bordering with Colombia. Better ~grades are noted at elevations of 6,000 feet (1,800 m) or higher
but these elevations are characterized by slower growth and lower productivity.
The coffee growing area was extended to marginal agro climatic region in the elevation range of
under 600m 600 metres (2,000 ft), called the premontane dry forest, though the area produced
low yields (less than 300 kg per hectare each year), which was made good by the enterprising
small farmers with crop diversification. Statistical survey has indicated that coffee plantations
are generally in the elevation range of 800—1,700 metres (2,600—5,600 fi) on the hills of the
Andean with slopes of 5 to 60%. The land holders were mostly small farmers who accounted for
87.5% of the total land holdings, with each holding of about 3.5 hectares (8.6 acres) under coffee
and with traditic~nal multilayered agro forestry practice.
As a perennial crop, the area covered under coffee was 280,000 hectares (690,000 acles) with the
Andeas region alone accounting for 125,000 hectares (310,000 acres).
The “Maracaibo’s” coffee exported from the Maracaibo port has sub varieties called Cucuta,
Mérida, Trujillo, and Tachira. The, eastern mountains coffee is known as Caracas, named after
the capital city. While these are the local varieties of coffee grown in Venezuela, the basic
universal coffee varieties under which the Venezuelan one fall under are the arabica (Coffea
arabica L.) which grows better in the high land regions, and the Robusta (Coffea canephora p. ex
Fr.) which grows in the low land regions; the former variety grows under forest canopy while the
latter grows under ~,artia1 shade.]
Lava do Fino is the country’s highest grade of coffee. The best quality of Venezuelan coffee is
reportedly from the western region which borders Colombia. The coffee is shipped from
Maracaibo and the coffee is also named as “Maracaibos”; the coffee grown is characterized as
“bright flavors with a clean, crisp fmish.” It is also light weight and of simple structure but
less acidic as compared with other Latin American coffee.
3
Coffee trees can be harvested within four years after planting. Each tree lives for about 50 years.
While two pickings occur annually (October and November; December, January, and part of
February) the latter one provides the larger harvest of the two. However, the picking season does
vary by elevation and local conditions such that trees at elevations greater than 3,000 feet
(910 m) are harvested later than those in lower elevations. Coffee production peaked to 1 million
bags per year before 1914, and after local consumption much of its exports were second only to
Brazil. In the Andean frontier region coffee production had increased ten times (between 1830
and 1930) making it the second largest coffee producing nation in the world. More than 82,000
tonnes of coffee were produced in~ 191 9;however, poor agricultural practices, soil erosion, less
incidei~ce of rainfall and over use of soil strength caused a drastic decline in the yield, in the
1 920s, which resulted in the decline of the coffee industry in the country; petroleum extraction
compounded its downfall. Typically, coffee production is at its greatest during the months
December and January. And shipping of Venezuelan coffee takes place between October to May.
Coffee grown in Venezuela is largely consumed by locals and the rest is sold mainly to
• the United States, Belgium and Germany.
Peru is one of the top 20 coffee producers in the world as of 2014, It ranks fifth in the export
ofArabica in the world market.
CENFROCAFE is a cooperative with more than 80 farm associations as well as ‘six dry mill
processing and finishing associations. Under this practice, the produce is marketed by the
finance, marketing and sales office .in Jaen, with direct accessibility to international export
markets, ultimately benefitting several hundred~ of coffee growers of the region. All the coffee
marketed by the associations is from an area above 1,000 meters (3,300 ft) elevation. This
organi~ation has facilitated a large number of farm families access to international markets. The
coffee marketed through CENFROCAFE, to the extent of about 92%, is organic; 100% is
certified as Fair Trade. This has resulted in improved quality, and greater demand for Peruvian
coffee in the international market, at competitive rates. The processing of coffee in Peru is
mostly by wet milling on the site of the plantations. By this process, the moisture content of the
coffee seeds is reduced to about 20% and then it is transported to the dry mills. However, this
decentralized system is unfavorable for coffee growing areas of northern Peru as it has led to
quality inconsis~encies, promotion of rot and the growth of fungus. The three prominent coffee
4
growing areas, located in the eastern slopes of the Andes, are Chanchamayo, the Amazonas
and San Martin regions, and the southern highlands St Ignacio, close to the Ecuadorian border,
is the centralized area of coffee plantations in northern Peru. Arabica is the dominant coffee
crop, 70% of which is Typica, 20% is caturra, and the remainder being of other types. About
75% of the coffee growing area lies at an elevation range of 1,000—1,800 meters (3,300—
5,900 ft), and planting done in the shaded areas is to the extent of 2,000 plants per ha.Farming is
done largely by small farmers, and coffee is handpicked. Organic coffee is grown on 90,000
hectares (220,000 acres).
Coffee produced in the country is mostly exported, and during 2012, 264,343 tons was exported
to US, Germany, Belgium, Colombia, Sweden and others, while internal consumption was
limited to about 10%. During 2014, coffee rust disease (Hemileia vastatris) affected 130,000
hectares (320,000 acres) in the central highlands of the country causing a decline of 6% in
production vis-à-vis the 2013 figure; compared to the highest ever production of 30,900 tons, the
shortfall was 15%.
In Africa coffee is grown in many countries and the selected countries are; Ethiopia, Rwanda,
and Uganda.
Ethiopia is the origin of coffee Arabica, and it grows wide variety of exemplary coffee, highly
differentiated, most of which are shade-grown by small farmers without chemical inputs
(Dempsey 2006). Ethiopia is the largest producer of coffee and ranks fifth in the world and first
in Africa by annual coffee production. For the past three tol2 four decades, coffee has been and
remains the leading cash crop and major export commodity of the country. Coffee accounts on
average for about 10% of total agricultural production, 5% of Gross Domestic Product, and
constitutes about 41% of total export earnings of the country (Worako 2008).
The number of coffee growers has been esthnated in about one million smaliholders’ farmers.
Most of them hold less than half a hectare of land, and grow 95 per cent of the coffee output
(Oxfam 2008). Total annual coffee production is of approximately 280,000 metric tons
(Dempsey 2006). Less than 40% of total national production of coffee is directed to official
export markets (Worako 2008). The same study (Worako 2008) indicated that, annual domestic
coffee consumption per household in the country is 24.5 kg and the per capita consumption is 4.5
kg. In Ethiopia livelihoods of approximately one quarter of the population depend on the coffee
5
sub~sector (Petit 2007). However, small holder ~offee growers in Ethiopia face high transaction
cost, lack of market information, poor infrastructure, and weak capital markets,
The coffee value chain in Ethiopia is composed of a large number of actors. It includes coffee
farmers, collectors, different buyers, processors, primary cooperatives, cooperative unions,
exporters and various government institutions (Gemech and Struthers, 2007). Ethiopian coffee is
sold both at local level and at the international market, the latter mainly through the commodity
exchange market and directly to international buyers through specialty market channels by coffee
cooperative unions.
Normally, all Ethiopia coffee should pass through commodity exchange market since 2001,
however, cooperatives have been granted permission to by~ pass auction opening ways for direct
sales (Dempsey, 2006). Cooperative Societies are advocated by the government of Ethiopia as
the main pillars of development and key market institutions in its Agricultural development led
industrialization strategy. This plan aims to unlock Ethiopia’s agricultural growth potential by
providing a better institutional environment for integrating small scale farmers into international
market.(FDRE, 2001).
Rwanda produces the prized Arabica Bourbon coffee, highly sought after in specialty coffee
markets world over (SNV, 2012). It is grown by approximately 500,000 smallholder farmers on
a total area of 33,000 ha (OCIR-Café, 2005). Despite the important role that the crop plays in the
livelihoods of rural farmers, national coffee throughput has been declining since the early 1 980s.
National production reached a peak of 43,000 tons in the 1986/87 coffee season. Between 2000
and 2004, national coffee production hovered between 16,000 and 25,000 tons with an average
yield of 2tons/ha (OCIR-Café, 2005). The production is relatively low when compared with main
coffee producers in Africa such as Ivory Coast and Uganda, which produce an annual average of
3.5 and 2.7 million tons respectively.
Problems related to international coffee marketing include stringent quality standards, costly
standards for certification and enforcement systems, bulking difficulties which limit regular
supply of economic volumes, increased variability in prices and limited opportunities to manage
price risk (ECART, 2007).
6
A number of initiatives have been crafted by both public and private sectors which have focused
on the technical or productivity constraints affecting coffee farmers at the expense of
institutional marketing arrangements for the crop. Rwandese coffee i~ considered to be of high
quality and is sold to conventional ~markets such as the US, Europe and other parts of the globe.
Strides have been made to improve the quality of Rwanda’s coffee following the promulgation of
the new coffee sector strategy in 1998.
However, the country’s export coffee remains largely obscured on the global market.(Mutandwa,
Kanuma, Rusatira, Kwiringirimana,Mugenzi,Govere and Foti, 2009) Challenges exist on how to
effectively establish the country’s coffee on the international market and also to ensure that the
marketing system keeps up with changes in the dynamic global market for high quality coffee
(Ntahontuye, 2008). Strategic management of the country’s niche markets remains largely
unexplored. This factor has also contributed to declining export earnings for coffee in the
country (Mutandwa et al,2009)
In Uganda Coffee is one of the most important cash crops playing a major role in the liveithoods
of many poor people and is a major foreign exchange earner in. Uganda. Uganda Coffee
Development Authority (UCDA), the government agency responsible for the sector, estimates
that about 500,000 households depend on coffee production. There are two main types of coffee
grown in Uganda namely Arabica and Robusta coffee. Annual production on average is made up
of 15% Arabica and 85% Robusta. In addition to serving as a main source of income, coffee has
many other uses and thus provides many opportunities for value addition investment.
Coffee can be used as a medicine to cure asthma, headaches, and Alzheimer’s disease. As a
stimulant, coffee can inhibit sleep which can make someone to keep working for longer hours..
Coffee is mostly grown in mixed farms where it is intercropped with food crops such as bananas
and beans which ensure households’ food security. It is also grown among shade trees that result
into sustainable coffee production, while ensuring a social, economic and suitable environment
that requires a minimal use of agro-chemicals such as fertilizers, pesticides and fungicides.
Cheap labor available in Uganda enhances great opportunities for investment in the coffee sector.
Coffee is a perennial crop and there are two main harvest seasons in Uganda for both Arabica
and Robusta coffee (March-June and September-November). The main production season for
7
Robusta ranges May-August for Masaka and Western regions and November to February for
Central, Eastern regions. In the case of Arabica, the main seasons are April to June for Western
Region and October to February for Eastern and West Nile Regions.
For Arabica coffee, main crop This begins in April- July and the following crop is October to
February. This is mainly in Ibanda and Kasese district,
Robusta Coffee is grown in the low altitude areas of Central, Eastern, Western and South Eastern
Uganda up to 1,200 meters above sea level. Arabica coffee on the other hand is grown in the
highland areas on the slopes of Mount Elgon in the East and Mt. Rwenzori and Mt. Muhabura in
the South Western Region (1500-2,300 m above sea level). Unlike Robusta whose native habitat
is the Lake Victoria Crescent, Arabica coffee is an introduced crop originating from Ethiopia.
Arabica coffee is more competitive on the international market because of its superior quality.
Uganda Robusta too has intrinsic quality attributes which also attract a premium on the
international coffee market. There is, also, a new Arabica variety locally known as Tuzza,
commonly referred to as catimors which performs well in low altitude areas of the country
predominantly zoned for Robusta coffee, (1,200-1,500 m). This variety is known for its high
yielding capabilities, drought resistance and tolerance to diseases presenting a very attractive
opportunity for investment.
Coffee growing areas in Central are Luwero, Mpigi, mukono, mityana, kayunga, masaka, rakai,
mubende, kiboga. In Western Bushenyi, Ntungamo, Mbarara, kasese, Ibanda, Rukungiri.
Generally the western region produces the highest quality of coffee. Other producing areas
include; Buwenge, Jinja, Iganga, Kamuli. These districts are generalized as Busoga. This area
produces theworst quality of coffee mainly because of post harvest handling and in addition they
harvest mainly pre-mature coffee which had low levels of quality.
Coffee fanners in Uganda use mainly the low input system and households strongly rely on
family labour for production. There is minimal use of agro-chemicals (fertilizers, pesticides and
fungicides) and this practice has made Uganda a suitable country for organic coffee production.
In general, the inputs in coffee production include land, labour, farm implements, seedlings,
mulching, fertilizers, pesticides and fungicides, as well as transport. Good storage facilities are
also essential for guaranteeing quality. Under medium management level, the yield of Robusta
8
nd Arabica is 5000 kg/ha and 1,100 kg/ha of clean and parchment coffee respectively. The
iverage costs ofproduction and yields per hectare are indicated in table 2 below product per day.
\~part from exporting green coffee beans Coffee can also be roasted, ground to make coffee
~owder which is in local coffee shops to prepare coffee drinks. Encouraging of local coffee
hops and local people to consume coffee could also help on value addition.
Doffee is grown and exported by more than 50.developing countries, but the major consumers
ire in all industrialized countries like USA, EU and, more recently, Japan. Globally, coffee is the
:econd.major traded commodity to oil and thus plays a vital role in the balance of trade between
leveloped and developing countries, providing the latter with an important source of export
~arnings to pay for imports of capital and consumer goods. World consumption of coffee is
rojected to increase by 0.4% annually from 6.7 million ton in 1998 - 2000 to 6.9 million tons in
~O10. Coffee consumption in developing countries is projected to grow from 1.7 million tons in
998 - 2000 to 1.9 million tons in 2010, at an annual rate of 1.3%, while their share in the world
narket is expected to increase from 26% in the base period to 28% in 2010. The projected higher
~rowth rate for developing countries compared to developed countries is due mainly to higher
ncome and population growth in developing countries, with increased coffee consumption
~ontinuing to be concentrated in the major coffee producing countries. Finally, World production
hr coffee in the crop year 2006/07 (April-March) was 121.57m bags, an increase of 11% over
:he previous season, while cqnsumption was forecast at 1 16m bags, according to the
nternational Coffee Organization (bC).
Jganda’s coffee export volumes grew by 30% from 126,000 metric tons in 2006 to 265,853
netric tons in 2007. Values grew by 40% from US$ 189 million in 2006 to US$ 265.8 million in
~007. Uganda Coffee Development Authority 2006 report indicated that yields and international
,rices for coffee were expected to increase in 2008, which offers significant opportunities for
.nvestment in the sector. Therefore coffee export volumes are predicted to increase along with
values.
Vbost of Uganda’s coffee in the 2006/07 season was exported to the European Union which
~ccounted for 72% market share of total exports as indicted below. The main country
lestinations were: The UK, Netherlands, Spain, Italy, Denmark and Norway. Outside the
Buropean Union, the main importing countries were Sudan, Singapore and China.
9
There are twelve main companies that imported Uganda’s coffee in 2006/07. These were: Ecom
Agro Industries, Olam International, Sucafina, Socadec, Drucafe, Cofflea, Luois Dreyfl~s,
Bernard Rothfos, Volcafe, Dectrade, Icona café and El Mthalib. The addresses and other details
of leading importing companies of Uganda coffee can be obtained on www.ugandacoffee.org
1.1 Statement to the Problem
In the resent report on coffee exports in Uganda, in September 2017 coffee exports amounted to
341,839 60-kilo bags worth US $ 38.58 million comprising 284,276 bags (US$ 31.50million) of
Robusta and 57,563 bags (US$7.09 million) of Arabica,
Compared to the same month last year, Robusta exports increased by 98.99% while Arabica
exports decreased by 12.9 1%. Similarly, Robusta value increased by 116.29% while Arabica
decreased by 14.63% compared to September 2016. Coffee exports for 12 months (October
2016-September 2017) totalled 4.61 million bags valued at US$ 545 million compared to 3.32
million bags worth US $ 327 million in the corresponding period the previous year, an increase
of 38.92% and 66.97% in quantity and value respectively.
Owing to this increase (38.82%) in quantity and 66.97% in value, there must have been an
increase in coffee production from the regions producing and as per my case study the
production of coffee by small scale farmers in Sironko District is determined by some factors
,like social factor, coffee production technology adoption and management of coffee’ cooperative
societies.
It is inevitable to access the influence, of these factors on the production of coffee by small scale
farmers since this contributes to the total production of coffee that is exported by Uganda.
The results from the study will be useful to, the Famers, Scholars, Business Development Service
Providers, Cooperative Society Management, Policy makers and Implementers to know which
factors determine production of coffee and income from coffee.
10
1.2 Puipose of the Study
The purpose of the study was to assess the factors that influence coffee production by small scale
farmers of two sub counties of Budadiri Town council and Busulani sub county in Sironko
District,
1.3 Specific Objectives
The specific objectives were to:
i. Assess the influence of social factors on small scale coffee production in two sub counties of
Budadiri Town council and Busulani sub county in Sironko District.
ii.Assess the influence of adoption of coffee production techniques on small scale in two sub
counties of Budadiri Town council and Busulani Sub County in Sironko District.
iii. Establish the influence of coffee cooperative societies’ management on small scale
Coffee production in two sub counties of Budadiri Town council and Busulani sub county in
Sironko District.
iv.Examine influence of coffee value addition on small scale coffee production in two sub
counties of Budadiri Town council and Busulani sub county in Sironko District
1.4 Research Questions
The research questions of the study were:
i.To what extent do the social factors of the small scale famers influence coffee production in the
two sub counties of Budadiri Town council and Busulan sub county, sironko District?
ii.To what extent does adoption of coffee production technology by small scale farmers influence
coffee production in two Sub counties of Budadiri town council and Busulani Sub County?
iii.How does management of coffee cooperative influence small scale coffee production in the
two sub counties of Budadiri Town council and Busulan sub county, sironko District?
11
iv,To what extent do coffee value addition influence small scale coffee production in the two sub
counties of Budadiri Town council and Busulani.sub county, sironko District?
1.5 Significance of the Study
The study findings and recommendations are hoped to generate both practical and theoretical
awareness important to other researchers, policy formulators,, policy implementers, coffee
Cooperative Sociefies, coffee factory Management and coffee stakeholders in revitalizing coffee
sector.
The study was to form the ground for replication by development practitioners while designing
coffee revival projects. It was also hoped to provide basis for further studies and also
documenting factors influencing coffee production within the sub counties and the all district as
well.
1.6 Scope of the Study V V
1.6.1 Content Scope
The study was conducted to assess the factors influencing of coffee production of small scale
farmers of Sironko District in two sub counties of Budadiri town council and Busulani sub
county. V
The study was also carried out to establish the impactof cooperative societies’ management on
production of small scale farmers in Busulani sub county ,Budadiri town council in sironko
District.
1.6.2Geographical Scope
Sironko district is found in Eastern Uganda and it is neighboring Kenya. Budadiri and Busulani
are found in sironko district.
L6,3Time Scope
V 12
The study was for five month and the first month was spent looking for the research topic. This
took a lot of time as being so keen on which research topic to take on .The secondS month after
the topic was got ,the research started on the proposal which is chapter one and the rest of the
work continued in .the remaining months,
1.7 Basic Assumptions of the Study
The basic assumption of the study was that the sample was representative of the target
population and the respondents were truthful
1.8 Definitions of Significant Terms
Coffee Brewed beverage prepared from the roasted beans of several species of an evergreen
shrub of the genus Coffea.
Cooperative Society Firm owned, controlled, and operated by a group of users for their own
benefit. Each member contributes equity capital, and shares in the control of the firm on the basis
of one-member, one-vote principle.
Technology Adoption Technology is also referred to as innovation which is anything new
successfully applied into economic and or social processes. In coffee’Production would refer to
management of coffee plantations including the management of Nurseries, pruning and weeding
procedures, use of fertilizers, pesticides, planting of new varieties and harvesting methods.
Strategic plan It is setting goals, determining actions to achieve the goals, and mobilizing
resources to execute the actions.A strategy describes how the ends (goals) will be achieved by
the means (resources).
Value addition To economically add value to a produët and form characteristics more preferred
in the market place.In Coffee value addition activities start at the very basic level of land
preparation, fertilizer application,Pests and diseases control and management, irrigation, primary
processing, secdndary processing and facilities maintenance
13
1.9 Organization of the Study
The study was organized in five chapters where chapter one gives the Background of the study.
Chapter two gives the literature review, conceptual frame Work and theoretical framework while
chapter three provides information on study research methodology, target population, sample
size and sampling procedure, data collection methods, validity and reliability of the instrument,
data collection procedures, data collection techniques ethical consideration and operational
definition of variables.
Chapter four gave data analysis, data presentation and interpretation and fmally, chapter five
gave a summary of findings, discussion, conclusions and recommendations,
14
CHAPTER TWO
LITERATURE REVIEW
2.0 Introduction
This chapter gives an overview on production of coffee in Uganda, overview of Cooperative
concept, a review of related literature on independent variables of the study which includes
influence of social factors, coffee production technology adoption, and management of
cooperative.
The section has concluded by giving both theoretical and Conceptual framework of the study.
2.1 Overview of Coffee Production in Uganda
Coffee is Uganda’s most valuable agricultural export commodity, contributing US$ 544 million
in 2016/17, about 20 percent of total export earnings. Furthermore, the crop, employs over 3.5
million households. (EPRC)
Cqffee is mostly grown in mixed farms where it is intercropped with food crops such as bananas and
beans which ensure households’ food security. It is also grown among shade trees that result into
sustainable coffee production, while ensuring a social, economic and suitable environment that requires a
minimal use of agro-chemicals such as fertilizers, pesticides and fungicides. Cheap labor available in
Uganda enhances great opportunities for investment in the coffee sector .Coffee is a perennial crop.
However, there are two main harvest seasons in Uganda for both Arabica and Robusta cOffee (March
June and September-November). The main production season for Robusta ranges May-August for
Masaka and Western regions and November to February for Central, Ea~tem regions. In the case of
Arabica, the main seasons are April-June for Western Region and October-February for Eastern and West
Nile Regions.
Robusta Coffee is grown in the low altitude areas of Central, Eastern, Western and South Eastern Uganda
up to 1,200 meters above sea level. Arabica coffee on the other hand is grown in the highland areas on the
slopes of Mount Elgon in the East and Mt. Rwenzori and Mt. Muhabura in the South Western Region
(1500-2,300 m above sea level). Unlike Robusta whose native habitat is the Lake Victoria Crescent,
Arabica coffee is an introduced crop originating from Ethiopia. Arabica coffee is more competitive on the
international market because of its superior quality. Uganda Robusta too has intrinsic quality attributes
15
which also attract a premium on the international coffee market. There is, also, a new Arabica variety
locally known as Tuzza, Coffee farmers in Uganda use mainly the low input system and households
strongly rely on family labour for production. There is minimal use of agro-chemicals (fertilizers,
pesticides and fungicides) and this practice has made Uganda a suitable country for organic coffee
production.
2.2 The Concept of Cooperatives
Cooperatives are user-owned, user-controlled and user-benefit organizations. They Could be agricultural,
non-agricultural, unions or Savings and Credit Cooperatives(SACCOs). They operate in different sectors
of the Economy including agricultural, handicraft, transport, housing development, building and
construction, consumer services, banking and insurance (Gamba and Komo, 2006). Cooperatives are
member-owned businesses; they aggregate the market power of people who on their own could achieve
little or nothing, and in so doing they provide ways out of poverty and powerlessness. The representative
body for cooperatives, the International Cooperaiive Alliance (ICA), defines a cooperative as an
autonomous association of persons united voluntarily to meet their common economic, social and cultural
needs at~d aspirations, through a jointly owned and democratically controlled enterprise.
This definition and the ICA set out seven cooperative principles: voluntary and open membership
democratic member control ,member economic participation, autonomy, independence, education,
training and information,
The first four of these are core principles without which a cooperative would lose its identity; guarantee
the conditions under which members own, control and benefit from the business. The education principle
is really a commitment to make membership effective and so is a precondition for democratic control,
while cooperation among cooperatives is a business strategy without which cooperatives remain
economically vulnerable. The last principle, concern for community, is about corporate responsibility, and
it leads into other concerns such as prevention of poverty and protection of the environment (ICA,
2002).
16
2.3 Literature Review on Independent Factors of the Study
This section reviews related literature on influence of social economic factors on small scale
coffee production, technology adoption, management of coffee cooperatives, coffee value
addition and influence of key players on coffee production.
2.3.1 Social Factors Affecting Small Scale Coffee Production
At both advanced and young age farmers rate of adoption of agricultural technology is low
(Akudugu,Guo, and Dadzie, 2012).
At the younger age, the scholar says farmers were not able to adopt modem agricultural
production technologies, especially capital intensive ones because they did not have adequate
resources to do so. At an older age they say that farmers’ volumes of economic activities were
reducing hence they were unable to pay for technologies.
Older farmers have accumulated years of experience in farming through experimentation and
observations and may find it difficult to leave such experiences for new technologies. In
addition, farmers’ perception that technology development and the subsequent benefits, require a
lot of time to realize, can reduäe their interest in the new technology because of farmers’
advanced age, and the possibility of not living long enough to enjoy it (Caswell, Fugue, Ingram,
Jans and
Kascak (2001), Khanna, (2001).
Elderly farmers often have different goals other than income maximization, in which case, they
will not be expected to adopt an income —enhancing technology (Tjornhom, 1995).
Maximum level of education within the farm household has a positive relationship with the
probability of adoption Akudugu et al, (2012).
The same author noted that farm households with well educated members are more likely to
adopt modem agricultural production technologies than those without. This is because educated
members even bring home modem agricultural production technologies, especially improved
crop varieties and livestock breeds for relatives to adopt. This is consistent with the literature that
education creates a favorable mental attitude for the acceptance of new practices especially of
17
information-intensive and management-intensive practices (Wailer, Hoy, Henderson, Stinner and
Welty (1998).; Caswell et al, 2001). Education involves impacting knowledge and skills to
people which they use to generate income,
The more educated people thus have income to invest in agriculture thereby likely to adopt
production technologies.
Gender is positively related to the adoption of modern agricultural production technologies by
farm households. This means that male farmers are more likely to adopt modern agricultural
production technologies their female counterparts. The reason for this is that men are the people
who make production decisions in the study area and also control productive resources such as
land, labour and capital which are critical for the adoption of new technologies (Akudugu et al,
2011). This finding contradicts those of Doss and Morris (2001) who in their study on factors
influencing improved maize technology adoption in Ghana, and Overfield and Fleming (2001)
studying coffee production in Papua New Guinea show insignificant effects of gender on
adoption.
Age was found not to influence coffee eco certification certified and non-certiflea farmers in
Tekangu cooperative society, Karatina by Kirumba and Pinard, (2010),
However, they found out that on average, certified farmers were slightly older than noncertifled
ones. The same trend was noted for household size, though certified households were slightly
smaller than non-certified households. There was a highly significant relationship between the
mean number of years spent in school for certified and noncertified farmers. The same Kirumba
and Pinard, (2010) found no significant connection between mean number of household
members on off-farm employment, farm size in hectares and the number of coffee bushes; for
certified and non-certified farmers. The authors found that certified farms were larger in sizes,
had more coffee bushes and more household members on off-farm employment than non-
certified farms. They further observed significant relationships between the mean area under
coffee in hectares, annual coffee production, number of adults working on farm, number of cattle
owned, number of goats and sheep owned.
là
2.3.2 Adoption of Production Techniques
Innovations are referred to as anything new successfully applied into economic and or social
processes. In coffee production this would refer to the way farmers manage their coffee
plantations including the management of nurseries, pruning and weeding procedures, the use of
fertilizers and pesticides, the planting of new varieties and the harvesting methods. The value of
an innovation must be measured with regard to its potential to generate benefits, like increase
yields, stabilize incomes or and contribute to sustainable development. The value of the
innovation is also a major factor determining its adoption. (Hartwich, and Scheidegger, 2010).
Coffee requires good nutrition which results in vigorous growth of plant which reduces
susceptibility to pests and diseases. Adequate supply of nitrogenous fertilizer is associated with
larger bold beans which are of high quality thus price. Organic fertilizer in form of Ammonium
Sulphate Nitrate (ASN), Calcium Ammonia Nitrate (CAN), Ammonia Sulphate(AS) or Urea are
Some of the fertilizers applied in coffee,
Increased productivity and reduced cost of production are the best strategies to enhance
competitiveness of coffee farming in order to face international competitiveness and maintain the
most important source of livelihood for the rural farming population in predominantly coffee
production zones (Gicuru, 2011). The same report also indicates that problems of smaliholder
coffee farmers are compounded by the strict coffee management regulations that prohibited
intercropping and emphasized on regular application of expensive inorganic fertilizers and
pesticide sprays which increases the likelihood of failure given . the high cost system is
unsustainable or unprofitable due to failing output prices. Smallholder coffee production varies
widely by the degree to which éonventional technologies such as inorganic fertilizers and
pesticides are adopted, as well as the extent to which technologies like Ruiru II and Batian a new
coffee cultivars, and agro forestry technologies are adopted. This variation means differentials in
the productivity, profitability and competitiveness of coffee fanning.
Purely business-oriented farms are likely to adopt open-grown coffee and the other extreme will
involve integration of coffee with food crops and! or trees (Gicuru, 2011).
Integration of shade trees with coffee has continued to receive renewed policy and research
attention due to increasing costs of inorganic inputs coupled with the high risk on the
19
environment. Growing coffee under shade has the desirable effects of suppressing weeds and
preventing build-up of certain pests, thereby cutting costs of production and preventing net losses
of coffee berries from diseases and pests. The optimum shade conditions for pest suppression
differ with climatic conditions, altitude and soils (Stayer, Guharay, Monterroso, and Muschler,
(2001). Selection of tree species and density, pruning regime and spatial arrangement are
important decisions that a farmer must make. Farmers who do not interplant coffee with trees or
food crops have a less integrated system of growing coffee generally referred to as open-grown
coffee farming.
Some farmers adopt shade-grown coffee by growing trees, shmbs or food crops in or around the
field. These different coffee management systems have cost and productivity implications and
may be significant factors affecting the profitability and survival of the coffee farming operation.
Apart from using shade trees in controlling weeds and pests, some coffee farmers adopt
alterna~ive low-cost technologies such as cover crops and mulching for weed control, cultural
pest control as well as inter-planting food crops to hedge against risks. Other farmers continue to
depend on high-cost systems that rely on external inputs. Overall, productivity of coffee is
generally low but there is big farm-to farm variability implying that some farms are more
productive than other farms.
The combination of different technologies and management techniques are likely to lead to
differences in productivity and profitability (GiCuru, 2011).
In response to declining coffee prices, farmers have followed four distinct routes; namely, to
uproot coffee, continue farming as before, or neglect the crop or practice coffee agro forestry.
Agriculture is not only an important source of income in developiiig countries, but it is also
responsible for serious environmental damage. (Isik,2004; Sterner, 2003, World Bank, 2008a). A
promising alternative to control the negative effects of agriculture on the environment and to
increase the income of rural poor is ECO-labels. Awarded by a third party who controls that the
production meets specific environmental criteria, ECO-labels allow consumers to compensate
producers who use environmentally friendly and socially responsible practices.
20
Though the different labels privilege different environmental aspects of production, the non use
of chemical fertilizers, the protection of the forest and the conservation of wildlife has been the
focus of organic certificates. Certified organic cultivation generates positive impact to the
community in the form of improvements in the environment. In addition, farmers benefit from
improved market access and reduced health problems like intoxication due to misused of
agrochemical (IFAD, 2003 ;Parrot, Olesen and Høgh-Jensen, 2007).
2.3.3 Cooperative Governance
Cooperative governance can be viewed in terms of the management committee who are elected
members of the cooperative society and the cooperative manager who is an employee of the
cooperative society and not necessarily a member of the cooperative society.
The Management Committee is the highest elected executive institution in a cooperative
enterprise. Members of the cooperative society are eligible for election into the management
committee which acts on behalf of the members. These factory farmers’ representatives from the
cooperative society management committee which manages the affairs of the society on behalf
of the thembers.
Everything done in the cooperative must be approved by the management committee
(Koopmans, 2006). The management committee ensures that decisions taken can in fact be
executed. The Management committee must guarantee a close correlation between theory and
practice, between decision and execution. It is always good management policy to view every
decision action in the context of the total activities of the enterprise, present and future.
In this case, the management committee must seek to discover the correlation between current
actions and their future consequences (Hussi, Murphy, Lindberg and Brenneman (1993).
The cooperative Manager is the chairperson of the management committee, and the only paid
officer in the enterprise. The cooperative manager initiates and presides over the meetings of the
management committee, and prepares the agenda for those meetings. It is this officer who is
most directly involved in the personal problems of members of the cooperative and of its
employees.
21
The manager represents the cooperative in other forums, institutions and government bodies; and
it is this person who is in charge of the operation of the different departments of the organization
as well as for the preparation and execution of the socioeconomic policy of the cooperative. It is
the manager who proposes plans, executes and~ evaluates (Ke~onde,2OO5). Most farmers have
became more business-minded as their own farm operations grow, They give more attention to
their cooperative’s management. They employ managers with more training and expect them to
improve their knowledge and skills.
Also, a growing number of cooperative managers seek to become more proficient in managing
the affairs of theif~ cooperatives (Porvali, 1993). Public concern about food safety, pollution
control, health and the environment, monopoly, standardization procedures and related issues
focuses attention on the competence, integrity, and behavior of cooperative managers. As a
result, cooperatives are becoming more aware of the need to indemnif~y cooperative managers
who are subject to increased legal exposure. The growing impact of world markets, even on the
individual family operation, is changing the management perspective from the local’ cooperative
level.
The local is being viewed less a~d le~s as an independent entity and more and more as part of a
system (Lindberg, 1993).
Poor governance and inefficiencies in cooperatives result in delays in supplying inputs to
farmers, credit processing and payment to fanners for their produce. High costs of fertilizer and
pesticides has, in some cases, forced the farmers to reduce application of these inputs, resulting
in delivery of low quality cherries and substantial loss of small cherries during pulping stage in
processing. The farmers get their earnings once a year, making it difficult for them to meet
periodic expenses they incur both at the farm and at personal levels. In addition, there is still
tight regulation in today’s Kenyan coffee sector. The regulations not only all require
smallholders to ‘process their coffee through a cooperative, but prohibit direct purchase from
farmers. Farmers also have limited information on the coffee market and existing member
associations are structurally weak to act as feedback mechanism to farmers (Chege, 2012).
22
2.3.4 Coffee Value Addition
Value-addition for coffee range from very intricately processed and packaged, to simple
additions or processes that can add to the worth of the final product. The Coffee Value addition
activities start at the very basic level yet very crucial in detennining the fmal quality of the end
product. Such activities include essentials such as appropriate land preparation, fertilizer
application, pests’ and diseases control and management, irrigation, primary processing,
secondary processing and facilities maintenanc~ (EPZ, 2014). Value additions along the coffee
value chain have been dismally low and skewed against the farmer who gets seven percent of the
market value, which is hardly a tenth of what accrues at the milling and marketing stage in the
value chain. ‘The bulk of value added accrues at the roasting stage of the value chain (Chege,
2012).
The high level of consumption has been achieved though a promotion strategy that offers various
brands made available in social places. Increasing local coffee consumption can enhance local
processing capacity that can be utilized for value addition and eventually the country should be
able to export finished coffee products (Karanja and Nyoro, 2002).
Different ways of adding value to coffee includes: Grow organic Coffee which many buyers in
the export market will happily pay 30 -60% more for better taste and health, in line with the
emerging trends and lifestyle in the major target export markets, Sell something unusual or hard
to find, have a special farm or estate label, or a recognizable brand, Sell direct and deliver to
high-end consumers such as restauiants and hotels who put a premium on freshness and focusing
on Coffee as product with unique or special qualities due to the soil in which it is grown, or
altitude or special climatic niche (EPZ 2014).
Sustainable coffee is increasingly becoming an important segment of the market offering a lot of
new opportunities ‘~vith a lot of support from European supermarkets and roasters.
The four major European certifications for coffee production standards are Fair-trade, Organic,
Rainforest Alliance and UTZ certified. Value added coffee by-products include: as a Source of
dietary fibre; Coffee spirit; Charcoal production; Mushroom cultivation; Production of citric acid
and gibberellic acid; Antioxidant compounds; Source of natural food colour; Production of
aroma compounds; Biogas production and Sources of phenolic compounds (EPZ, 2014).
23
Coffee branding through the Geographical Indication for single-origin coffee is a relatively new
concept that could improve value addition along the supply chain. Coffee branding according to
the zones of origin widens the market through segmentation. The farmers could use coffee
branding to strategically position themselves, through partnerships, and reduce price spread
between producer and retail level. This may be achieved through joint ventures in investment
that allows local roasting and packaging of the product before exportation. Further, the
partnership can take the form of contract farming. Contract farming has ancillary benefits in the
form of credit arrangement for critical inputs and may also embrace insurance schemes. For such
developments to be useful to farmers, the government may need to play a role in mediating and
establishing the ground rules for this arrangemen’t.
2.4 Theoretical Framework
The study is based on Fredrick Taylor theory of management which led the development of a
theory of management that analyzed work flows. Its main objective was improving economic
efficiency especially labor productivity. He attempted to apply science to the engineering of
prdcesses and management. Taylor believed in standardization of best practices and wreathed
traditions preserved merely for its own sake or to protect the social status of particular workers
with particular skills sets.
He advocated for transformation of craft production into mass production and knowledge
transfer between workers and from workers into tools, processes and documentation,
Taylor noticed that natural differences in productivity between workers were driven by various
causes including differences in talent, intelligence or motivation. He applied science in
understanding why and how these differences existed and how best practices could be analyzed,
syntheaized and then propagated to other workers through standardization of process steps. He
believed that decisions based upon rule of thumb and tradition should be replaced by practical
procedures developed after careful study of an individual at work, including via time and motion
slides which would synthesis the one best way to do any given task. The goal and promise was
both an increase in productivity and reduction of effort.
Taylor observed that some workers were more talented than others and that even smart ones
were often unmotivated. He observed those workers who were forced to perform repetitive tasks
24
t~nded to work at the slowest rate that goes unpunished. Taylor observed that, when paid the
same amount, workers tend to do the amount of work that the slowest among them does. This
reflected the idea that workers had vested interest on their own well-being and don’t benefit from
working above the defined rate of work when it will not increase their remuneration.
He proposed that time and motion studies combined with rational analysis and synthesis could
uncover one best method of performing any particular task and that prevailing methods were
seldom equal to these best methods.
Taylor acknowledged that if each employee’s, compensation was linked to their output, their
productivity could go up. His compensation plans included piece rates. He rejected the idea that
the trades including manufacturing were black art that couldn’t be analyzed, In his empirical
studies he examined various kind of manual labour and discovered Many concepts. He decided
that labour should include rest breaks so that workers could get time to recover from mental and
physical fatigue. As a result productivity increased (Kidombo, Ndiritu and Gakuu, 2013).
2.5 Conceptual Framework of the Study
The independent factors of the study included influence of: social factors, coffee
production technology adoption, management of coffee Cooperative Societies and value addition
while the dependent variables included coffee productivity per tree and the number of tree per
farm. Other factors affecting coffee production were government policies, weather, politics and
culture.
The Conceptual Framework of the study is shown in Figure 1
25
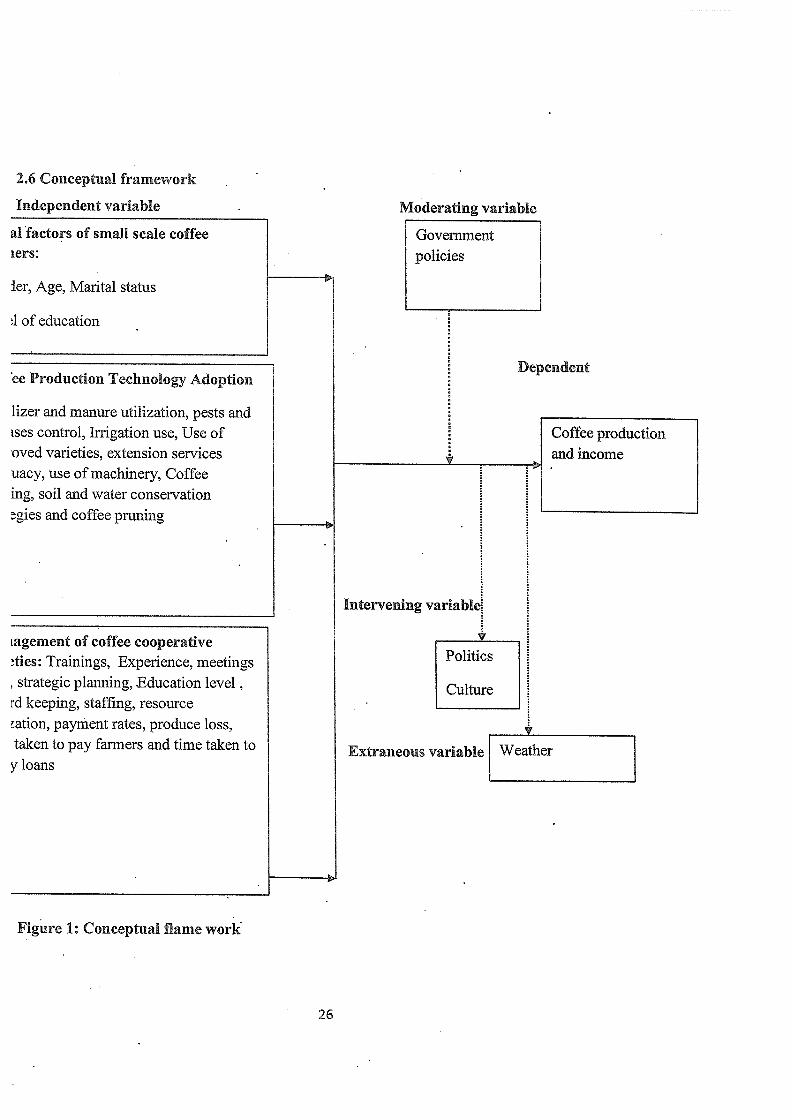
2.6 Conceptual framework
Independent variable Moderating variable
a! factors of small scale coffee GovernmentLers: policies
ler, Age, Marital status
~1 of education
Dependentèe Production Technology Adoption
lizer and manure utilization, pests and _________________
~ses control, Irrigation use, Use of Coffee productionoved varieties, extension services and incomeuacy, use of machinery, Coffeeing, soil and water conservation~gies and coffee priming —
______________________________ Intervening variables
iagement of coffee cooperative~ties: Trainings, Experience, meetings Politicsstrategic planning, Education level, Culture
id keeping, staffing, resource ___________
~ation, payment rates, produce loss, _________
taken to pay farmers and time taken to Extraneous variable Weathery loans
Figure 1: Conceptual flame work
26
2.7 Related Literature Review on Production of Coffee
Akudugu et a!, (2012) found both young and advanced age, gender and education ~level within
household influenced modem agricultural technology adoption in Nigeria, while Overfield and
Fleming (2001), Doss and Morris, (2001) study contradicts gen4er influences technology
adoption in coffee in Papua New Guinea, Maize in Ghana,
Kirumba and Pinard (2010) noted that age did not influence coffee eco certification in Tekangu —
Karatina, Kenya.
Both Gicuru (2011) and Stayer et al (2001) agrees that adoption in technology like cultural
practices will minimize cost of production but productivity will be low and adoption of more
expensive technologies will improve profitability and advocates for higher payment for organic
produced coffee. Both Parrot et al (2007) and IFAD, (2003) agree that organic cultivation will
benefit farmers from market access and reduced health problems.
Chege, (2012) cites poor governance and inefficiencies of cooperatives to cause delay in
supplying inputs and processing credits,
He also cites high cost of inputs, lack of information dissemination, poor leadership, strict
regulations, delayed payment and lack of farmers’ ownership of societies, over regulation of the
industry, coffee value chain organization structure to contribute to low production.
According to Karanja and Nyoro (2002), low coffee production in Kenya results from
international price fluctuation which saw Kenya reduce annual production of 130,000MT of
clean cherry in 1987/88 to current 50,000MT.
The authors reported that increased cost of production has reduced profitability of the enterprise
making it less competitive. He cited low profit of Kshs 14,000 per ton has resulted fanners
uprooting the crop and farming other better paying crops and converting coffee farms to prime
residential houses where such farms are around big towns like Kiambu, Nyeri town and Nyanza
regions. This is also in agreement with Kegonde, (2005) coffee production is on decline.
He attributed low production to high cost of coffee production he says is contributed by
inadequate credit facilities, high cost of credit and other inputs like fertilizers and irrigation, and
strict laws by Coffee Board of Kenya of restricting production to gazetted area and laws
27
prohibiting uprooting crop which discourage farmers going in coffee fanning. UNCTAD, (1999)
cites massive overproduction, collapsing of international prices, deteriorating quality, diseases
and climate change as the main causes of low coffee production.
The researcher addressed the knowledge gap of influence of social factors, influence of extent of
technology adoption, influence of management of coffee cooperative societies, influence of
coffee value addition and influence of roles of key players in small scale coffee production to
both bridge the knowledge gap and also check whether the findings of study done elsewhere
holds with the small scale coffee production in Budadiri Town Council and Busulani Sub county
in Sironko district
28
CHAPTER THREE
RESEARCH METHODOLOGY.
3.0 Introduction
This chapter provides an overview of the research methodology which was employed in the
study. It gives a description of the research design used, the target population, sample size and
sampling procedure and data collection methods and instruments.
Measures used to ensure validity and reliability of the instruments is also given in the chapter
together with data analysis, presentation, procedures and ethical considerations.
3,1 Research Design
The research study employed a descriptive survey design. According to Best (2004), a survey is
a means of gathering information about the characteristics, actions or opinions of a group of
people, referred to as population. It describes data and characteristics about a population and
phenomenon being studied. The descriptive survey design helps answer the questions like who,
what, where and how on describing the phenomenon on study. This design is appropriate for the
study because it will enable data collection from a large population.
3.2 Target Population
Target population is that population that the researcher wants to generalize the results of the
study. Mugenda and Mugenda (2003) define target population as the entire group a researcher is
interested in or the group about which the researcher wishes to draw conclusions. The target
population of the study wills the 600 small scale coffee produces in Busulani sub county and
Budadiri town council in Sironko District,
29
3,3 Sample Size and Sampling PSrocedure
According to Mugenda and Mugenda, (2003) non probability purposive sampling method is
adopted where a group has the required information with respect to the objectives of the study
and offer in depth information about the study.
In the coffee farmers’ strata, the researcher will use the following formula adopted from
Cochran, (1963) in order to determine the sample size.
n=N/[1 +N(e)2j
Where; n = sample size N = Population size, e Level of significance
n = 600/ [1+ 600(0.07)2 = 152
3.4 Data Collection Methods
The study will use primary data, which will be collected using questionnaires and interview
guides. The researcher will administer the questionnaires to respondents via personal interviews,
The questionnaires shall comprise of a variety of questions which shall be structured into
different sections with each of the sections addressing a specific objective. Both open and closed
questions will be included in the data collection tool. Questionnaires for all strata will be
structured in five parts. The first part shall capture the demographic information of the
respondent while the second, third and fourth parts will be designed to collect data on technology
adoption, cooperative management and value addition.
3.5 Validity of Instruments
According to Mugenda and Mugenda (2003), validity is a measure of relevance and correctness.
It is the accuracy and meaningfulness of inferences which are based on the research results. Data
collection techniques must yield information which is not only relevant to the research questions
but also correct. For the purpose of this study, the researcher will consult the research supervisor.
He will visite the Sub County cooperative officer in Sironko before conducting the study in
order to ascertain the validity of the research instruments. The specialists confirmed that the
issues were pertinent to the topic of study. Construct validity will also be used which according
to Mugenda and Mugenda (2003), is appropriate where no criteria or domain of content is
accepted as an adequate measure of content. This will be determined by measuring correlation
30
between concepts with theoretical framework. High Correlation of factors with theoretical
framework means that the instrument is valid.
3.6 Reliability of the Instruments
According to Mugenda and Mugenda (2003), reliability is a measure of the degree to which a
research instrument yields consistent results or data after repeated trials. Methods used to test for
reliability included pilot testing
3.6.1 Pilot Testing
Pilot testing as a smaller version of a larger study that is conducted to prepare for the study or to
field test the survey to provide a rationale for the design (Orodho 2004). It involves pre-testing of
the instruments to determine their validity and reliability. The researcher will pilot-tests the
instruments by using a different but a similar group from a different division and then made
necessary adjustments. A pilot study will be conducted in order to test the reliability and validity
of the questionnaires. The aim of the pilot survey will be to test whether the design of questions
was logical, if questions are clear and easily understood whçther the stated responses were
exhaustive and how long it would take to complete the questionnaire, The pre-test will also allow
the researcher to check whether the variables collected could be easily processed and analyzed.
The pre-testing will be carried out on a sample consisting of 10% of the respondents. Any
question found to be interpreted differently during the pre-testing will rephrased so that could
have same meaning to all respondents. Views given by the respondents during pre-testing will be
analyzed and used to improve the questionnaires before actual collection of data.
3,7 Data Collection Procedures
Three research instruments were to be used in the study for data collection: Interview schedules
for Coffee Cooperative Societies Management staff and stakeholders and questionnaires for
coffee farmers.
The researcher was formulating the instruments and administers them to the respondents
whereby relevant questions concerning the study’were asked through face to face to interviews.
The researcher sought approval foi~ the study from the University supervisor and after the study
proceeded with: data collection process and study instrument administration; Pilot testing;
31
Revision of the data collection instruments after the pilot study; Reproduction of required copies
for data collection upon approval by supervisor; Administration of data collection instruments to
respondents; Collection of duly completed research instruments, assessment of filled
questionnaires through serialization and coding for analysis; Data analysis and discussion;
preparation of conclusions and recommendations.
3.8 Data Analysis Techniques
Once all the data was collected from the field, it was cleaned and captured for coding.then the
variables wete entered and analyzed using Statistical Package for Social Sciences of any version
IBM 20 and EXCELL.
3.9 Ethical Considerations
The researcher relied on ethical issues as identified by Mugenda and Mugenda (2003), while
undertaking this study. The researcher followed the three principles of ethics which include
respect, beneficence and justice. The participants were informed of the purpose of the study
before information was sought from them thus conforming to the principle of voluntary and
informed consent. Honesty, integrity and confidentiality was highly maintained throughout the
study.
32
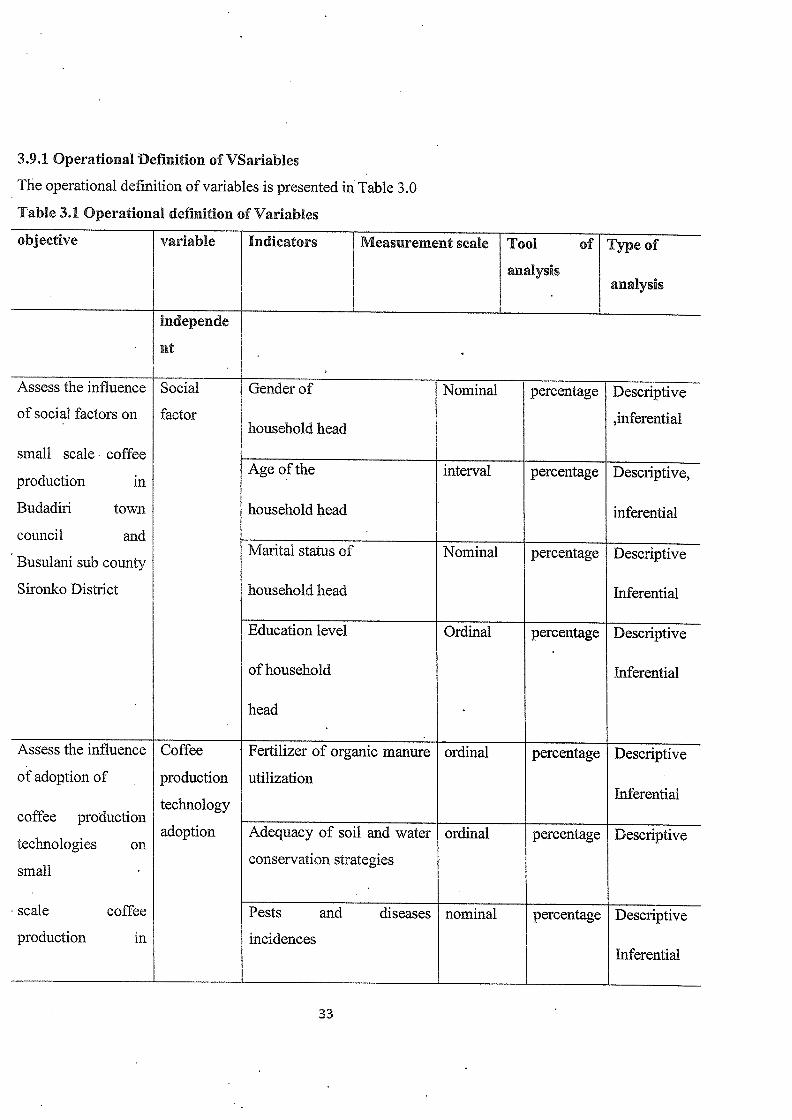
3.9.1 Operational Definition of VSariables
The operational definition of variables is presented in Table 3.0
Table 3.1 Operational definition of Variables
objective variable Indicators Measurement scale Tool of Type of
analysisanalysis
independe
~ ut
Assess the influence Social Gender of Nominal percentage Descriptive
of social factors on factor ,inferential. household head
small scale. coffee. Age of the interval percentage Descriptive,
production in
Budadiri town household head inferential
council andMarital status of Nominal percentage Descriptive
Busulani sub county
Sironko District household head Inferential
Education level Ordinal percentage Descriptive
of household Inferential
. head
Assess the influence Coffee Fertilizer of organic manure ordinal percentage Descriptive
of adoption of production utilizationInferential
technologycoffee production
adoption Adequacy of soil and water ordmal percentage Descriptivetechnologies on
conservation strategiessmall
• scale coffee Pests and diseases nominal percentage Descriptive
production in incidencesInferential
33
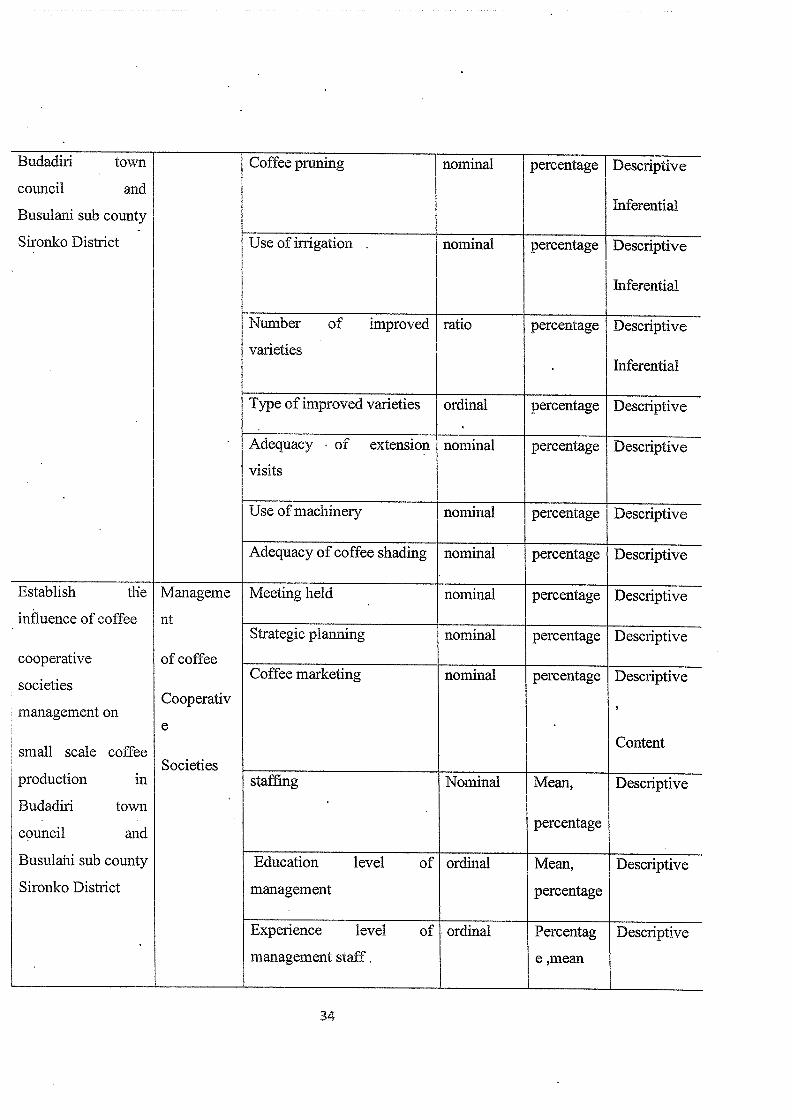
Budadiri town
council and
Busulani sub county
Sironko District
Establish the
influence of coffee
cooperative
societies
management on
small scale coffee
production in
Budadiri town
council and
Busulahi sub county
Sironko District
Coffee pruning nominal percentage Descriptive
Inferential
Use of irrigation nominal percentage Descriptive
Inferential
Number of improved ratio percentage Descriptive
varieties. Inferential
Type of improved varieties ordinal percentage Descriptive
Adequacy of extension nominal percentage Descriptive
visits
Use of machinery nominal percentage Descriptive
Adequacy of coffee shading
Meeting held
nominal percentage
nominal
Descriptive
Manageme
nt
of coffee
Cooperativ
e
Societies
percentage Descriptive
Strategic planning nominal percentage Descriptive
Coffee marketing nominal percentage Descriptive
Content
staffmg Nominal Mean, Descriptive
. percentage
Education level of ordinal Mean, Descriptive
management percentage
Experience level
management staff.
of ordinal Percentag
e ,mean
Descriptive
34
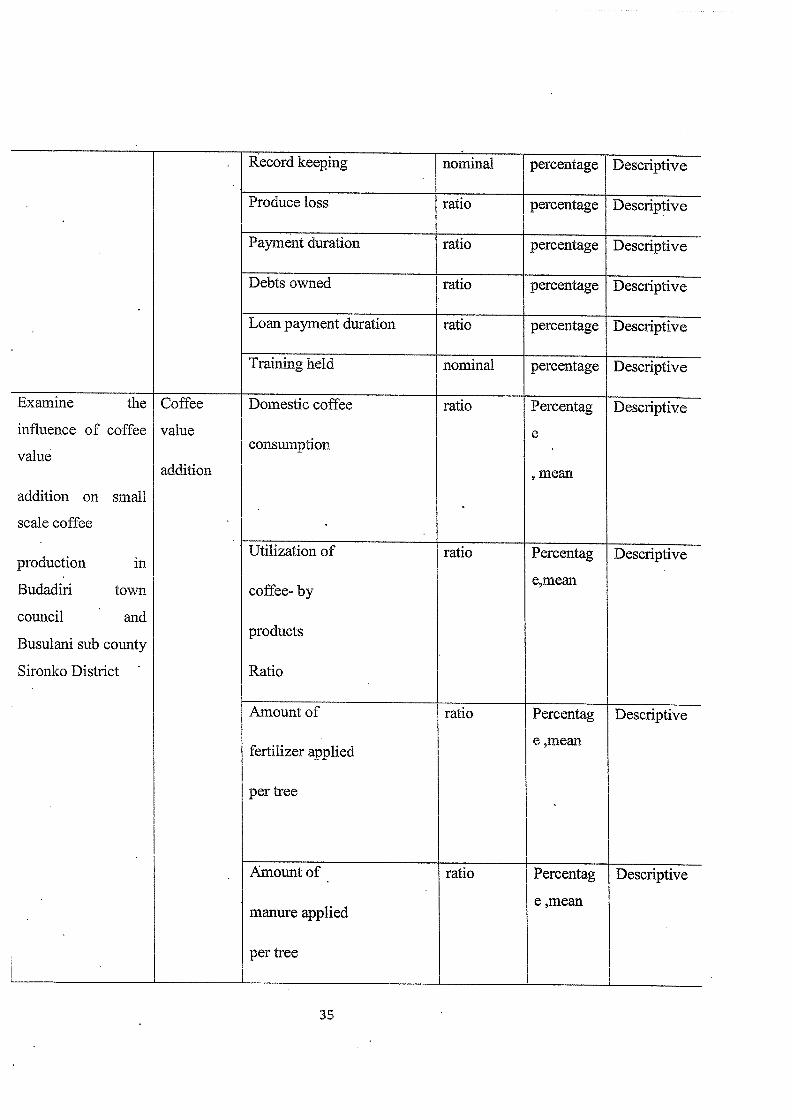
Examine the
influence of coffee
value
addition on small
scale coffee
production in
Budadiri town
council and
Busulani sub county
Sironko District
Record keeping nominal percentage Descriptive
Produce loss ratio percentage Descriptive
Payment duration ratio percentage Descriptive
Debts owned ratio percentage Descriptive
Loan payment duration ratio percentage Descriptive
Training held
Coffee
value
addition
nominal
Domestic coffee
consumption
percentage
ratio
Descriptive
DescriptivePercentag
C
mean
Utilization of ratio Percentag Descriptive
e,meancoffee~ by
products
Ratio
Amount of ratio Percentag Descriptive
e ,meanfertilizer applied
per tree
ratioAmount of•
manure applied
per tree
Percentag
e ,mean
Descriptive
35
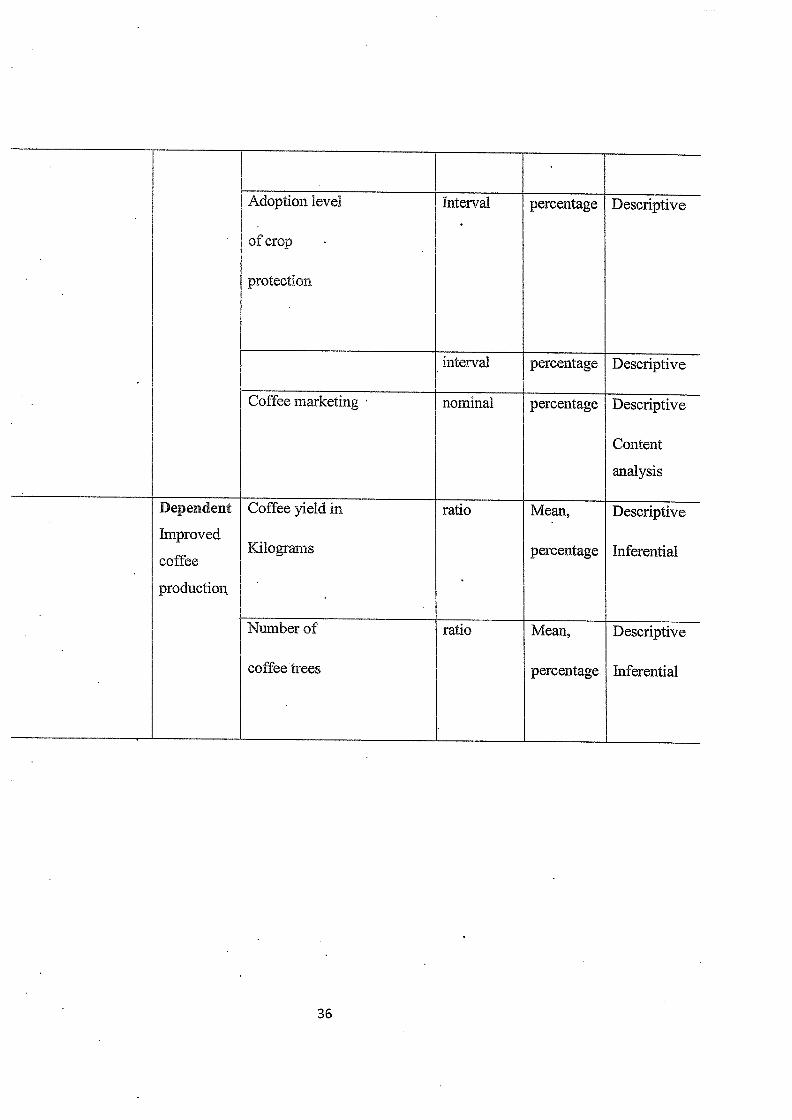
Number of
coffee trees
Mean,
percentage
Mean,
percentage
Descriptive
Content
analysis
Descriptive
Inferential
Descriptive
Inferential
Adoption level Interval percentage Descriptive
of crop
protection
~ interval percentage Descriptive
Coffee marketing nominal percentage
Dependent
Improved
coffee
production.
Coffee yield in
Kilograms
ratio
ratio
36
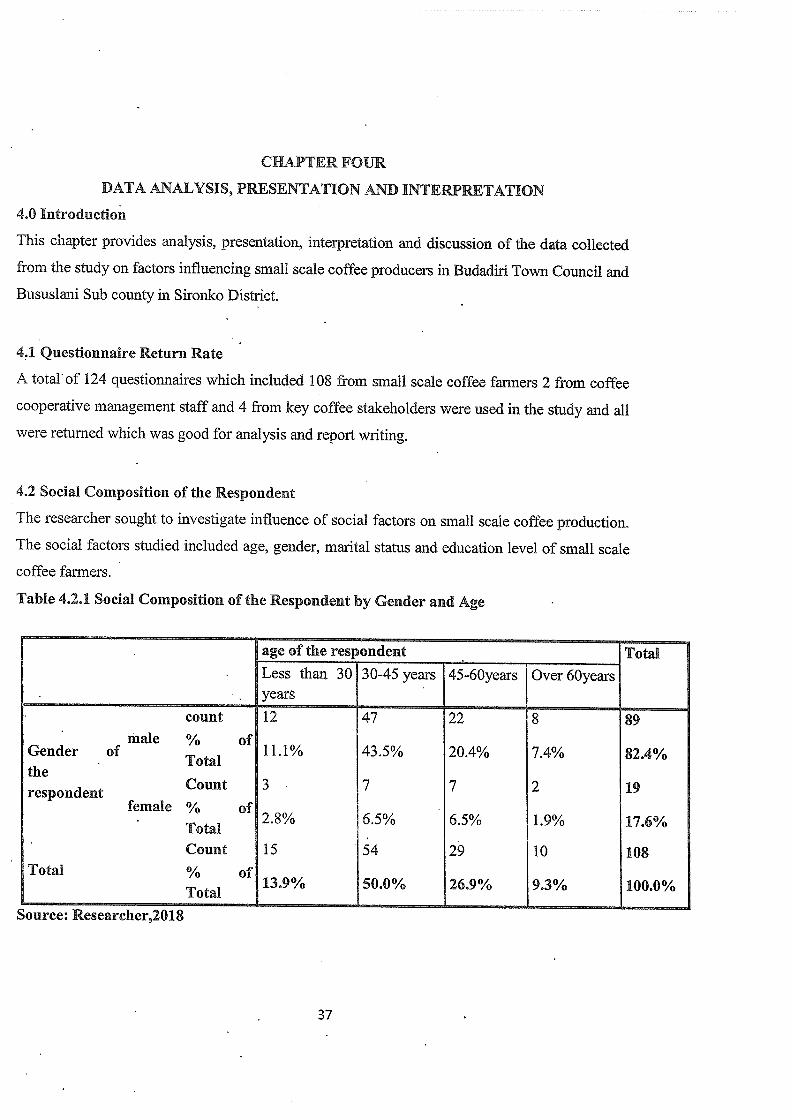
CHAPTER FOUR
DATA ANALYSIS, PRESENTATION AND INTERPRETATION
4.0 Introduction
This .chapter provides analysis, presentation, interpretation and discussion of the data collected
from the study on factors influencing small scale coffee producers in Budadiri Town Council and
Bususlani Sub county in Sironko District,
4.1 Questionnaire Return Rate
A total’of 124 questionnaires which included 108 from small scale coffee farmers 2 from coffee
cooperative management staff and 4 from key coffee stakeholders were used in the study and all
were returned which was good for analysis and report writing.
4.2 Social Composition of the Respondent
The researcher sought to investigate influence of social factors on small scale coffee production.
The social factors studied included age, gender, marital status and education level of small scale
coffee farmers.
Table 4.2.1 Social Composition of the Respondent by Gender and Age
. age of the respondent Total. Less than 30 30-45 years 45-60years Over 60years
. years
count 12 47 22 8 89‘ male % of 43.5% 20.4% 7.4% 82.4%
Gender of 11 1Total
theCount 3 7 7 2 19respondent
female % of 2.8% 6.5% 6.5% 1.9% 17.6%Total
~ Count 15 54 29 10 108Total % of 13.9% 50.0% 26.9% 9.3% 100.0%
TotalSource: Researcher,2018
37
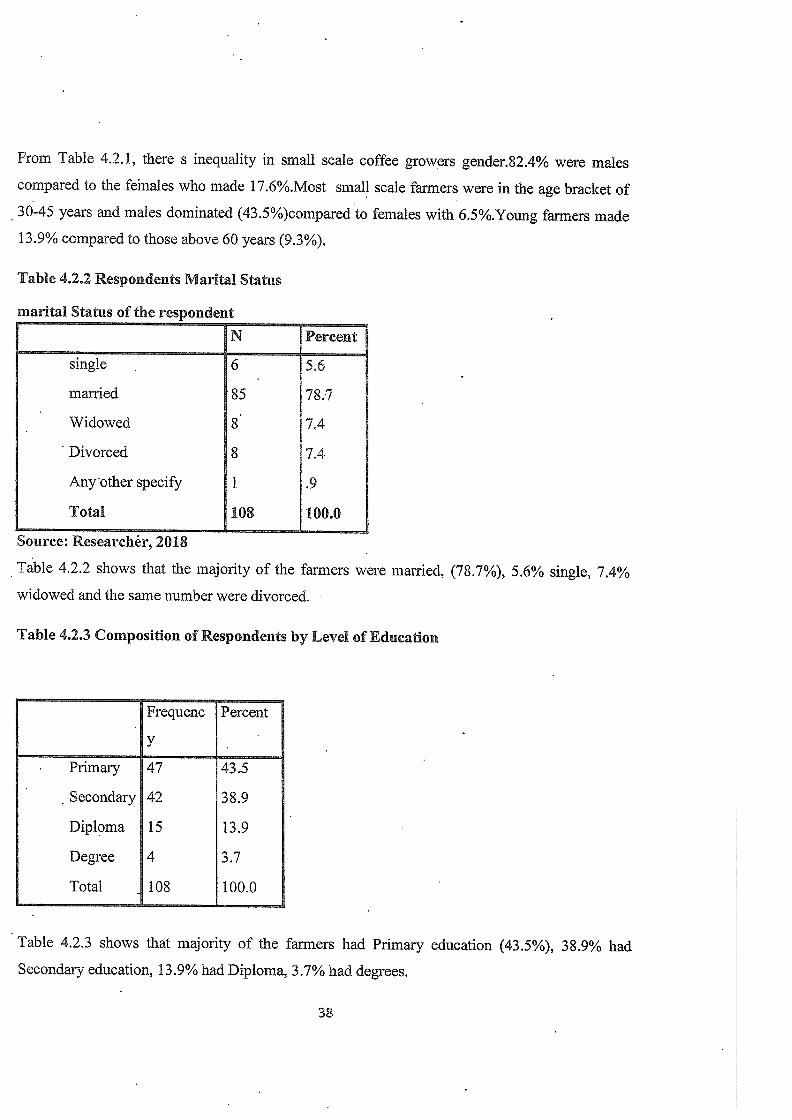
From Table 4.2.1, there s inequality in small scale coffee growers gender.82.4% were males
compared to the fehiales who made 1 7.6%.Most small scale farmers were in the age bracket of
30-45 years and males dominated (43.5%)compared to females with 6.5%.Young farmers made
13.9% compared to those above 60 years (9.3%).
Table 4.2,2 Respondents Marital Status
marital Status of the respondent
N Percent
single 6 5.6
married 85 78J7
Widowed 8 7,4
• Divorced 8 7.4
Any other specify 1 .9
Total 108 100.0
Source: Researcher, 2018
Table 4.2.2 shows that the majority of the farmers were married, (78.7%), 5.6% single, 7.4%
widowed and the same number were divorced.
Table 4.2.3 Composition of Respondents by Level of Education
• Frequenc Percent
y
• Primary 47 43.5Secondary 42 38.9
Diploma 15 13.9
Degree 4 3.7
Total 108 100.0
Table 4.2.3 shows that majority of the farmers had Primary education (43.5%), 38.9% had
Secondary education, 13.9% had Diploma, 3.7% had degrees.
38
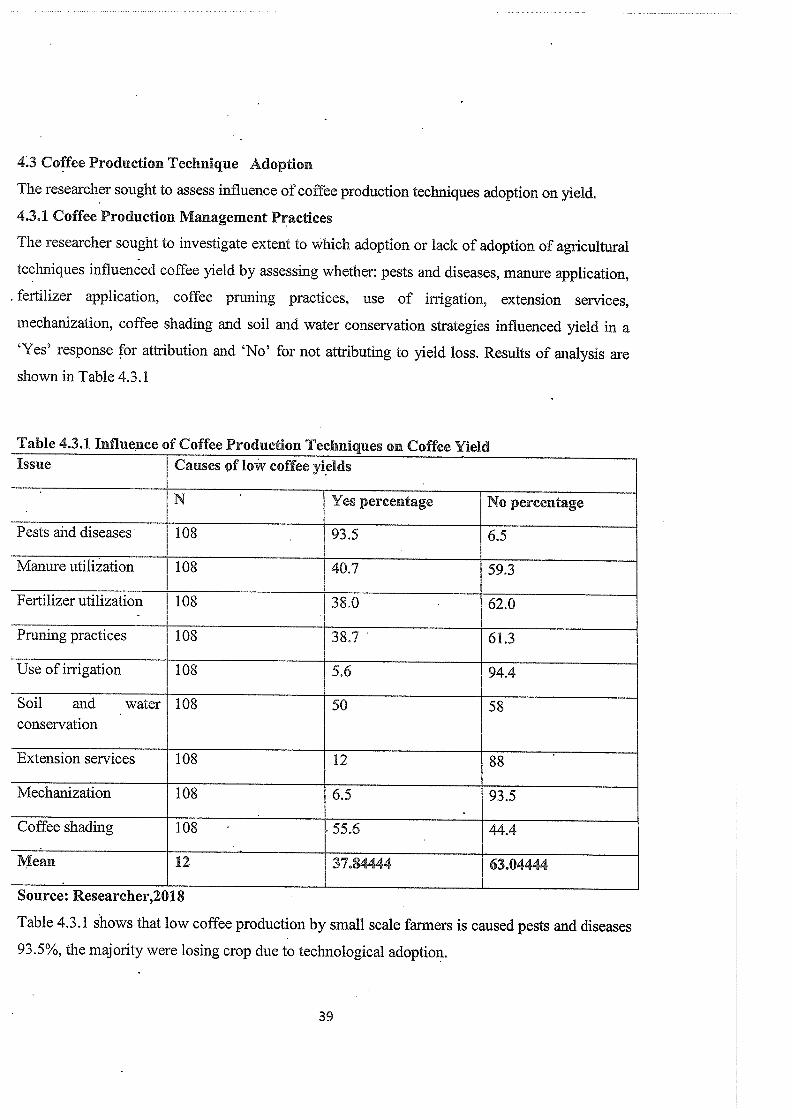
4.3 Coffee Production Technique Adoption
The researcher sought to assess influence of coffee production techniques adoption on yield.
4.3.1 Coffee Production Management Practices
The researcher sought to investigate extent to which adoption or lack of adoption of agricultural
techniques influenced coffee yield by assessing whether: pests and diseases, manure application,
fertilizer application, coffee pruning practices, use of irrigation, extension services,
mechanization, coffee shading and soil and water conservation strategies influenced yield in a
‘Yes’ response for attribution and ‘No’ for not attributing to yield loss. Results of analysis are
shown in Table 4.3.1
Table 4.3.1 Influence of Coffee Production Techniques on Coffee YieldIssue Causes ~f low coffee yields
, N Yes percentage No percentage
Pests and diseases 108 93.5 6.5
Manure utilization 108 40.7 59,3
Fertilizer utilization 108 38.0 62.0
Pruning practices 108 38.7 61.3
Use of irrigation 108 5.6 94.4
Soil and water 108 50 58conservation
Extension services 108 12 88
Mechanization 108 6.5 93.5
Coffee shading 108 55.6 44.4
Mean 12 37.84444 63.04444
Source: Researcher,2018
Table 4.3.1 shows that low coffee production by small scale farmers is caused pests and diseases
93.5%, the majority were losing crop due to technological adoption.
39
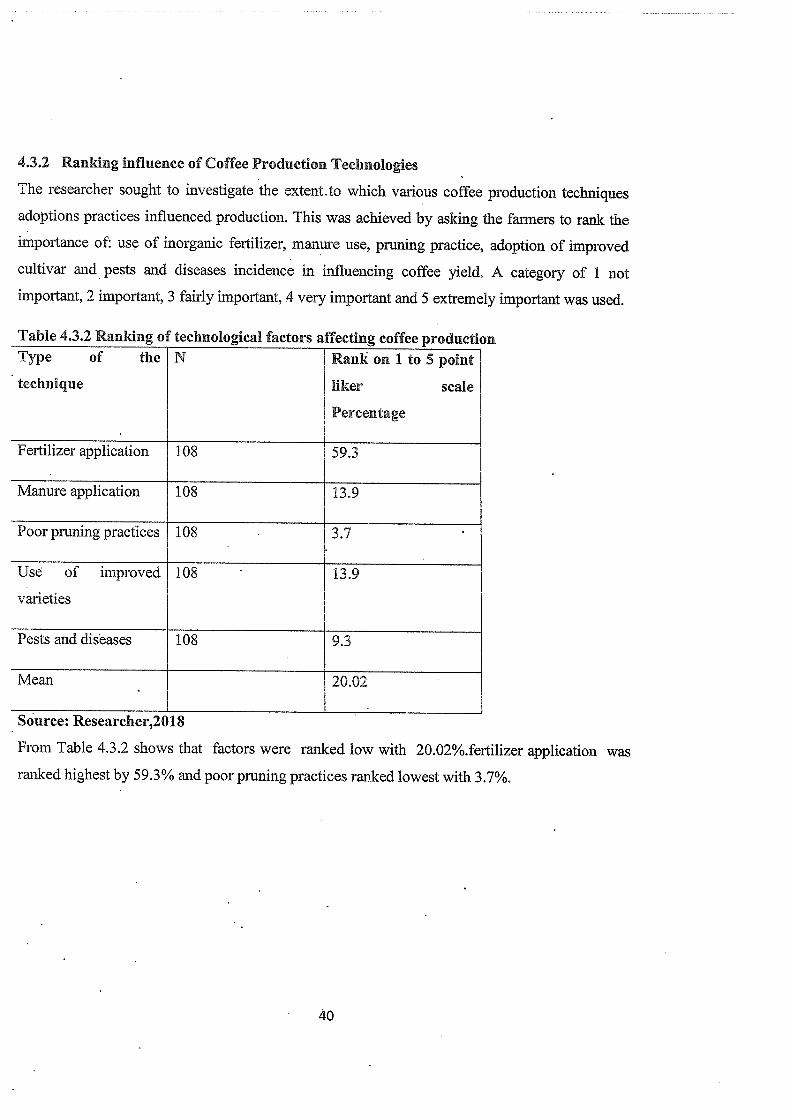
4.3.2 Ranking influence of Coffee Production Technologies
The researcher sought to investigate the extent.to which various coffee production techniques
adoptions practices influenced production. This was achieved by asking the farmers to rank the
importance of: use of inorganic fertilizer, manure use, pruning practice, adoption of improved
cultivar and pests and diseases incidence in influencing coffee yield. A category of 1 not
important, 2 important, 3 fairly important, 4 very important and 5 extremely important was used.
Type of the N Rank on 1 to 5 point
~ technique liker scale
Percentage
Fertilizer application 108 59.3
Manure application 108 13,9
Poor pruning practices 108 3.7
Us~ of improved 108 13.9
varieties
Pests and diseases 108 9.3
Mean 20.02
Source: Researcher,201 8
From Table 4.3.2 shows that factors were ranked low with 20.02%.fertilizer application was
ranked highest by 59.3% and poor pruning practices ranked lowest with 3.7%.
Table 4.3.2 Ranking of technological factors affecting coffee production
40
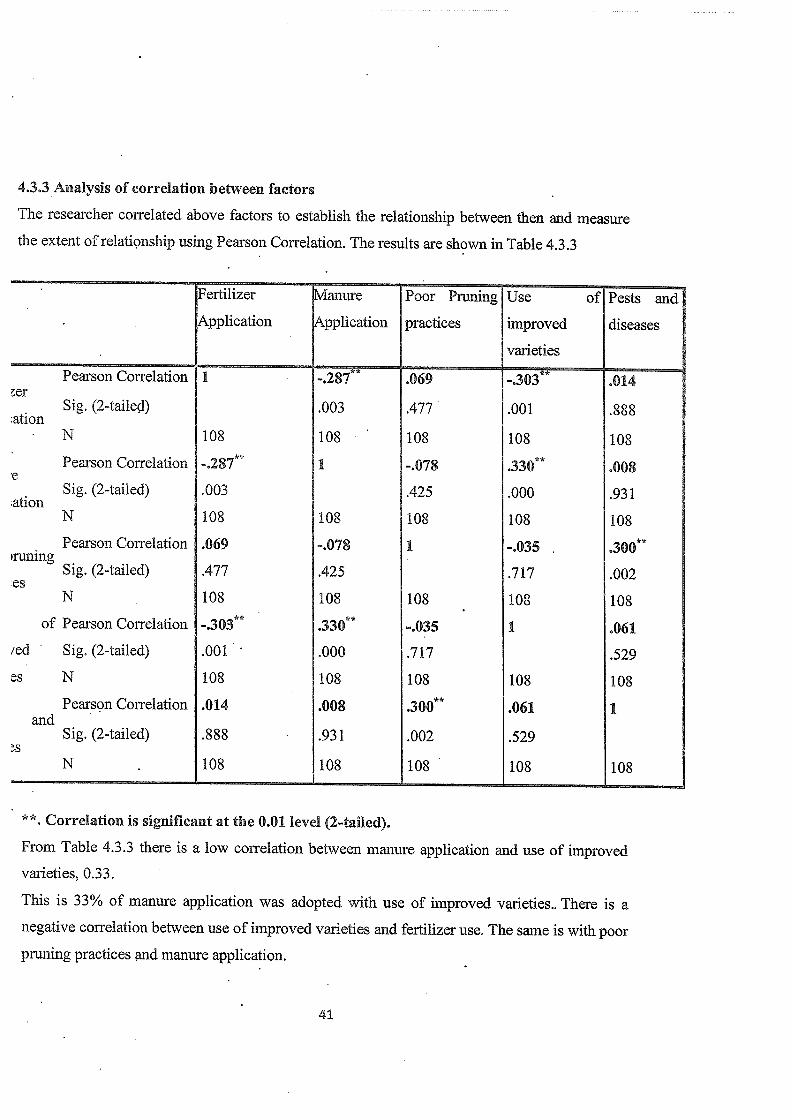
4.3.3 Analysis of correlation between factors
The researcher correlated above factors to establish the relationship between then and measure
the extent of relationship using Pearson Correlation. The results are shown in Table 4.3.3
~ertilizer ~4anure Poor Pruning Use of Pests and
. ~pplication ~pplication practices improved diseases
~ varieties
Pearson Correlation 1 ~,287** .069 .014~er
Sig. (2-tailed) .003 .477 .001 .888ation
• N 108 108 108 108 108
Pearson Correlation ~,287** 1 -.078 ,330** .008e
Sig. (2-tailed) .003 .425 .000 .931ation
N 108 108 108 108 108
Pearson Correlation .069 -.078 1 -.035 . ,300**~runing
Sig. (2-tailed) .477 .425 .717 .002es
N 108 108 108 108 108
of Pearson Correlation ,330** -.035 1 .061
ied Sig. (2-tailed) .001 .000 .717 .529
es N 108 108 108 108 108
Pearson Correlation .014 .008 ,300** .061 1and
Sig. (2-tailed) .888 .931 .002 .529~s
N . 108 108 108 108 108
**~ Correlation is significant at the 0,01 level (2-tailed).
From Table 4.3.3 there is a low correlation between manure application and use of improved
varieties, 0.33.
This is 33% of manure application was adopted with use of improved varieties.. There is a
negative correlation between use of improved varieties and fertilizer use. The same is with poor
pruning practices and manure application.
41
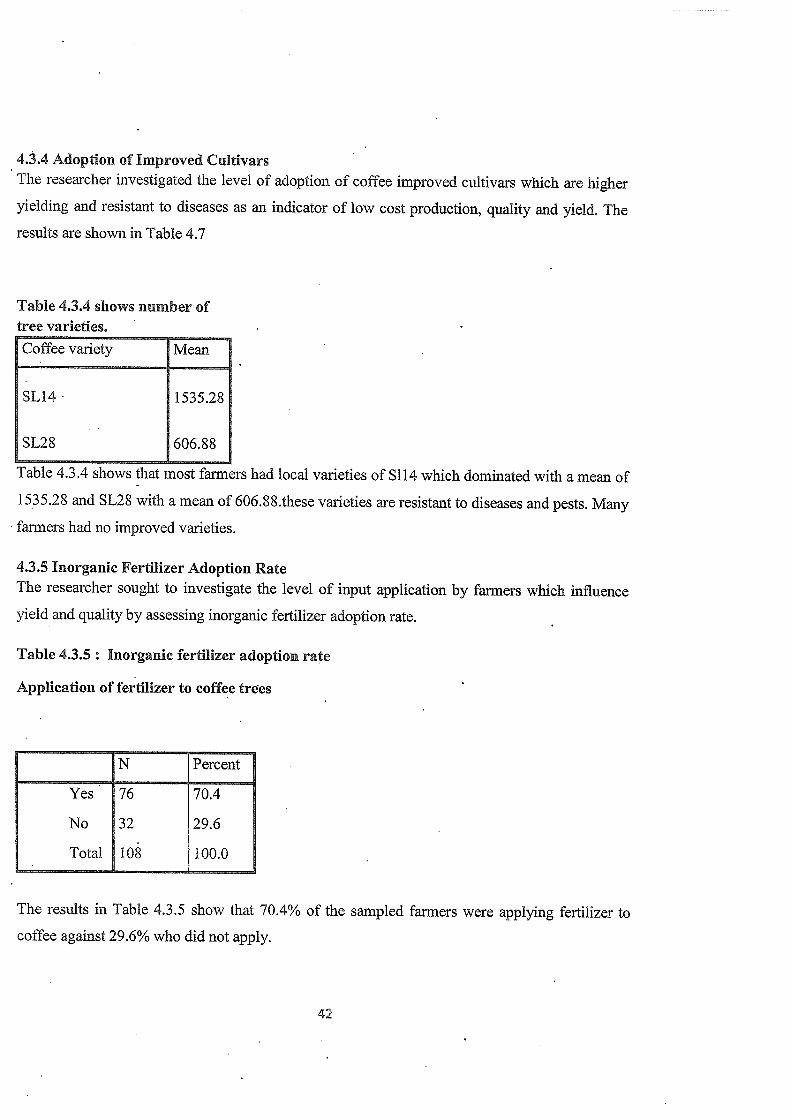
4.~.4 Adoption of Improved CultivarsThe researcher investigated the level of adoption of coffee improved cultivars which are higher
yielding and resistant to diseases as an indicator of low cost production, quality and yield. The
results are shown in Table 4.7
Table 4.3.4 shows number oftree varieties,Coffee variety Mean
SL14 1535.28
SL28 606.88
Table 4.3.4 shows that most farmers had local varieties of Sl14 which dominated with a mean of
1535.28 and SL28 with a mean of 606.88.these varieties are resistant to diseases and pests. Many
farmers had no improved varieties.
4.3.5 Inorganic Fertilizer Adoption RateThe researcher sought to investigate the level of input application by farmers which influence
yield and quality by assessing inorganic fertilizer adoption rate.
Table 4.3.5: Inorganic fertilizer adoption rate
Application of fertilizer to coffee trees
• N Percent
Yes 76 70.4
No 32 29.6
Total 108 100.0
The results in Table 4.3.5 show that 70.4% of the sampled farmers were applying fertilizer to
coffee against 29.6% who did not apply.
42
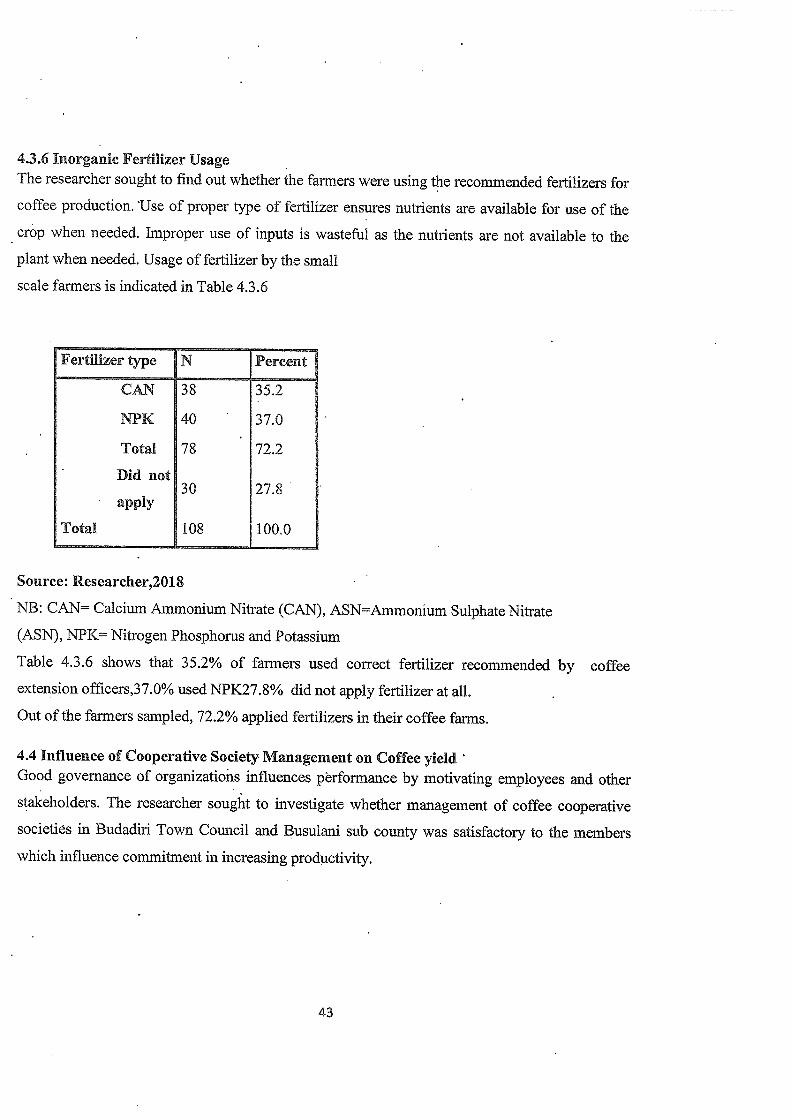
4.16 Inorganic Fertilizer UsageThe researcher sought to find out whether the farmers were using the recommended fertilizers for
coffee production. ‘Use of proper type of fertilizer ensures nutrients are available for use of the
crop when needed. Improper use of inputs is wasteful as the nutrients are not available to the
plant when needed. Usage of fertilizer by the small
scale farmers is indicated in Table 4.3.6
Fertilizer type N Percent
CAN 38 35.2
NPK 40 37.0
Total 78 72.2
~ Did not30 27.8
~ apply
Total 108 100.0
Source: Researcher,2018
NB: CAN~ Calcium Ammonium Nitrate (CAN), ASN=Ammonium Sulphate Nitrate
(ASN), NPK= Nitrogen Phosphorus and Potassium
Table 4.3.6 shows that 3 5.2% of farmers used correct fertilizer recommended by coffee
extension officers,37.0% used NPK27.8% did not apply fertilizer at all.
Out of the farmers sampled, 72.2% applied fertilizers in their coffee farms,
4.4 Influence of Cooperative Society Management on Coffee yield’Good governance of organizations influences performance by motivating employees and other
stakeholders. The researcher sought to investigate whether management of coffee cooperative
societies in Budadiri Town Council and Busulani sub county was satisfactory to the members
which influence commitment in increasing productivity.
43
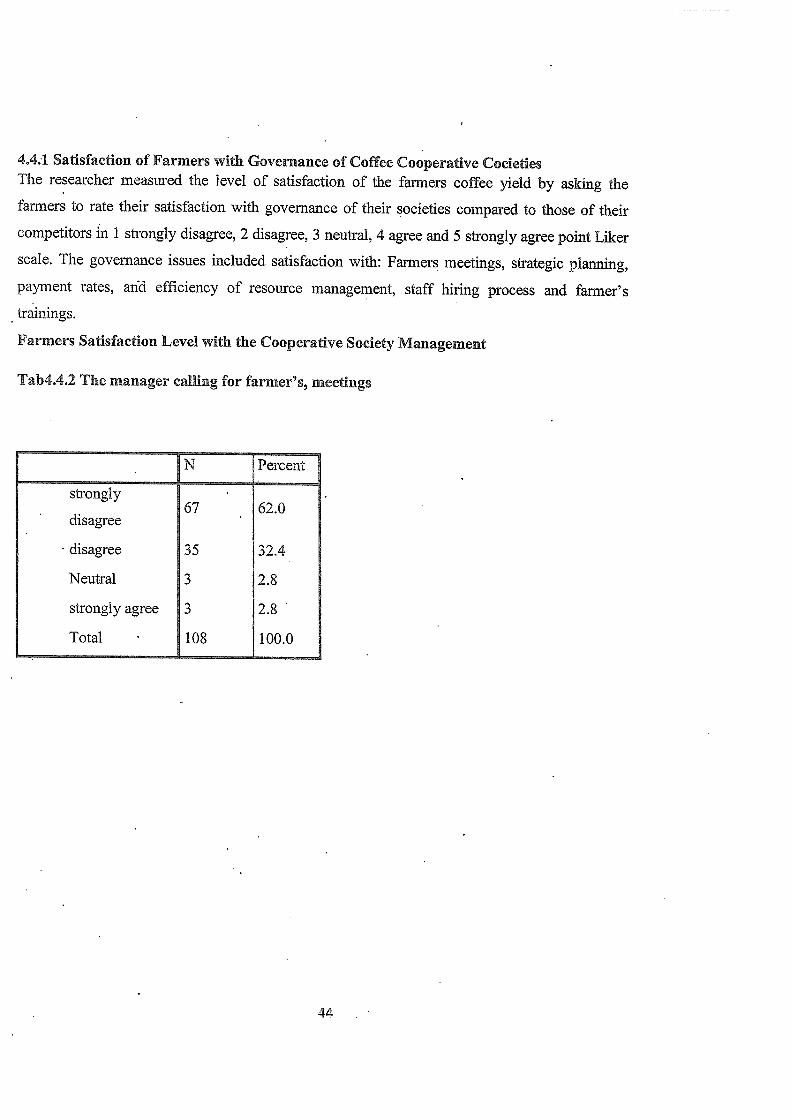
4.4;1 Satisfaction of Farmers with Governance of Coffee Cooperative CocietiesThe researcher measured the level of satisfaction of the farmers coffee yield by asking the
farmers to rate their satisfaction with governance of their societies compared to those of their
competitors in 1 strongly disagree, 2 disagree, 3 neutral, 4 agree and 5 strongly agree point Liker
scale. The governance issues included satisfaction with: Farmers meetings, strategic planning,
payment rates, and efficiency of resource management, staff hiring process and farmer’s
trainings.
Farmers Satisfaction Level with the Cooperative Society Management
Tab4.4.2 The manager caffing for farmer’s, meetings
• N Percent
strongly67 62.0
• disagree
~ disagree 35 32.4
Neutral 3 2.8
strongly agree 3 2.8
Total 108 100.0
44
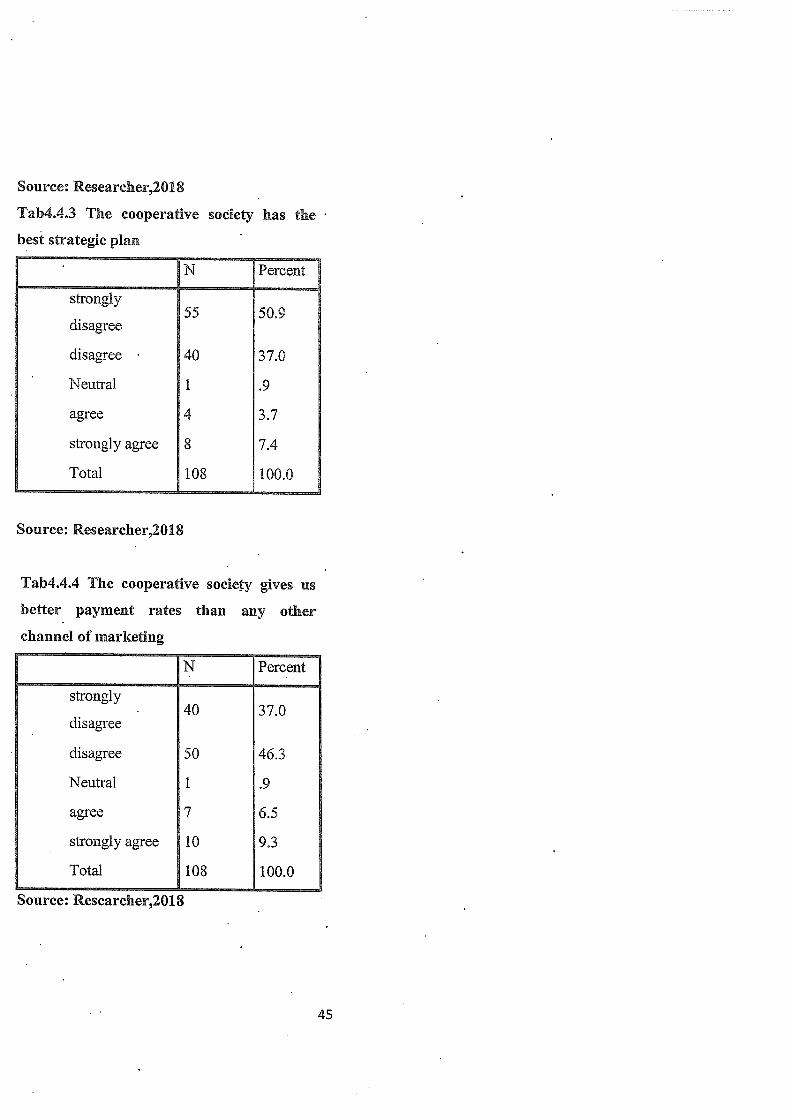
Source: Researcher,2018
Tab4.4,3 The cooperative
best strategic plan
Source: Researcher,2018
Tab4.4.4 The cooperative society gives us
better payment rates than any other
channel of marketing
N Percent
strongly~ 40 37.0
disagree
disagree 50 46.3
Neutral 1 .9
agree 7 6.5
strongly agree 10 9.3
Total 108 100.0Source: Researcher,2018
society has the
N Percent
strongly55 50.9
disagree
disagree 40 37.0
• Neutral 1 .9
agree 4 3.7
strongly agree 8 7.4
Total 108 100.0
45
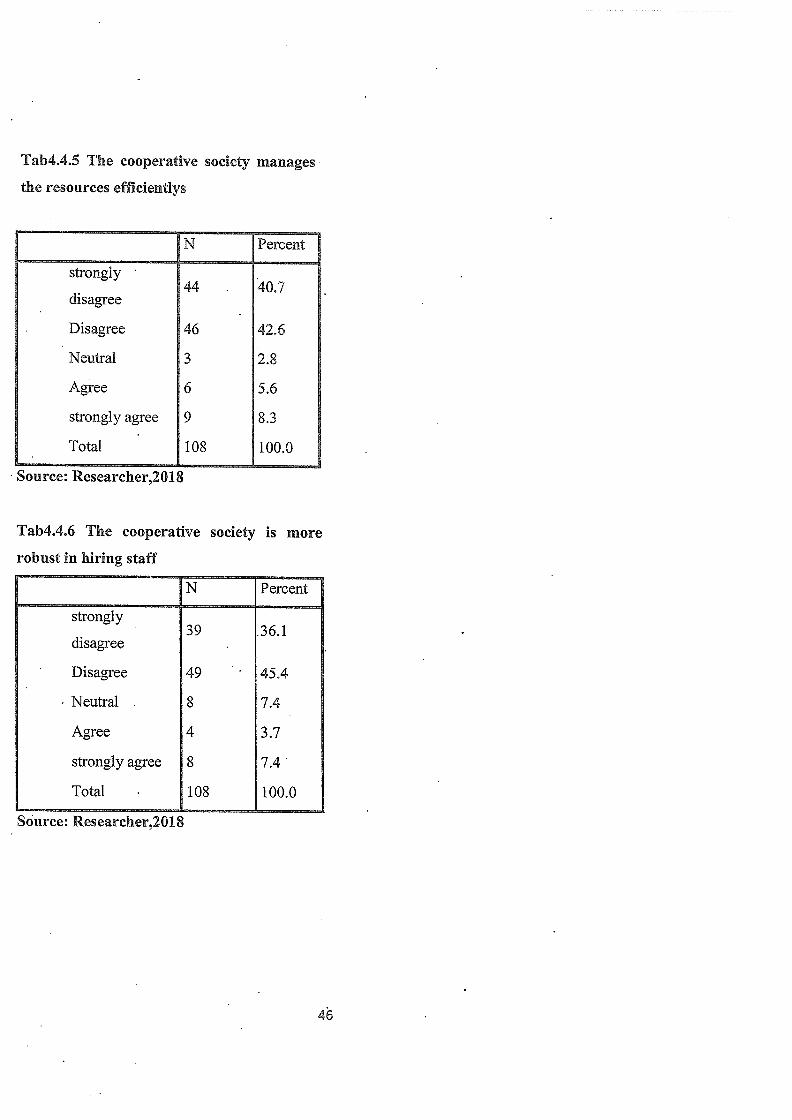
Tab4.4.5 The cooperative
the resources efficientlys
society manages
N Percent
strongly44 40.7
~ disagree
Disagree 46 42.6
Neutral 3 2.8
Agree 6 5.6
strongly agree 9 8.3
• Total 108 100.0
• Source: Researcher,2018
Tab4.4.6 The cooperative society is more
robust in hiring staff
N Percent
strongly~ 39 .36.1
disagree
‘ Disagree 49 45.4
. Neutral 8 7.4
Agree 4 3.7
strongly agree 8 7.4•
Total 108 100.0
Source: Researcher,2018
46
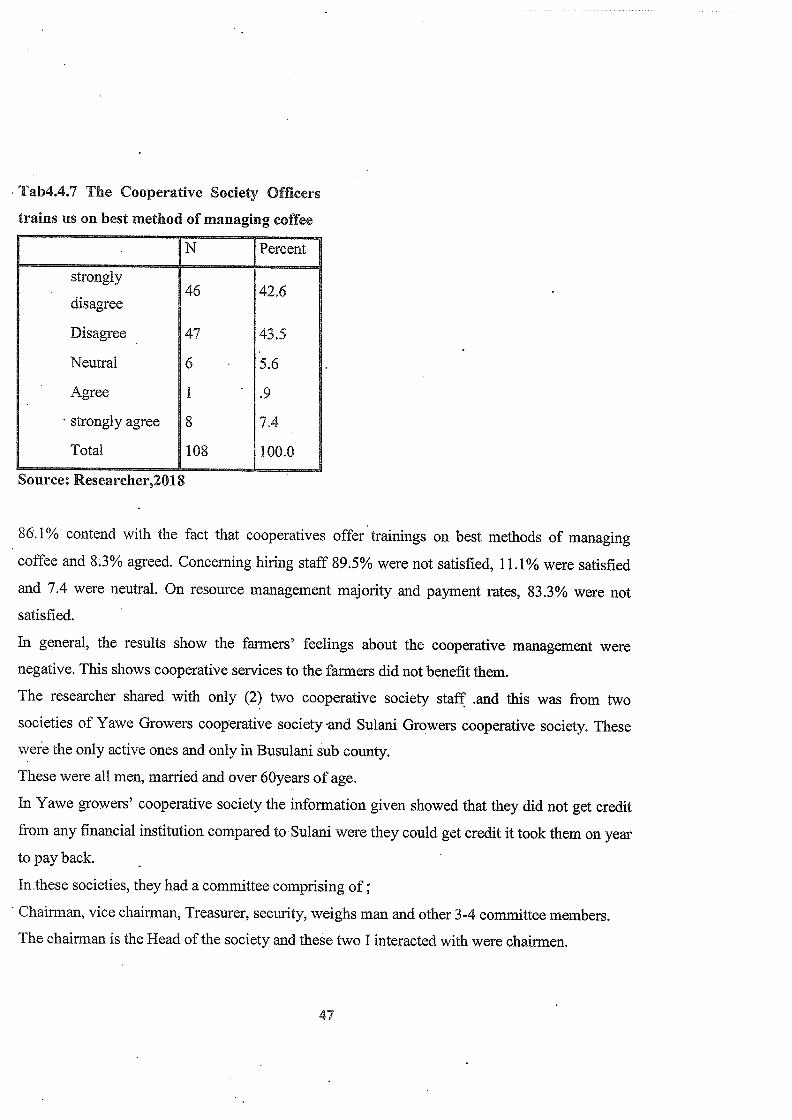
Tab4,4,7 The Cooperative Society Officers
trains us on best method of managing coffee
N Percent
strongly46 42.6
disagree
Disagree 47 43.5
Neutral 6 5.6
• Agree 1 .9
strongly agree 8 7.4
Total 108 100.0
Source: Researcher,2018
86.1% contend with the fact that cooperatives offer trainings on best methods of managing
coffee and 8.3% agreed. Concerning hiring staff 89.5% were not satisfied, 11.1% were satisfied
and 7.4 were neutral. On resource management majority and payment rates, 83.3% were not
satisfied.
In general, the results show the farmers’ feelings about the cooperative management were
negative. This shows cooperative services to the farmers did not benefit them.
The researcher shared with only (2) two cooperative society staff .and this was from two
societies of Yawe Growers cooperative society and Sulani Growers cooperative society. These
were the only active ones and only in Busulani sub county.
These were all men, married and over 60years of age.
In Yawe growers’ cooperative society the information given showed that they did not get credit
from any financial institution compared to Sulani were they could get credit it took them on year
to pay back.
In these societies, they had a committee comprising of;
Chairman, vice chairman, Treasurer, security, weighs man and other 3-4 committee members.
The chairman is the Head of the society and these two I interacted with were chairmen.
47
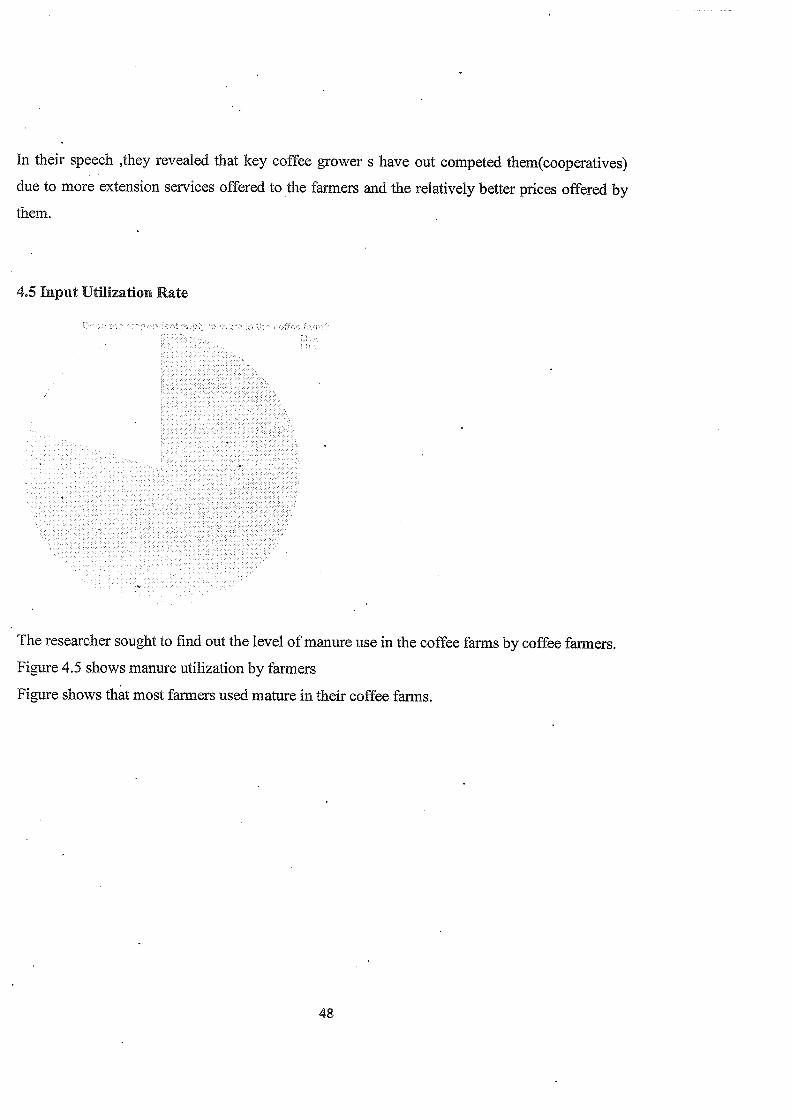
In their speech ,they revealed that key coffee grower s have out competed them(cooperatives)
due to more extension services offered to the farmers and the relatively better prices offered by
them.
4.5 Input Utilization Rate
The researcher sought to find out the level of manure use in the coffee farms by coffee farmers.
Figure 4.5 shows manure utilization by farmers
Figure shows that most farmers used mature in their coffee farms.
48
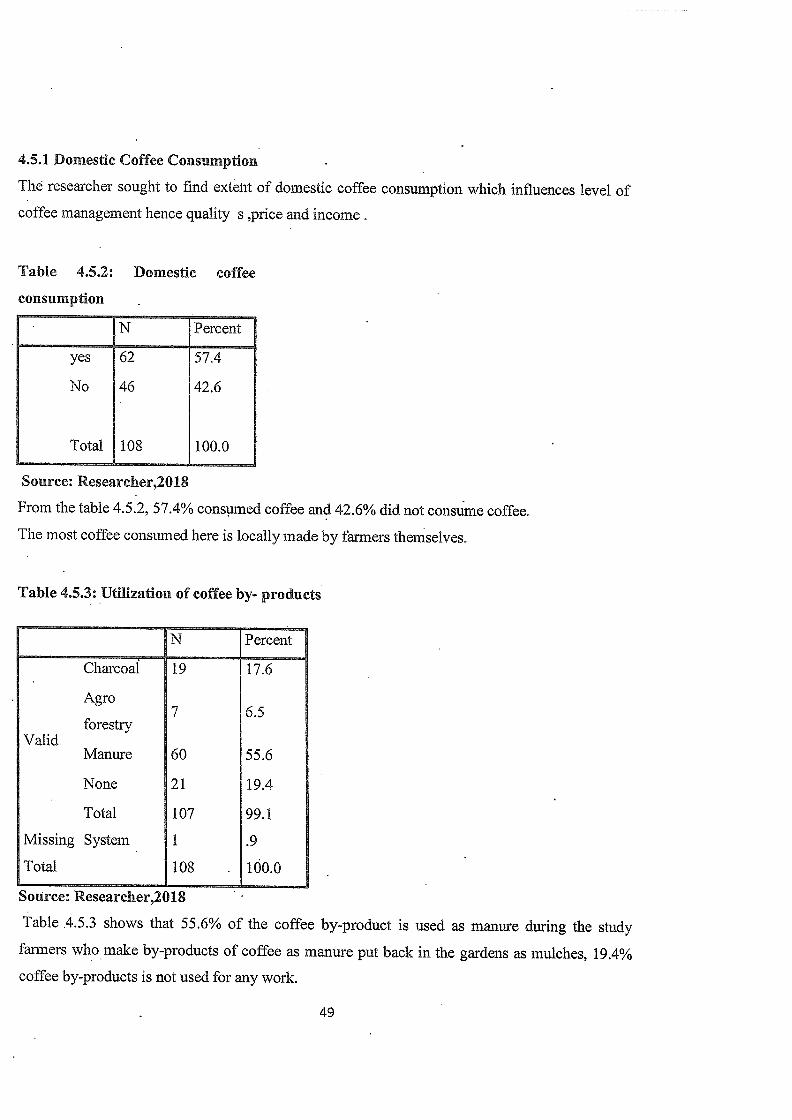
4.5.1 Domestic Coffee Consumption
Th~ researcher sought to find extent of domestic coffee consumption which influences level of
coffee management hence quality s ,price and income.
Table 4.5.2: Domestic coffee
consumption
N Percent
yes 62 57.4
No 46 42.6
Total 108 100.0
Source: Researcher,2018
From the table 4.5.2, 57.4% consumed coffee and 42.6% did not consume coffee.
The most coffee consumed here is locally made by farmers themselves.
Table 4,5.3: Utifization of coffee by- products
N Percent
Charcoal 19 17.6
Agro7 6.5
forestryValid
Manure 60 55.6
None 21 19.4
Total 107 99.1
Missing System 1 .9
Total 108 100.0
Source: Researcher,2018
Table .4.5.3 shows that 55.6% of the coffee by-product is used as manure during the study
farmers who make by-products of coffee as manure put back in the gardens as mulches, 19.4%
coffee by-products is not used for any work.
49
CHAPTER FWE
SUMMARY OF FINDINGS, DISCUSSION, CONCLUSIONS AND
RECOMMENDATIONS
5.1 Introduction
This chapter presents a summary of the key fmdings, a comparative discussion and conclusions
based on research~ findings. The chapter ends with recommendations for coffee revival, policy
action and further research,
5,2 Discussion
This section presents discussion of findings on factors affecting coffee production in Budairi
Town Council and Busulani Sub County. They include; influence of social factors, agricultural
techniques adoption, and management of coffee cooperative societies.
5.2.1 Influence of Social Factors
The study established that coffee farming in Budadiri Town Council and Bususlani Sub County
In sironko district.was a male dominated enterprise with 82.4%male ownership against 17.6%
women. Age of majority of farm~ers (50%) ranged between 30 to 45years. Majority, (78.7%) of
coffee farmers were married peopl~. There was a very low correlation between level of education
and yield of coffee by small scale farmers.
This disagrees with Akudugu et al, (2012) findings that technology adoption was higher with
maximum education level within a household. These findings also agree with Alcudugu et al
(2012) that at both young and advanced age farmers were finanëially constrained to invest in
high cost technology.
The study contradicts Akudugu et al (2012) fmdings that gender of farmer influence technology
adoption hence production but agrees with Doss and Morris (2001) and
Overfield and Flemimg (2001) findings that gender insignificantly influence technology adoption
hence production.
50
5.2.2 Influence of Agricultural Technique Adoption
The second objective of the study was to assess the influence of coffee production Techniques on
yield. The study established that 37.84% of respondent attributed low yield to techniques
production techniques adopted. The study further established that 63.04% of the respondents did
not attribute production techniques adopted to be a cause of low coffee yields.
According to the study pests and diseases (93.5%) attributed much tb the low coffee yields by
small farmers in this area of study..
In addition they disclosed that poor pnming practices as also a cause of low coffee yields in their
farms of coffee. They added that proper pruning methods clears weeds and other clipping plants
that grow on coffee trees, branches are cleared and given enough light to bear the cherries after
flowering.
The study agrees with both Kegonde, (2005), Karanja and Nyoro (2002) findings that low coffee
yield is due to low technology adoption. Both authors attributes low technology adoption to high
cost of inputs, poor infrastructure.
5.2.3 Influence of Cooperative Society Management
The third objective of the study was to establish the influence of coffee cooperative societies
management influence on small scale coffee production, The study e~stablished that small scale
coffee farmers had by 86.1% contended with the fact that cooperatives offer trainings on best
methods of managing coffee, Concerning hiring staff 89.5% were not satisfied, On resource
management and payment rates majority, 83.3% were not satisfied.
With the fmdings out of the study, there was no much influence of the cooperative management
on the production of coffee by small scale farmers in these two sub counties in Sironko
district,This comes with the fact that many coffee key prayers have out competed the societies.
for example Olam (U) LTD, Kyagalanyi , Nasaaga Investments. These buy from farmers and
they have extended services to almost every coffee grower willing to partner with them.
51
5.2.4 Influence of Coffee Value Addition
The fourth objective of the study was to examine the influence of coffee value addition on small
scale coffee production. The study established that there was consumption of 57.6% of coffee by
the coffee farmers .Those who did not consume coffee attributed it to coffee not being available
and not affording it. Some claimed they prefer other beverages. The study also established there
was low adoption of irrigation by 5.6% and Mechanization adoption was 6.5%,
5.3 Conclusions
The conclusions made from the study are given below:
1. The study revealed that education level of the farmers was not correlated with productivity of
coffee per tree. This was seen when a farmer with a primary certificate produces more coffee
than those with diploma.
2. Low yield was due to low utilization of inputs, poor agronomic practices and high incidences
of pests and diseases. High pests and diseases irrespective of high adoption of fertilizer were due
to underutilization:
3. ~Farmers were less satisfied with roles of cooperative society management
5.4 Recommendations
The following recommendations were made from the study;
1. The National Government needs to develop law on minimum education requirement for
farmers just like any other career academic skills requirement. This will ensure increased output
as the better educated farmers are able to understand technology ~md apply them and also
promote education
2. The Ministry of Agriculture should promote adoption of improved cultivars which are more
yieldin~ than the traditional varieties and pests and diseases resistant. This will improve yield
and quality and make the enterprise more profitable. This could be achieved by putting up
factory managed nurseries.
3. Government should increase manpower by hiring more agricultural extension workers and
agronomists. It must also revive Coffee cooperative societies and should introduce a capacity
building programme in which farmers are taken through seminars on good coffee agricultural
practices. In turn, the graduates should become trainers of their colleagues on best practices.
52
4. To ~nsure high return for the produce the county Government comes up with farm input
subsidy programme and also ensures the inputs are supplied to farmers timely. This will be
through improving of transport and communication infrastructure. To ensure proper utilization of
inputs, the ministry of Agriculture staff should sensitize farmers through trainings. To ensure
adherence to the standard the factory management should put up surveillance systems on crop
management
5. The cooperative societies need invest in mechanization of operations to ensure efficiency and
also put improve factory infrastructure like dying tables and automation of services.
5~6 Suggestions for Further Research
The following are suggested areas for further research
1. The study looked at influenceof social factors affecting coffee production in Budadiri Town
Council and Busulani Sub County but did not look at economic factors, Another study on
itifluence of economic factors on coffee production in the same area need to be done. Secondly,
2. A study to ascertain the economic factors influencing adoption of improved coffee cultivars
need to be done. Thirdly,
3. A study to ascertain influence of soil PH on coffee yield need to be done in various coffee
growing zones in order to come up with coffee fertilizer recommendation for farmers.
53
REFERENCES
Akudugu AL Guo E. and Dadzie & (2012). Adoption of Modern agricultural Production
Technology by Farm Households in Ghana. Journal of Biology, Agriculture and
Healthcare
Best, J. W and James, V (2004). Research in Education (7th Edition): Prentice hail, New Delhi.
India
Bibangamba, JR. (1989). Managing Rural Development in Uganda: Uganda Cooperative
Alliance Development Papers.
Caswell, M, Fuglie, K, Ingram, C., Jans S. and Kascak C. (2001).Adoption of Agricultural
prod~iction practices: Lessons learnedfrom the US. Department ofAgriculture Area
Studies Project. US Department of Agriculture, Resource Economics Division,
Economic Research Service, Agriculture Economic Report No. 792. Washington DC
Chege J (2012). A Case Study of Institution Building and Value Chain Strengthening to Link
Ethiopian Cooperative~ Coffee Producers to
FAQ 2004. The State ofAgricultural Commodity Markets. FAQ, Rome
FAQ (2004). Post harvest handling andprocessing ofCoffee in African countries:
Federation Development Republic of Ethiopia (FDRE 2005). A Plan for Accelerated and
Sustainable Development to End Poverty, Addis Ababa, Ethiopia
FNC (2008) Informacion Económica Cafetera. Estadisticas Históricas
Gemech, F. and Struthers, J (2007). Coffee Price Volatility in Ethiopia: Effects of Market
Reform Programmes. Published online 4 May 2007 in Wiley Inter Science~ Journal of
International Development. UK.
Giovannucci, Daniel. (2002). Colombia: Coffee Sector Study. Document of the World Bank
Latin American and Caribbean Regicinal Qffice
Hartwich, F. and Scheidegger, U (2010). Fostering Innovation Networks: the missing piece in
rural development? Rural Development News 1 (2010).
54
Hussi, P., Murphy I, Lindberg 0. and Brenneman L. (1993). The Development ofCooperatives
and Other Rural Organizations: The Role of the World Bank World Bank
Washington, D.C.
ICO (1997). Coffee price determination and volatility. Internationul Coffee Organisation.
London,Uk
ICO, (2004). Total Production of Exporting Countries International trade Centre. Coffee: An
Exporter’s Guide. London, Uk
ICO, (2013) (http://www.ico.org/trade_c.asp) retrived on 6/01/2014
IFAD (2003). The adoption of Organic Agriculture amongst Small Farmers in Latin America
and the Caribbean: Thematic Evaluation. IFAD Report no.1337 Cooperatives and
Other Rural Organizations, Agriculture and Rural Development Series, No. 8,
Washington, D.C., World Bank
MINICOFIN Report (2003). Poverty Reduction Strategies Draft Report, MINICOFJIV Rwanda.
Ntahontuye F. (2008). Factors affecting the adoption ofcoffee growing in Rwanda: A case study
ofRubavu District, Higher Institute ofAgriculture and Ahimal Husbandiy, Busoga,
Rwanda pesticide use in the Philippines. MS. Thesis, Virginia Polytechnic Institute
and State University, Virginia
UNCTAD (1999). Sustainability in the Coffee Sector: Exploring Opportunities for International
Cooperation: A Background Document for Brainstorming Uganda Coffee
development Authority Uganda bureau ofStatistics
Sironko District Local Government planning unit
Sironko District Local Government production Unit
Multi - Strata Agroforestiy Systems with Perennial Crops. Bib. Orton IICA / CA TIE. pp. 34—.
GGKEY:EXRAQNAQUX4. Retrieved 12 May 2013. “Venezuela,1992; the 5th
centenaiy of Evangelization in Venezuela, Scott 1604d”. Manresa-sj organization.
Retrieved 12 May 20 The Society 1895, p. 832,
55

“Peru: Coffee Annual” (pdJ,~.I. USDA Foreign Agricultural Service. Retrieved 7 June 2015.
“Peru: Coffee, green, yield (hectogram per hectare)’~ Fac~fIsh.com. Retrieved 7June 2015.
56
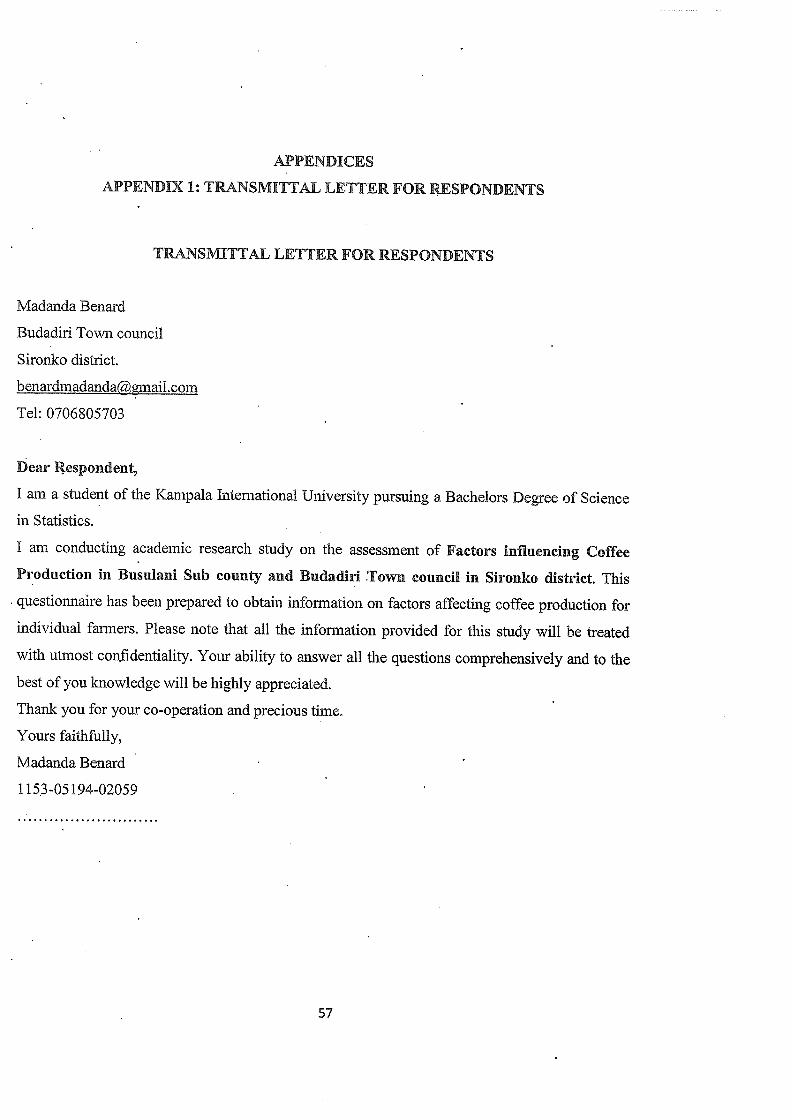
APPENDICES
APPENDIX 1: TRANSMITTAL LE11~ER FOR RESPONDENTS
TRANSMITTAL LETEER FOR RESPONDENTS
Madanda Benard
Budadiri Town council
Sironko district.
Tel: 0706805703
Dear I~espondent,
I am a student of the Kampala International University pursuing a Bachelors Degree of Science
in Statistics,
I am conducting academic research study on the assessment of Factors influencing Coffee
Production in Busulani Sub county and Budadiri Town council in Sironko district, This
questionnaire has been prepared to obtain information on factors affecting coffee production for
individual farmers. Please note that all the information provided for this study will be treated
with utmost confidentiality. Your ability to answer all the questions comprehensively and to the
best of you knowledge will be highly appreciated.
Thank you for your co-operation and precious time.
Yours faithfully,
Madanda Benard
1153-05194-02059
57
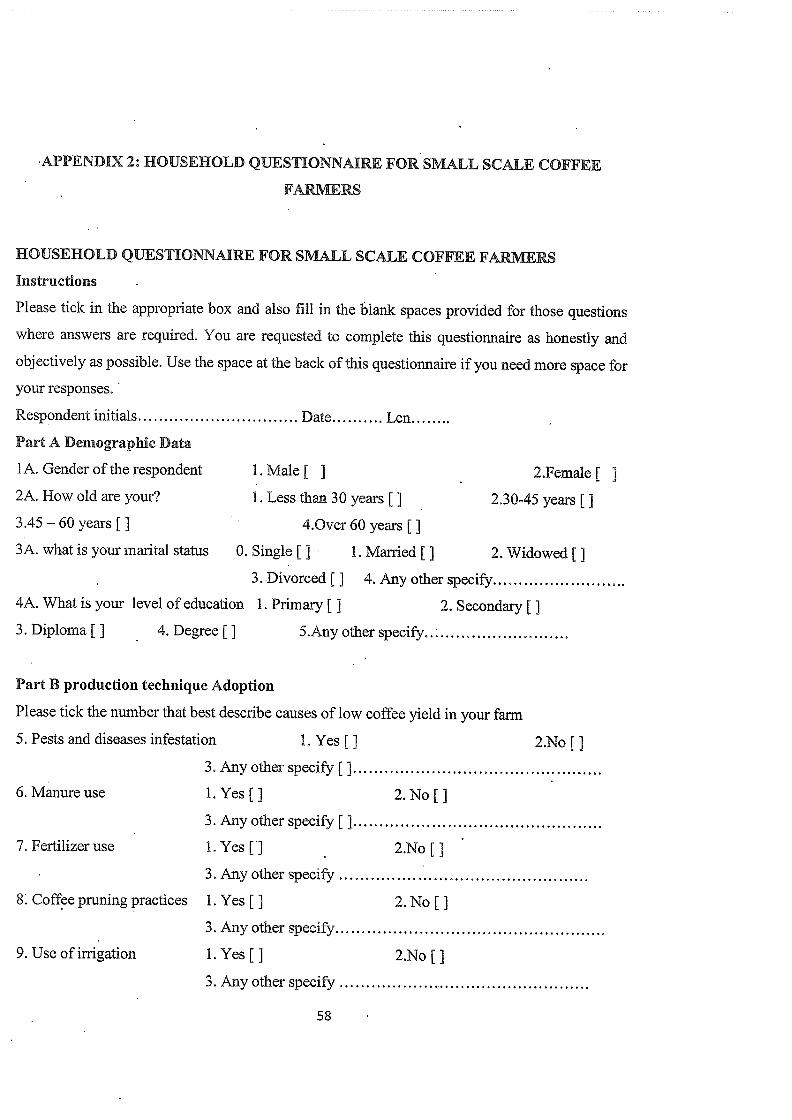
APPENDIX 2: HOUSEHOLD QUESTIONNAIRE FOR SMALL SCALE COFFEE
FARMERS
2.Female [ j
2.30-45 years [1
2. Widowed []
Part B production technique Adoption
Please tick the number that best describe causes of low coffee yield in your farm
5. Pests and diseases infestation 1. Yes {] 2.No [J3, Any other specify [11.Yes{] 2.No[j
3. Any other specify [ ]1.Yes[] 2.No[]
3. Any other specify
1.Yes[] 2.No[j
3. Any other specify
1.Yes[j 2.No[]
3. Any other specify
58
HOUSEHOLD QUESTIONNAIRE FOR SMALL SCALE COFFEE FARMERS
Instructions
Please tick in the appropriate box and also fill in the blank spaces provided for those questions
where answers are required. You are requested to complete this questionnaire as honestly and
objectively as possible. Use the space at the back of this questionnaire if you need more space for
your responses,
Respondent initials Date Len
Part A Demographic Data
1 A. Gender of the respondent 1. Male [ ]2A. How old are your? 1. Less than 30 years []3.45 —60 years [] 4.Over 60 years [j
3A. what is your marital status 1. Married [14. Any other specify
2. Secondary [1
0. Single [13. Divorced [j
4A. What is your level of education 1. Primary [ j
3. Diploma [ j 4. Degree [] 5.Any other specify
6. Manure use
7. Fertilizer use
8 Coffee pruning practices
9. Use of irrigation
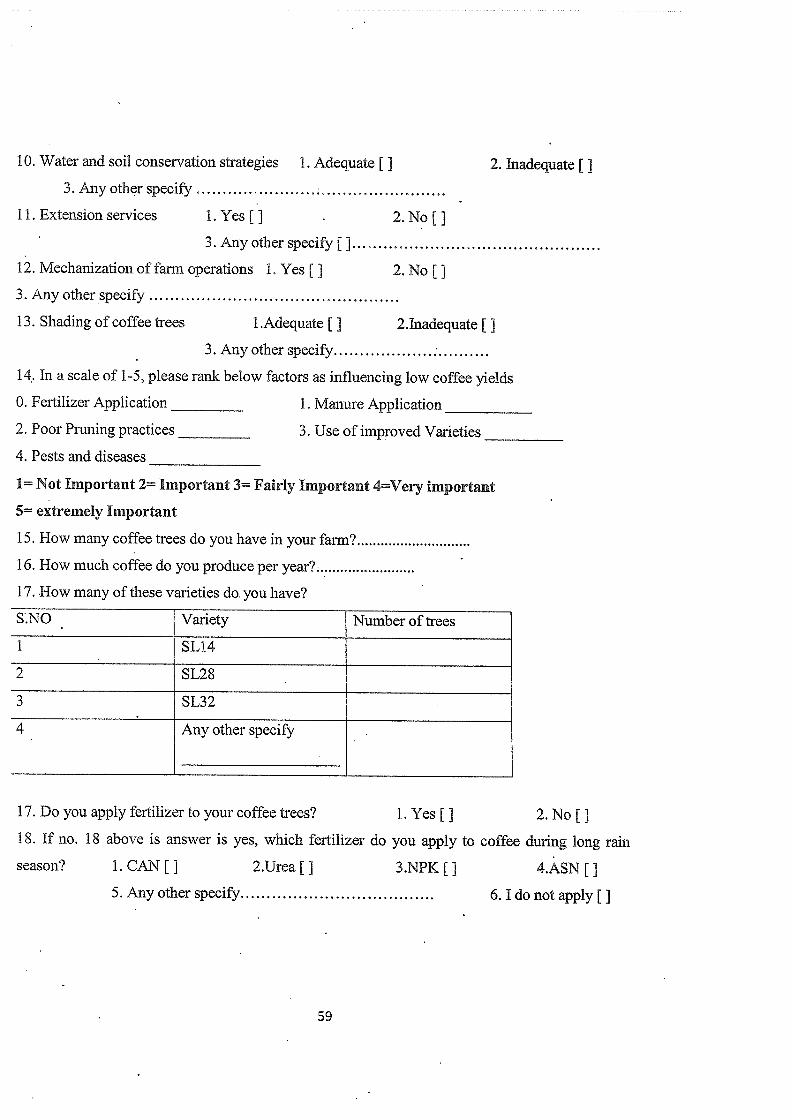
10. Water and soil conservation strategies 1. Adequate [] 2. Inadequate [1
3. Any other specify
11, Extension services 1. Yes [] 2. No []3. Any other specify [ ]
12. Mechanization of farm operations 1. Yes [] 2. No [j
3. Any other specify
13. Shading of coffee trees 1.Adequate [] 2Jnadequate []3. Any other specify
14. In a scale of 1-5, please rank below factors as influencing low coffee yields
0. Fertilizer Application _________ 1. Manure Application ___________
2. Poor Pruning practices _________ 3. Use of improved Varieties
4. Pests and diseases _______________
1= Not Important 2= Important 3= Fairly Important 4=Very important
5= extremely Important
15. How many coffee trees do you have in your farm9
16. How much coffee do you produce per year9
17. How many of these varieties do. you have?
S.NO Variety Number of trees
1 SL14
2 SL28
3 5L32
4 Any other specify
17. Do you apply fertilizer to your coffee trees? 1. Yes [j 2. No [j
18. If no. 18 above is answer is yes, which fertilizer do you apply to coffee during long rain
season? 1. CAN [j 2.Urea [] 3.NPK { j 4.ASN []5. Any other specify 6. I do not apply [ j
59
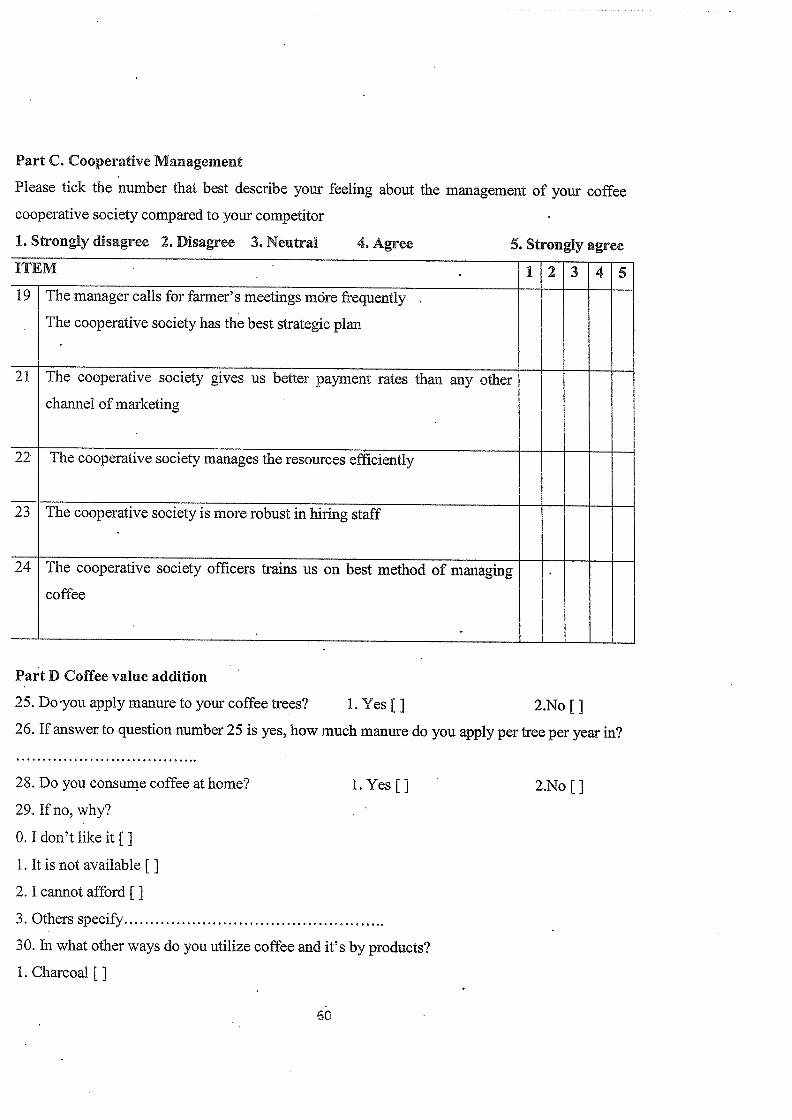
Part C. Cooperative Management
Please tick the number that best describe your feeling about the management of your coffee
cooperative society compared to your competitor
1. Strongly disagree 2. Disagree 3. Neutral 4. Agree 5, Strongly agree
ITEM . 12345
19 The manager calls for farmer’s meetings more frequently
• The cooperative society has the best strategic plan
21 The cooperative society gives us better payment rates than any other — — — — —
channel of marketing
22 The cooperative society manages the resources efficiently — — — — —
23 The cooperative society is more robust in hiring staff —
24 The cooperative society officers trains us on best method of managing — — — —
coffee
Part D Coffee value addition
25. Doyou apply manure to your coffee trees? 1. Yes [j 2,No [126. If answer to question number 25 is yes, how much manure do you apply per tree per year in?
28. Do you consume coffee at home? 1. Yes [129. If no, why?
0. I don’t like it [j
1. It is not available []2. I cannot afford [j
3. Others specify
30. In what other ways do you utilize coffee and it’s by products?
1. Charcoal [j
2.No[1
60

2. Agro forestry [ ]~3. Manure []4, None [15. Others specif~’
61
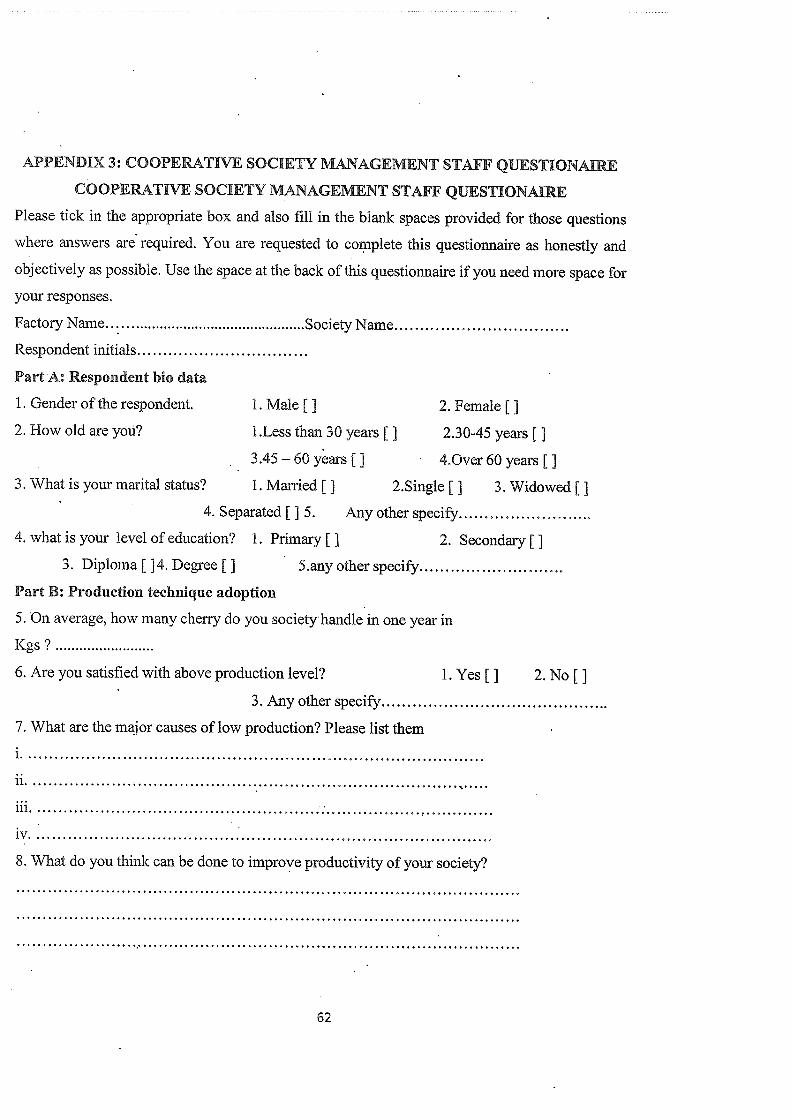
APPENDIX 3: COOPERATIVE SOCIETY MANAGEMENT STAFF QUESTIONAIRE
COOPERATIVE SOCIETY MANAGEMENT STAFF QUESTIONAIRE
Please tick in the appropriate box and also fill in the blank spaces provided for those questions
where answers are required. You are requested to complete this questionnaire as honestly and
objectively as possible. Use the space at the back of this questionnaire if you need more space for
your responses.
Factory Name Society Name .
Respondent initials
Part A: Respondent bio data
1. Gender of the respondent 1. Male [] 2. Female [j
2. How old are you? hess than 30 years [1 2.30-45 years []3.45—6oyears[] V 4.Over6oyears[j
3. What is your marital status? 1. Married [j 2.Single [] 3, Widowed []4. Separated [] 5. Any other specify
4. what is your level of education? 1. Primary [1 2. Secondary []3. Diploma [ ]4. Degree [] 5.any other specify
Part B: Production technique adoption
5. On average, how many cherry do you society handle in one year in
Kgs 7
6. Are you satisfied with above production level? 1. Yes [j 2. No [j
3. Any other specify
7. What are the major causes of low production? Please list them
1
ii ,~
111 .,
iv . .
8. What do you think can be done to improve productivity of your society?
62
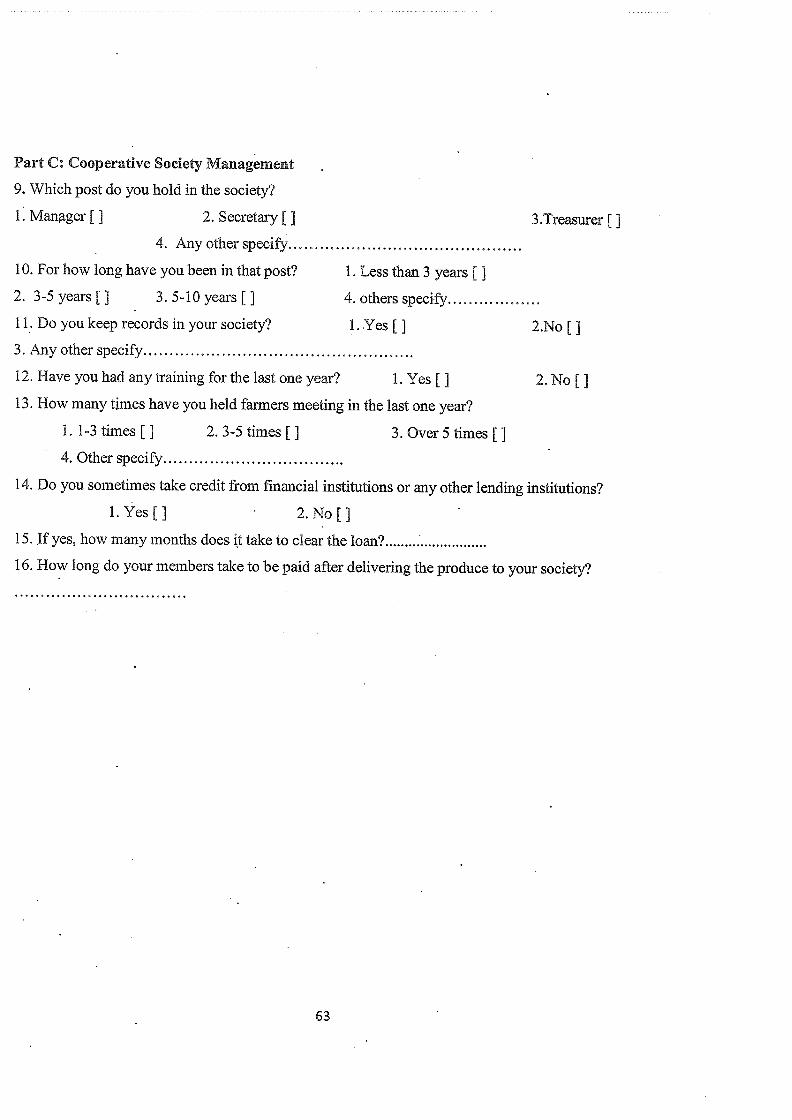
Part C: Cooperative Society Management
9. Which post do you hold in the Society?
1. Manager [1 2. Secretary [] 3 Treasurer [14. Any other specify
10. For how long have you been in that post? 1. Less than 3 years [12. 3-5 years [] 3. 5-10 years [] 4. others specify ... .
11. Do you keep records in your society? 1. Yes [] 2.No []3. Any other specify
12. Have you had any training for the last one year? 1. Yes [] 2. No [113. How many times have you held farmers meeting in the last one year?
1. 1-3 times [] 2.3-5 times [j 3. Over 5 times []4. Other specify
14. Do you sometimes take credit from financial institutions or any other lending institutions?
1.Yes[] 2.No[j
15. Jf yes, how many months does it take to clear the loan9
16. How long do your members take to be paid after delivering the produce to your society?
63
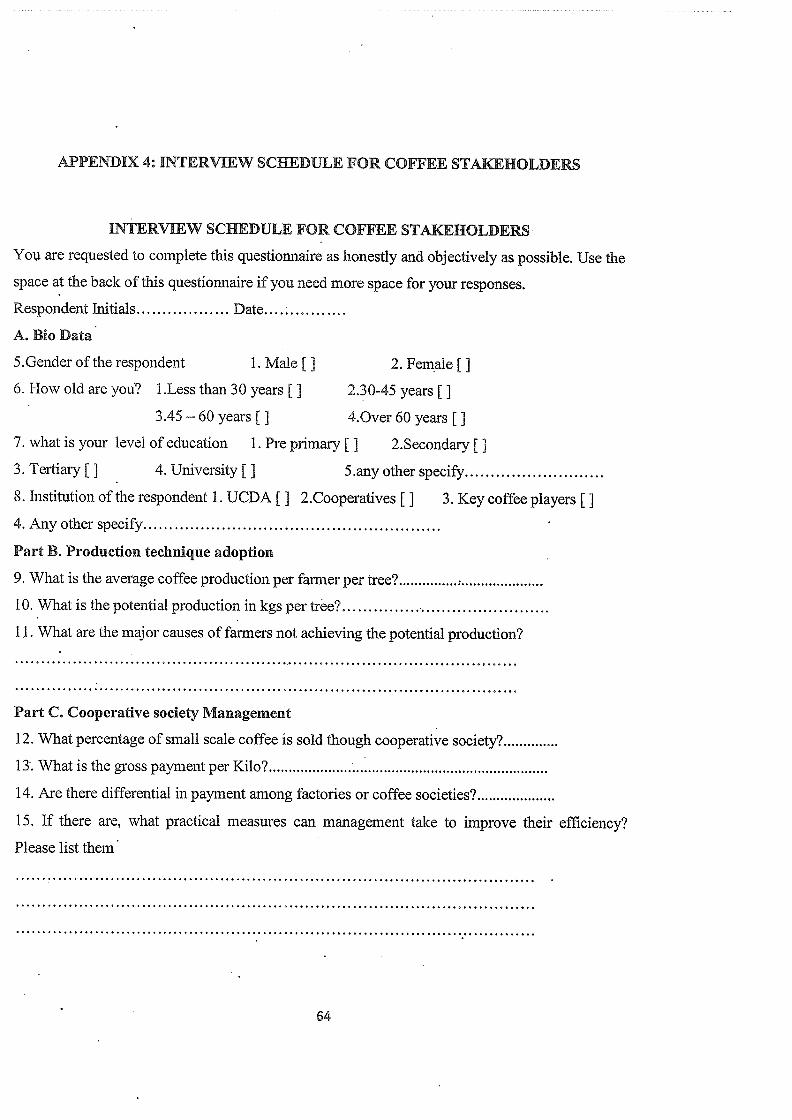
APPENDIX 4: INTERVIEW SCHEDULE FOR COFFEE STAKEHOLDERS
INTERVIEW SCHEDULE FOR COFFEE STAKEIIOLDERS
You are requested to complete this questionnaire as honestly and objectively as possible. Use the
space at the back of this questionnaire if you need more space for your responses.
Respondent Initials Date
A. Bio Data•
5 .Gender of the respondent 1. Male [] 2. Female [16. How old are you? 1.Less than 30 years [j 2.30-45 years [j
3.45—60 years { j 4.Over 60 years [j
7. what is your level of education 1. Pre primary [] 2.Secondary []3. Tertiary [] 4. University [] 5.any other specify
8. Institution of the respondent 1. UCDA [j 2.Cooperatives [j 3. Key coffee players []4. Any other specify
Part B. Production technique adoption
9. What is the average coffee production per farmer per tree9
10. What is the potential production in kgs per tree?
1.1. What are the major causes of farmers not achieving the potential production?
Part C. Cooperative society Management
12. What percentage of small scale coffee is sold though cooperative society9
13. What is the gross payment per Kilo~
14. Are there differential in payment among factories or coffee societies9
15. If there are, what practical measures can management take to improve their efficiency?
Please list them~
64
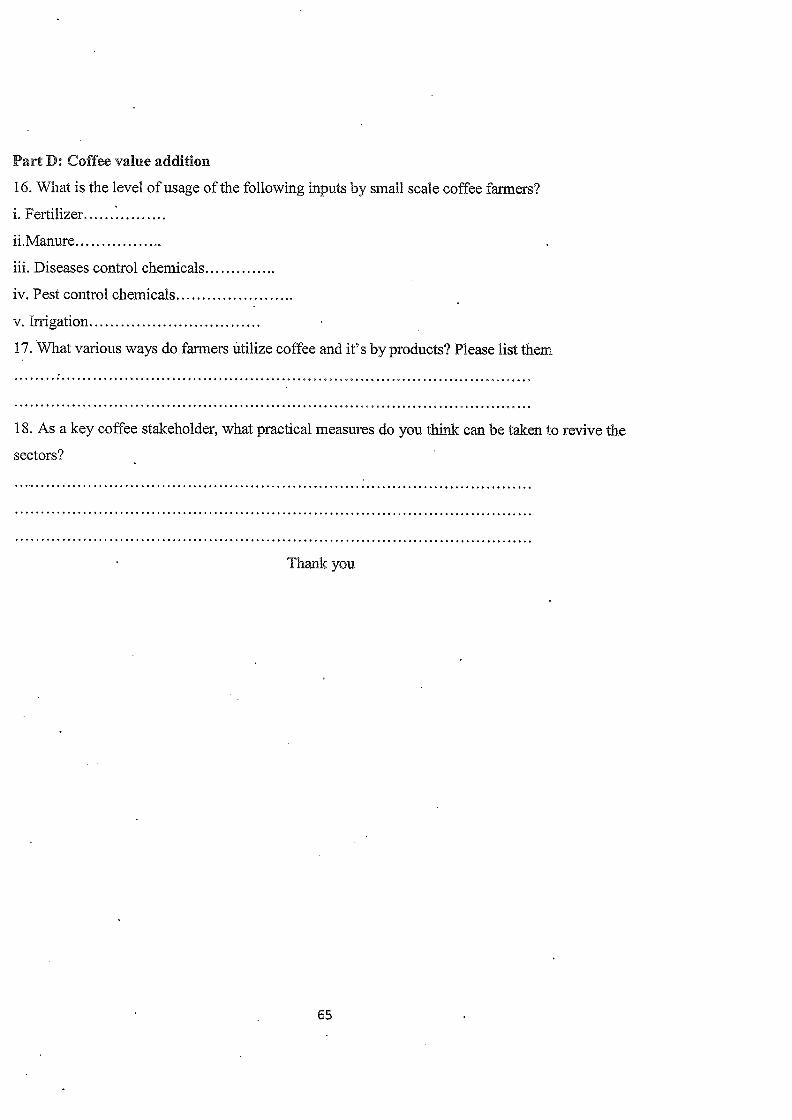
Part D: Coffee value addition
16. What is the level of usage of the following inputs by small scale coffee farmers?
i. Fertilizer.,....~...,...,..
ii,Manure
iii. Diseases control chemicals
iv. Pest control chemicals
v. Irrigation
17. What various ways do farmers utilize coffee and it’s by products? Please list them
18. As a key coffee stakeholder, what practical measures do you think can be taken to revive the
sectors?
Thank you
65
Copyright © 2022 FDOKUMEN