
Factors influencing season ticket - GUPEA
44
Bachelor's thesis, Marketing, Spring 2015 University of Gothenburg School of Business, Economics and Law The Department of Business Administration Authors: David Johnstone & Johan Nilsson Advisor: Martin Öberg Factors influencing season ticket- and non-season ticket holders' motivation to attend IFK Göteborg's games at Gamla Ullevi
-
Upload
khangminh22 -
Category
Documents
-
view
1 -
download
0
Transcript of Factors influencing season ticket - GUPEA

Bachelor's thesis, Marketing, Spring 2015
University of Gothenburg
School of Business, Economics and Law
The Department of Business Administration
Authors: David Johnstone & Johan Nilsson
Advisor: Martin Öberg
Factors influencing season ticket- and non-season ticket holders' motivation to attend IFK Göteborg's games at Gamla Ullevi
I
Abstract
________________________________________________________________________________________________________
IFK Göteborg wants to increase the number of spectators on match day. Attendance figures
experienced a drop over the previous season and when it comes to the pre-sales of season
tickets IFK Göteborg is outsold by all three major Stockholm-teams. To be able to create an
effective marketing strategy a key factor is to understand what motivate the spectators.
The purpose of this study was to describe why season ticket holders and non-season ticket
holders attend games at Gamla Ullevi, which factors have the greatest impact on game
attendance and investigate if differences between the groups exist. A survey was designed
based on The theory of personal investment (Maehr & Braskamp 1986) and spread through
various social media channels. A Likert-scale (1-7) was used to measure how different
items may have motivated the spectators to attend games at Gamla Ullevi this and/or last
season. Data was collected from 1103 valid respondents, 366 were season ticket holders
and 737 non-season ticket holders. The measure of central tendency for the data was
analyzed. Mann-Whitney U-test was used to test if there were any significant differences
between the groups. Finally, Spearman's Rho correlation coefficient was used between
motivational factors and numbers of games attended to find which factors had the greatest
impact on game attendance. Season ticket holders were motivated more strongly by a
greater number of items except from Varying external factors such as weather, hyped game,
time of day and opposing team which had more influence on the non-season ticket holders'
motivation. 7 out of 26 items were identified as identical between the two populations
when performing the Mann-Whitney U test. Several items correlated significantly with
number of games attended for both groups. Most important were items linked to Sense of
self (team identification) and Perceived options (e.g. watch live rather than on TV).
________________________________________________________________________________________________________
Key words: Attendance; Motivation; Sports Marketing; Season ticket; IFK Göteborg;
Football
II
Table of Contents Chapter 1 Introduction ....................................................................................................................................... 1
1.1 Introduction ................................................................................................................................................ 1
1.2 Problem Area .............................................................................................................................................. 2
1.3 Purpose and Research Questions ....................................................................................................... 3
1.4 Delimitations .............................................................................................................................................. 4
Chapter 2 Literature Review ............................................................................................................................ 5
2.1 What Makes People Attend Sporting Events? ................................................................................ 5
2.1.1 Motivation ........................................................................................................................................... 5
2.1.2 Fan motivation ................................................................................................................................... 5
2.1.3 The Theory of Personal Investment As Applied To Sports Spectating Decisions ... 7
2.2 Sports Marketing ....................................................................................................................................... 8
2.2.1 Product ................................................................................................................................................. 9
2.2.2 Place ....................................................................................................................................................... 9
2.2.3 Promotion ......................................................................................................................................... 10
2.2.4 Price .................................................................................................................................................... 10
2.3 Summary ................................................................................................................................................... 10
Chapter 3 Research Method ........................................................................................................................... 12
3.1 Research Method .................................................................................................................................... 12
3.2 Statistical Analysis ................................................................................................................................. 14
3.3 Factors ........................................................................................................................................................ 15
3.4 Pilot Study ................................................................................................................................................. 17
3.5 Data Gathering ........................................................................................................................................ 17
3.6 Model Problem Area and Delimitations ........................................................................................ 18
Chapter 4 Results ............................................................................................................................................... 19
III
4.1 Survey Turnout ....................................................................................................................................... 19
4.2 Measure of Central Tendency............................................................................................................ 20
4.3 Mann-Whitney U-test ........................................................................................................................... 22
4.4 Correlation ................................................................................................................................................ 24
Chapter 5 Analysis and Discussion ............................................................................................................. 27
5.1 Analysis and Discussion ...................................................................................................................... 27
5.2 Marketing Implications........................................................................................................................ 31
5.3 Conclusion ................................................................................................................................................ 32
5.4 Suggestions on Further Research .................................................................................................... 33
Chapter 6 References ........................................................................................................................................ 35
6.1 Literature .................................................................................................................................................. 35
6.2 Articles ....................................................................................................................................................... 36
6.3 Electronic Sources ................................................................................................................................. 38
1
Chapter 1 Introduction ________________________________________________________________________________________________________
In the first chapter of the essay we introduce IFK Göteborg, Allsvenskan and the role of the
spectator. The chapter presents the study's purpose and research questions, as well as the
delimitations associated with it.
________________________________________________________________________________________________________
1.1 Introduction
The game of football is one of passion, filled with history and tradition. For the devoted
supporter it can be a source of happiness and pride, gratifying and entertaining but just as
well cruel and unforgiving. By buying tickets and attending games the spectators
contribute to the club's revenue. The stadium is the arena in which the supporters gather to
watch and show their support for the team, and because the stadium is so connected to the
consumption of football it is also a part of the product itself (Ericsson & Persson 2013).
Therefore the spectator doesn’t only act as a consumer of the sport but also as a
contributor and a co-creator of the product as a whole.
IFK Göteborg is a football club competing in the Swedish highest division Allsvenskan.
During its century long existence the club has experienced domestic success being crowned
Swedish champions 18 times (IFK Göteborg 2015). The club has also experienced a fair
share of European glory having won the UEFA-cup twice as the first and only Swedish team
(UEFA 2015a). The team's home ground is Gamla Ullevi. The stadium was inaugurated in
time for the 2009 season of Allsvenskan and has a capacity of 18 416 seats (Got Event AB,
no date).
Allsvenskan is today ranked as the 24th best league by UEFA (UEFA 2015b). The leagues in
Belgium and Switzerland, ranked 9 and 10, have twice as high revenues (Olshov 2015). The
clubs in Allsvenskan will most likely have to double their income to reach a ranking around
15 (SvFF 2013a). A way to improve revenues is to get more people to attend the games.
People attending the games contribute to higher match day revenue not only through ticket
sales but through additional sales as well. To attend a game the spectator can either buy a
single ticket or hold a season ticket. Season ticket sales mean secured revenues for the club.
Season ticket sales may also work as a thermometer, a symbol for the interest in the team
and for the upcoming season.
2
1.2 Problem Area
Even though the team finished in second place 2014, attendance figures for IFK Göteborg's
matches experienced a drop over the previous season. The average number of attendance
for the home games was 10 739 (SvFF 2014b), which equals a decrease of 850 compared to
2013 (SvFF 2013b). Like all clubs IFK Göteborg wants to increase the number of spectators
on match day, and this year (2015) a goal to reach an average audience of 14 000 has been
set (Rosander 2015). A bold statement considering this represents an increase equivalent
to 30%.
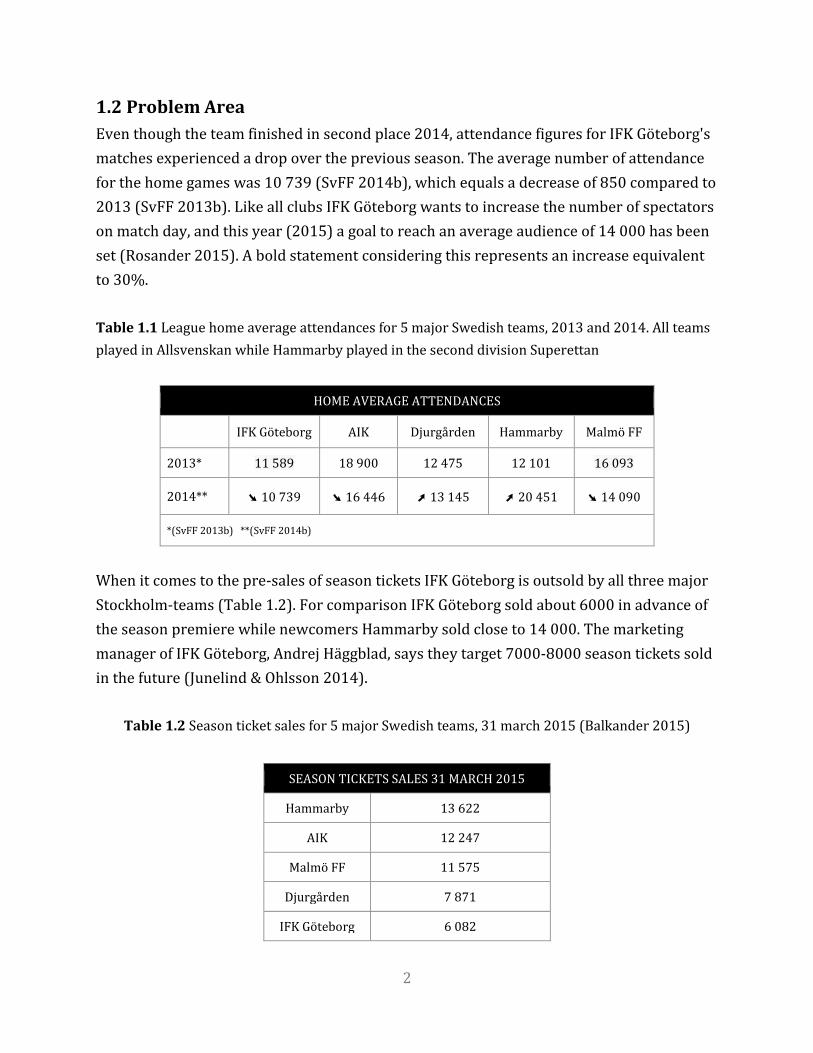
Table 1.1 League home average attendances for 5 major Swedish teams, 2013 and 2014. All teams
played in Allsvenskan while Hammarby played in the second division Superettan
HOME AVERAGE ATTENDANCES
IFK Göteborg AIK Djurgården Hammarby Malmö FF
2013* 11 589 18 900 12 475 12 101 16 093
2014** ➘ 10 739 ➘ 16 446 ➚ 13 145 ➚ 20 451 ➘ 14 090
*(SvFF 2013b) **(SvFF 2014b)
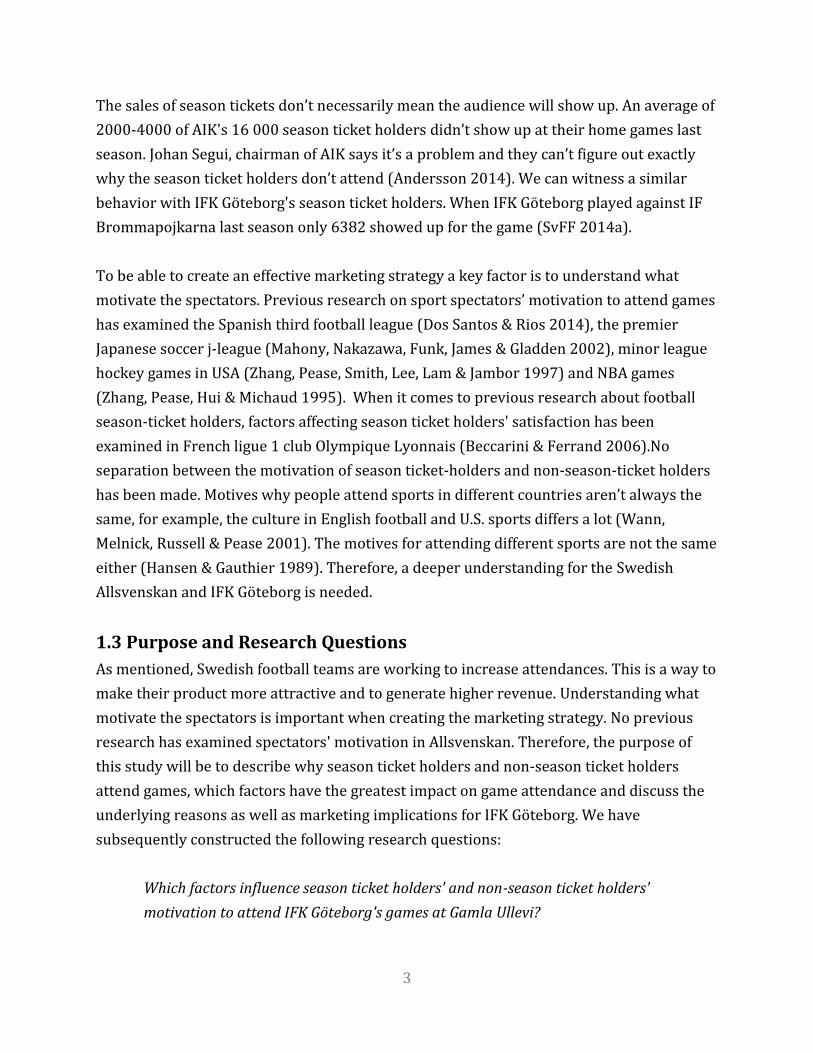
When it comes to the pre-sales of season tickets IFK Göteborg is outsold by all three major
Stockholm-teams (Table 1.2). For comparison IFK Göteborg sold about 6000 in advance of
the season premiere while newcomers Hammarby sold close to 14 000. The marketing
manager of IFK Göteborg, Andrej Häggblad, says they target 7000-8000 season tickets sold
in the future (Junelind & Ohlsson 2014).
Table 1.2 Season ticket sales for 5 major Swedish teams, 31 march 2015 (Balkander 2015)
SEASON TICKETS SALES 31 MARCH 2015
Hammarby 13 622
AIK 12 247
Malmö FF 11 575
Djurgården 7 871
IFK Göteborg 6 082
3
The sales of season tickets don’t necessarily mean the audience will show up. An average of
2000-4000 of AIK's 16 000 season ticket holders didn’t show up at their home games last
season. Johan Segui, chairman of AIK says it’s a problem and they can’t figure out exactly
why the season ticket holders don’t attend (Andersson 2014). We can witness a similar
behavior with IFK Göteborg's season ticket holders. When IFK Göteborg played against IF
Brommapojkarna last season only 6382 showed up for the game (SvFF 2014a).
To be able to create an effective marketing strategy a key factor is to understand what
motivate the spectators. Previous research on sport spectators’ motivation to attend games
has examined the Spanish third football league (Dos Santos & Rios 2014), the premier
Japanese soccer j-league (Mahony, Nakazawa, Funk, James & Gladden 2002), minor league
hockey games in USA (Zhang, Pease, Smith, Lee, Lam & Jambor 1997) and NBA games
(Zhang, Pease, Hui & Michaud 1995). When it comes to previous research about football
season-ticket holders, factors affecting season ticket holders' satisfaction has been
examined in French ligue 1 club Olympique Lyonnais (Beccarini & Ferrand 2006).No
separation between the motivation of season ticket-holders and non-season-ticket holders
has been made. Motives why people attend sports in different countries aren’t always the
same, for example, the culture in English football and U.S. sports differs a lot (Wann,
Melnick, Russell & Pease 2001). The motives for attending different sports are not the same
either (Hansen & Gauthier 1989). Therefore, a deeper understanding for the Swedish
Allsvenskan and IFK Göteborg is needed.
1.3 Purpose and Research Questions
As mentioned, Swedish football teams are working to increase attendances. This is a way to
make their product more attractive and to generate higher revenue. Understanding what
motivate the spectators is important when creating the marketing strategy. No previous
research has examined spectators' motivation in Allsvenskan. Therefore, the purpose of
this study will be to describe why season ticket holders and non-season ticket holders
attend games, which factors have the greatest impact on game attendance and discuss the
underlying reasons as well as marketing implications for IFK Göteborg. We have
subsequently constructed the following research questions:
Which factors influence season ticket holders' and non-season ticket holders'
motivation to attend IFK Göteborg's games at Gamla Ullevi?

4
Is there a difference between season ticket holders' and non-season ticket holders'
motivation to attend IFK Göteborg's games at Gamla Ullevi?
1.4 Delimitations
We decided to focus on a major Swedish club as we believe this yields a deeper
understanding of the spectators' motivation compared to examining several Allsvenskan
teams at the same time. In this study we examine IFK Göteborg and their home ground
Gamla Ullevi. We analyze factors that motivate, or motivated individuals to attend games
this and last season only. We don’t investigate factors like hooliganism, alcohol or handheld
flares at the arenas, as we find it too complex to include in this context. The survey was
issued at the season start of Allsvenskan. Another way would be to collect data
continuously over the course of the season to examine if the respondents are affected by
the team's performance, weather etc. This was not possible considering the time frame of
the thesis. We divide the attendees into season ticket holders and non-season ticket
holders. It would be interesting to divide the two groups further but it wouldn’t serve our
purpose. Delimitations regarding our research method are further discussed in section 3.6.
5
Chapter 2 Literature Review ________________________________________________________________________________________________________
The second chapter presents the literature framework of the study. First we introduce
motivational theories for sport spectators, then we examine the four factors of the sports
marketing mix. The chapter concludes with a summary.
________________________________________________________________________________________________________
2.1 What Makes People Attend Sporting Events?
To be able to understand why people attend sporting events it is important to understand
the difference between the factors of becoming a fan and a spectator. The factors affecting a
person to be a fan don’t need to the same factors affecting when deciding to attend an
arena, although they are connected and must be examined (Wann et al. 2001). In this
subchapter we will present the definition of motivation, fan motivation and sporting event
attendance motivation.
2.1.1 Motivation
Motivation is the influence that initiates the drive to satisfy wants and needs (Schwarz &
Hunter 2008). The study of motivation is often the endeavor to understand the why of
behavior (Deci & Ryan 1985). A motive for a sport consumer can be watching a star, love
for a team or hanging out with friends and family (Rein, Kotler & Shields 2006). For a sport
consumer it also involves tension and drive. Tension is mental or emotional stress and
drive is the desire to complete a task (Schwarz & Hunter 2008). When a sport consumer
has a want or need the next step is to come up with a plan how to satisfy it with influences
from the personality and learning process. The result is a behavior that hopefully will lead
to the fulfillment of the want or need which in turn will lead to reduced tension and then
satisfaction. Motives are emotions or needs that act to stimulate actions. Motives can be
either emotional or rational. An emotional motive is setting up goals based on subjective
criteria while rational motives are based on objective criteria (ibid).
2.1.2 Fan motivation
There are many motives behind fan motivation; researchers have found 8 motives being
the most common to motivate an individual to participate in sports as a fan (Wann et al.
2001).
6
Group affiliation: The most common way to watch sports is to watch it with other people
(Danielsson 1997). Studies have found that a motive for watching sport is the social aspect
of it (Gantz & Wenner 1995; Guttmann 1986; Pan, Gabert, McGaugh & Branvold 1997).
Family: Family is similar to the group affiliation motive. It suggests that being a fan is
motivated by spending time with family (Gantz & Wenner 1995; Guttmann 1986; Pan et al.
1997).
Aesthetic: To watch a perfectly executed penalty, a splendid save by the goalkeeper or to
watch one's favorite team play beautiful football are examples of enjoying sport and being a
fan. People are motivated by the beauty of the sport (Sloan 1989).
Self-esteem: This motive concerns an individual's desire because it gives an opportunity to
feel better about oneself (Pan et al. 1997; Sloan 1989). When a team wins, fans often join
them in the celebrations. This explains why fans tend to increase their association with
successful teams (Cialdini 1976).
Economic: A fifth motive is the possibility to gamble and win money in combination with
sport consumption (Gantz & Wenner 1995; Guttmann 1986).
Escape motive: Another motive is that of escape. The fans can temporarily forget about
their problems while participating in sports fandom (Gantz & Wenner 1995; Sloan 1989).
Entertainment: To be entertained motivates a fan. It is similar to attending the theatre,
watching television, listening to music or reading (Gantz & Wenner 1995; Sloan 1989). It is
enjoyable to watch one's favorite team win but it is more complex than that. A spectator's
enjoyment of watching a sport event is a function of the persons alliance with the home and
away team. Watching a team you dislike lose can be enjoyable (Smith, Turner, Garonzik,
Leach, Urch-Druskat & Weston 1996; Wann et al. 2001).
Eustress: The last motive is when a person doesn't get enough stimulation in daily life.
People who are participating in sports as a fan to gain excitement and stimulation are
motivated by eustress (Gantz & Wenner 1995; Sloan 1989).

7
2.1.3 The Theory of Personal Investment As Applied To Sports Spectating Decisions
Many theoretical approaches tend to focus on a specific component of the spectating
process (Wann et al. 2001). Sport spectating is multidimensional and complex (Guttmann
1986). Wann et al. (2001) suggest a more general theory is needed. They argue that The
theory of personal investment (Maehr & Braskamp 1986) seems to be most appropriate
because of its integration of several motivational factors. The theory identifies three
dimensions that are critical when determining motivation (Wann et al. 2001). The theory
has served as a foundation in previous sport behavior research (Duda, Smart &, Tappe
1989).
Perceived options refers to one's understanding of other behavioral alternatives available in
a specific situation, a spectator evaluating the weights and costs of other entertainment
options. For example, a customer can choose between different sports to watch, go play
golf, dine with family and friends etc. (Wann et al. 2001). The availability of the game on TV
can sometimes have negative effects on the attendance of the game (Zhang & Smith 1997).
In contrast, other researchers suggest there is a reciprocal relationship between those
factors. Numbers of home and away games watched on TV correlated positively with
attendance. Increased team identification through TV or other media lead to increases in
direct sport consumption (Wann & Branscombe 1993; Zhang et al. 1998).
Sense of self factors are more or less organized sets of perceptions, beliefs and feelings of
who one is (Maehr & Braskamp 1986). The most relevant factor of sense of self in sports is
identification with a team or a performer (Wann et al. 2001).Team identification is one of
the most important factors for motivating spectators to attend (Wann & Branscombe
1990). For example, Chicago Cubs haven't won the MLB since 1945 and still attract a large
number of spectators (Wann et al. 2001), also Hammarby in the Swedish second division
Superettan who attracted most spectators in 2014 (Roslund 2014)
Personal incentives are about how attractive or unattractive an individual views an
environmental component (Maehr & Braskamp 1986). In the area of sports marketing it is
about how an individual reflects the goals or reasons to attend a game or continue to do so.
Four different types of incentives are included in the model: task, ego, social and extrinsic
incentives.
8
Task incentives are unique components in each sport that attract spectators. Spectators
don't consume all sports in the same way, they have some sports they find more preferable
(Wann et al. 2001).
Ego incentives: Fans often see themselves as part of the team (ibid). Some researchers
suggest team performance as the most important factor for attendance (Guttmann 1986;
Zhang et al. 1995).
Social incentives refers to the social aspect of attending a game, such as spending time with
family or friends (Wann et al. 2001). Studies have argued for the social atmosphere as a
motivation for attending sport events (Pen et al. 1997; Zhang et al 1995).
Extrinsic incentives can be giveaways, free tickets or the opportunity to interact with
players. It can also be the attractiveness of a new stadium (Wann et al. 2001).
2.2 Sports Marketing
Sports marketing is the specific application of marketing principles and processes to sport
products and the marketing of non-sports products through association with sport (Shank
1999, pp.2). IFK Göteborg is marketing their product which is elite football, while their
sponsors use the club as a way to get their message across. There is a wide field of
literature covering the topic of sports marketing. While conducting our research we found
that most of the literature concerning the topic revolves around Kotlers's marketing mix.
This model centers around four variables: product, place, promotion, and price. It captures
the marketing activities that are used to create and communicate value to the customer
(Ericsson & Persson 2013).
The four items used in the sports marketing mix can all be linked to the motivational
factors described earlier in this chapter. They are all central to the consumers when
deciding whether to attend games or not, therefore we consider it relevant to examine how
the marketers approach these factors. They are also of importance when discussing
marketing implications for IFK Göteborg. The way to implement and use the sports
marketing mix can be viewed from a range of different perspectives. The consumer to
whom you market can be practitioners, attendees or sponsors (ibid). We’ll be looking on it
from an audience attracting perspective.
9
2.2.1 Product
The product is something that can be offered to a marketplace to meet a demand. Products
within sports marketing ranges from pure goods, like football equipment, to pure services,
like the game itself. The goal for every elite club is naturally to sell out each game (Ericsson
& Persson 2013). IFK Göteborg sells tickets to the public while in the same time selling
sponsorship to businesses. For IFK Göteborg, who provides an intangible service, a strategy
may be to “tangelize it”. You can highlight the tangible comforts of the facility rather than to
promote the game itself. You should stress the tangible aspects of the stadium such as the
design, seating and aesthetics, especially when the team is performing poorly (Shank
1999).
When it comes to attracting audience the club will market the first team's progress and
fixtures toward the intended target group in the region (Ericsson & Persson 2013). The
club can highlight the different players, match arrangements, home turf, culture in the
stands etc. Intangible sport products and services can, when negative, have a longer lasting
effect compared to tangible products. Customers will remember how a game was ruined for
them because of bad weather, foul language, or difficulties in finding a parking spot
(Schwarz & Hunter 2008). Every attendee for the game will have a different experience but
the core of the offer remains the same. In designing the individual product the club adds a
number of elements to create a setting complete and attractive to the viewer (Ericsson &
Persson 2013). The parts added can be physical products, and for a team in Allsvenskan
like IFK Göteborg, these parts may consist of the arena and its staff, match programme, big
screen monitors, and food-, drink- and souvenir sales. The opposing team, week day, and
kick off time are all important in the segmentation of the market (ibid).
2.2.2 Place
The primary distinction between the distributing channels for a sporting good compared to
services, such as attending a sporting event, is that the game is produced and consumed
simultaneously at the place of distribution (Shanks 1999). For IFK Göteborg that place is
Gamla Ullevi as long as the consumer actually attends the game. How the audience gets to
the stadium with different options is of relevance, Factors like stadium accessibility,
parking options and amenities are of relevance (Ericsson & Persson 2013). The game can
also be consumed through different media like watching it on television or through a
smartphone, which then moves the place into the consumer's living room (ibid).
10
2.2.3 Promotion
Promotional planning is one of the most important elements of the sports marketing mix
(Shanks 1999). Promotions are all activities the marketer performs to reach its business
goals. In the case of IFK Göteborg it can be the choice of communication strategy which is
embodied in advertising, the website, newsletters, PR activities but also physical sales
efforts such as activities in the city center or company visits (Ericsson & Persson 2013).
Promotion involves all form of communication to consumers (Shanks 1999).
In sports, building relationships is a natural part of the business. An elite club operating
within a popular sport wants to be a part of the good society and should aim to act
responsibility in various forms. Thereby creating good associations and become strongly
rooted in the locality in which it operates. An important part of the club's work is in various
ways informing about the activities of the club and through this emphasize its social
importance (Ericsson & Persson 2013).
2.2.4 Price
Price is an important part of the strategy the club uses to sell their respective products and
services. Within the marketing mix, price is the easiest factor to change. The price strategy
describes how the organization views its product and its brand as well as potential
customers or business partners, but also on the competition and how high or low the
product is in terms of attractiveness to the buyer (ibid). The perceived benefit of attending
an IFK Göteborg game is a subjective experience based on each individual’s perception of
the event. One consumer may pay a huge amount to see the game because of perceived
benefits, while another may attend only if given a ticket. It is important to recognize that
the value placed on attending the sporting event is unique to each individual (Shanks
1999).
2.3 Summary
Fans and spectators can have different motives to attend a game, they are both linked and
must be examined. There are eight motives researchers found out is most common why
people participate in sports as a fan: Group affiliation, Family, Aesthetic, Self-esteem,
Economic, Escape motive, Entertainment, and Eustress. The theory of personal investment as
applied to sport spectating decisions is multidimensional and covers both fan and spectator
motives when attending games. It contains three dimensions that are critical when

11
determining spectators' motivation: Perceived Options, Sense of self and Personal incentives.
Personal incentives is further divided into Task, Ego, Social and Extrinsic. The sports
marketing mix is a tool used by the clubs to attract spectators to the games. The four items
used in the sports marketing mix (Product, Place, Promotion, and Price) can all be linked to
the motivational factors described earlier. They are all central to the consumers when
deciding whether to attend games or not.
12
Chapter 3 Research Method ________________________________________________________________________________________________________
The third chapter describes the design and implementation of the study. The statistical
methods we will use are explained and argued. The model's problem area and delimitations
concludes the chapter.
________________________________________________________________________________________________________
3.1 Research Method
To find the answer to our research questions we undertook a quantitative study of the
club's audience. Quantitative research can be considered a research strategy that
emphasizes quantification regarding the collection and analysis of data and contains a
deductive approach to the relationship between theory and practical research, where the
emphasis is on testing theory. The research strategy has incorporated the scientific
method's standards and approaches, especially in terms of positivism. Quantitative
research holds an understanding of the social reality that constitutes of an external and
objective reality (Bryman & Bell 2013).
To find what motivates the IFK spectators it was essential to collect the data from the
supporters themselves. Surveys and structured interviews are in many regards similar as
research instruments in social research. The obvious difference between them is that for
the survey an interviewer is rarely present. To gather as much information as possible in
the shortest amount of time we collected our data by undertaking an online survey.
Advantages of surveys compared to structured interviews are that surveys are less
expensive and quicker to administer. Surveys that the respondents themselves fill in can be
distributed in many different ways, in infinite numbers and at the same time. Getting 1,000
respondents to answer should be compared to the time it takes for a large group of
interviewers to interview 1,000 people. Surveys suit respondents' needs better, because
they can be answered when the respondents have the time and opportunity to do so. Also,
surveys entail no interviewer effect. There are several studies showing that factors relating
to the interviewer can influence the responses that people leave on the questions (ibid).
There are drawbacks to surveys. You cannot help the respondent with interpretation or ask
follow-up questions. To address this problem and to minimize misconceptions we
performed a pilot study (See 3.4). Another drawback is that you cannot know for sure who
13
answered the survey. Even if a questionnaire is addressed to a particular person in a family
or a household there may still be someone else who answers it. It is not possible to have
control over other individuals who can interfere with- and affect the intended respondent.
Some researchers claim that when you distribute questionnaires via the internet some
internet users tend to assume different identities online (ibid).
We strived to keep the survey as short as possible in order to reduce the risk of survey
fatigue. It is easier for a respondent who tires of survey questions to throw the whole
questionnaire in the trash than it is for a respondent questioned by an interviewer to
interrupt the interview (ibid).
Surveys in comparison with structured interviews tend have less open questions, since it is
generally easier to answer closed questions (ibid). Like prior research on motivational
factors, earlier discussed in the problem area section e.g. Zhang et al (1997), our survey
will consist of Likert-scale items. There are a number of advantages with closed questions
like Likert-scale items. Closed questions are easy to answer for a respondent and increase
the comparability of responses. They are easy to process and computerize (Bryman & Bell
2013).
We used Likert items with 7 levels where the respondents had to grade how much a
specific factor motivates them to attend an IFK Göteborg game at Gamla Ullevi.
Respondents can be insecure about a question's meaning or purpose and a description of
the different options can help to clarify (ibid). Each level was coded in the following way:
7=Very much
6=Much
5=Somewhat
4=Unsure
3=Little
2=Very little
1=Not at all
Besides the Likert-scale items some additional questions were used to categorize the
respondents, e.g. gender, age and whether the respondent were a season ticket holder last
and/or this season. The respondents were also asked how many games they attended last
14
season, and how many they intended to attend this season. The gathered data was then
processed using IBM's statistics software SPSS.
3.2 Statistical Analysis
When a researcher gathers data from a sample and uses the statistics generated to reach
conclusions about the population from which the the sample was taken it’s called
inferential statistics. A sample is, if properly taken, a representative portion of the whole
population (Cortinhas & Black 2012). This study will concentrate on two populations. The
first will be people who visited at least one IFK game at Gamla Ullevi last or current season.
The second will be people with season tickets, this or the last season.
Likert scale items, give in strict sense rise to ordinal variables. Ordinal variables are
variables whose categories can be ranked but the distances between the categories are not
equal across the scale. Interval-/ratio variables include equal distances between the
categories. Many authors argue that Likert scale items can be treated as interval-/ratio
variables, because they generate a relatively large number of categories (Bryman & Bell
2013). Others disagree and mean Likert scales must be treated as ordered categories
(Jamieson 2004). Kuzon, Urbanchek & McCabe (1996) argues that the average of good and
very good cannot be “good-and-a-half”.
We will present comparisons between the two sample groups by describing a measure of
central tendency for each item. This description of the data yields information about the
centre, or middle part of a group of numbers (Cortinhas & Black 2012). A way to measure
the central tendency is examining the median; this would be in line with those who argue
Likert-scales must be treated as ordered categories. Since the Likert-scale only has 7 levels
we believe the median wouldn’t describe the data accurately. Instead we will be using the
arithmetic mean to analyze the samples. Using mean can be hard to justify when using
ordinal data like the Likert scale provides, but since our classifications is ordered in a way
that closely resembles an interval scale, it is our opinion that it is valid to compare the
means in this instance. An advantage with this method is that the mean is affected by each
and every value. This may also serve as a disadvantage because extremely large or small
values can cause the mean to be pulled towards the extreme value (Cortinhas & Black
2012). Since no extreme values could be inputted into our survey this problem didn’t affect
us. We will use SPSS to calculate mean and standard deviation for every item on each of our
two population samples. We will then analyze which items motivates each group the most.

15
These items will all be paired with a corresponding factor produced from the literature. We
then calculate the factor mean for each factor. Comparisons between each group can be
performed to find similarities and differences.
We will also use non-parametric statistics to analyze differences between the groups. This
is a class of statistical techniques that make few assumptions about the population and are
particularly applicable to ordinal level data (ibid). We will use the Mann-Whitney U test
which is a non-parametric counterpart of the t-test used to compare the means of two
independent populations. The use of the Mann-Whitney U test assumes that the samples
are independent and that the level of data is at least ordinal. With this we can find which
items in the two populations aren’t statistically identical.
We will further investigate to what degree each item in the survey influenced the amount
of games attended last season by the season ticket holders and the non-season ticket
holders. We will also investigate to what degree every item influences the amount of games
intended to attend this season by the season ticket holders and the non-season ticket
holders. Considering our independent variable is ordinal and our dependent variable is
interval-/ratio we will analyze the degree of association between two variables with
Spearman Rho correlation, which also is a non-parametric test (ibid).
The number of games attended last season will act as the dependent variable. A second
analysis will be performed with the number of games the respondents intend to attend this
season acting as the dependent variable. A separation will be made between season ticket
holders and non-season ticket holders.
3.3 Factors
The survey consisted of 26 likert scale items. Every item in the questionnaire were based
around seven factors produced from the literature. We used the six factors presented in
The theory of personal investment (Maehr & Braskamp 1986) as well as an additional factor
that deals with random variables which we believe is missing from the model. We decided
to call this factor Varying external factors and it accounts for variables the club cannot
control e.g. weather, and opponent team. The individual items were designed based on
previous research (Dos Santos & Rios 2014; Hansen & Gauthier 1989; Wann et al. 2001;
Zhang et al. 1997) and sports marketing literature discussed in the theory framework (See
2.2).
16
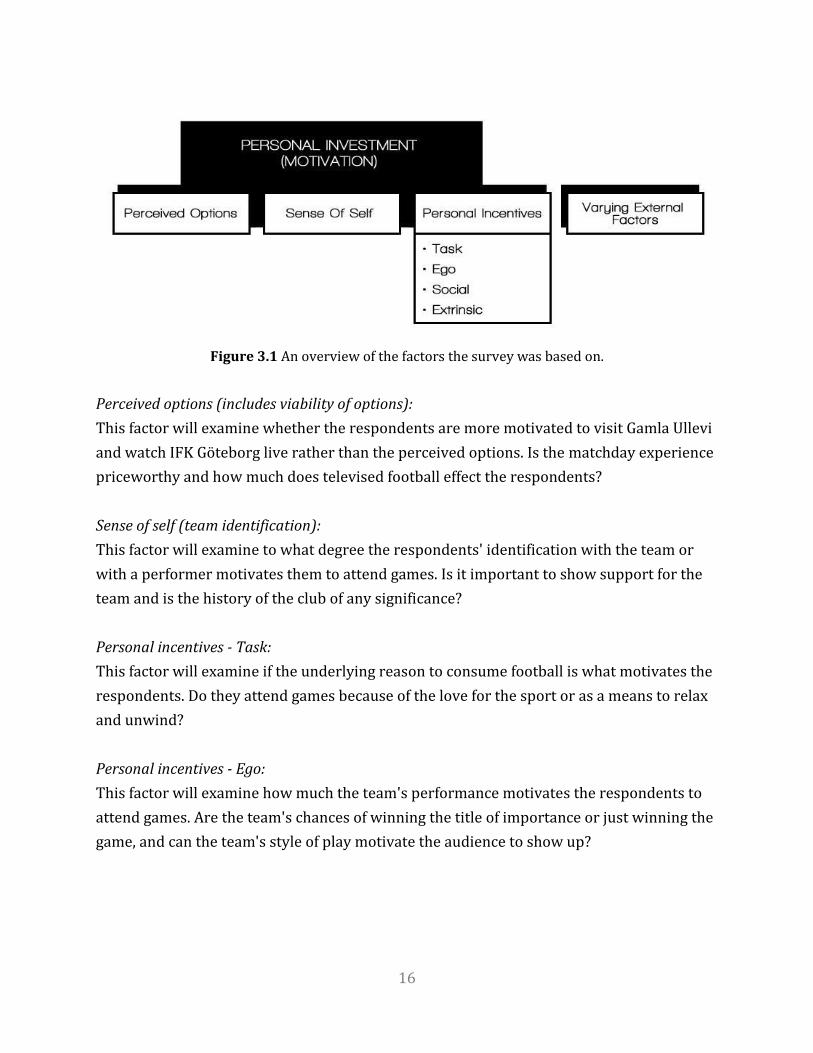
Figure 3.1 An overview of the factors the survey was based on.
Perceived options (includes viability of options):
This factor will examine whether the respondents are more motivated to visit Gamla Ullevi
and watch IFK Göteborg live rather than the perceived options. Is the matchday experience
priceworthy and how much does televised football effect the respondents?
Sense of self (team identification):
This factor will examine to what degree the respondents' identification with the team or
with a performer motivates them to attend games. Is it important to show support for the
team and is the history of the club of any significance?
Personal incentives - Task:
This factor will examine if the underlying reason to consume football is what motivates the
respondents. Do they attend games because of the love for the sport or as a means to relax
and unwind?
Personal incentives - Ego:
This factor will examine how much the team's performance motivates the respondents to
attend games. Are the team's chances of winning the title of importance or just winning the
game, and can the team's style of play motivate the audience to show up?

17
Personal incentives - Social:
This factor will examine if the social aspects of attending games motivates the respondents.
Is the stadium atmosphere and the chance of meeting friends and family of big importance,
or maybe to keep up a family tradition?
Personal incentives - Extrinsic:
This factor will examine how extrinsic aspects affect respondents' motivation. How is the
stadium viewed, is it pleasant and accessible enough to motivate people to turn up? How
important is the section of the stadium and how important is the ticket price?
Varying external factors:
This factor will examine how variables the club itself cannot control affect the respondents'
motivation. How important is the opponent team and the pre-game hype? How big impact
does the weather or time of kick off have?
3.4 Pilot Study
Validity is an assessment of the conclusions generated from a study to see if they are
related or not. Construct validity is to what degree a question measures what a researcher
claims it measures (Bryman & Bell 2013). To increase validity we conducted a pilot study
before distributing the survey to find if there were any misinterpretations or errors with
the questions. Pilot studies are especially important when conducting a survey since there
is no interviewer present who can handle any ambiguities (ibid). The pilot study was
performed on five people, two males and three females with a wide age difference. Two of
the participants were season ticket holders. We asked them to fill out the survey and
describe how they interpreted the questions, and whether they had any other feedback.
The results of the pilot study led us to rephrase some of the questions to make them more
apprehendable. We also added a couple of question to capture some aspects that the other
questions failed to. The participants of the study couldn’t think of any other motivating
factor than the ones presented in the questionnaire. The order of the questions was also
changed to make the survey more varied by separating similar questions.
3.5 Data Gathering
All of the data for this study was collected by issuing an online survey. The survey was
created using Google Forms. We got in touch with IFK Göteborg who helped to distribute

18
the survey through their official Facebook page and Twitter feed. All of the respondents
were anonymous.
One of the main limitations is that surveys usually involve a large shortfall (Bryman & Bell
2013). This failure means that the risk of errors and skewness of the result increases. It is
likely that there are some differences between those who complete the survey and those
who neglect to do so, and thus the results from the sample will be affected. How this affects
our study is further discussed in 3.6. There are strategies that researchers can take to
increase the response rate, e.g. give respondents a small reward, or use a sample that you
have some measure of control over (ibid). To increase the response rate in our survey the
participants were offered the chance of winning two cinema tickets.
The risk that one will get back questionnaires that are only partially answered is
considerable. You cannot supervise or assist the respondent the way possible in an
interview (Bryman & Bell 2013). This was prevented with the use of Google Forms that
stops the participants from submitting unfinished forms. As a result all submitted forms
were 100% completed.
Reliability concerns the question of whether the result of a study would be the same if the
study were made again (ibid). The weather or the team's performance during the time of
responding may have influenced the outcome of the survey. We expect other variables to
be consistent over time.
3.6 Model Problem Area and Delimitations
Since the survey was only distributed online through social media, it is not a certainty that
the respondents were representative for the whole population. We still have confidence
that our sample yields a good ground for the study. Various type of people responded to the
survey, people who attend a wide number of games, people of all ages and both season
ticket holders and non-season ticket holders. Most of the respondents were men, which
reflects the situation at the arena. We don’t specify what kind of weather motivates the
respondents, not all people are motivated by sunshine. The weather during the time of
responding may have influenced the outcome of the survey, as well as the team's
performance. We don’t separate the respondents in any other way than season or non-
season ticket holders. The survey was conducted over the course of three days at an early
stage of the season only.
19
Chapter 4 Results ________________________________________________________________________________________________________
In the fourth chapter we describe the turnout of the survey. The results from the statistical
tests are then presented. Measure of the central tendency shows which factors have the
highest mean for each group. To also test if there are significant differences between the two
populations we use Mann-Whitney U test which is a non-parametric test suitable for our data.
Lastly Spearman Rho Correlation is presented to examine which motivational factors
correlate with games attended. A factor can have a high mean for both those who attend
many games and those who attend few. Spearman Rho Correlation between motivational
factors and games attended gives an indication of which motivational factors determine the
behavior, i.e. numbers of games attended.
________________________________________________________________________________________________________
4.1 Survey Turnout
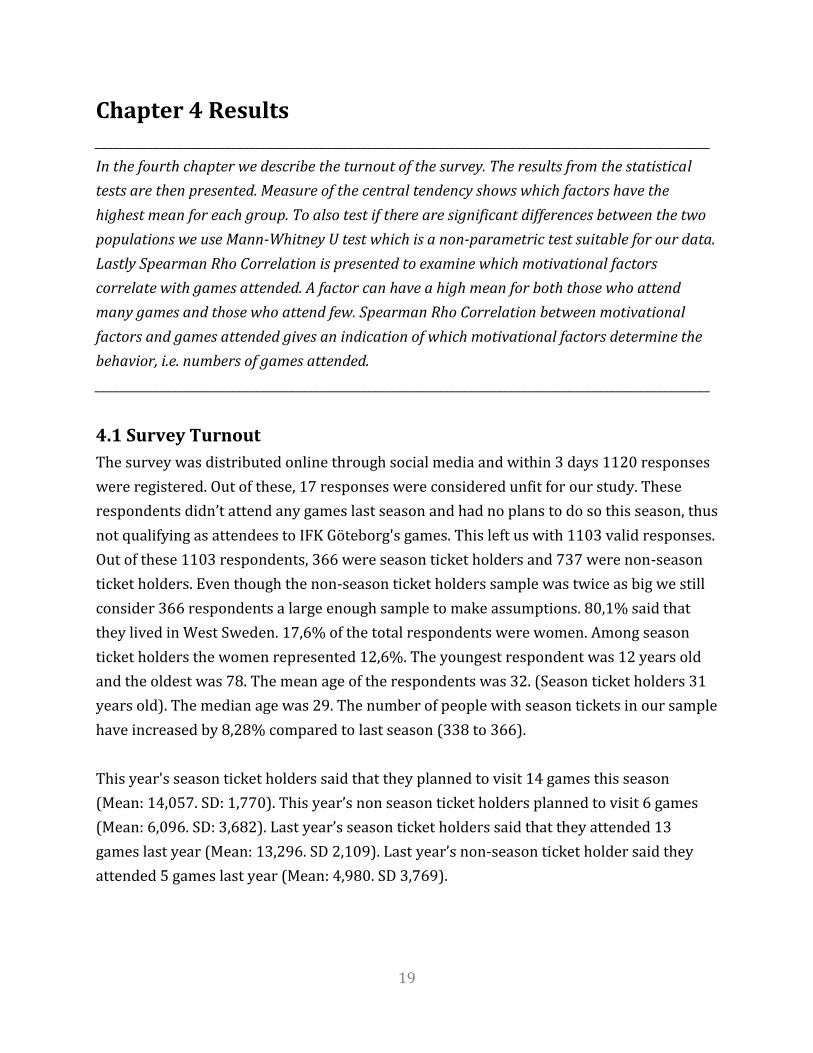
The survey was distributed online through social media and within 3 days 1120 responses
were registered. Out of these, 17 responses were considered unfit for our study. These
respondents didn’t attend any games last season and had no plans to do so this season, thus
not qualifying as attendees to IFK Göteborg's games. This left us with 1103 valid responses.
Out of these 1103 respondents, 366 were season ticket holders and 737 were non-season
ticket holders. Even though the non-season ticket holders sample was twice as big we still
consider 366 respondents a large enough sample to make assumptions. 80,1% said that
they lived in West Sweden. 17,6% of the total respondents were women. Among season
ticket holders the women represented 12,6%. The youngest respondent was 12 years old
and the oldest was 78. The mean age of the respondents was 32. (Season ticket holders 31
years old). The median age was 29. The number of people with season tickets in our sample
have increased by 8,28% compared to last season (338 to 366).
This year's season ticket holders said that they planned to visit 14 games this season
(Mean: 14,057. SD: 1,770). This year’s non season ticket holders planned to visit 6 games
(Mean: 6,096. SD: 3,682). Last year’s season ticket holders said that they attended 13
games last year (Mean: 13,296. SD 2,109). Last year’s non-season ticket holder said they
attended 5 games last year (Mean: 4,980. SD 3,769).
20
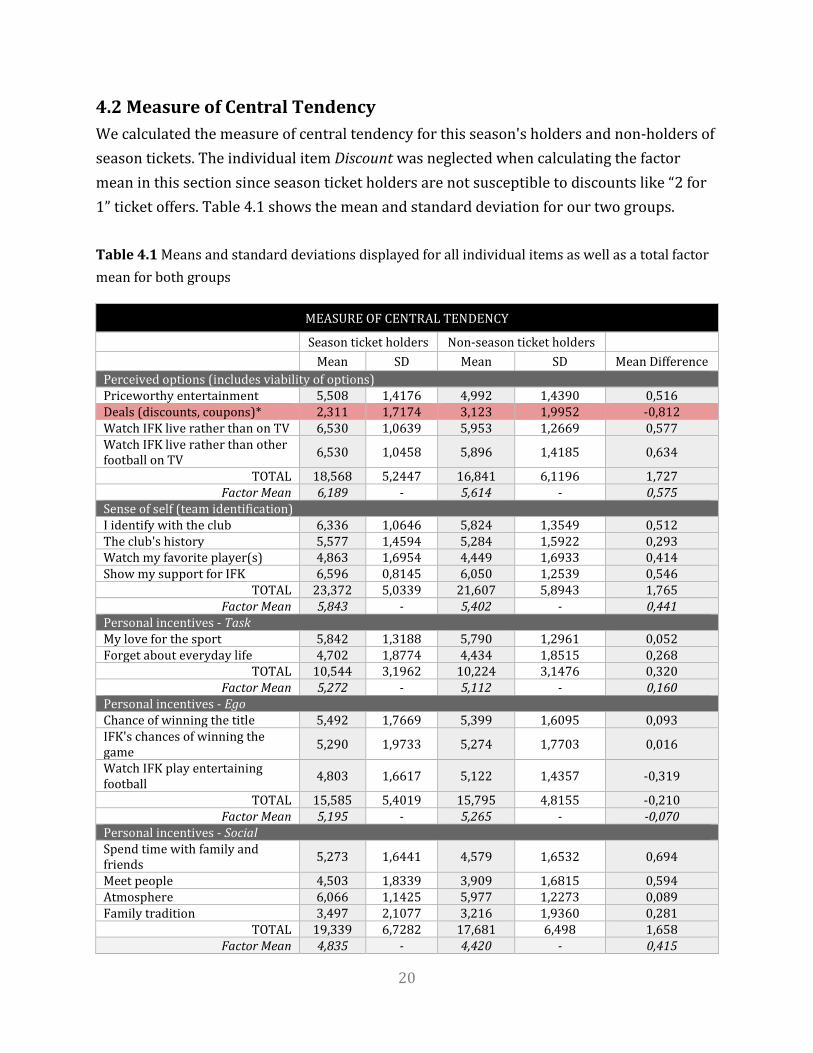
4.2 Measure of Central Tendency
We calculated the measure of central tendency for this season's holders and non-holders of
season tickets. The individual item Discount was neglected when calculating the factor
mean in this section since season ticket holders are not susceptible to discounts like “2 for
1” ticket offers. Table 4.1 shows the mean and standard deviation for our two groups.
Table 4.1 Means and standard deviations displayed for all individual items as well as a total factor
mean for both groups
MEASURE OF CENTRAL TENDENCY
Season ticket holders Non-season ticket holders Mean SD Mean SD Mean Difference Perceived options (includes viability of options) Priceworthy entertainment 5,508 1,4176 4,992 1,4390 0,516 Deals (discounts, coupons)* 2,311 1,7174 3,123 1,9952 -0,812 Watch IFK live rather than on TV 6,530 1,0639 5,953 1,2669 0,577 Watch IFK live rather than other football on TV 6,530 1,0458 5,896 1,4185 0,634
TOTAL 18,568 5,2447 16,841 6,1196 1,727 Factor Mean 6,189 - 5,614 - 0,575
Sense of self (team identification) I identify with the club 6,336 1,0646 5,824 1,3549 0,512 The club's history 5,577 1,4594 5,284 1,5922 0,293 Watch my favorite player(s) 4,863 1,6954 4,449 1,6933 0,414 Show my support for IFK 6,596 0,8145 6,050 1,2539 0,546
TOTAL 23,372 5,0339 21,607 5,8943 1,765 Factor Mean 5,843 - 5,402 - 0,441
Personal incentives - Task My love for the sport 5,842 1,3188 5,790 1,2961 0,052 Forget about everyday life 4,702 1,8774 4,434 1,8515 0,268
TOTAL 10,544 3,1962 10,224 3,1476 0,320 Factor Mean 5,272 - 5,112 - 0,160
Personal incentives - Ego Chance of winning the title 5,492 1,7669 5,399 1,6095 0,093 IFK's chances of winning the game 5,290 1,9733 5,274 1,7703 0,016
Watch IFK play entertaining football 4,803 1,6617 5,122 1,4357 -0,319
TOTAL 15,585 5,4019 15,795 4,8155 -0,210 Factor Mean 5,195 - 5,265 - -0,070
Personal incentives - Social Spend time with family and friends 5,273 1,6441 4,579 1,6532 0,694
Meet people 4,503 1,8339 3,909 1,6815 0,594 Atmosphere 6,066 1,1425 5,977 1,2273 0,089 Family tradition 3,497 2,1077 3,216 1,9360 0,281
TOTAL 19,339 6,7282 17,681 6,498 1,658 Factor Mean 4,835 - 4,420 - 0,415
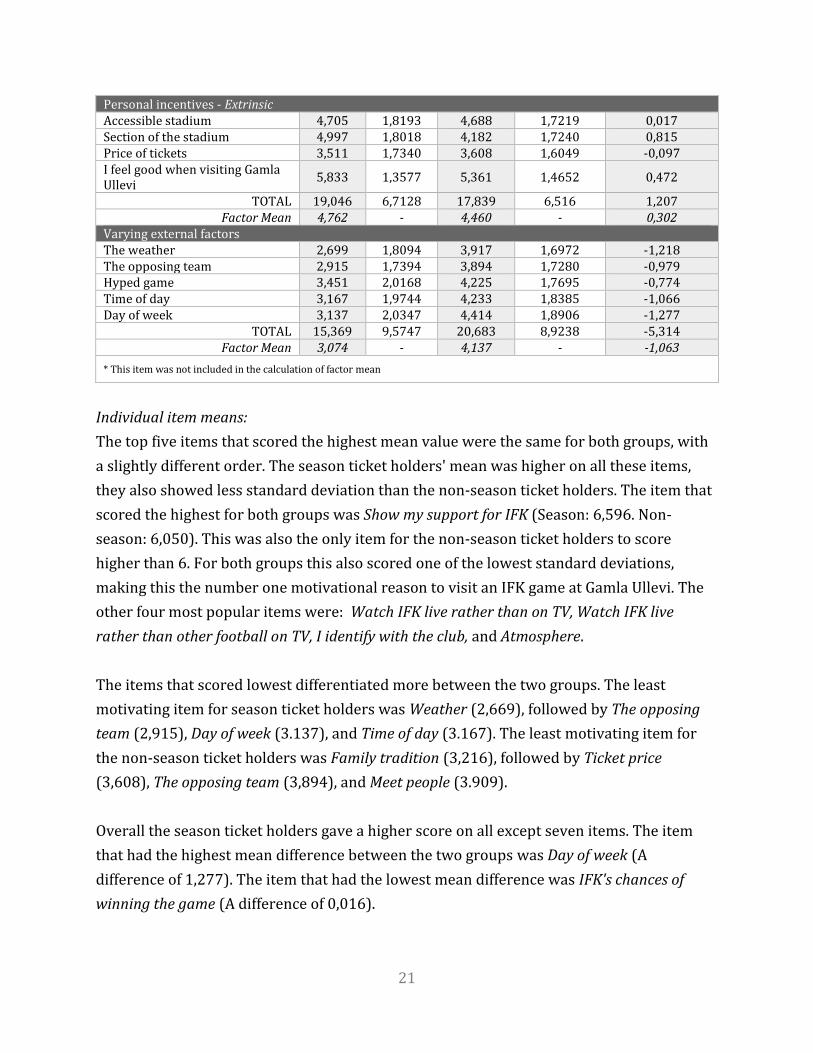
21
Personal incentives - Extrinsic Accessible stadium 4,705 1,8193 4,688 1,7219 0,017 Section of the stadium 4,997 1,8018 4,182 1,7240 0,815 Price of tickets 3,511 1,7340 3,608 1,6049 -0,097 I feel good when visiting Gamla Ullevi 5,833 1,3577 5,361 1,4652 0,472
TOTAL 19,046 6,7128 17,839 6,516 1,207 Factor Mean 4,762 - 4,460 - 0,302
Varying external factors The weather 2,699 1,8094 3,917 1,6972 -1,218 The opposing team 2,915 1,7394 3,894 1,7280 -0,979 Hyped game 3,451 2,0168 4,225 1,7695 -0,774 Time of day 3,167 1,9744 4,233 1,8385 -1,066 Day of week 3,137 2,0347 4,414 1,8906 -1,277
TOTAL 15,369 9,5747 20,683 8,9238 -5,314 Factor Mean 3,074 - 4,137 - -1,063
* This item was not included in the calculation of factor mean
Individual item means:
The top five items that scored the highest mean value were the same for both groups, with
a slightly different order. The season ticket holders' mean was higher on all these items,
they also showed less standard deviation than the non-season ticket holders. The item that
scored the highest for both groups was Show my support for IFK (Season: 6,596. Non-
season: 6,050). This was also the only item for the non-season ticket holders to score
higher than 6. For both groups this also scored one of the lowest standard deviations,
making this the number one motivational reason to visit an IFK game at Gamla Ullevi. The
other four most popular items were: Watch IFK live rather than on TV, Watch IFK live
rather than other football on TV, I identify with the club, and Atmosphere.
The items that scored lowest differentiated more between the two groups. The least
motivating item for season ticket holders was Weather (2,669), followed by The opposing
team (2,915), Day of week (3.137), and Time of day (3.167). The least motivating item for
the non-season ticket holders was Family tradition (3,216), followed by Ticket price
(3,608), The opposing team (3,894), and Meet people (3.909).
Overall the season ticket holders gave a higher score on all except seven items. The item
that had the highest mean difference between the two groups was Day of week (A
difference of 1,277). The item that had the lowest mean difference was IFK's chances of
winning the game (A difference of 0,016).
22
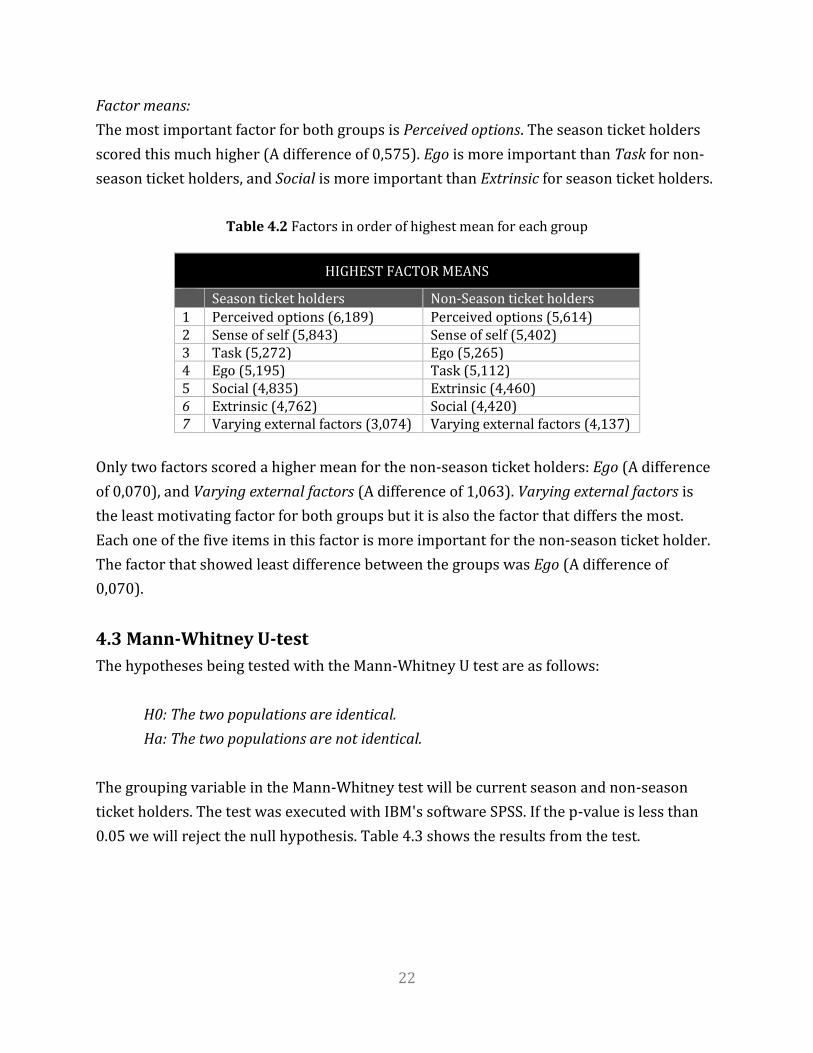
Factor means:
The most important factor for both groups is Perceived options. The season ticket holders
scored this much higher (A difference of 0,575). Ego is more important than Task for non-
season ticket holders, and Social is more important than Extrinsic for season ticket holders.
Table 4.2 Factors in order of highest mean for each group
HIGHEST FACTOR MEANS
Season ticket holders Non-Season ticket holders 1 Perceived options (6,189) Perceived options (5,614) 2 Sense of self (5,843) Sense of self (5,402) 3 Task (5,272) Ego (5,265) 4 Ego (5,195) Task (5,112) 5 Social (4,835) Extrinsic (4,460) 6 Extrinsic (4,762) Social (4,420) 7 Varying external factors (3,074) Varying external factors (4,137)
Only two factors scored a higher mean for the non-season ticket holders: Ego (A difference
of 0,070), and Varying external factors (A difference of 1,063). Varying external factors is
the least motivating factor for both groups but it is also the factor that differs the most.
Each one of the five items in this factor is more important for the non-season ticket holder.
The factor that showed least difference between the groups was Ego (A difference of
0,070).
4.3 Mann-Whitney U-test
The hypotheses being tested with the Mann-Whitney U test are as follows:
H0: The two populations are identical.
Ha: The two populations are not identical.
The grouping variable in the Mann-Whitney test will be current season and non-season
ticket holders. The test was executed with IBM's software SPSS. If the p-value is less than
0.05 we will reject the null hypothesis. Table 4.3 shows the results from the test.

23
Table 4.3 Mann-Whitney U test comparing the two populations
MANN-WHITNEY U TEST
Mann-Whitney U Asymp. Sig. (2-tailed)
Perceived options (includes viability of options) Priceworthy entertainment 106441,0 0,000 Deals (discounts, coupons) 102500,0 0,000 Watch IFK live rather than on TV 94528,0 0,000 Watch IFK live rather than other football on TV 96288,5 0,000
Sense of self (team identification) I identify with the club 104614,5 0,000 The club's history 121075,5 0,004 Watch my favorite player(s) 116154,0 0,000 Show my support for IFK 99762,0 0,000 Personal incentives - Task Love for the sport 130654,5 0,374* Forget about everyday life 123343,0 0,019 Personal incentives - Ego Chance of winning the title 125744,5 0,058* IFK's chance of winning the game 129708,0 0,285* Watch IFK play entertaining football 120904,0 0,004 Personal incentives - Social Spend time with family and friends 101295,0 0,000 Meet people 108440,5 0,000 Atmosphere 129473,5 0,249* Family tradition 125657,5 0,060* Personal incentives - Extrinsic Accessible stadium 133440,0 0,770* Section of the stadium 97749,0 0,000 Price of tickets 129859,0 0,306* I feel good when visiting Gamla Ullevi 108477,0 0,000 Varying external factors The weather 82067,0 0,000 The opposing team 92874,5 0,000 Hyped game 104323,0 0,000 Day of week 87249,0 0,000 Time of day 93391,50 0,000 *p>0,05
The Mann-Whitney U test identified that out of 26 items, the two populations were
identical on the 7 following:
- Love for the sport (U=130654,5, p=0,374)
- Chance of winning the title (U=125744,5, p=0,058)
- IFK's chance of winning the game (U=129708,0, p=0,285)
- Atmosphere (U=129473,5, p=0,249)
24
- Family tradition (U=125657,5, p=0,060)
- Accessible stadium (U=133440,0, p=0,770)
- Price of tickets (U=129859,0, p=0,306)
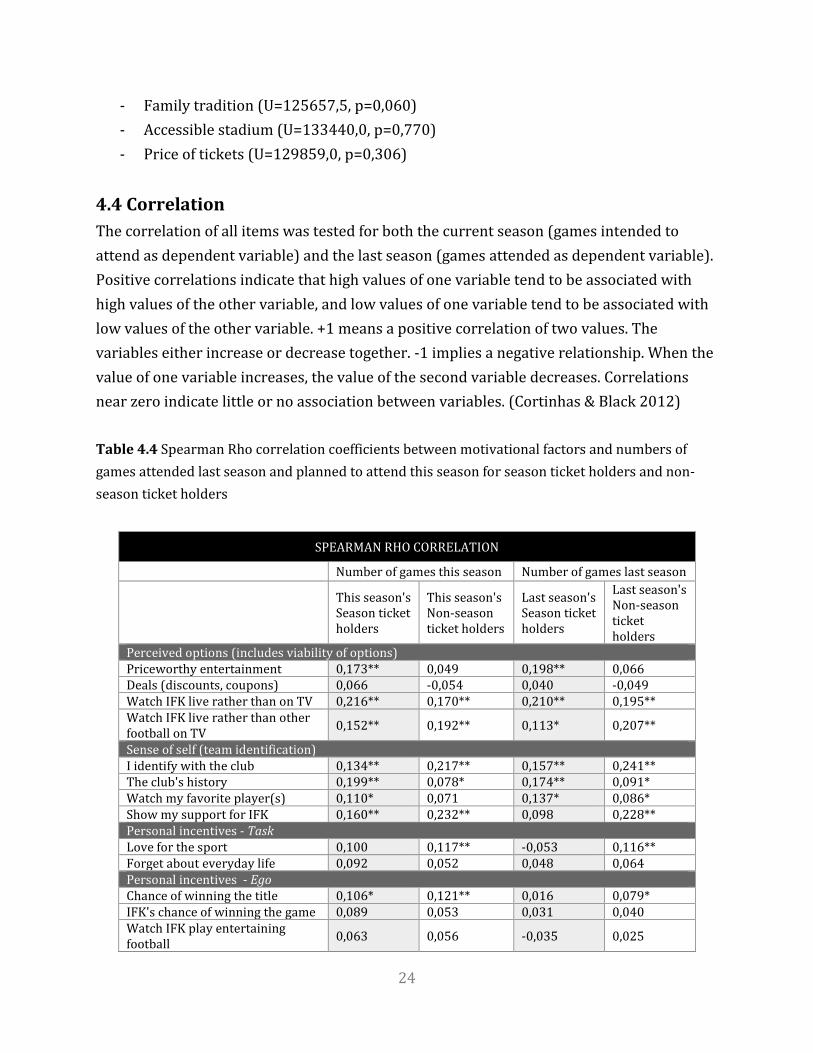
4.4 Correlation
The correlation of all items was tested for both the current season (games intended to
attend as dependent variable) and the last season (games attended as dependent variable).
Positive correlations indicate that high values of one variable tend to be associated with
high values of the other variable, and low values of one variable tend to be associated with
low values of the other variable. +1 means a positive correlation of two values. The
variables either increase or decrease together. -1 implies a negative relationship. When the
value of one variable increases, the value of the second variable decreases. Correlations
near zero indicate little or no association between variables. (Cortinhas & Black 2012)
Table 4.4 Spearman Rho correlation coefficients between motivational factors and numbers of
games attended last season and planned to attend this season for season ticket holders and non-
season ticket holders
SPEARMAN RHO CORRELATION
Number of games this season Number of games last season
This season's Season ticket holders
This season's Non-season ticket holders
Last season's Season ticket holders
Last season's Non-season ticket holders
Perceived options (includes viability of options) Priceworthy entertainment 0,173** 0,049 0,198** 0,066 Deals (discounts, coupons) 0,066 -0,054 0,040 -0,049 Watch IFK live rather than on TV 0,216** 0,170** 0,210** 0,195** Watch IFK live rather than other football on TV 0,152** 0,192** 0,113* 0,207**
Sense of self (team identification) I identify with the club 0,134** 0,217** 0,157** 0,241** The club's history 0,199** 0,078* 0,174** 0,091* Watch my favorite player(s) 0,110* 0,071 0,137* 0,086* Show my support for IFK 0,160** 0,232** 0,098 0,228** Personal incentives - Task Love for the sport 0,100 0,117** -0,053 0,116** Forget about everyday life 0,092 0,052 0,048 0,064 Personal incentives - Ego Chance of winning the title 0,106* 0,121** 0,016 0,079* IFK's chance of winning the game 0,089 0,053 0,031 0,040 Watch IFK play entertaining football 0,063 0,056 -0,035 0,025

25
Personal incentives - Social Spend time with family and friends 0,077 0,185** 0,051 0,156**
Meet people 0,096 0,138** 0,055 0,139** Atmosphere 0,042 0,142** -0,021 0,104** Family tradition 0,110* 0,123** 0,126* 0,143** Personal incentives - Extrinsic Accessible stadium 0,045 0,099** -0,009 0,057 Section of the stadium 0,103* 0,177** 0,113* 0,165** Price of tickets 0,006 0,025 0,009 0,002 I feel good when visiting Gamla Ullevi 0,165** 0,182** 0,121* 0,168**
Varying external factors The weather -0,093 -0,144** -0,145** -0,140** The opposing team -0,128* -0,44 -0,248** -0,076* Hyped game -0,130* -0,010 -0,210** -0,024 Day of week -0,183** -0,113** -0,156** -0,114** Time of day -0,155** -0,110** -0,104 -0,102** Notes: *Correlation is significant at the 0,05 level (2-tailed) **Correlation is significant at the 0,01 level (2-tailed)
Perceived options is a notable factor also when examining the Spearman Rho correlation
coefficients between motivational factors and numbers of games attended. The item
Priceworthy entertainment has a correlation for season ticket holders, while there is no
significant correlation for the non-season ticket holders. The items Watch IFK live rather
than on TV and Watch IFK live rather than other football on TV are correlated for both
groups.
In the Sense of self factor the item I identify with the club was significantly correlated across
both groups, last season's non-season ticket holders was the strongest (0,241). The club's
history had a stronger correlation for the season ticket holders while Show my support for
IFK was more correlated for the non-season ticket holders.
The Task factor only had one item correlating. Love for the sport correlated for the non-
season ticket holders, it measured 0,117 as strongest (this season).
Only one out of three items in the Ego factor had correlation for the groups. Chance of
winning the title had a significant correlation this season at the 0.01 level for the non-
season ticket holders (0,121). For the season ticket holders, this item didn’t correlate last
season.

26
All items in the Social factor had a correlation for the non-season ticket holders (at the 0.01
level), while Family tradition was the only item that correlated (at the 0.05 level) for the
season ticket holders.
In the factor Extrinsic, Price of tickets had no correlation. Section of the stadium showed
correlation for both populations, but stronger for the non-season ticket holders. I feel good
when visiting Gamla Ullevi showed a correlation for both groups.
Varying external factors had some items show a significant negative correlation. The
weather was negatively correlated for the non-season ticket holders' both seasons. For
season ticket holders The opposing team and Hyped game items were more correlated last
season compared to the current. Day of week was negatively correlated for both groups.

27
Chapter 5 Analysis and Discussion ________________________________________________________________________________________________________
In the fifth chapter we analyze and discuss the results yielded from the study. We propose
measures IFK Göteborg may take to increase the attendance on Gamla Ullevi. We draw
conclusions and then end the chapter by presenting suggestions on further research.
________________________________________________________________________________________________________
5.1 Analysis and Discussion
From analyzing the statistics we could see that the season ticket holders were more distinct
in their responses. The important items scored a higher mean while the less important
scored a lower one compared with the non-season ticket holders. The season ticket holders
were also motivated more strongly by a greater number of items. Considering the platform
in which the survey was distributed we can assume that many respondents were
supporters of IFK. It is also safe to assume that the season ticket holder sample is a more
homogenous group than its counterpart knowing that acquiring a season ticket is a
significant economic sacrifice. Respondents between both groups can still have the same
views just lacking the economic resources or the time required to invest.
Even though the survey was anonymous there is a possibility that respondents take on the
role of the dedicated supporter and responds in a way that socially should be expected
from them. Bryman & Bell (2013) argue that respondents may take another identity online.
The season ticket holders was the least motivated by weather which can be interpreted as
the weather doesn’t affect them, as to be expected from a dedicated supporter, not ruling
out that this is also the case.
In average both groups intended to attend one more game this season than they attended
last season. Chance of winning the title had a relatively high mean for both groups, people
might have felt an optimism when answering the survey in the beginning of the season.
This item has scored high in previous research as well (Hansen & Gauthier 1989). This is
also in line with the sports marketing literature which says that the clubs should market
the first team's progress to attract spectators (Ericsson & Persson 2013). However, no
correlation was found between Chance of winning the title and games attended.
28
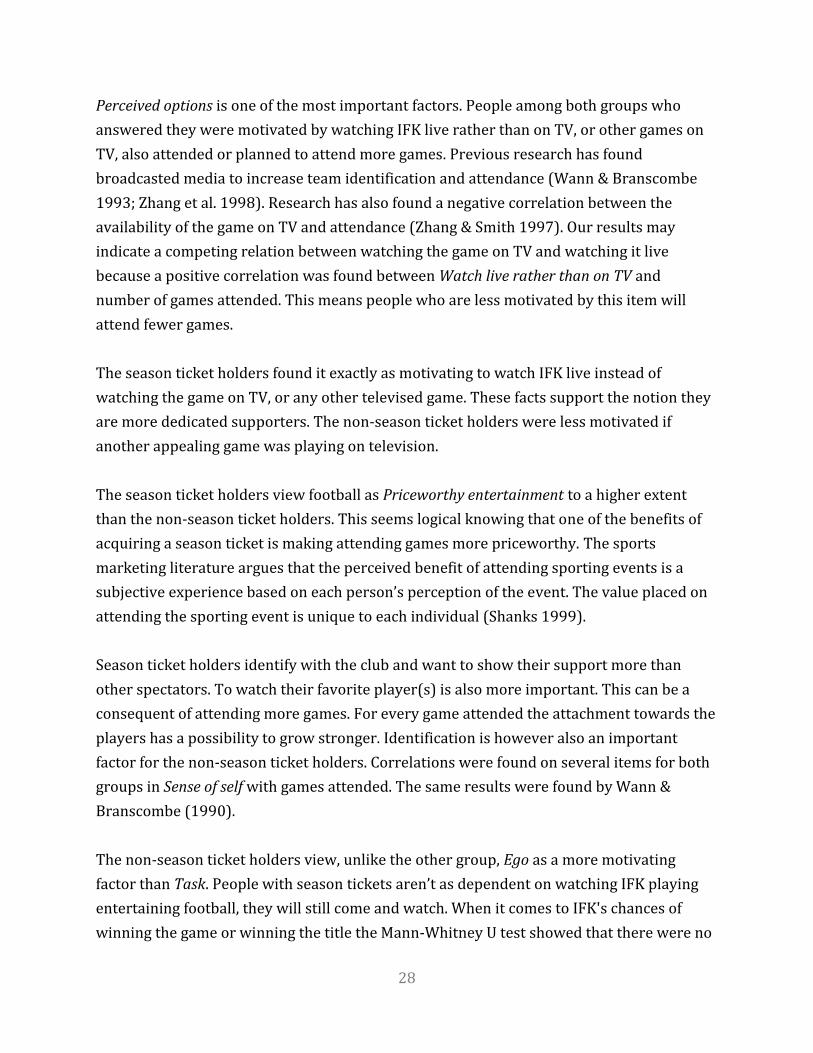
Perceived options is one of the most important factors. People among both groups who
answered they were motivated by watching IFK live rather than on TV, or other games on
TV, also attended or planned to attend more games. Previous research has found
broadcasted media to increase team identification and attendance (Wann & Branscombe
1993; Zhang et al. 1998). Research has also found a negative correlation between the
availability of the game on TV and attendance (Zhang & Smith 1997). Our results may
indicate a competing relation between watching the game on TV and watching it live
because a positive correlation was found between Watch live rather than on TV and
number of games attended. This means people who are less motivated by this item will
attend fewer games.
The season ticket holders found it exactly as motivating to watch IFK live instead of
watching the game on TV, or any other televised game. These facts support the notion they
are more dedicated supporters. The non-season ticket holders were less motivated if
another appealing game was playing on television.
The season ticket holders view football as Priceworthy entertainment to a higher extent
than the non-season ticket holders. This seems logical knowing that one of the benefits of
acquiring a season ticket is making attending games more priceworthy. The sports
marketing literature argues that the perceived benefit of attending sporting events is a
subjective experience based on each person’s perception of the event. The value placed on
attending the sporting event is unique to each individual (Shanks 1999).
Season ticket holders identify with the club and want to show their support more than
other spectators. To watch their favorite player(s) is also more important. This can be a
consequent of attending more games. For every game attended the attachment towards the
players has a possibility to grow stronger. Identification is however also an important
factor for the non-season ticket holders. Correlations were found on several items for both
groups in Sense of self with games attended. The same results were found by Wann &
Branscombe (1990).
The non-season ticket holders view, unlike the other group, Ego as a more motivating
factor than Task. People with season tickets aren’t as dependent on watching IFK playing
entertaining football, they will still come and watch. When it comes to IFK's chances of
winning the game or winning the title the Mann-Whitney U test showed that there were no

29
differences between the two populations. This test also showed that there were no
differences between the populations when it came to Love for the sport, Atmosphere, Family
tradition, and Stadium accessibility. Why these specific items are identical we can’t explain
with this study.
Season ticket holders view the social aspects like spending time with family and meet
friends as more motivating reasons for visiting Gamla Ullevi. Watching football can be
regarded as a social activity and if you attend many games with the same people this will
surely result in the creation of a social network that exists at Gamla Ullevi.
The non-season ticket holders who are motivated by the social aspects are attending more
games, while there is no correlation for the season ticket holders except from Family
Tradition (at the 0.05 level). Season ticket holders who are less motivated by the social
aspects might have other reasons motivating them to attend, e.g. stronger team
identification than the non-season ticket holders.
The Section of the stadium item has much more meaning to the season ticket holders. This
is probably due to the fact that if they choose poorly they are stuck with the same seat for
all of the season. People who buy tickets separately can have different seats for every game,
if the seat is bad they don’t need to sit there again. Seating is one of the tangible aspects the
clubs should highlight when not promoting the game itself according to the sports
marketing literature (Shanks 1999).
Both groups show relatively low motivation towards the Ticket price item. This should be
expected since it’s hard to imagine anyone being motivated paying for something unless it
was for a bargain price. Overall this particular item is on its own not obvious how to
interpret. Is the ticket price ranked low because the respondent doesn’t care about the
price, or is it because they consider the price to high? By comparing it to the Priceworthy
entertainment item which scored high we can draw the conclusion it’s the former,
particularly for season ticket holders. The Mann-Whitney U test shows that there is no
difference between the two populations regarding the ticket price item. We still believe
that ticket price is important when becoming a season ticket holder, it’s just not dealt with
when using a single Likert-scale item with no follow-up questions. Saving money should
reasonably be one of the main reason one acquires a season ticket, knowing that few games
actually sell out.
30
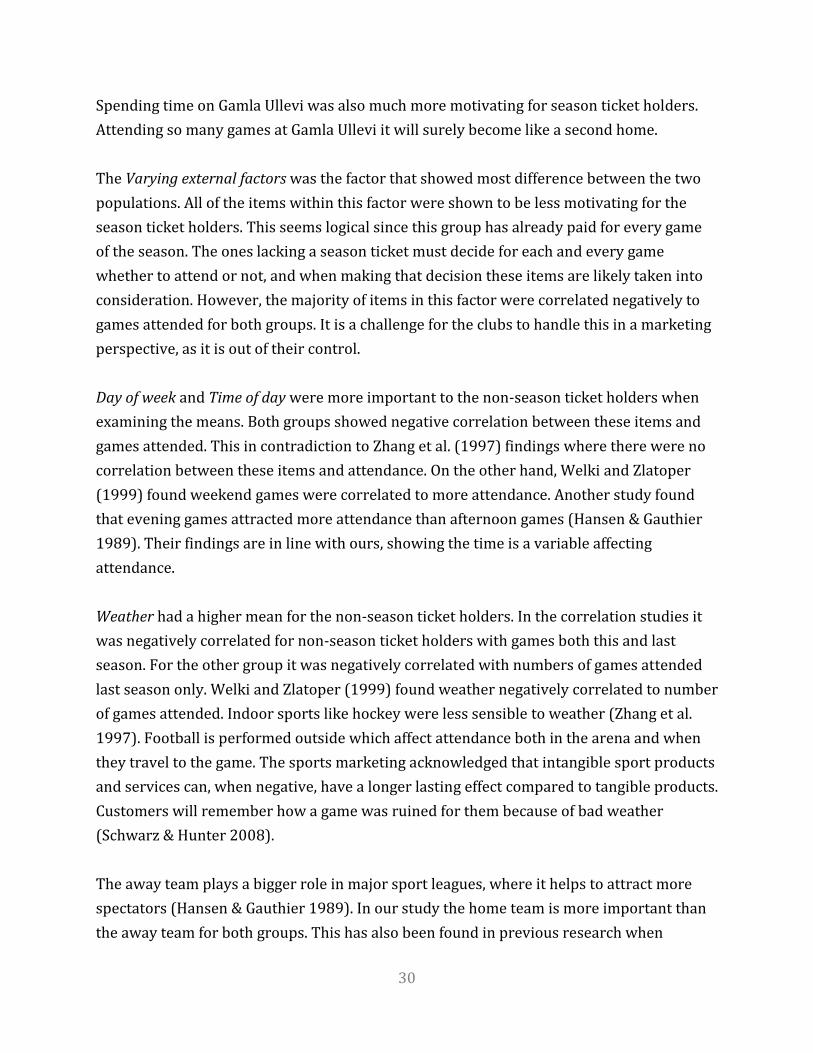
Spending time on Gamla Ullevi was also much more motivating for season ticket holders.
Attending so many games at Gamla Ullevi it will surely become like a second home.
The Varying external factors was the factor that showed most difference between the two
populations. All of the items within this factor were shown to be less motivating for the
season ticket holders. This seems logical since this group has already paid for every game
of the season. The ones lacking a season ticket must decide for each and every game
whether to attend or not, and when making that decision these items are likely taken into
consideration. However, the majority of items in this factor were correlated negatively to
games attended for both groups. It is a challenge for the clubs to handle this in a marketing
perspective, as it is out of their control.
Day of week and Time of day were more important to the non-season ticket holders when
examining the means. Both groups showed negative correlation between these items and
games attended. This in contradiction to Zhang et al. (1997) findings where there were no
correlation between these items and attendance. On the other hand, Welki and Zlatoper
(1999) found weekend games were correlated to more attendance. Another study found
that evening games attracted more attendance than afternoon games (Hansen & Gauthier
1989). Their findings are in line with ours, showing the time is a variable affecting
attendance.
Weather had a higher mean for the non-season ticket holders. In the correlation studies it
was negatively correlated for non-season ticket holders with games both this and last
season. For the other group it was negatively correlated with numbers of games attended
last season only. Welki and Zlatoper (1999) found weather negatively correlated to number
of games attended. Indoor sports like hockey were less sensible to weather (Zhang et al.
1997). Football is performed outside which affect attendance both in the arena and when
they travel to the game. The sports marketing acknowledged that intangible sport products
and services can, when negative, have a longer lasting effect compared to tangible products.
Customers will remember how a game was ruined for them because of bad weather
(Schwarz & Hunter 2008).
The away team plays a bigger role in major sport leagues, where it helps to attract more
spectators (Hansen & Gauthier 1989). In our study the home team is more important than
the away team for both groups. This has also been found in previous research when
31
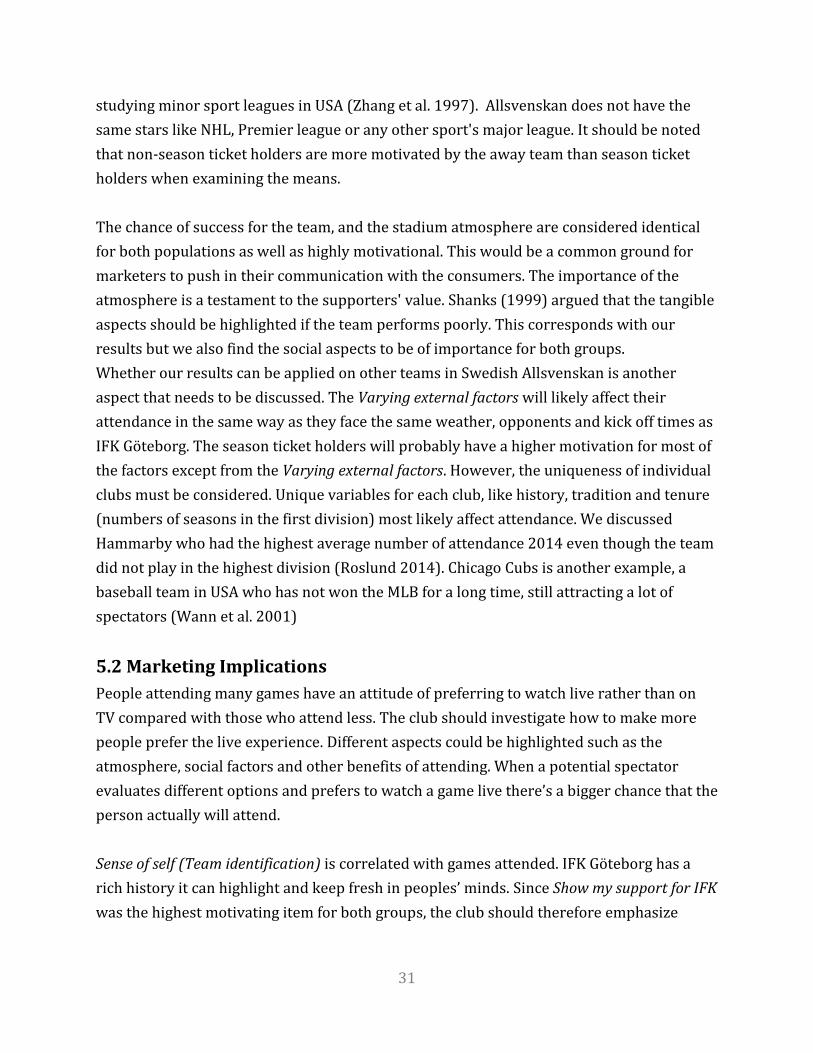
studying minor sport leagues in USA (Zhang et al. 1997). Allsvenskan does not have the
same stars like NHL, Premier league or any other sport's major league. It should be noted
that non-season ticket holders are more motivated by the away team than season ticket
holders when examining the means.
The chance of success for the team, and the stadium atmosphere are considered identical
for both populations as well as highly motivational. This would be a common ground for
marketers to push in their communication with the consumers. The importance of the
atmosphere is a testament to the supporters' value. Shanks (1999) argued that the tangible
aspects should be highlighted if the team performs poorly. This corresponds with our
results but we also find the social aspects to be of importance for both groups.
Whether our results can be applied on other teams in Swedish Allsvenskan is another
aspect that needs to be discussed. The Varying external factors will likely affect their
attendance in the same way as they face the same weather, opponents and kick off times as
IFK Göteborg. The season ticket holders will probably have a higher motivation for most of
the factors except from the Varying external factors. However, the uniqueness of individual
clubs must be considered. Unique variables for each club, like history, tradition and tenure
(numbers of seasons in the first division) most likely affect attendance. We discussed
Hammarby who had the highest average number of attendance 2014 even though the team
did not play in the highest division (Roslund 2014). Chicago Cubs is another example, a
baseball team in USA who has not won the MLB for a long time, still attracting a lot of
spectators (Wann et al. 2001)
5.2 Marketing Implications
People attending many games have an attitude of preferring to watch live rather than on
TV compared with those who attend less. The club should investigate how to make more
people prefer the live experience. Different aspects could be highlighted such as the
atmosphere, social factors and other benefits of attending. When a potential spectator
evaluates different options and prefers to watch a game live there’s a bigger chance that the
person actually will attend.
Sense of self (Team identification) is correlated with games attended. IFK Göteborg has a
rich history it can highlight and keep fresh in peoples’ minds. Since Show my support for IFK
was the highest motivating item for both groups, the club should therefore emphasize
32
people’s chance of showing their supportership, e.g. Facebook Check Ins and Instagram
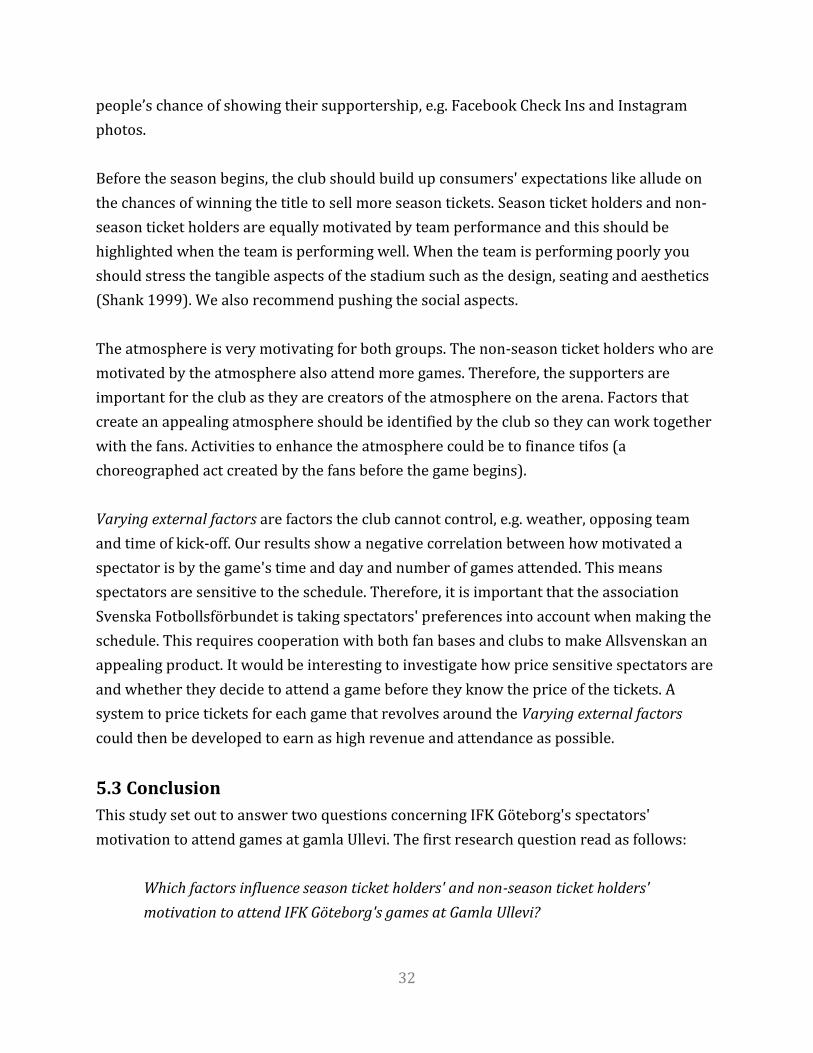
photos.
Before the season begins, the club should build up consumers' expectations like allude on
the chances of winning the title to sell more season tickets. Season ticket holders and non-
season ticket holders are equally motivated by team performance and this should be
highlighted when the team is performing well. When the team is performing poorly you
should stress the tangible aspects of the stadium such as the design, seating and aesthetics
(Shank 1999). We also recommend pushing the social aspects.
The atmosphere is very motivating for both groups. The non-season ticket holders who are
motivated by the atmosphere also attend more games. Therefore, the supporters are
important for the club as they are creators of the atmosphere on the arena. Factors that
create an appealing atmosphere should be identified by the club so they can work together
with the fans. Activities to enhance the atmosphere could be to finance tifos (a
choreographed act created by the fans before the game begins).
Varying external factors are factors the club cannot control, e.g. weather, opposing team
and time of kick-off. Our results show a negative correlation between how motivated a
spectator is by the game's time and day and number of games attended. This means
spectators are sensitive to the schedule. Therefore, it is important that the association
Svenska Fotbollsförbundet is taking spectators' preferences into account when making the
schedule. This requires cooperation with both fan bases and clubs to make Allsvenskan an
appealing product. It would be interesting to investigate how price sensitive spectators are
and whether they decide to attend a game before they know the price of the tickets. A
system to price tickets for each game that revolves around the Varying external factors
could then be developed to earn as high revenue and attendance as possible.
5.3 Conclusion
This study set out to answer two questions concerning IFK Göteborg's spectators'
motivation to attend games at gamla Ullevi. The first research question read as follows:
Which factors influence season ticket holders' and non-season ticket holders'
motivation to attend IFK Göteborg's games at Gamla Ullevi?

33
The item that scored the highest mean for both groups was Show my support for IFK. The
most motivating factor for both groups was Perceived options. In this factor, the two items
Watch IFK live rather than on TV and Watch IFK live rather than other football on TV,
correlated positively with the numbers of games attended for both groups. The second
most important motivating factor was Sense of self (team identification) where the item I
identify with the club had a positive correlation with numbers of games attended for both
groups.
The team's performance (Ego) has been considered the most important factor for
attendance in some previous studies (Guttmann 1986; Zhang et al. 1995). We found it
important but not as important as Perceived options and Sense of self (team identification).
However, which factor that is to be considered the most motivating for IFK Göteborg's
attendees we can’t say for certain, the channel through which we collected the data (IFK
Göteborg's official Facebook and Twitter) may not be representative for the whole
population.
Varying external factors correlated negatively with the number of games attended. This
means people may refrain from attending depending on the opponent team or the weather.
The second research question constructed for this study was the following:
Is there a difference between season ticket holders' and non-season ticket holders'
motivation to attend IFK Göteborg's games at Gamla Ullevi?
We found that season ticket holders were motivated more strongly by a greater number of
items when examining the measure of central tendency. 7 out of 26 items were identified
as identical between the two populations when performing the Mann-Whitney U test.
Varying external factors is the factor that differ the most between the two populations
(1,063 factor mean difference). These items are less motivating for the season ticket
holders.
5.4 Suggestions on Further Research
This study could be complemented by examining the team at several occasions throughout
the season with random survey samples at the stadium. We suggest further research also

34
could concentrate on qualitative methods. A qualitative study can yield a deeper
understanding for the spectators’ motivation to attend sporting events.
A comparison between spectators' motivation of different clubs in Allsvenskan would
contribute to knowledge about the league as a whole. Also, segment the spectators in
another way, such as standing audience, teenagers, families and seniors, to see how they
differ from each other in their motivation to attend.
35
Chapter 6 References ________________________________________________________________________________________________________
The references are presented according to the Harvard system. The references are divided
into literature, articles and electronic resources.
________________________________________________________________________________________________________
6.1 Literature
Bryman, A. & Bell, E. (2013). Företagsekonomiska forskningsmetoder. [Business Research
Methods] Trans. Nilsson, B. 2. ed. Stockholm: Liber.
Cortinhas, C. & Black, K. (2012). Statistics For Business And Economics. Chichester, West
Sussex: John Wiley & Sons.
Danielson, M.N. (1997). Home team: Professional sports and the American metropolis.
Princeton, NJ: Princeton University Press.
Deci, E.L. & Ryan, R.M. (1985). Intrinsic motivation and determination in human behavior.
New York: Plenum Press.
Ericsson, A. & Persson, J. (2013). Sport Marketing. 1. ed. Danderyd: JP Business Consulting.
Guttman, A. (1986). Sports spectators. New York: Columbia University Press.
Maehr, M.L., & Braskamp, L.A. (1986). The motivation factor: A theory of personal
investment. Lexington, MA: Lexington Books.
Rein, I. J., Kotler, P., & Shields, B. (2006). The elusive fan: Reinventing sports in a crowded
marketplace. McGraw-Hill Companies.
Schwarz, E.C. & Hunter, J.D. (2008). Advanced theory and practice in sport marketing.
Oxford: Butterworth-Heinemann.
Shank, M.D. (1999). Sports Marketing: A Strategic Perspective. Upper Saddle River, New
Jersey: Prentice Hall.
36
Sloan, L.R. (1989) The motives of sport fans. in J.D. Goldstein (Ed.), Sports, games, and play:
Social and psychosocial viewpoints. 2. ed. Hillsdale, NJ: Lawrence Erlbaum Associates.
Wann, D.L., Melnick, M.J, Russell, G.W. & Pease, D.G. (2001), Sport fans: the psychology and
social impact of spectators. New York: Routledge. pp. 23-68
6.2 Articles
Alonso Dos Santos, M. & Montoro Rios, F.J. (2014). Scale of spectators’ motivations at soccer
events. Soccer & Society, pp. 1-14.
Beccarini, C. & Ferrand, A. (2006). Factors Affecting Soccer Club Season Ticket Holders'
Satisfaction: The Influence of Club Image and Fans' Motives. European Sport Management
Quarterly, vol. 6, no. 1, pp. 1-22.
Cialdini, R.B. (1976). Basking in reflected glory: Three (football) field studies. Journal of
personality and social psychology, vol. 34, no. 3, pp. 366-375.
Duda, J.L., Smart, A.E., & Tappe, M.K. (1989). Predictors of adherence in the rehabilitation of
athletic injuries: An application of personal investment theory. Journal of Sport and Exercise
Psychology, vol.4, no. 11, pp. 367-381.
Kuzon, J.,W M., Urbanchek, M.G. & McCabe, S. (1996). The seven deadly sins of statistical
analysis. Annals of Plastic Surgery, vol. 37, no. 3, pp. 265.
Mahony, D.F., Nakazawa, M., Funk, D.C., James, J.D. & Gladden, J.M. (2002).
Motivational Factors Influencing the Behaviour of J. League Spectators. Sport Management
Review, vol. 5, no. 1, pp. 1-24.
Gantz, W. & Wenner, L.A. (1995). Fanship and the television sports viewing experience,
Sociology of Sport Journal, vol. 12, no. 1, pp. 56.
Hansen, H., & Gauthier, R. (1989). Factors affecting attendance at professional sport event.
Journal of Sport Management, vol. 3, no.1, pp. 15-32.

37
Jamieson, S. (2004). Likert scales: how to (ab)use them. Medical education, vol. 38, no. 12,
pp. 1217-1218.
Pan, D.W., Gabert, T.E., McGaugh, E.C. & Branvold, S.E. (1997) Factors and differential
demographic effects on purchases of season tickets for Intercollegiate Basketball Games.
Journal of sport behavior, vol. 20, no. 4, pp. 447-464.
Smith, R.H., Turner, T.J., Garonzik, R., Leach, C.W., Urch-Druskat, V. & Weston, C.M. (1996).
Envy and Schadenfreude. Personality and Social Psychology Bulletin, vol. 22, no. 2, pp. 158-
168.
Wann, D.L., & Branscombe, N.R. (1990). Die-hard and fair-weather fans: Effects of
identification on BIRGing and CORFing tendencies. Journal of Sport & Social Issues, vol. 14,
no. 2, pp. 103-117.
Wann, D.L., & Branscombe, N.R. (1993). Sport fans: Measuring degree of identification with
the team. International Journal of Sport Psychology, vol. 24, no. 1, pp. 1-17.
Welki, A.M., & Zlatoper, T.J. (1999). U.S. professional football game-day attendance. Atlantic
Economic Journal, vol. 27, no. 3, pp. 285-298.
Zhang, J.J., Pease, D.G., Hui, S.C., & Michaud, T.J. (1995). Variables affecting the spectator
decision to attend NBA games. Sports Marketing Quarterly, vol.5, no. 4, pp. 29-39.
Zhang, J. J., Pease, D. G., Smith, D. W. (1998). Relationship between broadcasting media and
minor league hockey game attendance. Journal of Sport Management, 12, pp. 103-122.
Zhang, J. J., Pease, D. G., Smith, D. W., Lee, J. T., Lam, T. C., & Jambor, E. A. (1997). Factors
affecting the decision making of spectators to attend minor league hockey games.
International Sports Journal, vol. 1, no. 1 pp. 39-53.
Zhang, J.J., & Smith, D.W. (1997). Impact of broadcasting on the attendance of professional
basketball games. Sport marketing quarterly, vol. 6, no. 1, pp. 23-29.
38
6.3 Electronic Sources
Andersson, M. (2014-05-20). AIK:s snitt sämre än väntat: “Inte nöjda”. Expressen.
http://www.expressen.se/sport/fotboll/allsvenskan/aiks-snitt-samre-an-vantat-inte-
nojda/ [2015-05-07]
Balkander, M. (2015-03-31). Uppdaterade årskortssiffror. Göteborgsposten.
http://blogg.gp.se/balkander/2015/03/31/15537/ [2015-05-18]
Got Event AB. [no date]. Gamla Ullevi. http://www.gamlaullevi.se/arenan/ [2015-05-14]
IFK Göteborg. (2015) Meriter. http://www.ifkgoteborg.se/Om-IFK-
Goteborg/Presentation/Meriter/ [2015-05-14]
Junelind, H., & Ohlsson, A. (2015-03-05). Därför ser Blåvitt upp till AIK och Hammarby.
Expressen. http://www.expressen.se/gt/sport/darfor-ser-blavitt-upp-till-aik-och-
hammarby/ [2015-05-07]
Olshov, A. (2015) Svensk och dansk klubblagsfotboll. Ny våg av svenska spelare till danska
superligan - som rasat till allsvenskans nivå Malmö: Øresundsinstituttet.
http://www.oresundsinstituttet.org/wp-
content/uploads/2015/03/Fotbollsanalys_20150313_SE_webb.pdf [2015-05-07]
Rosander, A. (2015-01-19) Blåvitt vill se ett snitt på 14000 åskådare. Göteborgsposten.
http://www.gp.se/sport/fotboll/ifkgoteborg/1.2604940-blavitt-vill-se-ett-snitt-pa-14-
000-askadare [2015-05-07]
Roslund, E.E. (2014-07-04) Hammarby - bäst i Sverige. SVT.
http://www.svt.se/sport/fotboll/hammarby-bast-i-sverige [2015-05-07]
Svenska fotobllsförbundet (SvFF). (2013a) Analys av allsvenska klubbarnas ekonomi 2013.
http://fogis.se/ImageVault/Images/id_108105/scope_0/ImageVaultHandler.aspx [2015-
05-07]
39
Svenska fotbollsförbundet (SvFF). (2013b) Statistik/ligor - Publikliga 2013.
http://svenskfotboll.se/allsvenskan/tidigare-ar/resultat-2013/statistikligor/?scr=spl
[2015-05-07]
Svenska fotbollsförbundet (SvFF). (2014-08-17a) Matchinformation: IFK Göteborg mot IF
Brommapojkarna. http://svenskfotboll.se/allsvenskan/match/?scr=result&fmid=2663211
[2015-05-07]
Svenska fotbollsförbundet (SvFF). (2014b) Statistik/ ligor - Publikliga 2014.
http://svenskfotboll.se/allsvenskan/tidigare-ar/resultat-2014/statistikligor/?scr=spl
[2015-05-07]
UEFA. (2015a). History. http://www.uefa.com/uefaeuropaleague/history/index.html
[2015-05-14]
UEFA. (2015-05-06b). UEFA ranking for club competitions.
http://www.uefa.com/memberassociations/uefarankings/country/index.html [2015-05-
06]
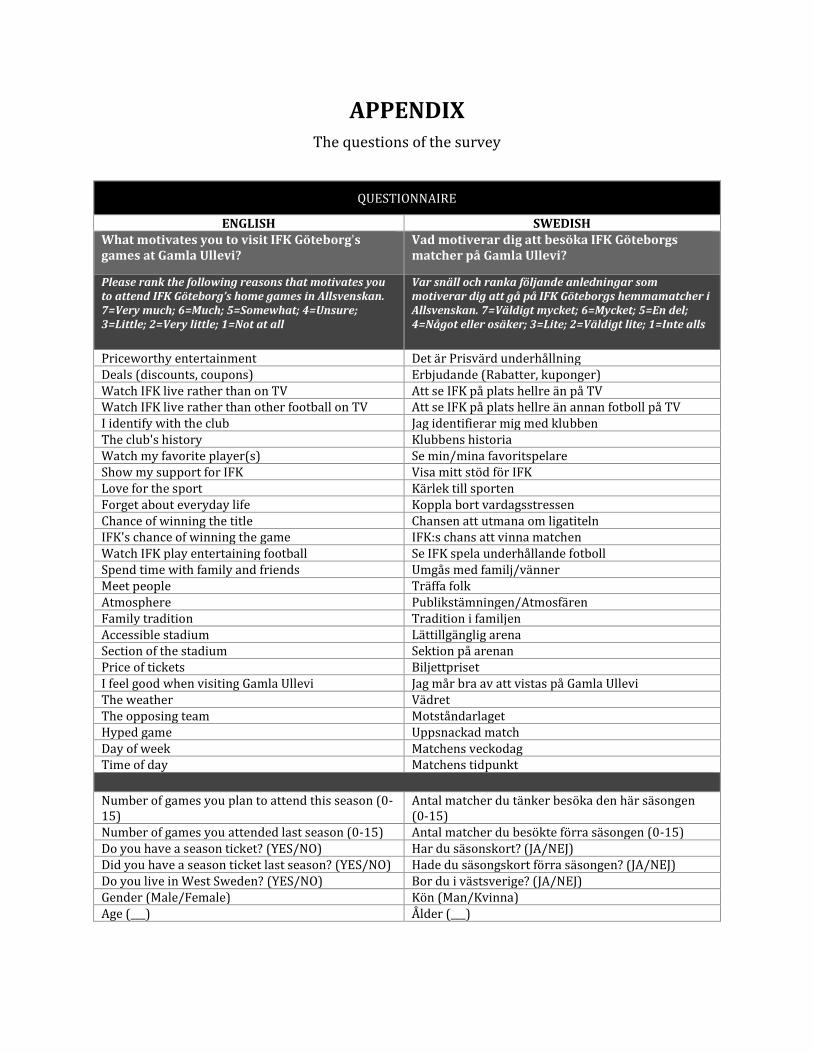
APPENDIX
The questions of the survey
QUESTIONNAIRE
ENGLISH SWEDISH What motivates you to visit IFK Göteborg's games at Gamla Ullevi?
Vad motiverar dig att besöka IFK Göteborgs matcher på Gamla Ullevi?
Please rank the following reasons that motivates you to attend IFK Göteborg’s home games in Allsvenskan. 7=Very much; 6=Much; 5=Somewhat; 4=Unsure; 3=Little; 2=Very little; 1=Not at all
Var snäll och ranka följande anledningar som motiverar dig att gå på IFK Göteborgs hemmamatcher i Allsvenskan. 7=Väldigt mycket; 6=Mycket; 5=En del; 4=Något eller osäker; 3=Lite; 2=Väldigt lite; 1=Inte alls
Priceworthy entertainment Det är Prisvärd underhållning Deals (discounts, coupons) Erbjudande (Rabatter, kuponger) Watch IFK live rather than on TV Att se IFK på plats hellre än på TV Watch IFK live rather than other football on TV Att se IFK på plats hellre än annan fotboll på TV I identify with the club Jag identifierar mig med klubben The club's history Klubbens historia Watch my favorite player(s) Se min/mina favoritspelare Show my support for IFK Visa mitt stöd för IFK Love for the sport Kärlek till sporten Forget about everyday life Koppla bort vardagsstressen Chance of winning the title Chansen att utmana om ligatiteln IFK's chance of winning the game IFK:s chans att vinna matchen Watch IFK play entertaining football Se IFK spela underhållande fotboll Spend time with family and friends Umgås med familj/vänner Meet people Träffa folk Atmosphere Publikstämningen/Atmosfären Family tradition Tradition i familjen Accessible stadium Lättillgänglig arena Section of the stadium Sektion på arenan Price of tickets Biljettpriset I feel good when visiting Gamla Ullevi Jag mår bra av att vistas på Gamla Ullevi The weather Vädret The opposing team Motståndarlaget Hyped game Uppsnackad match Day of week Matchens veckodag Time of day Matchens tidpunkt Number of games you plan to attend this season (0-15)
Antal matcher du tänker besöka den här säsongen (0-15)
Number of games you attended last season (0-15) Antal matcher du besökte förra säsongen (0-15) Do you have a season ticket? (YES/NO) Har du säsonskort? (JA/NEJ) Did you have a season ticket last season? (YES/NO) Hade du säsongskort förra säsongen? (JA/NEJ) Do you live in West Sweden? (YES/NO) Bor du i västsverige? (JA/NEJ) Gender (Male/Female) Kön (Man/Kvinna) Age (___) Ålder (___)