Synchronous Reference Frame with Finite Impulse Response ...
Upload
khangminh22Category
view
2download
0
Factors influencing impulse buying behaviour
amongst Generation Y students
J.A. Neves
STUDENT NUMBER: 23548193
Dissertation submitted in fulfilment of the requirements for the
degree
MAGISTER COMMERCII
in the discipline of
MARKETING MANAGEMENT
in the
FACULTY OF ECONOMIC SCIENCES AND INFORMATION TECHNOLOGY
at the
North-West University VAAL TRIANGLE CAMPUS
Supervisor: Dr E. Redda
Co-supervisor: Prof N. de Klerk
Vanderbijlpark
2016
i
DECLARATION
I declare that:
“Factors influencing impulse buying behaviour amongst Generation Y students”
is my own work, that all the sources used or quoted have been identified and
acknowledged by means of complete references and that this dissertation has not
previously been submitted by me for a degree at any other university.
________________________
J A Neves
November 2016
Vanderbijlpark
ii
ACKNOWLEDGEMENTS
A special word of thanks to the following persons who assisted me in completing this
study:
To God, for the continuous inspiration, love and strength
To my loving parents, Lara and Manuel Neves, for their strength, continuous
encouragement and love
To my better half, Yorik Weber, for his understanding, patience, constant
support and love
To my supervisor, Dr Ephrem Redda, for his kind words, constant motivation,
guidance and expertise in assisting me to complete the study
To my co-supervisor, Prof Natasha de Klerk, who provided additional guidance
and expertise in assisting me to complete the study
To the other master students, for their continuous motivation and support
To Aldine Oosthuyzen of the North-West University (Vaal Triangle Campus) for
assisting me with expert advice and assistance for the statistical procedures
followed within the study
To Linda Scott, for her professionalism in the language editing of this study
To the undergraduate students who participated in the piloting of the
questionnaire
To the undergraduate students who participated in the main questionnaire of the
final study
To the rest of my family, friends and colleagues who gave additional support
and advice in assisting me to complete this study.
Jacinta Ana Neves
Vanderbijlpark
2016

iii
LETTER FROM THE LANGUAGE EDITOR
Ms Linda Scott
English language editing
SATI membership number: 1002595
Tel: 083 654 4156
E-mail: [email protected]
6 November 2016
To whom it may concern
This is to confirm that I, the undersigned, have language edited the dissertation of
J.A. Neves
for the degree
MAGISTER COMMERCII : MARKETING MANAGEMENT
entitled:
Factors influencing impulse buying behaviour amongst
Generation Y students
The responsibility of implementing the recommended language changes rests with
the author of the dissertation.
Yours truly,
Linda Scott
iv
ABSTRACT
Factors influencing impulse buying behaviour amongst Generation Y students
Keywords: impulse buying behaviour, external factors, situational factors, consumer
behaviour, Generation Y students, South Africa.
Impulse buying is regarded as an important phenomenon in the context of retail
business and marketing. Impulse buying is regarded as an important marketing tool
for maximising revenues for businesses as it signifies an extensive amount of
products sold in the retail environment. This is because impulse buying has
significant influence on consumer buying behaviour and consumer decision making.
As a result, impulse buying behaviour has been identified as a key research concern
amongst marketing scholars and marketing practitioners. Impulse buying behaviour
is an often-arising phenomenon experienced by consumers when purchasing
products. For example, in 2013, South African consumers spent, on average, R13.5
billion a month on impulse items. Most consumers buy impulsively at one time or
another. The literature indicates that impulse buying behaviour is influenced by
external and situational factors. External factors are defined as the attempts to entice
consumers into a purchasing behaviour by marketing cues that are placed and
controlled by the marketer or storeowner. External factors include in-store
atmosphere, in-store browsing, in-store layout, salespersons, promotions and
reference groups. Situational factors are defined as the actual or perceived time
available for shopping and the amount of spending power of consumers. In other
words, situational factors include time and money availability.
The subjects of this study were Generation Y students. Generation Y consumers are
an important marketing segment in the global marketplace, because they account for
40 percent of South Africa‟s total population of 55 908 000 in 2016. Generation Y
students are aged 18 to 24 years. In particular, Generation Y students are spending
more than the other generations in South Africa. The average student is spending
R3 510 per month, which amounts to R42 120 per annum per student. Therefore,
due to the population size of South African students, at approximately 938 000
students, together they have the potential to spend R39.5 billion per year, which
makes Generation Y students an attractive segment to target.
v
The purpose of this study was to determine the factors that influence impulse buying
behaviour amongst Generation Y students. The study employed a quantitative
approach in realising its objectives. The target population of this study comprised of
full-time undergraduate Generation Y students, aged between 18 and 24 years and
enrolled at South African registered public higher education institutions (HEIs). The
sampling frame comprised the 26 registered South African public HEIs. A non-
probability judgement sample was utilised to select two HEI campuses, a traditional
university and a university of technology, located in the Gauteng province, from the
sampling frame. For the purpose of this study, the sampling method used was a non-
probability convenience sample of 400 students (200 per institution). Convenience
sampling was used to select the participants from two HEI campuses situated in the
Gauteng province. The primary data were obtained by means of a survey method,
using a self-administered questionnaire, which was hand-delivered to the contacted
lecturers at each of the two HEIs. The questionnaire requested the students to
indicate on a six-point Likert scale the level of their agreement and disagreement on
49 items designed to measure what factors they found the most influential, as well as
to provide certain demographic data.
Based on the statistical analysis done in this study, marketers and businesses
should focus on in-store atmosphere, in-store browsing, promotions and reference
groups influencing Generation Y students‟ affective response. Retailers could use
the insights from the study when designing marketing strategies to increase revenue.
Findings from this study contribute to the growing body of research on consumer
shopping behaviour by highlighting factors influencing impulse buying behaviour
amongst Generation Y students. Marketing academics and researchers could use
this study to assist in further research.
Although there were other studies in the topic of impulse buying and shopping
behaviour, this study (determining the factors influencing impulse buying) was the
first conducted in South Africa. This study could answer questions some retailers
might have. Future research opportunities could consider using credit cards, which
can play a major role in impulse buying behaviour. This provides an opportunity to
determine whether credit cards can be a factor influencing impulse buying behaviour.
vi
TABLE OF CONTENTS
DECLARATION .......................................................................................................... I
ACKNOWLEDGEMENTS .......................................................................................... II
LETTER FROM THE LANGUAGE EDITOR ............................................................. III
ABSTRACT .............................................................................................................. IV
TABLE OF CONTENTS ............................................................................................ VI
LIST OF FIGURES.................................................................................................... XI
LIST OF TABLES .................................................................................................... XII
CHAPTER 1 ............................................................................................................... 1
INTRODUCTION AND BACKGROUND TO THE STUDY ......................................... 1
1.1 INTRODUCTION ........................................................................................... 1
1.2 PROBLEM STATEMENT .............................................................................. 4
1.3 OBJECTIVES OF THE STUDY ...................................................................... 5
1.3.1 Primary objective ........................................................................................... 5
1.3.2 Theoretical objectives .................................................................................... 5
1.3.3 Empirical objectives ....................................................................................... 5
1.4 HYPOTHESIS TESTING ............................................................................... 6
1.5 RESEARCH DESIGN AND METHODOLOGY ............................................... 7
1.5.1 Literature review ............................................................................................ 7
1.5.2 Empirical study .............................................................................................. 7
1.5.2.1 Target population .......................................................................................... 7
1.5.2.2 Sampling frame ............................................................................................. 7
1.5.2.3 Sample method ............................................................................................. 8
1.5.2.4 Sample size ................................................................................................... 8
1.5.2.5 Measuring instrument and data collection method ........................................ 8
1.5.3 Statistical analysis ......................................................................................... 9
1.6 ETHICAL CONSIDERATIONS .................................................................... 10
1.7 CHAPTER CLASSIFICATION ..................................................................... 10
1.8 GENERAL ................................................................................................... 11
1.9 CLARIFICATION OF KEY CONCEPTS ....................................................... 11
vii
1.10 SYNOPSIS .................................................................................................. 12
CHAPTER 2 ............................................................................................................. 14
IMPULSE BUYING .................................................................................................. 14
2.1 INTRODUCTION ......................................................................................... 14
2.2 CONSUMER BEHAVIOUR .......................................................................... 14
2.2.1 Defining consumer behaviour ...................................................................... 14
2.2.2 Decision-making process ............................................................................ 15
2.2.1.1 Step 1: Problem recognition ........................................................................ 16
2.2.1.2 Step 2: Information search .......................................................................... 16
2.2.1.3 Step 3: Pre-purchase alternative evaluation ................................................ 17
2.2.1.4 Step 4: Purchase ......................................................................................... 18
2.2.1.5 Step 5: Post-purchase evaluation ................................................................ 18
2.3 IMPULSE BUYING ...................................................................................... 20
2.3.1 Defining impulse buying .............................................................................. 20
2.3.2 Impulse buying process ............................................................................... 22
2.3.2.1 Step 1: Browsing (product awareness) ........................................................ 22
2.3.2.2 Step 2: Create desire .................................................................................. 23
2.3.2.3 Step 3: Purchase decision ........................................................................... 23
2.3.2.4 Step 4: Post-purchase evaluation ................................................................ 23
2.3.3 Types of impulse buying .............................................................................. 23
2.3.3.1 Pure impulse buying .................................................................................... 24
2.3.3.2 Reminder impulse buying ............................................................................ 24
2.3.3.3 Suggestion impulse buying ......................................................................... 25
2.3.3.4 Planned impulse buying .............................................................................. 25
2.3.4 Levels of involvement .................................................................................. 25
2.3.4.1 Low involvement products ........................................................................... 26
2.3.4.2 High involvement products .......................................................................... 26
2.4 FACTORS INFLUENCING IMPULSE BUYING BEHAVIOUR ..................... 27
2.4.1 Impulse buying behaviour ........................................................................... 27
2.4.1.1 Cognitive response ...................................................................................... 28
2.4.1.2 Affective response ....................................................................................... 28
2.4.2 External factors ........................................................................................... 28
2.4.2.1 In-store atmosphere .................................................................................... 30
viii
2.4.2.2 In-store browsing ......................................................................................... 30
2.4.2.3 In-store layout .............................................................................................. 31
2.4.2.4 Salespersons ............................................................................................... 32
2.4.2.5 Promotions .................................................................................................. 32
2.4.2.6 Reference groups ........................................................................................ 32
2.4.3 Situational factors ........................................................................................ 33
2.4.3.1 Time availability ........................................................................................... 33
2.4.3.2 Money availability ........................................................................................ 34
2.5 GENERATION Y COHORT ......................................................................... 34
2.6 SYNOPSIS .................................................................................................. 35
CHAPTER 3 ............................................................................................................. 37
RESEARCH METHODOLOGY ................................................................................ 37
3.1 INTRODUCTION ......................................................................................... 37
3.2 RESEARCH DESIGN .................................................................................. 38
3.3 RESEARCH APPROACH ........................................................................... 39
3.4 SAMPLING STRATEGY .............................................................................. 39
3.4.1 Target population ........................................................................................ 40
3.4.2 Sampling frame ........................................................................................... 40
3.4.3 Sample method ........................................................................................... 40
3.4.4 Sample size ................................................................................................. 41
3.5 DATA COLLECTION METHOD ................................................................... 41
3.5.1 Questionnaire design .................................................................................. 42
3.5.2 Questionnaire format ................................................................................... 43
3.5.3 Questionnaire layout ................................................................................... 46
3.6 PRE-TESTING OF THE QUESTIONNAIRE ................................................ 47
3.7 ADMINISTRATION OF THE QUESTIONNAIRE .......................................... 48
3.8 PRELIMINARY DATA ANALYSIS ............................................................... 48
3.9 STATISTICAL ANALYSIS ........................................................................... 49
3.9.1 Factor analysis ............................................................................................ 50
3.9.2 Reliability analysis ....................................................................................... 51
3.9.3 Validity analysis ........................................................................................... 51
3.9.4 Descriptive statistical analysis ..................................................................... 53
3.9.5 Correlation analysis ..................................................................................... 54
ix
3.9.6 Significance tests ........................................................................................ 55
3.9.6.1 Regression analysis .................................................................................... 56
3.9.6.2 T-test………………………………………………………………………………. 56
3.10 SYNOPSIS .................................................................................................. 57
CHAPTER 4 ............................................................................................................. 59
DATA ANALYSIS AND INTEPRETATION .............................................................. 59
4.1 INTRODUCTION ......................................................................................... 59
4.2 PILOT TEST RESULTS ............................................................................... 59
4.3 PRELIMINARY DATA ANALYSIS ............................................................... 62
4.3.1 Coding ......................................................................................................... 63
4.3.2 Data gathering process ............................................................................... 65
4.3.3 Tabulation of variables ................................................................................ 66
4.4 DESCRIPTIVE ANALYSIS .......................................................................... 67
4.4.1 Demographic Information ............................................................................ 67
4.4.2 Impulse purchasing information ................................................................... 73
4.4.3 Confirmatory factor analysis ........................................................................ 75
4.4.4 Reliability and validity analysis of main study .............................................. 79
4.4.5 Descriptive statistics .................................................................................... 81
4.5 CORRELATION ANALYSIS ........................................................................ 83
4.6 TEST OF SIGNIFICANCE ........................................................................... 84
4.6.1 Regression analysis .................................................................................... 84
4.6.2 Two independent-samples t-test ................................................................. 88
4.7 SYNOPSIS .................................................................................................. 90
CHAPTER 5 ............................................................................................................. 91
SUMMARY, CONCLUSIONS AND RECOMMENDATIONS ................................... 91
5.1 INTRODUCTION ......................................................................................... 91
5.2 OVERVIEW OF THE STUDY ...................................................................... 91
5.3 MAIN FINDINGS OF THE STUDY ............................................................... 93
5.3.1 External factors of in-store atmosphere, in-store browsing, salespersons,
promotions and reference groups‟ that influence Generation Y students‟ cognitive
response to buy on impulse ..................................................................................... 93
x
5.3.2 External factors of in-store atmosphere, in-store browsing, salespersons,
promotions and reference groups‟ that influence Generation Y students‟ affective
response to buy on impulse ..................................................................................... 94
5.3.3 Situational factors of time availability and money availability that influence
Generation Y students‟ cognitive response to buy on impulse ................................. 95
5.3.4 Situational factors of time availability and money availability that influence
Generation Y students‟ affective response to buy on impulse .................................. 96
5.3.5 Gender differences concerning Generation Y students impulse buying
behaviour ................................................................................................................. 97
5.4 RECOMMENDATIONS ............................................................................... 97
5.4.1 Utilise impulse buying behaviour of the consumer ...................................... 98
5.4.2 Utilise external factors to influence impulse buying behaviour .................... 99
5.4.3 Utilise situational factors to influence impulse buying behaviour ............... 100
5.4.4 Utilise similar appeal to target Generation Y males and females .............. 100
5.5 CONTRIBUTIONS OF THE STUDY .......................................................... 101
5.6 LIMITATIONS AND FUTURE RESEARCH OPPORTUNITIES .................. 102
5.7 CONCLUDING REMARKS ........................................................................ 103
REFERENCE LIST ................................................................................................ 104
APPENDIX A ......................................................................................................... 121
COVER LETTER.................................................................................................... 121
SECTION A: DEMOGRAPHIC INFORMATION .................................................... 122
SECTION B: IMPULSE PURCHASING INFORMATION ...................................... 123
SECTION C: IMPULSE BUYING BEHAVIOUR .................................................... 124
SECTION D: EXTERNAL FACTORS SCALE ....................................................... 125
SECTION E: SITUATIONAL FACTORS SCALE .................................................. 127
xi
LIST OF FIGURES
Figure 2.1: Steps of the decision-making process ................................................. 16
Figure 2.2: Consumer evaluations = experiences – expectations ......................... 19
Figure 2.3: A model of the impulse buying process ............................................... 22
Figure 2.4: Typology of impulse buying ................................................................. 24
Figure 4.1: Higher education Institutions ............................................................... 68
Figure 4.2: Year of degree .................................................................................... 68
Figure 4.3: Province of origin ................................................................................ 69
Figure 4.4: Gender ................................................................................................ 70
Figure 4.5: Ethnic group ........................................................................................ 70
Figure 4.6: Language ............................................................................................ 71
Figure 4.7: Age ...................................................................................................... 72
Figure 4.8: Income per month ............................................................................... 73
Figure 4.9: Category of impulse buying ................................................................. 74
Figure 4.10: Latest impulse purchase .................................................................... 75
xii
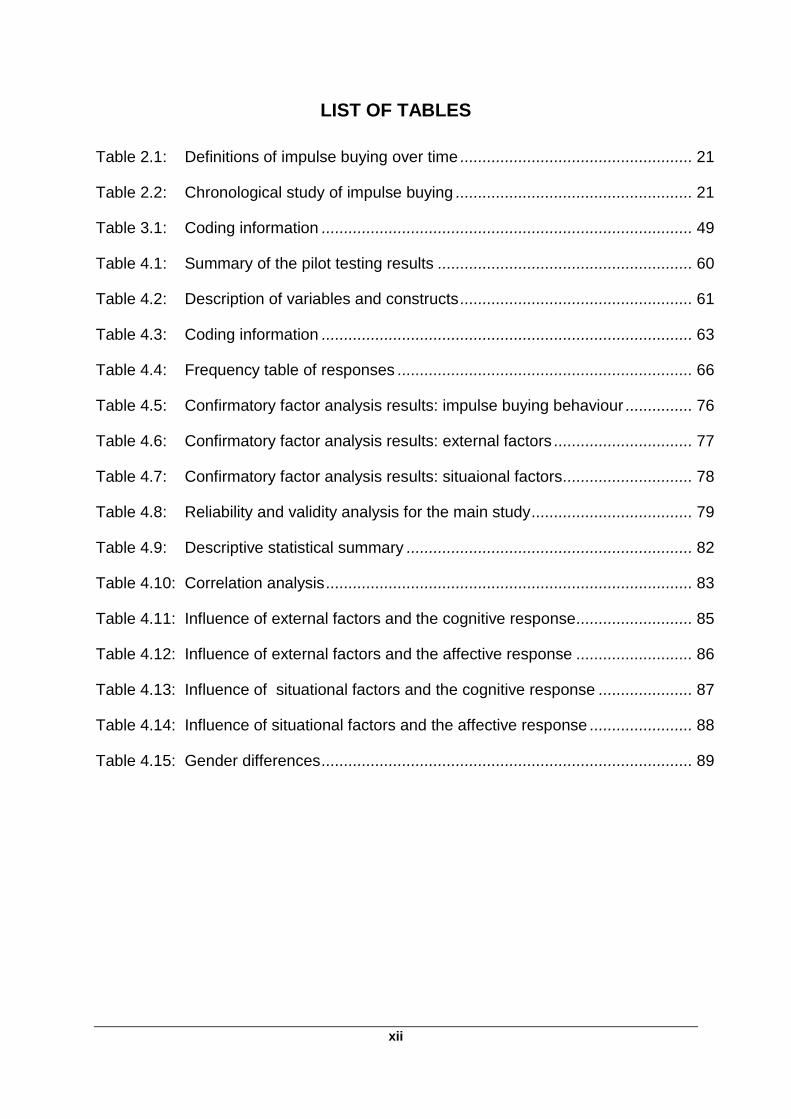
LIST OF TABLES
Table 2.1: Definitions of impulse buying over time .................................................... 21
Table 2.2: Chronological study of impulse buying ..................................................... 21
Table 3.1: Coding information ................................................................................... 49
Table 4.1: Summary of the pilot testing results ......................................................... 60
Table 4.2: Description of variables and constructs .................................................... 61
Table 4.3: Coding information ................................................................................... 63
Table 4.4: Frequency table of responses .................................................................. 66
Table 4.5: Confirmatory factor analysis results: impulse buying behaviour ............... 76
Table 4.6: Confirmatory factor analysis results: external factors ............................... 77
Table 4.7: Confirmatory factor analysis results: situaional factors ............................. 78
Table 4.8: Reliability and validity analysis for the main study .................................... 79
Table 4.9: Descriptive statistical summary ................................................................ 82
Table 4.10: Correlation analysis .................................................................................. 83
Table 4.11: Influence of external factors and the cognitive response .......................... 85
Table 4.12: Influence of external factors and the affective response .......................... 86
Table 4.13: Influence of situational factors and the cognitive response ..................... 87
Table 4.14: Influence of situational factors and the affective response ....................... 88
Table 4.15: Gender differences ................................................................................... 89
Chapter 1: Introduction and background to the study 1
CHAPTER 1
INTRODUCTION AND BACKGROUND TO THE STUDY
1.1 INTRODUCTION
A marketing tool referred to as impulse buying is used to increase sales for
businesses; as it facilitates to an extensive amount of products sold in the
environment of retail (Das & Das, 2015:188). In 2013, South African consumers
spent, on average, R13.5 billion a month on impulse items (Times Live, 2014). In
addition, when consumers travel by car to shops in comparison to other means of
transport, such as by train, bus or bicycle, there is a likelihood of 44 percent more
impulse purchases. This is due to a car providing convenience, independence and
space that other means of transport cannot provide. While impulse purchases are
increased by 88 percent during sale and bargain products in the stores, impulse
buying increases further by 23 percent when the shopping purchases are unplanned.
Furthermore, shoppers make an average of three impulsive purchases during 40
percent of all store visits (BetaBait, 2013).
Prior to 1982, the definition of impulse buying was focused on how the product was
utilised to persuade consumers to purchase the product rather than the consumer‟s
decision as the motivator of impulse purchases (Hausman, 2000:404). However,
after 1982, Hausman (2000:404) stated that researchers began to refocus their
attention on impulse buying tendencies and started investigating the dimensions that
influenced impulse buying amongst consumers. Bayley and Nancarrow (1998:99)
define impulse buying as an unexpected, persuasive, hedonically complicated
buying behaviour in which the promptness of an impulse conclusion prevents the
consumer to investigate additional information generating a purchase. Similarly,
Prajapati and Rathod (2013:128) define impulse buying as an instant purchase. An
instant purchase is done when a consumer has no objective to obtain a product
while shopping (Prajapati & Rathod, 2013:128).
Consumer behaviour is described as the actions consumers reveal while
investigating, buying, consuming, assessing and disposing of products and services
that are expected to fulfil the consumer‟s requirements (Schiffman et al., 2010:23).
Chapter 1: Introduction and background to the study 2
Complex buying behaviour, dissonance-reducing behaviour, habitual buying
behaviour, variety-seeking buying behaviour and impulse buying are various topics
that create an overall concept called consumer behaviour (Mäkinen, 2015:23).
Impulse buying is an occurrence experienced by consumers when purchasing
products (Verplanken & Sato, 2011:197). It involves a sudden, unexpected desire to
buy a product that was not considered before going on the shopping trip (Bink,
2010:4). Hausman (2000:405) is of the view that consumers who partake in impulse
buying are often regretful of their purchasing decision. Impulse products are
characterised as low-cost frequently purchased products that require a slight
cognitive (planning) effort from consumers (Rook & Hoch, 1985:23). MediaScope,
Inc. (2013), revealed the nine most common impulsive products, namely clothing,
beer, magazines, books, food, shoes, wine, toiletries and DVDs.
Impulse buying behaviour pertains to a person‟s affective and cognitive response to
purchasing on impulse (Dawson & Kim, 2009:24). The consumers‟ affective
responses are influenced by their mood, self-feelings or emotional state (Youn,
2000:43). The cognitive response refers to how the consumer understands, thinks
and interprets the information of the product. In addition, an impulse purchase and
disregard for the future may result from the cognitive response outcome (Youn,
2000:34). According to Karbasivar and Yarahmadi (2011:176), the consumer has
control over their affective and cognitive response, as these factors are internal.
Various factors may influence a consumer‟s impulse buying behaviour (Kalla &
Arora, 2011:148-153; Muruganantham & Bhakat, 2013:156; Vishnu & Raheem,
2013:69), which may be classified as external factors (Kalla & Arora, 2011:148-153;
Muruganantham & Bhakat, 2013:156; Vishnu & Raheem, 2013:69) and situational
factors (Beatty & Ferrell, 1998:171; Tinne, 2011:217; Muruganantham & Bhakat,
2013:156).
External factors relating to impulse buying behaviour refer to the attempts to entice
the consumers into a purchasing behaviour. This is done by implementing factors
positioned and monitor by the marketer or storeowner (Youn & Faber, 2000:180) of
which the consumer has no control over (Karbasivar & Yarahmadi, 2011:175). In
particular, when promotional tools are utilised, and offered to consumers, a need is
Chapter 1: Introduction and background to the study 3
triggered and consumers then have a higher motivation to buy on impulse (Dholakia,
2000:977). According to Dawson and Kim (2009:23), external factors influencing
consumers‟ impulse buying behaviour are essential to marketers and retailers due to
the increase of purchasing by existing consumers as well as helps to attract new
consumers (Dawson & Kim, 2009:23). Muruganantham and Bhakat (2013:152) and
Cho et al. (2014: 39) are of the opinion that in-store atmosphere, in-store browsing,
in-store layout, salespersons, promotions and reference groups are the external
factors that influence impulse buying behaviour.
Situational factors that might impact impulse buying behaviour comprise real or
observed availability of time and the expenditure ability the consumers possess
(Beatty & Ferrell, 1998:175). According to Bhatt and Pandya (2015:1782),
consumers who do not have the spending power or the available time will avoid the
shopping environment. Muruganantham and Bhakat (2013:156) opine that time and
money availability is essential situational aspects that affect impulse buying
behaviour.
Generation Y consumers are an important segment to market in the global
marketplace, as Generation Y accounts for 40 percent of South Africa‟s entire
population (55 908 000 individuals in 2016) (Statistics South Africa, 2016). According
to Markert (2004:21), the Generation Y cohort encompasses individuals born
between 1986 and 2005. This generation is known also as millennials or echo-
boomers (Acar, 2014:13). The marketplace are in great numbers of Generation Y
individuals and have surpassed any other group of generation with regards to
spending power (Khan et al., 2016:144), making this particular generation an
attractive market to target. Similarly, Yigit and Aksay (2015:107) regarded the largest
group of consumers as Generation Y. This group of consumers adapt and
experiment to new products that have come into the market (Viswanathan & Jain,
2013:484), therefore, Generation Y consumers have high brand awareness, but are
not brand loyal to the product (Noble et al., 2009:622) which creates an opportunity
for impulse purchases.
Members of the Generation Y student cohort are typically aged 18 years to 24 years
(Kilber et al., 2014:82). According to Sowetan Live (2013), on average, a student is
spending around R3 510 per month that amounts to R42 120 per annum. The
Chapter 1: Introduction and background to the study 4
population size of South African students, at approximately 938 000 students in
2013, with their potential spending power of R39.5 billion per year, makes
Generation Y students an attractive market segment to target. According to Khan et
al. (2016:144), Generation Y students may be persuaded to buy on impulse when
the factors influencing impulse buying behaviour are understood and implemented
by marketers and retailers. Branchik (2010:174) points out that, Generation Y
students should pay close attention from marketers, retailers and researchers due to
the population size and spending power of this generation.
1.2 PROBLEM STATEMENT
Impulse buying has a significant influence on consumer buying behaviour and
consumer decision-making. Therefore, impulse buying is a key research concern
amongst marketing researchers due to its views on consumer behaviour; in addition,
impulse buying contributes to the concept of marketing (Khuong & Tran, 2015:223).
At one time or another in the consumer‟s life, they will purchase a product on
impulse (Kacen & Lee, 2002:163).
As elucidated earlier, impulse buying has the potential to increase revenues for
businesses and Generation Y has become an important market segment for
businesses. Furthermore, when the factors influencing impulse buying are
understood and determined, businesses will be able to concentrate on those factors
to increase their revenues by employing appropriate marketing strategies in targeting
Generation Y students. Therefore, it is crucial for researchers to dedicate time and
energy to gain knowledge and understanding of the factors that trigger impulse
buying behaviour of consumers (Duarte et al., 2013:1234).
Globally, research on impulse buying behaviour of Generation Y students has been
scarce due to researchers concentrating only on the everyday consumer (Ebitu,
2015:42). Khan et al. (2016:144) concur, stating that limited studies have been
conducted on impulse buying behaviour amongst Generation Y members.
Furthermore, there is a scarcity of studies available on the factors influencing
members of this cohort‟s impulsive buying behaviour. Studies that were conducted in
South Africa on the topic of impulse buying behaviour by other researchers, have
concentrated only on certain aspects of impulse buying behaviour, in comparison to
Chapter 1: Introduction and background to the study 5
this particular topic. Hamilton (2010) focuses on how culture influences impulse
buying behaviour and Retief (2012) highlights how pop-up stores influence impulse
buying behaviour. Although significant progress has been made in recent years in
the field of consumer behaviour, there remains a gap regarding factors that influence
impulse buying behaviour amongst Generation Y students in South Africa. This
investigation intends to contribute to filling this void.
1.3 OBJECTIVES OF THE STUDY
The following objectives have been formulated for the study.
1.3.1 Primary objective
The primary objective of this study was to determine the factors that influence the
impulse buying behaviour of South African Generation Y students in order to guide
the formation of marketing strategies for effectively targeting this market.
1.3.2 Theoretical objectives
In order to achieve the primary objective, the following theoretical objectives were
formulated for the study:
Review the literature on consumer behaviour definition and the decision
making process.
Review the literature on impulse buying definition, impulse buying process,
types of impulse buying and the levels of involvement.
Review the literature regarding the factors that influence impulse buying
behaviour.
Review the literature pertaining to the characteristics of the Generation Y
cohort.
1.3.3 Empirical objectives
In accordance with the primary objective of the study, the following empirical
objectives were formulated:
Chapter 1: Introduction and background to the study 6
Determine whether the external factors of in-store atmosphere, in-store
browsing, in-store layout, salespersons, promotions and reference groups‟
influence Generation Y students‟ cognitive response to buy on impulse.
Determine whether the external factors of in-store atmosphere, in-store
browsing, in-store layout, salespersons, promotions and reference groups‟
influence Generation Y students‟ affective response to buy on impulse.
Determine whether the situational factors of time availability and money
availability influence Generation Y students‟ cognitive response to buy on
impulse.
Determine whether the situational factors of time availability and money
availability influence Generation Y students‟ affective response to buy on
impulse.
Determine whether male and female Generation Y students differ in their
impulse buying behaviour.
1.4 HYPOTHESIS TESTING
The following items were formulated for the study:
Ho1: External factors do not have a significant influence on Generation Y students‟
cognitive response.
Ha1: External factors have a significant influence on Generation Y students‟
cognitive response.
Ho2: External factors do not have a significant influence on Generation Y students‟
affective response.
Ha2: External factors have a significant influence on Generation Y students‟
affective response.
Ho3: Situational factors do not have a significant influence on Generation Y
students‟ cognitive response.
Ha3: Situational factors have a significant influence on Generation Y students‟
cognitive response.
Ho4: Situational factors do not have a significant influence on Generation Y
students‟ affective response.
Chapter 1: Introduction and background to the study 7
Ha4: Situational factors have a significant influence on Generation Y students‟
affective response.
Ho5: There is no significant difference between male and female Generation Y
students‟ in their impulse buying behaviour.
Ha5: There is a significant difference between male and female Generation Y
students‟ in their impulse buying behaviour.
1.5 RESEARCH DESIGN AND METHODOLOGY
The study comprises a literature review and an empirical study. Quantitative
research, using the survey method, was used for the empirical portion of the study. A
descriptive research design with a single cross-sectional sample was followed.
1.5.1 Literature review
In order to support the empirical study, a review of the literature on factors
influencing impulse buying behaviour amongst Generation Y students in South Africa
was conducted using secondary data sources, such as the Internet, textbooks and
online academic databases.
1.5.2 Empirical study
The empirical portion of this study comprises the following methodology dimensions:
1.5.2.1 Target population
The target population for this study comprise full-time undergraduate Generation Y
students, aged between 18 and 24, registered at South African public higher
education institutions (HEIs) in 2016. The target population was defined as follows:
Element: Full-time, Generation Y students aged between 18 and 24 years
Sampling Unit: South African registered public HEIs
Extent: Gauteng, South Africa
Time: 2016
Chapter 1: Introduction and background to the study 8
1.5.2.2 Sampling frame
The sampling frame that was used to conduct the study comprises the 26 registered
South African public HEIs (Universities South Africa, 2016). From this sample frame,
a non-probability judgement sample of two HEI campuses ‒ a traditional university
and a university of technology ‒ located in the Gauteng province was selected. The
reason for selecting the Gauteng province was that it comprises the largest
population of South African.
1.5.2.3 Sample method
For the purpose of this study, the sampling technique that was used was a non-
probability convenience sample of 400 Generation Y, full-time undergraduate
students, between the ages of 18 and 24. The participants were conveniently
selected from the two HEI campuses after the necessary permission was obtained
from the relevant academic staff members.
1.5.2.4 Sample size
A sample size of 400 full-time undergraduate Generation Y students was selected for
this study. This sample size was in range of other studies of this nature such as
those conducted by Dawson and Kim (2009) (sample size of 400); Yang et al.,
(2011) (sample size of 360); and Badgaiyan and Verma (2015) (sample size of 384),
therefore, it was considered sufficiently large.
1.5.2.5 Measuring instrument and data collection method
A self-administered structured questionnaire was utilised to gather the required data
for this study. The questionnaire included existing scales used in previously
published research. In order to measure the factors influencing impulse buying
behaviour of South African Generation Y students, three measuring scales were
utilised for the empirical portion of the study. A 20-item, Impulse Buying Tendency
Scale (IBTS), developed and validated by Verplanken and Herabadi (2001), was
utilised to measure the students‟ impulse buying behaviour. In order to measure the
influence of external factors on students‟ impulse buying behaviour, a 23-item scale,
developed and validated by Cho, Ching and Luong (2014) was used. A six-item
Chapter 1: Introduction and background to the study 9
measuring scale, developed and validated by Beatty and Ferrell (1998), was utilised
to measure the situational factors influencing students‟ impulse buying behaviour.
The participants were requested to complete a questionnaire consisting of five
sections. The first section (Section A) was used to gather the participant‟s
demographic data. The second section (Section B) was used to gather information
pertaining to the participants‟ impulse purchasing. The third section (Section C)
measured the impulse buying behaviour, namely cognitive response (10 items) and
affective response (10 items). The fourth section (Section D) measured the external
factors influencing impulse buying behaviour, namely in-store atmosphere (3 items),
in-store browsing (3 items), in-store layout (4 items), salespersons (4 items),
promotions (6 items) and reference groups (6 items). The last section (Section E)
measured the situational factors influencing impulse buying behaviour, namely time
availability (3 items) and money availability (3 items).
All scaled answers were determined on a six-point Likert scale, starting with strongly
disagree (1) and ending with strongly agree (6). The questionnaire included a front
page describing the nature of the study and requesting participation, in addition to
ensuring the privacy of the participant‟s information.
In order to ensure reliability, the survey was piloted on a convenience sample of 50
students of a South African HEI campus that was not included in the sampling frame.
Subsequently, the outcomes of the pilot test were inputted and the outcome was
utilised in implementing the final study.
1.5.3 Statistical analysis
The captured data will be evaluated using the statistical package IBM Statistical
Package for the Social Sciences (SPSS), version 23.0. The statistical methods
utilised on the empirical data sets to realise the study`s objectives are as follows:
Confirmatory factor analysis
Reliability and validity analysis
Descriptive statistical analysis
Correlation analysis
Significance tests
Chapter 1: Introduction and background to the study 10
Regression analysis
Two independent-samples t-test.
1.6 ETHICAL CONSIDERATIONS
The research study conformed to the ethical standards of academic research. The
required permission was obtained from the academic staff members involved. Ethical
clearance was obtained from the North-West University‟s Ethics Committee (ethical
clearance number ECONIT-2016-020). The identities and interests of the
participants were protected as well as guaranteed confidentiality of the information
provided by the participants. The participation was voluntary, assuring that no
individual person or institution was forced to participate against his or her own will.
1.7 CHAPTER CLASSIFICATION
Chapter 1: Introduction and background to the study
This chapter includes the introduction and background to the research study. It
contains an overview of the problem statement, the research objectives, hypothesis
testing, research methodology, chapter classification, general comments and
clarification of key terms.
Chapter 2: Impulse buying
This chapter gives a review of the literature linked to consumer behaviour, impulse
buying, factors influencing impulse buying behaviour and Generation Y cohort. This
chapter includes the definition of consumer behaviour, an explanation of consumer
buying decision process, the history of impulse buying, definitions, types of impulse
buying, level of involvement, past and current studies on factors influencing impulse
buying behaviour and characteristics of the Generation Y cohort.
Chapter 3: Research methodology
An examination of the questionnaire design, preparation, coding and distribution is
discussed. Additionally, a detailed explanation on the target population, sampling
method, sample frame, sample size, measuring collection and data collection
Chapter 1: Introduction and background to the study 11
method utilised. The data analysis and statistical techniques utilised are presented
and explained in this chapter.
Chapter 4: Data analysis and interpretation
In this chapter, data were analysed using statistical techniques and outlined further.
Problems experienced in this research were discussed, as well as the response rate
to the questionnaire. Research conducted and the findings were tabulated, analysed,
interpreted and evaluated.
Chapter 5: Summary, conclusions and recommendations
This chapter provides an assessment of the whole research study and conclusions
drawn from the study. Recommendations from the study were made and
recommendations for research in the future were included in this chapter.
1.8 GENERAL
Appendix is placed at the back of the dissertation.
The lists of the tables and figures are shown subsequent to the table of
contents in the dissertation.
The tables and figures can be found on the appropriate pages in the
dissertation.
Referencing is constructed by the NWU Harvard-style referencing, using the
NWU referencing guide.
1.9 CLARIFICATION OF KEY CONCEPTS
Consumer behaviour: is described as the actions consumers reveal while
investigating, buying, consuming, assessing and disposing of products and
services that are expected to fulfil the consumer‟s requirements.
Impulse buying: is defined as a sudden, unexpected desire to buy a
product that was not considered before going on the shopping trip.
Impulse buying behaviour: is defined as the shopper‟s persona, which
describes an individual rather than the atmosphere in the shops. Internal
factors are managed by the consumer (impulse buying behaviour includes a
consumer‟s affective and cognitive response).
Chapter 1: Introduction and background to the study 12
External factors: is defined as factors implemented by marketers and
storeowners to entice consumers into a purchasing behaviour by placing
marketing cues (external factors include in-store atmosphere, in-store
browsing, in-store layout, salespersons, promotions and reference groups).
Situational factors: Situational factors that might affect impulse buying
behaviour comprise real or observed availability of time and the expenditure
ability the consumers possess (situational factors include time availability
and money availability).
Generation Y: Generation Y consumers are born from 1986 to 2005. This
year gap is calculated at 17 to 39 years old in 2016.
Generation Y students: is defined as students between the ages of 18 to
24.
1.10 SYNOPSIS
Consumers buy impulsively at one time or another in their lives, often without
realising it. For this reason, impulse buying has a significant influence on consumer
buying behaviour and consumer decision making. Therefore, impulse buying is a key
research concern amongst marketing researchers due to its perspectives on
consumer behaviour; in addition, in the environment of marketing, impulse buying
has become a contributing factor. Impulse buying has several factors that influence a
consumer. Marketers could implement these factors to influence the Generation Y
students‟ buying behaviour, thereby increasing revenue (sales).
Similar studies to the one undertaken here have been conducted to determine the
factors influencing impulse buying behaviour in various countries; however, there
has been a lack of research on this particular topic in South Africa. Studies
concerning impulse buying behaviour by other academic researchers in South Africa
have focused on only one element, whereas this study concentrates on many
factors. Other academic researchers in South Africa focused on culture influencing
impulse buying behaviour and pop-up store influencing impulse buying behaviour.
Although research has been done in the field of consumer behaviour, this field is
extensive. Therefore, this provides a gap to determine whether certain factors
influence impulse buying behaviour amongst Generation Y students in South Africa.
Chapter 1: Introduction and background to the study 13
The Generation Y cohort is the largest population group when compared to other
generations today. This study intends to fill this void.
This chapter stipulated an overview of this study‟s introduction, problem statement,
objectives (primary, theoretical and empirical), hypotheses, research design and
methodology, ethical considerations, chapter classification, general comments and
clarification of key concepts. In the subsequent chapter, Chapter 2, an evaluation of
the literature concerning consumer behaviour, impulse buying, the factors influencing
impulse buying behaviour of the Generation Y cohort is undertaken.
Chapter 2: Impulse buying 14
CHAPTER 2
IMPULSE BUYING
2.1 INTRODUCTION
As stated in Chapter 1 (refer to Section 1.3.1), the primary objective of this study was
to determine the factors that influence impulse buying behaviour of South African
Generation Y students, in order to guide the formation of marketing strategies for
effectively targeting this market. The main aim of this chapter is to achieve the
theoretical objectives (refer to Section 1.3.2). This is realised by describing
consumer behaviour, impulse buying, the factors that influence impulse buying
behaviour and information on the traits of the Generation Y cohort.
The remainder of the chapter is arranged as follows. Section 2.2 discusses the
overall theory of consumer behaviour and the steps to the decision-making process.
Section 2.3 discusses impulse buying by demonstrating how the theory of impulse
buying has evolved over time, the impulse buying process, identifying the types of
impulse buying and lastly, identifying and describing impulsive items in terms of the
level of involvement. Section 2.4 discusses the factors influencing impulse buying
behaviour. Section 2.5 discusses the Generation Y cohort of South Africa that was
used as the target population of the study. Lastly, Section 2.6 provides a conclusion
of the chapter.
The next section discusses consumer behaviour.
2.2 CONSUMER BEHAVIOUR
This section defines consumer behaviour and describes the decision-making
process.
2.2.1 Defining consumer behaviour
Solomon et al. (2006:6) define consumer behaviour as the process involved when
consumers select, purchase, use or dispose of products and services, ideas or
experiences that are expected to fulfil the consumer‟s needs and desires. Schiffman
et al. (2010:23) explained how consumer behaviour focuses on shoppers and
Chapter 2: Impulse buying 15
relatives, as to how they use their time, their financial position and how they
consume the products. The knowledge ascertained by the consumer behaviour of
consumers helps the marketer to understand how the consumer may feel, think and
select items in stores (Brosekhan et al., 2013:8). According to Sahney (2003:23),
consumer behaviour entails what consumer‟s purchase, why consumers purchase
them, at what time consumers purchase them, the place the consumer purchases
them, the frequency of the purchase, usage frequency, and the evaluation of the
post-purchase and the influence of the evaluation on upcoming purchases.
Consumer behaviour is referred to as a continuous process, which comprises three
stages, specifically the pre-purchase, purchase and post-purchase stages (Solomon,
2013:32). Therefore, Section 2.2.2 describes the decision-making process of
consumer behaviour.
2.2.2 Decision-making process
Decision-making is defined as a process that entails selections by determining
objectives, assembling the required information and evaluating alternatives.
Consequently, a systematic decision-making process assists consumers to make
more of a precise decision by providing relevant information on products and
narrowing down the possible alternatives (Lunenburg, 2010:3). The systematic
decision-making process ensures that the best alternative is chosen (Al-Tarawneh,
2012:3).
Researchers have identified different steps within the decision-making process
namely, the seven step decision making process (Dönmez, 2011:20) which includes
identifying the decision, gathering information, identifying alternatives, weighing the
evidence, choosing among the alternatives, taking action and reviewing the decision
made. The other commonly used decision making process is the five-step decision-
making process (Munthiu, 2009:27) which includes problem recognition, information
search, pre-purchase alternative evaluation, purchase and post-purchase evaluation
The five step decision making process will be used for this study. Figure 2.1 below
displays the phases of the decision-making process.
Chapter 2: Impulse buying 16
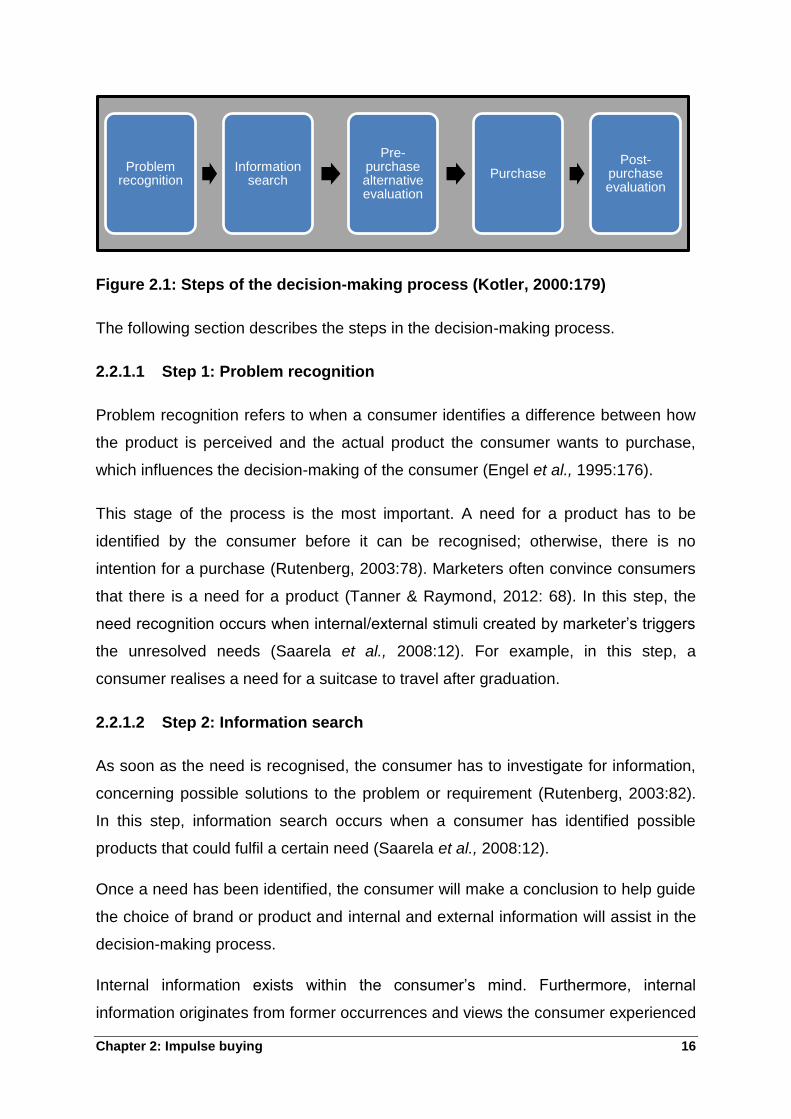
Figure 2.1: Steps of the decision-making process (Kotler, 2000:179)
The following section describes the steps in the decision-making process.
2.2.1.1 Step 1: Problem recognition
Problem recognition refers to when a consumer identifies a difference between how
the product is perceived and the actual product the consumer wants to purchase,
which influences the decision-making of the consumer (Engel et al., 1995:176).
This stage of the process is the most important. A need for a product has to be
identified by the consumer before it can be recognised; otherwise, there is no
intention for a purchase (Rutenberg, 2003:78). Marketers often convince consumers
that there is a need for a product (Tanner & Raymond, 2012: 68). In this step, the
need recognition occurs when internal/external stimuli created by marketer‟s triggers
the unresolved needs (Saarela et al., 2008:12). For example, in this step, a
consumer realises a need for a suitcase to travel after graduation.
2.2.1.2 Step 2: Information search
As soon as the need is recognised, the consumer has to investigate for information,
concerning possible solutions to the problem or requirement (Rutenberg, 2003:82).
In this step, information search occurs when a consumer has identified possible
products that could fulfil a certain need (Saarela et al., 2008:12).
Once a need has been identified, the consumer will make a conclusion to help guide
the choice of brand or product and internal and external information will assist in the
decision-making process.
Internal information exists within the consumer‟s mind. Furthermore, internal
information originates from former occurrences and views the consumer experienced
Problem recognition
Information search
Pre-purchase alternative evaluation
Purchase Post-
purchase evaluation
Chapter 2: Impulse buying 17
with a product or brand. Internal information is sufficient for the purchasing of
everyday products (for example, milk and bread). However, when it comes to a
major purchase of uncertainty or higher involvement and the consumer has not
gained enough information, another source is considered ‒ an external source.
External information on a product or brand is proposed by associates, relatives,
evaluations from other consumers or from the media (Bettman et al., 1998:189; Levy
& Weitz, 1998:129).
During the consumer decision-making process, the consumer pays attention to what
friends, family and other consumers have mentioned about the product or brand
(Hawkins et al., 2001:534; Engel et al., 1995:185). The internal information gained
from others will be judged more fairly than information from marketing tools (for
example, an advert or brochure) (Kardes et al., 2010:196-197). For example, in this
step, consumers begin looking at different suitcases on the web, talking to friends
about the suitcases and visiting stores to look at the suitcases.
2.2.1.3 Step 3: Pre-purchase alternative evaluation
An evaluation of alternatives is the stage of the decision-making process whereby a
consumer uses the information gathered in the information search (Kotler,
2000:180). In this step, the views of the brand or product are recognised and used to
fulfil the need, based on the product features (Saarela et al., 2008:12). The views of
the brand or product are determined by objective characteristics and subjective
characteristics. Objective characteristics include performance of the product,
whereas the subjective characteristics signify the brand worth, status and the
consumer‟s opinion (Anon (a), 2005:69; Rudani, 2013:230).
Good salespeople and marketing professionals have discovered that when a
consumer is offered a variety of selections, it can become overwhelming; therefore,
the consumer will refrain from purchasing. Consequently, the consumer develops
evaluative criterion to help narrow down the choices. An evaluative criterion is
defined as certain characteristics that are important to the consumer. Furthermore,
marketing professionals utilise the evaluative criteria to convince consumers to
purchase the product by reflecting only on the strengths of the product to make the
product more appealing (Tanner & Raymond, 2012:69).
Chapter 2: Impulse buying 18
The process will be guided to an evoked set, correspondingly recognised as the
consideration set (positive). The evoked set is defined as the possibility of buying the
collection (brands or products) since the consumer has had a good experience with
the product (Step 2) (Anon (a), 2005:68).
The process may also lead to inept set or inert set. Samli (1998:314) defined inept
set as the collection of brands or products that do not have a possibility of being
acquired, the reason being consumers having a negative opinion or a negative
buying occurrence with the product earlier. However, inert set is the collection of
brands or products for which the consumer has no judgement (neutral) (Samli,
1998:314). For example, in this step, the consumer decides on the price the
consumer is willing to pay and specific criteria that a suitcase must have. The
consumer then examines each suitcase based on each of those criteria.
2.2.1.4 Step 4: Purchase
As soon as the consumer has assessed the various outcomes of the available
products to fulfil the want, the consumer then selects the product or brand that fulfils
the need (Rutenberg, 2003:92). Thus, a decision to purchase a product is made
(Saarela et al., 2008:12). The decision will depend on the factors of the product,
namely the products features, perceived value and capabilities identified in the
previous step (Joubert, 2010:138). Furthermore, the decision to buy could be
dependent by the occurrence of shopping the consumer experiences in the store.
For example, in this step, the consumer decides on the best suitcase, based on the
evaluative criteria by the consumer and decides when, where and how to purchase
the suitcase.
2.2.1.5 Step 5: Post-purchase evaluation
The post-purchase assessment is employed to decide whether the consumer is
content or unhappy with the product purchased (Rutenberg, 2003:98). When the
consumer purchases and uses the product, the consumer will assess whether the
product satisfied the original need identified in the first step. The satisfaction level is
determined when the consumer evaluates the performance of the product (Saarela
et al., 2008:12). Furthermore, the consumer can be delighted, satisfied or dissatisfied
Chapter 2: Impulse buying 19
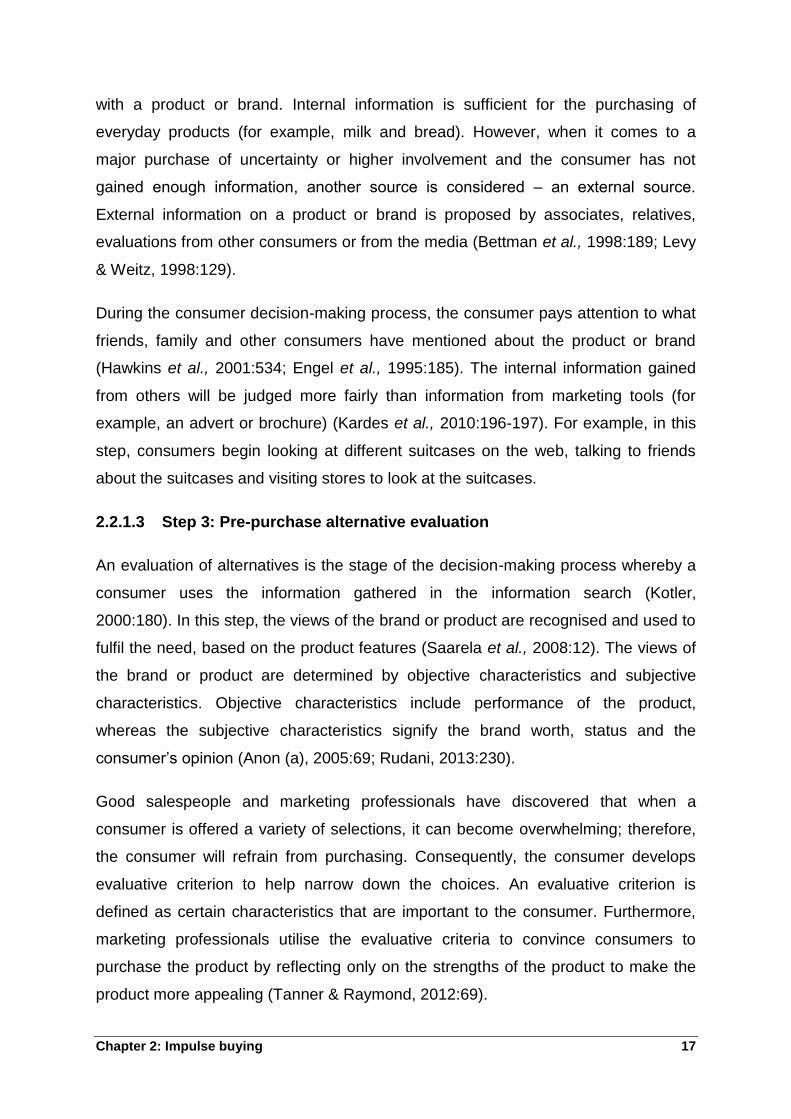
with the product and choice. Figure 2.2 displays how this process works in the post-
purchase evaluation in terms of consumer satisfaction.
Figure 2.2: Consumer evaluations = experiences – expectations (Iacobucci,
2013:185)
In the event of the consumer being delighted, the consumers‟ experiences should
exceed their expectations. When consumers are satisfied, the consumers‟
experiences should meet the expectations, and lastly, when consumers are
dissatisfied, the consumers‟ experiences fall short of the expectations (Iacobucci,
2013:185).
In addition, when the consumer is satisfied with the product, the information search
and alternative evaluation stages within the decision-making process are dismissed
when making future purchases. Moreover, the satisfied consumer then becomes
loyal to the brand. On the other hand, when the consumer is dissatisfied with the
experience of the product, the decision-making process will be repeated by the
consumer in the purchases to come and therefore will not become brand loyal
(Iacobucci, 2013:185). For example, in this step, the consumer decides whether the
suitcase is everything the consumer thought it would be and meets the initial needs.
In the following section, impulse buying behaviour is discussed by demonstrating
how the theory of impulse buying behaviour has evolved over time, the impulse
buying behaviour process, types of impulse buying and lastly, describing impulsive
items in terms of the levels of involvement.
Relative comparison
Expectations Experience or
Perceived performance
Perceived quality or Customer satisfaction
Chapter 2: Impulse buying 20
2.3 IMPULSE BUYING
This section defines impulse buying, the impulse buying process, types of impulse
buying and the level of involvement of impulsive products.
2.3.1 Defining impulse buying
Impulse buying is described as a purchase that is not planned. Consumers engage
in impulse buying when a consumer experiences an accumulation of emotions over
an item, which then leads to the purchase of the item without giving to much thought
about the situation (Gamage et al., 2008:1).
An impulsive decision-making process implies an unplanned action, which is
opposite to the prepared planning, which takes place in the consumer decision-
making process (Cant et al., 2009:64). The impulsive decision-making process and
consumer decision-making process is not completely different, in the impulsive
decision-making process the consumer also engages in the stages of the consumer
decision-making process. Furthermore, once a decision has been made an action
follows and to a consumer it appears that the planning did not follow the action. An
impulsive action is defined as an action made at that particular point of purchase,
and cannot be regarded as an unplanned approach to purchasing. The consumer
impulsively buys a product immediately after becoming aware of a need that was not
satisfied, but the consumer may not realise it at that point of purchase (Strydom et
al., 2000:73).
Brodén & Sőderberg (2011:14) state that several researchers through history have
defined the concept of impulse buying, however there has been several focuses on
the concept throughout time. Furthermore, Brodén and Sőderberg (2011:14)
conclude that earlier researchers of impulse buying focused more on when the
purchase decision and purchase itself was made, instead of the consumer making
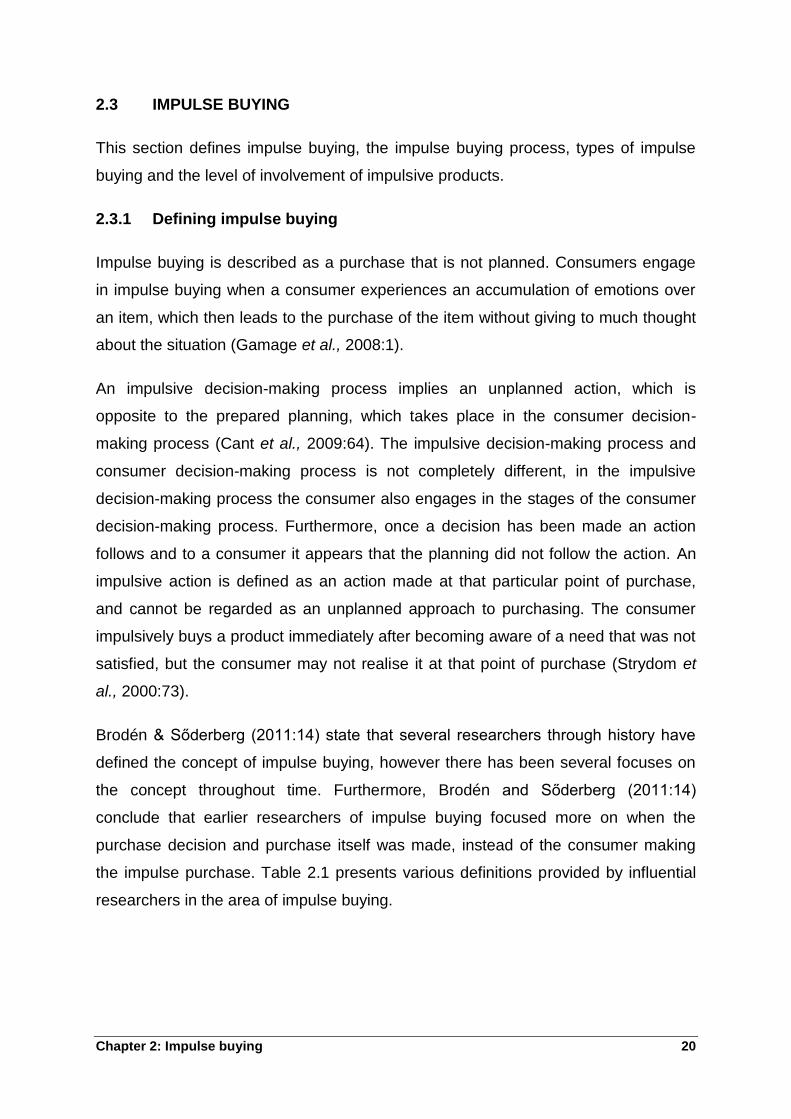
the impulse purchase. Table 2.1 presents various definitions provided by influential
researchers in the area of impulse buying.
Chapter 2: Impulse buying 21
Table 2.1: Definitions of impulse buying over time
Author Year Definition
Clover 1950 A act of unplanned buying without any consideration Stern 1962 Sudden urge to buy Rook, Rook and Fisher
1987 &1995
A sudden urge to buy something is backed up by an unplanned act of buying
Hoch and Loewenstein
1991 If the person is not passionate, there will be inconsistent buying
Kacen and Lee
2002 A subjective bias leads to the possession of something
Zhou and Wong
2003 A sudden desire to buy something is triggered within the consumer. This sudden desire becomes persistent and the consumer immediately buys it
Vohs and Faber
2007 A buying choice, which is influenced by emotions, makes a sudden urge
Xiao and Nicholson
2013 An external stimulus leads to the feeling of regret or happiness by making an unplanned and sudden act of buying
Source: Abbas and Bashir (2015:468)
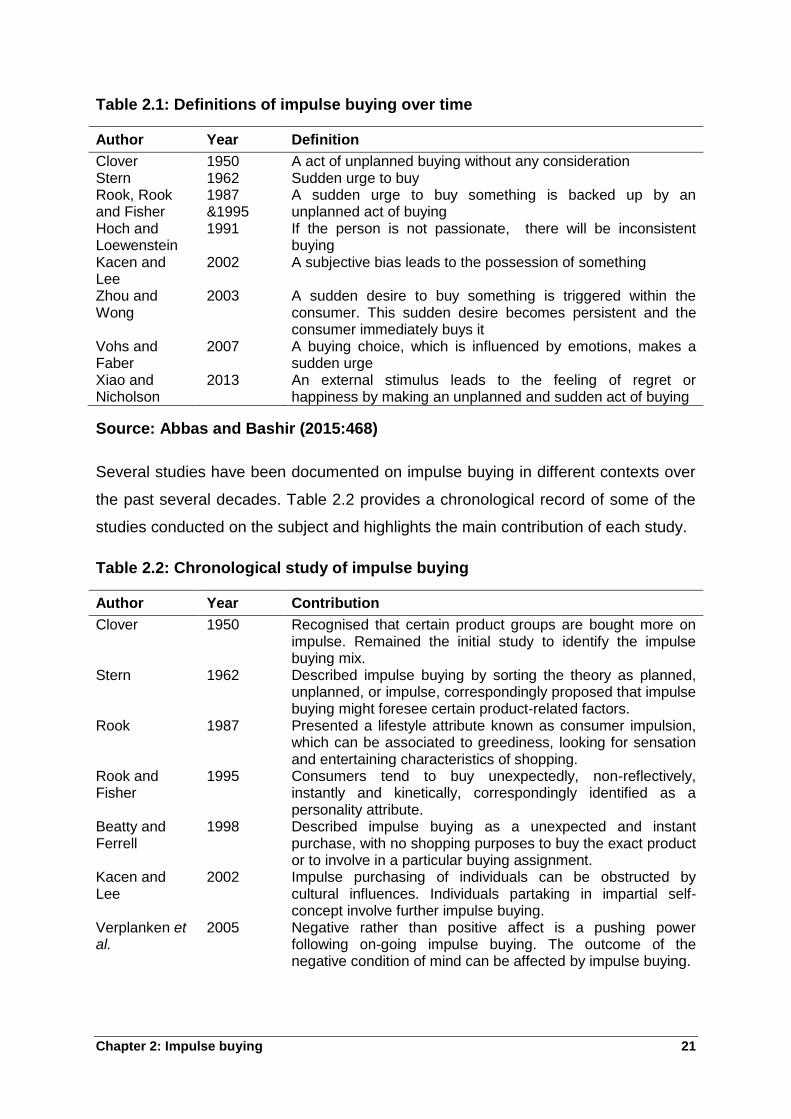
Several studies have been documented on impulse buying in different contexts over
the past several decades. Table 2.2 provides a chronological record of some of the
studies conducted on the subject and highlights the main contribution of each study.
Table 2.2: Chronological study of impulse buying
Author Year Contribution
Clover 1950 Recognised that certain product groups are bought more on impulse. Remained the initial study to identify the impulse buying mix.
Stern 1962 Described impulse buying by sorting the theory as planned, unplanned, or impulse, correspondingly proposed that impulse buying might foresee certain product-related factors.
Rook 1987 Presented a lifestyle attribute known as consumer impulsion, which can be associated to greediness, looking for sensation and entertaining characteristics of shopping.
Rook and Fisher
1995 Consumers tend to buy unexpectedly, non-reflectively, instantly and kinetically, correspondingly identified as a personality attribute.
Beatty and Ferrell
1998 Described impulse buying as a unexpected and instant purchase, with no shopping purposes to buy the exact product or to involve in a particular buying assignment.
Kacen and Lee
2002 Impulse purchasing of individuals can be obstructed by cultural influences. Individuals partaking in impartial self-concept involve further impulse buying.
Verplanken et al.
2005 Negative rather than positive affect is a pushing power following on-going impulse buying. The outcome of the negative condition of mind can be affected by impulse buying.
Chapter 2: Impulse buying 22
Table 2.2: Chronological study of impulse buying (continued…)
Author Year Contribution
Dawson and Kim
2009 Examined online impulse buying and discovered that the affective-cognitive traits have meaningful association‟s concerning a person‟s affective and cognitive condition and their online impulse-buying behaviour.
Chang et al. 2011 Impulsive purchases are an outcome of the positive expressive replies of the consumer in the retail setting.
Source: Muruganantham and Bhakat (2013:151-152)
The impulse buying process is discussed in the following section.
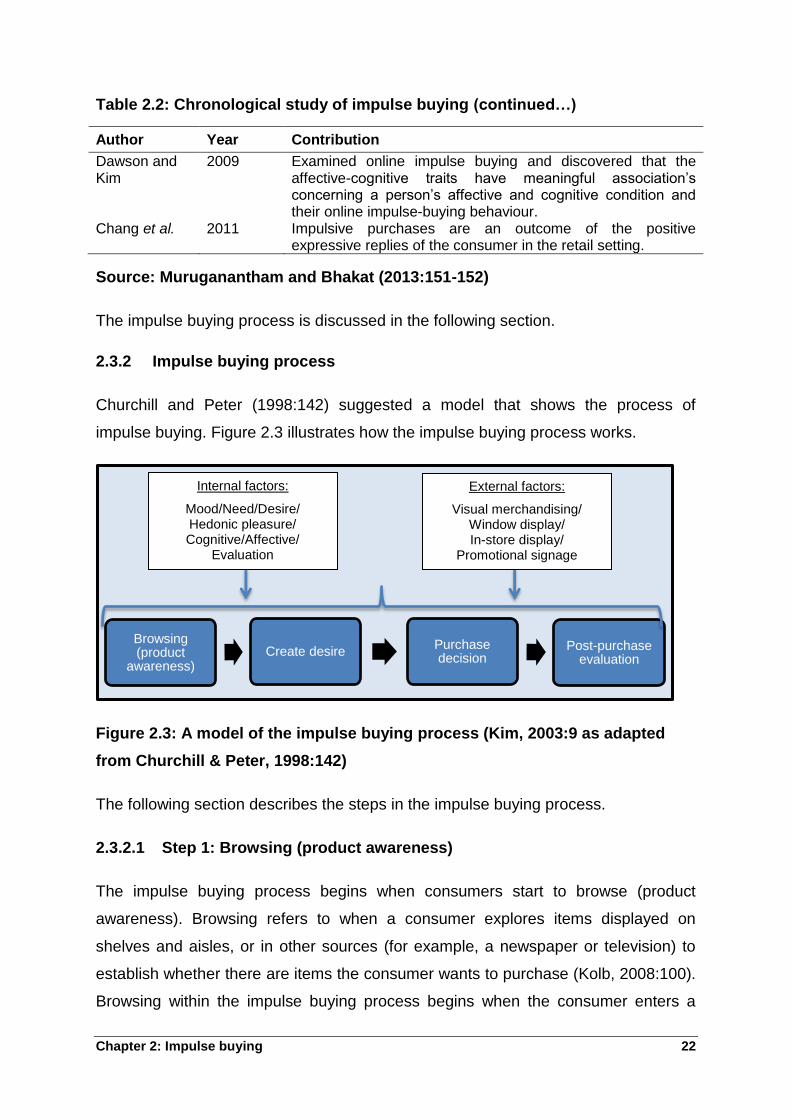
2.3.2 Impulse buying process
Churchill and Peter (1998:142) suggested a model that shows the process of
impulse buying. Figure 2.3 illustrates how the impulse buying process works.
Figure 2.3: A model of the impulse buying process (Kim, 2003:9 as adapted
from Churchill & Peter, 1998:142)
The following section describes the steps in the impulse buying process.
2.3.2.1 Step 1: Browsing (product awareness)
The impulse buying process begins when consumers start to browse (product
awareness). Browsing refers to when a consumer explores items displayed on
shelves and aisles, or in other sources (for example, a newspaper or television) to
establish whether there are items the consumer wants to purchase (Kolb, 2008:100).
Browsing within the impulse buying process begins when the consumer enters a
Browsing (product
awareness) Create desire
Purchase decision
Post-purchase evaluation
Internal factors:
Mood/Need/Desire/ Hedonic pleasure/ Cognitive/Affective/
Evaluation
External factors:
Visual merchandising/ Window display/ In-store display/
Promotional signage
Chapter 2: Impulse buying 23
store without intending to purchase an item (Kim, 2003:8; Hubrechts & Koktürk,
2012:7). Furthermore, as consumers glance at the products, consumers are
influenced by internal and external factors that activate their impulsive desire.
2.3.2.2 Step 2: Create desire
Desire refers to wish, long for, crave, or want something (Dictionary.com, 2016).
Consumers create their own desire to buy an item by browsing in the store and
finding an item, they did not intend to buy. That desire was caused by the internal
factors of the consumer and external factors of the store or marketer. Therefore,
when a consumer creates the desire to buy a product that was initially not on their
list, this makes them a potential impulse buyer.
2.3.2.3 Step 3: Purchase decision
Consumers make a purchase decision without prior knowledge and information
about the product. At this phase of the process, consumers purchase the product
regardless of the consumer‟s prior intention (Kim, 2003:10; Hadjali et al., 2012:246).
2.3.2.4 Step 4: Post-purchase evaluation
In the post-purchase evaluation stage, consumers may be satisfied or dissatisfied
with the purchase of the impulsive product (Kim, 2003:8). Dissatisfaction of impulsive
products has been experienced by consumers, but there remains a level of
satisfaction with the product purchased (Maclinnis & Price, 1987:480; Sherry,
1990:27).
In the impulse buying process, consumers are influenced by internal and external
factors that activate their impulse buying behaviour (Kim, 2003:10), which is
explained in detail in Section 2.4.
The following section describes the types of impulse buying that consumer‟s
experience.
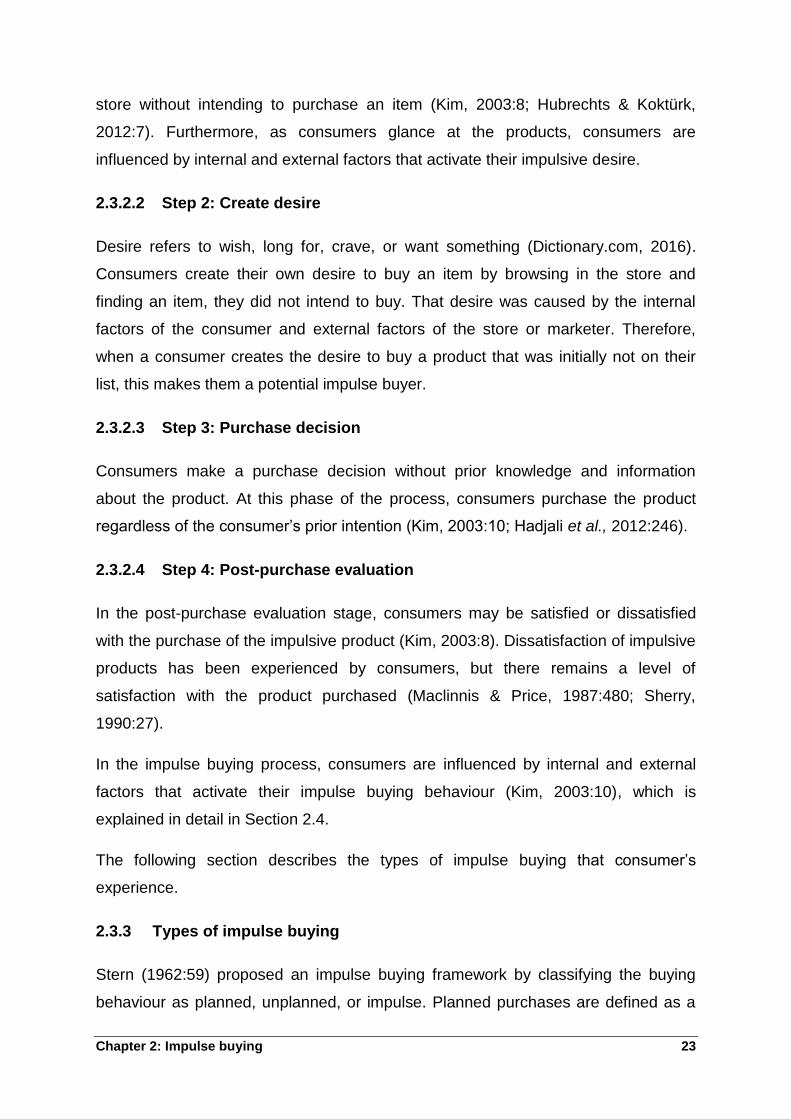
2.3.3 Types of impulse buying
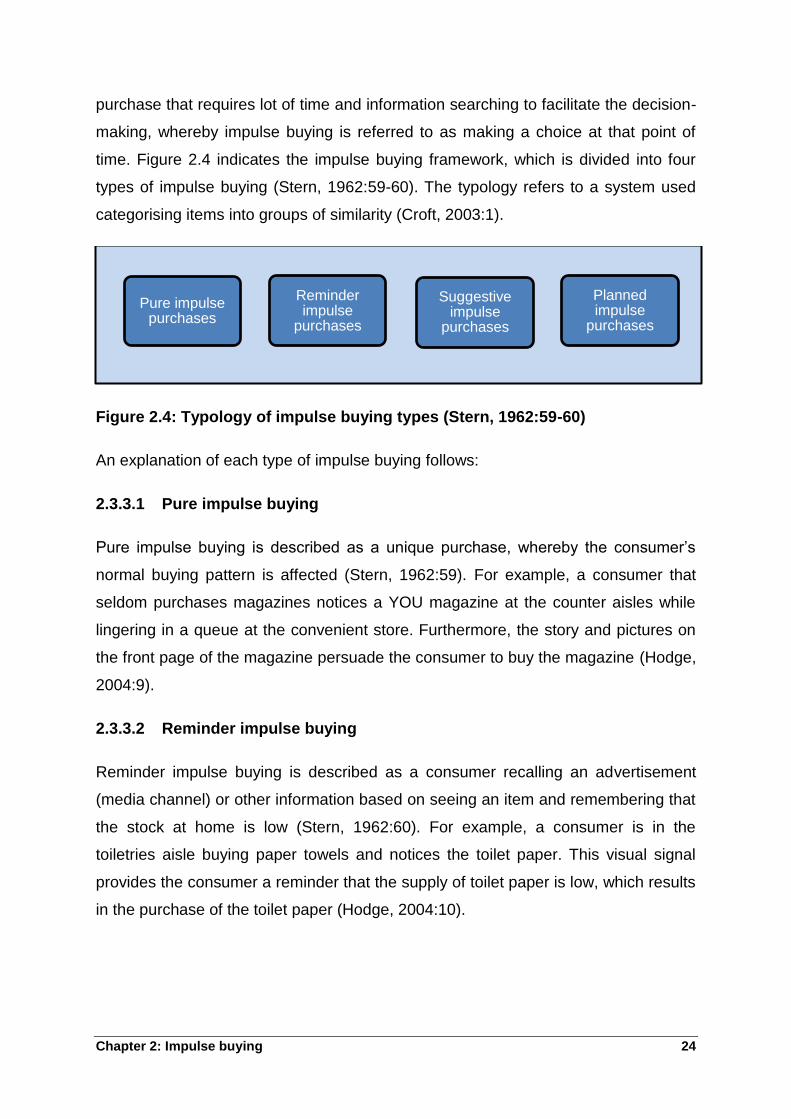
Stern (1962:59) proposed an impulse buying framework by classifying the buying
behaviour as planned, unplanned, or impulse. Planned purchases are defined as a
Chapter 2: Impulse buying 24
purchase that requires lot of time and information searching to facilitate the decision-
making, whereby impulse buying is referred to as making a choice at that point of
time. Figure 2.4 indicates the impulse buying framework, which is divided into four
types of impulse buying (Stern, 1962:59-60). The typology refers to a system used
categorising items into groups of similarity (Croft, 2003:1).
Figure 2.4: Typology of impulse buying types (Stern, 1962:59-60)
An explanation of each type of impulse buying follows:
2.3.3.1 Pure impulse buying
Pure impulse buying is described as a unique purchase, whereby the consumer‟s
normal buying pattern is affected (Stern, 1962:59). For example, a consumer that
seldom purchases magazines notices a YOU magazine at the counter aisles while
lingering in a queue at the convenient store. Furthermore, the story and pictures on
the front page of the magazine persuade the consumer to buy the magazine (Hodge,
2004:9).
2.3.3.2 Reminder impulse buying
Reminder impulse buying is described as a consumer recalling an advertisement
(media channel) or other information based on seeing an item and remembering that
the stock at home is low (Stern, 1962:60). For example, a consumer is in the
toiletries aisle buying paper towels and notices the toilet paper. This visual signal
provides the consumer a reminder that the supply of toilet paper is low, which results
in the purchase of the toilet paper (Hodge, 2004:10).
Reminder impulse
purchases
Planned impulse
purchases
Suggestive impulse
purchases
Pure impulse purchases
Chapter 2: Impulse buying 25
2.3.3.3 Suggestion impulse buying
Suggestion impulse buying can be described as a consumer who notices a product
initially and envisions a want for this product (Stern, 1962:60). For example, a
consumer spots the plastic peeler for the first time in the store. The display of the
plastic peelers is located next to the vegetables, and display full-colour pictures with
directions. Moreover, this item appeals to the consumer due to being easier and
faster than using a paring knife and therefore the plastic peeler is purchase by the
consumer (Hodge, 2004:10).
2.3.3.4 Planned impulse buying
Planned impulse buying is described as the choice the consumer makes to buy an
item based on sales endorsements (Stern, 1962:60). For example, a consumer
wants to buy milk, eggs and bread. Only these items are on the consumer‟s
shopping list. When the consumer proceeds towards the checkout counter, Simba
has a display of chips that are on sale. The consumer becomes aware that their
children love Simba chips as they consume the chips every day for lunch and that
one bag of chips is consumed per week. The consumer remembers that there is a
full bag of chips at home because a bag of chips was purchased last week.
Regardless, the consumer adds the Simba chips to the shopping trolley (Hodge,
2004:10).
The following section describes the level of involvement in terms of impulse buying
items.
2.3.4 Levels of involvement
Impulse buying involves a concept called level of involvement, which is referred to
how important the product is to the consumer or how interested the consumer is in
consuming the product (Tanner & Raymond, 2012:73). Lamb et al. (2009:146)
concur that the level of involvement entails when the consumer purchases a product,
the consumer determines the level of importance and the degree of information
processing which is attached to the product.
Chapter 2: Impulse buying 26
Parboteeah (2005:15-16) states how certain products are bought more on impulse
than other products. Impulse items can be categorised as any product, for example,
the latest product, trials or products at a low prices (Tinne, 2011:209). Butkeviciene
et al. (2008:59) state that products bought on impulse depend on the category, price
and symbolic meaning of the products. Stern (1962:62) suggests that products are
bought more on impulse when the products are not so expensive or when they have
a shorter production cycle.
2.3.4.1 Low involvement products
Low involvement products bought by consumers have been found to have a different
influence on consumption patterns than the high involvement of products (Rook &
Hoch, 1985:24).
Low involvement products are often bought on impulse however, the frequency of
this is minimal. Low involvement products are categorised as inexpensive and result
in a low risk purchase if the consumer feels as thou the product was a mistake
(Tanner & Raymond, 2012:73). Consumers are found to buy the products
automatically without giving to much thought. Examples of low involvement products
include toothpaste, matches and snacks. When a consumer buys toothpaste, there
is no risk involved even if the consumer buys toothpaste that is not the consumer‟s
favourite brand.
2.3.4.2 High involvement products
High involvement products is categorised as a high risk for consumers if the product
does not work, complicated, or expensive. Consumers will often spend majority of
the time comparing the products features, prices and warrantees (Tanner &
Raymond, 2012:73).
High involvement products can also extend to big-ticket items such as automobiles
and home appliances. A cell phone in particular entails an emotional approach as
well as a reasonable approach when purchasing (Kannan & Vinayagamoorthy,
2014:19). An example of a high involvement product is a car, whereby the consumer
researches the various models and different features of all the cars that are within
Chapter 2: Impulse buying 27
the budget before a decision is made. A high risk is involved as the consumer is
spending a lot of money on the item.
In the next section, the factors influencing impulse buying behaviour are discussed in
detail.
2.4 FACTORS INFLUENCING IMPULSE BUYING BEHAVIOUR
Research done by Schiffman et al. (2010:36) revealed that consumers purchase
impulsively when the influence of family, friends, advertising and role models come
into play, but also by their mood, situational moments and emotions. Moreover,
Schiffman et al. (2010:36) concludes that all of these factors collectively form the
concept of thinking and research regarding consumer behaviour. The first factor
discussed is impulse buying behaviour.
2.4.1 Impulse buying behaviour
A consumer‟s internal differences concerning an impulsive act may be regarded as
the most influential when purchasing on impulse (Chen, 2008:155). Personality-
related factors are characteristics of the consumer rather than the shopping
environment, which can influence impulse buying behaviour. This leads to the
business utilising the characteristics of the consumer to influence them to a minor
extent, but cannot control them completely (Žnideršić et al., 2014:84). Patil and
Agadi (2016:190) concur by stating that impulse buying behaviour symbolises the
consumer‟s internal traits that persuade the consumer to interact in impulse buying.
Rook and Hoch (1985:23) highlight that the consumer‟s experience the impulsive
urge during the shopping trip and not the product. Rook and Fisher (1995:305)
stated that when a consumer has a tendency to engage in impulse shopping, the
concept is referring to as the buying impulsiveness trait.
Chen (2008:155) states that when a consumer buys on impulse, the consumer is
influenced significantly by situational and social norms. Likewise, Kannan and
Vinayagamoorthy (2014:21) state that although the consumer‟s emotional state
(affective response) and personality traits (cognitive response) are important, they
are trigged by external factors to buy on impulse. Equally, Bessouh et al. (2015:861-
862) state that in the presence of others, the consumers senses are stimulated, due
Chapter 2: Impulse buying 28
to the physical environment, the atmosphere, or the product itself (considered
external and situational factors). In Maymand and Ahmadinejad‟s (2011:13058)
study, they proposed a research design whereby external and situational factors are
the independent variables, which directly influence impulse buying behaviour
(affective and cognitive response), which are the dependent variables.
The cognitive and affective response is regarded as factors within the impulse
buying behaviour that ultimately determine the buying decision of the consumer. Kim
and Mattila (2010:433) indicate that the consumer satisfaction level is influenced by
the cognitive and affective response of the consumer. A discussion pertaining to
these factors follows.
2.4.1.1 Cognitive response
The cognitive response entails the lack of planning when a purchasing decision is
made (Dincer, 2010:155). The cognitive response refers to mental structures and
processes involved reflecting and interpreting (Sharma, 2012:24). In addition,
cognitive response entails that once the consumer has experienced the product, a
combination of the consumer‟s cognition, knowledge and perceptions acquired assist
in the purchase. High involvement products such as laptops and cars involve
cognitive decision-making (Swarnalatha & Soundhariya, 2015:267).
2.4.1.2 Affective response
The affective response is regarded as the consumer‟s feelings of excitement and the
urge to buy a product (Dincer, 2010:155). The affective response entails the
consumer‟s irresistible desire to buy, positive buying emotions and mood
management (Sharma 2012:26). Low involvement products are selected by the
affective response of the consumer (Swarnalatha & Soundhariya, 2015:267).
The external factors influencing impulse buying behaviour are discussed next.
2.4.2 External factors
External factors are defined as factors implemented by marketers and storeowners
to entice consumers into a purchasing behaviour by placing marketing cues (Youn &
Faber, 2000:181). External factors are related to the shops atmosphere and
Chapter 2: Impulse buying 29
marketing atmosphere. The shops atmosphere incorporates the magnitude of the
store, setting and arrangements, while the marketing atmosphere is the various
sales and advertising performances (Patil & Agadi, 2016:189). Unlike internal
factors, external factors are controlled by the marketers or storeowners to motivate
impulse buying behaviour (Žnideršić et al., 2014: 84). A consumer can be persuaded
to buy on impulse once a consumer encounters graphic stimulus in the retail setting,
or several stimuli is positioned by the marketer or storeowner (Piron, 1991:509).
Applebaum (1951:175) remained the primary researcher to suggest that when
consumers are exposed to stimulus in the store, they are likely to make impulse
purchases. Xu (2007:40) states that the consumer‟s emotions are influenced by the
store environments, which could additionally guide to impulse buying in the shop.
Rook and Hoch (1985:24) highlight that the consumer‟s sensation and perception to
buy on impulse is determined by the external stimulus, which leads to a sudden urge
to buy. Similarly, Mattila and Wirtz (2001:564) discovered that impulse buying
behaviour is positively affected by the store environment, particularly when the store
setting over stimulates the stimuli within the store. Consumer emotions are affected
by the store environment (Donavan & Rossiter, 1982:54). Furthermore, Zhou and
Wong (2003:43) identified that point of purchases (POP) are informative and
experimental facets that influence impulse buying.
Mattila and Wirtz (2001:363) carried out an experimental study on how music and
the scent of the store influence the consumers purchasing decisions. The findings
demonstrated significant influence of both factors on their own as well as when
combining the two factors together. Zhou and Wong (2003:39) classified the in-store
shopping environment into two influences, namely promotional and atmospheric
influence. The promotional influence entails promotional discounts (for example,
vouchers and gifts) and is inexpensive, whereas, atmospheric influences entail the
enjoyment and attractiveness (for example, the crowds in the shop and
salespersons).
Patil and Agadi (2016:190) explained that retailers and storeowners are spending a
lot of money on promoting products and brands, with the aim of increasing brand and
product awareness, trail usage and market share. Hence, retailers and storeowners
Chapter 2: Impulse buying 30
need to become knowledgeable on the effectiveness of the store atmosphere and
determine to what extent they can influence the consumers purchasing behaviour.
This information and knowledge helps to determine where the business can utilise
their resources more effectively, which is designed to generate more sales and
become different to their competitors. External factors are independent variables;
they are outside of the consumer‟s control. These factors include in-store
atmosphere, in-store browsing, in-store layout, salespersons, promotions and
reference groups. A discussion pertaining to these factors follows.
2.4.2.1 In-store atmosphere
In-store atmosphere refers to the dynamics within the stores presentation (for
example, fittings, parquet, odour, noise intensity, lights, the level of the hot or cold
atmosphere in the store, and the backdrop). These factors within the store can be
used to observe how the consumers buying mood are influenced (Eroglu & Machleit,
1993:34). An important element of a store atmosphere is music, music has been
found to influence a consumers purchasing behaviour (Mattila & Wirtz, 2001:276).
According to the findings of Mattila and Wirtz (2001:285), good background music
within the store influences consumers to stay in the store as well as browse longer.
The outcome of a decent melody played in the background activates the consumer‟s
awareness that make them engage in impulse buying.
Store scent has also been found to influence consumer‟s purchasing intention
(Hussain & Ali, 2015:36). Pleasant aroma in a store makes consumers devote more
time observing their products, which will result in an impulsive purchase (Nishanov &
Ahunjonov, 2016:4).
2.4.2.2 In-store browsing
Consumers engaging in in-store browsing, means that the consumers scan through
the shops items for gaining knowledge and keeping themselves entertained with no
intention to purchase an item, which is an important part of impulse buying behaviour
(Vänniä, 2013:21). Consumers purchase more on impulse when they browse in the
stores than those who do not. In addition, consumers are then exposed to more
stimuli in the store when browsing longer (Vänniä, 2013:21). Therefore, the
consumers urge to buy on impulse increases (Kim, 2003:14).
Chapter 2: Impulse buying 31
2.4.2.3 In-store layout
Store layout refers to the organisation of the stores sections and aisles to ensure that
the layouts are well designed to expose consumers to all the possible products the
store has to offer in the given floor space (Shivangunde et al., 2012:7).
Good store layout assists consumers to find the product quickly (Bitner, 1992:66).
Ohta and Higuchi (2013:209) state that creating convenience for consumers involves
a well-organised store layout that enhances shopping process. However, in majority
of the stores, everyday essential products (for example, bread and milk) are located
towards the back of the shop to make sure consumers browse longer in the shop,
which amplifies the possibilities of impulse buying (Levy & Weitz, 2011:472).
Hubrechts and Koktűrk, (2012:15) state that the common layouts used is the grid
path layout, the free path layout and the forced path layout.
The grid pattern layout is a traditional layout that is preferred by superstores
(Vrechopoulos et al., 2004:14). This shop setting is characterised as long lanes and
the lines are organised in a rectangular arrangement (Vrechopoulos, 2004:42).
Moreover, this setting has numerous benefits, namely being a cheap layout to
implement, easy maintenance, ease of cleaning, consumers are familiar with where
the items are and the layout is easy to change (Shivangunde et al., 2012:17).
The free flow layout is characterised by the lanes, demonstrations and shelf levels;
hence, the liberty of movement. It is the simplest type of store layout, used mostly for
fashion stores (Banat & Wandebori, 2012:85). Moreover, the free flow layout has
several advantages, namely it gives a consumer the opportunity to browse anywhere
and provides flexibility to the consumer in a relaxed carefree environment (Ijaz et al.,
2014:313).
The forced path layout is a kind of setting that manipulates consumers to enter every
aisle through the store and consumers are forced to browse all products the store
has to offer (Li, 2010:14). This setting increases the odds of unintentional purchases
(Faizal and Radha, 2014:80). Moreover, the forced path layout has several
advantages such as forcing the customer to view all the items displayed in the store
Chapter 2: Impulse buying 32
and increasing the consumers‟ willingness to purchase items (Masudin & Fuadi,
2014:143).
2.4.2.4 Salespersons
A salesperson is a person who sells or assists consumers to buy items within the
store (Cambridge University Press, 2016). Consumers have shown to enjoy the
shopping experience more when there are helpful and friendly shop assistants. The
good service provided by the salespeople can positively influence the shopping
experience. However, it has also been determined that the consumers enjoy the
shopping environment more when there is no arrogant salesperson present (Jones,
1999:135). Research studies have shown that purchasing online encourages less
impulse purchases due to the absence of a salesperson to encourage the sale.
Therefore, the presence, behaviour and selling techniques of salespersons affect the
consumer‟s impulse buying behaviour (Ahuja, 2015:51).
2.4.2.5 Promotions
Sales promotion is defined as a marketing tool to persuade a consumer to buy the
product (Tutor2u, 2015). Offering products on discount or at a promotional price
encourages more impulse purchases. Marketers have learned that consumers fear
the future. Consumers immediately purchase the product due to not having enough
money available in the future, the product might not be available in the future, or the
promotion will not be on offer in the near future. Offers like scratch and win, by two
get one free, stop and shop, coupons, referral gifts and lucky draws manipulate
consumers to believing they are saving costs and getting value for money. Impulsive
purchases are implemented when consumers buy more than what they need (Jamal
& Lodhi, 2015:30-31).
2.4.2.6 Reference groups
A reference group entails a number of different groups, for example family, friends,
celebrities and religious groups (Mothapo, 2013:41). Reference groups compare
their attitudes, values, knowledge and behaviour over several aspects (including
buying behaviour) (Kumar, 2007:327). Impulse purchases are increased in the
Chapter 2: Impulse buying 33
presence of others (Tinne, 2011:212). For example, as soon as individuals are in a
crowd, they are inclined to consume more food (Luo, 2004:431).
Mothapo (2013:41) explained that family is considered an important group to many
consumers as from a young age the consumer belonged to this group first. The
consumer‟s parents or family members are the most influential at a young age, as
consumers learn from others purchasing behaviour. The younger generations
purchasing decisions are significantly influenced by reference groups. Generation Y
consumers engage in more purchases with the presence of others, and therefore
family and friends play a significant role (Feltham, 1998:377).
The situation factors influencing impulse buying behaviour are discussed next.
2.4.3 Situational factors
Situational factors entail all the factors that are related to the time and place of
observation (Mihic & Kursan, 2010:49-50). When the consumer buys on impulse, the
situational factors originate from the store environment (Rhorrami et al., 2015:824).
The situational factors such a time availability moderates the relationship between
the store environment and the consumer‟s impulsiveness (Xu, 2007:44, 51).
The consumer‟s available time and tendencies positively affect the browsing in the
store (Beatty & Ferrell, 1998:184). Stern (1962:61) identified the various
characteristics of the product that is confronted within the store, can possibly
influence impulse buying. Circumstances such as the consumers‟ economic
situation, time constraints, social visibility and emotions contribute to the feeling of
buying on impulse (Beatty & Ferrell, 1998:172, 184). A discussion pertaining to these
factors follows.
2.4.3.1 Time availability
Time indicates the temporal perspective of circumstances (Belk, 1975:427). Time
accessibility is employed to determine the situational traits in the temporal
perspective. Consumers shopping have been affected by the time available to
perform a task (Gehrt & Yan, 2004:6). Situations whereby the consumer has time
restraints, the consumer may change shopping habits or store choices and will not
notice the in-store marketing efforts and displays (Salman et al., 2014:188). In
Chapter 2: Impulse buying 34
contrast, when consumers are in the store and there is a higher availability of time,
the consumer may feel a positive emotional response to engage in unexpected
buying. On the other hand, consumers with a low accessibility of time could be
influenced negatively, whereby the chance of impulse buying will be reduced (Chang
et al., 2014:302).
2.4.3.2 Money availability
In the impulse buying process, availability of money has an important role, for
example, Beatty and Ferrell (1998:176) state that the money available facilitates in
increasing the buying power of the consumers. Consumers avoid the shopping
experience when they have no money available (Foroughi et al., 2012:42).
The next section discusses the traits of Generation Y.
2.5 GENERATION Y COHORT
Generation or age cohorts are a group of consumers who have had similar
experiences in terms of political, social, economic and social environments (Hawkins
et al., 2007:124). Individuals from the same generation usually have similar attitudes,
behaviours and value due to their similarities (Hawkins et al., 2007:124). Throughout
time, six diverse generations have been identified, specifically GI Generation,
Mature/Silents, Baby Boomers, Generation X, Generation Y/Millennium and
Generation Z/Boomlets (Marketing Teacher, 2016) of which Generation Y is currently
receiving the most attention.
Generation Y is regarded as the first generation to have an opportunity for women to
apply for jobs, income shared equally between men and women of the household,
family types differ, ethnic and cultural diversity are being respected and becoming
custom to divorce (Hawkins et al., 2007:184). Higher incomes are expected from this
generation, as this generation is more educated than other generations (Bakewell &
Mitchell, 2003:96-97). Although this generation has been brought up in a society
vulnerable to the economic uncertainty, drug abuse, AIDS, homelessness and gang
violence, Generation Y consumers have been characterised being emotional,
assertive, intellectually expressive, innovative, self-reliant, have a sense of
Chapter 2: Impulse buying 35
independence, curious and are optimistic for now and the future (Hawkins et al.,
2007:124).
Embracing diversity, being open-minded and techno-savvy are characteristics of
South African Generation Y consumers (Jide-akinwale, 2013:41). Generation Y
consumers are born from 1986 to 2005 (Markert, 2004:21). This generation is also
known as Millennial or Echo-Boomers (Acar, 2014:13).
The first generation born into a postmodern society are the Generation Y (Best &
Kellner 2003:76). They are the first generation to exist in a digital domain (Szekely &
Nagy, 2011:2187). From birth, Generation Y consumers have been exposed to the
digital world that is driven by the technology developments, namely cell phones, the
internet and iPods. This generation is known as a well-informed generation as the
knowledge gained on technological developments contribute towards this statement
(Yarrow & O‟Donnell, 2009:83). Consumers born before technology was invented will
only appreciate the technology of today, as Generation Y takes the technological
developments for granted.
The society and economic circumstances of the future will be determined by
Generation Y and generations to come (Szekely & Nagy, 2011:2187). Generation Y
is considered as the biggest collection of individuals, while being compared to the
other six generations. Based on Generation Y group size, this generation can utilise
global networks to link individuals together, giving this group the capabilities to
movements of mobilise mass.
The following section provides a synopsis of the chapter.
2.4 SYNOPSIS
This chapter focused on achieving the theoretical objectives set for this study. The
first objective was reviewing the literature on consumer behaviour, this objective was
achieved by describing the term consumer behaviour and how the consumer
decision-making process works. The second objective was reviewing the literature
on impulse buying. This objective was achieved by describing the definitions of
impulse buying, how impulse buying has revolutionised, the chronology of impulse
buying, the types of impulse buying, specifically pure, reminder, suggestive and
Chapter 2: Impulse buying 36
planned impulse purchases and how impulse products and level of involvement (low
and high) impacted impulse buying.
The third objective was reviewing the literature on the factors that influence impulse
buying behaviour. The main objective was to determine the factors influencing
impulse buying behaviour, as this was the primary objective of the study. The
primary and theoretical objective was achieved by describing the factors that had an
influence on impulse buying behaviour (cognitive and affective response) namely,
external factors (in-store atmosphere, browsing, layout, salespersons, promotions
and reference groups) and situational factors (time availability and money
availability). The last objective was reviewing the literature pertaining to the
characteristics of Generation Y cohort; this was achieved by describing the definition
as well as the characteristics of the Generation Y cohort, as this signifies the sample
size.
The next chapter describes the research methodology of the empirical portion of the
study.
Chapter 3: Research methodology 37
CHAPTER 3
RESEARCH METHODOLOGY
3.1 INTRODUCTION
According to Malhotra (2015:28), marketing research is used to solve a specific
problem, improve decision-making or recognising a marketing opportunity by
identifying, collecting, analysing and reporting the data. Correspondingly, Iacobucci
and Churchill (2010:5) define marketing research as what connects the consumer to
the marketer by means of information, which is used to observe the marketing
performances, improve the marketing opportunities and problems identified, and to
help understand the concept marketing.
As indicated in Chapter 1 (refer to Section 1.3.1), the primary objective for this study
was to verify the factors that affect impulse buying behaviour of South African
Generation Y students in order to guide the formation of marketing strategies for
effectively targeting this market. This primary objective was then organised into five
empirical objectives (refer to Section 1.3.3), which influence the grouping of the data
explained below:
Determine whether the external factors of in-store atmosphere, in-store
browsing, in-store layout, salespersons, promotion and reference groups‟
influence Generation Y students‟ cognitive response to buy on impulse.
Determine whether the external factors of in-store atmosphere, in-store
browsing, in-store layout, salespersons, promotion and reference groups‟
influence Generation Y students‟ affective response to buy on impulse.
Determine whether the situational factors of time availability and money
availability influence Generation Y students‟ cognitive response to buy on
impulse.
Determine whether the situational factors of time availability and money
availability influence Generation Y students‟ affective response to buy on
impulse.
Determine whether male and female Generation Y students differ in their
impulse buying behaviour.
Chapter 3: Research methodology 38
This chapter describes the theoretical background of the research methodology used
in collecting and analysing this data, including the questionnaire design, sampling
procedure, data collection process and the statistical techniques used to analyse the
descriptive analysis and tests of significance. This chapter begins with a discussion
of the marketing research design.
3.2 RESEARCH DESIGN
Hair et al. (2013:36) define the research design as an overall plan to utilise different
methods, in aim of gathering and examining the data. Moreover, identifying the
research design that is the most appropriate is determined by research objectives
and information requirements. Similarly, Clow and James (2014:34) define the
research design as a plan that is utilised to address the research problem, question
or hypothesis of the specific study. The research design is used to determine how to
collect the data and assist in the research process. The research designs are divided
into three classifications, specifically exploratory research, causal research and
descriptive research.
Exploratory research is conducted when more information is required about a
problem, for identifying relevant courses of action, as well as developing an
approach by gaining insights (Malhotra, 2015: 85-86). Causal research is referred to
as holding other variables constant; however expose the cause-and-effect
relationship amongst the dependent and independent variables (Wiid & Diggines,
2009:55-56). Descriptive research is conducted to determine the relationship of two
variables (Iacobucci & Churchill, 2010:59). Malhotra (2010:106) adds that there are
vast uses for descriptive research, namely describing the characteristics of specific
groups, making predictions and estimating consumer behaviour. Descriptive
research is used to respond to queries such as who, what, at what time, where and
in what way (Hair et al., 2008:32).
Additional categorises of descriptive research are longitudinal and cross-sectional
research designs (Iacobucci & Churchill, 2010: 86). A longitudinal research design
examines the same group of participants but at different time intermissions (Welman
et al., 2005:95). In contrast, a single cross-sectional research design uses any
sample or population only once for collecting the required information (Malhotra,
Chapter 3: Research methodology 39
2010:108). However, inside a multiple cross-sectional design participants (two or
more samples) are used only once to collect the required information (Malhotra,
2010:108).
For the purpose of this study, descriptive research design using a single cross-
sectional method was followed as this study attempts to uncover participants‟
impulse buying behaviour and the factors that influence their impulse buying
behaviour from the sample only once.
The following section discusses the research approach utilised in this study.
3.3 RESEARCH APPROACH
Within a research study, qualitative and quantitative research are the two basic
approaches used to collect and analyse data (Berndt & Petzer, 2011:45). According
to Cant et al. (2003:144), qualitative research is characterised as an unstructured,
exploratory research approach using a small sample size, which aims to provide an
understanding of the research problem. In addition, Burns and Bush (2014:146)
describe quantitative research as research conducted on a larger sample size that
involves administrating structured questions with predetermined response options.
Correspondingly, Hair et al. (2008:81) state that in quantitative research studies,
questionnaires utilise formal questions with predetermined response options, using a
large amount of participants.
This study pursued a quantitative research method since this research provides itself
to statistical evaluation of huge numbers of representative cases. The following
section discusses the sampling strategy employed in this study.
3.4 SAMPLING STRATEGY
The sampling strategy is the strategy the researcher uses to ensure the sample is
the closest representative of the sample as possible (Malhotra, 2015:271). According
to Berndt and Petzer (2011:33), a sample is referred to as a subgroup within the
population, whereby the data will be obtained; representing the sample utilised to
participate in the study. The following sub-sections describe the target population,
the sampling frame, the sampling method and the sampling size used in this study.
Chapter 3: Research methodology 40
3.4.1 Target population
The first step of the sampling process is defining the target population. A population
is defined as a group who share in similar characteristics (Zikmund & Babin,
2010:301). Similarly, Malhotra (2015:272) defines target population as to when a
researcher collects information of the participants and making conclusions. When
defining the target population, Sokhela (2015:28) suggests that researchers should
consider the participants in the survey research (element), the information needed by
the elements the information needed by the elements (sampling units), the
geographical boundaries (extent), as well as including the time period (term).
The target population appropriate for this study is full-time Generation Y students
aged 18 to 24, listed at South African public HEIs in Gauteng during 2016.
3.4.2 Sampling frame
Welman et al. (2005:57) briefly state that researchers need to clarify the population
to which the hypothesis applies before a sample of the population can be chosen.
Malhotra (2010:373) defines a sampling frame as the target population that
represents the elements.
The sampling frame for this study comprised 26 registered South African public HEIs
(Universities South Africa, 2016). From this sample frame, a non-probability
judgement sample of two HEI campuses, a traditional university and a university of
technology, located in the Gauteng province, was chosen. The reason for selecting
the Gauteng province is that it comprises the largest share of the South African
population.
3.4.3 Sample method
According to Gilbert and Churchill (1996:56), two types of sampling methods exist,
specifically probability and non-probability sampling. Probability sampling is a
sampling method whereby a random sampling technique is used, so the population
has a fixed possibility of being included in the sample (Malhotra, 2015: 275). In
contrast, non-probability sampling rather relies on a researcher‟s opinion than a
random selection (Malhotra, 2010:376).
Chapter 3: Research methodology 41
There are four various types of probability sampling techniques, specifically simple
random sampling, systematic sampling, stratified sampling and cluster sampling
(Malhotra, 2010:376), whereby non-probability sampling techniques include,
judgement sampling, quota sampling, snowball sampling and convenience sampling
(Welman et al., 2005: 56). A convenience sampling technique pertains to participants
that are quick to access (Hair et al., 2008:131). The advantages of this technique are
time and cost savings (Bradley, 2013:168).
The sampling method that was utilised in this study was a non-probability
convenience sampling of full-time Generation Y students aged 18 to 24 that were
registered at two South African HEIs in 2016.
3.4.4 Sample size
Malhotra (2015:274) describes a sample size as the amount of participants that will
be included in the research. Struwig and Stead (2010:120) suggest that similar
studies in nature utilising the same sample sizes, gives an opportunity for the
researcher to draw comparisons.
For the purpose of this study, a sample size of 400 full-time undergraduate
Generation Y students was chosen. The sample size is in the range of other studies
of this nature such as those conducted by Dawson and Kim (2009) (sample size of
400); Yang et al. (2011) (sample size of 360); Badgaiyan and Verma (2015) (sample
size of 384), therefore, was considered sufficiently large.
Within the succeeding section, the data collection method used in this study is
discussed.
3.5 DATA COLLECTION METHOD
Data collection refers to a task that entails collecting the responses from the
participants of the sample (Berndt & Petzer, 2011:202). Malhotra (2015:149)
distinguished between two types of quantitative descriptive data collection
techniques, specifically the survey method and the observation method. The
observation technique implies obtaining data from the participants by observing their
behaviour (Walliman, 2011:100), whereas the survey method is used to collect data
Chapter 3: Research methodology 42
from participants in a controlled manner by means of a self-administered
questionnaire (Malhotra, 2010: 211).
The survey method can be administered using different methods, specifically
personal interviews, telephone surveys, online interviews, mail surveys, self-
administered questionnaires and drop-off surveys (Hair et al., 2013:111). The
responsibility is dependent on the participants to read and complete the questions in
the self-administered questionnaires (Zikmund & Babin, 2010:166). In particular, the
drop-off survey method entails when the researcher of the study explains the studies
purpose to the participants of interest, once explained, the self-administered
questionnaires are left with the participants and are collected at a specified time
agreed upon (Aaker et al., 2011:231). In addition, Malhotra (2010: 228) states that
although drop-off surveys are similar to mail surveys, drop-off surveys are known to
have a higher response rate.
In this study, the method of data collection used was the survey method, whereby a
standardised self-administered questionnaire was utilised, using the drop-off survey
method to obtain the required data. The questionnaire was submitted for approval
and ethics clearance to the Ethics Committee of the Faculty of Economic Sciences
and Information Technology at the North-West University (Vaal Triangle campus).
Once the ethics clearance certificate was issued (Ethics Clearance Number:
ECONIT-ECON-2016-020) and permission was solicited, the questionnaires were
hand-delivered to the participating academic staff members of the two selected HEI
campuses to be distributed to the students for voluntary completion. The
questionnaires were distributed before the respective classes and were completed
before the class commenced with the teaching. The questionnaires were collected
once the participants were done completing them.
This next section describes the research instrument in this study, namely the
questionnaire.
3.5.1 Questionnaire design
A questionnaire is designed to obtain and collect primary raw data by creating a
framework consisting of set questions and scales. In addition, a construction of a
questionnaire entails validated scale measurements and formatting them into a
Chapter 3: Research methodology 43
complete measuring instrument for communicating with participants (Hair et al.,
2003:449). According to Wiid and Diggines (2009:172), the questionnaire assists in
solving the research problem; therefore, the questions within the questionnaire are
essential.
A questionnaire entails several objectives, namely a set of specific questions should
be translated in such a way that participants are able to answer, participants should
be motivated to complete the questionnaire and lastly, response errors within the
questionnaire should be minimise (Malhotra, 2010:335). A participant should not take
longer than 20 minutes to complete the questionnaire (McDaniel & Gates, 1999:379).
According to Iacobucci and Churchill (2010:221), the questionnaire‟s physical
appearance can affect the accuracy of replies, participant‟s reactions and processing
the questions with ease. The instructions of the questionnaire should be easy for
participants to understand (Welman et al., 2005:180). The questionnaire should
concentrate on a single topic; furthermore, the information required from the
questionnaire should be clear and brief without unnecessary words (Berndt & Petzer,
2011:187). A front page must be included in the self-administered questionnaire
stating the reason for the study (Bradley, 2013:189).
The recommendations mentioned above directed the design of the questionnaire
utilised in this study. The questionnaire employed in this study portrayed simple and
brief objectives. Due care was taken to ensure that simple English terminology was
used in order for the participants to have a clear understanding of the questions. In
addition, the questionnaire could be completed within 10 minutes, verified during the
pre-testing stage of the questionnaire, making the length of the questionnaire
acceptable. The questionnaire used a front page clarifying the reason of the study,
which stipulates the relevant contact information and the participation from
participants. The questionnaire is presented in appendix A.
3.5.2 Questionnaire format
The questionnaire used in this study, was designed in accordance with achieving the
empirical objectives of the research study as formulated in Chapter 1 (Section 1.3.3).
In accordance with the data required to achieve these objectives, this study adapted
and used three previously validated scales, namely the Verplanken and Herabadi‟s
Chapter 3: Research methodology 44
(2001) impulse buying behaviour scale, the Cho et al. (2014) external factors
influencing impulse buying behaviour scale and the Beatty and Ferrell‟s (1998)
situational factors influencing impulse buying behaviour scale.
The first scale, namely the Verplanken and Herabadi‟s (2001) impulse buying
behaviour scale (20 items), was utilised to determine Generation Y students‟ impulse
buying behaviour and included two constructs, namely cognitive response (10 items)
and affective response (10 items) (refer to appendix A). The second scale, namely
the Cho et al. (2014) external scale (23 items), was utilised to determine the
Generation Y student‟s impulse buying behaviour, comprising six constructs, namely
in-store atmosphere (3 items), in-store browsing (3 items), in-store layout (4 items),
salespersons (4 items), promotions (6 items) and reference groups (3 items) (refer to
appendix A). The third scale, namely the Beatty and Ferrell‟s (1998) situational scale
(6 items), was utilised to determine Generation Y student‟s impulse buying
behaviour, which consists of two constructs, namely time availability (3 items) and
money availability (3 items) (refer to appendix A). A six-point Likert scale, ranging
from strongly disagree (1) to strongly agree (6) was used to measure the
participants‟ rate of agreement or disagreement with each specific item in this study.
The format of a question refers to the extent of freedom given to the participant‟s
responses (Aaker et al., 2011:277). Questionnaires may be classified in two types, a
disguised questionnaire, which is appropriate when the intention of the study is
unknown to the participant by not making the questions easily readable, or an
undisguised questionnaire, where the purpose of the study is not hidden (Iacobucci
& Churchill, 2010:188). Furthermore, two major types of question formats were
identified, specifically unstructured (open-ended) and structured (closed-ended)
(Pallant, 2010:7). An unstructured questionnaire refers to participants providing their
own answers (Pallant, 2013:13); whereas, a structured questionnaire utilises specific
set of response options and response format (Malhotra, 2010:344).
Characteristics of object being measured are assigned with a numerical value known
as measurement (Iacobucci & Churchill, 2010:234). According to Malhotra
(2010:282), the characteristics of the item are being determined rather than the real
item, which includes the attitude, perception, behaviour, opinion or preference itself.
In order for the characteristics to be measured, a scale is utilised. A closed question
Chapter 3: Research methodology 45
is a type of scale (Bradley, 2013:202). According to Zikmund and Babin (2010:241),
a scale selected by the researcher is essential for the study.
An itemised rating scale refers to categorising each category by means of brief
descriptions or numerical values. The participant selects the best appropriate
category by means of the participant‟s perceived attitude or opinion on the question
(Wiid & Diggines, 2009:156). The three frequently utilised itemised rating scales are
semantic differential scale, the Stapel scale and the Likert scale (Cant et al.,
2003:141). The format of a question refers to the extent of freedom given to the
participant‟s responses.
According to Burns and Bush (2014:208), marketing researchers commonly use
Likert scale. Burns and Bush (2014:208) define a Likert scale by providing a series of
statements that the participants have to answer by indicating to what extent they
agree or disagree on agrees-disagrees scale. Likert scales used in previous studies
have found this scale to be reliable, therefore making Likert scales the most popular
amongst researchers (Chisnall, 1992:170), and in addition, Likert scales are easy to
understand.
In this study, an undisguised, self-administered questionnaire was employed. The
questions were utilised to acquire the participants‟ demographic information
contained three dichotomous questions. The three dichotomous questions had to be
answered by indicating an „x‟ on the name of their institution, their country of origin
and gender. Eight multiple-choice questions were answered by indicating an „x‟ on
their year of degree, province of origin, ethnic group, mother tongue language, age,
income per month, the category of impulse buying behaviour they engage in as well
as when last did they purchased on impulse. The questions that relate directly to the
topic of the study were configured in the form of three multiple-item scales in Section
C, Section D and Section E of the research instrument, respectively. A six-point
Likert scale, ranging from strongly disagree (1) to strongly agree (6), was used to
measure the participants‟ rate of agreement or disagreement with each specific item
pertaining to the study.
Chapter 3: Research methodology 46
3.5.3 Questionnaire layout
A questionnaire layout is the order or flow of questions included in the questionnaire
(Burns & Bush, 2010:341). The layout of the questionnaire is essential due to the
effect it has on the participants willingness to complete the questionnaire for the
study (Aaker et al., 2011:289). Placing the easy questions first in the questionnaire is
crucial, as this avoids intimidating the participants (Cant et al., 2003:156). Iacobucci
and Churchill (2010:220) state that the investigating questions of the participants
must be at the beginning of the survey. Questions should be grouped together in the
relevant sections of the questionnaire; this will avoid confusion and will ensure the
items are answered correctly (Malhotra, 2010:352; Struwig and Stead, 2010:89).
Berndt and Petzer (2011:184) state that the characteristics of the participants also
known as the demographic information could not be changed or controlled by
marketing efforts. Malhotra (2010:340) advised that the demographic section should
entail filtered questions; to clarify the participants used for this study are correct. One
requirement that was required for this study was the participant‟s age, as the
specified age of 18 to 24 was utilised.
This study comprise five sections (refer to appendix A). Section A (A1-9) was
designed to collect the demographical information of the participants. Section B (B1-
2) was designed to collect information pertaining to Generation Y students‟ impulse
purchasing. Section C (C1-20) was designed to measure the impulse buying
behaviour of Generation Y students, this scale was adopted from the Verplanken
and Herabadi (2001) scale. Section D (D1-23) was designed to measure the external
factors that influence impulse buying behaviour amongst Generation Y students, this
scale was adopted from the Cho et al. (2014) scale. Section E (E1-6) was designed
to measure the situational factors that influence impulse buying behaviour amongst
Generation Y students, this scale was adopted from the Beatty and Ferrell (1998)
scale.
The following explains the pre-testing of the questionnaire.
Chapter 3: Research methodology 47
3.6 PRE-TESTING OF THE QUESTIONNAIRE
According to Smith and Albaum (2012:72), a questionnaire should be pretested and
then piloted. A questionnaire is pretested in order to detect possible problems
concerning the understanding and completion of the questions (Aaker et al.,
2011:292).
Recommendations made by the participants who partook in the pre-testing of the
questionnaire should be taken into consideration and changes should be made
before the questionnaire is administered to the sample size of the main study
(McDaniel & Gates, 2007:355). However, Aaker et al. (2011:294) state that the
problems occurred in the pre-testing are not guaranteed that all the problems would
be resolved in the main questionnaire.
Once the questionnaire was designed, a debriefing approach was utilised on the pre-
testing of the questionnaire. Four knowledgeable researchers pre-tested the survey.
The purpose of the pre-test was to gain feedback on the wording of questions and
structure of the questionnaire to ensure that the questionnaire was well understood.
Academic researchers acquired 10 minutes to complete the survey, which remained
sufficient according to McDaniel and Gates (2007:352). The feedback provided by
the academic researchers utilised in pre-testing phase was utilised to improve the
questions in the questionnaire.
Once the questionnaire had been adjusted, as proposed by the academic
researchers, the questionnaire was distributed for pilot testing. A pilot study is
defined as giving out the questionnaire to a small-scale to test what the survey will
entail, including all the activities that will go into the main survey. Furthermore, Smith
and Albaum (2012:72) state that the pilot study helps manage the potential research
errors by testing how the survey fits together. Convenience sampling was utilised to
choose participants for the pilot test. The sample size of 50 undergraduate students
was used in the pilot testing and was not included in the main sample size.
Complications in the pilot test were improved upon. Subsequently, the final
questionnaire (Appendix A) was distributed for the main study.
The next section discusses how the questionnaire was administered for the main
study.
Chapter 3: Research methodology 48
3.7 ADMINISTRATION OF THE QUESTIONNAIRE
The main questionnaire for this study was administered between July and August in
2016, to a sample of 400 undergraduate students. A standardised questionnaire with
the same format on each questionnaire was used, to ensure consistency and
accuracy.
Lecturers at the two HEI‟s were approached, as permission was needed before the
distribution of the questionnaires. The self-administered questionnaires were
distributed to participating staff members at each of the two HEIs (200 per campus)
to be completed by the students. The questionnaires were distributed before the
respective classes and were completed in the class time. The questionnaires were
collected once the participants were done completing them.
The following section discusses the preliminary data analysis of the study.
3.8 PRELIMINARY DATA ANALYSIS
Data preparation involves basic statistical analysis procedures that will have to be
performed once the data has been collected (Gupta, 2003:285). Data preparation
involves editing, coding and tabulating. In this study, all questionnaires that had 10
percent or more missing values were excluded. However, the statistician completed
questionnaires with less than 10 percent missing values, where necessary, by the
mean value of the respective questions at each of the missing values.
Editing prepares the data for coding (Beri, 2013:256). The purpose of editing the
questionnaires used in the study was to eliminate errors and to prepare the data for
tabulation (Brown, 2008:303). Berndt and Petzer (2011:218) state that
questionnaires should be evaluated how they have been completed by means of
scanning through the answers.
Beri (2013:267) defines coding as the process of categorising the answers into
meaningful groups. This implies that codes are given symbols to represent the
coding. Moreover, Burns and Bush (2010:460) highlight numerical codes are given to
simplify the data analysis process.
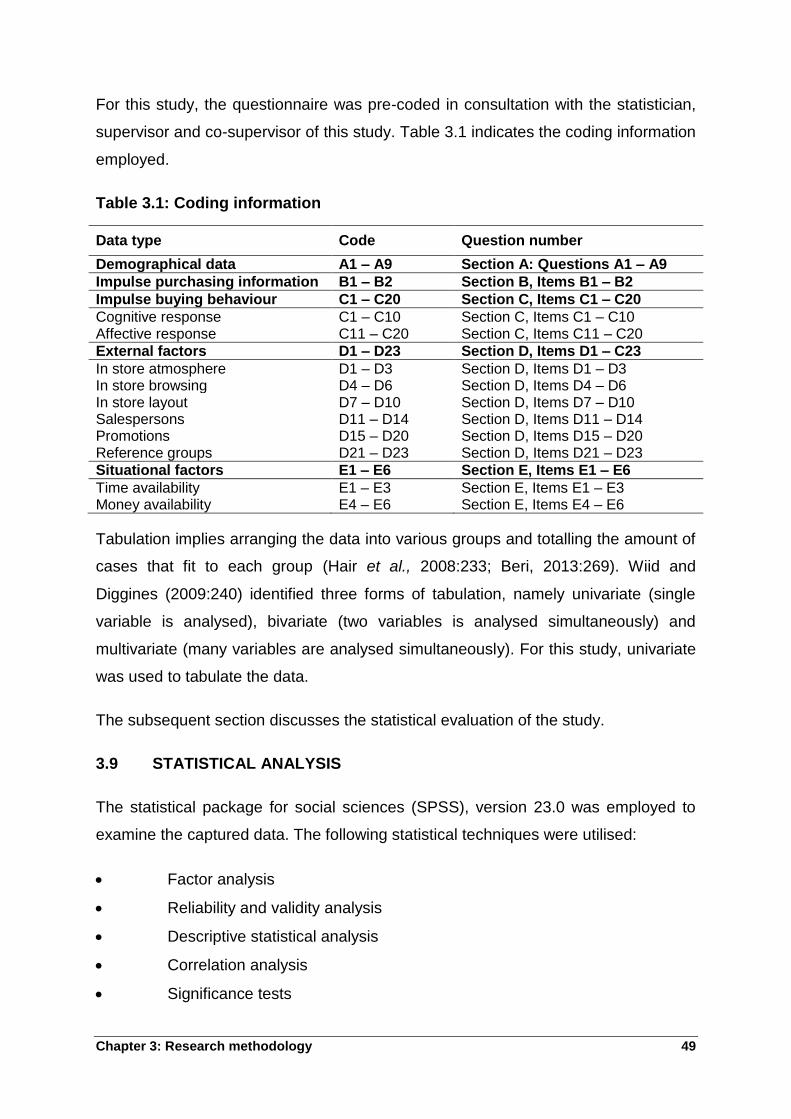
Chapter 3: Research methodology 49
For this study, the questionnaire was pre-coded in consultation with the statistician,
supervisor and co-supervisor of this study. Table 3.1 indicates the coding information
employed.
Table 3.1: Coding information
Data type Code Question number
Demographical data A1 – A9 Section A: Questions A1 – A9
Impulse purchasing information B1 – B2 Section B, Items B1 – B2
Impulse buying behaviour C1 – C20 Section C, Items C1 – C20
Cognitive response C1 – C10 Section C, Items C1 – C10 Affective response C11 – C20 Section C, Items C11 – C20
External factors D1 – D23 Section D, Items D1 – C23
In store atmosphere D1 – D3 Section D, Items D1 – D3 In store browsing D4 – D6 Section D, Items D4 – D6 In store layout D7 – D10 Section D, Items D7 – D10 Salespersons D11 – D14 Section D, Items D11 – D14 Promotions D15 – D20 Section D, Items D15 – D20 Reference groups D21 – D23 Section D, Items D21 – D23
Situational factors E1 – E6 Section E, Items E1 – E6
Time availability E1 – E3 Section E, Items E1 – E3 Money availability E4 – E6 Section E, Items E4 – E6
Tabulation implies arranging the data into various groups and totalling the amount of
cases that fit to each group (Hair et al., 2008:233; Beri, 2013:269). Wiid and
Diggines (2009:240) identified three forms of tabulation, namely univariate (single
variable is analysed), bivariate (two variables is analysed simultaneously) and
multivariate (many variables are analysed simultaneously). For this study, univariate
was used to tabulate the data.
The subsequent section discusses the statistical evaluation of the study.
3.9 STATISTICAL ANALYSIS
The statistical package for social sciences (SPSS), version 23.0 was employed to
examine the captured data. The following statistical techniques were utilised:
Factor analysis
Reliability and validity analysis
Descriptive statistical analysis
Correlation analysis
Significance tests
Chapter 3: Research methodology 50
Regression analysis
Two independent-samples t-test
3.9.1 Factor analysis
Factor analysis is a process used for data reduction and summarisation (Malhotra,
2010:636). Wiid and Diggines (2009:249), state that factor analysis is employed to
simplify the data by reducing the large number of variables (of which some are
interrelated) into factors (that are not interrelated) that still contain the original data.
Furthermore, Wiid and Diggines (2009:249) agree that factor analysis is employed to
structure the data by means of taking a large number of variables that measures the
characteristics of the small sample.
Factor analysis has two main approaches, namely exploratory and confirmatory
(Pallant, 2013:188). Furthermore, Struwig and Stead (2010:142) define exploratory
factor analysis, as an analysis that determines the dependent or independent
variables in the early stages of the study. On the other hand, Pallant (2013:188)
states that confirmatory factor analysis is used on a set of variables to test specific
hypotheses or theories of the study. Malhotra (2010:727) concurs, defining
confirmatory factor analysis as a method used to determine if the variables used in
the scale loaded are as expected in the relevant factor.
Prior to running factor analysis, it is essential to check the sampling adequacy. The
Kaiser-Meyer-Olkin (KMO) tests for sampling adequacy, as well as the Bartlett‟s test
of sphericity were run and executed. A value of 0.6 and greater for the KMO test is
recommended and a significant Bartlett‟s test of sphericity value indicates the
adequacy of the sample data for principle component analysis (Pallant, 2010:183).
For the purpose of this study, confirmatory factor analysis, using the principle
component analysis, using the direct-oblimin rotation, was used to determine
whether the items in the impulse buying behaviour, external and situational factors of
impulse buying scales, load as expected, based on Verplanken and Herabadi
(2001), Cho et al. (2014) and Beatty and Ferrell (1998) study.
A discussion pertaining to reliability analysis follows.
Chapter 3: Research methodology 51
3.9.2 Reliability analysis
Reliability is employed to evaluate whether the measuring instrument produces
consistent outcomes if repeated measurements are made (Malhotra, 2010:318).
Correspondingly, Wiid and Diggines (2009:7), describe reliability as results obtained
when the research is repeated or undertaken by other researchers. According to
Pallant (2013:6), the reliability of a scale indicates how free it is from random error.
Reliability has two types of indicators, namely test-retest reliability and internal
consistency (Pallant, 2013:6). McDaniel and Gates (1999:307) define internal
consistency reliability as the ability to produce similar results using different samples
to measure a phenomenon during the same time period. According to Iacobucci and
Churchill (2010:259) internal consistency can be measured in several ways, the most
commonly used statistic is the Cronbach‟s coefficient alpha. Malhotra (2010:319)
indicated that coefficient varies from zero to one, but a value less than 0.6 indicates
weak internal consistency reliability. For the purpose of this study, internal
consistency reliability was conducted, using the Cronbach alpha.
The following section discusses validity analysis.
3.9.3 Validity analysis
Malhotra (2010:320) defines validity by reflecting the true changes among the
objects on the characteristics being measure while observing the difference of
scores in the observed scale. Similarly, Wiid and Diggines (2009:6) define validity as
research that measures what was intended. Hair et al. (2003:303-304) identified
internal and external validity. Iacobucci and Churchill (2010:107) define the internal
validity as how accurate the research design identifies causal relationships, whereas
on the contrary, external validity is defined as how true the entire target population is
expected to be based on the causal relationship. The validity can be measured by
using face validity, content validity and construct validity (McDaniel & Gates,
1999:309).
Face validity is defined as a measuring instrument for researchers to judge the
degree to what it should measure (McDaniel & Gates 1999:309). Hair et al.
Chapter 3: Research methodology 52
(2008:151) state that a researcher‟s intuitive judgement is used to determine face
validity. Face validity is not a sufficient evaluation of validity.
Content validity and face validity are considered the same according to Aaker et al.
(2011:269). Malhotra (2010:320) defines content validity as a subjective but
systematic evaluation of how well the content of a scale represents the
measurement task. Furthermore, Iacobucci and Churchill (2010:257) state that a
researcher of the study has to determine if the entire domain of the constructs being
measured is covered within the scale.
Construct validity is defined as measuring the hypothesis created from concepts and
theories of the study (McDaniel & Gates, 1999:309). In comparison, Malhotra
(2010:320) defines construct validity as a validity that takes the constructs of the
scale and addresses the question the scale is measuring. Furthermore, Iacobucci &
Churchill (2010:257) state that when assessing the construct validity, deductions are
made by the researcher, deductions are determined by trying to respond to the
theory questions such as why the selected scale succeeds.
Clow and James (2014:271) identified that the construct validity can be broadened
into two categories, specifically convergent and discriminant validity. Convergent
validity is defined as to what extend the constructs being tested (similar or identical)
correlate (Struwig & Stead, 2010:142). Discriminant validity is defined as to how
differently the constructs are measured (McDaniel & Gates, 2007:262).
For the purpose of this study, content validity of the scales used in this study was
determined by asking two experienced researchers to assess the scale. Thereafter,
the questionnaire was piloted on a small sample of participants to assess the internal
consistency of the scaled items, as reported in Chapter 4. The construct validity of
the scales that were utilised was determined by making use of the inter-item
correlations. The inter-item correlations should range from 0.15 to 0.50 (Clark &
Watson, 1995:316).
The following section discusses the descriptive statistical analysis used for this
study.
Chapter 3: Research methodology 53
3.9.4 Descriptive statistical analysis
Descriptive statistics are used on a sample of participants to summarise and
describe the data obtained (Hair et al., 2013:257). Similarly, Zikmund and Babin
(2010:354) define descriptive statistics as transforming the raw data into a way that
describes the basic characteristics.
Clow and James (2014:378) states that basic descriptive statistics are when the
researcher reports the results of every question in the survey, whereby the
demographic profile of the sample is included. Descriptive statistics include the
overall data obtained by the questionnaire. Descriptive statistical techniques utilised
in this study measures of location, measures of variability and measures of shape
(Malhotra, 2010:486).
Measures of location are used to determine the distributions central point or the most
frequent response (Malhotra, 2010:486) and involve the mean, median and mode
(Malhotra, 2015:332). The mean is the average of all the responses. The mean is
determined by adding all the responses and then dividing by the number of
participants (Kolb, 2008:254). The median can be described as data arranged in
ascending or descending rank order and identifying the middle point (Malhotra,
2015:322). Mode can be described as the most common variable for all participants
(Kolb, 2008:254). The measure of location selected was the mean.
Measures of variability are used to determine differences amongst the variables in
the data as well as to what extent the data is distributed (Burns & Bush, 2010:466).
Malhotra (2015:333) identified range, variance and standard deviation as measures
of variability. Range can be described as the distance between the smallest and the
largest values of a frequency distribution (Zikmund & Babin, 2010:330). Variance can
be described as the square root of the standard deviation (Malhotra, 2010:487).
Standard deviation is used to measure the range of results determined by the mean.
In addition, when the range of the results is more at a distance from each other, the
more the results are away from the mean (Welman et al., 2005:233). The measure of
location chosen for this study was standard deviation.
Measures of shape are used to identify the distribution of the data. Skewness and
kurtosis are used to measure the measure of shapes. Skewness refers to how the
Chapter 3: Research methodology 54
distribution is located around the mean. A kurtosis is defined by the frequency
distribution, which determines the peakedness or flatness of the curve, in addition,
the peaked distribution presents an ordinary distribution (positive figure) and a flatter
distribution represents a negative figure (Malhotra, 2010:488-489). The measure of
shapes chosen for this study was skewness and kurtosis.
The following section discusses the correlation analysis for the captured data of the
study.
3.9.5 Correlation analysis
Correlation analysis is defined as the association between changes in one variable
affecting another (McDaniel & Gates, 1999:569). Correlation analysis indicates that
there is association between certain variables, but that does not necessarily mean
that a cause and effect relationship exists, in addition, correlation analysis should be
handled with care and common sense.
According to Hair et al. (2008:286), there are several correlation techniques; the
Pearson product-moment correlation coefficient and Spearman rank order
correlation coefficient are discovered as the most common. A common statistical test
to measure correlation is the Pearson‟s correlation coefficients. The Pearson‟s
product-moment correlation coefficients test examines the change of one variable
compared to that of another. Person correlation coefficient is denoted by making use
of the symbol r (Berndt & Petzer: 2011:239).
Berndt and Petzer (2011:239) state that a correlation with a positive sign refers to
two variables increasing together, whereas, when one variable decreases and the
other increases, this represents a negative correlation. Furthermore, Pallant
(2013:139) concluded that when the correlation is equal or close to zero, there is no
relationship between two variables.
According to Pallant (2013:139), the value size presented in the correlation
coefficient determines the strength of the relationship; correlation coefficients should
vary from +1 to −1 (Clow & James, 2014:309). Hair et al. (2013:312) state that a
value ranging between 0.10 and 0.29 is regarded as a small relationship, a value
ranging between 0.30 and 0.49 is regarded as a medium relationship and value
Chapter 3: Research methodology 55
between 0.50 and 1.0 is regarded as a strong relationship between the variables.
The direction of the relationship may be positive or negative (Malhotra, 2010:563).
For the purpose of this study, Pearson‟s correlation coefficients were computed and
utilised to determine the relationship between the external factors and situational
factors that influence Generation Y students. Based on these findings, the
hypotheses were then formulated for the study.
While correlation analysis determines the possible relationship and strength between
two variables (Hair et al., 2008:291), the strength of the association between the two
variables does not determine whether the variables are dependent or independent
(Brace et al., 2012:256). Therefore, in order to determine the influence of external
factors and situational factors towards impulse buying behaviour (affective and
cognitive response) by means of hypotheses testing, regression analysis is required.
The following section discusses the statistical techniques utilised to test the
hypotheses and empirical objectives of the study.
3.9.6 Significance tests
A significance test identifies whether the variables utilised within the test are either
significant or not (Harper, 1991:307). Significance testing is used for testing a
hypothesis (Daly et al., 1995:325). A result is said to be significant when there is no
sampling errors (Bradley, 2013:325). The test of significance enables researchers to
conclude whether the hypotheses are rejected or accepted for the study (Chisnall,
1992:330). The process for hypothesis testing involves the formulation of
hypotheses, selecting an appropriate test, choosing level of significance, collecting
data, calculating test statistics, determining and comparing probability and then
making a conclusion (Malhotra, 2010:489).
Five hypotheses (Section 1.4) were devised for this study with a significance marker
at a = 0.05 (Malhotra, 2010:492).
The following section discusses the regression analysis utilised for the captured data
of the study.
Chapter 3: Research methodology 56
3.9.6.1 Regression analysis
Regression analysis is defined as a predictive analysis technique in which one or
more variables are used to predict the level of another by use of the straight-line
formula (Burns & Bush, 2014:407). Pallant (2013:154) defines regression analysis as
a straight association amongst a single dependent variable and one or more
independent variable. In addition, Huizingh (2007:298) states that the dependent
variable is what the researcher wants to explain, whereas, the independent variable
explains this phenomenon. Regression analysis is used to investigate the hypothesis
conducted in the study. Regression analysis comprises bivariate, simple and multiple
regression analysis (Malhotra, 2010:568-577).
Bivariate regression analysis is referred to as a statistical technique that analyses
the linear relationship between two variables. This is achieved by estimating
coefficients for an equation for a straight line (Hair et al., 2003:572). Multiple
regression analysis is the adaptation of simple regression analysis. According to
Malhotra (2010:578), the research questions raised in the context of bivariate
regression can also be answered by the multiple regression but additional
independent variables have to be considered. Multiple regression analysis involves
determining the influence of several independent variables on a single dependent
variable, which may be measured simultaneously or on an interval-scale (Malhotra,
2015:372).
For the purpose of this study, bivariate regression analysis was employed to
investigate the hypothesis devised for this study, namely to determine whether there
is a significant influence with the external factors and the cognitive and affective
response, as well as the situational factors and the cognitive and affective response.
The following section discusses the t-tests utilised for the captured data of the study.
3.9.6.2 T-test
A t-test determines whether the means observed between two groups is sufficiently
large to change some variables or was it by chance. T-tests are used to determine
two groups (Welman et al., 2005:237). Chapman and Feit (2015:142) define a t-test
Chapter 3: Research methodology 57
as a mean of one sample against the mean of another. A t-test has three tests that
can be conducted, namely one sample, paired sample and independent sample.
A one-sample t-test is employed to examine if a specified mean differs from the
mean of a sample distribution (Clow & James, 2014:409). Paired sample t-tests are
employed between the similar participants to test the variance between the means
from the same group (Pallant, 2013:252). Independent sample t-test is tests selected
by two distinctive samples with different means (Zikmund & Babin, 2010:378).
A two independent-sample t-test was performed for this study to establish whether
male and female Generation Y students vary in their impulse buying behaviour.
3.10 SYNOPSIS
This chapter discussed the research methodology utilised. The first section
discussed the research design; a descriptive research design was utilised using a
single cross-section. The second section discussed the research approach, the
quantitative research design was utilised. The third section discussed the sampling
strategy, specifically the target population, sampling frame, method of sampling and
sample size of the study. The fourth section discussed the data collection method,
namely the questionnaire design, questionnaire format and questionnaire layout. The
fifth section discussed the pre-testing of the questionnaire and the sixth section
discussed the administration of the questionnaire.
The seventh section discussed the data preparation (namely, editing, coding and
tabulating was utilised). Lastly, the last section discussed the statistical analysis,
whereby the SPSS, Version 23.0 was used. The statistical analysis included
confirmatory factor analysis (the principle component analysis, with the direct-
Oblimin rotation was utilised), reliability (the internal consistency using the Cronbach
alpha was utilised), validity (namely, the face validity, content validity and construct
validity was utilised), descriptive statistics (namely, the mean, standard deviation,
skewness and kurtosis was utilised), correlation analysis and the significance tests
(namely, regression analysis and two independent-sample t-test was utilised).
The results of the empirical part are given in Chapter 4. This includes the tabulation
and explanation of the pilot and the main study‟s findings, additionally the findings
Chapter 3: Research methodology 58
concerning the demographic data, descriptive evaluation and hypotheses testing.
Having Chapter 4 has a basis, conclusions and recommendations are summarised in
Chapter 5.
Chapter 4: Data analysis and intepretation 59
CHAPTER 4
DATA ANALYSIS AND INTEPRETATION
4.1 INTRODUCTION
In the previous chapter, Chapter 3, the research methodology used was explained.
Based on the knowledge gained in Chapter 3, this chapter reviews and discusses
the analysis and interpretation of the empirical findings of the study. The primary
reason of this chapter is to achieve the six empirical objectives indicated in the first
chapter.
This chapter commences with a discussion of the results of the pilot test in Section
4.2, which is followed by a discussion of the preliminary data analysis that entailed
the coding, the data gathering process and the tabulation of the data in Section 4.3.
Section 4.4 presents a description of the sample and a summary of their impulse
buying behaviour. Subsequently, Section 4.5 provides a discussion on the various
inferential statistics applied in this study.
The chapter concludes with a synopsis highlighting the findings of the study. The
data evaluation was conducted utilising the SPSS, version 23.0 for Microsoft
Windows. The next section reports on the results of the pilot study.
4.2 PILOT TEST RESULTS
Following the pre-testing of the questionnaire, as outlined in Section 3.6, the
questionnaire was piloted on a judgment sample of 50 full-time undergraduate
students registered at a South African public HEI campus that did not form part of
the sampling frame in the main study. The pilot study was undertaken to determine
the internal-consistency reliability of the three scales employed within the
questionnaire before carrying out the main survey. Table 4.1 presents the results
pertaining to the reliability of the scales during the pilot test.
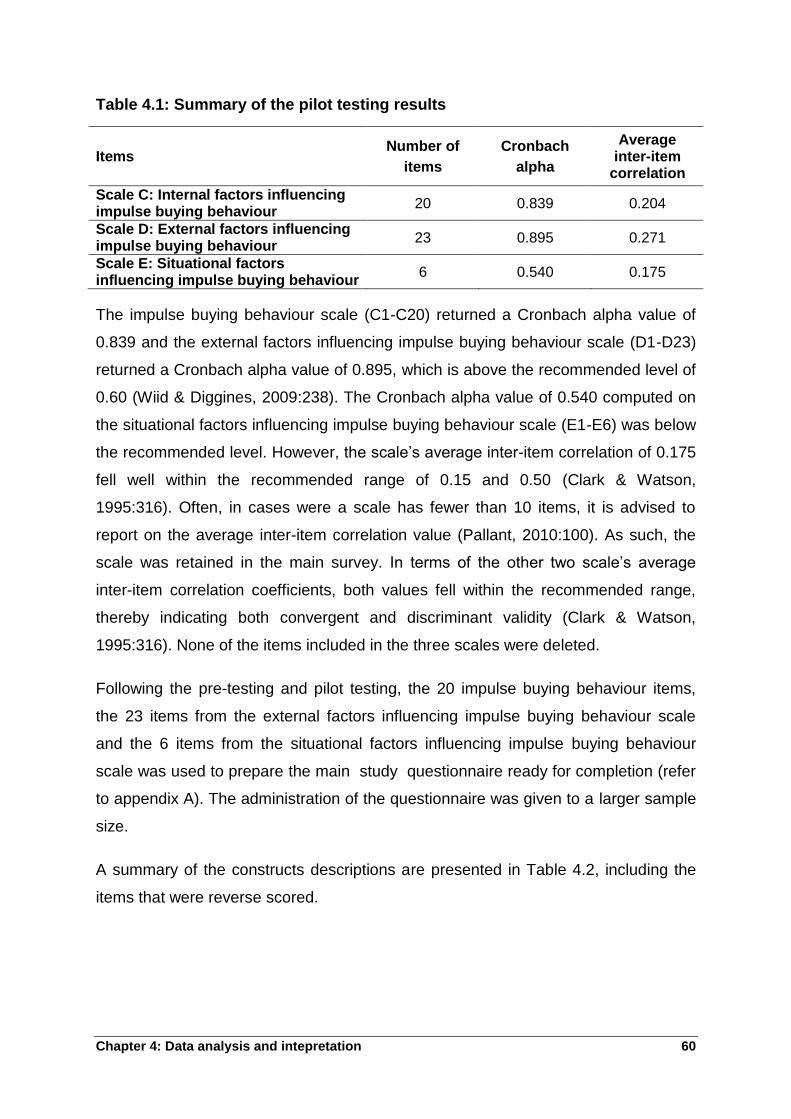
Chapter 4: Data analysis and intepretation 60
Table 4.1: Summary of the pilot testing results
Items Number of
items
Cronbach
alpha
Average inter-item
correlation
Scale C: Internal factors influencing impulse buying behaviour
20 0.839 0.204
Scale D: External factors influencing impulse buying behaviour
23 0.895 0.271
Scale E: Situational factors influencing impulse buying behaviour
6 0.540 0.175
The impulse buying behaviour scale (C1-C20) returned a Cronbach alpha value of
0.839 and the external factors influencing impulse buying behaviour scale (D1-D23)
returned a Cronbach alpha value of 0.895, which is above the recommended level of
0.60 (Wiid & Diggines, 2009:238). The Cronbach alpha value of 0.540 computed on
the situational factors influencing impulse buying behaviour scale (E1-E6) was below
the recommended level. However, the scale‟s average inter-item correlation of 0.175
fell well within the recommended range of 0.15 and 0.50 (Clark & Watson,
1995:316). Often, in cases were a scale has fewer than 10 items, it is advised to
report on the average inter-item correlation value (Pallant, 2010:100). As such, the
scale was retained in the main survey. In terms of the other two scale‟s average
inter-item correlation coefficients, both values fell within the recommended range,
thereby indicating both convergent and discriminant validity (Clark & Watson,
1995:316). None of the items included in the three scales were deleted.
Following the pre-testing and pilot testing, the 20 impulse buying behaviour items,
the 23 items from the external factors influencing impulse buying behaviour scale
and the 6 items from the situational factors influencing impulse buying behaviour
scale was used to prepare the main study questionnaire ready for completion (refer
to appendix A). The administration of the questionnaire was given to a larger sample
size.
A summary of the constructs descriptions are presented in Table 4.2, including the
items that were reverse scored.
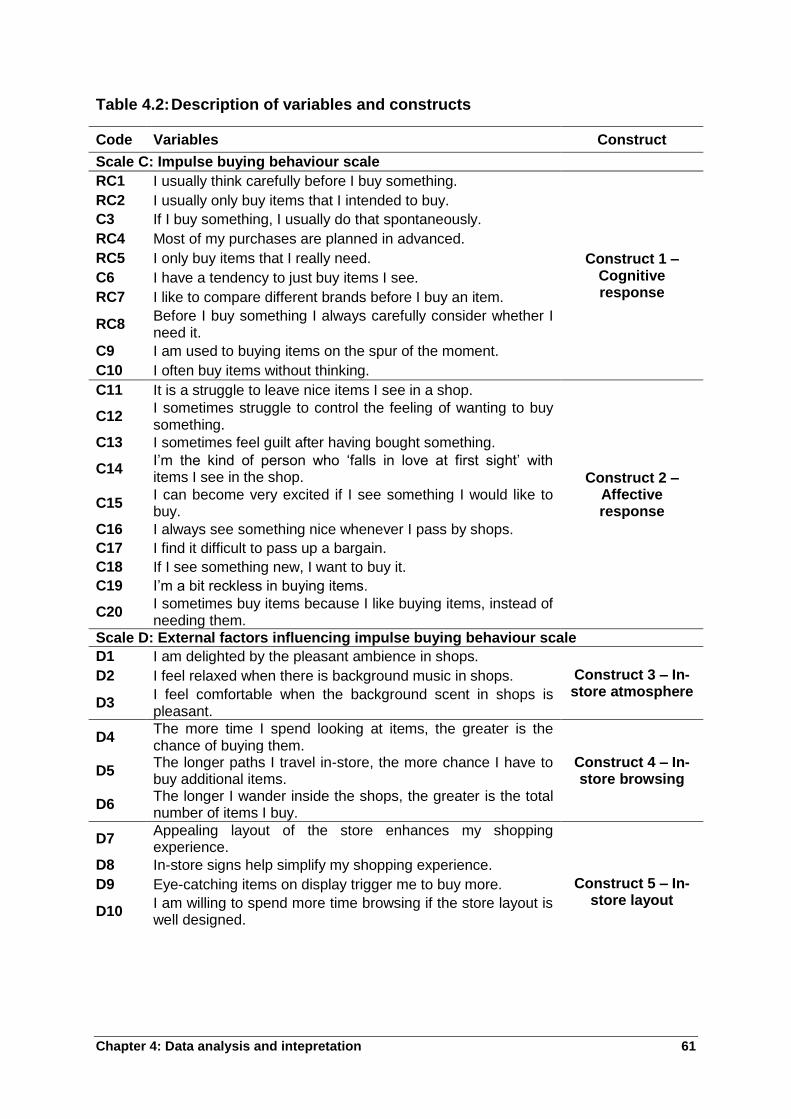
Chapter 4: Data analysis and intepretation 61
Table 4.2: Description of variables and constructs
Code Variables Construct
Scale C: Impulse buying behaviour scale
RC1 I usually think carefully before I buy something.
Construct 1 – Cognitive response
RC2 I usually only buy items that I intended to buy.
C3 If I buy something, I usually do that spontaneously.
RC4 Most of my purchases are planned in advanced.
RC5 I only buy items that I really need.
C6 I have a tendency to just buy items I see.
RC7 I like to compare different brands before I buy an item.
RC8 Before I buy something I always carefully consider whether I need it.
C9 I am used to buying items on the spur of the moment.
C10 I often buy items without thinking.
C11 It is a struggle to leave nice items I see in a shop.
C12 I sometimes struggle to control the feeling of wanting to buy something.
C13 I sometimes feel guilt after having bought something.
C14 I‟m the kind of person who „falls in love at first sight‟ with items I see in the shop. Construct 2 –
Affective response
C15 I can become very excited if I see something I would like to buy.
C16 I always see something nice whenever I pass by shops.
C17 I find it difficult to pass up a bargain.
C18 If I see something new, I want to buy it.
C19 I‟m a bit reckless in buying items.
C20 I sometimes buy items because I like buying items, instead of needing them.
Scale D: External factors influencing impulse buying behaviour scale
D1 I am delighted by the pleasant ambience in shops.
Construct 3 – In-store atmosphere
D2 I feel relaxed when there is background music in shops.
D3 I feel comfortable when the background scent in shops is pleasant.
D4 The more time I spend looking at items, the greater is the chance of buying them.
Construct 4 – In-store browsing
D5 The longer paths I travel in-store, the more chance I have to buy additional items.
D6 The longer I wander inside the shops, the greater is the total number of items I buy.
D7 Appealing layout of the store enhances my shopping experience.
D8 In-store signs help simplify my shopping experience.
Construct 5 – In-store layout
D9 Eye-catching items on display trigger me to buy more.
D10 I am willing to spend more time browsing if the store layout is well designed.
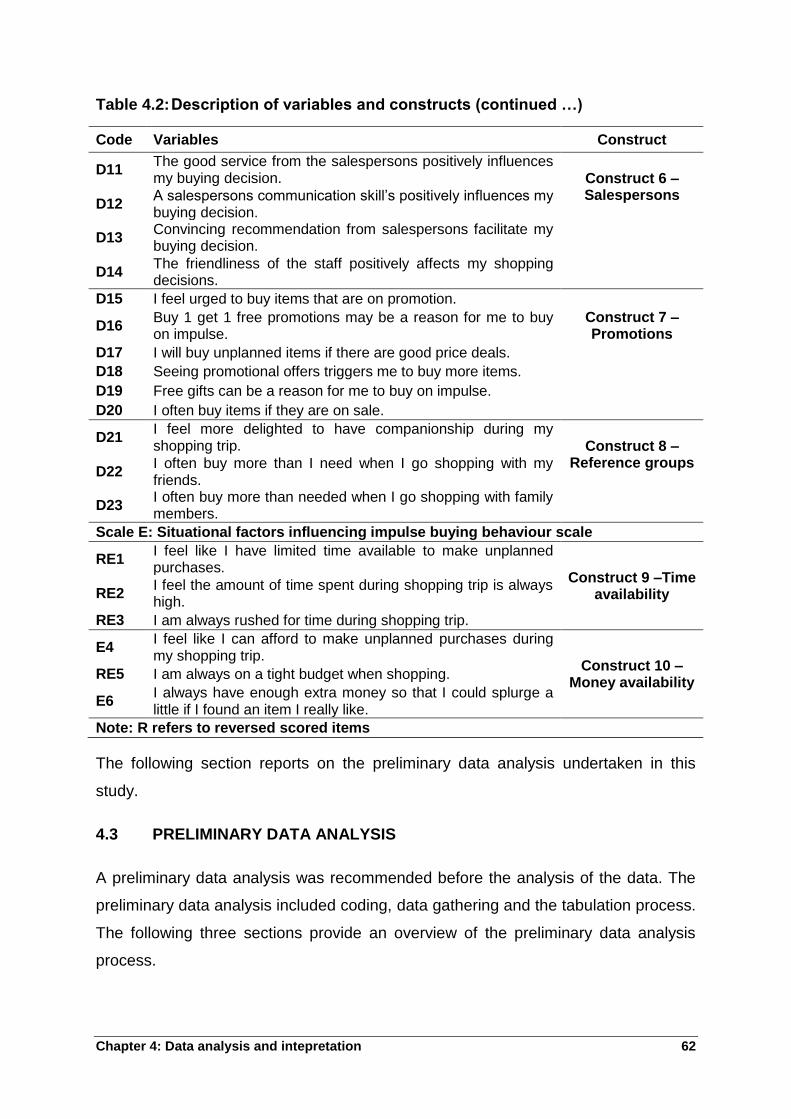
Chapter 4: Data analysis and intepretation 62
Table 4.2: Description of variables and constructs (continued …)
Code Variables Construct
D11 The good service from the salespersons positively influences my buying decision. Construct 6 –
Salespersons D12
A salespersons communication skill‟s positively influences my buying decision.
D13 Convincing recommendation from salespersons facilitate my buying decision.
D14
The friendliness of the staff positively affects my shopping decisions.
D15 I feel urged to buy items that are on promotion.
Construct 7 – Promotions
D16 Buy 1 get 1 free promotions may be a reason for me to buy on impulse.
D17 I will buy unplanned items if there are good price deals.
D18 Seeing promotional offers triggers me to buy more items.
D19 Free gifts can be a reason for me to buy on impulse.
D20 I often buy items if they are on sale.
D21 I feel more delighted to have companionship during my shopping trip. Construct 8 –
Reference groups D22
I often buy more than I need when I go shopping with my friends.
D23 I often buy more than needed when I go shopping with family members.
Scale E: Situational factors influencing impulse buying behaviour scale
RE1 I feel like I have limited time available to make unplanned purchases.
Construct 9 –Time availability RE2
I feel the amount of time spent during shopping trip is always high.
RE3 I am always rushed for time during shopping trip.
E4 I feel like I can afford to make unplanned purchases during my shopping trip.
Construct 10 – Money availability
RE5 I am always on a tight budget when shopping.
E6 I always have enough extra money so that I could splurge a little if I found an item I really like.
Note: R refers to reversed scored items
The following section reports on the preliminary data analysis undertaken in this
study.
4.3 PRELIMINARY DATA ANALYSIS
A preliminary data analysis was recommended before the analysis of the data. The
preliminary data analysis included coding, data gathering and the tabulation process.
The following three sections provide an overview of the preliminary data analysis
process.
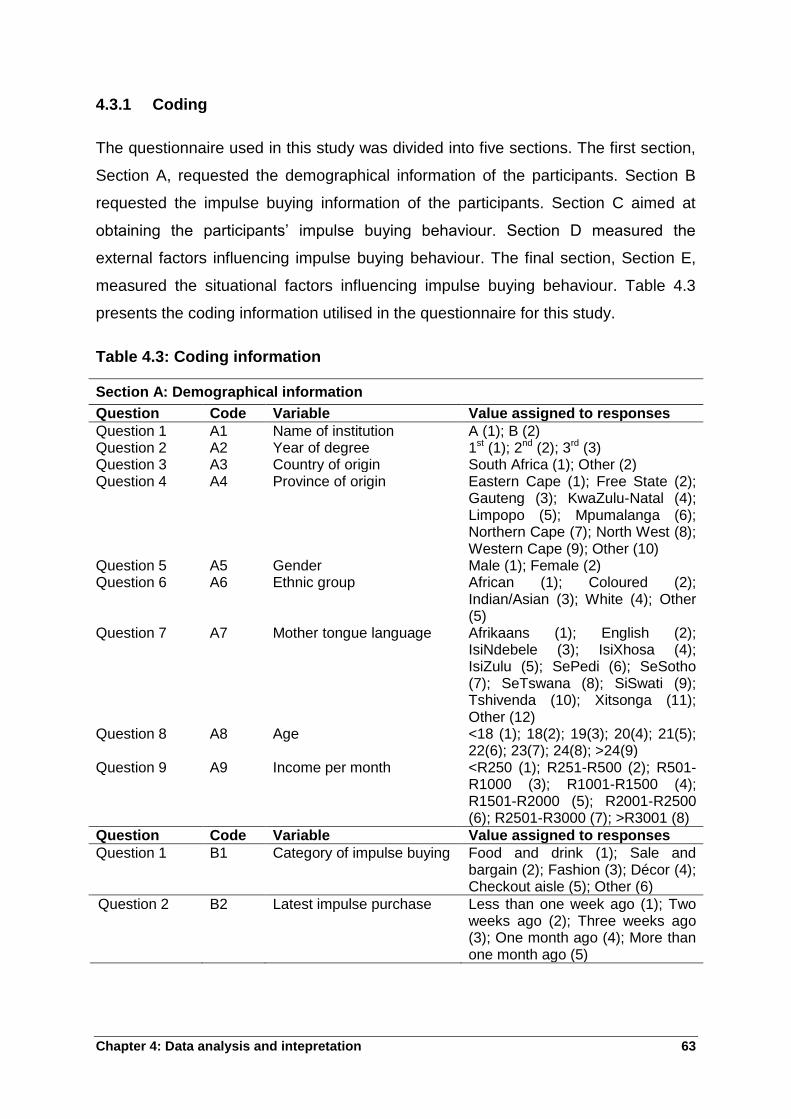
Chapter 4: Data analysis and intepretation 63
4.3.1 Coding
The questionnaire used in this study was divided into five sections. The first section,
Section A, requested the demographical information of the participants. Section B
requested the impulse buying information of the participants. Section C aimed at
obtaining the participants‟ impulse buying behaviour. Section D measured the
external factors influencing impulse buying behaviour. The final section, Section E,
measured the situational factors influencing impulse buying behaviour. Table 4.3
presents the coding information utilised in the questionnaire for this study.
Table 4.3: Coding information
Section A: Demographical information
Question Code Variable Value assigned to responses
Question 1 A1 Name of institution A (1); B (2) Question 2 A2 Year of degree 1st (1); 2nd (2); 3rd (3) Question 3 A3 Country of origin South Africa (1); Other (2) Question 4 A4 Province of origin Eastern Cape (1); Free State (2);
Gauteng (3); KwaZulu-Natal (4); Limpopo (5); Mpumalanga (6); Northern Cape (7); North West (8); Western Cape (9); Other (10)
Question 5 A5 Gender Male (1); Female (2) Question 6 A6 Ethnic group African (1); Coloured (2);
Indian/Asian (3); White (4); Other (5)
Question 7 A7 Mother tongue language Afrikaans (1); English (2); IsiNdebele (3); IsiXhosa (4); IsiZulu (5); SePedi (6); SeSotho (7); SeTswana (8); SiSwati (9); Tshivenda (10); Xitsonga (11); Other (12)
Question 8 A8 Age <18 (1); 18(2); 19(3); 20(4); 21(5); 22(6); 23(7); 24(8); >24(9)
Question 9 A9 Income per month <R250 (1); R251-R500 (2); R501-R1000 (3); R1001-R1500 (4); R1501-R2000 (5); R2001-R2500 (6); R2501-R3000 (7); >R3001 (8)
Question Code Variable Value assigned to responses
Question 1 B1 Category of impulse buying Food and drink (1); Sale and bargain (2); Fashion (3); Décor (4); Checkout aisle (5); Other (6)
Question 2 B2 Latest impulse purchase Less than one week ago (1); Two weeks ago (2); Three weeks ago (3); One month ago (4); More than one month ago (5)
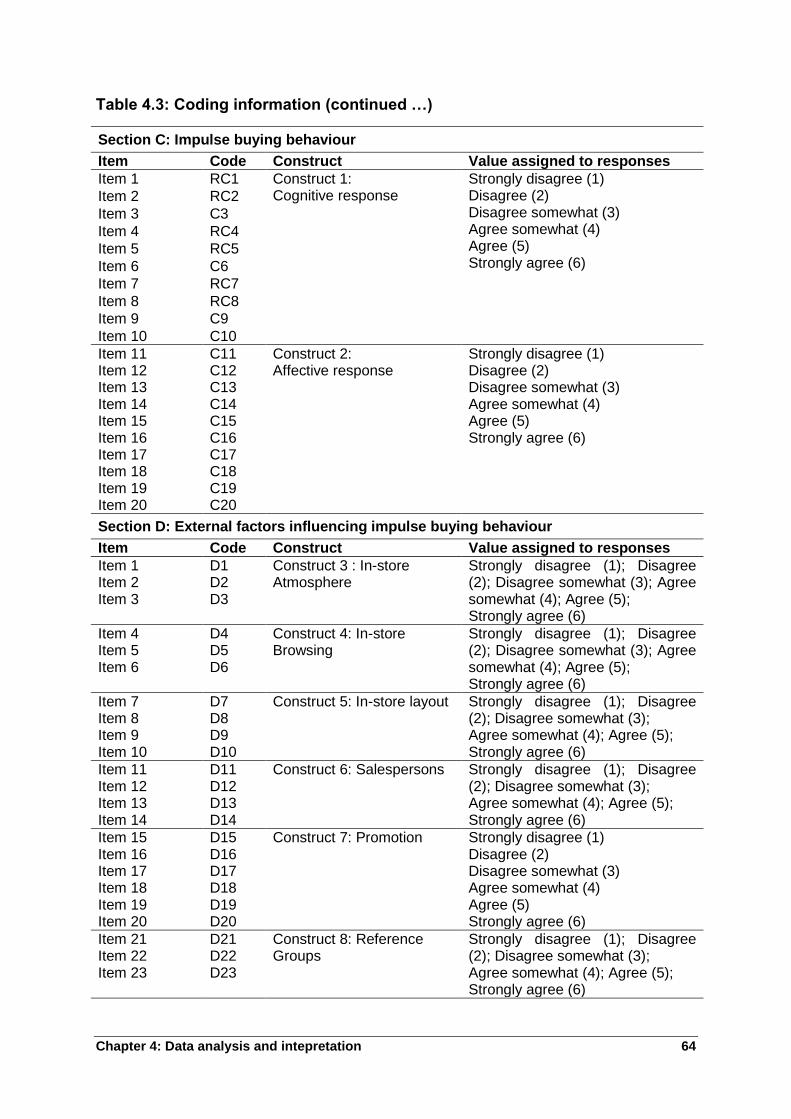
Chapter 4: Data analysis and intepretation 64
Table 4.3: Coding information (continued …)
Section C: Impulse buying behaviour
Item Code Construct Value assigned to responses
Item 1 RC1 Construct 1: Cognitive response
Strongly disagree (1) Disagree (2) Disagree somewhat (3) Agree somewhat (4) Agree (5) Strongly agree (6)
Item 2 RC2
Item 3 C3
Item 4 RC4
Item 5 RC5
Item 6 C6
Item 7 RC7
Item 8 RC8
Item 9 C9
Item 10 C10
Item 11 C11 Construct 2: Affective response
Strongly disagree (1) Disagree (2) Disagree somewhat (3) Agree somewhat (4) Agree (5) Strongly agree (6)
Item 12 C12 Item 13 C13 Item 14 C14 Item 15 C15 Item 16 C16 Item 17 C17 Item 18 C18 Item 19 C19 Item 20 C20
Section D: External factors influencing impulse buying behaviour
Item Code Construct Value assigned to responses
Item 1 D1 Construct 3 : In-store Atmosphere
Strongly disagree (1); Disagree (2); Disagree somewhat (3); Agree somewhat (4); Agree (5); Strongly agree (6)
Item 2 D2 Item 3 D3
Item 4 D4 Construct 4: In-store Browsing
Strongly disagree (1); Disagree (2); Disagree somewhat (3); Agree somewhat (4); Agree (5); Strongly agree (6)
Item 5 D5 Item 6 D6
Item 7 D7 Construct 5: In-store layout Strongly disagree (1); Disagree (2); Disagree somewhat (3); Agree somewhat (4); Agree (5); Strongly agree (6)
Item 8 D8 Item 9 D9 Item 10 D10
Item 11 D11 Construct 6: Salespersons Strongly disagree (1); Disagree (2); Disagree somewhat (3); Agree somewhat (4); Agree (5); Strongly agree (6)
Item 12 D12 Item 13 D13 Item 14 D14
Item 15 D15 Construct 7: Promotion Strongly disagree (1) Disagree (2) Disagree somewhat (3) Agree somewhat (4) Agree (5) Strongly agree (6)
Item 16 D16 Item 17 D17 Item 18 D18 Item 19 D19 Item 20 D20
Item 21 D21 Construct 8: Reference Groups
Strongly disagree (1); Disagree (2); Disagree somewhat (3); Agree somewhat (4); Agree (5); Strongly agree (6)
Item 22 D22 Item 23 D23
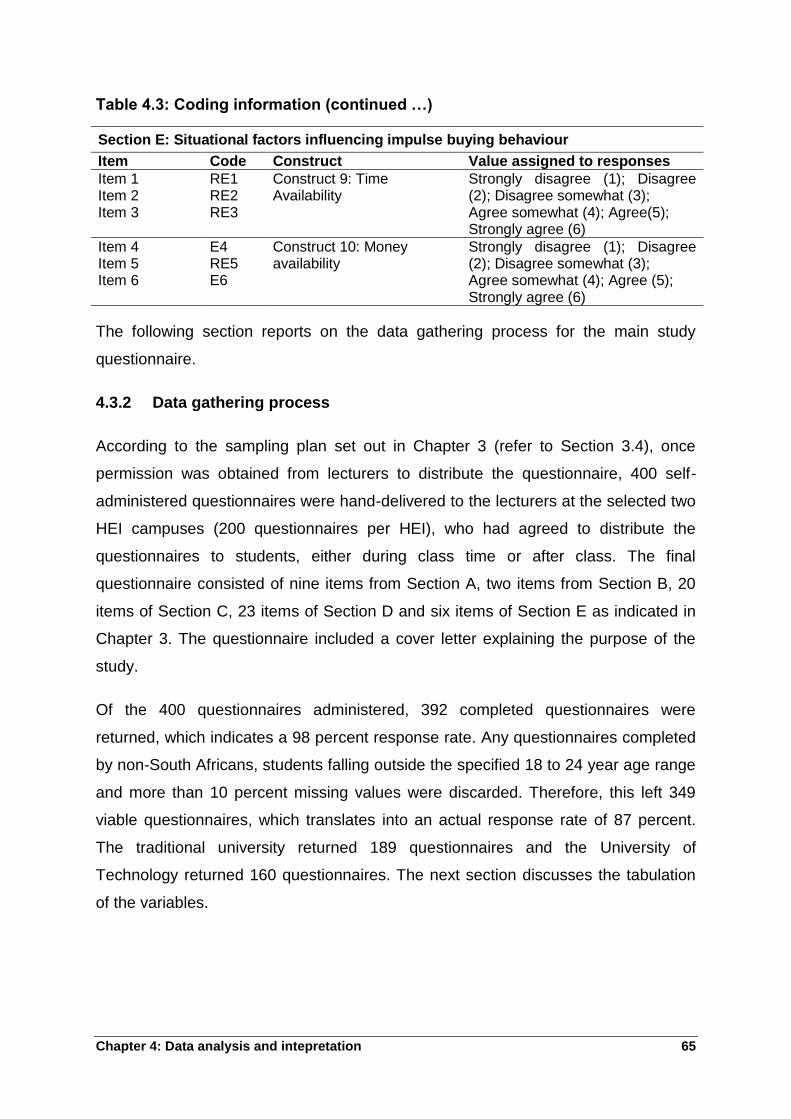
Chapter 4: Data analysis and intepretation 65
Table 4.3: Coding information (continued …)
Section E: Situational factors influencing impulse buying behaviour
Item Code Construct Value assigned to responses
Item 1 RE1 Construct 9: Time Availability
Strongly disagree (1); Disagree (2); Disagree somewhat (3); Agree somewhat (4); Agree(5); Strongly agree (6)
Item 2 RE2 Item 3 RE3
Item 4 E4 Construct 10: Money availability
Strongly disagree (1); Disagree (2); Disagree somewhat (3); Agree somewhat (4); Agree (5); Strongly agree (6)
Item 5 RE5 Item 6 E6
The following section reports on the data gathering process for the main study
questionnaire.
4.3.2 Data gathering process
According to the sampling plan set out in Chapter 3 (refer to Section 3.4), once
permission was obtained from lecturers to distribute the questionnaire, 400 self-
administered questionnaires were hand-delivered to the lecturers at the selected two
HEI campuses (200 questionnaires per HEI), who had agreed to distribute the
questionnaires to students, either during class time or after class. The final
questionnaire consisted of nine items from Section A, two items from Section B, 20
items of Section C, 23 items of Section D and six items of Section E as indicated in
Chapter 3. The questionnaire included a cover letter explaining the purpose of the
study.
Of the 400 questionnaires administered, 392 completed questionnaires were
returned, which indicates a 98 percent response rate. Any questionnaires completed
by non-South Africans, students falling outside the specified 18 to 24 year age range
and more than 10 percent missing values were discarded. Therefore, this left 349
viable questionnaires, which translates into an actual response rate of 87 percent.
The traditional university returned 189 questionnaires and the University of
Technology returned 160 questionnaires. The next section discusses the tabulation
of the variables.
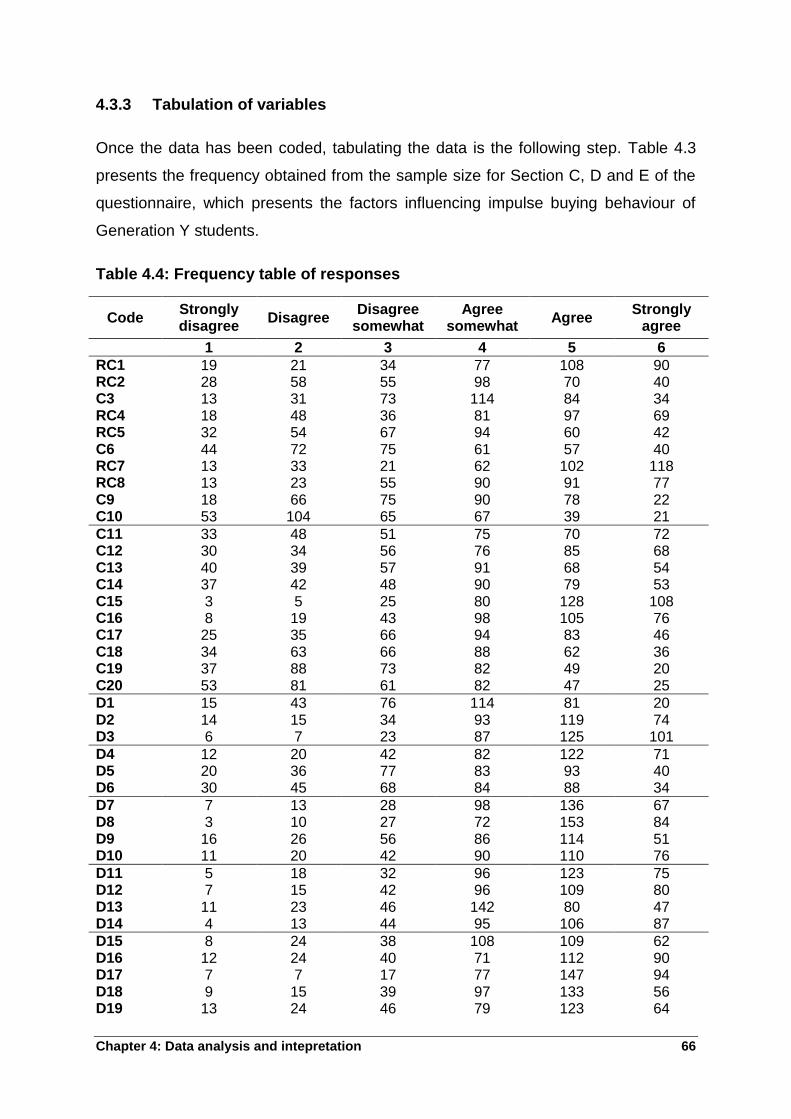
Chapter 4: Data analysis and intepretation 66
4.3.3 Tabulation of variables
Once the data has been coded, tabulating the data is the following step. Table 4.3
presents the frequency obtained from the sample size for Section C, D and E of the
questionnaire, which presents the factors influencing impulse buying behaviour of
Generation Y students.
Table 4.4: Frequency table of responses
Code Strongly disagree
Disagree Disagree
somewhat Agree
somewhat Agree
Strongly agree
1 2 3 4 5 6
RC1 19 21 34 77 108 90 RC2 28 58 55 98 70 40 C3 13 31 73 114 84 34 RC4 18 48 36 81 97 69 RC5 32 54 67 94 60 42 C6 44 72 75 61 57 40 RC7 13 33 21 62 102 118 RC8 13 23 55 90 91 77 C9 18 66 75 90 78 22 C10 53 104 65 67 39 21
C11 33 48 51 75 70 72 C12 30 34 56 76 85 68 C13 40 39 57 91 68 54 C14 37 42 48 90 79 53 C15 3 5 25 80 128 108 C16 8 19 43 98 105 76 C17 25 35 66 94 83 46 C18 34 63 66 88 62 36 C19 37 88 73 82 49 20 C20 53 81 61 82 47 25
D1 15 43 76 114 81 20 D2 14 15 34 93 119 74 D3 6 7 23 87 125 101
D4 12 20 42 82 122 71 D5 20 36 77 83 93 40 D6 30 45 68 84 88 34
D7 7 13 28 98 136 67 D8 3 10 27 72 153 84 D9 16 26 56 86 114 51 D10 11 20 42 90 110 76
D11 5 18 32 96 123 75 D12 7 15 42 96 109 80 D13 11 23 46 142 80 47 D14 4 13 44 95 106 87
D15 8 24 38 108 109 62 D16 12 24 40 71 112 90 D17 7 7 17 77 147 94 D18 9 15 39 97 133 56 D19 13 24 46 79 123 64
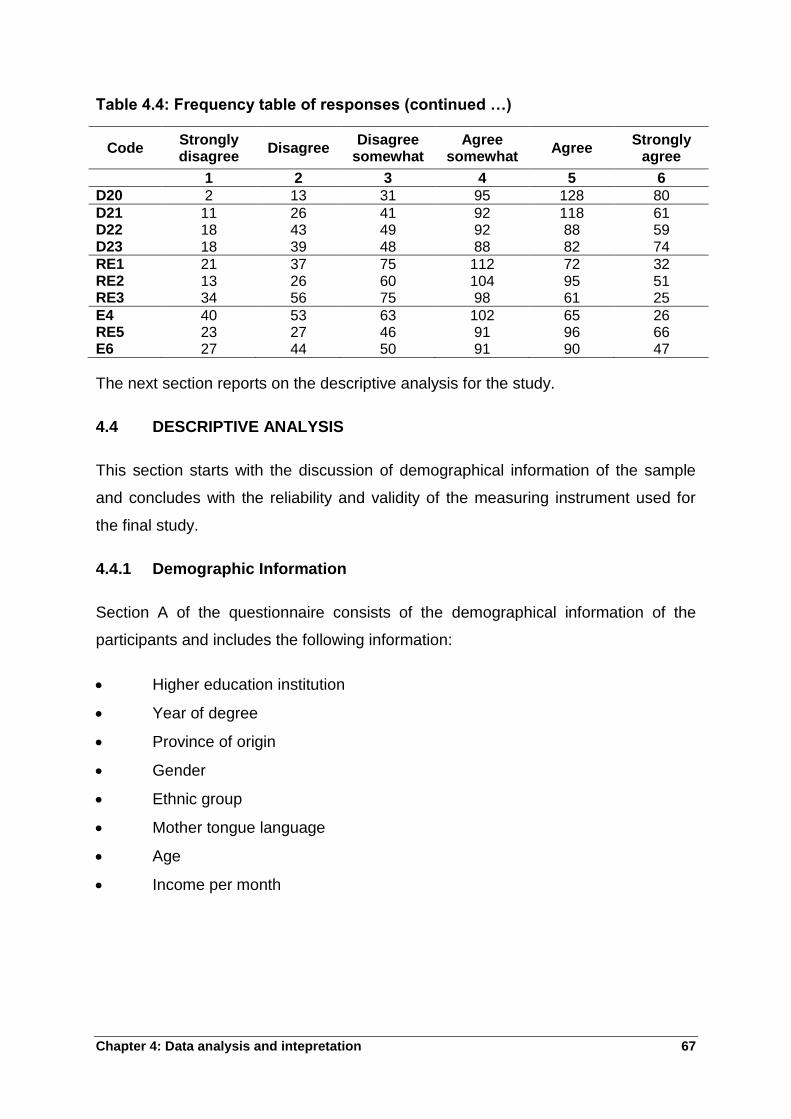
Chapter 4: Data analysis and intepretation 67
Table 4.4: Frequency table of responses (continued …)
Code Strongly disagree
Disagree Disagree
somewhat Agree
somewhat Agree
Strongly agree
1 2 3 4 5 6
D20 2 13 31 95 128 80
D21 11 26 41 92 118 61 D22 18 43 49 92 88 59 D23 18 39 48 88 82 74
RE1 21 37 75 112 72 32 RE2 13 26 60 104 95 51 RE3 34 56 75 98 61 25
E4 40 53 63 102 65 26 RE5 23 27 46 91 96 66 E6 27 44 50 91 90 47
The next section reports on the descriptive analysis for the study.
4.4 DESCRIPTIVE ANALYSIS
This section starts with the discussion of demographical information of the sample
and concludes with the reliability and validity of the measuring instrument used for
the final study.
4.4.1 Demographic Information
Section A of the questionnaire consists of the demographical information of the
participants and includes the following information:
Higher education institution
Year of degree
Province of origin
Gender
Ethnic group
Mother tongue language
Age
Income per month
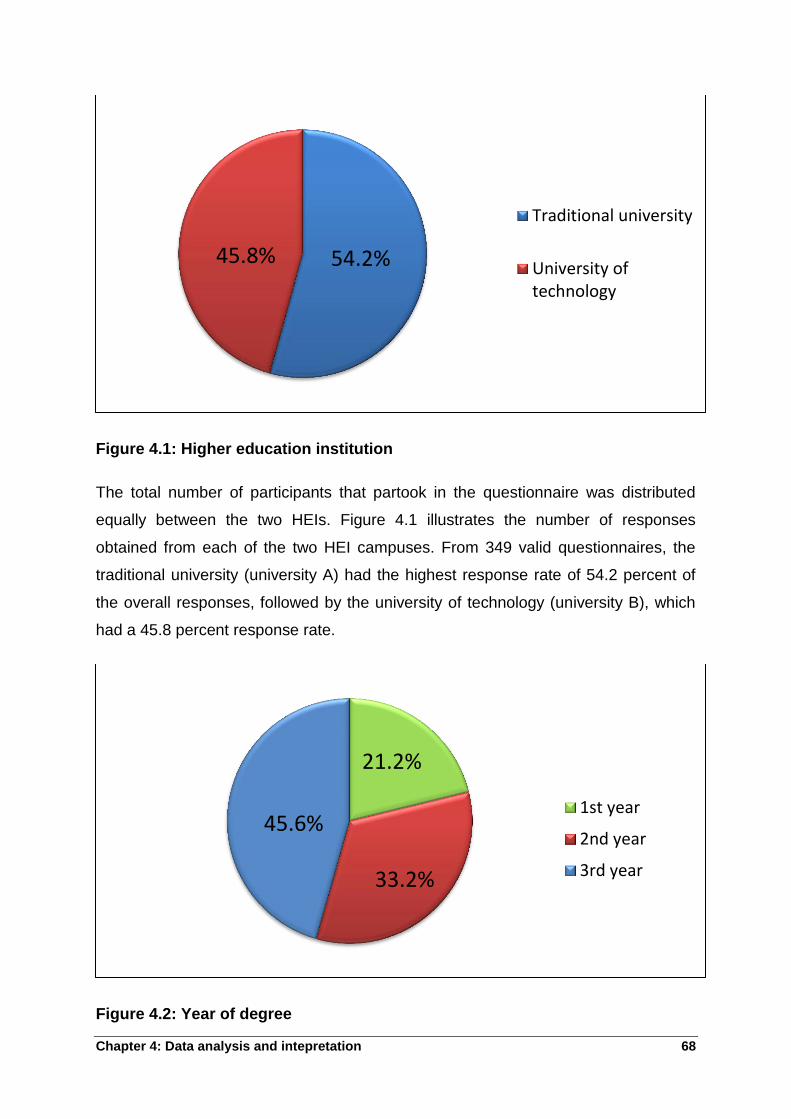
Chapter 4: Data analysis and intepretation 68
Figure 4.1: Higher education institution
The total number of participants that partook in the questionnaire was distributed
equally between the two HEIs. Figure 4.1 illustrates the number of responses
obtained from each of the two HEI campuses. From 349 valid questionnaires, the
traditional university (university A) had the highest response rate of 54.2 percent of
the overall responses, followed by the university of technology (university B), which
had a 45.8 percent response rate.
Figure 4.2: Year of degree
54.2% 45.8%
Traditional university
University oftechnology
21.2%
33.2%
45.6% 1st year
2nd year
3rd year

Chapter 4: Data analysis and intepretation 69
Table 4.5 presents the participants‟ year of study. The largest portion of the sample
was third-year students (45.6%). The second largest portion of the sample was
second-year students (33.2%). The third largest portion of the sample was first-year
students, at 21.2 percent.
Figure 4.3: Province of origin
Figure 4.3 represents the participants‟ province of origin. It is evident from the figure
that the majority of the participants originate from the Gauteng province,
representing 56.7 percent of the sample. The Free State province represented 14.3
percent, Limpopo represented 11.5 percent, North West represented 7.4 percent and
Mpumalanga represented 3.7 percent. KwaZulu-Natal represented 2.9 percent, the
Eastern Cape represented 2.3 and the Northern Cape and Western Cape both
represented 0.3 percent. Two participants failed to answer this question, therefore,
they were represented as the 0.60 percent missing category.
2.3%
14.3%
56.7%
2.9%
11.5%
3.7%
0.3%
7.4%
0.3%
0.6%
Eastern Cape
Free State
Gauteng
KwaZulu-Natal
Limpopo
Mpumalanga
Northern Cape
North West
Western Cape
missing
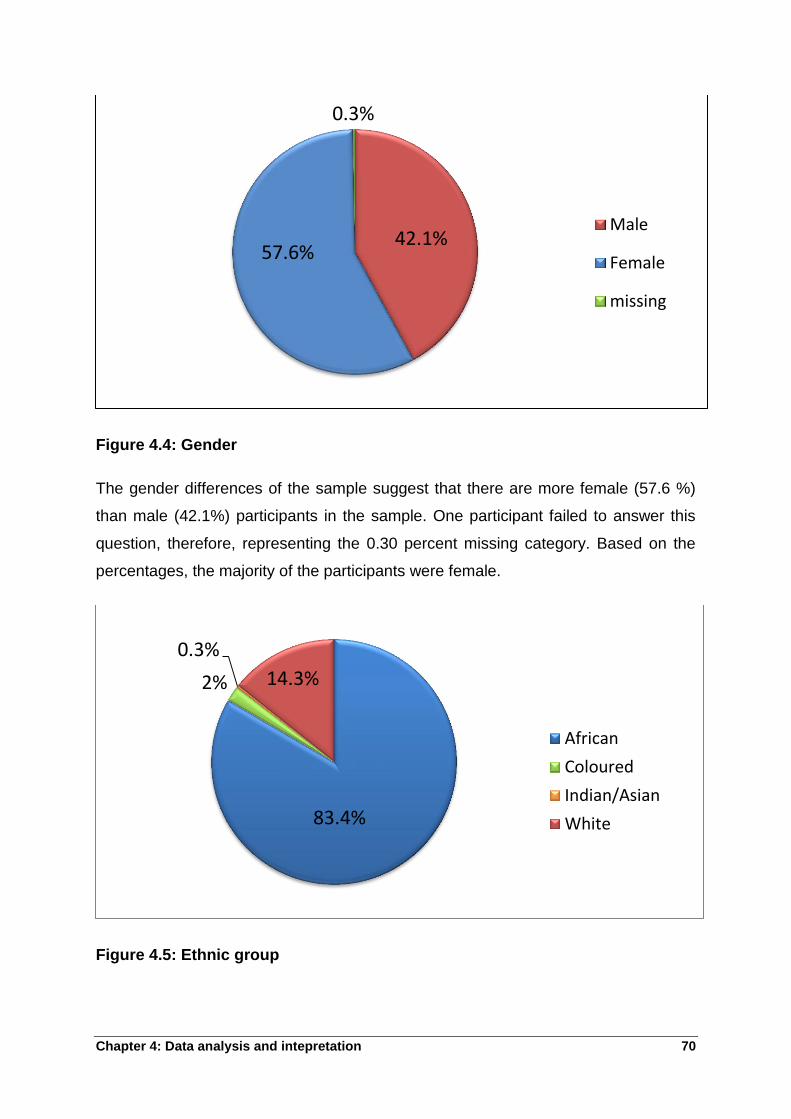
Chapter 4: Data analysis and intepretation 70
Figure 4.4: Gender
The gender differences of the sample suggest that there are more female (57.6 %)
than male (42.1%) participants in the sample. One participant failed to answer this
question, therefore, representing the 0.30 percent missing category. Based on the
percentages, the majority of the participants were female.
Figure 4.5: Ethnic group
42.1% 57.6%
0.3%
Male
Female
missing
83.4%
2%
0.3%
14.3%
African
Coloured
Indian/Asian
White
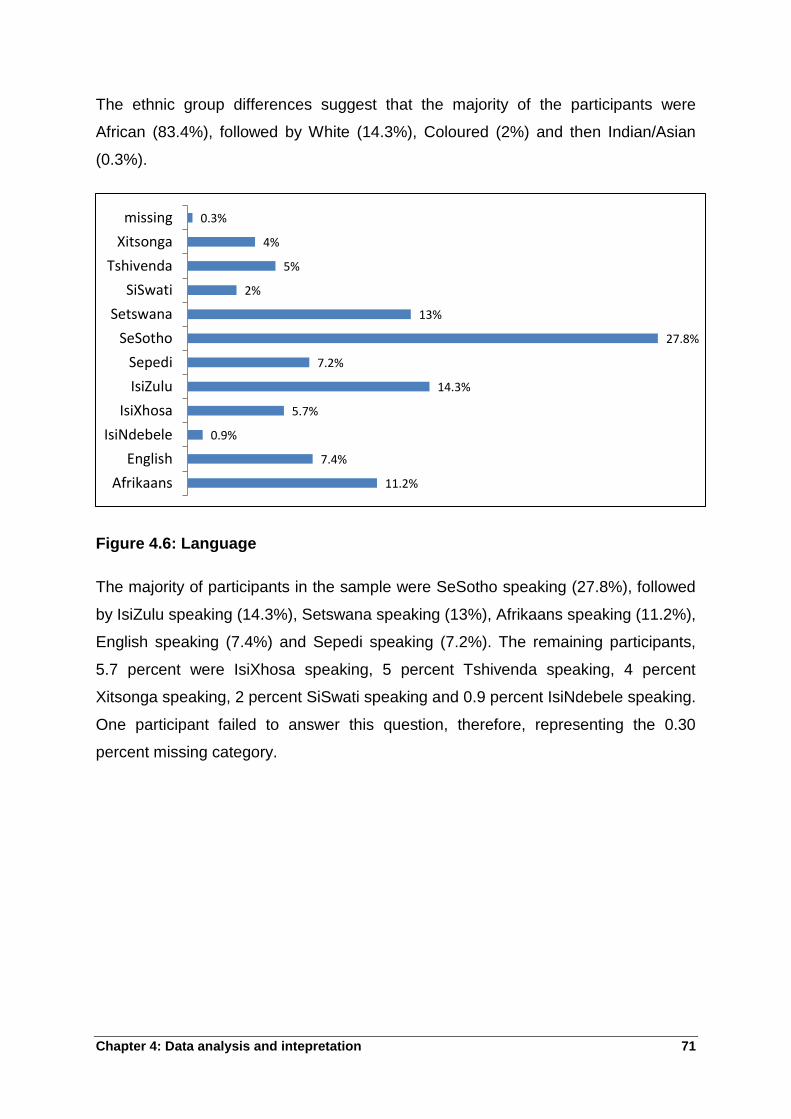
Chapter 4: Data analysis and intepretation 71
The ethnic group differences suggest that the majority of the participants were
African (83.4%), followed by White (14.3%), Coloured (2%) and then Indian/Asian
(0.3%).
Figure 4.6: Language
The majority of participants in the sample were SeSotho speaking (27.8%), followed
by IsiZulu speaking (14.3%), Setswana speaking (13%), Afrikaans speaking (11.2%),
English speaking (7.4%) and Sepedi speaking (7.2%). The remaining participants,
5.7 percent were IsiXhosa speaking, 5 percent Tshivenda speaking, 4 percent
Xitsonga speaking, 2 percent SiSwati speaking and 0.9 percent IsiNdebele speaking.
One participant failed to answer this question, therefore, representing the 0.30
percent missing category.
11.2%
7.4%
0.9%
5.7%
14.3%
7.2%
27.8%
13%
2%
5%
4%
0.3%
Afrikaans
English
IsiNdebele
IsiXhosa
IsiZulu
Sepedi
SeSotho
Setswana
SiSwati
Tshivenda
Xitsonga
missing
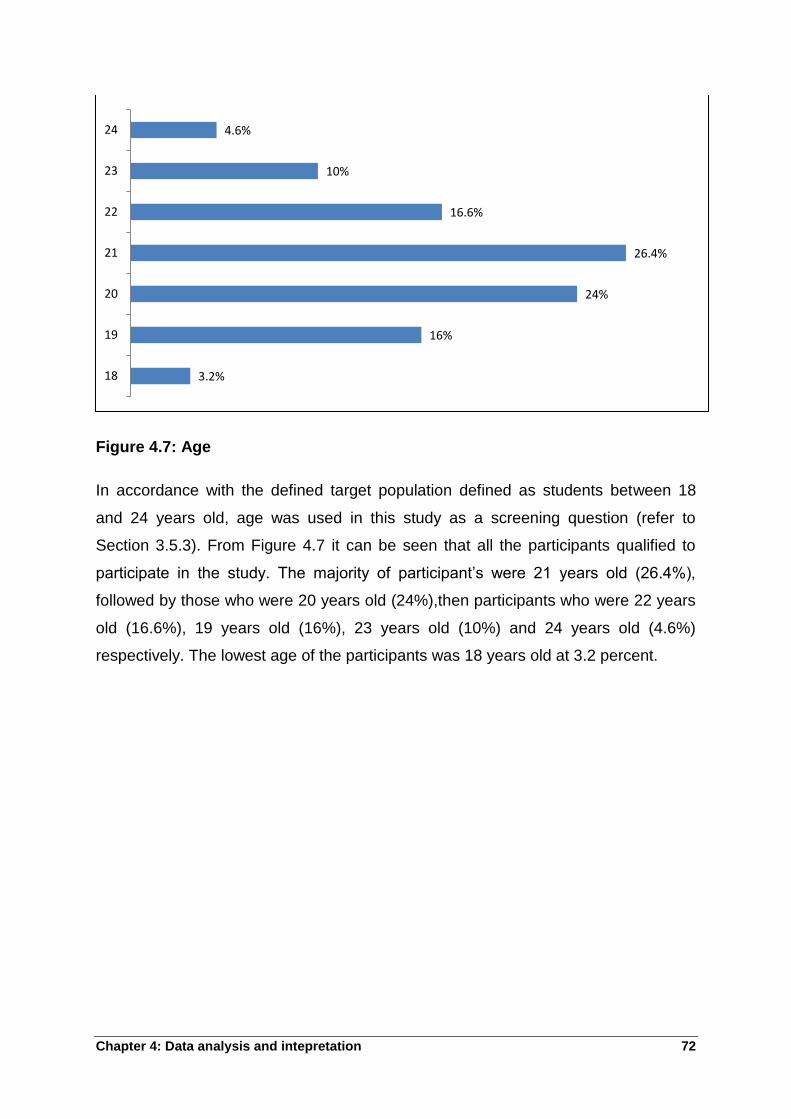
Chapter 4: Data analysis and intepretation 72
Figure 4.7: Age
In accordance with the defined target population defined as students between 18
and 24 years old, age was used in this study as a screening question (refer to
Section 3.5.3). From Figure 4.7 it can be seen that all the participants qualified to
participate in the study. The majority of participant‟s were 21 years old (26.4%),
followed by those who were 20 years old (24%),then participants who were 22 years
old (16.6%), 19 years old (16%), 23 years old (10%) and 24 years old (4.6%)
respectively. The lowest age of the participants was 18 years old at 3.2 percent.
3.2%
16%
24%
26.4%
16.6%
10%
4.6%
18
19
20
21
22
23
24
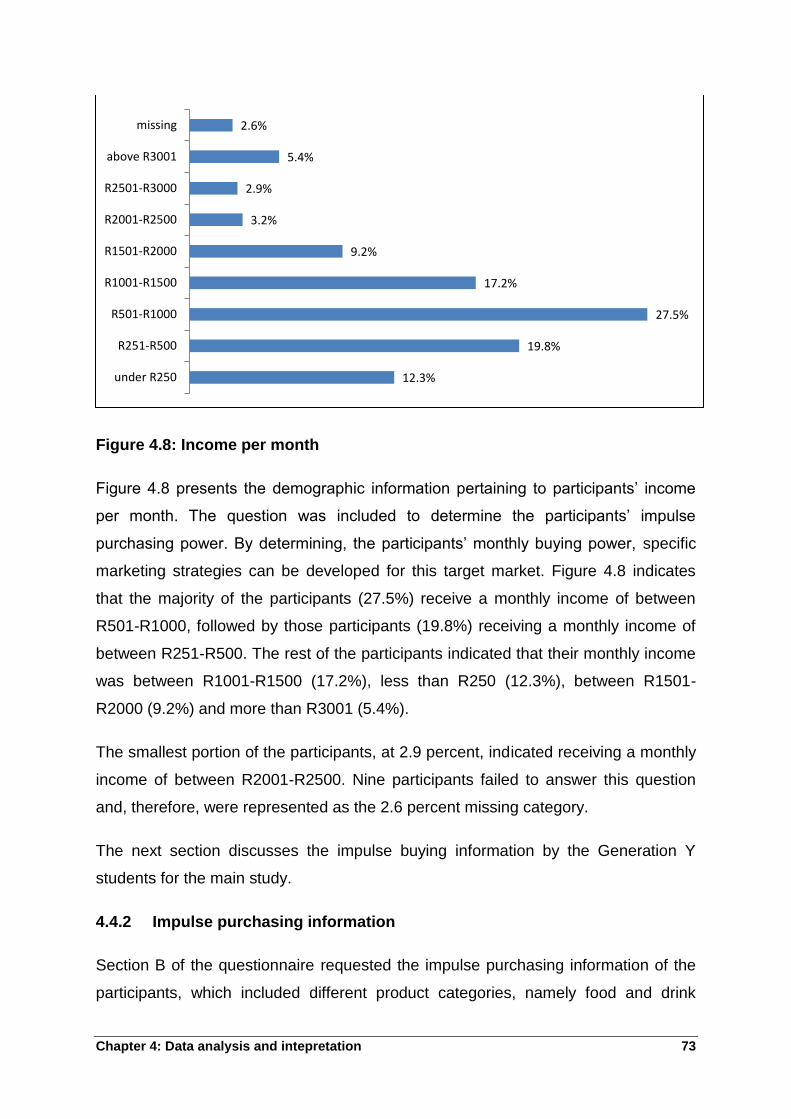
Chapter 4: Data analysis and intepretation 73
Figure 4.8: Income per month
Figure 4.8 presents the demographic information pertaining to participants‟ income
per month. The question was included to determine the participants‟ impulse
purchasing power. By determining, the participants‟ monthly buying power, specific
marketing strategies can be developed for this target market. Figure 4.8 indicates
that the majority of the participants (27.5%) receive a monthly income of between
R501-R1000, followed by those participants (19.8%) receiving a monthly income of
between R251-R500. The rest of the participants indicated that their monthly income
was between R1001-R1500 (17.2%), less than R250 (12.3%), between R1501-
R2000 (9.2%) and more than R3001 (5.4%).
The smallest portion of the participants, at 2.9 percent, indicated receiving a monthly
income of between R2001-R2500. Nine participants failed to answer this question
and, therefore, were represented as the 2.6 percent missing category.
The next section discusses the impulse buying information by the Generation Y
students for the main study.
4.4.2 Impulse purchasing information
Section B of the questionnaire requested the impulse purchasing information of the
participants, which included different product categories, namely food and drink
12.3%
19.8%
27.5%
17.2%
9.2%
3.2%
2.9%
5.4%
2.6%
under R250
R251-R500
R501-R1000
R1001-R1500
R1501-R2000
R2001-R2500
R2501-R3000
above R3001
missing
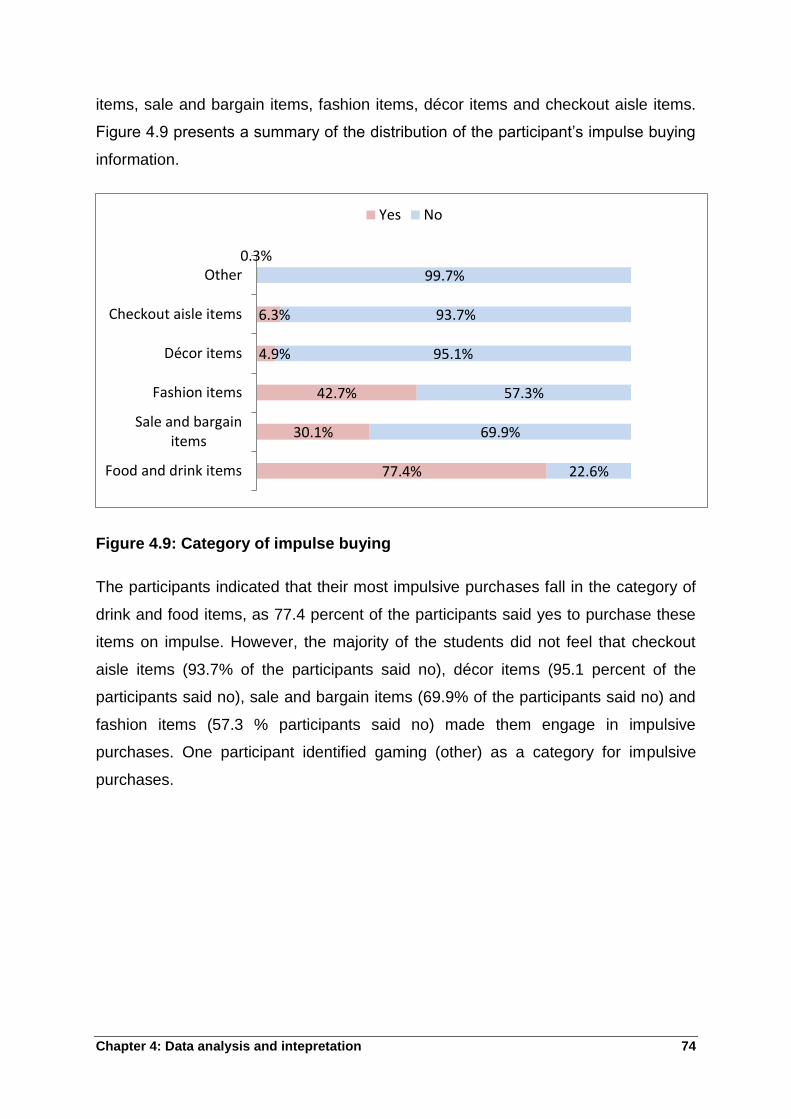
Chapter 4: Data analysis and intepretation 74
items, sale and bargain items, fashion items, décor items and checkout aisle items.
Figure 4.9 presents a summary of the distribution of the participant‟s impulse buying
information.
Figure 4.9: Category of impulse buying
The participants indicated that their most impulsive purchases fall in the category of
drink and food items, as 77.4 percent of the participants said yes to purchase these
items on impulse. However, the majority of the students did not feel that checkout
aisle items (93.7% of the participants said no), décor items (95.1 percent of the
participants said no), sale and bargain items (69.9% of the participants said no) and
fashion items (57.3 % participants said no) made them engage in impulsive
purchases. One participant identified gaming (other) as a category for impulsive
purchases.
77.4%
30.1%
42.7%
4.9%
6.3%
0.3%
22.6%
69.9%
57.3%
95.1%
93.7%
99.7%
Food and drink items
Sale and bargainitems
Fashion items
Décor items
Checkout aisle items
Other
Yes No
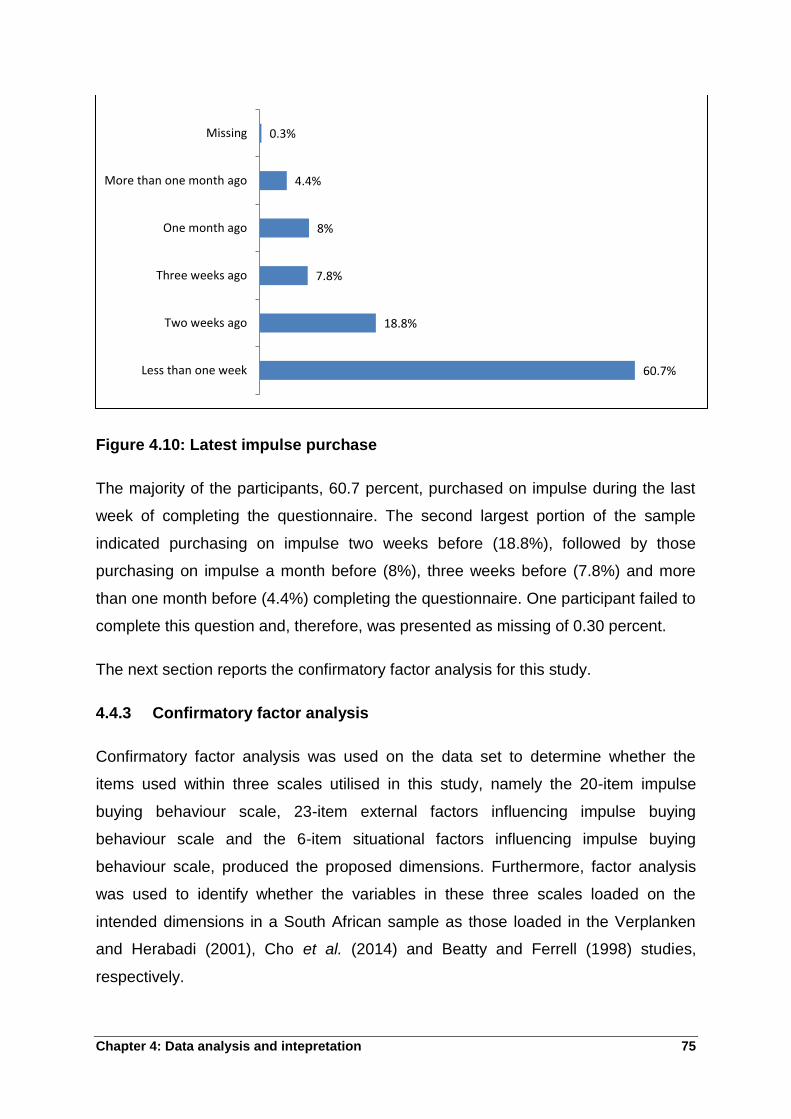
Chapter 4: Data analysis and intepretation 75
Figure 4.10: Latest impulse purchase
The majority of the participants, 60.7 percent, purchased on impulse during the last
week of completing the questionnaire. The second largest portion of the sample
indicated purchasing on impulse two weeks before (18.8%), followed by those
purchasing on impulse a month before (8%), three weeks before (7.8%) and more
than one month before (4.4%) completing the questionnaire. One participant failed to
complete this question and, therefore, was presented as missing of 0.30 percent.
The next section reports the confirmatory factor analysis for this study.
4.4.3 Confirmatory factor analysis
Confirmatory factor analysis was used on the data set to determine whether the
items used within three scales utilised in this study, namely the 20-item impulse
buying behaviour scale, 23-item external factors influencing impulse buying
behaviour scale and the 6-item situational factors influencing impulse buying
behaviour scale, produced the proposed dimensions. Furthermore, factor analysis
was used to identify whether the variables in these three scales loaded on the
intended dimensions in a South African sample as those loaded in the Verplanken
and Herabadi (2001), Cho et al. (2014) and Beatty and Ferrell (1998) studies,
respectively.
60.7%
18.8%
7.8%
8%
4.4%
0.3%
Less than one week
Two weeks ago
Three weeks ago
One month ago
More than one month ago
Missing
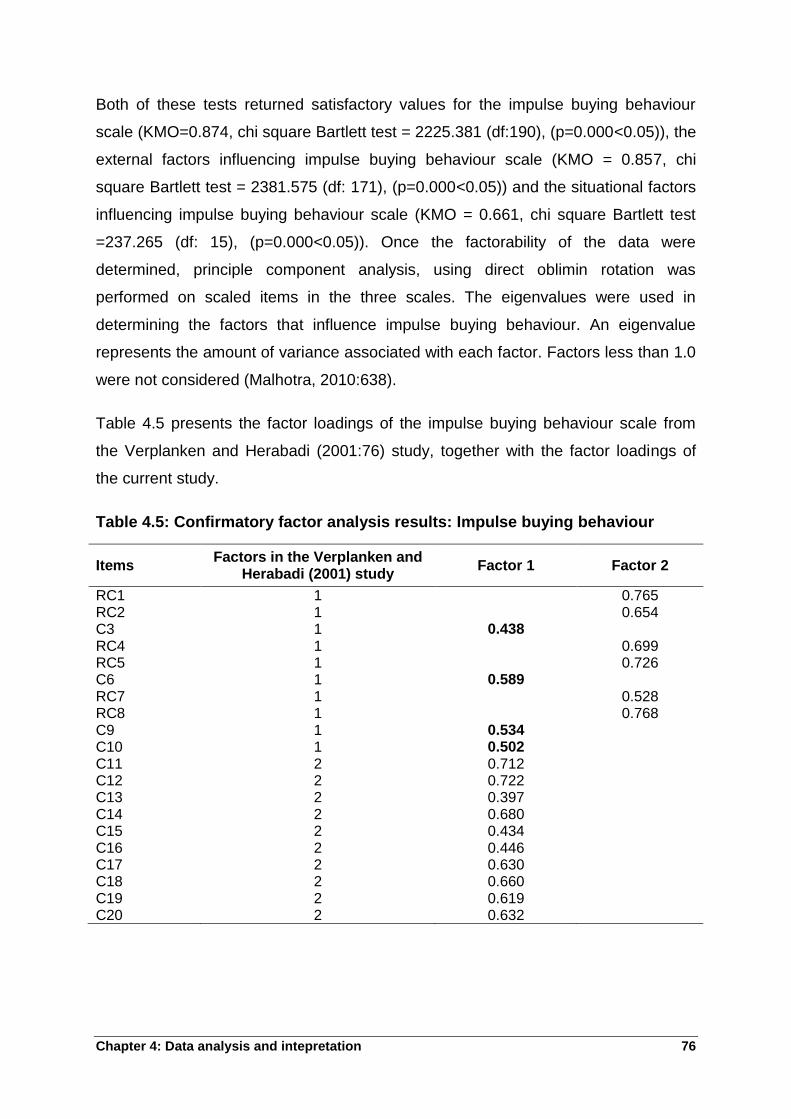
Chapter 4: Data analysis and intepretation 76
Both of these tests returned satisfactory values for the impulse buying behaviour
scale (KMO=0.874, chi square Bartlett test = 2225.381 (df:190), (p=0.000<0.05)), the
external factors influencing impulse buying behaviour scale (KMO = 0.857, chi
square Bartlett test = 2381.575 (df: 171), (p=0.000<0.05)) and the situational factors
influencing impulse buying behaviour scale (KMO = 0.661, chi square Bartlett test
=237.265 (df: 15), (p=0.000<0.05)). Once the factorability of the data were
determined, principle component analysis, using direct oblimin rotation was
performed on scaled items in the three scales. The eigenvalues were used in
determining the factors that influence impulse buying behaviour. An eigenvalue
represents the amount of variance associated with each factor. Factors less than 1.0
were not considered (Malhotra, 2010:638).
Table 4.5 presents the factor loadings of the impulse buying behaviour scale from
the Verplanken and Herabadi (2001:76) study, together with the factor loadings of
the current study.
Table 4.5: Confirmatory factor analysis results: Impulse buying behaviour
Items Factors in the Verplanken and
Herabadi (2001) study Factor 1 Factor 2
RC1 1 0.765 RC2 1 0.654 C3 1 0.438 RC4 1 0.699 RC5 1 0.726 C6 1 0.589 RC7 1 0.528 RC8 1 0.768 C9 1 0.534 C10 1 0.502 C11 2 0.712 C12 2 0.722 C13 2 0.397 C14 2 0.680 C15 2 0.434 C16 2 0.446 C17 2 0.630 C18 2 0.660 C19 2 0.619 C20 2 0.632
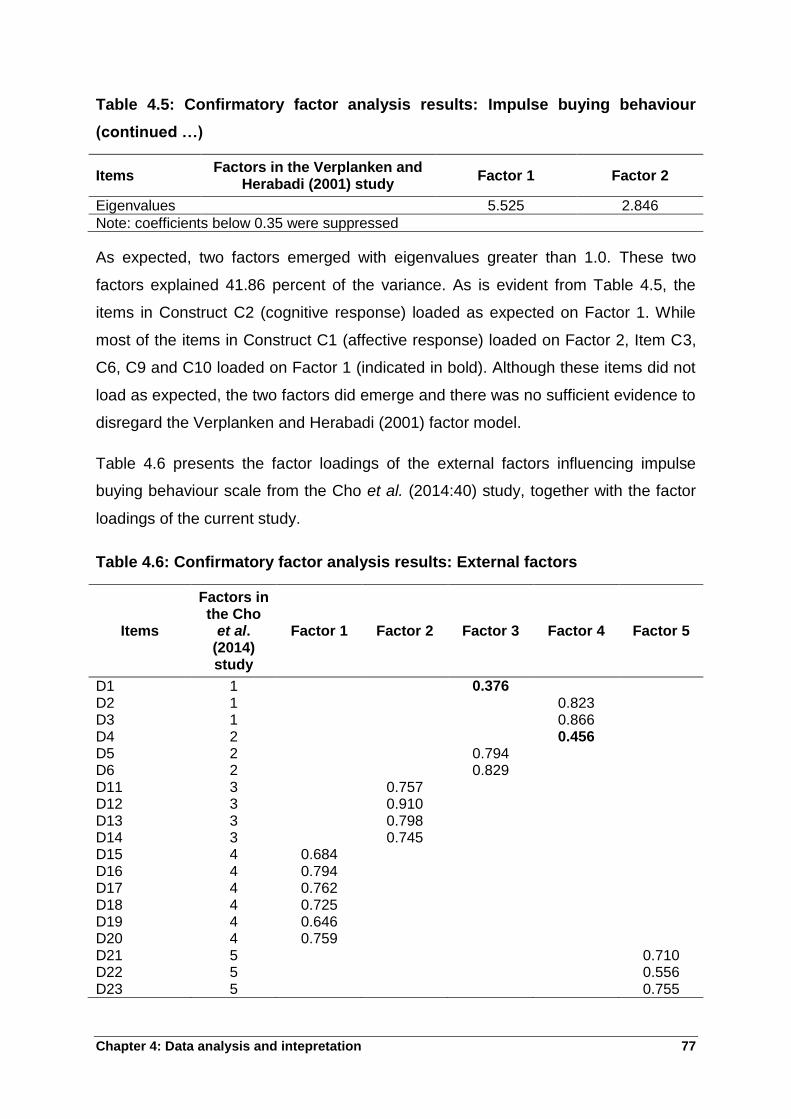
Chapter 4: Data analysis and intepretation 77
Table 4.5: Confirmatory factor analysis results: Impulse buying behaviour
(continued …)
Items Factors in the Verplanken and
Herabadi (2001) study Factor 1 Factor 2
Eigenvalues 5.525 2.846
Note: coefficients below 0.35 were suppressed
As expected, two factors emerged with eigenvalues greater than 1.0. These two
factors explained 41.86 percent of the variance. As is evident from Table 4.5, the
items in Construct C2 (cognitive response) loaded as expected on Factor 1. While
most of the items in Construct C1 (affective response) loaded on Factor 2, Item C3,
C6, C9 and C10 loaded on Factor 1 (indicated in bold). Although these items did not
load as expected, the two factors did emerge and there was no sufficient evidence to
disregard the Verplanken and Herabadi (2001) factor model.
Table 4.6 presents the factor loadings of the external factors influencing impulse
buying behaviour scale from the Cho et al. (2014:40) study, together with the factor
loadings of the current study.
Table 4.6: Confirmatory factor analysis results: External factors
Items
Factors in the Cho
et al. (2014) study
Factor 1 Factor 2 Factor 3 Factor 4 Factor 5
D1 1 0.376 D2 1 0.823 D3 1 0.866 D4 2 0.456 D5 2 0.794 D6 2 0.829 D11 3 0.757 D12 3 0.910 D13 3 0.798 D14 3 0.745 D15 4 0.684 D16 4 0.794 D17 4 0.762 D18 4 0.725 D19 4 0.646 D20 4 0.759 D21 5 0.710 D22 5 0.556 D23 5 0.755
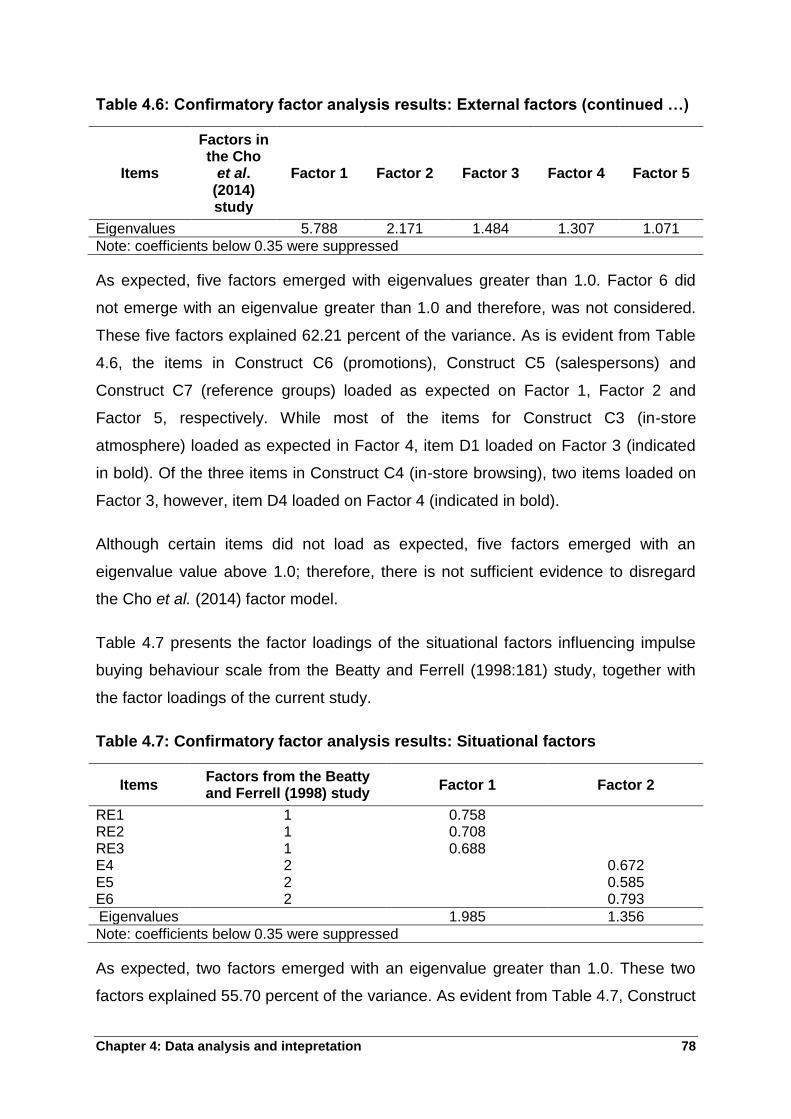
Chapter 4: Data analysis and intepretation 78
Table 4.6: Confirmatory factor analysis results: External factors (continued …)
Items
Factors in the Cho
et al. (2014) study
Factor 1 Factor 2 Factor 3 Factor 4 Factor 5
Eigenvalues 5.788 2.171 1.484 1.307 1.071
Note: coefficients below 0.35 were suppressed
As expected, five factors emerged with eigenvalues greater than 1.0. Factor 6 did
not emerge with an eigenvalue greater than 1.0 and therefore, was not considered.
These five factors explained 62.21 percent of the variance. As is evident from Table
4.6, the items in Construct C6 (promotions), Construct C5 (salespersons) and
Construct C7 (reference groups) loaded as expected on Factor 1, Factor 2 and
Factor 5, respectively. While most of the items for Construct C3 (in-store
atmosphere) loaded as expected in Factor 4, item D1 loaded on Factor 3 (indicated
in bold). Of the three items in Construct C4 (in-store browsing), two items loaded on
Factor 3, however, item D4 loaded on Factor 4 (indicated in bold).
Although certain items did not load as expected, five factors emerged with an
eigenvalue value above 1.0; therefore, there is not sufficient evidence to disregard
the Cho et al. (2014) factor model.
Table 4.7 presents the factor loadings of the situational factors influencing impulse
buying behaviour scale from the Beatty and Ferrell (1998:181) study, together with
the factor loadings of the current study.
Table 4.7: Confirmatory factor analysis results: Situational factors
Items Factors from the Beatty and Ferrell (1998) study
Factor 1 Factor 2
RE1 1 0.758 RE2 1 0.708 RE3 1 0.688 E4 2 0.672 E5 2 0.585 E6 2 0.793
Eigenvalues 1.985 1.356
Note: coefficients below 0.35 were suppressed
As expected, two factors emerged with an eigenvalue greater than 1.0. These two
factors explained 55.70 percent of the variance. As evident from Table 4.7, Construct
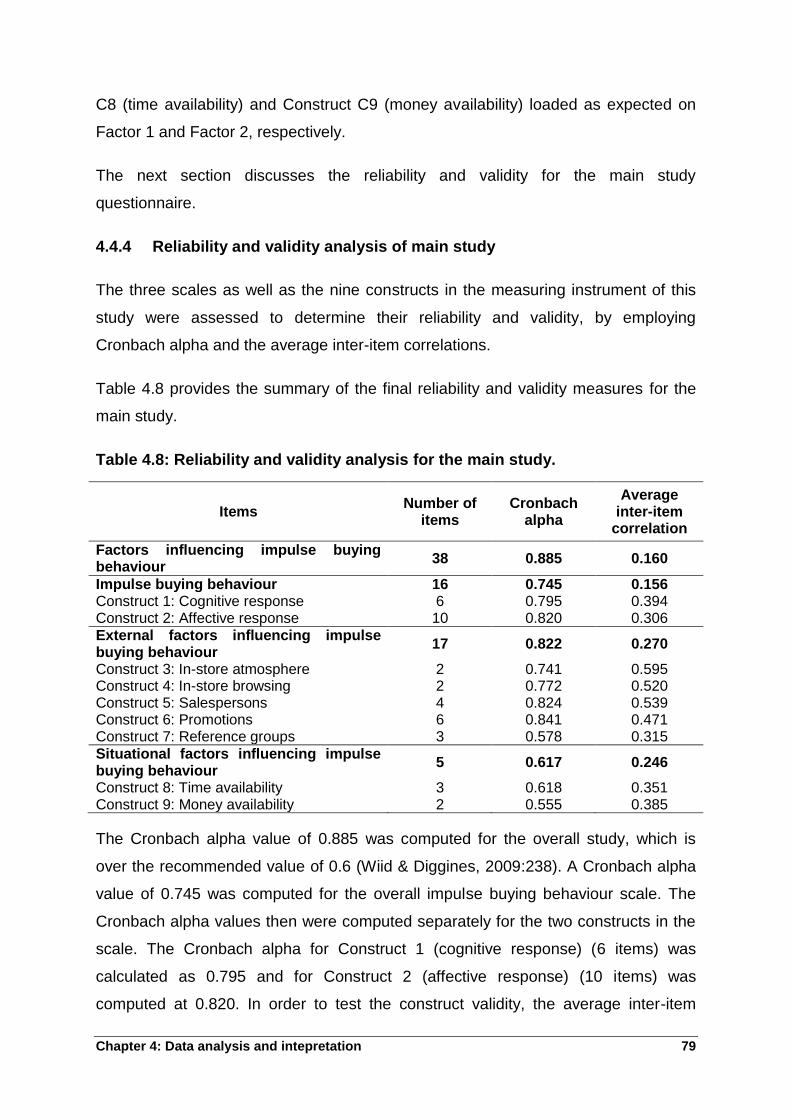
Chapter 4: Data analysis and intepretation 79
C8 (time availability) and Construct C9 (money availability) loaded as expected on
Factor 1 and Factor 2, respectively.
The next section discusses the reliability and validity for the main study
questionnaire.
4.4.4 Reliability and validity analysis of main study
The three scales as well as the nine constructs in the measuring instrument of this
study were assessed to determine their reliability and validity, by employing
Cronbach alpha and the average inter-item correlations.
Table 4.8 provides the summary of the final reliability and validity measures for the
main study.
Table 4.8: Reliability and validity analysis for the main study.
Items Number of
items Cronbach
alpha
Average inter-item
correlation
Factors influencing impulse buying behaviour
38 0.885 0.160
Impulse buying behaviour 16 0.745 0.156 Construct 1: Cognitive response 6 0.795 0.394 Construct 2: Affective response 10 0.820 0.306
External factors influencing impulse buying behaviour
17 0.822 0.270
Construct 3: In-store atmosphere 2 0.741 0.595 Construct 4: In-store browsing 2 0.772 0.520 Construct 5: Salespersons 4 0.824 0.539 Construct 6: Promotions 6 0.841 0.471 Construct 7: Reference groups 3 0.578 0.315
Situational factors influencing impulse buying behaviour
5 0.617 0.246
Construct 8: Time availability 3 0.618 0.351 Construct 9: Money availability 2 0.555 0.385
The Cronbach alpha value of 0.885 was computed for the overall study, which is
over the recommended value of 0.6 (Wiid & Diggines, 2009:238). A Cronbach alpha
value of 0.745 was computed for the overall impulse buying behaviour scale. The
Cronbach alpha values then were computed separately for the two constructs in the
scale. The Cronbach alpha for Construct 1 (cognitive response) (6 items) was
calculated as 0.795 and for Construct 2 (affective response) (10 items) was
computed at 0.820. In order to test the construct validity, the average inter-item
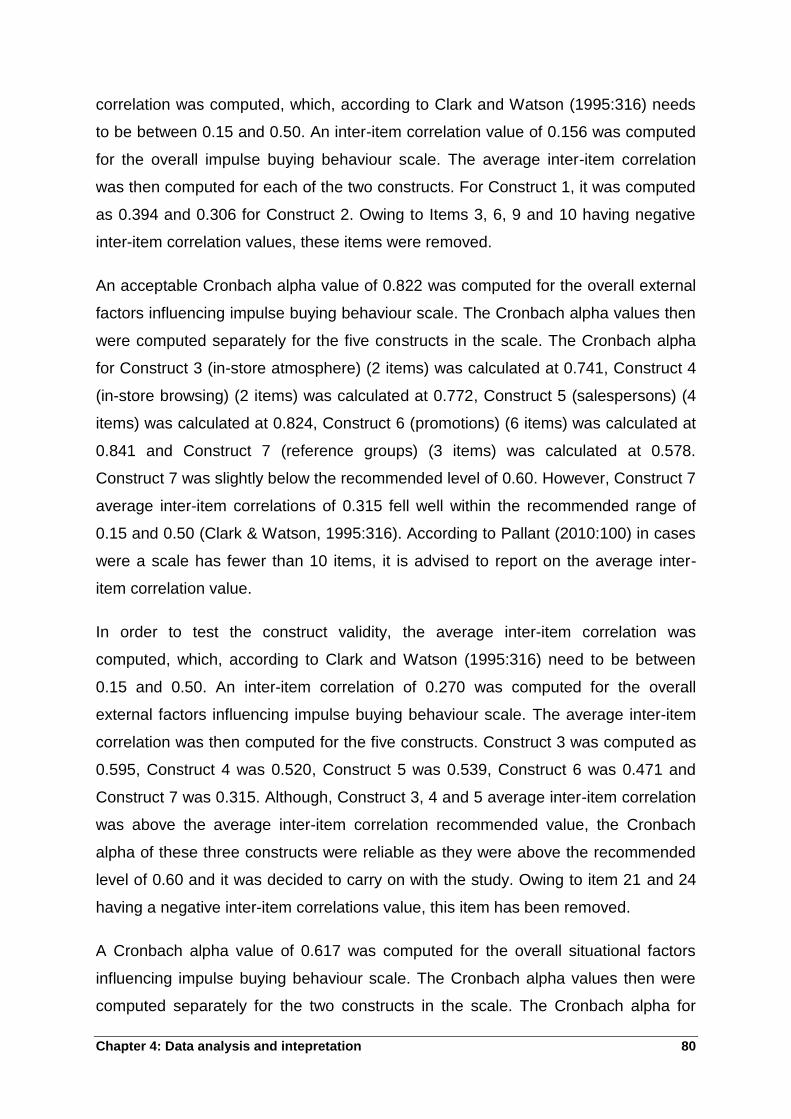
Chapter 4: Data analysis and intepretation 80
correlation was computed, which, according to Clark and Watson (1995:316) needs
to be between 0.15 and 0.50. An inter-item correlation value of 0.156 was computed
for the overall impulse buying behaviour scale. The average inter-item correlation
was then computed for each of the two constructs. For Construct 1, it was computed
as 0.394 and 0.306 for Construct 2. Owing to Items 3, 6, 9 and 10 having negative
inter-item correlation values, these items were removed.
An acceptable Cronbach alpha value of 0.822 was computed for the overall external
factors influencing impulse buying behaviour scale. The Cronbach alpha values then
were computed separately for the five constructs in the scale. The Cronbach alpha
for Construct 3 (in-store atmosphere) (2 items) was calculated at 0.741, Construct 4
(in-store browsing) (2 items) was calculated at 0.772, Construct 5 (salespersons) (4
items) was calculated at 0.824, Construct 6 (promotions) (6 items) was calculated at
0.841 and Construct 7 (reference groups) (3 items) was calculated at 0.578.
Construct 7 was slightly below the recommended level of 0.60. However, Construct 7
average inter-item correlations of 0.315 fell well within the recommended range of
0.15 and 0.50 (Clark & Watson, 1995:316). According to Pallant (2010:100) in cases
were a scale has fewer than 10 items, it is advised to report on the average inter-
item correlation value.
In order to test the construct validity, the average inter-item correlation was
computed, which, according to Clark and Watson (1995:316) need to be between
0.15 and 0.50. An inter-item correlation of 0.270 was computed for the overall
external factors influencing impulse buying behaviour scale. The average inter-item
correlation was then computed for the five constructs. Construct 3 was computed as
0.595, Construct 4 was 0.520, Construct 5 was 0.539, Construct 6 was 0.471 and
Construct 7 was 0.315. Although, Construct 3, 4 and 5 average inter-item correlation
was above the average inter-item correlation recommended value, the Cronbach
alpha of these three constructs were reliable as they were above the recommended
level of 0.60 and it was decided to carry on with the study. Owing to item 21 and 24
having a negative inter-item correlations value, this item has been removed.
A Cronbach alpha value of 0.617 was computed for the overall situational factors
influencing impulse buying behaviour scale. The Cronbach alpha values then were
computed separately for the two constructs in the scale. The Cronbach alpha for
Chapter 4: Data analysis and intepretation 81
Construct 8 (time availability) (3 items) was calculated as 0.618 and for Construct 9
(money availability) (2 items) was computed at 0.555. However, Construct 9 average
inter-item correlations of 0.385 fell well within the recommended range of 0.15 and
0.50 (Clark & Watson, 1995:316). According to Pallant (2010:100) in cases were a
scale has fewer than 10 items, it is advised to report on the average inter-item
correlation value.
In order to test the construct validity, the average inter-item correlation was
computed, which, according to Clark and Watson (1995:316) needs to be between
0.15 and 0.50. An inter-item correlation value of 0.246 was computed for the
situational factors influencing impulse buying behaviour scale. The average inter-
item correlation was then computed for each of the two constructs. For Construct 8 it
was computed as 0.351 and 0.385 for Construct 9. Owing to item 48 having negative
inter-item correlation value, this item has been removed.
After assessing the Cronbach alpha values and the average inter-item correlation
values for the overall study and the nine constructs, the Cronbach alpha values for
the nine constructs ranged from 0.555 to 0.841, thereby indicating satisfactory
internal-consistency reliability. The average inter-item correlation values for the nine
constructs ranged from 0.306 to 0.595, which were not far out of the suggested value
range. This suggests that the scale exhibits both convergent and discriminant
validity.
The next section discusses the descriptive statistics utilised in the study.
4.4.5 Descriptive statistics
Measures of location, variability and shape were determined across all the scaled
items used. Given that the questionnaire used a six-point Likert scale ranging from 1
= strongly disagree to 6 = strongly agree, this suggests that higher mean values are
associated with a more positive attitude towards factors influencing impulse buying
behaviour amongst Generation Y students.
Table 4.9 indicates the overview of the descriptive statistics.
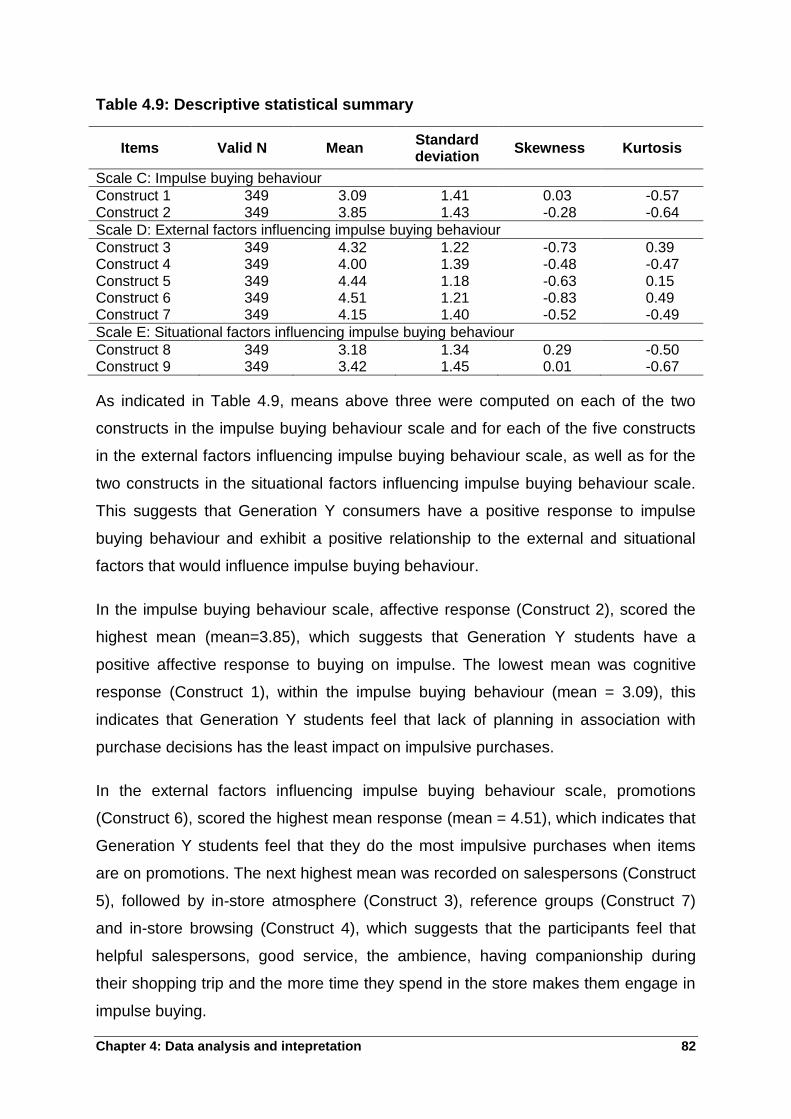
Chapter 4: Data analysis and intepretation 82
Table 4.9: Descriptive statistical summary
Items Valid N Mean Standard deviation
Skewness Kurtosis
Scale C: Impulse buying behaviour
Construct 1 349 3.09 1.41 0.03 -0.57 Construct 2 349 3.85 1.43 -0.28 -0.64
Scale D: External factors influencing impulse buying behaviour
Construct 3 349 4.32 1.22 -0.73 0.39 Construct 4 349 4.00 1.39 -0.48 -0.47 Construct 5 349 4.44 1.18 -0.63 0.15 Construct 6 349 4.51 1.21 -0.83 0.49 Construct 7 349 4.15 1.40 -0.52 -0.49
Scale E: Situational factors influencing impulse buying behaviour
Construct 8 349 3.18 1.34 0.29 -0.50 Construct 9 349 3.42 1.45 0.01 -0.67
As indicated in Table 4.9, means above three were computed on each of the two
constructs in the impulse buying behaviour scale and for each of the five constructs
in the external factors influencing impulse buying behaviour scale, as well as for the
two constructs in the situational factors influencing impulse buying behaviour scale.
This suggests that Generation Y consumers have a positive response to impulse
buying behaviour and exhibit a positive relationship to the external and situational
factors that would influence impulse buying behaviour.
In the impulse buying behaviour scale, affective response (Construct 2), scored the
highest mean (mean=3.85), which suggests that Generation Y students have a
positive affective response to buying on impulse. The lowest mean was cognitive
response (Construct 1), within the impulse buying behaviour (mean = 3.09), this
indicates that Generation Y students feel that lack of planning in association with
purchase decisions has the least impact on impulsive purchases.
In the external factors influencing impulse buying behaviour scale, promotions
(Construct 6), scored the highest mean response (mean = 4.51), which indicates that
Generation Y students feel that they do the most impulsive purchases when items
are on promotions. The next highest mean was recorded on salespersons (Construct
5), followed by in-store atmosphere (Construct 3), reference groups (Construct 7)
and in-store browsing (Construct 4), which suggests that the participants feel that
helpful salespersons, good service, the ambience, having companionship during
their shopping trip and the more time they spend in the store makes them engage in
impulse buying.
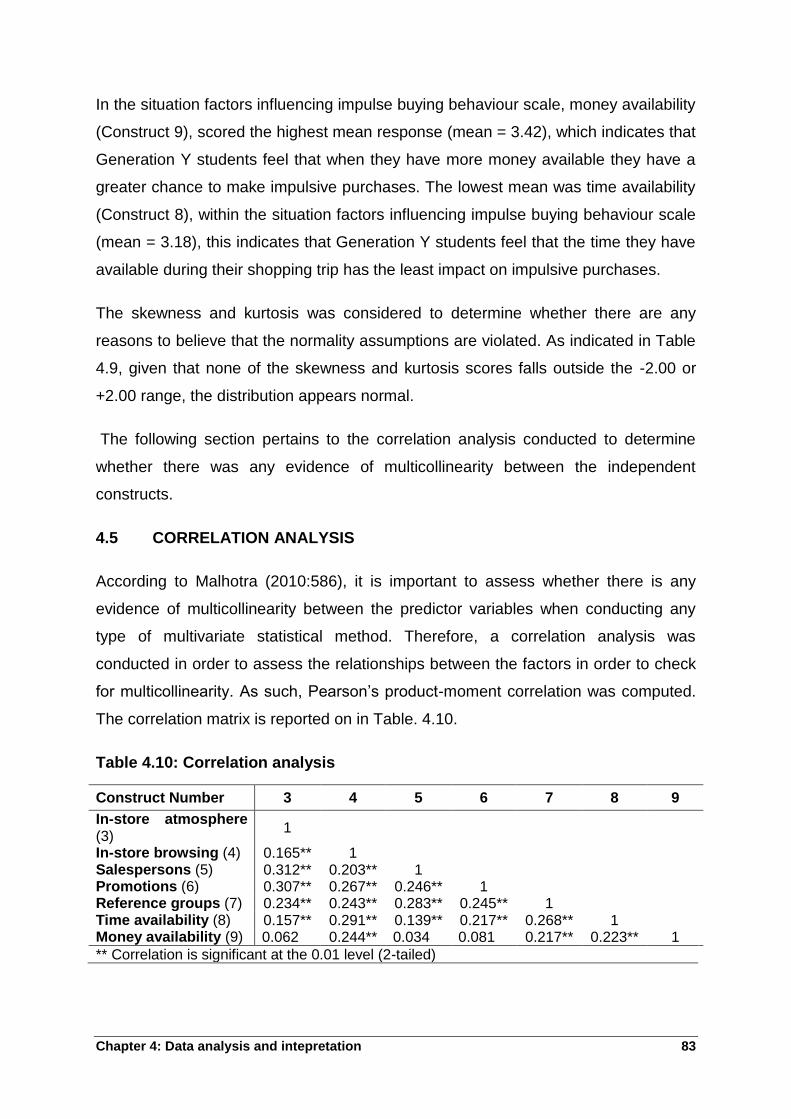
Chapter 4: Data analysis and intepretation 83
In the situation factors influencing impulse buying behaviour scale, money availability
(Construct 9), scored the highest mean response (mean = 3.42), which indicates that
Generation Y students feel that when they have more money available they have a
greater chance to make impulsive purchases. The lowest mean was time availability
(Construct 8), within the situation factors influencing impulse buying behaviour scale
(mean = 3.18), this indicates that Generation Y students feel that the time they have
available during their shopping trip has the least impact on impulsive purchases.
The skewness and kurtosis was considered to determine whether there are any
reasons to believe that the normality assumptions are violated. As indicated in Table
4.9, given that none of the skewness and kurtosis scores falls outside the -2.00 or
+2.00 range, the distribution appears normal.
The following section pertains to the correlation analysis conducted to determine
whether there was any evidence of multicollinearity between the independent
constructs.
4.5 CORRELATION ANALYSIS
According to Malhotra (2010:586), it is important to assess whether there is any
evidence of multicollinearity between the predictor variables when conducting any
type of multivariate statistical method. Therefore, a correlation analysis was
conducted in order to assess the relationships between the factors in order to check
for multicollinearity. As such, Pearson‟s product-moment correlation was computed.
The correlation matrix is reported on in Table. 4.10.
Table 4.10: Correlation analysis
Construct Number 3 4 5 6 7 8 9
In-store atmosphere (3)
1
In-store browsing (4) 0.165** 1 Salespersons (5) 0.312** 0.203** 1 Promotions (6) 0.307** 0.267** 0.246** 1 Reference groups (7) 0.234** 0.243** 0.283** 0.245** 1 Time availability (8) 0.157** 0.291** 0.139** 0.217** 0.268** 1 Money availability (9) 0.062 0.244** 0.034 0.081 0.217** 0.223** 1
** Correlation is significant at the 0.01 level (2-tailed)
Chapter 4: Data analysis and intepretation 84
As indicated in Table 4.10, none of the correlation coefficients between the predictor
variables exceeded the recommended cut-off point of 0.80 (Field, 2009:224). As
such, there is no suggestion of any apparent evidence of multicollinearity between
the predictors. This suggests that regression analysis can be conducted.
The hypotheses tested in this study are outlined in the next section.
4.6 TEST OF SIGNIFICANCE
In order to achieve the empirical objectives and test the hypotheses set out in
Chapter 1 (refer to Section 1.3.3), regression analysis and a two independent-
samples t-test was undertaken. The significance level for both tests was set at the
conventional 5 percent level, that is a = 0.05 and the decision rules applied were as
follows:
If p-value ≥ ɑ, conclude Ho
If p-value <ɑ, conclude Ha
4.6.1 Regression analysis
For addressing the first, second, third and fourth empirical objective of this study,
regression analysis were computed.
In order to address the first empirical objective in Chapter 1, regression analysis was
conducted to ascertain whether the external factors of in-store atmosphere, in-store
browsing, salespersons, promotions and reference groups‟ influence Generation Y
students‟ cognitive response to buy on impulse. The hypotheses were formulated as
follows:
Ho1: External factors do not have a significant influence on Generation Y students‟
cognitive response.
Ha1: External factors have a significant influence on Generation Y students‟
cognitive response.
Table 4.11 presents the results of this regression analysis.
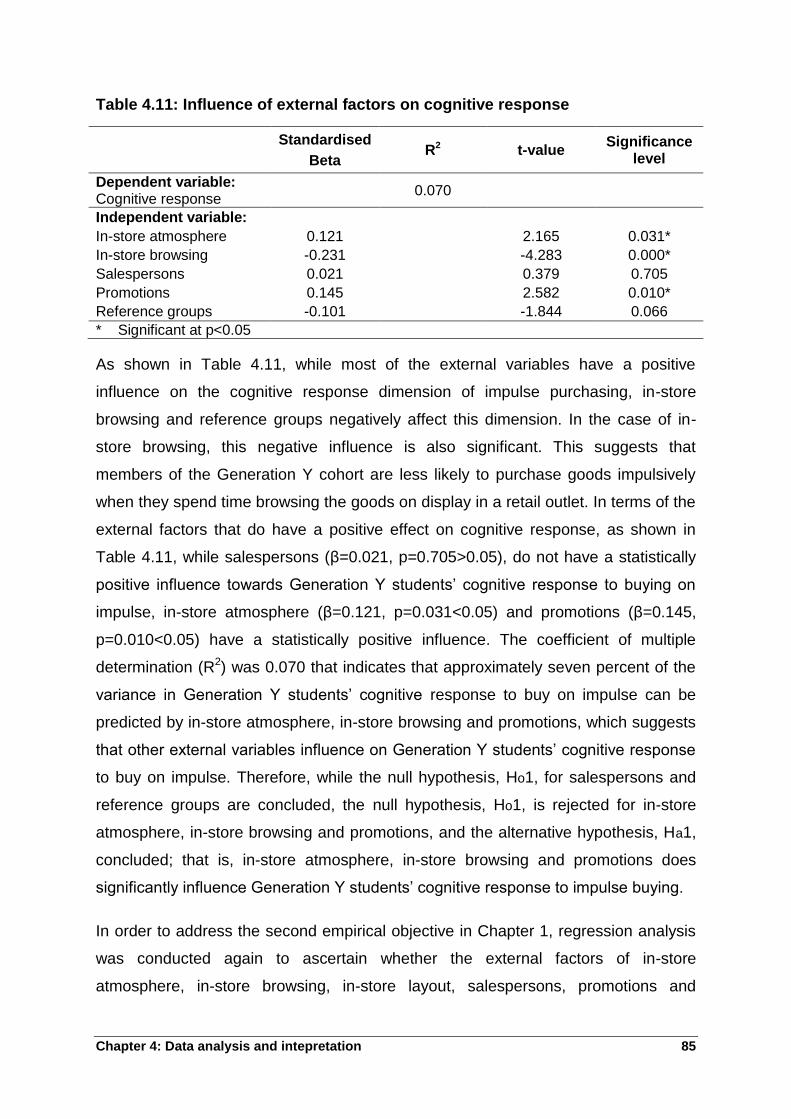
Chapter 4: Data analysis and intepretation 85
Table 4.11: Influence of external factors on cognitive response
Standardised
Beta R2 t-value
Significance level
Dependent variable: Cognitive response
0.070
Independent variable:
In-store atmosphere 0.121 2.165 0.031*
In-store browsing -0.231 -4.283 0.000*
Salespersons 0.021 0.379 0.705
Promotions 0.145 2.582 0.010*
Reference groups -0.101 -1.844 0.066
* Significant at p<0.05
As shown in Table 4.11, while most of the external variables have a positive
influence on the cognitive response dimension of impulse purchasing, in-store
browsing and reference groups negatively affect this dimension. In the case of in-
store browsing, this negative influence is also significant. This suggests that
members of the Generation Y cohort are less likely to purchase goods impulsively
when they spend time browsing the goods on display in a retail outlet. In terms of the
external factors that do have a positive effect on cognitive response, as shown in
Table 4.11, while salespersons (β=0.021, p=0.705>0.05), do not have a statistically
positive influence towards Generation Y students‟ cognitive response to buying on
impulse, in-store atmosphere (β=0.121, p=0.031<0.05) and promotions (β=0.145,
p=0.010<0.05) have a statistically positive influence. The coefficient of multiple
determination (R2) was 0.070 that indicates that approximately seven percent of the
variance in Generation Y students‟ cognitive response to buy on impulse can be
predicted by in-store atmosphere, in-store browsing and promotions, which suggests
that other external variables influence on Generation Y students‟ cognitive response
to buy on impulse. Therefore, while the null hypothesis, Ho1, for salespersons and
reference groups are concluded, the null hypothesis, Ho1, is rejected for in-store
atmosphere, in-store browsing and promotions, and the alternative hypothesis, Ha1,
concluded; that is, in-store atmosphere, in-store browsing and promotions does
significantly influence Generation Y students‟ cognitive response to impulse buying.
In order to address the second empirical objective in Chapter 1, regression analysis
was conducted again to ascertain whether the external factors of in-store
atmosphere, in-store browsing, in-store layout, salespersons, promotions and
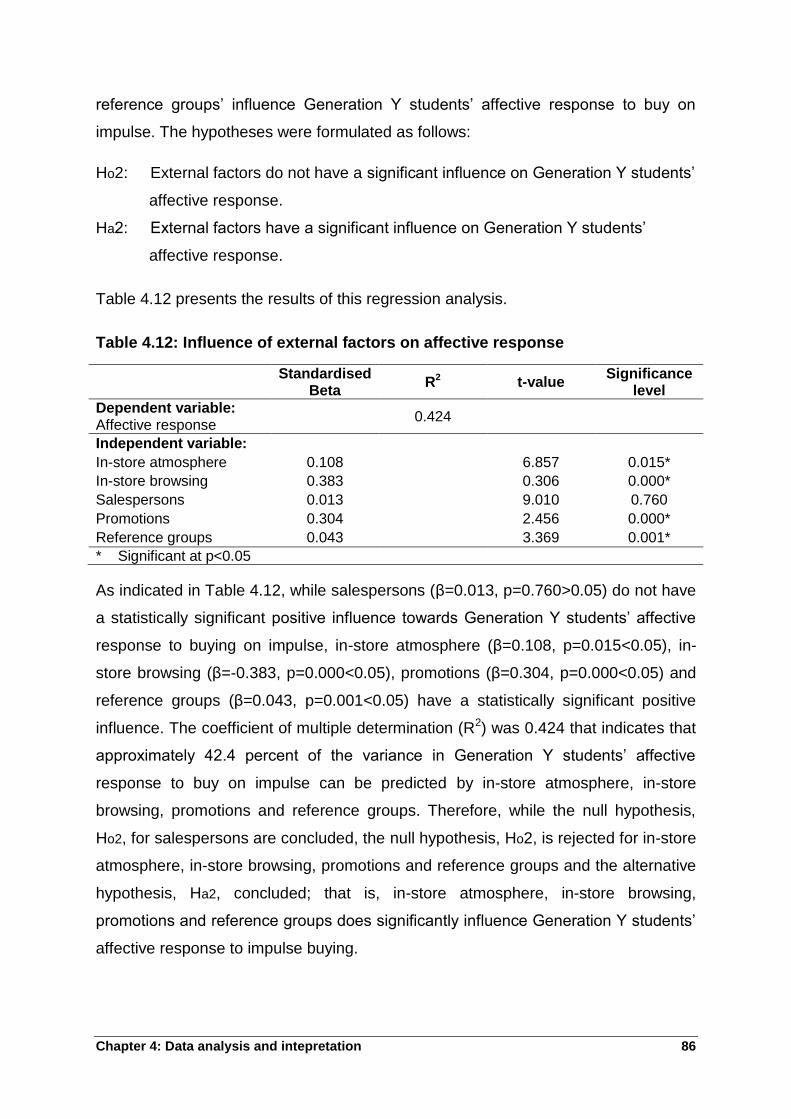
Chapter 4: Data analysis and intepretation 86
reference groups‟ influence Generation Y students‟ affective response to buy on
impulse. The hypotheses were formulated as follows:
Ho2: External factors do not have a significant influence on Generation Y students‟
affective response.
Ha2: External factors have a significant influence on Generation Y students‟
affective response.
Table 4.12 presents the results of this regression analysis.
Table 4.12: Influence of external factors on affective response
Standardised Beta
R2 t-value Significance
level
Dependent variable: Affective response
0.424
Independent variable:
In-store atmosphere 0.108 6.857 0.015*
In-store browsing 0.383 0.306 0.000*
Salespersons 0.013 9.010 0.760
Promotions 0.304 2.456 0.000*
Reference groups 0.043 3.369 0.001*
* Significant at p<0.05
As indicated in Table 4.12, while salespersons (β=0.013, p=0.760>0.05) do not have
a statistically significant positive influence towards Generation Y students‟ affective
response to buying on impulse, in-store atmosphere (β=0.108, p=0.015<0.05), in-
store browsing (β=-0.383, p=0.000<0.05), promotions (β=0.304, p=0.000<0.05) and
reference groups (β=0.043, p=0.001<0.05) have a statistically significant positive
influence. The coefficient of multiple determination (R2) was 0.424 that indicates that
approximately 42.4 percent of the variance in Generation Y students‟ affective
response to buy on impulse can be predicted by in-store atmosphere, in-store
browsing, promotions and reference groups. Therefore, while the null hypothesis,
Ho2, for salespersons are concluded, the null hypothesis, Ho2, is rejected for in-store
atmosphere, in-store browsing, promotions and reference groups and the alternative
hypothesis, Ha2, concluded; that is, in-store atmosphere, in-store browsing,
promotions and reference groups does significantly influence Generation Y students‟
affective response to impulse buying.
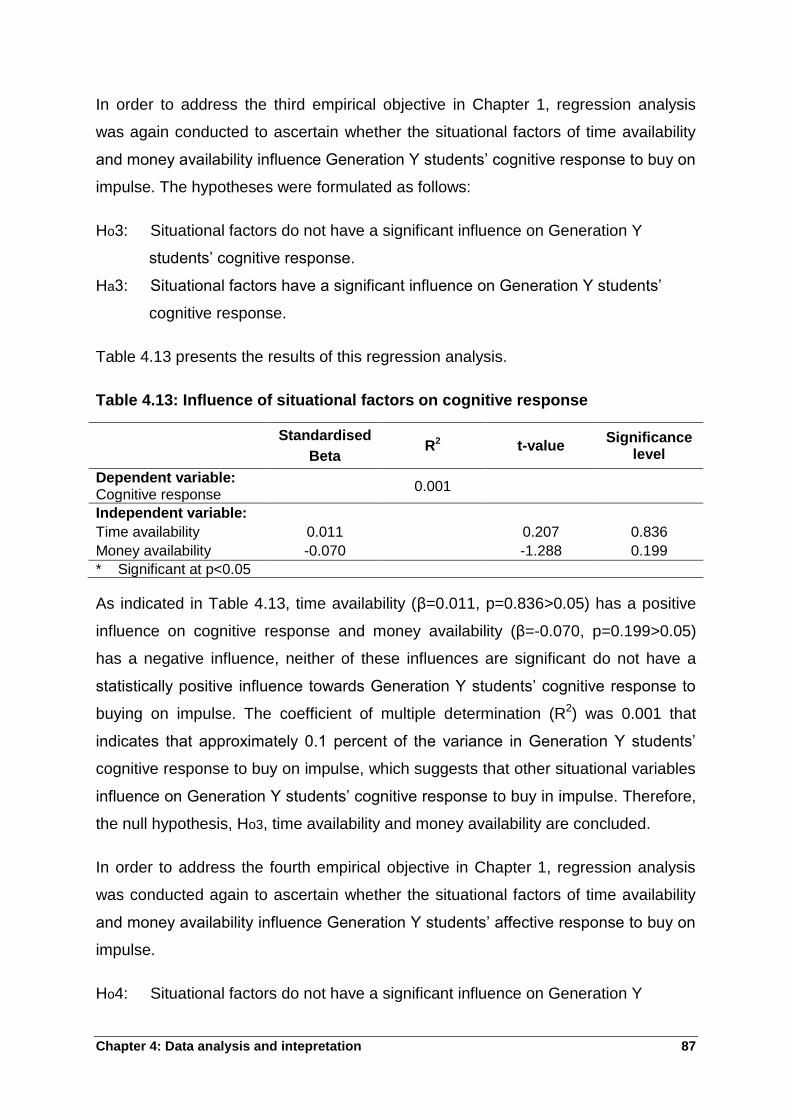
Chapter 4: Data analysis and intepretation 87
In order to address the third empirical objective in Chapter 1, regression analysis
was again conducted to ascertain whether the situational factors of time availability
and money availability influence Generation Y students‟ cognitive response to buy on
impulse. The hypotheses were formulated as follows:
Ho3: Situational factors do not have a significant influence on Generation Y
students‟ cognitive response.
Ha3: Situational factors have a significant influence on Generation Y students‟
cognitive response.
Table 4.13 presents the results of this regression analysis.
Table 4.13: Influence of situational factors on cognitive response
Standardised
Beta R2 t-value
Significance level
Dependent variable: Cognitive response
0.001
Independent variable:
Time availability 0.011 0.207 0.836
Money availability -0.070 -1.288 0.199
* Significant at p<0.05
As indicated in Table 4.13, time availability (β=0.011, p=0.836>0.05) has a positive
influence on cognitive response and money availability (β=-0.070, p=0.199>0.05)
has a negative influence, neither of these influences are significant do not have a
statistically positive influence towards Generation Y students‟ cognitive response to
buying on impulse. The coefficient of multiple determination (R2) was 0.001 that
indicates that approximately 0.1 percent of the variance in Generation Y students‟
cognitive response to buy on impulse, which suggests that other situational variables
influence on Generation Y students‟ cognitive response to buy in impulse. Therefore,
the null hypothesis, Ho3, time availability and money availability are concluded.
In order to address the fourth empirical objective in Chapter 1, regression analysis
was conducted again to ascertain whether the situational factors of time availability
and money availability influence Generation Y students‟ affective response to buy on
impulse.
Ho4: Situational factors do not have a significant influence on Generation Y
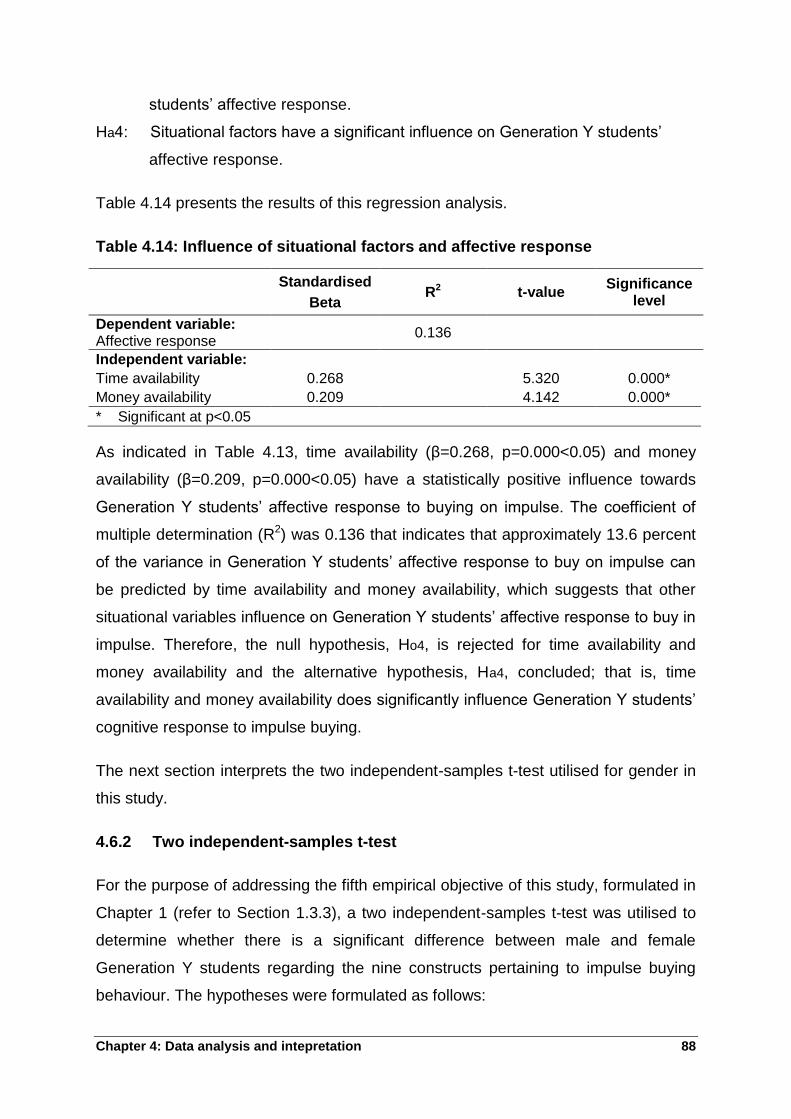
Chapter 4: Data analysis and intepretation 88
students‟ affective response.
Ha4: Situational factors have a significant influence on Generation Y students‟
affective response.
Table 4.14 presents the results of this regression analysis.
Table 4.14: Influence of situational factors and affective response
Standardised
Beta R2 t-value
Significance level
Dependent variable: Affective response
0.136
Independent variable:
Time availability 0.268 5.320 0.000*
Money availability 0.209 4.142 0.000*
* Significant at p<0.05
As indicated in Table 4.13, time availability (β=0.268, p=0.000<0.05) and money
availability (β=0.209, p=0.000<0.05) have a statistically positive influence towards
Generation Y students‟ affective response to buying on impulse. The coefficient of
multiple determination (R2) was 0.136 that indicates that approximately 13.6 percent
of the variance in Generation Y students‟ affective response to buy on impulse can
be predicted by time availability and money availability, which suggests that other
situational variables influence on Generation Y students‟ affective response to buy in
impulse. Therefore, the null hypothesis, Ho4, is rejected for time availability and
money availability and the alternative hypothesis, Ha4, concluded; that is, time
availability and money availability does significantly influence Generation Y students‟
cognitive response to impulse buying.
The next section interprets the two independent-samples t-test utilised for gender in
this study.
4.6.2 Two independent-samples t-test
For the purpose of addressing the fifth empirical objective of this study, formulated in
Chapter 1 (refer to Section 1.3.3), a two independent-samples t-test was utilised to
determine whether there is a significant difference between male and female
Generation Y students regarding the nine constructs pertaining to impulse buying
behaviour. The hypotheses were formulated as follows:
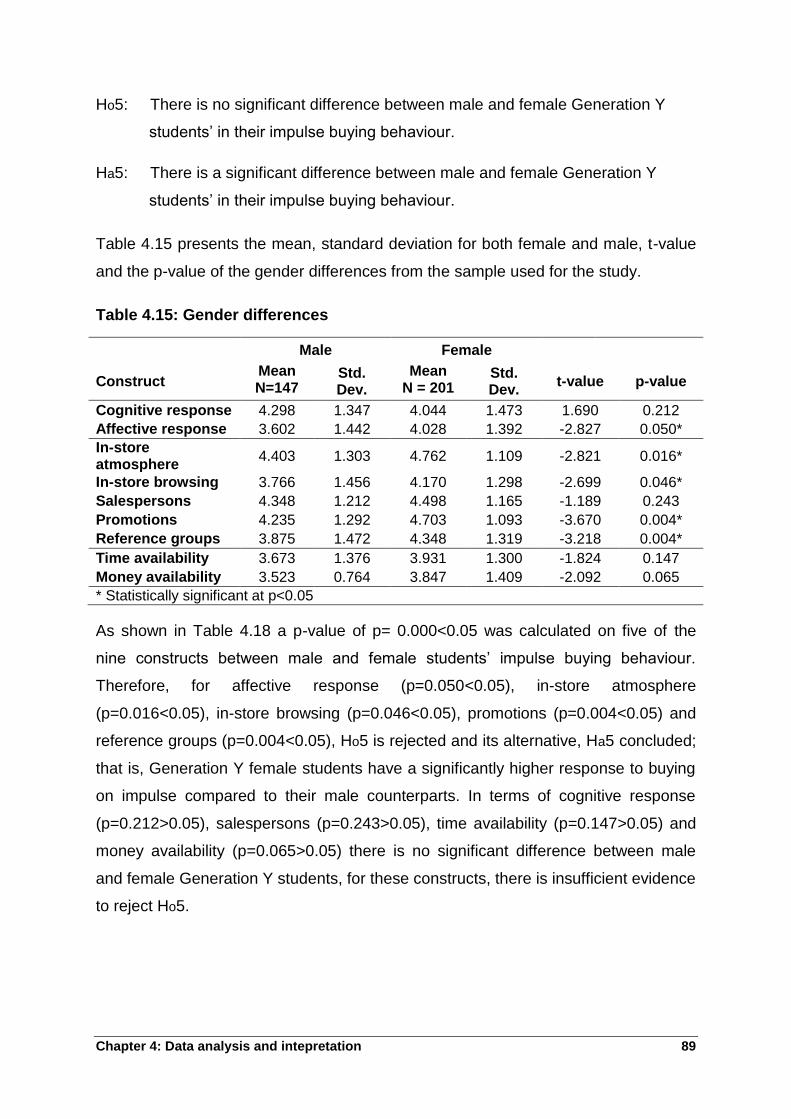
Chapter 4: Data analysis and intepretation 89
Ho5: There is no significant difference between male and female Generation Y
students‟ in their impulse buying behaviour.
Ha5: There is a significant difference between male and female Generation Y
students‟ in their impulse buying behaviour.
Table 4.15 presents the mean, standard deviation for both female and male, t-value
and the p-value of the gender differences from the sample used for the study.
Table 4.15: Gender differences
Male Female
Construct Mean N=147
Std. Dev.
Mean N = 201
Std. Dev.
t-value p-value
Cognitive response 4.298 1.347 4.044 1.473 1.690 0.212
Affective response 3.602 1.442 4.028 1.392 -2.827 0.050*
In-store atmosphere
4.403 1.303 4.762 1.109 -2.821 0.016*
In-store browsing 3.766 1.456 4.170 1.298 -2.699 0.046*
Salespersons 4.348 1.212 4.498 1.165 -1.189 0.243
Promotions 4.235 1.292 4.703 1.093 -3.670 0.004*
Reference groups 3.875 1.472 4.348 1.319 -3.218 0.004*
Time availability 3.673 1.376 3.931 1.300 -1.824 0.147
Money availability 3.523 0.764 3.847 1.409 -2.092 0.065
* Statistically significant at p<0.05
As shown in Table 4.18 a p-value of p= 0.000<0.05 was calculated on five of the
nine constructs between male and female students‟ impulse buying behaviour.
Therefore, for affective response (p=0.050<0.05), in-store atmosphere
(p=0.016<0.05), in-store browsing (p=0.046<0.05), promotions (p=0.004<0.05) and
reference groups (p=0.004<0.05), Ho5 is rejected and its alternative, Ha5 concluded;
that is, Generation Y female students have a significantly higher response to buying
on impulse compared to their male counterparts. In terms of cognitive response
(p=0.212>0.05), salespersons (p=0.243>0.05), time availability (p=0.147>0.05) and
money availability (p=0.065>0.05) there is no significant difference between male
and female Generation Y students, for these constructs, there is insufficient evidence
to reject Ho5.
Chapter 4: Data analysis and intepretation 90
4.7 SYNOPSIS
This chapter reported and discussed the analysis and interpretation of the empirical
findings of the study regarding the pilot and main questionnaire. Section 4.2
discussed the results of the pilot test. These results included the reliability and
validity. Section 4.3 reported the preliminary data analysis, which included the
coding, tabulation and data gathering process. Section 4.4 reported the descriptive
analysis, which included the demographic information, descriptive statistics,
confirmatory factor analysis, reliability and validity of the main study, as well as the
summary and discussion of the descriptive statistics.
Section 4.5 reported the correlation analysis; it was conducted in order to assess the
relationships between the independent factors in order to check for multicollinearity.
The results reported that none of the independent factors had a strong enough
correlation (above 0.8) and therefore, regression was utilised to determine the
relationships.
Section 4.6 reported the significance tests done in the study. Regression analysis
was conducted to test if the external factors (in-store atmosphere, in-store browsing,
in-store layout, salespersons, promotions and reference groups) had a significant
influence of the cognitive and affective response of the study as well as whether the
situational factors (time and money availability) had a significant influence on the
cognitive and affective response. In addition, two independent-sample t-tests were
used to conclude if there are any significant differences in male and female
Generation Y students‟ impulse buying behaviour. The next chapter, Chapter 5,
presents the summary, conclusion and recommendations for the study.
Chapter 5: Summary, conclusions and recommendations 91
CHAPTER 5
SUMMARY, CONCLUSIONS AND RECOMMENDATIONS
5.1 INTRODUCTION
This chapter provides an assessment of the attainment of the study‟s objectives. It
commences with an overview of the study (Section 5.2) followed by the main findings
of the study (Section 5.3) and recommendations (Section 5.4) based on the findings
of the study. Section 5.5 includes a detailed discussion on the contributions of the
study. Section 5.6 provides an overview of the limitations and future research
opportunities. Lastly, Section 5.7 presents with the concluding remarks for the study.
5.2 OVERVIEW OF THE STUDY
For the purpose of providing impartial recommendations, contributions to the study
and future research opportunities, it is essential to discuss the insights gained over
the previous four chapters.
Chapter 1 provided a brief introduction to the study (Section 1.1). Followed by the
problem statement (Section 1.2), which provided motivation for the need to conduct
this study in South Africa, amongst Generation Y students.
Accordingly, the primary objective of this study was formulated to determine the
factors that influence impulse buying behaviour of South African Generation Y
students, in order to guide the formation of marketing strategies for effectively
targeting this market.
In order to achieve the primary objective, the following theoretical objectives were
formulated and examined in the literature:
Review the literature on consumer behaviour definition and the decision
making process.
Review the literature on impulse buying definition, impulse buying
definition, impulse buying process, types of impulse buying and levels of
involvement.
Chapter 5: Summary, conclusions and recommendations 92
Review the literature regarding the factors that influence impulse buying
behaviour.
Review the literature pertaining to the characteristics of the Generation Y
cohort.
In accordance with the primary objective of the study, the following empirical
objectives were formulated:
Determine whether the external factors of in-store atmosphere, in-store
browsing, in-store layout, salespersons, promotions and reference groups‟
influence Generation Y students‟ cognitive response to buy on impulse.
Determine whether the external factors of in-store atmosphere, in-store
browsing, in-store layout, salespersons, promotions and reference groups‟
influence Generation Y students‟ affective response to buy on impulse.
Determine whether the situational factors of time availability and money
availability influence Generation Y students‟ cognitive response to buy on
impulse.
Determine whether the situational factors of time availability and money
availability influence Generation Y students‟ affective response to buy on
impulse.
Determine whether male and female Generation Y students differ in their
impulse buying behaviour.
Chapter 2 consists of the literature review, which addressed the theoretical
objectives of the study. Included in Chapter 2 is a discussion on consumer
behaviour, which included the definition of consumer behaviour (Section 2.2.1) and
the decision-making process (Section 2.2.2). The next section, named impulse
buying, includes the definition of impulse buying (Section 2.3.1), the impulse buying
process (Section 2.3.2), types of impulse buying (Section 2.3.3) and the levels of
involvement (Section 2.3.4). The factors influencing impulse buying behaviour
section is next, this section includes the internal factors (Section 2.4.1), external
factors (Section 2.4.2) and situational factors (Section 2.4.3) and demographic
factors (Section 2.4.4). Generation Y cohort was explained next (Section 2.5) as this
was the target market used for this study. A synopsis for the chapter was given
(Section 2.6).
Chapter 5: Summary, conclusions and recommendations 93
Chapter 3 consists of the research methodology utilised to achieve the empirical
objectives of the study. This chapter included an overview of the research design
(Section 3.2), the research approach (Section 3.3), the sampling strategy, which
includes the target population, sampling frame, method of sampling and sample size
(Section 3.4), the data collection method, which includes the questionnaire design,
format and layout (Section 3.5), the pre-testing of the questionnaire (Section 3.6), the
administration of the questionnaire for the main study (Section 3.7), the data
preparation (Section 3.8), the statistical analysis, which includes confirmatory factor
analysis, the reliability, validity, descriptive statistics, correlation analysis and
significance tests (Section 3.9) and lastly, the synopsis was given for the chapter
(Section 3.10).
Chapter 4 consists of the analysis and interpretation of the empirical findings for the
study. This chapter is utilised to achieve the empirical objectives of the study
(Section 1.3.3). Since much of the findings of Chapter 4 constitute the main findings
of this study, they are discussed in the following section.
5.3 MAIN FINDINGS OF THE STUDY
The main findings obtained from this study, in accordance with the empirical
objectives of the study, are discussed below:
5.3.1 External factors of in-store atmosphere, in-store browsing,
salespersons, promotions and reference groups’ that influence
Generation Y students’ cognitive response to buy on impulse
To determine the first empirical objective set out in Chapter 1, regression analysis
was conducted. While most of the external variables have a positive influence on the
cognitive response dimension of impulse purchasing, in-store browsing and
reference groups negatively affect this dimension. In the case of in-store browsing,
this negative influence is also significant. This suggests that members of the
Generation Y cohort are less likely to purchase goods impulsively when they spend
time browsing the goods on display in a retail outlet. In terms of the external factors
that do have a positive effect on cognitive response, while salespersons (β=0.021,
p=0.705>0.05), do not have a statistically positive influence towards Generation Y
students‟ cognitive response to buying on impulse, in-store atmosphere (β=0.121,
Chapter 5: Summary, conclusions and recommendations 94
p=0.031<0.05) and promotions (β=0.145, p=0.010<0.05) have a statistically positive
influence. The coefficient of multiple determination (R2) was 0.070 that indicates that
approximately seven percent of the variance in Generation Y students‟ cognitive
response to buy on impulse can be predicted by in-store atmosphere, in-store
browsing and promotions, which suggests that other external variables influence on
Generation Y students‟ cognitive response to buy on impulse. Therefore, while the
null hypothesis, Ho1, for salespersons and reference groups are concluded, the null
hypothesis, Ho1, is rejected for in-store atmosphere, in-store browsing and
promotions, and the alternative hypothesis, Ha1, concluded; that is, in-store
atmosphere, in-store browsing and promotions does significantly influence
Generation Y students‟ cognitive response to impulse buying.
These findings confirm the findings of previous research studies. Previous research
indicated that salespersons and reference groups do not affect the cognitive
response. Gandhi et al. (2014) determined that a salesperson or reference group
does not persuade the consumer to buy on impulse, as some consumers only need
a salesperson or reference groups when they are specifically looking for something,
or to want an opinion on a certain item. Therefore, this leads to consumers already
having a plan of action and not a mind set for unplanned purchases.
5.3.2 External factors of in-store atmosphere, in-store browsing,
salespersons, promotions and reference groups’ that influence
Generation Y students’ affective response to buy on impulse
To determine the second empirical objective set out in Chapter 1, regression
analysis was conducted to address this objective. Salespersons do not have a
statistically significant positive influence towards Generation Y students‟ affective
response to buying on impulse, in-store atmosphere, in-store browsing, promotions
and reference groups have a statistically significant positive influence. The
coefficient of multiple determination (R2) was 0.424, which indicates that
approximately 42.4 percent of the variance in Generation Y students‟ affective
response to buy on impulse can be predicted by in-store atmosphere, in-store
browsing, promotions and reference groups. Therefore, while the null hypothesis,
Ho2, for salespersons are concluded, the null hypothesis, Ho2, is rejected for in-store
atmosphere, in-store browsing, promotions and reference groups and the alternative
Chapter 5: Summary, conclusions and recommendations 95
hypothesis, Ha2, concluded; that is, in-store atmosphere, in-store browsing,
promotions and reference groups does significantly influence Generation Y students‟
affective response to impulse buying.
The findings of this study confirm the findings of previous research studies. Previous
research studies indicate that in-store atmosphere, in-store browsing, reference
groups and promotions do have a significant influence on the affective response. Xu
(2007) determined that the store environments (atmosphere and browsing) influence
the consumer‟s emotional state. Kaur and Singh (2007) concur and state that the
atmosphere of the store plays an important role in the impulse buying activity.
Karbasivar and Yarahmadi (2011) stated that promotions do have a positive
influence on a consumer‟s emotional response. Cho et al. (2014) state that when
others accompany consumers during a shopping trip, they can become persuasive
and encouraging buying an item that was originally not on the list, as this influences
the emotional responses of consumer‟s. However, the findings of this study
contradict with those of Yu and Bastin (2010). Yu and Bastin (2010) determined that
salespersons do have a significant influence on the affective response. Research by
Yu and Bastin (2010) found that when the service of a salesperson is helpful and
they are dedicated they bring up feelings of comfort for consumers, which makes
them delighted in the shopping trip. As explained in Section 5.3.2, reference groups
do not have an influence (Gandhi et al. 2014).
5.3.3 Situational factors of time availability and money availability that
influence Generation Y students’ cognitive response to buy on impulse
To determine the third empirical objective set out in Chapter 1, regression analysis
was conducted to address this objective. time availability (β=0.011, p=0.836>0.05)
has a positive influence on cognitive response and money availability (β=-0.070,
p=0.199>0.05) has a negative influence, neither of these influences are significant
do not have a statistically positive influence towards Generation Y students‟ cognitive
response to buying on impulse. The coefficient of multiple determination (R2) was
0.001 that indicates that approximately 0.1 percent of the variance in Generation Y
students‟ cognitive response to buy on impulse, which suggests that other situational
variables influence on Generation Y students‟ cognitive response to buy in impulse.
Chapter 5: Summary, conclusions and recommendations 96
Therefore, the null hypothesis, Ho3, time availability and money availability are
concluded.
The findings of this study confirm the findings of previous research studies. Previous
research studies indicate that the time and money availability do not influence the
cognitive response. Maymand and Ahmadinejad (2011) confirmed that time and
money availability does not influence the cognitive response. This is due to the
cognitive response involving planning and thinking of what should be purchased,
without the availability of money or time, the chances of making unplanned
purchases is non-existent.
5.3.4 Situational factors of time availability and money availability that
influence Generation Y students’ affective response to buy on impulse
To determine the fourth empirical objective set out in Chapter 1, regression analysis
was conducted to address this objective. As indicated in Table 4.13, time availability
and money availability do have a statistically significant positive influence towards
Generation Y students‟ affective response to buying on impulse. The coefficient of
multiple determination (R2) was 0.136 that indicates that approximately 13.6 percent
of the variance in Generation Y students‟ affective response to buy on impulse can
be predicted by time availability and money availability, which suggests that other
situational variables influence Generation Y students‟ affective response to buy on
impulse. Therefore, the null hypothesis, Ho4, is rejected for time availability and
money availability and the alternative hypothesis, Ha4, concluded time availability
and money availability does significantly influence Generation Y students‟ cognitive
response to impulse buying.
The findings of this study confirm the findings or previous research studies. Previous
research studies indicate that the time and money availability do influence the
affective response. Jeffery and Hodge (2007) determined that the more time
available the more chance of seeing an item, which could trigger the affective
response to buy on impulse. Foroughi et al. (2012) opined that the more money
available the more it will influence a consumer‟s mood positively.
Chapter 5: Summary, conclusions and recommendations 97
5.3.5 Gender differences concerning Generation Y students impulse buying
behaviour
To determine the fifth empirical objective set out in Chapter 1, a two independent-
sample t-test was conducted. A p-value of p= 0.000<0.05 was calculated on five of
the nine constructs between male and female students‟ impulse buying behaviour.
Therefore, for affective response (p=0.050<0.05), in-store atmosphere
(p=0.016<0.05), in-store browsing (p=0.046<0.05), promotions (p=0.004<0.05) and
reference groups (p=0.004<0.05), Ho5 is rejected and its alternative, Ha5 concluded;
that is, Generation Y female students have a significantly higher response to buying
on impulse compared to their male counterparts. In terms of cognitive response
(p=0.212>0.05), salespersons (p=0.243>0.05), time availability (p=0.147>0.05) and
money availability (p=0.065>0.05) there is no significant difference between male
and female Generation Y students, for these constructs, there is insufficient evidence
to reject Ho5.
The findings of this study confirm the findings of previous research studies. Previous
research studies indicate that gender does influence impulse buying behaviour.
Coley and Burgess (2003) indicate that gender does play a significant role and that
females are more impulsive buyers than males. However, Sharma (2012) states that
although gender does have a significant role, males are more impulse buyers than
females.
The next section discusses the recommendations for the study.
5.4 RECOMMENDATIONS
The following recommendations are based on the literature review (Chapter 2), along
with the empirical objectives (Chapter 1) concluded from South African Generation Y
students sample concerning factors influencing impulse buying behaviour. As well as
those emanating from the findings of this study, the following recommendations are
offered.
Chapter 5: Summary, conclusions and recommendations 98
5.4.1 Utilise impulse buying behaviour of the consumer
A consumer‟s internal differences concerning an impulsive act may be regarded as
the most influential when purchasing on impulse. Personality-related factors are
characteristics of the consumer rather than the shopping environment, which can
influence impulse buying behaviour. This leads the business utilising the
characteristics of the consumer to influence them to a minor extent, but cannot
control them completely. Impulse buying behaviour symbolises the consumers
internal characteristics that make the consumer engage in impulse buying. The
consumer experiences the impulsive urge during the shopping trip and not the
product. When a consumer has a tendency to engage in impulse shopping, the
concept is referring to as the buying impulsiveness trait.
The consumer‟s emotional state (affective response) and personality traits (cognitive
response) are trigged by external factors to buy on impulse. In the presence of
others, the consumer‟s senses are stimulated, due to the physical environment, the
atmosphere, or the product itself (considered external and situational factors).
Based on the above assumptions, marketers need to keep this in mind when
targeting Generation Y students. Although external and situational factors trigger
Generation Y students impulse buying behaviour, their emotions and personality
characteristic should be examined carefully as this will ultimately guide them in their
impulsive purchases. The affective response is associated with feelings of
excitement and urges to buy. The affective response reflects irresistible desire to
buy, positive buying emotions and mood management. Marketers and businesses
should promote low involvement products like food and drink items to trigger
Generation Y student‟s affective response, as these items are easily accessible. The
cognitive response is related to lack of planning in association with purchase
decisions. The cognitive response refers to mental structures and processes
involved in thinking, understanding and interpreting. Cognitive response consists of
person‟s cognition, knowledge and perceptions acquired by combination of direct
experience with attitude object. Marketers and businesses should promote high
involvement products like laptops to trigger Generation Y student‟s cognitive
response; as such, items have to be thought about.
Chapter 5: Summary, conclusions and recommendations 99
5.4.2 Utilise external factors to influence impulse buying behaviour
External factors are defined as factors implemented by marketers and storeowners
to entice consumers into a purchasing behaviour by placing marketing cues. External
factors are associated with the shopping and marketing environment. The shopping
environments include the stores ambience, size and design formats, while the
marketing environments entail various sales promotions. Unlike internal factors,
external factors are controlled by the marketers or storeowners to motivate impulse
buying behaviour. A consumer can buy on impulse when a consumer encounters a
visual stimulus in the store, or some potential stimuli placed by the marketer or
storeowner. External factors are independent variables; they are outside of the
consumer‟s control. These factors include in-store atmosphere, in-store browsing,
salespersons, promotions and reference groups.
In-store browsing entails the ambience, background music and scent of the shops.
In-store browsing entails the paths travelled in the store, the amount of time looking
at items in the store and the longer Generation Y students wander once inside the
store. Salespersons entail good service, communication skills, convincing
recommendations and friendliness. Promotions entail good price deals, buy one get
one free deals, free gifts and items on sale. Reference groups entail companionship
on the shopping trip, friends and family.
Based on the statistical analysis done in this study, marketers and businesses
should focus on in-store atmosphere, in-store browsing, promotions and reference
groups influencing Generation Y students‟ affective response. These constructs
influencing the affective response are the most important amongst Generation Y
students as these constructs presented the highest percentage. This means that
Generation Y students make a decision based on their emotions. When a store has
pleasant music and is presentable, the Generation Y students‟ mood can change to
a positive one, therefore, can increase the chance of an impulsive purchase. When
Generation Y students see promotions in the store, their emotions are positive, as
they do not want to miss out this opportunity, therefore, engage in impulsive
purchases. Marketers and businesses should also focus on in-store browsing
influencing Generation Y students‟ affective response. This means that when
Generation Y students are in an emotional state or in a particular mood the more
Chapter 5: Summary, conclusions and recommendations 100
time they will travel the paths of the store, or increase the amount of time looking at
items or wandering longer inside the store (for example, purchase chocolates when
feeling down). Often, shopping relieves a consumers‟ emotional state. Lastly,
marketers and retailers should find ways to encourage Generation Y students‟ to
shop with companions (regarded as family members and friends). Family members
and friends influence the Generation Y students‟ buying decisions emotionally.
5.4.3 Utilise situational factors to influence impulse buying behaviour
Situational factors entail all the factors that are related to the time and place of
observation. When the consumer buys on impulse, the situational factors originate
from the store environment. The situational factors such a time availability moderates
the relationship between the store environment and the consumer‟s impulsiveness.
The consumer‟s available time and impulse buying tendency positively affect in-store
browsing. Different aspects of the product encountered in the store, could affect
impulse buying. Factors such as the time pressure, the consumers‟ financial position,
emotional state and social visibility assist in the feeling of buying on impulse.
Time availability entails the time available to make unplanned purchases, a lot of
time available for the shopping trip and being rushed for time. Money availability
entails being able to afford unplanned purchases, always being on a tight budget or
having extra money to splurge a little.
Based on the statistical analysis done in this study, marketers and businesses
should focus on time availability and money availability influencing Generation Y
student‟s affective response. This means that the more time and spending power
Generation Y students have the more chance to browse the shops, which affects
their affective response. This means that Generation Y students will struggle to
control their urge to buy items, because they will have the available time and money
to make unplanned purchases.
5.4.4 Utilise similar appeal to target Generation Y males and females
Previous research indicates that gender plays an important role in targeting
consumers in impulse buying. Generally, it was determined that more females are
Chapter 5: Summary, conclusions and recommendations 101
impulsive buyers than males. As indicated in the statistical analysis done in Chapter
4, the mean for females was higher than that for males, indicating that the females
responded higher to the questions asked. Gender had a significant influence on the
affective response, in-store atmosphere, in-store browsing, promotions, reference
groups; however, gender had no significant influence on the cognitive response,
salespersons, time avaliability and money availability. This suggests that females are
more prone to be influenced than males. Therefore, marketers and retailers could
use the emotions of the female students, promotions, reference groups, in-store
atmosphere and in-store browsing to target female Generation Y students to
increase their sales.
5.5 CONTRIBUTIONS OF THE STUDY
Over time, retailers are conducting more research to understand what factors
influence impulse buying behaviour. Retailers are then using this valuable
information and adapting their stores to increase impulse buying, which increases
revenue. Accordingly, it is crucial for retailers to gain a competitive advantage by
implementing different marketing strategies that attract consumers.
The main contribution of this study is the identification of the factors that influence
impulse buying behaviour of Generation Y students in South Africa, which retailers
could use to design appropriate marketing strategies to increase revenue by
targeting Generation Y students. The study has found that in-store browsing,
promotions and reference groups influencing the affective response are the most
influential factors that could trigger Generation Y students` impulse buying
behaviour. This study was the first of its kind conducted in South Africa, which
answers questions some retailers might be interested in knowing.
Furthermore, findings from this study contribute to the growing body of research on
consumer shopping behaviour literature by giving light to factors influencing impulse
buying behaviour amongst Generation Y students. This study may assist in helping
marketers, retailers and research academics gain a better understanding of the
impulse buying behaviour phenomenon amongst Generation Y students.
The next section discusses the limitations and future research opportunities for the
study.
Chapter 5: Summary, conclusions and recommendations 102
5.6 LIMITATIONS AND FUTURE RESEARCH OPPORTUNITIES
Like all academic studies, this study also has its own limitations that could suggest
new opportunities for future research.
This study utilised only a quantitative approach in conducting the research.
Determining exactly what factors influence impulse buying behaviour by means of
the survey method is difficult. If Generation Y students were aware of their
responses to various shopping situations in the environment of a shop, the influence
of different factors could have been examined directly. Therefore, a combination of
quantitative and qualitative (for example, observation method) is recommended.
Another limitation of the study is it only focused on two HEIs in one province.
Therefore, there is an opportunity to conduct this research on a wider scale,
including other HEIs within other provinces. This will result in more accurate findings
and comparisons can be made throughout South Africa‟s HEIs.
Only using Generation Y students, aged 18 to 24 years of age, also limited the study.
An older generation (30-50) could be targeted to establish what factors of impulse
buying would influence them when shopping. The income of this age group would be
higher than that of Generation Y students; therefore, more purchases that are
impulsive can be made.
Another limitation of the study is that it only focused on using full-time undergraduate
students. This provides an opportunity for future research, as studies could be
conducted to determine part-time and postgraduate students` impulse buying
behaviours.
Previous studies indicate that credit cards can play a major role in impulse buying
behaviour. This study did not consider the effect credit cards have on impulse buying
behaviour. This provides an opportunity to determine whether credit cards could be a
factor influencing impulse buying behaviour.
The next section provides concluding remarks for this study.
Chapter 5: Summary, conclusions and recommendations 103
5.7 CONCLUDING REMARKS
This study explained the factors influencing impulse buying behaviour amongst
Generation Y students. The results revealed crucial information regarding the
influential factors. The most influential constructs that could influence Generation Y
students‟ impulse buying behaviour are in-store atmosphere, in-store browsing,
promotions and reference groups. This study could improve retailers‟ success
amongst the Generation Y students.
Despite the limitations stated in Section 5.6, the main aim of identifying the factors
influencing impulse buying behaviour amongst Generation Y students was achieved.
This study adds value to the knowledge of Generation Y decision making in South
Africa. Additionally, marketers and retailers who want to improve their marketing
campaign, retail environment and understanding of Generation Y students‟ impulse
behaviour will benefit from this study.
Refernece List 104
REFERENCE LIST
Aaker, D.A., Kumar, V., George. S.D. & Robert, P.L. 2011. Marketing research.
10th ed. Hoboken, NJ: Wiley.
Abbas, A. & Bashir, B. 2015. Impact of cognitive and affective process of decision
making on impulse purchase. Institute of Business and Management, 27(1):467-
473.
Acar, A.B. 2014. Do intrinsic and extrinsic motivation factors different for
Generation X and Generation Y? International Journal of Business and Social
Science, 5(5):12-20.
Ahuja, D. 2015. Making the pulse impulsive: a study of factors resulting impulse
buying. International Association of Scientific Innovation and Research (IASIR),
13(1):50-52.
Al-Tarawneh, H.A. 2012. The main factors beyond decision making. Journal of
Management Research, 4(1):1-23.
Anon(a). 2005. Chapter 3: Consumer behaviour and target audience decisions.
http://www.yumpu.com/en/document/view/10434510/consumer-behaviour-and-
target-audiience-decisions Date of access: 23 August 2016.
Applebaum, W. 1951. Studying consumer behaviour in retail stores. Journal of
Marketing, 16:172-178.
Badgaiyan, A.J. & Verma, A. 2015. Does urge to buy impulsively differ from
impulsive buying behaviour? Assessing the impact of situational factors. Journal of
Retailing and Consumer Services, 22:145-157.
Bakewell, C. & Mitchell, V.W. 2003. Generation Y female consumer decision
making styles. International Journal of Retail & Distribution Management, 131(2):95-
106.
Refernece List 105
Banat, A. & Wandebori, H. 2012. Store design and store atmosphere effect on
customer sales per visit. Second International Conference on Business, Economics,
Management and Behavioural Sciences, 13(14):84-89.
Bayley, G. & Nancarrow, C. 1998. Impulse purchasing: a qualitative exploration of
the phenomenon. Qualitative Market Research: An International Journal, 1(2):99-
114.
Beatty, S.E. & Ferrell, M.E. 1998. Impulse buying: modelling its precursors. Journal
of Retailing, 74(2):169-191.
Belk, R.W. 1975. Situational variables and consumer behaviour. Journal of
Consumer Research, 2(3):157-164.
Beri, G.C. 2013. Marketing research. 5th ed. New Delhi: Tata McGraw-Hill.
Berndt, A. & Petzer, D. 2011. Marketing research. Cape Town, SA: Pearson.
Bessouh, N., Iznasni, A. & Benhabib, A. 2015. Factors influencing impulse buying
of Algerian shoppers. International Journal of Science and Research, 4(3):860-866.
Best, S. & Kellner, D. 2003. Contemporary youth and the postmodern adventure.
The review of Education, Pedagogy and Cultural Studies, 25:75-93.
BetaBait. 2013. Impulse buying shopping fact sheet. http://www.betabait.com/the-
impulse-shoppoing-fact-sheet/ Date of access: 8 February 2016.
Bettman, J.R., Luce, M.F. & Payne, J.W. 1998. Constructive consumer choice
processes. Journal of consumer research, 25(3):187-217.
Bhatt, S.J. & Pandya, K. 2015. A study on impulse buying behaviour of customer of
Anand in shopping malls with reference to Big Bazar and D-mart. International
Journal of Retailing and Rural Business perspectives, 4(3):1781-1787.
Bink, L. 2010. The effect of in-store promotions and personal traits on impulse
buying concerning low involvement products. University Van Tilburg. (Thesis-PhD).
Refernece List 106
Bitner, M.J. 1992. The impact of physical surroundings on customers and
employees. The Journal of Marketing, 56(2):57-71.
Brace, N., Kemp, R. & Snelgar, R. 2012. SPSS for psychologists. 5th ed. United
Kingdom: Palgrave Macmillan
Bradley, N. 2013. Marketing research: tools & techniques. 3rd ed. Oxford, UK:
Oxford University Press.
Branchik, B.J. 2010. Silver dollars: the development of the US elderly market
segment. Journal of Historic Research in Marketing, 2(2):174-189.
Brodén, A. & Sőderberg, C. 2011. Impulse buying, reasons why and consumer
electronics, oh my! University of Gothenburg. (Thesis-Bachelors).
Brosekhan, A.A., Velayutham, C.M. & Phil, M. 2013. Consumer behaviour – a
literature review. Journal of Business and Management, 1:8-16.
Brown, L.O. 2008. Market research and analysis. Chicago: Wildside Press.
Burns, A.C. Bush, R.F. 2010. Marketing research. 6th ed. Upper Saddle River,
NJ: Prentice Hall.
Burns, A.C. & Bush, R.F. 2014. Marketing research. 7th ed. Essex, England:
Pearson Education Limited.
Butkeviciene, V., Stravinskiene, J. & Rutelione, A. 2008. Impact of consumer
package communication on consumer decision making process. Engineering
Economics, 1:57-65.
Cambridge University Press. 2016. “Salesperson definition”.
http://www.dictionary.cambridge.org/dictionary/english/salesperson Date of
Access: 22 August 2016.
Cant, M., Gerber-Nel, C., Nel, D. & Kotzé, T. 2003. Marketing research. Claremont,
SA: New African Books.
Refernece List 107
Cant, M.C., Strydom, J.W., Jooste, C.J. & du Plessis, P.J. 2009. Marketing
management. 5th ed. Cape Town, SA: Juta and company Ltd.
Chang, H., Eckman, M. & Yan, R. 2011. Application of the stimulus- organism-
response model to the retail environment: the role of hedonic motivation in impulse
buying behaviour, 21(3):233-249.
Chang, H.J., Yan, R.N. & Eckman, M. 2014. Moderating effects of situational
characteristics on impulse buying. International Journal of Retail & Distribution
Management, 42(4):298-314.
Chapman, C. & Feit, E.M. 2015. R for marketing research and analytics.
Switzerland: Springer International Publishing.
Chen, T. 2008. Impulse purchase varied by products and marketing channels.
Journal of International Management Studies, 1:154-161.
Chisnall, P.M. 1992. Marketing research. 4th ed. England, London: McGraw-Hill
Marketing Series.
Cho, J., Ching, G.S. & Luong, T. 2014. Impulse buying behaviour of Vietnamese
consumers in supermarket setting. International Journal of Research Studies in
Management, 3(2):33-50.
Churchill, G.A. & Peter, J.P. 1998. Marketing: creating value for customers.
Boston: Irwin McGraw-Hill.
Clark, L.A. & Watson, D. 1995. Constructing validity: basic issues in objective scale
development. Psychological assessment, 7(3):309-319.
Clover, V.T. 1950. Relative importance of impulse buying in retail stores. Journal of
Marketing, 25:66-70.
Clow, K.E. & James, K.E. 2014. Essentials of marketing research: putting research
into practice. Thousand Oaks, California: Sage.
Coley, A. & Burgess, B. 2003. Gender differences in cognitive and affective impulse
buying. Journal of Fashion Marketing & Management, 32(3):29-39.
Refernece List 108
Croft, W. 2003. Typology and Universals. 2nd ed. United Kingdom: Cambridge
University Press.
Daly, F., Hand, D.J., Jones, M.C., Lunn, A.D. & McConway, K.J. 1995. Elements of
statistics. England: Addison-Wesley.
Dawson, S. & Kim, M. 2009. External and internal trigger cues of impulse buying
online. Direct Marketing: An International Journal, 3(1):20-34.
Das, S.P. & Das, S.S. 2015. Impact of visual merchandising on consumers impulse
buying behaviour. The International Journal of Business and Management,
3(12):188-201.
Dholakia, U.M. 2000. Temptations and resistance: an integrated model of
consumption impulse formation and enactment. Psychology & Marketing,
17(11):955-982.
Dictionary.com, LLC. 2016. “Desire definition”.
http://www.dictionary.com/browse/desire Date of Access: 22 August 2016.
Dincer, C. 2010. The influence of affect and cognition on impulse buying behaviour.
Social Responsibility Journal, 1:153-158.
Donavan, R.J. & Rossiter, J.R. 1982. Store atmosphere: an environmental
psychology approach. Journal of Retailing, 58(1):34-57.
Donmez, D.O. 2011. Consumer information search and decision making process in
the video gaming market. Aarhus: Aarhus University. (Master-Thesis).
Duarte, P., Raposo, M. & Ferraz, M. 2013. Drivers of snack foods impulse buying
behaviour among young consumers. British Food Journal, 115(9):1233-1254.
Ebitu, E.T. 2015. Impulse buying behaviour and demographic analysis among
university of Calabar students, Nigeria. Journal of Marketing and Consumer
Research, 17:42-48.
Engel, J.F., Blackwell, R.D. & Miniard, P.W. 1995. Consumer behaviour. 5th ed.
Wisconsin, Madison: Dryden Press.
Refernece List 109
Eroglu, S.A. & Machleit, K.A. 1993. Atmospheric factors in the retail environment:
sights, sound and smells. Advances in Consumer Research, 20:34.
Faizal, S. & Radha, S. 2014. Impact of visual merchandising on consumer buying
behaviour in hypermarkets. Intercontinental Journal of Marketing Research Review,
2(5):77-858.
Feltham, T.S. 1998. Leaving home: brand purchase influences on young adults.
Journal of Consumer Marketing, 15(4):372-385.
Field, A. 2009. Discovering statistics using SPSS. 3rd ed. London: Sage
Publications Ltd.
Foroughi, A., Buang, N.A. & Sadeghi, R.H.M. 2012. Explaining the influence of
situational factors (money & time available) on impulse buying behaviour among
different ethics. International Journal of Fundamental Psychology & Social Science,
2(2):41-44.
Gamage, D.N.W., Wickramasingha, Y.M. & Henegedara, G.M. 2008. Factors
influencing impulse buying behaviour of rural people. Research and Training
Institute, 1:1-2.
Gandhi, A., Vajpayee, A. & Gautam, D. 2014. A study of impulse buying behaviour
and factors influencing it with reference to beverage products in retail stores.
Journal of Symobiosis Institute of Business Administration 8:1-17.
Gehrt, K.C. & Yan, R.N. 2004. Situational, consumer, and retailer factors affecting
internet, catalog, and store shopping. International Journal of Retail & Distribution
Mangement, 32(1):5-18.
Gilbert, A. & Churchill, Jr. 1996. Basic marketing research. 3rd ed. Orlando, FL:
The Dryden Press.
Gupta, S.L. 2003. Marketing research. New Delhi: Excel books.
Hadjali, H.R., Salimi, M., Nazari, M. & Ardestani, M.S. 2012. Exploring main factors
affecting on impulse buying behaviours. Journal of American Science, 8(1):245-251.
Refernece List 110
Hair, J.F., Bush, R.P. & Ortinau, D.J. 2003. Marketing research: within a changing
information environment. 2nd ed. New York, NY: McGraw-Hill.
Hair, J.F., Wolfinbarger, M., Ortinau, D.J. & Bush, R.P. 2008. Essentials of
marketing research. New York, NY: McGraw-Hill.
Hair, J.F., Celsi, M.W., Ortinau, D.J. & Bush, R.P. 2013. Essentials of marketing
research. 3rd ed. New York, NY: McGraw-Hill.
Hamilton, L. 2010. The influence of culture on students‟ impulse buying behaviour
in the Vaal Triangle. Vanderbijlpark: North West University. (Dissertation-Masters).
Harper, W.M. 1991. Statistics (the M&E handbook series). 6th ed. UK: Financial
Times Prentice Hall.
Hausman, A. 2000. A multi-method investigation of consumer motivations in
impulse buying behaviour. Journal of Consumer Marketing, 17(5):403-426.
Hawkins, D.I., Best, R.J. & Coney, K.A. 2001. Consumer behaviour: building
marketing strategies. 9th ed. Boston: Irwin McGraw-Hill.
Hawkins, D.I., Mothersbaugh, D.L. & Best, R.J. 2007. Consumer behaviour:
building marketing strategies. 10th ed. Pennsylvania: McGraw-Hill/Irwin.
Hoch, S.J. & Loewenstein, G.F. 1991. Time-inconsistent, preferences and
consumer self-control. Journal of Consumer Research, 17:492-507.
Hodge, R. 2004. Factors influencing impulse buying during an online purchase
transaction. Canada: University of Waterloo. (Thesis-Masters of Science).
Hubrechts, L. & Koktürk, B. 2012. Effects of visual merchandising on young
consumer‟s impulse buying behaviour. University of Halmstad. (Thesis-Bachelor).
Huizingh, E. 2007. Applied statistics with SPSS. Thousand Oaks, CA: Sage.
Hussain, R. & Ali, M. 2015. Effect of store atmosphere on consumer purchase
intention. International Journal of Marketing Studies, 7(2):35-43.
Iacobucci, D. 2013. MM4. Student edition. South-Western: Cengage Learning.
Refernece List 111
Iacobucci, D. & Churchill, G.A. 2010. Marketing research: methodological
foundations. 10th ed. South-Western: Cengage Learning.
Ijaz, M.F., Rhee, J., Lee, Y. & Alfian, G. 2014. Efficient digital signage layout as a
replacement to virtual store layout. International Journal of Information and
Electronics Engineering, 4(4):312-316.
Jamal, M. & Lodhi, S. 2015. Consumer shopping behaviour in relation to factors
influencing impulse buying: a case of superstores in Karachi, Pakistan. European
Journal of Business and Management, 7(31):30-46.
Jeffery, S.A. & Hodge, R. 2007. Factors influencing impulse buying during an online
purchase. Electronic Commerce Research, 1:367-379.
Jide-Akinwale, E. 2013. Influence of socialisation agents on Generation Y students‟
apparel purchasing intentions. Vanderbijlpark: North West University. (Dissertation-
Masters).
Jones, M.A. 1999. Entertaining shopping experiences: an exploratory investigation.
Journal of Retailing and Consumer Services, 6:129-139.
Joubert, P. 2010. Introduction to consumer behaviour. Cape Town, SA: Juta.
Kacen, J.J. & Lee, J.A. 2002. The influence of culture on consumer impulsive
buying behavior. Journal of Consumer Psychology, 12(2):163-176.
Kalla, S.M. & Arora, A.P. 2011. Impulse buying: a literature review. Global Business
Review, 12(1):145-157.
Kannan, P. & Vinayagamoorthy, A. 2014. A study on influencing impulse buying
behaviour. International Journal of Management and Social Science research
review, 1(1):19-27.
Karbasivar, A. & Yarahmadi, H. 2011. Evaluating effective factors on consumer
impulse buying behaviour. Asian Journal of Business Management Studies,
2(4):174-181.
Refernece List 112
Kardes, F.R., Cronley, M.L. & Cline, T.W. 2011. Consumer behaviour: science and
practice. South-Western: Cengage Learning.
Kaur, P. & Singh, R. 2007. Uncovering retail shopping motives of indian youth.
Young Consumers, 8(2):128-138.
Khan, N., Hui, L.H., Chen, T.B. & Hoe, H.Y. 2016. Impulse buying behaviour of
Generation Y in fashion retail. International Journal of Business and Management,
11(1):144-151.
Khuong, M.N. & Tran, T.B. 2015. Factors affecting impulse buying toward fashion
products in Ho Chi Minh City – a mediation analysis of hedonic purchase.
International Journal of Trade, Economics, and Finance, 6(4):223-229.
Kilber, J., Barclay, A. & Ohmer, D. 2014. Seven tips for managing Generation Y.
Journal of Management Policy and Practice, 15(4):80-91.
Kim, J. 2003. College students‟ apparel impulse buying behaviours in relation to
visual merchandising. Athens, Georgia: University of Georgia. (Thesis-Masters of
Science).
Kim, M.G. & Mattila, A.S. 2010. The impact of mood states and surprise cues on
satisfaction. International Journal of Hospitality Management, 29:432-436.
Kolb, B. 2008. Marketing research: a practical approach. London: Sage.
Kotler,P. 2000. Marketing management millennium edition. 10th ed. Upper Saddle
River, NJ: Prentice-Hall.
Kumar, S.R. 2007. Marketing and branding. Bangalore, India: Pearson Education.
Lamb, C.W., Hair, J.F & McDaniel, C. 2009. Marketing 2. Student edition. Mason,
OH: Cengage Learning.
Levy, M. & Weitz, B.A. 1998. Retailing management. 3rd ed. Wisconsin, Madison:
Irwin McGraw-Hill.
Levy, M. & Wietz, B.A. 2011. Retailing management. 8th ed. Wisconsin, Madison:
McGraw-Hill/Irwin.
Refernece List 113
Li, C. 2010. A facility layout design methodology for retail environments. University
of Pittsburgh. (Dissertation-PhD).
Lunenburg,F.C. 2010. The decision making process. National Forum of Educational
Administration and Supervision Journal, 27(4):1-12.
Luo, X.M. 2004. Group dynamics of impulse buying: an extended social facilitation
perspective. Advances in Consumer Research, 31:431.
Mäkinen, T. 2015. Customer‟s buying behaviour. Jamk University of Applied
Sciences. (Thesis-PhD).
Maclinnis, D.J. & Price, L.L. 1987. The role of imagery in information processing:
review and extension. Journal of Consumer Research, 13:473-491.
Malhotra, N.K. 2010. Marketing research: an applied orientation. 6th ed. Upper
Saddle River, NJ: Pearson Education.
Malhotra, N.K. 2015. Essentials of marketing research: a hands-on orientation.
Essex, England: Pearson Education.
Markert, J. 2004. Demographics of age: generational and cohort confusion. Journal
of current issues and research in advertising, 26(2):11-25.
Marketing Teacher. 2016. “Different generations”.
http://www.marketingteacher.com/the-six-living-generations-in-amerca Date of
Access: 22 August 2016.
Masudin, I. & Fuadi, M. 2014. Store layout for virtual retailing: a literature review.
Journal of Marketing Industry, 13(2):141-148.
Mattila, A.S. & Wirtz, F. 2001. Congruency of scent and music as a driver of in-
store evaluations and behaviour. Journal of retailing, 77(2):273-289.
Maymand, M.M. & Ahmadinejad, M. 2011. Impulse buying: the role of store
environmental stimulation and situational factors (an empirical investigation). African
Journal of Business Management, 5(34):13057-13065.
Refernece List 114
McDaniel, C. & Gates, R. 1999. Contemporary marketing research. 4th ed.
Cinicinnati, Ohio: South-Western College Publishing.
McDaniel, C. & Gates, R. 2007. Marketing research. 7th ed. Hoboken, NJ: Wiley.
MediaScope, Inc. 2013. How much money is spent on impulse buying.
http://mediascopeinc.wordpress.com/2013/03/20/impulse-buying/#comments Date of
access: 7 March 2016.
Mihic, M. & Kursan, I. 2010. Assessing the situational factors and impulsive buying
behaviour: market segmentation approach. Journal of Management, 15(2):47-66.
Mothapo, M.N. 2013. Importance of clothing brands on the purchasing decisions of
Generation Y in the Vaal Triangle area. Vanderbijlpark: North West University.
(Dissertation-Masters).
Munthiu, M.C. 2009. The buying decision process and types of buying decision
behaviour. Sibiu Alma Mater University Journals, 2(4):27-33.
Muruganantham, G. & Bhakat, R.S. 2013. A review of impulse buying behaviour.
International Journal of Marketing Studies, 5(3):149-160.
Nishanov, B. & Ahunjonov, U. 2016. The influence of store characteristics on
consumer‟s impulse buying behaviour. Journal of International Business Research
and Marketing, 1(3):20-26.
Noble, S.M., Haytko, D.L. & Phillips, J. 2009. What drives college age Generation Y
consumers. Journal of Business Research, 62:617-628.
Ohta, M. & Higuchi, Y. 2013. Study on the design of supermarket store layouts: the
principle of “sales magnet”. International Journal of Social, Behavioural,
Educational, Business and Industrial Engineering, 7(1):209-212.
Pallant, J. 2010. SPSS survival manual. 4th ed. London: Open University Press.
Pallant, J. 2013. SPSS survival manual: a step by step guide to data analysis using
IBM SPSS. 5th ed. New York, NY: Mc-Graw Hill.
Refernece List 115
Parboteeah, D.V. 2005. A model of online impulse buying: an empirical study.
Washington State University. (Dissertation-PhD).
Patil, P. & Agadi, R. 2016. Impact of visual merchandising on young customers‟
apparel impulse buying behaviour. International Journal of Advancement in
Engineering, Technology, Management & Applied Science, 3(1):187-199.
Piron, F. 1991. Defining impulse purchasing. Advances in Consumer Research,
18:509-514.
Prajapati, S.G. & Rathod, K.L. 2013. A study on impulse buying behaviour of
college students for branded apparels in Ahmedabad city. International Journal of
Management, 4(6):128-134.
Retief, M. 2012. Young South African consumers‟ impulse intentions toward visiting
pop-up stores. University of Pretoria. (Dissertation-Masters).
Rhorrami, M.S., Esfidani, M.D. & Delavari, S. 2015. The effect of situational factors
on impulse buying and compulsive buying: clothing. International Journal of
Management, Accounting and Economics, 2(8):823-837.
Rook, D.W. 1987. The buying impulse. Journal of Consumer Research, 14:189-
199.
Rook, D.W. & Fisher, R.J. 1995. Normative influences in impulsive buying
behaviour. Journal of Consumer Research, 22:305-313.
Rook, D.W. & Hoch, S.J. 1985. Consumer impulses. Advances in Consumer
Research, 12:23-27.
Rudani, R.B. 2013. Principles of management. New Delhi, India: McGraw Hill
Education.
Rutenberg, H. 2003. Factors affecting the preferences of the millennium generation
regarding convenience store. Johannesburg: University of Johannesburg.
(Dissertation-Masters).
Refernece List 116
Saarela, A., Stoorvogel, A. & Zinkweg, M. 2008. Buy now, think later. An insight on
impulse buying behaviour on the internet. Lund University. (Thesis-Masters).
Sahney, S. 2003. Module 1 – Consumer Behaviour. Vinod Gupta School of
Management, Indian Institute of Technology, Kharagpur, India, 1-15.
Salman, M., Khan, S. & Gul, M.S.A. 2014. Factors influencing impulse buying of
sports team merchandise in developing country: an empirical investigation. Pakistan
Journal of Commerce and Social Sciences, 8(1):185-200.
Samli, A.C. 1998. Strategic marketing for success in retailing. Connecticut,
London: Quorum Books.
Schiffman, L.G., Kanuk, L.L. & Wisenbilt, J. 2010. Consumer behaviour. 10th ed.
Upper Saddle River, NJ: Pearson Prentice Hall.
Sharma, K. 2012. Impact of affective and cognitive processes on impulse buying of
consumers. Rajkot: Saurashtra University. (thesis-PhD).
Sherry, J.F. 1990. A sociocultural analysis of a Midwestern flea market. Journal of
Consumer Research, 17:13-30.
Shivangunde, R.B., Shukla, R.K. & Mehrotra, V.S. 2012. Organised retailing: retail
store layout and design. Bopal: PSS Central Institution of Vocational Education.
Smith, S.M. & Albaum, G.S. 2010. An introduction to market research. Mexico:
Qualtrics.
Sokhela, P. 2015. Brand personality perceptions of luxury sedan motor vehicles
amongst the South African Generation Y cohort. North West University,
(Dissertation-Masters).
Solomon, M.R. 2013. Consumer behaviour: buying, having and being. 10th ed.
Boston, MA: Pearson Education.
Solomon, M., Bamossy, G., Alskegaard, S., & Hogg, M.K. 2006. Consumer
Behaviour: A European Perspective. 3rd ed. Upper Saddle River, NJ: Pearson
Prentice Hall.
Refernece List 117
Sowetan Live. 2014. 10 things you didn‟t know about student spending.
http://www.sowetanlive.co.za/news/business-news/2013/07/09/top-things-you-didn-t-
know-about-student-spending Date of access: 16 October 2016.
Statistics South Africa. 2016. Mid year population estimates 2016 South Africa.
http://www.statssa.gov.za/publications/P0302/P03022016.pdf Date of access: 16
October 2016.
Stern, H. 1962. The significance of impulse buying today. Journal of Marketing,
26(4):59-62.
Struwig, F.W. & Stead, G.B. 2010. Planning, designing and reporting research.
Cape Town: Pearson.
Strydom, J.W., Cant, M.C. & Jooste, C.J. 2000. Marketing management. 4th ed.
Cape Town, SA: Juta.
Swarnalatha, C. & Soundhariya, S. 2015. Impulse purchase: an overview. Global
Journal for research analysis, 4(7):267-268.
Szekely, L. & Nagy, Á. 2011. Online youth work and eYouth: a guide to the world of
the digital natives. Children and Youth Services Review, 33:2186-2197.
Tanner, J. & Raymond, M.A. 2012. Marketing principles. Houston: Flat World
Education.
Times Live. 2014. Impulse buying statistics in rands.
http://www.timeslive.co.za/thetimes/2014/05/27/impulse-buying-has-malls-smiling
Date of access: 7 March 2016.
Tinne, W.S. 2011. Factors affecting impulse buying behaviour of consumers at
Superstores in Bangladesh. ASA University Review, 5(1):209-220.
Tutor2u. 2015. “Sales promotion definition”.
http://www.ttor2u.net/business/reference/sales-promotion Date of Access: 22
August 2016.
Refernece List 118
Universities South Africa. 2016. Universities of South Africa.
http://www.universitiessa.ac.za/public-universities-south-africa. Date of access: 30
March 2016.
Vänniä, E. 2013. Impulse buying behaviour of young males in an airport
environment. International Business. (Thesis-Masters).
Verplanken, B. & Herabadi, A.G. 2001. Individuals differences in impulse buying
tendency: feeling and no thinking. European Journal of scientific Research, 15:71-
83.
Verplanken, B., Herabadi, A.G., Perry, J.A. & Silvera, D.H. 2005. Consumer style
and health: the role of impulsive buying in unhealthy eating. Psychology and Health,
20(4):429-441.
Verplanken, B. & Sato, A. 2011. The psychology of impulse buying: an integrative
self-regulation approach. Journal of Consumer Policy, 34(2):197-210.
Vishnu, P. & Raheem, A.R. 2013. Factors influencing impulse buying behaviour.
European Journal of Scientific Research, 100(3):67-79.
Viswanathan, V. & Jain, V. 2013. A dual-system approach to understanding
“Generation Y” decision making. Journal of Consumer Marketing, 30(6):484-492.
Vohs, K.D., & Faber, R.J. 2007. Spent resources: self-regulatory resource
avaliability affects impulse buying. Journal of Consumer Research, 33:537-547.
Vrechopoulos, A.P. 2004. What should an internet store look like? ECR Journal,
2:42-49.
Vrechopoulos, A.P., O‟Keffe, R.M., Doukidid, G.I. & Siomkos, G.J. 2004. Virtual
store layout: an experimental comparison in the context of grocery retail. Journal of
Retailing, 80:13-22.
Walliman, N. 2011. Research methods: the basics. London: Routledge.
Welman, C., Kruger, S.R. & Mitchell, B. 2005. Research methodology. 3rd ed.
New York, NY: Oxford University Press.
Refernece List 119
Wiid, J. & Diggines, C. 2009. Marketing research. Cape Town, SA: Juta.
Xiao, S., & Nicholson, M. 2013. A multi-disciplinary cognitive behavioural
framework of impulse buying: a systematic review of the literature. International
Journal of Management Reviews, 15(3): 333-356.
Xu, Y. 2007. Impact of store environment on adult Generation Y consumers‟
impulse buying. Journal of Shopping Center Research, 14(1):39-56.
Yang, D.J., Kuang, C.H. & Fong, X. 2011. A study of the factors that affect the
impulsive cosmetics buying of female consumers in Kaohsiung. International
Journal of Business and Social Science, 2(24):275-282.
Yarrow, K. & O‟Donnell, J. 2009. Gen BuY: how tweens, teens and twenty-
somethings are revolutionizing retail. San Francisco, CA: Jossey-Bass.
Yigit, S. & Aksay, K. 2012. A comparison between Generation X and Generation Y
in terms of individual innovativeness behaviour: the case of Turkish health
professionals. International Journal of Business Administration, 6(2):106-117.
Youn, S.H. 2000. The dimensional structure of consumer buying impulsivity:
measurement and validation. Minneapolis: University of Minnesota. (Dissertation –
PhD).
Youn, S. & Faber, R.J. 2000. Impulse buying: its relation to personality traits and
cues. Advances in Consumer Research, 27:179-185.
Yu, C. & Bastin, M. 2010. Hedonic shopping value and impulse buying behaviour in
transitional economies: a symbolisis in the mainland China marketplace. Journal of
Brand Management, 18(2):105-114.
Zhou, L. & Wong, A. 2003. Consumer impulse buying and in-store stimuli in
Chinese supermarkets. Journal of international Consumer Marketing, 16(2):37-53.
Zikmund, G.W. & Babin, J.B. 2010. Essentials of marketing research. 4th ed.
Mason, OH: South-Western/Cengage Learning.
Refernece List 120
Žnideršić, R.K., Grubor, A. & Marić, D. 2014. Impulsive consumer behaviour.
International Journal of Multidisciplinary in Business and Science, 2(2):81-89.

Appendix A 121
APPENDIX A
COVER LETTER
FACTORS INFLUENCING IMPULSE BUYING BEHAVIOUR AMONGST
GENERATION Y STUDENTS
Dear participant,
I am currently in the process of doing my Masters in Marketing Management at the
North West University (Vaal Campus) as a full-time student. I am working towards
completing my Masters Dissertation in 2016.
The purpose of this study is to determine the factors that influence impulse buying
behaviour of South African Generation Y students. Generation Y students are aged
between 18 – 25 years old.
I kindly ask you to please take 10 minutes of your time to complete the attached
questionnaire, as this will add valuable information to my research. All responses will
be kept confidential, and will only be used for research purposes, summarised in the
form of statistical data.
Thank you – your assistance and contribution is highly appreciated.
Jacinta Ana Neves ([email protected])
North West University (Vaal Triangle Campus)
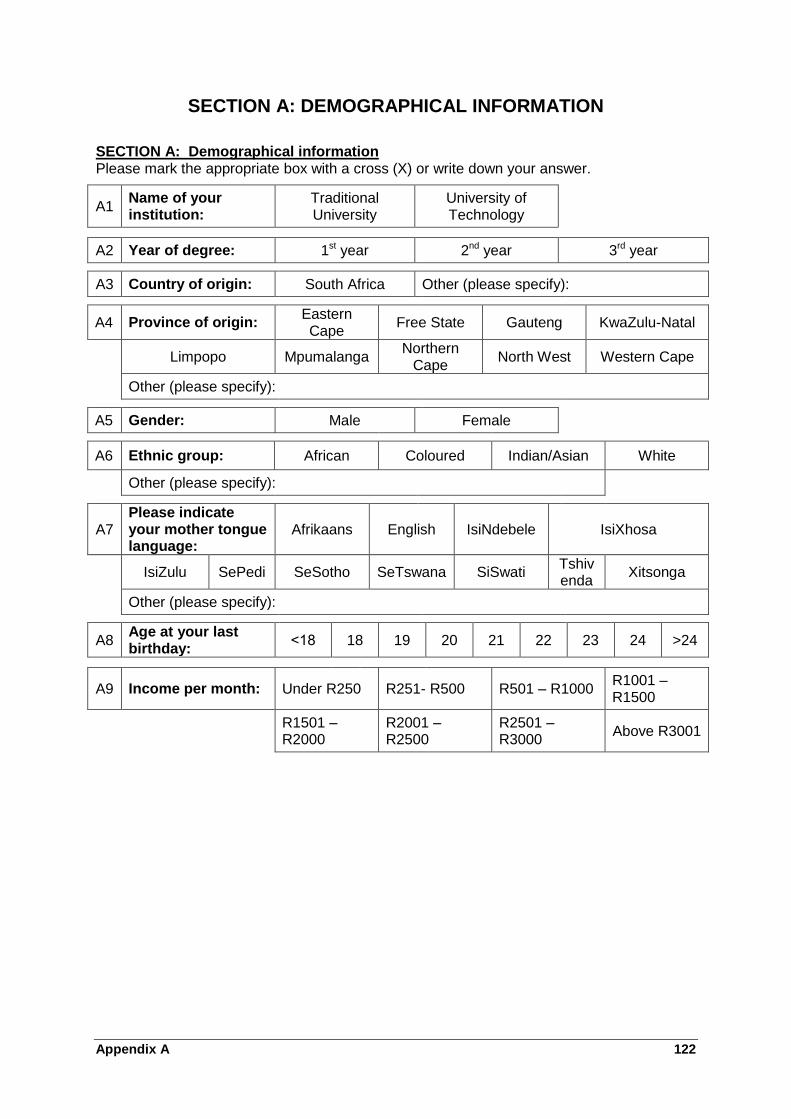
Appendix A 122
SECTION A: DEMOGRAPHICAL INFORMATION
SECTION A: Demographical information Please mark the appropriate box with a cross (X) or write down your answer.
A1 Name of your institution:
Traditional University
University of Technology
A2 Year of degree: 1st year 2nd year 3rd year
A3 Country of origin: South Africa Other (please specify):
A4 Province of origin: Eastern Cape
Free State Gauteng KwaZulu-Natal
Limpopo Mpumalanga Northern
Cape North West Western Cape
Other (please specify):
A5 Gender: Male Female
A6 Ethnic group: African Coloured Indian/Asian White
Other (please specify):
A7 Please indicate your mother tongue language:
Afrikaans English IsiNdebele IsiXhosa
IsiZulu SePedi SeSotho SeTswana SiSwati Tshivenda
Xitsonga
Other (please specify):
A8 Age at your last birthday:
˂18 18 19 20 21 22 23 24 >24
A9 Income per month: Under R250 R251- R500 R501 – R1000 R1001 – R1500
R1501 – R2000
R2001 – R2500
R2501 – R3000
Above R3001
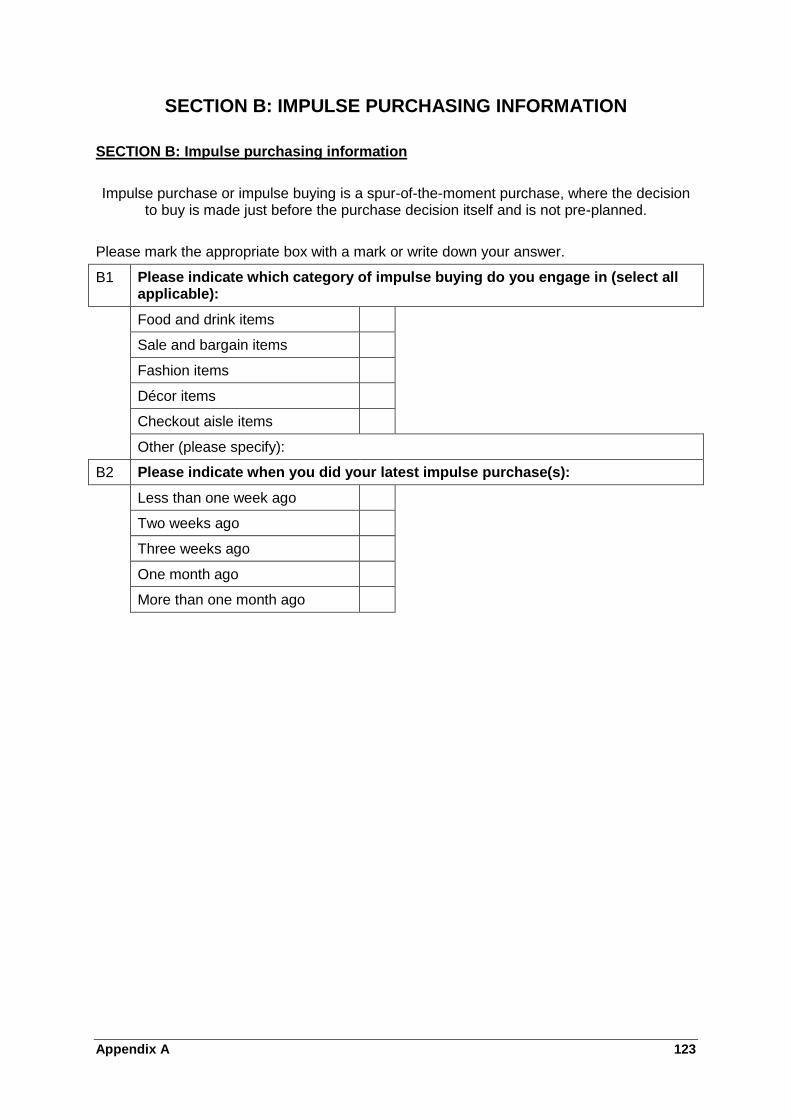
Appendix A 123
SECTION B: IMPULSE PURCHASING INFORMATION
SECTION B: Impulse purchasing information
Impulse purchase or impulse buying is a spur-of-the-moment purchase, where the decision to buy is made just before the purchase decision itself and is not pre-planned.
Please mark the appropriate box with a mark or write down your answer.
B1 Please indicate which category of impulse buying do you engage in (select all applicable):
Food and drink items
Sale and bargain items
Fashion items
Décor items
Checkout aisle items
Other (please specify):
B2 Please indicate when you did your latest impulse purchase(s):
Less than one week ago
Two weeks ago
Three weeks ago
One month ago
More than one month ago
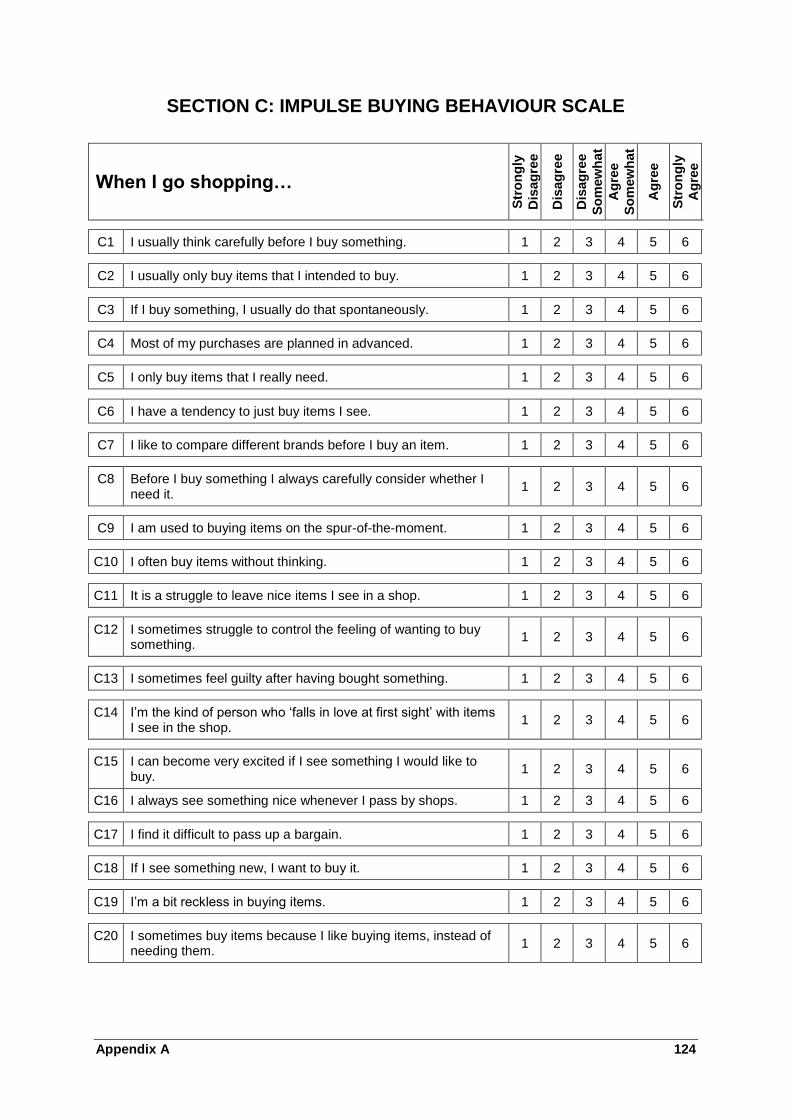
Appendix A 124
SECTION C: IMPULSE BUYING BEHAVIOUR SCALE
When I go shopping…
Str
on
gly
Dis
ag
ree
Dis
ag
ree
Dis
ag
ree
So
mew
hat
Ag
ree
So
mew
hat
Ag
ree
Str
on
gly
Ag
ree
C1 I usually think carefully before I buy something. 1 2 3 4 5 6
C2 I usually only buy items that I intended to buy. 1 2 3 4 5 6
C3 If I buy something, I usually do that spontaneously. 1 2 3 4 5 6
C4 Most of my purchases are planned in advanced. 1 2 3 4 5 6
C5 I only buy items that I really need. 1 2 3 4 5 6
C6 I have a tendency to just buy items I see. 1 2 3 4 5 6
C7 I like to compare different brands before I buy an item. 1 2 3 4 5 6
C8 Before I buy something I always carefully consider whether I need it.
1 2 3 4 5 6
C9 I am used to buying items on the spur-of-the-moment. 1 2 3 4 5 6
C10 I often buy items without thinking. 1 2 3 4 5 6
C11 It is a struggle to leave nice items I see in a shop. 1 2 3 4 5 6
C12 I sometimes struggle to control the feeling of wanting to buy something.
1 2 3 4 5 6
C13 I sometimes feel guilty after having bought something. 1 2 3 4 5 6
C14 I‟m the kind of person who „falls in love at first sight‟ with items I see in the shop.
1 2 3 4 5 6
C15 I can become very excited if I see something I would like to buy.
1 2 3 4 5 6
C16 I always see something nice whenever I pass by shops. 1 2 3 4 5 6
C17 I find it difficult to pass up a bargain. 1 2 3 4 5 6
C18 If I see something new, I want to buy it. 1 2 3 4 5 6
C19 I‟m a bit reckless in buying items. 1 2 3 4 5 6
C20 I sometimes buy items because I like buying items, instead of needing them.
1 2 3 4 5 6
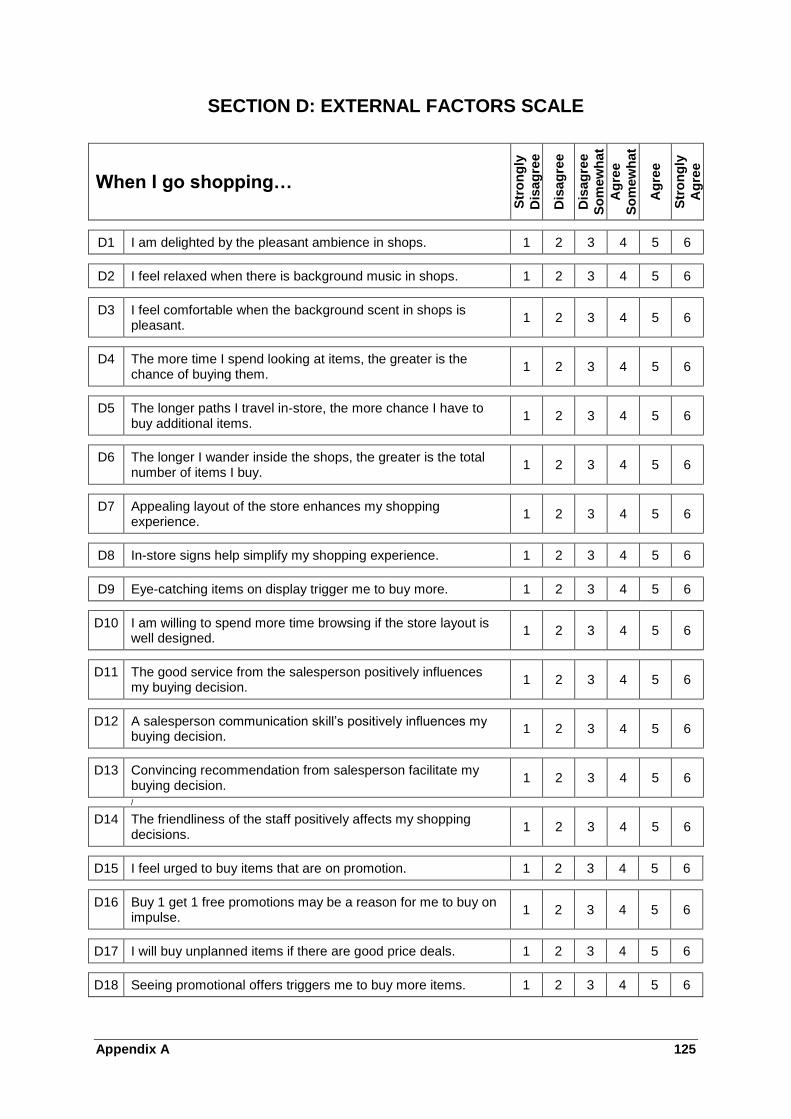
Appendix A 125
SECTION D: EXTERNAL FACTORS SCALE
When I go shopping…
Str
on
gly
Dis
ag
ree
Dis
ag
ree
Dis
ag
ree
So
mew
hat
Ag
ree
So
mew
hat
Ag
ree
Str
on
gly
Ag
ree
D1 I am delighted by the pleasant ambience in shops. 1 2 3 4 5 6
D2 I feel relaxed when there is background music in shops. 1 2 3 4 5 6
D3 I feel comfortable when the background scent in shops is pleasant.
1 2 3 4 5 6
D4 The more time I spend looking at items, the greater is the chance of buying them.
1 2 3 4 5 6
D5 The longer paths I travel in-store, the more chance I have to buy additional items.
1 2 3 4 5 6
D6 The longer I wander inside the shops, the greater is the total number of items I buy.
1 2 3 4 5 6
D7 Appealing layout of the store enhances my shopping experience.
1 2 3 4 5 6
D8 In-store signs help simplify my shopping experience. 1 2 3 4 5 6
D9 Eye-catching items on display trigger me to buy more. 1 2 3 4 5 6
D10 I am willing to spend more time browsing if the store layout is well designed.
1 2 3 4 5 6
D11 The good service from the salesperson positively influences my buying decision.
1 2 3 4 5 6
D12 A salesperson communication skill‟s positively influences my buying decision.
1 2 3 4 5 6
D13 Convincing recommendation from salesperson facilitate my buying decision.
1 2 3 4 5 6
/
D14 The friendliness of the staff positively affects my shopping decisions.
1 2 3 4 5 6
D15 I feel urged to buy items that are on promotion. 1 2 3 4 5 6
D16 Buy 1 get 1 free promotions may be a reason for me to buy on impulse.
1 2 3 4 5 6
D17 I will buy unplanned items if there are good price deals. 1 2 3 4 5 6
D18 Seeing promotional offers triggers me to buy more items. 1 2 3 4 5 6
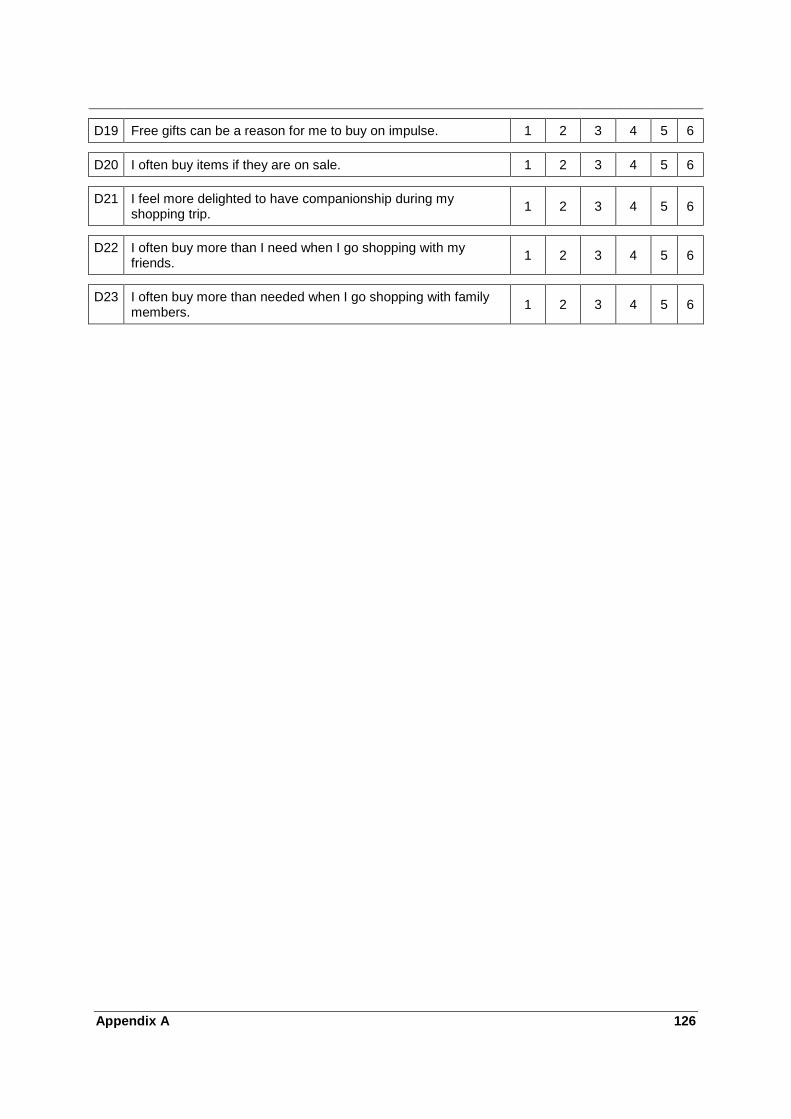
Appendix A 126
D19 Free gifts can be a reason for me to buy on impulse. 1 2 3 4 5 6
D20 I often buy items if they are on sale. 1 2 3 4 5 6
D21 I feel more delighted to have companionship during my shopping trip.
1 2 3 4 5 6
D22 I often buy more than I need when I go shopping with my friends.
1 2 3 4 5 6
D23 I often buy more than needed when I go shopping with family members.
1 2 3 4 5 6
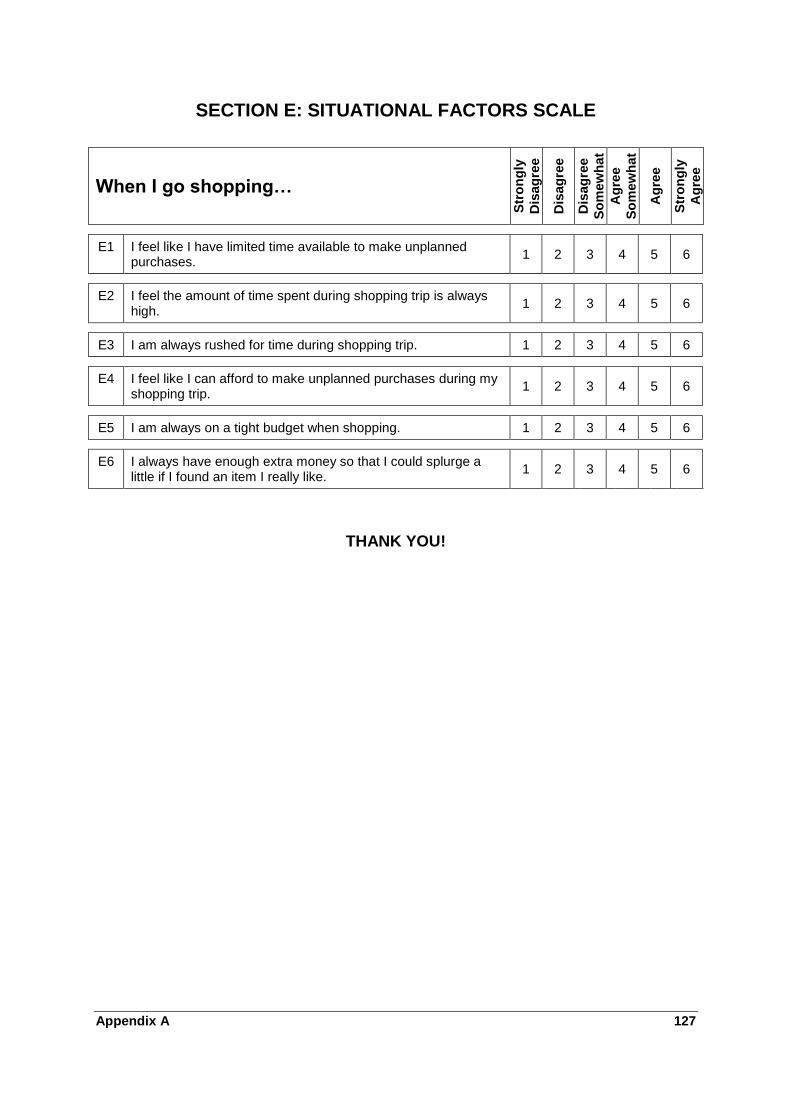
Appendix A 127
SECTION E: SITUATIONAL FACTORS SCALE
When I go shopping…
Str
on
gly
Dis
ag
ree
Dis
ag
ree
Dis
ag
ree
So
mew
hat
Ag
ree
So
mew
hat
Ag
ree
Str
on
gly
Ag
ree
E1 I feel like I have limited time available to make unplanned purchases.
1 2 3 4 5 6
E2 I feel the amount of time spent during shopping trip is always high.
1 2 3 4 5 6
E3 I am always rushed for time during shopping trip. 1 2 3 4 5 6
E4 I feel like I can afford to make unplanned purchases during my shopping trip.
1 2 3 4 5 6
E5 I am always on a tight budget when shopping. 1 2 3 4 5 6
E6 I always have enough extra money so that I could splurge a little if I found an item I really like.
1 2 3 4 5 6
THANK YOU!
Copyright © 2022 FDOKUMEN