DETERMINANTS OF FORMAL SOURCE OF CREDIT LOAN REPAYMENT PERFORMANCE OF SMALLHOLDER FARMERS: THE CASE...
107
DETERMINANTS OF FORMAL SOURCE OF CREDIT LOAN REPAYMENT PERFORMANCE OF SMALLHOLDER FARMERS: THE CASE OF NORTH WESTERN ETHIOPIA, NORTH GONDAR M. Sc. Thesis Amare Berhanu November 2005 Alemaya University
-
Upload
independent -
Category
Documents
-
view
2 -
download
0
Transcript of DETERMINANTS OF FORMAL SOURCE OF CREDIT LOAN REPAYMENT PERFORMANCE OF SMALLHOLDER FARMERS: THE CASE...

DETERMINANTS OF FORMAL SOURCE OF CREDIT LOAN
REPAYMENT PERFORMANCE OF SMALLHOLDER FARMERS: THE
CASE OF NORTH WESTERN ETHIOPIA, NORTH GONDAR
M. Sc. Thesis
Amare Berhanu
November 2005
Alemaya University
DETERMINANTS OF FORMAL SOURCE OF CREDIT LOAN
REPAYMENT PERFORMANCE OF SMALLHOLDER FARMERS: THE
CASE OF NORTH WESTERN ETHIOPIA, NORTH GONDAR
A Thesis Submitted to the
Department of Agricultural Economics, School of Graduate Studies
ALEMAYA UNIVERSITY
In Partial Fulfillment of the Requirements for the Degree of
MASTER OF SCIENCE IN AGRICULTURE
(AGRICULTURAL ECONOMICS)
By
Amare Berhanu
November 2005
Alemaya University
ii
SCHOOL OF GRADUATE STUDIES
ALEMAYA UNIVERSITY
As members of examining Board of the Final MSc Open Defense, we certify that we have read
and evaluated the thesis prepared by Amare Berhanu entitled DETERMINANTS OF
FORMAL SOURCE OF CREDIT LOAN REPAYMENT PERFORMANCE OF
SMALLHOLDER FARMERS: THE CASE OF NORTH WESTERN
ETHIOPIA, NORTH GONDAR and recommended that it be accepted as fulfilling the
thesis requirement for the degree of Master of Science in Agriculture (Agricultural
Economics).
------------------------------------------- ----------------------- --------------------------
Name of Chairman Signature Date
------------------------------------------- ----------------------- --------------------------
Name of Internal Examiner Signature Date
------------------------------------------- ----------------------- --------------------------
Name of External Examiner Signature Date
Final approval and acceptance of the thesis is contingent upon the submission of the final copy
of the thesis to the Council of Graduate Studies (CGS) through the Department Graduate
Committee (DGC) of the candidate’s major department.
I hereby certify that I have read this thesis prepared under my direction and recommend that it
be accepted as fulfilling the thesis requirement.
------------------------------------------- ----------------------- --------------------------
Name of Major Advisor Signature Date

DEDICATION
To Ethiopian Smallholder Farmers
iv
STATEMENT OF AUTHOR
I hereby declare that this thesis is my bonafide work and that all sources of materials used for
this thesis have been duly acknowledged. This thesis has been submitted in partial fulfillment
of the requirements for an advanced MSc degree at Alemaya University and is deposited at the
University Library to be made available to borrowers under the rules of the library. I solemnly
declare that this thesis is not submitted to any other institution anywhere for the award of any
academic degree, diploma, or certificate.
Brief quotations from this thesis are allowable without special permission provided that
accurate acknowledgement of source is made. Requests for permission for extended quotation
from or reproduction of this manuscript in whole or in part may be granted by the Department
of Agricultural Economics the Dean of the School of Graduate Studies, Alemaya University,
when in his judgment the proposed use of the material is in the interests of scholarship. In all
other instances, however, permission must be obtained from the author.
Name: ---------------------------------- Signature: ----------------
Place: Alemaya University, Alemaya
Date of Submission: ----------------
v
ABBREVIATIONS
A.A. Addis Ababa
ACORD Agency for Co-operation in Research and Development
ACSI Amhara Credit and Saving Institution
AIDB Agricultural and Industrial Development Bank
ANRS Amhara National Regional State
BoFED Bureau of Finance and Economic Development
BoPED Bureau of Planning and Economic Development
CBE Commercial Bank of Ethiopia
CBO Community Based Organizations
CSA Central Statistics Authority
DA Development Agent
DBE Development Bank of Ethiopia
FAO Food and Agriculture Organization
FMSC Farmers Multi Service Cooperative
GDP Dross Domestic Product
Ha Hectare
IFAD International Fund for Agricultural Development
LDCs Less Developed Countries
LPM Linear Probability Model
MASL Meters Above Sea Level
MFI Micro Finance Institution
MLE Maximum Likelihood Estimates
MoFED Ministry of Finance and Economic Development
MTDP Market Town Development Program
NBE National Bank of Ethiopia
NGO Non-Governmental Organization
OLS Ordinary Least Squares
PA Peasants’ Association
vi
POCSSBO Project Office for the Creation of Small Scale Organizations
RoSCA Rotating Saving and Credit Associations
RWSEP Rural Water Supply and Environment Program
SPSS Statistical Package for Social Sciences
SRS Simple Random Sampling
SS Systematic Sampling
TLU Tropical Livestock Unit
TOL Tolerance
UNDP United Nations Development Program
UNECA United Nations Economic Commission for Africa
VIF Variance Inflation Factor
vii
BIOGRAPHY
The author was born in Addis Ababa in 1973. He completed his primary and junior secondary
education at Mekane Heiwot and Miazeya 23 Junior Secondary Schools, respectively and
attended his secondary school education at Yekatit 12 Comprehensive Secondary School
(1987-1991). After passing Ethiopian School Leaving Certificate Examination (ESLCE), he
joined the former Alemaya University of Agriculture in September 1991 and graduated with
B.Sc degree in the field of Agricultural Economics in July 1995.
Starting from September 1995 up to September 2003 he served in different governmental
organizations in Amhara region. Immediately after graduation he was assigned to work in the
then Information for Town Development Project. Then five months later he was employed as
Socio-Economic Expert of Dembia Woreda Council Office. In June 1998 he was transferred to
the Zonal Administrative Office of North Gondar and worked as an Socio-Economic Expert
until July 2002.
Finally, he was transferred to his present Organization, the Rural and Agriculture Office of
Lay Armachiho Woreda, and served as a Head of Credit and Input Desk, from September
2002 until he joined Alemaya University to pursue his postgraduate study in September 2003.
viii
ACKNOWLEDGEMENTS
First and foremost let me praise and honor the almighty God for the opportunity and capacity
given to me to realize my aspiration.
Several individuals and organizations deserve acknowledgement for their contributions to the
study. My foremost appreciation and thanks go to my major advisor, Dr. Bekabil Fuffa for his
close supervision and professional advice and encouragement during the research work. My
heart-felt thanks also go to my co-advisor, Ato Gizachew Ashagrie, for his invaluable
comments and professional advice throughout the course of the research work. He also
deserves especial gratitude for permitting me to use Internet services of Gondar University for
this study.
I would also like to carry my gratitude to Amhara Region Agricultural Research Institute and
Integrated Livestock Development Project for providing me with financial and logistics
support during the process of data collection. In addition, I would like to thank staff members
of Gondar University, ILDP, North Gondar Administrative Zone Office and North Gondar
Rural Development and Agricultural Branch Office for their friendly and dedicated co-
operation. I am indebted to Dr. Belayneh Legesse, Dr. Edelegnaw Walle, Ato Mule Tarekegn,
Ato Megabiaw Tassew, Ato Bekele Hunde, Ato Tesfaye Kebede, Ato Tekeba Yalew for their
invaluable comments, encouragement and advice during the course of my study. My special
thanks are given to my wife, W/ro Asegedech Tezera and our families for their invaluable
encouragement throughout the study period.
My special gratitude goes to the members of the sample farm households, who responded to
numerous questions during the peak time of agricultural activity in the area, some of which
touched on very sensitive issues, such as their possession of assets, access to credit, and level
of debt.
ix
TABLE OF CONTENTS
DEDICATION ......................................................................................................................... iii
STATEMENT OF AUTHOR..................................................................................................iv
ABBREVIATIONS....................................................................................................................v
BIOGRAPHY...........................................................................................................................vii
ACKNOWLEDGEMENTS .................................................................................................. viii
LIST OF TABLES....................................................................................................................xi
LIST OF FIGURES.................................................................................................................xii
LIST OF APPENDICES....................................................................................................... xiii
ABSTRACT..............................................................................................................................xiv
INTRODUCTION .....................................................................................................................1
1.1. Background .....................................................................................................................1
1.2. Statement of the Problem...............................................................................................4
1.3. Objectives of the Study...................................................................................................6
1.4. Significance of the Study................................................................................................7
1.5. Scope and Limitations of the Study ..............................................................................7
1.6. Organization of the Thesis .............................................................................................8
2. LITERATURE REVIEW.....................................................................................................9
2.1. Definition and Theoretical Perspectives of Credit Market.........................................9
2.1.1. Definition and concepts of credit............................................................................9
2.1.2. The Need for Credit...............................................................................................10
2.1.3. Theoretical perspective of credit market.............................................................11
2.1.4. Rural credit, moral hazard and adverse selection..............................................13
2.1.4.1. Adverse selection.............................................................................................15
2.1.4.2. Moral hazard...................................................................................................16
2.2. Situation of Rural Finance in Ethiopia.......................................................................16
2.2.1. The emergence and evolution of formal credit in Ethiopia ...............................17
2.2.1.1. Rural credit before 1975 ................................................................................17
2.2.1.2. Rural credit during the Dergue period.........................................................20
2.2.1.3. Rural credit after the reform period.............................................................21
x
2.2.2. Formal financial institutions in Ethiopia.............................................................23
2.2.2.1. Amhara Credit and Saving Institutions (ACSI) ..........................................24
2.2.2.2.Cooperatives in Ethiopia.................................................................................25
2.2.3. Informal financial sector in Ethiopia...................................................................27
2.3. Empirical studies on loan recovery and defaults......................................................28
3. METHODOLOGY..............................................................................................................33
3.1. Description of the Study Area .....................................................................................33
3.1.1 Amhara National Regional State...........................................................................33
3.1.2. North Gondar Administrative Zone ....................................................................35
3.1.2.1. Population characteristics..............................................................................35
3.1.2.2. Farming system...............................................................................................35
3.1.2.3. Climate and topography ................................................................................36
3.2. Sampling procedures and Data Sources.....................................................................38
3.2.1. Sampling procedure ..............................................................................................38
3.3. Variable Specification and Hypotheses ......................................................................40
3.4. Methods of Data Analysis ............................................................................................44
3.4.1. Descriptive statistics ..............................................................................................44
3.4.2. Econometric model ................................................................................................44
4. RESULTS AND DISCUSSION..........................................................................................49
4.1. Results of Descriptive Statistics Analysis ...................................................................49
4.1.1 Source of Credit ......................................................................................................54
4.1.2. The distribution of the households with respect to rainfall availability...........55
4.1.3. Major agricultural production problems in the area.........................................56
4.2. Results of the Econometric Model ..............................................................................57
4.2.1. Multicollinearity and Hetroscedasticity Diagnosis.............................................57
4.2.2. Determinants of probability of being non-defaulter and degree of loan
recovery ............................................................................................................................60
5. CONCLUSIONS AND POLICY IMPLICATIONS ........................................................65
6. REFERENCES ....................................................................................................................68
7. APPENDICES......................................................................................................................76
xi
LIST OF TABLES
Table 1. Sampled Peasant Associations (second stage) ...........................................................38
Table 2. Sampled Households (Third stage) ............................................................................39
Table 3. Socio-economic and institutional characteristics of the households (continues
variables) ...........................................................................................................................51
Table 4. Socio-economic and institutional characteristics of the sample households (discrete
variables)…………………………………………………………………………………54
Table 5. Distribution of the Sample Households by Agro climatic conditions........................55
Table 6. Distribution of the sample households by causes of crop losses in the sample site. ..56
Table 7. Borrowers' responses on main reason for not repaying the loan ................................57
Table 8. VIF of the Continuous Explanatory Variables used in the study ...............................58
Table 9. Contingency Coefficients for Dummy Variables .......................................................59
Table 10. Maximum Likelihood Estimates of the Two-limit Tobit Model and the Effects of
Explanatory Variables on Probability of being Non-defaulter…………………………..63
Table 11. Marginal effects of Independent variables on rate of repayment ..............................64

xii
LIST OF FIGURES
Figure 1. Location of ANRS in Ethiopia 34
Figure 2. Zone and Woredas in which the Study Sites are located 37
xiii
LIST OF APPENDICES
Appendix 1. Capital and Branch Network of the Banking System in Ethiopia ........................77
Appendix 2. Branch Network of Insurance Companies ...........................................................77
Appendix 3. Micro Finance Institutions Operating in Ethiopia as of June 2003 (NBE)..........78
Appendix 4. Conversion Factors for Livestock Units ..............................................................79
Appendix 5. Survey Questionnaire............................................................................................80
xiv
DETERMINANTS OF FORMAL SOURCE OF CREDIT LOAN
REPAYMENT PERFORMANCE OF SMALLHOLDER FARMERS: THE
CASE OF NORTH WESTERN ETHIOPIA, NORTH GONDAR
By: Amare Berhanu
ABSTRACT
Delivering productive credit to the rural poor has been a hotly pursued but problem-plagued
undertaking. No other concern than loan default has an acute effect on the success of credit
programs in rural areas. Loan default is a crucial problem of rural financial services.
Therefore, the major concern of this study was to identify the major socio-economic,
institutional and natural factors that affect loan repayment capacity of smallholder farmers in
North Gondar of Amahara regional state. The main data used for this study were collected
from a sample of formal credit borrower farmers in the zone through structured questionnaire.
A total of 157 farm households cases were included in the final analysis. In addition,
secondary data were collected from different organizations and pertinent publication in order
to elaborate the present situation of rural credit in Ethiopia. Two-limit Tobit model was
employed to analyze factors influencing loan repayment and intensity of loan recovery among
smallholder farmers in the zone. A total of seventeen explanatory variables were included in
the model of which seven variables were found to be significant. These were agro ecology of
the study area, size of land holding, total number of livestock, number of years of experience
in agricultural extension services, number of extension contact days, credit source, and
income from off-farm activities. Therefore, consideration of these factors is vital as it provides
information that would enable to undertake effective measures with the aim of improving loan
repayment in the zone. It would also enable lenders and policy makers to have information as
to where and how to channel efforts in order to minimize loan default.
INTRODUCTION
1.1. Background
Ethiopia is a landlocked country in the horn of Africa, bounded by Eritrea in the North, in the
West by Sudan, in the South by Kenya and in the East by Somalia and Djibouti. It lies within
the tropics between 3°24` and 14°53` North; and 32°42` and 48°12` East. The country covers
1,120,000 square kilometers and the population is estimated at about 77 million in 2005,
which makes it the third most populous country in Africa. Ethiopia has reasonably good
resource potential for agricultural development- biodiversity, water resources, minerals, etc.
Yet, it is faced with complex poverty, which is broad, deep, and structural. The proportion of
the population below the poverty line is 44 per cent in 1999/2000 (MoFED, 2002)
In spite of the huge agricultural potential, the growth in agricultural production has not been
able to keep pace with that of the demand. Great proportion of cultivated land is held by
subsistence farmers who produce about 97% of the national agricultural output (Welday,
1999). The small-scale farmers, however, produce a little ‘surplus’ over their requirement and,
hence, could not adequately feed the population out of the agricultural sector. Experiences
over the past four decades had shown that in drought affected years farmers are the ones who
suffer from hunger /famine.
The contributing factors to the low level of productivity are many but poor and backward
technology is the principal one. Production methods have remained unchanged for thousands
of years. Times and methods of sowing crops are the same as those mentioned in the books
explaining the history of Ethiopia; the implements and tools for tilling, harvesting, threshing,
and winnowing are identical with, if improved a little better than, those described in the
ancient books. In brief, Ethiopia’s agriculture is characterized by extremely limited capital
resources, the use of traditional methods of production and, thus, low productivity of resources
2
involved in the production process. These characteristics tend to perpetuate the existing
situation whereby agriculture has not been able to feed the country's fast-growing population
and cannot therefore make a substantial contribution to economic growth.
According to Timmer (1988), the first step for economic development is 'getting agriculture
moving'. Moshar (1966) has classified the facilities and services involved in the modernization
of agriculture into two groups viz. the essentials and the accelerators. The former, as the name
implies, must be present to enable a farmer to adopt an innovation; and the latter are those that
may be important to get an innovation adopted. Credit is one of the five accelerators that
Mosher (1966) listed.
With introduction of new production technologies, the financial needs of farmers have
increased manifold in Ethiopia. Steady agricultural development depends upon the continuous
increase in farm investment. Most of the time, especially during the take-off stage of
agricultural development, heavy investment cannot be made by the farmers out of their own
funds because of their present level of incomes. Moreover, there exists no significant margin
of income that can be channeled into the agricultural sector to undertake development
activities. Thus, here comes the importance and significance of the availability of rural credit
to bridge the gap between owned and required capital (Singh et al., 1985).
It is important, however, that these borrowed funds be invested for productive purposes and
generate additional income to be repaid to the lending institutions to have sustainable and
viable production process. But increase in default rate is one of the major problems of lending
institutions (Singh et al., 1985). According to Bekele (2001), in Ethiopia loan repayment was
not a serious problem prior to 1990 and became a serious issue after 1990. For instance, it has
been reported that loan recovery ratio in Ethiopia declined from 54% in 1990 to 37% in 1991
and further dropped to 15% in 1992.
Delivering productive credit to the rural poor has been a hotly pursued but problem plagued
undertaking. Providing low –cost, efficient credit services and recovering a high percentage of
loans granted are the ideal aims in rural finance (Wenner, 1995). This is because low
repayment performance discourages the lender to promote and extend credit to large and
fragmented farm households. Therefore, a thorough investigation of the various aspects of

3
loan defaults, source of credit and condition of loan provision are of great importance both for
policy makers and lending institutions. Hence, this study was undertaken to analyze the
determinants of loan repayment from formal sources in North Gondar Administrative Zone.
4
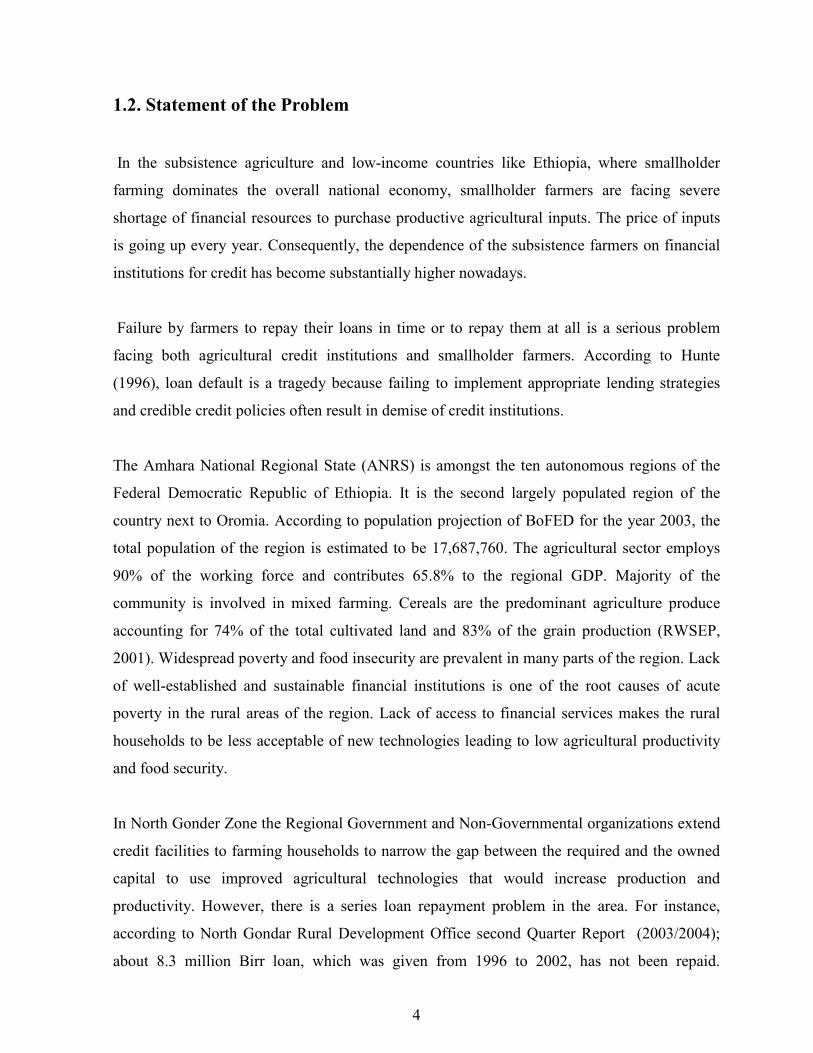
1.2. Statement of the Problem
In the subsistence agriculture and low-income countries like Ethiopia, where smallholder
farming dominates the overall national economy, smallholder farmers are facing severe
shortage of financial resources to purchase productive agricultural inputs. The price of inputs
is going up every year. Consequently, the dependence of the subsistence farmers on financial
institutions for credit has become substantially higher nowadays.
Failure by farmers to repay their loans in time or to repay them at all is a serious problem
facing both agricultural credit institutions and smallholder farmers. According to Hunte
(1996), loan default is a tragedy because failing to implement appropriate lending strategies
and credible credit policies often result in demise of credit institutions.
The Amhara National Regional State (ANRS) is amongst the ten autonomous regions of the
Federal Democratic Republic of Ethiopia. It is the second largely populated region of the
country next to Oromia. According to population projection of BoFED for the year 2003, the
total population of the region is estimated to be 17,687,760. The agricultural sector employs
90% of the working force and contributes 65.8% to the regional GDP. Majority of the
community is involved in mixed farming. Cereals are the predominant agriculture produce
accounting for 74% of the total cultivated land and 83% of the grain production (RWSEP,
2001). Widespread poverty and food insecurity are prevalent in many parts of the region. Lack
of well-established and sustainable financial institutions is one of the root causes of acute
poverty in the rural areas of the region. Lack of access to financial services makes the rural
households to be less acceptable of new technologies leading to low agricultural productivity
and food security.
In North Gonder Zone the Regional Government and Non-Governmental organizations extend
credit facilities to farming households to narrow the gap between the required and the owned
capital to use improved agricultural technologies that would increase production and
productivity. However, there is a series loan repayment problem in the area. For instance,
according to North Gondar Rural Development Office second Quarter Report (2003/2004);
about 8.3 million Birr loan, which was given from 1996 to 2002, has not been repaid.

5
Although there are such severe problems, factors that affect loan repayment performance of
small holders from formal sources have not been studied in the area.
Therefore, this study was initiated with the main objective of analyzing the determinants of
formal source of credit loan repayment performance of smallholder farmers in North Gondar
Administrative Zone.

6
1.3. Objectives of the Study
Te general objective of this study is to analyze the extent to which formal source of credit non-
default and default rates are associated with different personal, socio-economic and
institutional characteristic of farm households in Gondar Zone of Amhara Region.
The specific objectives are:
1. To identify the sources of credit and purpose of the loan among smallholder farmers in the
zone.
2. To determine the extent of defaults in the repayment of formal source of credit loans offered
to smallholder farmers in the study area.
3. To identify factors which affect formal source of credit loan repayment performance of
smallholders in the zone and determine their relative importance.
7
1.4. Significance of the Study
Funds extended for the purpose of augmenting capital of small farmers should be used for the
intended goal and finally be repaid to the lending institution in order to have viable, strong and
sustainable agricultural credit schemes and efficient operation mechanisms year after year.
Contrary to this fact, it has been reported in various literatures that loan default is a critical
problem of formal financial institutions in Ethiopia. Nonetheless, little has been attempted in
identifying specific important factors that should be treated to reduce this national problem.
Therefore, studies on the factors which affect loan repayment performance are vital to enable
governmental and non governmental financial institutions, policy makers, policy
implementers, as well as borrowers to have knowledge as to where and how to channel efforts
in order to minimize loan defaults and help to design successful credit programs in the study
area and outside of it. Moreover, the study would provide micro level information for those
who would like to conduct detailed and comprehensive studies on rural credit.
1.5. Scope and Limitations of the Study
This study was conducted in Gondar Zone of Amhara Regional State in Ethiopia. As stated in
the objectives, the main aim of this study is to identify important demographic, scio-economic
and institutional factors that affect loan repayment performance of smallholder farmers that
borrowed from formal credit sources. Accordingly, the study was conducted in three districts
of the zone and 157 randomly selected households that were users of credit from formal
sources during the 2003 agricultural production year were included in the study. Primary data
on the above main categories of variables were collected using structured questionnaire.
Descriptive statistics and two-limit Tobit econometric model were used to analyze the
primary data collected. Sixteen independent and one dependent, variables were selected for
analytical purpose.
This study is concerned with the analysis of the main determinants of formal credit source loan
repayment performance of North Gondar Administrative Zone small-scale farmers and did not
consider the loan repayment performance of the farmers in the area from informal credit
8
sources. However, the analysis of the loan repayment performance of the farmers from
informal credit sources could generate useful information that might help in channeling
financial resources to the farmers of the zone. Future research topics focusing on this could
thus generate useful information for policy makers, lending institutions and other stakeholders
working in rural development areas.
1.6. Organization of the Thesis
The remaining parts of the thesis are organized as follows. Chapter two presents review of
literature that includes definitions of concepts, the need for credit, overview of the financial
system in Ethiopia and empirical studies on loan repayment performance. Chapter three
presents the research methodologies employed in the study. Results obtained are presented and
discussed in detail in chapter four. Finally, chapter five presents summary and policy
implications of the research.
9
2. LITERATURE REVIEW
Conceptual and Analytical Models of Credit repayment as well as knowledge of past research
endeavors are essential for detailed analysis of determinants of loan repayment. In this chapter,
definitions of important terms of credit and finance, emergence and evolution of credit market
in Ethiopia, empirical studies on determinants of loan repayment at the global as well as at
country level are presented.
2.1. Definition and Theoretical Perspectives of Credit Market
2.1.1. Definition and concepts of credit
The Concise Mc Graw-Hill Dictionary of Modern Economics defines credit as an exchange of
goods and services for a promise of the future payment. It also indicates that credit is
necessary in a dynamic economy because of the time that elapses between the production of a
good and its ultimate sale and consumption and credit bridges this gap. The risk in extending
credit is the probability that future payment by the borrower will not be made (Greenwal &
Associates, 1983).
Financial institutions are private or governmental organizations, which serve the purpose of
accumulating funds from savers and channeling them to individual households, and business
looking for credit. Financial institutions are composed of deposit-type institutions (bank and
non-bank contractual saving institutions), personal and business financial companies,
government and quasi-government agencies, and miscellaneous lenders. Financial institutions
that receive funds from savers and lend them to borrowers are called financial intermediaries.
In broad sense, the term financial intermediary is applicable to all financial institutions
including commercial banks. These intermediaries pool money from savers and channel them
to individuals, mutual saving banks, saving and loan associations, insurance companies, and
pension trusts. In narrow sense, however, it excludes commercial banks (Greenwald &
Assocates, 1983). Formal financial institutions can be defined as institutions that are regulated
10
by central bank supervisory authorities for licensing and credit policy implementations. They
usually use legal documentation or the legal system to enforce their regulations.
2.1.2. The Need for Credit
Credit is the key means to have access to inputs in many development programs. This is
particularly true for rural development because so long as sufficient credit is not provided to
the development programs of weaker sections of the society, the goal of development may not
be achieved.
As a result of high population pressure in rural areas of developing countries, like Ethiopia,
increasing of additional productive land is difficult implying the need of improving farm level
productivity through intensification. This involves as pointed out by Jama and Kulundu
(1992), use of improved farm inputs such as fertilizers and improved seeds besides improved
tillage and husbandry practices. These inputs are not available on the farm and some farmers
are not able to purchase them due to lack of finance. Moreover, most of the commercial inputs
are expensive and hence smallholder farmers cannot afford to buy them from their own cash
earnings. It is, therefore, generally acknowledged that agricultural credit to smallholder
farmers can help to improve their farm productivity through use of improved farm inputs.
A number of researchers (Adams &Graham, 1981; Gongalez-Vega, 1977; FAO, 1996)
reported the requirement of credit facilities to small holders of less developed countries
(LDCs) for production and consumption smoothing. Governments of LDCs and aid agencies
have spent a large amount of money to this sector. The motivation has been the belief that
loans are an essential part of various input packages that were prescribed as part of agricultural
investment projects designed to introduce modern technologies and thus stimulate change and
growth in agriculture.
Kumer et al. (1978) from India also indicated that the needs for credit in the case of majority
of cultivators arises from inadequate savings to finance various activities on their farm.
Moreover, while their income accrues during limited period of the year, their expenses are
11
spread throughout the year. This implies that expenditure on inputs have to be incurred much
in advance of the income from resulting outputs. Producers meet these expenditures out of
their past savings and when these savings fall short of the requirement, they borrow if they
could manage getting. Some studies in Ethiopia showed that credit increased productivity in
agriculture by enabling farmers to adopt improved technologies. For instance, the study by
Wolday (1999) showed that farmers who had access to credit were more likely to use
improved seeds than those who had no access to credit.
According to Kebede (1995), credit makes traditional agriculture more productive through the
purchase of farm equipment and other agricultural inputs, the introduction of modern irrigation
system and other technological developments. Credit can also be used as an instrument for
market stability. Rural farmers can build their bargaining power by establishing storage
facilities and providing transport system acquired through credit. Credit plays a key role in
covering consumption deficits of farm households. This would, in turn, enable the farm family
to work efficiently in agricultural activities. Credit can farther be used as an income transfer
mechanism to remove the inequalities in income distribution among the small, middle, and big
farmers. Moreover, credit encourages savings and savings held with rural financial institutions
that could be channeled to farmers for use in agricultural production. Credit also creates
employment opportunities for rural farmers.
Rural households in Ethiopia need credit for investment in a range of on-farm, off-farm and
off_farm activities. There is potentially a huge demand for credit from 10-12 million rural
families, which is hardly met at present (IFAD, 2001). Most productive activities are seasonal
and there is equally strong credit demand for consumption smoothing.
2.1.3. Theoretical perspective of credit market
A major economic problem in developing countries is financial intermediation, the
mobilization of capital from one group (savers/lenders) and its simultaneous allocation to meet
the needs of another group (borrowers/entrepreneurs) (Christensen, 1993). Critical for efficient
capital mobilization and allocation, financial intermediation can be performed through various
forms of instrument. The three most important ones are equities (stocks), long-term (bonds),
and short-term loans (credit) (Stiglitz, 1989). In most developing countries, because of the
12
relative under-development of first two forms of instruments, credit markets for short term
loans become the major means of financial intermediation. The capital mobilization function
of credit markets is, however, constrained by several factors. First when there is a lack of
macroeconomic stability, as experienced by many Latin American countries during the 1970s
and 1980s, people prefer to invest in fixed assets- real estate, jewelry, etc… or to save in
foreign currencies overseas, instead of depositing local currencies in domestic institutions.
Second, savers are willing to deposit money in saving institutions only if they believe that they
will be able to withdraw the money according to pre specified terms. The risk of bank closure
and the availability of deposit insurance become important considerations for potential
depositors. In many countries, governments establish banking regulations such as capital and
reserve requirement to ensure the ability of banks to meet withdrawal demand.
Third, government regulations create opportunities for political abuses. In some developing
countries, for example: banking system is tightly controlled by government officials who see it
as a convenient source of cheap credit for their own expenditure projects and their favored
political clients ( Hanke and Walters, 1991). Offering mostly negative real interest rates to
depositors, the banking system is not an attractive saving avenue for most people (McKinnon,
1973). The limitation of the formal banking system may be compensated by informal credit
arrangements that offer higher returns for depositors, but these informal arrangements are
usually limited in scale and lack legal protection for depositors.
In addition to overcoming obstacles for capital mobilization, credit markets need to overcome
information problems associated with credit allocation (Stiglitz, 1989). First, because of the
potential for default, lenders need to solve the selection problem-screening loan applications
based not just on how much interest the borrowers are willing to pay, but another probability
of default. Second, enforcement problems related to the ability of lenders to ensure that
borrowers will actually repay principals and interests at specific times. Third, loan counteracts
need to include a variety of provisions other than interest rates. Non-price terms such as
collateral and other kinds of restrictive covenants, like market interlinkage, are often needed to
create appropriate incentives for loan repayment.
13
2.1.4. Rural credit, moral hazard and adverse selection
According to Conning and Udry (2005), contracting under asymmetric information lead to
several obvious questions such as, as to why the financial markets and risk sharing
arrangements often fail to achieve efficient exchange even in small village communities, as to
what explains the structure and organization of actual financial markets and why are
diversified outside financial intermediaries such as banks and insurance companies often
reluctant or slow to enter rural financial markets.
Accordingly, the defining characteristic of all financial contracts is that they involve the
exchange of state-contingent promises. But the fear that promises may be broken can limit the
set of credible promises that a would-be issuer can commit to keeping. In a world of complete
markets this problem was abstracted away by simply assuming that all potential contract
breaches could be immediately detected and causelessly deterred, but most of the modern
literature on financial contracting focuses on how asymmetric information and limited
enforcement problems may together limit the set of feasible commitments. This theory has
proven powerful and rich at providing insights with which to interpret the shape of real world
financial contracts and institutional arrangements Conning and Udry (2005).
While the theoretical literature on asymmetric information and imperfect enforcement is rich,
there has been comparatively little empirical work that attempts to characterize the exact
nature and extent of imperfect information in rural financial markets (ibid, PP.32). Chiappori
(forthcoming) is a useful review of relevant literature in the developed country context. Aleem
(1990) provides dramatic direct evidence of the 33 importance of screening costs for lenders.
Klonner (2004) shows that asymmetric information has dramatic consequences for bidding
patterns in (high-value) ROSCA auctions in a village in Southern India. Gine and Klonner
(2003) examine the role of imperfect information regarding borrower type for the structure of
financial markets in a coastal village in Tamil Nadu. They show that uncertainty about
(fishing) entrepreneurs’ ability slows the pace of costly technological innovation for relatively
poor entrepreneurs.
14
Karlan and Zinman (2004) use a randomized intervention to identify the extent of adverse
selection and moral hazard in a South African credit market. They find that about 40% of defaults
in this market can be attributed to one of these types of asymmetric information.
Asymmetric information makes it difficult for a would-be creditor or insurer to be sure
whether the expected probability distribution over state-contingent payoffs associated with a
contract promise is the one being represented by the seller or not, as in the case of adverse
selection (private information about the agent or the project’s characteristics) or moral hazard
(private information about whether a specified action or contingency has occurred or not). In
practice variants of each of these problems may be the concern.
A farmer may promise to work diligently to repay a loan but when that farmer’s harvest fails
and he declares a default a lender may not be able to tell whether this was due to just bad luck
or to the farmer’s mishandling of the loan. Lenders and insurers may also not be able to very
easily verify whether the farmer’s reported harvest failure is genuine or misrepresented.
In each of these cases the problem turns around to bite the borrower or the insuree who will
have a hard time obtaining credit or insurance from any source in the first place unless they
find a way of credibly signaling their commitment.
Problems of commitment can also arise however even when information is perfect and
symmetric because even though actions and outcomes are observed, agents may still be able to
simply renege or walk away from their commitments unless they face credible and effective
sanctions to dissuade such opportunistic default. Some literature refers to this last problem of
opportunistic default as the problem of ‘limited commitment’ (e.g. Ligon et al 1999; Paulson
et al 2003) yet many contracting problems involve an agent’s limited ability to commit to
fulfilling elements of a contract, whether it be to truthfully reveal their type (adverse
selection), to take a specified action (ex-ante moral hazard), to truthfully report an outcome
(ex-post moral hazard), or to deliver on a promise (opportunistic default). Each of these
problems is related and are all believed to play important roles in shaping the pattern of
financial contracting everywhere (Conning and Udry, 2005).
15
According to Ghosh and Mookherjee (1999), in adverse selection concept, defaults arise
involuntarily, owing to adverse income or wealth shocks that make borrowers unable to repay
their loans. The moral hazard in contrast stresses problems with contract enforcement:
borrowers may not repay their loans even if they have the means to do so. Both explain how
borrowing constraints endogenously arise in order to mitigate these incentive problems, even
in the absence of exogenous restrictions on interest rate flexibility.
In line with the above descriptions, the two important problems associated with financial
markets, i.e. adverse selection and moral hazard are discussed.
2.1.4.1. Adverse selection
According to Akerlof (1970), in the usual case, a key condition for the existence of adverse
selection is an asymmetry of information. In Economics, information asymmetry occurs when
one party to a transaction has more or better information than the other party.
The adverse selection theory of credit markets originated with the paper by Stiglitz and Weiss
(1981) (as sighted by Ghosh and Mookherjee 1999). The theory rests on two main
assumptions: that lenders cannot distinguish between borrowers of different degrees of risk,
and that loan contracts are subject to limited liability (i.e., if project returns are less than debt
obligations, the borrower bears no responsibility to pay out of pocket).
Adverse selection arises when borrowers have characteristics that are unobservable to the
lender but affect the probability of being able to repay the loan (Karlan and Zinman, 2004). A
lender can try to deal with this information problem directly, by trying to assess these
characteristics, or indirectly by offering loan terms that only good risks will accept. The
typical method for separating good risks from bad risks is to ask the borrower to pledge
collateral. Risky borrowers are likely to fail more often and lose their collateral. If the bank
offers two different contracts, one with high interest rates and low collateral and the other with
the opposite, risky borrowers will select the former and safe borrowers the latter. But poor
people by definition do not have assets that make useful collateral, meaning that lenders have
no effective way to separate good risks from bad. Group lending deals with adverse selection
by drawing on local information networks to achieve the equivalent of gathering direct
16
information on borrowers and using differences in loan terms to separate good from bad
borrowers (Eston and Gersovitz, 1981).
2.1.4.2. Moral hazard
The problem of moral hazard is immense for formal sector lending but even moneylenders
have not fully overcome it although they can distinguish between bad luck and poor
performance, especially when their clients reside in the same villages Mohiuddin (1993).
According to Gould and Lazear (2002), moral hazard is a problem and it results when one
party insures another against some event over which the insured party has some control.
Once a borrower has taken a loan, the project’s payoff depends in part on the borrower’s
actions, including levels of labor and other inputs. Ordinarily, we would expect the borrower
to choose these actions such that the marginal benefit of each action equals its marginal cost.
That is not necessarily the case with asymmetric information. In the absence of collateral, the
lender and borrower do not have the same objectives because the borrower does not fully
internalize the cost of project failure. Moreover, the lender cannot stipulate perfectly how the
borrower should run the project, in part, because some of the borrower’s actions are not
costlessly observable.
According to Mohiuddin (1993), problem of moral hazard is solved in formal sector poverty
lending by tying credit and savings together, by having a built-in mechanism for emergency
fund to handle unforeseen shocks (due to weather or price changes), and by its emphasis on
borrower-initiated lending to avoid loan use in risky unknown ventures where markets or input
supplies are uncertain.
2.2. Situation of Rural Finance in Ethiopia
Rural finance in Ethiopia, as in other developing countries, has dualistic features. Both formal
and informal saving and credit arrangements exist in the country. The second and the most
important in the rural areas is the informal sources which are categorized as commercial (those
who lend money on short term basis to obtain profit) and non-commercial (lenders that
generally include friends, relatives and neighbors).
17
2.2.1. The emergence and evolution of formal credit in Ethiopia
The formal sources are financial institutions that are set up legally and engaged in the
provision of credit and mobilization of savings. These institutions are regulated and controlled
by the National Bank of Ethiopia (NBE).
Here we can categorize evolution of formal rural credit services in Ethiopia by three period of
times; i.e. rural credit in Ethiopia before 1975, during the Derge period and after Derge
regime.
2.2.1.1. Rural credit before 1975
The present banking systems and formal credits structure can be traced back to 1905 when the
National Bank of Egypt established the Bank of Abyssinia, the first bank in Ethiopia. The
Bank of Abyssinia was liquidated by the imperial decree of August 29, 1931 and was replaced
by the Bank of Ethiopia with 60% of the capital owned by the government and 40% by the
general public. The Bank of Ethiopia was also closed in 1935 following the Italian invasion,
and Ethiopia had no banking system of its own until 1942 when the State Bank of Ethiopia,
authorized by the imperial charter, was established with a capital of 1 million Maria Theresa,
fully subscribed by the Ministry of Finance.
Following the creation of the Ministry of Agriculture in 1943, the Agricultural Bank of
Ethiopia was established to accelerate agricultural development by assisting small landholders
whose farms had been devastated during the Italian occupation through loans for purchase of
seeds, livestock and implements and to repair or reconstruct their homes and farm buildings
(Tesfaye, 1993). Public banks were supposed to mobilize resources and channel them in
accordance with the Second Five years Development Plan. The Plan identified, which
identified (i) agriculture as the leading economic activity, (ii) Mining, manufacturing and
power as “the most propulsive sectors. The Plan made a distinction between credit for
investment and current transactions and gave priority in investment credits to “directly
productive” economic activities. The Plan also allowed for interest rate discrimination
between borrowers favoring businesses that are in conformity with the Plan. Credit access was
not to be discriminated by ownership. Instead, the Plan explicitly recognized the private and
18
public sectors as equally important. Regarding rural finance, the share of agriculture reflected
the importance attached to it in the Plan. Subsistence and large-scale and mechanized
agriculture together were to receive about half of the bank credit. Subsistence agriculture was
transformed through (a) the introduction of improved tools and implements, modern
techniques, and better seeds; (b) credit, price and tax policies; and (c) land reform and
agricultural services (Assefa, 2004).
Accordingly, farmers were to be assisted to produce more marketable surpluses, and thereby
develop the subsistence agricultural sector into a monetized one. Credit for farm tools and
implements were to be extended by the Development Bank of Ethiopia not directly but
through the then Grain Corporation or Farmers’ Cooperatives. These institutions were to
receive credit funds and then buy the implements and supply them to farmers on credit (to be
repaid in kind) or lease or sell them on credit if they are expensive - such as selectors,
threshing machines, winnowers, etc… (to be repaid in cash). It was explicitly stated that credit
was to be provided only in goods and services, the reason being to ensure that it is used only
for productive purposes. These practices were expected to raise production as a result of rapid
application of efficient implements and lead to commercialization of peasant agriculture due to
increased marketable agricultural output. Priority for credit among farmers was to be
determined by the co-operatives with advice from extension agents.
Banks were also to extend credit to commercial farms for modern tools, fattening, etc... and
fishing co-operatives at favorable terms. High collateral as high as 200% of the loan, mainly in
the form of real property and machinery, and guarantor requirements, in the face of
widespread tenancy, land title problems e.g. communal land, rist system, etc..., proved to be
the major hindrances. Of the total DBE loans disbursed during 1951-69, only 42 per cent went
to agriculture, of which small farmers received only 7.5 per cent. The successor of DBE, the
AIDB whose objective, among others, was to mobilize funds and extend medium- and long-
term agricultural credit, did not do a better job in terms of reaching farmers with credit either.
19
In fact, its credit policy disqualified peasant farmers in areas away from the main road, without
many borrowers, required property collateral (which should be insured at the borrowers
expense) ranging 100 to 200% of the amount borrowed, and/or personal guarantor; and
required borrower farmers to sell their output to its subsidiary at fixed prices as a means of
enforcing repayment (Tesfaye, 1993). The implication of these on peasant farmers’ credit
access is clear. While the share of agriculture in AIDB total credit during 1970/71-74/75 was
high, averaging about 65 per cent, peasant farmers did not benefit much. It mainly went to
dairy development projects, large farmers, co-operatives of commercial farmers, etc….
The comprehensive and minimum Agricultural Extension package programs, which were
intended to support small farmers by, among other things, organizing them in a way that
makes it easier and less costly for the AIDB to provide credit, did not achieve much in terms
of reaching small farmers partly due to the stringent requirements involved such as high down
payment (25 to 75%), two reputable guarantors (one of them the landlord in case of tenant
borrowers), and signed lease agreement and partly due to incentive problems associated with
the share cropping arrangement that prevailed and marketing problems. Just like what
happened in most credit programs of other countries, benefits mainly accrued to the non-target
groups (landlords, large landowners/big cultivators, merchants, etc.). Overall, the extent of
exclusion was well recognized by the AIDB board so much so that in 1974 it decided to
introduce a small farmers credit program on pilot basis but was not implemented as it was
overtaken by events of the revolution (Tesfaye, 1993).
20
2.2.1.2. Rural credit during the Dergue period
After the fall of Emperor Haile Silassie government, the financial system in Ethiopia was
nationalized and restructured based on the 1976 Banking Law. The credit policy was geared
towards the overall policy of the country’s centralized economic management. All elements of
financial repression existed during this period in their severe form: controls on financial prices
(i.e. interest rates and exchange rates) and restrictions/control on new entry into the sector as
well as on the activities and portfolios existing financial institutions. Interest rates on loans to
different economic and social sectors were administratively fixed. The rate structure bears
little relationship with the opportunity cost of capital or the rate of inflation. All financial
institutions were publicly owned and entry was banned, thereby establishing a public
monopoly of the financial sector. Credit policy gave absolute priority to the socialized sector
public enterprises, state farms and cooperatives. Loans and advances by borrowing institutions
over the ten year period between 1981 and 1990 show that on average the government sector
took 36.4% of the total, while 50.3% went to public enterprises and the private sector’s share
was only 8.3% of the total loans and advances made by the banking system during the period.
More than 89 percent of AIDB agricultural loans went to state farms while the rest went to
agricultural co-operatives, with the private peasant sector receiving negligible share.
Discrimination against the private sector was not limited to credit access. The interest rate
schedule explicitly discriminated against the private sector. The NBE set lending rates ranging
between 4.5 – 9.5 percent, depending on the type of ownership and sector.
In many instances, banks have been directed by the NBE to lend for nonviable investments in
the public sector. As a result, most of the funds disbursed to the public enterprises, particularly
state farms, have remained uncollected, leaving the banks with low rate of growth of capital
and reserves. Among the financial institutions, the AIDB suffered serious capital depletion,
with its net capital becoming negative by the end of the 1990 fiscal year. Repayment problem
of the AIDB was so severe (highest 68% in 1988 and lowest of 11% in 1993) that it had to
terminate its agricultural inputs loans to rural households (Wolday, 2003) just as its
predecessor, the DBE, did in 1961. Therefore, the outcome with regard to reaching small rural
borrowers with financial services was disappointing both during the Imperial and Derge
regimes. Within the agricultural sector, registered FMSCs and producers’ cooperatives were
eligible for bank credit except for agricultural input loans. Lack of registration of these
21
cooperatives was the main impediment to the expansion of credit. For instance, as of May
1990, the percentage of registered Service Cooperatives was only 48, while that of the
producers’ cooperatives was only 14. So, the chance of getting credit by small producers was
very low. This is evident from the amount of rural credit that went to the peasant sector, out of
the overall supply of rural credit through both AIDB and CBE during the period 1982 – 1992
only Birr 792 million (9%) went to the peasant sector. Considering the large number of rural
population, the size of land under cultivation and the demand for credit, the volume of loan
extended to this sector was insignificant. Credit delivery systems have been insufficient to
serve the rural people.
2.2.1.3. Rural credit after the reform period
Following the fall of Derge regime, Ethiopia has followed free market economy, which
advocates financial liberalization. Financial liberalization is important component of a
successful development strategy. Both economic theory and practical experience suggest that
financial liberalization can stimulate economic development.
Financial liberalization in Ethiopia began at the end of 1992. The financial reforms undertaken
in Ethiopia include elimination of priority access to credit, interest rate liberalization,
restructuring and introduction of profitability criteria, reduced direct government control on
financial intermediaries and limits bank loans to the government, enhancement of the
supervisory, regulatory and legal infrastructure of the NBE, allowing private financial
intermediaries through new entry of domestic private intermediaries (rather than privatization
of the existing ones) and introduction of treasury bills through auction markets. Prior to 1992,
the interest rate charged to farmers’ cooperatives was 5%, which is below the rate of savings
deposit (6%). Financial institutions were obliged to pay interest margin on deposits from their
own sources. Lending rates that were between 4.5 and 9.5% were raised to 11-15% depending
on the sector until September 1994.
22
Discrimination of credit access and interest rates by type of ownership (i.e. between state
owned enterprises, cooperatives and private firms) was eliminated. Sectoral interest rates
discrimination was reduced, and domestic establishment of private financial institutions was
allowed and encouraged through proclamation number 29/1992. Since January 1995, the NBE
switched to a policy of floors on deposits and ceilings on lending rates, allowing banks to set
interest rates. The NBE revised the floor for saving deposits downwards to 3% from 6% in
2001/02 with an intention of encouraging investment and boost economic activity. Lending
rates quickly followed suit as the minimum-lending rate changed by commercial banks went
down from 10.5% to 7.5% in the same period.
Also, banks have been decentralizing loan decision making in order to reduce transaction costs
of borrowing and reducing screening hence transaction costs of lending. Entry restrictions into
banking were lifted for domestic banks. Entry rules and guidelines have been drawn. The
lending approaches of banks to target beneficiaries could be both a direct type and a two-tier
system. The direct type is in which the Bank extends credit directly to the end user. This could
be an individual person or organization such as cooperatives, government or private
enterprises, which have legal entity. In the two-tier approach, the Bank transfers its financial
resources to end users through other bodies such as cooperatives and peasant associations. In
the case of the first type, the credit beneficiaries enter loan agreements with the bank and are
responsible for repayment of the borrowed loan, whereas in the case of the latter other
intermediaries such as cooperatives or associations sign a loan contract with the bank and
channel the borrowed fund to their members or end users.
In the case of rural Ethiopia, regional governments act as intermediaries between banks and
farmers. These governments use their federally allocated budget as collateral to borrow from
banks and lend these funds to farmers for the purchase of agricultural inputs. This procedure
has enabled banks to lend a great deal of money to farmers. Nevertheless, there have been
cases of default, which have necessitated repayment out of the budget allocations of the
regional administrations. However, the inability of the formal financial sector to provide
adequate financial services to small farmers and the poor in general continued even after the
reform.
23
As compared to other economic sectors the share of agricultural sector in the total credit
disbursed by the banks has continued to be marginal. For instance, the share of agriculture in
the total credit disbursed between 1991/92 and 1997/98 has only been 14.7%, while domestic
trade had 32.2% and industry 13.2%. Recently, the share of agricultural credit stagnated at
around 16% and never exceeded 19% of the total credit disbursed. In addition, it is believed
that almost all of the agricultural credit is of short-term nature, which will have little impact on
long-term investment and transformation of agriculture. The financial resource that flows to
the sector is in general low when compared to the sector’s actual and expected contribution to
the economy growth in agricultural versus non-agricultural (Assefa, 2004).
The absence of an effective peasant institution for credit delivery is the other major problem
associated with the existing credit system in Ethiopia. A typical service cooperative has over 5
to 6 member peasant association or over 1000 member households. It is simply too large to
provide effective screening of borrowers, identify genuine defaulters, generate reliable demand
information, and/or exert any form of peer pressure on members to make timely repayment of
debts. At present, local community participation in screening borrowers and filtering genuine
defaulter is minimal. The authorities and the leaders of FMSCs have no objective means of
assessing the extent of crop loss. Weak cooperatives are also the main reason for the
government intervention in the credit market and diversion of valuable extension time to
administrative affairs. Hence, the effort to restructure FMSCs into smaller groups needs to be
stepped up (Mulat et al., 1998).
2.2.2. Formal financial institutions in Ethiopia
During fiscal year 2002/03, the numbers of banks where remained nine, of which three were
government owned. The number of insurance companies also stayed at nine, of which one was
state owned (annual report of NBE, 2004). According to the report, foreign entry in to the
financial sector is not allowed until domestic banks attain a certain degree of desired
competitiveness and the National Bank’s supervisory and regulatory capacity is adequately
strengthened.
24
The numbers of bank branches reached 339, of which 172 or about 51 percent belong to the
Commercial Bank of Ethiopia. Despite modest branch expansion, Ethiopia remains as one of
the under-banked countries even at sub-Saharan African countries standard. The bank branch
to population ratio was 1:20,400 during 2002/03. Similarly, total capital of the banking system
reached Birr 2.7 billion, of which about 75 percent was hold by government owned banks.
Commercial Bank of Ethiopia accounted for more than 47 percent of total capital of the
banking system (excluding NBE), NBE (2004) (Annex 1).
At the same time, total branches of insurance companies reached 106 at the end of the fiscal
year (2002/03). Yet geographical distribution of bank and insurance branches was highly
skewed to major towns and cities. Nearly 42 percent of insurance and 31 percent of bank
branches were located in Addis Ababa (Annex 2).
The number of micro-finance Institutions (MFI’s) that operated in the country has reached 22
at the end fiscal year 2002/03, (NBE, 2004). Their total capital stood at Birr 299 million, they
mobilized deposits of Birr 302 million, advanced loans of Birr 528 million and total assets at
Birr 791 million, by the end of the fiscal year. Of the total MFI’s, 10 were operating in Addis
Ababa, 5 in Oromia, 2 in Amhara. The bggest MFI namely , Dedebit Credit and Savings
Institution alone accounted for 47.1 percent of the total capital, 43.5 percent of savings, 34.9
percent of credit and 39.7 percent of the total asset of MFI’s. Amhara Credit and Saving
Institution is the third biggest MFI after Dedabit and Oromia Credit and Saving Institutions
(Annex 3).
2.2.2.1. Amhara Credit and Saving Institutions (ACSI)
Amhara credit and saving institution (ACSI) is a largest micro-finance in the region, which
provides micro credit and saving, and money transfer services. Since its inception in 1995
ACSI has been helped so many poor households live a moderately specified well being. At the
beginning it started its credit services as a local NGO for most vulnerable part of the society.
The institution stretched throughout the region in all woredas and covers about 20 percent of
kebeles as of May 2004. Since its establishment ACSI served more than 482, 083, loan clients
and currently it has about 288, 681 active loan clients and 449, 345 active saving clients BoRD
(2003).
25
It’s extending credit for small-scale enterprises agricultural inputs and housing construction
and maintenance for government employees. The main target groups of the institution are the
productive poor households, which fulfill the eligible criteria of creditworthiness.
According to BoRD (2003), the minimum loan size that provided by the institution is 150 Birr
while a maximum of 15,000 Birr. Most loans are basically have a one year duration. In
addition it changes 18 % interest rate for its loans. It has also model, which is a group pressure
as a loan guarantee methodology to provide credit service to the rural poor. In addition to
group lending ACSI implemented individual lending for government employees for residential
house construction.
2.2.2.2.Cooperatives in Ethiopia
Cooperation is the way of life of Ethiopians and has a long year of experience. This
cooperation may be cultural or religious organizations that make the population a close tie. For
example, iddir /focuses on funeral celebration/, ikuib /which helps for saving money and self
help to the members/, and wenfiel / which is focused on the cooperation on labor peak times
like in the time of harvest, wedding etc./.
However, a modern cooperative in Ethiopia was started at the time of emperor Hileselasie first
in 1961. During this time the first cooperative legal action was made and it is known by
Decree number 44/1961. The second attempt towards legal cooperatives was in 1964, and the
time was the end of first Five Year Development Plan. The first cooperative organization legal
proclamation known as proclamation number 241/1964 was declared. Based on this
proclamation 158 cooperatives were established with 33, 400 members and 9, 970, 600 Birr
total capital.
In 1974 Emperor Haileselasie government fall and was replaced by a socialist type of
government. This government proclaimed cooperative organization proclamation in 1978, and
it is called proclamation number 138/1978. Up to 1990 there were 10,524 different types of
cooperatives with 4,529,259 members and combined capital of Birr 465,467,428 throughout
the country. From these cooperatives 80% were rural cooperatives.
26
During the 1991 change of the government, the negative view towards cooperatives was
manifested in the actions of the farmers of looting and destroying FMSCs property and
records. The FMSCs themselves became notorious for waste and mismanagement. According
to Dessalegn (1994) more than 24 million Birr was misappropriated by those FMSCs, which
the ministry of agriculture had audited. That was almost certainly just the tip of the iceberg,
given that audits were carried out on fewer than 25% of cooperatives.
Wolday (2003) revealed that, the present Government, which was not very sympathetic to
cooperatives initiated by the former government, issued a proclamation in 1995 to reactivate
cooperative movement in the country. Member-led co-operatives are thought to be necessary
to reduce transaction costs and enhance the bargaining position of small farmer. However, in
1994 there was an attempt to strengthen the rural cooperatives. Among the basic action the
government took in this time was the proclamation of agricultural cooperatives, proclamation
no 85/1994.
Cooperative societies now provide a wide range of services, including the supply of inputs,
output marketing and distribute consumer goods. But bad experiences in the past, insufficient
capital, lack of managerial skills and inadequate support from CPB/ offices have not helped
the cooperative movement.
In 2004, the total number of cooperatives reached 7, 640 with 3,762,969 members and total
capital of Birr 316,140,725. The number of agricultural cooperatives was 54% of the total
cooperatives.
In ANRS a total of 1,025 FMSCs with combined capital has reached 45,132,744 Birr on July
2002. In 2004 around 622 (60.68%) FMSCs are actively engaged in agricultural input credit
extension activity. They administered most of the fund borrowed by the regional government
from commercial banks. They administer more than 80% of the input credit in year 2004 in the
region (ARCPB, 2005). The cooperatives have accumulated experiences in credit extension
and repayment collection.
27
2.2.3. Informal financial sector in Ethiopia
According to G/Yohannes (2000), compared with the formal financial institutions, informal
lending is by far the most important source of finance to the rural and urban population. In
recent years, the informal sector has continued to assume increased prominence mainly due to
restrictive rules and regulations of the formal financial sector. The operations of the informal
sector derive their rules and regulations from the country’s culture and customs. Informal
sector transactions are conducted on the basis of trust and intimate knowledge of customers.
The common cultural background and the mutual obligations and fervent bonds of family and
kinship, all operate to promote the trust, accountability and moral responsibility that is lacking
in the official banking system.
Besides, the informal lenders have easy access to information (at reasonable cost) about their
borrowers with whom they have social relations. This permits credit contracts to play a more
direct role in enforcing repayment. Also, the fact that collateral is rarely used in the informal
sector enables it to flexibly satisfy financial needs that cannot be met by the formal financial
institutions (G/Yohannes, 2000).
Nevertheless, the informal sector is not without limitations. Despite its flexibility, rapidity and
transparency of procedures, not only are there scarcities of loanable fund for investment, but
also the interest rates charged on these loans are often exorbitant. The informal financial sector
often embraces a wide group of individuals and institutions whose financial transaction are
generally not subject to direct control by the country’s key monetary and financial policy
instruments. Individual economic entities in the informal sector include moneylenders, money-
keepers, tradesmen, friends and relatives, neighbors, etc….
28
2.3. Empirical studies on loan recovery and defaults
Knowledge of determinants of loan repayment is undoubtedly important for it provides
information to be the lender on the incentives available for the borrower to comply with
repayment schedules. Loan repayment performance is affected by a number of socioeconomic,
institutional and natural factors. Some of which are believed to impact on repayment
negatively while others have positive impact. Various studies have been carried out
concerning loan repayment performance of borrowers in several countries. The following
presents the findings of studies on loan repayment performance.
Major socioeconomic variables that affect credit repayment include education, age of
household head, family size, gender of household head, etc…. Family size is expected to
affect loan repayment performance positively. This is because farmers with more families may
have more labor force for more diversified sources of income. For instance, Schreiner and
Nagarajan (1997), in a case study in Gambia,reported that large households are better in credit
risks. Where as Bhenda (1983) in his Indian case study, revealed that households with large
family were more prone to defaults. Also, Kashuliza(1993) reported a negative but statistically
insignificant relationship between household size and repayment performance.
Educational level of household head is another socioeconomic variable that affects loan
default rate both positively and negatively. For instance, Mengistu (1997) conducted a study
on the Market Town Development Program (MTDP) Credit Scheme of Bahir Dar and Awassa
towns using a binomial probit model. The study indicated that education has positive impact
on loan repayment. In addition, Ike (1986), in his economic and financial analysis on the
problem of loan default in Nigeria recommended that to improve loan recovery, educational
level of borrowers should be improved. On the other hand, Matin (1997), in his study on loan
repayment performance of borrowers in Bangladesh obtained a significant and negative
relationship between education status of the household and loan default rate. Bekele et al
(2003), in his Ethiopian case study revealed that, even if the variable was statistically
insignificant there was a negative relation ship between educational status of household head
and household’s loan repayment performance. According to him the reason was that literate
farmers were on average younger than the illiterate ones and that older farmers have the
tendency to accumulate more wealth and were better able to pay the loans they borrowed.
29
Similar findings were also reported by other researchers. For instance, Njaku and Obasi
(1991), in their Nigerian case study and Yaqub (1995), in his Bangladesh case study indicated
that education was negatively related with loan repayment.
Another socioeconomic variable that affects loan repayment performance is age of household
head. Logically as age increases the repayment capacity of borrowers is expected to increase.
This is because through time farmers acquire experience and knowledge of credit uses.
Moreover, older farmers are in a better position to accumulate wealth than younger ones. This
logical expression was supported by Berhanu’s (1999) result. According to him the age of a
borrower has positive impact on full loan repayment. On the other hand, even though the
coefficient showed absence of disparity between the categories of borrowers, there was a
negative relationship between age of borrower and repayment performance (Bekele, 2001).
As far as gender of household head is concerned, an empirical study made in Guyana by Hunte
(1996) using logistic regression model showed that male borrowers generate low default risks,
minimum or low credit rationing (giving nearly the amount the borrower requested or
demanded) and high repayment performance. Where as, the finding of Yaqub (1995) showed
that women were better than their male counter parts in loan repayment performance.
Another socioeconomic variable that affects loan repayment is farm size. Belay (2002), used
maximum likelihood estimates of the logistic regression model and showed that farm size was
important factor influencing the loan repayment performance of rural women in Eastern
Ethiopia. That is, the total farm size, which is a proxy for a host of factors including wealth
and income, has a significant and positive impact on loan repayment performance. Similarly,
Sharma and Zeller (1997) in their Bangladesh case study revealed that land holding had
negative and significant effect on the delinquency. Like wise, Matin (1997) by his study of
repayment performance in Grameen Bank, reported that the total operated land holding of the
households was negatively associated with default after a certain level.
30
Livestock ownership is another socioeconomic variable that affects repayment performance.
Belay and Belay (1998) in a case study at Alemegena District (Ethiopia) found out a
significant positive relation ship of livestock ownership and loan repayment performance of
farmers. Accordingly, animal production was found to be important source of cash income
during sharp fall of crop prices. Also, Bekele (2001) in his Ethiopian case study using logit
model revealed that value of total livestock holding has positive impact on loan repayment
performance of smallholder farmers. According to the study, farmers who owned more
livestock were able to repay their loans even when their crops failed due to natural disaster.
With regard to the relation ship between off-farm activities income and loan repayment
performance, Sharma and Zeller (1997) reported that off- farm income negatively influenced
loan repayment performance of group-based borrowers of Bangladesh. According to the
authors, off-farm income might increase willful default, as income was generated from various
sources, the borrowers might become reluctant and might not give more emphasis to loan
repayment. Similarly Bekele(2001), in his Ethiopian case study, revealed that off-farm income
influenced the loan recovery of farmers negatively. According to him, larger proportion of
defaulter households participated in off-farm activities than the non-defaulters. Households
who exercise off-farm activities probably gave less attention to farm affairs as income was
generated from different angles. In other words, households who generate income form off-
farm sources tend to be will full defaulters, because the punishment, which could be inhibition
of access to credit in the following season, may be less painful to them as they are less
dependent on farm activities. The other possible explanation is that households who take part
on off-farm activities may divert input loans to supplement the off-farm business.
Institutional variables were another factors, which could affect loan repayment performance of
smallholder farmers. Possible institutional factor that affect loan repayment include extension
contact, source of credit, loan amount etc… As far as source of credit is concerned, Miller
(1997) indicated that the principal reasons for some loans not to be repaid are: borrowers
anticipate a change in credit policies or because they lack confidence in the ability of credit
institutions’ to provide credit in the following year. Wenner (1995) stated that, formal lenders
find difficult and costly to ascertain accurately the likelihood of defaults; and monitor closely
how borrowers use funds and what technologies they choose for project implementation. Thus,
borrowers may not take actions that make repayment more likely (moral hazard). Weak legal
31
system, lack of secured collateral, and pervasive views that government bank loans are
patronage magnify loan enforcement costs for formal loans. In contrast, informal lender faces
substantially lower screening and monitoring costs because of social proximity and multi-
stranded relationships with clients. Thus, credit obtained from informal sources has high
likelihood of being repaid than credit obtained from formal sources. For instance, Bhende
(1983) reported that defaults were endemic in institutional credit; they were infrequent in
informal credit. Absolutely speaking, the largest defaulters were those households who have
borrowed most from institutional sources.
Loan amount is also another prominent factor that affects loan repayment performance. Vigno
(1993) in a case study of Burkina Faso stated that large loan amount receivers were better
payers than less amount of loan receivers. This result is in complete agreement with that of
Bekele et al. (2003) who in a case study of Ethiopia using logit model, stating that farmers
who took larger loans had better loan repayment performance. According to them, this could
be attributable to the effectiveness of local leaders in screening loan applications. The results
of Belay and Belay (1998) also strengthen the finding of negative relation ship between loan
default and loan amount. Similarly, Sharma and Zeller (1997) used Tobit model and found
that, in Bangladesh the grater the loan size, the greater the probability of unwilling default.
This was because in the event of project failure, the borrower or group of borrowers will find
it more difficult to meet repayment obligations out of their personal funds. Berhanu (1999)
also reported that loan size contributed to reduction of the probability of full loan repayment in
Ethiopia.
Different researchers emphasized the influence of the frequency of farmer’s contact with
development agents on loan repayment performance. Logically, the higher the linkage
between farmers and development agents, the more the information flow and the technological
(knowledge) transfer from the later to the former. Therefore, the farmers who have frequent
contacts with development agents are likely to settle their debt timely as opposed to those who
have no or less contacts. Jama and Kulundu (1992) analyzed small farmers’ credit repayment
performance in Kenya and found that, inadequate supervision and advice to farmers were
positively related to the proportion of loan diverted. The proportion of loan funds diverted to
non-intended purposes was also positively related to the proportion of arrears on loan given to
the farmers and was significant at 5 percent level. Similarly, Belay and Belay, 998) also
32
reported that, those farmers who made frequent contact with development agents were those
who paid their loans back to the lenders in time where as those who had less or no contact
were defaulters.
Effect of loan diversion on loan repayment performance of smallholder farmers, was also
studied by some researchers. For example, Mwijilo (1987) reported that about 50 percent of
the loanees who had defaulted assigned higher priority to off_farm uses of the income. This
result was supported by Fentahun’s (2000) finding in Dire Dawa Case. His fitted Tobit model
revealed that if a sizable amount of loan is diverted for productive ends by the borrower, then
repayment will be affected positively and vice versa otherwise.
Moreover, there are already very useful surveys and edited volume of articles covering
important aspects of the now vast literature on other factors that affected loan repayment
performance of smallholder farmers. A non-exhaustive additional list of key empirical studies
might include Ike (1986), Bekele (1995), Edelegnaw (1999), Mosely(1995) etc….While
considerable overlap with those earlier studies is inevitable in the present work, in this study
an attempted was to place more emphasis than earlier studies on continuity characteristics of
dependent variable and method of data analysis.
33
3. METHODOLOGY
The first section of this chapter describes the study area. The sampling procedure and data
sources are presented in section two. Section three presents variable specification and
hypothesis. Section four discusses the method of data analysis.
3.1. Description of the Study Area
3.1.1 Amhara National Regional State
The Amhara National Regional State (ANRS) is one of the states of the Federal Democratic
Republic of Ethiopia. The ANRS is located in the Northwestern part of the country (Figure 1)
between 8045' and 13
045' North latitude and 35
045'and 40
0 25' East longitudes. The boundaries
of the ANRS adjoin Tigray in the North, Oromia in the South, Afar in the East, Benishangul
Gumuz in the South West, and Sudan in the North West. The State is divided into 11
administrative zones, including the capital city of the region, Bahir Dar. The other 10
Administrative Zones are: East Gojam, West Gojam, Awi, North Gonder, South Gonder, Wag
Himra, North Wollo, South Wollo, North Shewa, and Oromia (BOPED 2002). The region
consists of 101 districts and 5,300 rural and urban kebeles (UNECA, 1996).
The total area of the region is 170, 752 km2. Topography is divided mainly into plains,
mountains, valleys, and undulating lands. The high and mid-altitude areas (about, 65% of total
areas) are characterized by a chain of mountains and a central plateau. The lowland part,
constituting 33% of the total area, covers the Western and Eastern parts of the region; these are
mainly plains that are large river drainage basins. Of the total area of the region, 27.3% is
under cultivation, 30% is under grazing and browsing, 14.7% is covered by forest, bush, and
herbs, and 18.9% is currently not used for productive purposes. The remaining 9.1% represent
settlement sites, swampy areas, and lakes (UNECA, 1996).
The population of the region was estimated to be 17.7 million in 2003. Of these, 90.3% live in
rural areas. Mean population density is 91 persons /km2 and ranges between 39 perosns/km
2 in
Wag Himra to 151 persons/ km2 in West Gojjam (BOPED, 2002). Persons below 25 years of
age form more than 65% of the population. A large proportion of the population in ANRS
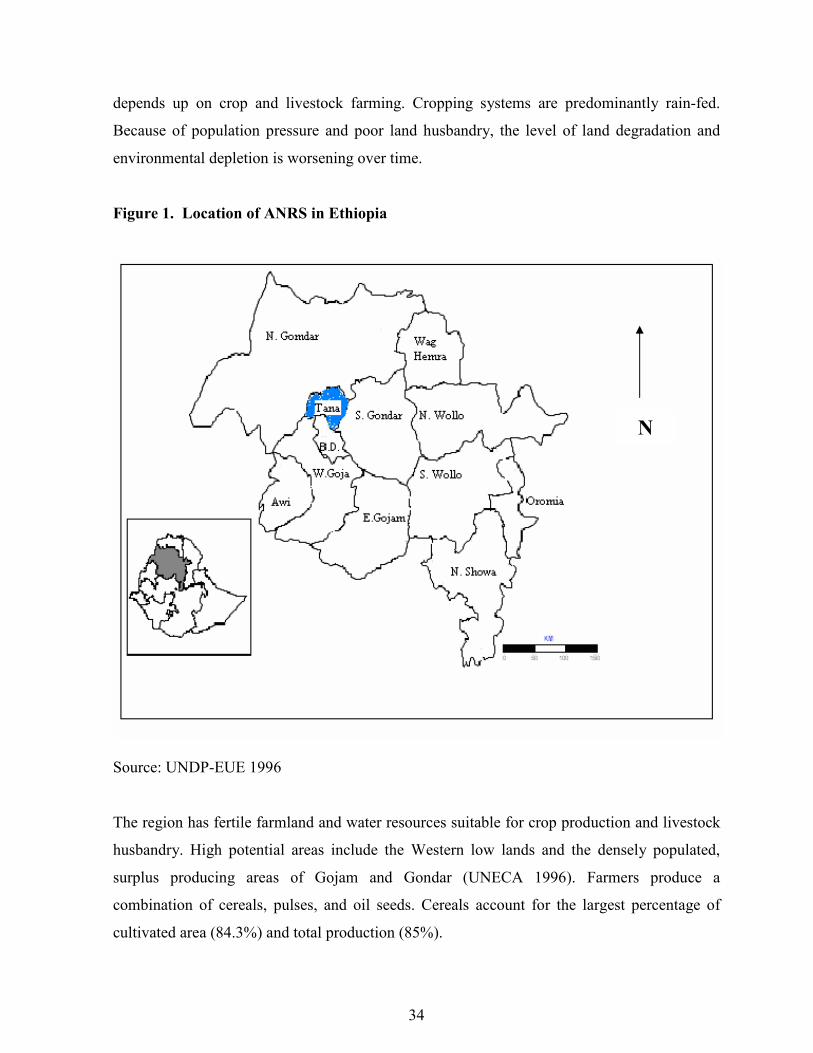
34
depends up on crop and livestock farming. Cropping systems are predominantly rain-fed.
Because of population pressure and poor land husbandry, the level of land degradation and
environmental depletion is worsening over time.
Figure 1. Location of ANRS in Ethiopia
Source: UNDP-EUE 1996
The region has fertile farmland and water resources suitable for crop production and livestock
husbandry. High potential areas include the Western low lands and the densely populated,
surplus producing areas of Gojam and Gondar (UNECA 1996). Farmers produce a
combination of cereals, pulses, and oil seeds. Cereals account for the largest percentage of
cultivated area (84.3%) and total production (85%).
N
35
3.1.2. North Gondar Administrative Zone
North Gondar Administrative Zone is located in the north –western part of the country (Figure
2) between 11056' and 13
045' North latitude and 35
011'and 35
0 50' East longitudes, 738 km.
from Addis Ababa. The boundaries of the Zone adjoin Tigray region in the North, Ageawe
Zone and West Gojam Zone in the South, Waghimra Zone and South Gondar Zone in the East
and the Sudan in the West. The zone comprises 18 woredas of which one is urban.
The total area of the Administrative Zone is 50,970 square kms. Most of it is located in the
North Central massif area of the highlands.
In striking contrast to the central massif are the lowlands located in the western region of
North Gondar Zone along the border of Sudan characterized by higher temperatures and
fragile soils. The low lands contain some of the largest tracts of semi-arid natural forest
remaining in Northern Ethiopia.
3.1.2.1. Population characteristics
According to the Amhara regional state Finance and Economic Development Bureau
projection, based on the 1994 national census, the total population of the North Gondar Zone
2,606,963 of which 1,319,662 are males and the rest 1,287,301 are females. The population
density is 54.11 persons per square km.
3.1.2.2. Farming system
The farming system of the study area is largely characterized by crop-livestock production
system (mixed farming systems). According to 2003 report of Central Agricultural Census
Commission, of the total agricultural holders reported in the region, the second largest number
of agricultural holders next to South Wollo Zone (16.3%) was found in North Gondar Zone
(14.3 %). Out of the total rural agricultural holders those who are engaged in crop production,
livestock and both crop and livestock productions were estimated to be 16.07 %, 8.58 % and
75.35 %, respectively. As far as the employment status of population engaged in agricultural
activities, about 72 percent of the population agricultural households age 10 years and over
was fully engaged in agricultural activities, while only 26.2 percent of the population were
36
partially engaged in agricultural activities. The proportion of population engaged in non-
agricultural activities only was negligible, amounting to 1.8 percent. Of the total land area
recorded in the region, the largest area is contributed by the Zone (29.85 %). The total land
holding area under different land uses was estimated to be about 570,160 hectares, in the zone.
Of this land, area under annual crops accounted for 507,474 hectares (89%), land under
permanent crops was estimated to be 2,347 hectares (0.4 %); grazing land amounted to be
12,312 hectares (2.2 %); fallow land is reported to be 37, 274 hectares (6.5 %); wood land
amounted to be 441 hectares (0.1 %) and land for other uses is estimated to be 10,311 hectares
(1.8 %). The average size of holdings was 1.29 hectares. The cropland areas that are actually
irrigated in 2001/02 were only 3142 hectare and this accounted for about 1.8 % of the total
cropland areas.
Livestock are also important in the farming system of the Zone. They serve as a source of
draught power, transport, income, food, fuel and manure. The major animal species kept in the
study areas are cattle, goats, sheep, and equine. According to CSA (2002), the study area has
1,906,822 cattle, 513,765 sheep, 678,575 goats, 37,715 horses, 220,639 asses, 12,360 mules,
704 camels, 3,122,485 poultry and 152,587 Beehives. The main sources of power for land
cultivation in the study area are oxen and family labor.
3.1.2.3. Climate and topography
The altitude of the Zone ranges from 4620 meters in the semen mountain in the North to 550
meters in the western parts of the study area and rainfall varies from 880 mm to 1772 mm with
the maximum temperature of 44.50c in the west and minimum temperature of –10
0c in the
highland. The area is also characterized by two seasons, the wet season, from June to
September and the dry season from October to May.
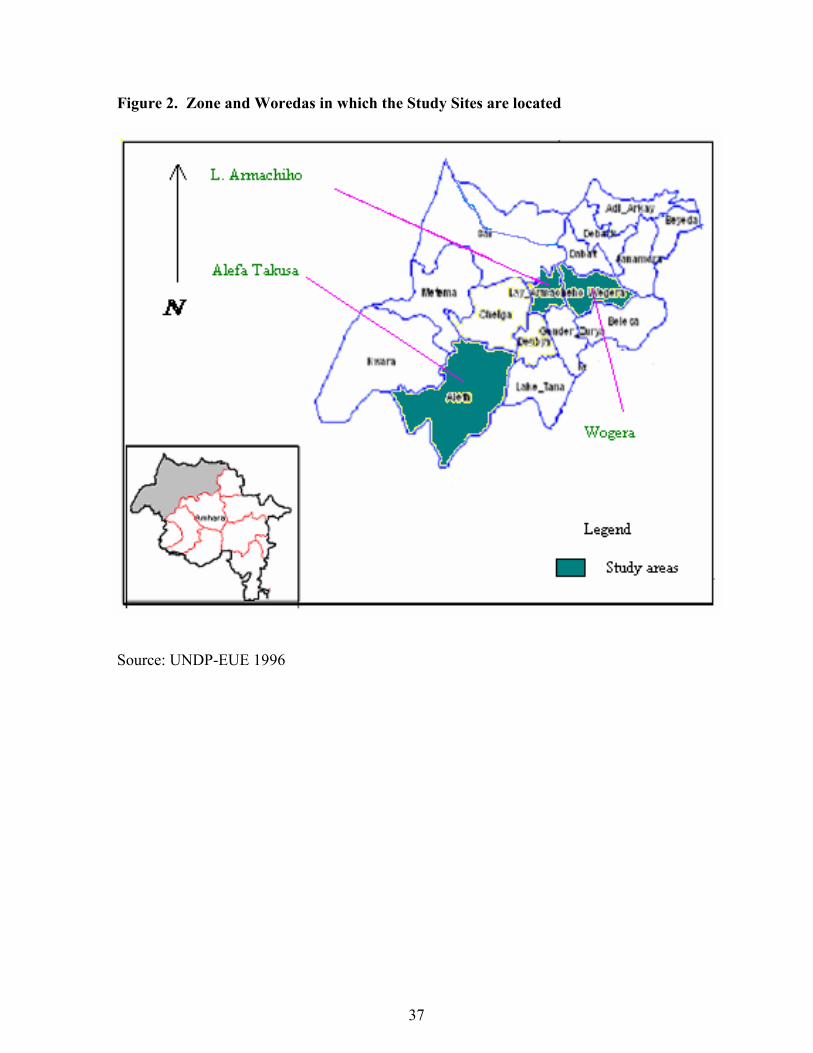
37
Figure 2. Zone and Woredas in which the Study Sites are located
Source: UNDP-EUE 1996
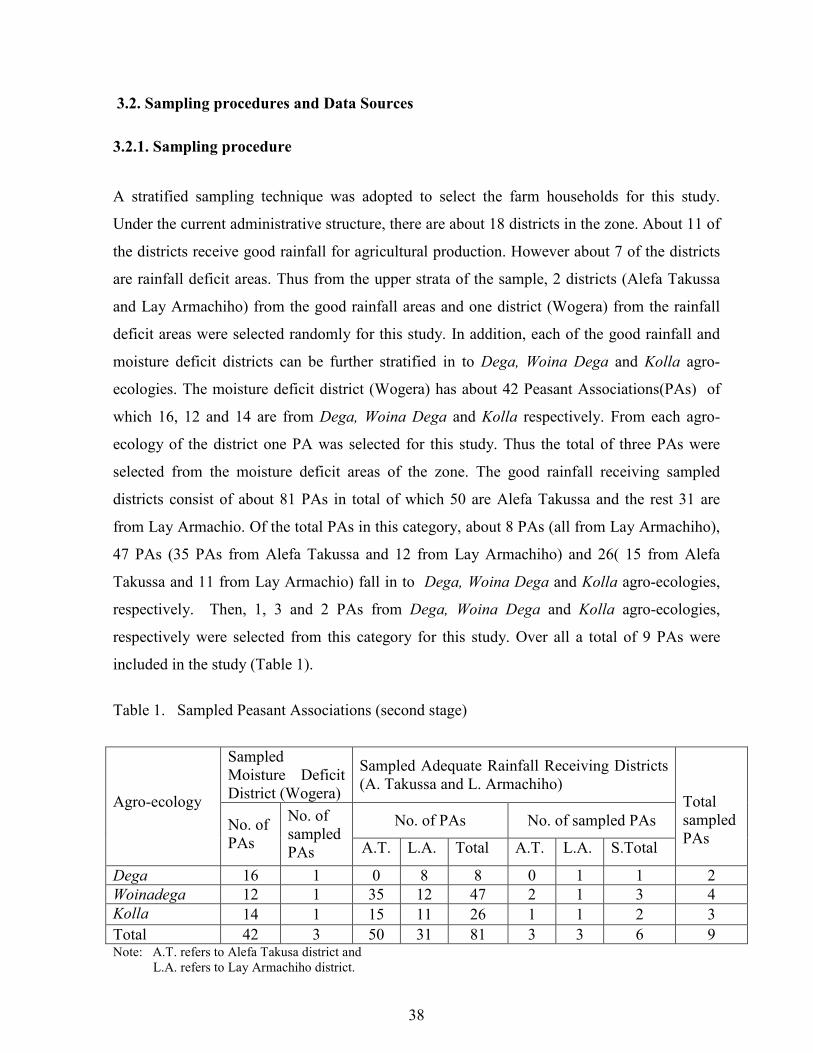
38
3.2. Sampling procedures and Data Sources
3.2.1. Sampling procedure
A stratified sampling technique was adopted to select the farm households for this study.
Under the current administrative structure, there are about 18 districts in the zone. About 11 of
the districts receive good rainfall for agricultural production. However about 7 of the districts
are rainfall deficit areas. Thus from the upper strata of the sample, 2 districts (Alefa Takussa
and Lay Armachiho) from the good rainfall areas and one district (Wogera) from the rainfall
deficit areas were selected randomly for this study. In addition, each of the good rainfall and
moisture deficit districts can be further stratified in to Dega, Woina Dega and Kolla agro-
ecologies. The moisture deficit district (Wogera) has about 42 Peasant Associations(PAs) of
which 16, 12 and 14 are from Dega, Woina Dega and Kolla respectively. From each agro-
ecology of the district one PA was selected for this study. Thus the total of three PAs were
selected from the moisture deficit areas of the zone. The good rainfall receiving sampled
districts consist of about 81 PAs in total of which 50 are Alefa Takussa and the rest 31 are
from Lay Armachio. Of the total PAs in this category, about 8 PAs (all from Lay Armachiho),
47 PAs (35 PAs from Alefa Takussa and 12 from Lay Armachiho) and 26( 15 from Alefa
Takussa and 11 from Lay Armachio) fall in to Dega, Woina Dega and Kolla agro-ecologies,
respectively. Then, 1, 3 and 2 PAs from Dega, Woina Dega and Kolla agro-ecologies,
respectively were selected from this category for this study. Over all a total of 9 PAs were
included in the study (Table 1).
Table 1. Sampled Peasant Associations (second stage)
Sampled
Moisture Deficit
District (Wogera)
Sampled Adequate Rainfall Receiving Districts
(A. Takussa and L. Armachiho)
No. of PAs No. of sampled PAs
Agro-ecology
No. of
PAs
No. of
sampled
PAs A.T. L.A. Total A.T. L.A. S.Total
Total
sampled
PAs
Dega 16 1 0 8 8 0 1 1 2
Woinadega 12 1 35 12 47 2 1 3 4
Kolla 14 1 15 11 26 1 1 2 3
Total 42 3 50 31 81 3 3 6 9 Note: A.T. refers to Alefa Takusa district and
L.A. refers to Lay Armachiho district.
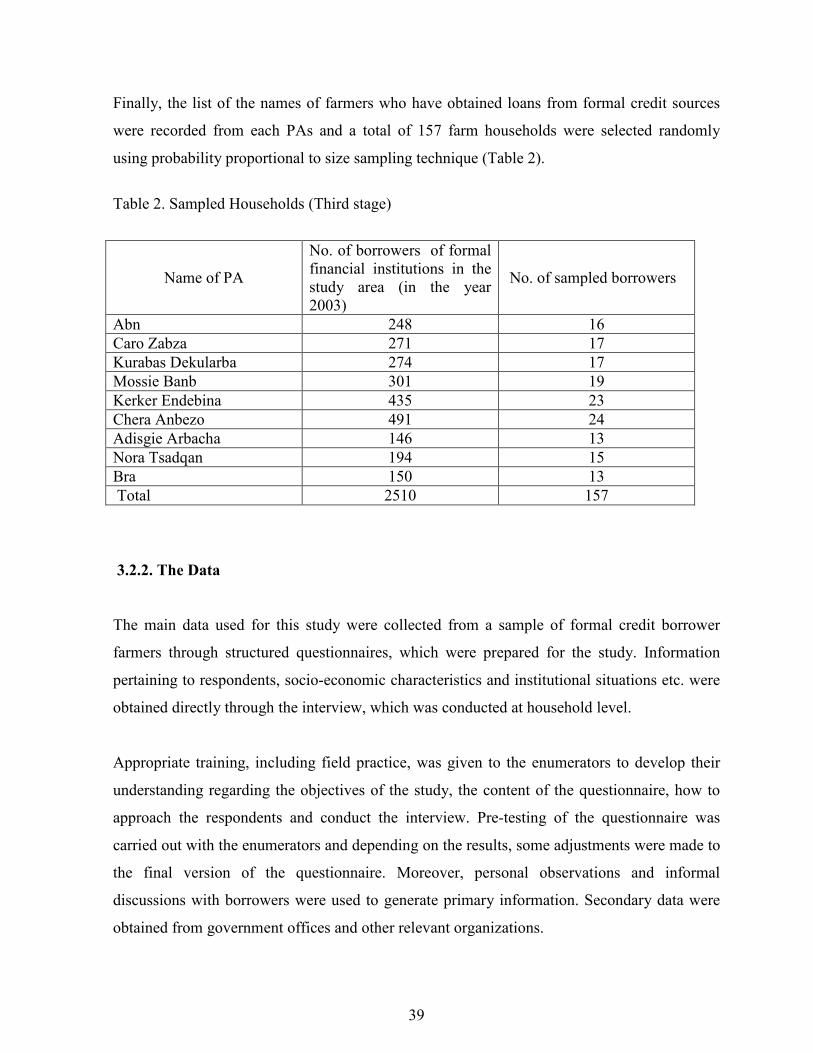
39
Finally, the list of the names of farmers who have obtained loans from formal credit sources
were recorded from each PAs and a total of 157 farm households were selected randomly
using probability proportional to size sampling technique (Table 2).
Table 2. Sampled Households (Third stage)
Name of PA
No. of borrowers of formal
financial institutions in the
study area (in the year
2003)
No. of sampled borrowers
Abn 248 16
Caro Zabza 271 17
Kurabas Dekularba 274 17
Mossie Banb 301 19
Kerker Endebina 435 23
Chera Anbezo 491 24
Adisgie Arbacha 146 13
Nora Tsadqan 194 15
Bra 150 13
Total 2510 157
3.2.2. The Data
The main data used for this study were collected from a sample of formal credit borrower
farmers through structured questionnaires, which were prepared for the study. Information
pertaining to respondents, socio-economic characteristics and institutional situations etc. were
obtained directly through the interview, which was conducted at household level.
Appropriate training, including field practice, was given to the enumerators to develop their
understanding regarding the objectives of the study, the content of the questionnaire, how to
approach the respondents and conduct the interview. Pre-testing of the questionnaire was
carried out with the enumerators and depending on the results, some adjustments were made to
the final version of the questionnaire. Moreover, personal observations and informal
discussions with borrowers were used to generate primary information. Secondary data were
obtained from government offices and other relevant organizations.
40
3.3. Variable Specification and Hypotheses
The dependent variable of the econometric model for this study is the proportion of formal
loan repaid during the specified repayment period. This was calculated as the ratio of the total
amount of credit repaid to the total amount of due. Its value ranges between 0 and 1. Those
borrower farmers that did not repay any amount of money they borrowed are considered as
complete defaulters (i.e., the value the repayment ratio in this case is zero). On the other hand,
those farmers that repaid back some proportion of the money they borrowed with in the stated
time are considered as non-defaulters.
Based on the literatures reviewed and discussion held with stakeholders, the explanatory
variables selected for this study were broadly categorized under socioeconomic, institutional
and natural factors. In what follows, a brief explanation of the explanatory variables selected
for this study and their likely influence on the loan repayment performance is presented below.
Family size (FAM_SIZE): Refers to the number of people under the same roof. The larger
the family members, the more the labor force available for production purpose. Therefore,
there is a possibility to have more alternative sources of income to overcome credit risks
(Schereiner & Nagarajan, 1997). Based on this, families with sufficient labor-force would be
expected to low probability of defaulting. On the other hand, large family size may imply self-
insufficiency in terms of food consumption because large households consume more than do
small households. This is usually true if the dependency ratio of the household is large.
Therefore, the effect of family size, on formal loan repayment capacity may be indeterminate a
priori.
Gender of the household head (GENDER): This is dummy variable in the model, which
takes a value 1 if the household head is male and 0, if the household head is female. Gender
differentials in the farm households play a significant role in economic performance of a given
household. Some empirical studies have demonstrated that gender is important in defining the
economic role of rural people in Africa (McSweeney, 1979; Dey, 1980). More specifically,
Gender differentials can be related to access to credit and one may expect that female-headed
households are less experienced in formal credit and hence will be defaulters for they know
little about the consequences of loan default. The opposite expectation may be that female
41
borrowers tend to be more loyal to the lenders than male borrowers. This may arise from the
fact that females are more responsible for childcare and home management and hence they
may be concerned more than males about the possible undesirable consequences arising from
the default. Therefore, it is expected that Gender of household head would have either positive
or negative impact on loan repayment performance of the respondents.
Age of the borrower (AGE) and (AGE)2: These variables were measured in years. Through
time household heads acquire experience in the farming business and/or credit use. Moreover,
older borrowers may accumulate more wealth than younger ones. Therefore, this variable is
hypothesized to have positive impact on loan repayment performance of respondents.
However, if they have insufficient labor within their households, older household heads in
rural areas are at a disadvantaged position economically in undertaking the heavy physical
labor required in agriculture. Each additional unit increase in age after some point would thus
add less to household income and may even reduce household income leading to low
repayment performance.
Education level (EDUCTLVL): This is a dummy variable, which takes a value 1 if the
household head is literate and 0 otherwise. Education increases farmers’ ability to get, process
and use information. For example, literate farmers may seek information on prices more than
the illiterates ones and consequently sell their produce at reasonable prices. Moreover,
education may enable farmers to be more aware of the importance of formal loan and hence
may reduce willful default. Therefore, ceteris paribus, education is expected to reduce the rate
of loan default.
Land holding (LNDHOLD): Refers to the total farm size (in hectares) owned by the family.
A farmer with more hectares of land is expected to be better off in loan repayment
performance. This is because, if augmented with other factors of production, large farm size
will give higher production that will enable the borrower to repay his/her loan. Therefore, this
variable is expected to have positive relation with the dependent variable.

42
Number of livestock owned (LIVSTKNO): This variable defined in terms of Tropical
Livestock Unit (TLU) and may serve as a proxy for the capacity to bear risks of using credit
for the purchase of new technology such as fertilizer and capture wealth effect. Livestock may
also serve as a proxy for oxen ownership, which is important for farm operations. It is
expected that this variable would have positive influence on loan repayment performance.
Income from off-farm activities (OFF_FARM): This is dummy variable, which takes a
value 1 if any member of the household was involved in off-farm activities and 0, otherwise.
Off-farm activities generate additional sources of income for smallholders. The cash generated
from these activities would back up the farmers’ income to settle debt even during bad
harvesting seasons and when repayment period coincides with low agricultural prices. Hence,
households involved in off-farm activities tend to be more capable of repaying loans in time.
Therefore, off-farm income, is hypothesized to have positive impact on loan repayment rate.
Expenditure on social festivals (CRMEXPNS): These are expenditure (in Birr) on
celebration such as weddings, funerals, engagements, circumcisions etc. over one year period.
Occasionally, such expenses are more than the normal economic stand of the borrower. As this
variable can be a proxy for use of income for non-productive purposes, it is expected to have a
negative impact on loan repayment performance of the farmers.
Experience in Extension package (PKGEXPRC): is the number of years a farmer
participated in extension program. Participating in Extension program play a great role in
agitating farmers to repay institutional loans in time. Participation in extension programs is
helpful as such farmers could have better income as a result of the use of new agricultural
technologies. In addition, farmers who have participate in extension programs are likely to
have better information on financial management and importance of timely repayment of
loans. Therefore, the more number of years the farmers participated in Extension program, the
better would be the loan repayment performance.
Contact with development agents (DACONTCT): This is the number of days per three
months time a farmer contacts a development agent for technical guidance. The higher the
linkage between farmers and development agents, the more the information flow and the
technological (knowledge) transfer from the later to the former. Those farmers with frequent
43
contact with extension workers are likely to have up-to-date information on production
technologies that would help them to increase their production and productivity and thus better
income. Thus, those farmers who have frequent contacts with development agents are likely
to settle their debt timely as opposed to those who have no or few contacts.
Source of credit (CRDTSRCE): Refers to the main formal credit sources for smallholder
farmers in the area. It takes values 1 for farmers who borrowed from Amhara Credit and
Saving Institute (ACSI) and 0 otherwise (Cooperatives). Unlike the cooperatives lending
scheme, ACSI grants loans to groups of farmers and not for individuals. Farmers who
borrowed from ACSI are expected to settle their loan timely than borrowers of other sources
(Cooperatives) due to group pressure. This is because, if borrowers form groups to get credit,
information asymmetry between borrowers and lender is expected to be lower. In addition,
groups may also have a comparative advantage in the enforcement of loan repayment.
Distance from main road (RODDIST): This is measured in kilometers from the
respondent’s residence to the main road; and is used as a proxy for market access and different
institutions. Borrowers near by the main road have a location advantage and can sell their farm
produce at good price and can contact the lender and development agent easily and frequently
than those who live in more distant locations. Therefore, nearness to main road is expected to
increase the repayment performance of smallholders.
Amount of loan (LNAMNT) and (LNAMNT) 2 are the value of a loan (in Birr) and its
square, respectively. We postulate a two-pronged hypothesis. First, the greater the loan size,
the greater the probability of unwilling default (negatively relate with loan repayment). This is
because in the event of production failure, the borrower will find it more difficult to meet
repayment obligations out of his/her personal funds. But, because the credit institution charge
an incremental penalty rate of interest on delinquent loans after a certain date, the larger the
loan, the higher is the penalty cost associated with any delinquency rate. The second factor
puts pressure on the borrower to reduce the deliquesce rate (positively relates with loan
repayment). It is for this reason that a squared term is included.
Purpose of borrowing (BORWPURP): This is a dummy variable, which takes a value 1 if
the household borrowed loan for purchase of farm inputs and 0, otherwise. The expenses on
44
variable agricultural inputs purchase such as chemical fertilizers and improved seeds are used
to produce enterprises that would give maximum benefits to the farmer. As this variable
proxies the use of the loan for productive purposes, it is expected to have positive impact on
loan repayment performance of small holders.
Agro-ecologic differentials (CLIMATE): this variable takes a value of 1 if the area belongs
to adequate rain receiving agro-ecology and 0, otherwise (if the agro ecology of the area is
moisture deficit). Agro ecological difference may influence the rate of loan recovery due to its
direct relation to farmers’ economic situation. For instance farmers in sufficient rainfall
districts produce different types of food and cash crops, and thus diversified sources of
income. Therefore, farmers who were living in adequate rain fall districts expected to to have
low loan default rates as compared to those farmers who were living in moisture deficit
districts.
3.4. Methods of Data Analysis
3.4.1. Descriptive statistics
Descriptive statistics is, one of the techniques used to summarize information (data) collected
from a sample. By applying descriptive statistics such as mean, standard deviation, frequency
of appearance etc. one can compare and contrast different categories of sample units (in this
case farm households) with respect to the desired characters so as to draw some important
conclusions.
3.4.2. Econometric model
There are several occasions where the variable to be modeled is limited in its range. Because
of the restrictions put on the values taken by the regressand, such models can be called limited
dependent variable regression models. When information on the regressand is available for
some observations, using OLS may result in a biased and inconsistent parameter estimates
even asymptotically. The bias arises from the fact that if we consider only the observable or nl
observations (i.e. only observations for which the values of the dependent variable are
observed) and omit the others, there is no guarantee that the expected value of the error terms,
45
E (ui), will be necessarily zero. And without E (ui)=0 we cannot guarantee that the OLS
estimates will be unbiased. It is intuitively clear that if we estimate a regression line based on
the n1 observations only; the resulting intercept and slope coefficients are bound to be different
than if all the (n1 +n2) observations were taken into account (Greene, 2000).
There are three types of regression models under the limited dependent variables models.
These are Censored or Tobit regression, Truncated regression and sample selected regression
models. Inferring the characteristics of a population from a sample drawn from a restricted
part of the population is known as truncation. A truncated distribution is the part of
untruncated distribution that is above or below some specified value (Greene, 2000). Whereas
a sample in which information on the regressand is available only for some observation is
known as censored sample.
The use of Tobit models to study censored and limited dependent variables has become
increasingly common in applied social science research for the past two decades (Smith and
Brame, 2003). Tobit is an extension of the Probit model and it is one approach to dealing with
the problem of censored data (Johnston and Dinardo, 1997).
Most of the studies conducted in modeling the determinants of loan repayment used
dichotomous discrete choice models (Logit and Probit) where the dependent variable is a
dummy that takes a value of zero or one depending on whether or not a farmer has defaulted.
However, Lynne et al. (1988) pointed out possible loss of information if a binary variable is
used as the dependent variable. In addition, binomial models, explain only the probability that
an individual made a certain choice (i.e. defaulted or has not defaulted) and they fail to take
into account the degree of loan recovery. The linear probability model (LPM), even though
computationally and conceptually simpler and easier the binary choice models, it depends on
the use of ordinary least squares (OLS) approach. Application of OLS to censored model
however, inherently produces hetroscedastic disturbance term (εi) and as a result, the standard
deviations of the estimates are biased. These inadequacies are minimized with the use of the
Tobit Model (Tobin, 1958).
46
In this study the value of the dependent variable is repayment ratio that has been computed as
the ratio of amount of loan repaid to the total amount borrowed from formal sources of credit.
Thus, the value of the dependent variable ranges between 0 and 1 and a two-limit Tobit model
has been chosen as a more appropriate econometric model.
The two-limit Tobit was originally presented by Rossett and Nelson (1975) and discussed in
detail by Maddala (1992) and Long (1997). The model derives from an underlying classical
normal linear regression and can be represented as:
y* = β′xi + εi , (1)
ε ~ N [0,σ2].
Denoting Yi as the observed dependent (censored) variable
L if Y* ≤ L
Yi = Y*= Xβ + εi if L < Y* <U (2)
U if Y* ≥ U
Where,
Yi = the observed dependent variable, in our case repayment ratio (ratio of amount repaid to
the amount borrowed)
Yi* = the latent variable (unobserved for values smaller than 0 and greater than 1).
Xi = is a vector of independent variables (factors affecting loan repayment and
intensity of loan recovery)
iβ = Vector of unknown parameters
εi = Residuals that are independently and normally distributed with mean
zero and a common variance 2σ ,
and i= 1,2,…n ( n is the number of observations).
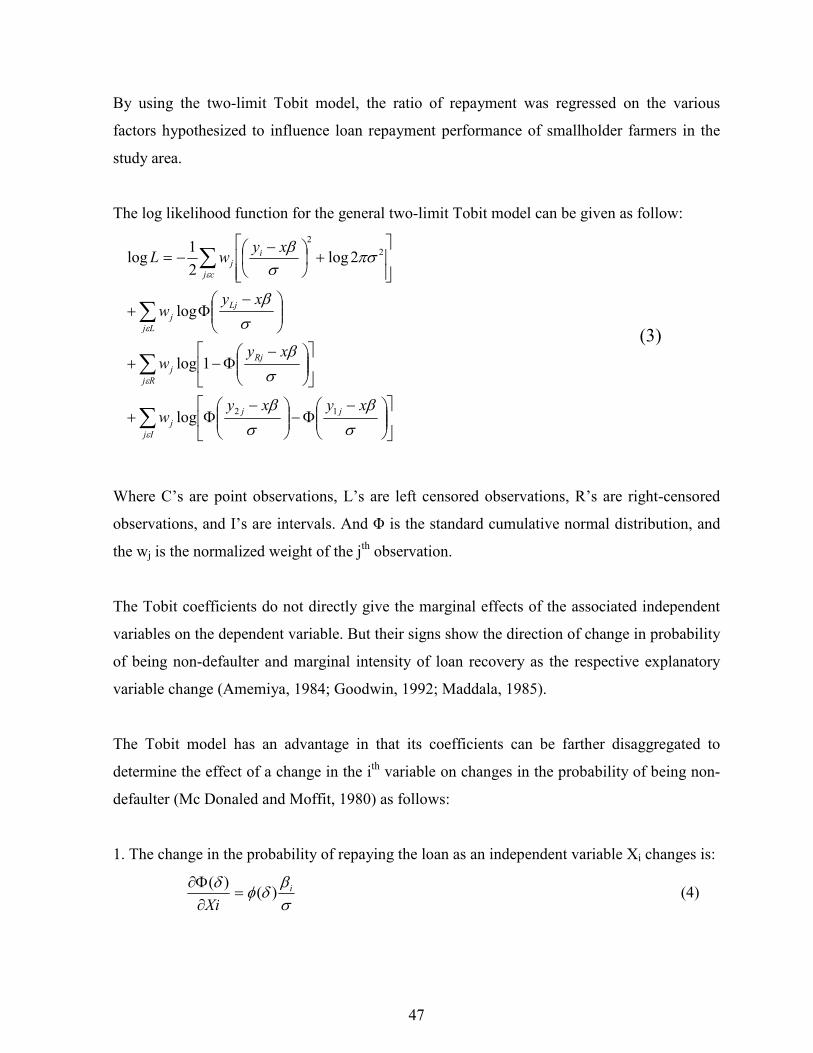
47
By using the two-limit Tobit model, the ratio of repayment was regressed on the various
factors hypothesized to influence loan repayment performance of smallholder farmers in the
study area.
The log likelihood function for the general two-limit Tobit model can be given as follow:
∑
∑
∑
∑
−Φ−
−Φ+
−Φ−+
−Φ+
+
−−=
Ij
jj
j
Rj
Rj
j
Lj
Lj
j
i
cj
j
xyxyw
xyw
xyw
xywL
ε
ε
ε
ε
σ
β
σ
β
σ
β
σ
β
πσσβ
12
2
2
log
1log
log
2log2
1log
(3)
Where C’s are point observations, L’s are left censored observations, R’s are right-censored
observations, and I’s are intervals. And Φ is the standard cumulative normal distribution, and
the wj is the normalized weight of the jth observation.
The Tobit coefficients do not directly give the marginal effects of the associated independent
variables on the dependent variable. But their signs show the direction of change in probability
of being non-defaulter and marginal intensity of loan recovery as the respective explanatory
variable change (Amemiya, 1984; Goodwin, 1992; Maddala, 1985).
The Tobit model has an advantage in that its coefficients can be farther disaggregated to
determine the effect of a change in the ith variable on changes in the probability of being non-
defaulter (Mc Donaled and Moffit, 1980) as follows:
1. The change in the probability of repaying the loan as an independent variable Xi changes is:
σβ
δφδ i
Xi)(
)(=
∂
Φ∂ (4)

48
2. The change in intensity of loan recovery with respect to a change in an explanatory variable
among non-complete defaulters is:
( )( ) ( )
( ) ( )( ) ( )
Φ−Φ
−−
Φ−Φ
−+=
∂
>>∂2
* )(1
),/(
LU
UL
LU
UULLi
i
ii
X
XLYUYE
δδδφδφ
δδδφδδφδ
β (5)
3. The marginal effect of an explanatory variable on the expected value of the dependent
Variable is:
( ))()()/(
Lui i
X
XYEδδβ Φ−Φ=
∂
∂ (6)
Where,
Xi = explanatory variables,
Φ (δ) = the cumulative normal distribution
δ =σβ ii X
= the Z-score for the area under normal curve
βi = a vector of Tobit maximum likelihood estimates
σ = the standard error of the error term.
σβ
δ
σβ
δ
iU
iL
XU
XL
−=
−=
L and U are threshold values ( L =0 and U =1 )
φ and Φ are probability density and cumulative density functions of the standard normal
distribution, respectively.
49
4. RESULTS AND DISCUSSION
This chapter discusses the analytical results of the study. The first section of this chapter
presents the descriptive statistics results of the study. This is followed by the discussion of the
econometric model results.
4.1. Results of Descriptive Statistics Analysis
The descriptive statistics analysis made use of tools such as mean, percentage, standard
deviation and frequency distribution. In addition, T-test and Chi-square test statistics were
employed to compare defaulter and non-defaulter groups with respect to some explanatory
variables.
4.1.1. Socio-economic and institutional characteristics of the sample households
Out of the total 157 interviewed households 123 (78.34%) were non-defaulters, and the
remaining 34 (21.66%) were defaulters. Among the defaulters, 19 (55.88 %) were complete
defaulters while 15(44.12 %) repaid 30-70 percent of the total loan of which they borrowed.
The average age of household heads was 44.85 years with the minimum and maximum ages of
25 and 80 years, respectively (Table 3). The average age of non-defaulter household heads was
43.34 years, while that of defaulters was 50.29 years with mean difference significant at 1%
level. On the other hand, the average family size of the sample households was 5.94; higher
than the national average of 5 persons (CSA, 1994). The largest family size was 13 and the
smallest was 1. The average family size of non-defaulters was 5.96, while that of defaulters
was 5.85 with no significant difference between means of the two groups (Table 3).
The survey results also revealed that 66.88 percent of the sample household heads were
illiterate, whereas 33.12 percent of the house holds heads were literate (Table 3). Of the total
sample respondents, 65.00 percent of the non-defaulters and 73.50 percent of defaulters were
illiterate respectively. There was no significant difference between defaulters and non-
defaulters in terms of their literacy level (Table 4).
50
The sample was composed of both male and female-headed households. Of the total sample
household heads 79.62 percent were male household heads and 20.38 percent were female
household heads. 29.40 percent of the defaulters and 17.90 percent of the non-defaulters were
female-headed households respectively. The differences in terms of gender among the two
groups was not significant (Table 4).
The distance in km that the beneficiaries traveled to get main road for accessing different
services was assessed. In line with this, the average distance traveled by the respondents to the
main road was about 5.14 km. On average, non-defaulters traveled about 4.79 Km while the
defaulters traveled on average about 6.43 km to reach the main road. The mean difference
between the distances covered by non-defaulters and defaulters was statistically significant at
5 % level of probability (Table 3).
Land is the basic asset of farmers. The average size of own cultivated land was nearly 1.38 ha,
the minimum and the maximum being 0.25 and 5 ha, respectively. Non-defaulters cultivated
on average larger area of land (1.53 ha) than defaulters (1.05 ha). The mean difference was
significant at 1 % level. 35.67 percent of the sample households cultivated farm plots by
renting in from other families (relatives, neighbors etc.). On the other land, nearly 17.6 percent
of the sample households stated that they rented out their cultivated land to others through
either renting or sharecropping arrangements. However, there was no significant difference
between defaulters and non-defaulters based on land rented-in or rented-out.
Farmers were also asked about the size of land, which was allotted for crop production. On the
average 1.4 hectares was covered by different crops (Table 3). Non-defaulters allotted more
proportion of land to cops (on average 1.34 ha) as compared to the defaulters (on average 0.72
ha), with mean difference significant at 1% significant level.
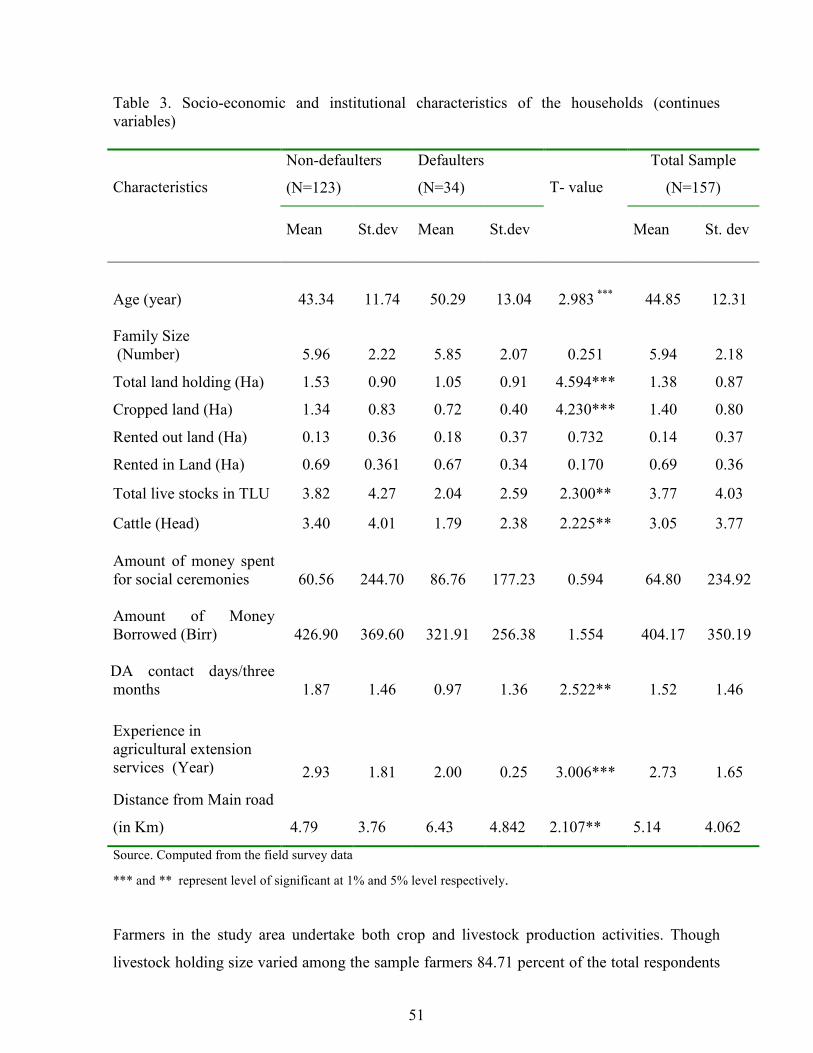
51
Table 3. Socio-economic and institutional characteristics of the households (continues
variables)
Non-defaulters
(N=123)
Defaulters
(N=34)
Total Sample
(N=157) Characteristics
Mean St.dev Mean St.dev
T- value
Mean St. dev
Age (year)
43.34
11.74
50.29
13.04
2.983 ***
44.85
12.31
Family Size
(Number)
5.96
2.22
5.85
2.07
0.251
5.94
2.18
Total land holding (Ha) 1.53 0.90 1.05 0.91 4.594*** 1.38 0.87
Cropped land (Ha) 1.34 0.83 0.72 0.40 4.230*** 1.40 0.80
Rented out land (Ha) 0.13 0.36 0.18 0.37 0.732 0.14 0.37
Rented in Land (Ha) 0.69 0.361 0.67 0.34 0.170 0.69 0.36
Total live stocks in TLU 3.82 4.27 2.04 2.59 2.300** 3.77 4.03
Cattle (Head) 3.40 4.01 1.79 2.38 2.225** 3.05 3.77
Amount of money spent
for social ceremonies
60.56
244.70
86.76
177.23
0.594
64.80
234.92
Amount of Money
Borrowed (Birr)
426.90
369.60
321.91
256.38
1.554
404.17
350.19
DA contact days/three
months
1.87
1.46
0.97
1.36
2.522**
1.52
1.46
Experience in
agricultural extension
services (Year)
2.93
1.81
2.00
0.25
3.006***
2.73
1.65
Distance from Main road
(in Km)
4.79
3.76
6.43
4.842
2.107**
5.14
4.062
Source. Computed from the field survey data
*** and ** represent level of significant at 1% and 5% level respectively.
Farmers in the study area undertake both crop and livestock production activities. Though
livestock holding size varied among the sample farmers 84.71 percent of the total respondents
52
owned livestock. Livestock are kept for various economic and social reasons in the study area.
The major economic reasons include provision or supply of draught power, generation of cash
income, food and animal dung (as an organic fertilizer and fuel). Based on Storck et al.
(1991) standard conversion factors, the livestock population number was converted into
Tropical Livestock Unit (TLU), so as to facilitate comparison between the two groups. On the
average, a household had 3.77 TLU with standard deviation of 4.03 (Table 3). The minimum
number of livestock kept was 1 whereas the maximum was 35.5 TLU. Non-defaulters owned a
larger number of livestock (on average 3.82 TLU) compared to the defaulters (on average 2.04
TLU) with mean difference significant at 5% significant level. The implication is that non-
defaulters have more access to financial capital by selling their livestock to recover their loan
(Table 3).
Expenditure on social festivals includes expenditure for social ceremonies such as wedding,
circumcision, funeral of a family member or close relative and engagement. Of the total
respondents 10.50 percent reported that they had celebrated one or more of the above
occasional ceremonies and 89.50 percent stated that they had not celebrated any of them
during the study period. Meanwhile, 7.60 percent of non-defaulters and 16.50 percent of
defaulters reported that they had celebrated one or more of these ceremonies. The minimum
and maximum expenditures for such ceremonies were Birr 100 and Birr 2535, respectively.
Average amount of money spent for social ceremonies, was higher for the defaulters’ group
than the non-defaulters’ group, although the difference was not found to be statistically
significant (Table 3).
Experience in agricultural extension package varied among the sample borrowers from
minimum value of one-year experience to a maximum of 10 years experience. Non-defaulters
participated on average for higher number of years (2.93) as compared to the defaulters who
participated on average for 2 years (Table 3). The mean difference between the two groups
was significant at 1% level of significance. That is, farmers experience in agricultural
extension services has significant role in loan repayment performance.
The results of the survey also indicate that 76.40 percent of the respondents had extension
contact, while 23.60 percent did not have any contact with extension agents. An average
number of extension contact days were 1.87 for non-defaulters and 0.97 for defaulters,
53
respectively. The differences between the two groups, was significant at 5% probability level.
That is, respondents who had frequent contacts with development agents settled their debt
timely as compared to those who had no or few contacts (Table 3).
The sample households on average borrowed Birr 404.17. However, the loan size varied in
accordance with the type of financial institution. The survey result also revealed that on
average Birr 426.90 was borrowed by non-defaulters and defaulters borrowed Birr 321.91 with
no significant mean difference among the groups (Table 3).
Farmers in the study area used credit from different institutions (Amahara Credit and Saving
Institution and Farmers’ Multi Service Cooperatives). With regard to sources of credit
(CRDTSRCE), out of the total respondents 53.50 percent borrowed from Co-operatives and
the rest 46.50 percent borrowed from ACSI.The performance of credit repayment varied with
respect to sources of credit. Larger proportion of defaulter households (73.50 percent)
borrowed from Cooperatives as compared to ACSI (26.50 percent). The difference between
these percentage figures was significant at 1% level (Table 4).
Another sources of income for the farmers of the area, other than livestock and crops
production, were off-farm activities. About 28.00 percent of the sample household heads
reported that at least one of their family members was engaged in off-farm activities, which
helped them to earn additional income. The survey results also indicated that larger proportion
of non-defaulter households (31.70 %) sent their members to off-farm activities as compared
to the defaulter households (14.70 %), with significant percentage difference at 10 %
probability level.
Ability to save refers to the saving behavior of households for future use. According to the
survey, 5.73 percent of the sample households have responded that they have good traditions
of putting money aside for future use. However, there was no significant difference in saving
behavior between the defaulters and non-defaulters.
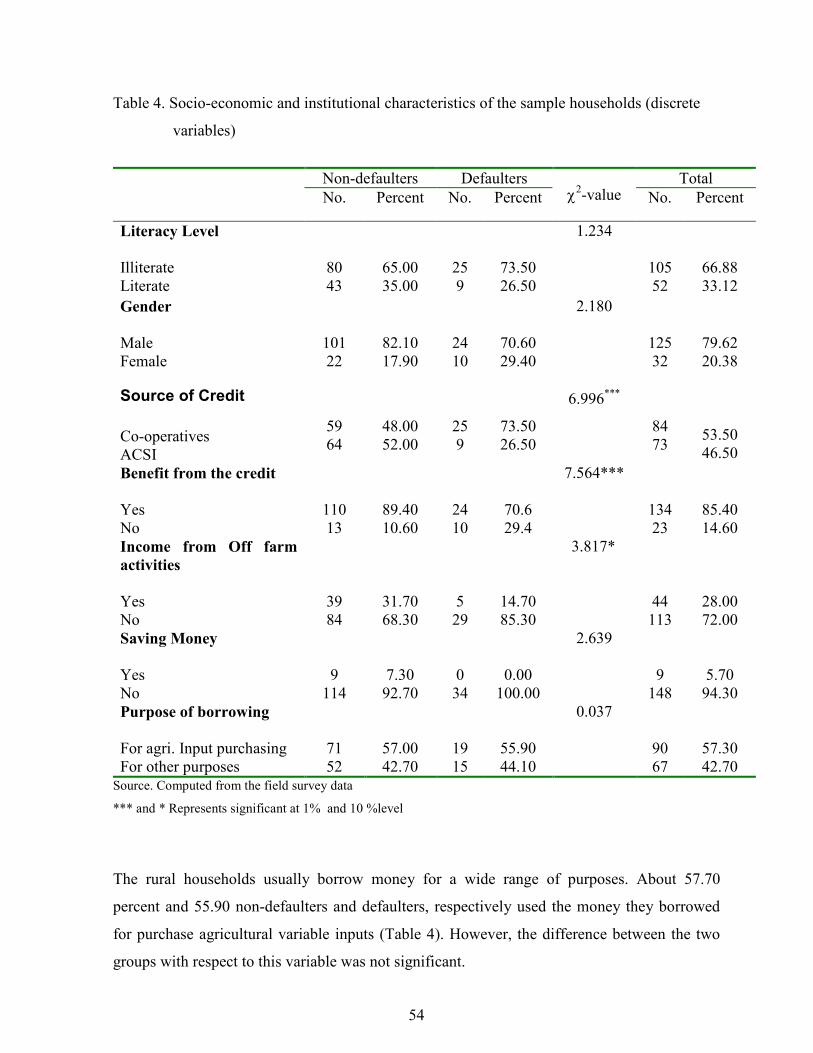
54
Table 4. Socio-economic and institutional characteristics of the sample households (discrete
variables)
Non-defaulters Defaulters Total
No. Percent No. Percent χ2-value No. Percent
Literacy Level
Illiterate
Literate
80
43
65.00
35.00
25
9
73.50
26.50
1.234
105
52
66.88
33.12
Gender
Male
Female
101
22
82.10
17.90
24
10
70.60
29.40
2.180
125
32
79.62
20.38
Source of Credit
Co-operatives
ACSI
59
64
48.00
52.00
25
9
73.50
26.50
6.996***
84
73
53.50
46.50
Benefit from the credit
Yes
No
110
13
89.40
10.60
24
10
70.6
29.4
7.564***
134
23
85.40
14.60
Income from Off farm
activities
Yes
No
39
84
31.70
68.30
5
29
14.70
85.30
3.817*
44
113
28.00
72.00
Saving Money
Yes
No
9
114
7.30
92.70
0
34
0.00
100.00
2.639
9
148
5.70
94.30
Purpose of borrowing
For agri. Input purchasing
For other purposes
71
52
57.00
42.70
19
15
55.90
44.10
0.037
90
67
57.30
42.70 Source. Computed from the field survey data
*** and * Represents significant at 1% and 10 %level
The rural households usually borrow money for a wide range of purposes. About 57.70
percent and 55.90 non-defaulters and defaulters, respectively used the money they borrowed
for purchase agricultural variable inputs (Table 4). However, the difference between the two
groups with respect to this variable was not significant.
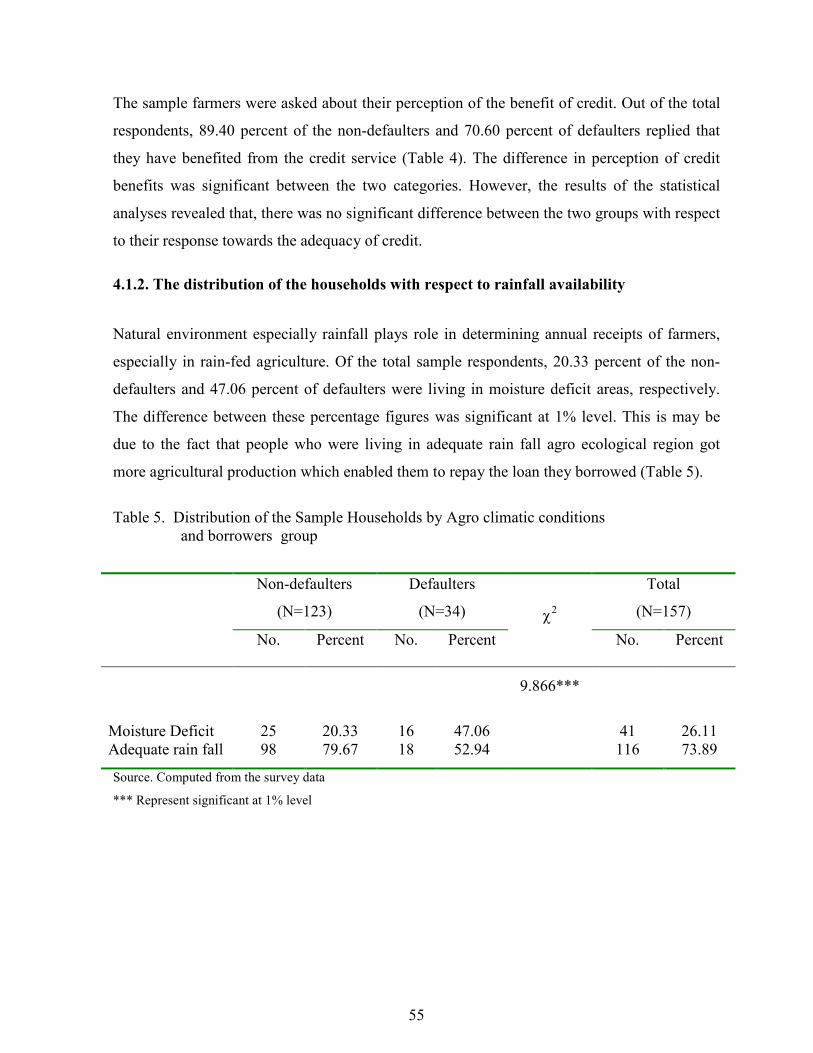
55
The sample farmers were asked about their perception of the benefit of credit. Out of the total
respondents, 89.40 percent of the non-defaulters and 70.60 percent of defaulters replied that
they have benefited from the credit service (Table 4). The difference in perception of credit
benefits was significant between the two categories. However, the results of the statistical
analyses revealed that, there was no significant difference between the two groups with respect
to their response towards the adequacy of credit.
4.1.2. The distribution of the households with respect to rainfall availability
Natural environment especially rainfall plays role in determining annual receipts of farmers,
especially in rain-fed agriculture. Of the total sample respondents, 20.33 percent of the non-
defaulters and 47.06 percent of defaulters were living in moisture deficit areas, respectively.
The difference between these percentage figures was significant at 1% level. This is may be
due to the fact that people who were living in adequate rain fall agro ecological region got
more agricultural production which enabled them to repay the loan they borrowed (Table 5).
Table 5. Distribution of the Sample Households by Agro climatic conditions
and borrowers group
Non-defaulters
(N=123)
Defaulters
(N=34)
Total
(N=157)
No. Percent No. Percent
χ2
No. Percent
9.866***
Moisture Deficit
Adequate rain fall
25
98
20.33
79.67
16
18
47.06
52.94
41
116
26.11
73.89
Source. Computed from the survey data
*** Represent significant at 1% level
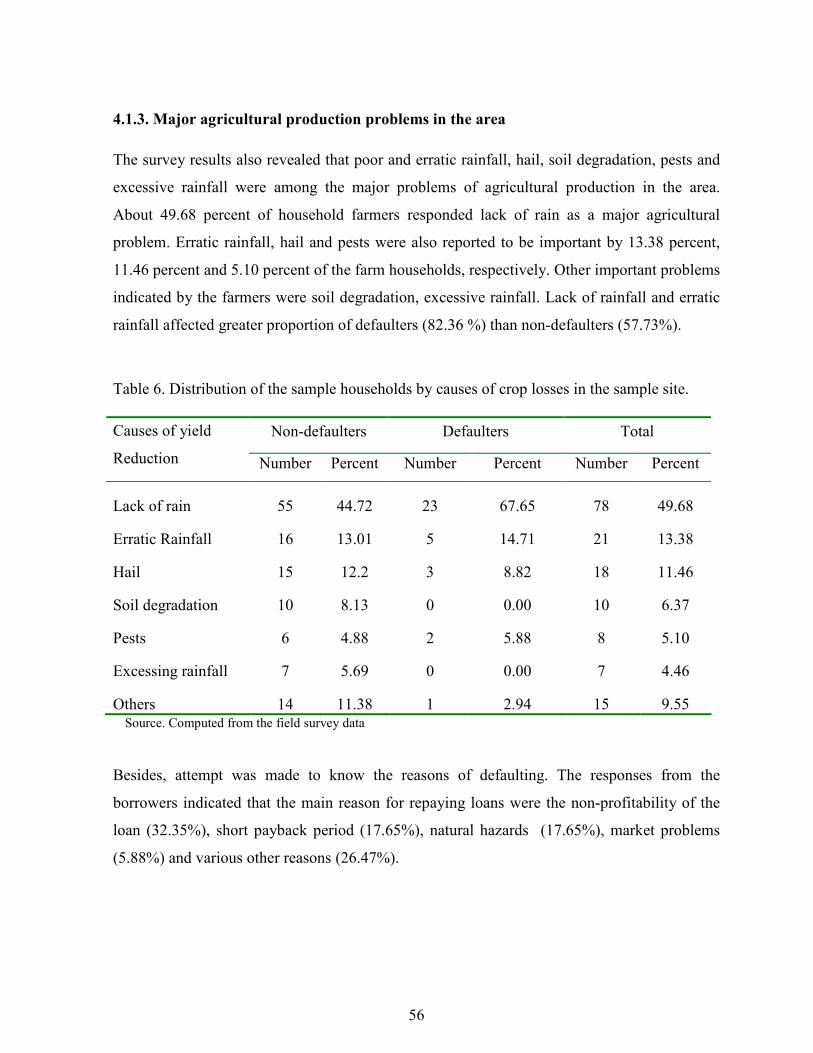
56
4.1.3. Major agricultural production problems in the area
The survey results also revealed that poor and erratic rainfall, hail, soil degradation, pests and
excessive rainfall were among the major problems of agricultural production in the area.
About 49.68 percent of household farmers responded lack of rain as a major agricultural
problem. Erratic rainfall, hail and pests were also reported to be important by 13.38 percent,
11.46 percent and 5.10 percent of the farm households, respectively. Other important problems
indicated by the farmers were soil degradation, excessive rainfall. Lack of rainfall and erratic
rainfall affected greater proportion of defaulters (82.36 %) than non-defaulters (57.73%).
Table 6. Distribution of the sample households by causes of crop losses in the sample site.
Non-defaulters Defaulters Total Causes of yield
Reduction Number Percent Number Percent Number Percent
Lack of rain 55 44.72 23 67.65 78 49.68
Erratic Rainfall 16 13.01 5 14.71 21 13.38
Hail 15 12.2 3 8.82 18 11.46
Soil degradation 10 8.13 0 0.00 10 6.37
Pests 6 4.88 2 5.88 8 5.10
Excessing rainfall 7 5.69 0 0.00 7 4.46
Others 14 11.38 1 2.94 15 9.55 Source. Computed from the field survey data
Besides, attempt was made to know the reasons of defaulting. The responses from the
borrowers indicated that the main reason for repaying loans were the non-profitability of the
loan (32.35%), short payback period (17.65%), natural hazards (17.65%), market problems
(5.88%) and various other reasons (26.47%).
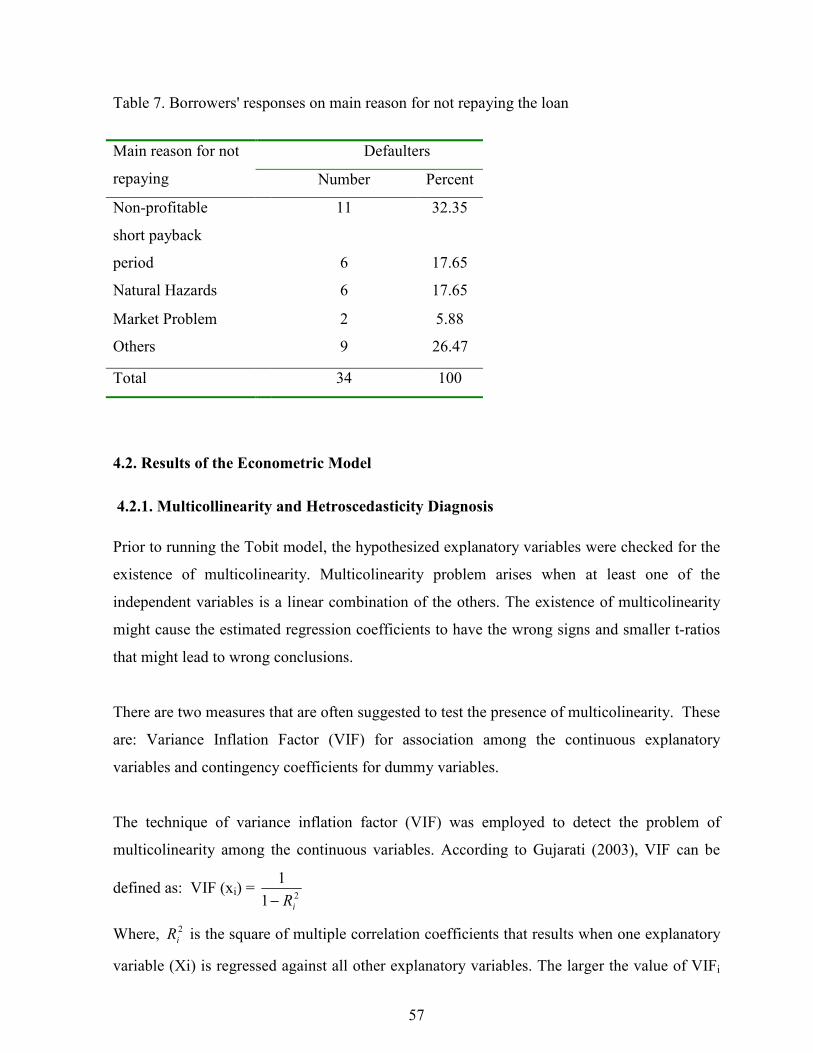
57
Table 7. Borrowers' responses on main reason for not repaying the loan
Defaulters Main reason for not
repaying Number Percent
Non-profitable 11 32.35
short payback
period
6
17.65
Natural Hazards 6 17.65
Market Problem
Others
2
9
5.88
26.47
Total 34 100
4.2. Results of the Econometric Model
4.2.1. Multicollinearity and Hetroscedasticity Diagnosis
Prior to running the Tobit model, the hypothesized explanatory variables were checked for the
existence of multicolinearity. Multicolinearity problem arises when at least one of the
independent variables is a linear combination of the others. The existence of multicolinearity
might cause the estimated regression coefficients to have the wrong signs and smaller t-ratios
that might lead to wrong conclusions.
There are two measures that are often suggested to test the presence of multicolinearity. These
are: Variance Inflation Factor (VIF) for association among the continuous explanatory
variables and contingency coefficients for dummy variables.
The technique of variance inflation factor (VIF) was employed to detect the problem of
multicolinearity among the continuous variables. According to Gujarati (2003), VIF can be
defined as: VIF (xi) = 21
1
iR−
Where, 2
iR is the square of multiple correlation coefficients that results when one explanatory
variable (Xi) is regressed against all other explanatory variables. The larger the value of VIFi
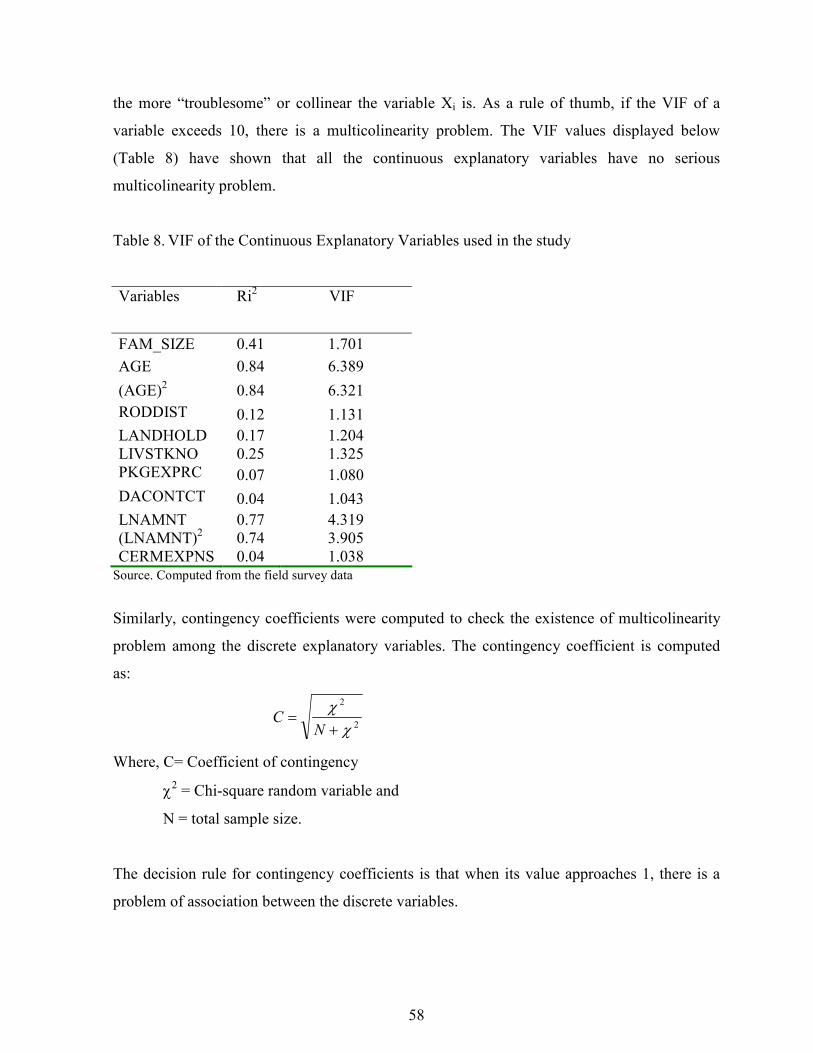
58
the more “troublesome” or collinear the variable Xi is. As a rule of thumb, if the VIF of a
variable exceeds 10, there is a multicolinearity problem. The VIF values displayed below
(Table 8) have shown that all the continuous explanatory variables have no serious
multicolinearity problem.
Table 8. VIF of the Continuous Explanatory Variables used in the study
Variables Ri2 VIF
FAM_SIZE 0.41 1.701
AGE 0.84 6.389
(AGE)2 0.84 6.321
RODDIST 0.12 1.131
LANDHOLD 0.17 1.204
LIVSTKNO 0.25 1.325
PKGEXPRC 0.07 1.080
DACONTCT 0.04 1.043
LNAMNT 0.77 4.319
(LNAMNT)2 0.74 3.905
CERMEXPNS 0.04 1.038 Source. Computed from the field survey data
Similarly, contingency coefficients were computed to check the existence of multicolinearity
problem among the discrete explanatory variables. The contingency coefficient is computed
as:
2
2
χχ+
=N
C
Where, C= Coefficient of contingency
χ2 = Chi-square random variable and
N = total sample size.
The decision rule for contingency coefficients is that when its value approaches 1, there is a
problem of association between the discrete variables.
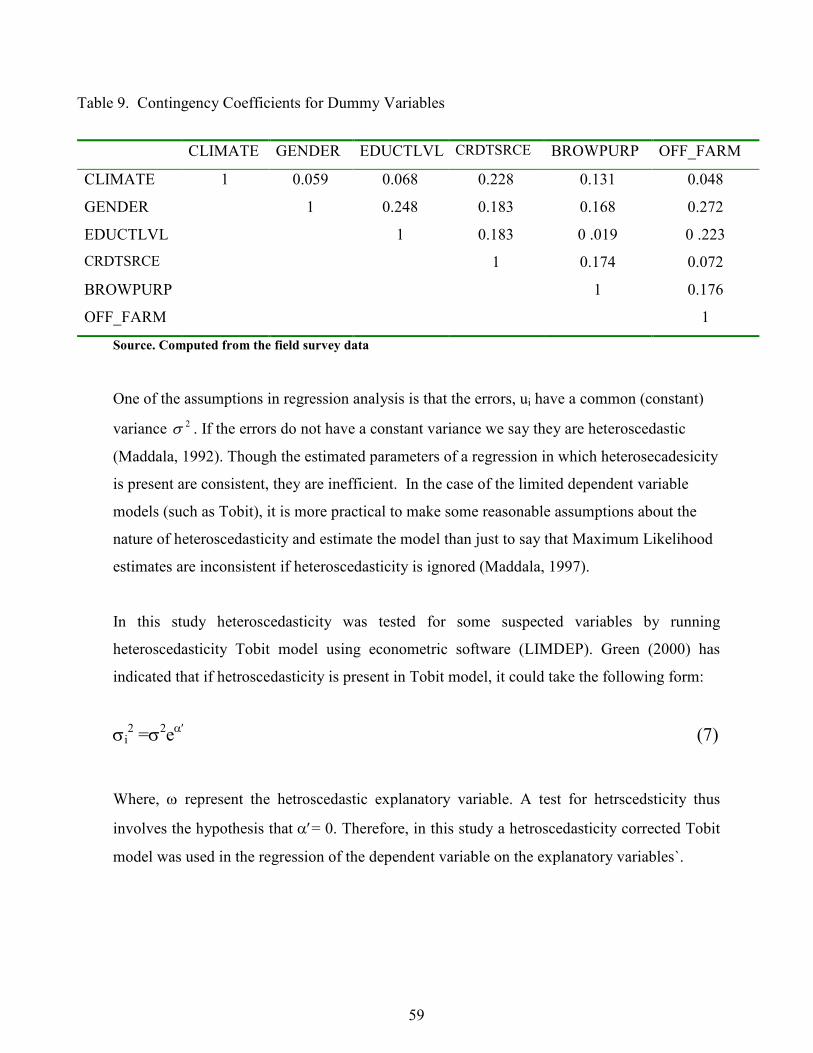
59
Table 9. Contingency Coefficients for Dummy Variables
CLIMATE GENDER EDUCTLVL CRDTSRCE BROWPURP OFF_FARM
CLIMATE 1 0.059 0.068 0.228 0.131 0.048
GENDER 1 0.248 0.183 0.168 0.272
EDUCTLVL 1 0.183 0 .019 0 .223
CRDTSRCE 1 0.174 0.072
BROWPURP 1 0.176
OFF_FARM 1
Source. Computed from the field survey data
One of the assumptions in regression analysis is that the errors, ui have a common (constant)
variance 2σ . If the errors do not have a constant variance we say they are heteroscedastic
(Maddala, 1992). Though the estimated parameters of a regression in which heterosecadesicity
is present are consistent, they are inefficient. In the case of the limited dependent variable
models (such as Tobit), it is more practical to make some reasonable assumptions about the
nature of heteroscedasticity and estimate the model than just to say that Maximum Likelihood
estimates are inconsistent if heteroscedasticity is ignored (Maddala, 1997).
In this study heteroscedasticity was tested for some suspected variables by running
heteroscedasticity Tobit model using econometric software (LIMDEP). Green (2000) has
indicated that if hetroscedasticity is present in Tobit model, it could take the following form:
σi2 =σ2eα′ (7)
Where, ω represent the hetroscedastic explanatory variable. A test for hetrscedsticity thus
involves the hypothesis that α′= 0. Therefore, in this study a hetroscedasticity corrected Tobit
model was used in the regression of the dependent variable on the explanatory variables`.
60
4.2.2. Determinants of probability of being non-defaulter and degree of loan recovery
The estimated results of the Tobit model and the marginal effects are shown in tables 10 and
11 respectively. A total of 17 explanatory variables were considered in the econometric model
out of which 7 variables were found to significantly influence the probability of being non-
defaulter and intensity of loan recovery among the farm households. These were agro-ecology
of the area, total land holding size of the family (hectare), total livestock holding (TLU),
number of years of experience in agricultural extension services, number of contact days of the
farm household lead with extension agents, source of credit and income from off farm
activities. The remaining 10 (family sizes of sample households, gender, age, age squared and
educational level of household heads, distance between main road and household residence,
purpose of borrowing, loan amount, loan amount squared and expenditure on social festivals)
were found to have no significant effect on the loan recovery of smallholder farmers.
Agro ecologic difference (CLIMATE) was one of the factors, which significantly influenced
loan repayment performance of the farmers. The econometric model result revealed that being
residence of adequate rainfall agro-ecological area increases probability of being non-defaulter
by 96.97 percent (Table 10) and increases the rate of repayment on average by 0.1136 for the
entire sample respondents and by 0.1403 among non-complete defaulters (Table 11). The
reason behind this is that farmers in good rainfall areas have the opportunity of growing
different crops that would help them derive good incpme from these activities and diversity
their income earning portfolio there by enabling them to pay the loans they borrowed more
than farmers lining in moisture deficit areas.
On the other hand the size of land holding in hectare (LNDHOLD) is one of economic factors,
which positively affected loan recovery of smallholder farmers (significant at 1% level). Each
additional hectare of land holding increases the probability of being non-defaulter by 52.88
percent (Table 10). On average, each additional hectare of land holding of smallholder farmers
increases the rate of loan repayment by 0.0619 for the entire sample and by 0.0765 for non-
complete defaulters (borrowers who paid a certain amount of loan but not all), citrus paribus.
As more and more land is brought under cultivation, farm-income is expected to increase due
61
to the increased output. Therefore, having larger size of land enhances a borrower’s capacity to
repay his/her loan timely.
Total livestock ownership (LIVSTKNO) is, as expected, positively related to the dependent
variable (significant at 10% level). Each additional TLU increases the probability being non-
defaulter by 10.70 percent. Also, for each additional unit of TLU the rate of loan repayment
increases by 0.0125 among the whole borrowers and by 0.0155 among non-complete
defaulters. The implication is that, Livestock are sources of cash in rural Ethiopia and serve as
security against crop failure. Farmers who owned more livestock are able to repay their loans
even when their crops fail due to natural disaster. In addition, as a proxy to oxen ownership the
result suggests that farmers who have larger number of livestock have sufficient number of
oxen to plough their field timely and as a result obtain high yield and income to repay loans.
Variables representing institutional service have strongly influenced smallholder farmer’s loan
recovery. For instance, number of years of experience in agricultural extension services
(PKGEXPRC) is the factor, which was positively related to the dependent variable (significant
at 1% level). Each additional year of agriculture extension package experience increases the
probability of being non-defaulter by 31.78 %. On average, one year additional participation
experience in the extension package increases rate of loan repayment by 0.0372 among the
whole respondents and by 0.0460 among non-complete defaulters, citrus paribus. This implies
that experienced farmers in extension programs have developed their credit utilization and
management skills that helped them to pay loans timely. In addition, as a result of their
participation in extension for a number of years, these farmers are the beneficiers of the use of
improved agricultural technologies that would increase their income generating capacity and
these repay loans timely.
Contact with DAs (DACONTCT) is another important institutional factor, which was
positively related to the dependent variable (significant at 10 % level). Each additional contact
increases a probability of being non-defaulter by 14.93 percent. Each additional DAs contact
days increases the rate of repayment (repayment ratio) by 0.0175 for the entire sample and by
0.0216 for non-complete defaulters, citris paribus. This implies that farmers with more
accesses to technical assistance on agricultural activities were able to repay their loan as
promised than those who had less or no assistance at all. The reason for this is that farmers
62
who have frequent contact with development agents are better informed about markets and
production technologies. As a result, they are motivated to timely repay their loans compared
to those with less or no contact with DAs.
In addition, the probability of being non-defaulter and the degree of loan recovery were also
positively and significantly influenced by the source of credit (CRDTSRCE). The formation of
borrowers group, the use of group responsibility and peer monitoring are the core principles
guiding financial transactions of Amhara Credit and Saving Institute. In-group lending
programs, the functions of screening, monitoring, and enforcement of repayment are to a large
extent transferred from the lender to the borrowers group members. Therefore group lending
might be the reason for better repayment performance of borrowers of ACSI than that of
Cooperatives. Being a borrower from ACSI increases the probability of being non-defaulter by
51.75 percent. Similarly, it increases loan repayment rate by 0.0606 for the entire sample and
by 0.0749 among non-complete defaulters.
Getting income from off-farm activities (OFF-FARM) is another economic factor that was
positively and significantly affected loan repayment performance of smallholder farmers. This
might be due to the fact that; off-farm activities were additional sources of income for
smallholders and the cash generated from these activities could back up the farmers’ income to
settle their debt even during bad harvesting seasons and when repayment period coincides with
low agricultural prices. Each additional unit of Off-farm income increases probability of being
non-defaulter by 90.59 percent and on average increases the rate of loan repayment by 0.1061
for the entire respondents and by 0.131 among non-complete defaulters. However, this result
is contrary to Bekele’s (2001), findings that, off-farm income was negatively related with loan
repayment performance of farmers.
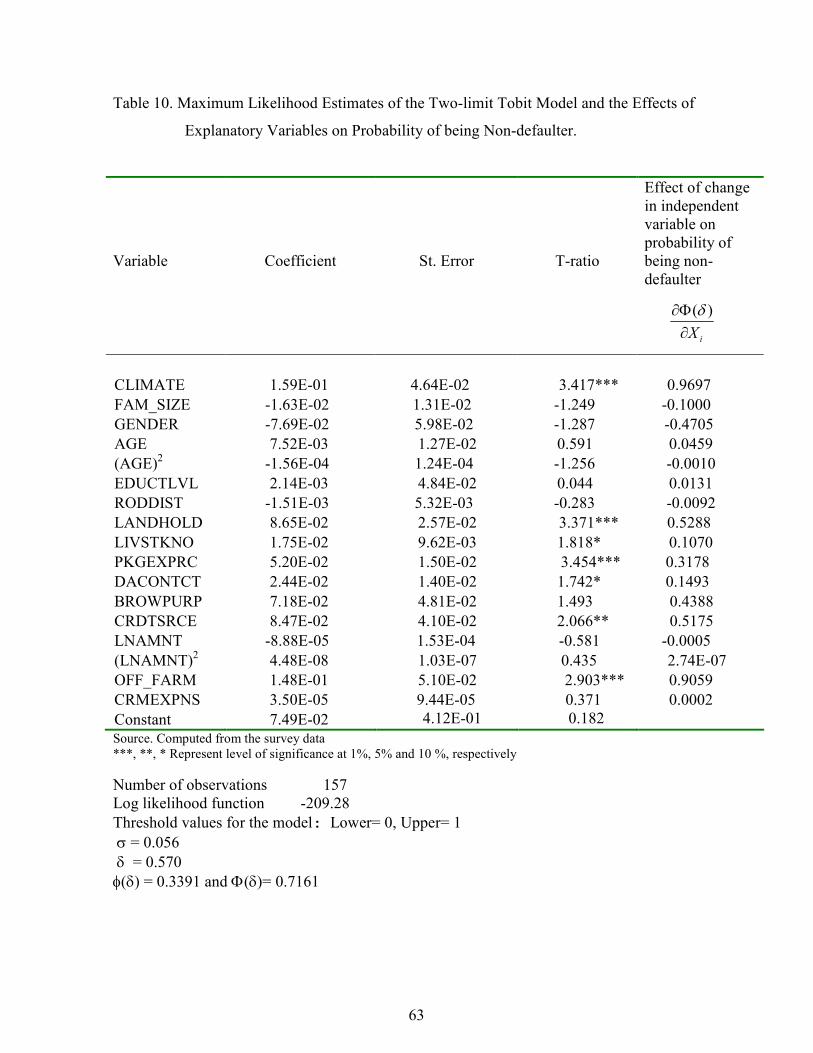
63
Table 10. Maximum Likelihood Estimates of the Two-limit Tobit Model and the Effects of
Explanatory Variables on Probability of being Non-defaulter.
Variable
Coefficient
St. Error
T-ratio
Effect of change
in independent
variable on
probability of
being non-
defaulter
CLIMATE
FAM_SIZE
GENDER
AGE
(AGE)2
EDUCTLVL
RODDIST
LANDHOLD
LIVSTKNO
PKGEXPRC
DACONTCT
BROWPURP
CRDTSRCE
LNAMNT
(LNAMNT)2
OFF_FARM
CRMEXPNS
Constant
1.59E-01
-1.63E-02
-7.69E-02
7.52E-03
-1.56E-04
2.14E-03
-1.51E-03
8.65E-02
1.75E-02
5.20E-02
2.44E-02
7.18E-02
8.47E-02
-8.88E-05
4.48E-08
1.48E-01
3.50E-05
7.49E-02
4.64E-02
1.31E-02
5.98E-02
1.27E-02
1.24E-04
4.84E-02
5.32E-03
2.57E-02
9.62E-03
1.50E-02
1.40E-02
4.81E-02
4.10E-02
1.53E-04
1.03E-07
5.10E-02
9.44E-05
4.12E-01
3.417***
-1.249
-1.287
0.591
-1.256
0.044
-0.283
3.371***
1.818*
3.454***
1.742*
1.493
2.066**
-0.581
0.435
2.903***
0.371
0.182
0.9697
-0.1000
-0.4705
0.0459
-0.0010
0.0131
-0.0092
0.5288
0.1070
0.3178
0.1493
0.4388
0.5175
-0.0005
2.74E-07
0.9059
0.0002
Source. Computed from the survey data
***, **, * Represent level of significance at 1%, 5% and 10 %, respectively
Number of observations 157
Log likelihood function -209.28
Threshold values for the model: Lower= 0, Upper= 1
σ = 0.056 δ = 0.570 φ(δ) = 0.3391 and Φ(δ)= 0.7161
iX∂
Φ∂ )(δ
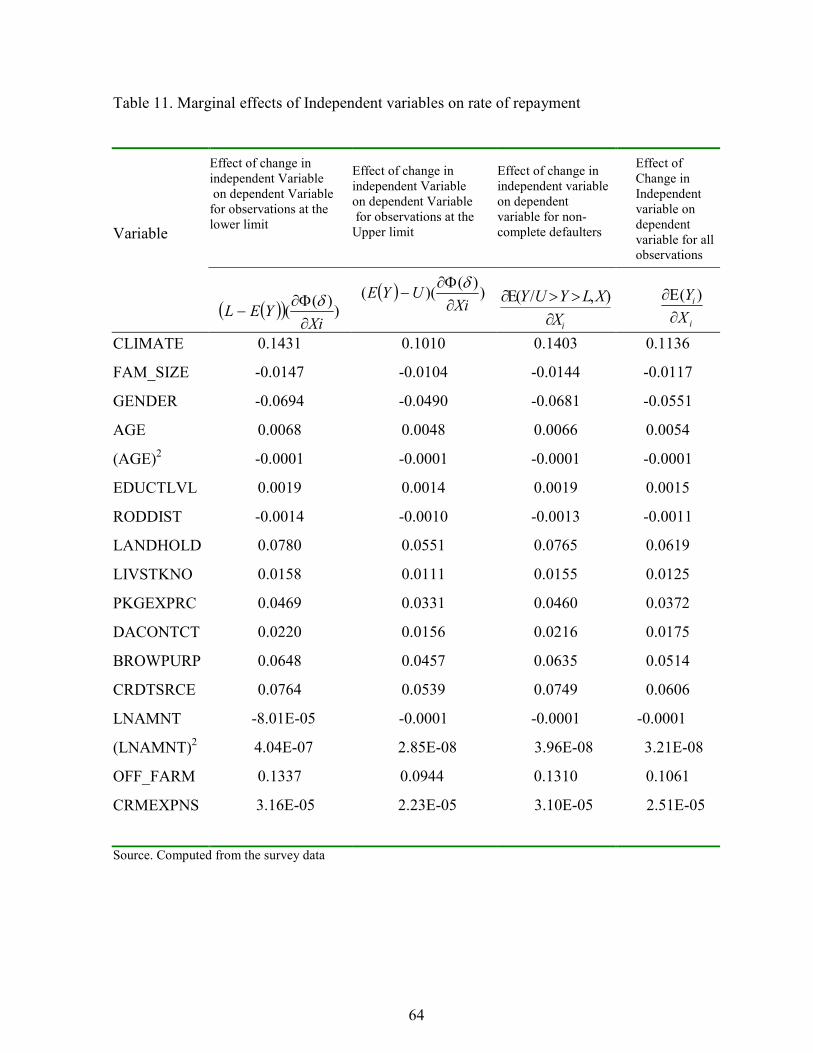
64
Table 11. Marginal effects of Independent variables on rate of repayment
Source. Computed from the survey data
Effect of change in
independent Variable
on dependent Variable
for observations at the
lower limit
Effect of change in
independent Variable
on dependent Variable
for observations at the
Upper limit
Effect of change in
independent variable
on dependent
variable for non-
complete defaulters
Effect of
Change in
Independent
variable on
dependent
variable for all
observations
Variable
( )( ) ))(
(Xi
YEL∂
Φ∂−
δ
( ) ))(
)((Xi
UYE∂
Φ∂−
δ
iX
XLYUY
∂
>>Ε∂ ),/(
i
i
X
Y
∂
Ε∂ )(
CLIMATE 0.1431 0.1010 0.1403 0.1136
FAM_SIZE -0.0147 -0.0104 -0.0144 -0.0117
GENDER -0.0694 -0.0490 -0.0681 -0.0551
AGE 0.0068 0.0048 0.0066 0.0054
(AGE)2 -0.0001 -0.0001 -0.0001 -0.0001
EDUCTLVL 0.0019 0.0014 0.0019 0.0015
RODDIST -0.0014 -0.0010 -0.0013 -0.0011
LANDHOLD 0.0780 0.0551 0.0765 0.0619
LIVSTKNO 0.0158 0.0111 0.0155 0.0125
PKGEXPRC 0.0469 0.0331 0.0460 0.0372
DACONTCT 0.0220 0.0156 0.0216 0.0175
BROWPURP 0.0648 0.0457 0.0635 0.0514
CRDTSRCE 0.0764 0.0539 0.0749 0.0606
LNAMNT -8.01E-05 -0.0001 -0.0001 -0.0001
(LNAMNT)2 4.04E-07 2.85E-08 3.96E-08 3.21E-08
OFF_FARM 0.1337 0.0944 0.1310 0.1061
CRMEXPNS 3.16E-05 2.23E-05 3.10E-05 2.51E-05
65
5. CONCLUSIONS AND POLICY IMPLICATIONS
Nowadays the prevalence of poverty has become a critical challenge of many societies in
developing countries. In these countries poverty is sever which has left millions of people out
of the basic needs of survival. One of the reasons for the rural households to live in the vicious
circle of poverty for long period is lack of access to financial services. Limited access to
financial service is also aggravated by poor performance of loan repayment. Increasing default
rate is by now one of the major problems of the lending institutions in the study area. The
present study was intended to identify and analyze the determinants of formal source of credit
loan repayment performance of smallholder farmers in North Gondar Administrative Zone
during the year 2003 (1995/96 E.C.).
A total of 157 smallholder households that obtained loan from formal credit lending institution
operating in the zone were included in the study. Descriptive statistics and two-limit Tobit
model were used to analyze the data collected from the sample respondents. The descriptive
statistics results showed that about 27 percent of sample households defaulted on the loans
they obtained. Of these about 56 percent were complete defaulters and the remaining 44
percent repaid 30 to 70 percent of the proportion of the loan they received. In addition, the
descriptive statistics results showed that there were significant differences between defaulters
and non-defaulters with respect to age, total land holding size, area of land devoted to crop
production, TLU, cattle ownership, income from off-farm activities and gender characteristics
of the households. Statistically significant differences were observed between defaulters and
non-defaulters also with respect to the distance from the main road, frequency of contact with
extension agents, experience in agricultural extension, source of credit, perception of benefit
of credit and agro-ecology of the respondent. On the other hand, from a total of 17
explanatory variables used in the two-limit Tobit regression model, seven variables (agro
ecology, land holding size, livestock ownership, experience in participation in the extension
package, frequency of contact with DA, source of credit used and income from off farm
activities) had statistically significant influence on the loan repayment performance of the
sample households.
66
The result of the econometric model showed that, farmers who had taken loan from Amhara
Credit and Saving Institute (ACSI) were relatively non-defaulters than who had borrowed
from Multi Service Cooperatives (MSC). The formation of borrowers group, the use of group
responsibility and peer monitoring are the principles guiding financial transaction of ACSI.
Loan extended to groups rather than individuals have high repayment rates due to many
reasons. Find, loans extended to groups reduce the information asymmetry between the lender
and the borrower. Thus, adverse selection and moral hazard problems are reduced in such
cases. Secondly, the joint liability mechanism in-group lending means group pressure on
members to repay loans timely would increase the repayment rate. Thus, the provision of
formal credit schemes in the area should focus on group lending, as it would increase the
likelihood of loan repayment by group members.
The finding of this study also revealed that, livestock are important farm assets that improve
the farmers’ repayment performance. As livestock are sources of income and serve as security
against crop failure, the result of this study is consistent with the priori expectation. It is,
therefore, important that more attention be given to the livestock sector at least in the
following areas: feed resource improvement and management; genetic resource improvement;
control and/or prevention of animal diseases and parasites; and development of marketing
facilities for animal and animal products.
Number of years of experience in agricultural extension services is a factor, which was
positively related to the dependent variable. This might because of the fact that those farmers
that have participated in the extension package have developed the skills of using new
agricultural technologies that would increase their income. This ultimately improves the loan
repayment performance of the farmers. In addition, those farmers that are regular participants
in the extension package are aware of the consequences of loan default on the availability of
credit for the next production season and are likely to make conscious decision to repay loan
timely. Thus, encouraging farmers to participate in the uptake of new technologies on regular
basis would improve the loan repayment performance the farmers. This could be done through
providing basket of options of technologies to the farmers from which they can choose. Also,
improving the marketing of agricultural products in the area through the expansion or rural
road networks, making available market information to the farmers and integration agricultural
producers might help the farmers get good prices for their products there may motivating them
67
to participate in the extension package on sustainable basis. In addition, deploying adequately
trained development agents in adequate numbers to the rural areas would increase the contact
and flow of information between the DA and income of the farmer that would improve loan
repayment.
On the other hand, land size is negatively correlated with loan default and it was one of the
most constraining factors. The possibility of its expansion seems bleak especially in the study
area. Thus, to mitigate the problem of cultivated land scarcity, the existing land must be
intensively used. For this purpose, farmers should rather be encouraged to use intensive
agricultural production methods. In this regard , the currant effort of the government to
promote small-scale irrigation scheme and water harvesting technologies should be further
expanded and strengthened.
The econometric results also showed that, farmers engaged in off-farm activities earn more
income were and able to settled their debts timely than others. This shows that, rural
development strategies should not only emphasis on increasing agricultural production but
concomitant attention should be given to promoting off-farm activities in the rural areas.
Lastly, farmers who were residents of adequate rainfall agro-climatic area had better loan
repayment performance than farmers who were residents of moisture deficit areas. Agro-
ecology of the area highly influenced agricultural production and productivity of the farmers.
Moisture availability is one of the factors that affect the type and range of crops to be grown
and animal s to be kept. Therefore, policies and strategies geared towards the development and
promotion of new technologies suitable to moisture deficit areas should be given adequate
emphasis in order to improve the loan repayment capacity of smallholder farmers living in
moisture deficit areas of the zone.
68
6. REFERENCES
Adams, D. and D. Graham, 1981. A critique of traditional agricultural credit projects and
policies. Journal of Development Economics. 8: 374-66.
Akerlof, G. A., 1970. The Market for Lemons: Quality Uncertainty and the Market
Mechanism. Quarterly Journal of Economics. 84 (3): 488-500.
Aldrich, J.H. and F.D.Nelson, 1984. Linear Probability, Logit and Probit Models: Quantitative
Applications in the Social Science: Sera Miller McCun, Sage Pub. Inc; University of
Minnesota and Iowa, New Delhi.
Aleem, I., 1990. Imperfect Information, Screening, and the Costs of Informal Lending: A
Study of a Rural Credit Market in Pakistan. W world Bank Economic Review.4 (3): 329-349.
Amemiya,T., 1984. Tobit model: A Survey. Journal of Econometrica. 24:3-63.
Amemiya, T., 1985. Advanced Econometrics. T.J press, Padstow Great Ltd.
ARCPB (Amhara Region Cooperative Promotion Bureau), 2005. Annual Report of
2004/2005. (Unpublished).
Assefa Admassie, 1987. A Study of Factors that Affect the Use of Agricultural Credit among
Peasant Farmers in Ethiopia: A case of two Districts. M Sc. Thesis Presented to the School of
Graduate Studies of Addis Ababa University, Ethiopia.
Assefa Admassie, 2004. A Review of the Performance of Agricultural Finance in Ethiopia.
Pre-and Post Reform Periods. 19p.
Begashaw Girma, 1978. The Economic Role of Traditional Savings and Credit Institutions in
Ethiopia. Savings and Development, 2(4), Milan.
Bekele Hundie, 2001. Factors Influencing the Loan Repayment Performance of Smallholders
in Ethiopia. MSc. Thesis Presented School of Graduate Studies of Alemaya University,
Ethiopia.
Belay Abebe, 2002. Factors Influencing Loan Repayment of Rural women in Eastern
Ethiopia: The Case of Dire Dawa Area. Thesis Presented to school of Graduate Studies of
Alemaya University.
Bekele Hundie, Belay Kassa, and Mulat Demeke, 2004. Factors Influencing Repayment of
Agricultural Input Loans in Ethiopia: The Case of Two Regions. African Review of Money,
69
Finance and Banking. Pp. 117-142.
Bekele Tilahun, 1995. Rural Credit in Ethiopia. Proceedings of Fourth Annual Conference of
the Ethiopian Economy. Pp. 353-372.
Belay Kebede and Belay Kassa, 1998. Factors affecting loan repayment performance of
smallholders in the Central Highlands of Ethiopia: The case of Alemegena District. Ethiopian
Journal Agricultural Economics.2 (2), 61-89.
Bhende, M.J., 1983. Credit Markets in the Semi-Arid Tropics of Rural South India.
Economics Program, Progress Report, ICRISAT, India.56p.
Berhanu Lakew, 1999. Micro-Enterprises Credit and Poverty Alleviation in Ethiopia. Addis
Ababa, Ethiopia.
BoPED (Bureau of Planning and Economic Development) Report, 2002. Gneral Repor of the
Region.
BoRD (Bureau of Rural Development), 2003. Rural Credit and Saving. Rural Household
Socio Economic Base Line Survey of 56 woredas in Amhara Region. 20: 1-35.
Christencer, G., 1993. The Limits to informal Financial Intermediation. World Development.
21(5): 721-731.
Cochran, W. G., 1977. Sampling Techniques. Tohn Wiley and Sons. Nework.
Conning,J. and C. Udry, 2005. Rural Financial Markets in Developing Countries. Working
Papers 914.Economic Growth Center, Yale University.
CSA (Centra Statistics Authority), 1994. Federal Democratic Republic of Ethiopia, Office of
Population and Housing Census Commission. Addis Ababa, Ethiopia.
CSA, 2002. FDRE Crop Production Sample Survey 2002/03. Addis Ababa.
Dessalegn Rhamato, 1994. After Mengistu a Mammoth Task. Trough Debut, Trial and Error
and Plain Hard Work, Ethiopia. Struggles to Shrug off 17 years of Mismanagement. Food and
Agriculture Organization, Rome.
Dey, J., 1980. Gambian Women: Unequal partners in Price Development Projects. Journal of
Development Studies. 17(3): 109-122.
70
Edilegnaw Wale, 1999. The Challenges in the Search for Efficient and Sustainable Rural
Credit Institutions and their Policy Implications in Ethiopia. Characteristics and Potenitials of
Local Informal Institutions in Rural Ethiopia , Some Experiance from North and West Shewa.
Eston, J. and M. Gersovitz, 1981. Debt with potential Repudiation: Theoretical and Emperical
Analysis. Review of Economic Studies. 48(2): 289-309.
Fentahun Melles, 2000. Informal Financial Institutions: Impact Analysis of ACORD's Credit
Intervention through Iddirs in Dire Dawa. M.Sc. Thesis Presented to School of Graduate
studies of Addis Ababa University, Ethiopia.
FAO (Food and Agriculture Organization), 1996. Rural Informal Credit Markets and the
Effectiveness of Policy Reform. Economic and Social Development Pape,r Rome. 134.
G/Yohannes, Worku, 2000. Microfinance Development in Ethiopia. A Paper Presented at
International Conference on the Development of Microfinance in Ethiopia: Achievements,
Problems and Prospects, Bahir Dar.
Ghosh, P. and D. Mookherjee, 1999. Credirt Rationning in Developing Countries. An
overview of the Theory. Readings in the Theory of Economic Development. Chapter 11:383-
401.
Gine, X. and S. Klonner, 2003. Fnancing a New Technology in Small-Sale Fishing:the
Dynamics of a Linked Product and Credit Contract. The World Bank Research Group,
Manuscript.
Gongalez-Vega, C., 1977. Interest rate restrictions and income distribution. American Journal
of Agricultural Economics. 59(5): 973-76.
Goodwin,B.K., 1992. An analysis of factors associated with consumers’ use of grocery
coupons. Journal of Agricultural and Resource Economics. 17:110-120.
Gould, J.P. and E. P. Lazear, 2002. Micro Economic Theory. Sixth Edition, Richard D.
Irwin,INC.
Greene, W.H. 2000. Econometric Analysis. Fourth Edition, Pretice Hall International,
Inc.New York.
Greenwal, D. and Associates, 1983.The Concise McGraw-Hill Dictionary of Modern
Economics. New York, USA.
Gujarati, D.N., 2003. Basic econometrics. Fourth Edition, McGraw Hill, New York.

71
Hanke, S.H. and A.A.Walters, 1991. Financial and Capital Markets in Developing Countries.
CA: ICS Press San Francisco.
Hoff, K. and J. Stiglitz, 1993. Imperfect Information and Rural Credit Markets. pp 33-52. In:
Puzzles and Policy Perspectives. Oxford University Press, New York.
Hosmer,D.W.and S.Lemeshew,1989.Applied Lojistic Regression. A Wiley-Interscience
Publication, New York.
Hunte, C.Kenrick, 1996.Controlling Loan Default and Improving the Lending Technology in
Credit Institutions. Saving and Development, Quarterly Review.1: 45-59.
IFAD (International Fund for Agricultural Development), 2001. Federal Democratic Republic
of Ethiopia Rural Financial Intermediation Program. , Report No. 1241-ET.
Ike, D.N., 1986. The problem of loan default in Nigerian Agriculture: An economic and
financial analysis. Indian Journal of Economics.66 (262): 409-422.
Jama, M.A., and D.M. Kulundu, 1992. Smallholder Farmers Credit Repayment Performance
in Ugari Division, Kakamaga District, Kenya. East Africa Review.8 (2): 85-91.
Johnston, J. And J.Dinardo, 1997. Econometrics Methods. Fourth Edition. The McGraw-Hill
Companies, Inc, New York.
Karlan, D. and J. Zinman (2004), Observing Unobservable: Identifying Information
Asymmetries with a Consumer Credit Field Experiment. Princeton Economics Department
working Paper.
Kebede Koomsa, 1995. Agricultural Credit Analysis. National Agricultural Policy Workshop.
19p.
Kashuliza, A., 1993. Loan Repayment and its Determinants in Smallholder Agriculture. A
case study in the Southern highlands of Tanzania. Estern Africa Economic Review. Vol. 9,
No. 1.Nairobi.
Kebede Tesfaye, 1982. Agricultural Credit in Ethiopia: Strategies for its Allocation and
Effective Utilization. MSc Thesis Presented to School of Graduate Studies of Addis Ababa
University, Ethiopia.
Kelejian, H.H. and W. Oates, 1981. An introduction to Econometric Analysis. Second edition,
Horper and Row Publishers.
72
Klonner, S., 2004. Buying Fields and Marrying Daughters: An Empirical Analysis of RoSCA
Auctions in a South Indian Village: Department of Economics, Cornell University.
Kumer, P., P.K.Joshi, and M.A. Muralidharan, 1978. Estimation of Demand for Credit on
Marginal Farms-A Profit Function Approach. Indian Journal of Agricultural Economics,
33(4): 106-114.
Ligon, E., J.P. Thomas, and T. Worall, (1999). Mutual Insurance with Limited Commitment:
Theory and Evidence from Village Economies, in, working paper. University of California,
Berkeley.
Long, S., 1997.Regression Models for Catagorical and Limited Dependent Variables.Thous
and Oaks,CA:Sage Publications.
Lynne, G.D., J.S. Shonkwiler, and L.R. Rola, 1988. Attitudes and Farmer Conservation
Behavior. American Journal of Agricultural Economics 70:12-19.
Maddala, G.S., 1983. Limited Dependent and Qualitative Variables in Econometrics.
Cambridge University Press, Cambridge.
Maddala, G.S., 1985. Limited Dependent and Qualitative Variables in Econometrics.
Cambridge University Press, Cambridge.
Maddala, G.S. 1992. Introduction to Econometrics. Second Edition. Macmillan Publishing
Company, New York.
Maddala, G.S. 1997. Limited Dependent and Qualitative Variables in Econometrics.
Cambridge University press, Cambridge.
Matin, I., 1997. Repayment Performance in Grameen Bank. Saving and Development.
Quarterly Review. 22(4): 451-473.
McDonald, J. and R. Moffit, 1980.The use of Tobit Analysis. Review of Econometrics and
Statistics. 62:318-321.
McKinnon, R.I., 1973. Money and Capital in Economic Development. Brookings Institution,
Washington, D.C.
McSweeney, B.G., 1979. Collection and Analysis of Data on Rural Women’s Time Use.
Studies in Family Planning. 10(11/12): 379-383.
73
Mengistu Bediye, 1997. Determinants of Micro-enterprise Loan Repayment and Efficiency of
Screening Mechanism in Urban Ethiopia: The case of Bahir Dar and Awassa Towns, Addis
Ababa.
Miller, L.F., 1977. Agricultural Credit and Finance in Africa. The Rockefeller Foundation.
U.S.A.
Mohiuddin, Y.,1993. Credit Worthiness of Poor Women. A Comparison of Som Minimalist
Credit Programmers in Asia: a Preliminary Analysis. The Pakistan Development Review.
34(4): 1199-1209. Tennessee, USA.
MoFED (Ministry of Finance and Economic Development), 2002. Sustainable Development
and Poverty Reduction Program. Addis Ababa Ethiopia.
Mosely, P., 1995. Aid and Power. The World Bank and Policy-based Lending. Volume1,
London and New York, Rout ledge.
Moshar, A.T., 1966. Getting Agriculture Moving: Essentials for Development and
Modernization. New York, Praeger.
Mulat Demeke, V. Kelly, T.S Jayne, Ali Said, J.C Le Vallee and H. Chen. , 1998. Grain
Marketing Research Project. Ministry of Economic Development and Cooperation. Addis
Abeba.
Mwinijilo, M.L., 1987. A Study in to the Causes of Medium-term Loan Defaluts among
Smallholder Farmers in Salima Agricultural Development Division. A Research Report
Submitted to the National Research Council of Malawi. Lilongwe.
NBE (National Bank of Ethiopia), 2004. National bank of Ethiopia 2002/2003 Annual Report.
Addis Ababa, Ethiopia.
Newman, W.L. 1997. Social Science Research Methods: Qualitative Quantitative Approaches.
Boston and Bacon.
North Gondar Rural Development Branch Office, (2004). 2003/2004 Progress Report. Gondar,
Ethiopia.
74
Paulson, A. L., and R. M. Townsend, 2003. Distinguishing Limited Commitment from Moral
Hazard in Models of Growth with Inequality. Federal Reserve Bank of Chicago.
Prais, S. and Houthakker, (1955). The Analysis of Family Budget:Cambridge University press.
New York.
Rosett, R. and F. Nelson, 1975. Estimation of the Two-limit Probit Regression Model.
Econometrica. 43:141-146.
Rutemiller, H.C., and D.A. Bowers (1968). Estimation in a Heteroscedasticitic Regression
Model. Journal of the American Statistical Association. 63:552-557.
RWSEP (Rural Water Supply and Environment Program), 2001. Phase III, Program
Document.. (Unpublished). Saharan Africa. NR Paper
96-05. Mexico, D.F.: CIMMYT.
Screiner, M. and G. Nagarjan, 1997. Predicting Creditworthiness: Evidence from ASCRAs
and ROSCAs in the Gambia. Saving and Development, Quarterly review. 22(4): 399-413.
Singh,G., J.S. Sidhu and S. Balawant, 1985. A Study on Repayment Performance of
Borrowers in Punjab. Financing Agriculture. India.
Smith, D.A. and R. Brame, 2003. Tobit Models In Social Science Research: Some Limitation
and a More General Alternative. Sociological Methods and Research. 31:364 –388.
Stighitz, E., 1989. Financial Markets and Development. Oxford Review of Economic Policy.
5(4): 55-68.
Storck, H.,Bezabih Emana, Berhanu Adnew , A.A. Borowiecki, and Shimelis W/Hawariat,
1991. Farming systems and Farm Management Practices of Small-holders in the Hararghe
Highlands." Farming system and Resource Economics in the Tropics. 11: Wissenschafts
Varlag Vauk Kiel KG, Germany.
Tesfaye Assefa, 1993. Rural Credit in Ethiopia, Addis Ababa, Ethiopia.
Timmer,C.P., 1988. The Agricultural Transformation. In:Chenery, H and Srinivasan,T.N.,Eds,
Handbook of Development Economics, Volume I. Elsevier Science Publisher.
75
Tobin, J., 1958. Estimation of Relation Ships for Limited Dependent Variables.
Econometrica. 26:24-36.
UNECA (United Nations Economic Commission for Africa), 1996. Sustainable Agriculture
and Environmental Rehabilitation Program/SAERP/. Statistical Master book on Sectoral
conditions and activities, in the Amhara Regional State, Vo. l 1. Addis Ababa, Ethiopia.
Vigano, L. 1993. A credit Scoring Model for Development Banks: An African Case Study.
Saving and Development. 17(4): 441-482.
Wenner, M. D. 1995. Group Credit: A menace to improve information transfer and loan
repayment performance. Journal of Development Studies.32 (2), 263- 281.
Welday Amha, 1999a. “Improved seed marketing and adoption in Ethiopia. Ethiopian Journal
of Agricultural Economics. 3: 41-8.
Welday Amha, 1999b. Networking Micro-finance Activities in Ethiopia: Challenges and
Prospects, A paper presented at the International Conference on Micro Finance Development
in Ethiopia, Bahir Dar.
Welday Amha, 2003. Micro finance in Ethiopia: Performance, Challenges and Role in Poverty
Reduction. AEMFI, Occasional Paper, 7.
Yaqub, S., 1995. Empowered to Default. Evidence from BRAC’s Micro-Credit Programs.
Small Enterprise Development. 6(4): 4-13.
Sharma, M. and M. Zeller, 1997. Repayment Performance in Group-Based Credit Programs
in Bangladesh: An Empirical Analysis. Food Consumption and Nutrition Division,
International Food Policy Research Institute, Washington D. C., USA.
Zeller, M., 1998. Determinants of Repayment Performance in Credit Groups: The Role of
Program Design, Intra group Risk Polling, and Social Cohesion. International Food Policy
Research Institute. Reprint No. 384.
76
7. APPENDICES
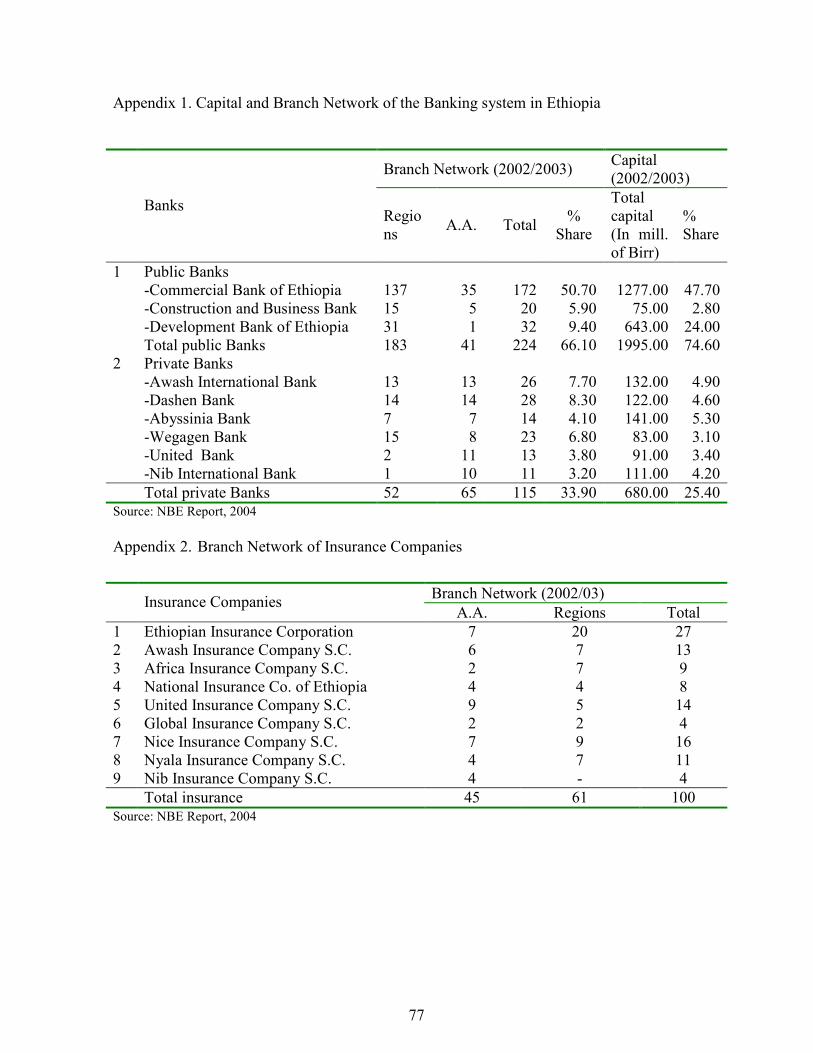
77
Appendix 1. Capital and Branch Network of the Banking system in Ethiopia
Branch Network (2002/2003) Capital
(2002/2003)
Banks Regio
ns A.A. Total
%
Share
Total
capital
(In mill.
of Birr)
%
Share
1 Public Banks
-Commercial Bank of Ethiopia
-Construction and Business Bank
-Development Bank of Ethiopia
137
15
31
35
5
1
172
20
32
50.70
5.90
9.40
1277.00
75.00
643.00
47.70
2.80
24.00
Total public Banks 183 41 224 66.10 1995.00 74.60
2 Private Banks
-Awash International Bank
-Dashen Bank
-Abyssinia Bank
-Wegagen Bank
-United Bank
-Nib International Bank
13
14
7
15
2
1
13
14
7
8
11
10
26
28
14
23
13
11
7.70
8.30
4.10
6.80
3.80
3.20
132.00
122.00
141.00
83.00
91.00
111.00
4.90
4.60
5.30
3.10
3.40
4.20
Total private Banks 52 65 115 33.90 680.00 25.40 Source: NBE Report, 2004
Appendix 2. Branch Network of Insurance Companies
Branch Network (2002/03) Insurance Companies
A.A. Regions Total
1
2
3
4
5
6
7
8
9
Ethiopian Insurance Corporation
Awash Insurance Company S.C.
Africa Insurance Company S.C.
National Insurance Co. of Ethiopia
United Insurance Company S.C.
Global Insurance Company S.C.
Nice Insurance Company S.C.
Nyala Insurance Company S.C.
Nib Insurance Company S.C.
7
6
2
4
9
2
7
4
4
20
7
7
4
5
2
9
7
-
27
13
9
8
14
4
16
11
4
Total insurance 45 61 100 Source: NBE Report, 2004
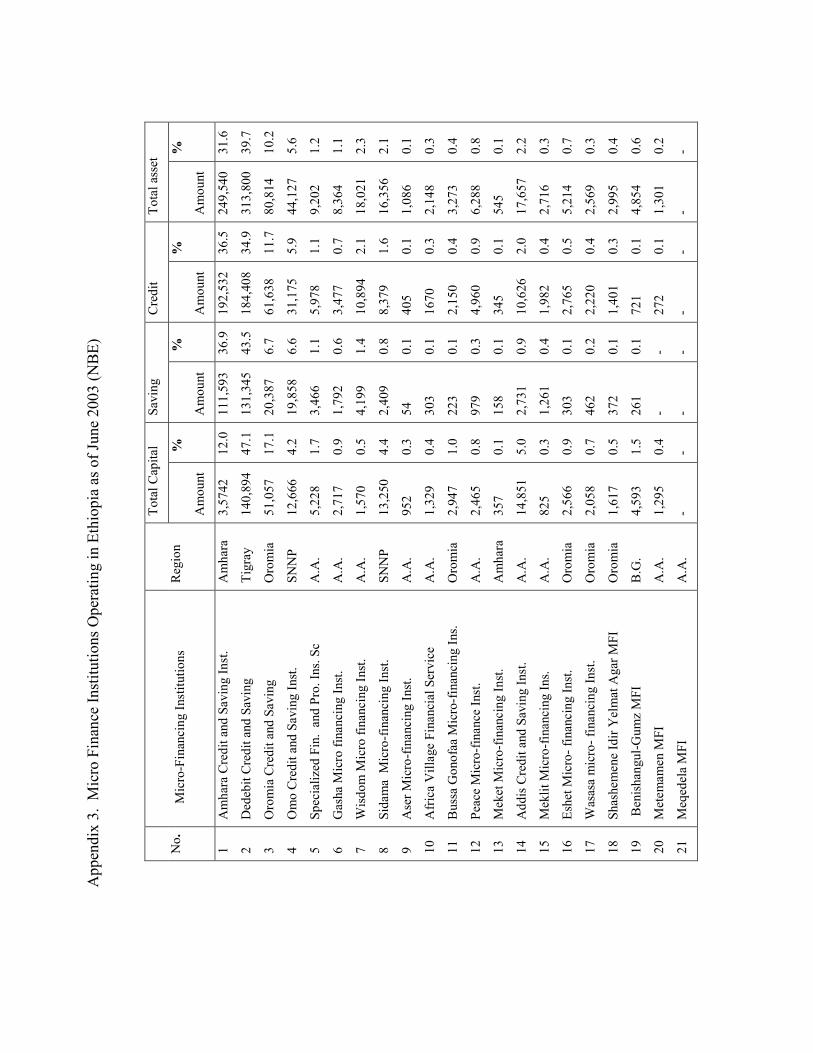
Appendix 3. Micro Finance Institutions Operating in Ethiopia as of June 2003 (NBE)
Total Capital
Saving
Credit
Total asset
No.
Micro-Financing Institutions
Region
Amount
%
Amount
%
Amount
%
Amount
%
1
2
3
4
5
6
7
8
9
10
11
12
13
14
15
16
17
18
19
20
21
Amhara Credit and Saving Inst.
Dedebit Credit and Saving
Oromia Credit and Saving
Omo Credit and Saving Inst.
Specialized Fin. and Pro. Ins. Sc
Gasha Micro financing Inst.
Wisdom Micro financing Inst.
Sidama Micro-financing Inst.
Aser Micro-financing Inst.
Africa Village Financial Service
Bussa Gonofaa Micro-financing Ins.
Peace Micro-finance Inst.
Meket Micro-financing Inst.
Addis Credit and Saving Inst.
Meklit Micro-financing Ins.
Eshet Micro- financing Inst.
Wasasa micro- financing Inst.
Shashemene Idir Yelmat Agar MFI
Benishangul-Gumz MFI
Metemamen MFI
Meqedela MFI
Amhara
Tigray
Oromia
SNNP
A.A.
A.A.
A.A.
SNNP
A.A.
A.A.
Oromia
A.A.
Amhara
A.A.
A.A.
Oromia
Oromia
Oromia
B.G.
A.A.
A.A.
3,5742
140,894
51,057
12,666
5,228
2,717
1,570
13,250
952
1,329
2,947
2,465
357
14,851
825
2,566
2,058
1,617
4,593
1,295
-
12.0
47.1
17.1
4.2
1.7
0.9
0.5
4.4
0.3
0.4
1.0
0.8
0.1
5.0
0.3
0.9
0.7
0.5
1.5
0.4
-
111,593
131,345
20,387
19,858
3,466
1,792
4,199
2,409
54
303
223
979
158
2,731
1,261
303
462
372
261
- -
36.9
43.5
6.7
6.6
1.1
0.6
1.4
0.8
0.1
0.1
0.1
0.3
0.1
0.9
0.4
0.1
0.2
0.1
0.1
- -
192,532
184,408
61,638
31,175
5,978
3,477
10,894
8,379
405
1670
2,150
4,960
345
10,626
1,982
2,765
2,220
1,401
721
272
-
36.5
34.9
11.7
5.9
1.1
0.7
2.1
1.6
0.1
0.3
0.4
0.9
0.1
2.0
0.4
0.5
0.4
0.3
0.1
0.1
-
249,540
313,800
80,814
44,127
9,202
8,364
18,021
16,356
1,086
2,148
3,273
6,288
545
17,657
2,716
5,214
2,569
2,995
4,854
1,301
-
31.6
39.7
10.2
5.6
1.2
1.1
2.3
2.1
0.1
0.3
0.4
0.8
0.1
2.2
0.3
0.7
0.3
0.4
0.6
0.2
-
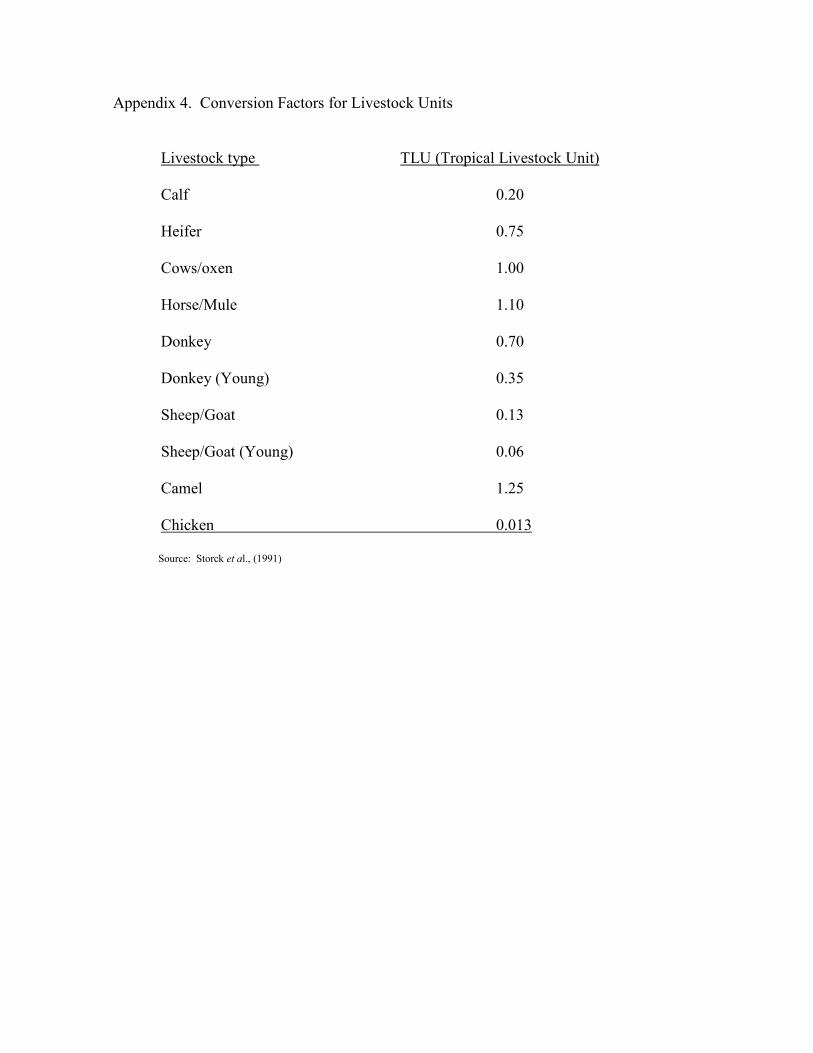
Appendix 4. Conversion Factors for Livestock Units
Livestock type TLU (Tropical Livestock Unit)
Calf 0.20
Heifer 0.75
Cows/oxen 1.00
Horse/Mule 1.10
Donkey 0.70
Donkey (Young) 0.35
Sheep/Goat 0.13
Sheep/Goat (Young) 0.06
Camel 1.25
Chicken 0.013
Source: Storck et al., (1991)
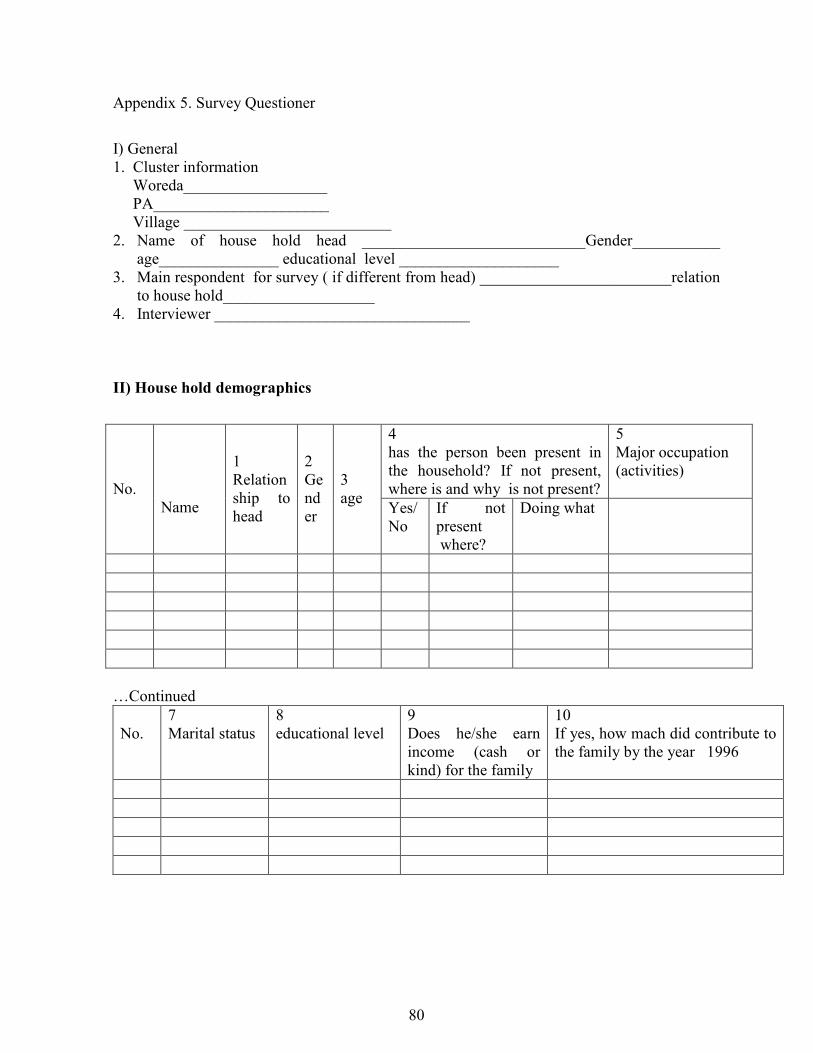
80
Appendix 5. Survey Questioner
I) General
1. Cluster information
Woreda__________________
PA______________________
Village __________________________
2. Name of house hold head ____________________________Gender___________
age_______________ educational level ____________________
3. Main respondent for survey ( if different from head) ________________________relation
to house hold___________________
4. Interviewer ________________________________
II) House hold demographics
4
has the person been present in
the household? If not present,
where is and why is not present?
5
Major occupation
(activities)
No.
Name
1
Relation
ship to
head
2
Ge
nd
er
3
age Yes/
No
If not
present
where?
Doing what
…Continued
No.
7
Marital status
8
educational level
9
Does he/she earn
income (cash or
kind) for the family
10
If yes, how mach did contribute to
the family by the year 1996
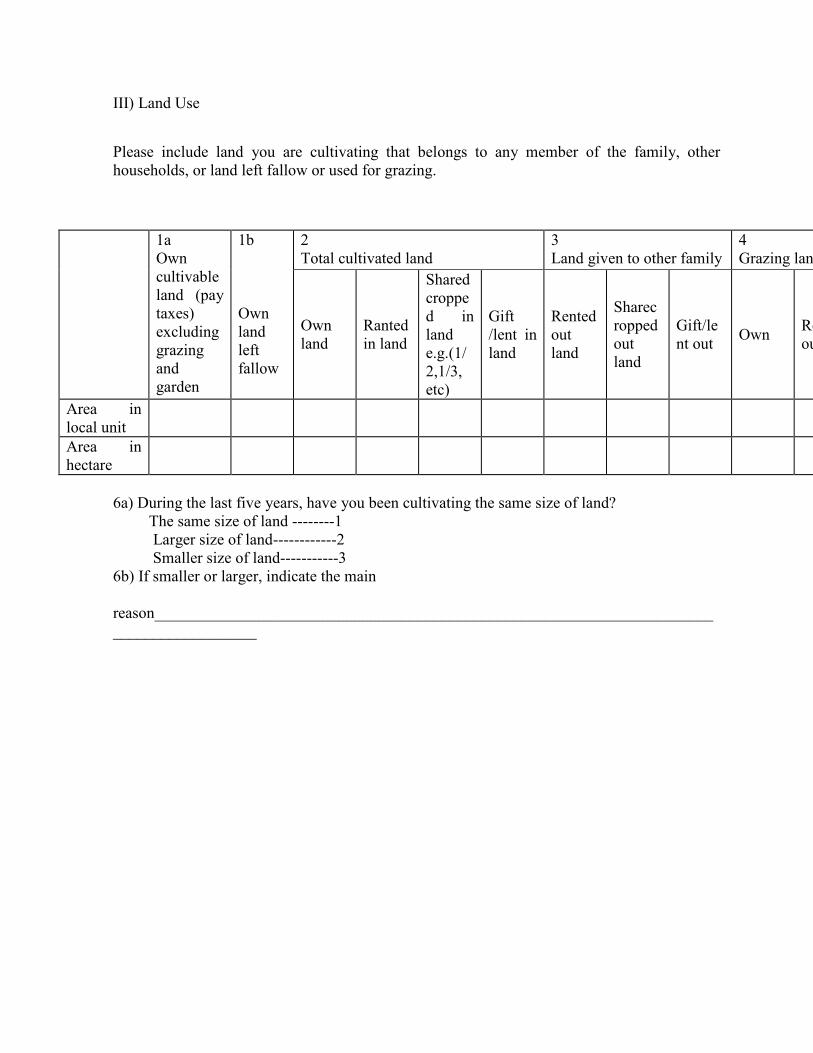
III) Land Use
Please include land you are cultivating that belongs to any member of the family, other
households, or land left fallow or used for grazing.
2
Total cultivated land
3
Land given to other family
4
Grazing land
1a
Own
cultivable
land (pay
taxes)
excluding
grazing
and
garden
1b
Own
land
left
fallow
Own
land
Ranted
in land
Shared
croppe
d in
land
e.g.(1/
2,1/3,
etc)
Gift
/lent in
land
Rented
out
land
Sharec
ropped
out
land
Gift/le
nt out Own
Rented
out
Area in
local unit
Area in
hectare
6a) During the last five years, have you been cultivating the same size of land?
The same size of land --------1
Larger size of land------------2
Smaller size of land-----------3
6b) If smaller or larger, indicate the main
reason______________________________________________________________________
__________________
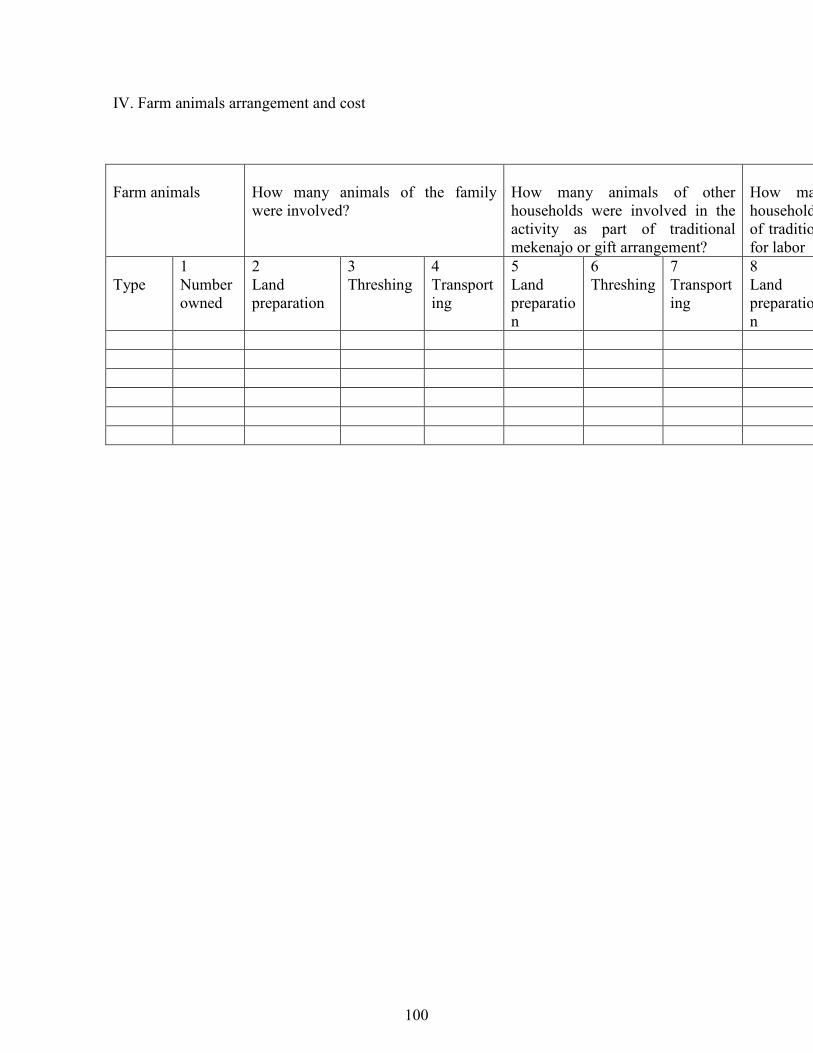
100
IV. Farm animals arrangement and cost
Farm animals
How many animals of the family
were involved?
How many animals of other
households were involved in the
activity as part of traditional
mekenajo or gift arrangement?
How many animals of other
households were involved as part
of traditional exchange of animals
for labor
Type
1
Number
owned
2
Land
preparation
3
Threshing
4
Transport
ing
5
Land
preparatio
n
6
Threshing
7
Transport
ing
8
Land
preparatio
n
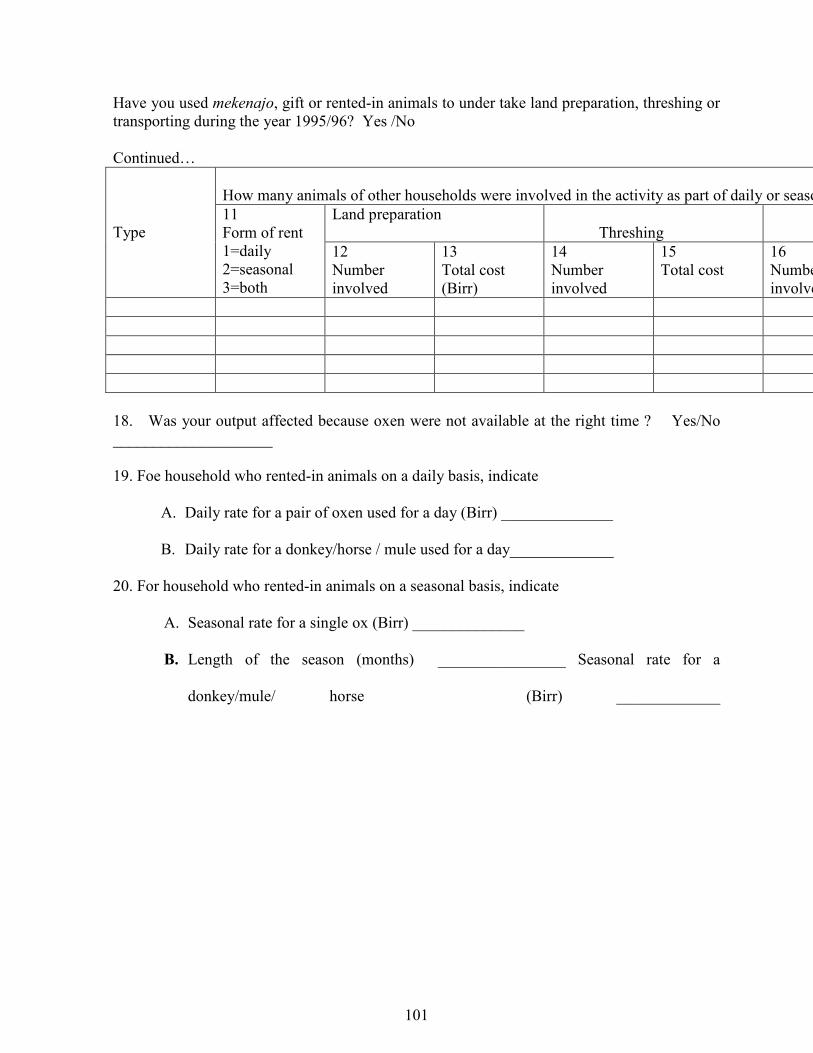
101
Have you used mekenajo, gift or rented-in animals to under take land preparation, threshing or
transporting during the year 1995/96? Yes /No
Continued…
How many animals of other households were involved in the activity as part of daily or seasonal rent
Land preparation
Threshing
TransportingType 11
Form of rent
1=daily
2=seasonal
3=both
12
Number
involved
13
Total cost
(Birr)
14
Number
involved
15
Total cost
16
Number
involved
18. Was your output affected because oxen were not available at the right time ? Yes/No
____________________
19. Foe household who rented-in animals on a daily basis, indicate
A. Daily rate for a pair of oxen used for a day (Birr) ______________
B. Daily rate for a donkey/horse / mule used for a day_____________
20. For household who rented-in animals on a seasonal basis, indicate
A. Seasonal rate for a single ox (Birr) ______________
B. Length of the season (months) ________________ Seasonal rate for a
donkey/mule/ horse (Birr) _____________
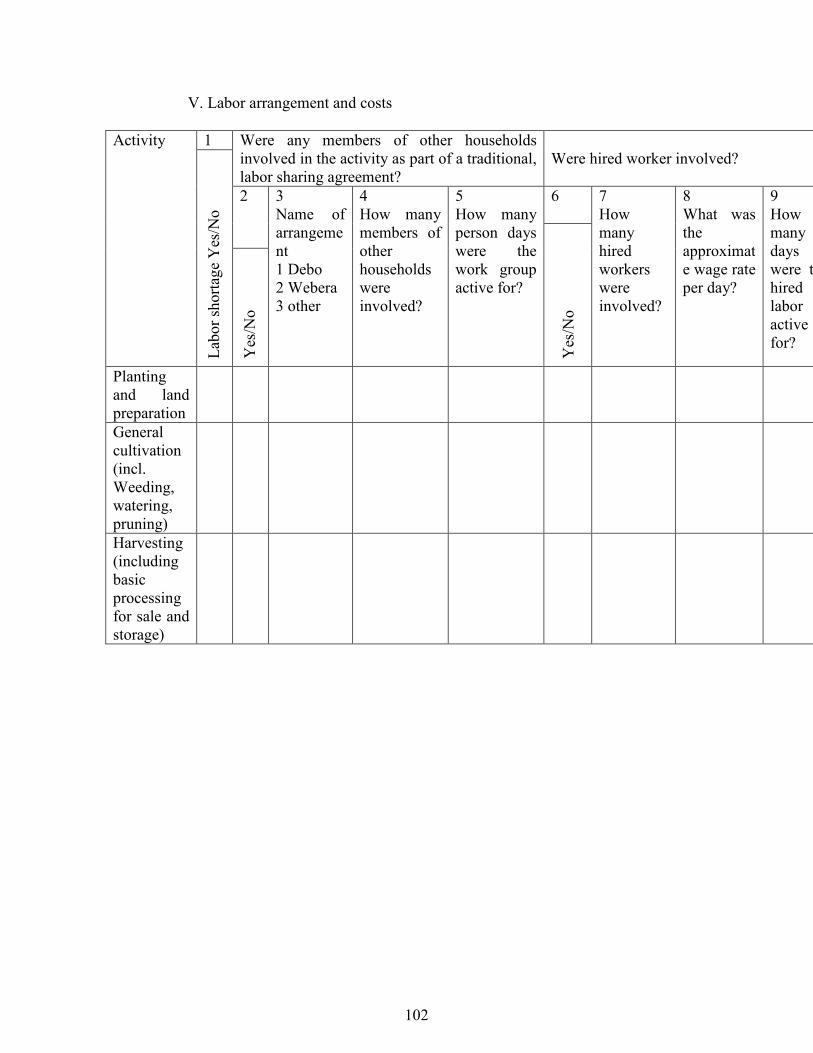
102
V. Labor arrangement and costs
1 Were any members of other households
involved in the activity as part of a traditional,
labor sharing agreement?
Were hired worker involved?
6 2
Activity
Labor shortage Yes/No
Yes/No
3
Name of
arrangeme
nt
1 Debo
2 Webera
3 other
4
How many
members of
other
households
were
involved?
5
How many
person days
were the
work group
active for?
Yes/No
7
How
many
hired
workers
were
involved?
8
What was
the
approximat
e wage rate
per day?
9
How
many
days
were the
hired
labor
active
for?
Planting
and land
preparation
General
cultivation
(incl.
Weeding,
watering,
pruning)
Harvesting
(including
basic
processing
for sale and
storage)
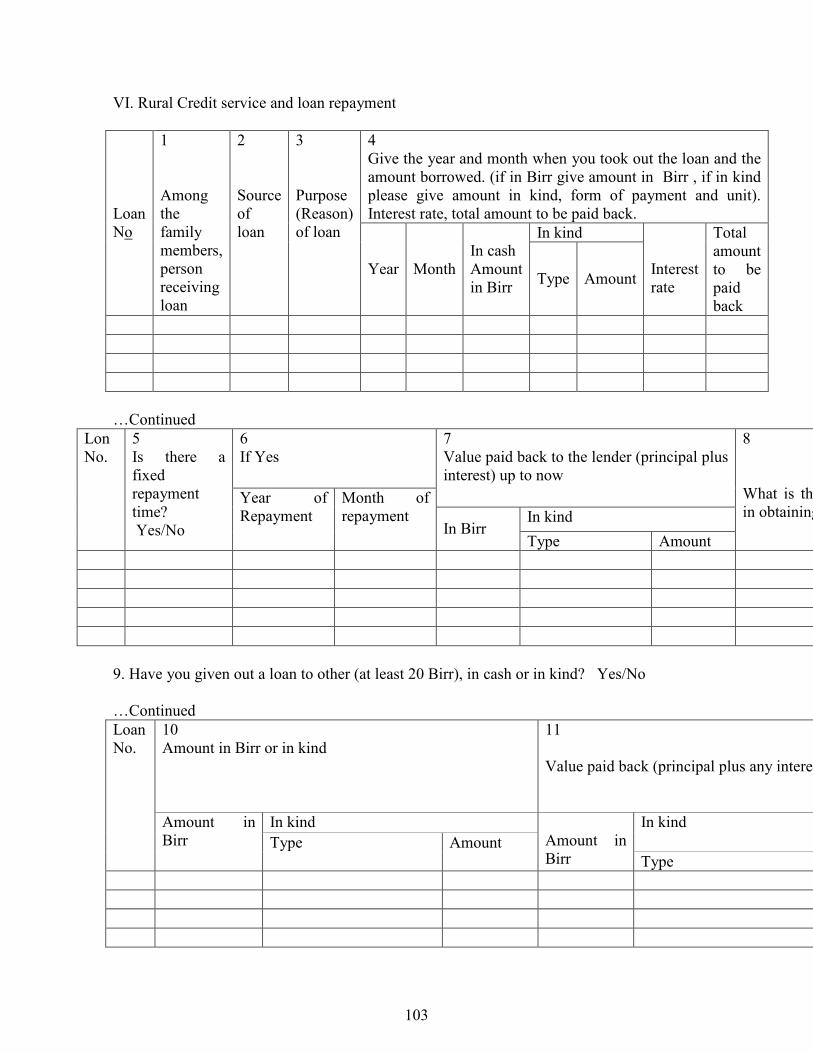
103
VI. Rural Credit service and loan repayment
4
Give the year and month when you took out the loan and the
amount borrowed. (if in Birr give amount in Birr , if in kind
please give amount in kind, form of payment and unit).
Interest rate, total amount to be paid back.
In kind
Loan
No
1
Among
the
family
members,
person
receiving
loan
2
Source
of
loan
3
Purpose
(Reason)
of loan
Year Month
In cash
Amount
in Birr Type Amount
Interest
rate
Total
amount
to be
paid
back
…Continued
6
If Yes
7
Value paid back to the lender (principal plus
interest) up to now
In kind
Lon
No.
5
Is there a
fixed
repayment
time?
Yes/No
Year of
Repayment
Month of
repayment In Birr
Type Amount
8
What is the most
in obtaining credit
9. Have you given out a loan to other (at least 20 Birr), in cash or in kind? Yes/No
…Continued
10
Amount in Birr or in kind
11
Value paid back (principal plus any interest) up to now
In kind In kind
Loan
No.
Amount in
Birr Type Amount
Amount in
Birr Type
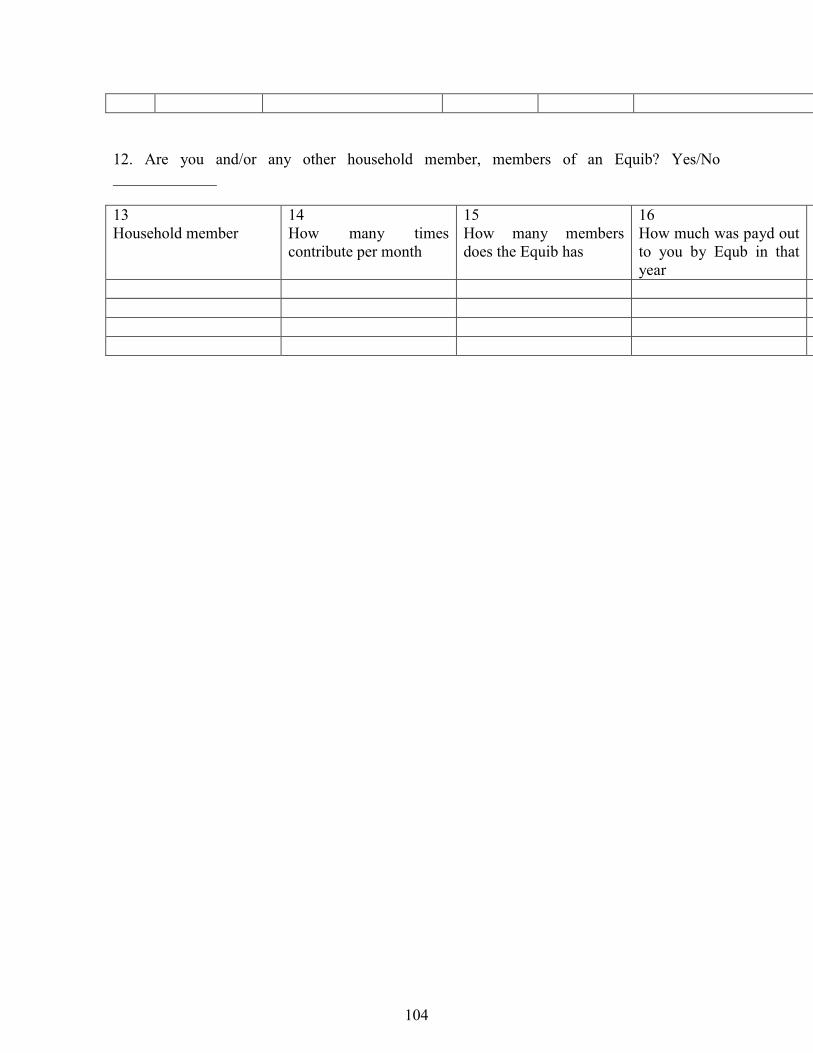
104
12. Are you and/or any other household member, members of an Equib? Yes/No
_____________
13
Household member
14
How many times
contribute per month
15
How many members
does the Equib has
16
How much was payd out
to you by Equb in that
year
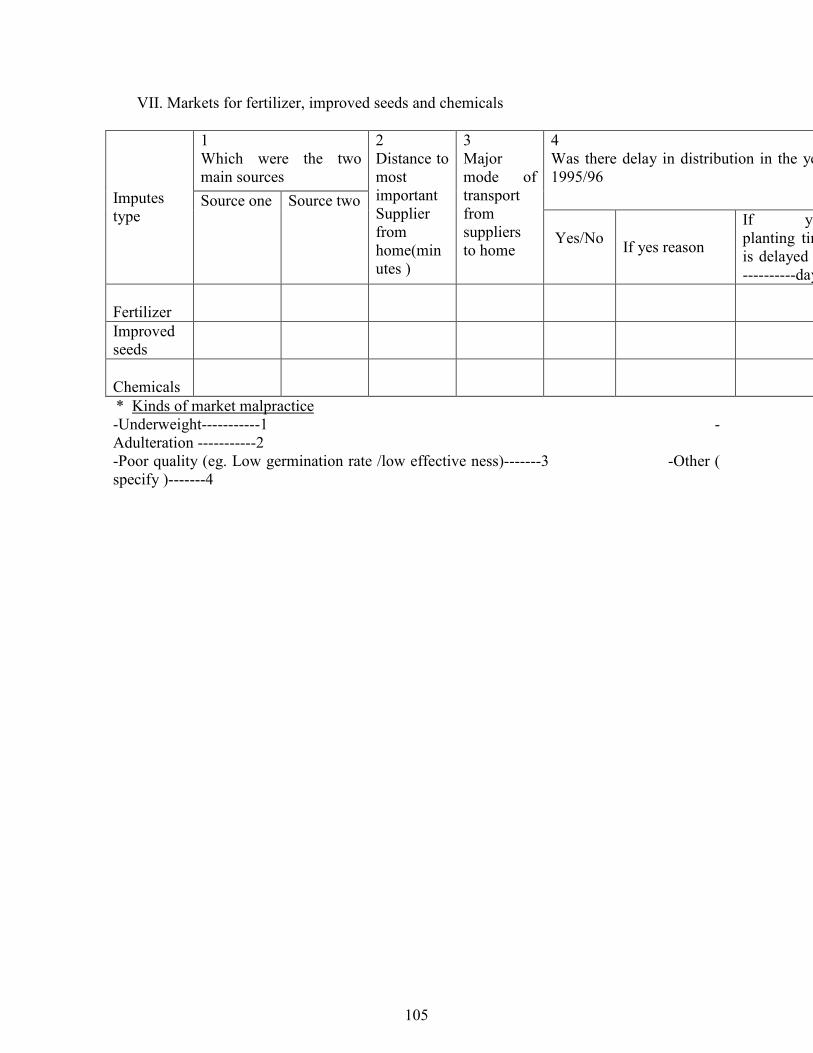
105
VII. Markets for fertilizer, improved seeds and chemicals
1
Which were the two
main sources
4
Was there delay in distribution in the year
1995/96
Imputes
type Source one Source two
2
Distance to
most
important
Supplier
from
home(min
utes )
3
Major
mode of
transport
from
suppliers
to home
Yes/No If yes reason
If yes,
planting time
is delayed by
----------days
Fertilizer
Improved
seeds
Chemicals
* Kinds of market malpractice
-Underweight-----------1 -
Adulteration -----------2
-Poor quality (eg. Low germination rate /low effective ness)-------3 -Other (
specify )-------4

106
continued …
6
Can you buy the input
whenever you went to
buy
Yes/ No
7
Canyou buy the input at
the nearest possible
point?
Yes/ No
8
Do you have choice in
desising from which
uppliers to buy?
Yes/ No
Fertilizer
Improved seeds
Chemicals
** Major short comings of Distribution
- Shortage of supply----------1
- Late arrival------------------ 2
- High price--------------------3
- Lack of credit----------------4
- Other (specify)--------------5
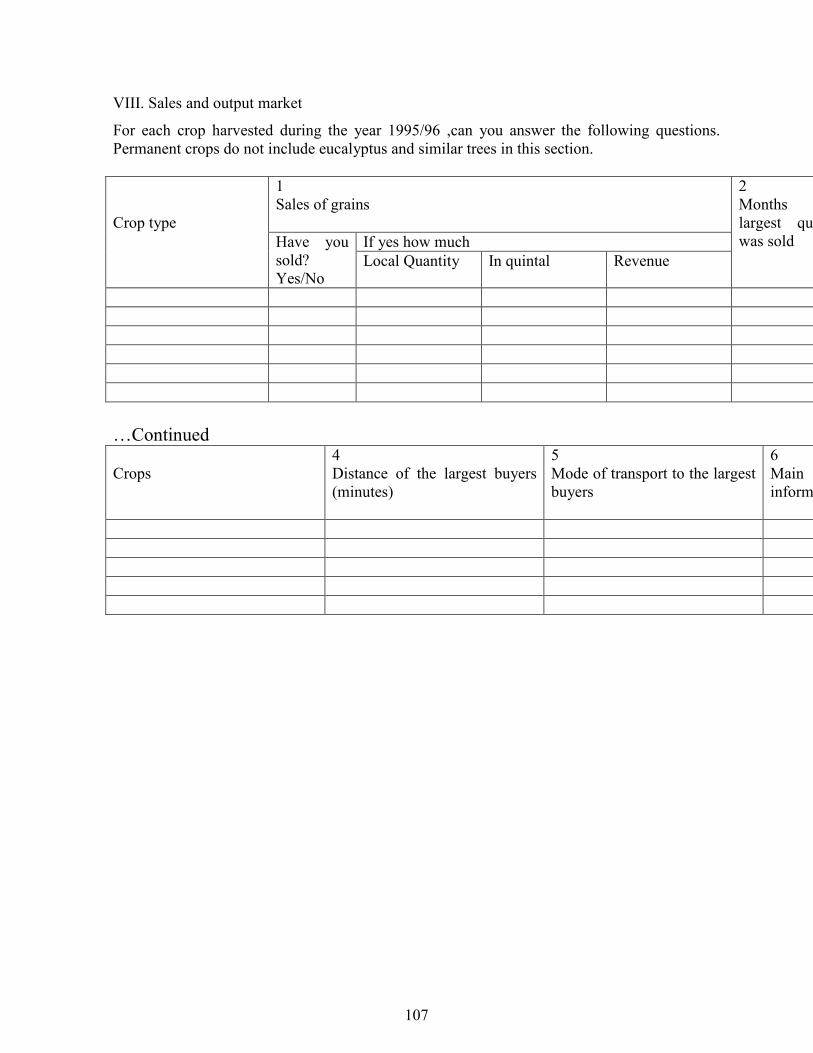
107
VIII. Sales and output market
For each crop harvested during the year 1995/96 ,can you answer the following questions.
Permanent crops do not include eucalyptus and similar trees in this section.
1
Sales of grains
If yes how much
Crop type
Have you
sold?
Yes/No Local Quantity In quintal Revenue
2
Months when
largest quantity
was sold
…Continued
Crops
4
Distance of the largest buyers
(minutes)
5
Mode of transport to the largest
buyers
6
Main source of price
information
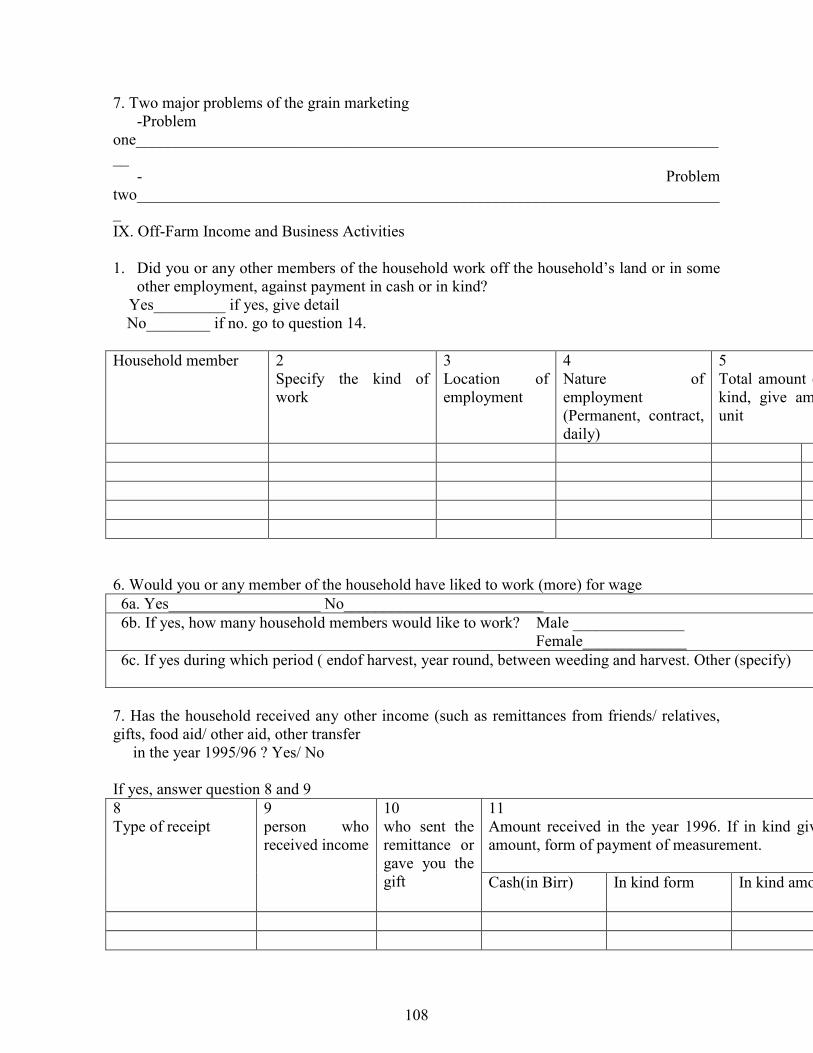
108
7. Two major problems of the grain marketing
-Problem
one_________________________________________________________________________
__
- Problem
two_________________________________________________________________________
_
IX. Off-Farm Income and Business Activities
1. Did you or any other members of the household work off the household’s land or in some
other employment, against payment in cash or in kind?
Yes_________ if yes, give detail
No________ if no. go to question 14.
Household member 2
Specify the kind of
work
3
Location of
employment
4
Nature of
employment
(Permanent, contract,
daily)
5
Total amount earned in the year 1996 if in
kind, give amount, form of payment and
unit
6. Would you or any member of the household have liked to work (more) for wage
6a. Yes___________________ No_________________________
6b. If yes, how many household members would like to work? Male ______________
Female_____________
6c. If yes during which period ( endof harvest, year round, between weeding and harvest. Other (specify)
7. Has the household received any other income (such as remittances from friends/ relatives,
gifts, food aid/ other aid, other transfer
in the year 1995/96 ? Yes/ No
If yes, answer question 8 and 9
11
Amount received in the year 1996. If in kind give the
amount, form of payment of measurement.
8
Type of receipt
9
person who
received income
10
who sent the
remittance or
gave you the
gift Cash(in Birr) In kind form In kind amount

109
12. Has any one from the family received training on handicraft skills? Yes/No
_______________
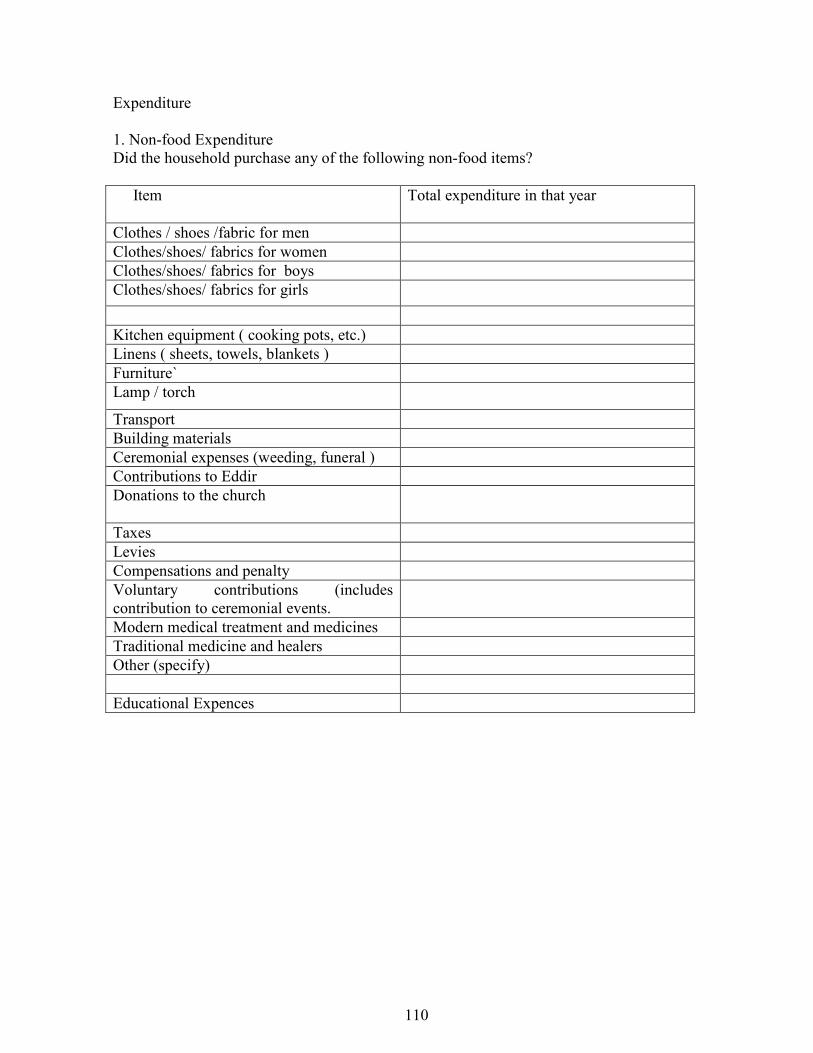
110
Expenditure
1. Non-food Expenditure
Did the household purchase any of the following non-food items?
Item Total expenditure in that year
Clothes / shoes /fabric for men
Clothes/shoes/ fabrics for women
Clothes/shoes/ fabrics for boys
Clothes/shoes/ fabrics for girls
Kitchen equipment ( cooking pots, etc.)
Linens ( sheets, towels, blankets )
Furniture`
Lamp / torch
Transport
Building materials
Ceremonial expenses (weeding, funeral )
Contributions to Eddir
Donations to the church
Taxes
Levies
Compensations and penalty
Voluntary contributions (includes
contribution to ceremonial events.
Modern medical treatment and medicines
Traditional medicine and healers
Other (specify)
Educational Expences