Effectiveness, persistence, and residue of amitraz plastic strips ...
Upload
independentCategory
view
1download
0
Plant and Soil225: 263–278, 2000.© 2000Kluwer Academic Publishers. Printed in the Netherlands.
263
Crop rotation and residue management effects on carbon sequestration,nitrogen cycling and productivity of irrigated rice systems
C. Witt1, K.G. Cassman2,∗, D.C. Olk1, U. Biker3, S.P. Liboon4, M.I. Samson1 and J.C.G.Ottow3
1International Rice Research Institute, MCPO Box 3127, 1271 Makati City, Philippines;2Department of Agro-nomy, University of Nebraska, P.O. Box 830915, Lincoln, Nebraska 68583-0915, USA;3Institut für AngewandteMikrobiologie, Justus-Liebig-Universität Giessen, Senckenbergstr. 3, D-35390 Giessen, Germany and4PhilippineRice Research Institute, Maligaya, Muñoz, 3119 Nueva Ecija, Philippines
Received 17 May 1999. Accepted in revised form 3 July 2000
Key words: aerated soil, anaerobic soil, biological nitrogen fixation, nitrogen fertilizer response, nitrogenmineralization, organic matter turnover
Abstract
The effects of soil aeration, N fertilizer, and crop residue management on crop performance, soil N supply, organiccarbon (C) and nitrogen (N) content were evaluated in two annual double-crop systems for a 2-year period (1994–1995). In the maize-rice (M-R) rotation, maize (Zea mays, L.) was grown in aerated soil in the dry season (DS)followed by rice (Oriza sativa, L.) grown in flooded soil in the wet season (WS). In the continuous rice system (R-R), rice was grown in flooded soil in both the DS and WS. Subplot treatments within cropping-system main plotswere N fertilizer rates, including a control without applied N. In the second year, sub-subplot treatments with earlyor late crop residue incorporation were initiated after the 1995 DS maize or rice crop. Soil N supply and plant Nuptake of 1995 WS rice were sensitive to the timing of residue incorporation. Early residue corporation improvedthe congruence between soil N supply and crop demand although the size of this effect was influenced by theamount and quality of incorporated residue. Grain yields were 13-20% greater with early compared to late residueincorporation in R-R treatments without applied N or with moderate rates of applied N. Although substitution ofmaize for rice in the DS greatly reduced the amount of time soils remained submerged, the direct effects of croprotation on plant growth and N uptake in the WS rice crops were small. However, replacement of DS rice by maizecaused a reduction in soil C and N sequestration due to a 33–41% increase in the estimated amount of mineralizedC and less N input from biological N fixation during the DS maize crop. As a result, there was 11–12% more Csequestration and 5–12% more N accumulation in soils continuously cropped with rice than in the M-R rotationwith the greater amounts sequestered in N-fertilized treatments. These results document the capacity of continuous,irrigated rice systems to sequester C and N during relatively short time periods.
Abbreviations:BNF – biological nitrogen fixation; [C] – carbon concentration; IRRI – International Rice ResearchInstitute; [N] – nitrogen concentration; SOC – soil organic carbon; TSN – total soil nitrogen
Introduction
Intensive irrigated rice systems, with two and some-times three rice crops produced each year in the samefield, are the dominant agricultural land use in the
∗ FAX No: (+01) 402-472-7904. E-mail: [email protected]
lowland tropics and subtropics of Asia (Cassman andPingali, 1995). Optimal productivity of these systemsdepends on relatively large inputs of inorganic N fer-tilizer, and grain yield is closely correlated with Nuptake under favorable growth conditions (Cassmanet al., 1993). Despite the importance of N fertilizerto productivity, there is little relationship between the

264
Table 1. Treatments and plot size in the split-split plot experimental design of the Rice-UplandCrop Rotation Experiment, 1994–95. WS = wet season; DS = dry season
Season Main plot factor Subplot factor Sub-subplot factor
Cropping system N fertilizer rate∗ Time of residue incorporation∗∗(12× 25 m) (12× 8 m) (6× 8 m)
1994 DS rice or maize 0, 95, or 190 kg N ha−1 –
1994 WS rice 0, 50, or 100 kg N ha−1 –
1995 DS rice or maize 0, 95, or 190 kg N ha−1 –
1995 WS rice 0, 50, or 100 kg N ha−1 early or late
∗Dry season N rate treatments are designated N0, N95, N190 in the text, while wet season N ratetreatments are designated N0, N50, N100.∗∗Imposed only in the fallow period between the 1995 DS and WS.
amount of N fertilizer applied by farmers and the indi-genous soil N supply of their fields, and this imbalancecontributes to low N fertilizer use-efficiency (Cassmanet al., 1996a; Olk et al., 1999).
Tremendous variation in indigenous soil N supply,measured as plant N uptake in a plot that does notreceive N fertilizer, is a consistent feature of intensiverice systems (Cassman et al., 1998; Olk et al., 1999).Large variation in soil N supply is evident amongfarmers’ fields in close proximity with the same soiltype and also in the same field over time (Cassmanet al., 1996b). This variation is not correlated withsoil organic carbon content (SOC) or total soil N con-tent (TSN), and it cannot be explained by climaticfactors such as temperature or solar radiation. Instead,soil management practices and associated effects onN immobilization-mineralization dynamics are con-sidered to be primary controls on soil N supply in thesesystems (Cassman et al., 1995; Olk et al., 1996).
Common soil management practices that affect Ncycling in these irrigated lowland rice systems arethe incorporation of crop residues in puddled soil un-der mostly anaerobic conditions, repetitive croppingcycles in flooded soil without an upland crop rota-tion, and soil drying only in the fallow period betweenrice crops, which may last from less than one weekto more than three months. Results from long-termexperiments indicate that continuous, irrigated ricecropping may cause a decline in soil N supply withtime although SOC and TSN are conserved or evenincrease over time (Cassman et al., 1995; Dobermannet al., 2000).
Although rotation with a non-rice crop grown inaerated soil and timing of tillage operations are likelyto exert large influences on C and N cycling and Navailability, there is little information on the mag-nitude and progression of such effects from field
experiments on irrigated lowland rice systems (as re-viewed by Cassman et al., 1998). Our objective wasto evaluate the initial effects of crop rotation, residueincorporation method, and N fertilizer on C and N cyc-ling, N availability, and crop N uptake in an irrigatedrice field during the initial two years of the rotationtreatments. A previous paper reported the effects ofthese management regimes on soil microbial biomassand labile soil N fractions (Witt et al., 1998).
Materials and methods
The field experiment
The experiment was established in 1993 at the Inter-national Rice Research Institute (IRRI), Los Baños,Laguna, Philippines (14◦11′ N, 121◦15′ E, 21 m abovesea level). The soil is classified as an Aquandic Epi-aquoll with 56% clay, 36% silt and an initial pH of6.6. The field had supported two irrigated rice cropsannually for at least eight years prior to the presentfield study. A uniformly managed rice crop was pro-duced in the 1993 wet season (WS) in which growthand yield were relatively uniform throughout the field.Treatments were initiated in the 1994 dry season (DS)and continued through the 1995 WS, a period whichincluded four crop cycles.
Treatments were arranged in a split-plot designwith four replicates (Table 1). Two annual double-croprotations were main plots: (1) a continuous rice-ricesystem (R-R) in which rice (IR72) was grown inflooded soil during both the DS from January–Apriland the WS from July–October, and (2) a maize-rice(M-R) rotation in which maize (Pioneer hybrids 3008in 1994 and 3014 in 1995) was grown in aerated soilduring the DS and rice was grown in flooded soil

265
Figure 1. Solar radiation (MJ m−2 d−1, 10-d intervals), rainfall (mm, 10-day intervals) and soil conditions in the Rice-Upland Crop RotationExperiment in 1994 and 1995. Long-term means were obtained from data recorded by the IRRI climate unit (1979–1994). M-R = maize-ricerotation, R-R = rice-rice cropping system, DS = dry season, WS = wet season.
during the WS. The time to maturity of the maize vari-eties and IR72 was about 100 days after emergence(DAE) or transplanting (DAT). Three N fertilizer treat-ments were subplots (designated N0, N95/N50, orN190/N100 as described in Table 1). All N fertilizerwas applied as prilled urea. Dry-season rice receivedfive split applications in N190 subplots at rates of 30,
40, 40, 50, and 30 kg N ha−1. The first split wasbroadcast-incorporated in puddled soil one day beforetransplanting and the other splits were topdressed atabout 20, 30, 40 and 55-70 DAT, respectively. TheN190 maize subplots received three N splits, with 60kg N ha−1 broadcast-incorporated in dry soil beforeplanting, 70 kg N ha−1 topdressed at about 20 DAE
266
and 60 kg N ha−1 topdressed at 40 DAE. The N95treatments of the R-R and M-R main plots receivedhalf of the N applied to the N190 subplots followingthe same schedule of application. In the WS, N fertil-izer for both R-R and M-R was applied in three splitswith 40% incorporated in puddled soil one day beforetransplanting, 40% topdressed at 42 DAT, and 20%topdressed at 53 DAT.
In both the DS and WS, 10-day-old rice seed-lings were transplanted in hills spaced at 20× 20 cm(250,000 hills ha−1). Floodwater depth was main-tained at 5–10 cm except during the initial 7–10 dayestablishment phase after transplanting and the lastweek before harvest when the field was drained. TheDS maize was planted at 15 cm intra-row spacing onridges 75 cm apart (89,000 plants ha−1). Maize wasirrigated by sprinklers during the first four weeks andthereafter by furrow irrigation. A thick plastic sheetwas inserted to 60 cm depth between main plot treat-ments to avoid leakage from the flooded rice mainplots into the maize main plots. All treatments re-ceived 26 kg P and 50 kg K ha−1 in each crop cycle,which was incorporated before planting. A blanket ap-plication of 10 kg Zn ha−1 was applied to the 1993 WSrice crop. Weeds, insects, and diseases were controlledas required to avoid yield loss.
The sequence of soil conditions during the fallowand cropping periods is shown in Figure 1. Imme-diately after harvest of WS rice, straw was cut at25–30 cm height and removed. The remaining stubblewas incorporated in aerated soil of the M-R rotation byrototiller about 30 d prior to seeding DS maize. In theR-R system, WS stubble was incorporated in floodedsoil about 30 d prior to transplanting when plots wereflooded, wet-plowed and puddled. In both croppingsystems, soil was freely drained during the 50–60 dfallow period between harvest of the DS crop and soilpreparation for the WS rice crop. After harvest of the1994 DS crops, maize stalks were cut below the lowestear and removed leaving 30-50 cm of stalk in the field.Rice straw was cut and removed as in the WS. The re-maining maize stalks were incorporated in aerated soilat 47 d before transplanting using a rototiller. Remain-ing rice stubble was incorporated in flooded soil 15d prior to transplanting WS rice. Severe soil crackingwas not observed in the DS when soils were irrigated.During the fallow periods, small cracks occurred in theupper 5 cm, but they did not extend below this depth.
Nitrogen-rate subplots were further split into ‘timeof crop residue incorporation’ sub-subplot treatmentsafter the 1995 DS crop. Maize stalk and rice straw re-
moval were performed in the same manner as in 1994,but crop residues were incorporated early (63 d be-fore transplanting) or late (14 d before transplanting)in randomized sub-subplot treatments within N-ratesubplots. Early incorporation was performed in aer-ated soil using a rototiller while late incorporationwas accomplished in flooded soil by wet plowing andpuddling.
Plant measurements
One day before incorporation, the biomass of above-ground crop residue was estimated from a 12-hill ricesample or a 12-plant maize sample from each plot.Total aboveground dry matter (DM) during the grow-ing season was also estimated from a 12-hill rice ora 12-plant maize sample at 40 DAT/DAE (i.e., pan-icle initiation in rice), flowering in rice or tasseling inmaize ( 70 DAT/DAE) and physiological maturity ( 95DAT/DAE) of the 1994 and 1995 DS crops. In additionto these sampling times, aboveground DM in the 1995WS crop was also measured at early tillering (14 DAT)and mid-tillering (25 DAT). All plant samples wereoven-dried to constant weight at 70◦C, weighed, andground to pass a 1 mm screen for N analysis by micro-Kjeldahl digestion, distillation, and titration (Bremnerand Mulvaney, 1982). Tissue carbon concentration [C]was measured by combustion in a Europa ScientificRoboprep-CN analyzer.
Grain yield was obtained from a central 5 m2 har-vest area at the mature grain stage ( 98 DAT/DAE)and is reported at a standard moisture content of 0.14(rice) or 0.15 kg H20 kg−1 fresh weight (maize). Strawyields were estimated from the oven-dry grain yieldof the 5 m2 harvest area and the harvest index (HI,i.e. grain yield as a proportion of aboveground plantDM) of the 12-hill plant sample at physiological ma-turity. Total plant N at maturity was calculated fromthe measured grain yields from the 5 m2 harvest area,the estimated straw yield, and the N concentration [N]of grain and straw from the 12-hill sample at physiolo-gical maturity. Plant N accumulation patterns duringcrop growth were based entirely on the dry matter and[N] of the 12-hill rice or 12-plant maize samples.
Soil measurements
Soil measurements were made only in N0 andN190/N100 subplot treatments. Because a plow pan ex-isted at 18–25 cm depth, initial soil samples in the1993 WS were taken from the 0–15 cm topsoil layer.Correcting for soil bulk density, this layer contained

267
approximately 1.2× 10⁶ kg soil ha−1 on an oven-dry basis. In subsequent soil samples taken during thecourse of the experiment, soil bulk density was de-termined prior to sampling so that the sampled depthcould be adjusted to contain 1.2× 10⁶ kg soil ha−1.Bulk density measurements were based on the oven-dry soil weight (48 h at 105◦C) of two 5-cm diametercores per subplot.
Soil samples were taken every 2–3 weeks to meas-ure extractable inorganic N in the topsoil layer. In1994, a composite sample was prepared by mixing 12soil cores taken from each subplot. After establishingresidue incorporation sub-subplots following the 1995DS crop, six soil cores were bulked from each sub-subplot. All soil samples were extracted within 2–3h and extracts were stored at -2◦C prior to analysis.Nitrate was determined from the extinction of the soilextract against a reduced aliquot at 210 nm using aBeckman DU 41 spectrophotometer (Navone, 1964).Ammonium analysis followed the method of Kempersand Zweers (1986). Separate subsamples of fresh soilwere air-dried and sieved (< 2 mm) for analysis ofSOC by a modified Walkley-Black method (Page etal., 1982) and TSN by Kjeldahl digestion, distillationand titration (Bremner and Mulvaney, 1982).
Computing the nitrogen and carbon balances
Only treatments with late residue incorporation wereconsidered for the C and N balances because lateresidue incorporation was imposed in both years of thestudy and is the most common practice of residue man-agement in irrigated rice systems. The carbon balancewas constructed based on the assumption that the min-imum (or net) amount of mineralized C was equivalentto the C input from crop residues minus the change inSOC during the five crop cycles from the beginningof 1993 WS rice crop to harvest of the 1995 WS ricecrop.
The N balance was constructed by accounting forchanges in TSN between 1993 and 1995, the N inputsfrom fertilizer, irrigation and rainfall, and net N re-moval by grain and straw (i.e., total N in above-groundDM minus the N returned to soil in the incorporatedcrop residues). Nitrogen inputs from irrigation waterwere computed from the estimated amount of appliedirrigation water (1200 mm in the DS and 600 mm inthe WS) and measurements of ammonium and nitratein the irrigation water, which were made at monthlyintervals throughout the 1994 and 1995 cropping sea-sons. The inorganic [N] in the irrigation water was
always less than 0.1 mg N L−1. The N contributionfrom rainfall was based on measurements made byApp et al. (1984) at the IRRI farm and more recent val-ues estimated from measurements taken by the IRRIclimate unit. Other major sources of N input or out-put not measured include N inputs from biologicalN2 fixation (BNF), gaseous N losses from ammoniavolatilization and denitrification, and leaching losses.Hence, the N balance estimates only net N gains orlosses. Leaching losses were probably small, how-ever, because of low infiltration rates< 1.2 mm d−1,as measured during the 1993 WS rice crop using adouble-ring infiltration system, and the absence ofdeep soil cracking in the fallow periods.
Climatic conditions and statistical analysis
Rainfall, mean daily solar radiation, and temperaturewere recorded at a weather station 100 m from theexperiment. Rice yield potential at the site is higherin the DS than the WS because of greater solar radi-ation in the DS (Figure 1). Mean daily temperature isrelatively constant throughout the year (25.9◦C in theDS vs. 27.5◦C in the WS), while rainfall is greatestfrom June to October. In general, seasonal trends insolar radiation followed long-term averages.
Time trends for plant N accumulation, extract-able inorganic soil N, SOC and TSN are presented astreatment means with standard errors (SE). Treatmenteffects on rice grain yield, plant DM, SOC and TSNwere evaluated according to the split plot (1994 WS)and split-split plot (1995 WS) design by standard ana-lysis of variance (ANOVA) (SAS, 1988). Significantdifferences among treatment means were comparedusing the Tukey-test (P< 0.05).
Results
Extractable soil NH4-N and NO3-N in the dryseason
In the R-R system, soil NH4-N increased after soilflooding and puddling prior to transplanting of the DSrice crop (Figure 2a, c). This increase was greater intreatments that received preplant fertilizer-N than incontrol plots without applied N, and the differencewas more apparent in 1995 than in 1994. The timebetween basal application of 30 kg urea-N ha−1 andsoil sampling was only one day in the 1994 DS (versusthree days in the 1995 DS), and it is likely that much of

268
Figure 2. The effect of fertilizer-N application (0 and 190 kg N ha−1 in N0 and N190 treatments) on soil extractable NH4-N and NO3-N inthe 1994 and 1995 dry season (DS). Fertilizer-N was applied in five and three splits in N190 treatments of rice and maize plots, respectively.Application rates and timing are indicated in each figure. Nitrate was below detection in the flooded soil from the DS rice treatments. Barsindicate standard errors (SE).
the urea had not yet been hydrolyzed before sampling.After mid-tillering (22 DAT), extractable NH4-N de-creased sharply in all treatments and remained loweven when soil was sampled after fertilizer-N top-dressings were applied in the N190 subplots. The lackof increase in extractable NH4-N following N top-dressing after 30 DAT results from rapid N uptake bythe rice crop (Cassman et al., 1998; Peng and Cas-sman, 1998) and rapid N losses from volatilizationwhen urea is broadcast into floodwater (Fillery andVlek, 1986).
In the aerated soil of N0 maize subplots, inorganicN remained<3 kg NH4-N ha−1 and<10 kg NO3-N ha−1 in the topsoil layer throughout the croppingperiod in both the 1994 and 1995 DS (Figure 2b, d).In contrast, soil NO3-N in the N190 maize subplotsremained at 25–35 kg N ha−1 throughout most ofthe 1994 DS maize crop (Figure 2b). Although ini-tial NO3-N levels in this treatment were similar in the
1995 DS, they decreased from 20 kg NO3-N ha−1 at20 DAE to< 5 kg NO3-N ha−1 at 40 DAE (Figure 2d)and never returned to the levels observed in the 1994DS. This decrease may have resulted from rapid de-nitrification when the maize plots were temporarilyflooded after a heavy rainfall event shortly after theN fertilizer topdressing at 23 DAE in February 1995(Figure 1). Nitrate losses of this magnitude from de-nitrification during brief flooding episodes have beenobserved in other studies on lowland rice soils (DeDatta et al., 1991; George et al., 1993).
Rice and maize response to applied N in the dryseason
Rice grain yields from corresponding treatments weresimilar in both the 1994 and 1995 DS (Table 2). RiceDM and grain yield were about 2-fold greater in N190than in N0 subplots in both years, while the corres-

269
Figure 3. The effect of fertilizer-N application (0 and 190 kg N ha−1 in N0 and N190 treatments) on plant N uptake of rice and maize in the1994 and 1995 dry season (DS). Bars indicate SE.
ponding increase in rice N accumulation at maturitywas more than 3-fold (Figure 3). Although maize DM,grain yield, and N accumulation were similar in N0plots in both years, there was a large difference in Nfertilizer response between years (Table 2, Figure 3).Maize grain yield was 40–55% greater in the N95and N190 subplots in the 1994 DS than in the 1995DS, and N uptake in 1994 was nearly double thatof 1995. We speculate that the smaller response toapplied N in 1995 reflected the large loss of NO3-Nduring temporary flooding as described above.
Extractable soil NH4-N and NO3-N in the wet season
During the fallow period after the DS harvest, sub-stantial amounts of NO3-N accumulated in soil of bothcropping systems (Witt et al., 1998). This NO3-N wasrapidly lost to denitrification after soil was flooded14 d prior to transplanting the WS rice crop (datanot shown). Extractable NH4-N was comparable inall treatments one day before preplant N application,which was two days prior to transplanting, and in-creased in all treatments during the 7 d period aftertransplanting (Figure 4). The magnitude of the in-crease after transplanting was influenced by the timeof residue incorporation and N fertilizer in the 1995
WS (Figure 4c, d). For example, extractable NH4-N at4 DAT in the 1995 WS was 33% greater in N100 sub-plots with early residue incorporation than with lateincorporation regardless of the previous DS crop. Thisdifference was similar to the difference in NH4-N at 4DAT in the 1994 WS when rice followed maize, whichhad early residue incorporation, versus rice followingrice, which had late incorporation (Figure 4a, b). Res-ults from the 1995 WS suggest that the greater increasein NH4-N in the 1994 WS rice following maize waslargely due to the early residue incorporation ratherthan the effects of crop rotation. Without applied N,extractable NH4-N also increased in the 7d followingtransplanting although the magnitude of the increasewas much smaller than in treatments receiving N fer-tilizer. After midtillering in both years, extractableNH4-N decreased sharply in all treatments and re-mained low throughout the remainder of the growingseason despite two N fertilizer topdressings.
Rice response to applied N in the wet season
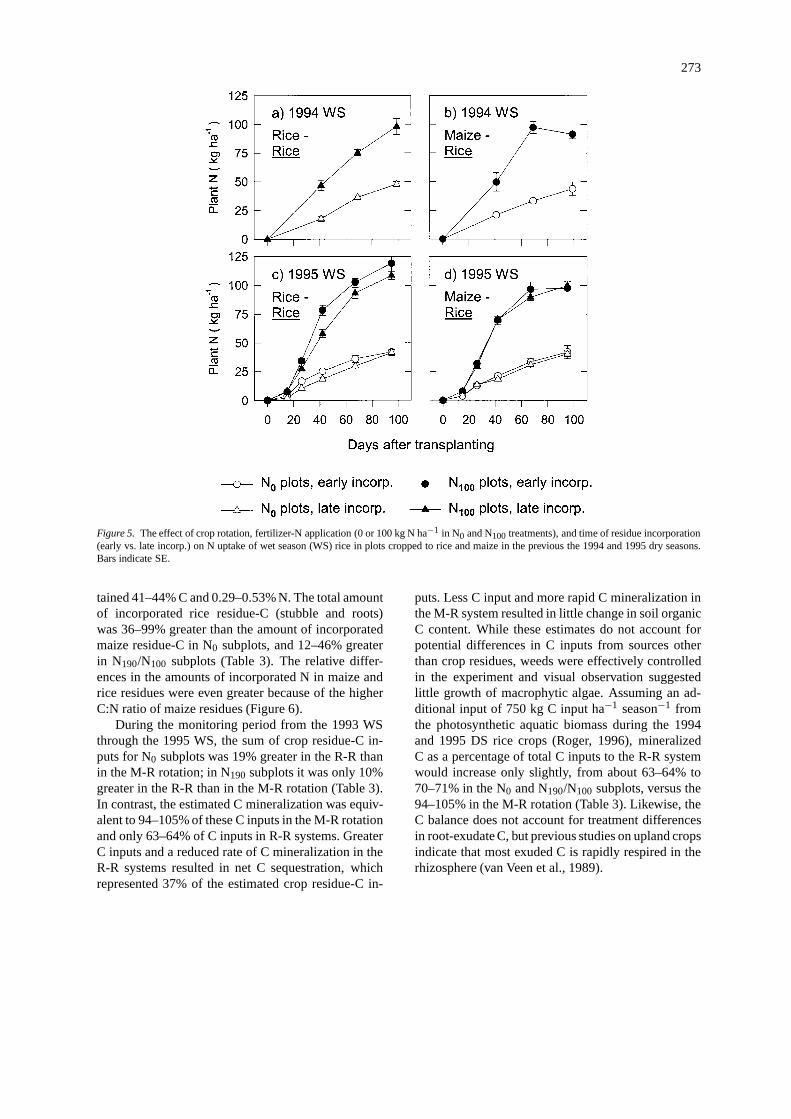
Fertilizer-N application had large effects on plantgrowth and grain yield in both cropping systemswhile the effects of crop rotation were relatively small(Figure 5, Table 2). Significant treatment interac-

270
Table 2. Grain yield and above-ground plant dry matter (DM) at maturity of rice and maize as affected by crop rotation (R-R = rice-ricesystem; M-R = maize-rice rotation), fertilizer-N application (N0 = 0 kg N ha−1, N50/95 = 50/95 kg N ha−1 in DS/WS; N190/N100 =
195/100 kg N ha−1 in DS/WS), and time of residue incorporation (RI; early/late) in the 1994 and 1995 wet season (WS). Note that time ofresidue incorporation was introduced as sub-sub plot treatment only after the 1995 DS, and that early and late residue incorporation in otherseasons refer to the time of incorporation in the respective fertilizer treatment of each cropping system (subplots). Maize yield and DM dataare shown inbold
1994 DS 1994 WS 1995 DS 1995 WS
Treatments Grain yield DM Grain yield DM Grain yield DM Grain yield DM
System N RI t ha−1 t ha−1 t ha−1 t ha−1 t ha−1 t ha−1 t ha−1 t ha−1
R-R N0 early 3.0± 0.1 6.3± 0.2
R-R N0 late 4.2± 0.3a 6.5± 0.6 4.2± 0.3 7.2± 0.4 4.1± 0.3 7.4± 0.4 2.5± 0.1 5.1± 0.3
M-R N0 early 3.9± 0.3 6.8± 0.4 2.9± 0.3 6.0± 0.4
M-R N0 late 1.7± 0.0 5.0± 0.3 1.8± 0.2 4.2± 0.6 2.8± 0.2 5.7± 0.5
R-R N95/N50 early 4.4± 0.2 9.6± 0.4
R-R N95/N50 late 7.6± 0.1 11.7± 0.3 5.5± 0.1 9.6± 0.3 7.8± 0.1 14.8± 0.2 3.9± 0.1 8.2± 0.1
M-R N95/N50 early 5.9± 0.1 10.1± 0.2 4.1± 0.1 9.1± 0.4
M-R N95/N50 late 5.6± 0.3 11.5± 0.5 3.6± 0.4 8.6± 1.1 4.2± 0.1 9.3± 0.4
R-R N190/N100 early 4.6± 0.1 11.1± 0.4
R-R N190/N100 late 8.6± 0.6 14.1± 0.6 6.8± 0.2 12.1± 0.3 8.0± 0.1 17.3± 0.3 4.6± 0.1 10.6± 0.3
M-R N190/N100 early 7.2± 0.2 12.9± 0.3 4.4± 0.1 11.2± 0.7
M-R N190/N100 late 7.0± 0.2 14.1± 0.5 5.0± 0.4 11.9± 1.2 4.4± 0.2 10.7± 0.6
Treatment meansb
Previous crop: rice 5.5 9.6 3.8 8.5
Previous crop: maize 5.7 9.9 3.8 8.7
N0 4.1c 7.0c 2.8c 5.8c
N95/N50 5.7b 9.8b 4.2b 9.0b
N190/N100 7.0a 12.5a 4.5a 10.9a
Early residue incorporation 3.9a 8.9a
Late residue incorporation 3.7b 8.3b
Interactionsc
Cropping system× N * * * NS
Cropping system× residue incorporation ** *
aStandard error.bMeans within main plot (crop rotation), subplot (N fertilizer rates), or sub-subplots (time of residue incorporation) levels followed by thesame letter in each column are not significantly different atP<0.05 (Tukey-test).c *,** indicate significance atP<0.05 and 0.01, respectively.
tions between previous crop and N fertilizer rate andbetween previous crop and time of residue incorpor-ation affected plant N accumulation, total DM, andgrain yield of WS rice (Table 2). Early residue incor-poration in the 1995 WS in the R-R system resulted ina 13–24% increase in DM and grain compared to lateresidue incorporation in N0 and N50 treatments, andthese increases were associated with greater N uptakeduring the vegetative growth phase before panicle ini-
tiation (PI) at 42 DAT (Figure 5c). The positive effectof early residue incorporation on plant N uptake wasgreatest in N100 treatments, which is consistent withsoil NH4-N levels during this period (Figure 4c). Thisdifference in N accumulation, however, was not ex-pressed in a grain yield response in the N100 treatment,nor was there a difference in grain yield between theN50 and N100 treatments in the 1995 WS (Table 2).Lack of a response to the higher N fertilizer rate

271
Table 3. Estimated carbon balance for the Rice-Upland Crop Rotation Experiment considering five consec-utive crops in 1993–1995. SOC = soil organic carbon; DS = dry season; WS = wet season. Data from the1995 WS refer to sub-subplots with late residue incorporation
Cropping system (DS–WS) Rice–Rice Maize–Rice
Fertilizer-N (kg N ha−1, DS/WS) 0/0 190/100 0/0 190/100
(kg C ha−1)
SOC, 1993 WS, initial 19130± 827a 19411± 272 19222± 791 19376± 972
SOC, 1995 WS, harvest 20973± 494 22147± 540 19005± 403 19833± 429
Change in SOC, 1993–1995 +1843± 440 +2736± 666 -216± 502 +457± 957
(+10%) (+14%) (-1%) (+2%)
C-input from crop residuesb
1993 WS crop 1228± 43 1910± 36 1228± 43 1910± 36
1994 DS crop 1385± 46 2042± 100 1017± 132 1822± 88
1994 WS crop 1138± 37 1808± 65 1317± 75 2012± 18
1995 DS crop 1179± 82 1959± 60 591± 61 1341± 224
C-input (∑
1993–1995) 4930± 182 7719± 208 4153± 284 7085± 179
Mineralized C, 1993–1995 3087± 557 4983± 465 4369± 564 6628± 867
Mineralized C in % of C input (63%) (64%) (105%) (94%)
aStandard error.bValues reported for C inputs from rice stubble and corn stalks are based on measurement of biomass atthe time of incorporation and the measured C concentration in those residues. Root-C inputs are based onmeasured root biomass immediately after harvest, and the C concentrations of these root samples.
Table 4. Estimated nitrogen balance for the Rice-Upland Crop Rotation Experiment consideringfive consecutive crops in 1993–1995. TSN = total soil nitrogen; DS = dry season; WS = wetseason. Data from the 1995 WS refer to sub-subplots with late residue incorporation
Cropping system (DS–WS) Rice–Rice Maize–Rice
Fertilizer-N (kg N ha−1, DS/WS) 0/0 190/100 0/0 190/100
(kg N ha−1)
TSN, 1993 WS, initial 1811± 47a 1798± 26 1771± 56 1795± 53
TSN, 1995 WS, harvest 1863± 49 1963± 42 1720± 29 1738± 42
Change in TSN, 1993–1995 +52± 30 +165± 38 -51± 32 -57± 14
(+2%) (+9%) (−3%) (−3%)
N-inputs, 1993–1995
Fertilizer-N 0 680 0 680
Irrigation water 11 11 6 6
Rainfall 8 8 8 8
N removal, 1993–1995
Grain and straw 214± 17 586± 15 178± 16 472± 18
Nitrogen balance, 1993–1995 +247± 32 +52± 51 +113± 20 -279± 22
aStandard error.

272
Figure 4. The effect of crop rotation, fertilizer-N application (0 and 100 kg N ha−1 in N0 and N100 treatments), and time of residue incorpor-ation (early vs. late incorp.) on soil extractable NH4-N in the 1994 and 1995 wet season (WS). Fertilizer-N was applied in three splits in N100treatments, and application rates and timing are indicated in each figure. Nitrate was below detection in all samples. Bars indicate SE.
and increased plant N accumulation probably resul-ted from typhoon damage and lower solar radiation(Figure 1), which reduced the yield potential com-pared to the 1994 WS. A smaller HI in the 1995 WS(data not shown) and greater grain yields in the 1994WS (Table 2) despite similar plant N accumulationin corresponding N fertilizer treatments of both years(Figure 5) are consistent with this supposition.
The time of residue incorporation had much smal-ler effects on N accumulation, DM and grain yieldof WS rice following DS maize than after DS rice(Figure 5d and Table 2). Smaller amounts of recycledcrop residue from the maize crop may account forthis difference. In the 1995 WS, for example, theamount of incorporated rice stubble was 40–120%greater than that of incorporated corn stalks dependingon N treatment and time of incorporation (Figure 6b).
Carbon and nitrogen balances
The amount of WS rice crop residues incorporatedprior to the DS ranged from 3200–3800 kg DM ha−1
in N0 treatments and from 5500–6100 kg DM ha−1 inN100 treatments (data not shown). The amount of DScrop residue incorporated prior to the WS ranged from1500–7500 kg DM ha−1 depending on crop, year, Nrate, and time of residue incorporation (Figure 6a, b).Roots recovered at crop maturity represented 32–45%of the total recycled C and N in the DS (data notshown) and 15–40% in the WS (Figure 6c–f).
The [C] of maize residue was greater than that ofrice while the [N] of rice residue was greater than inmaize. As a consequence, C:N ratios were higher formaize than rice residues in comparable N-rate treat-ments (Figure 6). Rice stubble contained 31–35% Cand 0.41–0.74% N, while rice roots contained 32–37% C and 0.48–0.73% N. Maize stubble contained40–41% C and 0.30–0.50% N, and maize roots con-
273
Figure 5. The effect of crop rotation, fertilizer-N application (0 or 100 kg N ha−1 in N0 and N100 treatments), and time of residue incorporation(early vs. late incorp.) on N uptake of wet season (WS) rice in plots cropped to rice and maize in the previous the 1994 and 1995 dry seasons.Bars indicate SE.
tained 41–44% C and 0.29–0.53% N. The total amountof incorporated rice residue-C (stubble and roots)was 36–99% greater than the amount of incorporatedmaize residue-C in N0 subplots, and 12–46% greaterin N190/N100 subplots (Table 3). The relative differ-ences in the amounts of incorporated N in maize andrice residues were even greater because of the higherC:N ratio of maize residues (Figure 6).
During the monitoring period from the 1993 WSthrough the 1995 WS, the sum of crop residue-C in-puts for N0 subplots was 19% greater in the R-R thanin the M-R rotation; in N190 subplots it was only 10%greater in the R-R than in the M-R rotation (Table 3).In contrast, the estimated C mineralization was equiv-alent to 94–105% of these C inputs in the M-R rotationand only 63–64% of C inputs in R-R systems. GreaterC inputs and a reduced rate of C mineralization in theR-R systems resulted in net C sequestration, whichrepresented 37% of the estimated crop residue-C in-
puts. Less C input and more rapid C mineralization inthe M-R system resulted in little change in soil organicC content. While these estimates do not account forpotential differences in C inputs from sources otherthan crop residues, weeds were effectively controlledin the experiment and visual observation suggestedlittle growth of macrophytic algae. Assuming an ad-ditional input of 750 kg C input ha−1 season−1 fromthe photosynthetic aquatic biomass during the 1994and 1995 DS rice crops (Roger, 1996), mineralizedC as a percentage of total C inputs to the R-R systemwould increase only slightly, from about 63–64% to70–71% in the N0 and N190/N100 subplots, versus the94–105% in the M-R rotation (Table 3). Likewise, theC balance does not account for treatment differencesin root-exudate C, but previous studies on upland cropsindicate that most exuded C is rapidly respired in therhizosphere (van Veen et al., 1989).

274
Figure 6. The amount of dry matter, C and N (mean and SE) contained in rice and maize crop residues (roots and stubble or stalks) incorporatedprior to the 1994 and 1995 wet season (WS) rice in control treatments without applied N (designated N0) and N-fertilized treatments (190/100kg N ha−1, designated N190/N100). Rice residues were incorporated late and maize residues early in the 1994 WS, while both rice and maizeresidues were incorporated early (E) and late (L) in separate subplot treatments before the 1995 WS.
The N budget indicated a net increase in TSN of52 kg N ha−1 in N0 and 165 kg N ha−1 in N190/N100treatments of the R-R systems and a decrease of 51 and57 kg N ha−1 in corresponding N treatments of the M-R systems between 1993 to 1995 (Table 4). Comparedto the initial TSN levels measured in the 1993 WS, theincrease in N190/N100 R-R main plots was significant(P<0.05). Subplots receiving N fertilizer maintainedgreater TSN than control plots without applied N.Nitrogen accumulation occurred in the R-R systemsdespite 20–24% greater N removal in harvested grainand straw than in M-R systems. Accounting for Ninputs from irrigation and atmospheric deposition, an
additional input of 247 kg N ha−1 was required to bal-ance the N budget of N0 subplots in R-R systems, orabout 50 kg N ha−1 per rice crop. We presume that thisadditional N input was derived from BNF. The posit-ive net N balance in the N0 M-R treatment indicatessubstantial inputs from BNF although it was less thanhalf the BNF input in the N0 R-R treatment. A smallnet positive N balance in the N190/N100 R-R treatmentalso indicates N input from BNF. In the N190/N100 M-R treatment, net N losses exceeded N inputs by 279kg N ha−1. In all treatments, the BNF contributionwould be underestimated by the amount of N lossesfrom volatilization or denitrification.

275
Figure 7. Soil organic C (SOC) and total soil N (TSN) content onan oven-dry soil basis in control (N0) and N-fertilized treatments(N190/N100: 190 and 100 kg N ha−1 in DS and WS, respectively) inthe Rice-Upland Crop Rotation Experiment, 1993–1995. Data fromthe 1995 WS were obtained from treatments with late residue incor-poration.∗, ∗∗,∗ ∗ ∗ indicate significant differences atP < 0.05,0.01, and 0.001, respectively, among main plot treatment means(rice-rice vs. maize-rice) at a given sample time. Bars indicate SE.WS = wet season, FP = fallow period, DS = dry season.
Differences in SOC and TSN between the R-Rand M-R systems were apparent after the first riceand maize crop cycle in the 1994 DS, and the mag-nitude of this difference increased during the secondDS crop in 1995 (Figure 7). Differences in SOC andTSN between crop rotation treatments were signific-ant at most sampling times after the first DS cropcycle in 1994. In the N190/N100 treatments, for ex-ample, both SOC and TSN were 12% greater in theR-R system than in the M-R rotation after the 1995WS rice crop, which represented a difference of 2314kg C and 225 kg N ha−1 in the puddled soil layer(Tables 3 and 4). The relatively large fluctuationsin SOC within treatments during the 1994 WS (Fig-ure 7) probably resulted more from inaccuracies inadjustment of sampling depth for changes in soil bulkdensity (see Materials and methods) than from actualfluctuations in SOC. Despite this variation, the rankingof SOC and TSN content in the four treatments wasconsistent.
Discussion
Results from this study document the interactive ef-fects of crop rotation, N fertilizer, and time of residueincorporation on soil N availability, rice N uptake andgrain yield, and soil C and N sequestration. Moreover,these effects were remarkably consistent despite year-to-year variations in the climate and unique weatherevents that influenced crop performance.
Substitution of maize for rice in the DS greatly re-duced the duration of soil submergence. In the fourconsecutive cropping seasons from the beginning ofthe 1994 DS and ending with the 1995 WS, soil wassubmerged 71% of the time in the R-R system andonly 31% in the M-R rotation. This difference in hy-drological status had large effects on soil C and Nbalance during the two-year study period, but relat-ively small effects on N availability, N uptake andyield of the WS rice crop. In contrast, soil and fer-tilizer N availability and plant N uptake were quitesensitive to soil conditions during the fallow periodas influenced by tillage and the amount and quality ofincorporated crop residues.
Soil C and N Balances
There was a 10–14% increase in SOC and a 2–9%increase in TSN of R-R systems and little change or aslight decrease in both SOC and TSN in M-R systemsduring the two-year period of this study. The differ-ences in C sequestration between the R-R and R-Msystems were not related to the amount of crop residueC-inputs. For example, there was a 10% increase inSOC in N0 subplots of R-R systems, which receivedtotal residue-C inputs of 4930 kg ha−1, compared witha 2% increase in N190/N100 subplots of the R-M rota-tion, which had total residue-C inputs of 7085 kg ha−1
(Table 3). Instead, reduced soil C sequestration in theM-R rotation resulted primarily from an estimated 33–41% increase in the amount of microbially mediated Cmineralization compared to the C mineralization ratein the R-R system. Because the size of the microbialbiomass pool was similar during the DS maize andrice cropping periods and also in the subsequent WSrice cropping period (Witt et al., 1998), the activityof the microbial populations must have differed con-siderably to account for the observed differences inC mineralization. We presume that the differences inmicrobial activity occurred mostly during the DS as aresult of anoxic soil conditions in the submerged riceplots versus the aerated soil status in maize plots.

276
Carbon sequestration with continuous rice crop-ping would also be favored by the accumulation ofphenolic end products that appears to occur when cropresidues decompose under anoxic conditions in low-land rice systems (Olk et al., 1996). Oxidation ofphenolic subunits produced from lignin degradationis greatly retarded when oxygen is limiting (Colberg,1988), allowing phenols to accumulate in intensivelycropped rice soils. In aerated soils, by contrast, phen-olic compounds can be completely degraded. Con-sistent with this hypothesis, Olk et al. (1996) foundgreater phenol-C content in young humic acid frac-tions extracted from soils with a history of continuousirrigated rice cropping than from similar soils in whichirrigated rice was rotated with or replaced by uplandcrops in the DS.
The N balance was largely influenced by N lossesand N inputs that were not measured directly. Denitri-fication losses would occur in both cropping systemsduring soil drying and wetting cycles between rainfallevents in fallow periods (Bronson et al., 1997; Gökand Ottow, 1988) and upon soil flooding at the endof the fallow period before puddling for the WS ricecrop (George et al., 1993). During the DS croppingperiod, the primary N-loss pathways probably differedin the rice and maize cropping periods because mostgaseous N losses in flooded rice result from volatiliz-ation (Buresh and Austin, 1988; Freney et al., 1985),while denitrification would account for most N lossesfrom this aerated soil with a pH of 6.6 when croppedto maize. Leaching losses would be small because ofthe low rate of infiltration. In the 1995 DS, the sea-sonal pattern of soil NO3-N and the poor N fertilizerefficiency are consistent with large losses of applied Nfertilizer by denitrification after the temporary flood-ing following an intense rainfall event. This constrainthighlights the potential difficulty of achieving efficientN fertilizer use by upland crops when grown in theDS on lowland soils of the humid tropics, where in-tense rainfall events and short-term flooding are notuncommon.
Net BNF inputs to the R-R system without ap-plied N were estimated to be about 50 kg N ha−1 ricecrop−1, which is similar to previous estimates fromother field studies and long-term experiments (Cass-man et al., 1995; Koyama and App, 1979). A positiveN balance of about 10 kg N ha−1 crop−1 in the N-fertilized R-R system implies a smaller net BNF inputthan in the N0 treatment. Assuming that 30–40% ofthe applied N was lost to volatilization, which is typ-ical for irrigated lowland rice (Fillery et al., 1986),
net BNF inputs in the N190/N100 treatment of the R-R system would be roughly similar to that in the N0treatment. Although a negative N balance has beenreported in some continuous irrigated rice systems thatreceive N fertilizer (as reviewed by Greenland, 1997),the results from our study suggest that BNF is notgreatly inhibited by applied N fertilizer when the ma-jority of N is broadcast into the floodwater in severalsplit applications.
The N balance also indicates substantial N inputsfrom BNF to the M-R system without N fertilizerapplication. We presume that most of the BNF con-tribution to the M-R rotation occurred under floodedsoil conditions during the WS rice crop because it isgenerally thought that BNF inputs are relatively smallin well-aerated soils (Bohlool et al., 1992; Kennedyand Tchan, 1997).
Congruence of nitrogen supply and crop demand
Both the timing and amount of residue incorporationinfluenced the N supply available for uptake by WSrice, especially during the vegetative stage of cropgrowth. Because rice grain yield is most sensitive toN supply before PI and plant N status at PI (Hasegawaet al., 1994; Sheehy et al., 1998), WS rice yields in theR-R system were greater with early rather than lateresidue incorporation in treatments without applied Nor with N50 despite similar N accumulation at maturitywith both residue incorporation methods. Lack of in-creased yield with early residue incorporation in N100plots despite greater plant N uptake most likely resul-ted from the unfavorable weather conditions and loweryield potential in the 1995 WS.
In some cases the effect of residue incorporationtiming on available N and N uptake was greater thanthe influence of the quantity of incorporated residue-Cand -N or the residue C:N ratio. This was appar-ent in the N0 treatment of the R-R system in the1995 WS when equivalent amounts of residue-C and-N were incorporated early and late (Figure 6f), andyet extractable inorganic soil N (Figure 4c) and cropN uptake (Figure 5c) were greater with early incor-poration. In the 1994 WS, likewise, the amount oflate-incorporated rice residue-N was two- to three-foldgreater than the amount of early-incorporated maizeresidue-N (Figure 6e), and yet soil N availability (Fig-ure 4 a, b) and crop N uptake (Figure 5a, b) weregreater with the early-incorporated maize residue thanwith the late-incorporated rice residue.

277
Compared to late residue incorporation, the be-nefits of early residue incorporation appear to resultfrom improved congruence between net N mineral-ization and the N demand of the subsequent ricecrop. Witt et al. (1998) observed the rapid periodof residue decomposition to be completed by trans-planting when residues were incorporated 60–63 daysbefore transplanting, which corresponds to the ‘early’incorporation treatment in the present study. In con-trast, the period of rapid decomposition following lateincorporation at 14-15 days prior to transplanting wassynchronous with the early stage of vegetative growth,causing temporary biological N immobilization. Sim-ilar rates of N uptake by the WS rice crop after PI(42 DAT, Figure 5c) regardless of residue incorpor-ation timing and comparable amounts of extractablesoil N after PI (Figure 4c) suggest that early sea-son differences in biological N immobilization weretransient.
There was no evidence that late residue incorpor-ation caused phytotoxic effects as a result of reducedorganic compounds or toxins produced during residuedecomposition, which is consistent with previousstudies (Rao and Mikkelsen, 1977). In our experiment,plant N uptake and DM at 15 DAT were similar in bothearly and late incorporation treatments and the benefitsof early incorporation occurred across a wide rangeof incorporated crop residue biomass. Previous studieshave further demonstrated that fertilizer-N applicationcan mitigate negative effects of residue incorporationon early plant N uptake when residues are incorpor-ated at least 7–10 days before transplanting (Azam etal., 1991; Patnaik, 1978).
In the present study, continuous rice double-cropping resulted in significant C and N accumulationwithin a two year period while the M-R rotationmaintained SOC and caused a 3% reduction in TSN.Although the maize cropping cycle in aerated soil hadlittle detectable influence on the performance of a sub-sequent rice crop compared to continuous rice in thistwo-year study, longer-term cumulative effects of anupland crop-rice rotation on soil C and N sequestrationand system performance deserve further study, witha broader emphasis to include other attributes of soilquality, including soil-borne insect and disease pests,that affect yield, yield stability and input requirementsof irrigated rice.
Acknowledgements
This research was supported in part by grants from theFederal Ministry for Economic Cooperation and De-velopment (BMZ), Germany. The authors thank Drs.Shaobing Peng and Achim Dobermann, IRRI, for theirhelpful comments on an earlier draft of this paper.
References
App A A, Santiago T, Daez C, Menguito C, Ventura W, Tirol A,Po J, Watanabe I, De Datta S K and Roger P A 1984 Estimationof the nitrogen balance for irrigated rice and the contribution ofphototropic nitrogen fixation. Field Crops Res. 9, 17–27.
Azam F, Lodhi A and Ashraf M 1991 Availability of soil and fer-tilizer nitrogen to wetland rice following wheat straw treatment.Biol. Fertil. Soils 11, 97–100.
Bohlool B B, Ladha J K, Garrity D P and George T 1992 Biologicalnitrogen fixation for sustainable agriculture: a perspective. PlantSoil 141, 1–11.
Bremner J M and Mulvaney C S 1982 Nitrogen – Total.In Methodsof Soil Analysis, Part 2. Eds. A L Page, R H Miller and D RKeeney. pp 595–623. Am. Soc. Agron., Madison, USA.
Bronson K F, Singh U, Neue H U and Abao E B Jr. 1997 Automatedchamber measurements of methane and nitrous oxide flux in aflooded rice soil: II. Fallow period measurements. Soil Sci. Soc.Am. J. 61, 988–993.
Buresh R J and Austin E R 1988 Direct measurement of dinitrogenand nitrous oxide flux in flooded soils. Soil Sci. Soc. Am. J. 52,681–688.
Cassman K G and Pingali P L 1995 Intensification of irrigated ricesystems: Learning from the past to meet future challenges. Geo.J. 35, 299–305.
Cassman K G, De Datta S K, Olk D C, Alcantara J M, Samson M I,Descalsota J and Dizon M A 1995 Yield decline and the nitrogeneconomy of long-term experiments on continuous, irrigated ricesystems in the tropics.In Soil management: Experimental basisfor sustainability and environmental quality. Eds. R Lal and B AStewart. pp 181–222. Lewis/CRC, Boca Raton, FL, USA.
Cassman K G, Gines G C, Dizon M A, Samson M I and AlcantaraJ M 1996a Nitrogen use efficiency in tropical lowland rice sys-tems: Contributions from indigenous soil resources and appliednitrogen inputs. Field Crops Res. 47, 1–12.
Cassman K G, Dobermann A, Sta.Cruz P C, Gines G C, SamsonM I, Descalsota J P, Alcantara J M, Dizon M A and Olk D C1996b Soil organic matter and the indigenous nitrogen supplyof intensive irrigated rice systems in the tropics. Plant Soil. 182,267–278.
Cassman K G, Kropff M J, Gaunt J L and Peng S 1993 Nitrogen useefficiency of rice reconsidered – what are the key constraints.Plant Soil 155/156, 359–362.
Cassman K G, Peng S, Olk D C, Ladha J K, Reichardt W, Dober-mann A and Singh U 1998 Opportunities for increased nitrogenuse efficiency from improved resource management in irrigatedrice systems. Field Crops Res. 56, 7–39.
Colberg P J 1988 Anaerobic microbial degradation of cellulose,lignin, oligolignols, and monoaromatic lignin derivates.In Bio-logy of anaerobic microorganisms. Ed. A J B Zehnder. pp333–372. Wiley, New York, USA.

278
De Datta S K, Buresh R J, Samson M I, Obcemea W N and Real J G1991 Direct measurement of ammonia and denitrification fluxesfrom urea applied to rice. Soil Sci. Soc. Am. J. 55, 543–548.
Dobermann A, Dawe D, Roetter R and Cassman K G 2000 Re-versal of rice yield decline in a long–term continuous croppingexperiment. Agron. J. (In press).
Fillery I R P and Vlek P L G 1986 Reappraisal of the significance ofammonia volatilization as an N loss mechanism in flooded ricefields. Fert. Res. 9, 79–98.
Fillery I R P, Roger P A and De Datta S K 1986 Ammonia volatiliz-ation from nitrogen sources applied to rice fields: II. Floodwaterproperties and submerged photosynthetic biomass. Soil Sci. Soc.Am. J. 50, 86–91.
Freney J R, Leuning R, Simpson J R, Denmead O T and MuirheadW A 1985 Estimating ammonia volatilization from flooded ricefields by simplified techniques. Soil Sci. Soc. Am. J. 49, 1049–1054.
George T, Ladha J K, Buresh R J and Garrity D P 1993 Nitratedynamics during the aerobic soil phase in lowland rice-basedcropping systems. Soil Sci. Soc. Am. J. 57, 1526–1532.
Gök M and Ottow J C G 1988 Effect of cellulose and straw incorpor-ation in soil on total denitrification and nitrogen immobilizationat initially aerobic and permanent anaerobic conditions. Biol.Fertil. Soils. 5, 317–322.
Greenland D J 1997 The sustainability of rice farming. CAB Inter-national and International Rice Research Institute, Wallingford,Oxon, UK, and Manila, Philippines.
Hasegawa T, Koroda Y, Seligman N G and Horie T 1994 Re-sponse of spikelet number to plant nitrogen concentration anddry weight in paddy rice. Agron. J. 86, 673–676.
Kempers A J and Zweers A 1986 Ammonium determination in soilextracts by the salicylate method. Commun. Soil Sci. Plant Anal.17, 715–723.
Kennedy I R and Tchan Y-T 1997 Biological nitrogen fixation innon-leguminous field crops: Recent advances. Plant Soil 141,93–118.
Koyama T and App A A 1979 Nitrogen balance in flooded rice soils.In Nitrogen and rice. pp 95–104. International Rice ResearchInstitute (IRRI), Los Baños, Philippines.
Navone R 1964 Proposed method for nitrate potable waters. J. Am.Water Works Assoc. 56, 781–783.
Olk D C, Cassman K G, Randall E W, Kinchesh P, Sanger L J andAnderson J M 1996 Changes in chemical properties of organicmatter with intensified rice cropping in tropical lowland soil.Europ. J. Soil. Sci. 47, 293–303.
Olk D C, Cassman K G, Simbahan G, Sta.Cruz P C, Abdulrach-man S, Nagarajan R, Pham Sy Tan and Satawathananont S1999 Interpreting fertilizer-use efficiency in relation to soilnutrient-supplying capacity, factor productivity, and agronomicefficiency. Nutr. Cycl. Agroecosyst. 53, 35–41.
Page A L, Miller R H and Keeney D R 1982 Methods of soilanalysis, Part 2. Am. Soc. Agron., Madison, USA.
Patnaik S 1978 Natural sources of nutrients in rice soils.In Soils andRice. pp 501–519. International Rice Research Institute (IRRI),Los Baños, Philippines.
Peng S, and Cassman K G 1998 Upper thresholds of nitrogen uptakerates and associated nitrogen fertilizer efficiencies in irrigatedrice. Agron. J. 90, 178–185.
Rao D N and Mikkelsen D S 1977 Effect of rice straw additionson production of organic acids in a flooded soil. Plant Soil 47,303–311.
Roger P A 1996 Biology and management of the floodwater eco-system in ricefields. International Rice Research Institute (IRRI),Los Baños, Philippines. 250 p.
SAS 1988 SAS/STAT User’s Guide. 6.03 edn. SAS Institute, Cary,NC, USA.
Sheehy J E, Dionora M J A, Mitchell P L, Peng S, Cassman KG, Lemaire G and Williams R L 1998 Critical nitrogen con-centrations: Implications for high-yielding rice (Oryza sativaL.)cultivars in the tropics. Field Crops Res. 59, 31–41.
van Veen J A, Merckx R and Van De Geijn S C 1989 Plant- and soilrelated controls of the flow of carbon from roots through the soilmicrobial biomass. Plant Soil. 115, 179–188.
Witt C, Cassman K G, Ottow J C G and Biker U 1998 Soil microbialbiomass and nitrogen supply in an irrigated lowland rice soil asaffected by crop rotation and residue management. Biol. Fertil.Soils 28, 71–80.
Section editor: S Recous
Copyright © 2022 FDOKUMEN