
Environmental assessment of shredder residue management
25
Resources, Conservation and Recycling 47 (2006) 1–25 Environmental assessment of shredder residue management Bob Boughton a,∗ , Arpad Horvath b a California Environmental Protection Agency, Department of Toxic Substances Control, Office of Pollution Prevention and Technology Development, 1001 I Street, P.O. Box 806, Sacramento, CA 95812, USA b Department of Civil and Environmental Engineering, University of California, 215 McLaughlin Hall # 1712, Berkeley, CA 94720-1712, USA Received 21 July 2005; received in revised form 23 September 2005; accepted 30 September 2005 Available online 14 November 2005 Abstract Metal recycling from automobiles, appliances and scrap steel occurs at dedicated metal shred- ding operations. Shredder residue (SR) consists of glass, rubber, plastics, fibers, dirt, and fines that remain after ferrous and nonferrous metals have been removed. The over 3 million tonnes of SR generated in the U.S. each year are managed by landfilling. Material recovery or energy recovery alternatives to landfilling can be beneficial because of conservation of non-renewable resources and reduction of waste disposal. In this study, the human health and environmental impacts of landfilling and three recovery options (supplemental fuel and mineral feed for cement manufacturing, hydrolysis to light fuel oil, and material recovery for recycling) were quantified and characterized using a life- cycle assessment (LCA) approach. Comparisons were carried out after characterization of emissions relative to potential impact categories of global warming, freshwater aquatic toxicity, acidification, eutrophication, human toxicity, photochemical oxidant creation, and terrestrial ecotoxicity. SR recov- ery in cement manufacturing could result in 1 million tonnes of coal conservation each year for the U.S. Compared to landfilling, recovery of the fuel and mineral value of SR in cement manufacturing provides net benefits for all environmental impact characteristics considered primarily due to avoided coal mining and landfilling impacts. As much as 750,000 tonnes of recyclable materials could be recovered from SR. Material recovery system impact results were very sensitive to process energy requirements as well as the assumptions of percent recovery and the specific material types recov- ered. Hydrolysis of SR could produce 250 million gallons of light fuel oil equivalent per year. The ∗ Corresponding author. Tel.: +1 916 323 9586; fax: +1 916 327 4494. E-mail address: [email protected] (B. Boughton). 0921-3449/$ – see front matter © 2005 Elsevier B.V. All rights reserved. doi:10.1016/j.resconrec.2005.09.002
Transcript of Environmental assessment of shredder residue management
Resources, Conservation and Recycling 47 (2006) 1–25
Environmental assessment of shredderresidue management
Bob Boughton a,∗, Arpad Horvath b
a California Environmental Protection Agency, Department of Toxic Substances Control,Office of Pollution Prevention and Technology Development, 1001 I Street,
P.O. Box 806, Sacramento, CA 95812, USAb Department of Civil and Environmental Engineering, University of California,
215 McLaughlin Hall # 1712, Berkeley, CA 94720-1712, USA
Received 21 July 2005; received in revised form 23 September 2005; accepted 30 September 2005Available online 14 November 2005
Abstract
Metal recycling from automobiles, appliances and scrap steel occurs at dedicated metal shred-ding operations. Shredder residue (SR) consists of glass, rubber, plastics, fibers, dirt, and fines thatremain after ferrous and nonferrous metals have been removed. The over 3 million tonnes of SRgenerated in the U.S. each year are managed by landfilling. Material recovery or energy recoveryalternatives to landfilling can be beneficial because of conservation of non-renewable resources andreduction of waste disposal. In this study, the human health and environmental impacts of landfillingand three recovery options (supplemental fuel and mineral feed for cement manufacturing, hydrolysisto light fuel oil, and material recovery for recycling) were quantified and characterized using a life-cycle assessment (LCA) approach. Comparisons were carried out after characterization of emissionsrelative to potential impact categories of global warming, freshwater aquatic toxicity, acidification,eutrophication, human toxicity, photochemical oxidant creation, and terrestrial ecotoxicity. SR recov-ery in cement manufacturing could result in 1 million tonnes of coal conservation each year for theU.S. Compared to landfilling, recovery of the fuel and mineral value of SR in cement manufacturingprovides net benefits for all environmental impact characteristics considered primarily due to avoidedcoal mining and landfilling impacts. As much as 750,000 tonnes of recyclable materials could berecovered from SR. Material recovery system impact results were very sensitive to process energyrequirements as well as the assumptions of percent recovery and the specific material types recov-ered. Hydrolysis of SR could produce 250 million gallons of light fuel oil equivalent per year. The
∗ Corresponding author. Tel.: +1 916 323 9586; fax: +1 916 327 4494.E-mail address: [email protected] (B. Boughton).
0921-3449/$ – see front matter © 2005 Elsevier B.V. All rights reserved.doi:10.1016/j.resconrec.2005.09.002

2 B. Boughton, A. Horvath / Resources, Conservation and Recycling 47 (2006) 1–25
hydrolysis process requires a significant amount of electricity, the impacts of which are somewhatoffset by the avoided impacts of producing fuels from crude oil resources. Primarily due to high elec-tricity consumption, both the hydrolysis and material recovery scenarios yielded trade-offs (some netbenefits and some net higher impacts) compared to landfilling. The results of this end-of-life impactassessment showed that the supplement for cement manufacturing option was environmentally bene-ficial to the current practice of landfilling and appears better in comparison to the other managementmethods studied.© 2005 Elsevier B.V. All rights reserved.
Keywords: Life-cycle assessment; Shredder residue; Resource recovery; Cement manufacturing; Supplementalfuel
1. Introduction
Shredder waste or shredder residue (SR) is generated from businesses that recover metalsfrom waste materials, such as automobiles and appliances (USEPA, 2004c; Fisher, 1999;ISRI, 2004). The high ferrous containing feedstocks are collected from automotive partsreclaiming and dismantling yards, metal recyclers as well as appliance dealers and landfills.Up to 12 million tonnes of steel and nonferrous metals are recovered by 200 shredderoperators in the U.S. each year (Staudinger, 2001). The over 3 million tonnes of SR generatedeach year is comprised primarily of glass, plastics, fabrics, dirt and fines, rubber, and non-ferrous metals (Das, 1995). Nearly all SR generated in the U.S. is landfilled (USEPA, 2004c;ISRI, 2004).
From a sustainability and industrial ecology perspective, recovery of energy and materialvalue of SR should be promoted in lieu of landfilling. The directive for end-of-life vehiclesin Europe (European Commission, 2005) has generated numerous efforts to encourageredesign, greater dismantling, and recovery of plastics and other materials from SR. As aresult, many different recovery systems have been reviewed (Zevenhoven, 2003). Similarefforts are also underway in the U.S. and Japan (Gallmeyer, 2003; Kusaka, 2000; USCAR,2002; Toyota, 2005; Recycling Today, 2005; Nissan, 2004). Plastics recovery from SR forrecycling and some testing of SR as a feedstock for pyrolysis and as a supplement for wastecombustor and cement manufacture have also been performed (Day, 1993a; Winslow, 2004,1998, 1999; Plastics, 2005; Keller, 2003). Systems to upgrade SR to meet market specifi-cations for low-ash low-sulfur fuel for blast furnace have also been tested (APC, 2005).
Recovery of gross fuel value from wastes can provide a significant economic advantageto large energy consuming industries (Mark, 1999). Table 1 shows the common compositionrange of SR by material type. Dry SR is about 50% combustible and 50% non-combustible(metals, glass, dirt, and residual ash). Others have studied the energy value of SR and energyrecovery in various systems (CAC, 1998; Zevenhoven, 2003; USDOE, 1987; CMP, 1990;Automotive Engineering, 1994; Saxena, 1995). Some separation of the SR components wasrequired to upgrade the energy value, as well as to reduce residual ash or remove problematicconstituents, such as PVC. As a result, co-combustion of SR with municipal solid wastefor energy recovery or as a blast furnace fuel may only be viable for less than half the SRwaste stream (the plastics, textiles and rubber fraction) with highest energy and lowest ash

B. Boughton, A. Horvath / Resources, Conservation and Recycling 47 (2006) 1–25 3
Table 1Composition of shredder residue reported and used for the study
Material type Typical SR compositionranges (wt%)
SR composition assumedfor this study (wt%)
Rubber (including tires) 10–20 15Plastics 20–30 24Iron 2–7 5Other (∼40% combustible) 5–10 11Fines (dirt, glass, paint, etc.) 15–25 20Glass 5–10 8Moisture 6–25 17
Sources: Staudinger (2001), RRF (1992), Orr (2000), USEPA (1991), Saxena (1995).
content. The rejected fraction of the SR would remain, however, and need to be landfilledor managed in another way.
While numerous systems have been developed and tested to process and recover mate-rials or energy from SR, to date no comparison of methods using life-cycle assessment(LCA) has been published. The focus of this study was to assess the human health andenvironmental tradeoffs of resource recovery options compared to the current practice ofSR landfilling in the U.S. The goal of the study was to quantify and characterize the envi-ronmental impacts and benefits of management options in a product end-of-life scenariousing LCA methodology. The alternative management options were chosen to include thebreadth of technologies tested for SR. No upstream options, such as vehicle or applianceredesign or increased dismantling were studied.
1.1. Alternative management methods studied
1.1.1. Cement manufactureCement manufacture consumes a significant amount of energy and mineral resources (van
Oss, 2002). Considerable environmental and monetary benefits result from using municipaland industrial wastes as energy and material resources (van Oss, 2003; Greer, 1992). Envi-ronmental benefits occur from reduced mining, reduced waste disposal and recovery of theenergy, alumina, ferrous and silicate content of wastes. Cement producers are successfullyusing many different materials for mineral feed substitutes (Holcim, 2005; van Oss, 2002,2003; Taiheiyo Cement, 2000; CIF, 2003). These include spent catalysts, aluminum pro-duction wastes, industrial ashes, filter cake and mill scale. Using supplemental fuels (suchas tires, plastics, hazardous waste solvents, and used motor oils) not only reduces the con-sumption of coal but also reduces coal mining, shipping and preparation costs as well. As asecondary benefit some emission reductions may occur. For example, substitutive fuels suchas plastics are of lower carbon content per unit of energy than coal which yield greenhousegas emission reductions. Additionally, significant nitrogen oxide emission reductions havebeen found with the use of waste tires as a fuel supplement (PCA, 2002; USEPA, 1995;Shumway, 2005; Bennett, 2005).
The U.S. EPA and the Portland Cement Association (and others) provide detailed descrip-tions of cement manufacturing (USEPA, 1995; PCA, 2004; Doyle, 1994; van Oss, 2002).

4 B. Boughton, A. Horvath / Resources, Conservation and Recycling 47 (2006) 1–25
Data from the most efficient kiln design using a preheater/precalciner was used for this study.Numerous studies discuss the very successful use of alternative fuels and waste materialsin cement manufacturing, the resulting benefits of energy and raw materials savings, theincorporation of residual ash into the cement product and the total destruction of organicconstituents in the fuel (Taiheiyo Cement, 2000; RRF, 1992; Cembureau, 2004; WBCSD,2005; Lanoir, 1997; Holcim, 2005) including contaminants, such as PCBs, CFCs and poly-brominated flame retardants. A majority of the amount of low and medium volatility heavymetals present in mineral and fuel feedstocks are found to be incorporated into the cementproduct. In contrast, only about 50% of the highly volatile metals, such as mercury arecaptured in air pollution control systems (Seyler, 2005; USEPA, 2004a). The large amountof limestone in the feed minerals is found to effectively control acid gas emissions. Cementplant operator experience with substitute fuels or materials, such as plastics, glass, wastetires, paint residue, incinerator ashes, used oil and slag is widespread. These componentsmake up the majority of SR or its combustion products. Hence, it is reasonable to assumethat SR would be a suitable substitute for coal and mineral feed.
U.S. cement production is over 100 million tonnes/year (Cement Americas, 2005) andconsumes over 150 million tonnes of mineral feed annually (van Oss, 2003; PCA, 2002). Ifit is assumed that all of the SR produced in the US could be processed for use as a fuel sup-plement, the over 3 million tonnes of SR generated per year would comprise 40 quadrillionjoules per year of energy potential, assuming an average 5000 BTU/lb or 11.6 MJ/kg (CAC,1998; Day, 1993b). This is equivalent to 1.3 million tonnes of coal (at 29 MJ/kg) or about10% of the over 13 million tonnes of coal equivalent consumed by the cement industry eachyear. Because of a high silica, alumina, and ferrous content, SR could contribute up to 1million tonnes/year of mineral feed for cement manufacture as well.
1.1.2. Materials recovery for recyclingMeeting market quality requirements for recycled materials from SR is difficult and
expensive (Gallmeyer, 2003; Staudinger, 2001; ANL, 2004; SALYP, 2004; Boon, 2003;APC, 2005; Keller, 2003). SR is comprised of over 20 different plastics, several types ofrubber and 12 different metals from automobiles alone (Sullivan, 1998). Considering pro-cessing costs, recyclable material recovery may only be a viable option for certain highvalue components from SR (Sendijarevic, 2004; Winslow, 1999). The processing requiredto recover marketable materials could involve many mechanical separation and purificationsteps (Winslow, 2004). Such a system has been developed by Argonne National Labs (ANL,2004) and is marketed in Europe by SALYP (2004). Significant energy and material inputs,such as water for washing, natural gas for heating, and electricity are required (Winslow,1998, 1999). Additional energy is required to prepare recovered materials for market (pel-letizing plastics, etc.). Generally, the energy and resources required are proportionate to thepercent recovery and the level of purity required. Secondary material uses that can toleratehigher contamination levels would be more advantageous from the generators’ perspectivebut would likely lead to less revenue. Considering the points above, it appears unlikely thatmore than 25 wt%, or 750,000 tonnes of SR could be economically recovered (Winslow,1999; Gallmeyer, 2003; Zevenhoven, 2003). The large volume of residuals from a materialrecovery system would likely be landfilled; however, some of this material could be usedfor energy recovery or other uses.

B. Boughton, A. Horvath / Resources, Conservation and Recycling 47 (2006) 1–25 5
1.1.3. Conversion to liquid fuelsA novel system that converts organic wastes to fuel oil using a low temperature water-
based hydrolysis process has been operating with turkey processing waste feedstock forseveral years (Adams, 2004). Tests for many other organic materials including SR have alsobeen done (CWT, 2004). The system operates at a high solids content to improve processefficiency (below 50% total water content). However, significant amounts of electricity arerequired to pressurize the hydrolysis system and pump and manage the material. On a dryweight basis, yields of over 60% as light fuel oil have been found from a wide varietyof organic feedstocks. Similar to pyrolysis and gasification processes, the hydrocarbongases produced (∼10% by weight) are used to provide system heat. The residual inorganicsolids may or may not have beneficial value; however, some ferrous and non-ferrous metalsshould be recoverable from the residual solids stream from SR feedstock. Tests with SRhave shown similar process requirements and outputs as the full-scale operating systemprocessing animal wastes (CWT, 2004). This process could generate 250 million gallonsof light fuel oil equivalent each year in the U.S. from SR. As a result, the volume ofSR currently landfilled could be cut by 75%; however, the 50% residuals by mass wouldlikely be hazardous because of heavy metals content. The hydrolysis process also greatlyreduces or eliminates problematic contaminants, such as PVC plastics, CFCs, PCBs andpolybrominated flame retardants.
2. Description of management method models
Landfilling and three alternative SR management methods were evaluated by accountingfor processing requirements and the products and wastes produced. Transportation impactsas well as ancillary inputs for production of transportation fuels and electricity were alsoincluded. In order to assess and compare the alternatives, a modular system model wasdeveloped. Inputs and outputs for each method were compiled as described below on a pertonne of SR basis.
2.1. Landfilling
The landfilling inventory includes inputs for energy and materials for landfill construc-tion, landfill operation, closure and maintenance, as well as transportation of SR to thelandfill. It was assumed that transportation to landfill was by truck at a distance of 100 kmwith an empty return trip (averaged distance for California shredders to local landfills).Emissions from landfill construction and equipment placing the SR in the landfill werecompiled (Denison, 1996; EREF, 2000). The environmental impacts from SR after disposalin landfills are not well established. No information from specific landfills with disposed SRwas available, and because a majority of SR composition is not putrescible, it was assumedthat SR will have no impacts following landfilling (i.e., no contribution to leachate or landfillgas). If constituents were leached from SR, the assumption was that leachate is collectedand treated or that constituents, such as heavy metals will be attenuated by soil (Camobreco,1999; Automotive Engineering, 1994). A thorough discussion of the fate of metals in land-filled waste and leachate is found in Doka (2005), Hellweg (2005) and Kjeldsen (2002). It

6 B. Boughton, A. Horvath / Resources, Conservation and Recycling 47 (2006) 1–25
was also assumed that landfill gas control would mitigate the release of any CFCs or othervolatile organics that are destroyed in the alternative processes.
There are no significant landfill displacement/capacity issues to consider if SR is divertedto alternative uses. SR is used as alternative daily landfill cover in lieu of soil at some landfills(CIWMB, 2003). Disposal in this way may provide an economic incentive for the shredderbecause of lower landfill fees as well as for the landfill operator that may otherwise need toimport soil. If SR is used as daily cover, some life-cycle benefits may occur by displacingsoil excavation and transportation costs, but this was not included in the study boundariesas it would constitute a small fraction of the overall landfilling impacts.
2.2. Hydrolysis to light fuel oil
Because the hydrolysis process only converts organic materials (including PVC, CFCs,and PCBs), there is value in removing the inert fines and glass from the SR prior to conver-sion. The resulting stream is upgraded in terms of net organic content and the removal ofconsiderable inert solids lowers the volume processed and commensurate energy require-ments of the hydrolysis process. Based on the average SR composition assumed for the study(Table 1), 200 kg of inerts were assumed to be removed and sent to hazardous waste landfilland 50 kg of marketable glass recovered per tonne of SR. The processing of the resulting750 kg of organic rich material (∼70 wt% organics) and 230 kg recycled water (net 40%moisture content within the system) requires 410 MJ of electricity (Froling, 2004). The54 kg of hydrocarbon gases generated (with a reported heating value 80% of natural gas(CWT, 2004)) are collected and combusted to provide process steam. Resulting emissionswere modeled using 2160 MJ steam from natural gas fired process (IKP, 2004). The hydrol-ysis process would also result in production of 33 kg of carbon dioxide. It was assumedthat no leaks or operations would result in other emissions. The process is assumed to pro-duce 335 kg of light fuel oil and 245 kg of inert solids and 83 kg of waste waters. It wasassumed that waste water is treated on site and then released to a public sewage treatmentfacility, resulting in negligible impact (Rebitzer, 2003). Up to 20 kg of iron was assumedto be recovered from the solid residuals, yielding 225 kg of solid waste sent 400 km to ahazardous waste landfill by truck. Impacts for the production of equivalent amounts of lightfuel oil, iron scrap and glass from virgin resources were included in the model.
2.3. Cement manufacturing supplement
SR processing steps to produce a supplemental fuel and mineral feedstock primarilyrequire separation and size reduction but may also include drying. Processing would alsoyield a more uniform and consistent feed material. The goal would be to produce a fuelsupplement equivalent to the energy content of coal and a silicate-rich low-combustiblecontent mineral meal equivalent. Metal recovery operations at shredders typically result inthree or more size separated fractions of SR which facilitates the segregation of energy- andmaterial-rich streams. Streams can be further separated with low technology equipment,such as screens, shaker tables and sink/float density separation systems. Trommeling willalso help to remove imbedded glass and dirt from larger materials to boost BTU value and toreduce residual ash content for the supplemental fuel fraction. For efficient transportation

B. Boughton, A. Horvath / Resources, Conservation and Recycling 47 (2006) 1–25 7
to a cement plant, the low-density oversize SR fraction (fluff) can be size-reduced anddensified by cutting and chopping equipment at the shredder location. The high chloridecontent of SR may also be of concern to cement plant operation. Removal of fines andPVC is assumed to lower the heavy metals and total chloride content to acceptable levels(Winslow, 2004; APC, 2005).
For the study, it was assumed that SR was upgraded in two steps. Screening was assumedto remove half the of the fines material by mass (resulting in removal of a majority of heavymetals content). For the larger sized materials, a dense media sink/float separation systemcan be used to separate the PVC and metallic residues (e.g., copper wire) from the lessdense organic fraction. As a result, 70% of the SR material mass and 80% of the energycontent was assumed to be recovered. Combined, a residual 30 wt% of the initial SR wasassumed to be sent 400 km to a hazardous waste landfill by truck with an empty return trip.The oversized and very low density materials were assumed to be size reduced to pass a1 in. screen at the shredder site. The net 700 kg of recovered material will displace about325 kg of coal and 150 kg of minerals (80% energy recovery from initial 1000 kg SR with11.6 MJ/kg divided by 29 MJ/kg for coal and 50% minerals recovery from initial 1000 kgSR with 30 wt% mineral content). Rail transport distance of 200 km one way to a cementmanufacturing facility was chosen (average distance from California shredders to cementplants).
The electricity required for the preparation steps were estimated by reviewing the process-ing to upgrade SR for blast furnace fuel (CAC, 1998; RRF, 1992), the processing to separatemarketable SR components (ANL, 2004; SALYP, 2004) and communications with shredderoperators (Hennen, 2003; Andrusyshyn, 2003). Removal of PVC using heavy media sepa-ration may require up to 0.03 MJ/kg feed. The high mineral fines were assumed to be groundto a meal consistency at the cement plant with existing milling systems requiring 0.02 MJ/kgSR (assuming 0.144 MJ of electricity per kg of mineral milling at the cement plant (PCA,2002)). The fuel substitute fraction can be introduced to the preheater/precalcining sectionas is with no further processing (Shumway, 2005; Bennett, 2005). This is similar to thecurrent use of whole tires and of tire shreds in existing facilities (PCA, 2002). Total com-bined electric power for processing SR should not exceed 0.07 MJ/kg SR feed includingmiscellaneous conveyor and materials handling electric energy costs.
The first column of Table 2 shows a common recipe for portland cement production.The processed SR will contribute fuel value and to the key elemental constituents of cement(i.e., calcium, iron, silicon, and aluminum). It was assumed that the upgraded SR was addedat a 15% supplemental fuel and 0.5% mineral substitution rate based on the values shownin Table 2. A net 14% of the SR supplement was assumed to become inert ingredients in thecement product. Realistically, the SR fuel and mineral substitution rate will depend on theneed to maintain product quality and consistent operations. The 10–100 times higher relativeheavy metals content of SR compared to coal (see Table 3) could become an issue at highsubstitution rates. Experience has shown that a majority of heavy metals are incorporatedinto the cement product and then chemically fixed in the ultimate concrete products (CAC,1998; Day, 1993a,b; RRF, 1992; PCA, 2002; Doyle, 1994; Cembureau, 2004). At the chosensubstitution rates, SR as a fuel and mineral supplement were assumed to not affect the netrelease of emissions, product quality or kiln operation (Prisciandaro, 2003). Although thereis very limited experience with cement manufacturing facilities using SR derived fuels, it

8 B. Boughton, A. Horvath / Resources, Conservation and Recycling 47 (2006) 1–25
Table 2Portland cement feedstock requirements and assumed SR substitution offsets
Cement feed components Component amount(kg/tonne cement)
Assumed SR contribution(at 15% fuel supplement)
Limestone 1273 2Cement rock, shale and clay 319 2Quartz/sand 22 3.5Iron ore 8 1Gypsum 48Coal (equivalent BTU basis) 120 18Inerts 5.5
Total 1790 32
Electricity (MJ) 541 −26Natural gas (MJ) 446Diesel fuels (MJ) 51
Sources: CAC (1998), Taiheiyo Cement (2000), PCA (2002), PCA (2004), van Oss (2002).
was assumed that cement plant emissions with SR supplemental fuel and minerals wouldnot be significantly different from those with alternative fuels currently used (Herat, 1996;USEPA, 1995; Denis, 2000). For example, used oil and waste tires contain comparableamounts of zinc compared to SR and are used up to 30% as fuel supplements with noreported problems (PCA, 2002; Cembureau, 2004).
The average large cement facility produces over 1 million tonnes of cement per year(USEPA, 1995; Doyle, 1994). Large cement plants using SR at 15% supplemental fueland 0.5% mineral feed supplement would conserve 18 kg of coal and 8.5 kg of mineralsper tonne of finished cement (see Table 2). These are lower substitution levels comparedto the commonly used 20% to 30% waste tires fuel supplement and 3% to 20% range foralternative minerals. Table 2 also shows the net electricity costs to produce the supplementare 26 MJ (SR processing requires 70 MJ while savings of 44 MJ result from not millingof displaced coal and minerals equivalents). Considering the above, it was assumed that atthis relatively low level of substitution of SR, there would be no change in cement product
Table 3Typical metal concentrations in SR, cement kiln feed (mg/kg) and cement plant emissions
Element SR, average Coal, average Mineral meal,average
Cement plant emissions(ppm/kg cement)
Ba 1350 222 97.6 0.18–0.46Pb 3760 32.1 10.2 0.04–0.71Cd 40 <0.25 1.05 0.001–0.008Cr 270 15.6 43.3 0.004–0.14Cu 11300 12 20 2.6–5.3Ni 400 10 15.8 naZn 11300 21.2 40.2 0.17–0.54Hg 0.9 <0.1 0.14 0.012–0.22As 10 1.4 22 0.006–0.012
Sources: Zevenhoven (2003), Greer (1992), Taiheiyo Cement (2000), CIF (2003), USEPA (1995), Keller (2003).

B. Boughton, A. Horvath / Resources, Conservation and Recycling 47 (2006) 1–25 9
quality, air emissions or plant operations to consider. Existing air pollution control systemsshould easily manage the three to six fold additional input flux of lead, zinc, or copper whenusing SR supplement at this level (Table 3). This assumption is reasonable considering thedata from operating cement plants show better than 99.9% emissions control for most heavymetals (Herat, 1996; USEPA, 1995, 2004a; Seyler, 2005) despite wide ranges of inputs. Ifspecific heavy metal or halide concentrations are excessive, problematic contaminants couldbe addressed by further segregation of shredder streams to reduce contamination or a lowerfuel or mineral substitution rate could be employed.
All the noncombustible content of SR supplement (glass, dirt, rust, ash) was assumed tobecome incorporated into the cement product and not contribute to the generation of kilndust or other wastes. Use of SR as a fuel supplement is assumed to not affect the overallcoal fuel market because the total energy value of California generated SR would comprise<1% of the California coal consumption (CEC, 1999).
The impacts of coal mining and rail transportation (2000 km one way) savings wereincluded in the model. Offsets were also included for minerals mining impacts, however,no transportation for minerals was assumed because cement plants are located near naturalmineral sources. Milling savings of displaced coal and minerals were also included.
2.4. Material recovery for recycling
The systems developed by Argonne National Labs (ANL, 2004) and by SALYP (SALYP,2004) were used for this study. These systems require significant energy and material inputs,such as water for washing, natural gas derived heat for heating and drying, and electric-ity. The recovered materials distribution assumed was based on ∼50% net recovery ofmarketable plastics, rubber and steel from the SR composition shown in Table 1. Higherrecovery rates are possible but the costs rise significantly with higher purity and higherrecovery. Residuals from the material recovery system were assumed to be landfilled; how-ever, some of this material could be used for energy recovery or other purposes. Electricityconsumption of 0.9 MJ/kg and fuel consumption of 0.7 MJ/kg (thermal energy from naturalgas) were used for modeling the material recovery process and to prepare materials for mar-ket, such as pelletizing plastics (ANL, 2004; SALYP, 2004). It is assumed that recoveredmaterials compete with secondary materials in the marketplace. However, some materialscould be recovered and used in higher valued markets. The volume of each material recov-ered is assumed to not have a significant effect on the recycled material markets. Trucktransportation for a distance of 100 km from the shredder operation to material users wasincluded. Manufacturing impacts for the production of equivalent amounts of recoveredmaterials from virgin resources were included in the model (USEPA, 2003a; IKP, 2004).
3. Methodology
Life-cycle assessment (LCA) methodology was used to compare current practice toalternative management methods based on accepted methods and protocols (ISO, 2002;SETAC, 1998). A life-cycle boundary and functional units were devised and applicabledata were acquired for each process. For comparative purposes, the structure for each case

10 B. Boughton, A. Horvath / Resources, Conservation and Recycling 47 (2006) 1–25
was devised as the current situation or “status quo” versus each management alternativeseparately. The status quo would include the current landfilling of SR as well as the ongoingprocurement of raw materials (e.g., coal) and the manufacture of products (e.g., glass orplastic resins) including the ancillary energy and transportation processes required for each.The alternative model included the processes, energy required and transportation as well asresidual waste disposal related to the alternative management method. The three comparativecases were then developed based on the assumptions described above.
3.1. Life-cycle boundary
The study focuses only on the end-of-life phase because the choice of the waste manage-ment method is assumed to not affect the prior phases of the product life cycle (manufactur-ing and use). The benefits from recovery of parts or recyclable materials through upstreamdismantling as well as the impacts of shredding and metal (ferrous and non-ferrous) recov-ery operations are excluded as these will also be equivalent for each case. Removal oflife-cycle phases from consideration is consistent with the principle of excluding identi-cal activities for comparative assessments (Tillman, 1994; Coleman, 2003; SETAC, 1998).Hence, the study boundary begins with the generation of SR after ferrous and nonferrousmetal recovery at a metal shredding facility and the boundary closes with one of the fourmanagement methods (i.e., landfilling of SR, substitution of SR in cement manufacturing,delivery of recovered recyclable materials from SR, or production of fuel oil via hydrolysisof SR). The system boundary was expanded to include the impacts of producing the materialor energy equivalents recovered via the alternative methods. These impacts were added tothe “status quo” impacts of landfilling for each comparison. Transportation-related impactsare considered for each scenario and are included as well as needed ancillary inputs (e.g.,production of electricity, transportation fuel production, etc.). Landfilling of residuals fromeach alternative was also included.
The three scenarios for comparing the alternative methods to landfilling are outlinedin Table 4. For each case, some process steps are aggregated. Hence, while assessing theimpacts from each discrete processing step may not be possible, the information availablewas useful for comparing the overall impacts of SR management alternatives to the currentpractice of landfilling. The life-cycle impacts from constructing and maintaining the treat-ment and separation systems or cement plant facility augmentations for using SR or forSR processing and material recovery systems were excluded considering the relatively lowtechnology equipment needed and the large volume of SR managed over an average facilitylifetime. Also, comparable storage and land requirements are required for each alternativemethod and were excluded for each case. It was also assumed that there are no environmen-tal differences between the use of the recovered materials from SR versus natural resourceor crude oil-based products. Overall, no impacts to markets from a change in managementmethod are anticipated (such as landfilling, coal mining, recycled materials, or cement).
3.2. Functional unit
Functional units for this study consist of management of 1 tonne of SR. The alterna-tive management methods studied result in either energy or resource recovery. Offsets

B.B
oughton,A.H
orvath/R
esources,Conservation
andR
ecycling47
(2006)1–25
11
Table 4Life-cycle boundaries and inventories used for SR management scenario comparisons (per tonne of SR basis)
Cases studied Life-cycle inventories included for each case
Landfilling withtransportation
Recovered materialequivalent production
Processing relatedemissions
Product transport
Current scenario-hydrolysiscase
1000 kg, 100 km by truck(round trip, empty return)
335 kg light fuel oil, 20 kgiron and 50 kg glass
Hydrolysis alternative case 425 kg of residuals,400 km to hazardouswaste landfill by truck(one way)
410 MJ grid electricity,43 kg methane (thermalenergy equivalent),process emissions of33 kg CO2
405 kg of materials100 km to market by truck(one way)
Current scenario-materialrecovery case
1000 kg, 100 km by truck(round trip, empty return)
60 kg rubber, 120 kgplastics, 20 kg iron, and50 kg glass
Material recoveryalternative case
750 kg of residuals,100 km by truck (roundtrip, empty return)
900 MJ grid electricity,700 MJ thermal energy(methane)
250 kg of materials100 km to market by truck(one way)
Current scenario-cementmanufacturing case
1000 kg, 100 km by truck(round trip, empty return)
325 kg coal mining and150 kg minerals mining
44 MJ grid electricity(milling coal andminerals)
325 kg coal by rail2000 km (one way)
Cement manufacturingalternative case
300 kg of residuals,400 km to hazardouswaste landfill by truck(one way)
70 MJ grid electricity 700 kg of materials200 km to cement plantby rail (one way)
12 B. Boughton, A. Horvath / Resources, Conservation and Recycling 47 (2006) 1–25
were compiled for equivalent amounts of materials and recovered energy for each scenariofollowing the SETAC “code of practice” (SETAC, 1998) and the technological “wholesystem method” approach (Tillman, 1994; Coleman, 2003; SETAC, 1998). To provide forcomparison, the impacts from processing SR to produce recovered materials as well astransportation impacts and residual materials disposal were compiled. A consistent methodwas then used for each alternative (as described above and shown in Table 4) allowing eachalternative to be compared to the current landfilling method by adding the impacts of pro-ducing the recovered products from virgin resources. This methodology provided a “levelplaying field” for comparison of each alternative to landfilling based on equivalent mass andenergy.
3.3. Impact assessment
An inventory of relevant energy and material inputs and environmental releases was com-piled for each process shown in Table 4. Mass of emissions of discrete compounds alonedoes not convey a degree of significance to human health or the environment. Each elemen-tal and chemical species has different specific impacts of differing degree. According toaccepted LCA protocol, a systematic procedure for classifying and characterizing the typesof environmental effects of each constituent using equivalence factors was followed (IKP,2004; ISO, 2002; SETAC, 1998). The potential impact characteristics of global warming,freshwater aquatic toxicity, acidification, eutrophication, human toxicity, photochemicaloxidant creation, and terrestrial ecotoxicity were used. This allowed for a straightforwardcomparison of the potential environmental impacts associated with each SR managementmethod compared to current disposal or “status quo”.
3.4. Data sources
Data for SR were gathered from national sources (Staudinger, 2001; RRF, 1992; Orr,2000; USEPA, 1991). The range and average values for SR presented in Tables 1 and 2are characteristic of U.S. reported values. The production impacts for all input and productmaterials (such as electricity, coal mining) are based on U.S. data (IKP, 2004; USEPA,2003a). Some of the processes, such as light fuel oil production and transportation were takenfrom GaBi inventories (IKP, 2004). Those inventories are based on German or Europeandata, but were considered to be of similar conditions to that of the US. Other sources fordata were listed in the process description sections above. Impact characterization factorswere used to derive potential impact characteristics using internationally accepted values(Guinee, 2002; USEPA, 2004b).
3.5. Data quality assessment
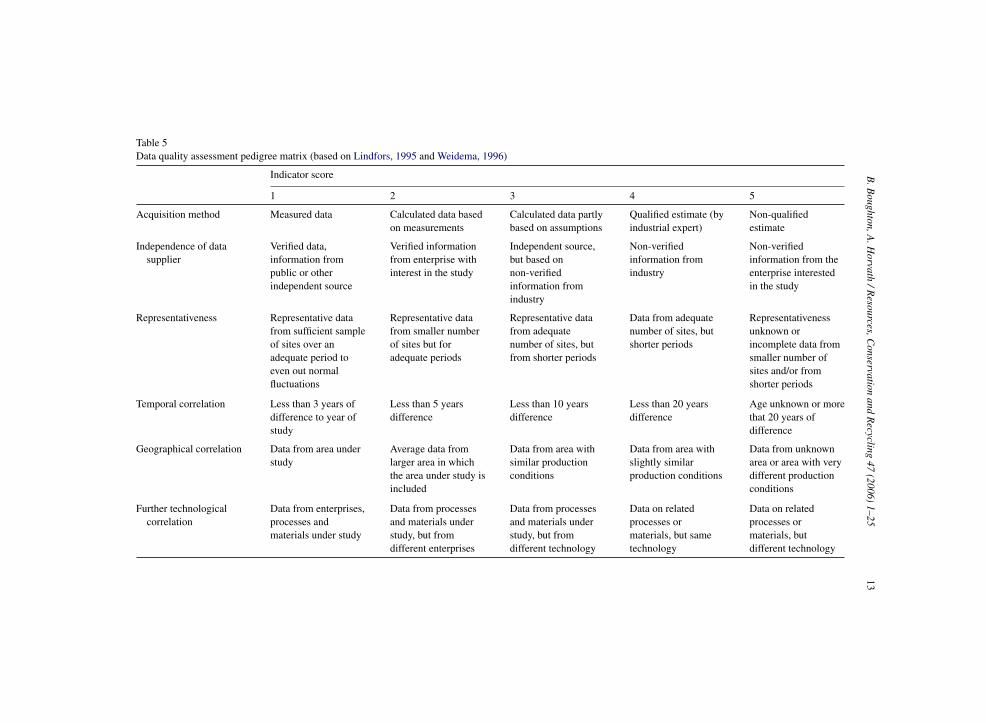
An accepted method in LCA to characterize the quality of data used is adopted hereinfrom (Lindfors, 1995; Weidema, 1996). The data quality pedigree matrix (presented inTable 5) captures typical sources of uncertainty and data quality challenges. Table 6 showsthe outcome of the data quality assessment process for this study. A majority of the dataquality indicators for this study range from 1 (the highest) to 3.
B.B
oughton,A.H
orvath/R
esources,Conservation
andR
ecycling47
(2006)1–25
13
Table 5Data quality assessment pedigree matrix (based on Lindfors, 1995 and Weidema, 1996)
Indicator score
1 2 3 4 5
Acquisition method Measured data Calculated data basedon measurements
Calculated data partlybased on assumptions
Qualified estimate (byindustrial expert)
Non-qualifiedestimate
Independence of datasupplier
Verified data,information frompublic or otherindependent source
Verified informationfrom enterprise withinterest in the study
Independent source,but based onnon-verifiedinformation fromindustry
Non-verifiedinformation fromindustry
Non-verifiedinformation from theenterprise interestedin the study
Representativeness Representative datafrom sufficient sampleof sites over anadequate period toeven out normalfluctuations
Representative datafrom smaller numberof sites but foradequate periods
Representative datafrom adequatenumber of sites, butfrom shorter periods
Data from adequatenumber of sites, butshorter periods
Representativenessunknown orincomplete data fromsmaller number ofsites and/or fromshorter periods
Temporal correlation Less than 3 years ofdifference to year ofstudy
Less than 5 yearsdifference
Less than 10 yearsdifference
Less than 20 yearsdifference
Age unknown or morethat 20 years ofdifference
Geographical correlation Data from area understudy
Average data fromlarger area in whichthe area under study isincluded
Data from area withsimilar productionconditions
Data from area withslightly similarproduction conditions
Data from unknownarea or area with verydifferent productionconditions
Further technologicalcorrelation
Data from enterprises,processes andmaterials under study
Data from processesand materials understudy, but fromdifferent enterprises
Data from processesand materials understudy, but fromdifferent technology
Data on relatedprocesses ormaterials, but sametechnology
Data on relatedprocesses ormaterials, butdifferent technology

14B
.Boughton,A
.Horvath
/Resources,C
onservationand
Recycling
47(2006)
1–25
Table 6Data quality table for SR environmental assessment
Acquisitionmethod
Independence ofdata supplier
Representativeness Temporalcorrelation
Geographicalcorrelation
Technologicalcorrelation
Landfilling 2 1 3 3 1 1Hydrolysis—process electricity 2 1 2 3 1 1Hydrolysis—diesel production 2 2 2 3 3 1Materials recovery—process electricity 2 1 2 3 1 1Materials recovery—materials production 2 2 3 3 3 1Cement plant—process electricity 2 1 2 3 1 1Cement plant—mining and transportation 2 1 2 3 3 1
Note: maximum: 1, minimum: 5.
B. Boughton, A. Horvath / Resources, Conservation and Recycling 47 (2006) 1–25 15
The most reliable data are available for the cement manufacturing process consumingsupplemental fuels on the account of the use of EPA and cement industry data. The qualityof data used to assess landfilling, hydrolysis, and materials recovery is generally good. Thesource of data for production of products derived from hydrolysis and materials recovery isthe LCA software and database (IKP, 2004), with reasonable documentation of data (fromGermany). The best scores overall were achieved for independence of the data, geographicalcorrelation, and technological correlation as data were available for U.S. conditions and forthe processes analyzed. The temporal correlation and representativeness categories receivedlower scores as most data were rather dated, and samples have been collected from anadequate number of sites, but for shorter time periods. Based on the authors’ experiencewith LCA studies, such a variety in data quality is typical in LCA, hence the data qualityherein can be considered currently acceptable.
3.6. Temporal and geographical considerations
The characteristics of SR are well documented and do not vary significantly with seasonor location in terms of material content, contaminant levels, heating value, etc. This is aresult of the distributed nature of the shredder businesses as well as the broad spectrumof metallic wastes accepted and the common metallic recovery systems used. Typically,waste metal, appliances and autos are collected from many sources and are combined dur-ing shredding. Over the time scale of years, the composition of SR has changed because ofthe increased use of plastics and aluminum at the expense of steel in autos and appliances.This trend is likely to continue. For this study it was assumed that there are no temporaland geographical differences in SR composition to consider. SR composition differenceswould likely only result in different relative proportions of products recovered for a givenalternative management method. While the net volumes may change with time, the char-acteristics of separated or processed streams were assumed to consistently meet marketrequirements (i.e., cement plant operator minimum energy value requirements, hydrolysisfacility operator requirements or secondary material market requirements).
The fact that the majority of SR is generated near large population centers will lead totransportation impacts for the shipment to cement plants which are often located in ruralareas. It was assumed that recovered secondary materials and products will compete inlocal markets. The market impact of the recovered materials and products from SR was notstudied.
4. Results
The potential impact characteristic results for each case are shown in Table 7. Theresults are presented for the current scenario and the alternative scenario for each manage-ment method studied (Table 4). In general the results for the current scenarios are roughlyequal for each case as expected. The alternatives show a different result with the cementmanufacturing alternative ranging from 8 to 38% of the characteristics compared to theother alternatives. Comparatively, the hydrolysis alternative yields characteristic valuesroughly half that of the material recovery alternative except for global warming. Figs. 1–3

16B
.Boughton,A
.Horvath
/Resources,C
onservationand
Recycling
47(2006)
1–25
Table 7Impact characteristic potentials for current SR landfilling scenarios, compared to hydrolysis, material recovery and cement manufacturing alternatives as outlined inTable 4 (1 tonne SR basis)
Impact characteristic potential Current scenario(hydrolysis)
Hydrolysisalternative
Current scenario(material recovery)
Material recoveryalternative
Current scenario(cement plantsupplement)
Cement plantsupplementalternative
Landfilling andequivalentproducts
Processingimpacts
Landfilling andequivalentproducts
Processingimpact
Landfilling andequivalentproducts
Processingimpact
Acidification (kg SO2 Eq.) 1.3 1.3 2.7 2.3 1.2 0.34Eutrophication (kg phosphate Eq.) 0.20 0.14 0.26 0.20 0.19 0.044Freshwater aquatic ecotoxicity (kg DCB Eq.) 1.6 0.25 1.1 0.50 0.41 0.089Global warming (100 years) (kg CO2 Eq.) 180 290 330 280 141 29Human Toxicity (kg DCB Eq.) 15 45 13 96 12 8.1Photochemical ozone creation (kg ethene Eq.) 1.0 0.10 0.53 0.17 0.18 0.038Terrestrial ecotoxicity (kg DCB Eq.) 0.22 0.31 0.12 0.67 0.085 0.054
Notes: DCB-dichlorobenzene; Eq.: equivalents.

B. Boughton, A. Horvath / Resources, Conservation and Recycling 47 (2006) 1–25 17
Fig. 1. Potential impact characteristic results for the current landfilling and the hydrolysis alternative.
Fig. 2. Potential impact characteristic results for the current landfilling and the materials recovery alternative.

18B
.Boughton,A
.Horvath
/Resources,C
onservationand
Recycling
47(2006)
1–25Fig. 3. Potential impact characteristic results for the current landfilling and the cement manufacturing alternative.

B. Boughton, A. Horvath / Resources, Conservation and Recycling 47 (2006) 1–25 19
graphically present the results for the cases studied. To provide consistency for comparison,the results for each case were normalized to 100% of the SR landfilling and equivalent prod-uct manufacture impacts for each characteristic, respectively. Also shown are the relativecontributions of each of the processes (as shown in Table 4) to the total results given inTable 6. The results for each case are further described below.
Fig. 1 shows the normalized results for the SR hydrolysis case (100% landfill scenariobasis). The hydrolysis to fuel oil management method was found to be equal to or preferred(lower net impact) for four of the seven characteristics considered, however, three charac-teristics exceed the impact of the landfilling scenario with human toxicity over three timesthat of the landfilling method. The hydrolysis scenario results were most sensitive to theimpacts from the production of electricity used by the hydrolysis process.
The materials recovery alternative management method (shown in Fig. 2) was found tobe equal to or preferred for five of the seven characteristics, however, two characteristicsare five to seven times that of the impact of the landfilling scenario. The materials recoveryscenario results were also most sensitive to the impacts from the production of electricityused by the materials recovery process.
Fig. 3 shows that the use of SR as a fuel and mineral feed supplement is preferred (lowernet impact) for every characteristic compared to landfilling. The cement manufacturingsupplement scenario results were most sensitive to the production of electricity used in theSR processing and milling steps and the landfilling of residual materials.
5. Discussion
The results of this end-of-life impact assessment showed that the cement manufacturingsupplemental feed option appears significantly better in comparison to the other manage-ment methods studied including landfilling. The use of SR as a fuel and mineral supplementcould result in a 30–75% reduction of current impacts. While some significant benefits werefound from the hydrolysis and materials recovery alternatives, each has some significantimpacts above that of the current management method resulting in trade-offs. With theexception of, the results for each management scenario were not sensitive to transportationrelated coal transportation impacts.
The magnitude of the difference between management methods would change consider-ing some of the assumptions of the study. For example, the results of the materials recoverycase are highly dependent on the percent recovery assumed for recovered materials whichis coupled to the electricity consumed. The study results have also shown where additionalwork on process improvements may be most beneficial. For the materials recovery andhydrolysis cases, improvements in efficiency to reduce the process electricity needs whileimproving product yields should be a primary focus.
Heavy metal concentrations (Table 3) in unprocessed SR are significantly higher thanin coal or mineral feed for cement manufacturing. The LCA model for substitution withSR in cement manufacturing included simple screening to remove fines and the assumptionthat heavy metals content is reduced by half. The assumption that there are no additionalemissions when using SR supplemental fuel and minerals may be conservative, but thecement industry currently uses substitute fuels with equivalent levels of many of the same

20 B. Boughton, A. Horvath / Resources, Conservation and Recycling 47 (2006) 1–25
elements of concern. In addition, several studies have shown that the level of heavy metalemissions from kilns was found not to be dependent on supplemental feed levels in the rangeof SR concentrations used in this study (Denis, 2000; Seyler, 2005). The human toxicityimpact for the cement option may be overstated for cement facilities that are located awayfrom significant populations. Because some electricity production may also occur away frompopulation centers, this may also be the case for the other management methods studied.
Examples of the potential resource conservation benefits for each alternative managementmethod are outlined below. If all generated SR was processed via hydrolysis, 250 milliongallons of light fuel oil equivalent could be generated (roughly equivalent to 1-day supplyfor the transportation sector in the U.S.). Materials recovery could lead to recycling of750,000 tonnes of materials (assuming that as much as 25% of U.S. SR could be recoveredand marketed). In addition to large natural resource savings potential of 1 million tonnes ofcoal per year, SR supplement in cement manufacturing would offset CO2 emissions by over100 kg/tonne of SR compared to landfilling. This level of CO2 loading can be put into contextby comparison to annual emissions of automobiles. For example, if all the 3 million tonnesgenerated SR in the U.S. annually was used as cement manufacturing fuel supplement, theresulting 300,000 tonnes of avoided CO2 emissions would be equivalent to emissions from70,000 cars (Toyota Camry, driven 12,500 miles/year) (Environmental Defense, 2004).
The results are conservative in that impacts following landfilling of SR (includinglandfilled residuals for each alternative) were assumed to be zero. Considering the highconcentrations of several metals (Table 3), the total burden to land can be brought intocontext by comparison to the total heavy metals disposal as reported in the Toxics ReleaseInventory (TRI) (USEPA, 2002). The total amount of lead landfilled from SR is estimatedto be over 10,000 tonnes/year for the U.S. (3 million tonnes of SR at 3760 ppm lead).For comparison, the TRI reported total for lead and lead compounds managed by off-siteland disposal was 17,400 tonnes in 2002. Similarly, the 16,000 tonnes/year of copper and34,000 tonnes/year of zinc in landfilled SR are also on the same order of magnitude as thereported 2002 TRI totals of 10,000 tonnes and 102,000 tonnes, respectively. Consideringheavy metal loadings alone, the burden to land from SR disposal should be of great con-cern and a motivator to reduce the heavy metal content of automobile components duringmanufacturing.
6. Conclusion
Decision-making in the environmental arena is commonly done on a stepwise basiswhere each discrete facility is considered individually. This piecemeal approach may fail tomaximize the opportunities for overall environmental improvements. A holistic, integratedview of activities and the environment provides a framework for the optimization of the netimpacts and benefits of waste management options. While the technology exists to processand recover specific materials from SR, there are several barriers to the recovery of SRmaterials by any method. Financial expenditure for processing facilities and the regulatoryhurdles to obtain approval for alternative fuels are two examples. Residual waste materialsfrom alternative methods may need to be managed as hazardous wastes because of concen-tration of heavy metals, an additional economic barrier. Transportation costs may also be

B. Boughton, A. Horvath / Resources, Conservation and Recycling 47 (2006) 1–25 21
barriers for products or recovered materials that need to be sent to far away markets. Addi-tionally, contamination of recovered materials (e.g., PCBs) may reduce the market optionsfor secondary materials and lead to unfavorable economics or increased processing costs.
Nearly all the SR generated in the US is currently landfilled. Because of populationgrowth and the increased use of plastics in vehicles and appliances, SR volumes will con-tinue to increase for some time. Following waste management principles, source reduction,returning used materials to original intended use and resource recovery are preferred overlandfilling. Source reduction should be considered as a way of reducing the generation ofSR (e.g., better car and appliance designs that would lead to longer service lives, and morerecovery of parts or materials through dismantling). However, considering the projectedgrowth in population and the average lifetime of automobiles and appliances, no significantdecrease in SR generation should be expected via source reduction in the near future.
SR processing to recover specific secondary materials is a costly endeavor and the mar-ket value of recovered materials, such as plastics and rubber may not support recoverycosts (Gallmeyer, 2003). Secondary market volumes may also be limited, and numerousother challenges may exist (ANL, 2004; Boon, 2003; Environment Australia, 2002). SRrecovery as a fuel and mineral supplement in cement manufacturing appears to be the mostadvantageous and practical near term option. However, an integrated or hierarchical schemamay be the most economical and preferred waste management approach (Plastics, 2005;Automotive Engineering, 1994). That is, recovery of the highest value recyclable materials,use of residual organic materials to produce fuels or as a fuel, and recovery of mineral valueby cement manufacturers, followed by landfilling of deleterious materials and residuals.
This study shows the potential environmental impacts and benefits of alternative man-agement methods for SR compared to landfilling. While future work can be directed atimproving the processes in terms of energy requirements, the next steps for evaluationwould be to examine the economics of these options. From a sustainability perspective,it would be better to choose the preferred option based on environmental and economicconsiderations rather than economics alone. The preferred option should then be demon-strated in a full-scale operation where emissions, recovery rates and costs can be accuratelymeasured.
Shredder residue has substantial energy, material and mineral value. Materials now con-sidered wastes should be seen as commodities with potential uses. Policy makers coulduse the results herein to support the recovery of SR as well as the facilities interested inusing these materials. Benefits would be realized by providing incentives for SR recovery,and by supporting markets for SR-derived products. However, regulatory barriers inhibitingenvironmentally sound and economically sustainable recycling may need to be addressed.Creating a system oriented towards efficient use of resources could require fundamentalchanges in the waste versus non-waste regulatory construct embedded in the RCRA system(USEPA, 2003b).
Acknowledgments
The conclusions herein represent those of the authors and do not necessarily representthose of the State of California or their organizations. The authors wish to thank Jeffrey Neu

22 B. Boughton, A. Horvath / Resources, Conservation and Recycling 47 (2006) 1–25
of Hugo-Neu Proler, Nick Andrusyshyn of Schnitzer Steel, John Bennett of Cal PortlandCement and Douglas Shumway of Mitsubishi Cement for their inputs to the study.
References
Adams, T, et al. Converting turkey offal into bio-derived hydrocarbon oil with the CWT thermal process. In:Proceedings of the Power-Gen Renewable Energy Conference. Las Vegas, March 2004.
Andrusyshyn N. Personal communications. Schnitzer Steel; 2003, http://www.schnitzersteel.com.ANL (Argonne National Laboratory). http://www.transportation.anl.gov/recycling/plastics.html, http://pe.es.
anl.gov/What%27s%20New/FOAM.pdf, http://pe.es.anl.gov/What’s%20New/FROTH.pdf, http://www.techtransfer.anl.gov/techtour/autoshredder.html, accessed January 4, 2004.
APC (American Plastics Council). www.americanplasticscouncil.org, accessed June 6, 2005.Automotive Engineering. Automotive shredder residue: three recovery choices. Automot Eng 1994;102(8):29–31.Bennett J. Personal communications. Cal Portland Cement; 2005.Boon J. End-of-life infrastructure economics for “clean vehicles” in the United States. J Ind Ecol 2003;7(1):25–45.CAC (Competitive Analysis Center Inc.). Automotive shredder residue: its application in steel mill blast furnaces.
Study for the American Plastics Council; 1998, www.americanplasticscouncil.org.Camobreco V, et al. Life-cycle inventory of a modern solid waste landfill. Waste Manage Res 1999;17:394–408.CEC (California Energy Commission). 1999 Fuels Report; 1999, http://www.energy.ca.gov/FR99/index.html,
accessed March 13, 2003.Cembureau. European Cement Industry Association. Environmental benefits of using alternative fuels in cement
production: alternative fuels in cement manufacture, http://www.cembureau.be, accessed October 4, 2004.Cement Americas. Cement Totals. http://cementamericas.com/mag/cement cement totals 3/, accessed June 3,
2005.CIF (Cement Industry Federation). Cement industry environmental report. http://www.cement.org.au/
environment/case studies/alternative fuels at bcsc.pdf, accessed October, 2003.CIWMB (California Integrated Waste Management Board). Statewide Alternative Daily Cover (ADC)
by Material Type, http://www.ciwmb.ca.gov/lgcentral/drs/reports/Statewide/ADCMatlTyp.asp, and annualCalifornia solid waste—disposal, import, export, and alternative daily cover (ADC) tonnage; 2003,http://www.ciwmb.ca.gov/LGCentral/DRS/Reports/Statewide/SWTotals.asp, accessed September 15, 2004.
CMP (Center for Materials Production). Automobile shredder residue—the problem and potential solutions. CMPreport #90-1; 1990.
Coleman T, Masoni P, Dryer A, McDougall FR. International expert group on life cycle assessment for integratedwaste management. Int J LCA 2003;8(3):175–8.
CWT (Changing World Technologies). Small scale processing of shredder residue using the thermal conversionprocess; 2004, www.changingworldtech.com, accessed January 7, 2005.
Das S, Curlee TR, Rizy CG, Schexnayder SM. Automobile recycling in the United States: energy impacts andwaste generation. Resour Conserv Recy 1995;14:265–84.
Day M. Auto shredder residues—a waste or a valuable resource? SAE 930562; 1993a. p. 73.Day M. Characterization of auto shredder residue. Resour Conserv Recy 1993b;9:255–79.Denis S, et al. Experimental evaluation of emission factors of cement kilns burning hazardous wastes. Toxicol
Environ Chem 2000;74:155–63.Denison R. Environmental life-cycle comparisons of recycling, landfilling, and incineration: a review of recent
studies. Annu Rev Energy Environ 1996;21:191–237.Doka G, Hischier R. Waste treatment and assessment of long term emissions. Int J LCA 2005;10(1):77–84.Doyle F, et al. Study of cementitious wastes at California cement plants. Technical Report AB3789, Berkeley:
University of California; 1994.Environment Australia. Environmental impact of end-of-life vehicles: an information paper; 2002,
http://www.deh.gov.au/industry/waste/elv/chapter11.html, accessed April 10, 2004.Environmental Defense. Tailpipe Tally—How much does your vehicle pollute? Online calculator, http://www.
ed.org, accessed February 10, 2004.

B. Boughton, A. Horvath / Resources, Conservation and Recycling 47 (2006) 1–25 23
European Commission. Management of end-of-life vehicles. http://europa.eu.int/scadplus/leg/en/lvb/l21225.htmand end-of-life vehicles, http://europa.eu.int/comm/environment/waste/elv index.htm, accessed June 14, 2005.
EREF (Enviromental Research and Education Foundation). Life-cycle inventory case studies of municipal solidwaste management, Washington, DC; 2000.
Fisher M. The role of plastics in automotive shredder residue. SAE Technical Study Series 1999-01-0664, Detroit,MI: Society of Automotive Engineers; 1999.
Froling M, Peterson A, Tester J. Turkey processing wastes to diesel oil. In: Proceedings of the 9th EuropeanBiosolids and Biowaste Conference; 2004.
Gallmeyer W, et al. USCAR U.S. Field Trial for Automotive Polymers Recycling. SAE 2003-01-0645;2003.
Greer W. Air pollution engineering manual air and waste management association. New York, NY: Van NostrandReinhold; 1992.
Guinee J. LCA handbook, characterization factors. Centre of Environmental Science. The Netherlands: LeidenUniversity; 2002, http://www.leidenuniv.nl/cml/ssp/projects/lca2/lca2.html, accessed January 9, 2003.
Hellweg S, Fischer U, Hofstetter T, Hungerbuhler K. Site-dependent fate assessment in LCA: transport of heavymetals in soil. J Cleaner Prod 2005;13:341–61.
Hennen L. Personal communications, Hugo-Neu Proler; 2003, http://www.HNP.com.Herat S. Energy recovery from solid and hazardous wastes using cement kilns. J Waste Manage Resour Recovery
1996;3(3):111–5.Holcim Ltd. Alternative fuels and raw materials. http://www.holcim.com/CORP/EN/oid/46240/module/gnm50/
jsp/templates/editorial/editorial.html, accessed June, 2005.IKP (IKP-University of Stuttgart and PE Europe GaBi Software System for Life Cycle Engineering).
http://www.gabi-software.com, accessed January 9, 2004.ISO (International Organization for Standardization). ISO 14040 Guidelines; 2002 http://www.iso.ch, accessed
January 6, 2004.Institute of Scrap Recycling Industries. End-of-life vehicles: a proven path to recycling,
http://www.isri.org/industryinfo/Elv.pdf, accessed March 3, 2004.Keller C. Optimized disposal of automotive shredder residue. In: Ludwig C, Hellweg S, Stucki S, editors. Municipal
solid waste management-strategies and technologies for sustainable solutions. Heidelberg, Germany: Springer-Verlag; 2003. p. 294–307.
Kjeldsen P, et al. Present and long-term composition of MSW landfill leachate: a review. Crit Rev Environ SciTechnol 2002;32(4):297–336.
Kusaka K, Iida S. Sorting, compaction and solidification technologies for automobile shredder residue. JSAE Rev2000;21:549–54.
Lanoir D. Physical and chemical characterization of automotive shredder residues. Waste Manage Res1997;15:267–76.
Lindfors L-G, Christiansen K, Hoffman L, Virtanen Y, Juntilla V, Hanssen O-J, et al. Nordic guidelines on lifecycle assessment. Nord 1995:20. Copenhagen, Denmark: Nordic Council of Ministers; 1995.
Mark F. Environmentally sound energy recovery from automotive shredder residue. In: SAE Technical StudySeries 01-0990. Detroit, MI: Society of Automotive Engineers; 1999.
Nissan. Eight carmakers form new alliance for shredder residue recycling. http://www.nissan-global.com/EN/NEWS/2004/ STORY/040109-01.html accessed March 3, 2004.
Orr. USCAR. U.S. Field Trial for automobile polymers recycling: Interim findings. Study 2000-01-0735, Detroit,MI: Society of Automotive Engineers; 2000.
PCA (Portland Cement Association). Life cycle inventory of portland cement manufacture, Report R&D # 2095a;2002.
PCA (Portland Cement Association), Manufacturing fact sheet; 2004, http://www.cement.org/concretethinking/manu facts.asp, accessed January 5, 2005.
Plastics. Plastics in end-of-life vehicles. http://www.plastics-in-elv.org, accessed January 7, 2005.Prisciandaro M, Mazziotti G, Veglio F. Effect of burning supplementary waste fuels on the pollutant emissions by
cement plant. Resour Conserv Recy 2003;39(2):161–84.Rebitzer G, Hunkeler D, Jolliet O. Life cycle costing—the economic pillar of life cycle thinking: methodology
and application to waste water treatment. Environ Progr 2003;22(4).
24 B. Boughton, A. Horvath / Resources, Conservation and Recycling 47 (2006) 1–25
Recycling Today. Recycling Opportunities in Auto Shredder Residue. www.recyclingtoday.com/News/news.asp?Id=7577, accessed June 9, 2005.
RRF (Recycling Research Foundation). Shredder residue: environmental information and characterization underRCRA. Washington, DC; 1992.
SALYP. http://www.salypnet.com and http://www.salypnet.com/environmentalimpact.htm, accessed October 5,2004.
Saxena S, Rao N, Rehmat A, Mensinger M. Combustion and co-combustion of auto fluff. Energy1995;20(9):877–87.
Sendijarevic V, et al. Screening study to evaluate shredder residue materials. SAE 2004-01-0468; 2004.SETAC (Society for Environmental Toxicology and Chemistry). Life-cycle impact assessment: the state-of-the-art,
and guidelines for life-cycle assessment: a “Code of Practice; 1998, http://www.setac.org/lca.html, accessedJanuary 3, 2004.
Seyler C, et al. Life cycle inventory for use of waste solvent as fuel substitute in the cement industry. Int J LCA2005;10(2):120–30.
Shumway D. Personal communications, Mitsubishi Cement; 2005.Staudinger J, Keoleian GA. Management of end-of-life vehicles (ELVs) in the U.S., Center for Sustainable Systems,
University of Michigan, Report # CSS01-01; 2001.Sullivan JL, Williams RL, Yester S, Cobas-Flores E, Chubbs, ST, Hentges SG, et al. Life cycle inventory of a
generic U.S. family—Sedan Overview of Results USCAR AMP Project. SAE Paper #982160, Detroit, MI:Society of Automotive Engineers; 1998.
Taiheiyo Cement. Environmental report 2000. http://www.taiheiyo-cement.co.jp/english/env2000, accessed Octo-ber, 2003.
Tillman A, Ekvall T, Baumann H, Rydberg T. Choice of system boundaries in life cycle assessment. J CleanerProd 1994;2(1).
Toyota. Toyota and Volkswagen cooperate in recycling and other areas. http://www.toyota.com/about/environment/partnerships/volkswagon cooperate.html, accessed January 7, 2005.
USCAR (United States Council for Automotive Research). USCAR celebrates a decade of automotive progress;2002, http://www.uscar.org/Media/2002issue1/p1 celebrates.htm, accessed January 7, 2005.
USDOE (U.S. Department of Energy). Power generation from automobile shredder waste fuel. Report DE-Pro7-871012704; 1987.
USEPA (US Environmental Protection Agency). PCB, Lead, Cadmium levels in shredder waste materials. ReportEPA 560/5-90-008A; 1991.
USEPA (US environmental Protection Agency). Air pollution emission factors—Portland cement manufacturing;1995, http://www.epa.gov/ttn/chief/ap42/ch11/final/c11s06.pdf, accessed January 5, 2004.
USEPA (US Environmental Protection Agency). Toxics Release Inventory; 2002, http://www.epa.gov/triexplorer,accessed March 10, 2004.
USEPA (US Environmental Protection Agency). Life-cycle inventory data set for material production of aluminum,glass, paper, plastic, and steel in North America. Report prepared for the U.S. EPA, Office of Research andDevelopment, Report EPA-600/Q-03-001, Research Triangle Park, NC; 2003a.
USEPA (US Environmental Protection Agency). Beyond RCRA—waste and material management in the year2020. EPA530-R-02-009; 2003b.
USEPA (US Environmental Protection Agency). Hazardous waste combustors—maximum achievable controltechnology standards; 2004a, http://www.epa.gov/epaoswer/hazwaste/combust/, accessed January 4, 2004.
USEPA (US Environmental Protection Agency). TRACI—tool for the reduction and assessment of chemicaland other environmental impacts; 2004b, http://www.epa.gov/ord/NRMRL/std/sab/iam traci.htm, accessedJanuary 6, 2005.
USEPA (US Environmental Protection Agency). Municipal solid waste, Automotive parts; 2004c,http://www.epa.gov/garbage/auto.htm, accessed March 3, 2004.
van Oss H. Cement manufacture and the environment. Part I. Chemistry and technology. J Ind Ecol 2002;6(1.).van Oss H. Cement manufacture and the environment. Part II. Environmental challenges and opportunities. J Ind
Ecol 2003;7(1.).WBCSD (World Business Council for Sustainable Development). Cement sustainability initiative,
http://www.wbcsdcement.org, accessed January 4, 2005.

B. Boughton, A. Horvath / Resources, Conservation and Recycling 47 (2006) 1–25 25
Weidema BP, Wesnæs M. Data quality management for life cycle inventories—an example for using data qualityindicators. J Cleaner Prod 1996;4(3–4):167–174, Great Britain: Elsevier Science Ltd.
Winslow G, et al. Study of Plastic Material Recovery form Automotive Shredder Residue. SAE 980093; 1998.Winslow G, et al. Recovery of Selected Engineering Plastics from Automotive Shredder Residue Using Shin
Flotation Technology. SAE 1999-01-0663; 1999.Winslow G, et al. Advanced Separation of Plastics from Shredder residue. SAE 2004-01-0469; 2004.Zevenhoven R, Saeed L. Automotive shredder residue (ASR) and compact disk (CD) waste: options for recovery
of materials and energy. Report TKK-ENY-14, Helsinki University of Technology, Energy Engineering andEnvironmental Protection: Espoo, Finland; 2003, http://eny.hut.fi/library/publications/tkk-eny/tkk-eny-14.pdf,accessed January 7, 2005.