STRATEGIC ENVIRONMENTAL ASSESSMENT INITIAL ...
219
STRATEGIC ENVIRONMENTAL ASSESSMENT INITIAL ASSESSMENT REPORT Hyder - Mott Connell Joint Venture This report is prepared by Hyder-Mott Connell Joint Venture for information and discussion purposes. The findings and recommendations do not necessarily represent the views of the HKSARG.
-
Upload
khangminh22 -
Category
Documents
-
view
0 -
download
0
Transcript of STRATEGIC ENVIRONMENTAL ASSESSMENT INITIAL ...

STRATEGIC ENVIRONMENTAL ASSESSMENT
INITIAL ASSESSMENT REPORT
Hyder - Mott Connell Joint Venture
This report is prepared by Hyder-Mott Connell Joint Venturefor information and discussion purposes. The findings andrecommendations do not necessarily represent the views ofthe HKSARG.

TABLE OF CONTENTS
1. INTRODUCTION
2. BASELINE CONDITIONS
3. ENVIRONMENTAL CAPITAL STOCK AND CARRYING CAPACITY
4. ENVIRONMENTAL CONSTRAINTS AND OPPORTUNITIES
5. ENVIRONMENTAL TARGETS
6. IDENTIFICATION OF KEY ENVIRONMENTAL ISSUES
7. CONCLUSIONS AND RECOMMENDATIONS
REFERENCES
ABBREVIATIONS
APPENDICES
FIGURES
TABLES
1
FOOTNOTES
ywtsoi
(updated in Feb, 2004)

1 Introduction
1.1 Preamble
1.1.1 Hong Kong like many major cities around the world has its share of environmental concerns and pollution problems to contend with. The issues which are particularly at the forefront of attention are reflections of the urban environment in which we live and work and indeed have changed over recent years and decades. Key environmental concerns affecting Hong Kong include:
• Air pollution problems which are caused by both mobile and stationary sources with the street level air quality mainly affected by vehicle emissions.
• Water pollution due to the discharge of domestic and industrial effluents into the marine waters surrounding Hong Kong.
• Noise pollution due to high density living in the metropolitan areas, the extent of vehicle traffic, the congestion on the roadways and the close proximity of residential developments to roads especially in the older areas and also the effects of the ever changing landscape and the associated construction works.
• Waste generation and the fast dwindling disposal site capacity coupled with the problem of siting new facilities in diminishing rural areas.
• Natural conservation and the juxtaposition of increasing development areas with the pressures of retaining the ecological resources and biodiversity.
• Landscape resources, both in the urban area and in the countryside, have been eroding at an alarming rate as a result of rapid development in the last few decades.
1.1.2 Clear recognition must be given to the anthropogenically influenced trans-boundary effects. In the latter connection, consideration must be given to “mobile” pollution sources such as water and air quality. It is of particular concern to decision makers and strategists that without appropriate management and planning, the environmental ‘carrying capacity’ (the number of individuals which can be supported in a given area without degradation to the natural, social and economic environment), could easily be exceeded or overwhelmed by internal and external pressures. In the latter context, the triggers could be development pressures such as population migration and shifts in economic development. As such, these influences must be given due regard in the development of targets and sustainable solutions.
1.1.3 The ultimate goal is for Hong Kong to be recognised as a ‘World City’ with internationally recognised lifestyles, environmental quality and city planning. To achieve this, various actions are required. These include a review of the environmental baseline conditions and a clear definition of the extent of the changes which have taken place over the years and are predicted to take place due to policies and practices which are being implemented. In addition to which, the current situation within the Hong Kong SAR needs to be examined in the context of “think globally, act locally”. This translates as reviewing environmental standards and targets set in Hong Kong against an international framework. Targets and standards can then be compared to international standards to allow Hong Kong’s performance to be benchmarked against international standards.
2

1.2 Background
1.2.1 In 1984 the first Territorial Development Strategy (TDS) adopted the then farsighted approach of utilising environmental protection principles by integrating environment, transport and land use planning into a framework which was flexible enough to guide the physical development of Hong Kong into the 1990s. Although it had been updated twice, in 1986 and 1988, to take account of changing circumstances, it was not until 1990 that a comprehensive review of the TDS was undertaken. The technical work of the TDS Review was completed in late 1996 and the report, including a Strategic Environmental Assessment (SEA), of the development strategies was published in 1998.
1.2.2 Since the completion of the TDS Review in late 1996, some of the fundamental assumptions have been superseded such as population projections and economic growth rates. Other new influencing factors which have strategic planning implications include China’s entry into the World Trade Organisation and the increasing socio-economic interactions between Hong Kong and the Mainland which must now be introduced.
1.2.3 It is evident that an updated planning framework is needed to guide the formulation of a long-term development strategy (referred to as HK2030) for Hong Kong and to provide a basis for allocating land for various land uses and investment in infrastructure. The focus of the strategic environmental assessment (SEA) is to address the issues of land-use planning in the context of sustainable development and in terms of minimising environmental impacts arising from the development options.
1.2.4 The definition of World City, as noted by the Commission on Strategic Development in its report “Hong Kong’s Long-Term Development Needs and Goals”, are cities which have defining characteristics (http://www.brandhk.gov.hk/brandhk/index_e.htm). Such cities possess a strong, internationally oriented services sector and a workforce with specialised skills and knowledge that, in turn, attract others with skills and specialised resources. These cities have excellent ‘hard’ and ‘soft’ infrastructure including transportation and telecommunications, world-class education and training, as well as a commitment to sustainable development. The quality of key institutions - universities, the media and civic organisations - and less tangible features including commitment to the rule of law, freedom of expression and association, free flow of information, openness and diversity, are also fundamental in determining whether cities have achieved the “world class status”.
1.2.5 World cities are, by definition, very cosmopolitan and this enables them to attract international capital, business and skilled individuals that make them centres for global commerce. As noted previously, the aim is for Hong Kong to become a World Class City, having facilities, services, and infrastructure which accord with such definitions.
1.2.6 Given that this Study spans a 30-year period it is evident that significant changes will take place in Hong Kong and elsewhere during this time. Changes which need to be considered include application of new technologies although other areas such as changes in lifestyle and method of working (from home, shorter weeks, different types of activities, etc.) are also important as these could affect the environment in which we live. It is of interest to note that other cities such as Singapore have confined their Sustainable Development plans to one decade rather than three decades.
3

1.2.7 Obvious uncertainties prevail over the extent and nature of the changes, however it is an exciting challenge to formulate a framework which addresses such possibilities. Uncertainties in the projections over a 30-year timespan such as population, transportation, housing and the provision of associated infrastructure, present obvious challenges. However, the goal is to develop a flexible and adaptable framework for land use planning and for the protection of our environment and resources while ensuring it is robust enough to withstand both external and internal influences.
1.2.8 Opportunities will be taken to examine innovative ideas, options and measures that could be adopted in the future to bring about continuous and sustainable improvements to Hong Kong’s living environment.
1.3 Scope of Work
1.3.1 The fundamental building block for Hong Kong to maintain and enhance its status as a World City in Asia (which is founded on its role as the gateway to the Mainland and a hub for business in the Asia-Pacific region) is environmental responsibility. Responsibilities include the provision of a ‘healthy environment’, protection of existing resources as well as identifying opportunities for expanding our capital stock and carrying capacity in local, regional and global terms.
1.3.2 To put the SEA into context, it should be noted that the Main Study of the HK2030 involves four key stages viz:
Stage 1 : Agenda Setting, Baseline Review and Identification of Key Issues;
Stage 2 : Examination of Key Issues;
Stage 3 : Formulation and Evaluation of Scenarios and Options; and
Stage 4 : Formulation of Development Strategies and Response Plans.
1.3.3 The SEA will be integrated with the Main Study by providing strategic environmental information and suggestions to facilitate the formulation, development, and identification of scenarios and options which could meet the environmental targets of a World City in Asia.
1.3.4 Strategic evaluation methodologies and assessment tools will be used to examine the development options in respect of their environmental sustainability implications and strategic environmental impacts. Reference will be made to the relevant environmental sections of the Study on Sustainable Development for the 21st Century (SUSDEV 21) when considering and evaluating the environmental sustainability of the development options considered. The SEA will examine the implications of the regional development, especially in the context of recent and potential future developments in the Pearl River Delta (PRD) and the consequences for Hong Kong’s environment.
1.3.5 There are a number of relevant environmental assessment reports or studies that are either completed, on-going or to be commissioned by the Government in the near future. These reports/studies may have a bearing on this SEA and either have been or will be reviewed where information is made available.
1.3.6 Innovative ideas and new technologies that could help solve the existing and
4

potential future environmental problems will also be investigated as part of the Study. The SEA Study Team will participate in the Main Study during the formulation of the development scenarios, options and strategies to ensure proper integration of environmental considerations and improvement measures into the development scenarios, options and strategies.
1.4 Purpose and Objectives of the Initial Assessment Report
1.4.1 The Initial Assessment Report has been prepared in accordance with the requirements of the Study Brief and aims to address the following:
• Review the baseline conditions and the environmental capital stock and carrying capacity
- establish the environmental, risk, ecological, landscape and cultural heritage baseline conditions
- review and update, where necessary, the baseline conditions and examine whether they may be influenced by various local and regional factors
- define environmental capital stock at present and pressure that has been and might be generated from the future developments
- measure the environmental carrying capacity using appropriate strategic indicators
- estimate the extent of improvement in environmental efficiency needed and the potential for meeting such an amount of improvement
• Identify the environmental opportunities, constraints and key environmental issues
- identify the major environmental constraints and key issues that would have influence on land use planning
- identify the environmental opportunities that land use planning could make use of, and land use planning principles/options and other measures which could bring about environmental improvements
- examine the likelihood that development in technologies and other measures could tackle the current environmental problems
• Review existing environmental targets for Hong Kong
- study the need to set separate sets of targets depending on the technological progress from the present to year 2030, and indicate any further potential improvement afterwards
• Propose future environmental targets
- propose environmental targets to be met by Hong Kong in order to achieve Hong Kong’s long-term vision
5

2 Baseline Conditions
2.1 General
2.1.1 According to the findings of the SUSDEV 21 study, the environmental baseline study has adopted the natural capital stock approach which reflects both the resource input functions and the waste assimilation functions that our natural environment performs. The natural capital stock concept has been defined as comprising four primary components: natural resources, ecological resources, assimilative resources capacity and heritage resources, and four secondary components: recreational value, landscape value, existence value and scientific value.
2.1.2 To achieve sustainability, natural capital stock which cannot be replaced or substituted, must be protected and enhanced where possible. Pollution levels in Hong Kong are placing a significant stress on present conditions. This in turn places an increasing burden upon the ability of Hong Kong’s environment, our “natural capital” to maintain itself and continue to absorb and neutralise pollution from human activities. This not only raises local sustainability issues, but also regional and global concerns. It is particularly the case for air quality in Hong Kong, which in recent years has been increasingly influenced by cross-boundary pollution regionally. Internationally, it is reflected in Hong Kong’s contribution to international phenomena such as global warming and climate change. Threats to globally endangered species and marine pollution similarly reflect the international importance of these issues.
2.2 Noise Conditions
2.2.1 Noise is somewhat unusual in that it is an invisible pollutant, and as it cannot be seen is less tangible than many other pollutants. It has long been an issue of concern in Hong Kong due to the large population for the limited usable land area and the consequent proximity of residential areas to significant noise sources. The major noise sources come from transportation such as aircraft operations, road traffic and railways as well as construction, and commercial/industrial operations. The volume of road traffic has doubled in the decade up to 1997 with associated implications for generated noise. Many noise sources have been eliminated or brought under greater control, however, there were at least one million people still affected by road and illegal construction noise. A noise programme aimed at reducing exposure to excessive noise levels has been progressively implemented for over ten years. Some highlights identified by EPD include:
Noise Programme - Highlights of Progress
• School insulation programme introduced to protect against road, aircraft and rail noise – 1987 – 1999
• Percussive piling limited to three to five hours a day in developed areas – 1989
• Programme begun to resurface highways with low-noise material – 1990
• Screening structures introduced to reduce traffic noise from new roads – 1990
6

• Tung Chung New Town designed to reduce noise impacts through integrated planning – mid 1990s
• Noise standards for industrial/commercial premises tightened - 1992
• Two commonly used pieces of noisy construction equipment (hand-held percussive breaker and air compressor) required to comply with international standards – 1992
• Vehicle noise controlled in line with international standards – 1996
• Controls introduced on noisy manual construction activities at night and on public holidays – 1996
• Noisy diesel, steam and pneumatic pile-drivers phased out in developed areas – 1999
2.2.2 According to EPD’s estimation, a total of 650 existing roads generate noise louder than L10(1 hour) 70 decibels. Direct noise mitigation in the form of noise barriers and enclosures will be retrofitted on 30 existing road sections. The implementation of these works is planned in five phases in a 10-year programme. About 25,000 flats will benefit from reduced noise levels of one to 19 decibels and 70% of residents will have noise lowered to below the limit of 70 decibels. Barriers are also continuing to be installed for new roads since 1990 and 100,000 people have benefited from the 30 kilometres of installed barriers. In addition, low noise surfacing materials are being used to resurface 72 existing road sections, which will benefit some 40,000 flats. The low noise road surfacing programme for low speed roads will be completed in 3 years’ time.
2.2.3 Apart from erection of noise barriers and low-noise surfacing, a trial scheme to ban heavy goods vehicles on the West Kowloon Corridor at night was conducted in 2000 and reduced the noise levels by two decibels. Pedestrianisation of streets in Mongkok and Causeway Bay in 2000 also helped reduce noise but some streets will still continue to be noisy.
2.2.4 The relocation of the airport has relieved some 380,000 people from aircraft noise. The SUSDEV 21 study reports have survey results which indicate that activities associated with existing industrial areas consistently resulted in the highest noise levels at residential locations within 300m. It was estimated that some 435,000 people are living within 300m from the six survey activities including cargo handling areas, industrial areas, and transport terminals. Among them, some 60,000 people would be exposed to the higher cumulative noise from the nearby sources. A Survey on Monitoring of Non-Transport Related Noise Pollution has been commissioned by Sustainable Development Unit (SDU) in order to update the database on non-transport related noise condition in Hong Kong.
2.3 Air Quality
2.3.1 The review of air quality within SUSDEV 21 described Hong Kong’s atmosphere as subject to a number of characteristic air streams, with north-easterly prevailing winds for approximately 70% of the year. Winds from the north are particularly prevalent during the winter months, when they carry significant levels of pollutants from industrial, motor vehicles and power stations sources in Guangdong. In addition, many urban areas of Hong Kong have limited air circulation due to the
7

density of high-rise buildings.
2.3.2 Air pollutants in Hong Kong are mainly classified into Criteria Air Pollutants (CAPs) and Toxic Air Pollutants (TAPs). CAPs are those pollutants for which Air Quality Objectives (AQOs) have been established. The established AQOs are presented in Table 2.1.
Table 2.1 Hong Kong Air Quality Objectives
Averaging Time Pollutant 1 hr (2) 8 hr (3) 24 hr (3) 3 month (4) 1 year (4)
Sulphur Dioxide 800 350 80 Total Suspended Particulates 260 80 Respirable Suspended Particulates (5) 180 55 Nitrogen Dioxide 300 150 80 Carbon Monoxide 30000 10000 Photochemical oxidants (as ozone) (6) 240 Lead 1.5
(1) Measured at 298K (25oC) and 101.325Kpa (one atmosphere) (2) Not to be exceeded more than three times per year (3) Not to be exceeded more than once per year (4) Arithmetic means (5) Respirable suspended particulates means suspended particles in air with a nominal
aerodynamic diameter of 10 micrometres or smaller (6) Photochemical oxidants one determined by measurement of ozone only
Criteria Air Pollutants (CAPs)
2.3.3 CAPs includes sulphur dioxide (SO2), nitrogen dioxide (NO2), carbon monoxide (CO), Ozone (O3), Lead (Pb), Total Suspended Particulates (TSP) and Respirable Suspended Particulates (RSP).
2.3.4 An Air Pollution Index (API) is a simple way of describing air pollution. Since June 1995, EPD has been reporting the API and making a forecast for the following day. The API converts air pollution data from several types of pollutants into a value ranging from 0 to 500 which is divided into bands according to potential effects on health. An API >100 means that one or more pollutants may pose immediate health effects to some susceptible members of the community.
2.3.5 Table 2.2 below provides a summary to identify trends in non-compliance with CAPs. This shows the compliance status of the Air Quality Objectives annually.
8

Table 2.2 Compliance Status of the Air Quality Objectives
POLLUTANT AQO 86 87 88 89 90 91 92 93 94 95 96 97 98 99 2000
24 hour x x x x x ✓ x ✓ x x x ✓ ✓ ✓ x Total Suspended Particulates Annual x x x x x x x x x x x x x x x
24 hour ✓ x x x ✓ ✓ ✓ ✓ ✓ x ✓ ✓ x x x Respirable Suspended Particulates Annual x x x x x x x x x x x x x x x
Sulphur dioxide 1 hour x x x x ✓ ✓ ✓ ✓ ✓ ✓ ✓ ✓ ✓ ✓ ✓
24 hour ✓ x x x ✓ ✓ ✓ ✓ ✓ ✓ ✓ ✓ ✓ ✓ ✓
Annual ✓ ✓ x x ✓ ✓ ✓ ✓ ✓ ✓ ✓ ✓ ✓ ✓ ✓
Nitrogen dioxide 1 hour x x x x x ✓ ✓ ✓ ✓ ✓ ✓ x ✓ x x
24 hour x x x x x x x x x x x x x x x
Annual ✓ ✓ x ✓ ✓ ✓ ✓ ✓ x ✓ ✓ x x x x
Carbon monoxide 1 hour ✓ ✓ ✓ ✓ n/a ✓ ✓ ✓ ✓ ✓ ✓ ✓ ✓ ✓ ✓
8 hour ✓ ✓ ✓ ✓ n/a ✓ ✓ ✓ ✓ ✓ ✓ ✓ ✓ ✓ ✓
Ozone 1 hour ✓ ✓ ✓ ✓ ✓ ✓ ✓ ✓ ✓ ✓ x ✓ ✓ x x
Lead 3 month ✓ ✓ ✓ ✓ ✓ ✓ ✓ ✓ ✓ ✓ ✓ ✓ ✓ ✓ ✓
Note : ✓ = air quality objective was achieved; x = air quality objective was not achieved n/a = information not available
Source: EPD Air Quality Reports, 1986-2000
2.3.6 In order to determine trends in longer term levels of air pollution in Hong Kong, data are presented in Table 2.3 for annual average concentrations of the pollutants monitored at each station and for the territory overall. These data show increasing trends in the Hong Kong annual average (ambient) concentrations for NO2, though ambient SO2 levels continue to decline at urban and new town stations. Ambient levels of particulates (both TSP and RSP) have remained consistently high over the last 10 years with both pollutants close to their respective permissible AQO limits. Whilst annual average concentrations of ozone have only risen slightly, there were two exceedances of the hourly AQO in 1996 and the highest level recorded in 1998 (at Tap Mun) of 239 µg/m3 was just slightly lower than the hourly AQO of 240 µg/m3. Although the results for ozone since 1996 have been greatly affected by the inclusion of data from additional monitoring stations, rising levels of this pollutant (along with NO2) are a cause for increasing concern over the formation of photochemical smog. However, additional data is required to establish the long-term trend of the background ozone level.
9

Table 2.3 Long-Term Trends in Annual Average Criteria Air Pollutants in Hong Kong
Pollution / Monitoring Station
86 87 88 89 90 91 92 93 94 95 96 97 98 99 2000
Sulphur Dioxide (Annual AQO = 80 µg/m3)
(Causeway Bay)* 18 26 23 16 27 - - - - - - - 20 25 28
(Hong Kong South)
- - - 11 8 7 12 9 - - - - - - -
(Junk Bay) 19 15 9 7 5 6 11 9 - - - - - - -
(Tsim Sha Tsui) 49 35 53 42 26 13 25 22 - - - - - - -
Central - - - - - - - - - - - - 19 28 28
Central / Western 17 15 19 16 19 18 23 24 19 21 15 18 14 19 18
Eastern - - - - - - - - - - - - - 17 13
Kwai Chung - - 126 111 67 23 22 33 24 20 21 18 15 29 21
Kwun Tong 27 71 56 36 39 22 21 31 24 10 19 16 12 18 18
Mong Kok - - - - - 49 49 43 51 33 30 18 18 25 19
Sha Tin - - - - - 14 8 10 10 13 13 11 8 14 18
Sham Shui Po 17 15 21 12 13 10 12 27 26 20 18 20 18 18 18
Tai Po - - - - 5 7 12 25 - - - 13 9 23 12
Tap Mun - - - - - - - - - - - - 6 9 7
Tsuen Wan - - 35 28 41 36 36 50 30 23 22 20 14 19 18
Tung Chung - - - - - - - - - - - - - 15 15
Yuen Long - - - - - - - - - 13 18 21 17 22 19
HK Average 25 30 43 31 25 19 21 26 26 19 20 17 14 20 18
Nitrogen Dioxide (Annual AQO = 80 µg/m3)
(Causeway Bay)* - - - 40 61 - - - - - - - 104 105 98
(Hong Kong South)
- - - - 21 25 29 26 - - - - - - -
(Junk Bay) 55 40 20 12 15 20 24 21 - - - - - - -
Central - - - - - - - - - - - - 102 92 91
Central / Western 67 63 31 60 50 46 50 50 52 54 47 58 52 56 53
Eastern - - - - - - - - - - - - - 66 55
Kwai Chung - - 27 36 39 44 44 48 46 46 44 49 46 72 69
10

Pollution / Monitoring Station
86 87 88 89 90 91 92 93 94 95 96 97 98 99 2000
Kwun Tong - 74 93 60 60 57 74 66 59 57 65 74 68 78 69
Mong Kok - - - - - 70 75 75 88 84 75 85 83 86 84
Sha Tin - - - - - - - - 40 44 45 49 45 50 46
Sham Shui Po - - - 47 65 48 57 62 65 67 62 71 67 64 63
Tai Po - - - - 33 36 40 42 46 45 44 50 51 54 47
Tap Mun - - - - - - - - - - - - 10 12 11
Tsuen Wan - - 63 67 52 57 63 56 59 61 59 68 62 67 61
Tung Chung - - - - - - - - - - - - - 43 45
Yuen Long - - - - - - - - - 42 52 61 54 60 57
HK Average 61 59 47 46 44 45 51 50 57 56 55 63 62 65 61
Carbon Monoxide (No Annual AQO)
Causeway Bay* - - - - - - - - - - - - 1183 1468 1504
Central - - - - - - - - - - - - 1068 1179 984
Kwai Chung - - - - - - - - 50 - 490 651 - - -
Mong Kok - - - - - 136 147 148 154 122 1100 1095 1146 941 1270
Tap Mun - - - - - - - - - - - - 432 603 493
Tsuen Wan - - - - - - - - - - - 720 718 1177 915
Tung Chung - - - - - - - - - - - - - 709 582
HK Average - - - - - 136 147 148 102 122 795 822 909 1013 958
Ozone (No Annual AQO)
(Junk Bay) 44 34 40 52 49 36 22 33 - - - - - - -
Central / Western 23 21 19 15 19 21 24 25 22 24 29 27 30 37 34
Eastern - - - - - - - - - - - - - 41 26
Kwai Chung - - 23 14 16 18 18 23 27 29 34 33 31 24 23
Kwun Tong - - - - - - - - - - - 17 17 25 24
Sha Tin - - - - - - - - - - - 22 30 39 35
Sham Shui Po - - - - - - - - - - - - 18 20 19
Tai Po - - - - - - - 16 - - - 28 31 37 35
Tap Mun - - - - - - - - - - - - 66 68 67
Tsuen Wan - - 23 17 17 16 17 11 - - - 22 20 26 22
11

Pollution / Monitoring Station
86 87 88 89 90 91 92 93 94 95 96 97 98 99 2000
Tung Chung - - - - - - - - - - - - - 43 37
Yuen Long - - - - - - - - - 17 20 24 23 18 29
HK Average 34 28 26 25 25 23 20 22 25 23 28 25 30 34 32
Total Suspended Particulates (Annual AQO = 80 µg/m3)
(Causeway Bay)* 96 110 110 87 86 - - - - - - - - - -
(Hong Kong South)
- - - 61 55 60 70 60 - - - - - - -
(Junk Bay) 85 90 104 77 69 73 77 77 - - - - - - -
(Tsim Sha Tsui) 89 90 95 77 73 71 86 82 - - - - - - -
Central / Western 89 90 102 84 75 75 86 81 87 93 87 84 77 81 71
Kwai Chung - - 146 100 86 83 91 88 88 81 75 71 63 87 82
Kwun Tong 102 120 143 121 92 89 104 105 107 107 99 93 80 87 79
Mong Kok - - - - - 109 159 148 158 135 142 134 103 110 97
Sha Tin - - - - - 61 81 74 78 73 69 66 67 76 58
Sham Shui Po 95 99 119 109 102 99 124 118 102 99 101 89 86 90 81
Tai Po - - - - 72 74 87 92 87 84 77 80 68 73 63
Tsuen Wan - - 126 98 87 89 107 106 101 97 85 82 74 79 71
Tung Chung - - - - - - - - - - - - - 75 71
Yuen Long - - - - - - - - - 131 114 103 97 102 95
HK Average 93 100 118 90 80 80 97 94 101 100 94 89 79 86 77
Respirable Suspended Particulates (Annual AQO = 55 µg/m3)
(Causeway Bay)* 58 67 66 54 55 - - - - - - - 109 105 101
(Hong Kong South)
- - - 38 37 43 46 35 - - - - - - -
(Junk Bay) 48 53 63 45 44 44 44 39 - - - - - - -
(Tsim Sha Tsui) 60 63 59 52 52 49 55 49 - - - - - - -
Central - - - - - - - - - - - - 87 76 66
Central / Western 57 68 71 53 54 56 60 56 56 59 52 56 49 53 50
Eastern - - - - - - - - - - - - - 47 42
Kwai Chung - - 87 58 52 54 55 53 51 52 48 51 45 56 51
Kwun Tong 59 66 74 58 62 66 72 64 57 62 59 59 53 52 52
12

Pollution / Monitoring Station
86 87 88 89 90 91 92 93 94 95 96 97 98 99 2000
Mong Kok - - - - - 59 71 66 69 75 77 75 63 67 60
Sha Tin - - - - - 42 51 43 53 50 46 47 46 51 46
Sham Shui Po 61 61 65 61 61 63 71 68 61 60 59 58 55 56 52
Tai Po - - - - 46 49 53 51 50 56 52 55 50 54 48
Tap Mun - - - - - - - - - - - - 37 44 38
Tsuen Wan - - 77 55 48 57 64 59 62 62 53 56 54 54 50
Tung Chung - - - - - - - - - - - - - 48 45
Yuen Long - - - - - - - - - 75 64 64 61 62 56
HK Average 57 63 70 53 51 53 58 53 57 61 57 58 59 59 54
Notes: - Information not available (x) Monitoring stations shown in parentheses are now closed * Causeway Bay now has a roadside station, but the data from this station have not been included, as the
roadside station does not represent ambient air quality. Source: EPD Air Quality Reports, 1986-2000 (& Consultants’ calculation of HK Averages)
2.3.7 The data also show that roadside levels of RSPs and NO2 are following a decreasing trend though roadside levels are significantly higher than the average territorial levels. Although roadside levels of TSP declined significantly between 1997 and 1998, they continue to exceed the AQO. Roadside levels of CO remain low and well within the permissible limits.
Toxic Air Pollutants (TAPs)
2.3.8 TAPs can affect health at substantially lower concentrations in the ambient environment and their health effects are typically carcinogenic in nature. Relevant standards for the TAPs are presented in Tables 2.4 and 2.5 respectively.
13

Table 2.4 Health Guidelines for Toxic Air Pollutants
TAP HEALTH GUIDELINES (µG/M3) AVERAGING TIME
Cadmium 0.005(a) Annual Lead 0.5(a) Annual
1.5(b) 3 months Benzene 6 X 10⁻⁶ per µg/m3 (a) Life risk
Benzo[a]pyene 0.387(c) 1 hour 1,3-Butadiene 19 (c) 1 hour
220 (d) Annual Formaldehyde 100 (a) 30 minutes
(a) WHO Air Quality Guidelines for Europe (b) Air Quality Objective (AQO) (c) Health Protection Concentration Level, Technical Memorandum for Issuing Air Pollution
Abatement Notices (d) A Reference Note on Occupational Exposure Limits for Chemical Substances in the Work
Environment, 1995, Labour Department, HKSAR Government. A safety factor of 100 has been applied for conversion of time-weight-average value to long-term exposure limit and to allow for variability in human response to chemicals.
Source: SUSDEV 21: Final Environmental Baseline Report
Table 2.5 Level of Toxic Air Pollutants in Hong Kong
Pollutant 1997-2000 Average Concentration (EPD)
Tsuen Wan Central / Western
1997 1998 1999 2000 1997 1998 1999 2000
Heavy Metals
Cadmium (ng/m3) 1.21 1.48 1.83 2.20 1.63 1.56 1.66 1.56
Hexavalent chromium (ng/m3)
0.34 0.33 0.27 0.25 0.59 0.52 0.26 0.22
Lead (ng/m3) 59 68 80 64 60 61 67 51
Nickel (ng/m3) 5.5 4.3 5.2 5.0 5.4 3.5 3.9 4.6
Organic Substance
Benzene (µg/m3) 2.90 2.60 2.79 2.44 2.40 2.10 2.11 1.46
Benzo[a]pyrene (µg/m3) 0.35 0.41 0.21 0.32 0.21 0.29 0.15 0.21
1,3-Butadiene (µg/m3) 0.52 0.20 0.30 0.22 0.53 0.20 0.23 0.16
Formaldehyde (µg/m3) 18.40
4.47 4.98 4.84 21.00
5.28 4.66 4.46
Perchloroethylene (µg/m3)
0.80 1.60 1.22 0.79 1.50 3.50 3.40 2.67
14

Pollutant 1997-2000 Average Concentration (EPD)
Tsuen Wan Central / Western
1997 1998 1999 2000 1997 1998 1999 2000
Dioxins (pgI-TEQ/m ) 3 0.022
0.097
0.143
0.061
0.024
0.080
0.096
0.051
Source: EPD Air Quality Reports, 1997 – 2000
Greenhouse Gases (GHGs)
2.3.9 GHGs constitute carbon dioxide (CO ), methane (CH ), nitrous oxide (N O), hydrofluorocarbons (HFCs), perfluorocarbons (PFCs) and sulphur hexafluoride (SF ). CO is the most significant greenhouse gas emitted in Hong Kong. Using the Global Warning Potential system, which is a means for comparing different greenhouse gases based on their relative atmospheric heating, CO emissions constitute 83-88% of the total emissions of GHGs between 1990 and 1997 (ERM 1999). Other contributors include methane (CH , 11-14%), nitrous oxide (N 0, 1-2%) and a combined contribution of around 1% from emissions of hydrofluorocarbons (HFCs), perfluorocarbons (PFCs) and sulphur hexafluoride (SF ). The emissions of these gases, in terms of their CO equivalent, for the period 1990-2000 are detailed in Table 2.6.
2 4 2
6 2
2
4 2
6 2
2.3.10 Despite recent reductions in annual GHG emissions, projections undertaken for the Greenhouse Gas Emission Control Study (ERM 1999) suggest that emissions are likely to increase more rapidly between 2000 and 2010 than has been witnessed between 1990 and 2000. These increases are based principally upon projected increases in energy consumption through demand for power generation and increased total transport, such that GHG emissions would increase (in CO equivalent terms) from 38.7 Mt in 1990 to 36.8 Mt in 2000.
2
2.3.11 These projections are based on implicit assumptions in the modelling that historical trends in energy consumption are an acceptable representation of likely future patterns of consumption, and on assumptions relating to data use, principally that projections of economic and social development in Hong Kong are accurate and that the latest data on actual fuel combustion are representative of future fuel use (ERM 2000).
Table 2.6 Total Greenhouse Gas Emissions in Hong Kong SAR, 1990-2000 (Thousand tonnes CO equivalent) 2
YEAR 1990 1991 1992 1993 1994 1995 1996 1997 1998 1999 2000
CO 33,729 36,141 40,757 41,457 34,966 35,609 34,517 33,381 31,367 29,868 31,1342
CH4 4,493 4,691 4,930 5,189 5,416 5,549 5,632 5,522 4,490 3,502 3,701N O 490 503 533 555 557 665 768 961 1,048 1,147 1,1802
HFCs - - - - - 214 269 339 476 569 709 SF6 - - - - - 112 112 113 119 119 119
PFCs - - - - - 0.73 0.95 1.24 2 2 3 38,713 41,336 46,220 47,201 40,939 42,150 41,299 40,318 37,502 35,207 36,846Total
Source: LegCo Panel on Environmental Affairs – Greenhouse Gas, June 2001, EPD, Environment and Food Bureau
15

2.4 Geology, Soils and Contaminated Land
Geology
2.4.1 Hong Kong SAR encompasses the Kowloon Peninsula, the New Territories, two large islands, namely Hong Kong Island and Lantau Island and a total of approximately 260 smaller islands with a total land area of 1099km2. The topography is rugged, comprising steep mountainous areas, and deeply dissected valleys. Almost 5% of the land area is reclaimed land, the earliest reclamation dates back to the mid 1800s.
2.4.2 Volcanic rocks give rise to rugged scenery and form the highest peaks, while granitic and sedimentary rocks generally form lower relief (Hong Kong Geological Survey, 2000).
Soils
2.4.3 The quaternary superficial deposits and deeper soils commonly occur in flat valley bottoms and across plains where they form fertile land that was extensively cultivated in the past. More recently these flatter areas have been increasingly developed for housing and infrastructure, and now only about 7% of Hong Kong’s land surface is agricultural land.
Contaminated Land
2.4.4 There is tremendous pressure on the ecological resources in Hong Kong. The presence of contaminated land provides both constraints and opportunities. Constraints in terms of the fact that contaminated land may not support a diverse range of species, and at worst may migrate offsite and harm neighbouring ecological resources; whereas opportunities in terms of the potential for redevelopment on brownfield sites to prevent further encroachment into natural areas.
2.4.5 Although historically the industrial processes present in Hong Kong were predominantly manufacturing and assembly, there was a significant number of potentially contaminating industrial processes which took place and are taking place, providing a potential source of both organic and inorganic contamination. These include:
• Shipyards/boatyards and other similar facilities
• Petrol stations and fuel tank farms
• Sawmills
• Airports
• Industrial Units
• Vehicle maintenance yards
• Storage Areas
• Tanneries
• Bleaching and dying
• Printing
• Electroplating works
16

• Scrapyards
• Medical facilities
• Electrical installations
• Steel mills
• Agricultural practices including pig farms
• Landfills
2.4.6 There is no mandate to clean up a contaminated site once operations have ceased, and it is thus possible that contamination from leaks or residual materials from operations may remain on site. However, land which is potentially contaminated which is being considered for redevelopment (or decommission) are designated projects under the EIAO and procedures are in place to determining the risk of contamination, through for example a desk study, which investigates the site history, reviews EPD records, old maps, newspapers, and information relating to site activities from the previous owners from which a Contamination Assessment Plan (CAP) will be developed and agreed with EPD. Examples include the redevelopment of Kai Tak Airport under the South East Kowloon Study and the Cheoy Lee Shipyards Decommissioning Works.
2.4.7 In general, the method for contaminated land management is to excavate and dispose off site. However, as demonstrated by the South East Kowloon Study and Cheoy Lee Shipyard examples, alternative treatment options are being considered and probable future remediation techniques would focus on in-situ treatment with the desire to reduce offsite waste disposal, especially as space within the strategic landfills becomes scarcer. Biopiles have become increasingly popular for the treatment of organic contamination.
2.4.8 Contaminated marine sediments are also an issue in Hong Kong, particularly with respect to disposal. A new set of controls for the testing and treatment of excavated marine mud came into force on 1st January 2002. These controls will provide specific management and disposal requirements, based on a defined testing regime based on a range of chemical and biological parameters.
2.4.9 Unlike other countries such as England, there is no contaminated land register in Hong Kong.
2.4.10 Prior to redevelopment of existing brownfield sites, a desk study would be recommended to assess the potential risk of contamination on construction workers and other sensitive receptors.
2.5 Water Resources and Water Quality
2.5.1 The water environment in HKSAR primarily comprises inland waters including rivers and freshwater resources, bathing waters and marine waters. All of these waters are regulated by Water Quality Objectives (WQOs) under the Water Pollution Control Ordinance (WPCO) enacted in 1980. The baseline conditions for each of the waters are described as follows.
17

River Waters
2.5.2 The major inland watercourses in Hong Kong and location of water quality monitoring stations in 2001 are shown in Figure 2.1. The water quality in the rivers is routinely monitored by EPD to keep track of compliance with WQOs. According to the published monitoring results for year 2001, 72% of the monitoring stations attained a Water Quality Index (WQI) of “good” or “excellent” status (Figure 2.2).
2.5.3 The river water quality has improved steadily since the late 1980s with a significant increase in dissolved oxygen content and return of fish and aquatic life to some previously heavily polluted inland waters. Suspended solids, aggregate organics, nutrients and metals have also been greatly reduced. With effective pollution control measures and progressive provision of sewers, improvements in WQO compliance were observed in Sam Dip Tam Stream and many larger rivers in the Deep Bay Water Control Zone (WCZ). However, the bacterial levels remain high in many of the rivers in particular those impacted by livestock waste and unsewered villages discharges.
2.5.4 HKSAR Government has set up a long-term objective to achieve full sewerage connections across the territory. The on-going implementation of Sewerage Master Plans (SMP) is a major step towards achieving the long-term objective.
2.5.5 EPD monitors riverbed sediment on a half-yearly basis at 8 locations in Shing Mun Main Channel, Lower Lam Tsuen River, River Indus, Lower River Beas, Lower River Ganges, Yuen Long Creek, Kam Tin River and Lower Tuen Mun River. It is however known that the riverbed sediment in some of the rivers, such as Shing Mun River and Kai Tak Nullah, are polluted. The contaminated sediment, when disturbed for instance during maintenance dredging and during storm events, will be released into the water column, thus posing a potential risk to the river water quality and to the downstream marine waters.
Freshwater Resources
2.5.6 There are scarce freshwater resources in HKSAR and the majority of Hong Kong’s freshwater supply (about 70% in 2001) is imported from Dongjiang in Guangdong Province. The remaining supplies are from the local reservoirs. Groundwater resources are not heavily exploited for water supply though some remote villages in the New Territories and outlying islands still depend on wells for irrigation and domestic consumption.
2.5.7 The local water gathering grounds cover approximately one third of the land area of Hong Kong. The catchwater drainage systems, in total, extend for approximately 120 km and drain into WSD’s 17 impounding reservoirs. The water gathering grounds are designated and are well protected and there have been no significant pollution problems reported in the recent years.
2.5.8 Since 1990, the growth rate of the overall water demand has dropped to approximately 0.6% per annum as shown in Table 2.7. The reduction in growth rate may be due to the significant decrease in industrial water consumption as a result of the relocation of many industries outside Hong Kong. It is forecast that further reduction in the industrial demand for water will occur as a result of stricter pollution control policies and the availability of cheaper land and labour elsewhere prompting more industries to relocate outside Hong Kong.
2.5.9 In 2001, 236 million m3 of seawater was supplied for domestic flushing purposes.
18

Approximately 80% of the population of Hong Kong uses seawater for flushing. This extensive use of seawater has greatly helped to reduce the demand on freshwater.
Table 2.7 Annual Fresh Water Consumption in Hong Kong (1990 – 2001)
YEAR POPULATION TOTAL VOLUME (M3/YEAR)
CONSUMPTION PER CAPITA (M3/YEAR)
1990 5,704,500 873,000,000 153.0 1991 5,752,000 884,000,000 153.7 1992 5,800,500 889,000,000 153.3 1993 5,901,000, 915,000,000 155.1 1994 6,035,400 923,000,000 152.9 1995 6,156,100 919,000,000 149.3 1996 6,435,500 928,000,000 144.2 1997 6,489,300 913,000,000 140.7 1998 6,543,700 916,000,000 140.0 1999 6,606,500 911,000,000 137.9 2000 6,665,000 924,000,000 138.6 2001 6,732,100 940,000,000 139.6
Note: The population estimate methodology has changed from ‘de facto’ concept to ‘resident’ concept after 1995.
Bathing Waters
2.5.10 There are currently a total of 41 gazetted beaches (Figure 2.3) and numerous non-gazetted beaches. Gazetted beaches are beaches which have been announced in the government gazette as bathing beaches, and are managed by the Leisure and Cultural Services Department (LCSD). Non-gazetted beaches are those which have not been announced as bathing beaches. The bathing water quality of the gazetted beaches and some selected non-gazetted beaches is regularly monitored by EPD.
2.5.11 Based on the Beach Water Quality Reports in Hong Kong between 1986 to 2000 released by EPD, the pollution reached the highest level at a significant portion of the beaches between 1995 and 1997 and the water quality at most of the beaches has been improving steadily since then. However, Beach Water Quality Report for the 2001 bathing season shows that, among the 41 gazetted beaches, 21 were found to be in “Good” condition whereas 13 were “Fair”, 5 were “Poor” and 2 were “Very Poor” (Figure 2.4). The percentage of beaches meeting WQO has slightly dropped from 85% in 2000 to 83% in 2001 since the year 2001 had been a wet year with exceptional heavy rain during summer months which flush pollutants in the beach hinterland into beaches causing temporary deterioration of water quality.
2.5.12 The beaches on the south of Hong Kong Island, Sai Kung District and Islands District are generally of “Good” and “Fair” water quality. The pollution in the beaches in the Tuen Mun area is primarily attributed to by the background sources rather than by the local discharges. The most polluted beaches are in Tsuen Wan District, due to the use of septic tank and soakaway pit systems in their unsewered hinterland.
19

2.5.13 Many of the beaches find temporary pollution increase during heavy rainfall. This increase is most pronounced in areas where there are unsewered villages such as in Shek O and Silvermine Bay. This phenomenon is described in Section 4.3 (Shek O) and Section 4.7 (Silvermine Bay) of Technical Note No. 13 on the Evaluation of Engineering Measures and Assessment of the Bathing Water Quality, and Section 9.6.3 of Survey Report of the Beach Pollution Reduction Study (CE 34/98).
Marine Waters
2.5.14 Under the WPCO, the HKSAR marine waters are divided into 10 Water Control Zones (WCZ) as shown in Figure 2.5, namely Tolo Harbour and Channel, Southern, Port Shelter, Junk Bay, Deep Bay, Mirs Bay, North Western, Western Buffer, Eastern Buffer and Victoria Harbour. Specific WQOs have been set up for each of the WCZs based on the ecological, fisheries and recreational considerations. A routine monitoring programme has been in place since 1986 for monitoring the water quality of these WCZs.
2.5.15 According to the 2001 monitoring data, the overall dissolved oxygen (DO) compliance rate fell substantially from 95% in 2000 to 76% in 2001 due to unusually warm and wet weather in 2001. Higher seawater temperature generally lowers the amount of DO and stimulates microbial activities which also consume more DO from the water. Similar to 2000, five WCZs (Mirs Bay, Port Shelter, Junk Bay, Eastern Buffer and Western Buffer) fully met the total inorganic nitrogen (TIN) objective. The un-ionised ammonia (NH3) objective was achieved in all WCZs except in Inner Deep Bay.
2.5.16 The overall compliance rate in 2001 was 79%. The following waters are where non-compliance with the WQOs has been consistently observed: Deep Bay WCZ on DO, TIN and NH3; Victoria Harbour WCZ on DO and TIN; Southern WCZ on TIN; Tolo Harbour and Channel WCZ on DO. The overall DO and TIN compliance rate have decreased in 2001 and bacterial level in Victoria Harbour, Eastern Buffer, Junk Bay and Western Buffer WCZs has been increasing in the last 15 years.
2.5.17 A total of 634 cases of red tides have been reported in Hong Kong Waters from 1980 to 2001. Most red tides occurred in the eastern waters including Tolo Harbour and Channel, Port Shelter and Mirs Bay. About 43% of those red tides occurred in Tolo Harbour and Channel WCZ although red tides had occurred in every WCZ at some time during the period. However, the number of red tides has been declining since 1988 although there have been some increases in Mirs Bay and other eastern waters. There were 40 reported red tides in 2001. It is noted that the red tide species varied in different WCZs. Red tides affect bathing beaches and some species have been associated with fish kills.
2.5.18 Some of the red tides were closely linked to the nutrient pollution in the marine waters. However, it is known that other physical factors such as sunlight, temperature, tidal currents and wind speeds also have strong influence on the algal bloom.
20

2.6 Waste
2.6.1 The HKSAR Government uses a waste classification system which defines five categories of waste arisings:
Municipal solid waste (MSW) includes waste arisings from the daily activities of domestic, commercial and industrial sources. Most MSW from domestic sources is collected by the public sector (Food and Environmental Hygiene Department), and most commercial and industrial waste is collected by private waste collectors.
•
•
•
•
•
Construction and Demolition (C&D) materials is defined as a mixture of inert materials and wastes arising from land excavation and formation, building construction, site clearance, demolition and roadworks.
Chemical waste arises from processes or trade activities which contain chemicals likely to cause environmental pollution or pose a health risk.
Special wastes include livestock and animal wastes, asbestos, clinical waste, treatment works, sludges and screenings.
Other solid waste include coal ash, dredged mud and excavated materials disposed of at marine dumps
2.6.2 At present, about 6.5 million tonnes of wastes are disposed of in the three landfills each year. In the past five years, the overall volume of waste (which comprises mainly C&D materials and domestic waste) has been increasing at an annual rate of 3.5%. For domestic waste alone, the average increase is 4% each year, which is significantly higher than the average population growth of 0.9% (EFB, 2001). Figure 2.6 shows the disposal of MSW and the corresponding population level.
2.6.3 The figures presented in Table 2.8 show a steadily increasing trend in the total material arisings (MSW and C&D materials) during the previous 15-year period. When these figures are normalised for population, the amount of waste requiring disposal per capita increased by 50% between 1986 and 1995 but has declined slightly since then (except 1998 and 1999 when a slight increase was again recorded). It is interesting to note that the peak in 1995 coincides with the peak in C&D materials for the same period. As C&D materials are generally at least 2-3 times greater than municipal waste arisings, it is clear that trends in the production of C&D materials dictate the overall trends in arisings.
21

Table 2.8 Waste Arisings (Tonnes Per Day)
YEAR MID YEAR POPULATION
TOTAL WASTE ARISING(1)
QUANTITY OF WASTE REQUIRING FINAL DISPOSAL
PER CAPITA
MSW C&D (LANDFILLED)
TOTAL QUANTITY OF
WASTE LANDFILLED(2)
1986 5,524,600 24,500 0.0044 5,870 2,850 8,960
1987 5,580,500 23,590 0.0042 6,300 4,220 10,770
1988 5,677,600 26,250 0.0047 6,410 6,520 13,190
1989 5,686,200 24,990 0.0044 6,580 5,580 12,480
1990 5,704,500 24,460 0.0043 7,10 8,450 15,920
1991 5,752,000 28,650 0.0050 7,390 16,380 24,110
1992 5,800,500 33,060 0.0057 7,930 11,960 20,210
1993 5,901,000 30,850 0.0052 8,450 11,520 20,220
1994 6,035,400 32,280 0.0053 8,430 15,480 24,300
1995 6,156,100 40,190 0.0065 7,790 14,120 22,260
1996 6,311,000 38,660 0.0061 8,140 7,520 16,150
1997 6,502,100 37,110 0.0057 8,680 6,480 15,780
1998 6,687,200 41,440 0.0062 8,730 7,890 16,550
1999 6,606,500 46,380 0.0070 9,270 7,890 18,040
2000 6,711,500 47,020 0.0070 9,335 7,475 17,900
*2001 6,732,100 48,140 0.0072 9,300 6,408 16,817
Notes: (1) Waste Arisings = MSW + C&D Material (including public fill) (2) Quantity Landfilled = MSW + C&D Waste + Special Waste * Consultants calculations based on data from EPD Annual Monitoring of Solid Waste Reports
Source: SUSDEV 21 Final Environmental Baseline Report, ERM August 2000.
2.6.4 There has been a general reduction in the volume of chemical wastes produced since the early 1990s principally due to the relocation of many industries to the Mainland which produce chemical waste. However, the resultant shortfall in feedstock for the Chemical Waste Treatment Centre (CWTC) at Tsing Yi (which can provide treatment for up to 200 tonnes chemical waste per day, which is then disposed of to landfill or within wastewater effluent) has been topped up with MARPOL waste from ships, such that the CWTC is currently operating at around 75% of its design capacity (SUSDEV 21, ERM 2000).
Landfills and Public Filling Areas
2.6.5 Materials which are not recovered for reuse or recycling purposes are generally collected by the existing waste management system. Disposal on land in strategic landfills is the major disposal method for MSW. Hong Kong has three principal strategic landfill sites located at West, South East and North East New Territories (WENT, SENT and NENT). The waste intake and capacity of the three strategic landfills are shown in Tables 2.9 and 2.10 respectively. Most domestic waste is collected from dwellings and held in Refuse Collection Points (RCPs) of which there are over 1,000 in public control.
22

Table 2.9 Waste Intake at 3 Strategic Landfills: WENT, SENT & NENT, 1993-2001
AVERAGE DAILY INTAKE (TPD) TOTAL TONNAGE OF WASTE RECEIVED
TOTAL CAPACITY OCCUPIED (TONNES)
YEAR WENT LANDFILL
SENT LANDFILL
NENT LANDFILL
WENT LANDFILL
SENT LANDFILL
NENT LANDFILL
ALL LANDFILLS
1993 1170* - - 50310 - - 50310 1994 2700 1160* - 985500 112520 - 1098020 1995 2810 7070 2620* 1025650 2580550 560680 4166880 1996 1970 7230 3440 719050 263890 1255600 4613600 1997 4180 7830 3500 1525700 2857950 1277500 5661150 1998 5420 7840 3300 1978300 2861600 1204500 6044400 1999 6195 8359 3490 2261175 3051035 1273850 6586060 2000 6104 8227 3573 2227960 3002855 1304145 6534960 2001 5862 7359 3596 2139630 2686035 1312540 6138205
* Figures shown are average of actual operation days rather than 365 days during the year of commissioning
Source: SUSDEV 21 Final Environmental Baseline Report, ERM August 2000
Table 2.10 Commission Date and Capacity of Strategic Landfills
LANDFILL COMMISSION DATE DESIGNED CAPACITY (TONNES)
SITE AREA (HECTARES)
WENT 19-Nov-93 61900000 106 SENT 26-Sept-94 43100000 100 NENT 1-Jun-95 35000000 67
Source: Environment Hong Kong 1998 (1) Tonnage of waste received by each strategic landfill each year was calculated as follows: For year of commissioning: Average daily intake (tpd) x No. of actual operation days (i.e. 43
days for WENT, 97 days for SENT & 214 days for NENT For other Years: Average daily intake (tpd) x 365 days (2) Waste Treatment & Disposal Indicator Total Remaining Landfill Capacity by Volume = Designed Capacity minus Used Capacity of all
landfills
2.6.6 From the RCPs, waste is collected in rounds and delivered to one of the 8 existing refuse transfer stations (at Hong Kong Island West and East, West Kowloon, Kowloon Bay, Sha Tin, North Lantau, Northwest New Territories) or to the Outlying Islands Refuse Transfer Facilities, where waste is containerised and dispatched by ship or road to the landfill sites. Some MSW is delivered directly to landfill. Commercial and industrial waste is collected by both private and public contractors and either delivered to the refuse transfer stations or directly to landfill. The total quantities of waste disposed to landfill between 1986 and 2001 and the quantity of waste requiring final disposal per year are shown in Table 2.11.
23

Table 2.11 Summary of Major Types of Solid Waste Requiring Final Disposal, 1986-2001
QUANTITY OF WASTE BY TYPE (TPD)
MUNICIPAL SOLID WASTE (LANDFILLED) C&D MATERIALS SPECIAL WASTE
TOTAL QUANTITY OF
WASTE LANDFILLED
YEAR ESTIMATED MID-YEAR
POPULATION (MILLION)
DOMESTIC(1)
(A) COMMERCIAL
(B) INDUSTRIAL
(C) LANDFILLED
(D) PUBLIC FILL (2)
(E)
LANDFILLED (F)
i.e. (A)+(B)+(C)+
(D)+(F)
1986 5524600 4420 370 1089 2850 15780 240 8960 1987 5580500 4630 430 1240 4220 13070 250 10770 1988 5627600 4580 420 1410 6520 13320 260 13190 1989 5686200 4870 450 1270 5580 12820 310 12480 1990 5704500 5460 380 1270 8450 8900 360 15920 1991 5752000 5560 400 1430 16380 4880 340 24110 1992 5800500 5760 460 1710 11960 13170 320 20210 1993 5901000 6000 570 1880 11520 10880 250 20220 1994 6035400 6070 700 1660 15480 8370 390 24300 1995 6156100 6210 520 1060 14120 18280 350 22260 1996 6311000 6260 1090 800 7520 22990 490 16160 1997 6502100 6760 1220 700 6480 21950 620 15780 1998 6687200 6820 1290 620 7030 25,680 790 16550 1999 6877570 7430 1250 590 7890 29220 880 18040 2000 6711500 7540 1151 644 7475 30210 1094 48114 2001 6732100 7551 1187 562 6408 32430 1109 49247 2006 7.34 8560 2790 5750 23000 2011 8.10 9570 3240 6280 25140 Source: SUSDEV 21 (1) Some domestic waste was incinerated up to May 1997 (2) Public Fill = inert C&D materials delivered to public filling areas (3) Predicted figures of population in 2006 & 2011 from the Planning Department under Scenario B of the TDSR (4) Municipal Solid Waste received at disposal facilities = (a)+(b)+(c) (5) Total quantity of all waste received at solid waste facilities = (a)+(b)+(c)+(d)+(f) (6) Estimated mid-year population from C&SD (7) Waste Arisings Indicators: {(a)+(b)+(c)+(d)+(e)}/ estimated mid-year population
2.6.7 The location of existing waste facilities is shown in Figure 2.7.
2.6.8 The three landfills (WENT, SENT, NENT) constructed in the 1990s were expected to accept waste until at least 2020, however, population growth and C&D materials have skewed the figures that were used to plan the landfills. If the current trend continues, some predictions show that the landfills will be full as early as 2008-2011. As a response, the Waste Reduction Framework Plan was introduced in November 1998, however, even if all targets are achieved, landfills will be full by between 2012 and 2018.
24

2.6.9 EPD is conducting studies on how to extend the useful lives of the existing landfills. A territory-wide constraint analysis has been undertaken to identify feasible new landfill locations. Strategic assessments on environmental, socio-economic, technical and other factors of the identified locations will be conducted before committing to the development of any of these sites.
2.6.10 Hong Kong has 13 closed landfills that collectively occupy about 300 hectares of land (1.6% of the urban area), 12 of which have been restored with the use of low permeability final cover, leachate collection systems, landfill gas management systems, leachate treatment works and environmental monitoring systems. The restored landfills have an operational period of up to 30 years during which significant building development cannot take place due to settlement problems.
Recovery and Recycling
2.6.11 In the commercial sector, a significant proportion (53% in 1994 – source: SUSDEV 21) of commercial and industrial waste is recovered. However, the recovery rate for domestic waste is much lower at only 8% in 1994. The comparably low recovery rate for domestic waste is thought to be a result of lack of incentives and facilities for the public to segregate waste (including limited separation/recycling infrastructure) (source: SUSDEV 21), as well as a generally low level of awareness regarding the need for waste reduction, recovery and recycling. With the introduction of new initiatives to further promote prevention and recovery of domestic waste since 2001, it is expected that the recovery rate for domestic waste will be increased to 14% in 2004 and 20% in 2007.
2.6.12 Through the existing informal or voluntary waste recovery system, about 1.94 million tonnes of MSW was recovered in Hong Kong in 2001. Of that total, 9% was recycled locally and 91% was exported to the Mainland and other countries for recycling (Environment Hong Kong, 2002).
2.6.13 A Construction Waste Task Force has been set up in 2000 for construction industry under the Waste Reduction Committee. It covers providing on-site sorting facilities for further public demolition contracts, recycling as much material as possible for use in less demanding construction works, providing adequate number of conveniently located barging points for the public fill being taken to reclamations, etc. Currently reclamation sites accept inert C&D materials, such as earth and rocks, and in 2000 they took in 30,000 tonnes per day, however, these will be in short supply after 2003 (Environment Hong Kong, 2001). It is worth noting that there is expected to be an acute shortage of public filling capacity to accommodate inert C&D materials in the coming years. By end 2005, there will be an estimated cumulative shortfall of some 24 million tonnes in public filling capacity. Due to the pressure on the landfill, the Government is considering landfill charges to encourage waste reduction.
2.6.14 New infrastructure will be necessary to ensure the collection of recyclable waste, for source separation and material recovery. Legislative tools such as the use of landfill taxes may be necessary to encourage the minimisation of waste and re-use of materials. Efforts to reuse old landfill sites must also be a prime consideration as evidenced by the EPD’s proposals to restore the closed landfills and use these for various purposes. To provide the context, the 13 closed landfills occupy about 300 hectares of land, an area which is 15 times the size of Victoria Park. Obviously for safety and health reasons, these closed landfills need to be restored to minimise their potential impacts on the environment and to enable their development for future beneficial use. They could provide land for uses such as the multi-purpose grass pitch at the restored Sai Tso Wan landfill, and golf
25

courses at Shuen Wan.
2.6.15 A total of 8 sites were leased to the recycling industry on Short Term Tenancies ranging from 3 to 7 years. On 11 September 2001, the SEF has announced the following 7 initiatives:
Setting up a 20-hectare Recovery Park at Tuen Mun Area 38 by early 2004 •
•
•
•
•
•
•
Planned injection of $100 million into the Environment and Conservation Fund
Enhancing collection of separated waste and adding 8,000 newly designed separation bins
Introduction of helpline on recycling
Enhancing public education and community work
Government setting examples on waste reduction
Reinforcing producer responsibility scheme
2.6.16 To ensure the long-term effectiveness of recycling initiatives, markets for these products need to be encouraged. The development of a consolidated organisation to promote markets for recycled materials could be a way forward for further collaboration within the waste industry and could help to promote government’s waste reduction initiative.
2.7 Energy
2.7.1 Hong Kong has a total installed electricity generating capacity of 11,568 MW (including 70% of the capacity of units 1 and 2 of the Mainland’s Guangdong Nuclear Power Station at Daya Bay and 50% of Phase I of the Guangzhou Pumped Storage Power Station, which are imported through CLP transmission connections to Guangdong provincial grid). The sources of generation in Hong Kong are completely thermal. Fuel gas is supplied for domestic, commercial and industrial uses. Two main types of fuel gas are available: town gas distributed by the Hong Kong and China Gas Company Limited; and liquefied petroleum gas supplied by oil companies.
2.7.2 With virtually no indigenous fossil resources, Hong Kong is totally dependent on imported fuels for energy generation. The current energy scene in Hong Kong is dominated by coal and oil products from other countries. Coal and fuel oil used for electricity generation represent about 52% of the primary energy requirements (Hong Kong Energy Statistics Annual Report 2001), compared to 68% in 1991. The input of coal products for electricity generation increased slightly, while that of the oil products increased significantly from 1996-2001. This was partly due to the introduction of natural gas to substitute some of the coal products for electricity generation since late 1995. Diversification and cleanliness of generation technologies are becoming more and more important in the energy industry (Hui, 1997a).
26

2.7.3 Energy demand in Hong Kong can be classified as arising from the residential, commercial, industrial and transport sectors. The two principal energy carriers for supply to residential, commercial and industrial users in Hong Kong are electricity and town gas. The transport sector currently relies heavily on diesel for trucks, buses and taxis, and petrol for private vehicles. A relatively small amount of electricity is used in rail transport.
2.7.4 The overall energy balance for Hong Kong provides an account of energy supply and demand and shows the origin and uses of all forms of energy. The final energy requirements for 2001 were about 375,551 Tj.
2.7.5 The electricity used in Hong Kong is supplied by two government-regulated, investor-owned companies, Hongkong Electric Company (HEC) and CLP Power Hong Kong Ltd (CLP) from three major power stations in Hong Kong:
Lamma Power Station (HEC) – coal fired steam plant 3,305MW •
•
•
Black Point Power Station (CLP) – combined cycle gas turbines 1,875MW
Castle Peak Power Station (CLP) – coal fired steam plant* 4,168MW
*two units have natural gas burners retrofitted to the boilers
(Source: SUSDEV 21)
2.7.6 In addition, under an arrangement with the Guangdong Nuclear Investment Company, CLP purchases approximately 70% of the electricity produced by the Daya Bay Nuclear Power Station in Guangdong. The two sources of gas supply in Hong Kong are Towngas (manufactured at two sites in Hong Kong) and liquefied petroleum gas (LPG) transported by sea.
2.7.7 The Hong Kong Energy Statistics 2001 Annual Report states that energy consumption can be divided into two types, these are: the final energy requirements (FER) which represents the amount of energy consumed by users for all energy purposes, such as air conditioning, lighting, cooking, and using machinery, but excludes non-energy uses, such as the use of kerosene as a solvent. Whereas primary energy requirements (PER) refers to the overall energy consumption within a geographic territory and includes the energy accounted for in the final energy requirement plus all energy used or lost in the energy conversion and distribution process.
2.7.8 The Hong Kong Energy Statistics Annual Report 2001’s figures show that the FER has increased from 238,707 Tj in 1991, to 288,555 Tj in 1996, up to 375,551 Tj in 2001 which is an increase of almost 60%. The FER for Hong Kong is shown in Table 2.12 below.
27

Table 2.12 Final Energy Requirements for Hong Kong
YEAR TOTAL IN TJ
1989 Primary Energy Requirement (PER) 389,436
Final Energy Requirement (FER) 221,870 1990
PER 400,825 FER 222,640
1994 PER 471,712 FER 300,999
1995 PER 467,288 FER 290,764
1999 PER 635,388 FER 464,528
2000 PER 584,015 FER 403,579
2001 PER 572,684 FER 375,551
Source: Hong Kong Energy Statistics, Annual Report 1999 Hong Kong Energy Statistics, Annual Report 2000 Hong Kong Energy Statistics, Annual Report 2001
2.7.9 The 2001 report shows that while gas consumption has increased significantly over the last decade, the pattern for the increase in use by the commercial, domestic and industrial users was rather stable. Between 1991 and 2001, however, electricity consumption by industrial users dropped whereas with increased consumption from commercial and domestic users.
2.7.10 In year 2000, Hong Kong Eco-Business awards were expanded to encourage the public and private sectors to publish environmental reports and implement green office practices and green property management. The aim is that this will give companies a clear idea of the energy consumed, which is the first step in identifying methods to reduce consumption.
Renewable Energy
2.7.11 In the United Nations system, renewable energy refers to large and small-scale hyrdropower, modern and traditional biomass energy, solar energy, wind energy, ocean energy, urban and rural organic waste and geothermal energy. Large hydropower and traditional biomass are by far the most important among them. The new and emerging renewable energy technologies such as solar, wind, modern biomass and geothermal contribute only a small portion at present.
28

2.7.12 The use of renewable energy in Hong Kong is presently very limited, there is limited information available to assess how much renewable energy is being utilised (FoE, 1996a). A study undertaken by EMSD was to explore the feasibility of wider application of new and renewable energy technologies in Hong Kong. It is expected that increasing number of projects in Hong Kong will adopt any forms of renewable energy, such as solar panels for hot water heating being installed by Architectural Services Department. It also ventures to incorporate the opportune renewable and clean energy, namely Building Integrated Photovoltaic (BIPV) and fuel cell in their building projects (ASD, 2000).
2.7.13 Land-use and space restrictions are important constraints since Hong Kong has a high population and building density. Large hydropower, traditional biomass energy and geothermal energy may not be feasible in Hong Kong because of the limited local conditions. The use of other renewable energy technologies, such as solar, wind and modern biomass, is also constrained by various reasons.
2.8 Natural Resources
2.8.1 Four quarries, Shek O, Lam Tei in Yuen Long, Lamma Island and Anderson Road in Kowloon East, supply half of the requirements for building material in Hong Kong. The remainder comes from quarries in Guangdong.
2.8.2 Hong Kong will be faced with a shortage of quarry stone used for construction by 2008, when supplies from local quarries and many in Guangdong will be exhausted. By 2013 the four sites in Hong Kong would cease operation, although a serious shortfall would not emerge until 2017 when supplies from most of the Mainland’s quarries would also be exhausted (www:hongkong.scmp.com/ ZZZ67K3M5WC.html).
2.9 Landscape
General
2.9.1 The Chief Executive emphasised the need to improve the environment and quality of life in Hong Kong in his 1999 Policy Address, and also agreed to devote more concerted efforts to promote landscaping/greening in his 2000 Policy Address. The reason for this policy direction was a response, in part, to both the public perception and the professional opinion of experts in the fields of urban design and landscape conservation and planning that the area provision of Hong Kong’s non-designated rural and urban landscapes was low, especially in comparison to other Asian and Mainland cities. The importance of these non-designated rural and urban landscapes, such as woodlands, forests, private parks and gardens, civic spaces, waterfront areas, roads and street corridors is closely related to the following functions:
• protecting and conserving rural ecological and landscape resources;
• improving urban micro-climate;
• providing passive and active leisure and recreation opportunities; and
• avoiding rural and urban blight leading to corollary adverse effects on
29

environmental and economic conditions.
2.9.2 These functions are also provided by statutory designated Country Parks, which comprise 40% of the land area of Hong Kong. However, the main shortcoming of this statistics is that it gives the false impression that Hong Kong residents live day-to-day in a green rural setting. In reality the overwhelming majority of people live in urban landscapes with little or no greenspace. Although the provision of open space is planned in accordance with the HKPSG, the level of provision is comparatively low by comparison to other South-East Asian cities. According to Dr. Charlie Q. L. Xue, Mr. Kevin Manual, and Mr. Rex Chung from the Division of Building Science and Technology at the City University of Hong Kong, public open space is an important index of living quality. For example, the HKPSG recommend 1.5m² of open space per person (ospp) compared to 6m² ospp in Tokyo, 4m² ospp in Singapore, 3m² ospp in Guangzhou, and 2m² ospp in Taipei and Shenzhen. In some parts of urban Hong Kong (e.g. Mong Kok), there is only 0.5m² ospp (source: International Conference on Megacities 2000, 8th-10th February 2000). While Country Parks have proved extremely successful in conserving important ecological and landscape resources as well as providing recreation space and enhancing visual amenity, they do not fulfill the needs of the majority of people on a day-to-day basis.
Underlying Influences Affecting Hong Kong’s Urban and Rural Landscapes
2.9.3 The underlying causes for the current situation can be summarised from a landscape conservation and planning standpoint as follows:
Historical Factors
• Infrastructure and building development have been progressively eroding the natural landscapes and ecological resources, especially in urban fringe areas where large mature trees and woodland were removed to make way for roads.
• The environment of some streets and roads is hostile to pedestrians, with low level of physical comfort (due to noise / air pollution, lack of shade and shelter etc.), and highly constrained pedestrian movement. Conversely, every effort is made to accommodate the requirements of road traffic and underground utilities.
Physical and Geographical Factors
• Insufficient provision has been made for open space in all urban districts of Hong Kong, and there is a lack of variety in the provision made (e.g. few civic open spaces).
• Inadequate or little landscape treatment of areas outside designated open spaces / sitting out areas, e.g. street corridors, waterfront areas, and other shared use spaces.
Economic Factor
• The design of public urban landscapes is overwhelmingly driven by the need for minimal initial cost and maintenance liability.
30

2.9.4 Hong Kong has no cohesive territory-wide landscape conservation and planning policy for non-designated landscapes. Historically, landscape and visual issues have been given low priority in the planning of public works, resulting in the loss of significant areas of natural but non-designated landscapes. Since 1997, the EIA Ordinance has enabled the prediction and judgement of the magnitude and significance of the impacts that new development/redevelopment may have on landscape resources/characters and visual amenities.
2.9.5 The meaning and definition of “landscape” has a number of interpretations. Originally, the term was used by scientists to refer to objectively defined entities such as geographic regions, areas and diverse tracts of land. However, during the 19th and 20th centuries, the word “landscape” began to be used more widely and subjectively, in other words to include designed and built environments and the complex element which generated reactions and emotions in humans to nature and aesthetics. For the purpose of this report, the term “landscape” refers to this wider definition, embracing physical, cultural/historic and aesthetic elements which combine to create specific patterns and features that are distinctive to particular localities encompassing the whole of the external environment, whether within villages, new towns, dense urban areas or in rural areas. It also includes the patterns and textures of buildings, streets, open spaces and trees, and their interrelationship within the built environment.
2.10 Risk
2.10.1 Government imposes special controls on industrial installations, which use hazardous materials in quantities exceeding specified threshold values. The industrial installations are designated as Potentially Hazardous Installations (PHIs) which include liquefied petroleum gas (LPG) and oil terminals, housing estate LPG stores, gas production plants, explosive depots, and chlorine stores at water treatment works.
2.10.2 There are currently 33 existing PHIs as shown on Figure 2.8.
2.10.3 The number of people exposed to risk above the individual risk guideline level (10-5 per year) (reference made under Figure 1 of Annex 4 for EIAO-TM as shown below) from PHIs has been greatly reduced from over 80,000 in 1987 to less than 1,000 in 2000. The major events which have affected the number of people exposed includes:
• relocation of oil depots at Ap Lei Chau, Kwun Tong and Tsing Yi;
• general improvements to chlorine equipment and operational procedures for many water treatment plants;
• decommissioning of oil and explosive depots; and
• increasing chlorine usage at water treatment works offset by new safety systems and procedures (e.g. scrubber systems).
31

1. Individual Risk Guidelines for Acceptable Risk Levels
Maximum level of off site individual risk should not exceed 1 in 100,000 per year, i.e. 1x 10⁻⁵ / year
2. Societal Risk Guidelines for Acceptable Risk Levels
(Source: Figure 1 of Annex 4 for EIAO-TM)
2.11 Ecological Conditions
2.11.1 Despite its small size, Hong Kong supports a wide range of habitats which provide homes for a variety of species. The habitats map (Figure 2.9) shows the location and extent of the habitats as described below.
Overview
2.11.2 The ecological baseline conditions of Hong Kong can be described using a wide array of attributes and descriptors. Perhaps the most obvious and useful attribute is biodiversity. Biodiversity has interwoven components: Taxonomic attributes such as species and families, while the distribution and abundance of populations and communities of those taxa describe the biodiversity of populations and communities of different species groups.
2.11.3 Another major descriptor used is habitats type and size and the spatial and temporal distribution patterns of habitats (physical diversity). Ecosystems can also be used to describe ecological baseline conditions, however the plasticity of the term (e.g. an aquarium can be defined as an ecosystem) and its complexity
32

(involves both the physical and biological realms) renders it an awkward tool to use at the level of countries or regions.
2.11.4 If these attributes (distribution and abundance of species and habitats) are the currency and capital of ecology then descriptors such as “naturalness”, “rarity”, “vulnerability to extinction”, form the basis by which the ecological currency and capital can be valued. This valuation is the second important component that forms the understanding of baseline conditions.
2.11.5 SUSDEV 21 and the Biodiversity Survey of Hong Kong have provided an assessment of the baseline ecological conditions of Hong Kong, albeit from differing perspectives. The Biodiversity Survey focused on describing and valuing the ecological biodiversity of Hong Kong, while SUSDEV 21 concentrated on describing and valuing the physical diversity. Together, these documents are the primary source of understanding the terrestrial ecological baseline conditions of Hong Kong and both are reviewed here. No such comprehensive analysis is available for marine ecological conditions and instead reference is made to individual studies wherever appropriate.
2.11.6 Hong Kong’s ecological baseline conditions can only be properly understood within a regional and global context. These frames of reference are becoming increasingly available and are significant for any long-term plans of resource use. In this section a review of the global context of Hong Kong’s ecology is also included.
Global Context
2.11.7 There are several sources available that map ecological attributes on a global scale. Ten Biomes are used to delineate the world’s terrestrial ecology by Cox, C.B. and Moore, P.D. 1993, while 14 realms and provinces and 26 ecoregions are used by Udvardy, M.D.F. 1975 and Bailey, R.G. and Hogg, H.C. 1986, respectively. Perhaps the most detailed attempt has been made most recently by the National Geographic Society and the World Wildlife Organisation which recognizes 867 land-based ecoregions.
2.11.8 Based on the National Geographic Society ecoregion profile, Hong Kong is described as lying within the ‘South China-Vietnam Subtropical evergreen forest’ (www.nationalgeographic.com/wildworld/terrestrial.html). This ecoregion forms a transitional zone between the tropical forests of Vietnam to the south and subtropical and mixed forests of southern China. The special features of this ecoregion are that it is rich in species from both the more tropical southern regions of Indochina and the subtropical forests of southern China. This ecoregion is subject to pressure from removal, and large areas of tropical broadleaf forest have been cleared to date. These tropical and subtropical moist broadleaf forests are described as critical/endangered within the national geographic ranking system.
2.11.9 Another threatened habitat within Hong Kong is the coastal wetlands and mangroves. World wide the area covered by coastal mangroves, mudflats and seagrass beds has gradually diminished over time due to increased coastal development, and species have been put under stress as a result of increased pollution loads. Of particular importance globally are Hong Kong’s wetlands at Mai Po. 450 species of bird have been recorded within Mai Po, and this wetland supports 72% of all of the bird species recorded in Hong Kong. It holds internationally important numbers of certain bird species, some of which are highly endangered. For example it is a main wintering site for approximately 252 individuals of the endangered (as defined on the World Conservation Union IUCN
33

red list category) black-faced spoonbill Platalea minor from an estimated total global population of 870 individuals (figures recorded over the winter of 2000-2001).
2.11.10 The Mai Po and Inner Deep Bay wetland is the largest remaining wetland in Hong Kong. It is of international importance due to the tens of thousands of migratory birds, including rare, endangered and vulnerable species which use the wetland. The area also supports a diverse community of flora and fauna, including over a dozen endemic invertebrate species. As such the HKSAR Government is committed to the conservation of this wetland. In September 1995, 1500 ha of the Mai Po and Inner Deep Bay wetland were listed as a Wetland of International Importance under the Ramsar Convention.
2.11.11 Under the Ramsar Convention, the conservation of this Ramsar Site should be promoted to protect plants and animals in the area and prevent environmental damage caused by incompatible development. Accordingly, those responsible for the management of the Ramsar Site are obliged to: formulate and implement a planning strategy to promote the conservation of the Ramsar Site; develop a management plan and provide adequate wardening for the area; and inform the Secretariat at the earliest possible time if the ecological character of the site has changed, is changing or is likely to change as a result of technological development, pollution or other human interference.
2.11.12 An ecological monitoring programme has been prepared (under AFCD management) which covers aspects such as water quality, mudflat quality (sediment quality and particle size), benthic infauna and epifauna, habitats extent and mangle and fishpond conditions. This on-going long-term monitoring commenced in 2001.
2.11.13 The Hong Kong population of chinese dolphin Sousa chinensis, which consists of about 200 mammals, is listed as endangered and there is concern that the health of the dolphins may be affected as a result of habitats loss from reclamation projects and pollution from development activities. These dolphins had previously been recorded up the Shenzhen River as far as Lok Ma Chau, however, its presence in Shenzhen Bay is now doubtful due to heavy boat traffic and pollution.
2.11.14 There are three species of amphibian endemic to Hong Kong, or with restricted range. These include the Hong Kong Cascade Frog (Amolops hongkongensis), the Hong Kong newt (Paramesotriton hongkongensis) and Romer’s Tree Frog (Philautus romeri), and of the 21 bat species known to occur in Hong Kong, the majorities are considered rare or have fairly local distributions. There is limited information available on bat species in Hong Kong, for example in the past five years, two new species (the Eastern Daubenton’s and Black-bearded Tomb Bats) have been recorded in Hong Kong and two species have been rediscovered locally, namely the Leschenault’s Rousette Bat Rousettus leschenaulti and the Wrinkle-lipped Bat Chaerephon plicata.
2.11.15 Research on mammals and species in Hong Kong is limited. New species are still being found, one of which is the Javan Mongoos Herpestes javanicus, which was first recorded in Mai Po in 1989. However, civet cats Viverridae, leopard cats Prionailurus bengalensis and the ferret badger Melogale moschata have become very rare in recent years (www.afcd.gov.hk/conservation/con_e.htm). Recent invertebrate studies cited by WWF have been conducted at Mai Po during which time over 20 species of invertebrate have been discovered which are new to science. A new species of crab (Parasesarma maipoensis) and two moths (Schrankia bilineata and Thalassodes maipoensis) have been identified amongst
34

the 400 species of invertebrates recorded which includes the endangered dragonfly Mortonagrion hirosei.
2.11.16 It is clear that there is still a lot to be learned about the species present in Hong Kong. As populations increase throughout Asia, it is anticipated that pressure on the remaining habitats will increase, not only through encroachment, but also through increased pollution loads. The rugged terrain found in Hong Kong will mean that there are areas which will be protected to some extent from intrusion by man, however, the habitats which are more threatened are those associated with the flatter areas, where the soil is deeper, or near wetlands or the coast.
2.11.17 Scientists today have described 1.4 million species of plants and animals, with estimates that the total number of species is between 5 to 30 million. However, it is also thought that 17,500 of these species will become extinct every year, (http://www.wwf.org.hk/eng/conservation/spe_cons/endangered_species.html) many of which will have taken millions of years to evolve. As with natural areas throughout the planet, conservation of remaining natural areas is considered to be a priority.
Biological Diversity
2.11.18 Hong Kong supports a wide diversity of ecological communities, with forests and shrublands being the most dominant habitats type, covering approximately 37% of the total terrestrial area of Hong Kong (SUSDEV 21).
2.11.19 A recent survey of the biodiversity of Hong Kong was funded by the Environment and Conservation Fund to identify sites and species of conservation importance. This survey identified that Hong Kong’s flora is incredibly diverse for its small land area, with 2135 species of vascular plants recorded. Of these species, 19 % of which (57 pteridophytes, 4 gymnosperms and 339 angiosperms) are either locally extinct or very rare. Another 15% are considered rare (Corlett et al, 2000). This plant diversity is not uniformly distributed over Hong Kong and the majority of the species are confined to sites which probably amount to less than 10% of the land area. The richest areas are small patches of montane forest above 400-500m, which have been protected by remoteness, dampness and inaccessibility.
2.11.20 In Hong Kong, terrestrial habitats are protected by designation as Country Parks, Special Areas or Sites of Special Scientific Interest (SSSI). There are 23 Country Parks in Hong Kong, including the recently designated Lung Fu Shan Country Park, and 15 Special Areas (11 of which fall within the boundary of Country Parks) created for the purpose of nature conservation. Together these protected areas cover 38% of the land area in Hong Kong. Country Parks are designated to serve both recreation and conservation purposes. Although concerns are often raised if visitor numbers are high, there should be no conflict of interest between these functions if appropriate zoning and management controls are exerted.
2.11.21 There are 64 SSSIs of which the designation is an administrative device. Of these SSSIs, some have statutory status by virtue of their designation on town plans made under the Town Planning Ordinance and Outline Zoning Plans (OZPs). Since 2001, AFCD has been providing active management to those SSSIs falling outside Country Parks, Special Areas, Marine Parks, Marine Reserves and Restricted Areas on a need basis.
35

Physical Diversity
2.11.22 Under the SUSDEV 21 Study’s baseline survey of terrestrial habitats, the entire land area of Hong Kong has been mapped into 25 categories of habitats/land cover and each was assigned with an ecological value of high, medium, low or negligible (Figure 2.9). Both vegetated upland areas (e.g. wetlands, ponds and inland watercourses) and coastal fringe areas (e.g. mangroves, seagrass beds, intertidal mudflats, and rocky and sandy shores) are included in the map. A consultancy study on “Terrestrial Habitats Mapping and Ranking Based on Conservation Value” will be commissioned by SDU in order to update the terrestrial habitats through field surveys.
2.11.23 As part of the habitats mapping exercise, area and percent cover for each of the 25 habitats/land cover categories was provided (see Table 2.13). These figures are based on satellite imagery and aerial photograph sources, the results of the field surveys and other relevant information. A detailed description of the habitats mapping and conservation ranking study is provided in SUSDEV 21’s Final Environmental Baseline Report.
Table 2.13 Hong Kong’s 25 Habitats Categories and their Land Area
HABITATS CATEGORY AREA (HA) % COVER
Grassland 26,081 23.4 Other (incl. Urban, buildings and other highly modified areas)
18,820 16.9
Lowland Forest 18,225 16.3 Mixed Shrubland 16,478 14.8 Shrubby Grassland 8,703 7.8 Baeckia Shrubland 5,977 5.4 Cultivation 4,381 3.9 Modified Watercourse 2,827 2.5 Fishpond/ Gei Wai 1,836 1.6 Intertidal Mudflat 1,564 1.4 Bare rock or Soil 1,440 1.3 Freshwater/Brackish Wetland 1,030 0.9 Rural Industrial Storage/Container 1,008 0.9 Golf Course/Urban Park 1,007 0.9 Natural Watercourse 783 0.7 Landfill 398 0.4 Mangrove 327 0.3 Quarry 229 0.2 Sandy (spatial) 206 0.2 Plantation or Plantation/Mixed Forest 180 0.2 Fung Shui Forest 112 0.1 Montane Forest 60 <0.1 Seagrass Bed 41 <0.1 Rocky Shore 710 62.3 Artificial Rocky/Hard Shoreline 273 24.0 Sandy Shore 156 13.7
Source: SUSDEV 21
36

2.11.24 Out of the total habitats area mapped, 40,095 ha were classified in the survey as being of high ecological value, representing 35.9% of the total land cover. The high ecological value areas were mainly identified as forest and shrubland habitats (including fung shui forest, montane forest, lowland forest and mixed shrubland) and inland water habitats (including freshwater / brackish wetland, intertidal mudflat, seagrass bed and sandy shore). Small areas of Cultivation, Plantation or Plantation / Mixed Forest, Shrubby Grassland, Grassland and Urban Park have also been identified as high ecological value habitats. Areas of high terrestrial ecological value are classified in Table 2.14 and illustrated in Figure 2.10.
Table 2.14 Areas of High Terrestrial Ecological Value
HABITATS CATEGORY AREA (HA) % COVER
Lowland Forest 18,219 16.3 Mixed Shrubland 16,468 14.7 Intertidal Mudflat 1,538 1.4 Fishpond / Gei Wai 1,278 1.1 Freshwater / Brackish Wetland 1,025 0.9 Natural Watercourse 738 0.7 Mangrove 321 0.3 Fung Shui Forest 112 0.1 Cultivation 86 <0.1 Grassland 74 <0.1 Plantation or Plantation / Mixed Forest 62 <0.1 Montane Forest 60 <0.1 Seagrass Bed 41 <0.1 Golf Course / Urban Park 35 <0.1 Shrubby Grassland 22 <0.1 Baeckia Shrubland 11 <0.1 Sandy Shore 5 <0.1 Bare Rock or Soil 3 <0.1
2.11.25 Further details on the ecological baseline of these terrestrial habitats are extracted from SUSDEV 21 results which are summarised below.
Forests and Shrublands
2.11.26 Forests and shrublands together constitute about 37% (based on mapping of the habitats on the base map) of the total land area of Hong Kong and are the most extensive vegetation types found in Hong Kong. Forest habitat can be distinguished into fung shui forest, montane forest, lowland forest and plantation. Fung shui forests are defined by their location behind current or abandoned villages and are often preserved because of traditional beliefs (Zhuang and Corlett, 1997).
2.11.27 Natural forest occurring higher than 600m above sea level is classified as montane forest whereas forests below that altitude are regarded as lowland or plantation. Both montane and lowland forest types are the result of regeneration since the extensive cutting during World War II. While both forest types afford important habitats for a variety of flora and fauna, some patches of montane forest
37

represent topographically protected areas which most likely contain species surviving since the early 19th century and are thus of particular importance. Plantations were first established in Hong Kong in the 1870s and just prior to World War II covered 70% of Hong Kong Island. Due to cutting for firewood and other uses, most plantation forest was removed during the Japanese Occupation from 1942 to 1945 (Corlett 1997).
Fung Shui Forests
2.11.28 The majority of the fung shui forests surveyed for the SUSDEV 21 habitats mapping exercise were small in size (the total area occupied by fung shui forest is only about 0.1% of the total land area) and subject to little or no human disturbance. Despite their small size, forests over 60 years old are dominated by native species and are known to contain rare plant species (Zhuang and Corlett 1997; Chu 1998). Protected and rare plant species including Pavetta Hongkongensis, Pygeum topengii and Xylosma longifolium, were recorded in some of the fung shui forest survey sites (e.g. North Lantau, Yim Tso Ha). Younger or non-native fung shui forests typically have the same ecological value as other lowland forests.
2.11.29 The majority of the fung shui forests surveyed under SUSDEV 21 remains intact or only slightly disturbed by development, and was considered to have a high ecological value. However, there are areas (e.g. Yuen Long Village) where disturbance of the habitats is great (with clearance of the under-storey for uses such as informal recreation) resulting in degradation of habitats quality.
Montane Forest
2.11.30 The montane forest sites surveyed in SUSDEV 21 were found to be intact and free from human disturbance. The habitats, in general, are structurally complex and support high species diversity and abundance. A number of rare protected plant species, including Amentotaxus argotaenie, Machelia maudiae, Illicium angustisepalum, and several species of orchid and Camellia were observed in some of the surveyed patches of Lantau Peak and Sunset Peak. Other rare plant species of Lithocarpus haipuinii, Machilus grijsii, Rhododendron simsii and Rhododendron farreae were also recorded at Ma On Shan. Camellia oleifer was observed in Tai Mo Shan. All the montane forests surveyed were located within designated SSSI areas and ecological value was assessed as high.
Lowland Forest
2.11.31 Most of the lowland forest patches mapped during SUSDEV 21 were relatively intact and confirmed to be of high ecological value, except for a few sites where ecological value was downgraded because of disturbance due to pollution (e.g. rubbish dumping), development (e.g. slope stabilisation) and/or low structural complexity and species abundance of the habitats. Some of the forest patches, such as those at Tai Lam Chung, though small in size (about 0.4 ha), support a closed, highly stratified canopy and dense under-storey vegetation.
2.11.32 Large patches (>3 ha) of well-preserved lowland forest were observed within various Country Park areas (e.g. Pat Sin Leng) or located next to villages (e.g. Wong Chuk Yeung Village). However, a few of the small lowland forests appear to have been disturbed by (regular) clearance of their under-story vegetation. Such clearance of vegetation serves to provide sufficient space for recreational activities (e.g. near picnic areas) or landscape purposes (particularly those established on slopes).
38

Plantations
2.11.33 Although plantations originate as artificial habitats, over time invasions of other species can increase ecological diversity. The ecological value of more recent plantings has been increased through use of mixed plantings and native species and it is reported (Zhuang and Corlett 1997) that efforts to contain hill fires in the last 30 years have resulted in a great expansion of spontaneous secondary forest dominated by Persea spp. such that forest now covers approximately 15,000 ha in Hong Kong of which around 5,000 ha is recognised as plantation.
2.11.34 During SUSDEV 21, some plantation areas surveyed were considered to be of high ecological value (i.e. upgraded from their indicative medium habitats value) because of their apparent old age and the observed structural complexity and species diversity. In contrast, one of the ‘plantation’ habitats at Sau Mau Ping was downgraded in value from medium to low. The adjustment was based on the disturbance imposed on the habitats due to its proximity to a refuse collection point.
Shrubland
2.11.35 Shrubland is a subjective classification that lies between grassland and forest. As such, it represents an intermediate successional stage and can vary widely in habitats structure from a mixture of low shrubs and grasses to tall shrubs approaching the height and structure of secondary forest. SUSDEV 21 classified shrubland as either mixed or Baeckia shrubland. In general, shrubland habitat has a higher potential to support biodiversity than grassland habitats, but a lower potential than most forest types. Those areas, which are covered with more than 50% shrubs as the major woody life form, are considered to be mixed shrubland. If such habitat is dominated by Baeckia frutescens (Myrtaceae), which occurs mainly on dry, coarse substrates, the habitat is considered to be Baeckia shrubland. Although Baeckia shrubland is a natural element of the flora of Hong Kong, SUSDEV 21 reported that it supports lower plant and animal diversity than other mixed shrubland.
Grassland
2.11.36 Hong Kong’s grasslands are highly varied, ranging from low communities with a mixture of herbs and small shrubs, to tall, dense stands of a single grass species. Both flora and fauna change with altitude and fire frequency. True grassland habitats are those where the land is covered by grasses and no visible woody plants. Grassland in which grasses are mixed with woody plants but still dominated by grasses (i.e. over 50% grasses) is referred to as shrubby grassland. Grasses may also be present in mixed or Baeckia shrubland but cover less than 50% of the area. In general, grassland contains few native animal species, and has a low level of structural complexity and thus is expected to support a moderate level of biodiversity.
39

Wetlands
2.11.37 Wetlands are areas which are inundated, seasonally or constantly with water. In SUSDEV 21, wetlands referred to habitats such as ponds, tidal mudflats and marshland where the habitats is typically represented by shallow waters which are dominated by emergent hydrophytes. Wetlands can be categorised into freshwater and brackish types, based on the salinity of the water (if the salinity is less than 10 ppt, the habitats is generally regarded as “freshwater” wetland). Hong Kong wetlands, particularly its freshwater wetlands, support a wide array of plants and animals, including submerged macrophytes (freshwater plants), amphibians, and a range of aquatic insects (e.g. dragonflies and damselflies) (Dudgeon and Chan 1996).
2.11.38 The wetlands identified in the SUSDEV 21 survey were found to exist in the form of marshes, pools or reedbeds. Large patches of wetlands (>10 ha) were observed in South Lantau, Nam Sha Po (Northwest New Territories) and Ting Kok (Northeast New Territories). They are generally remote from urban areas and subject to little or no human disturbance, apart from one of the patches at Ting Kok which was found to have been disturbed by dumping of solid wastes (e.g. plastic containers) and urban development (building of houses near the habitats). Apart from the Ting Kok wetland, many other wetlands generally of much smaller size were also thought to have been disturbed by pollution as evidenced by the highly turbid, dark brown or black-coloured water of the habitats. In many areas the odour of hydrogen sulphide was noted indicating poor water quality with low oxygen content. Impact on wetlands due to urban development has particularly obvious in such survey areas as Kam Tin and Ma On Kong where a number of the wetland patches have been developed or filled for construction purposes.
2.11.39 In-depth surveys have been conducted for 28 freshwater wetland sites identified in an AFCD’s study by Dudgeon and Chan (1996). Examples include the species rich marshes at Yung Shue O, Luk Keng and Sam A Tsuen and the ponds at Cheung Sheung (supporting several rare species) and Lamma Island. Most of the remaining Hong Kong freshwater wetlands are small on a global scale, but nevertheless may have particular local ecological importance. This applies especially if they are used as breeding, feeding or roosting sites where large numbers of a widely distributed species become concentrated during certain periods (Davies and Giesen 1994). Some rare or endemic species (e.g. Romer’s Tree frog Philautus romeri) are confined to small wetlands where predators or potential competitors are absent (Lau 1998).
Inland Watercourses
2.11.40 Two categories of watercourses were defined in SUSDEV 21, based on whether the watercourse was modified. Natural watercourses are rivers and streams experiencing natural flow patterns in unchannelised beds and banks. Modified watercourses include channelised rivers, streams and other water bodies, which are often without natural banks and beds and are not subject to natural flow patterns. Rivers with substantial abstraction of water for irrigation or domestic use are also regarded as modified watercourses. Examples of modified watercourses include drainage channels, nullahs, reservoirs and rivers and streams modified for flood protection or through abstraction. Natural watercourses are likely to support higher levels of biodiversity than modified watercourses although this may vary considerably from case to case.
40

2.11.41 SUSDEV 21’s field surveys indicated that some local freshwater streams, e.g. the upper reaches of the stream near Tsing Tam Village in the New Territories, are rural and support a high fauna species diversity and dense riparian vegetation. Despite despoilation by human, various other Hong Kong streams, e.g. Lam Tsuen River, support a diverse fauna including animals of various habitats from a range of phyla.
2.11.42 The watercourse sections located at Pat Heung, Lam Tsuen and Tai Po Kau in Northeast New Territories and Tai Ho Wan in North Lantau were regarded by SUSDEV 21 to be of high ecological value due to their relatively intact and undisturbed conditions and high biodiversity.
Mangroves, Fishponds and Gei Wais
2.11.43 Mangroves are mostly found in intertidal to high shore areas in the estuarine waters of sheltered bays, and seawards of salt meadows. The local distribution of the mangrove community is governed by the salinity regime and the availability of sheltered, depositing shores (Morton et al 1996). Mangroves have been characterised and mapped recently by Tam and Wong (1997). Apart from the largest mangroves established in Mai Po, much smaller patches of mangrove are scattered in areas such as Three Fathoms Cove and Ting Kok in Tolo Channel. Mangrove habitats are part of the highly productive coastal zone and mangroves are often associated with breeding and nursery grounds for a range of fauna, including commercial fish.
2.11.44 Tam and Wong (2000) have noted that many mangrove resources have been destroyed in recent decades by reclamation and infrastructure development. A large proportion of the original stock of mangrove habitats in Hong Kong has been cleared from areas which were historically featured as the most significant of Hong Kong’s mangrove stands such as in Tin Shui Wai, Tolo Harbour and Deep Bay. In these areas few healthy stands remain. Tam and Wong (1997) reported that only 15% of the original mangrove stands now remain in Deep Bay, and that more than 42% of the original mangroves along the coastline of Tolo Harbour have been destroyed by reclamation and the construction of new highways. In addition, mangroves are often regarded as convenient dumping grounds for construction, domestic, industrial and agricultural waste (Tam and Wong 1997). Most of the mangrove sites were considered to be of high ecological value after field assessment as they support moderate to high species diversity and are subject to little or no human disturbance.
Mai Po Marshes and Inner Deep Bay Ramsar Site
2.11.45 Hong Kong’s Mai Po Marshes has been designated since 1995 as a wetland of international importance under the Convention on Wetlands of International Importance especially as Waterfowl Habitats (the Ramsar Convention). Since both China and the UK are signatories, this Convention applies to Hong Kong, which has therefore an international obligation to protect wetlands of international importance and to promote the wise use in their territory.
2.11.46 The marshes, including the mudflats in Inner Deep Bay, cover an area of about 1,500 ha of wetland in north-western Hong Kong. The stand of mangrove forest at the Deep Bay/Mai Po is the sixth largest remaining one along the coast of PRD and the reedbed is one of the largest in Guangdong Province. In 1979, the Hong Kong Bird Watching Society began the counts on the number of waterbirds wintering in and around the wetlands of Mai Po and Inner Deep Bay. From the
41

first count in 1979, the numbers have increased from 12,830 (January 1979) to 68,000 (January 1997). Since then, the numbers have dropped and have stabilised at around 54,000. This decline is probably due to increasing pollution in Deep Bay, which affects the amount of food (e.g. crabs and mudskippers) available for the birds when they arrive (www.wwf.org.hk/eng/maipo/wildlife/habitatss.html). Mai Po also holds approximately 25% of the world’s population of the black-faced spoonbill.
2.11.47 Ramsar designation for the Mai Po and Inner Deep Bay wetlands provides an opportunity for conserving wetland in Hong Kong as an area where education, recreation, farming and conservation can be integrated for the benefit of the people of Hong Kong.
2.11.48 Fishponds are generally small artificial ponds that have been constructed for the purposes of raising freshwater fish. They are mostly reclaimed from mangrove habitats or converted from shrimp ponds, market gardens or paddies. Gei wais are similar enclosures but contain brackish water and are often flushed through tidal action. Gei wais are either excavated from native mangrove forest or converted from rice paddies. Depending on the management scheme utilised, fishponds and gei wais can provide valuable habitats similar to that provided by natural wetlands. Many of the fishponds surveyed were small in size (<0.5 ha) and abandoned (i.e. not under active management). Actively managed fishponds are generally of medium ecological value, except for those fish rearing fishponds in Ngau Tam Mei (Northwest New Territories) which, due to their concrete nature and lack of natural vegetation, are of low habitats value.
Seagrass Beds and Intertidal Mudflats
2.11.49 Seagrass beds occur in shallow, sheltered intertidal or subtidal areas and are recognised as areas of high biological productivity. As such, they provide high value habitats as feeding and nursery grounds for a range of marine species. Local seagrass beds have a very limited distribution and occupy less than 0.1% of the total land area.
2.11.50 Seagrass beds are dominated by one or more species of specialised marine grasses. Four species of seagrasses, namely Halophila ovata, H. beccarii, Ruppia martima and Zostera japonica have been recorded in Hong Kong (Hodgkiss and Morton, 1978a, b), and all co-occur with mangroves. Halophilia ovata and H. Beccarii are the most abundant amongst the four local seagrasses (Fong, 1998a), but still are restricted to only a few remote and less disturbed localities in Hong Kong (Lee, 1994).
2.11.51 Seagrasses have been documented to be threatened by development (Lee, 1997) and are protected under the Marine Parks Ordinance (Cap 476) under the category of ‘marine grasses’ in designated Marine Parks and Marine Reserves only. Rapid development of the inshore environment and the associated terrestrial catchments, together with impacts to offshore water quality threaten the survival of the Hong Kong seagrasses, and hence the extent of the seagrass bed habitats.
2.11.52 Intertidal mudflats often lie at sheltered heads of harbours or in bays land-locked by the surrounding coasts. They are classified as areas of fine-grained sediment (i.e. silt or fines) which lie between the high and low tide marks and which are not covered by seagrasses, mangroves or typical wetland vegetation. The habitat is generally fed with freshwater streams. Mudflats are known to support a variety of soft-bottomed invertebrates and thus provide valuable feeding habitats for migratory bird populations (Turner and Wong, 1991) as well as other organisms
42

(e.g. horseshoe crabs Limulus polyphemus).
Rocky and Sandy Shores
2.11.53 Rocky and sandy shores comprise most of the natural shoreline in Hong Kong. Rocky shore is defined as areas of stable (non-mobile) rocks larger than cobbles between the high and low tide marks covering more than 50% of the area. Rocky shores vary in degree of wave exposure they receive: some rocky shores, particularly on the eastern coast of Hong Kong, are exposed to the full strength of oceanic waves, e.g. the Ninepins, whereas others are protected, e.g. those within the inlets of Tolo Harbour. The wave energy experienced by these shores, combined with their geology, creates specific habitats. More exposed shores tend to be composed of jagged pinnacles of eroded rock whereas more sheltered areas usually have low-lying, smooth, rock platforms and large boulders.
2.11.54 Species assemblages exhibit characteristic distributional patterns based on the degree of exposure experienced by the shore habitats. Individual rocky shores also display zonation patterns with a progression of different species along the vertical gradient from terrestrial to marine environments. Artificial shoreline may serve a similar habitats function to natural rocky shore if it mimics a natural gradient and provides microhabitats. Boulder seawalls and blocks are known to provide some habitats values (Binnie Consultants Ltd 1996a and 1997a), however, other artificial shorelines (e.g. vertical seawalls) provide little or no habitats value.
2.11.55 All the sites of the outlying islands surveyed during SUSDEV 21, including North Ninepin Island, Basalt Island and Bluff Island, were considered of high conservation interest and high ecological value (upgraded from indicative medium ecological value) was assigned.
2.11.56 Sandy shore is defined as areas of sediments which are coarser than silt, and up to and including cobble-sized rocks, between the high and low tide marks. The ecological value of sandy shore habitats is expected to vary based on the degree of human disturbance. Some sandy shores, and especially sand flats, may support a variety of epibenthis and burrowing organisms and serve as important feeding grounds for many marine birds, whereas beaches that have been developed for recreational use (such as the gazetted swimming beaches) are almost devoid of life (Morton and Morton 1983; Morton et al 1996).
Terrestrial Habitats of Special Concern
2.11.57 In addition to the habitats described above, a number of Hong Kong’s habitats have been identified as being of international, regional and local importance for biodiversity. WWF (1999) has identified high biodiversity areas in Hong Kong such as the Mai Po and Inner Deep Bay Ramsar Site, Special Areas, Marine Parks and Marine Reserves, Restricted Areas, and SSSIs identified by the AFCD for their value on biodiversity.
Marine Baseline
2.11.58 The majority of Hong Kong’s marine habitats comprise soft bottom habitats supporting a mixture of sand and mud. Hard bottom habitats typically exist close to the shore, particularly prevalent on the east coast. Three areas of importance for marine biodiversity have been protected through the designation of Marine Parks at Hoi Ha Wan, Yan Chau Tong, Sha Chau and Lung Kwu Chau. A Marine Reserve has been designated at Cape D’Aguilar. Tung Ping Chau has been designated as the fourth Marine Park from 16th November 2001. This new marine
43

park covers 270 ha of coastal and sea area around Ping Chau in Mirs Bay. The area contains extensive coral communities and rich growth of seaweed. The fringing coral formation, measuring 1.8 sq. km., is one of the largest in Hong Kong. It supports about 124 species of reef fish. The sedimentary rock formation and geological features along the coastline are also of high scientific and educational value.
Marine Habitats
2.11.59 Marine habitats and biota have not yet been subject to a coordinated inventory study in Hong Kong. Information for this baseline comes from a variety of sources including academic, government and consultancy reports as well as our own data and observations.
2.11.60 According to superficial geophysical maps, Hong Kong’s seabed is primarily composed of marine mud with some sand. In coastal areas, hard substrate usually extends a short distance from the shore and most of this is in shallow water. Other important physical parameters that define marine habitats types are the composition of the hard coastal substrate, exposure to onshore winds and waves and the salinity tolerance regime set by the westerly Pearl River. Hard substrate tends to be either granitic slab or boulders of varying sizes, dominant windward shores tend to be orientated to receive weather from the east to south direction and the Pearl River has a marked influence on westerly waters and this diminishes as one moves to the clearer eastern waters.
Soft Habitats
2.11.61 Shin and Thompson (1982) provided a comprehensive analysis of the soft bottom habitats in Hong Kong (one year of sampling, more than 200 stations surveyed). They identified several different groups of invertebrate habitats-species complexes that were driven primarily by physical gradients (Pearl River discharge and tidally scoured channels). These data are being updated by AFCD’s study (i.e. Consultancy Study on Marine Benthic Communities in Hong Kong) that is resampling Hong Kong’s Benthos. While changes are likely to occur due to human impacts (e.g. Milicich and Co. are reviewing changes to the benthos caused by historic dumping of mud at Cheung Chau as part of the Study on the Long-term Arrangements to Accommodate Inert Construction and Demolition Materials and Dredged Mud; also refer to Seabed Ecology Studies for CED), the influences of substrate and river discharge still likely dominate benthos baseline patterns. Ascribing value to these habitats-species complexes is difficult, however, in general areas dominated by pioneering polychate groups such as the capitellids are generally valued as less significant.
2.11.62 Some very significant data on soft bottom fish communities comes from the Fisheries Resources Consultancy Study (1998). This was a one-year survey that concentrated on commercially important fauna. Based on fishermen’s reported catches, it appears that the clupeids (herrings, shads, and sardines), carangids (scads), sciaenids (croakers and drums) and siganids (rabbitfish) are the dominant groups in Hong Kong. A set of trawl, gill net and purse seine surveys undertaken in the same study identified several general areas of habitats as significant to either spawning or nursery functions for a range of fauna (Figure 2.11).
44

Hard Habitats
2.11.63 Hard substrate habitats have been less comprehensively surveyed. The Coastal Ecology Studies of 1994-97 provide one of the better snapshots of subtidal habitats in Hong Kong. These and other studies such as those completed for individual EIA and EM&A assessments (e.g. Lamma Channel Surveys for Penny’s Bay Reclamation, Po Toi Monitoring for Pennys Bay Reclamation), academic studies (McCory PhD thesis, unpub., various publications in journals such as Asian Marine Biology) and government studies (e.g. Marine Park feasibility assessments and monitoring) have generally found that the western and central waters support a less diverse fauna and flora than the less turbid and less polluted eastern waters. Exceptions to this generalisation include relatively coral rich areas such as Sham Wan and Tung O Wan at Lamma Island and areas such as Tseung Kwan O that support good soft coral communities.
Marine Biota
2.11.64 Significant marine biota that should also be included in this baseline assessment include Chinese White Dolphin, Finless Porpoise Neophocaena phocaenoides, Green Turtle Chelonia mydas, Horseshoe Crabs, hard and soft corals and gorgonian communities.
Chinese White Dolphin
2.11.65 The most comprehensive baseline data on the Chinese White Dolphin comes from the “Multi-Disciplinary Research Program on the Indo-Pacific Hump-Backed Dolphin Population” sponsored by AFCD (Jefferson 1998), and studies undertaken by the Swire Institute of Marine Science and the University of Hong Kong (Parsons et al 1995; Porter et al 1997) commissioned by AFCD.
2.11.66 The local (Guangdong) population of Sousa Chinensis is reported to be centred around the Pearl River Estuary and Hong Kong waters represent the eastern portion of its range. The population in Hong Kong waters varies seasonally from about 92 individuals in winter to about 163 individuals in autumn. It is speculated that heavy Pearl River flow during the summer might contribute to the higher numbers of dolphins dispersing into typically oceanic waters in Hong Kong (Jefferson 1998).
2.11.67 This species feeds mainly on fish (Jefferson 1998a, Parsons 1997) and has often been recorded feeding behind pair and shrimp trawlers. When feeding was not associated with trawlers, it was usually close to shore or near rock outcrops.
Finless Porpoise
2.11.68 The Ocean Park Conservation Foundation (OPCF) was commissioned by AFCD to study the Conservation Biology of the Finless Porpoise in Hong Kong Waters. Surveys were conducted between September 1995 and November 2000 and the final report was issued in January 2001. The surveys found that porpoises occurred in Hong Kong and adjacent waters year round but there was evidence of seasonal movements, with porpoises largely vacating Hong Kong’s south-western waters in summer and autumn. The peak season for Hong Kong is spring and it was estimated that some 152 porpoises inhabit territorial waters. Low season appears to be autumn when an estimated 55 porpoises were present. The report does however caution that these data are to be viewed as preliminary only.
2.11.69 In winter, the majority of porpoises were found in central and western parts of the
45

Porpoise’s range such as South Lantau, East Lantau and Lamma where abundance remained high into the spring (when numbers peaked). The report records a dramatic decrease in porpoise abundance in South Lantau and Lamma waters in the summer and a decline in all areas in autumn (low season). OPCF’s data indicates that they favour waters off the south-western coast of Lamma. The OPCF report concluded that southern Lamma is critical habitats and should be designated as a marine park due to its importance for the Porpoise.
2.11.70 In terms of the prey base of the Finless Porpoise, OPCF found that Porpoises in Hong Kong waters prey upon at least 25 species of fish, six species of cephalopod and one shrimp. Prey is generally inshore bottom dwelling and mid water species. They feed at different levels of the water column and feed over reefs and sandy substrates. Generally the Finless Porpoise exploits more open habitats than the Chinese White Dolphin does for food.
Green Turtle
2.11.71 The Green Turtle (Chelonia mydas) is the only one out of the three species of sea turtles found in Hong Kong waters that are known to breed locally. The sandy beach at Sham Wan on Lamma Island is the only documented nesting site for the Green Turtle (Morton & Ruxton, 1992). AFCD has begun releasing young turtles onto this beach in an effort to aid conservation of the species (80 green turtles were released in September 2001).
Horseshoe Crabs
2.11.72 Of the four species of Horseshoe Crab currently existing in the world, two species, Tachypleus tridentatus and Carcinoscorpius rotundicauda, have been recorded from Hong Kong waters in recent years. These animals have been studied over a three-year period (1995-1998) by Chiu and Morton (1999) under commission by China Light and Power Company Ltd. The study relied on observations collected from various sources and was not a systematic sampling survey. Results must therefore be treated tentatively. Patterns indicate that the horseshoe crab is more numerous in western waters and these species are thought to be associated with the estuarine hydrography caused by the Pearl River. The report suggests that numbers have declined alarmingly over the past ten years and existing individuals are under the threat of local extinction.
2.11.73 Pak Nai, San Tau and Shui Hau have been identified as nursery beaches for T.tridentatus while Pak Nai is the only confirmed nursery site for C.rotundicauda. While the former species appears to mate year round, the latter appears to have a much shorter mating season between April and August (Chiu and Morton, 1999). The site identified of greatest importance due to its use by these two species is Pak Nai on the coast of the North-western New Territories.
Hard and Soft Corals and Gorgonians
2.11.74 Hong Kong is at the northern edge of the range for growth of coral reefs and as such, there are no true coral reefs in Hong Kong. Instead, corals survive as either isolated colonies attached primarily to bedrock boulders and slabs or as more consolidated areas of fringing reef. Fauna is dominated by encrusting and massive faviid and poritid species. Depth distribution for hard corals is generally limited to -1m to -3m due to the high ambient turbidity levels. Most successful hard coral growth occurs in eastern waters where light and nutrient conditions are more favourable. Western and central waters tend to be less valuable for corals and are dominated by scattered colonies dominated mostly by encrusting faviids.
46

Exceptions exist at Sham Wan on Lamma Island which is an area of considerable fringing reef growth. Approximately 51 species of hard coral are recognised in Hong Kong, although recent observations (McCorry and Veron – pers comm) suggest that this list will undergo a major revision. Soft coral communities in Hong Kong are dominated by Dendronepthya species. These corals are found in considerably deeper water than their stony counterparts as they are less reliant on light. They are also more robust to sedimentation impacts as they are able to actively remove sediment from their surfaces.
2.11.75 Approximately 26 species of gorgonian from 15 genera are recognised as occurring in Hong Kong waters. These organisms tend to prevail in the less variable saline waters of the east where they require hard substrate for attachment. Gorgonians are often found in 20-25m of water. Black corals are also primarily found in eastern waters (e.g. Tung Ping Chau Marine Park) at a depth range of 10-20m.
Information Gaps
2.11.76 The assessment does not provide specific details of the health of the ecological resource which is generally due to the lack of data. There is still a lot to be learnt about the ecology of Hong Kong. Further studies are required to provide a baseline species list. Regular monitoring, similar to the bird monitoring conducted at Mai Po, would provide a clear indication on the ongoing health of the ecological resource, and would be a visible sign of any problems. It would also provide valuable baseline data for future development proposals.
2.11.77 While there are various local conservation bodies and wildlife groups, such as WWF Hong Kong, Conservancy Association, Friends of the Earth, Green Lantau Association, Green Power, Hong Kong Bird Watching Society, there is not a single body representing public opinion but rather varied opinion from different interest groups. Similar to the conservation bodies in other countries, these groups collect data/information, for example the Hong Kong Bird Watching Society holds detailed records of the avifauna of Hong Kong.
2.12 Cultural Heritage Conditions
2.12.1 The cultural heritage of Hong Kong is defined and preserved under the Antiquities and Monuments Ordinance of 1971 (Cap. 53). It defines a monument as a “place, building, site or structure which is declared to be a monument, historical building or archaeological or palaeontological site or structure under section 3, and further defines a relic as (a) a movable object made, shaped, painted, carved, inscribed or otherwise created, manufactured, produced or modified by human agency before the year 1800, whether or not it has been modified, added to or restored after the year 1799; and (b) fossil remains or impressions”.
2.12.2 The Ordinance provides for full protection of identified antiquities and monuments by declaration and gazettal. As at 14.12.2001, there were 75 such declared monuments throughout the territory, comprising primarily historical buildings, with a number of rock carvings and two archaeological sites. In the case of some privately owned buildings of heritage significance, arrangements will be made not to declare but to deem them as monuments with equal legal protection.
2.12.3 Grading is an administrative process and provides no legal protection; it does, however, inform other government departments of the heritage value of the
47

resources and the desire of the Antiquities Authority to see them preserved. This enables the planning process to take preservation into consideration when reviewing re-zoning requests and development proposals. The Antiquities Advisory Board undertakes the grading of buildings and structures and to date has identified over 500 graded buildings and structures, with each grade indicated as follows:
Grade 1 buildings of outstanding merit, which every effort should be made to preserve
Grade 2 buildings of special merit; efforts should be made to selectively preserve
Grade 3 buildings of some merits; to be recorded and be used as a resource for future selection of possible monuments
2.12.4 The 1997-1998 historical buildings and structures survey undertaken by the AMO has identified several thousand items of heritage interest, including shrines, temples, domestic buildings, shop houses and industrial structures.
2.12.5 The bulk of the remaining identified buildings and structures are recorded in AMO files, and are not afforded legal protection.
2.12.6 The Territory-wide Archaeological Survey carried out in 1997-8 identified several hundred archaeological sites in Hong Kong. This represents a large and valuable record of the occupation of the area for over 6000 years, from the prehistoric period through the Qing Dynasty. With the exception of 3 archaeological sites which have been declared, all archaeological sites are recorded in AMO files and are without legal protection.
2.12.7 The policy for heritage conservation is currently under government review. There is presently no clear definition on targets for cultural heritage preservation. The current standard for heritage preservation can be found under the Environmental Impact Assessment Ordinance, in particular under Technical Memorandum – Annex 10 Criteria for evaluating visual and landscape impacts, and Impact on Sites of cultural heritage; and Annex 19 Guidelines for assessment of impact on sites of cultural heritage and other impacts. A presumption for preservation of all sites of cultural heritage in-situ shall be assumed, with total destruction taken as the very last resort.
2.12.8 On the other hand, the Culture and Heritage Commission was established in April 2000 for advising the Government on the policies as well as funding priorities on culture and arts. The key responsibility of the Commission is to formulate a set of principles and strategies to promote the long-term development of culture (including heritage) in Hong Kong. The Urban Renewal Authority has also been charged with, amongst other functions, preservation of historic buildings during redevelopment.
48

2.13 Conclusions and Recommendations
2.13.1 From the baseline review, it is possible to determine the range of environmental issues which will need to be addressed, and for which targets will need to be developed to manage potential adverse environmental impacts. The following concludes the findings of the baseline survey, and highlights environmental problems.
Noise
2.13.2 The key noise sources in Hong Kong are predominantly from transportation and construction and this is significant due to the scarcity of usable land leading to the noise sources being located in close proximity to the noise sensitive receptors.
2.13.3 Noise reduction programs have been started since the 80’s and are still in progress to control, maintain and constantly improve the noise environment. They implement the existing statutory noise control requirements according to the NCO and guidelines as stipulated in HKPSG.
Air Quality
2.13.4 The air quality of Hong Kong is considered to be an issue of concern. The air pollutants have generally been classified into two categories. The first category is Criteria Air Pollutants (CAPs) for which Air Quality Objectives (AQOs) have been established. These include sulphur dioxide, nitrogen dioxide, carbon monoxide, ozone, lead and total suspended particulates (TSP), and respirable suspended particulates (RSP). The second category is Toxic Air Pollutants (TAPs) which include known carcinogens.
2.13.5 The data analysed showed increasing annual average ambient concentrations for NO2 with decreasing SO2 levels in urban and new town stations. Ambient levels of particulates have remained consistently high over the last 10 years and remain close to their respective AQO limits, and annual average ozone concentrations have risen slightly, raising concerns in particular over the formation of photochemical smog. Among the various TAPs (including heavy metals and organic substances) monitored in between 1997 and 2000, the concentration levels of TAPs in Hong Kong are comparable to those observed in other major cities such as Los Angeles and San Francisco (refer to Table 2.15 below). Greenhouse gas emissions are anticipated to increase over the next decade as a result of increasing energy consumption and transport demand.
49
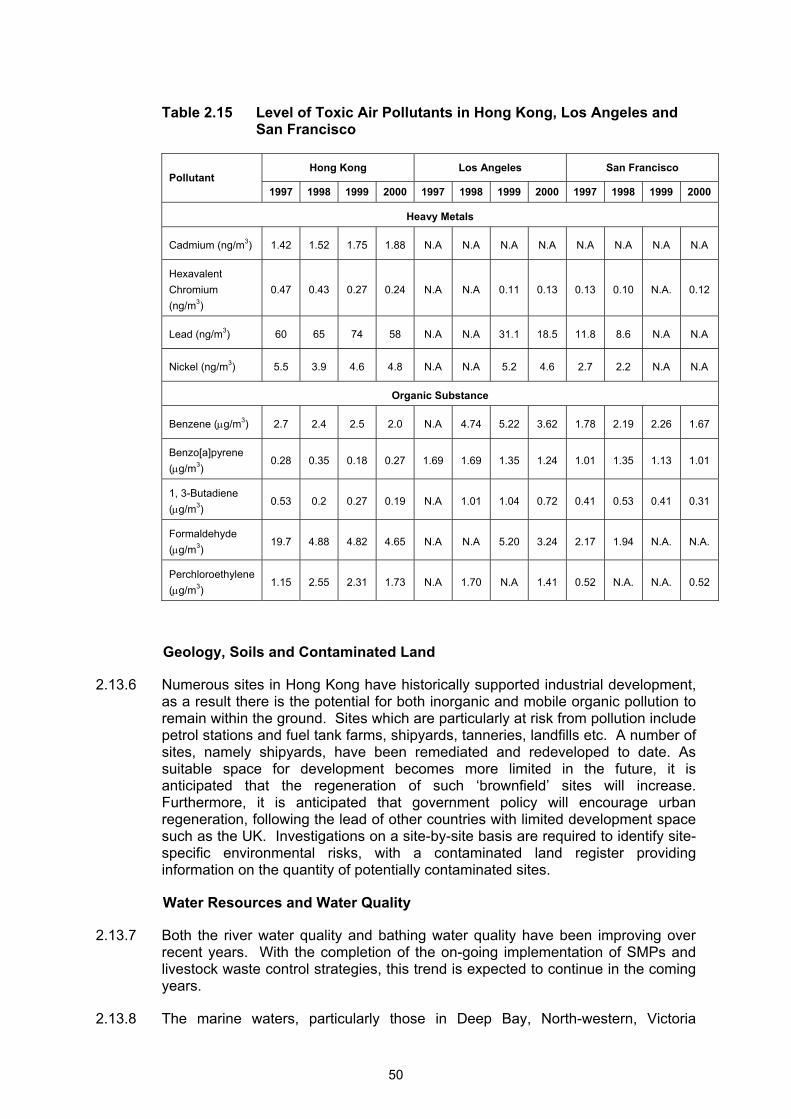
Table 2.15 Level of Toxic Air Pollutants in Hong Kong, Los Angeles and San Francisco
Hong Kong Los Angeles San Francisco Pollutant
1997 1998 1999 2000 1997 1998 1999 2000 1997 1998 1999 2000
Heavy Metals
Cadmium (ng/m3) 1.42 1.52 1.75 1.88 N.A N.A N.A N.A N.A N.A N.A N.A
Hexavalent Chromium (ng/m3)
0.47 0.43 0.27 0.24 N.A N.A 0.11 0.13 0.13 0.10 N.A. 0.12
Lead (ng/m3) 60 65 74 58 N.A N.A 31.1 18.5 11.8 8.6 N.A N.A
Nickel (ng/m3) 5.5 3.9 4.6 4.8 N.A N.A 5.2 4.6 2.7 2.2 N.A N.A
Organic Substance
Benzene (µg/m3) 2.7 2.4 2.5 2.0 N.A 4.74 5.22 3.62 1.78 2.19 2.26 1.67
Benzo[a]pyrene (µg/m3)
0.28 0.35 0.18 0.27 1.69 1.69 1.35 1.24 1.01 1.35 1.13 1.01
1, 3-Butadiene (µg/m3)
0.53 0.2 0.27 0.19 N.A 1.01 1.04 0.72 0.41 0.53 0.41 0.31
Formaldehyde (µg/m3)
19.7 4.88 4.82 4.65 N.A N.A 5.20 3.24 2.17 1.94 N.A. N.A.
Perchloroethylene (µg/m3)
1.15 2.55 2.31 1.73 N.A 1.70 N.A 1.41 0.52 N.A. N.A. 0.52
Geology, Soils and Contaminated Land
2.13.6 Numerous sites in Hong Kong have historically supported industrial development, as a result there is the potential for both inorganic and mobile organic pollution to remain within the ground. Sites which are particularly at risk from pollution include petrol stations and fuel tank farms, shipyards, tanneries, landfills etc. A number of sites, namely shipyards, have been remediated and redeveloped to date. As suitable space for development becomes more limited in the future, it is anticipated that the regeneration of such ‘brownfield’ sites will increase. Furthermore, it is anticipated that government policy will encourage urban regeneration, following the lead of other countries with limited development space such as the UK. Investigations on a site-by-site basis are required to identify site-specific environmental risks, with a contaminated land register providing information on the quantity of potentially contaminated sites.
Water Resources and Water Quality
2.13.7 Both the river water quality and bathing water quality have been improving over recent years. With the completion of the on-going implementation of SMPs and livestock waste control strategies, this trend is expected to continue in the coming years.
2.13.8 The marine waters, particularly those in Deep Bay, North-western, Victoria
50

Harbour and Tolo Harbour and Channels WCZs, are still suffering from pollution strains. This is reflected in the increasing nutrient levels, bacterial levels, decreasing DO levels and frequent occurrence of red tides.
2.13.9 The majority of Hong Kong’s freshwater supply is imported from Dongjiang in the Guangdong Province. The growth rate in freshwater consumption is decreasing primarily due to relocation of many industries outside HKSAR. There have been no significant pollution problems in local freshwater resources in the recent years.
Waste
2.13.10 Some predictions show that the three existing strategic landfill sites, i.e. WENT, SENT and NENT, will be full as early as 2008-2011, and it will take as long as 10 years to develop and build new landfills. Immediate action is required to reduce waste loads to prolong the life of these landfills. Household and municipal waste loads have risen steadily in line with the growth in population and wealth of the community. Construction and demolition materials exert a great strain on the landfills, short-term solutions associated with diversion of this inert material have had immediate impacts, however opportunities for re-use, recycling of this material are required. Due to the pressure on the landfill, the Government is considering landfill charges to encourage waste reduction.
Energy and Natural Resources
2.13.11 Although there has been a reduction in commercial energy consumption in recent years as a result of relocation of industries to the Mainland, there has been a gradual increase in Hong Kong’s energy requirement over the last decade. Hong Kong’s main fuel source for electricity generation is fossil fuels, which are all imported. There are numerous opportunities for the integration of renewable energy technologies into the urban environment. More recently there have been efforts to increase the use of renewable energy, to promote the use of water-cooled air conditioning systems, and to use the energy more efficiently through encouragement of green building design and energy conservation measures.
Landscape
2.13.12 The majority of Hong Kong residents live in urban environments with little or no greenspace. The landscape conservation and planning quality of Hong Kong’s non-designated rural and urban landscapes is considered to be low in comparison to other Asian and Mainland cities. These landscapes are important for providing leisure and recreational opportunities as well as for ecological conservation and visual enhancement. Hong Kong has inherited this urban environment as a result of years of infrastructure development which has eroded the natural landscapes, and insufficient provision of open space as the design of urban landscapes is overwhelmingly driven by the need for minimal initial cost and maintenance liability, and historically landscape and visual issues have been given a low priority in planning and public works.
Risk
2.13.13 There are currently 33 PHIs present within HKSAR, however in future new sites could be added to the register. These sites are used for the storage of potentially hazardous materials above a certain threshold quantity. The location of these PHIs and the associated consultation zones can pose constraints in terms of future planning.
51

Ecology
2.13.14 Hong Kong supports a surprisingly high biological diversity for its land area, with 2135 species of native and naturalized vascular plants recorded during a recent survey. The sites which support the greatest diversity cover about 10% of the total land area, whereas the richest patches are those small patches of montane forest above 400-500m which have been protected by their remoteness, dampness and inaccessibility. Terrestrial habitats are protected through a series of designations, which include Country Parks and Special Areas. There are currently 23 Country Parks and 15 Special Areas which cover 38% of the total land area. Sites of particular ecological importance and other special scientific interests, e.g. geological, can be designated as SSSI of which there are 64 within the territory.
2.13.15 Marine Parks and Marine Reserves are protected and managed by AFCD, and many of these designated sites are not only considered to be of local and regional importance, but also international importance with respect to biodiversity.
2.13.16 The increasing human population and associated pollution has exerted increasing pressure on the ecological resources. However, the rugged topography and statutory protection of terrestrial areas has reduced the impacts and limited encroachment into the more sensitive areas. Marine habitats and biota have yet to be fully covered by any coordinated inventory study in Hong Kong. However, the data available identifies that there is a range of hard and soft marine habitats, and biota frequenting these waters include Chinese white dolphins, finless porpoise, green turtle and horseshoe crabs.
2.13.17 Marine and coastal habitats are particularly vulnerable to developments and have suffered considerably from pollution as a result of increasing human disturbance, previous industrial and ongoing sewage discharges (areas that are particularly sensitive are the seagrass beds). Mangroves have also been cleared for reclamation and for coastal developments. Despite this, the remaining mangrove and wetland areas provide important habitats for wildlife, in particular the Mai Po marshes and the Inner Deep Bay (an internationally important wetland designated as a Ramsar site) which supports thousands of wintering waterbirds.
2.13.18 Awareness among local residents of the natural environment and its value is a key to conservation in the future. Management of this resource is required to maintain its biodiversity, and restrictions on emissions to the air and water body are required to prevent any further damage to the ecological resource. Monitoring is required to provide a species list from which changes over time, including the impacts of human induced global warming, can be better observed.
2.13.19 Monitoring would also provide information which could be usefully applied in the future, for example, providing experience of restoration of mangrove habitats.
Cultural Heritage
2.13.20 As at December 2001, there were 75 declared monuments that are protected under the Antiquities and Monuments Ordinance. For some privately owned buildings of heritage significance, arrangements are made not to declare but to deem them as monuments with equal legal protection.
52

2.13.21 In addition to the declared and deemed monuments, there are 551 graded historical buildings or structures which are classified into Grade I, II or III to indicate their relative importance, as well as a further 235 Sites of Specific Archaeological Interest (SSAI). 1 However, only declared monuments are afforded legal protection from damage or destruction.
53

3 Environmental Capital Stock and Carrying Capacity
3.1 Environmental Capital Value
3.1.1 The capital value of an asset is the present value of the stream of services it generates over its lifetime. The stock of this capital can be used in a sustainable or unsustainable manner.
3.1.2 This section focuses on natural capital, or the stock of natural assets that yields a flow of valuable goods and services into the future. The natural stock is particularly important since it provides both a resource input (or ‘source’) functions and waste assimilation (or ‘sink’) function. There are eight discreet elements of natural stock (SUSDEV 21), as follows:
Primary Components
• Natural resources – harvestable products or useable assets derived from naturally occurring or human managed environmental features (e.g. land supply, capture and culture fisheries, crops and livestock, potable water, flushing water)
• Ecological resources – defined species, flora/faunal groups, or habitats which act or are likely to act as key structuring components of the ecosystem (e.g. mangrove stands, natural woodland, seagrass bed, egretries, corals)
• Heritage resources – defined as those sites which contain historical, cultural or religious features (e.g. fung shui woodland, temples, historic buildings)
• Assimilation capacity – defined as environmental self-purification or equilibration processes (e.g. absorption and degradation of contamination in soils/sediments, air/water, landfill capacity, biological breakdown of contaminants) as well as man-made environmental infrastructure that reduce or modify pollutant loadings to the environment (e.g. sewage treatment works, landfills, incinerators)
Secondary Components
• Scientific values – environmental features which are being researched or are regarded as potential subjects for research (e.g. areas of biodiversity, geological SSSIs)
• Existence values – environmental or natural resource features which are appreciated by society irrespective of any other natural capital stock functions they may offer (e.g. dolphins, corals, Victoria Harbour)
• Landscape values – defined as those environmental features which provide scenic or aesthetic values (e.g. vegetated areas, islands, natural coastline, peaks)
• Recreational values – those sites which serve as amenity areas for human beings (e.g. beaches, trails and walkways, picnic/barbecue sites)
(Source: SUSDEV 21)
54

3.1.3 The areas identified in previous sections, e.g. noise, air quality, cultural heritage, geology, water, waste, ecology and natural resources, may belong to more than one of the above categories. For ease of reference, however, the same divisions are maintained throughout the following section.
Noise
3.1.4 The environmental capital value in terms of noise can be defined as the acceptable noise environment provided to noise sensitive receivers through the implementation of legislative control, HKPSG and improvement programmes.
3.1.5 The Noise Control Ordinance stipulates stringent noise limits for construction works carried out during restricted hours, especially in Designated Areas. As such the noise sensitive receivers are protected from the noise impacts due to construction activities in their vicinity.
3.1.6 Since 1987, 11 km of highways have been resurfaced, benefiting about 16,000 dwellings being protected from the road traffic noise impacts. Noise barriers and enclosures are common noise control measures for both mobile and fixed noise sources. For instance, the roadside barrier erected along the West Kowloon Expressway protects over 100,000 residents.
3.1.7 Urban planning plays a vital part in noise control. The zoning of areas can avoid the interface problems between industrial operations and noise sensitive receivers. Through the relocation of industrial operations to less populated areas, the residents in the vicinity of the original site can be benefited, for example, the relocation of the shipyard at North Tsing Yi benefits 10,000 residents.
Air Quality
3.1.8 The environmental capital value of air quality can be defined as the acceptable environment in terms of providing air which we breathe of good quality, and minimising the risks from potentially harmful pollutants and release of potentially climate changing gases in the air. Air quality will also include the ability to observe landscapes, without the view being inhibited by dense photochemical smog or smoke. Key indicators of air quality are provided by the Air Quality Objectives.
3.1.9 There are significant concerns about the quality of air over Hong Kong, which is generated by both stationary (such as construction sites and industry) and mobile sources. The mobile sources, which are predominantly exhaust emissions from diesel-fuelled vehicles, are being tackled by the Government. Government initiatives include for example a programme which aims to replace diesel vehicles with practicable alternatives and to impose the most stringent fuel and emission standards on the others. Additional mitigation measures include retrofitting older franchised buses with catalysts and rationalizing to help reduce pollution in blackspot areas. Under the Third Comprehensive Transport Study (CTS-3) and the Second Railway Development Study (RDS-2), new approaches to transport planning would be developed to promote more environmentally efficient transport systems. Besides, energy policy would be developed to control over emissions from power generation. Programmes to reduce emission from all sectors of Hong Kong industry and commerce (e.g. construction) would be extended. China is a signatory to the Kyoto Protocol and will be taking part in global effort to control the release of greenhouse gases in the future. The PRD study’s recommendations on new emission control strategies are currently under consideration which include the use of cleaner fuel for power generation, the control on VOC emissions from
55

printing and service station refuelling processes, the continuous expansion of environmentally friendly measures on transport strategic plan, etc.
3.1.10 Previous air pollution issues associated with sulphur dioxide releases and acid rain were successfully resolved, almost overnight, through the implementation of policies to ensure manufacturers transfer to low sulphur fuels and remove quantities of sulphur prior to release to the atmosphere.
Geology, Soils and Contaminated Land
3.1.11 One of the capital values of geology and soils, in addition to their function in providing aggregates for construction (which is addressed in the natural resources section), is their assimilation capacity in terms of ability to (with reference to biodegradable organic pollution in particular) degrade contamination, through the action of weathering and microbial breakdown. If managed effectively, the energy produced from this degradation in the form of landfill gas, could become a useful and sustainable energy source.
Water Resources
3.1.12 This is described in the Baseline Review.
Waste
3.1.13 Construction and demolition materials which are non-inert are disposed of at landfill along with MSW and other wastes. In order to address the depletion of landfills, inert C&D material should be used on reclamation projects, wherever possible. Landfill space of the three operational landfill sites are becoming extremely restricted and under present conditions, some predictions show that these three landfills will be full as early as 2008-2011. In an effort to prolong the landfill life, waste reduction initiatives under the Waste Reduction Framework Plan are being implemented, in an attempt to reduce the volume of MSW going to landfill.
3.1.14 In future it will be necessary to consider alternative waste treatment technologies. Wherever possible, these should include encouraging re-use and recovery in the waste stream, which will require new infrastructure for collection of recyclable waste, and for source separation and material recovery.
Natural Resources
3.1.15 Quarry production of aggregates from four sites in Hong Kong is around 17 million tonnes per annum (1996). And significant quantities of marine aggregates are also extracted from the seabed in Hong Kong waters (SUSDEV 21). Future land based mining has been effectively prevented due to the development pressure and competing land uses. Therefore the existing aggregate capital stock for Hong Kong is reducing whilst pressure for raw materials for development will continue.
3.1.16 Energy production in Hong Kong comes primarily from unsustainable fossil fuel sources which need to be imported. Energy requirements have also increased in the last decade, and are likely to increase further in the future. Without the use of renewable energy or significant energy minimisation measures, this will lead to an increase in the demand on primary energy (natural resources) with an associated increase in the release of greenhouse gases.
3.1.17 In terms of water resources, about 70% of all drinking water consumed in Hong
56

Kong comes from Guangdong, with the remaining 30% comes from the reservoirs within Hong Kong. While Hong Kong may have capacity to use water held within its reservoirs, freshwater resources within the Guangdong Province are under increasing pressure from pollution as a result of population increases and industrial development.
Landuse - Agriculture and Fisheries
3.1.18 Between 1954 and 2000, the area of cultivated land in Hong Kong has declined by more than 50% (HK2030 SGM Information Note 16/2001). There remain less than 3,000 ha of agricultural lands and fishponds in productive use. Nearly half of this is freshwater ponds, and one third for market gardening. Local marine fisheries are also in decline, catches landed have reduced by over 40% since 1976, with catches showing a decline in commercially valuable demersal inshore fish species.
3.1.19 Only 7% of fresh vegetables and 6% of freshwater fishes were produced locally in 2000 (HK2030 SGM Information Note 16/2001).
3.1.20 Hong Kong is dependent upon imports of agricultural products and fish. Hong Kong’s large demand for live marine fish is also thought to be perpetuating the use of destructive fishing techniques in countries which catch and supply these fish (SUSDEV 21). In recent years, over fishing and coastal developments have resulted in a drastic decline in fisheries resources in Hong Kong waters. According to the baseline data of SUSDEV 21 Study, quantities landed in Hong Kong had declined from a peak of just over 90,000 tonnes in 1976 to just over 50,000 tonnes in 1996.
3.1.21 In order to enhance fisheries and promote biodiversity in Hong Kong’s marine environment, AFCD has been implementing the artificial reef programme since 1996. The four existing artificial reef deployment sites are located at Hoi Ha Wan, Yan Chau Tong, Sha Chau and Chek Lap Kok. The effectiveness of the artificial reefs is encouraging that biodiversity and abundance of commercial fishes found around the artificial reefs is higher than those observed in nearby natural rocky shore areas. In 2002, the fishing industry in Hong Kong produced an estimated 169,790 tonnes of fresh marine fish, with about 90% of the total catch coming from waters outside Hong Kong.
3.1.22 Increasing production in farming would increase the area’s self sufficiency, providing an increased area for birds, open space aesthetic value, and may offer some benefit to non-commercial species through increased habitats size. In addition, it could provide angling and diving opportunities. However, agriculture and fisheries produce unwanted by-products including pesticide residues, nutrient enrichment and seabed disturbance from trawling.
Landscape
3.1.23 The environmental capital value in terms of landscape can be defined as the acceptable use and exploitation of the physical, cultural/historic and aesthetic properties of natural, conserved or designed environments for the support of the mental and physical well-being of the individual and the community as a whole; and the support of the protection and conservation of landscape diversity and value.
57

Ecology
3.1.24 Ecological resources are defined as species, communities or habitats which act, or are likely to act, as key structuring components of the ecosystem. Ecological resources form a critical component of the natural capital stock by providing, or potentially providing, food and fibre, genetic resources (natural products with medicinal or chemical properties, whose genetic structure can be used as the basis for valuable medicines), biological assimilative capacity (e.g. natural filtration, bioremediation and sequestration) and ecological insurance against catastrophic change. Ecological resources also have a major role in supporting the scientific, existence, landscape and recreational values of Hong Kong’s natural capital stock (SUSDEV 21).
3.1.25 Hong Kong has extensive undeveloped tracts of natural landscapes which contain diverse habitats supporting numerous native plant species and a varied wildlife, both resident and migratory. Areas of nature conservation are designated as Country Parks and Special Areas under the Country Parks Ordinance and managed by AFCD on the advice of the Country and Marine Parks Board. At present, there are 23 Country Parks, 15 Special Areas (11 of which lie within Country Parks) in Hong Kong, with a total area of 41,582 ha, amounting to around 38% of the total land area of Hong Kong.
3.1.26 The environmental capital value in terms of ecology can be defined as the acceptable harvesting/use or exploitation that can be tolerated without adversely impacting on the species richness and value. Continuing to protect and manage these areas, as well as preventing excessive disturbance, pollution or human encroachment are required to ensure that the resource and its carrying capacity are maintained.
Cultural Heritage
3.1.27 Heritage functions are defined as those sites which contain archaeological, historical or religious value although the source of heritage functions is essentially anthropogenic, the resource may be treated in the context of natural capital stock due to the significant link between heritage and natural capital stock. Heritage capital stock also serves a function in terms of existence, recreational and landscape values. According to AMO’s information,2 there are 75 declared monuments, 5 deemed monuments, 551 graded historic buildings and structures, and a further 235 archaeological sites, along with several thousand buildings and structures identified during the 1997-1998 historic building and structure survey.
3.1.28 Despite the massive scale of development in Hong Kong, there are still many other examples of historic interest, such as temples, villages, ancestral halls, shop houses, western style buildings, historic quarry sites, former military sites and traditional cultural activities and their locations. The resource is also set to increase as more discoveries are made, particularly in the area of archaeological research. The total extent of heritage resource has been more or less defined by the archaeological survey and historic building and structure survey undertaken in 1997-1998, though there may be limited scope for expansion. Further research is however required in order to adequately quantify the significance of the current environmental baseline.
3.1.29 Urban regeneration and development schemes have not been sensitive to the cultural and aesthetic benefits that could be afforded through restoration and preservation of historic buildings and other monuments. The current stock of
58

historic buildings is a shrinking resource in urban areas and proposal for future renewal in long established areas such as Wan Chai and many parts of Kowloon should take account of the few remaining historical features. Similarly, development pressures in rural and country areas pose a significant threat to the integrity of archaeological resources and their aesthetic value, whilst reclamation projects continue to sterilise areas which have high potential archaeological value.
3.2 Pressure Generated from the Future Developments
Noise
3.2.1 With the increasing business and social correlations between the Mainland and Hong Kong, and China’s entry into the World Trade Organisation (WTO), the cross-boundary transportation will be under pressure. The increased demand will require additional transport facilities which are a likely noise pollution source.
3.2.2 In order to accommodate the increasing population, redevelopment of previously developed urban areas can make use of the land more efficiently. The Urban Renewal Authority will have to deal with over 200 projects in the coming 20 years. However, there will be construction noise problems during the redevelopment period. The construction activities may cause nuisance to the surrounding land users. Moreover, during the transition period, interface problems between industrial and residential developments will potentially be a noise issue. The operation of factories may create noise impacts on new residential developments.
Air Quality
3.2.3 As the population of Hong Kong increases, the traffic volumes and rates of consumption of resources including electricity etc. will also increase. Without appropriate management strategies, this has the potential to have a significant adverse impact on air quality, particularly in urban areas, which will have a knock on impact on health. The trends in air pollution patterns suggest that stronger action will be needed to prevent further loss of assimilative capacity. Switching to cleaner alternative fuel from diesel will have some benefits, however, unrestricted growth in private traffic and commercial vehicles poses a long-term threat to air quality.
3.2.4 Without an appropriate strategic response to the long-term threat to air quality, a continued increase in the incident of respiratory illness and other health effects is likely, together with worsening visibility form photochemical pollution. These effects increase the social and economic burden of pollution and as air quality declines and receives further media attention, it is possible that tourism will decline and Hong Kong will become less attractive to companies and individuals seeking to locate and invest in the SAR. On the other hand, ever-tighter emission controls may place a financial burden on companies operating in the region.
Geology, Soils and Contaminated Land
3.2.5 Future development may have a positive impact on contaminated land. Due to the small land area available for development, it is probable that there will be further government initiatives to redevelop brownfield sites. This will require the remediation of sites which have been contaminated as a result of previous industrial/commercial activities.
59

Water Resources and Water Quality
3.2.6 The Water Supplies Department (WSD) compiles various data on the supply and consumption of freshwater in Hong Kong. Since 1990, the growth rate of the overall water demand has dropped to approximately 0.6% per annum. The reduction in growth rate may be due to the significant decrease in industrial water consumption as a result of the relocation of many industries outside Hong Kong. It is forecast that further reduction in the industrial demand for water will occur as a result of stricter pollution control policies and the availability of cheaper land and labour elsewhere prompting more industries to relocate outside Hong Kong. In 2001, 236 million m3 of seawater was supplied for flushing purposes. Approximately 80% of the population of Hong Kong uses seawater for flushing. This extensive use of seawater has helped to reduce the demand on freshwater for flushing purposes (HK2030 SGM Information Note 16/2001).
3.2.7 Reclamation of sites from the sea should only be undertaken with extreme caution as this disrupts the water flows and currents in the area, impacting on the assimilative capacity of the receiving water (e.g. the same volumes of sewage are entering a reduced amount of water). In addition, removal of coastal habitats (e.g. mangroves) reduces the area available for birds and spawning/juvenile fish. There have also been concerns raised in certain quarters as to the impact of reclamation projects on the harbour, and on water quality, ecology and landscape quality (www.info.gov.hk/epd).
Waste
3.2.8 As the population of Hong Kong continues to rise, the volume of waste produced will put pressure on the waste disposal facilities and fill up the landfills at a faster pace. Ongoing studies are considering the options for extending existing landfills, or possibly siting new facilities in the SAR. Options include the provision of facilities on existing land or the creation of an “artificial” island. Obviously any new facilities need to be fully appraised and detailed EIAs will be undertaken.
Energy and Natural Resources
3.2.9 Anticipated future population increase will put increasing pressure on the requirement for energy (which is predominantly generated by the combustion of fossil fuels) and natural resources, as additional buildings and infrastructure will be needed to cope with the increasing population.
3.2.10 Efforts to minimise energy requirements, including increase in energy efficiency and incorporation of renewable energy sources, should reduce the requirements for energy from fossil fuels. New construction projects could incorporate green design features where possible, and in an effort to prevent the filling of landfill sites.
3.2.11 Notable developments which may help to counteract the demand from increased population include the energy building codes, which are implemented via the ‘Hong Kong Energy Efficiency Registration Scheme for Buildings’. The scheme covers lighting, air conditioning, electrical and lift/escalator installations. There is also an energy efficiency labelling scheme which is a voluntary scheme covering refrigerators, room coolers, washing machines, clothes dryers and electric water heaters.
3.2.12 Demand side management policies are being implemented. From mid-2000, power companies have implemented rebate as well as information programmes for non-residential customers.
60

3.2.13 Energy audits have been conducted on public buildings to identify energy savings potential. There is also an energy end-use database, which provides useful insights into energy consumption patterns in the main end-use sectors and sub-sectors in Hong Kong.
3.2.14 Hong Kong is also working closely with local electricity and oil supply companies to examine the feasibility of introducing electric- and gas-powered vehicles. Two universities are carrying out research on photovoltaic systems, one university set up a monitoring rig to test the performance of different types of photovoltaic panels. The other project is a solar radiation monitoring programme to build a database on local radiation levels.
3.2.15 It is considered vital that Hong Kong looks to renewable energy and improved energy conservation measures to ensure a more sustainable energy supply in the future. A two-staged consultancy study on the ‘Potential Applications of Renewable Energy in Hong Kong’ was commissioned in November 2000. Stage 1 Study will evaluate the potential of various forms of new and renewable energy technologies for wide-scale local use, and related legal, institutional and promotional issues. It also makes recommendations for formulating an implementation strategy. Stage 2 Study will conduct a pilot project to demonstrate the applicability of Building Integrated Photovoltaic (BIPV) systems.
Landuse – Agriculture and Fisheries
3.2.16 The marine fishing industry is facing great difficulties as a result of intensive fishing pressure combined with rapid infrastructure development and increased marine pollution. The loss of important habitats such as mangroves, which provide a nursery for many commercial fish species, and pollution pressure on the Hong Kong’s seagrass beds has reduced viable habitats for such fish species.
3.2.17 Without appropriate urban redevelopment initiatives and with the anticipated population increase, the development pressure is likely to result in loss of any remaining open/natural or lowland agricultural areas. However, encroachment will be prevented on protected lands such as Country Parks or Special Areas.
Landscape
3.2.18 Hong Kong currently lacks an explicit or cohesive territory-wide landscape conservation and planning policy. Historically, landscape and visual issues have been given low priority in the planning process, resulting in the loss of significant areas of landscape particularly to urban development and major infrastructure projects. In addition, the value of designated landscapes is partly derived from their quality and extent, but which simultaneously exert increasing pressure on them. The continued sustainability of these landscapes in the future will depend on balancing the demands of recreation with the needs of landscape conservation. There is a clear and urgent need for a co-ordinated landscape conservation and planning policy with objectives including the use of designated landscapes, the conservation of non-designated landscapes and the quality of the whole living environment rather than on the individual component parts.
61

Ecology
3.2.19 Without appropriate management, increasing human population will certainly exert pressure on the ecological resource. The ways in which this will occur are:
• direct pressure of land take as increased areas of land will be required for housing, either encroaching on terrestrial areas, or reclaiming coastal environments. Pressures on low lying and coastal areas is anticipated to be the greatest;
• indirect pressure – increased volumes of traffic and increased activity (despite the relocation of heavy industry to the Mainland) may increase air pollution, and as such will impact on sensitive species, reducing their health or restricting their growth;
• increased population will mean increased sewage and wastewater effluent contributing to water pollution to both marine and potentially freshwater; and
• increased waste will take up the ever-decreasing landfill space, and will also have potential health and ecological impacts if inappropriately managed.
3.2.20 In addition to the above, it is anticipated that there are other forces which will have an impact on the ecological stock. These include the introduction of exotic species on a global and local scale, and human induced global warming. The exact response to increased ambient CO2, and potentially increased ambient temperatures, alterations to local weather patterns, and increased sea level cannot be accurately predicted, however, it is known that ‘healthy’, disease free, diverse environments are better able to respond to disturbance and environmental change.
Cultural Heritage
3.2.21 Cultural heritage is under significant threat from new development, particularly in urban areas where older buildings with no statutory protection have been demolished to make way for new schemes, rather than being incorporated into urban redevelopment programmes. The areas of highest potential for heritage resources are often coastal regions where the pressure for new development is the greatest and where significant reclamation has already been conducted. Rural areas are also under increasing threat from encroachment of developments, particularly in growth areas such as in the new towns and where the lack of development controls on private land is threatening many traditional village buildings and other cultural features in the New Territories (SUSDEV 21).
3.2.22 In addition to the threat of loss or destruction of heritage resources as a result of development, there are also other dangers. These include tourism-blight and over-use without planning; retention of a resource but destruction of its immediate environment; loss of the integrity of a heritage resource as a result of inappropriate reconstruction and re-use; and the threat of natural erosion to archaeological sites.
62

3.3 Environmental Carrying Capacity and Strategic Indicators
3.3.1 Carrying capacity refers to the number of individuals who can be supported in a given area within natural resource limits, and without degrading the natural social, cultural and economic environment for present and future generations. The carrying capacity for any given area is not fixed. It can be altered by improved technology, but mostly it is changed for the worse by pressures, which accompany a population increase. As the environment is degraded, carrying capacity reduces, leaving the environment no longer be able to support even the number of people who could formerly lived in the area on a sustainable basis.
3.3.2 The adoption of Sustainable Development principles offers a number of potential benefits including environmental benefits resulting from reduced wastage through energy savings, economic benefits arising from improved health and reduced economic burden as well as social benefits due to the improved amenity from natural and open areas by efficient land use.
Noise
3.3.3 Determining the environmental carrying capacity requires reference to certain criteria or standards to enable comparisons to be made. The increasing awareness of noise pollution has accompanied the development of noise assessment and acceptable noise criteria and standards, for example the noise standards stipulated in the NCO and the HKPSG.
3.3.4 Hong Kong has been described as a crowded, noisy city in the Environment Hong Kong 2000 by EPD. The sources are heavily trafficked road networks which take heavy, noisy vehicles through cramped residential areas and numerous construction sites within close proximity to residents.
3.3.5 With the relocation of the airport from Kai Tak in Kowloon to Chep Lap Kok on Lantau Island in 1998, the dominant noise problem in the urban area has changed from air traffic to road traffic. EPD estimated that in 1997 around 1 million people were affected by severe road traffic noise. According to CTS-3, under the high growth (high end) scenario, without additional restraint and mitigation measures, it is possible that by 2016, 50% more people in the New Territories would be exposed to excessive traffic noise as compared to year 1997. In view of this situation, it is likely that there is not much room in terms of noise carrying capacity.
3.3.6 The noise exposure percentage to high noise levels could be a strategic indicator for the noise carrying capacity. For instance, referring to the standards stipulated in the chart of Road Traffic Noise Exposure Compliance Zone in the Practice Note for Professional Persons PN 1/97 with which new housing developments are required to comply, the allowable exposure percentage varies depending on the site area of a housing development.
3.3.7 The number of prosecutions and complaints received could also be used as a strategic indicator. In 2000, there were 404 prosecutions for construction noise, 65 for industrial and commercial noise, 50 for neighbourhood noise and 3 for intruder alarms. The number of complaints received by EPD may be a useful indicator for incidences of noise from construction activities which are difficult to monitor on a territory-wide basis. In 1997, a total of 5,852 noise complaints were received by EPD relating to five categories of noise nuisance: construction (1,888 complaints), industrial and commercial (2,484), neighbourhood (1,270), transport (197) and product noise (13). This compares with a figure of 7,441 noise
63

complaints in 1996, 6,858 in 1995 and 5,761 in 1994.
Air Quality
3.3.8 Air quality cannot be thought of in terms of its ability to support, but rather in its ability to assimilate various environmental pollutants. The ‘assimilative capacity’ of the territory’s air is limited by a number of topographic and meteorological factors such as the prevailing north-easterly winds (70% of the year), confined air sheds that restrict dispersion of pollutants, and limited air circulation in urban areas due to the density of high rise buildings, which creates a ‘street canyon effect’.
3.3.9 Longer term trends in air pollutants projected by EPD show increases in annual average concentrations of NOx, decreases in SO2 and consistently high levels of particulates with both Total Suspended Particulates and Respirable Suspended Particulates being close to their respective AQO limits. Rising levels of ozone which contributes to photochemical smog is also a concern.
3.3.10 Compliance with AQOs will be used as a strategic indicator for air quality.
Geology, Soils and Contaminated Land
3.3.11 The issues associated with geology, soils and contaminated land in terms of carrying capacity are discussed within the Ecology and Water Resources sections.
Water Resources and Water Quality
River Waters
3.3.12 The potential impact of future developments on river waters will be represented by the compliance of river water quality with the WQOs and WQI. WQI is used to indicate the extent of organic pollution in a river and its ability to support aquatic life.
3.3.13 A lower rating of a development option indicates that the option would lead to a lower compliance frequency with the WQOs and WQI, hence a greater potential adverse impact on the river waters. Whereas a higher rating of the option indicates that the option would result in a higher or less decreased compliance frequency with the WQOs and WQI.
Freshwater Resources
3.3.14 The potential impact of future developments on the freshwater resources will be represented by the annual water consumption per capita.
3.3.15 A lower rating of a development option indicates that the option would lead to increased annual water consumption per capita, hence being less sustainable. Whereas a higher rating of a development option indicates that the option would lead to a decreased or less increased annual water consumption per capita.
Bathing Waters
3.3.16 The number of beaches rated as “good or fair” and the number of beaches rated as “poor or very poor” will be used as the indicator. A higher rating of a development option indicates that the option would lead to an increased number of beaches rated as “good or fair” or a decreased number of beaches rated as “poor or very poor”. A lower rating of a development option implies that the option
64

would result in a decreased number of beaches rated as “good or fair” or an increased number of beaches rated as “poor or very poor”.
Marine Waters
3.3.17 The compliance frequency with the WQOs in each of the WCZs will be used as the indicator. A lower rating of a development option indicates that the option would lead to a decreased or less increased compliance frequency with the WQOs and a higher rating indicates that the option would result in an increased or less decreased compliance frequency.
Waste
3.3.18 Obviously landfilling of waste causes land to be unusable for a period of time. The issues associated with waste are discussed within the sections on Ecology and Water Resources.
Natural Resources
3.3.19 The natural resources carrying capacity can be described as the amount of use and harvesting which can be conducted without adversely affecting the environment to replenish itself within a reasonable timescale.
Landuse - Agriculture and Fisheries
3.3.20 In common with many other major world cities, Hong Kong’s agriculture and fisheries natural capital stock does not fully support the local demand for fresh foodstuffs, and alternative sources have already been identified to meet demand. The health and yield from agriculture and fisheries can be used as an indicator of carrying capacity.
Landscape
3.3.21 The landscape carrying capacity can be described as the amount of natural and designed landscape resource which is needed to support the well-being of individuals and the community as well as to protect and conserve landscape diversity and value. Landscape carrying capacity strategic indicators could include:
• The area of protected landscape per 100,000 of population
• The volume of visitors to protected landscapes per year
• The area of urban greenspace per square kilometre
• The ratio of developed land to land covered by natural forest, scrubland and grassland. For example, Hong Kong has a developed land area of 230 km², while approximately 741 km² are covered with forest, scrub and grass, hence a ratio of 1 to 3.2
3.3.22 A study on the value of Hong Kong’s landscapes (i.e. Landscape Value Mapping of Hong Kong commissioned by the Planning Department in October 2001) will determine indicators from which landscape baseline conditions can be established and monitored, allowing development impact to be quantified.
65

Ecology
3.3.23 The ecological carrying capacity has been commonly defined as “the population of a given species that can be supported indefinitely in a defined habitats without permanently damaging the ecosystem upon which it is dependent” (the International Society for Ecological Economics, 1994). It is also a resource which is required to process carbon dioxide, provide goods, services and habitats, without the health of the resource being adversely affected which equally apply to diverse ecological resources. The assimilative capacity is a “system’s” ability to absorb waste materials, the process of environmental self-purification or equilibration. Assimilative capacity enhancers are therefore systems which reverse problems of pollution, public health or resource depletion. These systems are defined as man-made environmental infrastructure that enhance natural processes so as to reduce or modify pollutant loading to the environment. Assimilative capacity can also be increased through appropriate management, removal of dead/decaying vegetation to make way for new growth, or use of specific species to assist in the removal of organic compounds from water, or the introduction of microbes to assist in the breakdown of organic compounds in contaminated land or landfill sites.
3.3.24 Determining the ecological carrying capacity will require analysis of natural population dynamics and the disturbance in terms of building or infrastructure an area can support or the concentration of contaminants an environment can absorb/ or be exposed to without adversely disrupting the existing species diversity and population numbers. For example, different species will colonise different environments, and disturbance/encroachment or fragmentation may mean that more common disturbance resistant and ruderal species will replace potentially more established and more sensitive communities.
3.3.25 The findings of the HKU Biodiversity Survey have provided a useful ecological baseline. From this survey a set of indicators can be developed. These can be used to determine the health of the environment, an example of potential indicators is contained in Appendix B. Periodic surveys will be required to provide the information gained from these will be used to determine any improvements or reductions in the ecological carrying capacity.
3.3.26 About 10 million visitors to Country Parks were recorded in 2000 (www.info.gov.hk/hkfacts/country-e.pdf), most were engaged in leisure walking, fitness exercises, hiking, barbecuing, family picnics and camping. The number of visitors to the protected areas could be a carrying capacity indicator.
Cultural Heritage
3.3.27 Carrying capacity is a concept with limited applicability to cultural heritage. The stock of heritage resources is so diminished and endangered that the aim must be to preserve as many significant examples as possible. In terms of heritage conservation and management, carrying capacity can be viewed as the integration of the maximum number of resources into the wider development plans for the community.
3.3.28 Upon determining the value of resources and their priorities, there is a need for proposing sustainable development indicators to measure the loss and gain of heritage capital due to the following reasons:
• The CASET indicators of heritage sustainability as developed for SUSDEV 21
66

could benefit from further expansion; the current indicators only include two categories of cultural heritage: archaeological sites and historical buildings and structures. Additional heritage resources of local importance might also include cultural landscape features such as fung shui woodlands and ponds, traditional field patterns, pre-war clan graves, boulder paths and terraces; and remnants of early industries such as sauce and oil factories, salt pans and oyster cultivation.
• The CASET indicators which only show the number of recorded sites are unable to reflect the nature of the sites, their rarity, typicality, condition, the quality of their surroundings, public accessibility and other important criteria.
3.4 Environmental Efficiencies
3.4.1 To avoid continued environmental decline, future development must embrace concepts of resource efficiency, social equity, environmental protection and restoration and recognition of limits to growth.
3.4.2 The key response to the current condition of the natural capital stock in Hong Kong thus lies in the development of holistic and integrated policies and strategies to address the pressures acting upon the environment.
3.4.3 Overall speaking, sustainable development in Hong Kong will need to involve all sectors across the society for it to be successful. This means involving groups such as the public, business, industry, transport operators, legislators and district councils, some of which may have been unreceptive to previous environmental messages or changes. There is hence a need for action so that such groups are actively engaged in a constructive discussion to appreciate the environmental, social and economic interrelationships, which are vital to sustainable development.
3.4.4 In order to strike a balance between the protection of environment and economic development, environmental efficiencies can be determined by cost-benefit analysis. For example, road resurfacing and noise barriers using different materials provide different noise mitigation performances, or emission abatement equipment. Choice of materials not only depends on its effectiveness for the task in question but also other parameters such as durability, availability in the market and cost.
3.4.5 Urban planning is an efficient way to achieve protection of the environment. Through the planning process, the potential environmental issues are identified and addressed before commencement of the development. The allocation of land uses over the territory and the design of development to minimise the environmental impacts can be investigated. For instance, positioning of potentially polluting processes away from sensitive receptors; development of wastewater treatment facilities in areas where there is space to develop man-made reedbeds to remove organic matter; the orientation of buildings to protect dwellings from direct noise exposure to traffic noise; and the zoning of residential and industrial land uses at different locations to avoid their interface problem. As such, the installation of additional mitigation measures could be minimised. Moreover, the construction and operation cost for maintenance could be saved.
3.4.6 Control at source is always a better solution than passively isolating the receivers from environmental impacts. This is more cost effective than adding on end-of-pipe technologies or mitigation facilities.
67

3.5 Conclusions and Recommendations
3.5.1 Hong Kong has a significant capital stock of resources which includes extensive areas of protected land. However, the intense development in areas of Hong Kong has put pressure on the natural resources through direct land take, or through improved access to land (through infrastructure projects), or through the release of contaminants into the environment. The anticipated population increase will put further pressure on the environment as more space, resources and energy are required to support the population. There are likely to be further pressure as a result of global environmental issues such as the human enhanced greenhouse effect.
3.5.2 It is clear that without appropriate planning and control of future development, and without improvements in energy efficiency and reductions in the volume of solid and liquid waste and other pollutants, the environment will be seriously compromised. If this continues uncontrolled, it would lead to a reduced enjoyment of the environment and its resources, and will compromise the environment’s capacity to assimilate waste products. This will also reduce the resources left for future generations to meet their own needs.
3.5.3 A holistic approach to environmental management is required which should take into consideration all of the environmental aspects mentioned throughout this section. Regeneration of run-down or disused areas is recommended, with important character features maintained and materials reused where possible. This will reduce impacts of creeping incrementalism which have been noted in other world cities such as Tokyo and London. Methods of working with natural processes to enhance their assimilation and recycling functions are required. This can be achieved through research leading to technological advances, or through transfer of knowledge and techniques which have already been tried and tested through the implementation of effective environmental management systems to promote active environmental communication.
3.5.4 Environmental considerations must be at the forefront of planning and development to ensure that the use of resources and the associated emissions and waste arisings are as low as possible. The standards and targets require periodic review to ensure that they are ambitious enough with reference to emerging technologies and techniques. Putting environmental issues at the top of the agenda is necessary to raise public awareness. Education is the key, and strict legislative controls and economic incentives for non-polluting or environmentally conscientious management and operation, as well as penalties or ‘green taxes’ for polluting companies, can provide effective tools for improving environmental performance.
3.5.5 Cultural heritage resources in Hong Kong are rapidly diminishing in number and being compromised by development and disregard. They are of social and spiritual significance to the community and must be preserved and respected. Heritage may act as a constraint on development in some instances, however, it can also provide opportunities. These include the creative re-use of historical buildings, the development of cultural tourism in areas of traditional landscape and the preservation of archaeological sites as education centres.
68

4 Environmental Constraints and Opportunities
4.1 Introduction
4.1.1 This section identifies the major environmental constraints and key issues that would have an influence on the sustainability of Hong Kong. For example, on land the existing buildings will act as a constraint, reducing airflow, resulting in stagnation and potentially high levels of air pollution. However, there are also a number of opportunities for environmental enhancement and improvement through new and upcoming environmental technology. Increased global environmental awareness has also helped to push forward a number of major environmental initiatives as well as providing opportunities for worldwide co-operation in environmental protection.
4.2 Increased Global Environmental Awareness
4.2.1 The concept of Sustainable Development was first formally discussed in 1972 at the UN Conference on the Human Environment in Stockholm. The issues raised lead to the establishment of the World Commission on Environment and Development (WCED) by the UN General Assembly. The Commission was supported by the UN but it was an independent body outside the control of governments and the UN itself. The WCED summarised its findings in the following terms: “We came to see that a new development path was required, one that sustained human progress not just in a few places for a few years, but for the entire planet into the distant future. This ‘Sustainable Development’ becomes a goal not just for the developing nations, but for the industrialised ones as well.” (WCED, 1987)
4.2.2 The WCED in its 1987 publication ‘Our Common Future’ defined the concept of Sustainable Development as follows:
“Sustainable Development is development that meets the needs of the present without compromising the ability of future generations to meet their own needs.”
4.2.3 The WCED or Brundtland definition is widely used as a starting point for Sustainable Development strategies at national, regional and municipal levels. It is common for governments to re-phrase or expand on this definition when setting out their goals.
4.2.4 At the United Nations Conference for Environment and Development (known as Rio Earth Summit) in 1992, the Brundtland definition was adopted and a number of initiatives of particular importance for Sustainable Development were proposed. In particular, Agenda 21 – adopted at the Conference which names the key fields of action for Sustainable Development – required all countries to define and implement the programme areas according to local situations, capacities and priorities.
69

4.3 Environmental Constraints
Noise
4.3.1 As the availability of suitable land for development is limited and with the increasing transportation pressure between Hong Kong and the Mainland, traffic noise will still be a dominant noise source in the future. Due to a lack of integrated land-use planning in the past, industrial areas are located in close proximity to the residential areas, and the airport was located in what became (through urban growth) one of the town centres. Heavy trucks and busy traffic networks also pass by the noise sensitive areas such as residential developments, education institutes and hospitals. As a result of such a combination, environmental noise problems were created.
4.3.2 For existing urban areas, there are not many immediate solutions available regarding noise reduction. It is particularly problematic where flyovers pass through high-rise residential neighbourhoods. Comprehensive urban renewal could be effective in reducing noise pollution but may not be feasible due to multiple ownership. Requirement for thick glazing, lockable windows and split air-conditioning system is an option which could be adopted for piecemeal redevelopments. Ventilation technology may be advanced to a stage when openable windows for residential developments are not absolutely required, however this technology is not available at this time.
Air Quality
4.3.3 In terms of air pollution, the existing infrastructure and prevalence of high-rise buildings restrict air movement within many urban areas. In the future, planning must take into consideration the requirements for free and easy movement of air, to prevent the canyon effect which is currently experienced in many urban areas of Hong Kong.
4.3.4 Trans-boundary air pollution from the Mainland and other regions also affects Hong Kong’s air quality.
Geology, Soils and Contaminated Land
4.3.5 The costs associated with compensation for relocating privately owned PHIs and other facilities which may cause land contamination might prove a constraint to freeing up land for development.
Water Quality
4.3.6 The Pearl River is a significant source of nitrogen for Hong Kong’s North Western WCZ in the wet season. It is estimated that the contribution from the Pearl River could amount to 60% of the nitrogen level in the North Western WCZ (Hyder, 2000). The influence of the Pearl River decreases as you move further away. However, the extensive reclamation downstream of the river in recent years has altered the influence of the fresh flow from the river on the HKSAR waters. There is evidence to suggest that the extensive reclamation has led to more freshwater flow from the river being diverted to the west of the Pearl River Estuary.
4.3.7 In addition to the Pearl River, the pollution discharges from HK’s neighbouring area also affect the water quality of HKSAR waters, particularly in the Deep Bay WCZ. These are significant constraints as they are outside the control of the HKSAR Government.
70

4.3.8 It is economically attractive for many “zhens” and “xiangs” in the Mainland to exploit their forests for the wood export and for tourism development. Without the concept of Sustainable Development, these may lead to deterioration of water resources for themselves and for Hong Kong in the long term.
4.3.9 The increasing urban population within the Guangdong Province will result in increases in the volume of wastewater produced, which will act as a constraint if lacks of appropriate treatment and management.
4.3.10 Proper wastewater treatment is essential in improving the water quality in the rivers and the sea. However, there is limited land available for such installations. Underground and cavern options will probably be more acceptable to the general public. Special design requirements may be required for above ground treatment plants in more sensitive locations.
Waste
4.3.11 The Government targets at diverting 40% (30% in 1997) of municipal solid waste away from disposal at landfills by 2007. The three programmes under the Waste Reduction Framework Plan are now being proceeded although the amount of waste generated is still increasing.
4.3.12 Landfill only is no longer a sustainable solution in Hong Kong given the limited land supply. As noted in the foregoing section, the extension of existing landfills or establishment of a new facility (possibly on an artificial island) are possible options being examined. The use of public fill to accommodate inert C&D materials, which will otherwise be disposed of at landfills, has an acute shortage problem. It is estimated that the shortfall in public filling capacity would reach about 13.5 million m³ by end 2005. In the interim, we need to rely on fill banks which could provide temporary stockpiling capacity of about 10 million m³.
4.3.13 Livestock wastes have been controlled successfully by the introduction of the Livestock Waste Control Areas and this could be cited as an example of successful policy making in future stages of the Study.
Energy and Natural Resources
4.3.14 Further investigation is required into the options for use of renewable energy. Space for facilities for generation of wind energy, biomass, wave or hydroelectric power is a major constraint when identifying viable options for Hong Kong.
Greenhouse Gas
4.3.15 The potential impacts of the human enhanced greenhouse effect may act as a constraint on the ecological resources within Hong Kong. Changes to seasonal ambient temperature, ambient CO2 and alterations to rainfall patterns and intensity may put pressure on some of Hong Kong’s native species, reducing the ecosystem’s ability to respond to the predicted environmental changes. All opportunities to maintain biodiversity, increase vegetated areas and minimise the release of greenhouse gases must be considered.
71

Risk
4.3.16 The existing PHIs and certain other potentially hazardous linear infrastructure, such as high-pressure gas pipeline networks to the new towns, may act as a constraint in terms of the location of future development. Such constraints need to be taken into account in the overall land use plans when considering components of the development options.
Ecology
4.3.17 Due to the potential erosion or reduction of the ecological resource through increased development, opportunities for habitats creation and restoration are likely to increase. However, efforts for re-creation of mangrove habitats lost as a result of coastal development may be hampered due to the excessive human activity preventing the use of the habitats by numerous bird species and the increased risk of fuel spillages arising from the high volumes of marine traffic.
Cultural Heritage
4.3.18 Cultural heritage will in many cases act as a constraint on planning intentions when development proposals impact on heritage resources. Often the impacts can be mitigated or the resources integrated into the plan to mutual benefit. However, there will always be cases where the interests of conservation and planning are incompatible. It is important that heritage resources be clearly identified and ranked in terms of significance so that the planning process can accommodate them and engage in informed discussion as to their role in future development.
4.4 Environmental Opportunities
Noise
4.4.1 The relocation of Kai Tak Airport to Chek Lap Kok did bring about tremendous environmental improvement to the residents in Central and East Kowloon. However, Hong Kong International Airport will steadily increase its passenger and cargo throughput in the next 30 years. It is essential to ascertain how the different growth scenarios will affect the environmental quality of various possible development areas including Tung Chung and Tai Ho.
4.4.2 Road traffic noise is the greatest noise source in Hong Kong. For new development areas, there are opportunities for noise mitigation and reduction through better planning for different hierarchy of roads, submerging major roads, provision of mitigation at source, and protecting noise sensitive uses by non-noise sensitive uses to ensure a good living environment. To avoid traffic noise impacts, the direction of integrated land-use planning, similar to that of the proposed Hung Shui Kiu NDA, can be focused on the zoning of the whole area, the alignment of road networks and the mode of transportation. For instance, under the Comprehensive Feasibility Study for the Revised Scheme of South East Kowloon Development, efforts have been spent at the planning stage to avoiding trunk roads inside new towns, considering environmentally friendly mode of transit (such as trolley buses) and considering user-friendly pedestrian walkways.
72

4.4.3 The use of trains can be encouraged by designing high-density developments within walking distance of railway stations. This will effectively reduce private car trips on the roads, and would be facilitated by the provision of park-and-ride facilities at the fringe of the town, as well as the provision of comfortable and convenient pedestrian linkages to the stations. Restriction of car-parking provisions at congested areas and at convenient locations could also be considered.
4.4.4 In existing urban areas, there are many sites with industrial/residential interface problems. Designation of industrial land as “Residential (Group E)” (“R(E)”) zoning may help to phase out the existing industrial uses. However, it has to be implemented with a practical approach in that environmental assessment for ad-hoc redevelopments will have to be based on existing operations and not on subjective projections/assumptions. Otherwise, the overall urban environment cannot be improved incrementally.
Air Quality
4.4.5 The majority of our air pollution comes from road traffic, as such any efforts to reduce emissions from vehicles would have a beneficial effect on the air quality.
4.4.6 When planning for new development areas and urban renewal projects, breezeways could be planned to allow better air circulation in the town. Obsolete industrial buildings should be considered for conversion into other non-polluting uses. On one hand, this would minimise air pollution from industrial uses, and on the other hand, it could minimise production of demolition wastes.
4.4.7 Co-operation in regional planning may help to reduce cross-boundary air pollution. Although it may not bring about immediate effect, the air pollution problem in Hong Kong cannot be wholly resolved without the co-operation of Guangdong authorities.
Geology, Soils and Contaminated Land
4.4.8 Regeneration of obsolete industrial areas, and restoration of old landfill sites to free up land for potential development or recreational use would increase development potential within the existing urban areas. The existing PHIs can be considered as areas of opportunity if it is possible to reduce them through various means such as the application of new technology or alternative processing technology or relocation to outlying islands. This will be considered in the Key Issues Report and in the SEA study in general.
Water Quality
4.4.9 Similar to cross-boundary air pollution problem, close co-operation between Hong Kong and the Pearl River Delta region in land use planning and wastewater treatment provides opportunities for improving the quality of the water resources.
4.4.10 It has been the Government’s long-term objective to provide sewerage connection for remote areas. SMPs covering most of the territories have been produced although some are currently undergoing review. Implementation of the SMPs is under way, which is expected to benefit the water quality across the territories.
4.4.11 Stage 1 of the Harbour Area Treatment Scheme (HATS), which was fully commissioned at the end of 2001, has enabled 70% of the sewage flow treated before entering the Harbour. It is expected that the implementation of the
73

remaining stages of HATS would alleviate considerably the pollution level in and around Victoria Harbour. With the planned improvement in Hong Kong’s sewage treatment system in the harbour areas and other water control zones, the potential exists to exploit opportunities for water recreation activities for the general public and tourists. Opportunities however depend on a number of factors including marine traffic, available facilities, suitability of the site, etc.
Waste
4.4.12 While the Government has paid considerable efforts in dealing with waste prevention and recovery, there are still large volumes of non-recyclable waste need to be handled. The Government is examining the appropriate technologies for the development of large-scale waste treatment facilities in Hong Kong to reduce the volume of waste requiring disposal. For new development areas, it might be cost-effective to provide automatic refuse collection system to serve both public and private developments.
Energy and Natural Resources
4.4.13 The previously mentioned measures to encourage use of trains and discourage use of private cars are also beneficial for reducing natural resource consumption. Vehicles which run on renewable energy is a possibility in the future, however, the resources must be available at affordable prices and comparable efficiency to make this a viable option.
4.4.14 Waste incineration could provide a potential heat source which could be used for purposes such as energy production, whilst smaller alterations to techniques and processes such as the use of water-cooled air-conditioning system provides an energy efficient method of air conditioning. In this respect, adequate land has to be reserved for central chiller plants in addition to pump houses and water tanks.
4.4.15 Introducing appropriate environmental management provides significant opportunities for resources conservation (fuel, waste recycling, re-use of inert material from demolished buildings, etc.) through the minimisation of the use of resources, the use of new technologies, and the investigation and incorporation of renewable energy.
Landscape
4.4.16 Opportunities for enhancing the landscape value of existing urban areas include greening of roofs, streets and man-made slopes.
4.4.17 In redevelopment or new development areas, the requirement for the preparation of master landscape plans and creation of different types of open space will also provide an opportunity for enhancing landscape value.
Risk
4.4.18 Opportunities exist for the reduction in PHIs over time with the introduction of new technologies or the provision of new strategically located facilities. Examples of such opportunities include the potential reduction in chlorine storage at water treatment works which might reduce the consultation zone or even the change from chlorine to ozone in the disinfection process which might effect a declassification of the PHI. Other examples include the relocation of oil terminals or fuel storages to areas outside Hong Kong, such as Southern China, or the alternative use of non-petroleum based fuels. These could in effect reduce the
74

number of PHIs in Hong Kong.
Ecology
4.4.19 Current popular opinion in Hong Kong tends towards a more stringent approach to environmental conservation, including the conservation of our natural heritage through preservation of ecologically valuable areas which can be managed for eco-tourism purposes. Various proposals have been put forward by interest groups and individuals including the creation of new planning designations, such as Conservation Zones. Recent and on-going cases such as Tai Long Wan and Sha Lo Tung highlight increased public awareness and activism. This public enthusiasm and concern must not be underestimated or undervalued and careful evaluation is needed of these and other proposals to gauge their usefulness and effectiveness in past cases overseas and in local circumstances. Natural heritage can play an important role in achieving these key planning objectives, particularly if a wider range of resources is identified and exploited as having value and appeal to the community.
4.4.20 The environment can be managed in terms of ecological resources which can be manipulated to improve their value as wildlife habitats. To increase their value aesthetically, careful planning and an understanding of the processes at work are required. Mangrove replanting and wetland habitats creation activities also provide great opportunities to replace habitats which have been lost or degraded through reclamation or development.
4.4.21 The public must be involved in the setting of priorities for conservation. The most important priority areas could be protected, and the less sensitive areas could be allowed to be developed comprehensively with an appropriate portion of the site managed for nature conservation.
4.4.22 Under the current Small House Policy, large areas of land have been reserved for Village Development Area. Some of them cover ecologically valuable areas. Low-density low-rise village development in any case would not be a sustainable form of development in Hong Kong. For long-term planning, it is worthwhile exploring other ways to satisfy the villagers’ need for housing.
4.4.23 In both public and private developments, instead of landscaping for pure amenity purposes, planting trees of suitable native species should be encouraged to enhance biodiversity throughout the territory. Where appropriate, parts of Country Park can be used for re-creation of natural habitats.
Cultural Heritage
4.4.24 Our heritage is a strength and poses many opportunities but, at the same time, it is also a strength under threat. There is no doubt that in many cases heritage resources can act as constraints on development. It is imperative that, in planning for the future, heritage should be viewed as an affordable constraint that can be easily and profitably transformed into an opportunity with expert input and guidance so that aspects of traditional village life and urban history can be integrated into the planning process to present a full and fascinating picture of Hong Kong. This also applies to natural heritage, including much of the coastline and island areas and the scenic rural areas.
4.4.25 Opportunities for incorporation of cultural heritage features into urban settings will require the provision of a list of objective assessment criteria to evaluate the heritage values of both building and archaeological sites. The evaluation and
75

setting of priorities should be conducted in a comprehensive and transparent manner with the involvement of the public as well. The buildings and archaeological sites on top priority would require public commitment for their protection, for example through resumption or development right transfer.
4.4.26 Land use planning to incorporate heritage conservation could be encouraged in both public and private developments for sites which may not be of top conservation value. Private partnership particularly in the existing urban areas could play an important role.
4.4.27 There are opportunities for heritage tourism, like eco-tourism which could be explored, however, this would require careful management and planning.
4.5 Review of New Technologies
4.5.1 There is great potential for environmental advancement through the use of new technology. However, new technological features with limited distribution are often expensive, which acts as a deterrent to their uptake. Prices tend to remain high until their use becomes wider. This will act as a constraint initially.
4.5.2 As populations and industries increase, the greatest opportunity for controlling environmental impacts is through the application of new technologies which provide systems for increasing efficiency and minimising environmental impacts. In addition to industry, the rapid economic development in the last decade means that our urban areas have inevitably been expanded. Infrastructure has developed and new highways and roads have been built to support the increasing volumes of traffic. All these have exerted tremendous pressure on the environment. As the pressures continue to increase, more attention must be focused on the operations conducted. Preference must be given to the uptake of Environmentally Sound Technologies (ESTs). ESTs are less polluting and protect the environment by using resources in a more sustainable manner, recycling more of their wastes and products, and handling residual wastes in a more acceptable manner than the technologies for which they were substitutes. ESTs in the context of pollution are “process and product technologies” that generate low or no waste, for the prevention of pollution. They also cover “end of the pipe” technologies for treatment of pollution after it has been generated.
4.5.3 Opportunities for implementation of initiatives such as ‘The Joint Environment Markets Unit’ (JEMU) should be investigated. This is a mechanism which has been established in the UK involving co-operation between the government, private sector and research and development facilities, to increase firms’ awareness of the large and growing market for environmental goods and services, and to assist and encourage UK firms to utilise such opportunities. This ensures the best possible results from the transfer of technology. In order for this system to be fully effective, information must be made freely available on the environmental risks and benefits of technologies in question to allow informed choices to be made. JEMU is also in the process of establishing a database of UK suppliers of environmental technology.
76

4.5.4 The organisation of Hong Kong’s environmental information can be greatly improved by the use of a Geographic Information System (GIS). More and more data systems in EPD will include a GIS component. GIS is a computer system capable of assembling, storing, manipulating, and displaying geographically referenced information, i.e. data identified according to their locations. The way maps and other data have been stored or filed as layers of information in a GIS makes it possible to perform complex analyses. This has proved to be a very effective tool for organising, displaying and using data, and has a wide range of applications and uses in terms of environmental data. Although GIS is not a particularly new technology, the system can be continually improved by updating with more detailed or a greater range of data. Brief reference will be given to the use of GIS with respect to the parameters discussed below.
Environmental Management (General)
4.5.5 Appropriate and efficient environmental management is the key to ensure that the environmental advantages afforded by advances in technology are fully realised. Implementation of an effective Environmental Management System is a vital tool for ensuring that channels for communication are opened and that opportunities for bringing on board new technology in terms of pollution prevention devices and energy saving features are taken up. Environmental management and accreditation to EMAS (Eco-Management and Audit Scheme) or the internationally recognised environmental management standard, ISO14001, should be supported. This would be particularly attractive to businesses due to the potential long-term money saving opportunities.
4.5.6 An EMS is a tool that can be adopted on a company/organisation level basis. Essentially an EMS will guide organisations in ways in which they can conduct their daily activities in an environmentally sustainable manner. Through such a system, the impacts of organisations’ activities are monitored and assessed on a continuous basis.
4.5.7 The most widely recognised and accepted format and structure for an EMS is the International Standard Organisation’s standard ISO14001: 1996 EMS specification with Guidance for use. Organisations do not have to implement ISO14001 to bring on board sustainable development initiatives, however, the benefit is that such accreditation schemes provide an internationally recognised standard and provide a tried and tested method for incorporation of sustainable development initiatives. Further details of ISO14001 and how it can contribute to sustainable development are contained in Appendix A1.
Environmentally Friendly Construction Methods (HK-BEAM)
4.5.8 The Hong Kong Building Environmental Assessment Method (HK-BEAM) was developed through the HK-BEAM Steering Committee including the Department of Building Services Engineering of the Hong Kong Polytechnic University (BSE), the Welsh School of Architecture of the University of Wales College of Cardiff (WSA) and the Centre for Environmental Technology Limited (CET) now the Business Environmental Council (BET). HK-BEAM provides authoritative guidance to developers, consultants, owners, operators and users of practices which minimise the adverse effects of buildings on the global and local environments, whilst promoting a healthy indoor environment. It has been developed to set criteria for good environmental performances in buildings that would be recognised through an independently issued certificate. Developers and creditors can use the guidance to inform themselves on building procurement. Prospective purchasers
77

and tenants can obtain independent assessment of building performance to inform themselves or obtain advice on purchase or leasing decisions.
4.5.9 HK-BEAM defines good practice criteria for a range of environmental issues relating to the design, operation, maintenance and management of buildings. The HK-BEAM scheme currently embraces both new and existing air-conditioned office premises and new residential buildings. All of the criteria in the HK-BEAM and the assessment criteria are updated periodically as new information becomes available and as legal requirements evolve.
4.5.10 The Buildings Department will commission a consultancy study to prepare a Comprehensive Environmental Performance Assessment Scheme (CEPAS) for Buildings. This is in recognition of a growing awareness of a deteriorating built environment and follows on from the Construction Industry Review Committee Report of January 2001 which recommended the need for a common, comprehensive assessment scheme to provide a unified yardstick to determine the environmental performance of buildings. The CEPAS, which provides an incentive based green labelling system for new and existing buildings, intends to upgrade the environmental performance of Hong Kong’s buildings.
Performance Indicators for Sustainable Construction
4.5.11 The UK Sustainability Working Group, a collaboration of clients, industry and government working together to develop sustainable working practices in the UK, has developed a report ‘Rethinking Construction – The Movement for Innovation’ detailing environmental performance indicators (EPI) for sustainable construction.
4.5.12 This document proposes a set of six EPIs to include: operational and embodied carbon dioxide, water, waste, biodiversity and transport. For each of the EPIs, the aim is to develop benchmarks for a range of construction types, from offices through to infrastructure projects. The EPIs should allow the establishment of reasonable emissions, consumption levels and waste production to provide a benchmark against which the requirements of each construction type can be measured. Further details of the document are available in Appendix A2.
Noise
4.5.13 With the advancement in computer technology, computer software has become a useful aid in noise assessment especially during the planning stage as noise mapping or predicted impacts can assist in the formulation of development plans.
4.5.14 Environmental noise from roads in particular is one of the major environmental problems in Hong Kong. The GIS system has been manipulated and noise-modelling software has been developed for the collation of noise information throughout Hong Kong to identify and quantify the scale of noise problems, and evaluate the effectiveness of mitigation measures.
4.5.15 Transportation related noise is a key environmental issue. With the advancement of technologies, the modification of transportation facilities can help to reduce noise emissions. For instance, the advancement can be on the modification of vehicle design, the reduction on structural borne noise (such as the design of floating slab track) and the resurfacing of roads.
4.5.16 Low-noise porous road surfaces can reduce the generation and propagation of noise. According to the European Commission’s Green Paper (Future Noise Policy, European Commission, Green Paper, Brussels 1996), results have shown
78

that the emission noise levels can be reduced from levels generated on equivalent non-porous road surfaces by between 3 to 5 dB(A) on average, and by optimising the surface design, greater noise reductions are feasible. In order to reduce the road traffic noise in a cost-effective way, the European Commission will take action to promote the use of low noise road surfacing.
4.5.17 In Hong Kong, road resurfacing has started over 10 years. The Highways Department has conducted a number of trials and made references to other countries’ research on noise reduction and durability on the materials. Research and trials have been conducted to investigate the noise reduction performance of different surfacing materials with reference to British Standard, BS4987: Parts 1&2. Further investigations and trials are on the way to determine their suitability for use in Hong Kong. (Guidance Notes on Noise Reducing Road Surfacing, Highways Department, HKSAR, July 2001).
4.5.18 Railways are currently a major transportation mode and the stated intention is for even greater use of railways as a means of public transport in the future. New technologies can facilitate noise reduction to minimise the noise impacts when planning considerations have been exhausted. The current technologies on railway system such as the multi-plenum system and floating slab track could be useful paradigm for further improvement in the future.
4.5.19 The use of quiet equipment is becoming prevalent among industrial sectors. Installation of sound absorption materials, isolators and acoustic louvers could alleviate noise emissions.
4.5.20 In order to minimise construction noise impacts, the use of pre-casting façades is a common construction method in many housing developments. This building method can shorten the construction period and reduce the number of powered mechanical equipment (PME) needed during the construction of superstructure. Quiet PME and working methods have also been developed. For instance, super quiet generator for providing electricity to construction works and electric driven vibratory poker are much quieter than traditional ones.
Air Quality
4.5.21 Reduction of annual emissions of carbon dioxide and other GHGs can be achieved through reducing energy consumption. Since power plants are the most significant sources of CO2 in HKSAR, use of cleaner fuel for power generation is identified as the most effective measure in reducing GHG. Other mitigation measures include use of renewable energy, promoting energy efficiency and demand side management, and renewable energy research and development. Gases such as carbon dioxide, carbon monoxide, volatile organic compounds and oxides of nitrogen can be reduced by cutting vehicle emissions, or the use of alternative sources of fuel. Environmentally sustainable technologies which minimise the release of GHGs or provide an alternative to the combustion of fossil fuel should be favoured when replacing equipment.
4.5.22 The air quality model, PATH (Pollutants in the Atmosphere and their Transport over Hong Kong), was developed to study air pollution in Hong Kong as a result of cross-boundary sources. The system includes the location of emissions sources, emission strength and the location of sensitive receptors such as residential developments, ecologically sensitive areas etc. GIS is used in the maintenance of emissions inventory and the analysis of pollution exposures. Using this information, a pro-active approach can be taken to identify those plants/emission sources which would benefit from emissions management or the use of
79

additional/alternative abatement equipment.
4.5.23 An article extracted from the periodical “Hydrocarbon Engineering, Volume 6 Number 11, November 2001” describes a project, which investigates opportunities for designing totally green buses based on renewable solar energy, is to go ahead after receiving funding from the European Commission. The project, it is hoped, will develop buses which emit nothing more than water vapour. Detailed design work on the project is due to start at the beginning of the year and the project will be completed by September 2003.
4.5.24 Another example taken from an article in the South China Morning Post dated 20 November 2001 describes how Hong Kong and China Gas have taken gas emissions from its landfill site in Shuen Wan and used these for producing gas at its Tai Po gas production plant. The company has also built a dry ice plant in Tai Po to reduce emissions of carbon dioxide, a major contributor to global warming.
4.5.25 Another local company, CLP, has adopted another environmentally friendly technology, the trenchless cable, which is included in the new submarine transmission across Ma Wan and Kap Shui Mun Channels. This technology not only cuts down on set-up time and offers lower equipment costs, but also avoids repetitive open trenching, thus minimising the construction dust and noise pollution due to the extensive excavation works. Moreover, it reduces the amount of water pollution and wastewater generated from the construction process.
4.5.26 Furthermore, to some extent, self updating information on alternative technologies would be made available through the implementation of effective environmental management as the management process, which is necessary in order to achieve accreditation, requires that companies need to be up-to-date with new technologies.
Geology, Soils and Contaminated Land
4.5.27 The application of a GIS system could be used to identify sources of potential pollution, such as particular plants storing hazardous liquids including fuels and chemicals. This would assist in response efforts should a spillage occur, however, appropriate environmental management would have minimised the risks of accidental release. The GIS could also be used to map out the sites contained in the contaminated land register.
4.5.28 Due to the limited space available for development in Hong Kong, redevelopment of existing urban areas will be required to provide housing and infrastructure for the growing population. Typically, areas which have been subject to previous development would have a higher risk of land contamination than the case of developing on a greenfield site. As a result, remediation of areas of identified contamination will be required. Techniques for remediation in this growth area are continually advancing. The most suitable remediation technique will depend on the nature and location of identified contamination. Accepted and new techniques for remediation include:
• Excavate and dispose off site – this is effective for all contaminants, but will require disposal to landfill. Opportunities to remediate contamination on site would reduce the volumes of taking up landfill space.
• Contain and cover – material is contained in-situ. However, this is not effective for all contaminants, particularly mobile organic substances.
80

• Contain and isolate – opportunities for this method depend on the site in question. At present there are still uncertainties about the long-term performance.
• Dilute and reapply – only works for immobile substances
• Treatment and destroy – this is a relatively new technique, some studies are being undertaken to determine the effectiveness, cost implication, etc.
• Treatment and immobilise – again this is a relatively new technique, again there are issues associated with potential changes in standards after completion
4.5.29 It is clear that as environmental legislative demands increase and landfill space becomes a greater issue, techniques based on ‘treatment’ rather than retention or disposal will achieve wider market application. Currently biopiling has been used effectively for remediation of sites subject to organic contamination. The use of biotechnology will increase in the future in terms of the use of living organisms as an alternative to chemicals in cleaning up contaminated land and water. Current accepted and new techniques for bioremediation include:
• Bio Treatment – In-situ technologies include bio-venting, in-situ land treatment, air sparging and addition of nutrients, oxygen, and hydrogen peroxide. Ex-situ land treatment includes land treatment, soil piles and composting.
• Phytoremediation – This technique involves the use of green plants to clean up or control hazardous wastes. Types of phytoremediation include phytoaccumulation, phytoextraction, hyperaccumulation (metal accumulating plants to remove toxic metals from soil), phytostabilization (contaminant-tolerant plants to reduce mobility and prevent further contamination of organics) and phytodegradation or phototransformation (direct metabolism or degradation of organics) etc.
4.5.30 Policy initiatives for environmentally sound management of technology are required, regulatory authorities and expert advisory committees must be set up to ensure appropriate management to minimise environmental risk.
Water Quality
4.5.31 Advance treatment technologies such as continues type Sequencing Batch Reactor (SBR) process and Biological Aerated Filter (BAF) process are now being studied in order to improve the daily throughput (i.e. amount of wastewater to be treated daily) of Sewage Treatment Works. Whilst study on the UV lamp is now being undertaken in order to improve the efficiency and power consumption for wastewater treatment, it is recognised that 7KW UV lamp is now market available for TOC removal.
4.5.32 Opportunities for secondary and tertiary wastewater treatment of sewage prior to release require investigation to remove organic matter and reduce bacterial content. The use of fertilisers and pesticides should be subject to increased control and organic farming practices should be followed where possible. This would have the effect of improving coastal environmental water quality, creating a positive impact on the fishing and shellfish industry in particular, and providing further opportunities for the recreational use of the coastline.
4.5.33 Grey water recycling facilities to collect the wastewater generated from kitchen,
81

shower room, etc. for the purpose of toilet flushing would be a possible/feasible option to consider.
4.5.34 Soft engineering techniques, such as the use of gently sloping banks covered by natural vegetation at inland wetlands, not only provides a more pleasant environment aesthetically, but also acts as a sediment trap. Maintaining aquatic emergent vegetation, including reeds (Juncus spp, Phragmites spp) and sedges, also assists in the removal of organic materials (particularly nitrates and phosphates) from the water and increases the natural habitats area. This ensures that appropriate management can improve the ecological value and assist in the recreational enjoyment of this resource, whilst serving a useful function in pollution control.
Waste
4.5.35 In order to reduce the volume of waste for disposal at the landfills, the use of finite resources should be minimised, and reuse and recycling opportunities should be exploited where possible. Formal systems for the collection of recyclable materials should be provided in addition to existing voluntary schemes. New infrastructure will be required for the collection of recyclable wastes, for source separation and material recovery.
4.5.36 Waste to energy plants, which are being used in countries such as the UK, could reduce the volumes of material disposed of to landfill, whereas the heat and energy produced could be used by a range of facilities, including for heating and for the production of electricity. However, ash is produced as a result of incineration which will require disposal. The flue emissions, although treated and monitored, have often raised concerns from residents living in close proximity to these facilities.
4.5.37 Techniques for recycling materials and creation of useful products from waste materials will expand in the future. Opportunities for uptake of recycled materials must be identified. For non-reusable items, the use of biodegradable products, for example, using paper bags instead of plastic bags, or the use of cellulose packaging materials instead of polystyrene, would reduce the object’s long-term persistence in the environment.
Energy and Natural Resources
4.5.38 There are a number of technologies, which can be integrated into the urban environment, are applicable in Hong Kong, such as building-integrated photovoltaics (BIPV). Countryside and new towns in Hong Kong are potential candidates for small renewable energy systems, such as solar thermal, biomass and wind. Technologies involving the conversion of waste to energy may be used to help alleviate the problems associated with waste treatment and disposal while producing useful energy. Table 4.1 below provides a list of renewable energy technologies that would be applicable to Hong Kong:
82

Table 4.1 Renewable Energy Technologies Applicable to Hong Kong
A. Technologies that can be readily applied to Hong Kong, where appropriate:
1 passive solar design (and energy efficient building design)
2 solar photovoltaics (building-integrated and standalone on highways)
3 solar thermal (for water heating and absorption air-conditioning)
4 municipal waste to energy (incineration and digestion)
5 landfill gas
B. Technologies requiring further investigation and study:
6 small hydropower (river based)
7 wind energy (onshore and on islands)
8 wave, tidal and ocean thermal Source: Hui, 1997b
4.5.39 There are also opportunities for partnership between Hong Kong and the Mainland, which has abundant sources of renewable energy. Many issues would need to be worked out at a local level but from a strategic perspective there may be opportunities to examine ways to provide more interconnection for the long term.
4.5.40 In addition to the current research into potential applications for renewable energy in Hong Kong, notable recent developments in energy conservation include: Comprehensive Building Energy Codes, which is a set of codes implemented via ‘the Hong Kong Energy Efficiency Scheme for Buildings’. The scheme covers lighting, air conditioning, electrical and lift/escalator installations.
4.5.41 The Hong Kong SAR Government (i.e. Government’s Building Innovation Unit) is encouraging developers to employ “green building” features in recent and future residential projects. Some of the energy saving features of a “green building” include (i) Automated refuse collection system: centralised compaction chamber which not only saves petrol of waste transfer vehicles but also frees up more landfill space; (ii) Photovoltaic panels: rooftop converting sunlight into electricity, providing power to light up indoor areas; (iii) Solar panels: water running through tubes inside the panels and is heated for domestic use.
4.5.42 According to an article in the South China Morning Post (Victoria Button, 3/12/2001), Hong Kong is to get its first three solar powered urban buildings by the end of 2003. These structures will incorporate panels which will generate a portion of the electricity requirements to help reduce bills and cut greenhouse gas emissions. The three buildings are: a 29-storey commercial tower at 1 Peking Road, Tsim Sha Tsui; the Hong Kong Science Park in Tai Po; and a primary school on Ma Wan Island.
4.5.43 A research team from the University of Hong Kong developed a programme to put solar power in schools and stated that Hong Kong should set itself a target for generating a portion of its electricity from alternative sources, for example 25%. Solar panels could be used in building facades, roofs and shade canopies, there are an enormous number of buildings in Hong Kong which could lend themselves to generating solar energy.
83

4.5.44 The cost of solar powered technology has decreased considerably in the last decade, and is likely to decrease further in the future.
Natural Resources
4.5.45 As development advances the pressure on the reservoir of natural resources will increase. Technological advancement will focus on the use of renewable and environmentally friendly resources, such as renewable energy sources, over the use of finite resources. Again, appropriate environmental management which keeps organisations in touch with technological advances will allow the transfer of information relating to more environmentally sound technology.
Risk
4.5.46 New technologies for the reduction of PHIs or at least consultation zones (such as the potential change from chlorine to ozone in the disinfection process for water quality) might result in a declassification of works where such changes take place, thereby reducing the number of PHIs. Other ideas include the use of new fuel sources, rather than carbon based fuels, which would reduce the need for petroleum based fuel stores in Hong Kong. The relocation of petroleum based fuel stores to neighbouring areas outside Hong Kong, such as Southern China, would also reduce the number of PHIs in Hong Kong.
Ecology
4.5.47 Currently AFCD uses GIS to store site-specific information relating to country parks and recreational facilities. This system allows efficient editing and retrieval of information, and the system has been used to produce specific country park maps for display on country park information boards. The GIS can be further expanded to identify and map sensitive environments such as wetlands and areas supporting high biodiversity or protected species, which require additional management or protection, or to identify areas suitable for the transplanting of protected species as part of any species re-introduction/ habitats restoration programmes.
4.5.48 Efforts are currently being made to conserve rare and endangered plant species, once they have been identified, they are conserved mainly through the following three approaches.
4.5.49 Species protection: The Wild Animals Protection Ordinance provides species and habitats protection as does the Forests and Countryside Ordinance, under which damaging plants in any forest or plantation on government land is prohibited. Some rare and attractive species are specifically listed in the Forestry Regulations to control the sale and possession of such listed species as Camellia spp, Enkianthus quinqueflorus, Iris speculatrix and Impatiens hongkongensis.
4.5.50 Habitats Protection: many of the localities of rare plant species are situated within Country Parks under statutory protection.
4.5.51 Active Protection: various methods such as seed collection, cutting, air layering, etc. have been attempted to propagate rare and endangered plants. Transplantation may also be carried out if their habitats are found to be under threat. Successful examples of active propagation include Keteleeria fortunei, Camellia crapnelliana, and Camellia granthamiana. A base for flora conservation has been set up at the Shing Mun Arboretum. About 300 species including some rare species have been propagated and established there for conservation
84

purposes. The AFCD Herbarium located in Cheung Sha Wan Government Offices, which was established in the late 1800s, holds approximately 38,000 specimens. The AFCD has recently commissioned the compilation of the multi-volume ‘Hong Kong Flora’, which would become the ultimate reference for Hong Kong plants. A number of programmes also exist for the active protection of wild animals such as Chinese While Dolphin, Blackfaced Spoonbill, Green Turtle and Romer’s Tree Frog.
4.5.52 Although these are not new technologies, methods for conducting these conservation measures will advance and improve as knowledge and experience increases. Without appropriate management, protected areas can quickly lose their biodiversity and value. As a result, species transplantation and active protection can be used to restore degraded environments, and enhance the value of existing environments.
Cultural Heritage
4.5.53 Regarding the possible role of technological solutions, the use of information technology would substantially improve the management of cultural heritage in Hong Kong for the future. Networks of database, GIS mapping and computerised heritage inventories are used widely overseas to quantify, manage, categorise and preserve the heritage resources. This will provide efficient identification of known sites of archaeological interest or archaeologically sensitive areas.
4.5.54 As time passes, more recent structures displaying unique or revolutionary architectural designs, or buildings which supported historically significant practices or events, should be protected or preserved during redevelopment of urban areas. Records of these features should be maintained in addition to information relating to their structure and history. Over the past few decades, technological advances have made it possible to relocate heritage structures whilst successfully maintaining their architectural integrity.
4.5.55 It must be noted, however, that the first priority in the conservation of any heritage structure should be in the form of preservation in-situ, as the original location of a building is an integral part of its history. Relocation of a structure, such as Murray House in Stanley, should only be considered as a last resort. Integration of portions of an original building in a new construction can also be considered, where parts of a building have been destroyed or are in a condition so far deteriorated that they cannot be restored. Modern engineering techniques should be used in conjunction with conservation architecture procedures to determine the best design and in turn, how to implement it for the creation of a successfully integrated heritage resource.
4.6 Conclusions and Recommendations
Noise
4.6.1 Hong Kong is densely populated with limited developable land. Integrated land use / transport / environmental planning and policy play a vital role in improvement of noise environment. However, due to the limited space in Hong Kong, when planning options have been exhausted, noise control at source through the incorporation of new technologies and engineering design to minimise the noise problems is necessary.
85

Air Quality
4.6.2 As the Hong Kong population increases, energy and transport demands will also increase. Further methods of reducing pollution emissions are required such as cleaner technology, cleaner fuels, and better integration of environmental protection into transport and energy policies and planning. Moreover, further co-operation is required with Hong Kong’s neighbours to develop policies and practices to reduce trans-boundary air pollution.
Geology, Soils and Contaminated Land
4.6.3 Due to the limited space available for development in the territory, redevelopment of existing urban areas will increase. Remediation of land contaminated from the site’s previous use will be required to minimise risks to buildings, people, wildlife and water resources. The use of in-situ treatment, in particular bio-remediation techniques, are likely to increase and will minimise the volumes of contaminated material being disposed of in landfill.
4.6.4 Introduction of a contamination land register is recommended to provide information on sites where there is a real risk of contamination. This will provide valuable information for use during redevelopment.
Water Resources
4.6.5 There is a wealth of opportunities for environmental enhancement in terms of water resources. Proper sewage treatment prior to discharge to the sea will improve the quality of coastal waters, whilst soft engineering techniques for use on inland waterbodies and wetlands will maximise pollution control, and enhance recreational enjoyment of the area whilst minimising the costs.
Waste
4.6.6 To minimise the use of finite resources, opportunities for the reuse and recycling of materials must be taken up. Integrated waste treatment facilities also provide opportunities for reducing the volume of materials entering landfill.
Energy
4.6.7 Current and future initiatives to encourage developers to construct environmentally friendly buildings will have benefits in terms of cost savings to the owner/occupier, in addition to reduced emissions from energy production. In addition to long-term planning, good housekeeping is the easiest method for reducing energy consumption, and government-led awareness campaigns will provide the simplest energy saving opportunities.
4.6.8 To seize the opportunities, Hong Kong should establish a renewable energy market and gradually build up the experience with the technologies. The barriers and constraints to the diffusion of renewable energy should be removed. Legal, administrative and financing procedures should be established to facilitate planning and application of renewable energy projects. The Government could play a useful role in promoting renewable energy technologies by initiating surveys and studies to establish their potential in both urban and rural areas. For instance, the Government is actively studying the implementation of water-cooled air conditioning systems in Hong Kong. EMSD has also launched pilot schemes for wider use of fresh water for cooling towers for energy-efficient air conditioning system in 17 areas in Hong Kong.
86

Natural Resources
4.6.9 The search for alternatives to the use of finite natural resources will increase in the future as the volumes of finite resources decrease (and due to supply and demand economics prices will be likely to increase). Opportunities for the use of renewable resources must be investigated and encouraged.
Risk
4.6.10 Opportunities to reduce the number and/or influence of PHIs, for example by utilisation of new technology or alternative processes, will be considered when evaluating the development options or components thereof. New technologies could include the use of ozonation rather than chlorination in the disinfection process for water treatment works, or the use of alternative fuel such as solar energy which could reduce fuel storage areas both at the central and local depots/stores. Relocation of PHIs to alternative sites outside Hong Kong, such as in Southern China, would also reduce the number of PHIs, as indeed would be the change from carbon based fuel to alternative energy (solar, wind etc).
Ecology
4.6.11 In order for development in the future to be conducted in a sustainable manner, areas supporting endangered species, unique habitats, or high species diversity must be given increased protection. It is likely that species transplantation techniques will be developed, to conserve interesting or protected species within degraded urban environments to prevent destruction during urban regeneration. Increasing the information available regarding individual species requirements and lifecycle will be necessary to ensure the effectiveness of habitats restoration or re-creation projects.
Cultural Heritage
4.6.12 A focus on the use of information technology in heritage management is recommended. Innovative methods will be required to measure development and other pressures on our heritage capital. This should be based on the wide body of international information regarding computerisation and data graphics in the cataloguing and maintenance of heritage resources and in the presentation of these resources to the public.
4.6.13 The application of such technologies will allow assessment of the capacity of this capital to not only withstand such pressures, but also to influence their scale and design for mutual benefit.
87

5 Environmental Targets
5.1 Introduction
5.1.1 The definition of targets as “an objective or result to be aimed at” holds true for the environmental targets to be set for this Study. The inclusion of targets in the planning process serves various purposes, for example, targets:
• allow environmental legislation to be enacted and enforced;
• provide a mechanism and procedures for reviewing and updating legislation and standards in response to rising expectations, changes in technology, new data or information on effects on health of, say, air pollutants;
• allow savings to be made in environmental resources, for example water consumption;
• allow reductions to be achieved in, for example carbon dioxide emissions; and
• offer opportunities to enhance efforts in waste reduction, recycling and reuse.
5.1.2 The targets and standards currently in force in Hong Kong are detailed in Section 5.2 and reference is made to the existing legislative controls which are set out in the multifaceted Pollution Control Ordinances in the form of Water Quality Objectives, Air Quality Objectives, Noise criteria etc. and which form the basis of the environmental standards.
5.1.3 Supplementing these are a suite of guidelines issued by EPD which are practical guides to limit pollution during construction works (dust guidelines, runoff from site or discharge of wastes from toilets, canteens etc.) or during the operation of facilities such as CO levels in carparks. Thus it may be observed that there are in fact many strategic targets (objectives) as well as local objectives currently guiding our development policies.
5.1.4 However, in view of increased expectations of the general public, and environmental pressures (both internal and external), these objectives and targets need to be reviewed and revised to reflect the aspirations for the future and to provide incentives to continue striving for improvement. Potenial targets related to individual environmental aspects is detailed in Section 5.6.
5.1.5 It is also important to remember that the development options are being targeted for the year 2030, and as such the targets may not meet today but with the increasing requirements, an allowance must be made to achieve higher performance in future.
5.1.6 While the setting of targets may present some difficulties due to lack of information, an appropriate approach would be to benchmark Hong Kong’s performance against international standards (Section 5.3). Reference could also be made to overseas best practices as detailed in Sections 5.4 and 5.5.
88

5.2 Existing Standards and Targets
Noise
5.2.1 Exposure to high noise levels is an environmental problem common to many cities throughout the world. However, it is exacerbated in Hong Kong by the proximity of the sensitive receivers to the noise source(s) and their typically elevated locations due to high-rise buildings resulting from high population density and limited land for development.
5.2.2 The Noise Control Ordinance stipulates the noise limits for construction activities carried out during restricted hours, industrial operations such as chillers and generators. The noise limits are established in accordance with the area sensitivity rating of the noise sensitive receivers and the human response on noise during day-time and night-time periods.
5.2.3 Chapter 9 of the Hong Kong Planning Standards and Guidelines (HKPSG) provides guidance on planning against noise for both the public and private sectors. The noise standards regarding different noise emitters are recommended for planning of developments.
5.2.4 Thus, while from a human health and environmental protection viewpoint the same noise standards and targets should be set as for other World Cities, they will probably be more difficult and expensive to achieve in Hong Kong than for many cities in the world. It needs to be recognised that people’s aspirations and tolerance to noise exposure have changed and a quieter living environment is now expected and demanded.
5.2.5 An obvious measure of achievement is the number of people (in absolute terms and as a percentage of the population) exposed to excessive noise, i.e. noise levels higher than the agreed standards. The corresponding target would logically be to continually reduce these numbers of exposed population over time.
Air Quality
5.2.6 Air quality in Hong Kong has long been an issue of concern. Regulations and legislation have been enacted to combat air pollution over the last two decades and they have been effective. For example, a regulation in 1990 to reduce sulphur content in fuel resulted in an overnight plunge in sulphur dioxide levels. The sulphur dioxide concentrations fell by up to 80% in the industrial areas. Combined with reduction in industrial activity, total industrial SO2 emissions fell from 46,616 tonnes in 1989 (before the ban) to 16,688 tonnes in 1997 (reference made under “Clean Air for Hong Kong” – the then Planning, Environment and Lands Bureau). For the power plants, natural gas was introduced for power generation to reduce the emissions of gas pollutants and since 1991 all the new units have been installed with the gas desulphurisation system and filled with the low-NOx technology. SO2 and NOx concentrations reduced by 60% and 73% respectively in the period between 1991 and 1997 which also led to a reduction of ozone formation. With the execution of the Construction Dust Regulation in 1997, dust emitted from individual construction activities was reduced by up to 80%.
5.2.7 Vehicle emissions were identified as the key issue, and in recognition of this, in 1999 a programme was introduced to improve air quality through reducing motor vehicle emissions via the replacement of diesel vehicles with cleaner alternative where practicable, retrofitting of older diesel vehicles with particulate reduction
89

devices, tightening of existing fuel and vehicle emission standards, and ensuring the proper maintenance of in-use vehicles. Upon full implementation of the programme (by end 2005), the Government anticipates that particulate and nitrogen oxides emissions from vehicles would be reduced by 80% and 30% respectively. There are a number of other environmental opportunities including pedestrianisation of busy streets. Such a scheme has already been very successfully implemented for example in Causeway Bay.
5.2.8 The overall policy objective is to achieve (as soon as is reasonably practicable) and maintain an acceptable level of air quality. In order to do this, Air Quality Objectives (AQOs) for seven widespread air pollutants were established in 1987 under the Air Pollution Control Ordinance (based on international standards) which are set out in Table 2.1. These may be reviewed from time to time taking into account international developments. The AQOs provide measurable targets which should be achieved as soon as is reasonably practicable and to be maintained thereafter.
5.2.9 Hong Kong is neither a party to the United Nations Convention on Climate Change nor a party to the Kyoto Protocol, however, we have committed to contribute pragmatically to the global effort to combat global warming through domestic programmes.
Geology, Soils and Contaminated Land
5.2.10 Wherever industrial processes have taken place, there is a potential risk of ground contamination. As suitable development sites within Hong Kong become scarcer, the potential costs of remediating “brownfield” sites are becoming more attractive compared to the costs involved in designing and constructing buildings on Hong Kong’s hillsides. This main economic driver means that there has recently been a move towards redevelopment/regeneration of disused/degenerated sites, in particular sites previously used as shipyards (mainly due to their prime coastal location). Prior to development, the potential risks to human health, water, wildlife and construction materials must be assessed, and the soils and groundwater are tested accordingly.
5.2.11 There are a range of standards and parameters used to categorise material/sites as contaminated. Those in use in Hong Kong are as follows:
• Marine sediment – WBTC No. 3/2000 for Management of Dredged/Excavated Sediment
• Land Soil – Dutch List (Moen et al 1988) in EPD Pro PECC PN 3/94 (for general contamination assessment – all levels greater than Dutch Level B Threshold Values are considered by EPD to be contaminated); Table E1 (For Landfill Disposal Classification) of EPD/TR1/99 Guidance Notes.
• Land Water – Dutch List as above and EPD Technical Memorandum for effluent discharge into Drainage and Sewerage Systems.
5.2.12 Disposal arrangements for contaminated materials depend on its source. For example, those materials defined as contaminated mud/sediment arising from dredging would generally be disposed of at the contaminated mud pit at East Sha Chau. If the contaminated materials arise from land-based sites, i.e. land decontamination or demolition works, then stabilised materials would be disposed of at landfills (or treated on site). The intention is to minimise waste disposal as far as possible and in each case options for treating/leaving in-situ or disposal
90

should be considered. For chemical wastes, the Chemical Waste Treatment Centre at Tsing Yi provides treatment and disposal option.
5.2.13 There is currently no register of known or potentially contaminated sites. However, this would be a sustainable option to maximise the use of suitable development sites in Hong Kong, and to minimise encroachment onto natural areas. Urban regeneration of sites provides great development opportunities in many cities which have undergone economic restructuring.
Water
5.2.14 Most freshwater resources and marine waters in Hong Kong suffer to a greater or lesser extent from pollution from domestic, commercial, industrial and livestock waste discharges, as population and economic growth in the past have outstripped sewage services and discharge controls.
5.2.15 The efforts made by the HKSAR Government in combating the water pollution problems over the last 15 years have resulted in significant improvement in water quality in the beaches and rivers across the SAR and in parts of the marine waters (e.g. Tolo Harbour).
5.2.16 The Water Pollution Control Ordinance, which divides all the waters in Hong Kong into ten water control zones (WCZs) and three supplementary WCZs, is intended to control all wastewater discharges (including domestic sewage and trade effluent etc.) into the WCZs.
5.2.17 Water Quality Objectives (WQO) have been developed for the WCZs, and Sewerage Master Plans (SMPs) have been developed which provide a blueprint of the sewerage infrastructure required to collect the sewage on a catchment-by-catchment basis and direct it to the treatment facilities. As an example, WQOs for Southern WCZ is presented in Appendix E.
5.2.18 Although water consumption per capita has decreased in the last decade, the population has increased and so the overall water consumption has increased. There are no existing targets for water consumption, however, suitable targets include stabilising water consumption need to be introduced despite the population increases. Water consumption targets can be achieved with a framework for implementation of a variety of water saving measures. There are numerous methods for reducing freshwater consumption, including maintenance of water supply pipes to prevent leakage, retrofitting water using facilities, using grey water for landscaping and irrigation where appropriate.
Waste
5.2.19 Waste disposal was identified in the TDSR as being a key concern for Hong Kong. Some predictions show that the operational landfills in Hong Kong will be full in 4-7 years but spatial constraints and available land for siting new facilities is scarce. Concerns have been expressed that household and other municipal waste arisings have risen steadily in line with the growth in population and wealth of the community. According to the Monitoring of Solid Waste in Hong Kong – Waste Statistics for 2001 published by EPD, 16,820 tonnes of all wastes were disposed of daily.
91

5.2.20 The targets under the 1998 Waste Reduction Framework Plan (WRFP) has been updated as follows:
• Divert 40% (30% in 1997) municipal solid waste (MSW) away from disposal at landfills by 2007
• Divert 84% (80% in 1997) C&D materials away from disposal at landfills
5.2.21 In 2001, around 36% of the MSW produced was recovered, the remaining 64% was disposed of to landfill (Environment Hong Kong 2002, EPD). By building on existing practices, the aim is to further reduce the projected level of waste requiring disposal by 40% by 2007.
5.2.22 Anticipated C&D materials generated in the next 10 years are expected to be about 39,000 tonnes per day. These are mostly inert and would be suitable for land reclamation. The C&D materials management strategy which was implemented in early 1998 diverted the inert portion of C&D materials from entering landfills. It means that 84% (80% in 1997) C&D materials will be diverted away from disposal at landfills. Those non-inert portions, if contaminated, are non-recyclable which will be disposed of at landfills.
Energy and Natural Resources
5.2.23 As the population of Hong Kong continues to expand, it is inevitable that the energy requirements will increase. SUSDEV 21 expects that without the adoption of counterbalancing measures, under a probable scenario for the period 2000-2010, it is estimated that energy consumption will increase by 38% for electricity, by 29% for transport, by 31% for other uses (domestic and commercial, non-electric), and decline by 20% for industry.
5.2.24 Renewable energy resources, such as solar, wind, wave and landfill gas, are abundant energy sources. The supply of renewable energy from some sources is practically inexhaustible, and using renewable energy poses very little environmental risk. For sustainable economic development, renewable energy should be an integral part of the future energy system.
5.2.25 Similar with many other major cities worldwide, buildings are the dominant electricity consumers in Hong Kong in view of the extent of air conditioning units, ventilation lifts and other systems requiring power generation. Enhancing the energy performance of buildings is, therefore, a key measure to reduce the consumption of fossil fuels for electricity generation and the resultant greenhouse gas emissions.
5.2.26 Although various methods have been encouraged by the Government (e.g. green buildings initiatives), there are no specific targets for energy reduction for the future. The Government has, however, issued five codes of practice on energy efficiency of buildings, including one on overall thermal transfer value (OTTV) of buildings and four on major service installations in buildings.
5.2.27 The first action taken by the Government was the enactment of the Building (Energy Efficiency) Regulation in 1995 to control the OTTV of new commercial and hotel buildings. In conjunction with this Regulation, a code of practice has been published to define the OTTV calculation method and the compliance criteria (Buildings Department, 1995).
5.2.28 Following the OTTV code, the Government has published four codes of practice
92

on the energy efficiency of lighting, air-conditioning, electrical, and lift and escalator installations, which were developed by the Electrical and Mechanical Services Department (EMSD). These codes are being implemented under the voluntary Hong Kong Energy Efficiency Registration Scheme for Buildings (HKEERSB).
5.2.29 In the private sector, the Real Estate Developers Association (REDA) of Hong Kong launched the Hong Kong Building Environmental Assessment Method (HK-BEAM) in 1996, which is a voluntary scheme that assesses a wide range of environmental issues, including energy efficiency of buildings. In view of this, EMSD is intending to implement the codes as statutory requirement.
5.2.30 Again with natural resources such as non-renewable materials, for example aluminium for use in food tins/cans, with the exception of waste recycling methods, there are no specific standards relating to natural resources, and no specific targets relating to their preservation in the future.
Ecology
5.2.31 The natural environment of Hong Kong has undergone many changes over the last 150 years, as illustrated in old photographs, maps and pictures of the past. The pressure of development and changes in society have been manifested the ever changing image of Hong Kong. In recent years measures have been taken to improve the natural environment, new standards governing sewage treatment and waste disposal have been implemented in an attempt to clean up the marine and freshwater resources and air pollution control measures are also advancing. Almost all the land over 200m high is now protected within Country Parks and much of the New Territories remains rural with a large percentage of Lantau’s land area designated as Country Park. AFCD has the responsibility for managing the protected areas including Country Parks, Special Areas and Restricted Areas.
5.2.32 For environmental protection and nature conservation, Hong Kong relies on a combination of land use control and planning legislation. Existing active conservation policy and activities include, to name a few, management of Country and Marine Parks and the Mai Po Ramsar site for conservation, tree planting for habitats enhancement in Country Parks, implementation of conservation plans for the Black-faced Spoonbill and Chinese White Dolphin, translocation of Romer’s Tree Frog, propagation of rare plants, and maintenance of the Shing Mun Arboretum.
5.2.33 Although Hong Kong has a very well developed Country Parks System supplemented by town planning controls, the Government does not have a policy which would allow it, for example, to resume or purchase lands under private ownership for conservation purpose. As such this makes many ecological important areas vulnerable to damaging uses or even deterioration due to the lack of suitable attention. Nonetheless, under the EIA Ordinance, the project proponents are required to proactively identify any possible adverse ecological impacts arising from their development proposals and to avoid such impacts or where avoidance is not possible, propose mitigation measures to minimise or compensate for the impacts.
5.2.34 Apart from the EIA Ordinance, there are a number of legislative tools which provide for nature conservation. For example, the Wild Animals Protection Ordinance (Cap. 170) provides protection for wild animals from being hunt and disturbed while the Forest and Countryside Ordinance (Cap. 96) gives protection to trees and growing plants on government land from being damaged. The
93

Animals and Plants Protection of Endangered Species Ordinance (Cap. 187) gives effect to the Convention on International Trade in Endangered Species of Wild Fauna and Flora (CITES). The Marine Parks Ordinance (Cap. 476) is a legislative tool which also provides for nature conservation.
Landscape
5.2.35 In Hong Kong, there are a wide variety of landscapes, however for the purposes of this report three main landscape descriptions will be used. These are “natural”, “urban fringe” and “designed” landscapes. Natural landscapes include the large areas of Hong Kong, mainly in the New Territories and outlying islands, where there is very little dense urban developments. Large tracts of these areas are designated as Country Parks under the Country Parks Ordinance and whereby all development is strictly controlled, flora and fauna are protected and sites of historical and cultural significance are preserved. However, it also refers to non-designated land which is currently not protected by land-use zonings. Urban fringe landscapes are the peripheral areas where the dense urban development starts to give way to more natural landscapes, for example the villages between Castle Peak and Tuen Mun. These areas are a complex mosaic of land-uses and development densities. Designed landscapes are areas of public and private green open spaces usually within urbanised areas, excluding roadside amenity areas. Of these three categories, only designed landscapes have clearly identified targets and standards.
5.2.36 The main landscape planning standards and targets for designed landscapes are contained in Chapter 4 “Recreation and Open Space” of the HKPSG. The provision of open space is a key element in environmental planning and urban design and stems from a basic human need for activities that are essential to the mental and physical well-being of the individual and the community as a whole. The targets and standards of designed landscapes, or open space as defined in Chapter 4 of the HKPSG, are:
• In urban areas, including the Metro Area and the New Towns, the standard for provision of open space is a minimum of 20 ha per 100,000 persons, i.e. 2m² per person, apportioned as follows:
− a minimum of 10 ha per 100,000 persons (i.e. 1m2 per person) for District Open Space; and
− a minimum of 10 ha per 100,000 persons (i.e. 1m2 per person) for Local Open Space.
• Regional Open Space is provided as a “bonus” above the minimum standard. However, in the Metro Area, 50% of the Regional Open Space provision can be counted as District Open Space. This acknowledges the high level of “out of district” workers or visitors who use recreation open space in these districts and the role of urban fringe parks in the peripheral Metro Area to meet the recreational needs of the population.
• In public housing estates and comprehensive residential developments, the standard of provision for Local Open Space is 1m² per person throughout the territory.
• In industrial, industrial/office and commercial areas, the standard of provision is a minimum of 5 ha per 100,000 workers, i.e. 0.5m² per worker, and should mainly be used for Local Open Space for the enjoyment of workers.
94
• In rural townships such as Mui Wo and Sai Kung, the standard of provision is the same as for the urban areas, that is a minimum of 2m² per person, split equally between District Open Space and Local Open Space. The same standard of provision also applies to the outlying islands.
• In rural villages and small residential developments in the rural areas, the standard of provision is a minimum of 1m² per person for Local Open Space. Local Open Space managed by LCSD should preferably have a minimum size of 500m². Noting the rural locations of these settlements which enable the residents to have more easy access to the countryside, and the small population level, there is no requirement for the provision of District Open Space.
5.2.37 Furthermore, the Technical Memorandum of the EIA Ordinance contains criteria for the evaluation of visual and landscape impacts.
5.2.38 It is also recognised that open space can be provided without the need to set aside exclusive land areas. Designed landscapes such as roadside amenity areas perform other essential functions, including the penetration of light and air down to street level, the filtering of air by vegetation and trees, the movement of air thereby avoiding pockets of air pollution, the improvement of micro-climatic comfort for pedestrians, and the relief of visual blight. They also contribute to the achievement of other environmental targets, e.g. set-back by roadside amenity areas is planned in some cases to achieve acceptable noise levels at adjacent buildings.
5.2.39 However, landscapes such as roadside amenity areas, protected landscapes (Country Parks, Green Belts and Coastal Protection Areas, etc.) and non-protected landscapes are excluded from targets and standards because either they do not readily lend themselves to the formulation of targets and standards (roadside amenity areas), or they are entirely dependant on physical, cultural/historical and aesthetic properties (designed landscapes).
5.2.40 It should be noted that these existing standards and targets are likely to change with the completion of the current on-going study ‘Landscape Value Mapping of Hong Kong’ and also the current revision of HKPSG relating to the addition of a Chapter on Greening.
Risk Management of Potentially Hazardous Installations
5.2.41 Risk guidelines have been developed by the Government to allow the assessment of individual and societal risks of PHI sites (reference made under Figure 1 of Annex 4 for EIAO-TM). The societal risk guideline includes the requirement that risk levels should be “as low as reasonably practicable”. This requirement has resulted in the implementation of cost-effective risk mitigation strategies including:
• reduction of hazardous material inventories;
• provision of plant safety systems;
• control of residential development near PHIs; and
• PHI relocation from urban sites to sites in less populated areas.
5.2.42 Before 1986, almost all non-fuel gas PHIs did not comply with the risk guidelines. Since then, improvement works have been progressively implemented and now all
95
non-fuel gas PHIs are within the agreed limits. For example, containment and absorption systems have been installed in chlorine stores at water treatment works.
Cultural Heritage
5.2.43 There are several kinds of identified cultural heritage resources in Hong Kong, namely declared and deemed monuments, graded buildings, archaeological sites, and historic buildings and structures. Of these, only the declared and deemed monuments are afforded legal protection under the Antiquities and Monuments Ordinance.
5.2.44 The policy for heritage conservation is currently under government review. There is presently no clear policy definition on targets for cultural heritage preservation. The current standard for heritage preservation can be found under the EIA Ordinance, in particular under Technical Memorandum-Annex 10 Criteria for evaluating visual and landscape impacts, and Impact on sites of cultural heritage; and Annex 19 Guidelines for assessment of impact on sites of cultural heritage and other impacts. There should be presumption for preservation of all sites of cultural heritage in-situ, total destruction being taken as the very last resort.
5.3 International Standards
5.3.1 Over one hundred countries have set up high-level commissions to promote Sustainable Development. SUSDEV 21, which was completed in 2000, has carried out a review of the international and regional situation to provide the context for similar benchmarking in Hong Kong.
5.3.2 The international review indicates that usually there are three policy responses from governments towards Sustainable Development. First of all, long-term strategies should be developed and implemented, taking account of the environmental, resource and social implications of continuing the existing pattern of economic growth. Sustainable Development concepts should be introduced across government to bring a wider group of stakeholders into the consultation framework. Secondly, indicators should be developed to monitor progress, and thirdly measurable targets should be set. Essentially Hong Kong has achieved all three responses.
5.3.3 One of the requirements of this SEA is to review international strategies, indicators and targets and benchmark Hong Kong’s performance. In addition to which, a further aim of this Assignment is to redefine the targets and standards taking account of the changes over the next thirty years. It is however not the intention to state that, for example, at Year 2007 the AQO will be reduced by 25%, rather targets would be set for short, medium and long term achievement.
5.3.4 A number of international organisations aim to provide internationally recognised guidelines and assistance with the protection of human and environmental health. This section discusses the most prominent of these which are the World Health Organisation (WHO), World Bank (and International Finance Corporation) and the European Union (EU).
WHO
5.3.5 WHO, established in 1948, is a specialised agency of the United Nations with its
96

headquarters at Geneva. WHO admits all sovereign states (including those not belonging to the United Nations) to full membership. In 1999, there were 191 members. WHO is governed by the World Health Assembly, consisting of representatives of the entire membership, which meets at least once a year; an executive board elected by the World Health Assembly; and a secretariat headed by a director-general. There are regional organisations in Africa, the East Mediterranean, Southeast Asia, Europe, the West Pacific, and the USA.
5.3.6 WHO has developed guidelines to help protecting public health in areas including air quality, drinking water quality, noise, and sustainable use of water. These guidelines are used by the governments and agencies in the development of environmental standards and targets. Specific details relating to these targets are contained in Appendix D.
5.3.7 The information provided by WHO gives detailed instructions on application, and advice on methods for developing appropriate environmental strategies, legislation and standards.
The World Bank and International Finance Corporation (IFC)
5.3.8 The World Bank arose during World War II, and assisted in the rebuilding of Europe after the war. Reconstruction has remained an important focus of the Bank’s work. Now the Bank’s work has been expanded and concern for environmental sustainability within developing countries is an intrinsic part of the World Bank’s mission to fight poverty with lasting results.
5.3.9 After two years of consultation, the World Bank’s Board approved a new strategy on July 17, 2001. This new strategy places emphasis on developing country priorities with three objectives:
• Improving the quality of life — people’s health, livelihood and vulnerability — which is affected by environmental conditions;
• Improving the quality of growth — by supporting policy, regulatory, and institutional frameworks for sustainable environmental management and by promoting sustainable private development; and
• Protecting the quality of the regional and global commons such as climate change, forests, water resources and biodiversity.
5.3.10 The new strategy builds on a stocktaking of several decades of work in the environmental area. This work began with a series of safeguard policies designed to limit damage to the environment. More recently, the focus has shifted to the positive contribution that environmental policy can bring to the quality of life in developing nations. The International Finance Corporation (IFC), a member of the World Bank Group established in 1956, is the largest source of loan and equity financing for private sector projects in the developing world. This corporation specifically promotes sustainable private sector development.
97

United Nations Environmental Programme (UNEP)
5.3.11 This is an international organisation established by the Charter of the United Nations in 1945. The charter comprises a preamble and 19 chapters divided into 111 articles. It sets forth the purposes of the UN as: the maintenance of international peace and security; the development of friendly relations among states; and the achievement of co-operation in solving international economic, social, cultural, and humanitarian problems.
5.3.12 The United Nations Environmental Programme (UNEP), established in 1972, works to encourage Sustainable Development through sound environmental practices everywhere. Its activities cover a wide range of issues, from the atmosphere and terrestrial ecosystems, the promotion of environmental science and information, to an early warning and emergency response capacity to deal with environmental disasters and emergencies.
5.3.13 The environmental goals for the UNEP include the Agenda 21. This is to facilitate communication for meeting broader objectives, such as the implementation of Agenda 21, to facilitate inter-governmental negotiations, to monitor conventions and efforts for Sustainable Development, to transmit environmental alerts, and to transfer technical data.
5.3.14 The Global Environment Overlook or GEO 2000 is the latest state-of-the-environment report for maintaining a global overview of international assessments by UNEP. This provides recommended actions in encouraging industry, particularly small- and medium-sized enterprises, to set environmental targets.
European Union
5.3.15 The European Union (EU), is the name given since the ratification (Nov., 1993) of the Treaty of European Union, or Maastricht Treaty, to the European Community (EC), an economic and political confederation of European nations, and other organisations (with the same member nations) that are responsible for a common foreign and security policy and for co-operation on justice and home affairs. Fifteen countries – Austria, Belgium, Denmark, Finland, France, Germany (originally West Germany), Great Britain, Greece, Ireland, Italy, Luxembourg, the Netherlands, Portugal, Spain, and Sweden – are full members of the organisations of the EU.
5.3.16 As stated in the Directive 2002/49/EC relating to the assessment and management of environmental noise, the Member States must draw up action plans within their territories to manage noise issues to alleviate the noise impacts including:
Noise reduction for places near major roads which have more than six million vehicle passages a year, major railways which have more than 60,000 train passages per year and major airports.
•
•
•
Priorities which may be identified by the exceedance of any relevant limit value or by other criteria chosen by the Member States for agglomerations and for the major roads as well as the major railways within their territories.
The minimum requirements for Action Plans as contained in Annex V of the Directive (refer to Appendix F as attached).
98

5.3.17 However, in the meantime, only certain projects will conduct their own SEA or polices will be formulated for certain specific aspects to tackle the noise problems. Hong Kong’s limited space and poor planning in the past have exacerbated the noise problem (Environment Hong Kong 2001). Therefore an integrated approach on noise planning would likely be beneficial. The minimum requirements for Action Plans in Annex V of the Directive could form the basis for or as a reference to the formulation of integrated policy, plan(s) or programme(s) (PPP) in Hong Kong.
5.3.18 The European Environment Agency (EEA) was initially established by the EU, so all 15 EU member states are Agency members. The aim of the EEA is to establish a seamless environmental information system. This is done to assist the Community in its attempts to improve the environment and move towards sustainability, including the EU’s efforts to integrate environmental aspects into economic policies.
5.3.19 The EEA does not aim to replace existing structures, instead attempts to bring together, in compatible formats, the best available environmental data from the individual countries. This data forms the basis of integrated environmental assessments. The results are disseminated and made accessible to EU bodies, governments, the business community, academia, non-governmental organisations (NGOs) and the general public.
5.3.20 The legal basis for the EU’s environmental policy is found in articles 100a, and 130r to 130t of the Treaty on European Union. While leaving scope for member states to introduce more stringent measures than those agreed at Union level, the Treaty says EU policy should help to:
preserve, protect and improve the quality of the environment; •
•
•
•
•
•
•
•
protect human health;
ensure a prudent and rational use of natural resources; and
promote measures at international level to deal with regional or worldwide environmental problems.
5.3.21 The Treaty requires Union policy to aim at a high level of protection, at rectifying environmental damage at source, and to be based on taking preventive action and making the polluter pay.
5.3.22 Some key instruments of the Union’s environmental policy are:
Environmental impact assessment: a Directive laying down a systematic procedure for assessing the potential damage of individual projects and requiring public involvement in the process.
Free access to information on environmental pollution: this Directive requires national authorities to make information on the environment available to any person on request, without the person concerned having to prove an interest.
Eco-label for environmentally friendly products: this Regulation enables a manufacturer or first importer of a product to apply for an eco-label to the competent body in the member state. This body decides whether to award a label after assessing the product and consulting widely.
Eco-audit: a voluntary environmental auditing scheme co-ordinated by
99

member states which requires participating companies to incorporate environmental protection standards into their production processes.
The LIFE Regulation: a programme designed to provide financial incentives for Union priority projects in the environmental field.
•
•
•
•
5.3.23 Union legislation covers a number of areas including Water pollution, Atmospheric pollution, Noise, Chemical products, Waste disposal, Nature protection (http://www.europa.eu.int/pol/env/index_en.htm).
5.4 Overseas Sustainable Development Strategies
5.4.1 A search of the conditions, practices and policies relating to Sustainable Development and environmental protection for four major cities around the world has been undertaken. These are San Francisco, London, Singapore and Tokyo. Similarities of these cities include dynamic populations, mixed old/new infrastructure, and historical problem of air pollution from vehicles.
5.4.2 The city of San Francisco warrants special attention for its efforts towards achieving sustainable development. It established the Commission on the Environment in 1995 to produce and regularly update plans for the long-term environmental sustainability of San Francisco. The main objectives of the plan include (i) to raise awareness about global environmental issues; and (ii) to create a sustainable economy, and incorporation of these aims with community planning. While the main coverage is air quality, biodiversity, solid waste, water and wastewater, etc., the plan also addresses issues such as environmental justice, municipal expenditures and public information and education. An extract from a sustainable plan for San Francisco is attached as Appendix C.
Singapore
5.4.3 The Singapore Green Plan (SGP), which was unveiled in 1992, encapsulated the concepts of Sustainable Development within a series of action programmes. The basic tenet of the SGP was to set out strategic directions that should be followed to preserve, protect and enhance the environment.
5.4.4 In essence, these are the same tenets as set out in the Hong Kong Government’s White Paper “A Time for Change” which was prepared in response to the international attention given to sustainability following the “Rio Conference”.
5.4.5 In SGP was focused on environmental infrastructure, public health and environmental management. Other areas included environmental education, technology, resource conservation, clean technology, nature conservation and environmental noise.
5.4.6 The Ministry of the Environment claimed that the significant aspects of the SGP have been substantively completed and cited the following:
“Ambient air quality is healthy. It is well within the US EPA Ambient Air Quality Standards and the Long Term Goals for Ambient Air Quality of the World Health Organisation (WHO);
Inland and coastal water is clean and supports aquatic life; and
Singaporeans enjoy high public health standards despite being situated in a
100

region endemic in tropical diseases.”
5.4.7 The new challenge facing Singapore is “environmental sustainability” and how to maintain clean air, water and land in future and this is encompassed within SGP 2012. The key initiatives include:
use of innovative and effective technology; •
•
•
•
•
•
•
•
•
•
•
•
•
•
•
•
active participation of all sectors of the population to maintain a quality living environment (while pursuing economic prosperity); and
responding to the global challenges.
5.4.8 On the basis of the information available, it appears that Singapore has similar aspirations as Hong Kong, however the time frame is only one decade rather than three as envisaged for Hong Kong. This has a significant impact on the targets which may need to be set.
London
5.4.9 In the UK, there are many initiatives and plans being promulgated for Sustainable Development. The three objectives of London’s Sustainable Development Unit are:
to promote Sustainable Development to business in London;
to promote Sustainable Development to local authorities and a broader audience in London; and
to ensure Sustainable Development is embedded in all the policies and programmes of the Government Office for London.
5.4.10 Issues which are being addressed include the Local Agenda 21, biodiversity, waste, climate change, energy efficiency and environmental best practices. The overarching government policy is set to take account of ten guiding principles:
putting people at the centre;
taking a long term perspective;
taking account of costs and benefits;
creating an open and supportive economic system;
combating poverty and social exclusion;
respecting environmental limits;
the precautionary principle;
using scientific knowledge;
transparency, information, participation and access to justice; and
making the polluter pay.
5.4.11 The aforementioned are similar to the tenets set by Hong Kong in overall terms, but are generally broad aims, rather than specific measurable targets and goals.
101

Specific targets set by the UK are:
20% reduction in CO2 emission by 2010 (Kyoto commitment); and •
• 60% of UK’s new houses to be built on brownfield sites.
Tokyo
5.4.12 Tokyo has similar strategies towards Sustainable Development, in terms of implementation through Agenda 21. However, specific details are not available due to the fact that they are compiled in Japanese language.
5.5 Overseas Sets of Targets
5.5.1 There is no definitive set of international targets for air quality, water quality and noise etc. In many cases, WHO guidelines are used to assist in the preparation of specific targets which reflect a country’s underlying baseline conditions in terms of size, topography, infrastructure and population. The environmental standards and targets of other World Cities, such as London, Singapore and Tokyo, have been investigated. The details have been compared with those of Hong Kong and used to assist in the preparation of Hong Kong’s environmental targets.
5.5.2 For air quality, there are directly comparable and measurable targets for compliance. Water quality standards generally refer to the quality of the drinking water, water courses/bodies and groundwater, the relevance of which is the area’s reliance on the locality of these resources. Noise targets and renewable energy targets will also be reviewed within this section.
5.5.3 All three cities have sets of targets for conservation of natural areas and biodiversity, depending on the existing baseline conditions, and in particular available space. Details of the existing international conventions for ecology are detailed in Appendix D.
5.5.4 Improving the amount of green space and the aesthetic value of the urban environment is an aim for all of the world cities discussed in this section. The means by which this is achieved will be subject to land use planning direction and the environmental baseline, in particular available space. It is recognised internationally that managed open spaces set aside for recreational purposes are an important resource. Efforts being made within Hong Kong to rehabilitate landfill sites for recreational purposes and regeneration of derelict or contaminated urban environments are excellent examples of improving capital stock in terms of open space in urban areas where land is in short supply.
5.5.5 There are a number of international treaties and conventions which provide for international co-operation for the protection of specific resources. Lists of international conventions for subjects including ecology and cultural heritage are provided in Appendix D.
5.5.6 Table 5.1 provides details of the environmental issues on which London, Singapore and Tokyo have signed international agreements.
102

Table 5.1 International Agreements on Environmental Issues Signed by London, Singapore and Tokyo
COUNTRY/CITY INTERNATIONAL AGREEMENT
London (England and as such
London)
Air Pollution, Air Pollution-Nitrogen Oxides, Air Pollution-Sulphur 94, Air Pollution-Volatile Organic Compounds, Antarctic-Environmental Protocol, Antarctic-Marine Living Resources, Antarctic Seals, Antarctic Treaty, Biodiversity, Climate Change, Desertification, Endangered Species, Environmental Modification, Hazardous Wastes, Law of the Sea, Marine Dumping, Marine Life Conservation, Nuclear Test Ban, Ozone Layer Protection, Ship Pollution (Marpol Conventions), Tropical Timber 83, Tropical Timber 94, Wetlands, Whaling. Signed but not ratified: Air Pollution-Persistent Organic Pollutants, Climate Change-Kyoto Protocol
Singapore Biodiversity, Climate Change, Desertification, Endangered Species, Hazardous Wastes, Law of the Sea, Nuclear Test Ban, Ozone Layer Protection, Ship Pollution
Japan and as such Tokyo
Antarctic-Environmental Protocol, Antarctic-Marine Living Resources, Antarctic Seals, Antarctic Treaty, Biodiversity, Climate Change, Desertification, Endangered Species, Environmental Modification, Hazardous Wastes, Law of the Sea, Marine Dumping, Nuclear Test Ban, Ozone Layer Protection, Ship Pollution, Tropical Timber 83, Tropical Timber 94, Wetlands, Whaling. Signed but not ratified: Climate Change-Kyoto Protocol
Noise
5.5.7 WHO has developed a set of guidelines for noise exposure in urban environments. Details of which are provided in Appendix D.
5.5.8 Details of the approach of different countries / cities to noise are provided in Table 5.2.
Table 5.2 Comparative Approach to Noise Impacts
COUNTRY/CITY POLICIES AND REGULATIONS
London The Mayor of London and GLA are developing a strategy for tackling ambient noise in London. The draft ambient noise strategy will be available for consultation in May 2002, and will be published on 31/7/2003.
United States of America
Noise Control Act was implemented in 1972. The Act was supposed to protect health and well-being with an adequate margin of safety. This was accomplished in 1974 with the publication of the US EPA “Levels Document”. Subsequently guidelines for conducting environmental impact analysis were developed. (Ref: Guidelines for Community Noise, Geneva, WHO, 1999)
Singapore There is no noise policy, however permissible noise levels are set through the Environmental Pollution Control Regulations 1999.
Republic of Korea The Environmental Pollution Prevention Act was first established in 1963 and was revised as the Environment Preservation Act in 1977. The Government found that the control on various aspects of noise and vibration was ineffective. In 1990 the Act was subdivided into different categories including Noise and Vibration Control Act.
103

COUNTRY/CITY POLICIES AND REGULATIONS
Japan and as such Tokyo
No strategic noise policy. The Noise Control Law was enacted in 1968. It is intended to regulate the noise generated by the operation of factories and other types of work sites, including construction work, and to set maximum permissible levels of motor vehicle noise. Stipulated in the Basic Pollution Control Law of 1971, environmental control standards on noise were established based on requirements on noise control to preserve the living environment and protect human health. Different noise standards for different types of region and time periods were established. They have more specific control requirements on construction works at different areas, such as the type of construction activity, allowable duration, and allowable working hours during the day. In 1998 Japan reviewed the Environmental Quality Standards for Noise and revised the types of region from 3 to 4 types. However the noise standards have been relaxed, for instance in major residential areas, the daytime standard value has been increased from 50dB(A) to 55dB(A).
Taiwan Noise Pollution Control Act was promulgated in 1983 and amended in 1992. Draft amendments were approved by the Executive Yuan on 19 January 2000 and are under review by the Legislative Yuan. The revisions strengthen controls on all types of sites including noise from residential areas. They also include new controls on low-frequency noise pollution sources such as water-cooling towers, air coolers, and air conditioning systems, as well as on bothersome noise sources such as firecrackers and indoor remodelling.
EU The European Community has been aware of the noise emission problems for more than 30 years. Certain categories of noise emissions from products are already covered by Community legislation, such as Council Directive 70/157/EEC of 6 February 1970 on the approximation of the laws of the Member States relating to the permissible sound level and the exhaust system of motor vehicles. Their active approaches on the improvement of the noise environment includes periodic review of their current noise exposure in the region and the suitability of the established noise policy, the enactment of Council Directives, the investigation on the economic costs on the implementation of mitigation measures and assessment methodology. Although the directive does not set any limit value, nor does it prescribe the measures to be used in the action plans, which remain at the discretion of the competent authorities, the EU is developing a long-term strategy which includes objectives to reduce the number of people affected by noise in the longer term, and provides framework for developing existing Community policy on noise reduction from source.
Air Quality
5.5.9 WHO has set guidelines for air quality, details of which are contained in Appendix D. Table 5.3 below details the comparative approach of three countries/cities to air quality.
104

Table 5.3 Comparative Air Quality Regulations and Guidelines
COUNTRY/CITY REGULATIONS AND GUIDELINES
London The most significant source of air pollution in London is from traffic. As a result of concerns regarding air quality, the National Air Quality Strategy was introduced in March 1997, under the Environment Act 1995. This legislation brought about sets of targets for eight different air pollutants which have to be met by 2005, these targets are contained in Appendix D. The targets are used as a benchmark to see if air pollution is getting better or worse. Areas where it is considered unlikely that these targets will be met are designated as air quality management areas. In these areas the Local Authority puts together a plan to improve the air quality - a Local Air Quality Action Plan.
Singapore Singapore currently uses US EPA National Air Quality Standards (NAAQS) and the Long Term Goals for Ambient Air Quality of WHO. Details of the targets for NAAQS are contained in Appendix D.
Tokyo Automobile traffic is a major cause of urban air pollution in Tokyo. The Japanese Government has several environmental protection laws in effect relating to automobiles, including the Law Concerning Special Measures for Total Emission Reduction of Nitrogen Oxides from Automobiles (Automobile NOx Law), and the Air Pollution Control Law, aimed at solving congestion and pollution. The Air Pollution Control Law provides for stations in several parts of the country for a range of typical air pollutants. The Japanese Environment Agency continues its efforts to reduce urban air pollution by strengthening measures to cut emissions from factories and businesses, enforcing regulations for automobile exhaust gases, and promoting low-emission vehicles. However, an increase in diesel freight transport vehicles may have an adverse effect on air pollution control measures. In June 2001, air quality emission controls were further tightened, and the Tokyo Metropolitan Assembly recently approved an ordinance banning diesel-powered commercial vehicles from Tokyo streets if they exceed a limit on emissions of dangerous particles. The plan started in December 2000, and is scheduled to take full effect by October 2003. Details of the air quality standards for Japan are contained in Appendix D.
5.5.10 The European Community is aware of the environmental noise problems in Europe and the increase in the number of complaints received from the public. Green Paper on Future Noise Policy (COM(96) 540) was adopted and published by the Commission in November 1996. This Green Paper is the first step in the development of such a programme and aims to stimulate public discussion on the future approach to noise policy. It aims at giving noise abatement a higher priority in policy making and reviews the overall noise situation in the Community and national action taken to date. It also includes the outline of a framework for future action covering the improvement of information and its comparability and future options for noise from different sources.
5.5.11 The new framework for noise policy outlines options for future action including a proposal for a directive providing for the harmonisation of methods of assessment of noise exposure and the mutual exchange of information. Actions to reduce road traffic noise will address tyre noise and investigate the possibility of integrating noise costs into fiscal instruments, amending Community legislation on road worthiness tests to include noise and the promotion of low noise surfaces through Community funding. Other issues addressed include the noise problem due to the expansion of rail capacity, noise from air transportation and
105

simplification of the existing legislation setting emission limits for outdoor equipment including construction and garden machinery. (Ref: Noise – The Green Paper, http//europa.eu.int/comm./environment/noise/greenpap.htm).
5.5.12 At a conference held on 1 - 11 December 1997 in Kyoto of Japan, the Parties to the United Nations Framework Convention on Climate Change agreed to an historic Protocol to reduce greenhouse gas emissions by harnessing the forces of the global marketplace to protect the environment. A central feature of the Kyoto Protocol is a set of binding emissions targets for developed nations. The specific limits vary from country to country. The overall targets adopted for greenhouse gas emissions by 2008-12 are an 8% cut from 1990 levels for the European Union (EU), 7% for the USA, and 6% for Japan and Canada. Australia is allowed an 8% increase, while Russia has a target of 0% (i.e. 1990 levels). The national greenhouse gas emission targets are summarised in Appendix D.
Cultural Heritage
5.5.13 International experience of heritage preservation in Singapore, Sydney (New South Wales) and New York may offer insights into the planning related issues such as the provision of planning and financial incentives and the designation of heritage precincts. The concept of heritage precinct in Singapore and Sydney may provide inspiration to our approach to preservation.
5.5.14 Incentive to heritage preservation can be provided through planning instrument such as concessions, transfer of plot ratio and wavier of use or bulk requirements.
5.5.15 Transfer of plot ratio means transfer of development potential of one site to another. In the City of Sydney, the potential floor space (development potential) from the listed heritage sites can be transferred to another site, and such transferred development potential can be sold. In New York City, development rights of landmarks can be transferred to another site.
5.5.16 Planning concession is available in Singapore and New South Wales. In Singapore, concessions include waiving of car park provision, development charge, and car park deficiency charge. In New South Wales, concessions to building site ratio and parking provision are offered.
5.5.17 Waiver of use/bulk requirements is available in New York City. Individual landmarks and buildings in historic districts are eligible for waiver of zoning restrictions, provisions regulating the use, and built form control (HK2030 SGM Information Note 8/2001). Further information relating to methods of heritage conservation is contained in Appendix D.
Water Quality
5.5.18 The means by which water quality is assessed varies between countries/cities, details are provided in Table 5.4 below.
106

Table 5.4 Comparative Water Quality Regulations and Guidelines
COUNTRY/CITY REGULATIONS AND GUIDELINES
England - London In the UK, water quality is the responsibility of the Environment Agency. The Agency uses a General Quality Assessment (GQA) scheme to classify river quality into six grades from Grade A (very good) to Grade F (bad). The GQA scheme is the Agency’s national method for classifying water quality in rivers and canals. It provides a way of comparing river quality from one river to another and for looking at changes through time, based on chemistry, biology and nutrient parameters and aesthetics. Details of the classifications are provided in Appendix D.
The quality of bathing waters in England and Wales is monitored against standards set down in the Bathing Water Regulations (SI 1991/1597), which comes from the EC Bathing Water Directive (76/160/EEC). The Bathing Water Directive was created to protect public health and to improve or maintain water quality.
Singapore The water bodies within Singapore comprise of catchment areas where water is collected for the production of drinking water, and non-catchment areas. These bodies are monitored for parameters including pH, dissolved oxygen (DO), biological oxygen demand (BOD), total suspended solid (TSS), ammonical-nitrogen and sulphide; and coastal waters are subject to physical, chemical and bacteriological examinations.
Japan - Tokyo Japan’s water quality is regulated by the Environment Agency, who established the Environmental Quality Standards (EQS) for groundwater in March 1997, aiming at further promotion of comprehensive conservation of groundwater environment. The EQS are applied to all groundwater, and the same standard values are established as the standard for protecting human health with the 23 substances of the EQS for public water resources. Japan has a range of legislative mechanisms and targets for the control of water. Standard values for groundwater in Japan are contained in Appendix D.
United States Regulation, protection and improvement of water resources and supplies in the United States are the responsibility of the Environmental Protection Agency. The Office of Water protects public health by ensuring safe drinking water and protecting groundwater; regulates the nation’s discharges into surface waters such as wetlands, lakes, rivers, estuaries, bays and oceans; and protect the nation’s water resources on a watershed basis. The quality of drinking water in the states is monitored against standards set down in the Safe Drinking Water Act which are provided in Appendix D.
Energy and Natural Resources
5.5.19 A comparative study of worldwide policies regarding uptake of renewable energy resources was conducted by Moore and Ihle in 1999. A summary of the report findings is contained in Table 5.5.
107

Table 5.5 Policies / Statutory Requirements of Selected Countries on the Use of Non-fossil Fuel / Renewable Energy Sources
COUNTRY POLICIES/STATUTORY REQUIREMENTS
The Mainland of China
In 1995, the People’s Government voiced new commitment to renewable energy, as outlined in the New and Renewable Energy Development Program, 1996-2010, developed by the State Economic and Trade Commission and the former State Planning Commission and State Science and Technology Commission. The project comprises the installation of 190 MW wind farms and 10 MW PV system from 1999 to 2004. Of which, Shanghai will install 20 MW wind turbines.
Australia Mandatory target of additional 2% of their power generation from renewable energy. This will move up the share of renewables to 11% by 2010.
Japan The Law concerning the Promoting of the Development and Introduction of Alternative Energy requires waste to energy to be encouraged, via subsidisation, policy incentives and government funded R&D. The New Energy Law of 1997 focuses on the technology deployment so that renewables will supply 3.1% of Japan’s primary energy use by 2010.
Japan also has pledged to generate 5,000 MW of electricity using waste-to-energy technology by 2010.
Republic of Korea A target to supply 2% of total energy demand by new and renewable energy in 2006.
European Union The Communication from the Commission entitled “Energy for the Future: Renewable Energy Sources - White Paper for a Community Strategy and Action Plan (COM(97) 599 final)” and the European Council Resolution of 8 June 1998 on renewable sources of energy (OJ C 198, 24.6.1998) stipulates a target to double the share of renewable energies in gross domestic energy consumption across the EU from the present 6% to 12% by 2010. All member states are required to set national (non-binding) targets for renewables to be consistent with the EU’s target. Achieving this gross energy consumption objective of 12% would result in a 22.1% share of electricity produced from renewable energy sources. Current contribution of renewable energy sources to electricity supply in fifteen EU member states range from 3 to 71% (overall 16%).
United Kingdom Under the UK’s Non-Fossil Fuel Obligation Orders, more than 2% of its electricity (about 1,177 MW) is generated from renewable sources. The UK aims to increase renewable output to 5% by 2003 and 10% by 2010. The UK would be required to generate 10% of electricity by renewables by 2010 under EU’s target.
Ireland In 1996, 2% of power was from renewable energy. Share of renewable energy in total energy supply to be increased to 5% by 2010. Ireland would be required to generate 13.2% of electricity by renewables by 2010 under EU’s target.
Denmark 20% of electricity consumption from renewable energy by 2003. Use of 1.4 million tonnes of biomass for production of electricity and heat and installation of 750 MW offshore wind power capacity by 2005 and 2008 respectively. Denmark would be required to generate 29% of electricity by renewables by 2010 under EU’s target.
Netherlands Netherlands would be required to generate 12% of electricity by renewables by 2010 under EU’s target.
108

COUNTRY POLICIES/STATUTORY REQUIREMENTS
United States Non-hydro renewables and alternative energy currently accounts for 2% of electricity needs. Hydropower provides about 7% of electricity supplies. The New York State requires, through an executive order, the purchase of no less than 10% and 20% of the overall State facility energy requirements from renewables by 2005 and 2010 respectively.
Source: (Moore & Ihle 1999)
5.5.20 Further details of targets for the use of renewable energy are contained in Appendix D.
Risk Management
5.5.21 There are a number of nationally applied risk acceptability criteria used in various countries. Risk criteria are expressed in terms of Individual Risk which is a measure of the incremental increase in the probability of death of an individual working on, or living near a PHI; or Societal Risk which expresses the risk to the whole population in the vicinity of the PHI.
5.5.22 Risk criteria are most commonly given for Individual Risk. These are often expressed in terms of an upper (intolerable) limit and a lower (negligible) limit, with the risks lying between these limits subject to demonstration of acceptability. A selection of some of these limits is given in Table 5.6.
Table 5.6 Selected National Individual Risk Criteria
COUNTRY UPPER (INTOLERABLE) RISK CRITERIA
LOWER (NEGLIGIBLE) RISK CRITERIA
Netherlands 1 x 10⁻⁶ United Kingdom 1 x 10⁻³ (workers)
1 x 10⁻⁴ (public) 1 x 10⁻⁶
Australia (NSW & WA) 5 x 10⁻⁵ to 5 x 10⁻⁷ Canada 1 x 10⁻⁴ to 1 x 10⁻⁶ USA (Santa Barbara, Calif.) 1 x 10⁻⁵ 1 x 10⁻⁶ Hong Kong 1 x 10⁻⁵
Note: Many countries reduce their risk criteria when dealing with vulnerable population groups (i.e. children, the elderly and hospital patients)
5.5.23 The criteria for Societal Risk are usually expressed in graphical format. Examples of these are shown below in Figures 5.1 and 5.2. Hong Kong applies an upper societal risk criteria of 1 fatality every 10³ years to 1,000 fatalities every 106 years and a lower risk criteria of 1 fatality every 105 years to 1,000 fatalities every 108 years. The “as low as reasonably practicable” principle is applied to activities operating within these limits. The aversion to major disasters sets an upper limit of 1,000 fatalities irrespective of the likelihood.
109

Figure 5.1 Dutch Societal Risk Criteria
Figure 5.1(b) USA (Santa Barbara, Calif.) Off-Site Societal Risk Criteria
110

Figure 5.2 USA (Santa Barbara, Calif.) Off-Site Societal Risk Criteria
111

5.6 Potential Environmental Targets for Hong Kong
5.6.1 There are a wide variety of standards and targets applied globally, each tailored for the country’s prevailing environmental conditions to include infrastructure, geography, population, sensitive receptors and baseline conditions. These country specific targets should ensure that achievable targets are provided which can be improved/advanced over time.
5.6.2 Some targets already exist for Hong Kong. These have been reviewed, and new targets need to be established which can be revised periodically to reflect changes in environmental conditions. To ensure ongoing environmental improvement, the standards and targets of London are deemed to be particularly relevant due to its recognition as a World City, the relatively high population densities, the mixture of old and new buildings and facilities, mobile/transient populations and the high reliance on buses, etc. which create emissions problems (along with other sources). The intention is not to adopt its targets but rather to tailor these to the specific situation in Hong Kong.
5.6.3 In his Policy Address 1999, the Chief Executive has stated his vision to make Hong Kong an ideal home and to start working in partnership to achieve what is known as “sustainable development”. Therefore a key target would be to achieve this vision.
Noise
5.6.4 Noise is a particular concern in Hong Kong because of the close proximity of source to sensitive receptors. The Noise Control Ordinance stipulates noise limits for a range of activities. Noise planning is becoming increasingly important in Hong Kong to reduce noise exposure, and targets need to be set for Hong Kong to reduce the number of people exposed to excessive noise. An ambient noise strategy similar to that of London would compliment the existing approach to noise management, allowing progressively more stringent noise targets above and beyond guideline values proposed by the WHO. The purpose of the comparison with other world cities and benchmarking is to identify existing and planned best practices. Of those cities chosen, London is preparing an ambient noise strategy which is likely to represent the most proactive and best practice. The HK2030 SEA is intended to identify the appropriate individual environmental standards and targets for the future in broad directions. We believe a strategic noise policy would complement the existing noise control mechanisms. Such a policy would allow for (but not necessarily mandate) progressively more stringent noise targets. This is considered worthwhile to meet perceived public desires for a quieter environment (as evidenced by public consultation and noise complaints) and the expectation that future targets should go beyond legislation and be better than levels set purely for health reasons.
5.6.5 Potential targets for Hong Kong include:
• further reduction in sound power levels of construction works in the short term
• reduction in noise emission standards in the medium term
• reduction in noise level in the medium term
• progressively reduce the number of people exposed to excessive noise
112
Air Quality
5.6.6 The baseline conditions with respect to air quality in Hong Kong are of concern. The future situation regarding air quality is closely linked with future strategies for the use of energy and natural resources as well as transport policies. Regarding the use of energy and natural resources, regulations are in place to control the emissions from the Specified Processes such as power plants, incinerators and batching plants. To reduce sulphur dioxide emissions, the Fuel Restriction Regulations prohibit the use of solid and liquid fuel in Shatin and restrict the sulphur content of fuel in other districts (e.g. Hok Yuen Power Station). The Open Burning Regulation and the Construction Dust Regulation were introduced in 1996 and 1997 respectively to help reduce the particulate emissions. On the other hand, a major cause of air quality problem is emissions generated from vehicular traffic. Policies to convert diesel taxis to LPG have had some success with respect to improving roadside air quality. Further emission reductions can be achieved through reducing the use of private transport and adopting new technologies. Air Quality Objectives were established in 1987 under the Air Pollution Control Ordinance. These objectives are to be reviewed from time to time. Future land-use planning must take into consideration the effects of buildings in restricting air movement. Co-operation is also required with the Guangdong Provincial Government to provide a strategy for managing trans-boundary air pollution.
5.6.7 Potential targets for Hong Kong include:
• reduction in the use of fossil fuels, especially the use of diesel in urban areas
• reduction of canyon effect, say, through appropriate land use planning
• decreased reliance on vehicular transport
• increased use of public transport
• reduction in the effect of trans-boundary air pollution, e.g. through better co-operation with the Guangdong Provincial Government
• reviewing AQO from time to time taking into consideration overseas developments, and improving air quality progressively towards any revised targets
Geology, Soils and Contaminated Land
5.6.8 There is no list/register of potentially contaminated sites, and presently contamination issues are generally addressed during site redevelopment when a range of international standards are used to identify contaminated land. Investigation and mapping of potentially contaminated sites will be required in order to plan for reuse. A contaminated land register would be beneficial to provide information on sites which have an environmental risk, particularly in light of the likely future increase in the use of brownfield sites for redevelopment.
5.6.9 Potential targets for Hong Kong include:
• reduction in the development pressure on greenfield sites by means of, e.g. regeneration of derelict sites, ex-industrial areas, landfill sites, and PHIs sites etc.
113

• enhancement of information on the potential environmental risk associated with development of brownfield sites through the provision of a contaminated land register.
Water Resources and Water Quality
5.6.10 Freshwater and marine water suffer to a greater or lesser extent from pollution from domestic, commercial, industrial and agricultural wastes. The Government aims to achieve marine and freshwater quality objectives that will safeguard the health and welfare of the community and meet various conservation needs. Under the Water Pollution Control Ordinance, 10 WCZs have been set up. WQO have been set for the WCZs and sewerage master plans have been developed which provide a blueprint for sewerage infrastructure required to collect sewage on a catchment-by-catchment basis and direct to treatment facilities. Depending on the existing water quality of the WCZ, adoption of higher treatment level (e.g. CEPT, secondary and tertiary) of sewage prior to discharge should be a target, which will require the installation of additional pollution prevention infrastructure and sewerage facilities. Soft engineering practices could also be incorporated which will have the benefit of reducing treatment costs, while providing additional wetland habitats.
5.6.11 Hong Kong needs to import freshwater to supplement the existing freshwater resources. The demand for freshwater is likely to increase with the growing population and this will require either increasing local supply by building new reservoirs/expanding existing ones or increasing the amount imported from the Dongjiang, or by doing both. An important issue is that there will be a high potential for pollution of the freshwater supply from the Dongjiang Basin given the significant economic developments in this area. One of the pollution prevention measures is to construct the closed water supply route, which is already an on-going project.
5.6.12 Potential targets for Hong Kong include:
• reduce water consumption and seek opportunities on effluent reuse
• proper/adequate sewage treatment level prior to discharge
• management of riparian vegetation for enhancement of organic matters removal
• reduction in trans-boundary pollution, e.g. through better co-operation with Guangdong
• review WQO regularly to keep in line with international practices
• 100% compliance with WQO in the long term
Waste
5.6.13 Quantities of different types of solid waste disposed of are monitored, and waste reduction and recycling is encouraged. The initiatives for waste reduction are contained within the Government’s Waste Reduction Framework Plan. The key target is to safeguard the health and welfare of the community from adverse environmental effects associated with the handling and disposal of waste. There are particular plans for the reuse of C&D materials.
114

5.6.14 Potential targets for Hong Kong include:
• increase waste prevention, separation and recovery including the sorting of different types of wastes at source
• increase the amount of waste separation and recovery through, e.g. provision of necessary services and facilities, support to the development of the recycling sector, sustained effort in education and publicity in waste reduction, and development of integrated waste management facilities for handling non-recyclable wastes
• minimise excessive packaging wherever possible
• regeneration of existing buildings, and reuse and recycling of inert C&D materials to minimise volumes entering landfills
Energy and Natural Resources
5.6.15 Various methods have been employed by the Government to improve energy efficiency in buildings and various schemes have been implemented by the private sector. There are aims to increase the use of renewable resources and improve energy efficiency, such as implementation of water-cooled air conditioning systems in Hong Kong. However, specific targets are required regarding reduction in energy use and the associated atmospheric emissions. China is a signatory to the Kyoto Protocol and will be taking part in global effort to abate global warming. This can be achieved through the use of sustainable energy sources, using cleaner fuel rather than fossil fuel for power generation and the incorporation of energy saving features.
5.6.16 Potential targets for Hong Kong include:
• reduce the use of non-renewable energy through, e.g. use of energy-from-waste installations, increased use of renewable energy; and incorporation of energy saving features in buildings, etc.
• control greenhouse gas emissions through joint international effort and increased usage of public transport, etc.
• provision of targets for energy reduction in the future
Landuse and Landscape
5.6.17 To enhance the value and interest of the urban environment, culturally significant features must be incorporated into urban redevelopment projects. Opportunities for the reuse of existing and historic buildings should be considered to increase the diversity of the urban environment, this will also reduce the volume of building materials which will require disposal to landfill. A number of cities and city-regions have developed specific policies and statutory instruments that put landscape conservation and planning issues at the very centre of the development process, rather than relying on the creation of greenspaces through left-over fragments remaining once all the roads, railways, housing estates, drainage channels, utility services etc. have been built. There is a clear and urgent need for a co-ordinated landscape conservation and planning policy with objectives including conservation of non-designated landscapes and the quality of the whole living environment rather than on the component parts.
115

5.6.18 A cohesive set of landscape conservation and planning objectives are required. Potential targets for Hong Kong include:
• further enhancement in the protection of landscape through:
− formulating a territory-wide mapping of urban and rural landscape resources together with an indicator to measure the sensitivity of change of various landscape resources, as well as district-level landscape master plans for urban areas;
− adopting a fully co-ordinated approach to design, implementation and maintenance of public landscape works where emphasis is on all three stages rather than solely on maintenance; and
− devising planning procedures for validating design proposals and implemented projects against statutory landscape conservation and planning objectives.
• active greening of urban areas, through tree planting etc.
5.6.19 There are various methods of improving the aesthetic value of the urban landscape, whilst conservation efforts for natural landscapes and heritage features should ensure the continuing existence of valuable natural landscapes.
Risk Management
5.6.20 Plant safety improvement works have been progressively implemented and now all non-fuel gas PHIs are within the risk guidelines. However, the risk management of PHI sites is an ongoing process due to changes in plant inventories and population development near PHI sites. In addition to PHI sites, the risk guidelines are now used as assessment criteria under the EIA Ordinance for projects which involve manufacturing, storage, using or transportation of dangerous goods (EPD 2001).
5.6.21 Potential target to be set for Hong Kong could include:
• review the declassification opportunities with respect to re-zoning of industrial land
Ecology
5.6.22 Much of Hong Kong’s remaining natural areas are protected, either by their inaccessible location or through designation as Country Parks etc. The existing nature conservation strategy could be improved and is currently under review. It is important that the strategy is clear and comprehensive. Further surveys are necessary to provide a more complete record of current baseline conditions. Targets are required to maintain existing nature conservation areas and to manage and enhance urban natural areas for the benefit of local people and wildlife. To preserve the countryside and other important rural areas, the Government must promote reuse of brownfield sites (e.g. EPD is restoring landfills for recreational uses).
116

5.6.23 Potential targets to be set for Hong Kong could include:
• further enhancement in the protection of ecological resources on both government and private lands through, e.g. provision of an updated nature conservation policy, and better management and monitoring of existing ecological resource, etc.
Cultural Heritage
5.6.24 The policy for heritage conservation is currently under government review. There is presently no clear policy definition on targets for cultural heritage preservation. The current standard for heritage preservation can be found under the EIA Ordinance, in particular under Technical Memorandum-Annex 10 Criteria for evaluating visual and landscape impacts, and Impact on sites of cultural heritage; and Annex 19 Guidelines for assessment of impact on sites of cultural heritage and other impacts. There should be presumption for preservation of all sites of cultural heritage in-situ, total destruction being taken as the very last resort. This standard should be subject to review in view of the time scale adopted by the current study. A policy is required which states the objectives and path for cultural heritage conservation in the future.
5.6.25 Potential targets for Hong Kong include:
• further enhancement in the protection of cultural heritage resources through, e.g. developing a list of objective assessment criteria for evaluating heritage value, implementing a comprehensive cultural heritage protection strategy, and incorporating culturally interesting features into planning, etc.
Table 5.7 Summary of Potential Environmental Targets
Noise
(refer to 5.6.5)
• further reduction in sound power levels of construction works in the short term
• reduction in noise emission standards in the medium term
• reduction in noise level in the medium term
• progressively reduce the number of people exposed to excessive noise
Air Quality
(refer to 5.6.7)
• reduction in the use of fossil fuels, especially the use of diesel in urban areas
• reduction of canyon effect, say, through appropriate land use planning
• decreased reliance on vehicular transport
• increased use of public transport
• reduction in the effect of trans-boundary air pollution, e.g. through better co-operation with the Guangdong Provincial Government
• reviewing AQO from time to time taking into consideration overseas developments, and improving air quality progressively towards any revised targets.
117

Geology, Soils and Contaminated Land
(refer to 5.6.9)
• reduction in the development pressure on greenfield sites by means of, e.g. regeneration of derelict sites, ex-industrial areas, landfill sites, and PHIs sites etc.
• enhancement of information on the potential environmental risk associated with development of brownfield sites through the provision of a contaminated land register.
Water Resources & Water Quality
(refer 5.6.12)
• reduce water consumption and seek opportunities on effluent reuse
• proper/adequate sewage treatment level prior to discharge
• management of riparian vegetation for enhancement of organic matters removal
• reduction in trans-boundary pollution, e.g. through better co-operation with Guangdong
• review WQO regularly to keep in line with international practices
• 100% compliance with WQO in the long term
Waste
(refer 5.6.14)
• increase waste prevention, separation and recovery including the sorting of different types of wastes at source
• increase the amount of waste separation and recovery through, e.g. provision of necessary services and facilities, support to the development of the recycling sector, sustained effort in education and publicity in waste reduction, and development of integrated waste management facilities for handling non-recyclable wastes
• minimise excessive packaging wherever possible
• regeneration of existing buildings, and reuse and recycling of inert C&D materials to minimise volumes entering landfills
Energy & Natural Resources
(refer 5.6.16)
• reduce the use of non-renewable energy through, e.g. use of energy-from-waste installations, increased use of renewable energy; and incorporation of energy saving features in buildings, etc.
• control greenhouse gas emissions through joint international effort and increased usage of public transport, etc.
• provision of targets for energy reduction in the future
Landuse & Landscape
(refer 5.6.18)
• further enhancement in the protection of landscape through:
− formulating a territory-wide mapping of urban and rural landscape resources together with an indicator to measure the sensitivity of change of various landscape resources, as well as district-level landscape master plans for urban areas;
− adopting a fully co-ordinated approach to design, implementation and maintenance of public landscape works where emphasis is on all three stages rather than solely on maintenance; and
− devising planning procedures for validating design proposals and implemented projects against statutory landscape conservation and planning objectives.
• active greening of urban areas, through tree planting etc.
118

Risk Management
(refer 5.6.21)
• review the declassification opportunities with respect to re-zoning of industrial land
Ecology
(refer to 5.6.23)
• further enhancement in the protection of ecological resources on both government and private lands through, e.g. provision of an updated nature conservation policy, and better management and monitoring of existing ecological resource, etc.
Cultural Heritage
(refer 5.6.25)
• further enhancement in the protection of cultural heritage resources through, e.g. developing a list of objective assessment criteria for evaluating heritage value, implementing a comprehensive cultural heritage protection strategy, and incorporating culturally interesting features into planning, etc.
5.7 Conclusions
5.7.1 Establishment of targets, objectives or benchmarks can be very subjective especially when environment, health and economic development are intrinsically linked. As noted in Appendix D, the WHO recognises this interlinkage in their setting of targets. Although the economics of development options or setting of targets is outside the scope of this Study, it is important to be aware of the dilemmas to be faced, challenges to be overcome and practicalities of the issue to be addressed. As the economics of setting of targets is considered in this Study, the proposed targets set out in the preceding paragraphs must be subject to further assessment and public debate prior to their adoption.
5.7.2 Public participation will be vital to improving environmental standards and reaching environmental targets. One of the key methods of ensuring public involvement is to increase awareness of environmental concerns, and provide education and facilities for the public to ‘do their bit’. The Environmental Campaign Committee (ECC), which was set up in 1990, aims to promote public awareness of environmental issues and encourage the public to contribute actively towards a better environment.
5.7.3 The current means of ensuring public and private companies to consider the environment during planning is through the EIA Ordinance, which was introduced in 1998. This requires that all designated projects, unless exempted, to go through the statutory EIA process to assess their environmental impacts. Even exempted projects are required to take cognisance of environmental concerns through the implementation of environmental management plans or systems (during design, construction and operations).
119

6 Identification of Key Environmental Issues
6.1 Introduction
6.1.1 The nature of the SEA which encompasses all environmental aspects for Hong Kong means that there are many key issues which must be considered. The key issues are merely mentioned within this section, whereas full consideration of these issues at the ‘macro level’ and ‘micro level’ are discussed in detail as part of Task 4. The factors which will potentially have a significant influence on Hong Kong’s environmental resources are outlined below:
6.2 Influencing Factors
Regional Developments
6.2.1 Within the PRD region, rising human populations, increasing use of natural resources and a steady reduction in the area of agricultural land has led to increasing environmental pollution and adverse ecological impacts. These activities not only have a severe impact on the sustainability of the PRD, but also because Hong Kong is affected by these activities, they will act as a considerable environmental constraint on Hong Kong as well.
6.2.2 The PRD has in the past two decades experienced a rapid growth in its economy and urbanisation rate. By the year 2000, the degree of urbanisation reached 45%, and the population density was up to 872 people/km2, and it is fast becoming one of the most densely populated areas of the Mainland. The volumes of municipal domestic wastewater is increasing year on year, and with the low level of wastewater treatment, the volumes of untreated wastewater being discharged directly into rivers are increasing, causing extensive water pollution, not only within cities in the PRD but in the vicinity of the SAR. This is because the natural ability of the environment to break down such organic matters is exceeded due to the sheer volume of materials involved. In addition to the water pollution problems, there are also problems associated with acid rain particularly from industrial and vehicle emissions, and issues associated with solid waste disposal.
6.2.3 The implications of potential regional developments in the PRD will be discussed in the Key Issues Report to identify the potential impacts on Hong Kong’s environment. This will include any changes in the environmental condition of the whole region, and any changes in the pressure of the limited environmental capital, conservation areas and other ecologically sensitive areas within Hong Kong in a regional and global sense, particularly in terms of the requirements for economic development and transport networks.
6.2.4 Whilst it is widely recognised that environmental protection should be taken from a regional perspective, unlike many other countries where regional environmental protection authorities could be set up to ensure co-ordinated efforts across a broader geographical coverage, Hong Kong’s unique situation does not allow such kind of set up. Under ‘one country, two systems’, Hong Kong SAR has no jurisdiction over the development and planning of areas across the boundary and vice versa. Therefore, close co-operation between the governments on both sides is necessary, and further effort is required to ensure that there is an efficient two-way flow of information on the environment and planning issues in the PRD, allowing authorities on both sides of the boundary to formulate separate but mutually beneficial plans.
120

Population Dynamics
6.2.5 Recent observed population figures have differed significantly from previously predicted trends. The factors affecting population growth and movement will be examined, and the current and likely future trends will be reviewed to determine the potential effect that will have on Hong Kong’s environmental resources. Primary concerns to be addressed include the residential infrastructure required (water and wastewater impacts), transport (air and noise) and employment (air, noise, water and waste).
6.2.6 Changes in lifestyle and behavior of the population will to a certain extent impact on our environment. For example, increased private car ownership will cause noise and air pollution problems. A more affluent population will have a greater demand for consumer products which may in turn generate more wastage. Increasing demand for improvement in living conditions may drive some people to move away from city centres for more living space which may increase travelling distances of work journeys.
6.2.7 Environmental issues have caught much public attention in the past few decades. Apart from the conventional areas of concern such as air quality, noise and water quality, a new movement towards sustainable development has emerged in many developed countries which recognise the importance of long-term sustainability. As such, environmental concerns have been brought upfront instead of being left at the end of the pipeline as in the past.
Economic Transformation
6.2.8 Over the past 50 years, Hong Kong has experienced two major economic transformations. Hong Kong’s main economic activity shifted from entrepot trade to manufacturing/processing industries in the 1950s and 60s, and turned into a financial, trading and transportation centre for the Asia Pacific region in the late 1970s and 80s with the bulk of manufacturing industries having relocated to the Mainland. However, the Asian financial turmoil, China’s entry to the WTO and rapid development of information technology all add impetus to Hong Kong’s third economic transformation.
6.2.9 The transformation of Hong Kong’s economic structure would have positive and negative impacts on Hong Kong’s economic and social development, which in turn will have direct or indirect impacts on our environmental resources. For instance, the development of high-tech industries may have special land requirements, and the increase in popularity of home-based offices may greatly reduce work journeys and thus have positive impact on traffic noise and air quality problems.
6.3 Impacts on Environmental Conditions
6.3.1 The above influencing factors are likely to have a major impact on the environmental conditions experienced in the future. Their impact on the potential future environmental condition will be discussed in more detail in the Key Issues Report through examination of the relevant environmental aspects (water quality, waste, ecology etc.). Furthermore, the critical problems facing Hong Kong’s environment and the major issues of concern by the general public will be discussed, in particular, the issues of ecological conservation and landscape planning as well as conservation of cultural heritage resources (which are briefly mentioned below), will be specifically examined in the next report.
121

Ecological Conservation and Landscape Planning
6.3.2 Existing ecological issues include: lack of comprehensive monitoring of resources; and increased pressure from encroachment.
6.3.3 Natural open spaces are home to many wild animals such as birds and butterflies, as these places provide food, shelter and places to breed. These open spaces would also offer city dwellers a place to escape from noise and pollution associated with the city’s growing population and level of economic activity. Whilst development and conservation could be seen as opposing elements, they can be complementary and even mutually enhancing with suitable policies and planning measures. Examples of conservation policies from other World Cities will be reviewed, in particular London’s new biodiversity strategy which is currently being prepared by the Mayor of London.3 London is of particular interest because of its relative success at integrating natural and urban areas for the benefit of local residents and wildlife.
6.3.4 Landscapes can also be enhanced with the incorporation of archaeologically important artefacts or features in terms of providing character to an area. Incorporating biological diversity, character and an aesthetically pleasing environment requires carefully considered planning at several levels over several areas of expertise. It is also recognised that there is potential conflict between conservation and landscaping, as landscaping for aesthetic purposes may erode those natural habitats which support rich biodiversity. An understanding of the natural environment and the value of native species will be required. In addition, investment in habitats management and monitoring will be necessary to identify requirements for intervention should any conflicts arise.
6.3.5 In the Key Issues Report, the underlying influences affecting Hong Kong’s urban and rural landscapes will be assessed. The importance and benefits of having urban integrated rural environments will be discussed, and the nature conservation policy which is currently being reviewed, will be taken into account to determine methods for strengthening and enhancing our ecological and landscape resources.
Conservation of Cultural Heritage Resources
6.3.6 The heritage resources are under significant threat from new development, particularly in urban areas where older buildings with no statutory protection have been demolished to make way for new schemes rather than being incorporated into urban redevelopment programmes. In addition, the areas of highest potential for heritage resources are often in coastal regions where the pressure for new developments and reclamation is greatest. Rural areas are also under increasing threat from encroachment of developments, particularly in growth areas where the lack of development controls on private land is threatening many traditional village buildings and other cultural features.
6.3.7 The problems encountered in the conservation of cultural heritage resources are multi-faceted, interwoven with issues like development pressure due to shortage of land; inadequate resources to restore and maintain a historical building; lack of financial or planning incentives to compensate the owner’s loss if the resources are under private ownership; and absence of an integrated policy to facilitate a better co-ordination for declaration of monuments etc. These issues will be further examined in the Key Issues Report, taking into account the heritage policy currently being reviewed. Issues relating to the post-restoration active use of the historical buildings/sites will also be discussed.
122

6.4 Tackling the Issues
6.4.1 There are a number of changes or measures that could bring about environmental improvements. It should be recognised that environmental objectives are best achieved not only through environmental initiatives per se (such as changes in fuel type and standard, use of renewable energy and recycled materials, tightening of legal controls etc.), but also through an environmentally conscious land use and infrastructure plan. Hong Kong’s long-term development strategy should embrace all environmental factors while ensuring that economic and social factors are equally considered under the principle of sustainable development.
6.4.2 A list of environmentally friendly strategic options for HK2030 will be suggested in the Key Issues Report which could potentially enhance the environmental conditions, and facilitate meeting the environmental targets, in particular for those areas where improvements in environmental efficiency are needed (such as new and renewable energy). The options for the future will reflect the potential direction of further investigations or development. These will include the following aspects:
“No-go” Areas
6.4.3 A system for land protection, including the concept of “No-go” areas, will be explored with a view to protecting and enhancing resources of unique or significant ecological, archaeological, heritage or landscape values. Attempts will also be made to devise the criteria for defining various types of protected areas including “No-go” areas. Moreover, the ways for active conservation and appropriate management of the protected areas will be discussed.
Infrastructure and Transport Planning
6.4.4 The requirements and potential direction of future infrastructure and transport planning is to be reviewed taking account of the impacts of developments in terms of collection, treatment and disposal of liquid and solid waste, noise and air quality improvements or impacts due to increases in transport links (including rail and road development in which they are not mutually exclusive to each other but rather serve in different purposes).
Environmentally Sound Technology (EST)
6.4.5 A review will be conducted to investigate technological features which could be effectively incorporated into planning, and the likely future direction of environmental technology. While it is recognised that costs are a key driver in the selection of EST, cost benefit analyses will not be performed under this SEA.
123

Conservation of Energy Resources
6.4.6 Future trends in energy consumption and potential energy requirements for Hong Kong will be examined. Opportunities for the conservation of resources as well as the benefits in terms of air quality will also be considered.
Building Construction and Design
6.4.7 The impact of energy conservation features and potential for the use of renewable energy and the use of recycled materials in building construction will be reviewed. The impact of effective planning will be investigated to examine methods of increasing air movement in and around buildings, and waste reducing features etc. will also be documented.
Institutional Mechanisms
6.4.8 Existing institutional mechanisms within the Government relating to environmental aspects will be reviewed. Methods of increasing the effectiveness to meet the environmental targets, such as to provide better research support and incentives as well as establish a community network to increase public awareness, will also be examined. Moreover, the possibility of better engaging the private sector through partnership schemes in the conservation and management of habitats, cultural and landscape features or characteristic environments will be discussed.
124

7 Conclusions and Recommendations
7.1 Initial Assessment
Noise
7.1.1 The CTS-3 SEA revealed that if nothing were done in curbing the ever-increasing traffic growth, some additional 50% of people would be exposed to high traffic noise as compared with the situation in 1997. In order to prevent this situation from happening in the future, more careful land use and infrastructure planning to pre-empt noise problems, implementation of noise abatement programmes, stringent enforcement of noise control legislation, and greater social awareness on environmental protection should be considered. The increasing population will increase the need for transport facilities and also create pressure, unavoidably, to place sensitive receptors close to noise sources. The investigation of environmentally friendly transportation modes (such as trolley buses) should be conducted.
7.1.2 The Green Paper on Future Noise Policy (COM(96) 540) by the EC in November 1996 shares the experience in the Community that data covering the past 15 years do not show significant improvements in exposure to environmental noise especially road traffic noises even though, with legislative and technological progress, significant reductions of noise from individual noise sources have been achieved. The growth and spread of traffic in space and time and the development of leisure activities and tourism have partly offset the technological improvements. Forecast road and air traffic growth and the expansion of high-speed rail lines could exacerbate the noise problem. In the case of motor vehicles, other factors are also important such as the dominance of tyre noise above low speeds (50km/h) and the absence of regular noise inspection and maintenance procedures. In the future, reference can be made from the EC’s experience that apart from the improvement on technologies, regular inspection and maintenance procedures are important to reveal the situation and the effectiveness of the noise abatement plans and policies.
Air Quality
7.1.3 As the Hong Kong population increases, energy and transport demands will also increase. Further methods of reducing pollution emissions are required such as cleaner technology, cleaner fuels, better integration of environmental protection into transport and energy policies and planning. Moreover, further co-operation is required with Hong Kong’s neighbours to develop policies and practices to reduce trans-boundary air pollution.
Geology, Soils and Contaminated Land
7.1.4 There is limited information available regarding the presence of contaminated land in Hong Kong. It is anticipated that as the population increases, then the pressure for development and Sustainable Development policies will mean that regeneration of brownfield sites will be a key growth industry. Methods of contaminated land remediation are being increasingly used in Hong Kong, with expertise on techniques particularly biotechnology remediation methods becoming greater, reducing the volumes of materials which will require disposal to landfill.
125

7.1.5 The re-use of derelict or potentially contaminated sites for development has many advantages and opportunities. Firstly, it reduces the pressure for development on greenfield sites, secondly it allows for urban regeneration, and thirdly it provides opportunities for provision of recreational facilities which has a wide range of environmental and social benefits. A contaminated land register compiled and held by the Government would provide valuable information on sites where there is a risk of contamination from previous activity. This would provide a guide to the requirement for remediation, providing a method of managing risk and preventing negative impacts in the future.
Water Resources and Water Quality
7.1.6 The river water quality and bathing water quality in Hong Kong have been improving in recent years. This trend is expected to continue in the coming years as more and more unsewered villages are connected and SMPs implemented. The freshwater supply is mainly from Dongjiang in Guangdong Province. There are limited freshwater resources in Hong Kong although the ground water is generally not exploited. The growth rate of water consumption in the territories is decreasing. This trend is also expected to continue in the near future as more and more manufacturing industries relocate outside Hong Kong.
7.1.7 A significant portion of marine waters in Hong Kong is still under pressure from pollution discharges. Red tides still occur frequently in some WCZs. As such, the current water environmental stock is limited, and in some parts the water is over exploited. This situation can only be improved by further reducing the pollution load discharged into the marine waters. Although the on-going implementation of SMPs would lead to some improvement of the situation, major pollution reduction schemes such as the implementation of a preferred HATS and higher level of treatment for the discharges into the Deep Bay and North Western WCZs would be essential. The influence of the regional developments on the environmental stock in Hong Kong waters should also be recognised.
7.1.8 There are opportunities for environmental enhancement in terms of water resources. Higher level of sewage treatment prior to discharge to the sea will improve the quality of coastal waters, whilst soft engineering techniques for use on inland waterbodies and wetlands will maximise pollution control, and enhance recreational enjoyment of the area and at the same time minimise the costs.
Waste
7.1.9 Waste will be a major environmental problem in the future, exacerbated by the increased human population. There is limited space within Hong Kong for landfill, and the existing landfills are filling up at a faster rate than anticipated. Several methods are required to manage this impact, which include minimising waste at source, encouraging reuse and recycling. Alternative technologies to reduce the volumes of material going to landfill should also be explored.
Energy and Natural Resources
7.1.10 Recycling and the use of renewable energy sources are the key in the future, particularly due to a significant potential for “green energy” in Hong Kong. There are abundant opportunities for Hong Kong to make use of renewable energy, the most obvious of which is solar energy. Investigations are underway to identify opportunities. The use of renewable energy also includes the wider adoption of water-cooled air conditioning systems.
126

7.1.11 Environmentally friendly buildings improve the building’s energy efficiency, which is actively encouraged in new buildings in Hong Kong. However, the simplest method of reducing energy consumption is through simple housekeeping procedures.
Landuse and Landscape
7.1.12 A number of cities and city-regions have developed specific policies and statutory instruments that put landscape conservation and planning issues at the very centre of the planning and environmental protection process, rather than relying on the creation of green spaces through left-over fragments remaining once all the roads, railways, housing estates, drainage channels, utility services etc. have been built. There is a clear and urgent need for a co-ordinated landscape conservation and planning policy with objectives including conservation of non-designated landscapes and the quality of the whole living environment rather than on the component parts. The realisation of a cohesive set of landscape conservation and planning objectives could be achieved through the following:
• a territory-wide mapping of existing baseline information of Hong Kong’s landscape resources together with an indicator to assess their characteristics, condition, sensitivity to development change and scenic value (an on-going study);
• a district-level landscape masterplans for urban areas;
• a fully co-ordinated approach to design, implementation and maintenance of public landscape works where emphasis is on all three stages rather than solely on maintenance; and
• planning procedures for validating design proposals and implemented projects against statutory landscape conservation and planning objectives.
Risk
7.1.13 While the number of people exposed to risk at a level greater than the guideline level have dramatically reduced, it will still be important to reduce the numbers of PHIs wherever possible through, e.g. declassification of facilities or change in technology, as well as their proximity to people and the risk level (new technology or alternative sources of greener fuels for example) even further whenever practicable.
Ecology
7.1.14 Approximately 40% of the land area of Hong Kong is protected. However, the pressure on the ecological resource is likely to increase as the population rises, due to encroachment, disturbance and increased commercial and vehicular emission in particular. Projects are already underway to recreate some of the more threatened habitats which have suffered extensively in the past from human disturbance, in particular mangroves. Areas supporting endangered species, unique habitats or high species diversity require increased protection. Conservation efforts and management are required to maintain the ecological value of the resource, this would include research and monitoring, to provide information on individual species requirements and lifecycle. This information will be very useful for species transplantations, habitats restoration and re-creation projects. Furthermore, regular monitoring studies will provide additional information on the species present, and any changes to the ecological baseline
127

conditions.
Cultural Heritage
7.1.15 As at December 2001, there were 75 declared monuments within Hong Kong. Cultural heritage resources in Hong Kong are rapidly diminishing in number and being compromised by development and disregarded. Integration of historical resources into basic planning concepts should be of primary focus so that planning mechanisms can become an important preservation tool.
7.1.16 Heritage may act as a constraint on development in some instances. It can however also provide opportunities. These include the creative re-use of historical buildings, the development of cultural tourism in areas of traditional landscape and the preservation of archaeological sites as education centres.
7.1.17 A focus on the use of information technology in heritage management is recommended. Innovative methods will be required to measure developmental and other pressures on our heritage capital. This should be based on the wide body of international information regarding computerisation and data graphics in the cataloguing and maintenance of heritage resources and in the presentation of these resources to the public.
7.1.18 The application of such technologies will allow assessment of the capacity of this capital to not only withstand such pressures, but also to influence their scale and design for mutual benefit.
7.1.19 The definition of indicators for cultural heritage is the subject of considerable international debate at present. Hong Kong should monitor and participate in this discussion and devise a set of indicators in line with international standards but appropriate for local needs and circumstances.
128

REFERENCES
Architectural Services Department (2000). Environmental Report 2000.
Binnie Consultants Ltd (1996a). Fill Management Study. Investigation and Development of Marine Borrow Areas. Coral Growth at High Island Dam. EPD, July 1996.
Binnie Consultants Ltd (1997a). Coastal Ecology Studies. Chek Lap Kok, Qualitative Survey, Final Report. Geotechnical Engineering Office, Civil Engineering Department, December 1997
Buildings Department (1995). Code of Practice for Overall Thermal Transfer Value in Buildings.
Census and Statistics Department (1997). Hong Kong Energy Statistics Annual Report 1996 Edition.
Chiu H.M.C. and Morton B. (1999). The Biology, Distribution and Status of Horseshoe Crabs, Tachypleus tridentatus and Carcinoscorpius rotunicauda (Arthropoda: Chelicerata) in Hong Kong: Recommendations for Conservation and Management. Final Report to China Light and Power Co Ltd. The Swire Institute of Marine Science, The University of Hong Kong, Hong Kong.
Chu K.W.H. (1998). Conservation of Terrestrial Biodiversity in Hong Kong. M Phil Thesis, The University of Hong Kong, Hong Kong.
Corlett R.T. (1997). Human impact on the flora of Hong Kong Island. The Changing Face of East Asia during the Tertiary and Quaternary (ed Jablonski . N.G) pp 400-412. Centre of Asian Studies, The University of Hong Kong, Hong Kong.
Corlett R.T., Xing F., Ng S.C., Chau K.C. and Wong L.M.Y. (2000). Hong Kong vascular plants: distribution and status. Memoirs of the Hong Kong Natural History Society 23: 1-157
Costanza R., Cumberland J., Daly H., Goodland R. and Norgaard R. (1997). An Introduction to Ecological to Economics. St Lucie Press, Florida.
Davies J. and Giesen W. (1994). Towards a methodology for identifying tropical freshwater wetlands for protection. Mitteilungen Internationale Vereinigung fur theoretische und angewandte Limnologie 24: pp 27-39
Davis S.G. (1952). The Geology of Hong Kong. The Government Printer, Hong Kong.
Dudgeon D. and Chan E.W.C. (1996). Ecological Study of Freshwater Wetland Habitats in Hong Kong. Report for the Agriculture and Fisheries Department.
Electrical and Mechanical Services Department (1998). Code of Practice for Energy Efficiency of Air Conditioning Installations.
Electrical and Mechanical Services Department (1998). Code of Practice for Electrical Installations.
Electrical and Mechanical Services Department (1998). Code of Practice for Energy Efficiency of Lighting Installations.
129

Electrical and Mechanical Services Department (2000). Code of Practice for Energy Efficiency of Lift and Escalator Installations.
EPD (1997). Technical Memorandum on Environmental Impact Assessment Process, 1st edition, Environmental Protection Department, September 1997.
EPD (1999). Environment Hong Kong 1999.
EPD (2001). Environment Hong Kong 2001.
ERM (1999). Greenhouse Gas Emission Control Study, Draft Final Report, July 1999.
ERM (2000). Greenhouse Gas Emission Control Study: Projection and Model Report. Final Report for Environmental Protection Department, March 2000.
Fong C.W. (1998a). Distribution of Hong Kong Seagrasses. Porcupine! 18: pp10-12 (December 1998).
Friends of the Earth (1996a). Power Without Policy: Friends of the Earth Position on Energy Policy. Friends of the Earth, Hong Kong.
Friends of the Earth (1996b). Friends of the Earth’s Initial Response to the Territorial Development Strategy Review. Friends of the Earth, Hong Kong, December 1996.
Geotechnical Engineering Office (2000). Hong Kong Geological Survey (May 2000). Civil Engineering Department, The Government of the Hong Kong SAR.
Hodgkiss I.J. and Morton B. (1978a). Zostera nana Roth. (Potamogetonaceae) – a new record for Hong Kong. Memoirs of the Hong Kong Natural History Society 13: pp 23-27
Hodgkiss I.J. and Morton B. (1978b). Halophia beccarii Ascherson (Hydrocharitaceae) – a new record for Hong Kong, with notes on other Halophila species. Memoirs of the Hong Kong Natural History Society 13: pp 28-32
Hui S.C.M. (1997a). From Renewable Energy to Sustainability: The Challenge for Hong Kong, in Proc. of the POLMET ‘97 Conference, 25-27 November 1997, Hong Kong Institution of Engineers, Hong Kong: pp351-358
Hui S.C.M. (1997b). Renewable Energy in Europe: YMC Delegation 1996 Report. YMC Delegation 1996, Young Members Committee, The Hong Kong Institution of Engineers, Hong Kong, March.
Hyder Consulting Limited (2000). Update on Cumulative Water Quality and Hydrological Effect of Coastal Developments and Upgrading of Assessment Tool, Report on the Assessment of Cumulative Hydrodynamic and Water Quality Effects (Final). EPD, October 2000.
Jefferson T.A. (1998a). Population Ecology of the Indo-Pacific Hump-backed Dolphin (Sousa chinensis Osbeck, 1765) in Hong Kong Waters: Final Report. Ocean Park Conservation Foundation, April 1998.
Lau M.W.N. (1998). Habitats Use by Hong Kong Amphibians, with Special Reference to the Ecology and Conservation of Philautus romeri. PhD Thesis, The University of Hong Kong, Hong Kong.
Lee S.Y. (1997). Annual Cycle of Biomass of a Threatened Population of the Intertidal
130

Seagrass Zostera japonica in Hong Kong. Marine Biology 129: 183-193.
Moore C. and Ihle J. (1999). Renewable Energy Policy Outside the United States. Renewable Energy Policy Project (REPP), Issue brief No. 14, October 1999.
Morton B. and Morton J. (1983). The Sea Shore Ecology of Hong Kong. Hong Kong University Press, Hong Kong.
Morton B. and Ruxton J. (1992). Hoi Ha Wan. World Wide Fund for Nature Hong Kong. pp 55
Morton B., Williams G.A. and Lee S.Y. (1996). The Benthic Marine Ecology of Hong Kong: A Dwindling Heritage? In Coastal Infrastructure Development Hong Kong: A Review, pp 233-267. Hong Kong Government, Hong Kong.
Newman P. and Kenworthy J. (1999). Sustainability and Cities. Washington D.C. Island Press.
Parsons E.C.M., Felley M. and Porter L. (1995). An Annotated Checklist of Cetaceans Recorded from Hong Kong’s Territorial Waters. Asian Marine Biology 12: pp79-100
Parsons E.C.M. (1997). Hong Kong’s Cetaceans: the Biology, Ecology and Behaviour of Sousa chinensis and Neophocoena phocaenoides. PhD Dissertation, University of Hong Kong, Hong Kong.
Planning Department (2001). Hong Kong 2030: Planning Vision and Strategy. Built Heritage Preservation. SGM Information Note 8/2001 (20 June 2001)
Planning Department (2001). Hong Kong 2030: Planning Vision and Strategy. Review of Environmental Baseline Conditions. SGM Information Note 16/2001 (6 August 2001)
Porter L.J., Parsons E.C.M. and Morton B. (1997). The Status and Biology of the Chinese White Dolphin (Indo-Pacific Hump-backed Dolphin), Sousa chinensis in Hong Kong. Recommendations for Conservation and Management. Final Report to the Agriculture and Fisheries Department of the Hong Kong SAR Government. The Swire Institute of Marine Science, The University of Hong Kong.
Shin P.K.S. and Thompson G.B. (1982). Spatial Distribution of the Infaunal Benthos of Hong Kong. Marine Ecology Progress Series 10: pp 37-47
Tam F.Y. and Wong Y.S. (1997). Ecological Study of Mangrove Stands in Hong Kong.
Tam F.Y. and Wong Y.S. (2000). Hong Kong Mangroves. Agriculture, Fisheries and Conservation Department & City University of Hong Kong Press.
Turner E. and Wong K. (1991). The Threat to Nature/Reserves in the Incremental Encroachment of Development – Deep Bay Integrated Environmental Management. Polmet ‘91 (Asia) Ltd: pp 839-860
WWF (1999). Hong Kong’s Present Challenge: Profile of the Environment in the 1990s. CD-ROM prepare by WWF Hong Kong.
Zhuang X.Y. and Corlett R.T. (1997). Forest and Forest Succession in Hong Kong, China. Journal of Tropical Ecology 14: pp 857-866
131

ABBREVIATIONS AFCD Agriculture, Fisheries and Conservation Department AQO Air Quality Objectives BEAM Building Environmental Assessment Method BET Business Environmental Council BIPV Building-Integrated Photovoltaic C&D Construction and Demolition CAP Criteria Air Pollutants CAR Contamination Assessment Report CASET Computer Aided Sustainability Evaluation Tool CLP China Light Power Hong Kong Ltd. CWTC Chemical Waste Treatment Centre DO Dissolved Oxygen ECC Environmental Campaign Committee EIA Environmental Impact Assessment EMSD Electrical and Mechanical Services Department EPD Environmental Protection Department EPI Environmental Performance Indicator EST Environmentally Sound Technology GHG Greenhouse Gas GIS Geographic Information System GWP Global Warming Potential HATS Harbour Area Treatment Scheme HFC Hydrofluorocarbons HKPSG Hong Kong Planning Standards and Guidelines JEMU Joint Environment Markets Unit LCSD Leisure and Cultural Services Department LPG Liquefied Petroleum Gas MSW Municipal Solid Waste NCO Noise Control Ordinance NDA New Development Area NEF Noise Exposure Forecast NENT North East New Territories NOx Nitrogen Oxides OTTV Overall Thermal Transfer Value
132

PATH Pollutants in the Atmosphere and their Transport over Hong Kong PFC Perfluorocarbons PHI Potentially Hazardous Installations PME Powered Mechanical Equipment PRD Pearl River Delta RAP Remediation Action Plan RCP Refuse Collection Point RSP Respirable Suspended Particulates SAR Special Administrative Region SDU Sustainable Development Unit SEA Strategic Environmental Assessment SEF Secretary for Environment and Food SENT South East New Territories SMP Sewerage Master Plans SO2 Sulphur Dioxide SSSI Sites of Special Scientific Interest SUSDEV 21 Sustainable Development for the 21st Century TAP Toxic Air Pollutants TIN Total Inorganic Nitrogen TDSR Territorial Development Strategy Review TSP Total Suspended Particulates UN United Nations VOC Volatile Organic Compound WBTC Works Branch Technical Circular WCZ Water Control Zone WENT West New Territories WHO World Health Organisation WPCO Water Pollution Control Ordinance WRFP Waste Reduction Framework Plan WQI Water Quality Index WQO Water Quality Objectives WWF World Wide Fund
133

Footnotes 1 Source: AMO’s information dated 4.3.2002
2 Source: AMO’s information dated 4.3.2002
3 http://www.london.gov.uk/mayor/strategies/biodiversity/index.jsp
134

APPENDIX A1
Environmental Management - ISO 14001 EMS as a Contributor Towards Sustainable Development
A.1 The ISO was formed in 1946 to develop manufacturing, trade and communication
standards. It is based in Geneva, Switzerland and its members are the national standards bodies of 111 countries.
A.2 ISO 14001 can be considered to make contributions to Sustainable Development at two main levels. The first is at a high level such as national, regional, trading and/or political bloc level and involves people or governments in positions of power and influence decision-making, policy setting and strategies development which affect social, economic and environmental development within their power jurisdictions. The second is at a practical, individual organisation level including actual implementation of these policies and strategies and using available environmental tools to facilitate the implementation.
A.3 ISO 14001 EMS has achieved the status of being adopted as one of the few environmental initiatives to receive widespread support at the high level. Over 100 countries have been involved in developing and adopting the standard (and thereby agreeing not to develop new alternative national standards). This acceptance removes many of the potential political, cultural and non tariff trade barriers (such as those related to protecting national industries or supporting an existing national standard) which would normally inhibit universal acceptance of such a standard.
A.4 Consequently ISO 14001 will not be prevented or obstructed by high level influences (such as governments, regional political alliances, trading blocs etc.) from being taken up within their jurisdictions and making whatever contribution to Sustainable Development it can. However it does currently taken up by these high level organizations themselves and implemented within them to help systemise their approach to environmental issues and ensure environmental considerations are taken into account in the strategic decision-making processes. If it was widely taken up at this high level (rather than just by individual companies/organizations) and genuinely followed, it could make very significant and far reaching contributions to the environmental aspects of Sustainable Development.
A.5 At the second level there are a number of factors which cause ISO 14001 to be taken up, such as client requirements, peer pressure, public relations and in some cases business and environmental enlightenment. These ‘drivers’ will cause wide take up and usually it is a one-way process with few organizations giving up certification once it has been achieved. At this level ISO 14001 could make a contribution to Sustainable Development by ensuring good environmental practices and better environmental performance (through objectives and targets and continual improvement in environmental performance) for a vast number of organizations.

A.6 At both levels (but particularly at the high level because of the greater power and influence at this level), ISO 14001 could make a dramatic contribution if the organisations choose in their policy and as one of their main objectives and targets to incorporate sustainable principles into their planning and operations. They are of course free to do this and with growing environmental awareness and training would be more likely to do so.
A.7 ISO 14001 is intended to provide a framework which will ensure that all significant environmental issues are firstly identified, then evaluated and the significant ones are addressed and controlled. It provides requirements for monitoring of key issues, auditing of the operations and review of the system to enable updating. It requires a commitment to training of staff, prevention of pollution and demonstration of continual improvement. Taken together in a system, this all provides the fundamental basis for sound environmental performance and will facilitate the adoption of further initiatives to measure the performance and aim for higher levels of performance.
Status (Including Uptake)
A.8 The ISO 14001 standard is now the only environmental management system standard with worldwide recognition and acceptance. It was published as an official ISO standard in September 1996 and it would seem that in the absence of any genuine competitor it can only get stronger.
A.9 The worldwide uptake figures for ISO 14001 are very interesting and impressive. The official ISO web site (www.iso.ch.) has information regarding rate of uptake including a breakdown by country and recently by business type as well as the worldwide total number of organizations independently certified based on information provided by 570 Certification Bodies. (These are independent commercial organizations specifically offering certification services to organizations for standards such as ISO 14001. The Hong Kong Quality Assurance Agency is a local Certification Body but there are a number of international ones operating in Hong Kong.) As of April 2001, the web site shows that there were 6,219 certifications registered in 1999, which represented an increase of almost 80% on the existing number and brought the total to 14,106 (the statistics is still valid as of January 2002). These were spread over 84 different countries (or jurisdictions including China and the Hong Kong Special Administrative Region) and included ‘newcomers’ such as Afghanistan, Cyprus, Monaco, Namibia, Trinidad and Tobago and Zimbabwe.
A.10 In Hong Kong, the pattern of uptake is similar to many other countries with a total of 146 certifications as of September 2001 listed on the EPD website (www.info.gov.hk/epd) covering service sector, government and manufacturing.
Summary and Conclusions
A.11 How to implement or even move towards Sustainable Development is a mystery to most organizations and probably to many governments as well. However to make some progress at least on environmental aspects is usually considered more obvious and the necessary actions more tangible.
A.12 The ISO 14001 EMS standard provides a suitable framework and foundation on which a systematic approach to identifying and controlling an organization’s environmental impacts can be based. It is applicable to all types and sizes of organizations and requires continual improvement in the environmental

performance of the organization. In addition and very importantly it is recognized on a worldwide basis and can reach out to a very large number of organizations. This is shown by the current number of some 23,000 organizations with an EMS that has been independently certified to conform to it. This growth has occurred in just over 4 years and is increasing at around 70% per year. This is phenomenal growth and can genuinely be considered to be likely to make a significant contribution to improved environmental performance on a major scale.
A.13 The current trend to link EMS with quality management systems and health and safety systems will also make valuable contributions to sustainable practices, for example a clean, organized, safe, healthy and low polluting work environment will contribute to social well-being of every worker.
A.14 Overall speaking, the ISO 14001 EMS standard can be viewed as a first (albeit quite large) step towards raising the levels of public and private sector environmental performance and facilitating further advancement in areas which are even more focused towards increasing sustainability and providing a path for the journey towards Sustainable Development.

myccheung
APPENDIX A2


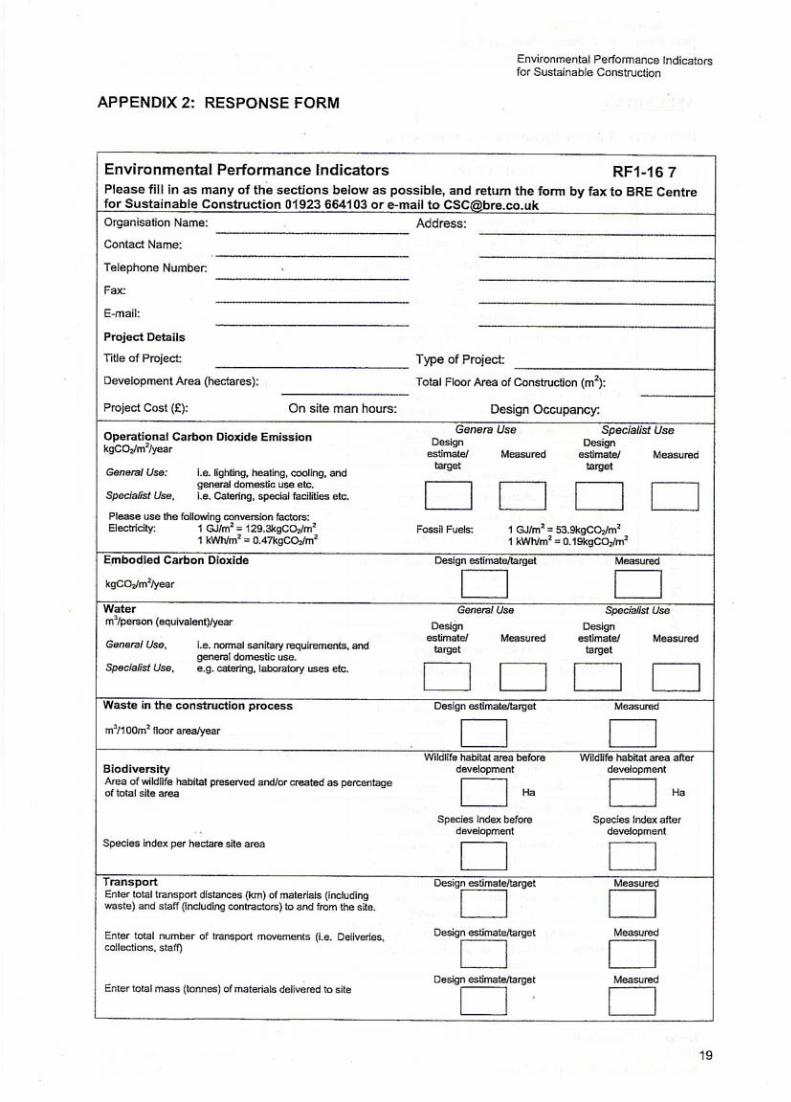

APPENDIX B
The Indicative List of Biodiversity Indicators
INDICATORS USED OR NOT
COMMENTS
Forestry biodiversity Total forest area Total Forest area as a % of total land area % of forest cover by forest type (primary, secondary or plantation) Ratio between exotic species and native species in plantation area Forest area change by forest type (primary, secondary or plantation) Per capita wood consumption Change in land use, conversion of forest land to other land uses (deforestation rate)
Self-generating area per habitats type Self-generating area as a % of total area Fragmentation of forests % of protected area to total forest area % of protected area with clearly defined boundaries % of forest managed for wood production % of forest land managed for recreation and tourism to total forest area Area and % of forests managed for catchment protection % of forest protected areas by forest type (age, class, and successional stage)
Area, length and numbers of biological corridors Annual volume and area of timber harvested - indigenous and plantation Contribution of forest sector to GDP Number and size of forest fires Reforested and afforested areas Area and extent of degraded lands reclaimed through forest operations Relationship between forest cover and frequency of flooding Changes in the proportions of stands managed for conservation and utilization of genetic resources (gene reserves, seed collection stands, etc.)
Area and % of forest area affected by anthropogenic effects (logging, harvesting for subsistence)
Area and % of forest area affected by natural disasters (insect attack, disease, fire and flooding)
Forest conversion affecting rare ecosystems by area Extent of mixed stands Managed forest ratio Wood harvesting intensity
ECO
SYST
EM /
HABI
TATS
Estimate of carbon stored Absolute and relative abundance, density, basal area and cover of various species
SPEC
IES
Threatened tree species as a % of the 20 most used for commercial purposes

INDICATORS USED OR NOT
COMMENTS
Number of threatened, keystone, flagship species Number of extinct, endangered, threatened, vulnerable and endemic forest dependent species by group (e.g. birds, mammals, vertebrates, invertebrates)
List of flora and fauna Existence of procedures for identifying endangered, rare and threatened species
Existing strategies for in-situ / ex-situ conservation of genetic variation within commercial, endangered, rare and threatened species of forest flora and fauna.
Number of forest dependent species whose populations are declining Population levels of representative species from diverse habitats monitored across their range
Number and extent of invasive species Agricultural Biodiversity
Agricultural area by crops (cereal, oil crops, forage, woodlands) Agricultural area (intensively farmed, semi-intensively farmed and uncultivated)
Change in area of agricultural land (conversion to or from agriculture) Intensification and extensification of agricultural land use EC
OSY
STEM
/ H
AB
ITA
TS
Use of agricultural pesticides
Number of species threatened by agriculture by group (e.g. birds, mammals, vascular plants, vertebrates, invertebrates)
Number of vertebrate species using habitats on agricultural land by species.
Differences in species diversity and abundance of arthropods and earthworms in organically and conventionally cultivated arable land
Rate of change from dominance of non-domesticated species to domesticated species
Species diversity used for food Erosion/Loss of genetic diversity patrimony
SPEC
IES
Crops/livestock grown as a % of number of 30 years before Accession of crops and livestock in ex-situ storage (number or %)
Replacement of landraces with few imported ones Replacement of indigenous crops Accessions of crops generated in the past decade (%) Coefficient of kinship or parentage of crops Inbreeding / outbreeding rate
GEN
ES
Rate of genetic interchange between populations (measured by rate of dispersal and subsequent reproduction of migrants)
Inland Waters Biodiversity
ECO
SYST
EM/
HA
BIT
Surface water quality: Nitrogen, Dissolved oxygen, pH, pesticides, heavy metals, temperature

INDICATORS USED OR NOT
COMMENTS
BOD on water bodies (re: eutrophication) Ground water quality: nitrates, salinity, toxicants Stream flow Stream sediment storage and load Changes in vegetation type along water courses Water resource vulnerability index Ratio between maximum sustained yield and actual average abundance
Glacier fluctuations Groundwater level (water table level) Wetland area Extent of wetland drainage and filling Fish family diversity Benthic macroinvertebrates: communities Macrophytes: species composition and depth distribution Threatened freshwater fish species as a % of total freshwater fish species known
Number of inland fish species introduced Number of exotic flora and fauna species (e.g. fish, aquatic weeds)
Number of endemic flora and fauna Changes in distribution and abundance of native flora and fauna Number of extinct, endangered, threatened/endangered/vulnerable/endemic inland water species by group (e.g. birds, aquatic mammals, invertebrates, amphibians, vascular plants, bottom fauna)
Changes in fish catches by species Species richness (number per unit area, number per habitat)
SPEC
IES
Indicator species Coastal and Marine Biodiversity
% of coastal zone with populations exceeding 100 inhabitants/km2
Annual rate of mangrove conversion Frozen ground activity Coral chemistry and growth pattern Lake levels and salinity Shoreline position Number of large scale bottom trawling vessels per 1,000km of coastal area
E.coli counts and nutrient levels as % of baseline levels Surface displacement
ECO
SYST
EM
Amount of poison chemicals and dynamite used for reef fishing

INDICATORS USED OR NOT
COMMENTS
Algae index Threatened fish species as a % of total fish species known
SPEC
IES
Change in proportion of fish catches by species per specific season
General Indicators1 Frozen ground activity Karst activity Slope failure (landslides) Relative wilderness index Changes in limiting factors for key species (e.g. nest holes for parrots, fruit bat roosting trees)
Soil quality Volcanic unrest Changes in total area of a particular habitats type Changes in largest block of a particular habitats type Changes in average size of a particular habitats type Change in mean nearest distance between blocks of a particular habitats type
Change in average width of break in an identified habitats corridor Total area of protected areas (use IUCN definition of protected areas)
% of protected area to total area Change in habitats boundaries % of area in strictly protected status % of area dominated by non-domesticated species Degree of connectivity of food web Existence of institutional capacity, policy and regulatory framework for the planning, management and conservation of biological diversity
ECO
SYST
EM/H
AB
ITA
TS
Size and distribution of protected areas Change in number and/or distribution of keystone or indicator species
Number of introduced species and genomes Change in presence, location, area, numbers of invasive plant or animal species
Number of introduced species and genome Quantity of specimens or species of economic/scientific interest removed from the environment
SPEC
IES
Density of road network
1 These are indicators that apply to more than two thematic areas and have been listed together to avoid repeating them

INDICATORS USED OR NOT
COMMENTS
% of area dominated by non-domesticated species occurring in patches greater than 1 000 sq. km.
Population growth and fluctuation trends of special interest species Sex ratio, age distribution and other aspects of population structure for sensitive species, keystone species, and other special interest species
Presence of taxa on environmental integrity Recorded species present by group Indigenous species present by group Non-indigenous species present by group Number of endemic/threatened/ endangered/vulnerable species by group
Temporal change in number of species (increase/decrease ) Change in composition of species over time Species Group: total number vs threatened species Species with small populations vs larger population size Spatial differences in the number of rare vs common species Spatial differences in the restricted vs wide range species Representativeness of intra-specific variability of endangered and economically important species
Diversity of native fauna Species richness (number, number per unit area, number per habitats area)
Species threatened with extirpation Species threatened with extinction (number or %) Endemic species threatened with extinction Species risk index Species with stable or increasing populations Species with decreasing populations Threatened species in protected areas Endemic species in protected areas Threatened species in ex-situ collections Threatened species with viable ex-situ populations Species used by local residents

APPENDIX C
Sustainable Plan for San Francisco
Introduction
The city of San Francisco established the Commission on the Environment and the Department of the Environment in 1995 to “produce and regularly update plans of the long-term environmental sustainability of San Francisco”. In 1997, the Commission on the Environment adopted the Sustainability Plan for the city of San Francisco.
Objectives/Aims
• To raise awareness about global environmental issues.
• To create a sustainable economy that will provide a good quality of life in the long term for everyone in San Francisco, while contributing minimal impact on the natural world.
• Coordinate the above areas with community planning.
Coverage
The following is a selection of some of the objectives that San Francisco will be trying to reach within the next five years:
• Air quality Vehicle-miles travelled in private automobiles have been reduced by 10%. All municipal building projects meet specifications that incorporate air quality
concerns (including specifications for the use of integrated pest management).
• Biodiversity Invasive plant species are continuously controlled in natural areas. The collection and organization of a biological inventory of the city’s natural areas
and biodiversity has begun.
• Energy and climate change and ozone depletion Each building’s energy characteristics (such as energy use and insulation) are
disclosed when it is listed for sale. CFC-based cooling and refrigeration equipment in San Francisco has been reduced
by 50%.
• Food and agriculture Three additional certified farmers’ markets have been established in locations close
to San Francisco’s residential neighbourhoods. All new housing projects have a dedicated amount of edible garden space.
• Hazardous materials The total amount of hazardous materials stored in San Francisco has been reduced
by 10% from 1995 levels. An environmental safety program has been created that is focused on educating
groups identified as more at-risk either because of their characteristics (for instance, children and people with suppressed immune systems) or their location (for instance, adjacent to a contaminated site).

• Human health Basic immunization among children under two years of age has increased to at least
90%. Historical and existing environmental contamination has been identified.
• Parks, open space and streetscapes Five recreational facilities in previously under-served neighbourhoods have been
added and others have been improved. Maps showing all the natural habitats areas in San Francisco have been established.
• Solid waste City government diverts 60% of its current waste generation. The salvage and reuse of construction and demolition materials has increased.
• Transportation An increase in the total number of person-trips into and within the City will be
accommodated while decreasing the number of single-occupancy vehicles. Agreement from the nine counties in the Bay Area on improving regional connections
through an integrated public-transit-oriented regional transportation plan has been achieved.
• Water resources and wastewater Tax credits and financial incentives are in place for water reductions in homes and
businesses. A lake management plan has been implemented.
• Economy and economic development A sustainable tourism industry has been created in San Francisco (with minimised
impacts on the environment and the City). A citywide network of neighbourhood boards has been established.
• Environmental justice Residents of poor communities are trained in the basic and technical job skills
required by new and existing sustainable businesses and industries. Decision-making bodies and processes have adequate and direct representation of
affected communities.
• Municipal expenditures A long-term budgeting policy promoting multi-year funding support and life-cycle
costing (full-cost accounting) for capital expenditures has been established. All departments have developed a maintenance program that sustains city parks,
buildings, streets and other public facilities.
• Public information and education An integrated environmental curriculum is in use in all public elementary schools in
San Francisco. An accessible clearinghouse of environmental information promotes volunteer
networking among organizations and individuals.
• Risk management Waterway hazards that increase the chance of oil spills have been identified and their
mitigation is underway. Legislation that mandates fire safety education and training programs has been
passed.

• Indicators include such items as: number of people going to clinics for respiratory problems; energy cost per tax dollar; tonnes of waste landfilled annually; and difference between the highest neighbourhood unemployment rate and the full
employment rate. Target Participants
All San Francisco residents and to a lesser degree (because of its basis) tourists.
Training of Educational Initiatives
The whole Plan is an educational initiative. It is available in the Internet and at the Department of the Environment. It was drafted together with the collaboration of hundreds of San Franciscans including representative of City government, business, the advocacy community, universities, and members of the general public. As a public and free document, it is to be found in public school and university libraries. It is a very comprehensive document and includes all the points taught at schools.

APPENDIX D
Comparison with Other World Cities
London
D.1 London is the capital of England and has a population of 16 million or 4,250 population per square kilometre.
D.2 London is situated on the east side of England straddled around the River Thames, although there is no clear boundary marking the edge of London other than the boundary of the London Boroughs which collectively form the Greater London. London has seen its fair share of environmental problems through history, however, air quality has significantly improved since the first half of the 20th century, when thick smog blanketed the city.
D.3 In 2000 the Greater London Authority (GLA) was established which has a new form of strategic citywide government for London. It is made up of a directly elected Mayor, the Mayor of London; and a separately elected Assembly, the London Assembly. Through this vehicle, sustainable development strategies are implemented.
D.4 In terms of sustainability, the London Development Agency (LDA) is a new body that has been created to promote economic development and regeneration. It is responsible for formulating and delivering the Mayor’s economic development and regeneration strategy for London. The LDA was established in July 2000 and joins the eight regional development agencies already set up in England. The LDA’s powers derive from the Regional Development Agencies Act 1998 as amended by the Greater London Authority Act 1999 (primarily Part V and Schedule 25), but it is the Mayor, not the Secretary of State, to be answerable for the LDA.
D.5 There are also a number of smaller independent and government organisations involved with sustainable development. One example is the London-21 organisation which aims to promote sustainable development and assist with the implementation of Agenda 21 in London. Under the Local Government Act 2000, local authorities (who are responsible for council taxes, lighting, social security etc.) have a duty to prepare ‘community strategies’, for promoting or improving the economic, social and environmental well-being of their areas, and contributing to the achievement of sustainable development in the UK. It also gives authorities broad new powers to improve and promote local well-being as a means of helping them to implement those strategies. The Government Office for London (GOL) was established for this purpose. Its aim is to promote sustainable development to local authorities and a broader audience in London.
Singapore
D.6 Singapore has a population of approximately 4 million or 6,411 persons per square kilometre. Singapore consists of the main, low-lying Singapore Island and 58 smaller islands within its territorial waters. Urban areas comprise almost 50% of the land area, while parkland, reservoirs, plantations and open military areas occupy 40%. Singapore Island measures approximately 42 km (26 miles) east to west and 23 km (14 miles) north to south at its widest points. While there are built-up, high-density areas all around the island, the main city area is in the south, built on the

shores of the Singapore River. The Central Business District (CBD) is at the southern shore of the river’s mouth. Chinatown adjoins the CBD to the southwest.
D.7 To the north of the Singapore River is the colonial district. To the west of the island is Jurong, an industrial area. The east coast has some of the older residential areas, a major beach park and the international airport. The northeast is the location of huge housing developments and the central north of the island has most of Singapore’s undeveloped land and remaining forest. A 1 km (0.6 m) causeway connects Singapore with Johor Bahru in Malaysia; a second causeway has opened on the west of the island to relieve congestion. Under current plans, land reclamation and housing developments should dramatically alter Singapore’s geography.
D.8 On the regional front, Singapore has participated actively in environmental fora under the ASEAN framework. ASEAN Environment Ministers have jointly agreed to harmonise environmental quality standards concerning water and air, to work towards combating sea pollution and also to jointly promote environmental technology. Singapore formulated the ASEAN Strategic Plan of Action on the Environment (SPAE), which will be ASEAN’s blueprint on environment for the next six years. Singapore was instrumental in formulating the ASEAN Agreement on Trans-boundary Haze Pollution, which was opened for signing by the Foreign Ministers in November 2001.
D.9 In 1992, Singapore unveiled the Singapore Green Plan (SGP) at the United Nations Conference on Environment and Development in Rio de Janeiro. The SGP sets out the strategic directions that Singapore should take to preserve, protect and enhance the environment.
Tokyo
D.10 Tokyo has a population of 28 million or 7,131 persons per square kilometre. It has variable topography with many dormant and some active volcanoes, it has about 1,500 seismic occurrences (mostly tremors) every year and is also subject to tsunamis and typhoons. Tokyo is a vast conurbation spreading out across the Kanto Plain from Tokyo Bay. It was almost completely rebuilt after an earthquake in 1923 and again after US air raids in World War II.
D.11 In Japan, as regards the conservation of the environment, local authorities are directly involved in regulation and guidance based on laws, the observation, measurement and control of pollution, ordinances etc. They also play the important role of operating various kinds of anti-pollution and nature conservation projects. This is one of the reasons why the environment in Japan has been preserved particularly well, even when compared to other developed countries.
D.12 Many local authorities, which have contact with local people and businesses on a regular basis, play an important role in dealing with not only regional environmental problems, but also global environmental problems. From the standpoint of the principle “Think Globally, Act Locally,” many local authorities used the Earth Summit as an opportunity to promote comprehensive and well-planned activities for global environmental conservation which conform to the natural and social conditions of regions, including the establishment of ordinances, plans and policy guidelines which include the perspective of global environmental conservation.
D.13 As of October 1992, there were two local authorities (prefectures and designated cities) which had established such regulations, six local authorities (prefectures, and

designated cities) which had established such ordinances, six local authorities (prefectures and designated cities) which had established such plans, and seventeen local authorities (Tokyo Metropolis, prefectures and designated cities) which had established such policy guidelines.
D.14 Japanese metropolitan areas already show high levels of many of the qualities that advocates of sustainability are attempting to encourage, such as higher population densities, more mixed land uses, greater use of public transit and more efficient energy consumption. Tokyo is marked as an exemplary example due to its high level of rail used, and low levels of gasoline consumption per capita. Newman and Kenworthy (1999) suggested that Tokyo may have ‘the most sustainable pattern of regional development among any of the megacities’. At the same time however, Japanese metropolitan areas are also seeing extensive patterns of metropolitan sprawl, decreasing population densities, extremely rapid increases in automobile kilometres travelled, worsening problems of congestion in suburban areas, and massive highway building projects.
San Francisco
D.15 San Francisco has a population of approximately 0.8 million or 120 persons per square kilometre. San Francisco covers the tip of a 50km peninsula in Northern California, with the Pacific Ocean on its western side and the San Francisco Bay to the north and east. Its hilly streets provide some gorgeous glimpses of the San Francisco Bay and its famous bridges.
D.16 There had been major earthquakes in this City in 1812 and 1865, but the Great Earthquake struck in 1906 with magnitude 8.25 on the Richter scale. The Great Fire that followed caused more damage than the earthquake – that swept across the city destroying about 28,000 buildings, 315 people were killed outright, 352 were missing, and water mains fractured to which half the city was in ruins. A decade of rebuilding followed the quake and enormous public works projects such as the Bay Bridge of 1936 and the Golden Gate Bridge of 1937 had brought more life into the local community.
D.17 The city of San Francisco established the Commission on the Environment and the Department of the Environment in 1995 to “produce and regularly update plans of the long-term environmental sustainability of San Francisco”. In 1997, the Commission on the Environment adopted the Sustainability Plan for the city of San Francisco, establishing sustainable development as a fundamental goal of municipal public policy, and approving the goals and objectives set out in the plan. The goals include concern about global environment, create a sustainable economy and coordinate of both of these areas with community planning. The Sustainable Plan was virtually the result of a community collaboration made up of over 350 institutions and individuals.

International Environmental Guidelines
Ecology
D.18 Many of the environmental targets set by governments at a local or national level are enacted in legislation, as standards and guidelines. The basis for these generally follows international conventions and in particular the World Health Organisation (WHO) targets on environment and health.
D.19 The WHO established nine targets on environment and health to be met by 2000. A period of fifteen years was allowed to achieve this. The WHO targets intrinsically bind health and environment and are stated as being essential to sustainable development.
Target 11 – Accidents: “By the year 2000, injury, disability and death from accidents should be reduced by at least 25%”.
Target 18 – Policy on Environment and Health: “By the year 2000, all Member States should have developed, and be implementing, policies on the environment and health to ensure ecologically sustainable development, effective protection and control of environmental health risks and equitable access to healthy environments”.
Target 19 – Environmental Health Management: “By the year 2000, there should be effective management systems and resources in all Member States for putting policies on environment and health into practice”.
Target 20 – Control of Water Pollution: “By the year 2000, all people should have adequate access to adequate supplies of safe drinking water, and pollution of groundwater sources, rivers, lakes and seas should no longer pose a threat to health”.
Target 21 – Control of Air Pollution: “By the year 2000, air quality in all countries should be improved to a point at which recognised air pollutants do not pose a threat to public health”.
Target 22 – Food Quality and Safety: “By the year 2000, health risks due to micro-organisms or their toxins, to chemical and to radioactivity in food should be effectively controlled in all Member States”.
Target 23 – Control of Hazardous Wastes: “By the year 2000, public health risks caused by solid and hazardous wastes and soil pollution should be effectively controlled in all Member States”.
Target 24 – Human Ecology and Settlements: “By the year 2000, cities, towns and rural communities throughout the Region should have physical and social environments supportive to the health of their inhabitants”.
Target 25 – Working Environment: “By the year 2000, the health of workers in all Member States should be improved by making work environments more healthy, reducing work related disease and injury, and promoting the well-being of people at work”.
D.20 Sub-areas for this include respiratory diseases such as asthma, asbestos related pneumoconiosis and allergic allevolitis, dermatological diseases, musculo-skeletal

disorders, noise induced hearing loss, occupational mental health acute poisons, occupational cancers, occupational injuries.
D.21 Not all of the foregoing are relevant in the context of land use planning but have been included to illustrate the close relationship between environmental issues and health problems as well as sustainable development.
D.22 The Friends of the Earth conducted a survey and review of the UK’s performance against the standards and targets and found that 7 of the defined targets were not met by 2000 and 2 were barely achieved. It must be recognised that some of the targets do not have absolute values attached to them, in which case there is no measurable definition of the success of the meeting of the target; others such as “elimination of unprotected at work to noise greater than 85dBA” has a fixed measurement but “the targets are not assessable using current data sources”. This statement emphasises the importance of defining the specific use of the targets for the avoidance of doubt.
D.23 Another perspective on the issue is the global World Bank statement on Targets for 2015 in connection with “environmentally sustainable development”. These include halving by 2015 the proportion of people without sustainable access to safe drinking water. However, what is meant by “sustainable access” is not explained.
D.24 There are a number of international conventions relating to nature conservation. These are listed below:
Convention on Wetlands of International Importance Especially as Waterfowl Habitats (Ramsar Convention, 1971) – aim to ensure the conservation of wetlands especially those of international importance, by fostering wise use, international cooperation and reserve creation – RAMSAR sites.
Convention Concerning the Protection of the World Cultural and Natural Heritage (WHC or World Heritage Convention, 1972) – aim to protect cultural and natural heritage of outstanding universal value through, among other things, the listing of World Heritage Sites.
Convention on International Trade in Endangered Species (CITES or Washington Convention, 1973) – aim to regulate the trade in endangered species of wild fauna and flora.
Convention on the Conservation of Migratory Species of Wild Animals (Bonn Convention, 1979) – aim to provide a framework for the conservation of migratory species and their habitatss by means of, as appropriate, strict protection and the conclusion of international agreement.
UN Convention on the Law of the Sea (UNCLOS, 1982) – lays down a comprehensive regime of law and order in the world’s oceans and seas; it is an umbrella convention which establishes rules governing all uses of the oceans and their resources.
UN Convention on Biological Diversity (CBD or Rio Convention, 1992) – aim for the conservation of biological diversity, the sustainable use of its components and the fair and equitable sharing of the benefits arising from the use of genetic resources.

UN Framework Convention on Climate Change (UNFCCC or Climate Change Convention, 1992) – aim to agree reduction targets and management of known greenhouse gases.
Noise
Table D.1 WHO Guideline Values for Community Noise in Specific Environments
SPECIFIC ENVIRONMENT CRITICAL HEALTH EFFECT(S) LEQ [DB]
TIME BASE [HOURS]
LAMAX, FAST [DB]
Outdoor living area Serious annoyance, daytime and evening Moderate annoyance, daytime and evening
55 50
16 16
- -
Dwelling, indoors Inside bedrooms
Speech intelligibility and moderate annoyance, daytime and evening Sleep disturbance, night-time
35
30
16
8
45
Outside bedrooms Sleep disturbance, window open (outdoor values)
45 8 60
School classrooms and pre-schools, indoors
Speech intelligibility, disturbance of information extraction, message communication
35 during class
-
Pre-school bedrooms, indoors
Sleep disturbance 30 sleeping-time
45
School, playground outdoor
Annoyance (external source) 55 during play
-
Hospital, ward rooms, indoors
Sleep disturbance, night-time Sleep disturbance, daytime and evenings
30 30
8 16
40 -
Hospitals, treatment rooms, indoors
Interference with rest and recovery #1
Industrial, commercial shopping and traffic areas, indoors and outdoors
Hearing impairment 70 24 110
Ceremonies, festivals and entertainment events
Hearing impairment (patrons: <5 times/year) 100 4 110
Public addresses, indoors and outdoors
Hearing impairment 85 1 110
Music through headphones/ earphones
Hearing impairment (free-field value) 85 #4 1 110
Impulse sounds from toys, fireworks and firearms
Hearing impairment (adults) Hearing impairment (children)
- -
- -
140 #2 120 #2
Outdoors in parkland and conservation areas
Disruption of tranquillity #3

Notes #1: as low as possible #2: peak sound pressure (not LAmax, fast), measured 100 mm from the ear #3: existing quiet outdoor areas should be preserved and the ratio of intruding noise to natural background
sound should be kept low #4: under headphones, adapted to free-field values
Air Quality
Table D.2 WHO Guideline Values for the “Classical” Air Pollutants (WHO 1999a)
COMPOUND ANNUAL AMBIENT AIR CONCENTRATION
[µG/M3]
HEALTH ENDPOINT Observed effect level
[µg/m3]
Uncertaintyfactor
Guideline value
[µg/m3]
Averaging time
500 - 7000 Critical level of COHb < 2.5%
n.a. n.a. 100 000 15 minutes
60 000 30 minutes 30 000 1 hour
Carbon monoxide
10 000 8 hours Lead 0.01 - 2 Critical level of Pb in
blood < 100 -150 µg Pb/l
n.a. n.a. 0.5 1 year
10 -150 Slight changes in lung function in asthmatics
365 - 565 0.5 200 1 hour Nitrogen dioxide
40 1 year Ozone 10 -100 Respiratory function
responses n.a. n.a. 120 8 hours
5 - 400 Changes in lung function in asthmatics
1000 2 500 10 minutes
Exacerbations of respiratory symptoms
250 2 125 24 hours
Sulphur dioxide
in sensitive individuals
100 2 50 ear
D.25 London has developed short-term air quality objectives, these figures are continually under review.
D.26 Table D.3 showing Air Quality Targets to be achieved in the UK as follows:

Table D.3 Air Quality Targets to be Achieved in the UK
POLLUTANT OBJECTIVES MEASURED AS TO BE ACHIEVED BY
Benzene 16.25µg/m3 (5ppb) Running annual mean 31 December 2003
1,3-Butadiene 2.25 µg/m3 (1ppb) Running annual mean 31 December 2003
Carbon Monoxide 11.6 mg/m3 (10ppm) Running 8 hour mean 31 December 2003
0.5µg/m3 Annual mean 31 December 2004 Lead
0.25µg/m3 Annual mean 31 December 2008
200µg/m3 (105ppb) not to be exceeded more
than 18 times a year
1 hour mean 31 December 2005
Nitrogen dioxide*
40µg/m3 (21ppb) Annual mean 31 December 2005
50µg/m3
not to be exceeded more than 35 times a year
24-hour mean 31 December 2004
Particles (PM10)
40µg/m3 Annual mean 31 December 2004
266 µg/m3 (100ppb) not to be exceeded more
than 35 times a year
15 minute mean 31 December 2005
350µg/m3 (132ppb) not to be exceeded more
than 24 times a year
1 hour mean 31 December 2004 Sulphur dioxide
125µg/m3 (47ppb) not to be exceeded more
than 3 times a year
24 hour mean 31 December 2004
Ppm = parts per million Ppb = parts per billion µg/m3 = microgrammes per cubic metre mg/m3 = milligrammes per cubic metre *the objectives for nitrogen dioxide are provisional
D.27 Singapore uses the US National Ambient Air Quality Standards (NAAQS) to provide targets for air quality.
D.28 The NAAQS establishes two types of national air quality standards. Primary standards set limits to protect public health, including the health of ‘sensitive’ populations such as asthmatics, children, and the elderly. Secondary standards set limits to protect public welfare, including protection against decreased visibility, damage to animals, crops, vegetation and buildings. NAAQS have been set for six principal pollutants, which are called ‘criteria’ pollutants which are shown in Table D.4 below.

Table D.4 US National Ambient Air Quality Standards (NAAQS)
POLLUTANT STANDARD VALUE MEASURED AS STANDARD TYPE
9ppm (10mg/m3) 8-hour average Primary Carbon monoxide (CO)
35ppm (40mg/m3) 1-hour average Primary Nitrogen Dioxide (NO2) 0.053ppm (100ug/m3) Annual arithmetic mean Primary and secondary
0.12ppm (235ug/m3) 1-hour average Primary and secondary Ozone (O3)
0.08ppm (157ug/m3) 8-hour average Primary and secondary Lead (Pb) 1.5ug/m3 Quarterly average Primary and secondary
50/ug/m3 Annual arithmetic mean Primary and secondary Particulate (PM10) of particles with a diameter of 10
micrometers or less
150ug/m3 24-hour average Primary and secondary
15ug/m3 Annual arithmetic mean **
Primary and secondary Particulate (PM2.5) of
2.5 micrometers or less 65ug/m3 24-hour average ** Primary and secondary
0.03ppm (80ug/m3) Annual arithmetic mean Primary 0.14ppm (365ug/m3) 24-hour average Primary Sulphur Dioxide (SO2) 0.5ppm (1300ug/m3) 3-hour average Secondary
* parenthetical value is an approximately equivalent concentration ** the ozone 8-hour standard and the PM2.5 standards are included for information only. Implementation of
these standards blocked by a Federal court.
Table D.5 Air Quality Standards in Japan
SUBSTANCE ENVIRONMENTAL CONDITIONS
Sulfur dioxide Daily average of hourly values shall not exceed 0.04 ppm, and hourly values shall not exceed 0.1 ppm (Notification on May 16th, 1973)
Carbon monoxide Daily average of hourly values shall not exceed 10 ppm , and average of hourly values in eight consecutive hours shall not exceed 20 ppm (Notification on May 8th, 1973)
Suspended particulate matter (1)
Daily average of hourly values shall not exceed 0.10 mg/m³ , and hourly values shall not exceed 0.20 mg/m³ (Notification on May 8th, 1973)
Nitrogen dioxide Daily average of hourly values shall be within the range from 0.04 ppm to 0.06 ppm or below (Notification on July 11th, 1978)
Photochemical oxidants (2) Hourly values shall not exceed 0.06 ppm (Notification on May 8th, 1973)
1. Suspended particulate matter is defined as air-borne particles with diameter smaller than or equal to 10µm .
2. Photochemical oxidants are oxidizing substances such as ozone and peroxiacetyl nitrate produced by photochemical reactions (only those capable of isolating iodine from neutral potassium iodide, excluding nitrogen dioxide.)

Table D.6 National Greenhouse Gas Emission Targets
(Note from the Secretariat of the Framework Convention on Climate Change (FCCC): This summary table should be taken as a reference only.)
Party Target Gas(es) Concerned
Base Level
Target Year Remarks
stabilization GHGs 1988 2000
Australia additional 20% reduction GHGs 1988 2005
Providing there are no net adverse impacts nationally, or on trade competitiveness, and if similar measures are taken by other major GHG emitters
Austria 20% reduction CO2 1988 2005 -
Bulgaria should not exceed GHGs 1988 2000 -
Canada stabilization net GHGs 1990 2000 On a GWP basis
Czech Republic stabilization CO2, CH4
and N2O 1990 2000 But invokes the flexibility clause of Article 4.6 of the Climate Convention *
5% reduction CO2 1990-
adjusted 2000
Denmark additional 20% reduction CO2
1988 -adjusted 2005
Additional reduction represents a contribution to the EC common reduction goal and is based on targets for the energy and transport sectors
Estonia - - - - No national target communicated
Finland - - - - No national target communicated
France total Annex I emissions to return to 1990 levels
CO2 1990 2000
Will undertake cost-effective measures as long as economic competitiveness is not threatened, and supports mitigation efforts to be undertaken at the EC level
Germany 25% reduction CO2 1990 2005 -
Greece limit CO2 growth to 15% CO2 1990 2000 -
Hungary - CO2
average 1985 -1987 levels
2000 -
Ireland limit CO2 growth to 20% CO2 1990 2000
Or 11% net increase including sinks, consistent with EC CO2 stabilization target
Italy limit net carbon-related emissions
CO2 1990 2000 Reflects EC commitment to stabilize CO2 emissions in the Union as a whole at 1990 levels by 2000

Party Target Gas(es) Concerned
Base Level
Target Year Remarks
stabilization CO2 on a per capita basis
“about” 1990
efforts to stabilize CO2 “about” 1990
2000 and
beyond
stabilization CH4 1990 1994
Japan
stabilization to extent possible
N2O and other GHGs 1990 1994
-
Latvia stabilization GHG 1990 2000 “Emission levels may grow after 2000 or even earlier”
Liechtenstein 20% reduction CO2 1990 2005 -
Luxembourg at least a 20% reduction CO2 1990 2005 -
Monaco - - - - No national target communicated
3% reduction CO2 1990-
adjusted 2000 Netherlands
10% reduction CH4 1990 2000
-
New Zealand stabilization net CO2 1990 2000 -
Norway limit CO2 to not exceed 1989 levels in 2000
CO2 1989 2000
Preliminary target to be considered in light of further studies, technological advances, international energy market development, international negotiations and agreements
Poland stabilization “emissions” 1988 2000 -
Portugal limit CO2 growth to 40% CO2 1990 2000 Consistent with the EC CO2
stabilization target
Romania for comparison purpose GHG 1989 2000 No national target communicated
Russian Federation - - - -
No national target established, but recognizes FCCC aim as a reference
stabilization GHG 1990 2000 Slovakia
20% reduction CO2 1988 2005 -
Spain limit energy-related CO2 growth to 25% CO2 1990 2000
Affects energy sector emissions only and is consistent with EC CO2 stabilization target
Sweden stabilization CO2 from fossil fuel 1990 2000 -

Party Target Gas(es) Concerned
Base Level
Target Year Remarks
stabilization CO2 1990-
adjusted 2000
Switzerland
further reduction CO2 and other GHGs - -
-
United Kingdom return to 1990 levels
CO2 and each major GHG
1990 2000 For CO2: a reduction of 4 - 8% below 1990 levels is expected by 2000
United States reduction net GHGs 1990 2000 On a GWP basis
* Article 4.6 of the Climate Convention states: “In the implementation of their commitments under paragraph 2 above, a certain degree of flexibility shall be allowed by the Conference of the Parties to the Parties included in Annex I undergoing the process of transition to a market economy, in order to enhance the ability of these Parties to address climate change, including with regard to the historical level of anthropogenic emissions of greenhouse gases not controlled by the Montreal Protocol chosen as a reference.”
Source: United Nations, Framework Convention on Climate Change (FCCC), Conference of the Parties Review of the Implementation of the Convention and of Decisions of the First Session of the Conference of the Parties; Commitments in Article 4; Second Compilation and Synthesis of first national communications from Annex I Parties; Addendum; Report by the Secretariat (Geneva, Switzerland: FCCC Secretariat, 27 June 1996).
Cultural Heritage
D.29 The designation of “Heritage Precincts” is a method of conservation which has been applied internationally. Preservation in the form of heritage precinct provides comprehensive protection to the heritage buildings, the environs and even the neighbourhood. This form of preservation will ensure the developments nearby are compatible with the historical characteristics of the precinct. Heritage precinct enhances the historical character of the area and the heritage buildings within it.
D.30 The Rocks in Sydney, Australia; Emerald Hill and Singapore River area in Singapore are some of the successful examples of preservation in the form of heritage precinct. Heritage precincts in both cities serve as a functioning integral part of the community. The heritage buildings house retail outlets, eateries/coffee shop, museums, galleries, and offices of community organisations. The flexible use of the heritage buildings brings life to the precinct and enhances the appeal of the heritage items.
D.31 The examples in Sydney and Singapore demonstrate that heritage precincts are valuable assets to cultural tourism, the heritage area in these two cities become major tourist attractions. With the tourist money and the income generated from the commercial use of the buildings, a rich source of revenue can be tapped for preservation works.
D.32 The examples in Sydney and Singapore share a common point in terms of institutional arrangement. A single authority is in charge of planning, development control, preservation, restoration, financial management and land management (including disposal of site for conservation of ‘shophouses’/traditional terrace in Singapore, and leasing land/building to suitable tenants for compatible uses in Sydney). Sydney Harbour Foreshore Authority even take up the role to co-ordinate

and promote tourism development, including organizing events, guided tour etc. Both the Sydney Harbour Foreshore Authority and the Urban Redevelopment Authority take comprehensive planning, restoration and management roles.
D.33 Details of important international conventions regarding cultural heritage are provided below:
The first attempt to establish a coherent and logically defensible philosophy for building conservation was in the Society for the Protection of Ancient Building’s Manifesto of 1877. The Manifesto consists principally of a plea to “put protection in place of restoration”, and only the last two paragraphs commend a philosophy of care. However, it is the relatively brief Manifesto statement that marks the starting point for the many later policy statements in which the underlying theme of the SPAB Manifesto is adopted and developed rather than being significantly amended.
The Athens Conference of 1931, organised by the International Museums Office, established basic principles for an international code of practice for conservation. The Second International Congress of Architects and Technicians of Historic Monuments, which met in Venice in May 1964, approved the text of an International Charter for the Conservation of Monuments and Sites (the Venice Charter), which superseded the Athens Charter. The Venice Charter, which was adopted by the newly formed International Council on Monuments and Sites (ICOMOS) in 1956 and published by them in 1966, is an important modern milestone for the conservation movement. ICOMOS is an international non-governmental organisation that promotes the study of the theory, methodology and technology of conservation applied to monuments, historic areas and sites. The Venice Charter stresses the importance of setting, respect for original fabric, precise documentation of any intervention, the significance of contributions from all periods to the building’s character, and the maintenance of historic buildings for a socially useful purpose. The Charter outlines the basic doctrine of what is now accepted to be an appropriate approach to dealing in philosophical terms with historic buildings.
The Venice Charter was followed by a plethora of other standards, charters, formal recommendations and conventions relating to building conservation. These provide invaluable guidance for practitioners working in the field of building conservation and are an essential framework for good practice in the protection and enhancement of the historic environment. The most significant of these that have the approval of ICOMOS are:
- The Florence Charter on Historic Gardens (1982). Provides a definition of the term historic garden and the architectural compositions that constitute the historic landscape. It emphasises the need to identify and list historic gardens, and provides philosophical guidance on maintenance, conservation, restoration and reconstruction. It refers back to the Venice Charter for many of its principles.
- The Washington Charter on the Conservation of Historic Towns and Areas (1987). A particularly useful document that considers broad principles for the planning and protection of historic urban areas.
- Charter for the Protection and Management of the Archaeological Heritage (1990). Considers the subject of archaeology under the following headings: definitions, integrated protection policies, legislation, survey,

maintenance and conservation, presentation, re-construction, and international co-operation.
- Resolution of the Symposium on the Introduction of Contemporary Architecture into Ancient Groups of Buildings (1972). Stresses the need for appropriate use of mass, scale, rhythm and appearance, and the avoidance of imitation.
- Resolution on the Conservation of Smaller Towns (1975). Considers the potential threats to such places, which are detailed as: lack of economic activity, outward movement of population, disruption of structures due to insertion of new elements, and measures to adapt to modern activities. Methods of counteracting these threats are then considered.
- Declaration of Amsterdam (Congress on the European Architectural Heritage, 1975). Notes that the significance of the architectural heritage and the justification for conserving it are now more clearly perceived, and considers processes that would place the conservation of the architectural heritage on firm and lasting foundations. The importance of integrating conservation of the architectural heritage into the urban and regional planning process is identified as one of the most important factors.
- The Charter on Cultural Tourism (1976). Considers the positive and negative effects of cultural tourism on historic monuments and sites.
- Tlaxcala Declaration on the Revitalisation of Small Settlements (1982). Considers initiatives for safeguarding communities living in small settlements and the traditional environment of such places.
- Guidelines for Education and Training in the Conservation of Monuments, Ensembles and Sites (1993). The aim of this document is to promote the establishment of standards and guidelines for education and training in the conservation of historic buildings, historic areas and towns, archaeological sites, and cultural landscapes. It emphasises the need to develop a holistic approach to heritage issues and sets out the relevant skills that are required.
D.34 The United Nations Educational and Scientific Organisation (UNESCO) was founded in 1947 and has promoted various Conventions and other instruments for the conservation of the cultural heritage. A selection of these are:
Recommendation Concerning International Competitions in Architecture and Town Planning (1956). Provides guidance for the drawing up of programmes for international competitions, in the interests both of organisers and of competitors.
Recommendations on International Principles Applicable to Archaeological Excavations (1956). Deals with general principles and regulations governing excavations and the trade in antiquities.
Recommendations Concerning the Safeguarding of the Beauty and Character of Landscapes and Sites (1962). Considers preventive measures aimed at protecting natural, rural and urban landscapes and sites, whether natural or man-made, which have cultural or aesthetic interest.

Recommendations Concerning the Preservation of Cultural Property Endangered by Public or Private Works (1968). Considers preventive and corrective measures which should aim at protecting or saving cultural properties from works likely to damage or destroy them, such as urban expansion and renewal projects, injudicious repair and modifications, highway works, agricultural operations, the construction of infrastructure and industrial development.
Recommendations Concerning the Protection at National Level of the Cultural and Natural Heritage (1972). Defines the terms cultural and natural heritage, and provides a lengthy consideration of general principles, the organisation of services, and protective measures under the headings of financial, administrative, scientific and technical.
Convention for the Protection of the World Cultural and Natural Heritage (1972). Introduces the concept of World Heritage Sites.
Recommendations Concerning the Safeguarding and Contemporary Role of Historic Areas (1976). Another lengthy and detailed document which provides a comprehensive set of standards and principles for the conservation of the historic environment.
D.35 The charters and standards should be viewed as providing guiding principles towards defining an appropriate response to particular conservation issues, not as instant and all-inclusive prescriptions. The following factors form the basis of most of the documents: comprehensive analysis of the place, minimum intervention in the historic fabric, precise documentation, respect for contributions from all periods, maintenance of authenticity and the requirement to take a holistic view of the historic environment.
Water Quality
D.36 Classification of freshwater bodies in the UK is provided in Table D.7.
Table D.7 Biological Classification - UK Environment Agency
CLASSIFICATION DESCRIPTION
A – Very good Biology similar to that expected for an unpolluted river. B – Good Biology is a little short of an unpolluted river. C – Fairly good Biology worse than expected for unpolluted river. D – Fair A range of pollution tolerant species present E – Poor Biology restricted to pollution tolerant species. F– Bad Biology limited to a small number of species very tolerant of pollution.

D.37 Samples are analysed for nitrate and orthophosphate. A grade is assigned for each of these nutrients according to Table D.8 below.
Table D.8 Nutrients – UK Environment Agency
CLASSIFICATION FOR PHOSPHATE GRADE LIMIT (MGP/L) AVERAGE DESCRIPTION
1 0.02 Very low 2 0.06 Low 3 0.1 Moderate 4 0.2 High 5 1.0 Very high 6 >1.0 Excessively high
Classification for nitrate Grade limit (mg NO3/l) average
Description
1 5 Very low 2 10 Low 3 20 Moderately low 4 30 Moderate 5 40 High 6 >40 Very high
D.38 There are no set ‘good’ or ‘bad’ concentrations for nutrients in rivers in the way that chemical and biological quality is described. Rivers in different parts of the UK have naturally different concentrations of nutrients. ‘Very low’ nutrient concentrations, for example, are not necessarily good or bad; the classifications merely states that concentrations in this river are very low relative to other rivers.
D.39 The bathing season in England and Wales runs from 15 May to 30 September and sampling commences two weeks before the start of the season. Agency policy is that 20 samples are taken at regular intervals throughout the season at each site. Samples are taken at predetermined sites where the average density of bathers has been shown to be the highest.
D.40 Each sample is analysed for total coliforms, faecal coliforms, and faecal streptococci. Faecal coliforms and faecal streptococci are indicators of the presence of traces of human sewage. There are two recognised categories for classification against the standards of the Directive:
The mandatory standard, which should not be exceeded. Where 95 percent of the samples should not contain more than 10,000 total coliforms per 100 ml of water, or 2,000 faecal coliforms per 100 ml of water.
The guideline standard, which should be achieved wherever possible. This standard requires 80 percent of the samples to have no more than 500 total coliforms per 100 ml of water, or 100 faecal coliforms per 100 ml of water. In addition to this, 90 percent of samples should have no more than 100 faecal streptococci per 100 ml of water. The EC derivation does not necessitate the monitoring of faecal streptococci.

D.41 Japanese standards for water quality are provided in Table D.9.
Table D.9 Japanese Standards for Water Quality
ITEM STANDARD VALUES
Cadmium 0.01 mg/litre or less Total cyanogen in no detectable amounts
Lead 0.01 mg/litre or less Chromium (VI) 0.05 mg/litre or less
Arsenic 0.01 mg/litre or less total mercury 0.0005 mg/litre or less alkyl mercury in no detectable amounts
PCB in no detectable amounts Dichloromethane 0.02 mg/litre or less
carbon tetrachloride 0.002 mg/litre or less 1,2-dichloroethane 0.004 mg/litre or less
1,1-dichloroethylene 0.02 mg/litre or less cis 1,2-dichloroethylene 0.04 mg/litre or less
1,1,1-trichloroethane 1.0 mg/litre or less 1,1,2-trichloroethane 0.006 mg/litre or less
trichloroethylane 0.03 mg/litre or less tetrachloroethylene 0.01 mg/litre or less
1,3-dichloro propane 0.002 mg/litre or less thiram 0.006 mg/litre or less
simazine 0.003 mg/litre or less thiobencarb 0.02 mg/litre or less
Benzene 0.01 mg/litre or less selenium 0.01 mg/litre or less
San Francisco Water Quality Objectives2
D.42 There are two types of objectives: narrative and numerical. Both narrative and numerical objectives define the level of water quality that shall be maintained within the region. Compliance with water quality objectives may be prohibitively expensive or technically impossible in some cases. The Regional Board will consider modification of specific water quality objectives as long as the discharger can demonstrate that the alternative objective will protect existing beneficial uses, is scientifically defensible, and is consistent with the State’s Anti-degradation Policy. This exception clause properly indicates that the Regional Board will conservatively compare benefits and costs in these cases because of the difficulty in quantifying beneficial uses.
D.43 Narrative objectives present general descriptions of water quality that must be attained through pollutant control measures and watershed management. They also serve as the basis for the development of detailed numerical objectives.
2 Chapter 3 Water Quality Objectives, San Francisco Bay Region

D.44 Numerical objectives typically describe pollutant concentrations, physical/chemical conditions of the water itself, and the toxicity of the water to aquatic organisms. These objectives are designed to represent the maximum amount of pollutants that can remain in the water column without causing any adverse effect on organism using the aquatic system as habitat, on people consuming those organisms or water, and on other current or potential beneficial uses. Table D.10 below shows part of the numerical water quality objectives.
Table D.10 Water Quality Objectives in San Francisco Bay Region
Parameter Objective Remarks
Objectives for Surface Water
E. coli (in colonies per 100ml) 126 Fresh Water at steady state (all areas)
235 Maximum at designated beach
Arsenic (µg/L) 36.0 (4-day average)
69.0 (1-hr average)
190.0 (4-day average)
360.0 (1-hr average)
Surface water with salinities > 5ppt
Surface water with salinities < 5ppt
Cadmium (µg/L) 9.3 (4-day average)
43.0 (1-hr average)
Surface water with salinities > 5ppt
Chromium (VI) (µg/L)
(May be met as total chromium)
50.0 (4-day average)
1100.0 (1-hr average)
11.0 (4-day average)
16.0 (1-hr average)
Surface water with salinities > 5ppt
Surface water with salinities < 5ppt
Cyanide (µg/L) 5.0 (1-hr average)
5.2 (4-day average)
22.0 (1-hr average)
Surface water with salinities > 5ppt
Surface water with salinities < 5ppt
Lead (µg/L) 5.6 (4-day average)
140.0 (1-hr average)
-
Mercury (µg/L) 0.025 (4-day average)
2.1 (1-hr average)
0.025 (4-day average)
2.4 (2-hr average)
Surface water with salinities > 5ppt
Surface water with salinities < 5ppt
Objectives for Municipal Supply
Arsenic (mg/L) 0.05 -
Cadmium (mg/L) 0.005 -
Chromium (mg/L) 0.05 -
Cyanide (mg/L) 0.2 -
Lead (mg/L) 0.05 -

Parameter Objective Remarks
Mercury (mg/L) 0.002 -
Dichloromethane (mg/L) 0.005 -
Carbon Tetrachloride (mg/L) 0.0005 -
1,2-dichloroethane (mg/L) 0.0005 -
1,1-dichloroethylene (mg/L) 0.006 -
cis 1,2-dichlorothylene (mg/L) 0.006 -
1,1,1-trichloroethane (mg/L) 0.2 -
1,1,2-trichloroethane (mg/L) 0.005 -
Trichloroethylene (mg/L) 0.005 -
Tetrchloroethylene (mg/L) 0.005 -
1,3-dichloropropene (mg/L) 0.0005 -
Benzene (mg/L) 0.001 -
Groundwater Quality Objectives
Total Dissolved Solids, TDS (mg/L)
Ambient or 500, whichever is lower
Ambient or 1000, whichever is lower
Central Basin
Fringe Subbasins
Nitrates (NO3) (mg/L) 45 Central Basin and Fringe Subbasins
D.45 United States standards for drinking water are provided in Table D.11.
Table D.11 United States Standards for Drinking Water
Contaminant MCLG1 (mg/L):
MCL or TT1 (mg/L)2
Potential health from exposure above the MCL
Common sources of contaminant in drinking
water MICROORGANISMS
Cryptosporidum zero TT3 Gastrointestinal illness (e.g., diarrhoea, vomiting, cramps)
Human and animal faecal waste
Giardio lamblia zero TT3 Gastrointestinal illness (e.g. diarrhoea, vomiting, cramps)
Human and animal faecal waste
Heterotrophic plate count (HPC) n/a TT3
HPC has no health effects; it is an analytic method used to measure the variety of bacteria that are common in water. The lower the concentration of bacteria in drinking water, the better the water system is maintained.
HPC measures a range of bacteria that are naturally present in the environment
Legionella zero TT3 Legionnaire’s Disease, a type of pneumonia
Found naturally in water, multiplies in heating systems
Total Coliforms (including fecal coliform and E. coli)
zero 5.0%4
Not a health threat in itself, it is used to indicate whether other potentially harmful bacteria may be present5
Coliforms are naturally present in the environment; as well as feces; fecal coliforms and E.coli only come from human and animal fecal waste.

Contaminant MCLG1 (mg/L):
MCL or TT1 (mg/L)2
Potential health from exposure above the MCL
Common sources of contaminant in drinking
water
Turbidity n/a TT3
Turbidity is a measure of the cloudiness of water. It is used to indicate water quality and filtration effectiveness (e.g. whether disease-causing organisms are present). Higher turbidity levels are often associated with higher levels of disease-causing micro organisms such as viruses, parasites and some bacteria. These organisms can cause symptoms such as nausen, cramps, diarrhea, and associated headaches.
Soil runoff
Viruses (enteric) zero TT3 Gastrointestinal illness (e.g. diarrhea, vomiting, cramps)
Human and animal fecal waste
DISINFECTION BY-PRODUCTS
Bromate zero 0.010 Increased risk of cancer By-product of drinking water disinfection
Chlorite 0.8 1.0 Anemia; infants & young children; nervous system effects
By-product of drinking water disinfection
Haloacetic acids (HAAS) n/a 0.060 Increased risk of cancer By-product of drinking water
disinfection Total Trihalomethanes (TTHMs)
none
n/a
0.10
0.080
Liver, kidney or central nervous system problems; increased risk of cancer
By-product of drinking water disinfection
DISINFECTANTS MRDL (mg/L)2
MRDL (mg/L)2
Chloramines (as Cl2)
MRDLG=4 MRDL=4.01 Eye/nose irritation; stomach discomfort, anemia
Water additive used to control microbes
Chlorine (as Cl2) MRDLG=4 MRDL=4.01 Eye/nose irritation; stomach discomfort
Water additive used to control microbes
Chlorine dioxide (as CIO2)
MRDLG=0.81 MRDL=0.81 Anemia; infants & young children;
nervous system effects Water additive used to control microbes
INORGANIC CHEMICALS
Antimony 0.006 0.006 Increase in blood cholesterol; decrease in blood sugar
Discharge from petroleum refineries; fire retardants; ceramics; electronics; solder
Arsenic 07 0.010 as of 1/23/06
Skin damage or problems with circulatory systems, and may have increased risk of getting cancer
Erosion of natural deposits, runoff from orchards, runoff from glass & electronics production wastes
Asbestos (fibres >10 micrometers)
7 million fibers per
Litre (MFL) 7 MFL Increased risk of developing
benign intestinal polyps
Decay of asbestos cement in water mains: erosion of natural deposits
Barium 2 2 Increase in blood pressure
Discharge of drilling wastes; discharge from metal refineries; erosion of natural deposits
Beryllium 0.004 0.004 Intestinal lesions
Discharge from metal refineries and coal-burning factories; discharge from electrical, aerospace, and defence industries
Cadium 0.005 0.005 Kidney damage
Corrosion of galvanized pipes; erosion of natural deposits; discharge from metal refineries; runoff from waste batteries and palms

Contaminant MCLG1 (mg/L):
MCL or TT1 (mg/L)2
Potential health from exposure above the MCL
Common sources of contaminant in drinking
water
Chromium (total) 0.1 0.1 Allergic dermatitis Discharge from steel and pulp mills; erosion of natural deposits
Copper 1.3 TT8;
Action Level = 1.3
Short term exposure: Gastrointestinal distress Long term exposure: Liver or kidney damage People with Wilson’s Decease should consult their personal doctor if the amount of copper in their water exceeds the action level
Corrosion of household plumbing systems; erosion of natural deposits
Cyanide (as free cyanide) 0.2 0.2 Nerve damage or thyroid
problems
Discharge from steel/metal factories; discharge from plastic and fertilizer factories
Fluoride 4.0 4.0 Bone disease (pain and tenderness of bones); Children may get mottled teeth
Water additive which promotes strong teeth; erosion of natural deposits; discharge from fertilizer and aluminium factories
Lead zero
TT Action Level 0.015
Infants and children: Delays in physical or mental development; children could show slight deflieits in attention span and learning abilities Adults: Kidney problems; high blood pressure
Corrosion of household plumbing systems; erosion of natural deposits
Mercury (inorganic) 0.002 0.002 Kidney damage
Erosion of natural deposits; discharge from refineries and factories; runoff from landfills and croplands
Nitrate (measured as Nitrogen)
10 10
Infants below the age of six months who drink water containing nitrate in excess of the MCL could become seriously ill and, if untreated may die. Symptoms include shortness of breath and blue-baby syndrome
Runoff from fertilizer use; leaching from septic tanks, sewage, erosion of natural deposits.
Nitrite (measured as Nitrogen)
1 1
Infants below the age of six months who drink water containing nitrite in excess of the MCL could become seriously ill and, if untreated may die. Symptoms include shortness of breath and blue-baby syndrome.
Runoff from fertilizer use; leaching from septic tanks, sewage; erosion of natural deposits.
Selenium 0.05 0.05 Hair or fingermail loss; numbness in fingers or toes; circulatory problems
Discharge from petroleum refineries; erosion of natural deposits; discharge from mines
Thallium 0.0005 0.002 Hair loss; changes in blood; kidney, intestine or liver problems
Leaching from ore-processing sites; discharge from electronics, glass and drug factories
ORGANIC CHEMICALS
Acrylamide zero TT Nervous system or blood problems; increased risk of cancer
Added to water during sewage/ wastewater treatment
Alachlor zero 0.002 Eye, liver, kidney or spleen problems: anentia: increased risk of cancer
Runoff from herbicide used on row crops
Atrazine 0.003 0.003 Cardiovascular system or reproductive problems
Runoff from herbieide used on row crops

Contaminant MCLG1 (mg/L):
MCL or TT1 (mg/L)2
Potential health from exposure above the MCL
Common sources of contaminant in drinking
water
Benzene zero 0.005 Anemia; decrease in blood platelets; increased risk of cancer
Discharge from factories; leaching from gas storage tanks and landfills
Benzo(a)pyrene (PAHs) zero 0.0002 Reproductive difficulties;
increased risk of cancer
Leaching from linings of water storage tanks and distribution lines
Carbofuran 0.04 0.04 Problems with blood, nervous system, or reproductive system
Leaching of soil fumigant used on rice and alfalfa
Carbon tetrachloride zero 0.005 Liver problems; increased risk of
cancer
Discharge from chemical plants and other industrial activities
Chlordane zero 0.002 Liver or nervous system problems, increased risk of cancer
Residue of banned termiticide
Chlorobenzene 0.1 0.1 Liver or kidney problems Discharge from chemical and agricultural chemical factories
2,4-D 0.07 0.07 Kidney, liver or adrenal gland problems
Runoff from herbicide used on row crops
Dalapon 0.2 0.2 Minor kidney changes Runoff from herbicide used on rights of way
1,2-Dibromo-3-chloropropane (DBCP)
zero 0.0002 Reproductive difficulties, increased risk of cancer
Runoff/leaching from soil fumigant used on soybeans, eoiton, pineapples, and orchards
o-Dichlorobenzene 0.6 0.6 Liver, kidney, or circulatory system problems
Discharge from industrial chemical factories
p-Dichlorobenzene 0.075 0.075 Anemia; liver, kidney or spleen damage; changes in blood
Discharge from industrial chemical factories
1, 2-Dichloroethane zero 0.005 Increase risk of cancer Discharge from industrial chemical factories
1, 1-Dichloroethylene 0.007 0.007 Liver problems Discharge from industrial
chemical factories cis-1, 2-Dichloroethylene 0.07 0.07 Liver problems Discharge from industrial
chemical factories trans-1, 2-Dichloroethylene 0.1 0.1 Liver problems Discharge from industrial
chemical factories
Dichloromethane zero 0.005 Liver problems; increased risk of cancer
Discharge from drug and chemical factories
1, 2-Dichloropropanc zero 0.005 Increased risk of cancer Discharge from industrial
chemical factories Di(2-ethtlhexy1) adipate 0.4 0.4 General toxic effects or
reproductive difficulties Discharge from chemical factories
Di(2-ethylhexy1) phthalate zero 0.006
Reproductive difficulties; liver problems; increased risk of cancer
Discharge from rubber and chemical factories
Dinoseb 0.007 0.007 Reproductive difficulties Runoff from lierbicide used on soybeans and vegetables
Dioxin (2.3, 7, 8-TCDD) zero 0.00000003 Reproductive difficulties;
increased risk of cancer
Emissions from waste incineration and other combustion; discharge from chemical factories
Diqual 0.02 0.02 Cataracts Runoff from herbicide use Endothall 0.1 0.1 Stomach and intestinal problems Runoff from herbicide use Endrin 0.002 0.002 Liver problems Residue of banned insecticide
Epichlorohydrin zero TT9 Increased cancer risk, and over a long period of time, stomach problems
Discharge from industrial chemical factories; and impurity of some water treatment chemicals
Ethylbenzene 0.7 0.7 Liver or kidneys problems Discharge from petroleum refineries
Ethylene dibromide zero 0.00005 Problems with liver, stomach, reproductive system, or kidneys; increased risk of cancer
Discharge from petroleum refineries

Contaminant MCLG1 (mg/L):
MCL or TT1 (mg/L)2
Potential health from exposure above the MCL
Common sources of contaminant in drinking
water
Glyphosate 0.7 0.7 Kidney problems; reproductive difficulties Runoff from herbicide use
Heptachlor zero 0.0004 Liver damage; increased risk of cancer Residue of banned termiticide
Heptachlor epoxide zero 0.0002 Liver damage; increased risk of cancer Breakdown of heptachlor
Hexachlorobenzene zero 0.001 Liver or kidney problems; reproductive difficulties; increased risk of cancer
Discharge from metal refineries and agricultural chemical factories
Hexacblorocyclopent adiene 0.05 0.05 Kidney or stomach problems Discharge from chemical
factories
Lindane 0.0002 0.0002 Liver or kidney problems Runoff/leaching from insecticide used on lumber, gardens
Methoxychlor 0.04 0.04 Reproductive difficulties Runoff/leaching from insecticide used on fruits, vegetables, alfalfa, livestock
Oxamyl (Vydate) 0.2 0.2 Slight nervous system effects Runoff/leaching from insecticide used on apples, potatoes, and tomatoes
Polychlorinated biphenyls (PCBs) zero 0.0005
Skin changes; thymus gland problems; immune deficiencies; reproductive or nervous system difficulties; increased risk of cancer
Runoff from landfills; discharge of waste chemicals
Pentachlorophenol zero 0.001 Liver or kidney problems; increased cancer risk
Discharge from wood preserving factories
Pieloram 0.5 0.5 Liver problems Herbicide runoff Simazine 0.004 0.004 Problems with blood Herbicide runoff
Styrene 0.1 0.1 Liver, kidney, or circulatory system problems
Discharge from rubber and plastic factories; leaching from landfills
Tetrachloroethylene zero 0.005 Liver problems; increased risk of cancer
Discharge from factories and dry cleaners
Toluene 1 1 Nervous system, kidney, or liver problems
Discharge from petroleum factories
Toxaphene zero 0.003 Kidney, liver, or thyroid problems; increased risk of cancer
Runoff/leaching from insecticide used on cotton and cattle
2,4,5-TP (Silvex) 0.05 0.05 Liver problems Residue of banned herbicide 1,2,4-Trichlorobenzene 0.07 0.07 Changes in adrenal glands Discharge from textile
finishing factories
1,1,1-Trichoroethane 0.20 0.2 Liver, nervous system, or
circulatory problems
Discharge from metal degreasing sites and other factories
1,1,2-Trichloroethane 0.003 0.005 Liver, kidney, or immune system
problems Discharge from industrial chemical factories
Trichloroethylene zero 0.005 Liver problems; increased risk of cancer
Discharge from metal degreasing sites and other factories
Vinyl chloride zero 0.002 Increased risk of cancer Leaching from PVC pipes; discharge from plastic factories
Xylenes (total) 10 10 Nervous system damage Discharge from petroleum factories; discharge from chemical factories
RADIONUCUDES

Contaminant MCLG1 (mg/L):
MCL or TT1 (mg/L)2
Potential health from exposure above the MCL
Common sources of contaminant in drinking
water
Alpha particles none7
15 picocuries per Litre (pCi/L)
Increased risk of cancer
Erosion of natural deposits of certain minerals that are radioactive and may emit forms of radiation known as alpha radiation
Beta particles and photon emitters none7
4 millirems per year
(mrem/yr)Increased risk of cancer
Decay of natural and man-made deposits of certain minerals that are radioactive and may emit forms of radiation known as photons and beta radiation
Radium 226 and Radium 228 (combined)
none7 5pCi/L Increased risk of cancer Erosion of natural deposits
Uranium zero 30ug/L as of 12/08/03
Increased risk of cancer, kidney toxicity Erosion of natural deposits
Notes 1 - Definitions
- Maximum Contaminant Level Goal (MCLG) - The level of a contaminant in drinking water below which there is no known or expected risk to health. MCLGs allow for a margin of safety and are non-enforceable public health goals.
- Maximum Contaminant Level (MCL) - The highest level of a contaminant that is allowed in drinking water. MCLs are set as close to MCLGs as feasible using the best available treatment technology and taking cost into consideration. MCLs are enforceable standards.
- Maximum Residual Disinfectant Level Goal (MRDLG) - The level of a drinking water disinfectant below which there is no known or expected risk to health. MRDLGs do not reflect the benefits of the use of disinfectants to control microbial contaminants.
- Maximum Residual Disinfectant Level (MRDL) - The highest level of a disinfectant allowed in drinking water. There is convincing evidence that addition of a disinfectant is necessary for control of microbial contaminants.
- Treatment Technique (TT) - A required process intended to reduce the level of a contaminant in drinking water.
2 - Units are in milligrams per litre (mg/l) unless otherwise noted. Milligrams per litre are equivalent to parts per
million (ppm) 3 - EPA’s surface water treatment roles require systems using surface or ground water under the direct influence
of surface water to (a) disinfect their water, and (b) filter their water or meet criteria for avoiding filtration so that the contaminants are controlled at the following levels: - Cryptosporidium (as of 1/1/02 for systems serving >10,000 and 1/14/05 for systems serving <10,000): 99%
removal - Giardia lamblia: 99.9% removal/inactivation - Viruses: 99.99% removal/inactivation - Legionella: No limit, but EPA believes that if Giardia and viruses are removed/inactivated, Legionella will
also be controlled - Turbidity: At no time can turbidity (cloudiness of water) go above 5 nephelolometric turbidity units (NTU);
systems that filter must ensure that the turbidity go no higher than 1 NTU (0.5 NTU for conventional or direct filtration) in at least 95% of the daily samples in any month. As of January 1, 2002, turbidity may never exceed 1 NTU, and must not exceed 0.3 NTU in 95% of daily samples in any month.
- HPC: No more than 500 bacterial colonies per millilitre - Long Term 1 Enhanced Surface Water Treatment (Effective Date: January 14, 2005): Surface water
systems or (GWUDI) systems serving fewer than 10,000 people must comply with the applicable Long Term 1 Enhanced Surface Water Treatment Rule provisions (e.g. turbidity standards, individual filter monitoring, Cryptosporidium removal requirements, updated watershed control requirements for unfiltered systems).
- Filter Backwash Recycling: The Filter Backwash Recycling Rule requires recycling systems to return specific recycle flows through all processes of the system’s existing conventional or direct filtration system or at an alternative location approved by the state.
4 - No more than 5.0% samples total coliform-positive in a month. (For water systems that collect fewer than 40
routine samples per month, no more than one sample can be total coliform-positive per month.) Every sample

that has total coliform must be analysed for either fecal coliforms or E.coli if two consecutive total coliform-positive samples, and one is also positive for E.coli fecal coliforms, has an acute MCL violation.
5 - Fecal coliform and E.coli are bacteria whose presence indicates that the water may be contaminated with
human or animal wastes. Disease-causing microbes (pathogens) in these wastes can cause diarrhea, cramps, nausea, headaches, or other symptoms. These pathogens may pose a special health risk for infants, young children, and people with severely compromised immune systems.
6 - Although there is no collective MCLG for this contaminant group, there are individual MCLGs for some of the
individual contaminants: - Haloacetic acids: dichloroacetic acid (zero); trichloroacetic acid (0.3mg/L) - Trihalomethanes: Bromodichloromethane (zero); bromoform 9zero); dibromochloromethane (0.06 mg/L)
7 - MCLGs were not established before the 1986 Amendments to the Safe Drinking Water Act. The standard for
this contaminant was set prior to 1986. Therefore, there is no MCLG for this contaminant. 8 - Lead and copper are regulated by a Treatment Technique that requires systems to control the corrosiveness of
their water. If more than 10% of tap water samples exceed the action level, water systems must take additional steps. For copper, the action level is 1.3mg/L, and for lead is 0.015 mg/L.
9 - Each water system must certify, in writing, to the state that when it uses acrylamide and/or epichlorophydrip to
treat water, the combination (or product) of dose and monomer level does not exceed the levels specified, as follows: Acrylanide = 0.05% dosed at 1 mg/L (or equivalent): EPichlorohydrin = 0.01% dosed at 20 mg/L (or equivalent).
Source: Office of Water, July 2002 (www.epa.gov/safewater)
Renewable Energy Targets
D.46 The Australian Government’s mandatory Renewable Energy Target commenced on 1st April 2001 (www.greenhouse.gov.au/markets). The Renewable Energy (Electricity) Act 2000 requires the generation of 9,500 gigawatt hours of extra renewable electricity per year by 2010, which could meet the residential electricity needs of four million people. In the Prime Minister’s statement in November 1997, Safeguarding the Future: Australia’s Response to Climate Change, provides details of actions which demonstrate the Commonwealth Government’s Commitment to an effective national greenhouse response. This $180 million package will significantly reduce Australia’s greenhouse gas emissions below projected levels. This package contains a range of measures that address both the supply and demand side of energy use.
D.47 The European White Paper for a Community Strategy provides details of the strategy to double the share of renewable energies in gross domestic energy consumption in the EU by 2010 (from the present 6% to 12%). The campaign sets out a framework for action to highlight investment opportunities and attract the necessary private funding which is expected to make up the lion’s share of the capital required. The key sector actions are 1,000,000PV systems, 15 million m2 solar collectors, 10,000 MW of wind turbine generators, 10,000 MW of combined heat and power biomass installations, 1,000,000 dwellings heated by biomass, 1,000 MW of biogas installations, 5 million tonnes of liquid biofuels (www:europa.eu.int/comm/energy/en/altpres.html).
D.48 The UK Government is proposing that 5% of the UK’s electricity should be met by renewables by the end of 2003, and 10% by 2010 as long as the cost to consumers

is acceptable. These targets are intended to act as a stimulus to industry and provide milestones for monitoring progress (www.dti.gov.uk/renewable/menu.html).
D.49 The USA is facing an energy shortage in a number of states, namely California, as populations increase without the corresponding increases in electricity production infrastructure. A report of the national Energy Development Group provides a range of recommendations regarding USA’s energy use. This document provides a range of recommended measures primarily aimed at reducing the reliance on imported fuel for production. Consumption reduction targets are also recommended, although no specific targets are proposed.

APPENDIX E
Water Quality Objectives for Southern Water Control Zone
Table E.1 Water Quality Objectives for Southern Water Control Zone Water Quality Objective PART OR PARTS OF ZONE
A. AESTHETIC APPEARANCE
Waste discharges shall cause no objectionable odours or discolouration of the water.
Tarry residues, floating wood, articles made of glass, plastic, rubber or of any other substance should be absent.
Mineral oil should not be visible on the surface. Surfactants should not give rise to a lasting foam.
There should be no recognisable sewage-derived debris.
Floating, submerged and semi-submerged object at a size likely to interfere with the free movement of vessels, or cause damage to vessels, should be absent.
Waste discharges shall not cause the water to contain substances which settle to form objectionable deposits.
Whole Zone
Whole Zone
Whole Zone
Whole Zone
Whole Zone
Whole Zone
B. BACTERIA
The level of Escherichia coli should not exceed 610 per 100 ml, calculated as the geometric mean of all samples collected in one calendar year.
The level of Escherichia coli should not exceed 180 per 100 ml, calculated as the geometric mean of all samples collected from March to October inclusive in one calendar year. Samples should be taken 3 times in a calendar month at intervals of between 3 and 14 days.
Secondary Contact Recreation Subzones and Fish Culture Subzones
Bathing Beach Subzones
C. DISSOLVED OXYGEN
Waste discharges shall not cause the level of dissolved oxygen to fall below 4 milligrams per litre for 90% of the sampling occasions during the year; values should be calculated as the water column average (arithmetic mean of at least 3 measurements at 1 metre below surface, mid-depth, and 1 metre above seabed). In addition, the concentration of dissolved oxygen should not be less than 2 milligrams per litre within 2 metres of the seabed for 90% of the sampling occasions during the year.
The dissolved oxygen level should not be less than 5 milligrams per litre for 90% of the sampling occasions during the year; values should be calculated as water column average (arithmetic mean of at least 3 measurements at 1 metre below surface, mid-depth and 1 metre above seabed). In addition, the concentration of dissolved oxygen should not be less than 2 milligrams per litre within 2 metres of the seabed for 90% of the sampling occasions during the year.
Waste discharges shall not cause the level of dissolved oxygen to be less than 4 milligrams per litre.
Marine waters excepting Fish Culture Subzones
Fish Culture Subzones
Inland waters of the Zone
D. pH
The pH of the water should be within the range of 6.5-8.5 units. In addition, waste discharges shall not cause the natural pH range to be extended by more than 0.2 units.
Marine waters excepting Bathing Beach Subzones; Mui Wo (A), Mui Wo (B), Mui Wo (C), Mui Wo (E) and Mui Wo (F) Subzones

Water Quality Objective PART OR PARTS OF ZONE
The pH of the water should be within the range of 6.0-9.0 units.
The pH of the water should be within the range of 6.0-9.0 units for 95% of samples. In addition, waste discharges shall not cause the natural pH range to be extended by more than 0.5 units.
Mui Wo (D) Subzones and other inland waters. Bathing Beach Subzones
E. TEMPERATURE
Waste discharges shall not cause the natural daily temperature range to change by more than 2.0 degree Celsius.
Whole Zone
F. SALINITY
Waste discharges shall not cause the natural ambient salinity level to change by more than 10%.
Whole Zone
G. SUSPENDED SOLIDS
Waste discharges shall neither cause the natural ambient level to be raised by 30% nor give rise to accumulation of suspended solids which may adversely affect aquatic communities.
Waste discharges shall not cause the annual median of suspended solids to exceed 20 milligrams per litre.
Waste discharges shall not cause the annual median of suspended solids to exceed 25 milligrams per litre.
Marine waters
Mui Wo (A), Mui Wo (B), Mui Wo (C), Mui Wo (E) and Mui Wo (F) Subzones. Mui Wo (D) Subzones and other inland waters.
H. AMMONIA
The ammonia nitrogen level should not be more than 0.021 milligram per litre, calculated as the annual average (arithmetic mean), as unionised form.
Whole Zone
I. NUTRIENTS
Nutrients shall not be present in quantities sufficient to cause excessive or nuisance growth of algae or other aquatic plants.
Without limiting the generality of the above objective, the level of inorganic nitrogen should not exceed 0.1 milligram per litre, expressed as annual water column average (arithmetic mean of at least 3 measurements at 1 metre below surface, mid-depth and 1 metre above seabed).
Marine waters
J. 5-DAY BIOCHEMICAL OXYGEN DEMAND
Waste discharges shall not cause the 5-day biochemical oxygen demand to exceed 5 milligrams per litre.
Inland waters of the Zone
K. CHEMICAL OXYGEN DEMAND
Waste discharges shall not cause the chemical oxygen demand to exceed 30 milligrams per litre.
Inland waters of the Zone
L. DANGEROUS SUBSTANCES
Waste discharges shall not cause the concentration of dangerous substances in marine water to attain such levels as to produce significant toxic effects in humans, fish or any other aquatic organisms, with due regard to biologically cumulative effects in food chains and to toxicant interactions with each other.
Waste discharges of dangerous substances shall not put a risk to any beneficial uses o the aquatic environment.
Whole Zone
Whole Zone
(Source: Adopted from CAP. 358, section 5, 1988 and L.N. 453 of 91)

myccheung
APPENDIX F


ywtsoi
Figure 2.1 Major inland waters in Hong Kong and the Water Quality Index (WQI) gradings of the monitoring stations in 2001

ywtsoi
Figure 2.2 Improving trend in the Water Quality Index (WQI) of inland waters of Hong Kong from 1986 to 2001 Major inland waters in Hong Kong and the Water Quality Index (WQI) gradings of the monitoring stations in 2001

ywtsoi
Figure 2.3 Location of beaches in Hong Kong

ywtsoi
Figure 2.4 Ranking of gazetted beaches in 2001

ywtsoi
Figure 2.5 Map of the 10 Water control Zones

ywtsoi
Figure 2.6
myccheung

ywtsoi
Figure 2.7 Location of Existing Waste Facilities

ywtsoi
Figure 2.8 General Location Plan for Existing PHIs in Hong Kong

ywtsoi
Figure 2.9 Map of Terrestrial Habitats in Hong Kong

ywtsoi
Figure 2.10 Terrestrial Habitats of High Ecological Value in Hong Kong

ywtsoi
Figure 2.11 Habitats with spawning/nursery functions in Hong Kong