
ENVIRONMENTAL IMPACT ASSESSMENT
410
ENVIRONMENTAL IMPACT ASSESSMENT OF TALONG LONDA HYDRO ELECTRIC PROJECT (225MW) East Kameng District, Arunachal Pradesh August 2014 Prepared by R. S. Envirolink Technologies Pvt. Ltd. 402, RADISSON SUITES COMMERCIAL PLAZA, B-BLOCK, SUSHANT LOK-I, GURGAON – 122 009 (HARYANA) PH. +91-124-4295383 www.rstechnologies.co.in On Behalf of GMR LONDA HYDRO POWER PVT. LTD. 302, NEW UDDAN BHAWAN, NEAR T-3 IGI AIRPORT, NEW DELHI
-
Upload
khangminh22 -
Category
Documents
-
view
3 -
download
0
Transcript of ENVIRONMENTAL IMPACT ASSESSMENT

ENVIRONMENTAL IMPACT ASSESSMENT OF
TALONG LONDA HYDRO ELECTRIC PROJECT (225MW) East Kameng District, Arunachal Pradesh
August 2014
Prepared by
R. S. Envirolink Technologies Pvt. Ltd.
402, RADISSON SUITES COMMERCIAL PLAZA,
B-BLOCK, SUSHANT LOK-I, GURGAON – 122 009 (HARYANA) PH. +91-124-4295383 www.rstechnologies.co.in
On Behalf of
GMR LONDA HYDRO POWER PVT. LTD.
302, NEW UDDAN BHAWAN, NEAR T-3 IGI AIRPORT, NEW DELHI

CONTENTS
CHAPTER 1: PROJECT DESCRIPTION
1.1 INTRODUCTION 1.1
1.2 HYDRO-POWER POTENTIAL OF ARUNACHAL PRADESH 1.2
1.3 HYDRO POWER POTENTIAL OF KAMENG SUB-BASIN 1.2
1.4 POLICY, LEGAL AND ADMINISTRATIVE FRAMEWORK 1.3
1.5 PROJECT DISCRIPTION 1.5
1.5.1 PROJECT ALTERNATE STUDIES 1.9
1.5.2 APPROACH TO THE PROJECT 1.10
1.5.3 INFRSTRUCTURE 1.11
1.5.4 CONSTRUCTION FACILITIES 1.12
1.6 OUTLINE OF THE REPORT 1.15
CHAPTER 2: METHODOLOGY
2.1 ENVIRONMENT IMPACT ASSESSMENT 2.1
2.2 METHODOLOGY 2.3
2.2.1 Study Area 2.3
2.2.2 Scoping Matrix 2.3
2.2.3 Surveys 2.6
2.2.4 Physiography 2.6
2.2.5 Geology 2.6
2.2.6 Meteorology 2.6
2.2.7 Hydrology 2.7
2.2.8 Land use and Land cover 2.7
2.2.9 Soil 2.7
2.2.10 WATER QUALITY AND AQUATIC BIOLOGY 2.8
2.2.11 Ambient Air Quality 2.9
2.2.12 Ambient Noise Level 2.9
2.2.13 Forest Types and Forest Cover 2.9
2.2.14 Vegetation Structure/ Floristic 2.9
2.2.15 Faunal Elements 2.11
2.2.16 Aquatic Ecology 2.11
2.2.17 Demographic Characteristics 2.12
2.2.18 Infrastructure Facilities 2.12
2.2.19 Public Health 2.12
2.3 IMPACT PREDICTION 2.13
2.4 ENVIRONMENTAL MANAGEMENT PLAN AND COST ESTIMATES 2.13

2.5 DAM BREAK ANALYSIS AND DISASTER MANAGEMENT PLAN 2.14
2.6 ENVIRONMENTAL MONITORING PROGRAMME 2.14
CHAPTER 3: HYDROLOGY
3.1 GENERAL 3.1
3.2 PHYSIOGRAPHY 3.1
3.3 DRAINAGE 3.6
3.4 METEOROLOGY 3.8
3.5 GEOLOGY 3.10
3.5.1 Geology of Project area 3.12
3.5.2 Seismic Zone 3.12
3.5.3 Site Specific Studies 3.13
3.6 SOIL 3.13
3.7 WATER AVAILABILITY 3.16
3.7.1 Design Flood 3.16
3.8 SEDIMENTATION 3.17
3.9 WATER QUALITY 3.18
3.10 AMBIENT AIR QUALITY 3.21
3.11 AMBIENT NOISE LEVEL 3.24
3.12 LANDUSE PATTERN 3.25
CHAPTER-4: ENVIRONMENTAL BASELINE STATUS -1 ECOLOGICAL ASPECT
4.1 GENERAL 4.1
4.2 TERRESTRIAL ECOLOGY 4.1
4.2.1 FOREST TYPE IN THE CATCHEMNT AREA 4.3
4.2.2 FOREST IN THE PROJECT AREA 4.4
4.2.3 FIELD STUDIES 4.5
4.2.4 FINDINGS OF THE VEGETATION SURVEY 4.6
4.2.4.1 FLORISTIC COMPOSITION 4.6
4.2.4.2 ECONOMICALLY IMPORTANT SPECIES 4.8
4.2.4.3 SPECIES DIVERSITY AND EVENNESS INDEX 4.32
4.2.4.4 ENDEMIC SPECIES 4.33
4.2.5 FAUNA 4.33
4.2.5.1 THREATENED SPECIES 4.40
4.3 AQUATIC ECOLOGY 4.40
4.3.1 AQUATIC ECOLOGY 4.40

4.3.2 RESULTS 4.41
4.3.3 FISHERIES 4.43
CHAPTER-5 SOCIO-ECONOMIC ASPECTS
5.1 GENERAL 5.1
5.2 STUDY OBJECTIVES 5.1
5.3 SOCIO-ECONOMIC STATUS IN THE STUDY AREA 5.1
5.3.1 Demographic Profile 5.3
5.3.2 Educational Profile 5.4
5.3.3 Health Care Facilities 5.5
5.3.4 Occupational Pattern 5.5
5.3.5 Other Amenities 5.6
5.4 SOCIO-ECONOMIC STATUS OF THE AFFECTED VILLAGES 5.6
5.4.1 Demographic Profile 5.6
5.4.2 Educational Profile 5.7
5.4.3 Occupational Pattern 5.8
5.4.4 Other Amenities 5.8
5.4.5 Public Perception of Project 5.8
CHAPTER-6 PREDICTION OF IMPACTS
6.1 GENERAL 6.1
6.2 IMPACTS ON LAND ENVIRONMENT 6.1
6.2.1 CONSTRUCTION PHASE 6.1
6.2.1.1 ENVIRONMENTAL DEGRADATION DUE TO IMMIGRATION OF
CONSTRUCTION WORKERS POPULATION
6.2
6.2.1.2 QUARRYING OPERATIONS 6.3
6.2.1.3 OPERATION OF CONSTRUCTION EQUIPMENT 6.3
6.2.1.4 SOIL EROSION/INCREASED SILTATION 6.4
6.2.1.5 MUCK DISPOSAL 6.4
6.2.1.6 CONSTRUCTION OF ROADS 6.5
6.2.1.7 PROJECT ROAD 6.6
6.2.2 OPERATION PHASE 6.6
6.2.2.1 IMPACTS ON WATER RESOURCES 6.6
6.3 IMPACTS ON WATER QUALITY 6.8

6.3.1.1 SEWAGE FROM CONSTRUCTION WORKER CAMPS 6.8
6.3.1.2 EFFLUENT FROM CRUSHERS 6.9
6.3.1.3 DISPOSAL OF MUCK 6.9
6.3.2 OPERATION PHASE 6.9
6.3.2.1 EFFLUENT FROM PROJECT COLONY 6.10
6.3.2.2 IMPACTS ON RESERVOIR WATER QUALITY 6.10
6.3.2.3 EUTROPHICATION RISKS 6.10
6.4 IMPACTS ON TERRESTRIAL FLORA 6.10
6.4.1 CONSTRUCTION PHASE 6.10
6.4.2 OPERATION PHASE 6.10
6.4.2.1 ACQUISITION OF FOREST LAND 6.11
6.5 IMPACTS ON TERRESTRIAL FAUNA 6.12
6.5.1 CONSTRUCTION PHASE 6.12
6.5.1.1 DISTURBANCE TO WILDLIFE 6.12
6.5.1.2 IMPACTS ON MIGRATORY ROUTES 6.12
6.5.2 OPERATION PHASE
6.6 IMPACTS ON AQUATIC ECOLOGY 6.13
6.6.1 CONSTRUCTION PHASE 6.13
6.6.1.1 IMPACTS DUE TO EXCAVATION OF CONSTRUCTION
MATERIAL FROM RIVER BED
6.13
6.6.1.2 IMPACTS DUE TO DISCHARGE OF SEWAGE FROM CONSTRUCTION
WORKER CAMP/COLONY
6.14
6.6.1.3 IMPACTS DUE TO HUMAN ACTIVITIES 6.14
6.6.2 OPERATION PHASE 6.14
6.6.2.1 IMPACTS DUE TO DAMMING OF RIVER 6.14
6.6.2.2 IMPACTS ON MIGRATORY FISH SPECIES 6.15
6.7 IMPACTS ON NOISE ENVIRONMENT 6.16
6.7.1 NOISE DUE TO CONSTRUCTION EQUIPMENT 6.16
6.8 AIR POLLUTION 6.17
6.8.1 POLLUTION DUE TO FUEL COMBUSTION IN VARIOUS EQUIPMENTS 6.17
6.8.2 EMISSIONS FROM VARIOUS CRUSHERS 6.18
6.8.3 FUGITIVE EMISSIONS FROM VARIOUS SOURCES 6.18
6.9 IMPACTS ON SOCIO-ECONOMIC ENVIRONMENT 6.18
6.9.1.1 POSITIVE IMPACTS ON SOCIO-ECONOMIC ENVIRONMENT 6.18
6.9.1.2 NEGATIVE IMPACTS ON SOCIO-ECONOMIC ENVIRONMENT 6.19
6.9.2 OPERATION PHASE 6.19
6.9.2.1 INCREASED INCIDENCE OF WATER-RELATED DISEASES 6.19

6.9.2.2 AGGREGATION OF CONSTRUCTION WORKER 6.19
6.9.2.3 EXCAVATIONS 6.20
6.9.2.4 INADEQUATE FACILITIES IN CONSTRUCTION WORKER CAMPS 6.20
CHAPTER-7: CLEAN DEVELOPMENT MECHANISM
7.1 INTRODUCTION 7.1
7.2 CDM PROJECT CYCLE 7.2
7.3 TALONG LONDA HEP 7.3
7.4 CDM PROCEDURES 7.5
7.5 CDM ACTIVITY FOR HYDRO ELECTRIC PROJECTS 7.6
7.6 MODALITIES AND PROCEDURES FOR CDM RUN-OF RIVER TALONG
LONDA HYDRO ELECTRIC PROJECTS
7.9
7.7 GHG REDUCTIONS FROM THE PROJECT ACTIVITY 7.12
7.8 CER REVENUE 7.13
7.9 TALONG LONDA HEP SUSTAINABLE DEVELOPMENT ACTION PLAN FOR
THE CDM CREDITING PERIOD
7.13
7.10 CONCLUSION 7.14
CHAPTER-8: ENVIRONMENT FLOW STUDY
8.1 INTRODUCTION 8.1
8.2 NORMS FOR ENVIRONMENTAL FLOW 8.1
8.3 SCOPE OF STUDY 8.2
8.4 IDENTIFICATION OF CRITICAL STRETCH 8.2
8.5 BASELINE DATA ON WATER QUALITY AND AQUATIC ECOLOGY 8.3
8.6 HABITAT REQUIREMENT 8.3
8.7 FLOWS AVAILABLE 8.4
8.8 SIMULATION OF RELEASE FROM THE BARRAGE 8.6
8.9 CONCLUSION 8.8

LIST OF TABLES
Table1.1 Status of Hydro-Power Potential of the North-eastern States 1.1
Table1.2 Energy and Peak Load Demand for the North Eastern Region
Period 2007 – 2022 1.2
1.2
Table1.3 Power potential of Kameng Basin 1.3
Table1.4 Salient Features of the proposed Talong Londa HEP 1.7
Table 1.5 Details of Land Requirement 1.13
Table 2.1 Salient Environmental Features 2.3
Table 2.2 Scoping for EIA study 2.4
Table 2.3 Water Quality Parameters Analyzed 2.8
Table 2.1 Sampling Locations 2.10
Table 2.2 Number of quadrats studied during field surveys for trees,
shrubs and herbs
2.10
Table 3.1 Meteorological stations and data availability 3.8
Table 3.2 Details of average monthly rainfall 3.9
Table 3.3 Regional Stratigraphic Sequence (Project area) 3.11
Table 3.4 Details of Earthquakes in North-eastern India (M > 6) 3.13
Table 3.5 Physico-chemical Analysis of Soil Samples 3.14
Table 3.6 PMF hydrograph ordinates at Talong Londa dam site 3.16
Table 3.7 Results of Water Quality Analysis (Winter Season) 3.19
Table 3.8 Results of Water Quality Analysis (Summer Season) 3.19
Table 3.9 Results of Water Quality Analysis (Monsoon Season) 3.20
Table 3.10 Techniques Used for Ambient Air Quality Monitoring 3.21
Table 3.11 3.22
Table 3.12 Summary of Ambient Air Quality Monitoring Results (Unit: g/m3) 3.23
Table 3.13 Hourly Equivalent Noise Levels (Unit: dB(A)) 3.24
Table 3.14 Day time Equivalent Noise Levels 3.25
Table 3.15 Land use Pattern in the Study Area 3.26
Table 4.1 Number of Species Observed Group-wise 4.7
Table 4.2 Economically Important Species found in the Study Area 4.7
Table 4.3 Community Characteristic of the Vegetation (Winter) 4.8
Table 4.4 Community Characteristic of the Vegetation (Summer) 4.15
Table 4.5 Community Characteristic of the Vegetation (Monsoon Season) 4.24
Table 4.6 Species Diversity Indices for Different Vegetation Components 4.32
Table 4.7 Major Faunal and insects Species Reported from the Study Area 4.35

Table 4.8 Threatened Species Reported in the Study Area 4.40
Table 4.9 Density of Phytoplankton, Benthos and Zooplankton (Winter) 4.41
Table 4.10 Density of Phytoplankton, Benthos and Zooplanktons (Summer) 4.42
Table 4.11 Density of Phytoplankton, Benthos and Zooplankton (Monsoon) 4.42
Table 4.12 Diversity Index of Phytoplankton, Benthos and Zooplanktons 4.43
Table 4.13 Fish Species Reported in Kameng Basin 4.43
Table 4.14 Fish Species Observed in Kameng River 4.44
Table 4.15 Composition of Fish Species Caught during Fisheries Survey 4.45
Table 5.1 Population and Literacy – Circle Wise 5.2
Table 5.2 Demographic Profile of Study Area Villages 5.3
Table 5.3 Demographic Profile of the Affected Villages 5.6
Table 5.4 Educational Profile of Affected Villages 5.7
Table 5.5 Occupational Pattern in Affected Villages 5.8
Table 6.1 Construction Workers Requirement for Project Construction 6.2
Table 6.2 Total Migrant Population (Peak Time) 6.2
Table 6.3 Land Requirement for Proposed Project (Unit: ha) 6.6
Table 6.4 Population residing in the downstream stretch 6.7
Table 6.5 Streams joining in the downstream stretch 6.7
Table 6.6 Tree Density at Sampling Sites 6.11
Table 6.7 Noise level due to Construction Equipment 6.16
Table 6.8 Increase in Noise due to Operation of Construction Equipment 6.16
Table 6.9 Transmission Loss Values for Construction Materials 6.17
Table 7.1 CDM Project Activity for Talong Londa 7.9
Table 7.2 Expected GHG reductions for Talong Londa HEP 7.13
Table 8.1 10-Daily Flow Series for 90% Dependable Year 8.5
Table 8.2 Results of Simulation 8.6
Table 8.3 Comparison of water depth and velocity in downstream of
project
8.8
Table 8.4 Peaking and Non-Peaking hour Generation Capability in 90% DY 8.8

LIST OF FIGURES
Figure1.1 Project Location Map of Talong Londa HEP 1.6
Figure 2.1 Study Area Map of Talong Londa HEP Showing Sampling Sites 1.6
Figure 3.1 Digital Elevation Model of Talong Londa H. E. project catchment
showing topography
3.3
Figure-3.2 Relief map of Talong Londa H. E. project catchment 3.4
Figure-3.3 Slope map of Talong Londa H. E. project catchment 3.5
Figure-3.4 Drainage map of Talong Londa H. E. project catchment 3.7
Figure 3.5 Meteorological stations in Kameng basin 3.10
Figure 3.6 Soil Map of Talong HE Project 3.15
Figure 3.7 Average Monthly Flow Pattern 3.16
Figure 3.8 Sediment Concentration at Talong Londa Dam Site 3.17
Figure-3.9 FCC of Talong Londa H. E. project catchment area generated
from IRS 1D LISS-III data
3.27
Figure-3.10 FCC of Talong Londa H. E. project study area generated from IRS
1D LISS-III data
3.28
Figure-3.11 Land use / land cover map of catchment area of Kameng basin
up to Talong Londa H. E. project dam site
3.29
Figure-3.15 Land use / land cover map of Talong Londa H. E. project study
area
3.30
Figure 5.1 Education profile of villages in the vicinity of Talong Londa HEP 5.5
Figure 5.2 Circle wise working population in study area of Talong Londa HEP 5.5
Figure 5.3 Occupational pattern in study area 5.6
Figure 5.4 Literacy rate in affected villages of Talong Londa HEP 5.7
Figure 7.1 CDM Process Cycle 7.1
Figure 8.1 Longitudinal Profile of Kameng River 8.2
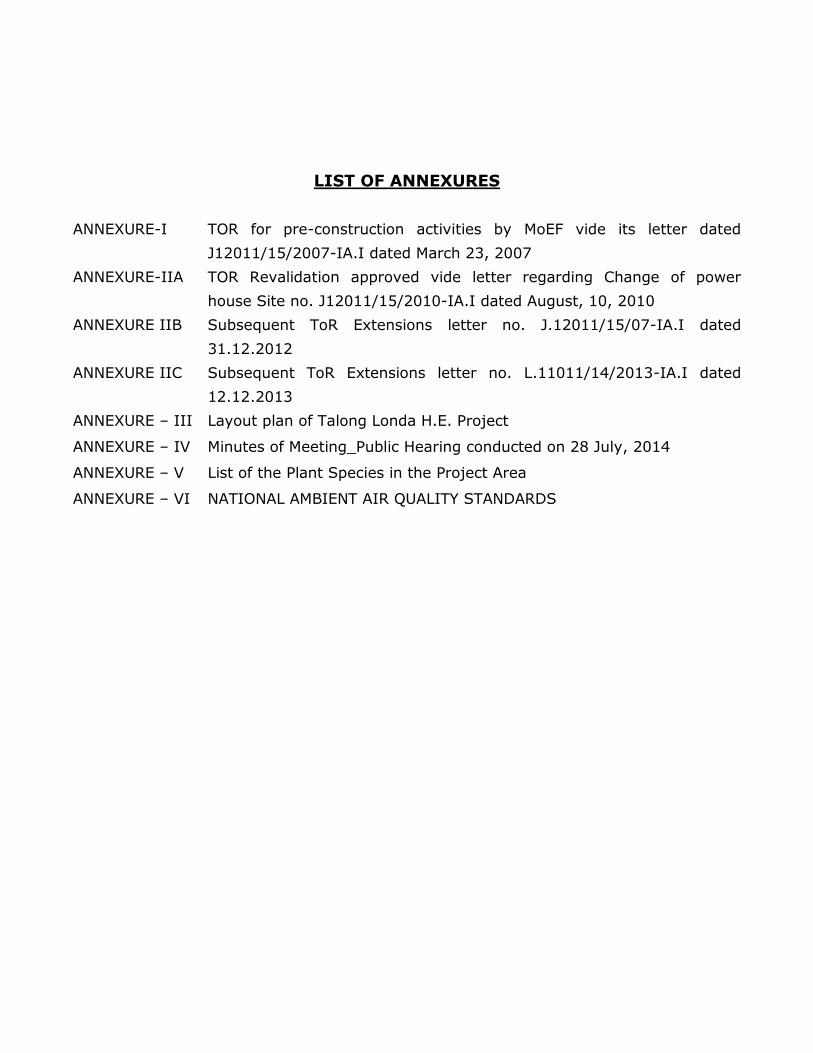
LIST OF ANNEXURES
ANNEXURE-I TOR for pre-construction activities by MoEF vide its letter dated
J12011/15/2007-IA.I dated March 23, 2007
ANNEXURE-IIA TOR Revalidation approved vide letter regarding Change of power
house Site no. J12011/15/2010-IA.I dated August, 10, 2010
ANNEXURE IIB Subsequent ToR Extensions letter no. J.12011/15/07-IA.I dated
31.12.2012
ANNEXURE IIC Subsequent ToR Extensions letter no. L.11011/14/2013-IA.I dated
12.12.2013
ANNEXURE – III Layout plan of Talong Londa H.E. Project
ANNEXURE – IV Minutes of Meeting_Public Hearing conducted on 28 July, 2014
ANNEXURE – V List of the Plant Species in the Project Area
ANNEXURE – VI NATIONAL AMBIENT AIR QUALITY STANDARDS

GMR Londa Hydro Power Pvt Ltd EIA study of Talong Londa H.E. Project
R S Envirolink Technologies Pvt. Ltd. 1.1
CHAPTER 1 INTRODUCTION
1.1 INTRODUCTION
The state of Arunachal Pradesh situated in the north-eastern region of the country
and lies between latitudes 26o28’N to 29o30’N and longitudes 91o3’E to 97o30’E.
The State shares international boundaries with China along the snow line in the
North, Bhutan to the West and Myanmar in South-east. The state shares most of
its southern boundary with Assam and a small stretch on the southern side with
Nagaland. The state is blessed with major rivers which have significant
hydropower potential, such as Subansiri, Siang, Kameng, Lohit, Dibang, Tirap and
many tributaries such as Kamla, Ranganadi (Panyor), Dikrong and Tawang Chhu.
Out of the country’s total hydro-power potential of 84,044 MW (at 60% load
factor), nearly 31,864 MW (38%) is located in the north-eastern region. The hydro-
power potential in each of the north-eastern state is given in Table-1.1.
Table1.1: Status of Hydro-Power Potential of the North-eastern States
State
Identified Capacity as per Re-assessment
Study
Capacity Developed Capacity Under Construction
Capacity yet to be Developed
(MW) (MW) % (MW) (%) (MW) %
Meghalaya 2394.00 185.20 7.74 124.00 5.18 2084.80 87.08
Tripura 15.00 15.00 100.00 0.00 0.00 0.00 0.00
Manipur 1784.00 105.00 5.89 0.00 0.00 1679.00 94.11
Assam 680.00 375.00 55.15 0.00 0.00 305.00 44.85
Nagaland 1574.00 99.00 6.29 0.00 0.00 1475.00 93.71
Arunachal 50328.00 423.50 0.84 2600.00 5.17 47304.50 93.99
Mizoram 2196.00 0.00 0.00 0.00 0.00 2196.00 100.00
Total (NE) 58971.00 1202.70 2.04 2724.00 4.62 55044.30 93.34
All India 148701.00 32442.50 21.82 13574.00 9.13 102684.50 69.05 Source: Central Electricity Authority; http://www.cea.nic.in/reports/hydro/he_potentialstatus_region.pdf–
As per Energy and peak Load Demand for North-East Regional Load Dispatch
Centre (NERLDC) during the year 2007-08, the peak demand registered was of
the order of 1710 MW and maximum demand met was 1065 MW (Refer Table
1.2). The existing power stations of the region met about 1202.7 MW of power
requirements. Thus, the peak load met by import from Eastern Region is about
507 MW. The region at present faces a power deficit of about 30%.
As per demand and supply position indicated in the 17th Electric Power Survey
conducted by the Central Electricity Authority (CEA), the energy requirement and

GMR Londa Hydro Power Pvt Ltd EIA study of Talong Londa H.E. Project
R S Envirolink Technologies Pvt. Ltd. 1.2
peak load in the North Eastern Region for the year 2016-17 is 21143 GWh and
3760 MW respectively. Considering the capacity additions that are envisaged
during the period 2007-2017, the peak demand in North Eastern region over a
period of 10 years is likely to be more than double from 1710 MW in 2007 - 08 to
as much as 3760 MW in 2016-17.
Table1.2: Energy and Peak Load Demand for the North Eastern Region Period 2007 – 2022
Period Energy (GWh) Peak Load (MW) 2007 - 08 9326 1710 2008 - 09 10193 1888 2009 - 10 11141 2083 2010 - 11 12184 2299 2011 - 12 13329 2537 2016 - 17 21143 3760 2021 - 22 36997 6180
1.2 HYDRO-POWER POTENTIAL OF ARUNACHAL PRADESH
It is evident from Table-1.1 that the state of Arunachal Pradesh accounts for
nearly 85% of the total power potential of the north-eastern states of the country.
The state has a huge hydro-power potential, which can be tapped to meet the
ever increasing power demand especially in the eastern sector. River Kameng is
one of the major northern tributaries of the river Brahmaputra.
The Talong Londa Hydro-Electric Project was identified scheme for hydropower
development by the Central Electricity Authority (CEA) in July 2004 and they
recommended its investigations on a priority basis.
The proposed Talong Londa HEP envisages 108.50 m maximum height above
deepest foundation level high concrete dam about 20 km upstream of the Seppa
town the District head quarter of East Kameng district. The power house is
proposed to be located at the toe of dam with an installed capacity (3 x 75) of 225
MW.
1.3 HYDRO POWER POTENTIAL OF KAMENG SUB-BASIN
As per the power potential studies carried out by CEA as part of 50,000 MW
initiative, 29 large scale hydroelectric schemes with an aggregate installed
capacity of 4637 MW have been identified in Kameng basin.
As per information available on website of Ministry of Development of North
Eastern Region as on March 2012, 28 hydroelectric schemes with an aggregate
installed capacity of 3940 MW have been allotted in Kameng basin (Table 1.3).

GMR Londa Hydro Power Pvt Ltd EIA study of Talong Londa H.E. Project
R S Envirolink Technologies Pvt. Ltd. 1.3
Apart from some mini and micro hydel schemes, no hydroelectric project has been
developed in the Kameng Basin so far. One scheme, namely Kameng H.E.
Project (600 MW), is under implementation.
Table1.3: Power potential of Kameng Basin
Sl. No. Name of Scheme Probable Installed Capacity (MW) Grade
1 Badao 70 A 2 Dibbin 120 A 3 Dinchang 90 A 4 Gongri 90 A 5 Jameri 50 A 6 Kameng Dam (Bana) 480 A 7 Kameng- II (Bharali-II) 600 A 8 Kameng-I 1120 A 9 Kapakleyak 160 A 10 Majingla 60 A 11 Nafra 96 A 12 Nazong 60 A 13 Pachuk-I 60 A 14 Pachuk-II 60 A 15 Papu 90 A 16 Para 55 A 17 Talong 225 A 18 Utung 100 A 19 Khuitam 29 B 20 Lachung 41 B 21 Papu Valley 35 B 22 Phanchung 45 B 23 Pichang 31 B 24 Rebby 31 B 25 Saskongrong 30 B 26 Sepla 46 B 27 Tarang Warang 30 B 28 Tsa - Chu - II 36 B 3940
Source: (Ministry of Development of NE Region web site, As on March 2012
1.4 POLICY, LEGAL AND ADMINISTRATIVE FRAMEWORK
The Ministry of Environment & Forests (MoEF), Government of India is the nodal
agency in the administrative structure of the Central Government, for the planning,
promotion, co-ordination and overseeing the implementation of environmental and
forestry programs. MoEF formulates environmental policies and accords
environmental clearance for the projects. A Comprehensive Environmental Impact
Assessment (CEIA) report is a prerequisite for environmental clearance. The
Comprehensive Environmental Study including Environmental Impact Assessment
(EIA) and Environmental Management Plan (EMP) were initially awarded to
WAPCOS by NEEPCO who were implementing the project. GMR Londa Hydro
Power Pvt Ltd, however, entrusted the task to review and finalize the EIA and
EMP reports to RS Envirolink Technologies Pvt. Ltd. including participation in
GMR Londa Hydro Power Pvt Ltd EIA study of Talong Londa H.E. Project
R S Envirolink Technologies Pvt. Ltd. 1.4
Environmental Clearance (EC) process subsequent to transfer of project to GMR
Londa Hydro Power Pvt Ltd., from NEEPCO.
As per the EIA notification of 14th September 2006 issued by Ministry of
Environment & Forests, hydro-power project falling under Category `A’ need to go
through EC process consisting of three stages viz., Scoping, Public Consultation
and Final Appraisal. Scoping covers approval of TOR for EIA studies, Public
Consultation is addressing concerns of local through a structured process and
Appraisal is detailed scrutiny of Project by expert Appraisal Committee. The TOR
for the project was approved by MoEF on 23rd March 2007 for 160 MW
(Annexure- I). On completion of the draft EIA report, Public Consultation followed
by final Appraisal will be completed as per the recent notification.
However, during the detailed investigation based on the water availability and
power potential studies, it was found that project can have potential of 225 MW
against earlier planned capacity of 160 MW. This increase capacity is approved by
CEA. Project FRL is also increased from earlier FRL El 480 m to FRL 488 m to
utilize the untapped head between upstream projects and Talong Londa HEP.
Therefore, as per the requirement of MoEF, TOR was revalidated for the revised
capacity and changed project physical parameters. TOR for revised capacity of
225 MW was issued by MoEF on 10th August 2010 having validity till August 2014
(Annexure - II). Revised TOR has stipulated the following additional conditions:
1. One turbine to remain operational all the time during the lean season and it is
to be ensured that a minimum depth of 0.5m is maintained in the downstream
stretch of the river for sustaining aquatic life. A scientific study needs to be
undertaken to estimate the requirement of environmental flow.
2. Separate Social Impact Assessment (SIA) study needs to be undertaken as
large number of families will be displaced. 0.5% of the project cost should be
earmarked for local skill development as per CEA guidelines.
3. Micro-zonation of the project area and the reservoir should be carried out and
approval of NCSPD be taken for the same and the design parameters be
finalized accordingly.
4. FRL to be capped at 488m
The present EIA/EMP report for the revised capacity of 225 MW has been
prepared in compliance with the above conditions.
Public Consultation: On completion of draft EIA report and its executive
summary, Public consultation process was initiated as per stipulated public

GMR Londa Hydro Power Pvt Ltd EIA study of Talong Londa H.E. Project
R S Envirolink Technologies Pvt. Ltd. 1.5
consultation process by Arunachal Pradesh State Pollution Control Board
(APSPCB). Public hearing was held on 28th July, 2014 at village Karwa, Near
Prayer Centre, East Kameng District Arunachal Pradesh. The proceedings of the
same have been appended as a separate document (Annexure III). The outcome
of the Public Consultation process in the form of report detailing the proceedings
and video of the entire event is submitted to MoEF by APSPCB. Major issues
raised during Public Consultation process and response is given at Chapter 16 of
EMP.
Appraisal: On completion of Public Consultation process, the final report (this
document) is submitted to MoEF for appraisal and Environmental Clearance.
M/s RS Envirolink Technologies Pvt. Ltd, Gurgaon, a QCI-NABET accredited
company to undertake River Valley, Hydroelectric, Drainage and Irrigation
Projects (Category A); has prepared EIA, EMP study reports.
A Social Impact Assessment (SIA) study is also carried out by independent
consultant and separate report is also submitted.
1.5 PROJECT DESCRIPTION
The proposed Talong Londa Hydroelectric project is envisaged as run of the river
scheme situated in East Kameng district of Arunachal Pradesh. The project
comprises concrete dam with a maximum height of 108.50 m above deepest
foundation level across river Kameng near village Pachi/Londa. The project
location is shown in Figures-1.1 and Project Layout is given in Annexure -IV.
The water conductor system consists of 94 m length and 5.2 m diameter three
parallel penstocks along the dam surface to feed the three units 75 MW of Vertical
Francis turbines in surface power house of 225 MW. The power house is located
on left bank-toe of the dam.

GMR Londa Hydro Power Pvt Ltd EIA study of Talong Londa H.E. Project
R S Envirolink Technologies Pvt. Ltd. 1.6
Figure1.1: Project Location Map of Talong Londa HEP
Project Location
A 108.50 m high and 253 m long concrete gravity dam with a dam toe power
house to produce 225 MW power by utilizing 71m head has been envisaged
across Kameng River.
The Talong Londa Hydro Electric Project has been conceived as a run-of-the river
scheme at alternative III described above in East Kameng district, Arunachal
Pradesh. GEL and Colenco have optimised the capacity of the project from 160
MW to 225 MW based on the hydrological data. Three machines of 75 MW each,
with a dam toe based power house have been proposed. Dam axis is kept at the
same location where it was planned by NEEPCO. The investigations have been
carried out at this location for DPR purpose. As per the current project layout the
project comprises a 108.50 m high concrete gravity dam above the deepest
foundation level EL. 381.50 m level across the river Kameng. The length of the
dam would be 253 m at its top which includes an overflow section of 117 m length
and 138 m long non-over flow sections with FRL at EL. 488.0 m and MDDL at EL.
486.80 m. The crest elevation of under sluice spillway has been kept at EL. 443.0
m and the crest elevation of overflow spillway has been kept at EL. 484.0 m. The
energy dissipation device has been planned through flip bucket which has been
designed to pass 16891 cumecs of flood discharge.
The proposed project therefore, envisages construction of:

GMR Londa Hydro Power Pvt Ltd EIA study of Talong Londa H.E. Project
R S Envirolink Technologies Pvt. Ltd. 1.7
108.50 m high concrete gravity dam from deepest foundation level with
proposed FRL at El. 488 m.
Three lines of penstocks each of 5.2 m diameter and length of each penstock
being 94 m.
Surface power house at the toe of dam on the left bank of Kameng River with
an installed capacity of 225 MW.
The salient features of the proposed project are given in Table-1.4.
Table1.4: Salient Features of the proposed Talong Londa HEP 1 Location
State Arunachal Pradesh District East Kameng Village Londa Access Airport Guwahati (410 km) Rail Head Naygaon (310 km) Geographical co-ordinates Latitude (N) 27 28' 55" Longitude (E) 93 1' 50"
River Kameng River
2 Hydrology
Catchment Area up to Dam Site 2814 Sq. km Snow Catchment Area 91 Sq. km Average Annual Sp. Yield 2228 mm over catchment Max./Min. Annual Yield (MCM) 8291 (Max.), 5235 (Min) Design Flood 16891 cumecs Average Annual Rainfall (Seppa) 2116 mm Sedimentation Rate 0.08 Ha-m/Sq. km/Yr.
3 Reservoir
Maximum Water Level (MWL) EL. 488.00 m Full Reservoir Level (FRL) EL. 488.00 m Minimum Drawdown Level (MDDL) EL. 486.80 m Gross Storage 92.5 MCM Live Storage 4.1 MCM Reservoir Submergence (at FRL) 350 ha Length of Reservoir (at FRL) 12.8 km
4 River Diversion Arrangement
Upstream Cofferdam Crest Elevation EL. 456.00 m Length 155 m Height 43 m Downstream Cofferdam Crest Elevation EL. 425 m Length 106 m Height 13 m Diversion Tunnel
Diameter, Shape 2 nos. 9.0 m dia, Horse shoe shaped
Length 447 m and 588 m 5 Dam
Type Concrete Gravity Dam Top Elevation EL. 490.00 m

GMR Londa Hydro Power Pvt Ltd EIA study of Talong Londa H.E. Project
R S Envirolink Technologies Pvt. Ltd. 1.8
Top of Concrete Wave Wall EL. 491.00 m Deepest Foundation Level EL. 381.50 m Max. Height above deepest foundation level
108.50 m
Length at top 253 m 6 Spillway
Type Submerged sluice/Ogee type Design Flood 16891 cumecs (PMF)
No. and size of bays 7 nos. Sluices 9.25 m (W) x 14.90 m (H) 1 no. Ogee 4m (W) x 4 m (H)
Crest Elevation EL. 443.00 m (Sluices) EL. 484.00 m (Ogee)
Energy dissipation Flip Bucket Bucket Invert Elevation EL. 424.36 m
7 Intake
Invert Elevation EL. 472.73 m Nos. and size of openings 3 nos. 5.6 m (W) x 5.6 m (H)
Design Discharge 349.23 cumecs (116.41 cumecs each)
8 Penstock
Type Circular Number 3 Diameter 5.2 m Length 94 m each
9 Power House
Type Surface, Dam Toe Rated Net Head 71.00 m Design Discharge 349.23 cumecs Type of Turbine Vertical Francis Nos. of units 3 Installed Capacity 225 MW (3 x 75 MW)
Power House size (Machine Hall) 59.97 m (L) x 21 m (W) x 47 m (H)
Rated Speed 150 rpm Turbine Floor Level EL. 415.25 m Generator Floor Level EL. 419.50 m Machine Hall Floor Level EL 424.25 m Unloading Bay Level EL. 439.00 m
Crane Capacity 2 nos. 150/30 MT at main loading bay and one no. 80/10 MT at unloading bay
10 Tailrace Tunnel & Channel
Tunnel No. 3 Tunnel Size 7 M D-Shaped Tunnel Length Varies 18.8m, 47.6m & 73.1m
Channel Size 48.5 m (W) x 42 m (L) (Average Length)
Minimum tail water level EL. 414.90 m Normal tail water level (all 3 units running at full load)
EL. 417.00 m
Maximum tail water level (at PMF) EL. 437.70 m 11 Switchyard
Type Surface Size 35 m x 130 m
12 Energy Generation
Annual Generation (90% dependable)
890.44 MU

GMR Londa Hydro Power Pvt Ltd EIA study of Talong Londa H.E. Project
R S Envirolink Technologies Pvt. Ltd. 1.9
13 Project Cost
Civil Works Rs. 1009.5 Crores E&M Works Rs. 280.00 Crores Escalation Rs. 453.50 Crores Interest during construction and finance charges
Rs. 429.90 Crores
Total Project Cost Rs. 2172.90 Crores 14 Generation Cost and Tariff
Levellised Tariff in terms of CERC Regulation
Rs. 5.54 per KWh
Levellised Tariff as per MoA terms Rs. 5.69 per KWh
1.5.1 PROJECT ALTERNATE STUDIES
The project authorities explored three alternative sites referred to as alternative
site I, II and III which were geologically evaluated from upstream to downstream
area of Kameng river to finalise the project layout. These have been described
below:
Alternative site I:
The 50 m high concrete gravity dam was proposed across Kameng river near
Khora village and power house about 10 km d/s of dam site with 5.9 km long head
race tunnel as in PFR.
The left bank slope is covered with slope wash and river born materials however
on the right bank bed rock is exposed near the dam axis. It is anticipated that the
depth of excavation for keying the dam into left abutment would be considerable
and the width of the dam structure would thereby largely increase.
The HRT would be passing through mica-schist with augen grains, quartzite and
gneisses and may be traversed by faults which would have to be tackled during
project execution. The HRT would be aligned in strike section which may pose
problems during tunnelling. The power house area which is located by the side of
a conspicuous nalla is virtually devoid of any rock exposure and is accommodated
in an area covered by considerable depth of overburden.
Alternative II:
The 60 m high concrete gravity dam with a toe power house has been proposed
at alternative site - II. The river flows towards the southeast direction. Here width
of the river is more than the alternative site I with terraces on the left bank. The
slope below the left bank road is disturbed with large blocks of rocks lying in a
sandy soil matrix and the excavation on the left bank may be enormous. The right
bank of river edge is also covered by overburden. A huge excavation is required
to accommodate the power house on the left bank which may trigger slope

GMR Londa Hydro Power Pvt Ltd EIA study of Talong Londa H.E. Project
R S Envirolink Technologies Pvt. Ltd. 1.10
instability problems warranting protection of the entire slope above the power
house. Therefore, this site does not appear to have much advantage over the
alternative site I.
Alternative III:
In view of the adverse site conditions at Alternate I and Alternate II sites another
site was selected (Alternative III – Present site). Concrete gravity dam of 104 m
height with dam toe power house on the Left Bank is proposed. At present
location, Dam axis is aligned in N22OE – S22OW direction. Here the Kameng river
flows towards S68OE at dam site where left bank comprises an overburden below
the road section having two slope segments, one being around 35O just below the
road section up to about 30 m towards river and second one flattens to around
15O up to the river level. The slope below the road section is occupied by gneissic
and schistose boulders in a dark coloured sandy soil matrix and cultivated land
appears to have a stable slope of 25O for a distance of about 50m above the road
section along dam axis.
The right bank disposes a vertical rocky slope comprising well defined upstream
dipping foliation with joints dipping towards 55O North westerly and 25O dipping
towards S70OE are the most prevalent sets occurring in the right abutment. Sub-
vertical joints dipping towards N15OE have been strongly prevalent on the right
bank which has been responsible for formation of the cliff face. The rock type is
Quartz-mica-schist and biotite gneiss with pegmatite and quartz veins intrusions
and the strike of foliation is N20OW-S20OE dipping 75O towards N70OE. Since the
power house has been proposed at the dam toe, the problems of driving the
tunnel along the strike of the rock and apprehended intersection of faults as has
been observed at the alternative site I may largely be avoided. Therefore the site
appears to be suitable when compare to other two alternatives.
1.5.2 APPROACH TO THE PROJECT
The nearest Board gauge rail head is at Nayagaon, in Assam and is about 290 km
by metalled road from Seppa. The nearest airport is at Guwahati which is 230 km
from project site. Itanagar, capital of Arunachal Pradesh is 290 km from project
site. The distance to Guwahati is 410 km from the project site. Kolkatta is the
nearest sea port from project site. Distance from Guwahati to the proposed Talong
Londa HEP Site is tabulated below showing the important stations in the route:

GMR Londa Hydro Power Pvt Ltd EIA study of Talong Londa H.E. Project
R S Envirolink Technologies Pvt. Ltd. 1.11
S. No. From Station - To Station Distance
(km)
Cumulative Distance from Guwahati (km)
1. Guwahati – Tezpur 180 180
2. Tezpur – Bhalukpong (Assam- Arunachal Pradesh Border)
60 240
3. Bhalukpong – Seppa (District) 150 390
4. Seppa – Pachi (Proposed Dam Site) 20 410
1.5.3 INFRASTRUCTURE
Rail: The Nayagaon railhead is proposed to include provisions for:
Unloading and storage facilities for heavy machinery and equipment.
Covered and uncovered storage for electrical and other equipment.
Storage of about 1000 tonnes of cement.
Space for parking, loading and unloading.
For this, facilities will need to be established near rail yard of Nayagaon.
Road: Existing Roads
The project site is accessible to motor vehicles by an all weather road from the
nearest rail head. An all weather road connects Bhalukpong-Seppa-project site.
The road from Bhalukpong to Seppa via Bana is maintained by BRO. Road from
Nich Phu (About 40 km from Bhalukpong en route to Bana) to Seppa is now
proposed to be converted to Trans Arunachal Highway which is likely to be
commenced in short time. This road will be constructed as double lane road. Road
from Seppa to project site is under state PWD and already strengthened to double
lane.
Proposed New Roads and Bridges
The sites of all the major components of the projects will be connected to the
existing road system by new access roads.
Following project roads and bridges are proposed for construction and operation
of the Project:
i) One bridge of about 200 m span on u/s of dam axis for diversion tunnel (DT)
excavation
ii) One bridge of about 125 m span on d/s of the dam axis DT excavation and
closure.
GMR Londa Hydro Power Pvt Ltd EIA study of Talong Londa H.E. Project
R S Envirolink Technologies Pvt. Ltd. 1.12
iii) 1750 m long approach road from existing road to DT inlet portal.
iv) 725 m long approach road from existing road to DT outlet portal.
v) Approach road of 200 m long from the diversion road to magazine storage
area.
vi) Approach road 425 m long approach road from existing road to power house
unloading bay. This road will also provide access to the switchyard.
All the other construction roads to dam, power house pit and tail race channels
would be planned in the berms of excavation of these components.
The reservoir will cause about 4 km of the existing road and four pedistrain
suspension bridges. The proposed realigned road length in submergence area is
about 5.7 km. Three new pedestrian suspension bridges are proposed to be
constructed for the bridges coming under submergence.
1.5.4 CONSTRUCTION FACILITIES
Location: The proposed location for construction facilities will be close to dam site, where
activities are mainly concentrated. It is envisaged that such facility will include a
concrete batching and mixing plant, main stores (covered and uncovered) and a
workshop for maintenance of project equipment. The main project colony
including offices and permanent and temporary quarters for project staff will be
needed near the construction sites which will include a site office, permanent
quarters for operating staff of the dam and temporary quarters for contractor
labours. Suitable muck dumping area for disposing of excavated material required
has been identified at RD 17 km from Seppa. This area is 3 km downstream of
dam axis.
Project Headquarters:
The project headquarters is being planned in vicinity of Dam site. Final location
will be firmed up in consultation with project affected community. This will include
project offices, residential accommodation for the project staff, guest house, and
utility services such as shopping centre, club and community centre. It is
proposed that residential and non-residential buildings should be constructed
mostly in two or three storey blocks so that the maximum staff can be
accommodated at one place at minimum cost and land requirement.

GMR Londa Hydro Power Pvt Ltd EIA study of Talong Londa H.E. Project
R S Envirolink Technologies Pvt. Ltd. 1.13
Residential Buildings:
Residential buildings will be required to house staff working during the
construction of the project and subsequently for the operational staff at both the
dam site and at the powerhouse. It is proposed to construct about 100 units of
residential accommodation in permanent structures together with about 250
temporary units for use solely during the construction period of the project.
Non-Residential Buildings:
Temporary facilities at appropriate locations, including colonies for Contractors,
will be required during the construction of the project. Some of these may be
retained after the completion of the project for the benefit of both permanent
project staff and the local population.
Non-residential buildings will include: office, stores, workshops, hospital/
dispensary, community centre, material testing laboratory, barrack for security
staff, telephone exchange/ wireless station, fire station, officer's club, staff club,
mess/canteen, and compressor shed. Total land requirements for the colony area
is worked out based on the requirements for the buildings for these activities,
providing the space for the recreation facility, parking, landscaping and open
space requirements for the colony area.
Amenities such as fire station, police station, bus stand and other public utilities
may also be provided in conjunction with the local administration.
Land Requirement:
The Land requirement for the project shall be limited for accommodating different
project components and other allied works and is given in Table-1.5.
Table 1.5: Details of Land Requirement S. No. Component Area in ha
1. Dam, Power House and Diversion tunnel Complex 10.00 2 Submergence area at FRL (EL. 488 m), Slope area
including the river course 350.00
3 Diversion road 5.00 4 i) Muck disposal area 10.00 ii) Magazine area 0.60 iii) Rehabilitation and Resettlement 4.00 iv) Colony area 2.50 v) Construction Facility Area 12.00 vi) Quarry Area at Meuba Area 3.00 vii) Quarry Area at 3 Kilo Meter 4.00 viii) Quarry Area at D/s of Dam Axis 4.00

GMR Londa Hydro Power Pvt Ltd EIA study of Talong Londa H.E. Project
R S Envirolink Technologies Pvt. Ltd. 1.14
ix) Quarry area near Pachi 8.00 Total Land Required (Ha) is 413.10 Ha including 101
Ha of River bed areas. 413.10
Water Supply:
The provision of adequate water supplies for both human use and construction
purposes will require further investigation. It is envisaged that supplies will be
available locally from perennial tributaries of the river. The provision for water
treatment plant is also envisaged at suitable location to ensure availability of safe
drinking water.
Construction Power:
It is anticipated that construction activities during peak will require around 5 MVA
of power. The arrangement of DG sets shall be done for full backup to cater this
requirement. The final requirement is required to be estimated more accurately by
the contractor during construction stage considering requirement from the
following units.
Batching Plant, aggregate processing plant, drives operating hopper and silo,
screw and belt conveyor, air compressor, water pump, etc.
Machines: blower air fan, compressed air line, water supply arrangement,
drilling rig operation, illumination, concrete pump, gantry operation, etc.
Offices and Job facility: office, mess, workshop, etc.
Project area illumination
Telecommunications:
For smooth implementation of Project including its operation and maintenance, an
efficient telecommunication system with internet connectivity is required to be
made. Existing facilities at Project are:-
At present the project area is under the coverage of BSNL and likely to be
connected with private service providers.
GMR has installed the V-Sat facility at its office cum guest house at Seppa.
Muck Disposal Area:
The spoil from various construction sites would be disposed off at designated
areas in a controlled manner to protect the environment. Most of the muck
generated is proposed to be carried to the aggregate processing plants for
aggregate production. The balance quantity or the one not fit for processing would
be directed to the designated disposal site.

GMR Londa Hydro Power Pvt Ltd EIA study of Talong Londa H.E. Project
R S Envirolink Technologies Pvt. Ltd. 1.15
The toes of the disposal piles would be retained and protected by providing
suitably designed gabion walls erected over concrete bases.
Suitable muck dumping area for disposing of excavated material required has
been identified at 3 km downstream of dam axis. Total quantity of muck generated
is 24.4 lacs cum, considering swell index @ 40%, the quantity of muck required to
be disposed is 10.3 lacs cum. This area can accommodate about 12 lac cum of
muck, and thus is sufficient to accommodate the muck generated from all the
project activities. Land required for the muck is 12 ha. Muck is to be retained by
the masonry wall and wire crates. Muck disposal will be carried out as per State
Pollution Control Board Guidelines and compacted and later to be reclaimed as
per norms.
Explosive Magazine:
An explosive magazine of 20 T capacity for storing the explosives for about one
month requirement has been planned at 2.5 km upstream of dam axis.
1.6 OUTLINE OF THE REPORT
The Comprehensive EIA for the proposed Talong Londa HE Project has been
presented in two parts - First part presents the findings of EIA study and the
second part includes various mitigation measures under the EMP. The contents of
both the parts of the document are organized as follows:
PART – I Environment Impact Assessment Chapter-1 This Chapter gives an overview of the need for the project. The policy,
legal and administrative framework for environmental clearance has been
summarized. The objectives and need for EIA study too have been covered. Brief
description of the proposed hydroelectric project is also given.
Chapter-2 Outlines of the methodology adopted for conducting the
Comprehensive EIA study.
Chapter-3 Covers the environmental baseline of physical aspects of environment.
The baseline study involved both field work and review of existing documents
necessary for identification of data which already may have been collected for
other purposes.
Chapter-4 Presents the biological environmental aspects. The study is based on
collection of data from various secondary data sources. As a part of the
Comprehensive EIA study, detailed ecological survey was conducted for various

GMR Londa Hydro Power Pvt Ltd EIA study of Talong Londa H.E. Project
R S Envirolink Technologies Pvt. Ltd. 1.16
seasons. The findings of the study were analyzed and ecological characteristics of
the study area have been described in this Chapter.
Chapter-5 Presents Social Economic Data in the Project area. This chapter also
provides the perception of the local towards the project.
Chapter-6 Describes the anticipated positive and negative impacts as a result of
the construction and operation of the proposed hydro-power project. It is
essentially a process to forecast the future environmental conditions of the project
area that might be expected to occur as a result of the construction and operation
of the proposed project. An attempt was generally made to forecast future
environmental conditions quantitatively to the extent possible. But for certain
parameters, which cannot be quantified, the general approach has been to
discuss such intangible impacts in qualitative terms so that planners and decision
makers are aware of their existence as well as their possible implications.
Chapter -7 Describes the Clean Development Aspect of the Projects. This
includes the benefits and procedure of the CDM aspects.
Chapter -8 Environment Flow Scoping Clearance letter issued by MoEF on
August 10, 2010 has stipulated that, “During the lean season at least one
turbine remains operational to maintain sufficient flow in river in such a way so that a minimum of 0.5 m water depth is available in the river stretch for sustaining the aquatic life during the running of the project. A scientific study should be undertaken to estimate the required environment flow.
Keeping the above scope in view, a scientific study has been undertaken to
establish the flow requirement in lean, monsoon and remaining four months based
on ecological and downstream use considerations and outcome is discussed in
this chapter.
PART –II Environment Management Plan The Part-II of the report deals with different Environmental Management Plans
prepared to mitigate the adverse environmental impacts. The contents of the Part-
II are organized as follows:
Chapter-1 delineates the Biodiversity Conservation and Management Plan for
mitigation of anticipated adverse impacts likely to accrue as a result of the
proposed project. The approach for formulation of Biodiversity Conservation Plan
is to maximize the positive environmental impacts and minimize the negative
ones. After suggesting environmental mitigation measures, the cost required for
implementation of various measures is also estimated.

GMR Londa Hydro Power Pvt Ltd EIA study of Talong Londa H.E. Project
R S Envirolink Technologies Pvt. Ltd. 1.17
Chapter-2 Catchment Area Treatment (CAT) plan is outlined in this Chapter. Silt
yield Index (SYI) Method has been used for categorization of sub-watersheds into
erodibility classes. Treatment measures for very high and high erosion categories
of sub-watersheds have been formulated. Cost required for implementation of
CAT Plan too has been estimated.
Chapter-3 describes the various measures to be undertaken for the Conservation
& Management of the Fish fauna.
Chapter-4 This chapter on Public Health Delivery System deals with the basic
health care facilities available in the area and setting up of new infrastructure as
well as improvement of existing infrastructure along with the cost estimates.
Chapter-5 This chapter describes various Solid Waste Disposal problems that are
likely to accrue during the construction period and also the formulation of
management plan for the same.
Chapter-6 It deals with the Muck Disposal Plan for muck that is likely to be
generated during the construction of various project components and also
suggests measures for both engineering and biological measures for rehabilitation
of muck disposal sites.
Chapter-7 This chapter covers adverse impact of construction activities on the
Landscape and suggests measures for restoration of the disturbed area back to
their similar or near-similar pre-construction conditions and land use.
Chapter-8 This chapter describes various provisions being made for the reduction
of pressure of the adjoining forest of the project area during the construction
period like energy conservation, subsidy for fuel wood, green belt creation, etc.
Chapter-9 This chapter covers Resettlement and Rehabilitation provisions for the
Project affected families
Chapter-10 This chapter covers various environmental risks that are foreseen
during the construction on air, water, soil and noise environment in the project
area and also deals with mitigation measures during the construction and
operational phase. Resettlement and Rehabilitation provisions for the Project
affected families.
Chapter-11 Dam Break Analysis using HEC-RAS model has been conducted.
The results of the modeling exercise are outlined in this Chapter. Disaster

GMR Londa Hydro Power Pvt Ltd EIA study of Talong Londa H.E. Project
R S Envirolink Technologies Pvt. Ltd. 1.18
Management Plan (DMP) too has been outlined for implementation in case of
Dam Break.
Chapter-12 This Chapter describes the possibility of slope failures, land slips etc.
due to fluctuation water along the reservoir periphery. In order to mitigate the
same Reservoir Rim Treatment Plan and measures for treatment of existing
landslides/ slips, and prevention of further slides by undertaking engineering as
well as biological measures have been suggested. The cost estimation for various
activities involved also has been made.
Chapter-13 This Chapter discusses various aspects of Compensatory
Afforestation Programme to be implemented by the State Forest Department.
Chapter-14 Environmental Monitoring Programme for implementation during
project construction and operation phases has been presented in this Chapter. The environmental monitoring programme has been suggested to assess the
adequacy of various environmental safeguards, and to compare the predicted and
actual scenario during construction and operation phases. This will be the project
proponents to formulate remedial measures not foreseen during the planning
stage but arising during these phases and to generate data for further use.
Chapter-15 Summarizes the cost required for implementation of the
Environmental Management Plan (EMP) and the Environmental Monitoring
Programme.
Chapter-16 This Chapter discusses major issues raised during Public
Consultation process and response given by project developer.

GMR Londa Hydro Power Pvt Ltd EIA study of Talong Londa H.E. Project
R S Envirolink Technologies Pvt. Ltd. 2.1
CHAPTER 2 METHODOLOGY
2.1 ENVIRONMENT IMPACT ASSESSMENT
The importance given to environmental considerations in order to achieve
sustainable and successful development is increasingly gaining acceptance
among various developmental experts and institutions. Understanding the
consequences of development and forecasting its impact on the basic life support
system - land, water and air - is referred to as the Environment Impact
Assessment or EIA. More recently new dimensions have been added to the EIA
studies encompassing impacts on the ethnic diversity, socio-cultural and socio-
economic aspects including displacement, resettlement and rehabilitation of
human societies where developmental activities are undertaken.
The process of EIA varies greatly from project to project and depends vastly on
the magnitude of operations and location of the project. EIA studies give emphasis
on the assessment and prediction of impacts of development on natural
ecosystems and their species along with concentrating on geophysical features,
which mostly cover reversible impacts. The main aim of having EIA studies
carried out is to understand and prioritize the impact of development activity on
the natural life support systems and processes with main emphasis on the
continuation of ecosystem processes and functions, so that adequate
remedial/mitigating measures are taken right from the design stage.
Typically in a hydro-power scheme, whose sustenance and continuity largely
depends on the quality of ecosystems in the catchment of its river and reservoir,
biological health of the catchment will control not only the quality and quantity of
water in the river but also the life of reservoir. There is only one way to generate
hydro-power on sustainable basis and that is by maintaining the natural
ecosystems in the catchment. Hydro-power is a direct benefit of natural
ecosystem functions, which are controlled by the biodiversity. There is now
experimental evidence to show that catchment areas of Yangtze River in China
with dense vegetation cover (biodiversity) have resulted in increased hydro-power
generation and higher income as compared to other catchments with lesser
vegetation and reduced biodiversity.

GMR Londa Hydro Power Pvt Ltd EIA study of Talong Londa H.E. Project
R S Envirolink Technologies Pvt. Ltd. 2.2
Figure 2.1 Study Area Map of Talong Londa HEP Showing Sampling Sites

GMR Londa Hydro Power Pvt Ltd EIA study of Talong Londa H.E. Project
R S Envirolink Technologies Pvt. Ltd. 2.3
2.2 METHODOLOGY
Standard methodologies of Environment Impact Assessment were followed for
conducting the CEIA study for the proposed Talong Londa Hydro Electric Project.
A brief account of the methodologies and matrices followed in the present study is
given below under different headings. All the methods were structured for the
identification, collection and organization of environmental impact data. The
information thus gathered has been analyzed and presented in the form of a
number of visual formats for easy interpretation and decision-making.
2.2.1 STUDY AREA The study area earmarked for EIA study is as below (Refer Figure 2.1).
Upstream of the dam site 10 km on either side from the periphery of
reservoir submergence
Downstream of the dam site 10 km on either side of the river
Catchment Area Catchment area of the tributaries directly
draining into the reservoir
The salient environmental features of the project are listed in Table-2.1.
Table 2.1: Salient Environmental Features
Particulars Details
Nearest railway station Nayagaon (310 km)
Nearest Airport Guwahati (410 km)
Nearest village Pachi (1km)
Nearest town Seppa (20 km)
Hills/valleys Area has an undulating terrain
Monuments Nil
Archaeologically important places Nil
National Parks Nil
List of Industries Nil
Seismicity Seismic Zone-V as per BIS-1893-2003
2.2.2 SCOPING MATRIX
Scoping is a tool which gives direction for selection of impacts due to the project
activities on the environment. As part of the study, scoping exercise was
conducted selecting various types of impacts which can accrue due to
hydroelectric project. Based on the project features, site conditions, various

GMR Londa Hydro Power Pvt Ltd EIA study of Talong Londa H.E. Project
R S Envirolink Technologies Pvt. Ltd. 2.4
parameters to be covered were selected. The results of scoping analysis are
presented in Table-2.2.
Table 2.2: Scoping for EIA study
Aspects of Environment Likely Impacts
Land Environment
Construction phase Increase in soil erosion
Pollution by construction spoils
Acquisition of land for construction
works colonies
Solid waste from construction works
colonies
Operation phase Acquisition of land for various project
appurtenances
Water Resources and Water Quality
Construction phase Increase in turbidity of nearby receiving
water bodies
Degradation of water quality due to
disposal of wastes from construction
works colony and construction sites
Operation phase Disruption of hydrologic regime
Sedimentation and siltation risks
Impacts on D.O. due to reservoir
stratification
Risk of eutrophication
Aquatic Ecology
Construction phase Increased pressure on aquatic ecology
as a result of indiscriminate fishing.
Reduced productivity due to increase
in turbidity
Operation phase Impacts on migratory fish species
Impacts on spawning and breeding
grounds
Degradation of riverine ecology
Increased potential for reservoir
fisheries
Terrestrial Ecology

GMR Londa Hydro Power Pvt Ltd EIA study of Talong Londa H.E. Project
R S Envirolink Technologies Pvt. Ltd. 2.5
Aspects of Environment Likely Impacts
Construction phase Increased pressure from construction
works to meet their fuel wood and
timber requirements
Adverse impacts due to increased
accessibility of the area
Operation phase Impacts on wildlife movement
Socio-Economic Aspects
Construction phase Improved employment potential during
the project construction phase
Development of allied sectors leading
to greater employment
Pressure on existing infrastructure
facilities
Friction between the construction
works and the native population
Operation phase Loss of lands
Loss of private properties
Increased revenue from power
generation
Public Health
Construction phase Impacts due to disposal of untreated
sewage from construction works camps
Operation phase Increased incidence of vector borne
disease due to increase in water
spread area.
Air Environment
Construction phase Emissions due to fuel combustion in
construction equipment
Increased vehicular movement
Entrainment of fugitive emissions
Noise Environment
Construction phase Increased noise level due to operation
of various equipment
Increased vehicular movement.
Based on the Scoping matrix, the environmental baseline data have been
collected and the project details superimposed on environmental baseline
conditions to understand the beneficial and deleterious impacts due to the
construction and operation of the proposed project.

GMR Londa Hydro Power Pvt Ltd EIA study of Talong Londa H.E. Project
R S Envirolink Technologies Pvt. Ltd. 2.6
2.2.3 SURVEYS
Initially after the receipt of TOR from MoEF, GoI, field surveys were carried out in
2006-2007 covering three seasons i.e. Pre-monsoon, Monsoon and Winter (Lean)
seasons. Later on after the receipt of revised Tor for 225MW capacity in 2010, the
baseline data was updated in the years 2010-2011. The environmental baseline
data was collected for flora, fauna, forest types and ecological parameters as well
as sociological aspects. In addition, surveys and studies were also conducted for
understanding aquatic ecology and fish diversity of Kameng river.
Field surveys in the study area were also conducted for the purpose of ground
truthing and augmenting the remotely sensed data. For this purpose various
attributes such as land features, rivers, forests and vegetation types were
recorded on the ground.
2.2.4 PHYSIOGRAPHY
The spatial database on physiographic features like drainage, roads, settlements
and villages, etc. was created from maps of Survey of India (SOI) topographic
sheets, satellite data and then analyzed with Geographic Information System
(GIS) tools. A slope model for the study area as well as the catchment area
intercepted at the dam site of the proposed Talong Londa hydroelectric project
was prepared from SRTM data obtained from the GLCF web site. The area for
each slope category was calculated for entire catchment. Percent area under
various slope categories namely gently sloping, moderately sloping, strongly
sloping, moderately steep to steep, steep, very steep and escarpments were
calculated for the entire catchment.
2.2.5 GEOLOGY
The regional geology around the project area highlighting geology, stratigraphy
and structural features were based on the existing information on these aspects
contained in Detailed Project Report (DPR) of the project. In addition the important
parameters of seismicity were assessed using published literature on seismic
history and seismo-tectonic nature of the regional rock types in the area.
2.2.6 METEOROLOGY
Meteorological factors like precipitation, temperature and evapo-transpiration are
important, as they have a profound impact on the water availability, cropping
pattern, irrigation and drainage practices, soil erosion and public health, etc.
Rural Works Department monitors various meteorological features at a Seppa

GMR Londa Hydro Power Pvt Ltd EIA study of Talong Londa H.E. Project
R S Envirolink Technologies Pvt. Ltd. 2.7
station, which is the nearest meteorological station located in the project area. The
data form the Seppa station for various meteorological aspects was collected for
utilization in the Comprehensive EIA study.
2.2.7 HYDROLOGY
Hydrological data for river Kameng as available in the Detailed Project Report was
collected and suitably incorporated in the Comprehensive EIA study.
2.2.8 LANDUSE AND LANDCOVER
Land use and land cover map of the study area as well as catchment was
prepared from satellite data of 2006. Digital data on CDROMs of IRS-1D was
used for the present studies and the project area was extracted from the full
scenes with the following details:
Satellite Sensor Path/Row Date Data type & Bands
IRS-1D LISS-III 111/52 11.11.2006 Digital (2,3,4,5)
For the secondary data, Survey of India topo sheets on 1:50,000 scale were
referred for the preparation of base map and drainage map.
For the collection of ground truth a reconnaissance survey was carried out in the
study area. For the preparation of environment management plans like catchment
area treatment, land use/ land cover maps and related thematic maps were
prepared and classified on 1:50,000 scale. Different forest density classes were
identified and the degraded areas and scrubs were also delineated for the
purpose of erosion mapping along with settlements and agricultural areas. The
non-forest land cover in the form of barren land, river, etc. was also delineated for
the calculation and classification of erosion intensity.
2.2.9 SOIL
The soil quality was monitored at various locations in the catchment area. The
monitoring was conducted for three seasons as discussed above. Grab samples
were collected and analyzed in the laboratory for relevant parameters. The
parameters monitored were:
pH
Available Potassium
Available Nitrogen
Available Phosphorus
GMR Londa Hydro Power Pvt Ltd EIA study of Talong Londa H.E. Project
R S Envirolink Technologies Pvt. Ltd. 2.8
Organic matter
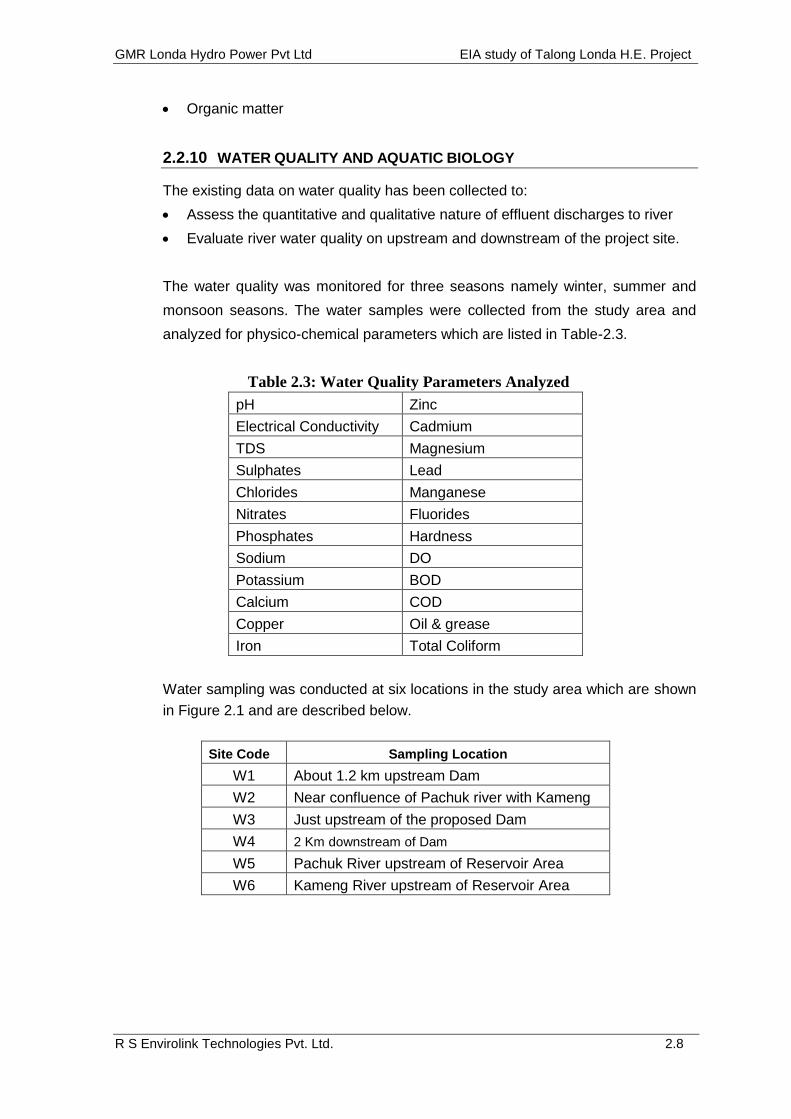
2.2.10 WATER QUALITY AND AQUATIC BIOLOGY
The existing data on water quality has been collected to:
Assess the quantitative and qualitative nature of effluent discharges to river
Evaluate river water quality on upstream and downstream of the project site.
The water quality was monitored for three seasons namely winter, summer and
monsoon seasons. The water samples were collected from the study area and
analyzed for physico-chemical parameters which are listed in Table-2.3.
Table 2.3: Water Quality Parameters Analyzed pH Zinc
Electrical Conductivity Cadmium
TDS Magnesium
Sulphates Lead
Chlorides Manganese
Nitrates Fluorides
Phosphates Hardness
Sodium DO
Potassium BOD
Calcium COD
Copper Oil & grease
Iron Total Coliform
Water sampling was conducted at six locations in the study area which are shown
in Figure 2.1 and are described below.
Site Code Sampling Location
W1 About 1.2 km upstream Dam
W2 Near confluence of Pachuk river with Kameng
W3 Just upstream of the proposed Dam
W4 2 Km downstream of Dam
W5 Pachuk River upstream of Reservoir Area
W6 Kameng River upstream of Reservoir Area

GMR Londa Hydro Power Pvt Ltd EIA study of Talong Londa H.E. Project
R S Envirolink Technologies Pvt. Ltd. 2.9
2.2.11 AMBIENT AIR QUALITY
The ambient air quality was monitored at two locations in the study area.
Monitoring was conducted for two seasons namely winter and months. The
frequency of monitoring in each season was twice a week for four consecutive
weeks. The parameters monitored were SPM, RPM, SO2, and NOx. SPM and
RPM have been estimated by gravimetric method. Modified West and Gaeke
method (IS-5182 Part-II, 1969) has been adopted for estimation of SO2. Jacobs
Hochheiser method (IS5182 Part-IV, 1975) has been adopted for the estimation of
NOx.
2.2.12 AMBIENT NOISE LEVEL
As a part of the EIA study noise level was monitored at various locations in the
study area. Monitoring was conducted in winter, pre-monsoon and monsoon
seasons. At each station, hourly noise level was monitored using hand held digital
sound level meter.
2.2.13 FOREST TYPES AND FOREST COVER
The details on forest types and forest cover in the catchment area were based on
field surveys in the area supplemented with the working plans of the forest
divisions of the study area. The major forest types, sub-tropical, temperate, sub-
alpine and alpine, encountered in the area were described based on the
classification of Champion and Seth (1968), Negi (1989, 1996), Srivastava and
Singh (2005).
2.2.14 VEGETATION STRUCTURE/ FLORISTIC
The detailed account of floristic diversity and ecology has been described based
on the primary surveys in the catchment area and study area of the proposed
project. These surveys were undertaken during different seasons of the year to
assess the vegetation structure and to prepare inventory of plant species
belonging to different plant groups like angiosperms, pteridophytes, bryophytes
and lichens found in the study area.
The community structure of the study area was studied by Quadrat method. The
size and number of quadrats needed were determined using the species- area
curve (Misra, 1968). The data on vegetation were quantitatively analyzed for
abundance, density, frequency as per the methodology given in Curtis & McIntosh
(1950). The Importance Value Index (IVI) for trees was determined as the sum of
relative density, relative frequency and relative dominance (Curtis, 1959).

GMR Londa Hydro Power Pvt Ltd EIA study of Talong Londa H.E. Project
R S Envirolink Technologies Pvt. Ltd. 2.10
The sampling locations were selected on the basis of the area located in the
vicinity of proposed projects and its components, however the sampling was
undertaken to assess the composition of particular forest type/s in that area.
Detailed list of six selected sampling locations is given at Table 2.4.
Standard methodology of vegetation sampling was used for community structure.
Nested quadrat sampling method was used for the study of community structure
of the vegetation. Each sampling unit consisted of randomly placed quadrats of 10
x 10 m2 for trees, 5 x 5m2 for shrubs and 1 x 1m2 for herbs (Table 2.4). For
sampling of vegetation, number of quadrats laid varied during seasonal surveys at
a particular sampling site/ area depending upon the heterogeneity/ homogeneity
of the vegetation encountered in a particular site/ area (see Table 2.4). At each
site the quadrats were laid along the altitudinal gradient beginning from the
vegetation along the river bank/riverine vegetation and further up along the slope
ensuring maximum possible representative coverage of the vegetation of a
particular sampling location. Each sampling location/ area was divided into grids
vertically as well as horizontally along the slopes thereby capturing the maximum
diversity of vegetation. In case of trees for calculation of total basal area/cover per
unit area was calculated by measuring the cbh (circumference at breast height) of
each individual tree belonging to different species which was then converted into
basal area using the formula given in the following paragraph.
Table 2.1: Sampling Locations
Sites Sampling Location
V1 Dam site/Power House site
V2 Catchment area
V3 Submergence area: Left Bank
V4 Submergence area: Left Bank
V5 Catchment: Upstream of Pachuk-Kameng Confluence
V6 Downstream of Proposed Power house area
Table 2.2: Number of quadrats studied during field surveys for trees, shrubs
and herbs Sampling Site Trees
(10x10) m2 Shrubs (5x5) m2
Herbs (1x1) m2
Post monsoon / Winter
Pre Monsoon/ Summer
Monsoon
V1 10 15 20 20 20
V2 10 15 20 20 20
V3 10 15 22 22 22
V4 10 15 22 22 25
GMR Londa Hydro Power Pvt Ltd EIA study of Talong Londa H.E. Project
R S Envirolink Technologies Pvt. Ltd. 2.11
V5 12 14 18 18 26
V6 14 15 20 20 25 For the calculation of dominance, the basal area was determined by using
following formula.
Basal area = π r2
The index of diversity was computed by using Shannon Wiener Diversity Index
(Shannon Wiener, 1963) as:
H = - Σ (ni/n) x ln (ni/n)
Where, ni is individual density of a species and n is total density of all the species
The Evenness Index (E) is calculated by using Shannon's Evenness formula
(Magurran, 2004).
Evenness Index (E) = H / ln(S)
Where, H is Shannon Wiener Diversity index; S is number of species
The data on vegetation collected through quadrat study was quantitatively
analysed for abundance, density and frequency. Species diversity and evenness
index was calculated by using the Shannon-Wiener Diversity Index (1963) and
Evenness Index, respectively.
2.2.15 FAUNAL ELEMENTS
Since observations of fauna and wildlife take long time, primary surveys were
limited to field visits and direct and indirect sightings of animals. The presence of
wildlife was also confirmed from the local inhabitants depending on the animal
sightings and the frequency of their visits in the catchment area. In addition to
these, secondary sources mainly literature was referred for preparing checklists
and other analysis in the study of animals and wildlife in the region.
2.2.16 AQUATIC ECOLOGY
Water resources projects have beneficial as well as adverse impacts on fish
production. The data on the prevailing fish species in the river Kameng was
collected from Fisheries Department of State Government and through literature
review as well. Fishing was done at various sites in the project area and river
stretches both upstream and downstream of the project site to ascertain the
disposal pattern of fish species. Identification and measurements of all the fish
catch was done and an inventory of the fish species was also prepared. Various
migratory species and the species to be affected due to conversion of lentic to

GMR Londa Hydro Power Pvt Ltd EIA study of Talong Londa H.E. Project
R S Envirolink Technologies Pvt. Ltd. 2.12
lotic conditions as a result of commissioning of the proposed project were also
identified.
Water samples from river Kameng were also collected as a part of field studies.
The density and diversity of phytoplankton, species diversity index and primary
productivity etc. were also studied. The field studies were conducted for three
seasons i.e. winter, summer and monsoon seasons.
2.2.17 DEMOGRAPHIC CHARACTERISTICS
The demographic and socio-economic status of the project affected area as well
as in the study area was compiled through field surveys as well secondary
sources. Detailed socio-economic census survey was conducted in all the villages
likely to be affected by the proposed project. Collection of data was completed at
two levels - at village/ block and individual household level. The socio-economic
survey at the village/ block level was aimed at finding out the status and extent of
amenities and resources available in villages. Based on the assessment of
demographic profile of Project Affected Families (PAFs), using guidelines and
norms as per The Right to Fair Compensation and Transparency in Land
Acquisition, Rehabilitation and Resettlement Act, 2013 and State Policy on
Resettlement and Rehabilitation (2008), Resettlement and Rehabilitation Plan
(R&R Plan) was formulated. Finding of the survey and R&R plan is being
presented separate SIA report.
2.2.18 INFRASTRUCTURE FACILITIES
The present status of infrastructure facilities, status and availability of electricity,
drinking water, communication and mode of transportation, commercial,
educational and health facilities, veterinary services, etc. was collected using
secondary data sourced from Census of India 2001 and 2011.
2.2.19 PUBLIC HEALTH
Development of water resources could have both beneficial and adverse effects
on the health of the people in and around the project area. In order to assess the
existing status of public health, the following data on public health status has been
collected from Public Health Department:
prevalent vectors in the area
prevalence of malaria and other water and vector-borne diseases in the area

GMR Londa Hydro Power Pvt Ltd EIA study of Talong Londa H.E. Project
R S Envirolink Technologies Pvt. Ltd. 2.13
2.3 IMPACT PREDICTION
Prediction is essentially a process to forecast the future environmental conditions
of the project area that might be expected to occur because of implementation of
the project. Impact of project activities has been predicted using mathematical
models and overlay technique (super-imposition of activity on environmental
parameter). For intangible impacts qualitative assessment has been done. The
environmental impacts predicted are as follows:
Loss of cultivable land (including Jhum land) and forests
Impacts on landuse pattern
Displacement of population due to acquisition of private and community
properties
Impacts on hydrologic regime
Impacts on water quality
Increase in incidence of water-related diseases including vector-borne diseases
Effect on riverine fisheries including migratory fish species
Increase in air pollution and noise level during project construction phase
Impacts due to sewage generation from construction works camps
Impacts due to acquisition of forest land
Impacts due to increase in terrestrial and aquatic ecology due to increased
human interferences during project construction and operation phases
2.4 ENVIRONMENTAL MANAGEMENT PLAN AND COST ESTIMATES
Based on the environmental baseline conditions and project inputs, the adverse
impacts were identified and a set of measures have been suggested as a part of
Environmental Management Plan (EMP) for their amelioration.
The management measures have been suggested for the following aspects:
Prevention of environmental degradation during construction phase
Maintenance of water quality
Compensatory afforestation
Wildlife conservation
Control of water-related diseases
Air pollution control
Stabilization of quarry sites
Restoration of muck disposal and construction areas
Sustenance and enhancement of fisheries potential
Greenbelt development

GMR Londa Hydro Power Pvt Ltd EIA study of Talong Londa H.E. Project
R S Envirolink Technologies Pvt. Ltd. 2.14
Roadside plantation
Rehabilitation and Resettlement Plan for Project Affected Families (PAFs)
Control measures to mitigate adverse impacts due to jhum cultivation
The expenditure required for implementation of R&R Plan, CAT Plan and EMP
has also been estimated as a part of the EIA study.
2.5 DAM BREAK ANALYSIS AND DISASTER MANAGEMENT PLAN
The dam break analysis was carried out using HEC-RAS model for this project in
the following stages:
Developed inflow hydrograph for the reservoir at the time of failure
The hydrograph was routed through reservoir
Estimated the outflow hydrograph after the dam break. Model was developed
to asses the movement of flood wave downstream its travel time, maximum
water level etc.
The Disaster Management Plan (DMP) to cater for the exigencies in case of a
dam break has been suggested. It outlines the actions to be taken in the event of
a dam break.
2.6 ENVIRONMENTAL MONITORING PROGRAMME
It is necessary to continue monitoring of certain parameters to verify the adequacy
of various measures outlined in the (EMP) and to assess the implementation of
mitigative measures. An environmental monitoring programme including
monitoring frequency for critical parameters has been suggested for
implementation during project construction and operation phases. The staff,
necessary equipment and agencies to be involved for implementation of the EMP
and costs have also been indicated.

GMR Londa Hydro Power Pvt Ltd EIA of Talong Londa H.E. Project
R S Envirolink Technologies Pvt. Ltd. 3.1
CHAPTER 3
ENVIRONMENT BASELINE STATUS I- PHYSICO-CHEMICAL ASPECTS
3.1 GENERAL
Before start of any Environmental Impact Assessment study, it is necessary to
identify the baseline levels of relevant environmental parameters which are likely to
be affected as a result of the construction and operation of the proposed project. A
similar approach has been adopted for conducting the EIA study for the proposed
Talong Londa Hydroelectric Project. A Scoping Matrix as outlined in Chapter-2 was
formulated to identify various issues likely to be affected as a result of the proposed
project. Based on the specific inputs likely to accrue in the proposed project,
aspects to be covered in the EIA study were identified. The other issues as outlined
in the Scoping Matrix were then discarded. Thus, planning of baseline survey
commenced with the shortlisting of impacts and identification of parameters for
which the data needs to be collected.
The baseline status has been evaluated under the following three categories:
Physico-chemical aspects
Ecology
Socio-Economic and ethnographic aspects.
The baseline setting for physico-chemical aspects have been covered in this
Chapter.
3.2 PHYSIOGRAPHY
The topography in the Kameng river catchment is highly undulating (Figure 3.1).
The elevations in catchment of Kameng River up to the dam site vary from 410m
to above 6,400m. Majority of the catchment lies between 800m and 2800m
accounting for more than 63% of the total catchment area (Figure 3.2). More than
72% of the catchment is characterized by strongly to moderately steep slopes
while steep slopes are found in the higher reaches only (Figure 3.3). Nearly 1/4th
of the catchment has moderate slopes.
Physiographically the state of Arunachal Pradesh can be divided into four
domains viz., i) the Himalayan Range, ii) the Trans-Himalayan Range, iii) the
Naga-Patkoi Range and iv) the Brahmaputra Plain. The Himalayan Range rising
abruptly from the Brahmaputra plain covers the eastern-most part of the Himalaya
extending from the border of Bhutan to the Dibang and Lohit valleys and
terminating against the Tidding-Tuting suture. The Trans Himalayan Range

GMR Londa Hydro Power Pvt Ltd EIA of Talong Londa H.E. Project
R S Envirolink Technologies Pvt. Ltd. 3.2
commonly known as the Mishmi Hills, the easternmost part of Arunachal Pradesh
abuts against the Himalayan Range along the Tidding suture. The Naga-Patkoi
Range defines the southern limit of the upper Brahmputra Plain. These form a part
of the ENE-WSW trending Arakam Yoma Mountain chain which assumes an
arcuate pattern in the vicinity of the Mishmi Thrust.
The topography of the Kameng basin in upper reaches divides itself in to two
distinct zones i.e. Greater Himalaya and Lower Himalaya. The Greater Himalaya
abounds with glaciers and mostly are covered with permanent snow above
elevation 5,000 m while lower regions in Himalaya are generally rain-fed. The
topography of the basin is hilly with steep slopes in upper regions and
moderately plain areas in lower regions.
The areas in hilly regions are low in fertility due to rock out-crops,
boulders and gravels. The major tributaries in the basin are perennial due to
runoff from snow melt. In lower reaches good agricultural land is available in
adequate quantities.

GMR Londa Hydro Power Pvt Ltd EIA of Talong Londa H.E. Project
R S Envirolink Technologies Pvt. Ltd. 3.3
Figure-3.1 Digital Elevation Model of Talong Londa H. E. project catchment showing topography

GMR Londa Hydro Power Pvt Ltd EIA of Talong Londa H.E. Project
R S Envirolink Technologies Pvt. Ltd. 3.4
Figure-3.2 Relief map of Talong Londa H. E. project catchment

GMR Londa Hydro Power Pvt Ltd EIA of Talong Londa H.E. Project
R S Envirolink Technologies Pvt. Ltd. 3.5
Figure-3.3 Slope map of Talong Londa H. E. project catchment

GMR Londa Hydro Power Pvt Ltd EIA of Talong Londa H.E. Project
R S Envirolink Technologies Pvt. Ltd. 3.6
3.3 DRAINAGE
The river Kameng is one of the many northern tributaries of Brahmaputra
river. Kameng river flows between longitudes 92º 00' 00" to 93º 20' 55" E and
latitudes 26º 38' 00" to 28º 59’ 50” N. The river Kameng drains an area of about
12,500 sq km. The total length of the river from its origin in the Himalaya at an
elevation of about 5,000m up to its confluence with Brahmaputra River is about
200 km. The Rivers Digen, Tenga, Gang Ri, Bichom, Para, Pacha, Pachi, Pachuk,
Papu and Dikrang are the main tributaries of Kameng.
The Kameng in its upper reaches generally flows in north-south direction,
taking numerous large turns in its course. About 20 km downstream of Seppa,
it is joined by right bank tributary i.e. Bichom river. After then its takes a turn
and flows in westerly direction. It joins the Brahmaputra River about 11 km
upstream of Tejpur town. The highest peak is Kangte (7090 m asl) in West
Kameng district. The Kameng catchment map is shown in Figure 3.4.
River Kameng orginates from the Greater Himalayan region draining the southern
slopes of the Himalayan range along the India-China border. It drains a number of
glacial lakes like Salai Laibuk, Wai Laibuk, Kachhe Laibuk, etc. Along its initial
course it receives drainage from Wipriyang Nadi on its right bank. The river
Kameng then receives flow from Waleng Bung on its left bank in the upper
reaches. Further downstream it is joined by Para River draining Chayang Tajo
Circle near Margingla. Later downstream, it receives water from Pachi river on its
left bank. Pachuk River is the largest right bank tributary of Kameng downstream
of the confluence of Pakke Bung. The proposed dam site is located about 7 km
downstream of the confluence of river Pachuk with Kameng. The catchment area
up to dam site is 2,814 sq km. The major source of water in the catchment area is
rainfall. In a small portion of upper catchment runoff due to melting of snow also
contributes to the flow.
The Kameng river which is also known as Jia-Bhareli in its lower reaches,
originates in the upper Himalayan ranges at an elevation of about 4800 m. The
river system is characterized by steep gradient of 1:8 to 1:10 in initial 10 km
reach, 1 in 12 in 10 to 20 km reach, about 1 in 20 in further 20 km reach and
progressively reducing to 1 in 200 m balance reach before outfalling in the
Brahmaputra.

GMR Londa Hydro Power Pvt Ltd EIA of Talong Londa H.E. Project
R S Envirolink Technologies Pvt. Ltd. 3.7
Figure-3.4 Drainage map of Talong Londa H. E. project catchment

GMR Londa Hydro Power Pvt Ltd EIA of Talong Londa H.E. Project
R S Envirolink Technologies Pvt. Ltd. 3.8
The Kameng river flows in north-south direction in its upper reaches, taking large
turns in its course and river flows in narrow valley up to Seppa town, afterward it
widens out. About 18 km d/s from Seppa town, the river is joined by a major
tributary Bichom. The combined river then takes a turn and flows in westerly
direction. The river takes a U-turn about 35 km d/s of confluence of Bichom and
starts flowing in easterly direction. Downstream of confluence of Dikker Nala, the
Kameng takes a north-south direction and joins the Brahmaputra about 10 km
upstream of Tezpur.
About 20% of the total catchment area in the upper reaches remains snow bound
throughout the year and keeps contributing to the river flow during the lean
months due to glacial melt and remaining catchment area is rain fed.
3.4 METEOROLOGY
The climate of the project area includes four seasons. Winter season lasts from
December to February followed by pre-monsoon or summer season from March to
May. The monsoon season begins in June and continues up to mid October. The
period from second half of the October to November is the post-monsoon season.
In this area south-west monsoon commences in the month of May and continues
till the end of October with heavy rains in July and August. During non-monsoon
period (November to April), thunderstorms occur frequently and with advancement
towards hot season; the frequency of thunder storm increases. The winter
precipitation is caused by western disturbances.
a. Precipitation
The long term stations in the area having precipitation data are Seppa and
Bhalukpong. The detail of the period of availability of precipitation data for different
raingauge stations in the Kameng basin in the vicinity of the project is given in
Table-3.1 and Figure-3.5.
Table 3.1: Meteorological stations and data availability Sl. No. Station Period of rainfall data
1. Seppa Apr 82 to Dec 05 2. Bhalukpong Jan 85 to Dec 06 3. Talong Londa old dam site Apr 04 to July 07 4. Buragoan Jan 71 to Dec 81 5. Khuppi Jan 69 to Dec 81 6. Badao-N- Lamnio Jan 05 to Sept 05 7. Badao-Morzingla June 05 to Sept 05 8. Badao - Lajja-D-SITE Jan 05 to Sept 05
10. Lower Leyak May 04 to Aug 05
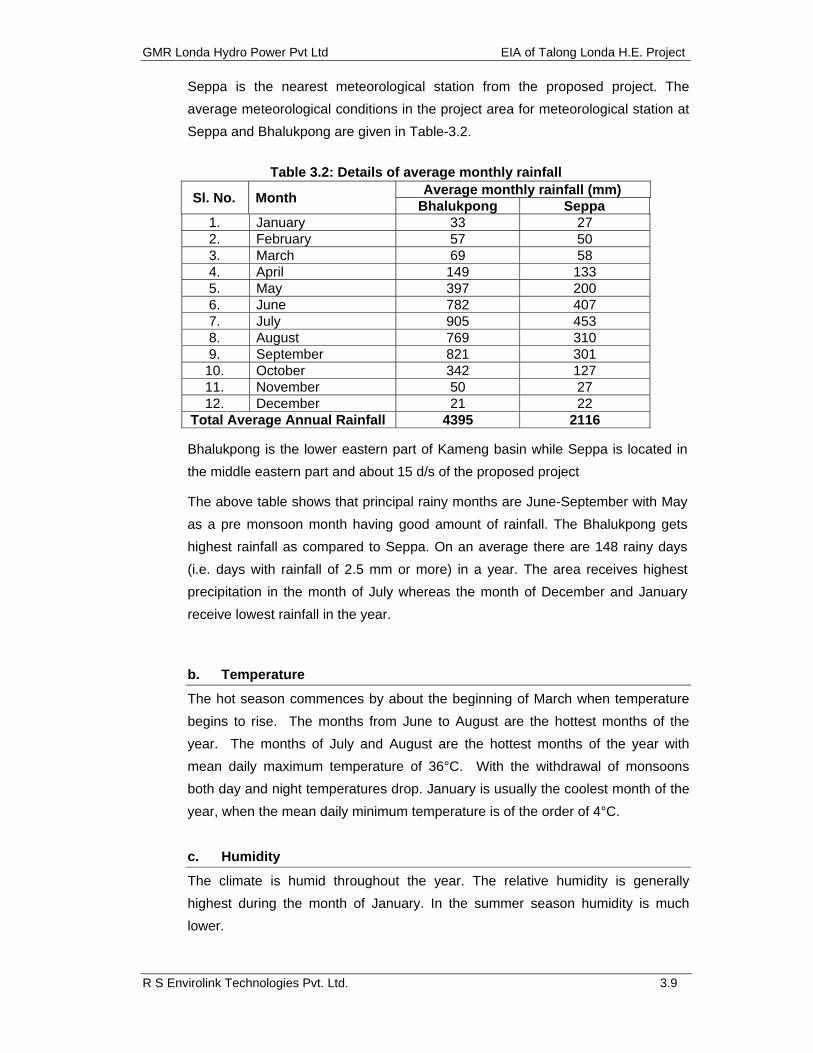
GMR Londa Hydro Power Pvt Ltd EIA of Talong Londa H.E. Project
R S Envirolink Technologies Pvt. Ltd. 3.9
Seppa is the nearest meteorological station from the proposed project. The
average meteorological conditions in the project area for meteorological station at
Seppa and Bhalukpong are given in Table-3.2.
Table 3.2: Details of average monthly rainfall
Sl. No. Month Average monthly rainfall (mm)
Bhalukpong Seppa 1. January 33 27 2. February 57 50 3. March 69 58 4. April 149 133 5. May 397 200 6. June 782 407 7. July 905 453 8. August 769 310 9. September 821 301
10. October 342 127 11. November 50 27 12. December 21 22
Total Average Annual Rainfall 4395 2116
Bhalukpong is the lower eastern part of Kameng basin while Seppa is located in
the middle eastern part and about 15 d/s of the proposed project
The above table shows that principal rainy months are June-September with May
as a pre monsoon month having good amount of rainfall. The Bhalukpong gets
highest rainfall as compared to Seppa. On an average there are 148 rainy days
(i.e. days with rainfall of 2.5 mm or more) in a year. The area receives highest
precipitation in the month of July whereas the month of December and January
receive lowest rainfall in the year.
b. Temperature
The hot season commences by about the beginning of March when temperature
begins to rise. The months from June to August are the hottest months of the
year. The months of July and August are the hottest months of the year with
mean daily maximum temperature of 36°C. With the withdrawal of monsoons
both day and night temperatures drop. January is usually the coolest month of the
year, when the mean daily minimum temperature is of the order of 4°C.
c. Humidity
The climate is humid throughout the year. The relative humidity is generally
highest during the month of January. In the summer season humidity is much
lower.
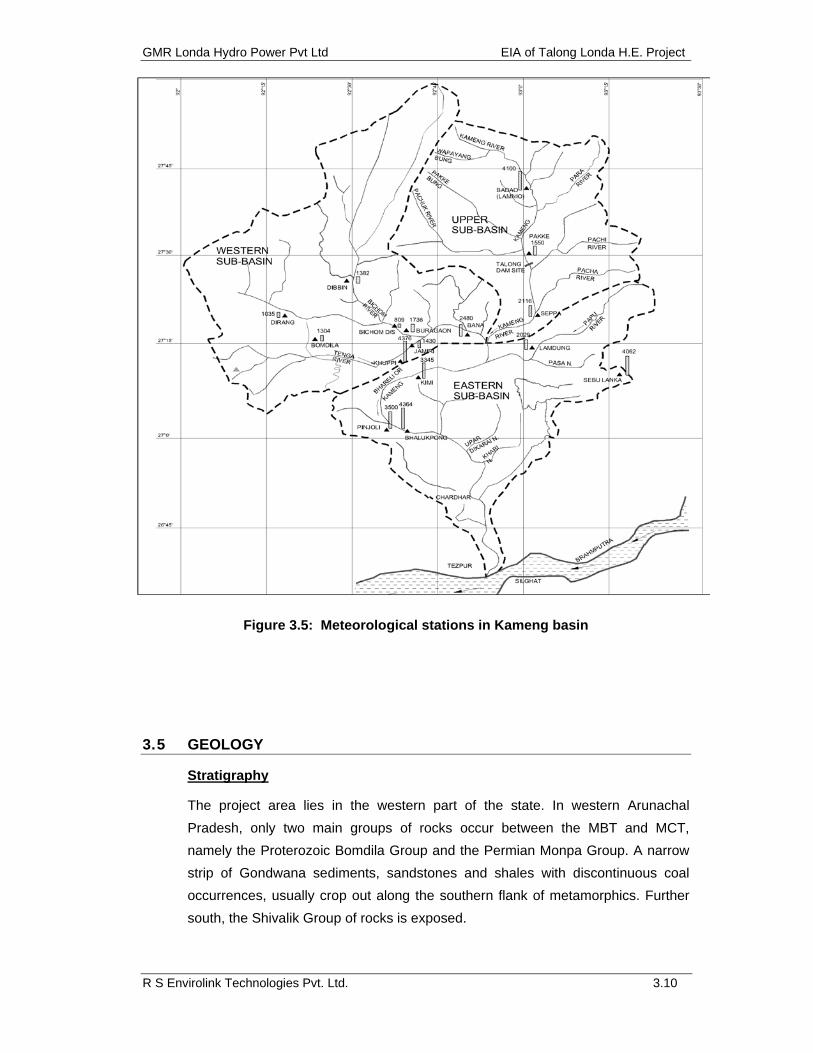
GMR Londa Hydro Power Pvt Ltd EIA of Talong Londa H.E. Project
R S Envirolink Technologies Pvt. Ltd. 3.10
Figure 3.5: Meteorological stations in Kameng basin
3.5 GEOLOGY
Stratigraphy
The project area lies in the western part of the state. In western Arunachal
Pradesh, only two main groups of rocks occur between the MBT and MCT,
namely the Proterozoic Bomdila Group and the Permian Monpa Group. A narrow
strip of Gondwana sediments, sandstones and shales with discontinuous coal
occurrences, usually crop out along the southern flank of metamorphics. Further
south, the Shivalik Group of rocks is exposed.

GMR Londa Hydro Power Pvt Ltd EIA of Talong Londa H.E. Project
R S Envirolink Technologies Pvt. Ltd. 3.11
Table 3.3.Regional Stratigraphic Sequence (Project area)
Group
Geological Age Formation Lithological Description
Recent Quarternary Formation Soil and alluvium.
-------------------------------------------Unconformity------------------------------------ Pre-Cambrian Phasang Granite Pegmatite & quartz veins, massive
non-foliated mica granite. -------------------------------------------Intrusive Contact--------------------------------
Bom
dila Group
Pre-Cambrian Ziro Gneisses (Talong-Londa HE Proj
Gneiss with pegmatite and quartz veins, biotite granite gneisses, Leuco-granite and augen gneiss.
-------------------------------------------Intrusive Contact-------------------------------- Pre-Cambrian Tenga Formation Dolomite with fine chert
bands.Grey, green & black phyllites, Slate, flaggy quartzite with Occasional cross beddings.
-------------------------------------------Unconformity-----------------------------------
Pre-Cambrian Khetabari Formation Mica peridotite. Micaceous, Graphitic ochry para amphibolite.Quartz-micaceous fuchite at Places, Staurolite-Kyanite-biotite- Gneiss.
Ziro Gneiss
The Ziro Gneiss, biotite granite gneiss, consists of several variants such as
foliated gneiss with occasional megacrysts of feldspar and quartz migmatitic
orthogneiss, streaky feldpathic gneiss and augen gneiss. Good exposures of
these gneisses are seen in the Nechiphu-Bomdila section, Ziro-Daporizo section
and Seppa-Veo section. The augen gneisses are particularly found along shear
zones and are probably the products of ductile deformation.
The Talong Londa Hydro Electric Project site is located in the Ziro formation of
Bomdila group. The rock types of Ziro formation are banded gneiss, streaky
gneiss, augen gneiss, quartz biotite gneiss with occasional thin bands of mica
schist, and porphyroblastic gneiss along with patches of leucocratic gneiss.
Intrusions of pegmatite and vein quartz are also observed.
Regional Structure
Tectonically, the area is a complex domain of several tectonic features. The major
tectonic features are the Main Central Thrust (MCT), Main Boundary Thrust
(MBT), Main Frontal Thrust (MFT), Mishmi Thrust, Lohit Thrust, Bomdila lineament
and Brahmaputra lineament.

GMR Londa Hydro Power Pvt Ltd EIA of Talong Londa H.E. Project
R S Envirolink Technologies Pvt. Ltd. 3.12
The MCT and Bomdila lineament lie at a considerable distance from the site (40 to
50km) and do not appears to be influencing the geology of the project.
3.5.1 GEOLOGY OF PROJECT AREA
The detailed geological mapping of the dam, power house, tail pool and diversion
tunnel indicate that Quartz biotite gneiss, augeon gneiss and streaky gneiss with
intrusive of pegmatite veins belongs to Bomdilla group which are equivalent to
Ziro gneisses are exposed in the project area.
The left bank is covered with the overburden material below the road level (EL.
447m) forming two slope segments – one being around 35° below the road and
second one which is flattened slope(around 15°) up to the river bank. Above the
road level, the hill slopes continue at an angle of 45° with rocky exposure along
the spur like configuration. The rock type observed is greyish white coloured,
medium to coarse grained, slightly to moderately weathered, medium strong to
strong biotite gneiss with pegmatite and quartz veins, traversed by a number of
joint sets. The general strike of the quartz biotite gneiss is N1650 - N3450 dipping
600 towards N2550, occasional swings in the strike are noticed attributed to
warping/broad folding in the rocks. As such no major shear zone or fault is
observed in the area.
The right bank disposes a sub-vertical rocky slope and occupied by fresh, hard,
to very strong quartz biotite-gneiss with quartzites intruded by pegmatite and vein
quartz bands mostly along the foliation planes & joints comprising well defined
upstream dipping foliation, general strike is N160°- N 340°, dipping 600 towards
N250°,variation of 20° is observed in the foliation trend. Shearing and fracturing is
seen along the foliation joint set at various places. No major shear zone or fault is
observed in the area.
River Bed
The river bed portion is occupied with riverine deposits comprising sand, pebbles,
cobbles and large boulders and is devoid of any in situ rock outcrop.
3.5.2 SEISMIC ZONE
The project area is located in seismic zone V as per seismic zone map of India as
per BIS standard IS -1893 (Part -1) - 2002- Criteria for Design of Earthquake
Resistant Design of Structures- Part -1 – General Provisions and Buildings.
According to GSHAP data, the state of Arunachal Pradesh falls in a region of high

GMR Londa Hydro Power Pvt Ltd EIA of Talong Londa H.E. Project
R S Envirolink Technologies Pvt. Ltd. 3.13
to very high seismic hazard. Historically, parts of this State have experienced
seismic activity greater than M 7.0 and one event of M 8.6 in 1950.
A list of epicentres of earthquakes of magnitude more than 6 on the Richter scale
in the North-eastern India is listed in Table 3.4.
Table 3.4: Details of Earthquakes in North-eastern India (M > 6)
Date and Year Epicentral location Magnitude
Jan. 10, 1869 Cachar 7.5
Jan.12, 1897 Great Assam Earthquake. Epicentre near Shillong.
8.7
Aug. 31, 1906 270 N : 970 E 7.0 (Depth 120 km) Dec., 1908 26.50 o N : 97o E 7.6 July 8, 1918 24.50N : 910E (Near Srinangal) 7.6 Sep. 9, 1923 25.50N : 910E 7.1 July 3, 1930 25.80N : 90.20E (Near Dhubri) 7.1 Jan. 27, 1931 25.60 N : 96.80E 7.6 Aug. 14, 1932 260N : 95.50E 7.0 (Depth 120 km) Jan. 2, 1934 24.50N : 950E 6.5 (Depth 130 km) Aug. 16, 1938 23.50N : 94.50E 7.2 May 27, 1939 24.50N : 940E 6.5 (Depth 75 km) Jan. 21, 1941 27.50N : 92.50E Oct. 23, 1943 260N : 930E 7.2 Sept. 12, 1946 23.50N: 900E 7.5 July 29, 1947 28.50N : 940E 7.75
Aug. 15, 1950 28.50N : 96.7-0E (Near Arunachal Pradesh Tibet border)
8.6
March 21,1954 24.40N : 940E (Manipur-Burma border)
7-7.25
Feb. 18, 1968 250N : 940E 6.2 July 29, 1970 26.10N : 94.40E 6.5 June 7, 2000 26.80 N : 97.2OE 6.5 Source: Indian Meteorological Department (IMD).
3.5.3 SITE SPECIFIC STUDIES
The site specific study was carried out by Department of Earthquake Engineering,
IIT Roorkee and they have recommended a value of 0.36g for MCE and 0.18g for
DBE conditions and the same has been incorporated in the design of the project
components.
3.6 SOIL Soil of the project area is classified as per the maps of NBSS & LUP and is shown
in Figure-3.6. There are five main soil groups found in the study area i.e. Lithic
Udorthents, Typic Palaehumulus, Typic Kanhaplohumulus, Umbric Dystrocrepts
and Pachic Haplumbrepts (Figure 3.6).
The soil quality in the project area varies with topography. Generally, soil in the
area is loose, sandy loam or sandy loam mixed with pebbles. In the region up to
elevation of 500 msl, the soil texture varies from sandy to loamy. In areas without
dense vegetation, top soil depth is quite less, and comprises mainly of pebbles.

GMR Londa Hydro Power Pvt Ltd EIA of Talong Londa H.E. Project
R S Envirolink Technologies Pvt. Ltd. 3.14
The pH of the soil is in slightly acidic range. At higher altitudes, the soil varies from
loamy to clayey with a thick layer of humus at the top. Thick humus is found in
areas which are covered with evergreen forests.
As a part of the field studies, soil samples were collected from various locations in
the project area, which were then analysed for physico-chemical parameters. For
the soil sampling locations refer Figure-2.1 in Chapter 2. The results are tabulated
in Table-3.5.
The pH of the soil is in slighty acidic range. The low levels of nutrients indicate
that the soil in the project area has low soil productivity. The continuous washout
of nutrients along with runoff as a result of high precipitation and steep slopes can
be attributed as the main reason for low to moderate soil productivity.
Table 3.5: Physico-chemical Analysis of Soil Samples Parameter Location
S1 S2 S3 S4 S5Winter Season pH 6.6 6.6 6.8 7.0 6.9Potassium, kg/ha 104 128 136 90 148Nitrogen, kg/ha 278 310 340 250 380Phosphorus, kg/ha 10 18 21 8 22Organic matter, % 0.7 0.6 0.9 0.5 0.9Pre - monsoon Season pH 6.7 6.8 6.6 7.1 6.8Potassium, kg/ha 101 125 135 91 146Nitrates, kg/ha 275 306 342 245 378Phosphates, kg/ha 9 16 20 6 20Organic matter, % 0.6 0.5 0.7 0.6 0.7Monsoon Season pH 6.5 6.6 6.7 6.9 6.8Potassium, kg/ha 101 122 138 91 146Nitrates, kg/ha 301 302 332 245 368Phosphates, kg/ha 8 14 19 7 18Organic matter, % 0.5 0.5 0.6 0.5 0.8
Note: S1 - Near Bridge on Kameng river in about 15 km upstream
S2 - About 12 km upstream of proposed dam
S3 - Near confluence of Pachuk with Kameng
S4 - Near proposed dam site
S5 - 2 km downstream of the proposed dam

GMR Londa Hydro Power Pvt Ltd EIA of Talong Londa H.E. Project
R S Envirolink Technologies Pvt. Ltd. 3.15
Figure 3.6: Soil Map of Talong HE Project

GMR Londa Hydro Power Pvt Ltd EIA of Talong Londa H.E. Project
R S Envirolink Technologies Pvt. Ltd. 3.16
3.7 WATER AVAILABILITY
A long term series of 10 daily discharges at Talong Londa dam site was derived
from the observed 10 daily flow series of Bichom dam site. CWC has approved a
10-daily discharge series of 13 years period from 1969-70 tp 1981-82 as water
availability series of Talong Londa HE Project.The average annual specific yield of
this series is 2228 mm. The average monthly flow pattern at dam site is given
below in Figure 3.7.
Figure 3.7: Average Monthly Flow Pattern
3.7.1 DESIGN FLOOD
The peak of the PMF hydrograph works out to be 16,891 cumec. The ordinates of
the PMF hydrograph are given in Table-3.6.
Table 3.6 PMF hydrograph ordinates at Talong Londa dam site
Time Baseflow Total Time Baseflow Total (hours) (cumec) (cumec) (hours) (cumecs) (cumecs)
0 140 141 32 140 11804 1 140 143 33 140 10369 2 140 150 34 140 9085 3 140 166 35 140 7998 4 140 192 36 140 7093 5 140 236 37 140 6307 6 140 304 38 140 5614 7 140 431 39 140 4979 8 140 648 40 140 4391 9 140 942 41 140 3828
10 140 1289 42 140 3286 11 140 1688 43 140 2775 12 140 2141 44 140 2291 13 140 2672 45 140 1854 14 140 3267 46 140 1467 15 140 3768 47 140 1122 16 140 4071 48 140 817 17 140 4236 49 140 570

GMR Londa Hydro Power Pvt Ltd EIA of Talong Londa H.E. Project
R S Envirolink Technologies Pvt. Ltd. 3.17
18 140 4389 50 140 379 19 140 4802 51 140 258 20 140 5636 52 140 195 21 140 6804 53 140 162 22 140 8169 54 140 146 23 140 9715 55 140 141 24 140 11432 56 140 141 25 140 13316 57 140 141 26 140 15226 58 140 141 27 140 16544 59 140 141 28 140 16835 60 140 141 29 140 16167 61 140 141 30 140 14871 62 140 141 31 140 13336 63 140 141
On the suggestion of CWC, an additional baseflow of 56 cumecs has been added
to the above hydrograph peak to obtain final PMF value of 16,891 cumecs.
3.8 SEDIMENTATION
Sediment study needs long term observed sediment data in order to review
reservoir capacity studies. The sediment sampling at the dam site is available for
one year only, with occasional high values due to debris carried in the monsoon
months. For the available data, sediment concentration plot, with some gaps, is
given below in Fig. 3.8.
Figure 3.8: Sediment Concentration at Talong Londa Dam Site

GMR Londa Hydro Power Pvt Ltd EIA of Talong Londa H.E. Project
R S Envirolink Technologies Pvt. Ltd. 3.18
The management of silt in the reservoir is proposed by spilling excess discharges
through low level spillways and thus to pass down silt with water (sluicing). This
will reduce the trapping of silt in the reservoir from very beginning. This differs
from the flushing in the sense that silt is passed out of the reservoir before its
deposition. In case of larger silt deposition being observed, reservoir flushing will
be necessary at regular intervals.
Silt management by sluicing as well as by flushing will be studied on a numerical
model after collection of some more silt data. This exercise will provide useful
information regarding the final stable profile of accumulated silt in the reservoir
and long term regime of the river upstream. It will also help in planning the
operations and frequency of such operations for silt management in most effective
ways.
3.9 WATER QUALITY
The proposed project is located in an area with low population density with no
major sources of pollution. The major sources of water in the project area are
rivers or nallahs which flow adjacent to the habitations. The water is conveyed to
the point of consumption. The effluent generated from domestic sources in the
project area and its surroundings ultimately reaches river Kameng through various
streams/channels outfalling in the river. River Kameng like any other river in
mountainous stretch follows a general discharge pattern; swell in monsoon
season and shrink in winter season. Even, for minimum flow condition, there is
sufficient water available in river Kameng, for dilution of untreated sewage
generated from domestic sources. There are no industries in the area. The area
under agriculture is quite less, (about 10%) which coupled with negligible use of
agro-chemicals, means that apart from domestic sources, pollution loading is
virtually negligible.
As a part of EIA study, water samples were collected for three seasons which was
carried out at the following sites:
W1 - About 1.2 km upstream Dam
W2 - Near confluence of Pachuk river with Kameng
W3 - Just upstream of the proposed Dam
W4 - 2 km downstream of Dam
W5 - Pachuk River upstream of Reservoir Area
W6 - Kameng River upstream of Reservoir Area
The location of various sampling stations is marked in Figure-2.1 in Chapter 2.

GMR Londa Hydro Power Pvt Ltd EIA of Talong Londa H.E. Project
R S Envirolink Technologies Pvt. Ltd. 3.19
The pH was recorded with the help of pH Scan (Eutech) and pH meter (EI – 132
E) in the field. For the turbidity of water, samples were collected in sampling
bottles from different sites in the field and brought to the laboratory for analysis.
The turbidity was recorded with the help of Nephelometer or Turbidometer (EI –
331 E). The total dissolved solids were measured with the help of TDScan 1
(Eutech) at each site. Similarly conductivity was recorded with the help of TDScan
3 (Eutech) at the site. Dissolved oxygen was measured by using digital DO meters
(Eutech ECDO 602K and EI – 831). Total alkalinity, total hardness, Ca and Mg
contents, chloride and heavy metals were measured with the help of APHA (1992)
and Adoni (1985). Nitrate (NO3 – N) was measured using HANNA instruments (HI
93728 and HI 93713, respectively). The results for various seasons are listed in
Tables-3.7 to 3.9.
Table 3.7: Results of Water Quality Analysis (Winter Season) Parameter W1 W2 W3 W4 W5 W6
pH 7.4 7.2 7.8 7.5 7.2 7.6
Electrical Conductivity, micromhos/cm 180 212 185 179 202 181
TDS, mg/l 121 124 130 136 118 126
Sulphates, mg/l <1.0 <1.0 <1.0 <1.0 <1.0 <1.0
Chlorides, mg/l 41 47 43 48 41 44
Nitrates, mg/l 2.1 5.2 3.1 2.4 4.9 2.9
Phosphates, mg/l 1.1 6 4.7 6.4 4.6 4.6
Sodium, mg/l 5.1 6 4.7 6.4 5.2 4.2
Potassium, mg/l 3 1.4 1.2 2.2 1.3 1.2
Calcium, mg/l 14 10 12 12 11 12
Copper, mg/l <1.0 <1.0 <1.0 <1.0 <1.0 <1.0
Iron, mg/l <1.0 <1.0 <1.0 <1.0 <1.0 <1.0
Zinc, mg/l <1.0 <1.0 <1.0 <1.0 <1.0 <1.0
Cadmium, mg/l 2.2 2.7 2.4 1.9 2.4 2.2
Magnesium, mg/l 2 2 2 10 3 2
Lead, mg/l <0.01 <0.01 <0.01 <0.01 <0.01 <0.01
Manganese, mg/l <1.0 <1.0 <1.0 <1.0 <1.0 <1.0
Fluorides, mg/l <1.0 <1.0 <1.0 <1.0 <1.0 <1.0
Hardness, mg/l 44 36 40 38 36 38
Alkalinity, mg/l 34 29 35 32 27 36
DO, mg/l 8.4 8.2 8.2 1.2 7.9 7.8
BOD, mg/l 1.4 1.3 1.2 1.2 1.2 1.1
COD, mg/l 3.4 3 2.9 3 2.8 2.6
Oil & grease, mg/l <1.0 <1.0 <1.0 <1.0 <1.0 <1.0
Total Coliform Absent Absent Absent Absent Absent Absent
Table 3.8: Results of Water Quality Analysis (Summer Season)
Parameter W1 W2 W3 W4 W5 W6pH 7.6 7 7.4 7.6 7.1 7.3

GMR Londa Hydro Power Pvt Ltd EIA of Talong Londa H.E. Project
R S Envirolink Technologies Pvt. Ltd. 3.20
Electrical Conductivity, micromhos/cm 188 191 182 187 186 180 TDS, mg/l 119 120 125 135 117 123Sulphates, mg/l <1.0 <1.0 <1.0 <1.0 <1.0 <1.0 Chlorides, mg/l 42 45 42 45 44 43 Nitrates, mg/l 2.3 4.8 3 2.6 2.4 3 Phosphates, mg/l 1 5.9 4.8 6.2 3.2 4.6 Sodium, mg/l 5 5.8 4.5 6.3 4.6 4.2 Potassium, mg/l 3.1 1.2 1 2 2.1 1Calcium, mg/l 13 9 11 10 11 10 Copper, mg/l <1.0 <1.0 <1.0 <1.0 <1.0 <1.0 Iron, mg/l <1.0 <1.0 <1.0 <1.0 <1.0 <1.0 Zinc, mg/l <1.0 <1.0 <1.0 <1.0 <1.0 <1.0 Cadmium, mg/l 2 2.6 2.3 1.7 2.1 2.2 Magnesium, mg/l 2 2 2 8 2 2 Lead, mg/l <0.01 <0.01 <0.01 <0.01 <0.01 <0.01 Manganese, mg/l <1.0 <1.0 <1.0 <1.0 <1.0 <1.0 Fluorides, mg/l <1.0 <1.0 <1.0 <1.0 <1.0 <1.0 Hardness, mg/l 45 37 42 40 42 44 Alkalinity, mg/l 35 31 36 34 32 38 DO, mg/l 8.1 8 8.1 1.3 7.9 8.2 BOD, mg/l 1.3 1.2 1 1.1 1.1 1 COD, mg/l 3.5 1.6 2.5 2.8 2.9 2.3 Oil & grease, mg/l <1.0 <1.0 <1.0 <1.0 <1.0 <1.0 Total Coliform Absent Absent Absent Absent Absent Absent
Table 3.9: Results of Water Quality Analysis (Monsoon Season)
Parameter W1 W2 W3 W4 W5 W6 pH 7.7 7 7.4 7.6 7.2 7.3 Electrical Conductivity, micromhos/cm 88 71 82 77 87 82 TDS, mg/l 59 40 55 55 59 53 Sulphates, mg/l <1.0 <1.0 <1.0 <1.0 <1.0 <1.0 Chlorides, mg/l 42 45 42 45 43 45 Nitrates, mg/l BDL BDL BDL BDL BDL BDL Phosphates, mg/l BDL BDL BDL BDL BDL BDL Sodium, mg/l 5 5.8 4.5 6.3 4.8 5.5 Potassium, mg/l 3.1 1.2 1 2 2.8 1.3 Calcium, mg/l 17 16 14 17 16 13 Copper, mg/l <1.0 <1.0 <1.0 <1.0 <1.0 <1.0 Iron, mg/l <1.0 <1.0 <1.0 <1.0 <1.0 <1.0 Zinc, mg/l <1.0 <1.0 <1.0 <1.0 <1.0 <1.0 Cadmium, mg/l 1.2 1.6 1.3 1.1 1.2 1.3 Magnesium, mg/l 1.94 1.945 1.95 2.9 2.01 1.86 Lead, mg/l <0.01 <0.01 <0.01 <0.01 <0.01 <0.01 Manganese, mg/l <1.0 <1.0 <1.0 <1.0 <1.0 <1.0 Fluorides, mg/l <1.0 <1.0 <1.0 <1.0 <1.0 <1.0 Hardness, mg/l 48 47 49 50 46 48 Alkalinity, mg/l 25 28 28 29 26 27 DO, mg/l 9.1 9.5 9.7 8.3 8.8 9.2 BOD, mg/l 1.1 1 <1.0 1 1.1 1.1 COD, mg/l 2.5 1.2 1.5 1.8 2.5 1.4 Oil & grease, mg/l <1.0 <1.0 <1.0 <1.0 <1.0 <1.0 Total Coliform Absent Absent Absent Absent Absent Absent
The low levels of cations and anions in the above table indicate that the quality of
river Kameng is good. The low hardness levels indicate the soft quality of water.

GMR Londa Hydro Power Pvt Ltd EIA of Talong Londa H.E. Project
R S Envirolink Technologies Pvt. Ltd. 3.21
The high DO (8.2 to 9.7 mg/l) and low BOD (1.1 to 1.4 mg/l) levels indicate the
absence of organic pollution sources. This is mainly due to absence of pollution
sources from industries in the catchment area. The only source of organic
pollutants is the domestic source. The area has low population density and even
the minimum flow is much higher than the flow required for dilution of sewage,
hence, there is no adverse impact on water quality. This is reflected in the low
BOD and high D.O. levels. The D.O. levels are close to saturation condition.
The heavy metals monitored as a part of the study are below the permissible
limits, which can be attributed to absence of pollution from industrial sources. The
oil & grease levels were below the detectable range. During the socio-economic
study it was also observed that majority of the villages use water of adjacent rivers
and streams. Normally in a remote area with low population density, like the
proposed project site, no water treatment is done. The incidences of major
epidemics related to water-borne diseases have not been reported in the area.
3.10 AMBIENT AIR QUALITY
In a water resource project, impacts on air quality are marginal and limited only
during construction phase. In order to assess the existing status of air quality an
ambient air quality monitoring was undertaken at two locations in the project area.
The monitoring stations are located at dam site and Pachi village. The baseline
data of ambient air environment was generated for the following parameters:
Particulate Matter size less than 10 g/m3 (PM10)
Particulate Matter size less than 2.5 g/m3 (PM2.5)
Sulphur dioxide (SO2) g/m3
Oxides of Nitrogen (NOx) g/m3
The techniques used for monitoring of various parameters are given in Table-3.10.
Table 3.10: Techniques Used for Ambient Air Quality Monitoring
Parameter Technique Technical Protocol
PM10 Respirable Dust Sampler (Gravimetric method) IS-5182 (Part-IV)
PM2.5 Respirable Dust Sampler (Gravimetric method) IS-5182 (Part-IV)
SO2 West and Gaeke IS-5182 (Part-II)
NOx Jacob & Hochheiser IS-5182 (Part-VI)
The frequency of monitoring was twice a week for four consecutive weeks. The
parameters studied were PM10, PM2.5, SO2 and NOx. The results of ambient air
quality monitoring are summarized in Table-3.11. The summary of ambient air
quality monitoring results is given in Table-3.12. The locations of sampling stations
are shown in Figure-2.1 of Chapter 2.

GMR Londa Hydro Power Pvt Ltd EIA of Talong Londa H.E. Project
R S Envirolink Technologies Pvt. Ltd. 3.22
Table 3.11: Results of Ambient Air Quality (Unit : g/m3) Station PM10 PM2.5 SO2 NOx
Winter season Dam site 54 26 7.4 10.2
44 24 7.8 7.9 52 25 6.4 8.2 52 25 BDL 7.9
57 27 6.2 10.2
48 25 7.1 11.4 60 29 6.4 10.2 54 28 6.9 8.2
Pachi village 51 25 BDL 7.9 54 26 6.8 8.2
47 21 BDL 10.4 49 22 BDL 11.0
54 26 6.9 7.9
51 24 7.0 8.1 60 31 7.4 8.2 55 27 8.2 8.7
Pre-monsoon season / Summer
Dam site 51 25 7.3 10.1 43 24 7.6 7.7 50 24 6.3 8.0
51 23 BDL 7.8
55 25 6.0 10.0 47 25 7.0 11.2 58 28 6.3 10.1 52 27 6.7 8.0
Pachi village
49 24 BDL 7.7 52 25 6.6 8.1 46 20 BDL 10.3 45 21 BDL 11.2 51 25 6.8 7.6 50 22 7.0 8.0 57 29 7.2 8.1 52 25 8.0 8.5 Monsoon season
Dam site
48 22 6.3 8.1 43 21 6.0 7.7 49 22 6.3 8.0 50 22 BDL 7.8 51 23 BDL 8.0 47 21 6.9 10.2 51 23 6.3 8.1 49 23 6.1 7.0
Pachi village
49 23 BDL 7.7 47 22 BDL 8.1 46 21 BDL 8.3 42 20 BDL 9.2 49 23 6.3 7.6 50 22 7.0 7.7 47 21 6.9 7.7 48 23 7.0 7.5
BDL= Below detectable limits

GMR Londa Hydro Power Pvt Ltd EIA of Talong Londa H.E. Project
R S Envirolink Technologies Pvt. Ltd. 3.23
Table 3.12: Summary of Ambient Air Quality Monitoring Results (Unit: g/m3) Station Average Maximum Minimum Winter seasonPM10 Dam site 53.13 60 48 Pachi village 53.5 60 47 PM2.5 Dam site 26.00 29 22 Pachi village 26.25 31 21 SO2 Dam site 6.89 7.8 BDL Pachi village 7.26 8.2 BDL NOx Dam site 9.28 11.4 7.9 Pachi village 9.09 11.2 7.7 Summer seaonPM10 Dam site 50.88 58 43 Pachi village 50.25 57 45 PM2.5 Dam site 25.13 28 23 Pachi village 23.88 29 20 SO2 Dam site 6.74 7.6 BDL Pachi village 7.12 8 BDL NOx Dam site 9.11 11.2 7.7 Pachi village 8.69 11.2 7.6 Monsoon seaonPM10 Dam site 48.55 51 43 Pachi village 47.25 50 42 PM2.5 Dam site 22.13 23 21 Pachi village 21.88 23 20 SO2 Dam site 6.32 6.9 BDL Pachi village 6.8 7 BDL NOx Dam site 8.11 10.2 7.0 Pachi village 7.98 9.2 7.5
Observations on PM10 Levels
The PM10 levels as observed during field studies is much lower than the
permissible Annual limit of 60 g/m3 in summer and monsoon season (Refer
Annexure-V). In winter season the PM10 level of 60 g/m3 at Pachi village and
Dam Site, which is about to exceed the limit, it is due to the burning for forest area
for Jhum cultivation.

GMR Londa Hydro Power Pvt Ltd EIA of Talong Londa H.E. Project
R S Envirolink Technologies Pvt. Ltd. 3.24
Observations on PM2.5 Levels
The average PM2.5 levels ranged from 26.0 to 26.25 g/m3, 23.88 to 25.13 g/m3
and 21.88 to 22.13 g/m3 in winter, summer and monsoon seasons, respectively.
The maximum PM2.5 level was observed to be 31 g/m3, which is well below the
annual permissible limit of 40 g/m3.
Observations on SO2 Level
The highest SO2 level was observed at Pachi village was 8.2 g/m3, which is well
below the annual permissible limit of 50 g/m3. The absences of anthroprogenic
sources are responsible for low SO2 level.
Observations on NOx Levels
The highest NOx value of 11.4 g/m3 was observed at dam site, which too was
well below the maximum annual permissible limit of 40 g/m3.
3.11 AMBIENT NOISE LEVEL
Baseline noise data has been measured using a weighted Sound Pressure Level
(SPL) meter. The survey was carried out in calm surrounding. Hourly noise meter
readings were taken at different sites. The location of various noise monitoring
stations is shown in Figure 2.1. The noise levels were monitored continuously
from 6 AM to 9 PM at each location and hourly equivalent noise level was
measured. Sound Pressure Level (SPL) measurement in the ambient environment
was made using sound pressure level meter.
The average ambient noise levels are given in Table 3.13. The day time
equivalent noise levels are given in Table 3.14.
Table 3.13: Hourly Equivalent Noise Levels (Unit: dB(A))
Time Near Dam site Village Pachi Village Lora Near Power house Winter season 6 – 7 A.M. 43 40 41 41 7 – 8 A.M. 44 41 41 42 8 -9 A.M. 55 44 43 51 9-10 A.M. 58 44 48 51 10-11 A.M. 57 43 47 50 11 am - 12 Noon 57 40 48 52 12 noon – 1 P.M. 58 41 41 53 1 –2 PM 56 40 42 52 2 – 3 PM 54 48 49 52 3 – 4 PM 58 48 45 48 4 – 5 PM 58 47 46 48 5 – 6 PM 47 40 44 42 6 – 7 PM 44 43 45 43 7 – 8 PM 42 40 44 42 8 – 9PM 42 41 41 42

GMR Londa Hydro Power Pvt Ltd EIA of Talong Londa H.E. Project
R S Envirolink Technologies Pvt. Ltd. 3.25
Time Near Dam site Village Pachi Village Lora Near Power house Winter season Summer season 6 – 7 A.M. 45 41 41 43 7 – 8 A.M. 46 43 41 46 8 -9 A.M. 53 45 44 50 9-10 A.M. 60 46 44 54 10-11 A.M. 61 48 47 57 11 am - 12 Noon 62 49 48 52 12 noon – 1 P.M. 62 49 41 52 1 –2 PM 65 50 43 55 2 – 3 PM 65 52 48 55 3 – 4 PM 58 52 49 53 4 – 5 PM 59 47 47 49 5 – 6 PM 57 45 46 47 6 – 7 PM 48 44 45 48 7 – 8 PM 49 43 43 46 8 – 9 PM 45 41 40 45 Monsoon season 7 – 8 A.M. 46 44 41 53 8 -9 A.M. 52 47 41 50 9-10 A.M. 65 54 53 61 10-11 A.M. 68 54 55 62
Table 3.14: Day time Equivalent Noise Levels
The day time equivalent noise level at various sampling stations ranged from 42.7
to 51.5 dB(A), 44.5 to 55.7 dB(A) and 47.5 to 57.8 dB(A) in winter, summer and
monsoon seasons, respectively. The around the dam site and power house
locations is comprised mainly of the flow of the river.
3.12 LANDUSE PATTERN
Landuse provides details of various categories of lanuses e.g. for agriculture,
settlement, forest, whereas land cover provides the details such as vegetation,
rocks or buildings that are present on the surface. Accurate landuse and
landcover identification is the key to most of the planning processes.
The landuse pattern of the project and catchment area has been studied through
digital satellite imagery data. Digital IRS LISS-III and satellite data was procured
from National Remote Sensing Agency (NRSA), Hyderabad. The data was
processed through ERDAS IMAGINE software.
S.No. Location Zone Value dB(A)
Winter Season
Summer Season
Monsoon Season
1 Near Dam Site Residential 51.5 55.7 57.8 2 Village Pachi Residential 42.7 46.3 49.8 3 Village Lora Residential 44.3 44.5 47.5 4 Near Power house site Residential 47.3 50.1 56.5

GMR Londa Hydro Power Pvt Ltd EIA of Talong Londa H.E. Project
R S Envirolink Technologies Pvt. Ltd. 3.26
Ground truthing studies were conducted in the project area to validate various
signals in the satellite images and correlate them with different landuse domains.
As a part of field studies ground truthing was conducted in the project as well as
the study area. The image was then classified using the prominent signatures
extracted based on the past experience. The False Color Composite (FCC) and
classified image of the catchment and study area is shown in Figures-3.9 and
3.10.
The landuse/ landcover map of the entire catchment as well as study area has
been given in Figures-3.11 & 3.12. The landuse pattern of the study area is given
in Table-3.15.
The major land use category in the study area is forest land, which accounts for
nearly 96.68% of the total study area. This includes dense forest (77.14%) with
crown cover density > 40% and open forest (19.54%) with crown cover density <
10%. The other major land use land cover categories are agricultural Jhum land
(2.10%) and barren area (0.67%).
Table 3.15: Landuse Pattern in the Study Area Landuse/Landcover Area in % Area in ha
River/Water Bodies 0.46 81.74 Barren Areas 0.67 118.6 Agricultural Land 2.1 372.2 Dense Forest 77.14 13677.25 Open Forest 19.54 3464.41 Settlement/Built-up Areas 0.09 15.80
Total 100.0 17730.00

GMR Londa Hydro Power Pvt Ltd EIA of Talong Londa H.E. Project
R S Envirolink Technologies Pvt. Ltd. 3.27
Figure-3.9 FCC of Talong Londa H. E. project catchment area generated from IRS 1D LISS-III data

GMR Londa Hydro Power Pvt Ltd EIA of Talong Londa H.E. Project
R S Envirolink Technologies Pvt. Ltd. 3.28
Figure-3.10 FCC of Talong Londa H. E. project study area generated from IRS 1D LISS-III data

GMR Londa Hydro Power Pvt Ltd EIA of Talong Londa H.E. Project
R S Envirolink Technologies Pvt. Ltd. 3.29
Figure-3.11 Land use / land cover map of catchment area of Kameng basin up to Talong Londa H. E. project dam site
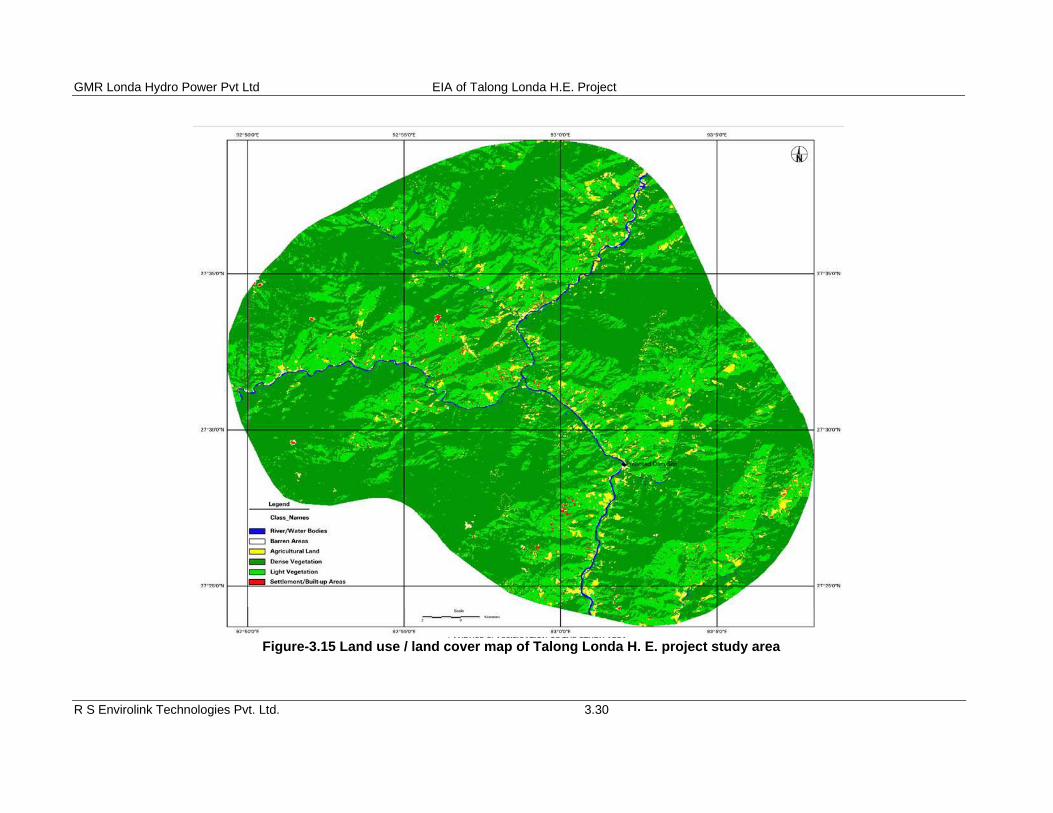
GMR Londa Hydro Power Pvt Ltd EIA of Talong Londa H.E. Project
R S Envirolink Technologies Pvt. Ltd. 3.30
Figure-3.15 Land use / land cover map of Talong Londa H. E. project study area
GMR Londa Hydro Power Pvt Ltd EIA of Talong Londa H.E. Project
R S Envirolink Technologies Pvt. Ltd. 4 1
CHAPTER 4
ENVIRONMENT BASELINE STATUS I- ECOLOGICAL ASPECTS
4.1 GENERAL
The baseline status has been divided into following three categories:
Physico-chemical aspects
Ecology
Socio-economic and ethnographic aspects.
The baseline setting for ecological aspects are outlined in the present Chapter. As
a part of the EIA study, a detailed Ecological survey was conducted for three
seasons. The objectives of the ecological survey were to:
Prepare a checklist of flora in the study area.
Assess the presence of rare/endangered, economically important and
medicinal plant species.
Determine frequency and density of different vegetation components. Estimate
density and volume of the trees with height above 8 m.
List wildlife in the project area, reported and encountered during field study.
Determine frequency, abundance and density of phytoplanktons and
zooplanktons.
Assess biological productivity of river Kameng in the study area.
4.2 TERRESTRIAL ECOLOGY
4.2.1 FOREST TYPE IN THE CATCHEMNT AREA
The state of Arunachal Pradesh occupies the largest area (83,743 km2) in the
northeastern region of India. It is uniquely situated in the transition zone between
the Himalayan and Indo-Burmese regions (Mani, 1974; Rodgers and Panwar,
1988). The diversity of topographical and climatic condition has favored the
growth of luxuriant forests, which are home to myriad plant and animal species.
Administratively, the forest area is under the jurisdiction of Seppa Forest Division.
The legal status of forests is Unclassfied State Forest (USF). Though the State
Government is the ultimate owner of these forests, these are neither surveyed nor
demarcated and as such no detailed record and maps are available with the
Forest Department. The village community traditionally enjoys the rights of the
physical possession of forest land and removal of timber and forest produce, free

GMR Londa Hydro Power Pvt Ltd EIA of Talong Londa H.E. Project
R S Envirolink Technologies Pvt. Ltd. 4 2
of loyalty for domestic use. As per the working plan of Seppa forest division the
forest in the area has been grouped in the sub group Tropical Semi-evergreen
Forest.
The area is located in a high rainfall zone. The main feature of these forests is the
heterogeneous mixture of species. Structurally these forests cannot be clearly
differentiated into distinct stories. In general the top storey is open and composed
of a mixture of evergreen, semi evergreen and deciduous species. Pure patches
of bamboos are also common and are scattered all over the forest area. After
preliminary survey of the study area these forests can be grouped in the Sub
group- 2B Northern Tropical Semi Evergreen Forest of Champion and Seth’s
(1968) Revised Survey of Forest Types of India. The forests can be described in
following sub-groups and types:
2B/C1a: Assam Alluvial Plains Semi-Evergreen Forest
2B/C1b: Eastern Sub-montane Semi-evergreen forest
2B/C1/IS1: Sub-Himalayan light alluvial Semi-Evergreen Forests
2B/2S1: Secondary moist bamboo brakes
The details on forest types and forest cover in the catchment area were based on
field surveys in the area supplemented with the working plans of the forest
divisions of the study area. As per classification given by Champion and Seth
(1968), forest types of study area are discussed below:
I. Assam Alluvial Plains Semi-Evergreen Forest 2B/C1a
In the project study area and its surroundings up to 900m mainly Tropical semi-
evergreen forests are found. The dominant tree species in top storey are
Dipterocarpus gracilis, D. retusus, Castanopsis indica, Mesua ferrea and
Terminalia myriocarpa which are found in association with Altingia excelsa,
Artocarpus chaplasa, Duabanga grandiflora, Terminalia chebula, Pterospermum
acerifolium and Stereospermum chelonoides. The second and third storeys are
represented by small trees like Leea compactiflora, Rhus semialata, Chisocheton
paniculatus, Talauma hodgsonii and shrubs like Abroma augusta, Dendrocnide
sinuata, Costus speciosus and Maesa chisia. Amongst the climbers Smilax glabra,
Stephania glabra and Thunbergia grandiflora are prominent. The ground flora
includes herbs such as Hedyotis scandens, Urena lobata, Impatiens tripetala and
Tacca integrifolia and fern and fern-allies. In addition ferns like Cyathea spinulosa
and Angiopteris evecta are also found along the banks of perennial streams.

GMR Londa Hydro Power Pvt Ltd EIA of Talong Londa H.E. Project
R S Envirolink Technologies Pvt. Ltd. 4 3
The epiphytic flora consists mainly of orchids like Aerides multiflorum, Dendrobium
cathcartii, Cymbidium ensifolium, Celogyne corymbosa, Eria pumila, and
Pholidota imblicata. Among terrestrial orchids Calanthe masuca, Goodyera
procera, Habenaria acuminata and Phaius flavus are found. Canes are
represented by Calamus erectus and C. leptospadix.
II. Eastern Sub-montane Semi-evergreen forest (2B/C1b)
This forest type is found in the sub-Himalayan tract and the lower slopes of the
hills with a predominance of evergreen species in the top canopy and is found
between 700 and 1000m elevations. Major species which constitute the top
canopy are Ailanthus integrifolia, Castanopsis indica, Duabanga grandiflora,
Dysoxylum binectiferum, Schima wallichii, Stereospermum tetragonum,
Tetrameles nudiflora and Toona microcarpa. Second storey is mainly evergreen
and represented by Bauhinia purpurea, Elaeocarpus floribundus, Gynocardia
odorata, Mallotus roxburghii, Oroxylum indicum, and Spondias pinnata. The
shrubs are represented by Boehmeria macrophylla, Brassiopsis mitis, Costus
speciosus, Dendrocalamus hamiltonii, Leycesteria formosa, Padera formosa and
Randia wallichii. Climbers and epiphytes are few. Species of Cissus repanda,
Cuscuta reflexa, Derris scandens, Dioscorea alata, Raphidophora decursiva,
Rubia cordifolia and Smilax glabra are important climbers. The herbs and grasses
are represented by Achyranthes aspera, Bidens bipinnata, Commelina
benghalensis, Cyrtococcum accrescens, Digitaria ciliaris, Hedychium coccineum,
Oplismenus compositus, Pogonatherum paniceum, Saccharum spontaneum and
Thysanolaena latifolia.
III. Sub-Himalayan light alluvial Semi-Evergreen Forests (2B/C1/IS1)
This forest sub type is generally found in parts of areas covered by this working
scheme. Evergreen species are dominant though deciduous species are also
present in significant proportion and the forest is a mixture of both species.
Haldisopa (Adina oligocephala), Jamuk (Syzygium cuminii), Nahar (Mesua
ferreaa), Banderdima (Dysoxyum procerum), Sam (Artocarpus chaplasha),
Pachola (Kydia glabrescens), Moj (Albizia lucida), Sia Nahar (Kayea assamica),
Seileng (Sapium baccatum) is prominent and consists of mixture of evergreen and
deciduous species with abundant shrubby undergrowth. Floristic composition of
this forest are Hollock (Terminalia myriocarpa), Jutuli (Altingia excels), Bonsum
(Phoebe goalparsensis), Sopa (Magnolia species), Hingori (Castanopsis indica),
Dhuna (Canarium strictum=Syn C. reisinferum), Poma (Toona ciliate=syn Cedrela
Toona), Mekahai (Phoebe cooperiana), Amari (Amoora wallichii), Behera
(Terminalia bellirica), Khonkan (Duabang gradiflora), Bual (Ehrita acuminate),

GMR Londa Hydro Power Pvt Ltd EIA of Talong Londa H.E. Project
R S Envirolink Technologies Pvt. Ltd. 4 4
Boromthuri (Talauma hodgsonii), Gahari sopa (Magnolia griffithii), Bon Am
(Mangifera sylvatica), Surat (Loportea cremulata) etc. Gound flora are Hati
bhekuri (Solanum subtruncatum), Banposila (Sarauia punduana), Kaupat
(Phrynium imlbricatum), Torn (Alpina alluthas), Bhat (Clerodendrum viscosum),
Kolgoch (Musa species), Bogitora (Alpinia molluccensis). Bamboos are Kako bans
(Dendrocalamus hamiltonii) and Bojal bans (Pseudostachyum polymorphum).
Canes are Lejai bet (Calamus floribundus) and Raidang bet (Calamus flagellum).
Palms are Toko palm (Livistona jenkinsiana) and Jeng (Calamus erectus).
Climbers are Ghila lata (Entada scabdens), Pani lath (Vitis planicaulis), Kuchai
(Acacia pennata), Gowlia lath (Vitis latifolia), Dimorulata (Ficus scandenc),
Hegumi lata (Tinospora cordifolia), Mermeri lath (Gnetum scandens), etc.
IV. Secondary moist bamboo brakes (2B/2S1)
Secondary moist bamboo brakes occur in scattered patches throughout the area.
At places where bamboo patches are found, the clumps are thick and there is no
possibility of regeneration of any tree species in these bamboo patches.
Commonly distributed bamboo species are Dendrocalamus hamiltonii, Bambusa
pallida and Pseudostrachyum polymorphum. The undergrowth in these forests
mostly consists of Phrynium imbricatum, Clerodendron infortunatum, and
Clerodendrum viscosum. The bamboo species found in the forests are
Dendrocalamus hookerii, Bambusa tulda and Chimonobambusa callosa.
4.2.2 FOREST IN THE PROJECT AREA
The submergence area is about 350 ha at Full Reservoir Level (FRL) 488 msl and
extends up to a length of about 12.8 km upstream of the proposed dam site. The
vegetation is highly degraded on left bank as a result of human activities like jhum
cultivation, conversion of valley areas into permanent agricultural fields, grazing,
collection of fuel-wood and fodder by the local inhabitants, etc. However, right
bank is less affected/ disturbed as compared to left bank.
The entire study area as well as the catchment areas are either under dense
forest or open forest. However, the area around the project component is largely
affected by shifting cultivation.
Under each forest type, along the narrow river valleys, there exist small patches of
riverine forests observed. The remnant forests are largely of secondary
successional type. These forests including the shifting cultivation fallows of
different ages are dominated by the species of Macaranga, Bridelia and

GMR Londa Hydro Power Pvt Ltd EIA of Talong Londa H.E. Project
R S Envirolink Technologies Pvt. Ltd. 4 5
Callicarpa. They are seen scattered along with tall grasses or banana or a
combination of both. Depending on the age of the fallow, trees like Macaranga
form pure patches with comparatively less undergrowth. In this area, along the
river valley, a few large trees are seen scattered. The important trees are: Ficus
spp., Syzygium spp., Ailanthus grandis, Canarium strictus, Terminalia myriocarpa,
Ulmus lanceifolia, etc. A few large trees are also found plastered with epiphytes of
orchids, ferns and mosses. This is more prominent in moist and shady areas. The
orchids observed in the area include, Vanda, Dendrobium, Coelogyne, Eria, etc.
Lycopodium selago, Asplenium nidus and Microsorum are a few epiphytic ferns
found in the project area. The shrub layer is rich. Micromelum, Phlogacanthus,
Maesa, Ficus squamata are prominent.
Ulmus, Lycopodium, Vanda, Rhynchostylis, Hoya, Pteris and Angiopteris are the
species important from conservation point of view. Some of the culturally
important species and useful plants for the community are: Phrynium pubinerve,
Syzygium wallichii, Livistona, Phlogacanthus, Cordia, etc. The area has some
fodder species like Villebrunea, Bauhinia, Pouzolzia, Sarcochlamys, etc. Urtica
dioica, Laportea crenulata are poisonous and cause itching on contact. Aesculus
assamica and Millettia pachycarpa are pisicidal. The common wild leafy vegetable
include, Diplazium esculentum, Polygonum capitatum, Spilanthus paniculata,
Crassocephalum crepidioides, Sarchochlamys pulcherrima, Chenopodium album,
Clerodendrum colebrookianum, Pouzolzia bennetiana and Dendrocalamus
hamiltonii (Tender shoots).
4.2.3 FIELD STUDIES
The study area lies in East Kameng (Seppa) district of Arunachal Pradesh
extending from the dam site/power house site on Kameng River at Pachi/Londa
village including the tail end of the submergence up to Pakke village. The study
sites fall along the Chayang Tajo road of Seppa. The following sites were selected
for as a part of the vegetation survey:
i. Project area or the direct impact area within 10 km radius of the main project
components like barrage site, power house, etc. and also area within 10 km
upstream of reservoir tail.
ii. Upstream of proposed project area
iii. Intermediate catchment between barrage site and power house and the river
stretch downstream of barrage up to power house.
iv. Downstream of Power house

GMR Londa Hydro Power Pvt Ltd EIA of Talong Londa H.E. Project
R S Envirolink Technologies Pvt. Ltd. 4 6
The sampling location map is enclosed as Figure-2.1 of Chapter 2. Methopdology
for data collection was given in Chapter 2.
4.2.4 FINDINGS OF THE VEGETATION SURVEY
Areas to be affected by Talong Londa project, which are beyond Seppa along the
Chayang Tajo road, do not have any dense forest. The entire project areas as well
as the catchment areas are either open forests (< 40% canopy area) or non-forest
(<10% canopy cover) areas largely affected by shifting cultivation. The vegetation
in the study area may be broadly classified into two types: (i) tropical semi-
evergreen and (ii) subtropical forests. Under each forest type, along the narrow
river valleys, there exist small patches of riverine forests.
The remnant forests are largely of secondary successional type. These forests
including the shifting cultivation fallows of different ages are dominated by the
species of Macaranga, Bridelia and Callicarpa. They are seen scattered along
with tall grasses or banana or a combination of both. Depending on the age of the
fallow, trees like Macaranga form pure patches with comparatively little
undergrowth.
In this area, along the river valley, a few large trees are seen scattered. The
important trees are: Ficus spp., Ailanthus grandis, Canarium strictus, Terminalia
myriocarpa, Ulmus lanceifolia, etc. Ulmus is an interesting species that is seen
here. The tree is also found in Lohit district of Arunachal Pradesh outside this
location. A few large trees are also found covered with epiphytes like orchids,
ferns and mosses. This is more prominent in moist and shady areas. The orchids
include, Vanda, Dendrobium, Coelogyne, Eria, etc. Lycopodium selago,
Asplenium nidus and Microsorum are a few epiphytic ferns found in the project
area. Hoya lanceolata is an important Asclepiadaceae epiphyte.
The shrub layer is rich. Micromelum, Phlogacanthus, Maesa, Ficus squamata are
prominent.
4.2.4.1 FLORISTIC COMPOSITION
Total 228 plant species were recorded during floristic survey in the study area. A
list of plant species found in the study area representing Angiosperms,
Pteridophytes, Bryophytes, Fungi, Algae, and Lichen is given in Annexure-IV. The
names of the family are also given. The number of plant species belonging to
different groups is summarised in Table-4.2.

GMR Londa Hydro Power Pvt Ltd EIA of Talong Londa H.E. Project
R S Envirolink Technologies Pvt. Ltd. 4 7
Table 4.1: Number of Species Observed Group-wise Plant Group No. of species Angiosperms 185 Pteridophytes 19 Bryophytes 2 Fungi 8 Algae 7 Lichen 7 Total 228
Vegetation Characteristics
Callicarpa arborea and Macaranga denticulata were the dominant species
observed in the east bank forest at the Dam site. They are often scattered along
with tall grasses or banana or combination of both. Trees like Macaranga
denticulata, form pure patches with comparatively less undergrowth. In this area
along the river valley, a few large trees like Ficus, Syzygium, Ailanthus,
Terminalia, Ulmus, etc. are found to be scattered. In all about 52 tree species
were recorded in the project area. The tree density was not as high as compared
to other sub-tropical forest vegetation. Composite list of various floral species
observed at various sampling sites in the study area is given in Annex IV.
4.2.4.2 ECONOMICALLY IMPORTANT SPECIES
About 30 economically important plant species were recorded from the study
area. The names of economically important plants species found during the
survey have been listed in Table 4.2.
Table 4.2: Economically Important Species found in the Study Area
Species Uses Ageratum conyzoides Medicinal Alangium begoniaefolium Fodder Artemisia nilagirica Medicine Bambusa sp. Construction Castanopsis tribuloides Timber, Fruits edible Chenopodium album Leafy vegetable Clerodendrum colebrookianum Leafy vegetable Colocasia sp. Leafy vegetable Crassocephalum crepidioides Leafy vegetable Cyathea spinulosa Fodder Dendrobium hamiltonii Tender shoots Drymaria cordata Medicinal Ficus cunia Fodder Ficus roxburghii Fodder, fruits edible Macaranga denticulata Fuel Mangifera sylvatica Medicinal/Edible Nephrolepis cordifolia Tuber edible

GMR Londa Hydro Power Pvt Ltd EIA of Talong Londa H.E. Project
R S Envirolink Technologies Pvt. Ltd. 4 8
Species Uses Oxalis corniculata Medicinal Polygonum molle Leafy vegetable Pouzolzia bennetiana Leafy vegetable Pteris biaurita Medicine Rhus javanica Fruits edible, medicine Rubus sp. Medicinal Rumex nepalensis Medicine Sarchochlamys pulcherrima Leafy vegetable Schima wallichii Fuel Solanum nigrum Fruit edible Solanum torvum Medicinal Spilanthus paniculata Leafy vegetable Syzygium wallichii Fruit edible Thysanolaena maxima Broom industry, fodder
The community characteristics of the vegetation at various sampling locations at
different sites in the Study Area of Talong Londa Project for winter, summer and
monsoon seasons are given in Tables-4.3 to 4.5 respectively.
Table 4.3: Community Characteristic of the Vegetation (Winter)
V1. Dam Site
Species Frequency %
Density (No./ha)
Basal Area (m2/ha)
IVI
Trees Altingia excelsa 30 70 0.89 47.77 Bischofia javanica 20 30 0.29 22.01 Bombax ceiba 10 10 0.51 16.58 Callicarpa arborea 10 20 0.20 13.28 Dalbergia rimosa 10 20 0.25 14.22 Ficus cunia 20 40 0.29 24.51 Grewia disporum 10 10 0.05 7.98 Horsfieldia amygdalina 30 40 0.64 35.60 Macaranga denticulata 40 110 0.79 60.45 Oroxylum indicum 10 10 0.16 10.04 Pterospermum acerifolium 10 10 0.64 19.01 Rhus javanica 10 10 0.07 8.35 Ulmus lanceifolia 10 20 0.57 20.20 Total 400 5.35 Shrubs Ficus silhentensis 10 20 8.63 Maesa ramentacea 20 30 - 15.73 Polygonum molle 20 80 - 23.42 Raphidophora decursiva 10 40 - 11.71 Rubus rugosus 20 80 - 23.42 Saccharum spontaneum 10 50 - 13.25 Schefflera wallichii 20 80 - 23.42 Solanum khasianum 10 120 - 24.02 Solanum torvum 30 60 - 25.90 Travesia palmata 10 40 - 11.71

GMR Londa Hydro Power Pvt Ltd EIA of Talong Londa H.E. Project
R S Envirolink Technologies Pvt. Ltd. 4 9
Species Frequency %
Density (No./ha)
Basal Area (m2/ha)
IVI
Urtica dioica 20 50 - 18.80 Total 650 Herbs Asplenium nidus 10 1000 - 2.56 Bidens pilosa 50 20000 - 19.90 Cardamine hirsute 10 1000 - 2.56 Cynoglossum furcatum 20 2000 - 5.11 Embelia sp. 20 3000 - 5.59 Equisetum debile 10 1000 - 2.56 Galinsoga parviflora 30 40000 - 25.21 Hedychium spicatum 10 1000 - 2.56 Impatiens chinensis 10 2000 - 3.03 Lycopodium selago 10 2000 - 3.03 Nephrolepis cordifolia 30 4000 - 8.15 Plantago ovata 20 4000 - 6.06 Pteris biaurita 30 10000 - 10.99 Selaginella kraussiana 10 2000 - 3.03 Coelogyne sp. 10 1000 - 2.56 Colocassia esculenta 20 3000 - 5.59 Dendrobium bicameratum 10 1000 - 2.56 Drymaria cordata 10 1000 - 2.56 Eria stricta 10 1000 - 2.56 Eupatorium odoratum 30 8000 - 10.04 Hoya lanceolata 10 1000 - 2.56 Cassia occidentalis 20 3000 - 5.59 Mikania micrantha 30 6000 - 9.09 Paspalum scobiulaluin 30 90000 - 48.90 Rivia ornate 20 2000 - 5.11 Sabia lanceifolia 10 1000 - 2.56 Total 211000
V2. Catchment Area
Species Frequency %
Density (No./ha)
Basal Area (m2/ha) IVI
Trees Albizia lebbeck 20 20 0.48 21.14 Bauhinia purpurea 10 10 0.20 9.98 Bischofia javanica 10 10 0.64 16.47 Bombax ceiba 10 10 0.51 14.55 Callicarpa arborea 10 10 0.13 8.95 Citrus aurantium 20 40 0.20 23.07 Cordia dichotoma 10 10 0.13 8.95 Croton sp. 10 10 0.13 8.95 Erythrina stricta 10 10 0.16 9.39 Ficus cunia 20 20 0.10 15.54 Ficus roxburghii 20 20 0.14 16.13 Litsea monopetala 20 20 0.25 17.75 Macaranga deticulata 20 80 1.29 51.27 Oroxylum indicum 10 10 0.13 8.95 Pterospermum acerifolium 10 10 0.96 21.19

GMR Londa Hydro Power Pvt Ltd EIA of Talong Londa H.E. Project
R S Envirolink Technologies Pvt. Ltd. 4 10
Species Frequency %
Density (No./ha)
Basal Area (m2/ha) IVI
Spondias pinnata 10 10 0.24 10.57 Terminalia myriocarpa 10 10 0.51 14.55 Ulmus lanceifolia 10 10 0.51 14.55 Rhus javanica 10 10 0.07 8.06 Total 330 6.78 Shrubs Artimesia nilagirica 30 60 - 21.52 Indigofera dosua 10 20 - 7.17 Maesa ramentacea 20 40 - 14.35 Milletia pachycarpa 10 20 - 7.17 Osbeckia nepalensis 20 60 - 17.52 Pegia nitida 10 30 - 8.76 Polygonum molle 20 100 - 23.87 Raphidophora decursiva 10 20 - 7.17 Rubus mollucanus 30 80 - 24.70 Saccharum spontaneum 10 30 - 8.76 Schefflera wallichii 10 10 - 5.59 Solanum khasianum 10 10 - 5.59 Solanum torvum 20 40 - 14.35 Thysanolaena maxima 10 20 - 7.17 Trevesia palmata 10 20 - 7.17 Urtica dioica 20 70 - 19.11 Total 630 Herbs Anaphalis triplinervis 10 2000 - 3.41 Angiopteris sp. 10 1000 - 2.93 Bidens pilosa 20 15000 - 12.20 Cardamine hirsuta 10 2000 - 3.41 Centella asiatica 20 4000 - 6.83 Coelogyne sp. 10 1000 - 2.93 Colocasia sp. 10 2000 - 3.41 Cassia occidentalis 10 2000 - 3.41 Dioscorea bulbifera 10 1000 - 2.93 Drymaria cordata 10 3000 - 3.90 Embelia sp. 10 3000 - 3.90 Equisetum debile 10 1000 - 2.93 Eupatorium odoratum 20 10000 - 9.76 Galinsoga parviflora 40 12000 - 15.61 Hedychium spicatum 10 2000 - 3.41 Hoya lanceolata 10 1000 - 2.93 Impatiens chinensis 20 3000 - 6.34 Lycopodium selago 20 20000 - 14.63 Mikania micrantha 10 1000 - 2.93 Nephrolepis cordifolia 20 4000 - 6.83 Paspalum scobiulaluin 10 91000 - 46.83 Plantago ovata 10 2000 - 3.41 Pteris biaurita 30 4000 - 9.27 Rivia ornate 20 4000 - 6.83 Sabia lancifolia 30 10000 - 12.20 Selaginella kraussiana 10 2000 - 3.41 Urtica parviflora 10 2000 - 3.41

GMR Londa Hydro Power Pvt Ltd EIA of Talong Londa H.E. Project
R S Envirolink Technologies Pvt. Ltd. 4 11
Species Frequency %
Density (No./ha)
Basal Area (m2/ha) IVI
Total 205000 V3. Submergence Area
Species Frequency %
Density (No./ha)
Basal area (m2/ha)
IVI
Trees Altingia excelsa 10 20 0.20 12.79 Castonopsis tribuloides 20 30 0.38 22.55 Dalbergia rimosa 20 20 0.78 28.08 Duabanga grandiflora 40 40 0.39 32.28 Eurya acuminata 20 30 0.38 22.55 Ficus lamponga 10 20 0.20 12.79 Heteropanax fragrans 20 20 0.10 14.20 Hovenia acerba 10 20 0.14 11.57 Lindera neesiana 20 20 0.10 14.20 Macaranga denticulata 20 30 0.48 24.59 Mallotus nepalensis 10 20 0.14 11.57 Ostodes paniculata 10 10 0.16 9.35 Rhus javanica 10 10 0.07 7.51 Schima wallichii 20 20 0.25 17.26 Sterospermum chelonoides 20 20 0.48 21.96 Trema orientalis 10 10 0.20 10.16 Vitis peduncularis 10 20 0.20 12.79 Wrightia arborea 10 20 0.25 13.81 Total 380 4.9 Shrubs Clerodendrum colebrookianum 10 50 - 11.04 Kydia glabrescens 20 40 - 13.63 Leea indica 10 40 - 9.63 Maesa chisia 10 30 - 8.23 Micromelum integerrimum 20 60 - 16.45 Millettia pachycarpa 20 70 - 17.86 Pegia nitida 10 30 - 8.23 Phyllanthus curviflora 10 20 - 6.82 Rumex nepalensis 30 90 - 24.68 Saurauia cerea 20 50 - 15.04 Solanum eriatum 30 80 - 23.27 Thysanolaena maxima 10 20 - 6.82 Trevesia palmata 10 60 - 12.45 Urena lobota 20 20 - 10.82 Total 710 Herbs Anaphalis triplinervis 20 4000 - 6.69 Asplenium nidus 10 1000 - 2.86 Bidens pilosa 20 15000 - 12.01 Cardamine hirsuta 10 2000 - 3.35 Centella asiatica 20 4000 - 6.69 Coelogyne sp. 10 1000 - 2.86 Colocasia esculanta 10 2000 - 3.35 Cynoglossum furcatum 10 2000 - 3.35

GMR Londa Hydro Power Pvt Ltd EIA of Talong Londa H.E. Project
R S Envirolink Technologies Pvt. Ltd. 4 12
Species Frequency %
Density (No./ha)
Basal area (m2/ha)
IVI
Dioscorea bulbifera 10 1000 - 2.86 Drymaria cordata 10 3000 - 3.83 Embelia sp. 10 3000 - 3.83 Equisetum debile 10 1000 - 2.86 Eupatorium odoratum 20 10000 - 9.59 Galinsoga parviflora 40 12000 - 15.32 Hedychium spicatum 10 2000 - 3.35 Hoya lancifolia 10 1000 - 2.86 Impatiens chinensis 20 3000 - 6.21 Lygodium flexuosum 20 20000 - 14.42 Mikania micrantha 10 1000 - 2.86 Nephrolepis cordifolia 20 4000 - 6.69 Paspalum scobiulaluin 10 91000 - 46.34 Plantago ovata 10 2000 - 3.35 Pouzolzia hirta 30 4000 - 9.08 Rivia ornate 20 4000 - 6.69 Sabia lancifolia 30 10000 - 11.97 Selaginella kraussiana 10 2000 - 3.35 Urtica parviflora 10 2000 - 3.35 Total 207000
V4. Subnergence area: Right abnk of Kameng River
Species Frequency
% Density (No./ha)
Basal area (m2/ha) IVI
Tree Albizia arunachalensis 30 50 22.37 48 Albizia lebbeck 40 40 8.50 32 Artocarpus lakoocha 10 20 4.82 8 Bauhinia purpurea 30 40 21.53 20 Dalbergia clarkei 10 10 3.65 6 Dillenia scabrella 10 20 10.90 9 Erythrina stricta 20 20 8.51 11 Ficus glomerata 20 30 2.58 20 Ficus semicordata 30 40 3.59 48 Kydia calycina 20 30 3.98 21 Pandanus furcatus 20 30 7.65 14 Phoebe lanceolata 10 10 1.28 5 Pterospermum acerifolium 20 20 7.07 12 Saurauia roxburghii 20 30 14.18 14 Sterculia kingii 10 10 1.96 5 Terminalia myriocarpa 30 40 14.25 27 Albizia arunachalensis 30 50 22.37 48 Shrub Acacia gageana 13 53 - 9 Cassia alata 13 53 - 9 Dendrocalamus strictus 13 53 - 27 Ficus fistulosa 13 53 - 9 Rubus ellipticus 13 53 - 9 Bambusa pallida 13 80 - 36 Calamus floribundus 13 80 - 11 Trevesia palmata 20 80 - 16

GMR Londa Hydro Power Pvt Ltd EIA of Talong Londa H.E. Project
R S Envirolink Technologies Pvt. Ltd. 4 13
Mimosa pudica 20 107 - 15 Musa acuminata 27 107 - 34 Strobilanthes paniculata 20 107 - 15 Saccharum spontaneum 20 133 - 17 Alpinia nigra 13 187 - 17 Melastoma normale 20 187 - 39 Oxyspora cernua 27 213 - 37 1547 Herbs Alocasia forniculata 10.00 1000 - 7 Achyranthes bidentata 5.00 1500 - 5 Begonia roxburghii 10.00 2000 - 9 Commelina cristata 10.00 2500 - 10 Oxalis debilis 15.00 2500 - 12 Costus speciosus 15.00 3000 - 27 Pilea umbrosa 10.00 3000 - 12 Osbeckia nutans 30.00 3500 - 30 Chenopodium ambrosioides 15.00 4000 - 16 Hedychium densiflorum 15.00 4500 - 46 Bidens pilosa 15.00 5000 - 21 Cyperus compactus 20.00 5000 - 20 Justicia procumbens 25.00 5000 - 23 Pteridium aquilinum 20.00 5500 - 37 Ageratum conyzoides 15.00 6000 - 25 54000
V5. Catchment: Upstream of Pachuk-Kameng Confluence
Species Frequency
% Density (No./ha)
Basal area
(m2/ha) IVI Trees Albizia arunachalensis 17 17 8.31 31 Dalbergia clarkei 17 17 5.22 15 Flacourtia jangomas 17 17 6.20 16 Macaranga denticulata 17 17 10.51 19 Artocarpus lakoocha 17 25 5.54 19 Dillenia scabrella 17 25 3.25 14 Lagerstroemia sp. 8 25 13.03 14 Pterospermum acerifolium 17 25 9.30 18 Cyathea spinulosa 25 33 14.35 18 Pandanus furcatus 25 33 6.58 17 Saurauia roxburghii 33 33 5.45 24 Bauhinia purpurea 33 42 18.64 23 Ficus semicordata 25 42 18.51 36 Terminalia myriocarpa 33 42 6.68 34 392 131.56 Shrub
Cassia alata 14 57 - 11 Dendrocalamus strictus 14 86 - 46 Mimosa pudica 14 86 - 13 Trevesia palmata 14 86 - 15

GMR Londa Hydro Power Pvt Ltd EIA of Talong Londa H.E. Project
R S Envirolink Technologies Pvt. Ltd. 4 14
Alpinia malaccensis 14 114 - 15 Bambusa pallida 29 114 - 68 Datura stramonium 21 114 - 19 Musa acuminata 21 114 - 25 Alpinia nigra 21 143 - 21 Saccharum spontaneum 14 171 - 19 Melastoma normale 29 343 - 47 1429 Herb Ageratum conyzoides 22 5556 - 33 Bidens pilosa 17 4444 - 25 Blumea aromatica 11 2222 - 13 Bulbostylis densa 11 3333 - 15 Chenopodium ambrosioides 22 4444 - 26 Dicranopteris linaris 11 4444 - 22 Hedychium gracile 22 2778 - 49 Pteridium aquilinum 17 6111 - 42 Scleria terrestris 17 2222 - 16 Solanum indicum 11 1667 - 11 Thysanolaena maxima 11 3333 - 24 Tridax procumbens 22 3889 - 24 44444
V6. Downstream of Proposed Power house area
Species Frequency
% Density (No./ha)
Basal area
(m2/ha) IVI Artocarpus lakoocha 7 7 12.89 14 Altingia excelsa 7 14 11.98 11 Trema orientalis 14 14 8.08 9 Xylosma controversum 7 14 7.87 7 Albizia arunachalensis 14 21 21.29 18 Dalbergia ssissoo 14 21 15.81 19 Erythrina variegata 14 21 9.46 15 Pterospermum acerifolium 14 21 9.98 15 Wrightia arborea 14 21 8.79 11 Castanopsis indica 14 29 17.59 20 Duabanga grandiflora 21 29 14.38 20 Macaranga denticulata 21 29 24.87 25 Pandanus furcatus 21 29 12.99 16 Ficus semicordata 21 36 23.80 32 Terminalia myriocarpa 29 36 16.29 28 Vitis peduncularis 21 36 11.14 19 Saurauia roxburghii 21 43 21.33 22 421 248.56 Shrub Abroma angusta 13 80 - 13

GMR Londa Hydro Power Pvt Ltd EIA of Talong Londa H.E. Project
R S Envirolink Technologies Pvt. Ltd. 4 15
Acacia gageana 13 53 - 12 Alpinia nigra 27 240 - 32 Bambusa pallida 7 27 - 13 Cassia alata 20 80 - 17 Clerodendron colebrookianum 27 133 - 24 Dendrocalamus strictus 13 53 - 59 Melastoma normale 27 160 - 28 Miliusa globosa 20 107 - 18 Musa acuminata 27 107 - 39 Oxyspora cernua 20 213 - 30 Saccharum spontaneum 13 107 - 15 1360 Herb Adiantum philippense 5 1364 - 6 Celosai argentea 9 1364 - 10 Rungia parviflora 9 1364 - 8 Hedychium densiflorum 5 1818 - 8 Carex cruciata 14 2273 - 13 Osbeckia nutans 18 2273 - 19 Begonia roxburghii 14 2727 - 15 Thysanolaena maxima 14 2727 - 35 Achyranthes bidentata 14 3636 - 18 Chirita oblongifolia 18 3636 - 19 Persicaria chinensis 14 3636 - 18 Bidens pilosa 18 4091 - 21 Costus speciosus 18 4545 - 63 Justicia procumbens 18 5455 - 24 Selaginella indica 14 6364 - 22 47273
Table 4.4: Community Characteristic of the Vegetation (Summer)
V1. Dam Site/Power House Site Species Frequency
% Density (No./ha)
Basal area (m2/ha)
IVI
Trees Altingia excelsa 30 70 0.89 47.76 Bischofia javanica 20 30 0.29 22.05 Bombax ceiba 10 10 0.51 16.54 Callicarpa arborea 10 20 0.20 13.18 Dalbergia rimosa 10 20 0.25 14.29 Ficus cunia 20 40 0.29 24.43 Grewia disporum 10 10 0.05 7.97 Horsfieldia amygdalina 30 40 0.64 35.66 Macaranga denticulata 40 110 0.79 60.38 Oroxylum indicum 10 10 0.16 10.05 Pterospermum acerifolium 10 10 0.64 19.07 Rhus javanica 10 10 0.07 8.38

GMR Londa Hydro Power Pvt Ltd EIA of Talong Londa H.E. Project
R S Envirolink Technologies Pvt. Ltd. 4 16
Species Frequency %
Density (No./ha)
Basal area (m2/ha)
IVI
Ulmus lanceifolia 10 20 0.57 20.23 Total 400 5.35 Shrubs Ficus silhentensis 10 20 8.63 Maesa ramentacea 20 30 - 15.73 Polygonum molle 20 80 - 23.42 Rhaphidophora decursiva 10 40 - 11.71 Rubus rugosus 20 80 - 23.42 Saccharum spontaneum 10 50 - 13.25 Schefflera wallichii 20 80 - 23.42 Solanum khasianum 10 120 - 24.02 Solanum torvum 30 60 - 25.90 Travesia palmata 10 40 - 11.71 Urtica dioica 20 50 - 18.80 Total 650 Herbs Asplenium nidus 50 9000 9.14 Bidens pilosa 40 16000 10.06 Cardamine hirsuta 30 35000 14.73 Cassia occidentalis 20 3000 3.47 Coelogyne sp. 30 3000 4.73 Colocassia esculenta 30 6000 5.67 Cynoglossum furcatum 20 4000 3.78 Dendrobium bicameratum 30 3000 4.73 Drymaria cordata 30 26000 11.92 Embelia sp. 20 2000 3.16 Equisetum debile 30 18000 9.42 Eria stricta 30 6000 5.67 Eupatorium odoratum 20 8000 5.03 Galinsoga parviflora 20 20000 8.78 Hedychium spicatum 20 2000 3.16 Hoya lanceolata 20 3000 3.47 Impatiens chinensis 40 13000 9.13 Lycopodium selago 30 29000 12.86 Mikania micrantha 30 4000 5.05 Nephrolepis cordifolia 30 12000 7.55 Paspalum scobiulaluin 40 28000 13.81 Plantago ovata 30 12000 7.55 Pteris biaurita 30 9000 6.61 Rivia ornata 20 2000 3.16 Sabia lancifolia 20 2000 3.16 Selaginella kraussiana 40 35000 16.00 Viola repens 40 10000 8.19 Total 320000
V2. Catchment Area
Species Frequency %
Density (No./ha)
Basal area (m2/ha)
IVI
Trees Albizia lebbeck 20 20 0.48 21.16

GMR Londa Hydro Power Pvt Ltd EIA of Talong Londa H.E. Project
R S Envirolink Technologies Pvt. Ltd. 4 17
Species Frequency %
Density (No./ha)
Basal area (m2/ha)
IVI
Bauhinia purpurea 10 10 0.20 9.96 Bischofia javanica 10 10 0.64 16.53 Bombax ceiba 10 10 0.51 14.54 Callicarpa arborea 10 10 0.13 8.91 Citrus aurantium 20 40 0.20 23.05 Cordia dichotoma 10 10 0.13 8.91 Croton sp. 10 10 0.13 8.91 Erythrina stricta 10 10 0.16 9.41 Ficus cunia 20 20 0.10 15.53 Ficus roxburghii 20 20 0.14 16.17 Litsea monopetala 20 20 0.25 17.81 Macaranga deticulata 20 80 1.29 51.25 Oroxylum indicum 10 10 0.13 8.91 Pterospermum acerifolium 10 10 0.96 21.22 Spondias pinnata 10 10 0.24 10.58 Terminalia myriocarpa 10 10 0.51 14.54 Ulmus lanceifolia 10 10 0.51 14.54 Rhus javanica 10 10 0.07 8.09 Total 330 6.78 Shrubs Artimesia nilagirica 30 60 - 23.41 Indigofera dosua 10 20 - 15.61 Maesa ramentacea 20 40 - 7.80 Milletia pachycarpa 10 20 - 27.05 Osbeckia nepalensis 20 60 - 9.62 Pegia nitida 10 30 - 9.62 Polygonum molle 20 100 - 5.98 Rhaphidophora decursiva 10 20 - 5.98 Rubus mollucanus 30 80 - 15.61 Saccharum spontaneum 10 30 - 7.80 Schefflera wallichii 10 10 - 21.06 Solanum khasianum 10 10 - 7.80 Solanum torvum 20 40 - 7.80 Thysanolaena maxima 10 20 - 19.24 Trevesia palmata 10 20 - 7.80 Urtica dioica 20 70 - 7.80 Total 630 Herbs Anaphalis triplinervis 60 14000 7.34 Angiopteris sp. 60 20000 8.48 Bidens pilosa 40 33000 9.38 Blumea sp. 50 12000 6.18 Cardamine hirsuta 40 32000 9.19 Cassia occidentalis 40 4000 3.88 Centella asiatica 40 25000 7.86 Coelogyne sp. 40 4000 3.88 Colocasia sp. 40 4000 3.88 Dioscorea bulbifera 50 5000 4.85 Drymaria cordata 40 36000 9.94 Embelia sp. 50 5000 4.85 Equisetum debile 40 22000 7.29

GMR Londa Hydro Power Pvt Ltd EIA of Talong Londa H.E. Project
R S Envirolink Technologies Pvt. Ltd. 4 18
Species Frequency %
Density (No./ha)
Basal area (m2/ha)
IVI
Eupatorium odoratum 40 16000 6.16 Galinsoga parviflora 40 38000 10.32 Hedychium spicatum 20 2000 1.94 Hoya lanceolata 40 5000 4.07 Impatiens chinensis 40 19000 6.72 Lycopodium selago 50 41000 11.67 Mikania micrantha 40 5000 4.07 Nephrolepis cordifolia 40 13000 5.59 Paspalum scobiulaluin 50 36000 10.72 Piper beetuloides 40 5000 4.07 Plantago ovata 30 11000 4.43 Pteris biaurita 40 15000 5.97 Rivea ornata 20 3000 2.13 Sabia lancifolia 30 7000 3.67 Selaginella kraussiana 30 25000 7.08 Stephania sp. 20 2000 1.94 Urtica parviflora 40 12000 5.40 Viola repens 40 18000 6.53 Total 489000
V3 Submergence area
Species Frequency %
Density (No./ha)
Basal area (m2/ha)
IVI
Trees Altingia excelsa 10 20 0.20 12.68 Castanopsis tribuloides 20 30 0.38 22.57 Dalbergia rimosa 20 20 0.78 28.04 Duabanga grandiflora 40 40 0.39 32.26 Eurya acuminata 20 30 0.38 22.57 Ficus lamponga 10 20 0.20 12.68 Heteropanax fragrans 20 20 0.10 14.19 Hovenia acerba 10 20 0.14 11.63 Lindera neesiana 20 20 0.10 14.19 Macaranga denticulata 20 30 0.48 24.64 Mallotus nepalensis 10 20 0.14 11.63 Ostodes paniculata 10 10 0.16 9.36 Rhus javanica 10 10 0.07 7.54 Schima wallichii 20 20 0.25 17.35 Sterospermum chelonoides 20 20 0.48 21.97 Trema orientalis 10 10 0.20 10.13 Vitis peduncularis 10 20 0.20 12.68 Wrightia arborea 10 20 0.25 13.90 Total 380 4.9 Shrubs Clerodendrum colebrookianum 10 50 - 16.45 Ficus silhetensis 10 40 - 6.82 Indigofera dosua 10 10 - 8.23 Kydia glabrescens 20 40 - 8.23 Leea indica 10 40 - 12.45

GMR Londa Hydro Power Pvt Ltd EIA of Talong Londa H.E. Project
R S Envirolink Technologies Pvt. Ltd. 4 19
Species Frequency %
Density (No./ha)
Basal area (m2/ha)
IVI
Maesa chisia 10 30 - 24.68 Micromelum integerrimum 20 60 - 10.82 Millettia pachycarpa 20 70 - 9.63 Pegia nitida 10 30 - 9.63 Phyllanthus curviflora 10 20 - 11.04 Rumex nepalensis 30 90 - 17.86 Saurauia cerea 20 50 - 6.82 Solanum eriatum 30 80 - 15.04 Thysanolaena maxima 10 20 - 23.27 Trevesia palmata 10 60 - 13.63 Urena lobota 20 20 - 5.41 Total 710 Herbs Anaphalis triplinervis 50 11000 - 7.73 Asplenium nidus 50 17000 - 9.33 Bidens pilosa 40 36000 - 13.42 Cardamine hirsuta 30 27000 - 10.07 Centella asiatica 40 28000 - 11.29 Coelogyne sp. 40 5000 - 5.18 Colocasia esculanta 30 4000 - 3.95 Cynoglossum furcatum 30 4000 - 3.95 Dioscorea bulbifera 40 5000 - 5.18 Drymaria cordata 30 28000 - 10.33 Embelia sp. 30 3000 - 3.68 Equisetum debile 30 15000 - 6.87 Eupatorium odoratum 30 12000 - 6.08 Galinsoga parviflora 20 26000 - 8.84 Hedychium spicatum 30 3000 - 3.68 Hoya lanceolata 30 4000 - 3.95 Impatiens chinensis 40 13000 - 7.30 Lygodium flexuosum 40 6000 - 5.44 Mikania micrantha 40 5000 - 5.18 Nephrolepis cordifolia 40 15000 - 7.84 Paspalum scobiulaluin 40 20000 - 9.17 Piper beetuloides 50 8000 - 6.94 Plantago ovata 30 11000 - 5.81 Pouzolzia hirta 30 12000 - 6.08 Rivea ornata 20 2000 - 2.45 Sabia lancifolia 40 8000 - 5.97 Selaginella kraussiana 30 22000 - 8.74 Stephania sp. 20 2000 - 2.45 Urtica parviflora 30 13000 - 6.34 Viola repens 40 11000 - 6.77 Total 376000

GMR Londa Hydro Power Pvt Ltd EIA of Talong Londa H.E. Project
R S Envirolink Technologies Pvt. Ltd. 4 20
V4 Subnergence area: Right abnk of Kameng River
Species Frequency %
Density (No./ha)
Basal area (m2/ha)
IVI
Trees Albizia arunachalensis 30 50 22.37 48 Albizia lebbeck 40 40 8.50 32 Artocarpus lakoocha 10 20 4.82 8 Bauhinia purpurea 30 40 21.53 20 Dalbergia clarkei 10 10 3.65 6 Dillenia scabrella 10 20 10.90 9 Erythrina stricta 20 20 8.51 11 Ficus glomerata 20 30 2.58 20 Ficus semicordata 30 40 3.59 48 Kydia calycina 20 30 3.98 21 Pandanus furcatus 20 30 7.65 14 Phoebe lanceolata 10 10 1.28 5 Pterospermum acerifolium 20 20 7.07 12 Saurauia roxburghii 20 30 14.18 14 Sterculia kingii 10 10 1.96 5 Terminalia myriocarpa 30 40 14.25 27 440 136.81 Shrub Acacia gageana 13 53 - 9 Cassia alata 13 53 - 9 Dendrocalamus strictus 13 53 - 27 Ficus fistulosa 13 53 - 9 Rubus ellipticus 13 53 - 9 Bambusa pallida 13 80 - 36 Calamus floribundus 13 80 - 11 Trevesia palmata 20 80 - 16 Mimosa pudica 20 107 - 15 Musa acuminata 27 107 - 34 Strobilanthes paniculata 20 107 - 15 Saccharum spontaneum 20 133 - 17 Alpinia nigra 13 187 - 17 Melastoma normale 20 187 - 39 Oxyspora cernua 27 213 - 37 1547 Herb Achyranthes bidentata 10 5500 - 25 Begonia roxburghii 10 4500 - 18 Commelina benghalensis 15 3500 - 20 Cynodon dactylon 5 2500 - 10 Cyperus cyperoides 15 3000 - 18 Equisetum diffusum 20 5000 - 31 Euphorbia hirta 15 3000 - 19 Onychium siliculosum 10 2500 - 13 Osbeckia nutans 10 5000 - 18 Oxalis corniculata 10 2000 - 12 Pouzolzia hirta 15 5000 - 24 Pteridium aquilinum 15 7000 - 43 Pteris vittata 15 5000 - 27 Sida acuta 10 4000 - 21 57500

GMR Londa Hydro Power Pvt Ltd EIA of Talong Londa H.E. Project
R S Envirolink Technologies Pvt. Ltd. 4 21
V5 Catchment: Upstream of Pachuk-Kameng Confluence
Species Frequency %
Density (No./ha)
Basal area (m2/ha) IVI
Trees
Albizia arunachalensis 17 17 8.31 31 Dalbergia clarkei 17 17 5.22 15 Flacourtia jangomas 17 17 6.20 16 Macaranga denticulata 17 17 10.51 19 Artocarpus lakoocha 17 25 5.54 19 Dillenia scabrella 17 25 3.25 14 Lagerstroemia sp. 8 25 13.03 14 Pterospermum acerifolium 17 25 9.30 18 Cyathea spinulosa 25 33 14.35 18 Pandanus furcatus 25 33 6.58 17 Saurauia roxburghii 33 33 5.45 24 Bauhinia purpurea 33 42 18.64 23 Ficus semicordata 25 42 18.51 36 Terminalia myriocarpa 33 42 6.68 34
392 131.56 Shrub Cassia alata 14 57 - 11 Dendrocalamus strictus 14 86 - 46 Mimosa pudica 14 86 - 13 Trevesia palmata 14 86 - 15 Alpinia malaccensis 14 114 - 15 Bambusa pallida 29 114 - 68 Datura stramonium 21 114 - 19 Musa acuminata 21 114 - 25 Alpinia nigra 21 143 - 21 Saccharum spontaneum 14 171 - 19 Melastoma normale 29 343 - 47
1429 Herb Hedychium gardnerianum 6 556 - 4 Alocasia forniculata 6 1667 - 6 Begonia roxburghii 6 2222 - 8 Cynodon dactylon 11 2222 - 11 Justicia procumbens 11 2222 - 11 Oxalis debilis 11 2222 - 11 Osbeckia nutans 11 2778 - 12 Oxalis corniculata 11 2778 - 14 Euphorbia hirta 11 4444 - 58 Pilea umbrosa 22 5556 - 27 Ageratum conyzoides 11 6111 - 20 Bidens pilosa 22 6111 - 27 Chenopodium ambrosioides 17 6667 - 23 Solanum indicum 17 6667 - 27 Achyranthes bidentata 22 9444 - 40
61667

GMR Londa Hydro Power Pvt Ltd EIA of Talong Londa H.E. Project
R S Envirolink Technologies Pvt. Ltd. 4 22
F. Downstream of Proposed Power house area
Species Frequency
% Density (No./ha)
Basal area (m2/ha) IVI
Artocarpus lakoocha 7 7 12.89 14 Altingia excelsa 7 14 11.98 11 Trema orientalis 14 14 8.08 9 Xylosma controversum 7 14 7.87 7 Albizia arunachalensis 14 21 21.29 18 Dalbergia ssissoo 14 21 15.81 19 Erythrina variegata 14 21 9.46 15 Pterospermum acerifolium 14 21 9.98 15 Wrightia arborea 14 21 8.79 11 Castanopsis indica 14 29 17.59 20 Duabanga grandiflora 21 29 14.38 20 Macaranga denticulata 21 29 24.87 25 Pandanus furcatus 21 29 12.99 16 Ficus semicordata 21 36 23.80 32 Terminalia myriocarpa 29 36 16.29 28 Vitis peduncularis 21 36 11.14 19 Saurauia roxburghii 21 43 21.33 22 421 248.56 Shrub Abroma angusta 13 80 - 13 Acacia gageana 13 53 - 12 Alpinia nigra 27 240 - 32 Bambusa pallida 7 27 - 13 Cassia alata 20 80 - 17 Clerodendron colebrookianum 27 133 - 24 Dendrocalamus strictus 13 53 - 59 Melastoma normale 27 160 - 28 Miliusa globosa 20 107 - 18 Musa acuminata 27 107 - 39 Oxyspora cernua 20 213 - 30 Saccharum spontaneum 13 107 - 15 1360 Herb Achyranthes bidentata 19 4091 - 18 Ageratum conyzoides 20 5000 - 19 Begonia roxburghii 23 3182 - 21 Carex cruciata 21 2273 - 23 Colocasia affinis 19 2727 - 16 Costus speciosus 11 2778 - 12 Desmodium trifolium 36 4545 - 34 Galinsoga parviflora 21 2727 - 18 Hedychium densiflorum 15 2273 - 13 Oenothera acaulis 20 4545 - 19 Osbeckia nutans 14 1818 - 12 Osbeckia nutans 11 2222 - 11 Oxalis corniculata 24 4545 - 22 Pouzolzia hirta 28 6364 - 26 Rungia parviflora 22 4545 - 19 Thysanolaena maxima 18 3636 - 17 57273

GMR Londa Hydro Power Pvt Ltd EIA of Talong Londa H.E. Project
R S Envirolink Technologies Pvt. Ltd. 4 23
Table 4.5: Community Characteristic of the Vegetation (Monsoon Season) V1 Dam Site/Power House Site
Species Frequency %
Density (No./ha)
Basal area (m2/ha)
IVI
Trees Altingia excelsa 30 70 0.89 47.76 Bischofia javanica 20 30 0.29 22.05 Bombax ceiba 10 10 0.51 16.54 Callicarpa arborea 10 20 0.20 13.18 Dalbergia rimosa 10 20 0.25 14.29 Ficus cunia 20 40 0.29 24.43 Grewia disporum 10 10 0.05 7.97 Horsfieldia amygdalina 30 40 0.64 35.66 Macaranga denticulata 40 110 0.79 60.38 Oroxylum indicum 10 10 0.16 10.05 Pterospermum acerifolium 10 10 0.64 19.07 Rhus javanica 10 10 0.07 8.38 Ulmus lanceifolia 10 20 0.57 20.23 Total 400 5.35 Shrubs Ficus silhentensis 10 20 8.63 Maesa ramentacea 20 30 - 15.73 Polygonum molle 30 110 - 23.42 Rhaphidophora decursiva 10 40 - 11.71 Rubus rugosus 20 80 - 23.42 Saccharum spontaneum 10 50 - 13.25 Schefflera wallichii 20 80 - 23.42 Solanum khasianum 20 160 - 24.02 Solanum torvum 30 70 - 25.90 Travesia palmata 10 40 - 11.71 Urtica dioica 30 90 - 18.80 Total 770 Herbs Asplenium nidus 40 10000 9.14 Bidens pilosa 60 18000 10.06 Cardamine hirsuta 30 45000 14.73 Cassia occidentalis 30 6000 3.47 Coelogyne sp. 40 4500 4.73 Colocassia esculenta 40 7000 5.67 Cynoglossum furcatum 30 5000 3.78 Dendrobium bicameratum 40 3000 4.73 Drymaria cordata 30 24000 11.92 Embelia sp. 20 3000 3.16 Equisetum debile 20 12000 9.42 Eria stricta 30 9000 5.67 Eupatorium odoratum 20 8000 5.03 Galinsoga parviflora 40 28000 8.78 Hedychium spicatum 40 7000 3.16 Hoya lanceolata 30 4000 3.47 Impatiens chinensis 50 19000 9.13 Lycopodium selago 30 22000 12.86 Mikania micrantha 20 4000 5.05

GMR Londa Hydro Power Pvt Ltd EIA of Talong Londa H.E. Project
R S Envirolink Technologies Pvt. Ltd. 4 24
Species Frequency %
Density (No./ha)
Basal area (m2/ha)
IVI
Nephrolepis cordifolia 30 12000 7.55 Paspalum scobiulaluin 30 18000 13.81 Plantago ovata 30 13000 7.55 Pteris biaurita 40 13000 6.61 Rivia ornata 20 2000 3.16 Sabia lancifolia 20 2000 3.16 Selaginella kraussiana 40 25000 16.00 Viola repens 40 12000 8.19 Total 335500
V2 Catchment area
Species Frequency %
Density (No./ha)
Basal area (m2/ha)
IVI
Trees Albizia lebbeck 20 20 0.48 21.16 Bauhinia purpurea 10 10 0.20 9.96 Bischofia javanica 10 10 0.64 16.53 Bombax ceiba 10 10 0.51 14.54 Callicarpa arborea 10 10 0.13 8.91 Citrus aurantium 20 40 0.20 23.05 Cordia dichotoma 10 10 0.13 8.91 Croton sp. 10 10 0.13 8.91 Erythrina stricta 10 10 0.16 9.41 Ficus cunia 20 20 0.10 15.53 Ficus roxburghii 20 20 0.14 16.17 Litsea monopetala 20 20 0.25 17.81 Macaranga deticulata 20 80 1.29 51.25 Oroxylum indicum 10 10 0.13 8.91 Pterospermum acerifolium 10 10 0.96 21.22 Spondias pinnata 10 10 0.24 10.58 Terminalia myriocarpa 10 10 0.51 14.54 Ulmus lancifolius 10 10 0.51 14.54 Rhus javanica 10 10 0.07 8.09 Total 330 6.78 Shrubs Artimesia nilagirica 30 60 - 23.41 Indigofera dosua 10 20 - 15.61 Maesa ramentacea 20 40 - 7.80 Milletia pachycarpa 10 20 - 27.05 Osbeckia nepalensis 20 60 - 9.62 Pegia nitida 10 30 - 9.62 Polygonum molle 20 100 - 5.98 Rhaphidophora decursiva 10 20 - 5.98 Rubus mollucanus 30 80 - 15.61 Saccharum spontaneum 10 30 - 7.80 Schefflera wallichii 10 10 - 21.06 Solanum khasianum 10 10 - 7.80 Solanum torvum 20 40 - 7.80 Thysanolaena maxima 10 20 - 19.24 Trevesia palmata 10 20 - 7.80

GMR Londa Hydro Power Pvt Ltd EIA of Talong Londa H.E. Project
R S Envirolink Technologies Pvt. Ltd. 4 25
Species Frequency %
Density (No./ha)
Basal area (m2/ha)
IVI
Urtica dioica 20 70 - 7.80 Total 630 Herbs Anaphalis triplinervis 60 16000 7.34 Angiopteris sp. 60 22000 - 8.48
. 60 22000 8.48
Bidens pilosa 50 33000 9.38 Blumea sp. 60 12000 6.18 Cardamine hirsuta 40 32000 9.19 Cassia occidentalis 50 9000 3.88 Centella asiatica 40 25000 7.86 Coelogyne sp. 40 4000 3.88 Colocasia sp. 40 4000 3.88 Dioscorea bulbifera 50 5000 4.85 Drymaria cordata 40 36000 9.94 Embelia sp. 50 5000 4.85 Equisetum debile 30 12000 7.29 Eupatorium odoratum 40 16000 6.16 Galinsoga parviflora 50 38000 10.32 Hedychium spicatum 20 2000 1.94 Hoya lanceolata 40 5000 4.07 Impatiens chinensis 50 22000 6.72 Lycopodium selago 50 41000 11.67 Mikania micrantha 40 5000 4.07 Nephrolepis cordifolia 40 13000 5.59 Paspalum scobiulaluin 50 36000 10.72 Piper beetuloides 40 5000 4.07 Plantago ovata 30 11000 4.43 Pteris biaurita 40 15000 5.97 Rivea ornata 20 3000 2.13 Sabia lancifolia 30 9000 3.67 Selaginella kraussiana 30 25000 7.08 Stephania sp. 20 2000 1.94 Urtica parviflora 50 17000 5.40 Viola repens 40 18000 6.53 Total 498000
V3 Submergence Area: Right Bank
Species Frequency %
Density (No./ha)
Basal area (m2/ha) IVI
Trees Altingia excelsa 10 20 0.20 12.68 Castonopsis tribuloides 20 30 0.38 22.57 Dalbergia rimosa 20 20 0.78 28.04 Duabanga grandiflora 40 40 0.39 32.26 Eurya acuminata 20 30 0.38 22.57 Ficus lamponga 10 20 0.20 12.68 Heteropanax fragrans 20 20 0.10 14.19 Hovenia acerba 10 20 0.14 11.63 Lindera neesiana 20 20 0.10 14.19

GMR Londa Hydro Power Pvt Ltd EIA of Talong Londa H.E. Project
R S Envirolink Technologies Pvt. Ltd. 4 26
Species Frequency %
Density (No./ha)
Basal area (m2/ha) IVI
Macaranga denticulata 20 30 0.48 24.64 Mallotus nepalensis 10 20 0.14 11.63 Ostodes paniculata 10 10 0.16 9.36 Rhus javanica 10 10 0.07 7.54 Schima wallichii 20 20 0.25 17.35 Sterospermum chelonoides 20 20 0.48 21.97 Trema orientalis 10 10 0.20 10.13 Vitis peduncularis 10 20 0.20 12.68 Wrightia arborea 10 20 0.25 13.90 Total 380 4.9 Shrubs Clerodendrum colebrookianum 30 90 - 16.45 Ficus silhetensis 10 40 - 6.82 Indigofera dosua 20 20 - 8.23 Kydia glabrescens 20 40 - 8.23 Leea indica 10 40 - 12.45 Maesa chisia 10 30 - 24.68 Micromelum integerrimum 20 60 - 10.82 Millettia pachycarpa 20 70 - 9.63 Pegia nitida 10 30 - 9.63 Phyllanthus curviflora 10 20 - 11.04 Rumex nepalensis 30 100 - 17.86 Saurauia cerea 20 50 - 6.82 Solanum eriatum 30 80 - 15.04 Thysanolaena maxima 10 20 - 23.27 Trevesia palmata 10 60 - 13.63 Urena lobota 20 30 - 5.41 Total 780 Herbs Anaphalis triplinervis 50 12000 - 7.73 Asplenium nidus 50 18000 - 9.33 Bidens pilosa 40 36000 - 13.42 Cardamine hirsuta 30 27000 - 10.07 Centella asiatica 50 29000 - 11.29 Coelogyne sp. 40 7000 - 5.18 Colocasia esculanta 30 8000 - 3.95 Cynoglossum furcatum 30 4000 - 3.95 Dioscorea bulbifera 40 5000 - 5.18 Drymaria cordata 30 28000 - 10.33 Embelia sp. 30 3000 - 3.68 Equisetum debile 30 11000 - 6.87 Eupatorium odoratum 30 12000 - 6.08 Galinsoga parviflora 20 28000 - 8.84 Hedychium spicatum 40 8000 - 3.68 Hoya lanceolata 30 4000 - 3.95 Impatiens chinensis 40 18000 - 7.30 Lygodium flexuosum 40 6000 - 5.44 Mikania micrantha 40 5000 - 5.18 Nephrolepis cordifolia 40 15000 - 7.84 Paspalum scobiulaluin 40 20000 - 9.17 Piper beetuloides 50 8000 - 6.94

GMR Londa Hydro Power Pvt Ltd EIA of Talong Londa H.E. Project
R S Envirolink Technologies Pvt. Ltd. 4 27
Species Frequency %
Density (No./ha)
Basal area (m2/ha) IVI
Plantago ovata 30 11000 - 5.81 Pouzolzia hirta 30 12000 - 6.08 Rivea ornata 20 2000 - 2.45 Sabia lancifolia 40 8000 - 5.97 Selaginella kraussiana 30 22000 - 8.74 Stephania sp. 20 2000 - 2.45 Urtica parviflora 40 16000 - 6.34 Viola repens 40 11000 - 6.77 Total 396000
V4 Submergence area: Right bank of Kameng River
Species Frequency % Density (No./ha) Basal area (m2/ha) IVI Trees Albizia arunachalensis 30 50 22.37 48 Albizia lebbeck 40 40 8.50 32 Artocarpus lakoocha 10 20 4.82 8 Bauhinia purpurea 30 40 21.53 20 Dalbergia clarkei 10 10 3.65 6 Dillenia scabrella 10 20 10.90 9 Erythrina stricta 20 20 8.51 11 Ficus glomerata 20 30 2.58 20 Ficus semicordata 30 40 3.59 48 Kydia calycina 20 30 3.98 21 Pandanus furcatus 20 30 7.65 14 Phoebe lanceolata 10 10 1.28 5 Pterospermum acerifolium 20 20 7.07 12 Saurauia roxburghii 20 30 14.18 14 Sterculia kingii 10 10 1.96 5 Terminalia myriocarpa 30 40 14.25 27 440 136.81 Shrub Acacia gageana 13 53 - 9 Cassia alata 13 53 - 9 Dendrocalamus strictus 13 53 - 27 Ficus fistulosa 13 53 - 9 Rubus ellipticus 13 53 - 9 Bambusa pallida 13 80 - 36 Calamus floribundus 13 80 - 11 Trevesia palmata 20 80 - 16 Mimosa pudica 20 107 - 15 Musa acuminata 27 107 - 34 Strobilanthes paniculata 20 107 - 15 Saccharum spontaneum 20 133 - 17 Alpinia nigra 13 187 - 17 Melastoma normale 20 187 - 39 Oxyspora cernua 27 213 - 37 1547
Herb Sida acuta 8 1200 - 5 Equisetum diffusum 8 1600 - 6 Osbeckia nutans 4 1600 - 20 Commelina benghalensis 8 2000 - 7 Eleusine indica 8 2000 - 7

GMR Londa Hydro Power Pvt Ltd EIA of Talong Londa H.E. Project
R S Envirolink Technologies Pvt. Ltd. 4 28
Oenothera acaulis 8 2000 - 7 Phrynium pubinerve 4 2000 - 5 Pronephrium nudatum 8 2000 - 7 Paspalum longifolium 12 2800 - 12 Spilanthes paniculata 12 2800 - 9 Chromolaena odorata 8 3200 - 8 Floscopa scandens 8 3200 - 9 Oxalis corniculata 8 3200 - 9 Pouzolzia hirta 12 3200 - 12 Phyllanthus sp. 12 3600 - 14 Cyperus cyperoides 12 4000 - 14 Desmodium trifolium 16 4000 - 16 Onychium siliculosum 12 4000 - 16 Pteris vittata 24 4000 - 17 Ageratum conyzoides 16 4400 - 15 Galinsoga parviflora 16 4400 - 14 Euphorbia hirta 16 4800 - 15 Cynodon dactylon 16 5600 - 16 Bidens biternata 16 6000 - 20 Polygonum barbatum 12 6800 - 20 84400
E. Catchment: Upstream of Pachuk-Kameng Confluence
Species Frequency
% Density (No./ha)
Basal area (m2/ha) IVI
Trees Albizia arunachalensis 17 17 8.31 31 Dalbergia clarkei 17 17 5.22 15 Flacourtia jangomas 17 17 6.20 16 Macaranga denticulata 17 17 10.51 19 Artocarpus lakoocha 17 25 5.54 19 Dillenia scabrella 17 25 3.25 14 Lagerstroemia sp. 8 25 13.03 14 Pterospermum acerifolium 17 25 9.30 18 Cyathea spinulosa 25 33 14.35 18 Pandanus furcatus 25 33 6.58 17 Saurauia roxburghii 33 33 5.45 24 Bauhinia purpurea 33 42 18.64 23 Ficus semicordata 25 42 18.51 36 Terminalia myriocarpa 33 42 6.68 34 392 131.56 Shrub Cassia alata 14 57 - 11 Dendrocalamus strictus 14 86 - 46 Mimosa pudica 14 86 - 13 Trevesia palmata 14 86 - 15 Alpinia malaccensis 14 114 - 15 Bambusa pallida 29 114 - 68 Datura stramonium 21 114 - 19 Musa acuminata 21 114 - 25 Alpinia nigra 21 143 - 21 Saccharum spontaneum 14 171 - 19 Melastoma normale 29 343 - 47 1429

GMR Londa Hydro Power Pvt Ltd EIA of Talong Londa H.E. Project
R S Envirolink Technologies Pvt. Ltd. 4 29
Herb Liparis viridiflora 4 385 - 2 Commelina benghalensis 4 1154 - 4 Cyanotis vaga 4 1538 - 4 Desmodium laxiflorum 8 1538 - 6 Euphorbia hirta 8 1538 - 7 Loxostigma griffithii 8 1538 - 6 Osbeckia nutans 8 1538 - 15 Phrynium pubinerve 8 1538 - 7 Polygonum chinensis 8 1538 - 6 Sida acuta 8 1538 - 7 Desmodium trifolium 12 1923 - 9 Oenothera acaulis 8 1923 - 7 Paspalum longifolium 8 1923 - 8 Onychium siliculosum 8 2308 - 8 Hedychium gardnerianum 8 3077 - 35 Pronephrium nudatum 12 3077 - 12 Elastostema obtusum 12 3462 - 12 Forrestia mollissima 8 3846 - 14 Pilea umbrosa 15 3846 - 15 Centella asiatica 8 4231 - 12 Cynodon dactylon 15 4231 - 15 Cyperus cyperoides 12 4615 - 13 Polygonum barbatum 12 4615 - 15 Elatostema monandrum 15 5000 - 18 Bidens biternata 15 6538 - 23 Pteris vittata 12 6538 - 21 75000
F. Downstream of Proposed Power house area
Species Frequency
% Density (No./ha)
Basal area (m2/ha) IVI
Artocarpus lakoocha 7 7 12.89 14 Altingia excelsa 7 14 11.98 11 Trema orientalis 14 14 8.08 9 Xylosma controversum 7 14 7.87 7 Albizia arunachalensis 14 21 21.29 18 Dalbergia ssissoo 14 21 15.81 19 Erythrina variegata 14 21 9.46 15 Pterospermum acerifolium 14 21 9.98 15 Wrightia arborea 14 21 8.79 11 Castanopsis indica 14 29 17.59 20 Duabanga grandiflora 21 29 14.38 20 Macaranga denticulata 21 29 24.87 25 Pandanus furcatus 21 29 12.99 16 Ficus semicordata 21 36 23.80 32 Terminalia myriocarpa 29 36 16.29 28 Vitis peduncularis 21 36 11.14 19 Saurauia roxburghii 21 43 21.33 22 421 248.56 Shrub Abroma angusta 13 80 - 13 Acacia gageana 13 53 - 12 Alpinia nigra 27 240 - 32

GMR Londa Hydro Power Pvt Ltd EIA of Talong Londa H.E. Project
R S Envirolink Technologies Pvt. Ltd. 4 30
Bambusa pallida 7 27 - 13 Cassia alata 20 80 - 17 Clerodendron colebrookianum 27 133 - 24 Dendrocalamus strictus 13 53 - 59 Melastoma normale 27 160 - 28 Miliusa globosa 20 107 - 18 Musa acuminata 27 107 - 39 Oxyspora cernua 20 213 - 30 Saccharum spontaneum 13 107 - 15 1360 Herb Chromolaena odorata 8 1600 - 7 Colocasia affinis 8 1600 - 8 Paspalum longifolium 8 1600 - 7 Equisetum diffusum 4 2000 - 6 Onychium siliculosum 8 2000 - 8 Floscopa scandens 12 2400 - 10 Oenothera acaulis 12 2400 - 11 Sida acuta 8 2400 - 9 Eleusine indica 12 2800 - 12 Commelina benghalensis 12 3200 - 13 Pronephrium nudatum 8 3200 - 13 Desmodium trifolium 8 3600 - 11 Pteris vittata 12 3600 - 14 Bidens biternata 12 4000 - 14 Galinsoga parviflora 16 4000 - 19 Oxalis corniculata 8 4000 - 11 Phrynium pubinerve 12 4000 - 14 Pouzolzia hirta 12 4000 - 16 Cyperus cyperoides 8 4400 - 15 Spilanthes paniculata 16 4400 - 20 Ageratum conyzoides 16 4800 - 19 Cynodon dactylon 16 4800 - 19 Polygonum barbatum 12 5600 - 26 76400
The site upstream of proposed reservoir of Talong HEP is characterized by open
canopy tree layer. This area is dominated by Albizia arunachalensis, Terminalia
myriocarpa, Ficus semicordata, Bauhinia purpurea, Saurauia roxburghii,
Pandanus furcatus and Kydia calycina. However only Terminalia myriocarpa was
the most frequently found tree species.
Shrub layer is represented by 15 species at this location. Oxyspora cernua was
most dominant shrub species during in the sampling site. Other dominant shrub
species were Melastoma normale, Alpinia nigra, Saccharum spontaneum, Musa
acuminata, Mimosa pudica, Trevesia palmata, Calamus floribundus, Bambusa
pallida and Strobilanthes paniculata.
Herbaceous flora near powerhouse area is comprised of 39 species. At this site
Ageratum conyzoides, Achyranthes bidentata, Bidens pilosa, Bidens biternata,
Euphorbia hirta, Equisetum diffusum, Onychium siliculosum, Polygonum

GMR Londa Hydro Power Pvt Ltd EIA of Talong Londa H.E. Project
R S Envirolink Technologies Pvt. Ltd. 4 31
barbatum, Pteridium aquilinum, Pteris vittata, Desmodium triflorum and Euphorbia
hirta are the common herbs of this area.
At sampling located near the confluence of Pachuk river and Kameng River
Terminalia myriocarpa and Bauhinia purpurea are the most dominant. Ficus
semicordata, Saurauia roxburghii, Pandanus furcatus, Cyathea spinulosa,
Pterospermum acerifolium and Artocarpus lakoocha are the other prominent tree
species. Melastoma normale was the most dominated species associated with
Musa acuminata and Bambusa pallida. Eupatorium odoratum, Alpinia nigra,
Datura stramonium, Alpinia malaccensis, Trevesia palmata were the other
dominant species.
The herbaceous layer is comprised of 45 species in this area. Pteridium
aquilinum, Ageratum conyzoides and Dicranopteris linearis were the most
dominant during winter/post monsoon sampling, Achyranthes bidentata during
summer/pre-monsoon and Pteris vittata, Bidens biternata and Elatostema
monandrum during monsoon were most commonly found species. Other most
common species were Bidens pilosa, Pteridium aquilinum, Thysanolaena maxima,
Pilea umbrosa, Elatostema obtusum, Pilea umbrosa, Centella asiatica, and
Solanum indicum.
4.2.4.3 SPECIES DIVERSITY AND EVENNESS INDEX
To understand the species diversity Shannon Weiner Diversity was calculated
separately for trees, shrubs and herbs. Amongst the trees the species diversity
Index ranged from 2.23 to 2.83 and in shrubs from 2.27 to 2.64. The species
diversity in herbs was always higher during monsoon period (3.02 to 3.17), in
winter from 2.08 to 3.15 and in summer 2.53 to 3.15.
The evenness index in trees is in range of 0.87 to 0.98 and for shrubs 0.93 to
0.96. In herbs evenness index in winter season is in range of 0.64 to 0.97, in
summer 0.89 to 0.98 and in monsoon season it in range of 0.92 to 0.98 (Table-
4.6).
Table 4.6: Species Diversity Indices for Different Vegetation Components Vegetation component
Shannon Weaver Index (H) Pielous’s Evenness Index (E) Winter Summer Monsoon Winter Summer Monsoon
V1 Dam site/ Power House site
Trees 2.225 2.225 2.225 0.8676 0.8676 0.8676 Shrubs 2.223 2.292 2.278 0.9655 0.9559 0.9501 Herbs 2.078 2.942 3.019 0.6378 0.8927 0.9161
V2 Catchment area
Trees 2.656 2.656 2.656 0.9022 0.9022 0.9022 Shrubs 2.565 2.565 2.250 0.9253 0.9253 0.9383

GMR Londa Hydro Power Pvt Ltd EIA of Talong Londa H.E. Project
R S Envirolink Technologies Pvt. Ltd. 4 32
Herbs 3.146 3.146 3.163 0.9163 0.9163 0.9212
V3 Submergence area: Right Bank
Trees 2.830 2.830 2.830 0.9792 0.9792 0.9792 Shrubs 2.531 2.642 2.647 0.9591 0.9532 0.9550 Herbs 2.269 3.147 3.173 0.6884 0.9253 0.9330
V4 Submergence area: Left Bank
Trees 2.671 2.671 2.671 0.963 0.963 0.963 Shrubs 2.588 2.588 2.588 0.956 0.956 0.956 Herbs 2.616 2.583 3.131 0.966 0.978 0.972
V5 Catchment: Upstream of Pachuk-Kameng Confluence
Trees 2.584 2.584 2.584 0.979 0.979 0.979 Shrubs 2.270 2.270 2.270 0.947 0.947 0.947 Herbs 2.421 2.531 3.100 0.974 0.935 0.979
V6 Downstream of Proposed Power house area
Trees 2.760 2.760 2.760 0.974 0.974 0.974 Shrubs 2.339 2.339 2.339 0.941 0.941 0.941 Herbs 2.601 2.714 3.075 0.961 0.979 0.981
4.2.4.4 ENDEMIC SPECIES
Endemic texa are those species which restricted to a specified geographic area.
Three endemic species (Angiopteris evecta, Pteris biaurita, Dendrocalamus
hamiltonii) were observed in the project area, which are endemic to North East
India. These species are abundantly available in the catchment area. It would be
worth while to mention that during survey none of the above mentioned species
observed on the land to be acquired for the proposed project.
4.2.5 FAUNA
Jhum cultivation is common in the proposed project area and its surroundings. As
a result, vegetation of the area is degraded. The submergence area of the
proposed project is quite degraded. Thus, the project area and its surroundings do
not support large scale faunal population. The proposed submergence area is
neither potential site for wildlife sanctuary nor offer migration route to any major
animal species.
There is no national Park or sanctuary in the project area. Pakhui Wildlife
Sanctuary (now Pakke Tiger Reserve) is the nearest protected area, located
about 29 km downstream from the proposed dam site (see Figure below).

GMR Londa Hydro Power Pvt Ltd EIA of Talong Londa H.E. Project
R S Envirolink Technologies Pvt. Ltd. 4 33
Map Showing distance between proposed Dam site and Pakke Tiger Reserve
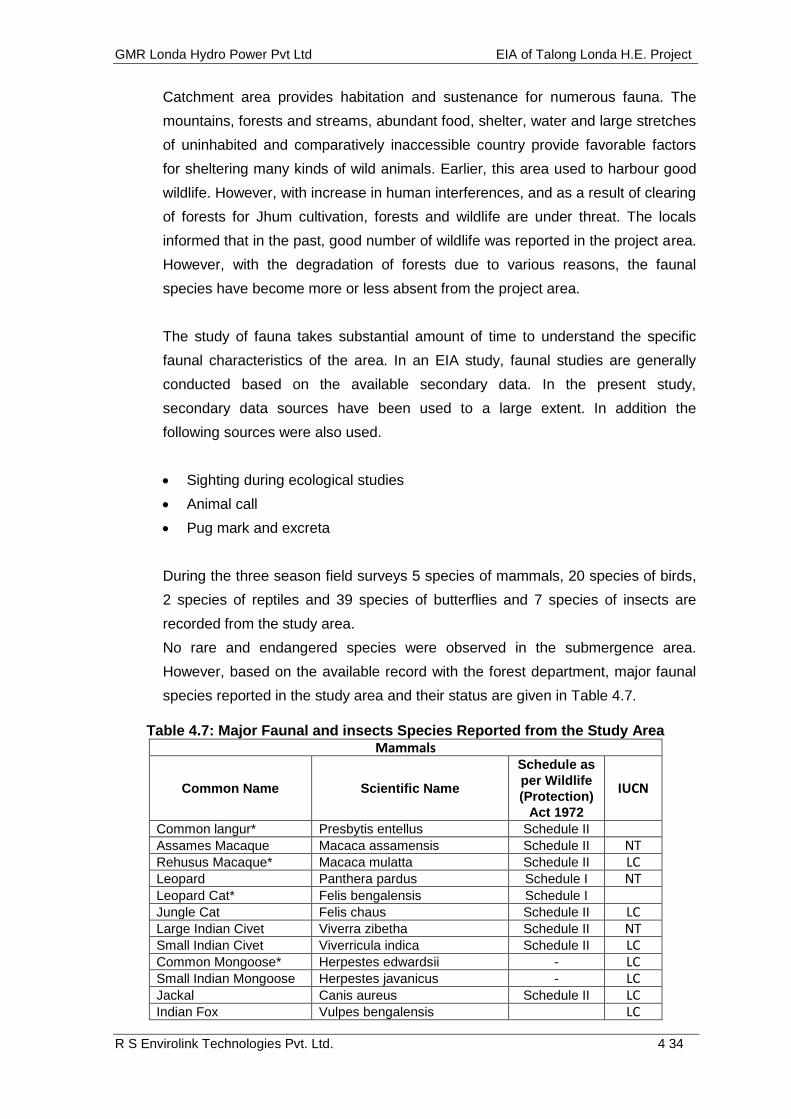
GMR Londa Hydro Power Pvt Ltd EIA of Talong Londa H.E. Project
R S Envirolink Technologies Pvt. Ltd. 4 34
Catchment area provides habitation and sustenance for numerous fauna. The
mountains, forests and streams, abundant food, shelter, water and large stretches
of uninhabited and comparatively inaccessible country provide favorable factors
for sheltering many kinds of wild animals. Earlier, this area used to harbour good
wildlife. However, with increase in human interferences, and as a result of clearing
of forests for Jhum cultivation, forests and wildlife are under threat. The locals
informed that in the past, good number of wildlife was reported in the project area.
However, with the degradation of forests due to various reasons, the faunal
species have become more or less absent from the project area.
The study of fauna takes substantial amount of time to understand the specific
faunal characteristics of the area. In an EIA study, faunal studies are generally
conducted based on the available secondary data. In the present study,
secondary data sources have been used to a large extent. In addition the
following sources were also used.
Sighting during ecological studies
Animal call
Pug mark and excreta
During the three season field surveys 5 species of mammals, 20 species of birds,
2 species of reptiles and 39 species of butterflies and 7 species of insects are
recorded from the study area.
No rare and endangered species were observed in the submergence area.
However, based on the available record with the forest department, major faunal
species reported in the study area and their status are given in Table 4.7.
Table 4.7: Major Faunal and insects Species Reported from the Study Area Mammals
Common Name Scientific Name
Schedule as per Wildlife (Protection)
Act 1972
IUCN
Common langur* Presbytis entellus Schedule II Assames Macaque Macaca assamensis Schedule II NT
Rehusus Macaque* Macaca mulatta Schedule II LC Leopard Panthera pardus Schedule I NT Leopard Cat* Felis bengalensis Schedule I
Jungle Cat Felis chaus Schedule II LC Large Indian Civet Viverra zibetha Schedule II NT Small Indian Civet Viverricula indica Schedule II LC Common Mongoose* Herpestes edwardsii - LC Small Indian Mongoose Herpestes javanicus - LC Jackal Canis aureus Schedule II LC Indian Fox Vulpes bengalensis
LC

GMR Londa Hydro Power Pvt Ltd EIA of Talong Londa H.E. Project
R S Envirolink Technologies Pvt. Ltd. 4 35
Himalayan Black Bear Selenarctos thibetanus Schedule II VU Common Otter Lutra lutra
NT
Particolored Flying Squirrel
Hylopetes alboniger
LC
Indian Porcupine Hystrix indica Schedule IV
Rufous Tailed Hare Lepus nigricollis ruficaudatus
LC Mithun* Bos fontanalis
Barking deer Muntiacus muntjak Schedule II LC Wild Boar Sus scrofa Schedule III LC
Note: *: Recorded during field investigation; IUCN: International Union for Conservation of Nature; LC: Least Concerned; VU: Vulnerable; NT: Near Threatened; EN: Endangered
AVI FAUNA
Familiy Common Name Scientific Name
Schedule as per
Wildlife (Protection)
Act 1972
IUCN
Accipitridae Black kite Milvus migrans
LC Accipitridae Crested goshawk Accipter trivirgatus
LC
Accipitridae Crested serpent eagle Spilornis cheela
LC Aegithalidae Black throated tit Aegithalos concinnus IV LC Aegithinidae Common iora Aegithina tiphia
LC
Alcedinidae Common kingfisher* Alcedo atthis IV LC Alcedinidae Pied kingfisher Ceryle rudis IV LC
Alcedinidae White throated kingfisher*
Halcyon smyrnensis IV LC
Anhingidae Darter / Snake bird Anhinga melanogaster
LC Apodidae Himalayan swiftlet* Collocalia brevirostris
LC
Campephagida Bar bellied cuckoo shrike
Coracina striata LC
Campephagidae Large wood shrike Tephrodornis gularis
LC Campephagidae Long tailed minivet Pericrocotus ethologus
LC
Caprimulgidae Grey nightjar Caprimulgus indicus
LC
Certhiidae Brown throated treecreeper
Certhia discolor LC
Charadriidae Little ringed plover Charadrius dubius
LC Charadriidae Red wattled lapwing Vaneiius indicus
LC
Chloropseidae Orange bellied leafbird Chloropsis hardwickii
LC Cinclidae Brown dipper Cinclus pallasii
LC
Cisticolidae Grey breasted prinia Prinia hodgsonii
LC Columbidae Emerald dove Chalcophaps indica IV LC Columbidae Green imperial pigeon Ducula badia IV LC Columbidae Oriental turtle dove* Streptopelia orientalis IV LC Columbidae Pin tailed green pigeon Treron apicauda IV LC
Columbidae Pompadour green pigeon
Treron pompadora IV LC
Columbidae Spotted dove * Streptopelia chinensis IV LC Coraciidae Indian roller* Coracias bengalensis
LC
Corvidae Green magpie Cissa chinensis IV LC Corvidae Grey treepie Dendrocitta formosae IV LC Corvidae Large billed crow* Corvus macrorhynchos IV LC Cuculidae Common hawk cuckoo Hierococcyx varius IV LC Cuculidae Green billed malkoha Phaenicophaeus tristis
LC
Cuculidae Lesser coucal Centropus bengalensis
LC Cuculidae Plaintive cuckoo Cacomantis merulinus
LC

GMR Londa Hydro Power Pvt Ltd EIA of Talong Londa H.E. Project
R S Envirolink Technologies Pvt. Ltd. 4 36
Dicruridae Black drongo* Dicrurus macrocercus IV LC Dicruridae Bronzed drongo* Dicrurus aeneus IV LC
Dicruridae Lesser racket tail drongo*
Dicrurus remifer IV LC
Estrildidae Scaly breasted munia Lonchura punctulata
LC Eurylaimidae Long tailed broadbill Psarisomus dalhousiae
LC
Falconidae Collared falconet
Microhierax caerulescens LC
Falconidae Oriental hobby Falco severus
LC Glareolidae Small pratincole Glareola lactea IV LC Laridae River tern Sterna aurantia
LC
Meropidae Green bee eater* Merops orientalis
LC Motacillidae Grey wagtail Motacilla cinerea
LC
Motacillidae White wagtail Motacilla alba
LC Muscicapidae Black capped forktail Enicurus immaculatus
LC
Muscicapidae Chestnut bellied rock thrush
Monticola rufiventris IV LC
Muscicapidae Grey bushchat Saxicola ferrea
LC Muscicapidae Hodgson’s redstart Phoenicurus hodgsoni
LC
Muscicapidae Large niltava Niltava grandis
LC Muscicapidae Little forktail Enicurus scouleri
LC
Muscicapidae Oriental magpie robin Copsychus saularis
LC Muscicapidae Pale chinned flycatcher Cyornis poliogenys IV LC
Muscicapidae Rufous gorgeted flycatcher
Ficedula strophiata IV LC
Muscicapidae Slaty backed forktail Enicurus schistaceus
LC
Muscicapidae White capped water redstart*
Chaimarrornis leucocephalus LC
Muscicapidae White crowned forktail Enicurus leschenaulti
LC Muscicapidae White rumped sama Copsychus malabaricus
LC
Nectariniidae Purple throated sunbird Nectarinia sperata IV LC Nectariniidae Streaked spiderhunter Arachnothera magna
LC
Oriolidae Black hooded oriole Oriolus xanthornus
LC Paridae Green backed tit Parus monticolus IV LC Paridae Sultan tit Melanochlora sultanea IV LC Passeridae House sparrow* Passer domesticus
LC
Passeridae Tree sparrow Passer montanus
LC Phalacrocoracidae Little cormorant* Phalacrocorax niger
LC
Phasianidae Grey peacock pheasant Polyplectron bicalcaratum
IV LC
Phasianidae Hill partridge Arborophila torqueola IV LC Phasianidae Kalij pheasant Lophura leucomelanos IV LC Phasianidae Red jungle fowl Gallus gallus IV LC
Picidae Fulvous breasted woodpecker
Dendrocopos atratus IV LC
Picidae Grey headed woodpecker*
Picus canus IV LC
Picidae Rufous woodpecker* Celeus brachyurus IV LC Picidae Speckled piculet Picumnus innominatus
LC
Pittidae Blue napped pitta Pitta nipalensis IV LC
Pycnonotidae Black bulbul Hypsipctes leucocephalus
IV LC
Pycnonotidae Red vented bulbul* Pycnonotus cafer IV LC Pycnonotidae Striated bulbul Pycnonotus striatus IV LC Pycnonotidae White throated bulbul Alophoixus flaveolus IV LC Ramphastidae Blue throated barbet Megalaima franklinii IV LC

GMR Londa Hydro Power Pvt Ltd EIA of Talong Londa H.E. Project
R S Envirolink Technologies Pvt. Ltd. 4 37
Ramphastidae Lineated barbet Megalaima lineata IV LC Rhipiduridae White throated fantail Rhipidura albicollis
LC
Sittidae Chestnut bellied nuthatch
Sitta castanea
LC
Strigidae Brown hawk owl Ninox scutulata IV LC Strigidae Collored scops owl Glaucidium brodiei
LC
Sturnidae Common myna* Acridotheres tristis IV LC Sturnidae Jungle myna Acridotheres fuscus IV LC Sylviidae Black faced warbler Abroscopus albogularis
LC
Sylviidae Greenish warbler
Phylloscopus trochiloides LC
Sylviidae Mountain tailor bird Orthotomus cuculatus
LC Timaliidae Black chinned yuhina Yuhina nigrimenta
LC
Timaliidae Greater necklace laughing thrush
Garrulax pectoralis IV LC
Timaliidae Grey sided laughing thrush
Garrulax caerulatus LC
Timaliidae Long tailed sibia Heterophasia picaoides
LC Timaliidae Red tailed minla Minla ignotincta
LC
Timaliidae Rufous fronted babbler Stachyris rufifrons IV LC
Timaliidae Rufous necked laughing thrush
Garrulax ruficolis IV LC
Timaliidae Rufous winged fulvetta Alcippe castaneceps
LC Timaliidae Silver eared mesia Leiothrix argentauris
LC
Timaliidae Slender billed scimitar babbler
Xiphirhynchus superciliaris
IV LC
Timaliidae Spotted wren babbler Spelaeornis formosus IV LC Timaliidae Straited yuhina Yuhina castaniceps
LC
Timaliidae White broad scimitar babbler
Pomatorhinus rufficolis IV LC
Timaliidae White crested laughing thrush
Garrulax leucolophus IV LC
Timaliidae White napped yuhina Yuhina bakeri
LC Timaliidae Abbott’s babbler Malacocincla abbotti IV LC Turdidae Blue whistling thrush* Myophonus caeruleus IV LC Turdidae Lesser shortwing Brachypteryx leucophrys
LC
Upupidae Common hoopoe* Upupa epops
LC Zosteropidae Oriental white eye* Zosterops palpebrosus
LC
Note: *: Recorded during field investigation; IUCN: International Union for Conservation of Nature;
REPTILES
Family Common Name Scientific Name
Schedule as per
Wildlife (Protection)
Act 1972
IUCN
Agamidae Oriental garden lizard* Calotes versicolor
Agamidae Green forest calotes Calotes jerdoni
Typhlopidae Common blind snake Ramphotyphlops brahminus Pythonidae Python* Python molurus Schedule I VU
Colubridae Copperhead snake Elaphae radiate
Colubridae
Black banded trinket snake
Elaphae porphyracea
Colubridae Indo Chinese rat snake Ptyas korros
Note: *: Recorded during field investigation; IUCN: International Union for Conservation of Nature; VU: Vulenrable

GMR Londa Hydro Power Pvt Ltd EIA of Talong Londa H.E. Project
R S Envirolink Technologies Pvt. Ltd. 4 38
Butterflies
Family/ Scientific Name Common Name Hesperiidae Burara harisa consobrina Orange Awlet Hasora vitta vitta Plain Banded Awl Papilionidae Graphium macareus Lesser Zebra Graphium sarpedon Common Bluebottle Papilio memnon Great Mormon Princeps alcmenor Redbreast Princeps paris paris Paris Peacock Pieridae Appias lyncida Chocolate Albatross Eurema bland silhetana Three Spot Grass Yellow Eurema hecabe Common Grass Yellow Pieris canidia Indian Cabbage White Pieris canidia canidia Cabbage White Lycaenidae Acytolepis puspa Common Hedge Blue Caleta elna Elbowed Pierrot Celastrina argiolus Hill Hedge Blue Pseudozizeeria maha Pale Grass Blue Riodinidae Zemeros flegyas Punchinello Nymphalidae Argynnis hyperbius Indian Fritillary Cirrochroa tyche mithila Common Yeoman Cyrestis thyodamas Common Map Danaus chrysippus Plain Tiger Danaus genutia Common Tiger Euploea mulciber mulciber Striped Blue Crow Euploea radamanthus Magpie Crow Hestina nama Circe Lethe verma Straight Banded Treebrown Mycalesis perseus Common Bushbrown Neptis hylas varmona Common Sailer Parantica sita Chestnut Tiger Parantica tityoides Chocolate Tiger Stibochiona nicea Popinjay Vanessa indica Indian Red Admiral Ypthima asterope maharatta Common Threering
Other Insects Amesia sanguiflua Moth Apoidea sp. Bee Ceriagrion fallax Damselfly Hierodula sp. Mantis Orthetrum glaucum Blue Marsh Hawk Trachyzulpha sp. Katydids Grasshopper

GMR Londa Hydro Power Pvt Ltd EIA of Talong Londa H.E. Project
R S Envirolink Technologies Pvt. Ltd. 4 39
4.2.5.1 THREATENED SPECIES
Out of the total faunal species recorded from the study area 2 species each are
under Schedule I and Schedule II of Wildlife (Protection) Act 1972 (Table 4.8). It
would also be worthwhile to mention that during the field survey none of the above
mentioned threatened species were observed from the submergence area.
Table 4.8: Threatened Species Reported in the Study Area
Common Name Scientific Name Schedule as per Wildlife (Protection) Act 1972
IUCN
Common langur* Presbytis entellus Schedule II
Rehusus Macaque* Macaca mulatta Schedule II LC Leopard Cat* Felis bengalensis Schedule I
Python* Python molurus Schedule I VU
4.3 AQUATIC ECOLOGY
4.3.1 AQUATIC ECOLOGY
Biological parameters are very important in the aquatic ecosystem, since they
determine the productivity of a water body. Primary productivity is an important
indicator of pollution level in any aquatic ecosystem. Fish production is dependent
on production of zooplanktons which in turn is dependent on the phytoplankton
production or primary productivity. All these are related to the physico-chemical
characteristics of the water.
Micro and Macro Biota
The density and diversity of Phytoplankton and zooplankton in the river water was
studied by collecting the water samples from various locations in the Study Area.
For enumeration of the phytoplankton population, 100 litre composite water
samples were collected from the river surface up to 60 cm depth and were filtered
through a 20 µm net to make 1 litre of bulk sample. The bulk samples so collected
were preserved in 2% formalin solution and were brought to the laboratory for
analysis. Ten replicates of water samples each of 15 ml were made out of the
preserved 1 litre bulk sample and were centrifuged at 1500 rpm for 10 minutes.
After centrifuging, the volume of aliquot concentrate was measured. 0.1 ml of
aliquot concentrate was used for enumeration of phytoplankton population in each
replicate. A plankton chamber of 0.1 ml capacity was used for counting of
plankton under a light microscope. The total number of plankton present in a litre
of water sample was calculated using the following formula:

GMR Londa Hydro Power Pvt Ltd EIA of Talong Londa H.E. Project
R S Envirolink Technologies Pvt. Ltd. 4 40
N = (n x v x 100)/ V; where,
N= Number of phytoplankton per litre
n = average number of plankton cells in 0.1 ml of aliquot concentrate
v = volume of plankton concentrate (aliquot)
V= volume of water from bulk sample centrifuged
Phytoplankton species diversity index was calculated using Shanon’s species
diversity index (H) formula taking the density values of each phytoplankton
species into consideration.
Shannon index of general diversity (H): - Pi log Pi, where
ni = density value for each species
N = total density values
Pi = density probability for each species = ni /N
4.3.2 RESULTS
Phytoplankton species and their population during winter, summer and monsoon
seasons are given in Tables- 4.9 to 4.11 respectively. The phytoplankton
communities in Kameng River were dominated by Bacillariophyta. The
phytoplankton, zooplankton and benthos population in the project area was much
lower as compared to the rivers in the plains.
Diversity index for phyto Phytoplanktons, bentose and zooplanktons was found
maximum during winter season. Seasonal variation in diversity was given in table
4.12.
Table 4.9: Density of Phytoplankton, Benthos and Zooplankton (Winter) Species Class Dam/ Power House site Phytoplankton Frustulia sp. Bacillariophyta 5 Pinnularia sp. Bacillariophyta 2 Gomphonema sp. Bacillariophyta 3 Fragilaria capucina Bacillariophyta 1 Navicula sp. Bacillariophyta 1 Stauroneis phoenicuteron Bacillariophyta 2 Gomphoneis herculeanum Bacillariophyta 3 Total 17 Benthos Stone fly Plecoptera 14 May fly Ephemeroptera 7 Damsel fly Zygophera 3 Total 24 Zooplankton Diffugia lebes Rhizopoda 2 Diffugia sp. Rhizopoda 1 Total 3

GMR Londa Hydro Power Pvt Ltd EIA of Talong Londa H.E. Project
R S Envirolink Technologies Pvt. Ltd. 4 41
Table 4.10: Density of Phytoplankton, Benthos and Zooplanktons (Summer) Species Class Dam/ Power House Site
Phytoplankton Frustulia sp. Bacillariophyta 11 Pinnularia sp. Bacillariophyta 9 Gomphonema sp. Bacillariophyta 4 Fragilaria capucina Bacillariophyta 2 Navicula sp. Bacillariophyta 9 Stauroneis phoenicuteron Bacillariophyta 3 Gomophoneis herculeanum Bacillariophyta 5 Total 43
Benthos Stone fly Plecoptera 15 May fly Ephemeroptera 9 Damsel fly Zygoptera 5 Total 29
Zooplankton
Diffugia lebes Rhizopoda 2 Diffugia acuminata Rhizopoda 3 Euglypha ciliata Rhizopoda 1 Brachionus angularis Rotifera 2 Alona affinis Cladocera 7 Total 15
Table 4.11: Density of Phytoplankton, Benthos and Zooplankton (Monsoon) Species Class Dam/Power House Site
Phytoplankton Frustulia sp. Bacillariophyta 13 Pinnularia sp. Bacillariophyta 9 Gomphonema sp. Bacillariophyta 8 Fragilaria capucina Bacillariophyta 3 Navicula sp. Bacillariophyta 8 Stauroneis phoenicuteron Bacillariophyta 2 Gomophoneis herculeanum Bacillariophyta 6 Total 46
Benthos Stone fly Plecoptera 12 May fly Ephemeroptera 10 Damsel fly Zygoptera 8 Total 30
Zooplankton Diffugia lebes Rhizopoda 3 Diffugia acuminata. Rhizopoda 4 Euglypha ciliata Rhizopoda 2 Brachionus angularis Rotifera 3 Alona affinis Cladocera 5 Total 17

GMR Londa Hydro Power Pvt Ltd EIA of Talong Londa H.E. Project
R S Envirolink Technologies Pvt. Ltd. 4 42
Table 4.12: Diversity Index of Phytoplankton, Benthos and Zooplanktons
Vegetation component
Species Diversity Index (H)
Winter Summer Monsoon
Phytoplankton 1.814 1.803 1.809
Benthos 1.085 1.007 0.934
Zooplankton 1.564 1.395 0.637
4.3.3 FISHERIES
The state of Arunachal Pradesh is endowed with rich fisheries potential in the form
of riverine resources. An assessment of literature survey on fishery resources
reveals that a vast and varied potential occurs in the Kameng river. The published
account on fish species from river Kameng has been given by Nath and Dey
(1990). A total of 73 fishes have been listed from the Kameng basin (Refer Table-
4.13). Depending upon the water temperature and DO levels these species
undertake short and long journey to survive and propagate in most optimal
condition.
Table 4.13: Fish Species Reported in Kameng Basin
Aborichthys elongatus Glossogobius giuris Aborichthys kempi Glyptothorax horai Acanthocobitis botia Glyptothorax pectinopterus Acrossocheilus hexagonolepis (M) Gudusia chapra Amblyceps mangois Heteropneustes fossilis Amblypharyngodon mola Labeo dero Anabas testudineus Labeo pangusia Aspidoparia jaya Lepidocephalus annandalei Aspidoparia morar Lepidocephalus guntea Badis badis Macrognathus aculeatus Bagarius bagarius Mastacembalus armatus Barilius barna Mastacembalus pancalus Barilius bendelisis Mystus bleekeri Barilius bola Mystus cavasius Barilius tileo Mystus vittatus Barilius vagra Nandus nandus Botia dario Noemacheilus rupecola Botia rostrata Notopterus notopterus Brachydanio rerio Olyra longicaudata Chagunius chagunio Ompak pabo Chanda baculis Ompak padba Chanda nama Pseudecheneis sulcatus Chanda ranga Puntius chola Channa orientalis Puntius sophore

GMR Londa Hydro Power Pvt Ltd EIA of Talong Londa H.E. Project
R S Envirolink Technologies Pvt. Ltd. 4 43
Cirrhina reba Puntius ticto Clarias batrachus Rasbora elanga Crossocheilus latius latius Rasbora rasbora Cyprinus carpio Salmostoma bacaila Danio aequipinnatus Schizopyge progastus Danio dangila Schizopygopsis stoliczkae Esomus danricus Schizothorax richardsonii (M) Euchiloglanis hodgarti Semiplotus semiplotus Euchiloglanis labilatum Tor progenesis Euchiloglarnis kamengensis Tor putitora (M) Garra annandalei Tor tor (M) Garra gotyla gotyla Wallago attu Garra macClellandi Xenentodon cancila
Note: M – Migratory species
The proposed dam site may obstruct the migration route of the mahaseer species,
which can be termed as one of the adverse impacts. The mahaseer species
undertake upstream migration in river Kameng during summer and monsoon
months for feeding and breeding. As the winter sets in the upper reaches, the
species takes a downstream journey up to its confluence with river Brahmaputra.
In addition certain species of Schizothorax (Snow trout) also undertake migration
from upper reaches up to the project site during winter months. This fish species
breeds in the lower reaches.
River Kameng is a tributary of river Brahmaputra and has good fisheries potential.
There are no fish landing centers in the project area also. It was also observed
during the field visit, that no large scale fishing activities are being practiced by the
population in and around the project area.
It was during our interaction with the locals and Fisheries Department, it was
confirmed that there are no permanent fishermen in the project area. However,
few locals are involved in fishing activities to augment their income. No family is
fully dependent on fishing for earning his living. The fisheries are mostly
subsistence type.
More than 50 castings each in the upstream and downstream of the dam site were
done in different sections of the river. A total no. of 16 species observed during
survey, which is given in Table 4.14 and their composition given in Table-4.15.
Table 4.14: Fish Species Observed in Kameng River Scientific Name Common/Local Name Schizopyge progastus Trout Schizothorax richardsonii Snow Trout Danio aequipinnatus Danio Danio dangila Dadva Barilius barna - Barilius bendelisis -

GMR Londa Hydro Power Pvt Ltd EIA of Talong Londa H.E. Project
R S Envirolink Technologies Pvt. Ltd. 4 44
Acrossocheilus hexagonolepis Mahseer Chagunius chagunio - Tor putitora Mahseer Tor tor Mahseer Crossocheilus latius - Garra gotyla - Garra annandalei - Botia rostrata - Amblyceps mangois - Glyptothorax horai -
Table 4.15: Composition of Fish Species Caught during Fisheries Survey Species Composition (%) Winter Summer Monsoon Tor sp. 35 45 52
Acrosocheilus sp. 18 20 24
Labeo sp. 15 10 11
Chagunius chagunio 10 10 12
Salmostoma bacaila 8 4 4
Schizothorax sp. 2 1 2
Other species 12 10 14
The survey results indicate that Mahaseer is the dominant species which,
contributes 35-45% of the total catch which is followed by Acrossocheilus sp. (18-
20%), Labeo (10-15%), Chagunius chagunio (10%), Salmostoma bacaila (4-8%),
Schizothorax sp. (1-2%) and miscellaneous (10-12%). The length of Tor sp.
caught during the fisheries survey ranged 100-250 mm, with weight varying 50-
400 gm. The catch per man hour in one km stretch of river Kameng about 15 km
downstream of the proposed dam site, has been worked out as 450 g to 650g.
The occurrence of varying sizes of T. putitora and Acrossocheilus hexagonolepis
in cast net catch (100-250 mm) indicates the possibility of the spawning of this
species in this stretch of the river. Mahseers are normally observed at elevations
between 300 and 800 m above mean sea level. They migrate to the lower reaches
for spawning. During the fisheries survey conducted in the project area, which has
an elevation ranging from 400-500 m above mean sea level Mahseer was
observed. They come to the area for spawning purposes. There is every
possibility of developing a local stock of both species Tor and Acrossocheilus. In
due course of time the local stock is bound to undertake upstream migration from
the proposed reservoir.

GMR Londa Hydro Power Pvt Ltd EIA study of Talong LondaH.E. Project
RS Envirolink Technologies Pvt. Ltd. 5.1
5.1 GENERAL
Development projects are planned based on the availability of exploitable natural
resources and on commissioning they act on growth foci. This attracts flow of
finances, investments, jobs and other livelihood opportunities, which brings in people
from different cultural and social background. Such planned activities not only
provide impetus to the local economy but also bring about a multi-dimensional
economic, social and cultural change. Most often it has been observed that such
development projects are commissioned in economically and socially backward
areas, which are inhabited by some of the indigenous populations. Commissioning of
development project invariably brings about a number of desired and undesired
impacts along with it.
The Talong Londa Hydro-electric Project is located in an economically backward
area. A detailed social economic study was undertaken to understand the overall
social and economic status of the people residing in the vicinity of this project. This
comprehension would help planners to make an assessment of the likely overall
impacts of the project on the micro-environment.
5.2 STUDY OBJECTIVES
The main aim of the study is to assess the socio-economic status of the project
affected villages/ families/ persons, and subsequently to prepare Resettlement and
Rehabilitation Plan for the Project Affected Families (PAFs) affected by the Talong
Londa HEP. More specifically, the objectives of the study are to:
Compile socio-economic data for the villages in the study area from the
secondary sources.
Undertake a survey of the affected villages and population, i.e. villages falling
within the submergence area and the working area of the project.
Understand various socio-economic aspects of the affected population viz.,
profile of the affected villages, demographic characteristics and socio-economic
conditions.
Formulate a Resettlement and Rehabilitation package for the project affected
families.
5.3 SOCIO-ECONOMIC STATUS IN THE STUDY AREA
The Talong Londa hydroelectric project is located amidst a socially and economically
backward and sensitive indigenous tribal community, viz., Nishis of Arunachal
Pradesh. These people call themselves the descendants of Abo Tani, the great
Chapter SOCIO-ECONOMIC ASPECTS 5

GMR Londa Hydro Power Pvt Ltd EIA study of Talong LondaH.E. Project
RS Envirolink Technologies Pvt. Ltd. 5.2
legendary forefather of all the Adi, Nishi, Hill Miri, Tagin, Bori, Bokar and Apatani
tribal groups. The people are primarily animists, who followed the belief of Donyi
Polo, i.e. they believe in Donyi (the Sun) and Polo (the Moon) as their supreme God.
However, in the more recent times, Christianity has made a great influence on many
of these people and many have converted to Christianity.
A detailed socio-economic study was undertaken to understand the overall social and
economic status of the PAFs, their life-style and to assess the likely impacts of the
project in terms of loss of personal and community property of the PAFs as well as
the changes that are foreseen in the social, cultural and economic environment of the
PAFs due to the proposed Talong Londa HEP. The Methodology and findings of the
survey has been discussed in R&R Plan in the Environmental Management Plan.
This chapter primarily deals with socio-economic status of the villages falling in study
area for which secondary data has been compiled from Census of India, 2011.
Study area is spread in four circles of East Kameng District viz. Seppa, Bameng,
Pipu and Khenewa. The total population of these four circles is 85690 of which 49.2
percent are males. Seppa is the only circle with an urban population of 18350, all
other circles are rural. The total literacy rate of the four circles is 52.1% with Seppa
owning the highest number of literates (57.8%). Of the total population in the study
area, 90% of population belongs to Scheduled Tribe. According to the census 2011,
the sex ratio of the total population in these four circles is 1031.
Population and literacy data of four circles is given at Table 5.1.
Table 5.1: Population and Literacy – Circle Wise
Circle TRU Population Literacy
Total Male Female SC ST Total Male Female % Seppa Total 29214 14411 14803 0 25138 16881 9416 7465 57.8 Seppa Rural 10864 5142 5722 0 10535 5346 2920 2426 49.2 Seppa Urban 18350 9269 9081 0 14603 11535 6496 5039 62.9 Bameng Total 5549 2765 2784 0 5504 2367 1402 965 42.7 Bameng Rural 5549 2765 2784 0 5504 2367 1402 965 42.7 Bameng Urban 0 0 0 0 0 0 0 0 0.0 Khenewa Total 4230 2089 2141 0 4085 1822 1029 793 43.1 Khenewa Rural 4230 2089 2141 0 4085 1822 1029 793 43.1 Khenewa Urban 0 0 0 0 0 0 0 0 0.0 Pipu-Dipu Total 3852 1828 2024 0 3838 1236 725 511 32.1 Pipu-Dipu Rural 3852 1828 2024 0 3838 1236 725 511 32.1 Pipu-Dipu Urban 0 0 0 0 0 0 0 0 0.0
Total 85690 42186 43504 0 77130 44612 25144 19468 52.1 Source: Census of India 2011; SC: Scheduled Caste; ST: Scheduled Tribes
A census survey of the population residing in the vicinity villages of the project area
was carried out. This section deals with the overall village summary of the socio-
economic standards and the amenities available to the local people living therein.

GMR Londa Hydro Power Pvt Ltd EIA study of Talong LondaH.E. Project
RS Envirolink Technologies Pvt. Ltd. 5.3
5.3.1 Demographic Profile
There are 69 villages belonging to four circles falling within the study area of
proposed Talong Londa H.E. Project. The total human population of these villages is
12277 of which 12181 belong to Scheduled Tribes which constitutes 99.2 % of the
total population. There are 2374 households in study area with Bameng circle having
the highest number (980) followed by Khenewa (622), Seppa (409) and Pipu (363).
Table 5.2 gives demographic profile of villages in study area.
Table 5.2: Demographic Profile of Study Area Villages
Sl.No. Circle Village Household Population Sex
Ratio Total Male Female
1
Seppa
Kamsa 19 205 97 108 1113
2 Richa 13 93 50 43 860
3 Weshy 28 234 118 116 983
4 Tallong – I 29 151 71 80 1127
5 Tallong – II 28 121 58 63 1086
6 Mebuwa - I 2 10 7 3 429
7 Mebuwa - II 8 25 12 13 1083
8 Mebuwa - III 11 56 38 18 474
9 Mogkhra 49 262 120 142 1183
10 Viwa 4 17 7 10 1429
11 Pabua 35 198 103 95 922
12 Rokjiwa (Rapipu) 5 21 11 10 909
13 Pakoti 53 408 218 190 872
14 Pachi Camp 20 133 60 73 1217
15 Tallong – III 36 163 82 81 988
16 Mebua Camp 58 280 130 150 1154
17 12th Mile Camp 11 70 21 49 2333
18
Bameng
Tara 21 111 53 58 1094
19 Milorang 43 262 128 134 1047
20 Beyong 60 242 123 119 967
21 Pakke Camp 108 507 240 267 1113
22 Lorrah 43 257 119 138 1160
23 Londa 69 275 138 137 993
24 18th Mile Camp 27 118 58 60 1034
25 Khora 20 71 37 34 919
26 40 K.M. Camp 44 157 76 81 1066
27 Jawa Camp 40 163 83 80 964
28 Longri Riang 25 125 56 69 1232
29 Emboriang 19 77 39 38 974
30 Effa 34 108 57 51 895
31 Lengdi/Liang 18 89 45 44 978
32 Tallo 26 140 76 64 842
33 Rikhung 23 135 66 69 1045
34 Lapung 17 85 48 37 771
35 Rengte-Wah 34 212 114 98 860
36 Taffo 17 68 40 28 700
37 Rasong 15 70 33 37 1121
38 Sepilliang 18 128 72 56 778

GMR Londa Hydro Power Pvt Ltd EIA study of Talong LondaH.E. Project
RS Envirolink Technologies Pvt. Ltd. 5.4
Sl.No. Circle Village Household Population Sex
Ratio Total Male Female
39 Tayung 24 99 51 48 941
40 Bameng H.Q. 204 934 471 463 983
41 Rigo Camp/Lorrah I.A.Y vill.
31 181 87 94 1080
42
Khenewa
Yacho 10 50 22 28 1273
43 Wagyung 6 25 10 15 1500
44 Sangbia Camp 7 26 12 14 1167
45 Paffa 50 239 115 124 1078
46 Sangbia 60 281 135 146 1081
47 Margingla Camp 33 196 87 109 1253
48 Pabing 6 25 15 10 667
49 Pordung 63 340 167 173 1036
50 Pordung Sullung 5 25 13 12 923
51 Waii 86 510 242 268 1107
52 Rawa 56 323 174 149 856
53 Sefew 9 38 19 19 1000
54 Pangia 34 249 128 121 945
55 Jokhia 43 289 141 148 1050
56 Jomoh 51 469 232 237 1022
57 Wallong 28 113 64 49 766
58 Khenewa H.Q. 75 337 171 166 971
59
Pipu-Dipu
Bokar 78 313 148 165 1115
60 Lochung 25 131 59 72 1220
61 Tabri 40 188 90 98 1089
62 Fachang 26 114 64 50 781
63 Kapu Dada 34 172 79 93 1177
64 Kawa Dada 9 46 25 21 840
65 Kotte Camp 22 99 53 46 868
66 Lozi 14 71 33 38 1152
67 Horungwa 11 56 31 25 806
68 Dafri 41 194 101 93 921
69 Attarang 63 297 136 161 1184
Total 2374 12277 6079 6198 1020
Source: Census of India 2011
5.3.2 Educational Profile
There are 31 primary schools, 11 middle schools and only 1 secondary school in the
study area. The lone secondary school is in Bameng HQ. There is no senior
secondary school or college in the entire study area. Moreover, there is not even a
single college in the entire district. Poor educational infrastructure is reflected in the
literacy status in the area. Average literacy rate in the study area is 40%; village wise
rate varies from 0 to 80%. Mebuwa-1 village in Seppa circle has highest literacy rate
of 64.5%.
Male literacy rate is fairly high as compared to that of female literacy rate. Out of the
total number of literates 58% are males.

GMR Londa Hydro Power Pvt Ltd EIA study of Talong LondaH.E. Project
RS Envirolink Technologies Pvt. Ltd. 5.5
0
1000
2000
3000
4000
Male Literate FemaleLiterate
MaleIlleterates
FemaleIlleterates
Educational Profile of the Vicinity Villages
Seppa 20%
Bameng 24% Khenewa
28%
Pipu-Dipu 28%
Working Population in the study area
Figure 5.1: Education profile of villages in the vicinity of Talong Londa HEP
5.3.3 Health Care Facilities
Health infrastructure is also very poor in the study area. Local people are forced to
travel long distances for their basic medical needs. A large number of people have
been reported to be suffering from Malaria, Diarrhoea etc. Out of the 69 villages in
the study area only three villages viz. Pakke ,Pachi and Bameng H.Q have Primary
Health Centers (PHC) and 1 Child Welfare Center (CWC) at Bameng HQ. The
existing PHCs were observed to be in bad shape and require urgent attention.
5.3.4 Occupational Pattern
Distribution of the working population among the four circles in the study area show
that Khenwa and Pipu has the highest percentage of working population, whereas
Seppa has the lowest percentage of working population.
Figure 5.2: Circle wise working population in study area of Talong Londa HEP
Occupational status of the main, marginal and non-workers of the vicinity villages in
the project area is depicted in the enclosed graph. It shows that there is nearly an
equal distribution of the males and females workers in the main working population
and in the non-working population.

GMR Londa Hydro Power Pvt Ltd EIA study of Talong LondaH.E. Project
RS Envirolink Technologies Pvt. Ltd. 5.6
0
10
20
30
40
50
60
70
MainWorker M
MainWorker F
MarginalWorker M
MarginalWorker F
NonWorker M
NonWorker F
Figure 5.3: Occupational pattern in study area
5.3.5 Other Amenities
The current status of transport in the villages is highly unsatisfactory. Among the total
69 villages, only 10 have bus service, only 7 villages have power supply facility for
their various domestic uses and only 2 villages have the postal and banking facility.
5.4 SOCIO-ECONOMIC STATUS OF THE AFFECTED VILLAGES
The villages where the families whose land or house is likely to be affected by the
proposed project activities have been categorized as affected villages. A total of 8
villages will be affected due to various components of proposed Talong Londa HEP.
All the villages come under the jurisdiction of Seppa and Bameng circles of East
Kameng District. The socio- economic profile of these villages is discussed in the
following text.
5.4.1 Demographic Profile
Demographic profile of the 8 villages which will be affected due to various project
activities is given at Table 5.3 below. The affected villages have 357 households with
a total population of 1789; however, not all the households will be affected. Details of
affected families are discussed in R&R Plan as part of Environmental Management
Plan. Almost the entire population of affected villages is scheduled tribe (99.12%).
Table 5.3: Demographic Profile of the Affected Villages
Villages Households Total Population
Male Population
Female Population SC ST Sex
Ratio Talong 57 272 129 143 0 269 1109 Pachi Camp 20 133 60 73 0 130 1217 12th Mile Camp 11 70 21 49 0 68 2333 Pakke Camp 108 507 240 267 0 503 1113 Lorrah 43 257 119 138 0 254 1160 Londa 69 275 138 137 0 275 993 Tallo 26 140 76 64 0 139 842 Rikhung 23 135 66 69 0 135 1045 Total 357 1789 849 940 0 1773 1107

GMR Londa Hydro Power Pvt Ltd EIA study of Talong LondaH.E. Project
RS Envirolink Technologies Pvt. Ltd. 5.7
0.00
10.00
20.00
30.00
40.00
50.00
60.00
70.00
Talong PachiCamp
12thMile
Camp
PakkeCamp
Lorrah Londa Tallo Rikhung
Pe
rce
nta
ge
Total
Male
Female
5.4.2 Educational Profile
As is the case of entire region, educational status in the affected villages is not very
impressive, as is evident from the data given in Table – 5.4. Literacy rate of all the
affected villages is below the national average of 65.38%, with lowest at Talong
(32.35%) and highest at Pachi Camp (55%), however, the higher values are close to
state literacy rate of 66.96%. Male literacy rate far exceeds that of female literacy
rate, however it shows large variation from 34.29% at 12th Mile Camp to 69.81% at
Tallo, as compared to state average of 73.7%. Female literacy rate figures vary from
30.19% at Tallo to 65.71% at 12 Mile Camp as compared to state average of 59.6%.
Figure 5.4: Literacy rate in affected villages of Talong Londa HEP
Table 5.4: Educational Profile of Affected Villages
Villages Literacy Rate (%) No. of Educational Institutes
Total Male Female Primary School
Middle School
Secondary School
Senior School
Talong 32.35 53.41 46.59 0 0 0 0
Pachi Camp 54.89 45.21 54.79 1 1 0 0
12th Mile Camp 50.00 34.29 65.71 0 0 0 0
Pakke Camp 44.38 56.44 43.56 1 1 0 0
Lorrah 36.58 63.83 36.17 0 0 0 0
Londa 40.73 58.93 41.07 0 0 0 0
Tallo 37.86 69.81 30.19 1 0 0 0
Rikhung 37.78 50.98 49.02 0 0 0 0
3 2 0 0
Further, the data on number of educational Institutes show the poor state of
educational infrastructure in villages. Only three villages viz. Pachi, Tallo and Pakke
have primary schools and two of this viz. Pachi and Pakke have middle schools. No
educational institutes exist in other affected villages.

GMR Londa Hydro Power Pvt Ltd EIA study of Talong LondaH.E. Project
RS Envirolink Technologies Pvt. Ltd. 5.8
5.4.3 Occupational Pattern
Out of the total population (1789) of the affected villages (8), working population is
43.82%, which is closely distributed between male (46%) and female (54%). Majority
of these are main workers (98%) i.e., those who worked for at least 183 days in the
preceding 12 months. Percentage of female workers is higher in both main workers
and marginal workers as compared to their male counterparts. Table 5.5 gives
Occupational Pattern in affected villages.
Table 5.5: Occupational Pattern in Affected Villages
Village Total Worker Main Worker Marginal Worker Non Worker
T M F T M F T M F T M F
Talong 153 71 82 144 67 77 9 4 5 119 58 61
Pachi Camp 40 21 19 40 21 19 0 0 0 93 39 54
12th Mile Camp 25 8 17 25 8 17 0 0 0 45 13 32
Pakke Camp 213 94 119 213 94 119 0 0 0 294 146 148
Lorrah 109 47 62 107 45 62 2 2 0 148 72 76
Londa 126 63 63 123 62 61 3 1 2 149 75 74
Tallo 51 26 25 49 24 25 2 2 0 89 50 39
Rikhung 67 32 35 67 32 35 0 0 0 68 34 34
Total 823 381 442 807 372 435 16 9 7 1057 525 532
5.4.4 Other Amenities
All the affected villages are known to possess an average sized volley ball ground. 2
fair price shops are also located in the village Londa. There are total 12 churches in
all the affected villages since a large proportion of population believes in Christianity.
The facilities like transport and banking are not available to the local people .The
regular power supply is also lacking in almost all the villages. The local people have
access to the water supply for various domestic uses but not to the safe drinking
water.
5.4.5 Public Perception of Project
The socio-economic survey team visited the entire area getting affected by the
project and data regarding public perception and awareness of the project was
collected by direct interaction with PAFs on the basis of structured questionnaires.
Several meetings and discussions were held with both the educated youth and
Anchal Samiti Members of the affected villages regarding the displacement of PAF’s
and options for R&R. It was observed during the field survey that all the respondents
were aware about the project.
In general, people welcome the project as it will bring infrastructural development and
progress in the area. Most of the respondents from the project area have a positive
outlook towards the construction of the project; however, some of them doubt that the
compensation for the loss of livelihood and other properties may not be adequate.
The educated youth in the area are looking forward to employment opportunities
during construction and operation and hence have positive mindset about the

GMR Londa Hydro Power Pvt Ltd EIA study of Talong LondaH.E. Project
RS Envirolink Technologies Pvt. Ltd. 5.9
development. They consider it as a positive step towards the path of development for
the area as a whole; however, they showed concern that this development is at the
cost of their ancestral land, other immovable properties and livelihood for which they
should be properly compensated.
It was observed that out of the total surveyed population, all the young respondents
feel that due to this developmental project they will get more employment, which is
the basic need for sustaining their lives. Infrastructure in terms of educational,
transportation and medical facilities will improve. The people believe that the area
can emerge as a tourist spot by the construction of this project leading to further
improvement in infrastructure and development in the area.
People were equally concerned about the adverse impacts due to project related
activities and are aware of the loss of their agricultural lands due to acquisition. They
understand that this development will lead to influx of migratory population leading to
change in their social attitude. They are also concerned about environmental impacts
especially leading to more landslides and loss of their natural water resources lying in
the project area. However the PAFs are ready to give their cultivable land or
homestead in exchange for adequate compensation.
The families likely to be displaced insist that the resettlement should be done within
their own or nearby villages otherwise their social and cultural ethos may get
disturbed.
The above findings and observations reveal that all the population of the project-
affected area, all tribal, are in favor of the construction of this project. However efforts
need to be made by the project developer and the administration that the indigenous
people should not suffer but benefit from this developmental project.
GMR Londa Hydro Power Pvt Ltd EIA study of Talong Londa H.E. Project
R S Envirolink Technologies Pvt. Ltd. 6.1
6.1 GENERAL
The proposed Talong Londa Hydro Electric Project would lead to generation of
number of environmental impacts owing to the activities that would be undertaken
during the construction of various project appurtenances, e.g. concrete dam,
drilling and blasting during construction activities like roads, construction of
permanent and temporary housing and construction workers colonies, quarrying
for construction material and dumping of muck generated from various project
activities. The likely impacts have been considered for various aspects of
environment, including physico-chemical, ecological and socio-economic aspects.
Based on the project details and the baseline environmental status, potential
impacts as a result of the construction and operation of the proposed Talong
Londa Hydro-Electric Project have been identified. Wherever possible, the
impacts have been quantified and otherwise, qualitative assessment has been
undertaken. This Chapter deals with the anticipated positive as well as negative
impacts due to construction and operation of the proposed Talong Londa HEP.
6.2 IMPACTS ON LAND ENVIRONMENT
6.2.1 CONSTRUCTION PHASE
Very few impacts of construction phase are permanent. Majority of the
environmental impacts attributed to construction works are temporary in nature,
lasting mainly during the construction phase and often do not extend much
beyond the construction period. However, if these issues are not properly
addressed, the impacts can continue even after the construction phase for longer
duration. The time required for construction of the project has been estimated as
about 5 (+1 years of preconstruction) years. Even though the impacts due to
construction are temporary in nature, they need to be reviewed closely as they
could be significant due to the nature and intensity of the impacts.
The major anticipated impacts during the construction phase are as follows:
Environmental degradation due to immigration of Construction workers
population
Quarrying operations
Operation of construction equipment
Soil erosion/increased siltation
Muck disposal
Impacts due to construction of roads
Chapter PREDICTION OF IMPACTS
6
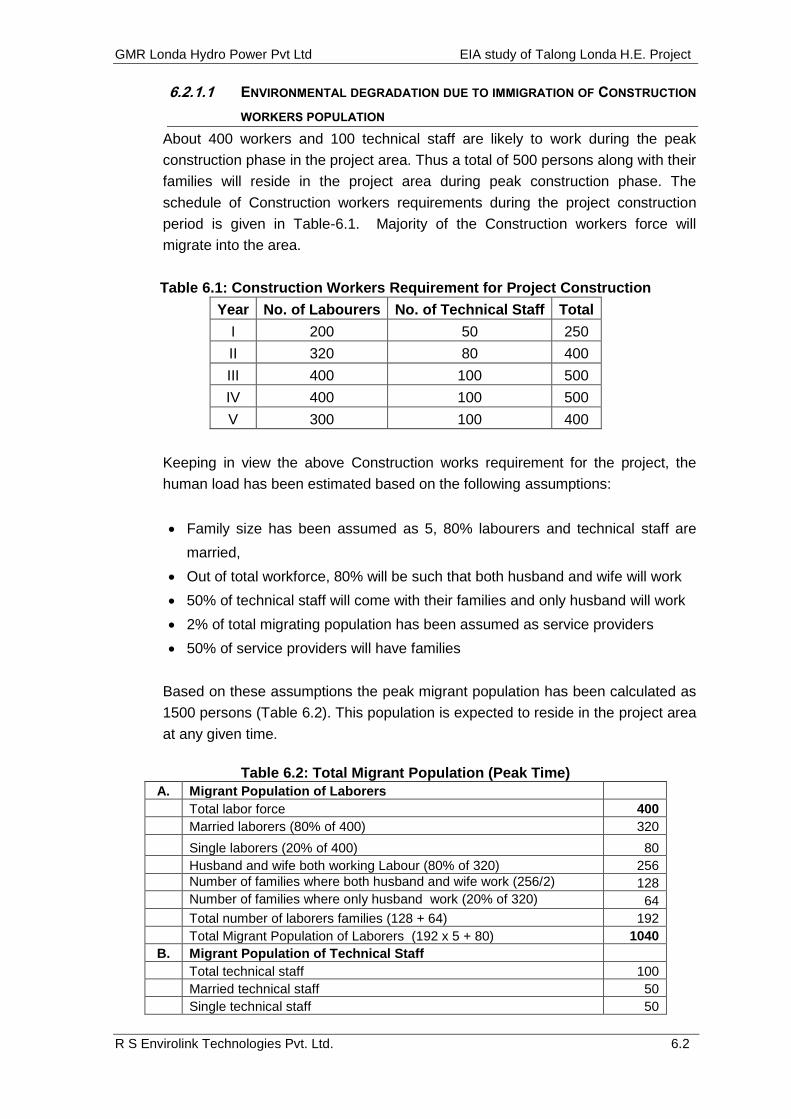
GMR Londa Hydro Power Pvt Ltd EIA study of Talong Londa H.E. Project
R S Envirolink Technologies Pvt. Ltd. 6.2
6.2.1.1 ENVIRONMENTAL DEGRADATION DUE TO IMMIGRATION OF CONSTRUCTION
WORKERS POPULATION
About 400 workers and 100 technical staff are likely to work during the peak
construction phase in the project area. Thus a total of 500 persons along with their
families will reside in the project area during peak construction phase. The
schedule of Construction workers requirements during the project construction
period is given in Table-6.1. Majority of the Construction workers force will
migrate into the area.
Table 6.1: Construction Workers Requirement for Project Construction
Year No. of Labourers No. of Technical Staff Total
I 200 50 250
II 320 80 400
III 400 100 500
IV 400 100 500
V 300 100 400
Keeping in view the above Construction works requirement for the project, the
human load has been estimated based on the following assumptions:
Family size has been assumed as 5, 80% labourers and technical staff are
married,
Out of total workforce, 80% will be such that both husband and wife will work
50% of technical staff will come with their families and only husband will work
2% of total migrating population has been assumed as service providers
50% of service providers will have families
Based on these assumptions the peak migrant population has been calculated as
1500 persons (Table 6.2). This population is expected to reside in the project area
at any given time.
Table 6.2: Total Migrant Population (Peak Time)
A. Migrant Population of Laborers Total labor force 400 Married laborers (80% of 400) 320
Single laborers (20% of 400) 80 Husband and wife both working Labour (80% of 320) 256 Number of families where both husband and wife work (256/2) 128 Number of families where only husband work (20% of 320) 64 Total number of laborers families (128 + 64) 192 Total Migrant Population of Laborers (192 x 5 + 80) 1040
B. Migrant Population of Technical Staff Total technical staff 100 Married technical staff 50 Single technical staff 50

GMR Londa Hydro Power Pvt Ltd EIA study of Talong Londa H.E. Project
R S Envirolink Technologies Pvt. Ltd. 6.3
Total migrant population of technical staff (50 x 5 + 50) 300 Migrant Workforce (Labor plus Technical) 1340
C. Service Providers Total service providers (2% of total migrant workforce) 27 Married service providers (50 % as assumed) 14 Single service providers 14 Total migrant population of service providers (14 x 5 + 14) 84 Total Migrant Population 1424
Separate accommodation and related facilities for workers, service providers and
technical staff are to be arranged. The volume of Construction Worker force is
likely to create problems of sewage disposal, solid waste management, tree
cutting to meet fuel requirement, etc. Appropriate mitigating measures have been
suggested in EMP, which needs to be implemented to minimize such impacts.
6.2.1.2 QUARRYING OPERATIONS
The total concrete aggregate requirement for construction of concrete gravity
dam, powerhouse and other components of the project is about 16.8 lacs cum.
This comprises of 12.6 lacs cum (includes wearing and non wearing) of coarse
aggregate and 4.2 lacs cum of fine aggregate.
Assuming the total losses of 38% to be accounted for in the quantity estimation of
raw material from quarry site to batching plant for production of aggregate, the
total requirement of material for concrete as well as for coffer dam excluding the
clay material, works to be 23.25 lacs cum.
In case of impervious material the quantity required is estimated as 27500 cum.
Considering, rejection at borrow area site 20% and handling and transit losses
from borrow area to the upstream coffer dam 10% the required quantity of
impervious material in the borrow area works out to 35750 cum.
The quarrying operations will be semi-mechanized in nature. Normally, in a hilly
terrain like Arunachal Pradesh, quarrying is done by cutting the hill face, and this
leaves a permanent scar, once the quarrying activities are over with the passage
of time, rock from the exposed face of the quarry under the action of wind and
other erosional forces, slowly gets weathered and they become a potential source
of landslide. Thus, it is necessary to implement appropriate slope stabilization
measures to prevent the possibility of soil erosion and landslides at the quarry
sites.
6.2.1.3 OPERATION OF CONSTRUCTION EQUIPMENT
During the construction phase, various types of equipment will be brought to the
site. These include crushers, batching plant, drillers, earth movers, rock bolters,
etc. The siting of these construction equipments would require significant amount

GMR Londa Hydro Power Pvt Ltd EIA study of Talong Londa H.E. Project
R S Envirolink Technologies Pvt. Ltd. 6.4
of space. In addition, land will also be temporarily acquired, i.e. for the duration of
project construction; for storage of the quarried material before crushing, crushed
material, cement, rubble, etc. Proper siting of these facilities is important so as to
have minimum impact due to their location and operation. The various criteria for
selection of these sites would be:
Proximity to the site of use
Sensitivity of forests in the nearby areas
Wildlife, if any, in the nearby area
Proximity from habitations
Efforts shall be made to select the site for locating the construction equipment in
such a way that the adverse impacts on environment are minimal including that on
residents of nearby villages.
During construction phase, there will be increased vehicular movement for
transportation of various construction materials to the project site. Large quantity
of dust is likely to be entrained due to movement of trucks and other heavy
vehicles on unpaved road. Impact will be local and temporary, lasting only
during construction phase and is not very significant due to absence of major
habitations in the project area. However sufficient mitigation measures would be
required to minimize the impact of dust on health of the people living in the vicinity
and laborers working in the project area.
6.2.1.4 SOIL EROSION/INCREASED SILTATION
The runoff from the construction sites will have a natural tendency to flow towards
river Kameng or its tributaries. For some distance downstream of major
construction sites, such as dam, power house, etc. there is a possibility of
increased sediment levels in river water resulting in reduction in light penetration
and hence reduced photosynthetic activity to some extent. This is likely to have an
adverse impact on the primary productivity of the affected stretch of river Kameng
and its tributaries. River Kameng has sufficient flow throughout the year;
therefore, impacts on this account are not expected to be significant. However,
some adverse impacts are anticipated on the streams and nallahs which have low
flow during lean season.
6.2.1.5 MUCK DISPOSAL
Total quantity of muck generated is 24.4 lacs cum. The 14.10 lacs cum of is
proposed to be utilize as construction material in various project structures.
Remaining 10.3 Lacs cum muck is proposed to be dumped at pre-identified
locations. The muck is proposed to be dumped in an environmentally sound
manner in pre-identified dumping sites, which are proposed to be rehabilitated.
Generally during the construction phase and also during the disposal of muck,

GMR Londa Hydro Power Pvt Ltd EIA study of Talong Londa H.E. Project
R S Envirolink Technologies Pvt. Ltd. 6.5
there is a possibility of washing away of this muck into the main river which might
cause some negative impacts on the aquatic ecosystem of the river. Even though
the negative impact is going to be a short term in this case, yet sufficient care
would be taken during the construction to ensure that very little rubble/muck is
allowed to be washed into the main channel.
Muck disposal can lead to impacts on various aspects of environment.
Normally, the land is cleared before muck disposal. During clearing
operations, trees are cut, and undergrowth perishes as a result of muck
disposal.
In many of the sites, muck is stacked without adequate stabilisation measures.
In such a scenario, the muck moves along with runoff and creates landslide
like situations. Many a times, boulders/large stone pieces enter the river/water
body, affecting the benthic fauna, fisheries and other components of aquatic
biota.
Normally muck disposal is done at low lying areas, which get filled up due to
stacking of muck. This can sometimes affect the natural drainage pattern of
the area leading to accumulation of water or partial flooding of some area
which can provide ideal breeding habitat for mosquitoes.
Thus, it is necessary to develop a proper muck disposal plan for amelioration of
above referred impacts. The details of the same have been covered in
Environmental Management Plan outlined in separate Volume of this Report.
6.2.1.6 CONSTRUCTION OF ROADS
The topography of the project area has steep slopes, which descend rapidly into
narrow valleys. The conditions can give rise to erosion hazards due to downhill
movement of soil aggregates. The project construction would entail significant
vehicular movement for transportation of construction material and heavy
construction equipment. Most of the roads in the project area would require
widening apart from the new roads proposed to be constructed for this project.
The details of the roads proposed to be constructed and improved are given
below.
The dam site is located about 1 km upstream of the confluence of Kameng with
Pachi. PWD road (20 km) is available from Seppa, district headquarters of East
Kameng upto Dam site. About 4 km length of road is likely to be submerged which
is being proposed to be realigned.

GMR Londa Hydro Power Pvt Ltd EIA study of Talong Londa H.E. Project
R S Envirolink Technologies Pvt. Ltd. 6.6
6.2.1.7 PROJECT ROAD
All the project appurtenances lie close to the main access road. A number of small
road having width of 5 m with 3 m metalled surface taking off from the main
access road need to be constructed to give approach to dam and power house,
colony, and other project component. The total length will be about 5 km.
Thus, about 7.5 km of new roads including realignment of near dam and
upstream, are proposed to be constructed. The major impacts likely to accrue as a
result of construction of the proposed project are:
Loss of forest and vegetation by cutting of trees
Geological disturbance due to blasting, excavation, etc.
Soil erosion as the slope cutting operation disturbs the natural slope and leads
to land slips and landslides.
Interruption of drainage and change in drainage pattern
Disturbance of water resources with blasting and discriminate disposal of fuel
and lubricants from road construction machinery
Siltation of water channels/ reservoirs from excavated debris
Effect on flora and fauna
Air pollution, due to dust from debris, road construction machinery, etc.
The indirect impact of the construction of new roads is the increase in accessibility
to otherwise undisturbed areas, resulting in greater human interference and
subsequent adverse impacts on the ecosystem. Appropriate management
measures required to mitigate adverse environmental impacts during road
construction have been recommended. The details of the same have been
covered in Environmental Management Plan outlined in second part of this report.
6.2.2 OPERATION PHASE
The Total land required for the project is about 413.10 ha, as per the break-up
given in Table-6.3.
Table 6.3: Land Requirement for Proposed Project (Unit: ha)
S. No. Component Area in ha 1. Dam, Power House and Diversion tunnel Complex 10.00 2 Submergence area at FRL (EL. 488 m), Slope area
including the river course 350.00
3 Diversion road 5.00 4 i) Muck disposal area 10.00 ii) Magazine area 0.60 iii) Rehabilitation and Resettlement 4.00 iv) Colony area 2.50 v) Construction Facility Area 12.00 vi) Quarry Area at Meuba Area 3.00 vii) Quarry Area at 3 Kilo Meter 4.00 viii) Quarry Area at D/s of Dam Axis 4.00 ix) Quarry area near Pachi 8.00

GMR Londa Hydro Power Pvt Ltd EIA study of Talong Londa H.E. Project
R S Envirolink Technologies Pvt. Ltd. 6.7
Total Land Required (Ha) is 413.10 Ha including 101 Ha of River bed areas. 413.10
About 413.10 ha of land, out of which 284 ha of land to be acquired is owned by
the Forest Department and the balance i.e. 129.10 ha of land is community private
land which is mainly used as agriculture land. Appropriate compensatory
measures have been suggested in lieu of various categories land being proposed
to be acquired.
6.2.2.1 IMPACTS ON WATER RESOURCES
The construction of dam leads to the formation of reservoir. The passage of flood
through a reservoir leads to the reduction in peak flow. The dry season flow in the
river too is regulated. Thus, construction of the dam would lead to moderation in
peak flood and delay in time lag as well. Since, in the proposed project, dam toe
power house is envisaged, hence, adverse impacts on riverine ecology as a result
of diversion of water for hydropower generation are not envisaged. However,
there are 8 villages situated in the immediate downstream stretch of the river (see
Table 6.4). A small population of 1669 persons belonging to 344 households
resides in this stretch. They do get their drinking water supply from the river
instead are dependent upon the streams that join the main Kameng river. Table 6.4: Population residing in the downstream stretch
Population Households Left Bank Rikhung 157 34 Tallong – I 115 27 Tallong – III 24 5 Pakoti 188 33 Right Bank Londa 275 58 18th Mile Camp 193 38 Pachi Camp 227 48 12th Mile Camp 77 17 Mogkhra 207 40 Mebua Camp 206 44
Table 6.5: Streams joining in the downstream stretch
S.No Stream Distance from dam
Left Bank/ Right Bank
1. Pachi river 0.95km Left Bank
2. Ngosong Nallah 1.85 km Right Bank
3. Wesong Bung 4.35 km Right Bank
4. Recha Nallah 5.95 km Right Bank
5. Defaos Bung 6.1 km Left Bank

GMR Londa Hydro Power Pvt Ltd EIA study of Talong Londa H.E. Project
R S Envirolink Technologies Pvt. Ltd. 6.8
6. Kade Nallah 7.05 km Right Bank
7. Pakoti Nallah 9.4 km Right Bank
8. Changri Bung 9.75 km Left Bank
9. Hagrong Bung 10.55 km Left Bank
10. Nelu Bung 12.15 km Left Bank
11. Talong Bung 13.85 km Right Bank
12. Pacha River 14.9 km Left Bank
13. Kuchi Bung 15.8 km Left Bank
The survey of streams/ Nala was done considering zero km at Dam site which is
at village Londa and close to Narangso Nala. The kilometer reading has been
followed on the speedo-meter of the vehicle since there was no mile and kilometer
stone available along the road towards the project site. It should be noted that all
the nallahs downstream from the dam are perennial.
As seen from the Table 6.5 there are at least 13 major streams that join Kameng
river downstream of dam up to Pacha river. There are 6 nallas that add to the
discharge of Kameng river. Therefore there will be sufficient water available in the
river for various uses.
6.3 IMPACTS ON WATER QUALITY
6.3.1 CONSTRUCTION PHASE
The major sources of water pollution during project construction phase are as
follows:
Sewage from Construction work camps/colonies
Effluent from crushers
Disposal of muck
6.3.1.1 SEWAGE FROM CONSTRUCTION WORKER CAMPS
The project construction is likely to last for a period of 5+1 years. As mentioned
earlier in section, about 400 workers and 100 technical staff are likely to work
during project construction phase. However, most of the employees/workers
during construction phase are likely to be employed from outside the project area.
The construction phase, also leads to mushrooming of various allied activities to
meet the demand of immigrant Construction Worker population in the project area.
The domestic water requirement for the Construction Worker and the technical
staff migrating into the project area is of the order of 0.11 mld @ 70 lpcd.

GMR Londa Hydro Power Pvt Ltd EIA study of Talong Londa H.E. Project
R S Envirolink Technologies Pvt. Ltd. 6.9
Assuming that about 80% of the water supplied will be generated as waste/
sewage. The BOD load contributed by domestic sources will be about 68 kg/ day.
If the human waste and refuse is directly drained into the river channel, the
coliforms and other disease causing micro-organisms will increase leading to water
borne diseases. This is one of the negative impacts, which will not only lead to
human health hazard, but also increase pollution levels in the water and bringing
about changes in the natural biotic diversity of the aquatic ecosystem of the river.
Therefore, project authorities would be taking appropriate measures to check such
disposal into the river. In order to avoid any deterioration in water quality and
subsequent changes in the aquatic biota, project authorities propose to have a
proper sewage disposal system in and around various Construction Worker
colonies to check the discharge of waste and refuse into the river. In absence of
such measures there is bound to be deterioration in water quality and the
subsequent changes in the aquatic biota.
6.3.1.2 EFFLUENT FROM CRUSHERS
During construction phase, at least one crusher is proposed to be commissioned
at the dam site. The capacity of the crusher is likely to be of 360 tph. Water is
required to wash the boulders and to lower the temperature of the crushing edge.
About 0.1 m3 of water is required per tonne of material crushed. The effluent from
the crusher would contain high suspended solids. The quantum of effluent
generated is of the order of 12-15 m3/hr or 0.0033 to 0.0042 m3/sec. The natural
slope in the area is such that, the effluent from the crushers will ultimately find its
way in river Kameng through natural drains. However, no major adverse impacts
are anticipated due to small quantity of effluent and large volume water available
for dilution in river Kameng. However, turbidity levels in small tributaries,
especially, in lean season will increase. To minimize the impact, it is proposed to
treat the effluent before disposal to ameliorate even if only the marginal impacts
are likely to accrue on this account.
6.3.1.3 DISPOSAL OF MUCK
The major impact on the water quality arises when the muck is disposed along the
river bank. The project authorities have identified suitable muck disposal sites which
are located near the river channel. The muck will essentially come from the road-
building activity, tunneling and other excavation works. The unsorted waste going
into the river channel will greatly contribute to the turbidity of water continuously for
long time periods. The high turbidity is known to reduce the photosynthetic
efficiency of primary producers in the river and as a result, the biological productivity
will be greatly reduced. Therefore, the prolonged turbid conditions would have
negative impact on the aquatic life.

GMR Londa Hydro Power Pvt Ltd EIA study of Talong Londa H.E. Project
R S Envirolink Technologies Pvt. Ltd. 6.10
6.3.2 OPERATION PHASE
The various aspects covered as a part of impact on water quality during project
operation phase are:
o Effluent from project colony
o Impacts on reservoir quality
o Eutrophication risks
6.3.2.1 EFFLUENT FROM PROJECT COLONY
During the operation phase, due to absence of any large scale construction
activity, the cause and source of water pollution will be much different. Since, only
a small number of O&M staff will reside in the area in a well designed colony with
sewage treatment plant and other infrastructural facilities, the problems of water
pollution due to disposal of sewage are not anticipated. In the operation phase,
about 100 families (total population of 500) will be residing in the area. About 0.03
mld of sewage will be generated. The total BOD loading will be of the order of 22
to 25 kg/day. It is proposed to provide biological treatment facilities including
secondary treatment for the sewage so generated. Thus, no impacts are
anticipated as a result of disposal of effluents from the project colony.
6.3.2.2 IMPACTS ON RESERVOIR WATER QUALITY
The flooding of previously forest and agricultural land in the submergence area
will increase the availability of nutrients resulting from decomposition of the
vegetative matter. Phytoplankton productivity can supersaturate the euphotic zone
with oxygen before contributing to the accommodation of organic matter in the
sediments. Enrichment of impounded water with organic and inorganic nutrients
will be the main water quality problem immediately on commencement of the
operation. However, this phenomenon is likely to last for a short duration of few
years from the filling up of the reservoir.
6.3.2.3 EUTROPHICATION RISKS
Another significant impact observed in the reservoir is the problem of
eutrophication which occurs mainly due to the disposal of nutrient rich effluents
from the agricultural fields. The fertilizer use in the project area is negligible,
hence, runoff at present does not contain significant amount of nutrients. Even in
the post-project phase, the use of fertilizers in the project catchment area is not
expected to rise significantly. Thus, in the post-project phase, problems of
eutrophication, which is primarily caused by enrichment of nutrients in water, are
not anticipated.

GMR Londa Hydro Power Pvt Ltd EIA study of Talong Londa H.E. Project
R S Envirolink Technologies Pvt. Ltd. 6.11
6.4 IMPACTS ON TERRESTRIAL FLORA
6.4.1 CONSTRUCTION PHASE
The direct impact of construction activity for any water resource project in a
mountainous terrain similar to that of proposed project is generally limited in the
vicinity of the construction sites only. As mentioned earlier, a large population
(1500) including technical staff, workers and other group of people are likely to
congregate in the area during peak project construction phase. It can be assumed
that the technical staff will be of higher economic status and will live in a more
urbanized habitat, and will not use wood as fuel, if adequate alternate sources of
fuel are provided. However, workers and other population groups residing in the
area may use fuel wood (if no alternate fuel is provided) for whom firewood/coal
depot could be provided. There will be an increase in population by about 1,500 of
which about 1200 are likely to use fuel wood. On an average, the fuel wood
requirements will be of the order of (1.0 * 365 * 1200 * 10-3) 438 m3. The wood
generated by cutting one tree is 2.5-3.0 m3. Thus, about 150-180 trees will be cut
every year to meet the fuel wood requirements, which mean every year on an
average about 0.5 to 0.8 ha of forest area will be cleared for meeting fuel wood
requirements, if no alternate sources of fuel are provided. Hence, to minimize
such impacts, it is proposed to provide alternate fuel for cooking e.g. Kerosene,
LPG to the Construction Worker force. The other alternative is to provide
community kitchens on a cooperative basis by the contractor. The details of the
same have been covered in Environmental Management Plan outlined in Part-II of
this Report.
The other major impact on the flora in and around the project area would be due
to increased level of human interferences. The workers may also cut trees to meet
their requirements for construction of houses, furniture. Normally in such
situations, lot of indiscriminate use or wastage of wood is also observed,
especially in remote or inaccessible areas. Thus, it is necessary to implement
adequate surveillance to ameliorate the adverse impacts on terrestrial flora during
project construction phase.
6.4.2 OPERATION PHASE
6.4.2.1 ACQUISITION OF FOREST LAND
The total land required for the project is 413.10 ha of which 284 ha is Forest land.
The tree density at various sampling stations is given in Table 6.6.
Table 6.6: Tree Density at Sampling Sites
Sampling site Plant no./ha Dam site/Power House site 400 Catchment area 380 Submergence area: Left Bank 330 Submergence area: Left Bank 440

GMR Londa Hydro Power Pvt Ltd EIA study of Talong Londa H.E. Project
R S Envirolink Technologies Pvt. Ltd. 6.12
Catchment: Upstream of Pachuk- Kameng Confluence 392 Downstream of Proposed Power house area 421
The tree density at various sampling sites in the land to be acquired for the project
is 330 to 440 tree/ha. Normally in dense forest, the tree density is of the order of
1100 trees/ha. Thus, the tree cover in the project area indicates the degraded
status of forests in the area. Compensatory afforestation has been recommended
as a part of EMP.
6.5 IMPACTS ON TERRESTRIAL FAUNA
6.5.1 CONSTRUCTION PHASE
6.5.1.1 DISTURBANCE TO WILDLIFE
The total land required for the project is 485 ha of which 400 ha comes under
submergence (including river bed) and 85 ha is required for other project
appurtenances. Based on the field survey and interaction with locals, it was
confirmed that no major wildlife is reported in the proposed submergence area. It
would be worthwhile to mention here that most of the submergence lies within the
gorge portion. Thus, creation of a reservoir due to the proposed project is not
expected to cause any significant adverse impact on wildlife movement. The
project area and its surroundings are not reported to serve as habitat for wildlife
nor do they are located on any known migratory route. Thus, no impacts are
anticipated on this account.
During construction phase, a large number of machinery and construction Worker
will have to be mobilized. This activity may have some disturbance to the wildlife
population. The operation of various construction equipments is likely to generate
significant noise, especially during blasting. The noise may scare the fauna and
force them to migrate to other areas. Likewise, siting of construction equipment,
godowns, stores, Construction Worker camps, etc. may generally disturb
whatever fauna is left in the area. However, no large-scale fauna is observed in
the area. Thus, impacts on this account are not expected to be significant.
However, few stray animals sometimes venture in and around the project site.
Thus, to minimize any harm due to poaching activities from immigrant
Construction worker population, strict anti-poaching surveillance measures need
to be implemented, especially during project construction phase. The same have
been suggested as a part of the Environmental Management Plan which has been
presented Part-II of this Report.
6.5.1.2 IMPACTS ON MIGRATORY ROUTES
The faunal species observed in the project area are not migratory in nature. The
proposed submergence area is not the migratory route of wild animals. However,
during the course of survey, information was gathered through locals in the project
area and subsequently discussed with forest official. It was told that elephants are
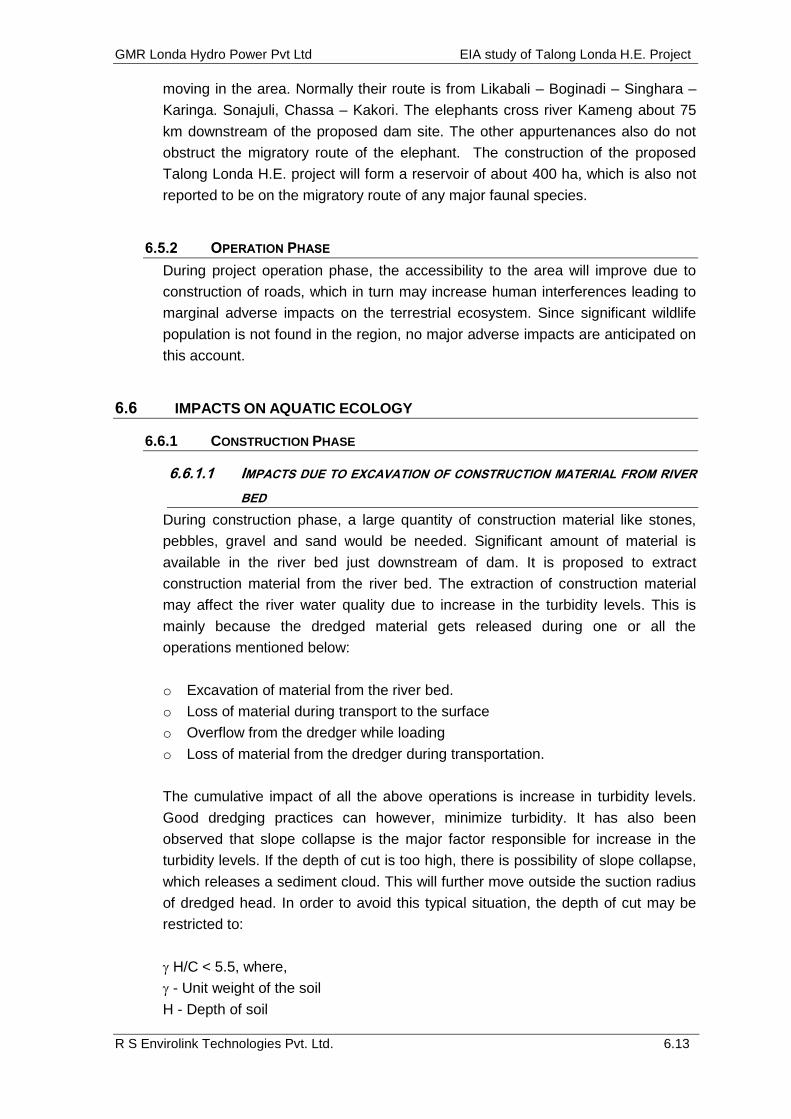
GMR Londa Hydro Power Pvt Ltd EIA study of Talong Londa H.E. Project
R S Envirolink Technologies Pvt. Ltd. 6.13
moving in the area. Normally their route is from Likabali – Boginadi – Singhara –
Karinga. Sonajuli, Chassa – Kakori. The elephants cross river Kameng about 75
km downstream of the proposed dam site. The other appurtenances also do not
obstruct the migratory route of the elephant. The construction of the proposed
Talong Londa H.E. project will form a reservoir of about 400 ha, which is also not
reported to be on the migratory route of any major faunal species.
6.5.2 OPERATION PHASE
During project operation phase, the accessibility to the area will improve due to
construction of roads, which in turn may increase human interferences leading to
marginal adverse impacts on the terrestrial ecosystem. Since significant wildlife
population is not found in the region, no major adverse impacts are anticipated on
this account.
6.6 IMPACTS ON AQUATIC ECOLOGY
6.6.1 CONSTRUCTION PHASE
6.6.1.1 IMPACTS DUE TO EXCAVATION OF CONSTRUCTION MATERIAL FROM RIVER
BED
During construction phase, a large quantity of construction material like stones,
pebbles, gravel and sand would be needed. Significant amount of material is
available in the river bed just downstream of dam. It is proposed to extract
construction material from the river bed. The extraction of construction material
may affect the river water quality due to increase in the turbidity levels. This is
mainly because the dredged material gets released during one or all the
operations mentioned below:
o Excavation of material from the river bed.
o Loss of material during transport to the surface
o Overflow from the dredger while loading
o Loss of material from the dredger during transportation.
The cumulative impact of all the above operations is increase in turbidity levels.
Good dredging practices can however, minimize turbidity. It has also been
observed that slope collapse is the major factor responsible for increase in the
turbidity levels. If the depth of cut is too high, there is possibility of slope collapse,
which releases a sediment cloud. This will further move outside the suction radius
of dredged head. In order to avoid this typical situation, the depth of cut may be
restricted to:
H/C < 5.5, where,
- Unit weight of the soil
H - Depth of soil

GMR Londa Hydro Power Pvt Ltd EIA study of Talong Londa H.E. Project
R S Envirolink Technologies Pvt. Ltd. 6.14
C - Cohesive strength of soil
The dredging and deposition of dredged material may affect the survival and
propagation of benthic organisms. The macro-benthic life which remains attached
to the stones, boulders etc. gets dislodged and is carried away downstream by
turbulent flow. The areas from where construction material is excavated, benthic
fauna get destroyed. In due course of time, however, the area gets decolonized,
with fresh benthic fauna. The density and diversity of benthic fauna will however,
be less as compared with the pre-dredging levels.
The second important impact is on the spawning areas of fishes. Almost all the
cold water fish breed in the flowing waters. The spawning areas of these fish
species are found amongst pebbles, gravel, sand etc. The eggs are sticky in
nature and remain embedded in the gravel and subsequently hatched. Any
disturbance of stream bottom will result in adverse impacts on fish eggs. Even
increase in fine solids beyond 25 ppm will result in deposition of silt over the eggs,
which would result in asphyxiation of developing embryo and also choking of gills
of young newly emerged fry. Thus, if adequate precautions during dredging
operations are not undertaken, then significant adverse impacts on aquatic
ecology are anticipated.
6.6.1.2 IMPACTS DUE TO DISCHARGE OF SEWAGE FROM CONSTRUCTION WORKER
CAMP/COLONY
The proposed hydro-power project would envisage construction of temporary and
permanent residential colonies to accommodate Construction Worker and staff
engaged in the project. This would result in discharge of sewage which is usually
discharged into the nearby water body. However, it is proposed to commission
adequate number of septic tanks for treatment of domestic sewage before its
disposal in to the river. Due to perennial nature of river Kameng, it maintains
sufficient flow throughout the year which is sufficient to dilute the treated sewage
from residential colonies. Therefore, as mentioned earlier, no adverse impacts on
water quality are anticipated due to discharge of sewage from Construction worker
camp/colony.
6.6.1.3 IMPACTS DUE TO HUMAN ACTIVITIES
Accumulation of Construction Worker force in the project area might results in
enhancement in indiscriminate fishing including use of explosives. The use of
explosive material to kill fishes in the river in the project area would result in
complete loss of fishes and other aquatic life making a river stretch completely
barren. Indiscriminate fishing will reduce fish stock availability for commercial and
sport fishermen. These aspects have been adequately covered in the
Environmental Management Plan (EMP) outlined in Part-II of this report.

GMR Londa Hydro Power Pvt Ltd EIA study of Talong Londa H.E. Project
R S Envirolink Technologies Pvt. Ltd. 6.15
6.6.2 OPERATION PHASE
6.6.2.1 IMPACTS DUE TO DAMMING OF RIVER
The damming of river Kameng near village Pachi will result in creation of 400 ha
of submergence area. The dam will change the fast flowing river to a quiescent
lacustrine environment. The creation of a pond will bring about a number of
alterations in physical, abiotic and biotic parameters both in upstream and
downstream directions of the proposed dam site. The micro and macro benthic
biota is likely to be most severely affected as a result of the proposed project.
The positive impact of the project will be the formation of a water body which can
be used for fish stocks on commercial basis to meet the protein requirement of
region. The commercial fishing in the proposed reservoir would be successful,
provided all tree stumps and other undesirable objects are removed before
submergence. The existence of tree stumps and other objects will hinder the
operation of deep water nets. The nets will get entangled in the tree stumps and
may be damaged.
The reduction in flow rate of river Kameng especially during lean period is likely to
increase turbidity levels downstream of the dam. Further reduction in rate of flow
may even create condition of semi-dessication in certain stretches of the river.
This would result in loss of fish life by poaching. Hence, it is essential to maintain
minimum flow required for sustenance of riverine fisheries till the disposal point of
the tail race discharge.
6.6.2.2 IMPACTS ON MIGRATORY FISH SPECIES
The obstruction created by the dam would hinder the migration of certain
commercial species especially Schizothorax sp. These fishes undertake annual
migration for feeding and breeding. Therefore, fish migration path may be
obstructed due to high dam and fishes are expected to congregate below the dam
wall. Under this situation poaching activities may increase in the area.
Most of the species will shift to the section of the river where they find favorable
environment for breeding since the dam is 104 m high, the construction of fish
ladder is not feasible in the proposed dam. However, it is proposed that the
artificial seed production in hatchery may be adopted which can be stocked in the
river stretches downstream and upstream of the proposed dam.
The Schizothorax species are steno-thermal. During winter months, they migrate
from headwaters near flood plains in search of suitable feeding and breeding
grounds. The sampling in river Kameng both on upstream and downstream of the
proposed dam site for macro-benthic life gave 2 units/sq m of fry of Schizothorax
sp. This observation further strengthens the fact that Schizothorax sp. migrate
during winter months. With the onset of summer season, these species migrates

GMR Londa Hydro Power Pvt Ltd EIA study of Talong Londa H.E. Project
R S Envirolink Technologies Pvt. Ltd. 6.16
upstream. These species during project construction phase are likely to
congregate in the reservoir. It is expected that in due course of time these species
will adapt themselves to the changed habitat.
6.7 IMPACTS ON NOISE ENVIRONMENT
6.7.1 NOISE DUE TO CONSTRUCTION EQUIPMENT
In a water resource project, the impacts on ambient noise levels are expected only
during the project construction phase, due to operation of various construction
equipments. Likewise, noise due to quarrying, blasting, vehicular movement will
have some adverse impact on the ambient noise levels in the area. The noise
level due to operation of various construction equipments is given in Table-6.7.
Table 6.7: Noise level due to Construction Equipment
Equipment Sound Level (dBA)
Unsilenced pile diver 110
Unsilenced scraper/grader 94
Unsilenced pneumatic drill 90
Unsilenced compressor 85
Cranes 82
Generator 82
Under the worst case scenario, considered for prediction of noise levels during
construction phase, it has been assumed that all these equipment generate noise
from a common point. The increase in noise levels due to operation of various
construction equipments are given in Table-6.8.
Table 6.8: Increase in Noise due to Operation of Construction Equipment
Distance (m)
Average Ambient noise levels (dBA)
Noise levels due to construction
activities (dBA)
Increase in ambient noise level due to construction
activities (dBA) 100 48 76 28 200 48 70 22 500 48 62 14 1000 48 56 8 1500 48 52 4 2000 48 50 2 2500 48 49 1 3000 48 49 1
As per Table-5.6, increase in noise level shall be of the order of 8 dBA, within 1
km from the project area. However, it would be worthwhile to mention here that in
absence of the data on actual location of various construction equipment, all the
equipment have been assumed to operate at a common point. This assumption
leads to over-estimation of the increase in noise levels.

GMR Londa Hydro Power Pvt Ltd EIA study of Talong Londa H.E. Project
R S Envirolink Technologies Pvt. Ltd. 6.17
It is a known fact that there is a reduction in noise level as the sound wave passes
through a barrier. The noise transmission loss values for common construction
materials are given in Table-6.9.
Table 6.9: Transmission Loss Values for Construction Materials
Material Thickness (inches) Decrease in noise level (dBA)
Light concrete 4 38
6 39
Dense concrete 4 40
Concrete block 4 32
6 36
Brick 4 33
Granite 4 40
Wood Bamboo 15
The walls of various houses will attenuate at least 15 to 30 dBA of noise. In
addition there is attenuation due to the following factors.
Air absorption
Rain
Atmospheric inhomogeneities and atmospheric turbulence.
Vegetal foliage
Thus, no increase in noise levels is anticipated as a result of various activities,
during the project construction phase. The noise is also generated due to blasting
during tunneling operations. However, it is not likely to have any effect on
habitations. No major wildlife is observed in and around the project site. Hence, no
significant impacts on wildlife are anticipated as a result of blasting activities in the
proposed project.
6.8 AIR POLLUTION
In a water resources project, air pollution occurs mainly during project construction
phase. The major sources of air pollution during construction phase are:
Pollution due to fuel combustion in various equipment
Emission from various crushers
Fugitive emissions from various sources.
6.8.1 POLLUTION DUE TO FUEL COMBUSTION IN VARIOUS EQUIPMENTS
The operation of various construction equipments requires combustion of fuel.
Normally, diesel is used in such equipment. The major pollutant which gets
emitted as a result of combustion of diesel is SO2. The PM10 emissions are
minimal due to low ash content in diesel. The short-term increase in SO2, even

GMR Londa Hydro Power Pvt Ltd EIA study of Talong Londa H.E. Project
R S Envirolink Technologies Pvt. Ltd. 6.18
assuming that all the equipment are operating at same point of time, is quite low,
i.e. of the order of less than 1g/m3. Hence, no major impact is anticipated on this
account on ambient air quality.
6.8.2 EMISSIONS FROM VARIOUS CRUSHERS
The operation of the crusher during the construction phase is likely to generate
fugitive emissions, which can move even up to 1 km in predominant wind
direction. During construction phase, one crusher is likely to be commissioned
near proposed dam site. During crushing operations, fugitive emissions
comprising mainly the suspended particulate will be generated. During layout
design, care should be taken to ensure that the Pachi village Construction Worker
camps, colonies, etc. are located on the leeward side and outside the impact zone
(say about 10 km on the wind direction) of the crushers.
6.8.3 FUGITIVE EMISSIONS FROM VARIOUS SOURCES
During construction phase, there will be increased vehicular movement. Lot of
construction material like sand, fine aggregate are stored at various sites, during
the project construction phase. Normally, due to blowing of winds, especially when
the environment is dry, some of the stored material can get entrained in the
atmosphere. However, such impacts are visible only in and around the storage
sites. The impacts on this account are generally, insignificant in nature.
6.9 IMPACTS ON SOCIO-ECONOMIC ENVIRONMENT
6.9.1 CONSTRUCTION PHASE
A project of this magnitude is likely to entail both positive as well as negative
impacts on the socio-cultural fabric of area.
6.9.1.1 POSITIVE IMPACTS ON SOCIO-ECONOMIC ENVIRONMENT
One of the main reasons for promoting hydroelectric schemes is their
environmentally friendly character. This form of energy, unlike the energy from
other conventional sources, entails no discharges of wastes or emission of toxic
gases. It is virtually free from pollution and thus can be looked as “technology of
the future” for the rural and remote areas. The following positive impacts are
anticipated on the socio-economic environment of the local people of villages of
project area during the project construction and operation phases:
Expatriate constructors who would probably come from other parts of the country
would undertake construction activities.
A number of marginal activities and jobs would be available to the locals in the
project improves the job opportunities during construction phase.

GMR Londa Hydro Power Pvt Ltd EIA study of Talong Londa H.E. Project
R S Envirolink Technologies Pvt. Ltd. 6.19
Education will receive a shot in the arm. The advantage of education to secure
jobs will quickly percolate through all sections of the population and will induce
people to get their children educated.
The availability of electricity to the rural areas will reduce the dependence of the
locals on alternative energy sources namely forest.
With increased availability of electricity, small-scale and cottage industries are
likely to come up in the area.
The proposed project site is well connected by road. Efforts to be made to develop
eco-tourism, which could earn additional revenue.
6.9.1.2 NEGATIVE IMPACTS ON SOCIO-ECONOMIC ENVIRONMENT
Although, there are a number of positive impacts of the proposed project, one
major negative impact is identified i.e. there will be loss of land due to the
proposed project. Of the 237 project affected families, 112 households are
displaced either due to lose of their houses.
6.9.2 OPERATION PHASE
The proposed project involves acquisition of Jhum lands, private and forest lands
for the project. The impacts due to acquisition land are studied in the Social
Impact Assessment Report (SIA). A detailed R&R Plan for Project Affected
Families has also been suggested as per the SRRP 2008 and The Right to Fair
Compensation and Transparency in Land Acquisition, Rehabilitation and
Resettlement Act, 2013.
6.9.2.1 INCREASED INCIDENCE OF WATER-RELATED DISEASES
The construction of a reservoir replaces the riverine ecosystem by a lacustrine
ecosystem. The vectors of various diseases breed in shallow water areas not very
far from the reservoir margins. The magnitude of breeding sites for mosquitoes
and other vectors in the impounded water is in direct proportion to the length of
the shoreline. The construction of the reservoir would increase the shoreline by
many times as compared to the pre-project shoreline of river Kameng under
submergence. Thus, the construction of the proposed reservoir would enhance
the potential breeding sites for various diseases vectors. There are chances that
incidence of malaria may increase as a result of the construction and operation of
the proposed project. In addition to the construction of the reservoir, the following
factors too would lead to the increased incidence of malaria in and around the
project area:
aggregation of Construction Worker
excavation, and
inadequate facilities in Construction Worker camp.

GMR Londa Hydro Power Pvt Ltd EIA study of Talong Londa H.E. Project
R S Envirolink Technologies Pvt. Ltd. 6.20
6.9.2.2 AGGREGATION OF CONSTRUCTION WORKER
About 500 laborers and technical staff will congregate in the project area during
peak construction phase. The total increase in population is expected to be of the
order of 1500. Most of the Construction Worker would come from various parts of
the country. The laborers would live in dormitories provided by the contractor.
Proper sanitary facilities are generally provided. Hence, a proper surveillance and
immunization schedule needs to be developed for the Construction Worker
population migrating into the project area.
6.9.2.3 EXCAVATIONS
The excavation of earth from borrow pits etc. is one of the major factor for the
increase in prevalence of malaria. After excavation of construction material, the
depressions are generally left without treatment where water gets collected.
These pools of water, then serves as breeding grounds for mosquitoes. However,
in the present case, the borrow areas are within the river bed, which in any case
remain under water. Thus, no additional habitat for mosquito breeding is created
due to excavation.
The flight of mosquito is generally limited up to 1 to 2 km from the breeding sites.
Since, no residential areas are located within 1 km from the reservoir, periphery,
increased incidences of malaria are not anticipated. However, Construction
Worker camps, etc. could be vulnerable to increased incidence of malaria, if
proper control measures are not undertaken.
6.9.2.4 INADEQUATE FACILITIES IN CONSTRUCTION WORKER CAMPS
Improperly planned Construction Worker camps generally tend to become slums,
with inadequate facilities for potable water supply and sewage treatment and
disposal. This could lead to outbreak of epidemics of water-borne diseases.
Adequate measures for supply of potable water and sewage treatment have been
recommended as a part of Environmental Management Plan presented in a Part-II
of this report.

GMR Londa Hydro Power Pvt Ltd EIA study of Talong Londa H.E. Project
R S Envirolink Technologies Pvt. Ltd. 7.1
CHAPTER 7
CLEAN DEVELOMENT MECHANISM
7.1 INTRODUCTION
In the techno-economic evaluation, apart from the investment risk Talong Londa
H.E. Project is likely to face several barriers such as Government policies,
regulatory risk and other externalities etc. and to overcome these barriers during
project implementation and operation, GMR Londa Hydro Power Pvt. Limited is
conceptualizing the project under consideration as Clean Development
Mechanism (CDM) project.
CDM is a mechanism established and developed under Kyoto Protocol to reduce
Greenhouse Gases (GHGs) emission. At the 1992 Rio Earth Summit, countries
agreed to the United Nations Framework Convention on Climate Change
(UNFCCC) in response to growing evidence that human activity was contributing
to global warming. The UNFCCC contained a non-binding commitment by
industrialized countries (listed in Annex I of the Convention) that they would
reduce their emission of GHGs to 1990 levels by the year 2000. But soon it
became clear that this wasn‟t enough to avoid dangerous climate change.
Therefore in 1995, at the first Conference of Parties (COP) after the Convention
entered into force, parties began to negotiate a Protocol that would set tighter and
legally binding targets for reducing greenhouse gas emissions.
Subsequently, in 1997 at the 3rd COP to the Convention in Japan, Parties agreed
on a Protocol that set binding targets for industrialized countries (Annex-1
countries) to reduce their emissions by an average of 5.2% below 1990 levels in
the period 2008-2012, The Protocol was given the name of the city in which it was
negotiated Kyoto Protocol.
For assisting Annex-1 countries in reducing emissions up to specified level and
helping them in reducing cost of such reduction a marketing mechanism was
developed called as CDM on the ground that the emission reduction at any place
across the globe will benefit the global environment equally. Under CDM, Certified
Emission Reductions (CERs) are allotted to the projects in Non-Annex 1 countries
(developing countries) which result in reduction of GHGs emission. Buyers in
Annex-1 countries to meet their reduction targets can buy these credits from these
developers in Non Annex-I countries. Various agencies have been authorized and

GMR Londa Hydro Power Pvt Ltd EIA study of Talong Londa H.E. Project
R S Envirolink Technologies Pvt. Ltd. 7.2
specified for governing the whole procedure. Any project in India, which results in
GHGs emission reduction can be, a potential CDM project.
The energy generated from Talong Londa HEP will be exported to Northern
Eastern Western North-Eastern grid (NEWNE) grid thereby replacing equivalent
amount of power that would have been generated by mainly thermal mix. Thus
Talong Londa H.E. Project can be a potential CDM project. CDM process cycle is
detailed in forthcoming paragraphs. 7.2 CDM PROJECT CYCLE
GMR Londa Hydro Power Pvt. Limited has identified Talong Londa H.E. Project in
India. To overcome barriers during project implementation, owner conceptualized
this project as CDM project and hence the same is included in this project Report.
Various steps involved in CDM cycle are given in Figure 7.1.
Figure 7.1 CDM Process Cycle
As a next step, GMR Londa Hydro Power Pvt. Limited shall draft Project Design
Document (PDD) by selecting appropriate baseline and monitoring methodology
and submit the same to India Designated National Authority (DNA), where the
project is located, for Host Country Approval (HCA).
In case, if methodology is not approved for mentioned project case by UNFCCC,
then Project Proponent (PP) shall propose new methodology to register his CDM
project activity with UNFCCC. Since Talong Londa H.E. Project is a hydro electric

GMR Londa Hydro Power Pvt Ltd EIA study of Talong Londa H.E. Project
R S Envirolink Technologies Pvt. Ltd. 7.3
project, the approved methodology ACM0002 (ACM stands for Approved
Consolidated Methodology) shall be used. PP shall carry out validation process in
parallel with filing project for Host Country Approval. PP shall appoint Designated
Operational Entity (DOE) to carry our validation process.
DOE will webhost PDD in their dedicated UNFCCC interface for Global
Stakeholder Comment for 30 days. After the comment period, DOE shall carry out
validation site visit and prepare Draft Validation Report (DVR)1. PP shall prepare
replies with necessary reference documents and submit the same to DOE.
Upon closure of all queries, DOE will submit project for requesting registration to
UNFCCC EB. In the mean time, PP may receive HCA and shall submit the same
to DOE which is necessary requirement for requesting registration. PP should
submit registration fees to UNFCCC based on the scale and quantum of emission
reductions. After successful registration of the project, PP shall monitor emission
reductions and appoint DOE for verifying the same to facilitate issuance of CERs
for the entire crediting period. (10 years or 7 years renewed twice i.e. a total of 21
years). Apart from emission reductions, the CDM projects should lead to
sustainable development in the context of the project activity to ensure that the
project contribute to sustainable development. 7.3 TALONG LONDA HEP
North Eastern region is very rich in hydro-power potential on account of moderate
to heavy rainfall in the region and the mighty Brahmaputra river and its tributaries.
The reassessed hydropower potential of this region on October 2007 is 58971
MW out of which only 2% has been harnessed so far2. Talong Londa HEP is a
renewable energy generation project, located in the East Kameng District of
Arunachal Pradesh at latitude 27°28‟55” N and longitude 93°01‟50” E on Kameng
river.
The river Kameng is one of the principal north bank tributaries of the river
Brahmaputra. The project it will provide 225 MW of peak power with generation of
886 Million unit of electricity in a 90% dependable year with 95% plant availability.
The project will provide 14% of power generation free to Arunachal Pradesh. The
development of the project will enhance the quality of life of the people living in
and around the project by way of development of roads & communications,
1 DVR is Draft Validation Report from DOE which has set of findings/queries based upon validation site visit and PDD submitted for Global Stake holder comment. 2 www.cea.nic.in

GMR Londa Hydro Power Pvt Ltd EIA study of Talong Londa H.E. Project
R S Envirolink Technologies Pvt. Ltd. 7.4
availability of reliable, dependable, uninterrupted power for development of
small/medium industries, development of tourism etc.
Talong Londa HEP qualifies as CDM Project because the emission reductions
achieved by the Talong Londa project activity is real, measurable and additional.
In spite of various barriers for implementation of the Talong Londa HEP, only the
CDM finance that envisaged will make it viable and give a positive boost to go
ahead with the project.
The concept of registering a GHG emission reduction project as “CDM Project”
with UNFCCC involves the Government in which the project is implemented,
known as „Host Country‟ in CDM paradigm. Each host country shall designate an
agency (known as Designated National Authority, DNA) to take care of issue
relating to CDM under the protocol.
Designated National Authority (DNA)
The Government of India constituted the National Clean Development Mechanism
Authority (NCDMA) under Ministry of Environment and Forest (MoEF),
Government of India (GoI) for the purpose of protecting and improving the quality
of environment in terms of the Kyoto Protocol.
NCDMA evaluates and approve the projects as per the guidelines and general
criteria laid down in the relevant rules and modalities pertaining to CDM in addition
to the guidelines issued by the CDM Executive Board (EB).
The evaluation includes an assessment of the probability of eventual successful
implementation of CDM projects and evaluation of extent to which projects meet
the sustainable development objectives, as it would seek to prioritize projects in
accordance with national priorities.
The NCDMA can recommend certain additional requirements to ensure that the
project proposals meet the national sustainable development priorities, legal
framework and also gives priority to those projects with higher sustainable
development benefits.
The Authority will also carry out the financial review of projects to ensure that the
project do not involve diversion of official development assistance (ODA)3 in
3 www.en.wikipedia.org/wiki/Official_development_assistance.

GMR Londa Hydro Power Pvt Ltd EIA study of Talong Londa H.E. Project
R S Envirolink Technologies Pvt. Ltd. 7.5
accordance with CDM procedures and also ensure that the market environment of
the CDM project is not conducive to under-valuation of Certified Emission
Reduction (CERs) particularly for externally aided projects.
The Authority carries out activities to ensure that the project developers have
reliable information relating to all aspects of CDM which include creating
databases on organizations designated for carrying out activities like validation,
monitoring and verification of project activities, and to collect, compile and publish
technical and statistical data relating to CDM initiatives in India.
The Director of the NCDMA is responsible for day-to-day activities of the authority
including constituting committees or sub-groups to coordinate and examine the
proposals or to get detailed examination of the project proposals. The CDM
procedures involve in a specific registration process for all potential CDM projects. 7.4 CDM PROCEDURES
Project Design Document
The Project design document (CDM-PDD) is the most important document of any
CDM Project; the PDD has to be prepared as per the guidelines for completing
(CDM-PDD) approved by the CDM-EB on the basis of CDM modalities and
procedures. The PDD consists of five sections (a) technological description of
project activity, (b) application of baseline and monitoring plan (c) duration of
project activity and crediting period (d) Environmental Impacts (e) Stakeholder‟s
comments. Project participants shall submit information on their proposed CDM
project activity using the Project design document.
Host Country Approval
All the potential CDM projects of developing countries shall take approval from the
concerned host country approval before proceeding for Validation of the projects.
The DNA will assess the projects as mentioned at Section 3.0 and approves the
project, if found eligible.
ODA: Flows of official financing administered with the promotion of the economic development and welfare of developing countries as the main objective, and which are concessional in character with a grant element of at least 25 percent (using a fixed 10 percent rate of discount). By convention, ODA flows comprise contributions of donor government agencies, at all levels, to developing countries (“bilateral ODA”) and to multilateral institutions. ODA receipts comprise disbursements by bilateral donors and multilateral institutions.

GMR Londa Hydro Power Pvt Ltd EIA study of Talong Londa H.E. Project
R S Envirolink Technologies Pvt. Ltd. 7.6
Validation of the CDM Project Activity Validation is the process of independent evaluation of the PDDs, submitted by the
project proponents (for evaluating Baseline, Additionality, Monitoring plan,
Environmental Impacts, Stake holders), by a CDM-EB approved, Designated
Operational Entity (DOE).
Registration of the CDM Project Activity
Registration is the formal acceptance by the CDM-EB of validated project as a
CDM project activity against the request of DOE.
Verification / Certification of the CDM Project Activity
Verification is the periodic independent review and ex-post determination by the
DOE of the monitored reductions in anthropogenic emissions by sources of
greenhouse gases that have occurred as a result of a registered CDM project
activity during the verification period.
7.5 CDM ACTIVITY FOR HYDRO ELECTRIC PROJECTS
Hydro Electric Projects particularly run-of-river hydro projects typically lead to
GHG emission reduction and hence are natural choices as CDM projects. Till
date i.e. 09-09-2008 globally 49 Large Scale (above 15 MW) Hydro Electric
Projects are registered with CDM executive Board and out of this 10 are in India.
The World‟s largest CDM run of river Hydro Electric Power Project of 192 MW
capacity is registered from India at 17-05-2007 and approx reducing 494,668
metric tonnes of CO2 equivalent4 per annum.
Talong Londa HEP Project Activity towards Sustainable Development and as CDM Project
The Indian economy is highly dependent on coal and other thermal fuels to
generate energy and for production processes. As the population‟s demand for
electricity is increasing, resulting in an immense stress on natural resources (fossil
fuel) of the environment. Relying on coal as a major energy source is risky as the
country becomes dependant on international supply and promotes climate change
due to GHG emissions.
The main objective of the Talong Londa HEP is to produce clean energy in a
sustainable manner, by optimizing a renewable resource, i.e. river water. The
effective generation capacity of the Northern Region is 35726 MW. Thermal
4 The CO2 equivalent is the basis of Global Warming Potential (GWP) for other green house gases (CH4, N2O, and SF6) and one tonne of GHG reduced is CO2 equivalent per tonne.

GMR Londa Hydro Power Pvt Ltd EIA study of Talong Londa H.E. Project
R S Envirolink Technologies Pvt. Ltd. 7.7
contributes half of the generation and Hydro more than a third. Gas adds about
10% with Nuclear and renewable energy contributing the balance out of 12776
MW of hydro generation capacity 8105 MW (67%) is run of the river 4031 MW
(33%) is reservoir based. Most of the Northern Region hydro generation is snow
fed having maximum generation during summer and minimum during winter5.
During peak summer and winter period, the Northern Region has been found to
be a power deficit region and the average shortage in region during the year
2006-2007 has been 10.60 % and 15.40 % in terms of energy and peak MW
requirements6
The implementation of the proposed Talong Londa 225 MW HEP project, will
contribute to meeting the power and energy demand in the Northern grid and will
displace electricity that would otherwise have to be produced through the
construction of fossil fuel based thermal power plants.
Apart from emission reductions, the CDM projects should lead to sustainable
development in the context of the project activity to ensure that the project
contribute to sustainable development.
6 http://www.nrldc.org/grid_reports.aspx

GMR Londa Hydro Power Pvt Ltd EIA study of Talong Londa H.E. Project
R S Envirolink Technologies Pvt. Ltd. 7.8
Sustainable Development Indicators
It is the prerogative of the host country (India) to confirm whether a clean
development mechanism project activity assists in achieving sustainable
development and should also be oriented towards improving the quality of life of
the poor from the environmental standpoint.
Following indicators should be considered while designing CDM project activity:
Social well-being
Economic well-being
Environmental well-being
Technological well-being
Social well being: The CDM project activity should lead to alleviation of poverty
by generating additional employment, removal of social disparities and
contribution to provision of basic amenities to people leading to improvement in
quality of life of people.
The Talong Londa HEP activity as it will bring infrastructural development and
progress in the area. The preliminary survey conducted amongst the local
populace during the EIA studies reveals that most of the respondents from the
project area have a positive outlook towards the construction of the project. The
educated youth in the area are looking forward to employment opportunities
during construction and operation and hence have positive mindset about the
development. They consider it as a positive step towards the path of development
for the area as a whole.
It was observed that out of the total surveyed population, all the young
respondents feel that due to this developmental project they will get more
employment, which is the basic need for sustaining their lives. Infrastructure in
terms of educational, transportation and medical facilities will improve. The people
believe that the area can emerge as a tourist spot by the construction of this
project leading to further improvement in infrastructure and development in the
area.
Economic well being: The Talong Londa HEP project activity brings in
investment consistent with the needs of the people.

GMR Londa Hydro Power Pvt Ltd EIA study of Talong Londa H.E. Project
R S Envirolink Technologies Pvt. Ltd. 7.9
Environmental well being: This aspect has been dealt in detail in EIA/EMP
report and the measures of mitigation have been proposed. These include
discussion of impact of the project activity on resource sustainability and resource
degradation, due to proposed activity; bio-diversity friendliness; impact on human
health; reduction of levels of pollution.
Technological well being: The CDM project activity should lead to transfer of
environmentally safe and sound technologies that are comparable to best feasible
practices in order to assist in up-gradation of the technological base. The transfer
of technology can be within the country or from other countries.
The latest technological options are being considered for the Talong Londa HEP
and will be incorporated in relevant chapters of DPR.
7.6 MODALITIES AND PROCEDURES FOR CDM RUN-OF RIVER TALONG LONDA
HYDRO ELECTRIC PROJECTS
The following are the important parameters required for successful registration of
the CDM projects as per UNFCCC guidelines:
Methodology
The methodology, ACM0002 (Version 14) is applicable to grid-connected
renewable power generation. Talong Londa HEP activity involves electricity
generation under the following conditions.
The CDM project activity vis-à-vis applicability conditions for Talong Londa HEP in
the ACM0002 (version 14) is described below in Table 7.1:
Table 7.1 CDM Project Activity for Talong Londa
Condition Applicability to Talong Londa HEP
Applies to electricity capacity additions from: Run of-river hydro power plants; hydro power projects with existing reservoirs where the volume of the reservoir is not increased.
The Talong Londa HEP is a grid connected hydro power project
New hydroelectric power projects with reservoirs having power densities (installed power generation capacity divided by the surface area at full reservoir level) greater than 4 W/m2
Talong Londa is a new hydroelectric project with a reservoir having a power density of 64.29 W/m2.

GMR Londa Hydro Power Pvt Ltd EIA study of Talong Londa H.E. Project
R S Envirolink Technologies Pvt. Ltd. 7.10
This methodology is not applicable to project activities that involve switching from fossil fuels to renewable energy at the site of the project activity, since in this case the baseline may be the continued use of fossil fuels at the site;
Talong Londa HEP renewable energy project with no fuel-switch involved.
The geographic and system boundaries for the relevant electricity grid can be clearly identified and information on the characteristics of the grid is available
Talong Londa HEP project activity shall supply power to NR Grid via PGCIL regional grids of North East Region, Eastern Region and also the inter-regional transmission grids between each of these regional grids. This in turn caters to electricity demand in various states in North India. The NR Grid encompasses all power plants supplying power through the grid to the states of Delhi, Haryana, HP, Jammu & Kashmir, Punjab, Rajasthan, Uttar Pradesh, Uttaranchal, and Union Territory of Chandigarh. Adequate data is available to estimate grid emission factor.
Baseline Scenario
The Talong Londa HEP is the installation of a new grid-connected renewable
power plant/unit; the baseline scenario is the following:
Electricity delivered to the grid by the project activity would have otherwise been
generated by the operation of grid-connected power plants and by the addition of
new generation sources, as reflected in the combined margin approach (CM)
calculations described in the tool7.
The Talong Londa HEP will inject the clean renewable energy in the Northern grid
and hence displaces the fossil fuel based electricity generation from the Northern
grid. As per the Methodology the Northern grid emission factor calculation has to
be evaluated from the above mentioned tool.
Additionality
The one of the most essential criteria to successfully qualify as a Registered CDM
Project is to prove additionality i.e. to conclude that the project is not a “business
as usual scenario”. One has to establish that the planned GHG emissions
reductions would not occur without the additional incentive provided by emission
reductions credits. The additionality of the project activity shall be demonstrated
and assessed using the latest version of the “Tool for the demonstration and
assessment of additionality” (Version 7.0.0).
http://cdm.unfccc.int/methodologies/PAmethodologies/tools/am-tool-07-v4.0.pdf

GMR Londa Hydro Power Pvt Ltd EIA study of Talong Londa H.E. Project
R S Envirolink Technologies Pvt. Ltd. 7.11
The detail barriers analysis for Talong Londa HEP is explained below.
Financial Closure
The Talong Londa HE project activity is a large scale hydro power project and
there were many barriers faced by project proponents for the project activity
implementation. Financial closure is the major barrier faced by the project activity
due to delays in regulatory approvals from state and central government of India.
High Capital Cost
The development of Talong Londa HEP will entail high capital cost, long gestation
period, difficult terrains, geological risks, hydrological risks and rehabilitation and
resettlement related issues. This explains the reason, why the large hydro power
potential of India (around 150,000 MW), only 17% has been exploited and only
14% has been used for generation, despite low Operation & Maintenance (O&M)
cost involved in the operation of the projects.
Low Return on the Investments
The development of the Talong Londa HEP activity without considering it as CDM
project activity is financially less attractive than other investment options and not
feasible. The project activity entails high capital cost and low Internal Rate of
Return (IRR) of the project without considering CDM benefits is low.
Risk Perception of Lenders
Indian Banks and Financial institutes view hydro power projects by private sector
companies as risky ventures because of (i) their limited experience in financing
hydro projects for private sector; (ii) the lack of full hydrological insurance cover,
and (iii) volatility in electricity prices which make revenues unstable. Lenders
require higher equity participation from the investors to cover for the risk inherent
in private sector-promoted hydro power projects (as high as 50% equity
component as against 30% for equity component approved by Government). This
makes financial closure difficult to achieve for hydro projects. Because of high
capital cost and risk perception of lenders, it is difficult to arrange capital for hydro
power projects in India.
Infrastructural Barrier
The Project activity is located in a hilly, remote area in Arunachal Pradesh. Lack of
infrastructural facilities is a major barrier for project implementation.

GMR Londa Hydro Power Pvt Ltd EIA study of Talong Londa H.E. Project
R S Envirolink Technologies Pvt. Ltd. 7.12
Evacuation Facility
The Talong Londa HEP activity is in hilly area and is surrounded by dense forest
with no power evacuation facility in the nearby area. Project proponents need to
develop a power transmission network to evacuate power generated in the power
plant. This will require commitment of additional financial & managerial resources
from owner.
Geological Risk
Two water streams are linked underground for power plant construction. As the
power project is located in a hilly area, it faces a huge geological risk of
encountering hard rocky structure for excavation leading to cost and time over
run. Also erosion of turbine components due to high head and sand/silt content
(and also due to quartz crystals of high hardness) in the water may be excessive
and reduce the annual energy production.
Heavy Rainfall
The heavy precipitation rate in the project activity area is 2116 (annual average).
This will affect the project work and site accessibility during construction phase
and will lead to increase in the gestation period leading huge financial investment.
Project Boundary
The spatial extent of the project boundary includes the project power plant and all
power plants connected physically to the electricity system that the CDM project
power plant is connected to. For Talong Londa HEP, the project boundary
consists of power house which shall be physically connected to the North grid via
its own Associated Transmission Line and sub-station to the Talong pooling point
of the grid.
7.7 GHG REDUCTIONS FROM THE PROJECT ACTIVITY
Based on details given in the Central Electricity Authority (CEA)‟s user guide for
the CO2 Baseline data (version 9) for the Indian Power Sector8, the combined
margin approach for CO2 emission reduction calculation will be applied and the
Northern grid emission factor will be fixed as ex-ante for the entire fixed crediting
period (The crediting period for a CDM project activity is the period for which
reductions from the baseline are verified and certified by a designated operational
entity for the purpose of issuance of certified emission reductions (CERs) of 7
8 www.cea.nic.in/planning/c%20and%20e/Government%20of%20India%20website.html

GMR Londa Hydro Power Pvt Ltd EIA study of Talong Londa H.E. Project
R S Envirolink Technologies Pvt. Ltd. 7.13
years. The Table 7.2 shows the calculation sheet for expected GHG reductions for
Talong Londa HEP.
Table 7.2 Expected GHG reductions for Talong Londa HEP
Year Electricity Generation
(MWh)
Baseline Emission
factor (tCO2/MWh)
Baseline Emissions
(tCO2)
Project activity
emissions (tCO2)
Leakage (tCO2)
Emission Reductions
(tCO2)
2018 875626 0.98 858,114 0 0 858114 2019 875626 0.98 858,114 0 0 858114 2020 875626 0.98 858,114 0 0 858114 2021 875626 0.98 858,114 0 0 858114 2022 875626 0.98 858,114 0 0 858114 2023 875626 0.98 858,114 0 0 858114 2024 875626 0.98 858,114 0 0 858114 Total 6129384 6006796 0 0 6,006,796
Total number of crediting years 7 Annual average over the crediting period of estimated reductions (tonnes of CO2e) 858,114
7.8 CER REVENUE
This project has a net potential to generate is 875,626 MWh of power which
results in emission reductions of approximately 858,114 tCO2 per year and total of
6,006,796 tonnes of CO2 in total crediting period of 7 years. Looking at the present
scenario, and taking an optimum market value of 1 EURO per CER and an
exchange rate of Rs. 70/- per Euro, the Talong Londa H.E.P would generate
revenue of about Rs. 420,475,729 (~ 43) Crores in crediting period of 7 years. 7.9 TALONG LONDA HEP SUSTAINABLE DEVELOPMENT ACTION PLAN FOR
THE CDM CREDITING PERIOD
As a responsible corporate entity, GMR Group has been involved in numerous
community development activities through its GMR Varalakshmi Foundation
(GMRVF) at its business units. Accordingly, the Talong Londa Hydroelectric
Project team and the Foundation team based at project site are engaged with
community development activities and have been providing basic welfare
services. The development activities have been helpful to win the confidence and
trust of the community and also to ensure and enhance their active participation.
Efforts will be made to ensure the achievement through the planned intervention.
Women Empowerment
Quality Education

GMR Londa Hydro Power Pvt Ltd EIA study of Talong Londa H.E. Project
R S Envirolink Technologies Pvt. Ltd. 7.14
General Health & Hygiene
Community Development
Youth Training and Empowerment
The sustainable development initiatives will strictly follow the stipulated guidelines
of MoEF i.e. 2% of issued CER revenue will be utilized for society and community
development in the project region throughout the crediting period of the project. 7.10 CONCLUSION
The Talong Londa H.E. Project in India is a one of the unique projects with
respect to various parameters as mentioned above. Considering the positive
effect it would have on the developmental activities in India, harnessing untapped
hydro potential in India and contributing both to India and India‟s sustainable
development, the effective implementation of this project will be a milestone.
However, GMR Londa Hydro Power Pvt. Limited would have to defy boundaries,
barriers to implementation and risks to profit from the project.
Considering an inventory of barriers that are associated with the implementation
of the project, CDM revenues would help in alleviating the risks, both financial and
technical, associated with the project. Successful registration of the project would
also help to strengthen hydropower sector and attracting foreign investment in
India.
The proposed CDM project Talong Londa H.E. Project would result in the
sustainable development to the local community in India thorough socio-economic
well being environmental well being and technological well being.

GMR Londa Hydro Power Pvt Ltd EIA study of Talong Londa H.E. Project
R S Envirolink Technologies Pvt. Ltd. 8.1
CHAPTER 8
ENVIRONMENT FLOW STUDY
8.1 INTRODUCTION
Development of hydropower project leads to diversion of river water and/or
alteration of the flow regime by damming the river; therefore, environment flow
release is recommended to ensure that river stretch downstream of dam should
have adequate water at all times to sustain the ecology and environment of the
affected reach. Ecological systems supported by the rivers are too complicated to
be summarized by a single minimum flow requirement but require comprehensive
environmental flow regimes to be defined. "Environmental flow regime" means a
schedule of flow quantities that reflects seasonal fluctuations and should be
adequate to support a sound ecological environment to maintain productivity,
extent, and persistence of key aquatic habitats in and along the affected water
bodies.
Various types of projects affect the downstream river stretch differently. Run of the
river schemes involving diversion of water through head race tunnels make the
stretch between diversion structure and tail water release point dry in the absence
of adequate releases. Projects with powerhouses at the toe of the dam, may not
make the significant intermediate river stretches dry, however, during water
storage for diurnal peaking especially in lean period, entire downstream stretch
can become dry in the absence of environment flow release. The most critical
reach for assessing release of environmental flow is immediately downstream of
diversion structure till first significant tributary meets river. Based on a scientific
study, environment flow release for the critical reach is assessed and
recommended to be released to minimize the impact.
8.2 NORMS FOR ENVIRONMENTAL FLOW
There are no set norms for minimum releases to be maintained at all times on
account of ecology and environment and to address issues concerning riparian
rights, drinking water, health, aquatic life, wildlife, fisheries, silt and even to honour
the sensitive religious issues like cremation and other religious rites, etc. on the
river banks. No state has any set policy for minimum flows except Himachal
Pradesh state government which has declared its policy regarding ensuring
minimum flow of water in HEPs / ROR projects to ensure minimum flow of 15%
water immediately downstream of the diversion structure of the project throughout

GMR Londa Hydro Power Pvt Ltd EIA study of Talong Londa H.E. Project
R S Envirolink Technologies Pvt. Ltd. 8.2
the year. For the purpose of determination of minimum discharge, the average
discharge in the lean months i.e. from December to March is considered.
8.3 SCOPE OF STUDY
Scoping Clearance letter issued by MoEF on August 10, 2010 has stipulated that,
“During the lean season at least one turbine remains operational to maintain
sufficient flow in river in such a way so that a minimum of 0.5 m water depth
is available in the river stretch for sustaining the aquatic life during the
running of the project. A scientific study should be undertaken to estimate
the required environment flow.
Keeping the above scope in view, a scientific study has been undertaken to
establish the flow requirement in lean, monsoon and remaining four months based
on ecological and downstream use considerations and outcome is discussed in
following text.
8.4 IDENTIFICATION OF CRITICAL STRETCH
Talong Londa HEP is planned on Kameng river. Immediate upstream project is
Marjingla HEP with proposed TWL as 490 m and on downstream side Kameng
dam is proposed with 375 m FRL. None of these projects have been accorded
scoping clearance. A longitudinal profile of the Kameng river is prepared showing
the location of Talong Londa HEP and that of upstream and downstream projects
and is given at Figure 8.1 below.
Figure 8.1: Longitudinal Profile of Kameng River

GMR Londa Hydro Power Pvt Ltd EIA study of Talong Londa H.E. Project
R S Envirolink Technologies Pvt. Ltd. 8.3
There is a free flowing stretch of about 500m with upstream project at present,
however, the upstream project has not yet finalized their features and approached
authorities for Scoping Clearance, it is likely that this distance may increase.
Length of reservoir of Talong Londa is about 12.8 Km; there is no intermediate
river stretch between dam and power house as this is dam toe project and tail
water discharge channels drains just downstream of plunge pool.
Further, about 950 m downstream from dam, Pachi river meets Kameng on left
bank. This is a major tributary with 356.48 sq km of catchment area and a planned
Phanchung hydropower project (45 MW). Powerhouse of Phanchung HEP is
planned along left bank of Kameng river, just upstream of the confluence of Pachi
river with Kameng river.
Downstream of Talong Londa HEP, Kameng river is very flat with average slope of
1 in 350 for next 15 Km and there is no planned project in this reach. Kameng
Dam HEP with proposed FRL of 375 m is about 15 Km downstream of Talong
Londa HEP. This project has not been accorded scoping clearance as of now.
The stretch, which will get affected due to diurnal variation in flow regime
especially during lean season is the entire stretch downstream of dam and initial
950 m is considered critical stretch, after that contribution of Pachi river will add to
Kameng’s flow.
8.5 BASELINE DATA ON WATER QUALITY AND AQUATIC ECOLOGY
To study various physico-chemical characteristics of Kameng river in the study
area of proposed hydro-electric project sampling was carried out at six locations
(W1 to W6) for three different seasons viz. winter, pre-monsoon and post-
monsoon seasons and results are discussed in chapter 3 and data is given in
Table 3.7 through 3.9. Aquatic Ecology including Fish Fauna of Kameng river is
discussed in Chapter 04, section 4.3 and data is given in 4.11 to 4.17.
8.6 HABITAT REQUIREMENT
a) Requirement Based on the Downstream Users
The construction of dam and storage of water for peaking power generation would
lead to the reduction in water discharge in the critical river stretch downstream of
dam mainly during lean season. There is no significant population in this stretch
with direct dependence on river water for agriculture/other needs, therefore,
quantified water requirement for downstream user is not there.

GMR Londa Hydro Power Pvt Ltd EIA study of Talong Londa H.E. Project
R S Envirolink Technologies Pvt. Ltd. 8.4
b) Requirement Based on the Aquatic Life
As discussed in the baseline section, the survey results indicate that Mahseer is
the dominant species which, contributes 35-45% of the total catch which is
followed by Acrossocheilus sp. (18-20%), Labeo sp. (10-15%), Chagunius
chagunio (10%), Salmostoma bacaila (4-8%), Schizothorax sp. (1-2%) and
miscellaneous species (10-12%). The length of Tor putitora caught during the
fisheries survey ranged from 100-250 mm, with weight varying 50-400 g. The
catch per man hour in one km stretch of river Kameng about 15 km downstream
of the proposed dam site, varied from 450 to 650g. The occurrence of varying
sizes of T. putitora and Acrossocheilus hexagonolepis in cast net catch (100-250
mm) indicates the possibility of the spawning of this species in this stretch of the
river. Mahseer is normally observed at elevations between 300 and 800 m above
mean sea level. They migrate to the lower reaches for spawning. During the
fisheries survey conducted in the project area, which has an elevation ranging
from 400-500 m above mean sea level (MSL), fish Mahseer was observed. They
come to the area for spawning purposes.
The construction of Talong Londa HEP would create and obstruction on the
migration route of Mahseer, however by ensuring adequate flow in the
downstream stretch throughout the year, continuity of habitat can be maintained
for this reach of Kameng with Pachi and other tributaries meeting in the
downstream reach.
To assess the habitat requirement, Mahseer has been considered as the dominant
species as per EIA Baseline survey. Environment flow release, meeting the habitat
requirement of Mahseer is considered adequate for other species present. The
depth requirement for Mahsheer is 0.5 m and velocity from 0.5 to 1.5 m/s.
Therefore for the purpose of this study, minimum depth in lean period should be
0.5 m and same is recommended by EAC during scoping clearance. Velocity vary
across the width of the river and when there is higher velocity at center the fish
fauna get desired velocity towards the banks.
8.7 FLOWS AVAILABLE
90% dependable year has been worked based on 10-daily flow series from 1969-
70 to 1980-81 at Talong Londa HEP which is year 1978-79. Data is tabulated at
Table 8.1 along with monthly average values.

GMR Londa Hydro Power Pvt Ltd EIA study of Talong Londa H.E. Project
R S Envirolink Technologies Pvt. Ltd. 8.5
Table 8.1: 10-Daily Flow Series for 90% Dependable Year
Month Discharge (cumec) 10 Daily Average Monthly
Average Jun-I 209.91
296.20 Jun-II 308.02 Jun-III 370.67 Jul-I 322.42
329.22 Jul-II 325.78 Jul-III 339.45 Aug-I 494.01
348.45 Aug-II 316.16 Aug-III 235.18 Sep-I 288.57
300.12 Sep-II 345.09 Sep-III 266.71 Oct-I 270.36
210.97 Oct-II 194.80 Oct-III 167.75 Nov-I 139.75
129.34 Nov-II 128.26 Nov-III 120.00 Dec-I 98.00
82.76 Dec-II 79.25 Dec-III 71.04 Jan-I 61.47
56.81 Jan-II 56.99 Jan-III 51.96 Feb-I 49.53
47.93 Feb-II 49.20 Feb-III 45.07 Mar-I 42.93
43.17 Mar-II 42.28 Mar-III 44.31 Apr-I 55.52
63.10 Apr-II 66.82 Apr-III 66.95 May-I 79.00
80.62 May-II 57.59 May-III 105.26
As can be seen from the above data, monsoon period is June-September, from
October onwards flow start decreasing, lean period starts from January and
extends upto April. Flow start increasing again during the month of May.

GMR Londa Hydro Power Pvt Ltd EIA study of Talong Londa H.E. Project
R S Envirolink Technologies Pvt. Ltd. 8.6
8.8 SIMULATION OF RELEASE FROM THE DAM
Surveyed river cross-sections are available for the critical river stretch of 1 km
immediate downstream of Talong Londa HEP and same were used for the
modeling study to simulate the flow so as to establish the requirement of release
from the Dam. Modeling has been carried out on MIKE 11 software. River cross
section at these locations were taken and various flow releases were simulated to
work out the depth and velocity during different release scenarios. Manning’s
coefficient has been taken as 0.04.
As can be seen from the discharge series of 90% DY, four leanest months are
Jan-April and average flow in lean season is 52.75 cumec. 100% release is taken
equivalent to average flow of that particular period in 90% dependable year i.e.
baseline scenario without any dam. Further scenarios were simulated for releases
of 10%, 15%, 20%, 25%, 30%, 40% and 50% of average value. For each scenario
depth, velocity and water width of flow were worked out and same is summarized
in the Table 8.2 and 8.3.
Table 8.2: Results of Simulation
Location
River bed (m)
Water level (m)
Water depth (m)
Flow velocity
(m/s) Flow
width (m) 10% Release Scenario (5.275 cumec)
KAMENG 0.00 411.00 411.98 0.98 0.518 11.293 KAMENG 93.00 410.90 411.87 0.97 1.03 5.34 KAMENG 245.00 410.60 411.49 0.89 0.805 7.94 KAMENG 445.00 410.43 411.29 0.86 0.42 29.32 KAMENG 495.00 410.10 411.22 1.12 0.915 9.43 KAMENG 585.00 410.10 410.92 0.82 1.457 7.24 KAMENG 745.00 409.10 410.461 1.36 0.422 17.741 KAMENG 1154.00 409.00 410.197 1.20 0.718 16.098 Average
1.02 0.79 13.05
15% Release Scenario (7.9125 cumec) KAMENG 0.00 411.00 412.211 1.21 0.628 12.156 KAMENG 93.00 410.90 412.077 1.18 1.274 6.498 KAMENG 245.00 410.60 411.656 1.06 0.945 8.735 KAMENG 445.00 410.43 411.476 1.05 0.432 30.086 KAMENG 495.00 410.10 411.408 1.31 0.99 10.388 KAMENG 585.00 410.10 411.118 1.02 1.708 8.937

GMR Londa Hydro Power Pvt Ltd EIA study of Talong Londa H.E. Project
R S Envirolink Technologies Pvt. Ltd. 8.7
Location
River bed (m)
Water level (m)
Water depth (m)
Flow velocity
(m/s) Flow
width (m) KAMENG 745.00 409.10 410.637 1.53 0.493 20.751 KAMENG 1154.00 409.00 410.344 1.34 0.798 16.787 Average
1.21 0.91 14.29
20% Release Scenario (10.55 cumec) KAMENG 0.00 411.00 412.404 1.40 0.722 12.88 KAMENG 93.00 410.90 412.253 1.35 1.478 7.466 KAMENG 245.00 410.60 411.793 1.19 1.066 9.404 KAMENG 445.00 410.43 411.615 1.19 0.466 30.657 KAMENG 495.00 410.10 411.541 1.44 1.107 11.053 KAMENG 585.00 410.10 411.234 1.13 1.766 9.516 KAMENG 745.00 409.10 410.796 1.69 0.548 23.455 KAMENG 1154.00 409.00 410.49 1.49 0.846 17.477 Average
1.36 1.00 15.24
25% Release Scenario (13.1875 cumec) KAMENG 0.00 411.00 412.571 1.57 0.787 13.507 KAMENG 93.00 410.90 412.407 1.51 1.658 8.319 KAMENG 245.00 410.60 411.917 1.32 1.171 10.008 KAMENG 445.00 410.43 411.74 1.31 0.497 31.174 KAMENG 495.00 410.10 411.661 1.56 1.207 11.655 KAMENG 585.00 410.10 411.343 1.24 1.823 10.06 KAMENG 745.00 409.10 410.942 1.84 0.586 26.331 KAMENG 1154.00 409.00 410.637 1.64 0.877 18.166 Average
1.50 1.08 16.15
30% Release Scenario (15.825 cumec) KAMENG 0.00 411.00 412.719 1.72 0.827 14.064 KAMENG 93.00 410.90 412.547 1.65 1.821 9.091 KAMENG 245.00 410.60 412.03 1.43 1.264 10.561 KAMENG 445.00 410.43 411.856 1.43 0.525 31.649 KAMENG 495.00 410.10 411.771 1.67 1.297 12.206 KAMENG 585.00 410.10 411.444 1.34 1.883 10.567 KAMENG 745.00 409.10 411.077 1.97 0.602 29.996 KAMENG 1154.00 409.00 410.784 1.78 0.899 18.856 Average
1.62 1.14 17.12

GMR Londa Hydro Power Pvt Ltd EIA study of Talong Londa H.E. Project
R S Envirolink Technologies Pvt. Ltd. 8.8
Table 8.3: Comparison of water depth and velocity in downstream of project
10 % of average
(5.257 cumec)
15 % of average
(7.91 cumec)
20 % of average
(10.55 cumec)
25 % of average
(13.18 cumec)
30 % of average
(15.82 cumec) Depth Vel. Depth Vel. Depth Vel. Depth Vel. Depth Vel. KAMENG 0.00 0.98 0.518 1.21 0.628 1.40 0.722 1.57 0.787 1.72 0.827 KAMENG 93.00 0.97 1.03 1.18 1.274 1.35 1.478 1.51 1.658 1.65 1.821 KAMENG 245.00 0.89 0.805 1.06 0.945 1.19 1.066 1.32 1.171 1.43 1.264 KAMENG 445.00 0.86 0.42 1.05 0.432 1.19 0.466 1.31 0.497 1.43 0.525 KAMENG 495.00 1.12 0.915 1.31 0.99 1.44 1.107 1.56 1.207 1.67 1.297 KAMENG 585.00 0.82 1.457 1.02 1.708 1.13 1.766 1.24 1.823 1.34 1.883 KAMENG 745.00 1.36 0.422 1.53 0.493 1.69 0.548 1.84 0.586 1.97 0.602 KAMENG 1154.00 1.20 0.718 1.34 0.798 1.49 0.846 1.64 0.877 1.78 0.899 Average 1.02 0.79 1.21 0.91 1.36 1.00 1.50 1.08 1.62 1.14
8.9 CONCLUSION
Operation of the Talong Londa HEP has been planned for peaking and non-
peaking hour power generation during high discharge period from June to
November and only peaking hour power generation during low discharge period
i.e. December to May. Peaking and non-peaking hour generation planned based
on 90% Dependable Year (DY) discharge data is given at Table 8.3 below.
Table 8.4: Peaking and Non-Peaking hour Generation Capability in 90% DY
Month Discharge (cumec)
Peaking Capability (Hr)
Non Peaking Capability (Hr)
Jun 209.91 6.00 18.00 308.02 6.00 18.00 370.67 6.00 18.00
Jul 322.42 6.00 18.00 325.78 6.00 18.00 339.45 6.00 18.00
Aug 494.01 6.00 18.00 316.16 6.00 18.00 235.18 6.00 18.00
Sep 288.57 6.00 18.00 345.09 6.00 18.00 266.71 6.00 18.00
Oct 270.36 6.00 18.00

GMR Londa Hydro Power Pvt Ltd EIA study of Talong Londa H.E. Project
R S Envirolink Technologies Pvt. Ltd. 8.9
Month Discharge (cumec)
Peaking Capability (Hr)
Non Peaking Capability (Hr) 194.80 6.00 18.00
167.75 3.00 21.00
Nov 139.75 3.00 21.00 128.26 3.00 21.00 120.00 3.00 21.00
Dec 93.77 6.00 0.44 75.02 5.16 0.00 66.81 4.59 0.00
Jan 57.24 3.93 0.00 52.76 3.63 0.00 47.73 3.28 0.00
Feb 45.30 3.11 0.00 44.97 3.09 0.00 40.84 2.81 0.00
Mar 38.70 2.66 0.00 38.05 2.61 0.00 40.08 2.75 0.00
Apr 51.29 3.52 0.00 62.59 4.30 0.00 62.72 4.31 0.00
May 74.77 5.14 0.00 53.36 3.67 0.00
101.03 6.00 0.94
As can be seen from the Table, for the monsoon period (June to September) and
two 10-daily period of October; there will be 6 hours of peaking generation and 18
hours of non-peaking generation. This will be changed to 3 hours of peaking and
21 hours of non-peaking generation during November. Peaking discharge is
considered equivalent to design discharge of 349.23 cumec and there will be
minimum one machine will be running during non-peaking hours. Hence, during
this period of 6 months period (June – November) there will always water
available in the downstream stretch.
In the remaining 6 months (December- May), flow will be available in the
downstream stretch only during peaking power generation say for 2.66 to 6 hours
daily. Pachi river meets on left bank at about 950 m downstream of dam.
Therefore, adequate release should be made from Talong Londa HEP to reduce
the impact on entire downstream stretch of 950 m for aquatic life for remaining
non peaking hours.
Results of simulation are discussed in Table 8.3. As the river is flat, the discharge
of 5.275 cumec (10% of lean season average) is giving depth of more than 82 cm
at all the cross sections. The flow velocity is in range of 0.42 to 1.457 cumec. The
pre-project average of 52 cumec during lean period and over 80 cumec during

GMR Londa Hydro Power Pvt Ltd EIA study of Talong Londa H.E. Project
R S Envirolink Technologies Pvt. Ltd. 8.10
May and December, the release of 5.275 cumec for 950m river stretch till the
confluence of Pachi River is sufficient. Therefore, a minimum of 5.275 cumec
(10% of average lean season discharge in 90% DY) release is recommended
during entire non peaking period from December to May. This flow will be
released from dam during non-peaking hours when no machine is running to
ensure water availability in the downstream stretch. An additional dam toe turbine
can also be considered for non-peaking hour power generation during lean period
to utilize the flow.
The above study fulfills the requirement of ToR, for criteria of minimum river depth
of 0.5 m in downstream of dam for aquatic life.

No.J.12011/1S/2007-IA.I
Shri RSRana G M R Energy limited J 3 , Dhawan Deep Building No.6, Jantar Mantar Road , New Delhi - 110001
<JR : Telegrom : PARYAVARAN.
NEW OELHI ~TIfT1f : TelePhone : & Fax 24362827 ~: Telex: W-681 85 DOE IN FAX: 4360618
"I'lTtI" ~
'f'IRl:ar q.i "" zi,rr.r1f GOVERNMENT OF INDIA
MINISTRY OF ENVIRONMENT & FORESTS 'f'Ir.1:"1' ~. m. <It. orr . .. I ... ~ ....
PARYAVARAN SHAVAN. C.G.O. COMPLEX ~ ~, 'ff fi:lo<oi't-11 0003
LODHI ROAD. NCW DELHI-110003
23.03.2007
Subject - Tolong Hydro-electric Power Project (160 MW) in Arunachal Pradesh - Scoping regarding.
Sir,
This has reference to your letter No. GEUtolonglTORIMoEF/07.dated 9th February 2007 on the above mentioned subject. The proposal was considered by the expert committee at its meeting held on 22 nd February 2007.The committee noted that the project involves cqnstruction of 102 m high dam above deepest river bed. The site of the dam is located at Village - Pachi in Arunachal Pradesh. The construction period envisaged is 4 years and the cost of the project is Rs. 903.92 Crores.
2. The Ministry of Environment and Forests hereby accords clearance for preconstruction activities in the proposed sites , as per the provisions of Environmental Impact Assessment Notification, 2006, along with the following Terms of ReferenceCTOR) for preparation of EIA report. These TORs are in addition to the proposed TORs mentioned in the FORM 1.
a) Structure height [damlbarrage height] b) Construction methodology/period c) Design discharge & its RI [Recurrence interval] d) Submergence area e) Water body inundating forest area f) Compensatory afforestation g) Design earthquake parameter
00003008
Text Box
ANNEXURE -I

-2
h) Comprehensive EIA report should· include three seasons data viz. pre-monsoon, monsoon & post-monsoon including winter
i) Indicate distance from biosphere reserve on a map. j) For project affected families who are likely to loose land only,
the following information are to be given land available before acquisition land taken from them and land remaining with the family In case 70% of land of any family is taken, then that family should be counted as a fully affected family
k) Shannon- Weaver diversity index, plant fossil, phytoplankton as well as micro-fauna, avifauna, animal fossil
I) Details on tunneling aspect, such as machines to be employed, for controlled blasting charge density etc.
m) Comprehensive downstream impact. This shall include not only the bypassed stretch of the river but also downstream of the power house. The issue is not only about quantities of minimum flows to be maintained in the bypassed reach but also about the overall ecological impacts within 10 km radius
n) Dambreak analysis & disaster management 0) Critically degraded catchment area should be identified as per
AISLUS method; year-wise physical and financial target in the CAT plan.
p) Options assessment study: Show what are the options available for fulfilling the needs of the people that the project hopes to deliver. This section should also show if and how the proposed project is the least cost option and also include reducing the transmission and distribution losses to the minimum.
q) Impact of DG sets on surrounding environment. r) Snow-fed and rain-fed regions in the catchment area need to be
demarcated.
Copyto;-
Yours faithfully,
J~ (Dr. S. Bhowmik)
Additional Director
1. Secretary, Ministry of Power, Shram Shakti, Bhawan, Rafi Marg, New Delhi-11 0001 .
2. Secretary, Department of Power, Govt. of Arunachal Pradesh . . Secretariat, Itanagar.
3. Member Secretary, State Pollution Control Board, Itanagar, A. P. 4. CCF, Regional Office, Ministry of Environment & Forests,
Shillong. 3 !L~'l.
(Dr. S. Bhowmik) Additional Director

00003008
Text Box
ANNEXURE -II


GMR Londa Hydro Power Pvt Ltd EIA study of Talong Londa H.E. Project
R S Envirolink Technologies Pvt. Ltd. Annexure III.1
Annexure-III Project Layout

Annexure IV
List of Plants Recorded from Study Area
List of Angiosperms
S.no Family Species 1 Acanthaceae Rungia parviflora 2 Acanthaceae Strobilanthes paniculata 3 Acanthaceae Justicia procumbens 4 Actinidiaceae Saurauia roxburghii 5 Alangiaceae Alangium begonifolium 6 Altingiaceae Altingia excelsa 7 Amaranthaceae Celosia argentea 8 Amaranthaceae Achyranthes bidentata 9 Anacardiaceae Mangifera sylvatica 10 Anacardiaceae Pegia nitida 11 Anacardiaceae Rhus javanica 12 Anacardiaceae Rhus scandens 13 Anacardiaceae Spondias pinnata 14 Annonaceae Miliusa globosa 15 Apiaceae Centella asiatica 16 Apocynaceae Wrightia arborea 17 Araceae Colocasia affinis 18 Araceae Colocasia esculenta 19 Araceae Rhaphidophora decursiva 20 Araceae Alocasia forniculata 21 Araliaceae Heteropanax fragrans 22 Araliaceae Schefflera wallichii 23 Araliaceae Trevesia palmata 24 Arecaceae Calamus floribundus 25 Asclepiadaceae Hoya lanceolata 26 Asteraceae Ageratum conyzoides 27 Asteraceae Anaphalis triplinervis 28 Asteraceae Artemisia nilagirica 29 Asteraceae Bidens biternata 30 Asteraceae Bidens pilosa 31 Asteraceae Eupatorium odoratum 32 Asteraceae Galinsoga parviflora 33 Asteraceae Mikania micrantha 34 Asteraceae Spilanthes paniculata 35 Asteraceae Tridax procumbens 36 Asteraceae Blumea aromatica 37 Asteraceae Chromolaena odorata 38 Asteraceae Galinsoga parviflora 39 Balsaminaceae Impatiens chinensis 40 Begoniaceae Begonia roxburghii

41 Bignoniaceae Oroxylum indicum 42 Bignoniaceae Sterospermum chelonoides 43 Bombacaceae Bombax ceiba 44 Boraginaceae Cordia dichotoma 45 Brassicaceae Cardamine hirsuta 46 Burseraceae Canarium bengalensis 47 Caryophyllaceae Drymaria cordata 48 Chenopodiaceae Chenopodium ambrosioides 49 Combretaceae Terminalia myriocarpa 50 Commelinaceae Commelina appeniculata 51 Commelinaceae Commelina benghalensis 52 Commelinaceae Commelina cristata 53 Commelinaceae Cyanotis vaga 54 Commelinaceae Floscopa scandens 55 Commelinaceae Forrestia mollissima 56 Convolvulaceae Rivea ornata 57 Cyperaceae Cyperus compactus 58 Cyperaceae Cyperus cyperoides 59 Cyperaceae Cyperus kyllingia 60 Cyperaceae Scleria terrestris 61 Cyperaceae Carex cruciata 62 Dilleniaceae Dillenia scabrella 63 Dioscoreaceae Dioscorea bulbifera 64 Euphorbiaceae Bischofia javanica 65 Euphorbiaceae Croton oblonga 66 Euphorbiaceae Macaranga denticulata 67 Euphorbiaceae Mallotus nepalensis 68 Euphorbiaceae Ostodes paniculata 69 Euphorbiaceae Phyllanthus cuscutiflorus 70 Euphorbiaceae Euphorbia hirta 71 Fabaceae Desmodium laxiflorum 72 Fabaceae Desmodium triflorum 73 Fabaceae Acacia gageana 74 Fabaceae Albizia arunachalensis 75 Fabaceae Albizia lebbeck 76 Fabaceae Bauhinia purpurea 77 Fabaceae Cassia alata 78 Fabaceae Cassia occidentalis 79 Fabaceae Dalbergia clarkei 80 Fabaceae Dalbergia rimosa 81 Fabaceae Dalbergia sissoo 82 Fabaceae Erythrina stricta 83 Fabaceae Erythrina variegata 84 Fabaceae Indigofera dosua 85 Fabaceae Millettia pachycarpa 86 Fagaceae Castanopsis indica

87 Fagaceae Castanopsis tribuloides 88 Fagaceae Mimosa pudica 89 Flacourtiaceae Xylosma controversum 90 Geraniaceae Geranium nepalensis 91 Gesneriaceae Chirita oblongifolia 92 Gesneriaceae Loxostigma griffithii 93 Lauraceae Cinnamomum bejolghota 94 Lauraceae Lindera neesiana 95 Lauraceae Litsea monopetala 96 Lauraceae Phoebe lanceolata 97 Leeaceae Leea indica 98 Lythraceae Duabanga grandiflora 99 Lythraceae Lagerstroemia acuminata
100 Malvaceae Abroma angusta 101 Malvaceae Kydia glabrescens 102 Malvaceae Kydia calycina 103 Malvaceae Sida acuta 104 Malvaceae Sterculia kingii 105 Malvaceae Urena lobata 106 Melastomataceae Melastoma normale 107 Melastomataceae Osbeckia nepalensis 108 Melastomataceae Oxyspora cernua 109 Melastomataceae Osbeckia nutans 110 Moraceae Artocarpus lakoocha 111 Moraceae Ficus cunia 112 Moraceae Ficus fistulosa 113 Moraceae Ficus glomerata 114 Moraceae Ficus lamponga 115 Moraceae Ficus roxburghii 116 Moraceae Ficus semicordata 117 Moraceae Ficus silhentensis 118 Moraceae Ficus squamata 119 Musaceae Musa acuminata 120 Musaceae Musa balbisiana 121 Myrsinaceae Embelia sp. 122 Myrsinaceae Maesa chisia 123 Myrsinaceae Maesa ramentacea 124 Myrtaceae Horsfieldia amygdalina 125 Myrtaceae Syzygium sp. 126 Onagraceae Oenothera acaulis 127 Orchidaceae Bulbostylis densa 128 Orchidaceae Liparis viridiflora 129 Oxalidaceae Oxalis corniculata 130 Oxalidaceae Oxalis debilis 131 Pandanaceae Pandanus furcatus 132 Plantaginaceae Plantago ovata

133 Polygonaceae Polygonum molle 134 Poaceae Bambusa pallida 135 Poaceae Dendrocalamus hamiltonii 136 Poaceae Dendrocalamus strictus 137 Poaceae Paspalum scrobiculatum 138 Poaceae Saccharum spontaneum 139 Poaceae Thysanolaena maxima 140 Poaceae Cynodon dactylon 141 Poaceae Paspalum longifolium 142 Poaceae Eleusine indica 143 Polygonaceae Rumex nepalensis 144 Polygonaceae Persicaria chinensis 145 Polygonaceae Polygonum barbatum 146 Polygonaceae Polygonum chinensis 147 Urticaceae Pouzolzia hirta 148 Rhamnaceae Hovenia acerba 149 Rosaceae Rubus ellipticus 150 Rosaceae Rubus mollucanus 151 Rosaceae Rubus rugosus 152 Rutaceae Citrus aurantium 153 Rutaceae Micromelum integerrimum 154 Sabiaceae Sabia lanceolata 155 Salicaceae Flacourtia jangomas 156 Saururaceae Saurauia cerea 157 Simaroubaceae Ailanthus grandis 158 Solanaceae Datura stramonium 159 Solanaceae Solanum erianthum 160 Solanaceae Solanum indicum 161 Solanaceae Solanum khasianum 162 Solanaceae Solanum torvum 163 Sterculiaceae Pterospermum acerifolium 164 Theaceae Eurya acuminata 165 Tiliaceae Grewia disperma 166 Ulmaceae Trema orientalis 167 Ulmaceae Ulmus lanceifolia 168 Urticaceae Urtica dioica 169 Urticaceae Urtica parviflora 170 Urticaceae Elatostema obtusum 171 Urticaceae Elatostema monandrum 172 Urticaceae Pilea umbrosa 173 Verbenaceae Callicarpa arborea 174 Verbenaceae Clerodendrum colebrookianum 175 Verbenaceae Viburnum colebrookianum 176 Violaceae Viola pilosa 177 Vitaceae Vitis peduncularis 178 Zingiberaceae Hedychium densiflorum

179 Zingiberaceae Hedychium gardnerianum 180 Zingiberaceae Hedychium gracile 181 Zingiberaceae Alpinia malaccensis 182 Zingiberaceae Alpinia nigra 183 Zingiberaceae Hedychium spicatum 184 Zingiberaceae Molineria curculigoides 185 Zingiberaceae Costus speciosus
List of Pteridophytes
Family Scientific Name
Aspleniaceae Asplenium nidus
Athyriaceae Athyrium angustum
Crptogrammaceae Onychium siliculosum
Cyatheaceae Cyathea spinulosa
Dennstaedtiaceae Pteridium aquilinum
Equisetaceae Equisetum debile
Equisetaceae Equisetum diffusum
Gleichiaceae Dicranopteris linearis
Lycopodiaceae Lycopodium selago
Lygodiaceae Lygodium flexuosum
Marantaceae Phrynium pubinerve
Nephrolepidaceae Nephrolepis cordifolia
Pteridaceae Pteris biaurita
Pteridaceae Pteris vittata
Selaginellaceae Selaginella indica
Selaginellaceae Selaginella kraussiana
Thelypteridaceae Adiantum philippense
Thelypteridaceae Pronephrium nudatum
Thelypteridaceae Phegopteris auriculata
List of Bryophytes
Family Scientific Name Dicranaceae Microdus assamicus
Anthocerotaceae Folioceros paliformis
List of Lichens
Family Scientific Name Gomphillaceae Echinoplaca sp. Graphidaceae Graphis duplicata Haematomaceae Haematomma puniceum Physciaceae Heterodermia sp. Lecanoraceae Lecanora distans Lecidiaceae Lecidea nagalandica Opegraphaceae Mezosia sp.

List of Algae
Family Scientific Name Fragilariaceae Fragilaria capucina
Chlorophyceae Frustulia sp.
Bacillariophyceae Gomophoneis herculeanum
Bacillariophyceae Gomphonema sp.
Naviculaceae Navicula sp.
Naviculaceae Pinnularia sp.
Bacillariophyceae Stauroneis phoenicuteron
List of Ferns
Family Scientific Name Auricilariaceae Auricularia auricula
Cantharellaceae Cantharellus cibarius
Clavariaceae Clavaria botrytis
Ganodermataceae Ganoderma applanatum
Hymaenochaetaceae Phellinus gilvus
Polyporaceae Polyporus arcularius
Polyporaceae Polyporus grammocephalus

GMR Londa Hydro Power Pvt Ltd EIA study of Talong Londa H.E. Project
R S Envirolink Technologies Pvt. Ltd. Annexure IV.1
Annexure-IV PLANT SPECIES REPORTED
IN THE STUDY AREA Species Family Angiosperms Strobilanthus paniculata Acanthaceae Alangium begonofolium Alangiaceae Altingia excelsa Altingiaceae Mangifera sylvatica Anacardiaceae Pegia nitida Anacardiaceae Rhus javanica Anacardiaceae Rhus scandens Anacardiaceae Spondias pinnata Anacardiaceae Centella asiatica Apiaceae Wrightia arborea Apocynaceae Colocasia esculenta Araceae Rhaphidophora decursiva Araceae Heteropanax fragrans Araliaceae Schefflera wallichii Araliaceae Trevesia palmata Araliaceae Hoya lanceolata Asclepiadaceae Ageratum conyzoides Asteraceae Anaphalis triplinervis Asteraceae Artemisia nilagirica Asteraceae Bidens biternata Asteraceae Bidens pilosa Asteraceae Eupatorium odoratum Asteraceae Galinsoga parviflora Asteraceae Mikania micrantha Asteraceae Tridax procumbens Asteraceae Impatiens chinensis Balsaminaceae Oroxylum indicum Bignoniaceae Sterospermum chelonoides Bignoniaceae Bombax ceiba Bombacaceae Cordia dichotoma Boraginaceae Cardamine hirsuta Brassicaceae Canarium bengalensis Burseraceae Drymaria cordata Caryophyllaceae Terminalia myriocarpa Combretaceae Commelina appendiculata Commelinaceae Rivea ornata Convolvulaceae Cyperus kyllinga Cyperaceae Dioscorea bulbifera Dioscoreaceae Bischofia javanica Euphorbiaceae Croton oblonga Euphorbiaceae Macaranga denticulata Euphorbiaceae Mallotus nepalensis Euphorbiaceae Ostodes paniculata Euphorbiaceae Phyllanthus curniflorus Euphorbiaceae

GMR Londa Hydro Power Pvt Ltd EIA study of Talong Londa H.E. Project
R S Envirolink Technologies Pvt. Ltd. Annexure IV.2
Species Family Albizia lebbeck Fabaceae Bauhinia purpurea Fabaceae Bauhinia sp. Fabaceae Cassia occidentalis Fabaceae Dalbergia rimosa Fabaceae Erythrina stricta Fabaceae Indigofera dosua Fabaceae Milletia pachycarpa Fabaceae Castonopsis tribuloides Fagaceae Geranium nepalensis Geraniaceae Cinnamomum bejolghota Lauraceae Lindera neesiana Lauraceae Litsea monopetala Lauraceae Leea indica Leeaceae Kydia glabrescens Malvaceae Urena lobata Malvaceae Osbeckia nepalensis Melastomataceae Ficus cunia Moraceae Ficus lamponga Moraceae Ficus roxburghii Moraceae Ficus silhentensis Moraceae Ficus squamata Moraceae Musa sp. (wild banana) Musaceae Embelia sp. Myrsinaceae Maesa chisia Myrsinaceae Maesa ramentacea Myrsinaceae Horsfieldia amygdalina Myrtaceae Syzygium sp. Myrtaceae Oxalis corniculata Oxalidaceae Plantago ovata Plantaginaceae Polygonum molle Ploygonaceae Bambusa pallida Poaceae Dendrocalamus hamiltonii Poaceae Paspalum scrobiculaluin Poaceae Saccharum spontaneum Poaceae Thysanolaena maxima Poaceae Rumex nepalensis Polygonaceae Pouzolzia hirta Pouzolziaceae Hovenia acerba Rhamnaceae Rubus mollucanus Rosaceae Rubus rugosus Rosaceae Citrus aurantium Rutaceae Micromelum integerrimum Rutaceae Sabia lanceolata Sabiaceae Saurauia cerea Saurauiaceae Ailanthus grandis Simaraubaceae Solanum eriatum Solanaceae Solanum khasianum Solanaceae

GMR Londa Hydro Power Pvt Ltd EIA study of Talong Londa H.E. Project
R S Envirolink Technologies Pvt. Ltd. Annexure IV.3
Species Family Solanum torvum Solanaceae Duabanga grandiflora Sonneratiaceae Pterospermum acerifolium Sterculiaceae Eurya acuminata Thaeaceae Grewia disporum Tiliaceae Trema orientalis Ulmaceae Ulmus lancifolius Ulmaceae Urtica dioica Urticaceae Urtica parviflora Urticaceae Callicarpa arborea Verbenaceae Clerodendron colebrookianum Verbenaceae Viburnum colebrookianum Verbenaceae Viola pilosa Violaceae Vitis peduncularis Vitaceae Hedychium spicatum Zingiberaceae Molineria curculigoides Zingiberaceae Pteridophytes Angiopteris sp. Angiopterdaceae Asplenium nidus Aspleniaceae Equisetum debile Equisetaceae Lycopodium selago Lycopodiaceae Lygodium flexuosum Lygodiaceae Nephrolepis cordifolia Nephrolepidaceae Phegopteris auriculata Thelypteridaceae Pteris biaurita Pteridaceae Selaginella kraussiana Selaginellaceae Fungi Auricularia auricula Auricilariaceae Cantharellus cibarius Cantharellaceae Clavaria botrytis Clavariaceae Ganoderma applanatum Ganodermataceae Phellinus gilvus Hymaenochaetaceae Polyporus arcularius Polyporaceae Polyporus grammocephalus Polyporaceae Algae Fragilaria capucina Fragilariaceae Frustulia sp. Chlorophyceae Gomophoneis herculeanum Bacillariophyceae Gomphonema sp. Bacillariophyceae Navicula sp. Naviculaceae Pinnularia sp. Naviculaceae Stauroneis phoenicuteron Bacillariophyceae Bryophytes `Folioceros paliformis Anthocerotaceae Microdus assamicus Dicranaceae Lichen Echinoplaca sp. Gomphillaceae Graphis duplicata Graphidaceae

GMR Londa Hydro Power Pvt Ltd EIA study of Talong Londa H.E. Project
R S Envirolink Technologies Pvt. Ltd. Annexure IV.4
Species Family Haematommapuniceum Haematomaceae Heterodermia sp. Physciaceae Lecanora distans Lecanoraceae Lecidea nagalandica Lecidiaceae Mezosia sp. Opegraphaceae

ENVIRONMENTAL MANAGEMENT PLAN OF
TALONG LONDA HYDRO ELECTRIC PROJECT (225MW) East Kameng District, Arunachal Pradesh
August 2014
Prepared by
R. S. Envirolink Technologies Pvt. Ltd.
402, RADISSON SUITES COMMERCIAL PLAZA,
B-BLOCK, SUSHANT LOK-I, GURGAON – 122 009 (HARYANA) PH. +91-124-4295383 www.rstechnologies.co.in
On Behalf of
GMR LONDA HYDRO POWER PVT. LTD.
302, NEW UDDAN BHAWAN, NEAR T-3 IGI AIRPORT, NEW DELHI

Table of Contents (PART-II –EMP REPORT)
Sl No
Particulars Page No.
CHAPTER 1: BIODIVERSITY CONSERVATION & MANAGEMENT PLAN 1.1 INTRODUCTION 1.1
1.2 BIODIVERSITY 1.1
1.3 MAJOR THREATS TO BIODIVERSITY 1.2
1.3.1 Shifting Cultivation 1.3
1.3.2 Grazing Pressure 1.3
1.3.3 Encroachment 1.3
1.3.4 Illegal Extraction of Minor Forest Produce & NTFP 1.3
1.3.5 Timber Extraction 1.3
1.3.6 Hunting and Poaching 1.3
1.4 CONSERVATION ACTIVITIES & DEVELOPMENT WORKS TO BE
UNDERTAKEN
1.4
1.4.1 Conservation & Management of Bio-resources 1.4
1.4.1.1 Conservation of Rare Plant Species 1.4
1.4.1.2 Biotechnology Based Conservation 1.5
1.4.1.3 Habitat Improvement Programme 1.6
1.4.2 Habitat Improvement for Wildlife 1.7
1.5 MITIGATION MEASURES & ECO-DEVELOPMENT ACTIVITIES 1.8
1.5.1 Anti poaching Measures 1.8
1.5.1.1 Intensive Patrolling 1.8
1.5.1.2 Engagement of part time informers 1.8
1.5.1.3 Purchase of anti-poaching kits 1.8
1.5.1.4 Infrastructure Development 1.8
1.5.1.5 Purchase of Survey equipment & Vehicle 1.9
1.5.1.6 Construction of Check posts 1.9
1.5.2 Noise Mitigation and Management 1.9
1.5.3 Community-based Sustainable Natural Resources
Management
1.11
1.6 INSTITUTIONAL SUPPORT FOR IMPLEMENTATION 1.11
1.7 BIODIVERSITY CONSERVATION MEASURES DURING
CONSTRUCTION PHASE
1.12
1.8 MONITORING PLAN 1.13
1.9 COST ESTIMATES 1.13
CHAPTER 2: CATCHMENT AREA TREATMENT PLAN
2.1 NEED FOR CATCHMENT AREA TREATMENT 2.1
2.2 APPROACH FOR THE STUDY 2.2
2.2.1 Definition of the Problem 2.2
2.2.2 Data Acquisition and Preparation 2.3

2.2.3 Output Presentation 2.12
2.3 ESTIMATION OF SOIL LOSS USING SILT YIELD INDEX (SYI)
METHOD
2.12
2.4 WATERSHED MANAGEMENT – AVAILABLE TECHNIQUES 2.16
2.5 CATCHMENT AREA TREATMENT (CAT) PLAN 2.17
2.6 COST ESTIMATE 2.19
CHAPTER 3: FISHERIES CONSERVATION PLAN
3.1 INTRODUCTION 3.1
3.2 FISH COMPOSITION 3.1
3.3 IMPACTS ON FISH FAUNA 3.2
3.3.1 Impacts due to Submergence 3.2
3.3.2 Impacts due to Proposed Dam on the River 3.2
3.3.3 Impacts on Migratory Fish Species 3.3
3.4 SUSTENANCE OF RIVERINE FISHERIES 3.4
CHAPTER 4: PUBLIC HEALTH DELIVERY SYSTEM
4.1 THE PRESENT STATUS OF MEDICAL FACILITIES 4.1
4.2 CONTROL OF VECTOR-BORNE DISEASES 4.1
4.3 DEVELOPMENT OF MEDICAL FACLITIES 4.1
4.4 HEALTH EXTENSION ACTIVITIES 4.2
4.5 COST ESTIMATES 4.3
CHAPTER 5: SOLID WASTE MANAGEMENT PLAN
5.1 INTRODCUTION 5.1
5.2 LABOUR POPULATION MIGRATING IN THE PROJECT AREA 5.1
CHAPTER 6: MUCK DISPOSAL PLAN
6.1 INTRODUCTION 6.1
6.2 QUANTUM OF MUCK GENERATION 6.1
6.3 DUMPING SITES 6.1
6.4 PROCESS OF DUMPING 6.2
6.5 RECLAMATION MEASURES FOR STABILIZATION OF SPOIL
DUMPS
6.3
6.5.1 Engineering Measures 6.3
6.5.2 Biological Measures 6.4
6.6 COST ESTIMATES 6.4
CHAPTER 7: LANDSCAPING AND RESTORATION OF CONSTRUCTION SITES
7.1 INTRODUCTION 7.1
7.2 QUARRYING OPERATIONS 7.1
7.3 RESTORATION OF QUARRY SITES 7.2
7.3.1 Measures for Pre-project Activity 7.2
7.3.2 Measures for Post-project Activity 7.2
7.4 LANDSCAPING AND RESTORATION OF CONSTRUCTION AREAS 7.5
7.5 PLAN IMPLEMENTATION 7.6
7.6 COST ESTIMATES 7.7

CHAPTER 8: FOREST PROTECTION PLAN
8.1 INTRODUCTION 8.1
8.2 ENERGY CONSERVATION MEASURES 8.1
8.2.1 Provisions for Kitchen Fuel 8.1
8.2.2 Community kitchen 8.1
8.2.3 Efficient cooking facilities 8.2
8.3 COST ESTIMATES FOR ENERGY CONSERVATION 8.2
8.4 CREATION OF GREEN BELT 8.2
8.4.1 Sites For Greenbelt Development 8.2
8.4.2 Guidelines & Techniques for Green Belt Development 8.3
8.5 GREEN BELT DEVELOPMENT 8.4
8.5.1 Roadside plantation 8.4
8.5.2 Green Belt Development along the Reservoir rim 8.6
8.5.3 Green Belt at Dam site and Power house site 8.6
8.5.4 Green Belt around Crusher plants 8.6
8.5.5 Green Belt around Colony area and Office complex 8.6
8.6 INFRASTRUCTURE DEVELOPMENT FOR GREEN BELT PLAN 8.6
8.7 COST ESTIMATE FOR GREEN BELT DEVELOPMENT 8.6
8.8 FINANCIAL REQUIREMENTS FOR FOREST PROTECTION PLAN 8.7
CHAPTER 9: RESETTLEMENT AND REHABILITATION PLAN
9.1 INTRODUCTION 9.1
9.2 LAND REQUIREMENT 9.2
9.3 PROJECT AFFECTED FAMILIE 9.2
9.4 REHABILITATION AND RESETTLEMENT ACT AND POLICY 9.3
9.5 R&R PACKAGE FOR PROJECT AFFECTED FAMILIES 9.9
9.5.1 Compensation For Land Owners 9.9
9.5.2 Elements of Rehabilitation And Resettlement 9.9
9.5.3 Housing Benefit and Compensation 9.12
9.5.4 Pension for Life to Vulnerable Person 9.13
9.5.5 Special Provisions 9.13
9.5.6 Compensation against Diversion of USF and RF 9.13
9.6 RESETTLEMENT OF DISPLACED FAMILIES 9.19
9.7 ECONOMIC DEVELOPMENT PACKAGE 9.19
9.7.1 Existing Facilities in the Project Affected Village 9.20
9.7.2 Education and Skill Development 9.20
9.7.3 Skill Development Centre 9.21
9.7.4 Health Care (Upgradation & Assistance to existing PHC) 9.22
9.7.5 Upgradation of Water Supply and Sanitation 9.22
9.7.6 Assistance to Entrepreneurs for Providing Transportation 9.22
9.7.7 Basic Infrastructure 9.23
9.7.8 Sports and Recreational Activities 9.23
9.7.9 Social Welfare Schemes 9.24
9.7.10 Overall Budget for Eco- Development Package 9.25

9.8 INSTITUTIONAL ARRANGEMENT FOR R & R 9.26
9.8.1 Monitoring and Evaluation 9.25
9.8.2 Participation of PAFs 9.28
9.9 FINANCIAL PACKAGE 9.28
CHAPTER 10: ENVIRONMENTAL RISKS ASSESSMENT & MANAGEMENT
10.1 IMPACTS ON PHYSICAL ENVIRONMENT 10.1
10.2 AIR ENVIRONMENT 10.2
10.2.1 Impacts on Ambient Air Quality – Emissions and Dust 10.2
10.2.2 Mitigation Measures 10.3
10.3 NOISE LEVEL 10.4
10.3.1 Noise due to Construction Equipment 10.4
10.3.2 Mitigation Measures 10.5
10.4 WATER ENVIRONMENT 10.6
10.5 ACCIDENTAL RISKS 10.7
10.5.1 Safety in Explosive Handling 10.7
10.5.2 Safety during Construction 10.8
10.6 COST ESTIMATES 10.10
CHAPTER 11: DAM BREAK MODELING & DISASTER MANAGEMENT PLAN
11.1 INTRODUCTION 11.1
11.2 NEED FOR DAM BREAK MODELING 11.2
11.2.1 Emergency Planning 11.2
11.2.2 Development Control 11.3
11.2.3 Insurance Companies 11.3
11.3 DAM BREAK MODEL 11.3
11.4 METHODOLOGY 11.4
11.5 STATEMENT OF THE PROBLEM 11.4
11.6 DAM BREAK MODELING PROCESS 11.5
11.6.1 Hydrodynamic Modeling 11.5
11.6.2 Description of Reservoir and Appurtenant Structures 11.6
11.6.3 Boundary Conditions for Dam Break Modeling 11.7
11.6.4 Specifications of Dam Break Structures 11.7
11.6.5 Geometrical Specifications 11.8
11.6.6 Breach Characteristics 11.8
11.6.7 Failure Moment 11.8
11.7 OVERVIEW OF THE PROJECT 11.8
11.8 INPUT DATA AND MODEL SET-UP 11.9
11.8.1 Input Data Requirement 11.9
11.8.2 Design Flood Hydrograph 11.10
11.9 DAM BREAK SIMULATION 11.13
11.9.1 Selection of Dam Breach Parameters 11.13
11.9.2 Critical Condition for Dam Break Study 11.13
11.10 ASSUMPTIONS 11.14

11.11 DISCUSSIONS ON RESULTS 11.16
11.11.1 Dam Break Study for Design Flood Hydrograph 11.16
11.12 PREPARATION OF INUNDATION MAP 11.30
11.13 DISASTER MANAGEMENT PLAN 11.31
11.13.1 Surveillance 11.32
11.13.2 Emergency Action Plan 11.33
11.13.3 Administrative and Procedural Aspects 11.34
11.13.4 Preventive Action 11.34
11.13.5 Communication System 11.34
11.13.6 Merits of Satellite Communication System 11.35
11.13.7 Financial Outlay for Installation of VSAT Communication System
11.35
11.13.8 Evacuation Plans 11.36
11.13.9 Notifications 11.37
11.13.10 Cost Estimates for Disaster Management 11.37
CHAPTER 12: RESERVOIR RIM TREATMENT PLAN
12.1 INTRODUCTION 12.1
12.2 IMPACTS ON RESERVOIR SLOPES 12.1
12.3 TREATMENT MEASURES 12.2
12.3.1 Treatment Measures for Landslides/ Slips 12.2
12.3.2 Protection of Houses and Agricultural fields 12.2
12.3.3 Treatment at the Mouth of Streams joining Reservoirs 12.2
CHAPTER 13: COMPENSATORY AFFORESTATION PROGRAMME
13.1 GENERAL 13.1
13.2 OBJECTIVES 13.1
13.2.1 The Indian Forest Conservation Act (1980) 13.2
13.3 COMPENSATORY AFFORESTATION PROGRAMME 13.3
13.3.1 Diversion of Forest Land for Talong H. E. Project 13.3
13.3.2 Compensatory Afforestation Strategy for the Proposed
Project
13.3
13.4 COST OF COMPENSATORY AFFORESTATION 13.5
13.5 NET PRESENT VALUE (NPV) 13.5
CHAPTER 14: ENVIRONMENTAL MONITORING PROGRAMM
14.1 INTRODUCTION 14.1
14.2 AREAS OF CONCERN 14.1
14.3 WATER QUALITY 14.1
14.4 MUCK/ DEBRIS DUMPING AND DISPOSAL 14.2
14.5 AIR QUALITY AND METEOROLOGY 14.3
14.6 NOISE 14.3
14.7 MINIMUM ENVIRONMENTAL FLOW 14.3
14.8 AQUATIC ECOLOGY AND FISHERIES 14.3
14.9 INCIDENCE OF WATER-RELATED DISEASES 14.4
14.10 FINANCIAL REQUIREMENT 14.4

CHAPTER 15: SUMMARY OF COST ESTIMATES
15.1 COST FOR IMPLEMENTING ENVIRONMENTAL MANAGEMENT
PLAN
15.1
CHAPTER 16: PUBLIC HEARING ISSUES AND RESPONSE 16.1

List of Tables (Part – II)
Table 1.1: Cost Estimate for Conservation of Indigenous tree species 1.5
Table 1.2: Species suggested for plantation under afforestation programme 1.6
Table 1.3: Estimated cost of Biodiversity Conservation and Management Plan 1.12
Table 2.1: Landuse Classification for Free Draining Catchment at Diversion Site 2.11
Table 2.2: Areas Falling Under Different Slope Categories 2.11
Table 2.3: Soil Loss Ranges for the River Catchment 2.12
Table 2.4: Criteria for Erosion Intensity Rate 2.15
Table 2.5: Basis for Selection of Catchment Area Treatment Measures 2.17
Table 2.6: Erosion Intensity Categorization as per SYI Classification 2.17
Table 2.7: Erosion Intensity Rates of Catchment Area 2.18
Table 2.8: Sub-watershed wise proposed treatment measures 2.18
Table 2.9: Cost Estimate for Catchment Area Treatment 2.19
Table 2.10: Year-wise Target (Physical and Financial) for Catchment Area Treatment
Plan 2.20
Table 3.1: Fish Species Observed in Kameng River 3.1
Table 3.2: Aquaculture Facility Components and Fund Allocation to Raise Seeds of
Mahseer Species (Flow-through-System) 3.4
Table 3.3: Aquaculture Facility Components and Fund Allocation for Other Commercial Carps (Earthen S
Table 4.1: Budgetary estimates for developing health care facilities 4.3
Table 5.1: Periodic labour requirement during the construction of the project 5.1
Table 5.2: Calculation of total migrant population (Peak time) 5.2
Table 5.3: Expenditure on Solid Waste Management 5.3
Table 6.1: Cost of engineering structures to be built at muck disposal sites 6.3
Table 6.2: Recommended Tree Species for Afforestation 6.4
Table 6.3: Cost estimates for biological measures 6.5
Table 6.4: Financial Requirements for Relocation of Dumping Material 6.5
Table 7.1: Cost Estimates for Restoration Works and Landscape Designing 7.7
Table 8.1: Financial Provision for Energy Conservation Measures 8.2
Table 8.2: List of plants species proposed for Green Belt development 8.3
Table 8.3: Cost estimate for Green belt development in Talong Londa HEP 8.7
Table 9.1: Land requirement for Talong Londa HEP 9.2
Table 9.2: Category of Project affected families 9.2
Table 9.3: Village wise list of Displaced Families 9.3
Table 9.4: R&R Package for PAFs 9.15
Table 9.5: Budgetary estimates for Social Welfare schemes 9.24
Table 9.6: Summary of Economic – Development Package and Budget 9.26
Table 9.7: Summary of budgetary estimates 9.28
Table 10.1: Impacts during Construction Phase 10.1
Table 10.2: List of Relevant BIS Standards 10.10
Table 10.3: Estimated cost of implementation of mitigation and safety measures 10.10

Table 11.1: Elevation-Volume relationship of the reservoir 11.9
Table 11.2: Discharge Capacity through spillway 11.10
Table 11.3: Design Flood Hydrograph (PMF) 11.11
Table 11.4: Profile of crests and times due to breach for river below dam 11.16
Table 11.5: Profile of crests and times in case of SPF for river below dam 11.20
Table 11.6: Profile of crests and times in case of PFM for river below dam 11.23
Table 11.7: Profile of crest in different scenario 11.27
Table 11.7: Estimated cost of setting up of a Satellite Communication System &
Disaster Management Plan 11.37
Table 12.1: Cost of Reservoir Rim Treatment 12.3
Table 13.1: Recommended tree species for Afforestation 13.2
Table 13.2: Cost estimates of Compensatory Afforestation Plan 13.5
Table 14.1: Cost estimates for Environmental Monitoring Programme 14.4
Table 14.2: Matrix of Environmental Monitoring Plan 14.5
Table-15.1: Cost for Implementing Environmental Management Plan 15.1
Table-16.1: Public Hearing Issues and Response by Developer
16.1
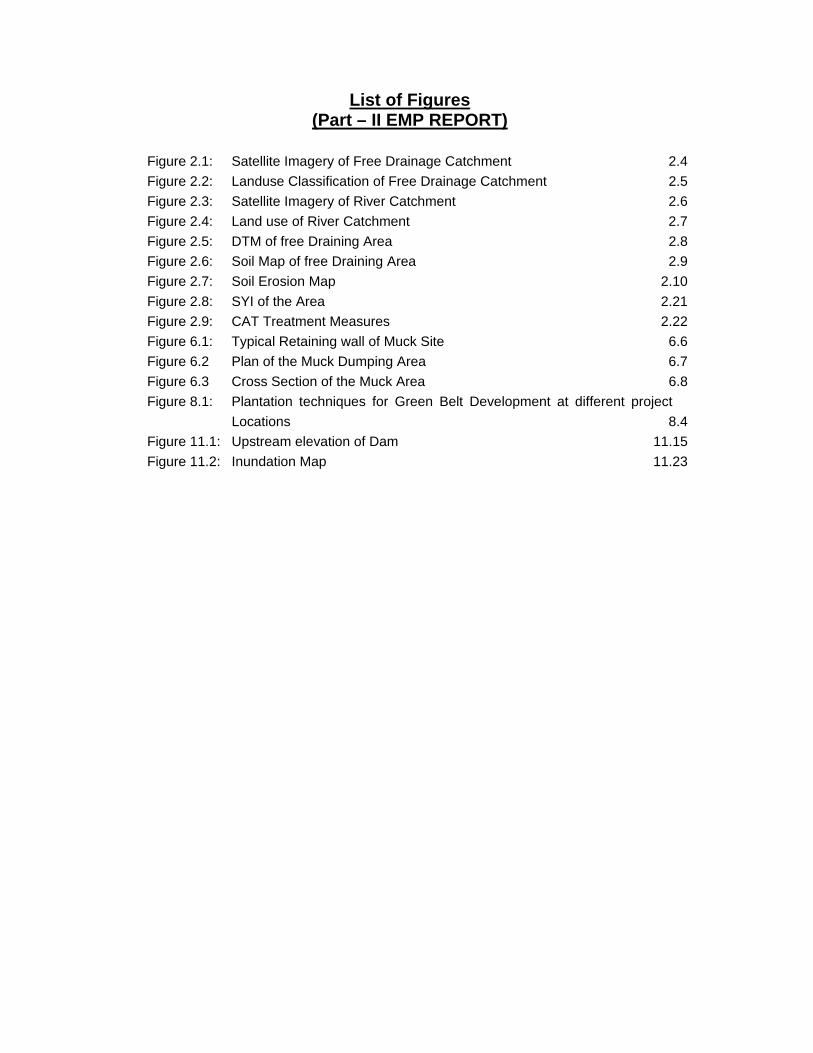
List of Figures (Part – II EMP REPORT)
Figure 2.1: Satellite Imagery of Free Drainage Catchment 2.4
Figure 2.2: Landuse Classification of Free Drainage Catchment 2.5
Figure 2.3: Satellite Imagery of River Catchment 2.6
Figure 2.4: Land use of River Catchment 2.7
Figure 2.5: DTM of free Draining Area 2.8
Figure 2.6: Soil Map of free Draining Area 2.9
Figure 2.7: Soil Erosion Map 2.10
Figure 2.8: SYI of the Area 2.21
Figure 2.9: CAT Treatment Measures 2.22
Figure 6.1: Typical Retaining wall of Muck Site 6.6
Figure 6.2 Plan of the Muck Dumping Area 6.7
Figure 6.3 Cross Section of the Muck Area 6.8
Figure 8.1: Plantation techniques for Green Belt Development at different project
Locations 8.4
Figure 11.1: Upstream elevation of Dam 11.15
Figure 11.2: Inundation Map 11.23

List of Annexure (Part – II EMP REPORT)
Annexure Particulars
Annexure – I DBM Analysis

GMR Londa Hydro Power Pvt. Ltd. EMP of Talong Londa H.E. Project
R S Envirolink Technologies Pvt. Ltd. 1.1
CHAPTER 1
BIODIVERSITY CONSERVATION & MANAGEMENT PLAN
1.1 INTRODUCTION
Biodiversity is part of our daily lives and livelihood, and constitutes resources upon
which families, communities, nations and future generations depend. Every organism
and its variation are unique and have its own role to play in a particular ecological
niche. During the last few decades, the pace of species extinction has increased
dramatically as a result of human activities. Ecosystems are being fragmented or
eliminated, and several species are in decline. The fragmentation, degradation, and
loss of habitats pose serious threat to biological diversity. These losses are
irreversible and pose a threat to our own well being, considering our dependence on
food crop and medicines and other biological resources.
Conservation of biodiversity is a global concern and its protection is one of the
challenging tasks facing mankind today. One of the key underlying assumptions
about biodiversity management is that native species and ecological processes are
most likely to be maintained. To maintain and strengthen the biodiversity
management recommendations are primarily aimed at managed forests. The
recommendations are designed to promote long term stand level maintenance and
recruitment of important structural attributes such as: wildlife, diversity of species,
special or unique habitats for floral and faunal wealth, riparian areas and wetlands,
coarse woody debris, horizontal and vertical structural diversity.
The main objective of Biodiversity Conservation and Management plan is sustainable
use of natural resources which involves scientific management of natural wealth vis-
à-vis developmental activities is likely to affect these resources. The threats to
natural terrestrial and aquatic ecosystems generally arise due to by anthropogenic
activities that may arise as a result of construction and associated activities of
proposed Talong Londa HEP. Therefore, Biodiversity Conservation & Management
plan has been formulated for the conservation and management of the forest
ecosystems in Talong Londa HE Project area.
1.2 BIODIVERSITY
Flora
The entire project area as well as the catchment area is either open forests or non-
forest areas largely affected by shifting cultivation. During the study, 141 plant

GMR Londa Hydro Power Pvt. Ltd. EMP of Talong Londa H.E. Project
R S Envirolink Technologies Pvt. Ltd. 1.2
species were recorded from the project area which belongs to various taxonomical
groups viz. Angiosperms (108), Pteridophytes (9), Bryophytes (2), Lichens (7), Algae
(7) and Fungi (8). Artemisia nilagirica, Maesa, Ficus squamata, Micromelum
integerrimum and Thysanolaena maxima dominated the shrub layer while, Pouzolzia,
Bidens, Eupatorium odoratum and Nephrolepis cordifolia were dominant in the
herbaceous layer. The forest is also having some orchids like Dendrobium, Vanda,
Coelogyne, Eria, etc. and also epiphytic ferns like Asplenium, Selaginella,
Lycopodium, etc.
Fauna
The forest of catchment area provides habitation and sustenance for numerous wild
fauna. The State Forest Department reported a total of 177 wild fauna in which 29
mammals, 31 reptiles, 111 birds and 6 amphibian species in the forest area. Out of
them, some animal species are facing various category of threat due to dwindling of
their population in wild. The mammalian species like, Capricornis sumantraenis,
Ursus thibetanus, Cuon alpines are categorized under vulnerable while, Presbytis
pileatus and Aonyx cinerea reported in endangered category of ZSI Red Data Book.
Besides that one reptilian species i.e. Python molurus bivittatus also reported in
endangered category of Red Data Book, published by ZSI, 1994.
1.3 MAJOR THREATS TO BIODIVERSITY
The fragmentation of forested landscape in the area is happening due to degradation
activities like shifting cultivation (jhum), clear felling for timber, encroachment into
forest land, man-animal conflict, introduction of exotic species and uncoordinated
infrastructural development.
Population explosion, over exploitation of forest resources, urbanization, unscientific
management, encroachment of forest land, illicit felling, lack of regeneration of
forests and outdated laws are major factors responsible for the degradation and
depletion of forests in area. Deforestation may led to reduction of rainfall, silting of
rivers and dams, increase soil erosion, dryness in the air and increase in
temperature, adversely affecting not only forestry but also agriculture and
horticulture, etc.
In the proposed Talong Londa H. E. Project, the threat of habitat disturbance,
degradation and fragmentation may not only come from the constructional activities,
but also from the population of migrant labourers that will be employed by the project
developers from time to time.

GMR Londa Hydro Power Pvt. Ltd. EMP of Talong Londa H.E. Project
R S Envirolink Technologies Pvt. Ltd. 1.3
1.3.1 SHIFTING CULTIVATION
Shifting cultivation is the main cause of degradation and depletion of forests cover.
This result to habitat loss, degradation, and fragmentation are important causes of
known species-populations extinctions.
1.3.2 GRAZING PRESSURE
The forest area is also under heavy grazing pressure by the livestock and is
susceptible to damage by semi domestic Mithun and other animals. Mithun is
considered as the main culprit for the failure of the plantations due to heavy browsing
and trampling of seedlings. This results in soil compaction and damage the ground
flora and saplings of tree species.
1.3.3 ENCROACHMENT
Encroachment of forestland is a serious threat to biodiversity of the area, which leads
to forest degradation and loss of valuable natural resources.
1.3.4 ILLEGAL EXTRACTION OF MINOR FOREST PRODUCE & NTFP
The collection of Minor Forest Produce (MFP) in the form of small timber, fuel wood,
and fodder by the people living in the surrounding villages in the project area and
areas between the village and forests area is putting immense biotic pressures on
these bio-resources. It often leads to slope destabilization and soil erosion problems
causing landslides. There is likelihood of increase in biotic interference with the influx
of labour population during the construction of the project. This floating human
population will exert serious pressure on the semi-natural ecosystems around the
project construction activity sites. The pressures may be foreseen in terms of fuel-
wood collection, rearing of livestock and the grazing pressure on the surrounding
forest ecosystems.
1.3.5 TIMBER EXTRACTION
The local tribal from the study are dominantly depends upon forest for their day to
day timber needs. This results in tremendous pressure on the forests. The demand
for timber and other wood produce is very high in the area for various activities like
the construction of houses, agriculture and other development activities. Therefore,
the demand of fodder, fuel wood, grass, timber and other natural resources in the
project area would be addressed with creation of other alternative schemes.
1.3.6 HUNTING AND POACHING
In Arunachal Pradesh hunting and poaching is associated with culture in most of the
communities. Animals are hunted mainly for meat, skin, teeth, feather, beaks and
other parts, which are used as a part of traditional dresses and ceremonies.

GMR Londa Hydro Power Pvt. Ltd. EMP of Talong Londa H.E. Project
R S Envirolink Technologies Pvt. Ltd. 1.4
Pheasants, Hornbills, Barking Deer are the commonly hunted wild species for food
and for trophies.
Awareness about wildlife laws is extremely low. Some believe that hunting would
continue because this is part of their traditional practice. The police and the Forest
Department should take care to strictly implement the Wildlife Protection Act, 1972.
The setting up of anti-poaching and monitoring camps at strategic sites in each of the
fringe areas may be helpful in reducing illegal activities.
1.4 CONSERVATION ACTIVITIES & DEVELOPMENT WORKS TO BE UNDERTAKEN
1.4.1 CONSERVATION & MANAGEMENT OF BIO-RESOURCES
The following activities are proposed under the management plan.
1.4.1.1 CONSERVATION OF RARE PLANT SPECIES
It is proposed to plant trees like; Ulmus lanceifolia, Altingia excelsa, Bischofia
javanica, Dalbergia sp. etc. under the afforestation programme and the same
provision will be made under various schemes like Compensatory Afforestation
programme, afforestation and enrichment plantation under CAT plan and JFM. The
propagation and cultivation method for these species have been standardized by the
State Forest Research Institute (SFRI), Itanagar. The species can be grown in some
protected areas as well as in existing forest areas having adequate canopy cover.
Although the affected species is available in other Tropical and Sub-tropical forests of
Arunachal Pradesh particularly in the districts of Lower Subansiri, Upper Subansiri,
Papumpare, East Kameng and West Kameng, the following measures by the project
authorities would ensure their continued presence in the affected areas.
(i) The tree species should be planted adequately under compensatory
afforestation programme.
(ii) Other than the construction works at dam/power house site, big trees in other
places will not be disturbed.
(iii) Institutions in Arunachal Pradesh such as SFRI, Tippi Orchid Research Centre,
Arunachal University etc. would be supported to conserve the rare species in
their botanical gardens/Canetum/Arboretum or propagating them through tissue
culture methods. A provision of Rs. 10.00 lacs have been earmarked for this
purpose.
(iv) Small grants would be provided to the villagers in the catchment area to raise
plantations of indigenous tree species in degraded lands available around their

GMR Londa Hydro Power Pvt. Ltd. EMP of Talong Londa H.E. Project
R S Envirolink Technologies Pvt. Ltd. 1.5
villages to ensure their conservation through cultivation. A provision of Rs.
10.00 lacs has been for this purpose for distribution to Village Conservation
Committees (VCCs) to be constituted for undertaking various conservation and
awareness activities.
Thus, a total provision of Rs. 20.0 lacs needs to be earmarked for conservation of
indigenous tree species. The details are given in Table-1.1.
Table-1.1: Cost Estimate for Conservation of Indigenous tree species
Parameter Cost (Rs. In lacs)
Grant for various institutions 10.00
Grant for VCCs to raising plantation and conservation of
indigenous tree species in the catchment
10.00
Total 20.00
1.4.1.2 BIOTECHNOLOGY BASED CONSERVATION
Biotechnology-based Programmes can benefit the local population with the support
of the project in the area of cultivation of medicinal and aromatic plants. Medicinal
herbs are considered as major components of non timber forest produce. There are
over 500 species of medicinal plants reported till now from Arunachal Pradesh.
Commonly collected medicinal plants in area are Ageratum conyzoides, Artemisia
nilagirica, Drymaria cordata, Oxalis corniculata, Mangifera sylvatica, Pteris biaurita,
Rubus sp., and Rumex nepalensis. The local tribal people utilize these plants for the
treatment and cure of a large number of diseases.
Under the Bio-technology Programme a project on creating awareness and
promotion of medicinal plants for the production and marketing would be
implemented with the help of Regional Research Laboratory (RRL), Jorhat to benefit
the population of project area. One of the most active agency/NGO in the area is
District Horticulture & Agriculture Development co-operative Society (DHADCS),
Seppa, which has also done work in the field of Medicinal and Aromatic plant
cultivation, agro-horticulture and animal husbandry. The society has also been
participating in various extension and promotion activities as tree planting drives on
Vana Mahotsava (Festival of Planting Trees), organizing workshops and public
meetings.
Herbal nursery would be established in one Gram Panchayat Unit. The Herbal Plant
Conservation Group at local level can tie up with the ayurvedic companies in the
nearby cities. Under this, group training to farmers should be given to make them
aware of the use of herbal plants in animal health care also. Self Help Groups (SHG)

GMR Londa Hydro Power Pvt. Ltd. EMP of Talong Londa H.E. Project
R S Envirolink Technologies Pvt. Ltd. 1.6
formed by women should be involved for the promotion of herbal drugs from the
kitchen stock and rare medicinal plants. A financial provision of Rs. 10.00 lacs has
been made in the management plan including nursery development to be
implemented for at least 5 years initially for this activity.
1.4.1.3 HABITAT IMPROVEMENT PROGRAMME
Some of the habitat improvement programmes for the forest areas in the region are -
Artificial Plantations, Aided Natural Regeneration (ANR), Apnavan schemes and
others such as Social Forestry, Minor Forest Produce (MFP), and Minimum Needs
Programme (MNP). Of these, the local villagers are undertaking Apnavan scheme
and the Department of Environment and Forests are undertaking community and the
other schemes. Habitat improvement programme by plantations is an integral part of
biodiversity management. This programme consists of bringing into useful
association of those condition needed by a species to reproduce and survive. The
following activities have been proposed for habitat improvement programme:
Afforestation
Area under forest and tree cover will be expanded through systematic planning and
implementation of afforestation and rehabilitation programme in degraded and open
forests and available abandoned jhummed lands.
Regeneration of felled areas will be ensured in a time bound manner and productivity
of plantations will be increased through use of improved seeds and planting stock.
The indigenous fruit bearing plants, vital from wildlife point of view are proposed to be
planted so as to enrich the habitat and ensure the sufficient availability of food. Mixed
plantations of fodder, fuel wood and wild fruit species will be promoted. This activity
will increase forest cover and will provide habitat to the animals. The species
suggested for afforestation programme is given in Table 1.2. However, the species to
be planted may be finalized by the Forest Department. The cost of afforestation has
been included in the CAT plan cost.
Table 1.2: Species suggested for plantation under afforestation programme
Botanical name Local name
Altingia excelsa Jutuli
Gmelina arborea Gamari
Acacia auriculiformis Akash mohni
Syzygium sp. Jamun
Dendrocalamus sp. -

GMR Londa Hydro Power Pvt. Ltd. EMP of Talong Londa H.E. Project
R S Envirolink Technologies Pvt. Ltd. 1.7
Duabanga grandiflora Khokan
Bauhinia purpurea Kanchan
Lagestroemia minuticarpa Ajar
Cyathea spinulosa -
Calamus laptospadix -
Ulmus lycopodium -
Nursery Development
Out of the forest area at least 2 nurseries shall be established. Also, the seed sowing
by way of dibbling of environmentally and ecologically interactive species in the
compartment prone to man-animal conflict zones is proposed. Accordingly sowing of
50 quintals of high quality seeds is proposed for sowing during the action plan period.
The cost of implementation of Habitat Enhancement in the catchment has been
covered in CAT plan cost.
1.4.2 HABITAT IMPROVEMENT FOR WILDLIFE
Forests are vital for the survival, foraging, breeding and nesting of many wild fauna.
Natural forests provide a variety of food materials to the mammals, birds, reptiles and
insects not only in the form of fodder but also flowers, fruits and seeds etc. provide
nectar and food for many birds, insects and butterflies. In the forests, food is always
available for the faunal component. Although most floral species flower during spring
through summer but fruit maturation and seed ripening takes place in them
throughout the year. Therefore, the first strategy of improvement of habitat for wild
fauna is avoiding nest predation or brood parasitism through maintenance of large
contiguous forest tract. The forest areas have the ability to support the largest
number of forest interior birds and will also be more likely to provide habitat for area
sensitive species. It is more practicable to protect the existing forest area rather than
creating new forest area.
Maintenance of well developed woody understorey forest vegetation would be
another consideration for facilitating nesting habitat of many birds. In the uneven
aged forest, the availability of food and shelter is ensured for a longer run.
Afforestation along forest edges with the native species is also necessary to increase
the interior depth of the forest stand. Similarly, another important aspect pertains to
adoption/ reorientation of management strategies for the nesting requirement, food
habits understanding and breeding behaviour, etc. of the birds.

GMR Londa Hydro Power Pvt. Ltd. EMP of Talong Londa H.E. Project
R S Envirolink Technologies Pvt. Ltd. 1.8
1.5 MITIGATION MEASURES & ECO-DEVELOPMENT ACTIVITIES
On one side mitigations measures like anti-poaching measures, creation of noise
reduction barriers, and control of grazing will be adopted whereas in addition eco-
development activities like awareness among people will also be taken up.
1.5.1 ANTI-POACHING MEASURES
For the improvement of vigilance and measures to check poaching number of
measures described below would be undertaken.
1.5.1.1 INTENSIVE PATROLLING
Provision of long and short distance frequent patrolling is made in the Biodiversity
Management Plan. Based on the assessment of the strength and the workload of the
staff, additional staff will be deployed for watch and ward, long and short range of
patrolling for surveillance and detection of wildlife crimes.
1.5.1.2 ENGAGEMENT OF PART TIME INFORMERS
The engagement of part-time informers is proposed in this plan so as to strengthen
the network of anti-poaching activities. It is obvious that during winters the high
altitude wild animals and pheasants migrate from high altitude towards lower altitude
and venture into human habitations. This proposed activity shall check poaching
activities during lean periods.
1.5.1.3 PURCHASE OF ANTI-POACHING KITS
To capture and translocate wild animals out of human habitations or agricultural
lands, various trapping equipments pertaining to anti-poaching activities are needed.
In the absence of these the staff faces difficulties and all efforts made on this behalf
are futile. For this an amount of Rs. 3.00 lacs has been earmarked. The anti-
poaching kits will include equipments for self defense of the staff as well.
1.5.1.4 INFRASTRUCTURE DEVELOPMENT
This includes anti-poaching huts, rock shelters development and residential quarters
for forest guards. For effective monitoring, one watch tower is also proposed to be
established at an identified place having high pressure of biotic interference.
These basic amenities are required for the field staff to enable them to do effective
patrolling in the areas. An amount of Rs.5.00 lacs is proposed for watch tower and
accommodation.

GMR Londa Hydro Power Pvt. Ltd. EMP of Talong Londa H.E. Project
R S Envirolink Technologies Pvt. Ltd. 1.9
1.5.1.5 PURCHASE OF SURVEY EQUIPMENT
In order to improve network and vigilance it is required to procure equipment like V-
SAT and to document and develop a database IT infrastructure like laptops,
altimeters, G.P.S., spotoscope, binoculars, as well as digital still cameras are
essential. For better communication and purchase of survey equipment an amount
of Rs. 6.00 lacs has been proposed.
1.5.1.6 CONSTRUCTION OF CHECK POSTS
To improve vigilance for anti-poaching, better protection, enforcement for control
grazing practices the construction of control-grazing-cum-anti poaching check posts
(Prefabricated Dome House – 200 sq ft one room set each) is proposed to be
constructed at a cost of Rs. 3.00 lacs during the implementation period. This activity
is aimed to control movement of smugglers/ thieves during night hours.
It is recommended that check posts be installed near major construction sites and
labour camps. It is proposed to develop 1 check post near dam site, which shall be
operational during construction phase. The check post will have 4 guards and a
range officer to ensure that poaching is strictly checked in the area. The range officer
will supervise the guards of check post. It is also recommended that the staff
managing the check post will have adequate communication equipment. It is
proposed that one wireless sets will be provided at check post. Apart from inter-
linking of check posts, the wireless link needs to be extended to Divisional Forest
Office and the local police station also.
The Eco-development Committees and Village Conservation Committees (VCCs) will
be constituted for this purpose which will help State Forest Department in capacity
building and micro-planning of the various eco-developmental activities formulated
for community development. The activities under this programme are aimed at
improvement of livelihood of people living in the project area. Under this programme,
number of activities have been proposed and are described in the following
paragraphs.
1.5.2 NOISE MITIGATION AND MANAGEMENT
The studies have indicated harmful effects of high noise levels on the behavior of
wild animals and birds in wilderness areas. Generally during the construction period,
the noise levels at a distance of 7 meter vary from 100-110 dB (A) at a given time.
Such high noise levels for prolonged periods pose a health hazard for wildlife.
Therefore, during the construction period, even though forest cover would act as a
potential noise absorber to some extent, it will be ensured that the noise levels do not
go above 100 dB (A) at any given time in the project area. It is proposed to adopt and

GMR Londa Hydro Power Pvt. Ltd. EMP of Talong Londa H.E. Project
R S Envirolink Technologies Pvt. Ltd. 1.10
implement measures like controlled and regulated blasting with strict surveillance and
also to devise schedule of implementation after due consultation with concerned
wildlife officials keeping the potential impact on animal behavior and their breeding
time, nesting, etc. Some of the suggested measures for mitigation of noise impact
are given below:
i) Regular maintenance of equipment that are potential source of noise.
ii) The equipment that needs to be placed permanently at one place like
generators, etc. should be housed in enclosures consisting of noise absorbing
structures.
iii) The heavy equipment like rotating or impacting machines should be mounted
on anti-vibration mountings.
iv) Wherever combustion engines are required, they will be fitted with silencers.
v) The traffic generated due to movement of trucks, dumpers, etc. used for the
project works will be managed to produce a smooth flow instead of a noise
producing stop and start flow. Necessary training/ orientation will be provided to
the traffic operators/ drivers to make them aware of the environmental aspects
of the traffic movement in the forest areas. Sounding of loud horns, etc. in the
forested areas is to be prohibited.
vi) During the clearing of vegetation the land for any project work, the project
authorities will ensure that the working area has sufficient layers of tree cover
around it. It will act as an effective noise and dust absorber. It will be ensured
that bigger trees are not lopped or cut around the periphery of the site. The tree
layer will act as noise buffer and likely to cut off noise by about 3-12 dB at a site
depending upon the density of vegetation. These measures will be planned in
advance and well before starting operation at any site.
vii) The project authorities will monitor the noise at critical sites from time to time
under the Environmental Monitoring Programme.
viii) Noise Reduction Barriers shall be created in the project area where heavy
machinery shall be installed. It will act as an acoustic barrier so that wild
animals are not affected adversely by creation of noise produced by the
machinery.
A provision of Rs. 10.00 lacs has been made in the budget for implementing these
measures.

GMR Londa Hydro Power Pvt. Ltd. EMP of Talong Londa H.E. Project
R S Envirolink Technologies Pvt. Ltd. 1.11
1.5.3 COMMUNITY-BASED SUSTAINABLE NATURAL RESOURCES MANAGEMENT
In Arunachal Pradesh, the biological diversity and variability of the ecosystems are
used and conserved by traditional communities through various informal institutions
and using traditional ecological knowledge systems. These communities have
diverse food habits, culture and linguistic variations complemented by community
knowledge and informal rural social institutions, which determine the access and
conservation of natural resources.
In the state indigenous tribes have traditional rights over the forest products. They
practice shifting cultivation and hunting. Animal hunting in the region is related not
only to food requirement but is also associated with their culture, customs, thrill and
festivals. The prohibition of hunting and shifting cultivation is a serious challenge in
this region. The natural resource management can be achieved by joint forest
management involving tribes, through local NGOs and coordinated efforts of the
project proponents and the government. This joint programme should be carried at
various levels like awareness programmes, reward system, incentives to villagers.
These groups would bring the awareness towards continued survival and importance
of wildlife and forests. It would also encourage the active hunters to surrender their
hunting guns at the cost of good incentives.
The constituents of natural resource management would be an Eco-Development
Committee (EDC), local NGO, based on the environment conservation and a
Financing Body. Eco Development Committee would involve local people, Forest
Department and the project proponents. EDC would discourage burning of forests,
hunting and slash and burn agriculture. Some of the local people will be appointed in
the EDC on payment of honorarium basis. The EDC would prepare a plan for
sustainable exploitation of forest resources. The participating NGO would run
awareness programme through, research documents, pamphlets, brochures,
hoardings, teaching and training programmes for the local communities. The project
proponent would provide the finances for supporting the activities of EDC and NGO
for at least 5 years.
In order to implement above mentioned activities, an amount of Rs. 15.00 lacs is
proposed.
1.6 INSTITUTIONAL SUPPORT FOR IMPLEMENTATION
Following institutions may be in seeking guidance and technical support during
implementation of the Biodiversity Conservation & Management Plan:

GMR Londa Hydro Power Pvt. Ltd. EMP of Talong Londa H.E. Project
R S Envirolink Technologies Pvt. Ltd. 1.12
• State Forest Research Institute (SFRI), Itanagar & Rajiv Gandhi University for
providing the technical guidance regarding the monitoring and evaluation of the
faunal diversity in the area.
• Regional Research Laboratory, Jorhat and State Forest Research Institute,
Itanagar for guidance conservation and development of medicinal plants.
• Cane and Bamboo Technology Centre, Guwahati for training, cultivation and
marketing of Bamboo and Cane. Besides these organizations/ institutes Gram
Panchayats, Mahila Mangal Dals, Yuvak Mandals, Ex-servicemen’s Bodies,
Schools, Village Forest Development Societies, local user groups, other
Community Based Organisations (CBOs) and NGOs would also be actively
involved in sustainable management of biological resources.
1.7 BIODIVERSITY CONSERVATION MEASURES DURING CONSTRUCTION PHASE
The following activities and safeguards measures will be undertaken during
construction phase:
i) To strictly monitor and impose restrictions on the activities and movement of
labourers and associated workers to avoid disturbance in the habitat of wild
animals and birds.
ii) To monitor noise levels during construction activities that are required to be
maintained wherein only restricted/essential activities will be allowed and carried
out at night in areas wherever the project work and activity is undertaken in the
vicinity of animal/bird habitats.
iii) To make provision for the supply of the free or subsidized kerosene/LPG from the
depots to be set up for this purpose to minimize the pressure on forests and
animal habitats.
iv) To keep the interference of human population to the minimum and ensure that
the contractors do not set up labour colonies in the vicinity of forests and
wilderness areas.
v) The improvement of existing infrastructure with conservation and protection in
addition to new strategies.
vi) To enforce mix of incentives and strict regulatory framework for protection of
wildlife.
vii) To enforce the rules and regulations of the Wildlife (Protection) Act, 1972, Forest
(Conservation) Act, 1980, Environment Protection Act (1986), Biological Diversity
Act (2002), for the preservation of habitats and protection of flora and wild
animals.
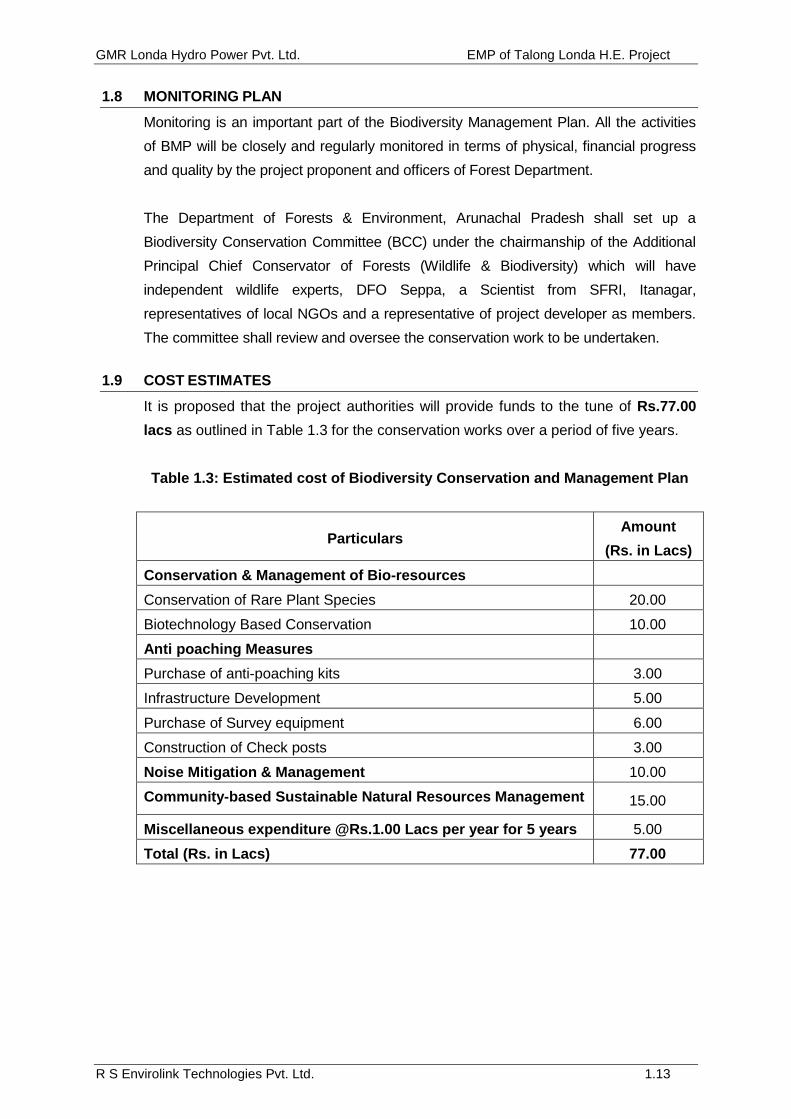
GMR Londa Hydro Power Pvt. Ltd. EMP of Talong Londa H.E. Project
R S Envirolink Technologies Pvt. Ltd. 1.13
1.8 MONITORING PLAN
Monitoring is an important part of the Biodiversity Management Plan. All the activities
of BMP will be closely and regularly monitored in terms of physical, financial progress
and quality by the project proponent and officers of Forest Department.
The Department of Forests & Environment, Arunachal Pradesh shall set up a
Biodiversity Conservation Committee (BCC) under the chairmanship of the Additional
Principal Chief Conservator of Forests (Wildlife & Biodiversity) which will have
independent wildlife experts, DFO Seppa, a Scientist from SFRI, Itanagar,
representatives of local NGOs and a representative of project developer as members.
The committee shall review and oversee the conservation work to be undertaken.
1.9 COST ESTIMATES
It is proposed that the project authorities will provide funds to the tune of Rs.77.00
lacs as outlined in Table 1.3 for the conservation works over a period of five years.
Table 1.3: Estimated cost of Biodiversity Conservation and Management Plan
Particulars Amount
(Rs. in Lacs)
Conservation & Management of Bio-resources
Conservation of Rare Plant Species 20.00
Biotechnology Based Conservation 10.00
Anti poaching Measures
Purchase of anti-poaching kits 3.00
Infrastructure Development 5.00
Purchase of Survey equipment 6.00
Construction of Check posts 3.00
Noise Mitigation & Management 10.00
Community-based Sustainable Natural Resources Management 15.00
Miscellaneous expenditure @Rs.1.00 Lacs per year for 5 years 5.00
Total (Rs. in Lacs) 77.00

GMR Londa Hydro Power Pvt. Ltd. EMP of Talong Londa H.E. Project
R S Envirolink Technologies Pvt. Ltd. 2.1
CHAPTER-2
CATCHMENT AREA TREATMENT PLAN
2.1 NEED FOR CATCHMENT AREA TREATMENT
It is a well-established fact that reservoirs formed by dams on rivers are
subjected to sedimentation. The process of sedimentation embodies the
sequential processes of erosion, entrainment, transportation, deposition and
compaction of sediment. The study of erosion and sediment yield from
catchments is of utmost importance as the deposition of sediment in reservoir
reduces its capacity, and thus affecting the water availability for the designated
use. The eroded sediment from catchment when deposited on streambeds and
banks causes braiding of river reach. The removal of top fertile soil from
catchment adversely affects the agricultural production. Thus, a well-designed
Catchment Area Treatment (CAT) Plan is essential to ameliorate the above-
mentioned adverse process of soil erosion.
Soil erosion may be defined as the detachment and transportation of soil. Water
is the major agent responsible for this erosion. In many locations, winds, glaciers,
etc. also cause soil erosion. In a hilly catchment area, as in the present case,
erosion due to water is a common phenomenon and the same has been studied
as a part of the CAT Plan. Soil erosion leads to:
loss in production potential
reduction in infiltration rates
reduction in water-holding capacity
loss of nutrients
increase in tillage operation costs
reduction in water supply
The CAT plan highlights the management techniques to control erosion in the
catchment area of a water resource project. The life span of a reservoir is greatly
reduced due to erosion in the catchment area. Adequate preventive measures
are thus needed for the treatment of catchment for its stabilization against future
erosion.

GMR Londa Hydro Power Pvt. Ltd. EMP of Talong Londa H.E. Project
R S Envirolink Technologies Pvt. Ltd. 2.2
CAT Plan has been formulated for free draining catchment i.e. up to the tail water
levels of upstream HE projects on Pachuk and Kameng River which is 177.30 sq
km.
The catchment area treatment involves:
Understanding of the erosion characteristics of the terrain and,
Suggesting remedial measures to reduce the erosion rate.
In the present study `Silt Yield Index’ (SYI), method has been used. In this
method, the terrain is subdivided into various watersheds and the erodibility is
determined on relative basis. SYI provides a comparative erodibility criteria of
catchment (low, moderate, high, etc.) and do not provide the absolute silt yield.
SYI method is widely used mainly because of the fact that it is easy to use and
has lesser data requirement. Moreover, it can be applied to larger areas like sub-
watersheds, etc.
2.2 APPROACH FOR THE STUDY
A detailed database on natural resources, terrain conditions, soil type of the
catchment area, socio-economic status, etc. is a pre-requisite to prepare
treatment plan keeping in view the concept of sustainable development. Various
thematic maps, Geographic Information System (GIS) data base system with real
coordinate system have been used. For accurate results latest satellite data is
used for the analysis, and deriving land use information. Reality check was also
undertaken during the field surveys.
Various steps, covered in the study, are as briefly described in the following
paragraphs:
2.2.1 Definition of the Problem
The requirements of the study were defined and the expected outputs were
finalized. The various data layers of the catchment area to be used for the study
are as follows:
Slope Map
Soil Map
Land use Classification Map

GMR Londa Hydro Power Pvt. Ltd. EMP of Talong Londa H.E. Project
R S Envirolink Technologies Pvt. Ltd. 2.3
Current Management Practices
Catchment Area Map.
2.2.2 Data Acquisition and Preparation
The data available from various sources has been collected. The ground maps,
contour information, etc. were scanned, digitized and registered as per the
requirement. Data was prepared depending on the level of accuracy required and
any corrections required were made. All the layers were geo-referenced and
brought to a common scale (real co-ordinates), so that overlay could be
performed. A computer program using standard modeling techniques was used
to estimate the soil loss. The formats of outputs from each layer were firmed up
to match the formats of inputs in the program. The grid size to be used was also
decided to match the level of accuracy required, the data availability and the
software and time limitations. The format of output was finalized. Ground truthing
and data collection was also included in the procedure.
For the present study, IRS P6-LISS III digital satellite data was used for
interpretation & classification. The data has been procured in raw digital format
and has been geo-referenced using Survey of India topographical sheets with the
help of standard data preparation techniques in standard image processing
software. The interpretation of geo-referenced satellite data has been done using
standard enhancement techniques, ground checks and experiences of qualified
professionals. A detailed ground truth verification exercise has been undertaken
as a part of ecological survey to enrich the image interpretation process.
The catchment area considered for the present study is given in Figure 2.1 as
raw satellite imagery. The classified land use map of the free draining catchment
area, considered for the study, is shown as Figure 2.2. The land use pattern of
the catchment area is summarized in Table 2.1. Raw satellite data and classified
image have been shown as Figure 2.3 and Figure 2.4.

GMR Londa Hydro Power Pvt. Ltd. EMP of Talong Londa H.E. Project
R S Envirolink Technologies Pvt. Ltd. 2.4
Figure-2.1 FCC of the Draining Catchment

GMR Londa Hydro Power Pvt. Ltd. EMP of Talong Londa H.E. Project
R S Envirolink Technologies Pvt. Ltd. 2.5
Figure 2.2: Landuse Classification OF Free Draining Catchment

GMR Londa Hydro Power Pvt. Ltd. EMP of Talong Londa H.E. Project
R S Envirolink Technologies Pvt. Ltd. 2.6
Figure2.3 Satellite Image of the River Catchment

GMR Londa Hydro Power Pvt. Ltd. EMP of Talong Londa H.E. Project
R S Envirolink Technologies Pvt. Ltd. 2.7
Figure 2.4 Landuse of The River Catchment

GMR Londa Hydro Power Pvt. Ltd. EMP of Talong Londa H.E. Project
R S Envirolink Technologies Pvt. Ltd. 2.8
Figure-2.5 DTM of the Free Draining Area

GMR Londa Hydro Power Pvt. Ltd. EMP of Talong Londa H.E. Project
R S Envirolink Technologies Pvt. Ltd. 2.9
Figure 2.6 Soil Map of the Free Draining Area

GMR Londa Hydro Power Pvt. Ltd. EMP of Talong Londa H.E. Project
R S Envirolink Technologies Pvt. Ltd. 2.10
Figure-2.7 Soil Erosion Map of the Area

GMR Londa Hydro Power Pvt. Ltd. EMP of Talong Londa H.E. Project
R S Envirolink Technologies Pvt. Ltd. 2.11
Derived contours from topographical maps were used for preparation of Digital
Elevation Model (DEM) of the catchment area and to prepare a slope map. The
first step in generation of slope map is to create surface using the elevation
values stored in the form of contours or points. After marking the catchment area,
all the contours on the topographical maps were derived. The output of the
digitisation procedure was the contours as well as points contours in form of x, y
& z points. (x, y - location and z - their elevation). All this information was in real
world co-ordinates (latitude, longitude and height in meters above sea level).
A Digital Terrain Model (DTM) of the area was then prepared, which was used to
derive a slope map. The slope was divided in classes of slope percentages. The
areas falling under various standard slope categories have been tabulated below
in Table 2.2. The slope map is enclosed as Figure 2.5.
Table 2.1: Landuse Classification for Free Draining Catchment
Landuse/Landcover Area in percentage Area in ha
River/Water Bodies 0.46 81.74
Barren Areas 0.67 118.60
Agricultural Land 2.10 372.20
Dense Vegetation 77.14 13677.25
Light Vegetation 19.54 3464.41
Settlement/Built-up Areas 0.09 15.80
Total 100.00 17730.00
Table 2.2: Areas Falling Under Different Slope Categories
Slope category (percentage) Area in percentage Area in ha
0-1 0.00 0.64
1-3 0.12 21.79
3-5 0.15 26.91
5-10 1.03 182.62
10-15 1.62 287.06
15-25 7.44 1319.34
25-33 10.59 1877.44
33-50 35.02 6209.02
> 50 44.02 7805.17
Total 100.00 17730.00

GMR Londa Hydro Power Pvt. Ltd. EMP of Talong Londa H.E. Project
R S Envirolink Technologies Pvt. Ltd. 2.12
Soil map has been digitized and produced using soil maps collected from
National Bureau of Soil Survey & Landuse Planning (NBSS & LUP). Various
layers, thus prepared, were used for Modeling. Soil map has been shown as
Figure 2.6.
Model was prepared using standard modeling techniques to calculate the soil
loss using input from all the layers as described below:
Modeling: The river catchment area has been divided into small grids of
25m*25m. The vector layer so generated of 25 m grid size was updated by
landuse/ landcover details, soil information and slope values in GIS software
using different maps as generated above. Soil loss has then been calculated for
each grid using modelling techniques) through information derived from updated
grids with the help of a customized computer software/program.
A thematic map has been prepared using these calculated soil erosion values for
delineating areas prone to soil erosion in the free draining catchment. The
percentages of catchment area falling in different soil vulnerability classes are
given in Table 2.3 and shown in Figure 2.7.
Table 2.3: Soil Loss Ranges for the River Catchment
S. No. Soil loss range in tons/acre/ annum Area in ha Area in %
1 0 - 2 2594.90 14.64
2 2 – 4 4573.73 25.80
3 4 – 6 4811.54 27.14
4 6 – 8 3320.85 18.73
5 8 – 10 1491.06 8.41
6 >10 937.92 5.29
Total 17730.00 100.00
2.2.3 Output Presentation
The result of the modeling was interpreted in pictorial form to identify the areas
with high soil erosion rates. The primary and secondary data collected as a part
of the field studies were used as an input for the model.
2.3 ESTIMATION OF SOIL LOSS USING SILT YIELD INDEX (SYI) METHOD
In `Silt Yield Index’ (SYI), method, the terrain is subdivided into various
watersheds and the erodibility is determined on relative basis. SYI provides a

GMR Londa Hydro Power Pvt. Ltd. EMP of Talong Londa H.E. Project
R S Envirolink Technologies Pvt. Ltd. 2.13
comparative erodibility criteria of catchment (low, moderate, high, etc.) and do
not provide the absolute silt yield. SYI method is widely used mainly because of
the fact that it is easy to use and has lesser data requirement. Moreover, it can
be applied to larger areas like sub-watersheds, etc.
The SYI, considering sedimentation as product of erosivity, erodibility and aerial
extent was conceptualized in the All India Soil and Land Use Survey (AISLUS) as
early as 1969 and has been in operational use since then to meet the
requirements of prioritization of smaller hydrologic units within river valley project
catchment areas.
The erosivity determinants are the climatic factors and soil and land attributes
that have direct or reciprocal bearing on the unit of the detached soil material.
The relationship can be expressed as:
Soil Erosivity = f (Climate, physiography, slope, soil parameters, land use/land
cover, soil management)
Silt Yield Index
The SYI is defined as the Yield per unit area and SYI value for hydrologic unit is
obtained by taking the weighted arithmetic mean over the entire area of the
hydrologic unit by using suitable empirical equation.
Prioritization of Watersheds/Sub-watersheds
The prioritization of smaller hydrologic units within the vast catchments is based
on the SYI of the smaller units. The boundary values or range of SYI values for
different priority categories are arrived at by studying the frequency distribution of
SYI values and locating the suitable breaking points. The watersheds/ sub-
watersheds are subsequently rated into various categories corresponding to their
respective SYI values.
The application of SYI model for prioritization of sub-watersheds in the catchment
areas involves the evaluation of:
a) Climatic factors comprising total precipitation, its frequency and intensity,
b) Geo-morphic factors comprising land forms, physiography, slope and
drainage characteristics,

GMR Londa Hydro Power Pvt. Ltd. EMP of Talong Londa H.E. Project
R S Envirolink Technologies Pvt. Ltd. 2.14
c) Surface cover factors governing the flow hydraulics and
d) Management factors.
The data on climatic factors can be obtained for different locations in the
catchment area from the meteorological stations whereas the field investigations
are required for estimating the other attributes.
The various steps involved in the application of model are:
Preparation of a framework of sub-watersheds through systematic delineation
Rapid reconnaissance surveys on 1:50,000 scale leading to the generation of
a map indicating erosion-intensity mapping units.
Assignment of weightage values to various mapping units based on relative
silt-yield potential.
Computing Silt Yield Index for individual watersheds/sub-watersheds.
Grading of watersheds/sub-watersheds into very high, high, medium, low and
very low priority categories.
The area of each of the mapping units is computed and silt yield indices of
individual sub-watersheds are calculated using the following equations:
Calculation of Silt Yield Index
To calculate silt yield index, the methodology developed by All India Soil & Land
Use Survey (Department of Agriculture, Govt. of India) has been followed, where
each erosion intensity unit is assigned a weightage value. When considered
collectively, the weightage value represents approximately the relative
comparative erosion intensity. A basic factor of K = 10 was used in determining
the weightage values. The value of 10 indicates a static condition of equilibrium
between erosion and deposition. Any addition to the factor K (10+X) is
suggestive of erosion in ascending order whereas subtraction, i.e. (10-X) is
indicative of deposition possibilities.
Delivery ratios were adjusted for each of the erosion intensity unit. The delivery
ratio suggests the percentage of eroded material that finally finds entry into
reservoir or river/ stream. Area of each composite unit in each sub-watershed
was then estimated.

GMR Londa Hydro Power Pvt. Ltd. EMP of Talong Londa H.E. Project
R S Envirolink Technologies Pvt. Ltd. 2.15
Silt yield index (SYI) was calculated using following empirical formula as follows:
SYI = (Ai * Wi ) * Di * 100 ; where i = 1 to n
Aw
where,
Ai = Area of ith unit (EIMU)
Wi = Weightage value of ith mapping unit
n = No. of mapping units
Aw = Total area of sub-watershed.
Di = Delivery ratio
Delivery ratios are assigned to all erosion intensity units depending upon their
distance from the nearest stream. The criteria adopted for assigning the delivery
ratio are as follows:
Nearest Stream Delivery ratio
0 - 0.9 km 1.00
1.0 - 2.0 km 0.95
2.1 - 5.0 km 0.90
5.1 - 15.0 km 0.80
15.1 - 30.0 km 0.70
The SYI values for classification of various categories of erosion intensity rates
are given in Table 2.4 and shown in Figure 2.8.
Table 2.4: Criteria for Erosion Intensity Rate
Priority categories SYI Values
Very high > 1300
High 1200-1299
Medium 1100-1199
Low 1000-1099
Very Low <1000
The erosion intensity category of various sub-watersheds in the catchment area
as per a SYI index has been estimated. The objective of the SYI method is to
prioritize sub-watershed in a catchment area for treatment. The area under very
high and high erosion categories only is to be treated at the project proponent
cost. Hence, CAT plan shall be suggested for very high and high erosion
GMR Londa Hydro Power Pvt. Ltd. EMP of Talong Londa H.E. Project
R S Envirolink Technologies Pvt. Ltd. 2.16
categories, as a part of the EMP, the expenses of which have to be borne by
project proponents.
2.4 WATERSHED MANAGEMENT – AVAILABLE TECHNIQUES
Watershed management is the optimal use of soil and water resources within a
given geographical area so as to enable sustainable production. It implies
changes in land use, vegetative cover, and other structural and non-structural
action that are taken in a watershed to achieve specific watershed management
objectives. The overall objectives of watershed management programme are to:
increase infiltration into soil;
control excessive runoff;
manage & utilize runoff for useful purpose.
Following Engineering and Biological measures shall be suggested for the
catchment area treatment:
Engineering Measures Step drain
Angle iron barbed wire fencing
Stone masonry
Check dams
Biological Measures Development of nurseries
Plantation/afforestation
Pasture development
Social forestry
The basis of site selection for different biological and engineering treatment
measures under CAT are given in Table 2.5.

GMR Londa Hydro Power Pvt. Ltd. EMP of Talong Londa H.E. Project
R S Envirolink Technologies Pvt. Ltd. 2.17
Table 2.5: Basis for Selection of Catchment Area Treatment Measures
Treatment measure Basis for selection
Social forestry, fuel wood and
fodder grass development
Near settlements to control tree felling
Contour Bunding Control of soil erosion from agricultural fields.
Pasture Development Open canopy, barren land, degraded surface
Afforestation Open canopy, degraded surface, high soil
erosion, gentle to moderate slope
Barbed wire fencing In the vicinity of afforestation work to protect it
from grazing etc.
Step drain To check soil erosion in small streams, steps
with concrete base are prepared in sloppy
area where silt erosion in the stream and
bank erosion is high due to turbidity of
current.
Nursery Centrally located points for better supervision
of proposed afforestation, minimize cost of
transportation of seedling and ensure better
survival.
2.5 CATCHMENT AREA TREATMENT (CAT) PLAN
In the present report, CAT Plan as per the slope, land use pattern, soil
characteristics has been suggested. The prioritization of sub-watersheds for
various treatment measures was done using SYI method. Therefore, the CAT
plan has been suggested only for sub-watersheds with very high and high
erosion categories as well as SYI.
Table 2.6: Erosion Intensity Categorization as per SYI Classification
Sub watershed Area in ha SYI Priority Category
W1 423.4 1198 Medium
W2 584.9 1250 High
W3 547.4 1178 Medium
W4 519.1 1153 Medium W5 244.8 1310 Very High W6 1427.0 1142 Medium
W7 749.4 1113 Medium
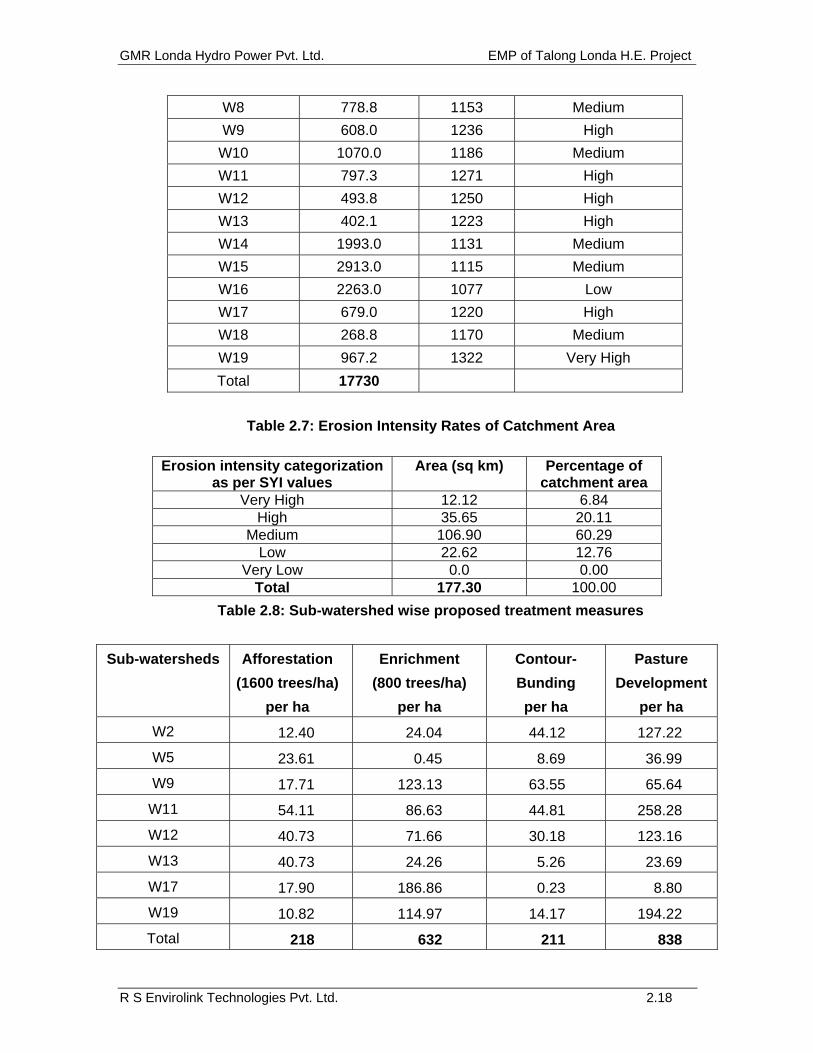
GMR Londa Hydro Power Pvt. Ltd. EMP of Talong Londa H.E. Project
R S Envirolink Technologies Pvt. Ltd. 2.18
W8 778.8 1153 Medium
W9 608.0 1236 High
W10 1070.0 1186 Medium
W11 797.3 1271 High
W12 493.8 1250 High
W13 402.1 1223 High
W14 1993.0 1131 Medium
W15 2913.0 1115 Medium
W16 2263.0 1077 Low
W17 679.0 1220 High
W18 268.8 1170 Medium
W19 967.2 1322 Very High
Total 17730
Table 2.7: Erosion Intensity Rates of Catchment Area
Erosion intensity categorization
as per SYI values Area (sq km) Percentage of
catchment area Very High 12.12 6.84
High 35.65 20.11 Medium 106.90 60.29
Low 22.62 12.76 Very Low 0.0 0.00
Total 177.30 100.00
Table 2.8: Sub-watershed wise proposed treatment measures
Sub-watersheds Afforestation
(1600 trees/ha)
per ha
Enrichment
(800 trees/ha)
per ha
Contour-
Bunding
per ha
Pasture
Development
per ha
W2 12.40 24.04 44.12 127.22
W5 23.61 0.45 8.69 36.99
W9 17.71 123.13 63.55 65.64
W11 54.11 86.63 44.81 258.28
W12 40.73 71.66 30.18 123.16
W13 40.73 24.26 5.26 23.69
W17 17.90 186.86 0.23 8.80
W19 10.82 114.97 14.17 194.22
Total 218 632 211 838

GMR Londa Hydro Power Pvt. Ltd. EMP of Talong Londa H.E. Project
R S Envirolink Technologies Pvt. Ltd. 2.19
The objective of the SYI method is to prioritize sub-watershed in a catchment
area for treatment. The area under very high and high erosion categories have to
be treated by the project proponents, which accounts for about 47.24% of the
total free draining catchment area.
2.6 COST ESTIMATE
The cost required for Catchment Area Treatment is Rs. 688.92 lacs. The details
are given in Tables 2.9.
Table 2.9: Cost Estimate for Catchment Area Treatment
S.
No. Item Rate
(Rs.) Target
Physical Financial (Rs. in Lacs)
Biological Measures 1. Afforestation (1600 trees/ ha) 39,000/ha 218.0 ha 85.022. Enrichment Plantation (800
trees/ha) 19,500/ha 632 ha 123.24
3. Maintenance of afforestation area
5,000/ha 850 ha 42.50
4. Pasture development 20,000/ha 838 ha 167.605. Nursery development 2,00,000/n
o.20 no. 40.00
6. Maintenance of nursery 100,000/no 20 no. 20.007. Vegetative fencing 45,000/km 10 km 4.508. Watch and ward for 5 years
@ 10/ persons 5000/man-
month600 Man-
months 30.00
Engineering Measures 9. Contour Bunding 25,000/ha 211 ha 42.20
10. Check Dams 2,00,000 22 no. 44.00 Total 599.06
Total cost for Biological and Engineering Measures = Rs. 599.06 lacs Administrative expenditure - A Government Expenditure 3% of A (including O&M) = Rs. 17.97 lacs
Establishment cost 7% of A = Rs. 41.94 lacs
Contingency 5% of A = Rs. 29.95 lacs
Total Rs. 688.92 lacs
The details of area to be treated are given in Figure 2.9. The year wise physical
and financial targets are given in Table 2.10.

GMR Londa Hydro Power Pvt. Ltd. EMP of Talong Londa H.E. Project
R S Envirolink Technologies Pvt. Ltd. 2.20
Table 2.10: Year-wise Target (Physical and Financial in Rs Lacs) for Catchment Area Treatment Plan Measures Year I Year II Year III Year IV Year V Total
Physical Financial Physical Financial Physical Financial Physical Financial Physical Financial Physical Financial Biological measures
Afforestation 75 ha 29.25 75 ha 29.25 68 ha 26.52 - - - - 218.0 ha 85.02
Enrichment Plantations
150 ha 29.25 150 ha 29.25 150 ha 29.25 150 ha 29.25 32 ha 6.24 632.0 ha 123.24
Maintenance of afforestation
225 ha 11.25 225 ha 11.25 218 ha 10.90 150 ha 7.50 32 ha 1.6 850.0 ha 42.5
Pasture Development
175 ha 35.00 175 ha 35.00 175 ha 35.00 175 ha 35.00 138 ha 27.6 838.0 ha 167.6
Nursery development
10 no. 20.00 10 no. 20.00 - - - - - - 20 no. 40.0
Maintenance of Nursery
- - - 8.0 - 8.0 - 4.0 - - - 20.0
Vegetative fencing
3 km 1.35 3 km 1.35 3 km 1.35 1 km 0.45 - - 10.0 km 4.5
Watch and ward
- 6.0 - 6.0 - 6.0 - 6.0 - 6.0 - 30.0
Engineering Measures
Contour Bunding
75 ha 15.0 75 ha 15.0 61 ha 12.2 - - - - 211.0 ha 42.2
Check Dams 6 no. 12.0 6 no. 12.0 6 no. 12.0 4 no. 8.0 - - 22 no. 44.0Total 159.1 167.1 141.22 90.2 41.4 599.06

GMR Londa Hydro Power Pvt. Ltd. EMP of Talong Londa H.E. Project
R S Envirolink Technologies Pvt. Ltd. 2.21
Figure 2.8 SYI of the Area

GMR Londa Hydro Power Pvt. Ltd. EMP of Talong Londa H.E. Project
R S Envirolink Technologies Pvt. Ltd. 2.22
Figure 2.9 CAT Treatment Measures

GMR Londa Hydro Power Pvt. Ltd. EMP of Talong Londa H.E. Project
R S Envirolink Technologies Pvt. Ltd. 3.1
CHAPTER 3
FISHERIES CONSERVATION PLAN
3.1 INTRODUCTION
A river valley project may have adverse or beneficial effects on the fish fauna,
depending upon the particular situation and the fish fauna inhabiting the concerned
river. Similarly it has various impacts on the people, the livelihood of which depends
on the fish. The regulation of a river leads the fragmentation of habitat and may have
adverse effects on indigenous and migratory fish. On the other hand pondage
provides a large volume of water, which is beneficial with respect to fish culture and
may play an important role in uplifting economic growth. Regarding the river valley
project, fish and fisheries is an important issue in the management strategy. The
fishery development is planned either for the conservation of indigenous species or
for commercial aspects. The present management plan has been prepared for the
proposed Talong Londa HEP in Arunachal Pradesh, which would be a compensatory
effort and fulfill the fish diet of inhabitants.
3.2 FISH COMPOSITION
River Kameng is a tributary of river Brahmaputra and has good fisheries potential.
There are no regular fish landing centers in the project area. It was also observed
during the field visits, that no large scale fishing activities are being practiced by the
population in and around the project area. There are no permanent fishermen in the
project area; however, few locals are involved in fishing activities to augment their
income. No family is fully dependent on fishing for earning his living and the activity is
mostly of subsistence type.
As a part of the EIA study, fisheries surveys were conducted during January 2006
and April 2006 and July 2007 using cast net. 50 castings each in the upstream and
downstream of the dam site were done in different sections of the river. A total no. of
16 species observed during survey which is given in Table-3.1
Table 3.1: Fish Species Observed in Kameng River Scientific Name Common/Local Name SchIzopyge Progastus Trout Schizothorax richardsonii Snow Trout Danio aequipinnatus Danio Danio dangila Dadva Barilius barna - Barilius bendelisis -

GMR Londa Hydro Power Pvt. Ltd. EMP of Talong Londa H.E. Project
R S Envirolink Technologies Pvt. Ltd. 3.2
Acrossocheilus hexagonolepis Mahseer Chagunis chagunio - Tor putitora Mahseer Tor tor Mahseer Crossocheilus latius - Gara gotyla - Gara annandalei - Botia rostrata - Amblyceps mangois - Glyptothorax horai -
The dominant species in the area is Mahseer, followed by Acrosocheilus sp. Labeo,
Chagunius chagunio, Salmostoma bacaila, Schizothoraxsp. Mahseers are normally
observed at elevations between 300-800 m above mean sea level. They migrate
from large rivers to small streams and tributaries for spawning. During the fisheries
survey conducted in the project area, which has an elevation ranging from 400-500 m
above mean sea level, Mahseer was observed. They come to the area for spawning
purposes. There is every possibility of developing a local stock of both species Tor
and Acrossocheilus. In due course of time the local stock is bound to undertake
upstream migration from the proposed reservoir.
3.3 IMPACTS ON FISH FAUNA
3.3.1 IMPACTS DUE TO SUBMERGENCE
A riverine system would be converted into semi-lacustrine system. It will change the
physical, chemical and biological characteristics of water. Also, the fish adapted in
lotic system would suffer in stagnant waters. The inundation might lead the depletion
of bottom dweller species like Glyptothorax spp., etc.
3.3.2 IMPACTS DUE TO PROPOSED DAM ON THE RIVER
The dam on the river Kameng near village Pachi will result in creation of 350 ha of
submergence area. The dam will change the fast flowing river to a quiescent
lacustrine environment. The creation of a pond will bring about a number of
alterations in physical, abiotic and biotic parameters both in upstream and
downstream directions of the proposed dam site. The micro and macro benthic biota
is likely to be most severely affected as a result of the proposed project.
The positive impact of the project will be the formation of a water body which can be
used for fish stocks on commercial basis to meet the protein requirement of region.
The commercial fishing in the proposed reservoir would be successful, provided all
tree stumps and other undesirable objects are removed before submergence. The

GMR Londa Hydro Power Pvt. Ltd. EMP of Talong Londa H.E. Project
R S Envirolink Technologies Pvt. Ltd. 3.3
existence of tree stumps and other objects will hinder the operation of deep water
nets. The nets will get entangled in the tree stumps and may be damaged.
The reduction in flow rate of river Kameng especially during lean period is likely to
increase turbidity levels downstream of the dam. Further reduction in rate of flow may
even create condition of semi-dessication in certain stretches of the river. This would
result in loss of fish life by poaching. Hence, it is essential to maintain minimum flow
required for sustenance of riverine fisheries till the disposal point of the tail race
discharge.
3.3.3 IMPACTS ON MIGRATORY FISH SPECIES
The obstruction created by the dam would hinder the migration of certain commercial
fish species especially Schizothorax sp. These fishes undertake annual migration for
feeding and breeding. Therefore, fish migration path may be obstructed due to high
dam and fishes are expected to congregate below the dam wall. Under this situation
poaching activities may increase in the area.
Most of the species will shift to the section of the river where they find favourable
environment for breeding since the dam is 104 m high construction of fish ladders is
not feasible in the proposed dam. However, it is proposed that the artificial seed
production in hatchery may be adopted which can be stocked in the river stretches
downstream and upstream of the proposed dam.
The Schizothorax species are steno-thermal. During winter months, they migrate
from headwaters near flood plains in search of suitable feeding and breeding
grounds. The sampling in river Kameng both on upstream and downstream of the
proposed dam site for macro-benthic life gave 2 units/sq m of fry of Schizothorax sp.
This observation further strengthens the fact that Schizothorax sp. migrate during
winter months. With the onset of summer season, these species migrates upstream.
These species during project construction phase are likely to congregate in the
reservoir. It is expected that in due course of time these species will adapt
themselves to the changed habitat.
3.4 SUSTENANCE OF RIVERINE FISHERIES
Based on the present fish fauna observed in river Kameng and considering its
location in a warm sub-tropical region, Mahseer and other commercial carps (Catla
catla, Labeo rohita and Cirrhinus mrigala) seem to be the most appropriate for
development of reservoir fisheries for commercial purposes.

GMR Londa Hydro Power Pvt. Ltd. EMP of Talong Londa H.E. Project
R S Envirolink Technologies Pvt. Ltd. 3.4
The stocking program comprises of the following:
Acclimatization stocking (introduction of new fish species in water course)
Supplementary stocking (a species already living in a water body)
Transfer stocking (transportation of mature fish from one water body to another)
Repetitive stocking (species which do not propagate in natural conditions).
To carry out the stocking programme on annual basis, suitable aquaculture facilities
have to be created in river Kameng to meet the requirements of fingerlings. The
endemic stocks in Kameng river are the Mahseer and other commercial major carps.
The proposed aquaculture facilities have to meet the requirements of fingerlings of
the two main groups of carps. The proposed aquaculture facilities have to be in two
parts namely (a) flow through system facility for Mahseer species; and (b) Earthen-
stagnant water facility for other commercial carps.
Taking into consideration the total submergence area of 350 ha, the total requirement
of fingerlings of Mahseer and other commercial carps works out to be about 24500 in
equal proportion (12250 Mahseer and 12250 other commercial carps). The stocking
rate of 100 fingerlings per hectare is recommended for both the species. To
accommodate the infrastructure, a site approximately 3.0 ha in area may be needed
for both the Mahseer and other commercial carps.
The cost required to create aquaculture facilities (excluding land) as listed in Table
3.2 & 3.3. Since production, transportation and stocking of fisheries is a highly
specialized subject for which project proponent may not have requisite expertise, it is
recommended that these activities may be coordinated by fisheries department for
which an amount of Rs. 65.00 lacs has been allocated.
Table 3.2: Aquaculture Facility Components and Fund Allocation to Raise
Seeds of Mahseer Species (Flow-through-System)
S. No. Component Dimension
(m3) Rate of
flow (lpm) Total
Number Cost (Rs. in lacs)
1 Hatchery Building 5x5x5 - - 2.00 2 Hatching with 4 tray each 2.0x0.5x0.4 3-5 10 5.00 3 Nurseries ponds 5x1x0.5 25-50 5 5.00 4 Rearing Units (Cement lined) 10x2x1.0 75-100 3 5.00 5 Raceways (Cement lined) 10x5x1.0 150-200 2 5.00 6 Storage-cum-desilting Tank 25x10x5 1 3.00 7 Office Building As per norms - 1 5.00 8 Residential Unit As per norms - 4 15.00 9 Installation of water supply system - - - 2.50
10 Electric Installation - - - 2.50 Total 50.00

GMR Londa Hydro Power Pvt. Ltd. EMP of Talong Londa H.E. Project
R S Envirolink Technologies Pvt. Ltd. 3.5
Table 3.3: Aquaculture Facility Components and Fund Allocation for Other Commercial Carps (Earthen Stagnant Water)
S. No. Component Dimension
(m3) Number Total water
area (m2) Cost (Rs. in lacs)
1 Nursery Pond 10x5x1 5 250 2.50 2 Rearing Ponds 20x5X1 5 500 5.00 3 Stocking Ponds 20x10x2 3 - 7.50 4 Office building common - - - 5 Residential units common - - -
Total 15.00
The selection of Mahseer and other commercial carps is based on the principle that
endemic or local fish population adapt better to less pronounced changes in the
abiotic habitat than to profound changes. It is expected that in the course of time,
Mahseer would be able to adjust to the changed ecology, especially their movement
from the reservoir to upstream in search of feeding and breeding grounds.
With the creation of the reservoir the local stock of Mahseer would get trapped as a
result of damming. In due course of time, local stock available in the reservoir will
have an upstream extension into different streams after impoundment with some
evidence of seasonal movement between reservoir and streams. As a result, the
annual recruitment of stock of Mahseer in due course of time would replenish the
population, otherwise, affected due to closure of migratory route from flood plains to
the hill stream stretches.

GMR Londa Hydro Power Pvt. Ltd. EMP of Talong Londa H.E. Project
R S Envirolink Technologies Pvt. Ltd. 4.1
CHAPTER 4
PUBLIC HEALTH DELIVERY SYSTEM
4.1 THE PRESENT STATUS OF MEDICAL FACILITIES
The delivery of health services is rendered through hospitals, primary health care
centers and dispensaries. The district hospital serve as a referral centre for
complicated cases, while the primary health centers and dispensaries provide health
needs primarily to the inhabitants of rural areas.
4.2 CONTROL OF VECTOR-BORNE DISEASES
The increase in water fringe area provides suitable habitats for the growth of vectors
of various diseases and they are likely to increase the incidence of water-related
diseases. Malaria could be the major vector-borne disease in the area. The main
breeding season of the anopheles mosquito (malaria vector) is the months of
September and March. The preferred habitat is stagnant or slow moving fresh water
open to sunshine or moderate shade. Malaria can be controlled by mosquito control
and mosquito proofing measures.
The anti-malarial operations can be coordinated by various Primary Health Centers in
the nearby villages and hospital at district headquarters, in association with the
project authorities. The suggested measures are explained in following paragraphs:
The site selected for habitation of workers should not be in the path of natural
drainage.
Adequate drainage system to dispose storm water drainage from the labour
colonies should be provided.
Adequate vaccination and immunization facilities should be provided for workers
at the construction site.
The labour camps and resettlement sites should be at least 2 to 3 km away from
a main water body or borrow pit areas.
4.3 DEVELOPMENT OF MEDICAL FACLITIES
A population of about 1,500 is likely to congregate during the construction phase.
There is no medical facility in the immediate vicinity of the project area. It is
recommended that the following medical facility should be provided by the developer
to ensure safe and healthy operations during the entire construction phase:
One fully equipped ambulance need to be procured to provide pre-hospital care
to accident victims. The ambulance should always be stationed near major

GMR Londa Hydro Power Pvt. Ltd. EMP of Talong Londa H.E. Project
R S Envirolink Technologies Pvt. Ltd. 4.2
construction sites or the sites where risky operations are taking place such as
blasting during tunneling. The ambulance should be equipped with life saving
equipment, drugs along with trained manpower and communication system.
Typically the ambulance should have equipments such as Fornoflex Chair/COT,
Ventilator, Vacuum splint kit (Adult), Scoops Stretcher, Oxygen Cylinder with
accessories, Resuscitation bag (Adult), Suction pump, Spine board,
siren/beacon, Emergency light with public address system, Wireless equipments,
additional battery, First Aid bag, BP instrument, stethoscope, etc.
First-aid posts need to be established – one near dam site (Pachi village) to take
care of basic medical needs of the workers at major construction site. The first aid
posts will have essential medicines including ORS packets, dressing materials,
stretcher, wheel chair, etc. The first aid post can be housed in temporarily erected
structure and should be managed by one Health Assistant and assisted by one
dresser/first aid attendant. A visiting doctor can attend First Aid post regularly
every day at a fixed time.
As the existing medical facilities in the area are not adequate, budget provisions
have been made for strengthening existing PHCs and PHSCs in the area.
4.4 HEALTH EXTENSION ACTIVITIES
The health extension activities will have to be carried out in the villages situated
within the study area. It is important to inculcate hygienic habits of environmental
sanitation especially with respect to water pollution by domestic wastes.
A medico needs to be engaged to make regular visits to these villages and organize
health promotional activities with the active participation of the local village leaders,
NGOs and available local health functionaries. The health functionaries would
undertake the following tasks as a part of health promotional activities:
Organize awareness programs and medical camps to make people aware about
the common diseases in the region. This should include poster campaign,
awareness camps, medical camps for health check-ups and
vaccination/treatment, etc.
Collect water samples to ascertain the potability of water from different sources
so as to monitor regular disinfection of drinking water sources.
Maintain close surveillance on incidence of communicable diseases in these
villages.
Maintain close liaison with the community leaders and health functionaries of
different departments, so that they can be mobilized in case of an emergency.
Close interaction to be maintained with health department functionaries of the state
government

GMR Londa Hydro Power Pvt. Ltd. EMP of Talong Londa H.E. Project
R S Envirolink Technologies Pvt. Ltd. 4.3
4.5 COST ESTIMATES
Budgetary estimates for public health delivery system have been worked out as Rs.
70.00 Lacs, as per the break up given at Table 4.1.
Table 4.1: Budgetary estimates for developing health care facilities
Sl. No. Particulars Amount (Rs. Lacs)
A. Ambulance 1 no. with all the basic medicare facilities and small DG set, etc. to cater for villages in the project area
10.00
B. Four first aid posts including sheds, furniture and basic equipment
10.00
C. Budget for strengthening existing medical facilities 20.00
D. Budget for Health Awareness/ Vaccination Camps 7.00
E. Budget for combating communicable diseases 8.00
F. Budget for combating vector borne diseases 5.00
G. Maintenance of ambulance and recurring contingent expenditure @ Rs.2.00/ year
10.00
Total (Rs. Lacs) 70.00

GMR Londa Hydro Power Pvt. Ltd. EMP of Talong Londa H.E. Project
R S Envirolink Technologies Pvt. Ltd. 5.1
CHAPTER 5
SOLID WASTE MANAGEMENT PLAN
5.1 INTRODCUTION
The construction of the proposed Talong Londa HEP will involve different categories
of manpower like labour, technical, other officials and service providers. Most of
these technical and non- technical workers will be temporary and will leave the region
as soon as the construction work of the project is finished. Some of the workers will
be accompanied along with their families. The total population of workers and their
families has been calculated around 1500. These people will be living in temporary
and permanent colonies / settlements. Large amount of solid waste and wastewater
will be generated from the temporary / permanent colonies. A proper management
system will be required to dispose off this generated waste to keep the environment
of the region clean and healthy. These colonies and temporary settlements will also
require proper water facilities for drinking and cleaning.
The project authorities will take sufficient precautions for developing proper system for
the sewage treatment from the colonies of labours and workers, solid waste disposal
and cleaning of the colony area. For these septic tanks and soak pits shall be provided
for individual dwellings. There should be proper water facilities to these workers for
drinking and other purposes. The project authorities will ensure proper waste disposal
by adopting various disposable methods like incineration, composting etc.
5.2 LABOUR POULTAION MIGRATING IN THE PROJECT AREA
About 400 workers and 100 technical staff are likely to work during the peak
construction phase in the project area. Thus a total of 500 persons along with their
families will reside in the project area during peak construction phase. The schedule
of labour requirements during the project construction period is given in Table-5.1.
Table 5.1: Periodic labour requirement during the construction of the project
Year No. of Labourers No. of Technical Staff Total
I 200 50 250
II 320 80 400
III 400 100 500
IV 400 100 500
V 300 100 400
During peak construction phase, the total human populations that live around the
project site are around 1423 as detailed in Table 5.2. Thus for worst scenario 1500
persons shall be taken. This population is expected to reside in the project area at

GMR Londa Hydro Power Pvt. Ltd. EMP of Talong Londa H.E. Project
R S Envirolink Technologies Pvt. Ltd. 5.2
any given time. The other assumptions made for assessing human load are as
under:
Family size has been assumed as 5, 80% labourers and technical staff are
married,
Out of total workforce, 80% will be such that both husband and wife will work
50% of technical staff will come with their families and only husband will work
2% of total migrating population has been assumed as service providers
50% of service providers will have families
Based on these assumptions the peak migrant population has been calculated as
1500 persons (Table 5.2). This population is expected to reside in the project area at
any given time.
Table 5.2: Calculation of total migrant population (Peak time) A. Migrant Population of Laborers Total labor force 400 Married laborers (80% of 400) 320 Single laborers (20% of 400) 80 Husband and wife both working Labour (80% of 320) 256 Number of families where both husband and wife work (256/2) 128 Number of families where only husband work (20% of 320) 64 Total number of laborers families (128 + 64) 192 Total Migrant Population of Laborers (192 x 5 + 80) 1040
B. Migrant Population of Technical Staff Total technical staff 100 Married technical staff 50 Single technical staff 50 Total migrant population of technical staff (50 x 5 + 50) 300 Migrant Workforce (Labor plus Technical) 1340
C. Service Providers Total service providers (2% of total migrant workforce) 27 Married service providers (50 % as assumed) 14 Single service providers 14 Total migrant population of service providers (14 x 5 + 14) 84 Total Migrant Population 1424
In India average per capita solid waste generated per day is considered as 425 g (dry
weight). Therefore, for about 1500 persons an estimated amount of about 638 kg/day
of solid waste will be generated. This waste would not be allowed to be dumped near
any surface water body or a stream.
Adequate facilities for collection conveyance and disposal of municipal waste
generated from labour camps should be developed. For solid waste collection
masonry storage vats, each of 2 m3 capacity at convenient dumping points in the

GMR Londa Hydro Power Pvt. Ltd. EMP of Talong Londa H.E. Project
R S Envirolink Technologies Pvt. Ltd. 5.3
labour camp will be constructed. Each vat will have a storage capacity of 150 kg (dry
weight) of garbage, which will be emptied at regular intervals and will be transported
to the landfill site. One covered truck to collect the solid waste from the common
collection point and transfer it to the disposal site needs to be put to service. A
suitable landfill site can be identified and designed to contain the municipal waste
from all the Project Township, labour colonies, etc. A total provision of Rs. 65.21
Lacs needs to be earmarked for this purpose. The details are given in Table-5.3.
Table 5.3: Expenditure on Solid Waste Management Item Cost (Rs. in Lacs)
Two covered trucks for conveyance of solid waste up to landfill site
30.00
Manpower cost for 6 persons @ Rs.5000/month for 4 years including 15% escalation/year
21.91
Waste collection hand carts 4@ Rs. 25,000/unit 1.00 Preparation of landfill site 1.30 Awareness programme 1.00 Prevention of leaching from landfill 10.00 Total 65.21
Generally, from sanitary landfill, there is little risk from methane, generated due to the
decay of vegetable matters, as it slowly diffuses at low concentration through the
covering material. The most serious risk from sanitary landfill is that of pollution from
leachates. Thus, the bed of the disposal sites should be covered with an impervious
material so as to ensure that leachate does not lead to soil and water pollution.

GMR Londa Hydro Power Pvt. Ltd. EMP of Talong Londa H.E. Project
R S Envirolink Technologies Pvt. Ltd. 6.1
CHAPTER 6 MUCK DISPOSAL PLAN
6.1 INTRODUCTION
The proposed Talong Londa Hydroelectric project is envisaged as run of the river
scheme situated in East Kameng district of Arunachal Pradesh. The project
comprises of concrete dam with a height of 108.5 m above deepest foundation level
across river Kameng near village Londa. The water conductor system consists of
about 94 m length and 5.2 m diameter three penstocks along the dam surface to feed
the two units of Vertical Francis turbine in surface power house of 225 MW having
three units of 75 MW each. The power house is located at left bank-toe of the dam. In
addition to this the construction of spillway channel, intake structure, power house
complex, and the approach roads as well as the excavation for the dam would also
generate a large amount of material.
6.2 QUANTUM OF MUCK GENERATION
About 24.4 Lacs cum of muck considering swell index of 40% is expected to be
generated as a result of construction of Dam, power house and other appurtenant
works. The project proposes to utilize about 14.10 Lac Cum of excavated material as
construction material in various project structures. Remaining about 10.3 Lacs cum
muck is proposed for dumping at pre-identified location. An area of 12 ha has been
embarked for the disposal of muck which is sufficient to meet the estimated muck
quantity. Details of the Muck Dumping site with typical retaining wall are provided in
Figure 6.1 to Figure 6.3.
6.3 DUMPING SITES
Most of the excavated material is proposed to be disposed at the designated site
near the proposed dam site. The muck would be piled at an angle of repose (<45°)
at the proposed dumping sites which is typical retaining angle of loose rock. Muck
slopes would be broken up by creating benches across the slope. This will be done
to provide stability to the slopes and also to provide ample spacing for planting of
trees later after sufficient vegetation cover has established itself. It would further help
in holding and consolidating the material stacked at different sites. Efforts will be
made to relocate and rehabilitate the material within short distances from sites of its
generation.

GMR Londa Hydro Power Pvt. Ltd. EMP of Talong Londa H.E. Project
R S Envirolink Technologies Pvt. Ltd. 6.2
6.4 PROCESS OF DUMPING
The main objectives of process of muck dumping and restoration of these muck
disposal sites are:
to protect and control soil erosion
to create greenery in the muck disposal areas
to improve and develop the sites into recreational sites
to ensure maximum utilization of muck for the construction purpose
to develop the muck disposal sites/ dumping yards to blend with the surrounding
landscape
to minimize damages due to the spoilage of muck in the project area.
Suitable retaining walls shall be constructed prior to dumping of muck and terraces
would be developed so as to support the muck on vertical slope and for optimum
space utilization. Loose muck would be compacted layer-wise. The muck disposal
area will be developed in a series of terraces of retention walls. In between the
terraces, catch water drains will also be provided. The terraces of the muck disposal
area will be ultimately covered with fertile soil and suitable plants will be planted
adopting suitable bio-technological measures.
The project authorities would ensure that the dumping yards blend with the natural
landscape by developing the sites with gentle slopes, bunds, terraced and water
ponds, patches of greenery in and around them. These sites can also be developed
later as recreational parks and tourist spots with sufficient greenery by planting
ornamental plants. The re-vegetation of dumping yards through ‘Integrated
Biotechnological Approach’ would be undertaken. It may be necessary to inoculate
the spoil dumps for development of landscape as the soils would be poor in nutrients.
This can be developed through culture of microorganism or vermiculture practices at
the nurseries developed for this purpose. This task can be undertaken by reputed
agencies that have the required technology in the field of reclamation of derelict and
degraded lands.
All the spoil areas will be developed as per the latest technology of dumping, the
impact of rain, the time and angle of soil setting. In addition sprinkling of water may
also be resorted to, if required to avoid or minimize dust pollution. Proper drainage
system also has to be provided to ensure unobstructed flow of runoff. Planting with
suitable species of trees, shrubs and other biomass will also be initiated.

GMR Londa Hydro Power Pvt. Ltd. EMP of Talong Londa H.E. Project
R S Envirolink Technologies Pvt. Ltd. 6.3
6.5 RECLAMATION MEASURES FOR STABILIZATION OF SPOIL DUMPS
6.5.1 ENGINEERING MEASURES
For stacking of dumped material concrete masonry retaining walls are proposed to
be built before the dumping of any material on to the site. The cost of the same has
been given in Table 6.1. In addition catchwater drains are also proposed to be built
and leveling of soil would also be done after dumping the material on every cycle and
simultaneously improving the drainage of the disposal site.
Table 6.1 Cost of engineering structures to be built at muck disposal sites
S. No. DESCRIPTION Qty(Cum) Unit Rate
(Rs.)Amount (Rs.
in lacs) 1 Open Excavation
In Soil 3150 m3 253 8.0
2 Concrete (PCC) - M15 3910 m3 4739 185.3
3 Stone Wire crates 1564 m3 800 12.5 4
Contingencies and Work Charged Establishment @ 3% of cost of works except L.S. items
6.15
Total (A) 211.95
6.5.2 BIOLOGICAL MEASURES
As the excavated material is disposed in muck disposal yards which are in general
devoid of nutrients and soil contents to support a vegetation cover, therefore, special
biological measures, however, are required to be undertaken. The soil required for
spreading over such an area would require nutrient profiling of soil for different base
elements. Appropriate admixture of nutrients for application such as NPK would be
done before providing soil cover on the top surface of muck disposal site for
undertaking any re-vegetation or afforestation of the area.
The re-vegetation of the dumping sites through ‘Integrated Biotechnological
Approach’ to be followed would be based on the following parameters:
i) Evaluation of dumped material for its physico-chemical properties to assess the
nutrient status to support vegetation.
ii) Formulation of appropriate blends of organic waste and compost generated from
colonies and soil to enhance the nutrient status of rhizosphere.
iii) Inoculation of plants with suitable mycorrhizal fungi, rhizobium, azotobacter and
phosphate solubilizers (biofertilizers inoculum).

GMR Londa Hydro Power Pvt. Ltd. EMP of Talong Londa H.E. Project
R S Envirolink Technologies Pvt. Ltd. 6.4
iv) Monitoring of growth response of different plant species from time to time and
undertake appropriate mitigative measures, if required.
Mass culture of plant specific biofertilizers and mycorrhizal fungi required for this
programme shall be procured from TERI or similar agencies. Plantation of saplings
will be carried out in pits in plain area of spoil tips, using identified blend and
biofertilizer inoculum. The pits will be filled with the mixture of FYMC and mycorrhizal
inoculum near the root system. After this, plant saplings already inoculated with
biofertilizers (Rhizobium and Azotobacter bacteria) would be planted and refilling will
be done to cover the entire plant root system. The citrus peel to be arranged from the
orchards in the region. Turfing (sodding) and suitable shrubs will be grown at slopes.
For this the indigenous and native plant species of high ecological and economic
value and which can adapt to local habitat will be selected. The recommended tree
species are given in Table-6.2.
Table 6.2: Recommended Tree Species for Afforestation Botanical name Local NameAltingia excels Jutuli Acacia auriculiformis Akash mohni Dendrocalamus sp. Syzygium sp Jamun Duabanga grandiflora Khokan Bauhinia purpurea Kanchan Lagerstroemia minuticarpa Ajar
All the approach roads to various project structures will be constructed by employing
the methodology recommended by Border Roads Task Force (BRTF) with minimal
environmental damage. The methodology consists in developing the formation width
in half cutting and half filling, so that the materials obtained from cutting are utilised in
filling. The excavation on hill side will be done to get a stable slope for the materials
encountered. At places where there is problem of retaining the hill slope breast wall,
gabion walls shall be done in natural slope to retain the fill materials.
In case of steep gorge, retaining wall, gabion structure shall be constructed to retain
the fill material. To minimise the environmental damage, construction material like
stones, sand, etc. required for the construction of road will be obtained mostly from
the excavated material. In the streams, box culverts will be provided to prevent the
erosion of nala bed.
6.6 COST ESTIMATES
The cost estimate for implementation of muck disposal plan undertaking engineering,
biological, bio-technological measures and maintenance is given below.

GMR Londa Hydro Power Pvt. Ltd. EMP of Talong Londa H.E. Project
R S Envirolink Technologies Pvt. Ltd. 6.5
Table 6.3: Cost estimates for biological measures
S. No. Biological Measures Quantity Unit Rate
(Rs.)
Amount
(Rs. in Lacs)
1. Plantation 12 ha 39000 4.68 2. Turfing on 4 ha 39000 1.56 3. Fencing cost 1000 RM 550 5.50 4. Channeling fencing 2000 m2 900 18.00 5. Cost of 2 no. portable pumps
with accessories 2 No. 2500 5.00
6. Cost of FYMC & bio-fertilizers Job LS - 2.00 7. Cost of biological inputs, soil
testing and technology Job LS - 10.00
8. Watch and ward 4 No. @ Rs. 150/man/day for 4 years
5840 Man day
150 8.76
9. Add 15% for tribal area 8.32 Total 63.82
A provision of Rs. 275.77 Lacs has been earmarked for stabilization and restoration
of muck disposal site. The details are given in Table-6.4.
Table-6.4: Financial Requirements for Relocation of Dumping Material
S. No. Item Cost (Rs. in Lacs)
1. Engineering MeasuresConstruction of retaining walls including the cost of wire mesh, preparation of beds, cutting, etc.
211.95
2. Biological MeasuresStabilization and Re-vegetation of dumped material using VAM technology
63.82
Total 275.77
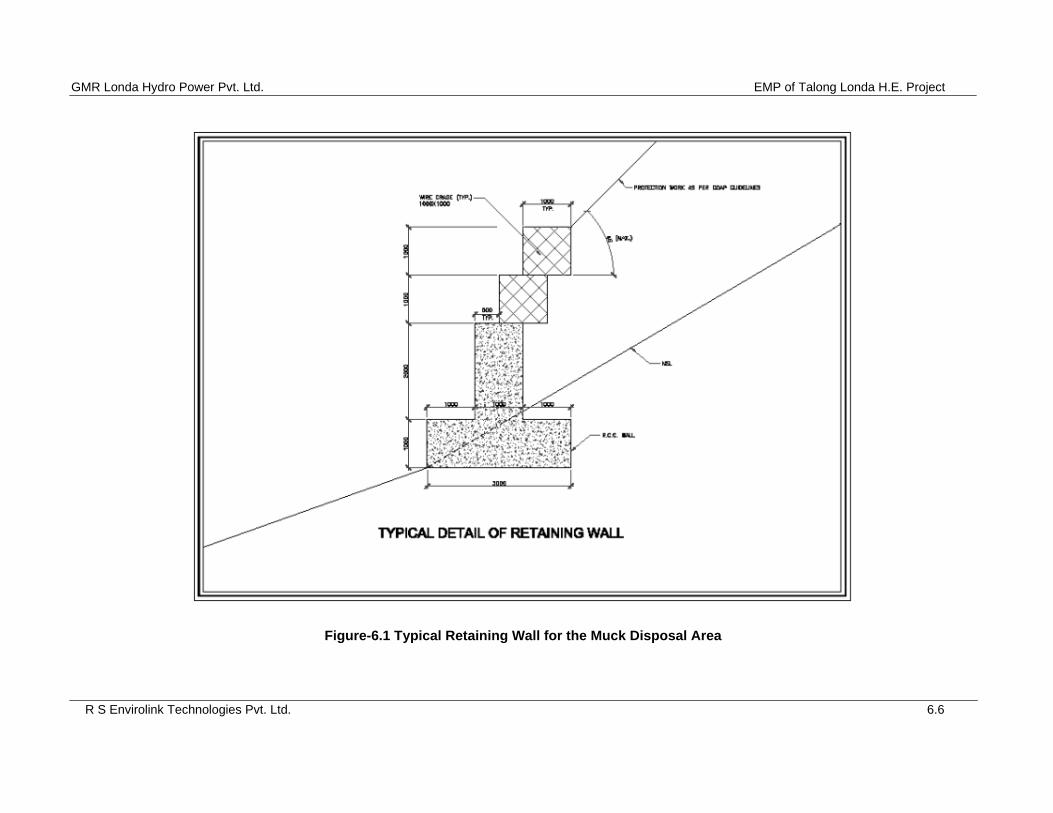
GMR Londa Hydro Power Pvt. Ltd. EMP of Talong Londa H.E. Project
R S Envirolink Technologies Pvt. Ltd. 6.6
Figure-6.1 Typical Retaining Wall for the Muck Disposal Area
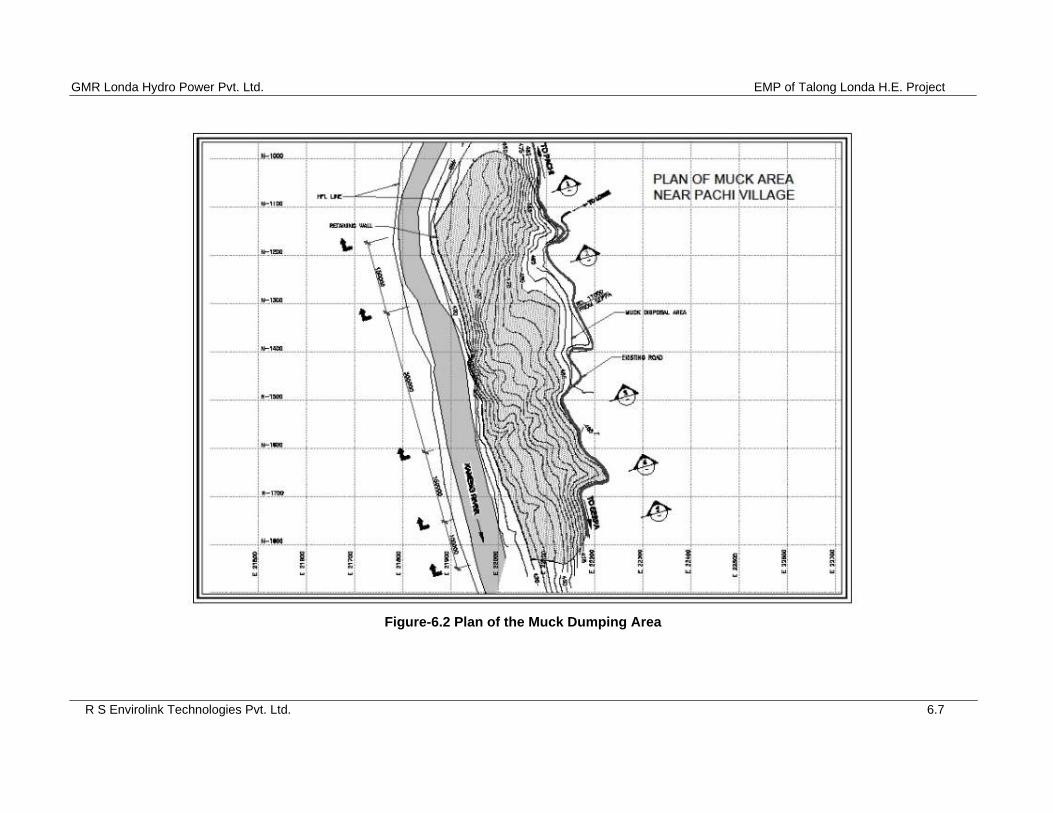
GMR Londa Hydro Power Pvt. Ltd. EMP of Talong Londa H.E. Project
R S Envirolink Technologies Pvt. Ltd. 6.7
Figure-6.2 Plan of the Muck Dumping Area

GMR Londa Hydro Power Pvt. Ltd. EMP of Talong Londa H.E. Project
R S Envirolink Technologies Pvt. Ltd. 6.8
Figure-6.3 Cross Section through Muck Dumping Area

GMR Londa Hydro Power Pvt. Ltd. EMP of Talong Londa H.E. Project
R S Envirolink Technologies Pvt. Ltd. 7.1
CHAPTER 7
LAND SCAPING AND RESTORATION OF CONSTRUCTION SITE
7.1 INTRODUCTION
The proposed Talong Londa H.E. Project on Kameng River would require
construction of various project components and infrastructural facilities like residential
colonies for its staff, offices, contractor’s and labour colonies in addition to various
access roads and other structures.
During construction phase of the project, number of temporary construction sites and
working areas will come up. In addition to this mining for construction material will
also be carried out. To restore these areas to its original landscape as much as
possible and retain its aesthetic values following restoration measures have been
suggested. In addition avenue plantations around the colonies and working sites will
be carried out.
7.2 QUARRYING OPERATIONS
The total quantity of aggregate required for concreting and masonry in the proposed
dam is about 23.25 cum3. Total area of the identified quarries is 31 Ha.
Quarry Sites Location of Quarry Sites Area in ha
I In situ Rock Quarry at Meuba 4.0
II In Situ Rock Quary at Rega 12.0
III In Situ Rock Quary at D/s of Dam Axis 5.0
IV In Situ Rock Quary at Pachi 10.0
Total area to be restored 31.0
The quarrying operations are semi-mechanized in nature. Normally, in a hilly terrain
like Arunachal Pradesh, quarrying is normally done by cutting the hill face. A
permanent scar is likely to be left, once quarrying activities are over. With the
passage of time, rock from the exposed face of the quarry under the action of wind
and other erosion forces, get slowly weathered and after some time, they become a
potential source of landslide.
These activities will result either in the modification or destruction of the existing
landscape of the area. It is therefore imperative that after the project work and related
activities are over these disturbed areas require restoration works to bring the

GMR Londa Hydro Power Pvt. Ltd. EMP of Talong Londa H.E. Project
R S Envirolink Technologies Pvt. Ltd. 7.2
disturbed area back to their similar or near-similar pre-construction conditions and land
use.
Different project related activities will require forest and private land. The
acquired land will also be used for dumping of muck and other garbage from the colony
area. There will be indirect disturbance also to the area because of increase in the
human population and traffic movement. It will be essential for the project authority to
restore the area back to its original state.
7.3 RESTORATION OF QUARRY SITES
The impacts of excavation of construction materials such as clay, rock and sand for
construction of hydroelectric projects on environment depend on excavation process,
local hydrological conditions, climate, rock types, extent and type of quarrying
operations and topography. Physical changes in the soil and water associated with
excavation activity also have direct or indirect impact on the biological environment.
The major environmental impacts would be due to excavation and degradation of
land around the quarry and on vegetation around it. The quarrying in stages by
developing different benches leads to lesser impacts and restoration of sites is much
faster as compared to haphazard unscientific mining. The environmental degradation
of the landscape in and around the quarry and along the haul roads is inevitable. The
quarry areas therefore, require restoration measures.
The quarries will be extensively disturbed as a result of excavation of construction
material. The vegetal cover along with top soil will be removed and the area will
become barren. After the completion of quarrying activity, these areas need to be
restored to their normal habitat conditions. To achieve this, appropriate measures
would be adopted before and after quarrying activity at various sites in the project
area so that the restoration work is effective and scientifically executed.
7.3.1 MEASURES FOR PRE-PROJECT ACTIVITY
The top 6-12” of soil will be removed before starting the quarrying activity or any
other surface disturbances. The removed top soil will be kept separate and stock
piled so that it could be reused subsequently for the rehabilitation of quarry sites after
the completion of quarrying activity.
7.3.2 MEASURES FOR POST-PROJECT ACTIVITY
Diversion of Run-off
Effective drainage system will be provided to avoid the infiltration of run-off and
surface waters into the ground of quarry sites to avoid its erosion.

GMR Londa Hydro Power Pvt. Ltd. EMP of Talong Londa H.E. Project
R S Envirolink Technologies Pvt. Ltd. 7.3
Filling of the Depressions
Removal of rocks from the quarry sites for different construction works will result in
the formation of depression and/or craters. These will be filled up by the dumping
materials consisted of boulders, rock, gravel and soil. The boulders and rocks will be
extracted from the muck generated during various project related operations. The
gravel and soil shall be the same as removed before starting the quarrying activity at
a particular site.
Construction of Retaining Walls/ Support Structures
Gabions and retaining walls will be erected at the filled up depressions of quarry sites
to provide necessary support particularly at the quarry sites, where there are
moderately steep slopes.
Rocks for Landscaping
After the project activity is over, these sites would be splattered with the leftovers of
rocks and boulders. These leftovers can support the growth of mosses and lichens
which will act as ecological pioneers and would initiate the process of succession and
colonization. Boulders of moderate sizes would be used to line the boundary of the
path.
Laying of the Top Soil
The top soil removed before the start of the project activity would be used for
covering the filled up depressions/craters at the quarry sites. Fungal spores naturally
present in the top soil would aid the plant growth and natural plant succession.
VAM Fungi for Soil Reclamation
The process of soil reclamation by using VAM fungi and soil microflora for the early
establishment of juvenile seedlings is well documented. For the reclamation of the top
soil, microflora isolated from rhizophenic soil and root surroundings (nearby areas),
Vesicular Arbuscular Mycorrhizal (VAM) fungi isolated from the roots of the plant
species growing in these areas and organic manure would be used either individually
or in different combinations. The two important factors which improve the existing
VAM-plant association are selection of an efficient VAM fungal species which can help
to enhance phosphorous supply and the choice of the genotype which can get
maximum benefit of the VAM association. It is recommended to use the cost-effective
and highly efficient VAM fungi for the revegetation of the areas degraded by the
quarrying activity. VAM fungi have been extensively used for greening the degraded
and barren lands and have been reported to increase yields by about 30% - 50%.

GMR Londa Hydro Power Pvt. Ltd. EMP of Talong Londa H.E. Project
R S Envirolink Technologies Pvt. Ltd. 7.4
Top soil obtained from the project sites, before the start of the quarrying activity,
would be reclaimed by using VAM fungi. Seedlings will then be transferred to the
enriched top soil for the colonization of their roots with VAM fungi. The procedure will
be standardized for each of the plant species to achieve optimal colonization of roots
by VAM fungi as climate, soil and vegetation types of the areas to be treated would
determine the success of VAM fungi in the reclamation of the degraded areas. A brief
description of the recommended procedure to be followed for the colonization of
seedlings with VAM fungi is given below:
(i) Top soil collected before the start of proposed activities at the reclamation
sites would be used for
a) The preparation of the beds in the nursery,
b) Collection of microflora from the rhizophenic soil and root surroundings, and
c) Filling the small polythene bags which will be used subsequently for
transplantation purposes.
(ii) Different strains of VAM would be isolated from the roots of the juvenile
seedlings, particularly of dominant tree species, present in the reclamation
sites.
(iii) Selection of VAM strains, isolates from the rhizophenic soil and root
surroundings for desirable characteristics such as species-specificity,
resistance, temperature tolerance, etc.
(iv) Some of the commonly used VAM strains would be obtained from NEERI,
Nagpur, IARI, New Delhi and/ or NEHU, Shillong.
(iv) Commercial strains obtained from organisations and desirable strains isolated
from the soil and roots would be cultured in economically viable and efficient
synthetic media.
(v) Preparation of mother cultures and their appropriate dilution to the tub-set up
(mix up).
(vi) Plant species which will be inoculated by specific and efficient strains would
be grown to 1-2 months old seedlings stage in the beds prepared with the top
soil.
(vii) Inoculum will be placed as a thin layer (3-4 cm) below the soil surface in each
of the polythene bags involving mycorrhizal treatment. The top of the
inoculum will be layered with vermiculite and the mixture will then be sprayed
with nutrient solutions and/or hormones.

GMR Londa Hydro Power Pvt. Ltd. EMP of Talong Londa H.E. Project
R S Envirolink Technologies Pvt. Ltd. 7.5
(ix) Two days after the treatment of the soil with efficient strains, 1-2 months old
seedlings raised in nurseries will be transplanted individually into each of the
polythene bags.
(x) After 30 days of inoculation, plants will be selected randomly for the
confirmation of VAM colonization on the roots of seedlings by using standard
techniques.
(xi) Successfully colonised plantlets would be transplanted to the reclamation
sites.
(xii) Monitoring of the colonized seedling for a minimum period of 3-4 years.
Re-vegetation
In addition to the use of VAM fungi for the enrichment of the top soil,
revegetation of the quarry sites and plant areas would require the initial
establishment of fast growing grasses. These grasses spread by creeping rootstocks
or rhizomes and will also help in binding the soil at these sites. This would initiate the
process of colonization of the degraded areas by plant species. Perennial species
will be established subsequently by seeding or planting them directly into the annual
crop residue.
Along with the annuals and perennials, nitrogen-fixing herbaceous legumes and non-
leguminous shrub will be planted at these sites to increase the nitrogen levels of the
soil. However, only limited use will be made of these legumes, because these
legumes with their dense persistent cover will retard or prevent the invasion and
establishment of native plant species that contribute to the habitat diversity.
Temporary crop cover of annuals and perennials will thus help in the stabilization of
the quarry sites, which will take approximately 5–6 years.
Once the initial establishment of perennials is complete and the quarry sites are
stabilized, the sites would be ready for plantation of permanent reclamation species.
Subsequently tree species like Altingia excelsa, Gmelina arborea, Acacia
auriculiformis, Syzygium sp., Dendrocalamus sp., Duabanga grandiflora.
7.4 LANDSCAPING AND RESTORATION OF CONSTRUCTION AREAS
During construction phase, locations have been selected for the development of
office area and colonies for staff and labours, plant area and construction facilities.
These areas will be highly disturbed due to clearing of the vegetation and forests.
Following measures will be applied for the rehabilitation and landscaping of the
colony areas and construction sites. The forest land at these sites will be cleared for
the movement of heavy equipments required for different project related activities

GMR Londa Hydro Power Pvt. Ltd. EMP of Talong Londa H.E. Project
R S Envirolink Technologies Pvt. Ltd. 7.6
which would lead to the fragmentation and destruction of the habitats at these sites.
The following measures will be used for the rehabilitation of the plant areas:
(i) Herbaceous plants and tree seedlings, grown in nurseries or in greenhouses,
will be sown in alternating rows. The growth of herbaceous and tree species
will provide adequate erosion control, add vegetation variety for aesthetic
values and provide the habitat for wildlife.
(ii) The rows of herbaceous plants will be later used for the cultivation of
medicinally important plant species which can be grown in this eco-climatic
zone.
(iii) The choice of the tree species for plantation will depend upon the topography
of the area required to be regenerated after the constructional activities.
The construction of the project is expected to lead to certain changes in the area
since laying of components viz. dam and power house require excavations. Also
approach roads have been proposed to excess these construction areas. Although,
no major alteration of the area is expected, still measures have been recommended
for landscaping and restoration of construction sites is recommended. The measures
are given in the following paragraphs:
Garden Complex: A garden with local ornamentation plants and trees will be
created near dam site in areas left after the construction activities. All plants will be
properly labeled with scientific and/or common names.
Creation of view points: Two view points will be created one near the power house
and other at suitable place along the periphery of the reservoir.
Playgrounds: Parks and play grounds for children would be developed in and
around the colony area.
7.5 PLAN IMPLEMENTATION
The landscaping and restoration plan will be implemented with help of landscaping
experts and in consultation with Government of Arunachal Pradesh Horticulture
Department as well as Forest Department of Seppa Division and the coordination
and funding will be provided by the project proponent. The help of Centre for
Environmental Management of Degraded Ecosystems (CEMDE) at the University of
Delhi may also be sought for the requisite technical and scientific expertise for
successful implementation of this plan.

GMR Londa Hydro Power Pvt. Ltd. EMP of Talong Londa H.E. Project
R S Envirolink Technologies Pvt. Ltd. 7.7
7.6 COST ESTIMATE
Table 7.1 shows the cost estimate for different aspect of restoration and landscape.
A laboratory has also been proposed for the isolation, culture and inoculation of VAM
and other microflora. A plant nursery would be essential to provide the supply of plant
samplings for the plantation at different sites in the colony and project area Rs. 60.00
Lacs would be required to restore and maintain the project area in its original/near
original condition.
Table 7.1: Cost Estimates for Restoration Works and Landscape Designing
S. No.
Item of Work Amount (Rs. In Lacs)
A. Pre-construction Measures 3.00
Removal of top soil, transportation & stock piling
Total (A) 3.00
B. Restoration Measures
i) Diversion channels 3.00
ii) Retaining walls 5.00
iii) Filling of the craters 2.00
iv) Preparation of mounds 1.00
Total (B) 11.00
C. Reclamation and Phytoremediation
i) Field Works 20.00
Collection of microflora from the field
Nursery development
Plantation and maintenance of successfully colonized seedlings
ii) Laboratory Works 15.00
Selection, culturing and maintenance of strains
Preparation of mother cultures
Confirmation of successful colonization
iii) Watch and ward (4 persons for 4 years @ Rs. 4000/month including escalation of 10% every year)
9.00
Total (C) 44.00
D. Development of parks, play grounds and gardens (Included in the Economic Development Package)
2.00
Total (D) 2.00
Total (A + B + C + D) 60.00

GMR Londa Hydro Power Pvt. Ltd. EMP of Talong Londa H.E. Project
R S Envirolink Technologies Pvt. Ltd. 8.1
CHAPTER 8 FOREST PROTECTION PLAN
8.1 Introduction
During proposed Project construction phase, migration of labour, quarrying activities,
road development, etc activities will be carried out. The migrant labourers may use
forest wood for the fuel purpose. This will create biotic pressure on the forest. The
quarrying and other construction activities will result either in the modification or
destruction of the existing landscape of the area.
The following measures will help in minimizing pressure on forest.
ENERGY CONSERVATION MEASURES
GREEN BELT DEVELOPMENT
8.2 ENERGY CONSERVATION MEASURES
The baseline study shows that in towns like Seppa, LPG and kerosene is used for
cooking, where as in villages main source for fuel is wood. Due to the lack of proper
LPG supply in remote villages, people are compelled to use wood as a fuel. In the
project area there are 78 villages, which are having a population of around 35,435
(Census, 2001). The existing facilities may become insufficient for supply of kitchen
fuel for the migrant population during the construction of the project at least for 5 years.
The total floating population including children coming from outside will be around
1500. They will require fuel for cooking and various other purposes. The project
authorities would be required to make adequate arrangements for supply of kitchen
fuel and conservation of energy. The details of the provision for kitchen fuel are
provided in the following sections.
8.2.1 Provisions for Kitchen Fuel
During survey, it was noticed that most of the people were still using traditional fuel,
i.e. wood. Burning of wood is one of the sources of air pollution which emits
suspended particulate matter, carbon monoxide and polycyclic hydrocarbons.
Women and children are mainly affected by these pollutants. Modern kitchen fuels
like LPG and kerosene are not easily available in the region. The demand for kitchen
fuel will also increase due to the population coming from outside for the construction
and other related work of the project. Project authority would provide kitchen fuel and
make arrangement for community kitchen, canteen and efficient cooking facilities.
8.2.2 Community kitchen
The peak labour force of about 1500 is proposed to migrate at project site during the
construction period. The project developer would make sufficient arrangement for the

GMR Londa Hydro Power Pvt. Ltd. EMP of Talong Londa H.E. Project
R S Envirolink Technologies Pvt. Ltd. 8.2
establishment of at least one community kitchen and a canteen. This can be
established either near the dam site or near the project colony. This facility would be
open to local people also who are living nearby. The facility would maintain proper
hygiene while preparing and supplying food.
8.2.3 Efficient cooking facilities
As the proposed project is located in remote area in Arunachal Pradesh, where
supply of kitchen fuel is not easy, project authority would take measures for reducing
the fuel consumption. The authority should provide pressure cookers to the families
of migrant workers as well to local villagers. Accordingly budget has been allocated
for the supply of cookers. This facility will also increase the work efficiency of migrant
workers and they will also get proper daily diet.
8.3 COST ESTIMATES FOR ENERGY CONSERVATION
A total grant of Rs. 15.00 lacs has been assigned towards the provision of kitchen
fuel, and other facilities including establishment of community kitchen or canteens for
the migrant workers (Table 8.1).
Table 8.1: Financial Provision for Energy Conservation Measures
S. No. Particulars Amount (Rs. in lacs)
1 LPG and Kerosene Depot Construction 2.50 2 For supply of Gas and Cylinders 5.00 3 For supply of Kerosene Supply 2.00 4 Distribution of Pressure Cookers and Solar Cookers 2.00 5 Community Kitchen (1 Nos.) 2.50 6 Canteen (1 No.) 1.00 Total (Rs. in lacs) 15.00
8.4 CREATION OF GREEN BELT
A green belt around the reservoir periphery, road side and office complex/colony
area will be created to avoid erosion of soil, prevention of land slips, minimize the air
pollution and noise pollution in the project area. Development of green belt not only
minimizes these impacts but also improves the aesthetic environment of the region.
Therefore, a “Green Belt Development Plan” has been proposed around the project
area in general and along the project components in particular using the local flora.
8.4.1 Sites for Greenbelt Development
Although the forest loss due to reservoir submergence and other project
appurtenances has been compensated as a part of compensatory afforestation,
however in addition to above, it is proposed to develop greenbelt around the

GMR Londa Hydro Power Pvt. Ltd. EMP of Talong Londa H.E. Project
R S Envirolink Technologies Pvt. Ltd. 8.3
perimeter of various project appurtenances, selected stretches along reservoir
periphery, etc.
The general consideration involved while developing the greenbelt are:
Trees growing upto 10 m or above in height with perennial foliage should be
planted around various appurtenances of the proposed project.
Planting of trees should be undertaken in appropriate encircling rows around the
project site.
Generally fast growing trees should be planted
Since, the tree trunk area is normally devoid of foliage upto a height of 3 m, it
may be useful to have shrubbery in front of the trees so as to give coverage to
this portion.
8.4.2 Guidelines & Techniques for Green Belt Development
Extensive survey in the project area was undertaken to observe the structure and
composition of vegetation. The soil characteristics were also kept in mind. Based on
this survey and environmental conditions suitable native plants species have been
proposed for green belt development plan (Table 8.2). The schematic arrangement of
greenbelt plantation proposed along the reservoir rim, roads office, crusher plants
and colony is presented in Figure 8.1.
Table 8.2: List of plants species proposed for Green Belt development
Sites Tree species Shrub species Herbaceous species
Roadside
Plantation
Callistemon citrinus, Alnus
nepalensis, Salix spp., Prunus
cerasoides, Bauhinia spp.,
Ligustrum nepalense,
Cupressus torulosa and Thuja
spp.
Desmodium elegans,
Cotoneaster microphyllus,
Daphne spp., Agave
americana, Euphorbia
royleana, Berberis aristata,
Rubus spp.
Dioscorea deltoidea,
Origanum vulgare,
Thymus linearis,
Hedychium spicatum,
Bergenia ciliata,
Asparagus adscendens,
Potentilla nepalensis
Staff
colony/
Office
complex
Aesculus indica, Malus
domestica, Juglans regia,
Prunus armeniaca, Callistemon
citrinus
Fragaria spp., Rubus spp.,
Rosa spp., Bougainvillea
spp., Hibiscus rosa-
sinensis
Tagetes patula,
Valeriana spp., Viola
biflora, Iris spp.
Crusher Cedrus deodara, Pinus Cotoneaster microphyllus, Tagetes patula,

GMR Londa Hydro Power Pvt. Ltd. EMP of Talong Londa H.E. Project
R S Envirolink Technologies Pvt. Ltd. 8.4
plant /
Power
plant
wallichiana, Alnus nepalensis,
Aesculus indica, Albizia spp.,
Cupressus torulosa
Indigofera heterantha,
Berberis aristata, Rubus
spp., Dendrocalamus
strictus, Viburnum spp.
Anemone rivularis,
Bergenia ciliata,
Asparagus adscendens,
Potentilla nepalensis
Reservoir
rim
Populus ciliata, Salix
babylonica, Salix denticulata,
Callistemon citrinus, Alnus
nepalensis, Lyonia ovalifolia,
Cedrus deodara
Cotoneaster microphyllus,
Berberis spp., Rosa spp.,
Agave americana,
Euphorbia royleana, Rhus
spp.,
Asparagus adscendens,
Origanum vulgare,
Bergenia ciliata,
Asparagus adscendens,
Potentilla nepalensis
Figure 8.1: Plantation techniques for green belt development at different project
locations
8.5 GREEN BELT DEVELOPMENT
Green belt development will comprise plantations at various places like alongside
roads, around the periphery of reservoir rim, and at different project offices and
colonies.
8.5.1 Roadside plantation
In Talong Londa H. E. Project area construction of about 3 km long approach roads
are proposed. It is proposed to carry out roadside plantation along these roads. The

GMR Londa Hydro Power Pvt. Ltd. EMP of Talong Londa H.E. Project
R S Envirolink Technologies Pvt. Ltd. 8.5
cost of the plantation has been calculated as per the existing labour charges,
material cost (plants, FYM, tree guards, etc.) and the total area of plantation. The
spacing for trees is proposed 3 m while 2 m for shrubs. The pit size has been
recommended as 45 cm x 45 cm x 5 cm for trees and 30 cm x 30 cm x 30 cm for
shrubs. The total cost of roadside plantation works out to be Rs. 1.0 lacs (Table 8.3).
Plantation along roads must take into account visibility aspects on curves so as to
ensure safe driving.
8.5.2 Green Belt Development along the Reservoir rim
Most of the area in the vicinity of proposed reservoir of Talong Londa H.E. Project is
under open tropical semi-evergreen and sub tropical forest type. The creation of
green belt on either side of the reservoir will ensure protection of the reservoir area
from any minor slips due to fluctuation in the water level. The slopes on both the
banks will be planted with suitable tree species for creation of a green belt around the
reservoir rim. In areas with moderately steep slopes indigenous, economically
important, soil binding tree species will be planted, which are able to thrive well under
high humidity and flood conditions. A proposed scheme of plantation around the
reservoir is given below.
i. The green belt will start from the immediate vicinity of the reservoir rim on both
the banks, up to the tail of the reservoir wherever moderately steep slopes are
available for plantation.
ii. The average width of the green belt will be around 40 m varying from about 15 m
at places to 120 m or as physiographic and land features allow. There would be
at least 2 layers of plantation.
iii. Water loving species, preferably Salix spp. and Populus ciliata will be planted in
the row nearest to the reservoir rim. The soil present at this level and the air
moisture are favourable for the survival and growth of these species.
iv. It is also proposed to plant fruit bearing and such species which are best studied
for bird-nesting.
v. Species like Aesculus indica, Juglans regia, Bauhinia spp., Quercus
leucotrichophora etc. will occupy the middle portions of the green belt. These
species have been observed to thrive well in this area.
vi. The outermost layer of the green belt will be composed of hardy tree species and
shrubby mix to withstand any external influences/ pressures of grazing, browsing
by cattle and sheep, etc. In this layer the species Ficus spp. and Quercus sp. will
be planted in the inner as well as outer rows.
In all plantations would be undertaken on an area of about 5.00 ha along the
periphery of reservoir.

GMR Londa Hydro Power Pvt. Ltd. EMP of Talong Londa H.E. Project
R S Envirolink Technologies Pvt. Ltd. 8.6
8.5.3 Green Belt at Dam site and Power house site
Plantation at the dam site and power house has been proposed for control of erosion/
siltation of the reservoir and aesthetic importance. The plants of recreational value,
horticultural importance shall be planted within the complex. Developing a lawn and
flower garden surrounded by this green belt may serve the purpose of beautification
of the dam site area.
8.5.4 Green Belt around Crusher plants
For mitigating the impact of dust and noise, which will rise from the crusher plant,
plantation must be done around the crusher plant area. One crusher plant is
proposed in the project area and about 400 m distance surrounding the crusher
working area has to be planted.
8.5.5 Green Belt around Colony area and Office complex
Plantation around the project colony and office complexes is proposed to be done, so
that, greenery is developed. Precaution should be exercised by not planting large
size trees around buildings and other similar structures as during winter the sun rays
are obstructed by them invariably and much wanted sunshine is impaired. Besides
this, it is also proposed to develop green belt around the working areas for trapping
the dust and noise. The area proposed for colonies, is about 3.0 ha. Plantation of
avenue, ornamental and fruit trees are proposed in these areas along with the area
around office complex. The ornamental, fruit plants will be procured from the
horticulture department and local market while the avenue plants will be raised in the
project nursery. For protection of trees from cattle iron tree guards shall be required.
8.6 INFRASTRUCTURE DEVELOPMENT FOR GREEN BELT PLAN
The creation of nursery for Green Belt Development has been included already in
Landscaping and Restoration Plan and the requirement would be met from these
nurseries which are located in almost the same area.
8.7 COST ESTIMATE FOR GREEN BELT DEVELOPMENT
For the creation of green belt around the reservoir sufficient financial provision has
been made by the project authorities. Plantations would be carried out around
reservoir, roads as well as areas in colonies and construction sites. The estimated
cost of plantations as well as maintenance for 5 years will be Rs. 6.10 lacs. The
plantation for this purpose will be carried out with the participation of the State Forest/
Horticulture Department(s). The cost estimate for green belt development is given in
Table 8.3.

GMR Londa Hydro Power Pvt. Ltd. EMP of Talong Londa H.E. Project
R S Envirolink Technologies Pvt. Ltd. 8.7
Table 8.3: Cost estimate for Green belt development S. No. Component Amount (Rs. in
Lacs) 1 Cost of plantation along road side 1.00 2 Cost of plantation around Dam site and power house 0.50
3 Cost of avenue and ornamental plantation around Residential areas and office complex for 1.00
4 Cost of plantation & maintenance along reservoir periphery for 5 ha Rs.42,000.00/ ha 2.10
5 Iron tree guards @ 1000 each 0.50 6 Contingency 0.50
7. Maintenance of plantations other than reservoir periphery @ Rs.10,000.00 / year 0.50
Total (Rs. in Lacs) 6.10
8.8 FINANCIAL REQUIREMENTS FOR FOREST PROTECTION PLAN
Total allocation of Rs. 21.10 Lacs (Rs. 15.0 lacs + Rs. 6.10 lacs) have been made
for undertaking various measures for mitigating pressure on forests under forest
protection plan.

GMR Londa Hydro Power Pvt. Ltd. EMP of Talong Londa H.E. Project
RS Envirolink Technologies Pvt. Ltd. 9.1
CHAPTER 9
RESETTLEMENT & REHABILITATION PLAN
9.1 INTRODUCTION
The proposed Talong Londa Hydroelectric project is envisaged as run of the
river scheme situated in East Kameng district of Arunachal Pradesh. The Talong
Londa Hydroelectric Project area falls in Seppa and Bameng Circles of East
Kameng District.
The project comprises of concrete dam with a maximum height of 108.5 m above
deepest foundation level across river Kameng near village Pachi/Londa. The
water conductor system consists of three parallel penstocks each of 94 m length
and 5.2 m diameter, along the dam surface to feed the Vertical Francis turbine
each of 75MW unit, totaling 225 MW. The dam toe surface powerhouse is
located on left bank of the river.
As is typical of any hydropower project, land would be required for construction
of dam, powerhouse and other structures; submergence area, muck dumping,
quarrying, colony and construction camps, etc. Land acquisition impacts the
families/ communities that have ownership of land and are using the same for
agriculture and other purposes. Therefore, the Rehabilitation and Resettlement
Plan has been prepared to comprehensively address the issues arising out of
land acquisition, assessment of land/house/asset coming under acquisition,
estimation of extent of loss and compensation to be offered in line with The
Right to Fair Compensation and Transparency in Land Acquisition,
Rehabilitation and Resettlement Act, 2013 (RFCT_LARR) and State
Rehabilitation and Resettlement Policy (SRRP), 2008 of Arunachal Pradesh.
The R&R plan has been prepared keeping in view the following objectives:
To compensate families whose land or other assets are acquired for the
project.
To create better living conditions and to improve the quality of life of
Project Affected Families in particular and also of other people residing in
the project area.
To contribute to the overall development of the project affected areas.
To create good rapport with the local people for long-term relationship
and mutual benefits.

GMR Londa Hydro Power Pvt. Ltd. EMP of Talong Londa H.E. Project
RS Envirolink Technologies Pvt. Ltd. 9.2
9.2 LAND REQUIREMENT
For the development of Talong Londa HEP, land would be acquired for
construction of project components, submergence area, muck dumping,
quarrying, construction camps and colony, etc. Based on the final project layout,
land requirement has been finalized as 413.10 ha. Component wise break of
land requirement is given at Table 9.1.
Table 9.1: Land requirement for Talong Londa HEP
S. No. Component Area in ha
1. Dam, Power House and Diversion tunnel Complex 10.00
2 Submergence area at FRL (EL. 488 m), Slope area including the river course 350.00
3 Diversion road 5.00 4 i) Muck disposal area 10.00
ii) Magazine area 0.60 iii) Rehabilitation and Resettlement 4.00 iv) Colony area 2.50 v) Construction Facility Area 12.00 vi) Quarry Area at Meuba Area 3.00 vii) Quarry Area at 3 Kilo Meter 4.00 viii) Quarry Area at D/s of Dam Axis 4.00 ix) Quarry area near Pachi 8.00
Total Land Required (Ha) is 413.10 Ha including 101 Ha of River bed areas. 413.10
The private land requirement is 129.1 ha belonging 237 PAFs losing land, house
from 8 villages falling in Seppa and Bameng Circles of East Kameng district as
per the list given at Table 9.2.
Table 9.2: Category of Project affected families
S. No.
Village Name
No. of families losing Total No. of
Families House+ Land
House only
Land only
1 Londa 87 18 - 105 2 Lorah - - 45 45 3 Pachi 2 - 5 7 4 Pakke - - 9 9 5 Rikhung - - 19 19 6 Talong - - 8 8 7 Tallo 5 - 28 33 8 12 Mile Camp - - 11 11
Total 94 18 125 237
9.3 PROJECT AFFECTED FAMILIES
As is the case in large part of Arunachal Pradesh, land records are not available
in terms of the land ownership of individual/family. The communities own the
private land and have rights to work and use the land for various purposes.
Circle officers of Seppa as well as Bameng circle have confirmed the ownership

GMR Londa Hydro Power Pvt. Ltd. EMP of Talong Londa H.E. Project
RS Envirolink Technologies Pvt. Ltd. 9.3
of entire land for the project i.e. 129.1 ha as community land. All families,
having right of exploitation on community land, were considered as Project
Affected Families. The respective circle officers have provided list of 237 project
affected families belonging to 8 villages. List of PAFs is given in separate SIA
Report.
Out of 237, 112 families belonging to 3 villages viz. Londa, Pachi and Tallo, are
coming under displacement due to loss of their houses. The list was further
expanded to Nuclear Families and this number corresponds to 154 nuclear
families coming under involuntary displacement. List of Displaced Families is
given at Table 9.3.
Table 9.3: Village wise list of Displaced Families
Sl. No. Village Name Total PAFs PAFs under
Displacement 1 Londa 105 105 2 Lorah 45
3 Pachi 7 2 4 Pakke 9
5 Rikhung 19
6 Talong 8
7 Tallo 33 5 8 12 Mile Camp 11
Total 237 112
Socio economic survey for the project affected villages as well as the project
affected families were carried out during 2010 and was updated in subsequent
years in 2014 to evaluate the socio-economic status of the families getting
affected by the project.
Several public interactive meetings were held with the people of affected
villages of Talong Londa HEP during the socio-economic surveys. The Gram
Burrah and project affected families participated in these interactive meetings.
The valuable inputs from these meetings have been given due consideration
while preparing the R&R package as well as identifying the developmental
projects in social sector.
9.4 REHABILITATION AND RESETTLEMENT ACT AND POLICY
In order to provide the adequate compensation to affected families and
infrastructure facilities in the area, Arunachal Pradesh Government has
formulated its own Rehabilitation and Resettlement Policy (2008). Since
Arunachal Pradesh is dominated by a large number of tribes, whose livelihood
depends primarily on natural resources, the State Policy, therefore, was
prepared considering the aspiration of tribes, their customary right over forests
and water, their culture and customs etc. The main objectives of the State Policy

GMR Londa Hydro Power Pvt. Ltd. EMP of Talong Londa H.E. Project
RS Envirolink Technologies Pvt. Ltd. 9.4
are to provide appropriate and adequate compensation to affected families
against the diversion of land (especially forest land - Unclassified State Forest),
to minimize the displacement, to provide adequate infrastructure facilities at
resettlement sites, to improve the living standard of affected families and to
facilitate the harmonious relationship between project developer and project
affected families. The policy also emphasized the Social Impact Assessment in
case of the displacement of more than 20 families.
However only recently notified „The Right to Fair Compensation and
Transparency in Land Acquisition, Rehabilitation and Resettlement Act, 2013
(RFCT_LARR)‟ has been made effective from January 01, 2014. As per the
clause 24(1) of the Act, in any case of land acquisition proceedings ini tiated
under the Land Acquisition Act, 1894 where no award under section 11 has
been made, then all provisions of this act relating to the determination of
compensation shall apply. Relevant provisions have been considered while
developing R&R package for Project Affected Families.
For this project, procedure and compensation will be as per the RFCT_LARR
2013 and following key definitions will be followed:
(a) "Administrator" means an officer appointed for the purpose of rehabilitation
and resettlement of affected families under sub-section (l) of section 43;
(b) "affected area" means such area as may be notified by the appropriate
Government for the purposes of land acquisition;
(c) 'affected family" includes-
(i) a family whose land or other immovable property has been acquired;
(ii) a family which does not own any land but a member or members of
such family may be agricultural labourers, tenants including any form
of tenancy or holding of usufruct right, share-croppers or artisans or
who may be working in the affected area for three years prior to the
acquisition of the land, whose primary source of livelihood stand
affected by the acquisition of land;
(iii) the Scheduled Tribes and other traditional forest dwellers who have
lost any of their forest rights recognized under the Scheduled Tribes
and Other Traditional Forest Dwellers (Recognition of Forest Rights)
Act, 2006 due to acquisition of land;
(iv) family whose primary source of livelihood for three years prior to the
acquisition of the land is dependent on forests or water bodies and

GMR Londa Hydro Power Pvt. Ltd. EMP of Talong Londa H.E. Project
RS Envirolink Technologies Pvt. Ltd. 9.5
includes gatherers of forest produce, hunters, fisher folk and boatmen
and such livelihood is affected due to acquisition of land;
(v) a member of the family who has been assigned land by the State
Government or the Central Government under any of its schemes and
such land is under acquisition;
(vi) a family residing on any land in the urban areas for preceding three
years or more prior to the acquisition of the land or whose pr imary
source of livelihood for three years prior to the acquisition of the land
is affected by the acquisition of such land;
(d) "agricultural land" means land used for the purpose of --
(i) agriculture or horticulture;
(ii) dairy farming, poultry farming, pisciculture, sericulture, seed farming
breeding of livestock or nursery growing medicinal herbs;
(iii) raising of crops, trees, grass or garden produce; and
(iv) land used for the grazing of cattle;
(e) "appropriate Government" means,-
(i) in relation to acquisition of land situated within the territory of, a
State, the State Government:
(ii) in relation to acquisition of land situated within a Union territory
(except Puducherry), the Central Government;
(iii) in relation to acquisition of land situated within the Union territory of
Puducherry, the Government of Union territory of Puducherry;
(iv) in relation to acquisition of land for public purpose in more than one
State, the Central Government, in consultation with the concerned
State Governments or Union territories; and
(v) in relation to the acquisition of land for the purpose of the Union as
may be specified by notification, the Central Government:
Provided that in respect of a public purpose in a District for an area not
exceeding such as may be notified by the appropriate Government, the
Collector of such District shall be deemed to be the appropriate
Government;
(f) "Authority" means the Land Acquisition and Rehabilitation and Resettlement
Authority established under section 5l;
(g) "Collector" means the Collector of a revenue district, and includes a Deputy
Commissioner and any officer specially designated by the appropriate
Government to perform the functions of a Collector under this Act;

GMR Londa Hydro Power Pvt. Ltd. EMP of Talong Londa H.E. Project
RS Envirolink Technologies Pvt. Ltd. 9.6
(h) "Commissioner'' means the Commissioner for Rehabilitation and
Resettlement appointed under sub-section (l) of section 44;
(i) "cost of acquisition" includes-
(i) amount of compensation which includes solatium, any enhanced
compensation ordered by the Land Acquisition and Rehabilitation and
Resettlement Authority or the Court and interest payable thereon and
any other amount determined as payable to the affected families by
such Authority or Court;
(ii) demurrage to be paid for damages caused lo the land and standing
crops in the process of acquisition;
(iii) cost of acquisition of land and building for settlement of displaced or
adversely affected families;
(iv) cost of development of infrastructure and amenities at the resettlement
areas;
(v) cost of rehabilitation and resettlement as determined in accordance with
the provisions of this Act:
(vi) administrative cost,-
(A) for acquisition of land, including both in the project site and out of
project area lands, not exceeding such percentage of the cost of
compensation as may be specified by the appropriate Government;
(B) for rehabilitation and resettlement of the owners of the land and
other affected families whose land has been acquired or proposed
to be acquired or other families affected by such acquisition;
(vii) cost of undertaking 'Social Impact Assessment study';
(j) "company" means-
(i) a company as defined in section 3 of the Companies Act, 1956. Other
than a Government company:
(ii) a society registered under the Societies Registration Act, 1860 or under
any corresponding law for the time being in force in a State;
(k) "displaced family" means any family, who on account of acquisition of land
has to be relocated and resettled from the affected area to the resettlement
area;
(l) "entitled to act" in relation to a person, shall be deemed to include the
following persons, namely:
(i) trustees for other persons beneficially interested with reference to any
such case, and that to the same extent as the person beneficially
interested could have acted if free from disability;
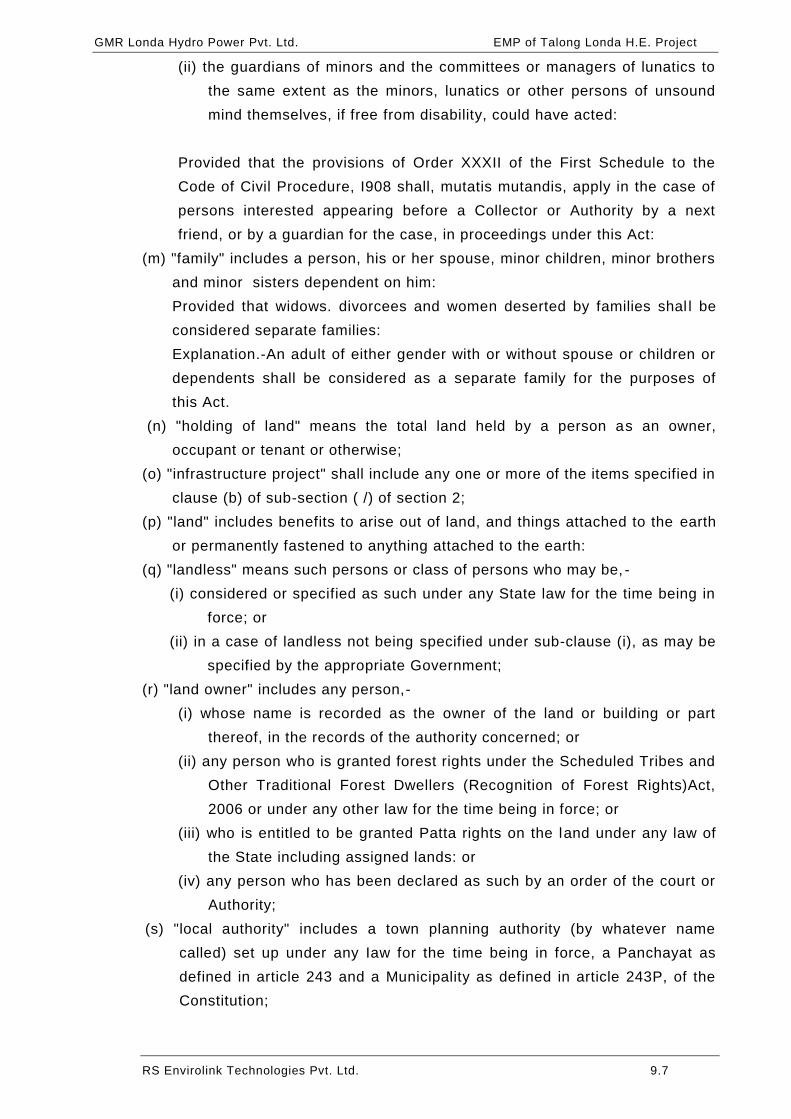
GMR Londa Hydro Power Pvt. Ltd. EMP of Talong Londa H.E. Project
RS Envirolink Technologies Pvt. Ltd. 9.7
(ii) the guardians of minors and the committees or managers of lunatics to
the same extent as the minors, lunatics or other persons of unsound
mind themselves, if free from disability, could have acted:
Provided that the provisions of Order XXXII of the First Schedule to the
Code of Civil Procedure, I908 shall, mutatis mutandis, apply in the case of
persons interested appearing before a Collector or Authority by a next
friend, or by a guardian for the case, in proceedings under this Act:
(m) "family" includes a person, his or her spouse, minor children, minor brothers
and minor sisters dependent on him:
Provided that widows. divorcees and women deserted by families shal l be
considered separate families:
Explanation.-An adult of either gender with or without spouse or children or
dependents shall be considered as a separate family for the purposes of
this Act.
(n) "holding of land" means the total land held by a person as an owner,
occupant or tenant or otherwise;
(o) "infrastructure project" shall include any one or more of the items specified in
clause (b) of sub-section ( /) of section 2;
(p) "land" includes benefits to arise out of land, and things attached to the earth
or permanently fastened to anything attached to the earth:
(q) "landless" means such persons or class of persons who may be, -
(i) considered or specified as such under any State law for the time being in
force; or
(ii) in a case of landless not being specified under sub-clause (i), as may be
specified by the appropriate Government;
(r) "land owner" includes any person,-
(i) whose name is recorded as the owner of the land or building or part
thereof, in the records of the authority concerned; or
(ii) any person who is granted forest rights under the Scheduled Tribes and
Other Traditional Forest Dwellers (Recognition of Forest Rights)Act,
2006 or under any other law for the time being in force; or
(iii) who is entitled to be granted Patta rights on the land under any law of
the State including assigned lands: or
(iv) any person who has been declared as such by an order of the court or
Authority;
(s) "local authority" includes a town planning authority (by whatever name
called) set up under any Iaw for the time being in force, a Panchayat as
defined in article 243 and a Municipality as defined in article 243P, of the
Constitution;

GMR Londa Hydro Power Pvt. Ltd. EMP of Talong Londa H.E. Project
RS Envirolink Technologies Pvt. Ltd. 9.8
(t) "marginal farmer" means a cultivator with an un-irrigated land holding up to
one hectare or irrigated land holding up to one-half hectare;
(u) "market value" means the value of land determined in accordance with
section 26;
(v) "notification" means a notification published in the Gazette of lndia or, as
the case may be, the Gazette of a State and the expression "notify" shall
be construed accordingly;
(w) "patta" shall have the same meaning as assigned to it in the relevant
Central or Slate Acts or rules or regulations made thereunder;
(x) "person interested" means-
(i) all persons claiming an interest in compensation to be made on account
of the acquisition of land under this Act;
(ii) the Scheduled Tribes and other traditional forest dwellers, who have
lost any forest rights recognized under the Scheduled Tribes and Other
Traditional Forest Dwellers (Recognition of Forest Rights) Act, 2006;
(iii) a person interested in an easement affecting the land;
(iv) persons having tenancy rights under the relevant State laws including
share-croppers by whatever name they may be called; and
(v) any person whose primary source of livelihood is likely to be adversely
affected;
(y) "prescribed" means prescribed by rules made under this Act;
(z) "project" means a project for which land is being acquired, irrespective of the
number of persons affected;
(za) "public purpose" means the activities specified under sub-section (l) of
section 2;
(zb) "Requiring Body" means a company, a body corporate, an institution, or any
other organization or person for whom land is to be acquired by the
appropriate Government, and includes the appropriate Government, if the
acquisition of land is for such Government either for its own use or for
subsequent transfer of such land is for public purpose to a company, body
corporate, an institution, or any other organization, as the case may be,
under lease, license or through any other mode of transfer of land;
(zc) "Resettlement Area" means an area where the affected families who have
been displaced as a result of land acquisition are resettled by the
appropriate Government;
(zd) "Scheduled Areas,, means the Scheduled Areas as defined in section 2 of
the Provisions of the Panchayats (Extension to the Scheduled Areas) Act,
1996;
(ze) “small farmer” means a cultivator with an un-irrigated land holding up to two
hectares or with an irrigated land holding up to one hectare, but more than
the holding of a marginal farmer.

GMR Londa Hydro Power Pvt. Ltd. EMP of Talong Londa H.E. Project
RS Envirolink Technologies Pvt. Ltd. 9.9
9.5 R&R PACKAGE FOR PROJECT AFFECTED FAMILIES
Rehabilitation and Resettlement benefits to be given to the project affected
families have been discussed in Schedule I, II and III of RFCT_LARR.
Applicability of the provision of the Act for R&R benefits is briefly discussed
below:
9.5.1 COMPENSATION FOR LAND OWNERS
The following components shall constitute the minimum compensation package
to be given to those whose land is acquired and to tenants referred to in clause
(c) of Section 3 in a proportion to be decided by the appropriate Government.
Sl. No. Component of compensation
package in respect of land acquired under the Act
Manner of determination of value
1 Market value of land To be determined as provided under section 26.
2 Factor by which the market value is to be multiplied in the case of rural areas
1.00 (one) to 2.00 (Two) based on the distance of project from urban area, as may be notified by the appropriate Government
3 Factor by which the market value is to be multiplied in the case of urban areas
1 (One)
4 Value of assets attached to land or building
To be determined as provided under section 29
5 Solatium Equivalent to one hundred per cent of the market value of land mentioned against serial number 1 multiplied by the factor specified against serial number 2 for rural areas pot serial number 3 for urban areas plus value of assets attached to land or building against serial number 4 under column (2)
6 Final award in rural areas Market value of land mentioned against serial number 1 multiplied by the factor specified against serial number 2 plus value of assets attached to land or building mentioned against serial number 4 under column (2) plus solatium mentioned against serial number 5 under column (2).
7 Final award in urban areas Market value of land mentioned against serial number 1 multiplied by the factor specified against serial number 3 plus value of assets attached to land or building mentioned against serial number 4 under column (2) plus solatium mentioned against serial number 5 under column (2).
9.5.2 ELEMENTS OF REHABILITATION AND RESETTLEMENT
In addition to compensation for land, the second schedule provides following
elements of rehabilitation and resettlement entitlements for all the affected
families (both land owners and families whose livelihood is primarily dependent
on land acquired).
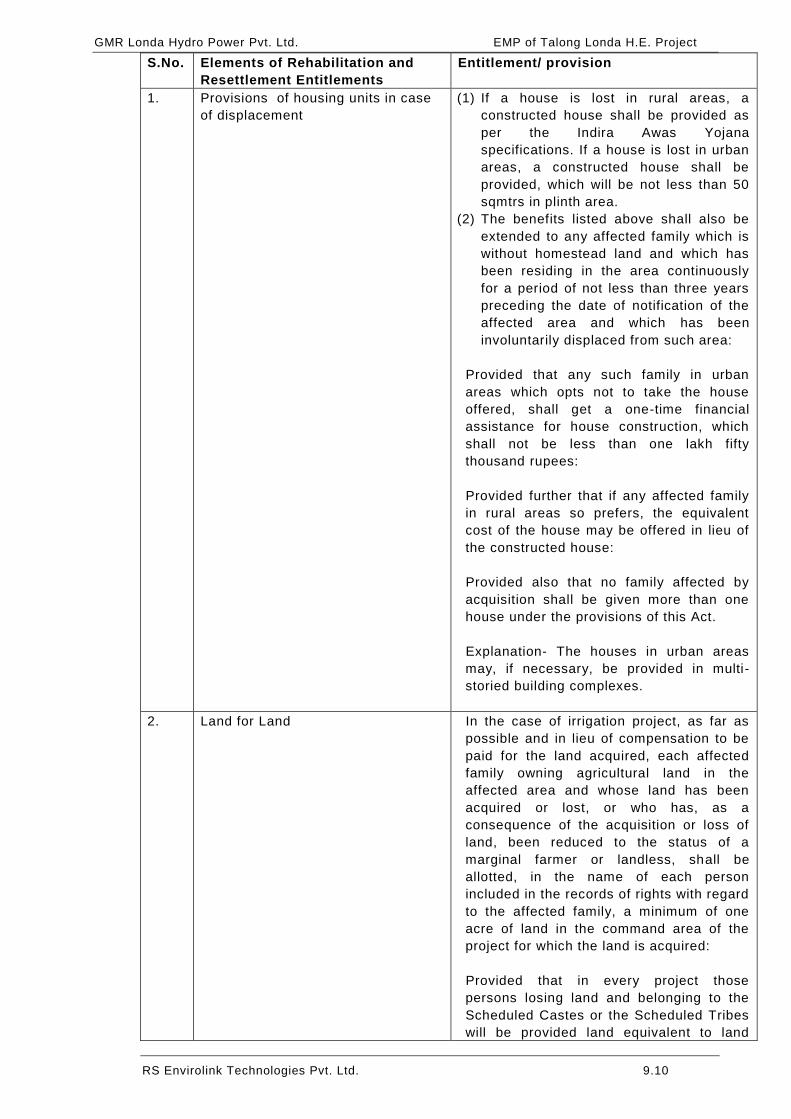
GMR Londa Hydro Power Pvt. Ltd. EMP of Talong Londa H.E. Project
RS Envirolink Technologies Pvt. Ltd. 9.10
S.No. Elements of Rehabilitation and Resettlement Entitlements
Entitlement/ provision
1. Provisions of housing units in case of displacement
(1) If a house is lost in rural areas, a constructed house shall be provided as per the Indira Awas Yojana specifications. If a house is lost in urban areas, a constructed house shall be provided, which will be not less than 50 sqmtrs in plinth area.
(2) The benefits listed above shall also be extended to any affected family which is without homestead land and which has been residing in the area continuously for a period of not less than three years preceding the date of notification of the affected area and which has been involuntarily displaced from such area:
Provided that any such family in urban areas which opts not to take the house offered, shall get a one-time financial assistance for house construction, which shall not be less than one lakh fifty thousand rupees: Provided further that if any affected family in rural areas so prefers, the equivalent cost of the house may be offered in lieu of the constructed house: Provided also that no family affected by acquisition shall be given more than one house under the provisions of this Act. Explanation- The houses in urban areas may, if necessary, be provided in multi-storied building complexes.
2. Land for Land In the case of irrigation project, as far as possible and in lieu of compensation to be paid for the land acquired, each affected family owning agricultural land in the affected area and whose land has been acquired or lost, or who has, as a consequence of the acquisition or loss of land, been reduced to the status of a marginal farmer or landless, shall be allotted, in the name of each person included in the records of rights with regard to the affected family, a minimum of one acre of land in the command area of the project for which the land is acquired: Provided that in every project those persons losing land and belonging to the Scheduled Castes or the Scheduled Tribes will be provided land equivalent to land

GMR Londa Hydro Power Pvt. Ltd. EMP of Talong Londa H.E. Project
RS Envirolink Technologies Pvt. Ltd. 9.11
S.No. Elements of Rehabilitation and Resettlement Entitlements
Entitlement/ provision
acquired or two and a one-half acres, whichever is lower.
3 Offer for Developed Land In case the land is acquired for urbanization purposes, twenty per cent of the developed land will be reserved and offered to land owning project affected families, in proportion to the area of their land acquired and at a price equal to the cost of acquisition and the cost of development. Provided that in case the land owning project affected family wishes to avail of this offer, an equivalent amount will be deducted from the land acquisition compensation package payable to it.
4 Choice of Annuity or Employment The appropriate Government shall ensure that the affected families are provided with the following options: (a) Where jobs are created through the project, after providing suitable training and skill development in the required field, make provision for employment at a rate not lower than the minimum wages provided for in any other law for the time being in force, to at least one member per affected family in the project or arrange for a job in such other project as may be required; or (b) One-time payment of 5 lakh rupees per affected family; or (c) Annuity policies that shall pay not less than 2,000 rupees per month per family for 20 years, with appropriate indexation to the consumer price index for agricultural labourers
5 Subsistence grant for displaced families for a period of one year
Each affected family which is displace from the land acquired shall be given a monthly subsistence allowance equivalent to 3000 rupees per month for a period of one year from the date of award. In addition to this amount, the schedule castes and the scheduled tribes displaced from scheduled areas shall receive an amount equivalent to 50000 rupees. In cases of displacement from the scheduled areas, as far as possible, the affected families shall be relocated in a similar ecological zone, so as to preserve the economic opportunities, language, culture and community life of the tribal communities.
6 Transportation cost for displace Each affected family which is displaced

GMR Londa Hydro Power Pvt. Ltd. EMP of Talong Londa H.E. Project
RS Envirolink Technologies Pvt. Ltd. 9.12
S.No. Elements of Rehabilitation and Resettlement Entitlements
Entitlement/ provision
families shall get a one-time financial assistance of 50,000 rupees as transportation cost for shifting of the family, building materials, belongings and cattle.
7 Cattle shed / Petty shops cost Each affected family having cattle or having a petty shop shall get one time financial assistance of such amount as the appropriate Government may, by notification, specify subject to a minimum of 25,000 rupees for construction of cattle shed or petty shop as the case may be.
8 One time grant to artisan, small traders and certain others
Each affected family of an artisan, small traders or self-employed person or an affected family which owned non-agricultural land or commercial, industrial or institutional structure in the affected area, and which has been involuntarily displaced from the affected area due to land acquisition , shall get one time assistance of such amount as the appropriate Government may, by notification, specify subject to a minimum of 25000 rupees
9 Fishing rights In cases of irrigation or hydel projects, the affected families may be allowed fishing rights in the reservoirs, in such manner as may be prescribed by the appropriate Government
10 One time Resettlement Allowance Each affected family shall be given a one time “Resettlement Allowance” of 50000
rupees only 11 Stamp duty and registration fee (1) The stamp duty and other fees payable
for registration of the land or house allotted to the affected families shall be borne by the Requiring Body.
(2) The land for house allotted to the affected families shall be free from all encumbrances.
(3) The land or house allotted may be in the joint names of wife and husband of the affected family.
9.5.3 HOUSING BENEFIT AND COMPENSATION
Clause No. 8.3.1 of SRRP, 2008 - Any Affected family owing house & whose house
has been acquired or lost shall be allotted free of cost house & plot for the house site to
the extent of actual loss of area of the acquired house but not more than 250 sq.m
(approx. 2500 sq. feet) of land in rural areas or 150 sq m (approx. 1500 sq feet) in urban
area, as the case may be for each nuclear family. The size and design of the house will
be decided by the State Authority in consultation with the project affected community
and the project authority;
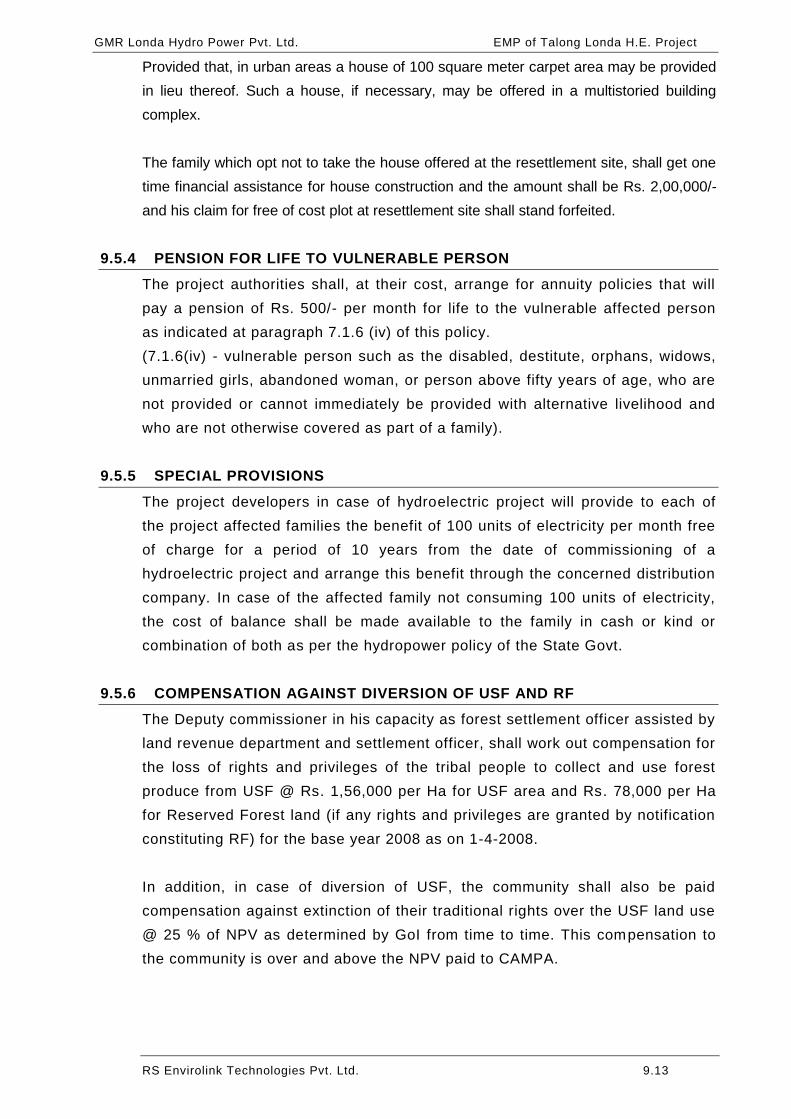
GMR Londa Hydro Power Pvt. Ltd. EMP of Talong Londa H.E. Project
RS Envirolink Technologies Pvt. Ltd. 9.13
Provided that, in urban areas a house of 100 square meter carpet area may be provided
in lieu thereof. Such a house, if necessary, may be offered in a multistoried building
complex.
The family which opt not to take the house offered at the resettlement site, shall get one
time financial assistance for house construction and the amount shall be Rs. 2,00,000/-
and his claim for free of cost plot at resettlement site shall stand forfeited.
9.5.4 PENSION FOR LIFE TO VULNERABLE PERSON
The project authorities shall, at their cost, arrange for annuity policies that will
pay a pension of Rs. 500/- per month for life to the vulnerable affected person
as indicated at paragraph 7.1.6 (iv) of this policy.
(7.1.6(iv) - vulnerable person such as the disabled, destitute, orphans, widows,
unmarried girls, abandoned woman, or person above fifty years of age, who are
not provided or cannot immediately be provided with alternative livelihood and
who are not otherwise covered as part of a family).
9.5.5 SPECIAL PROVISIONS
The project developers in case of hydroelectric project will provide to each of
the project affected families the benefit of 100 units of electricity per month free
of charge for a period of 10 years from the date of commissioning of a
hydroelectric project and arrange this benefit through the concerned distribution
company. In case of the affected family not consuming 100 units of electricity,
the cost of balance shall be made available to the family in cash or kind or
combination of both as per the hydropower policy of the State Govt.
9.5.6 COMPENSATION AGAINST DIVERSION OF USF AND RF
The Deputy commissioner in his capacity as forest settlement officer assisted by
land revenue department and settlement officer, shall work out compensation for
the loss of rights and privileges of the tribal people to collect and use forest
produce from USF @ Rs. 1,56,000 per Ha for USF area and Rs. 78,000 per Ha
for Reserved Forest land (if any rights and privileges are granted by notification
constituting RF) for the base year 2008 as on 1-4-2008.
In addition, in case of diversion of USF, the community shall also be paid
compensation against extinction of their traditional rights over the USF land use
@ 25 % of NPV as determined by GoI from time to time. This compensation to
the community is over and above the NPV paid to CAMPA.

GMR Londa Hydro Power Pvt. Ltd. EMP of Talong Londa H.E. Project
RS Envirolink Technologies Pvt. Ltd. 9.14
Keeping in view the above provisions, R&R Package has been developed for
Project Affected Families, in consultation with district administration and local
representatives; and same is given at Table 9.4.

GMR Londa Hydro Power Pvt. Ltd. EMP of Talong Londa H.E. Project
RS Envirolink Technologies Pvt. Ltd. 9.15
Table 9.4: R&R Package for PAFs
Clause No.
Provision as per "RFCT_LARR Act, 2013"
or "State Rehabilitation and Resettlement Policy, 2008"
(SRRP - 2008) of Govt. of Arunachal Pradesh
No. of Eligible nuclear families
/ persons
Rate as per guidelines /
policies
Cost in Rs. (for eligible
families) as per guidelines /
policies
Remarks
Rehabilitation & Resettlement package for Affected families (as per RFCT_LARR Act, 2013)
4 Choice of Annuity or Employment
The appropriate Government shall ensure that the affected families are provided with the following options: (a) where jobs are created through the project, after providing suitable training and skill development in the required field, make provision for employment at a rate not lower than the minimum wages provided for in any other law for the time being in force, to at least one member per affected family in the project or arrange for a job in such other project as may be required; or (b) one time payment of five lakhs rupees per affected family; or (c) annuity policies that shall pay not less than two thousand rupees per month per family for twenty years, with appropriate indexation to the Consumer Price Index for Agricultural Labourers.
237
Rs. 2,000/- per month for a period of 20 years (Option - C)
113,760,000.00 --
5 Subsistence grant for displaced families for a Period of one year
Each affected family which is displaced from the land acquired shall be given a monthly subsistence allowance equivalent to three thousand rupees per month for a period of one year from the date of award.
112
Rs. 3,000/- per month per family for one year from date of award
4,032,000.00 --
6 Transportation cost for displaced families
Each affected family which is displaced shall get a one-time financial assistance of fifty thousand rupees as transportation cost for shifting of the family, building materials, belongings
112 Rs. 50,000.00 5,600,000.00 --

GMR Londa Hydro Power Pvt. Ltd. EMP of Talong Londa H.E. Project
RS Envirolink Technologies Pvt. Ltd. 9.16
Clause No.
Provision as per "RFCT_LARR Act, 2013"
or "State Rehabilitation and Resettlement Policy, 2008"
(SRRP - 2008) of Govt. of Arunachal Pradesh
No. of Eligible nuclear families
/ persons
Rate as per guidelines /
policies
Cost in Rs. (for eligible
families) as per guidelines /
policies
Remarks
and cattle. 7 Cattle shed/petty shops cost
Each affected family having cattle or having a petty shop shall get one-time financial assistance of such amount. As the appropriate Government may, by notification, specify subject to a minimum of twenty-five thousand rupees for construction of cattle shed or petty shop as the case may be.
112 Rs.25,000.00 2,800,000.00 --
8 One time Grant to artisan, small traders and certain others
Each affected family of an artisan, small traders or self-employed person or an affected family which owned non-agricultural land or commercial, industrial or institutional structure in the affected area, and which has been involuntarily displaced from the affected area due to land acquisition , shall get one time assistance of such amount as the appropriate Government may, by notification, specify subject to a minimum of 25000 rupees
36 Rs.25,000.00 9,00,000.00 --
10 One-time Resettlement Allowance
Each affected family shall be given a one-time "Resettlement Allowance" of fifty thousand rupees only.
112 Rs.50,000.00 5,600,000.00 --
Rehabilitation & Resettlement package for Affected families (as per SRRP - 2008) 8.3 Housing Benefits and Compensation
8.3.1
Any Affected family owing house & whose house has been acquired or lost shall be allotted free of cost house & plot for the house site to the extent of actual loss of area of the acquired house but not more than 250 sq.m (approx. 2500 sq. feet) of land in rural areas of 150 sq.m (approx. 1500 sq. feet) in urban area, as the case may be for each nuclear family. The size and design of the house will be decided by the State Authority in consultation with the project affected community and the project authority;
112 Rs.320,000.00 35,840,000.00
The family which opt not to take the house offered at the resettlement site, shall get one time financial assistance for house construction and the amount shall be Rs. 2,00,000/- and his claim for free of cost plot at

GMR Londa Hydro Power Pvt. Ltd. EMP of Talong Londa H.E. Project
RS Envirolink Technologies Pvt. Ltd. 9.17
Clause No.
Provision as per "RFCT_LARR Act, 2013"
or "State Rehabilitation and Resettlement Policy, 2008"
(SRRP - 2008) of Govt. of Arunachal Pradesh
No. of Eligible nuclear families
/ persons
Rate as per guidelines /
policies
Cost in Rs. (for eligible
families) as per guidelines /
policies
Remarks
Provided that, in urban areas a house of 100 square meter carpet area may be provided in lieu thereof. Such a house, if necessary, may be offered in a multistoried building complex.
resettlement site shall stand forfeited (Ref SRRP-2008, Chapter VIII, Clause No 8.3.2)
8.12 Pension for Life to Vulnerable Affected Persons
8.12.1
The project authorities shall, at their cost, arrange for annuity policies that will pay a pension of Rs. 500/- per month for life to the vulnerable affected person as indicated at paragraph 7.1.6 (iv) of this policy. (7.1.6(iv) - vulnerable person such as the disabled, destitute, orphans, widows, unmarried girls, abandoned woman, or person above fifty years of age, who are not provided or cannot immediately be provided with alternative livelihood and who are not otherwise covered as part of a family)
57
Rs. 500/- per month for a period of 20 years
68,40,000.00 --
8.14 Special Provisions
8.14.5
The project developers in case of hydroelectric project will provide to each of the project affected families the benefit of 100 units of electricity per month free of charge for a period of 10 years from the date of commissioning of a hydroelectric project and arrange this benefit through the concerned distribution company. In case of the affected family not consuming 100 units of electricity, the cost of balance shall be made available to the family in cash or kind or combination of both as per the hydropower policy of the State Govt.
112
100 units of electricity per month to each PAFs from COD (@ Levellised tariff of Rs 4.32 per unit)
5,806,080.00 --
9 Compensation against Diversion of Unclassified State Forest (USF) and Reserved Forest
(ii)
The Deputy commissioner in his capacity as forest settlement officer assisted by land revenue department and settlement officer, shall work out compensation for the loss of rights and privileges of the tribal people to collect and use forest produce
--
USF @ Rs 1,56,000/- per
Ha (Total Land -
64,443,600.00 --

GMR Londa Hydro Power Pvt. Ltd. EMP of Talong Londa H.E. Project
RS Envirolink Technologies Pvt. Ltd. 9.18
Clause No.
Provision as per "RFCT_LARR Act, 2013"
or "State Rehabilitation and Resettlement Policy, 2008"
(SRRP - 2008) of Govt. of Arunachal Pradesh
No. of Eligible nuclear families
/ persons
Rate as per guidelines /
policies
Cost in Rs. (for eligible
families) as per guidelines /
policies
Remarks
from USF @ Rs. 1,56,000 per Ha for USF area and Rs.78,000 per Ha for Reserved Forest land (if any rights and privileges are granted by notification constituting RF) for the base year 2008 as on 1-4-2008.
413.10 Ha)
(iii)
In addition, in case of diversion of USF, the community shall also be paid compensation against extinction of their traditional rights over the USF land use @ 25 % of NPV as determined by GoI from time to time. This compensation to the community is over and above the NPV paid to CAMPA.
-- -- 4,96,29,000.00
As per the Forest land diversion case the amount will be provided to community
Total 29,52,50,680.00

GMR Londa Hydro Power Pvt. Ltd. EMP of Talong Londa H.E. Project
RS Envirolink Technologies Pvt. Ltd. 9.19
9.6 RESETTLEMENT OF DISPLACED FAMILIES
As can be seen from Table 9.3, there are 112 nuclear families who are coming
under involuntary displacement and they belong to 3 villages. After due
consultation with displaced families a plan has been prepared to resettle
displaced families at a place of their choice. As per the State R&R Policy, a land
area of 250 sq.m. has been considered for each nuclear family and additional
area 0.75 Ha for civic amenities and infrastructure development. Therefore, an
area of 307 sq.m. per family has been considered and 4ha land is proposed
near the Londa village for rehabilitation.
Resettlement of displaced families in the existing villages can put pressure on
existing infrastructure and amenities in those locations. To avoid such a
situation, amenities and infrastructure in the resettlement area will be
strengthened with a view to improve quality of life. Activities planned for
development in resettlement locations include:
Drinking water supply
Electrification for domestic lighting
Community centre
Approach road
Internal pathways
Drainage system
Avenue plantation
Grave Yard
A total budget of Rs. 400 lacs is proposed for development of amenities and
basic infrastructure at the resettlement site.

GMR Londa Hydro Power Pvt. Ltd. EMP of Talong Londa H.E. Project
RS Envirolink Technologies Pvt. Ltd. 9.20
9.7 ECONOMIC DEVELOPMENT PACKAGE
As the project is located in one of the remote area of Arunachal Pradesh, which
is an under developed area of the State, it is therefore imperative for the project
developer to become a dutiful partner in the Economic Development of the area.
Project Developer proposes to implement various programmes and activities,
which would not only lead to economic upliftment, but also socio-cultural
development in the area. In addition to the relief and rehabilitation package for
the affected families, the project authorities will undertake a plan of
infrastructural development in the project area which helps in upliftment of basic
facilities for the benefit and use of locals. A detailed account of these proposed
development activities is discussed under this head.
The Economic Development Plan is developed in consultation with the project
affected villages. The baseline data of available facilities and requirements of
the local population were collected to prepare this plan.
9.7.1 EXISTING FACILITIES IN THE PROJECT AFFECTED VILLAGES
The existing facilities in the affected villages as identified during the survey
are discussed below:
Road Network and Transport
Metalled road connects Seppa, the district HQ of East Kameng with project
affected villages. There is no public transport facility available in the area.
Few light vehicles like Sumo, Jeep, etc. ply on daily basis, which is the only
mode of transport in the area.
Post Office and Bank
The Post Offices in the area located in the major towns. Most of the villages
can access post office within 4-5 Km distance.
Educational Facilities
In the project affected area there are primary schools and middle school.
The lone secondary school is in Bameng HQ.
Telecommunication
The telecommunication facilities are extremely poor in the area. The mobile
cellular network is also not available in the study area.
Water, Sanitation and Electricity Supply
All the villages in the project area have the facility of water supply through
pipes connected to natural springs. Water supply is not a major constrain t in
the area due to availability of good quality water from the springs. However,
sanitation facilities are not well developed in the villages. Most of the
villages have electricity supply.
Market Places
Seppa is the only major market in the area for sale of agriculture produce
and to buy vegetable and grocery.
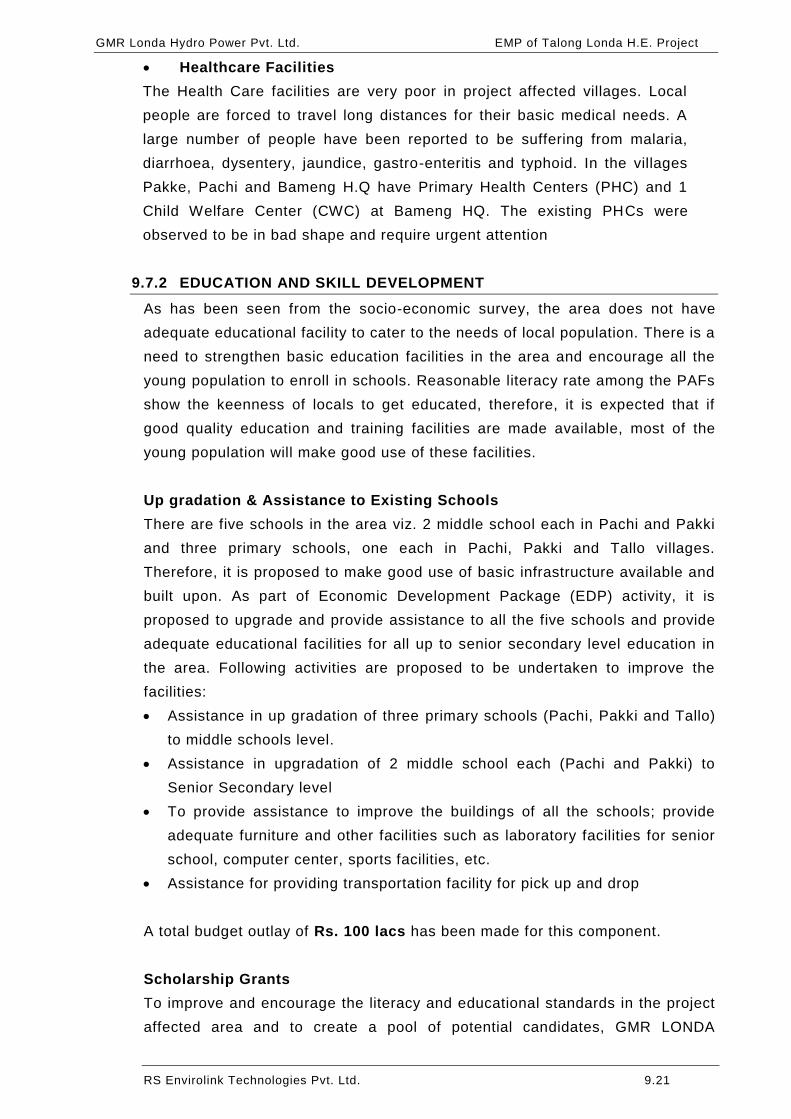
GMR Londa Hydro Power Pvt. Ltd. EMP of Talong Londa H.E. Project
RS Envirolink Technologies Pvt. Ltd. 9.21
Healthcare Facilities
The Health Care facilities are very poor in project affected villages. Local
people are forced to travel long distances for their basic medical needs. A
large number of people have been reported to be suffering from malaria,
diarrhoea, dysentery, jaundice, gastro-enteritis and typhoid. In the villages
Pakke, Pachi and Bameng H.Q have Primary Health Centers (PHC) and 1
Child Welfare Center (CWC) at Bameng HQ. The existing PHCs were
observed to be in bad shape and require urgent attention
9.7.2 EDUCATION AND SKILL DEVELOPMENT
As has been seen from the socio-economic survey, the area does not have
adequate educational facility to cater to the needs of local population. There is a
need to strengthen basic education facilities in the area and encourage all the
young population to enroll in schools. Reasonable literacy rate among the PAFs
show the keenness of locals to get educated, therefore, it is expected that if
good quality education and training facilities are made available, most of the
young population will make good use of these facilities.
Up gradation & Assistance to Existing Schools
There are five schools in the area viz. 2 middle school each in Pachi and Pakki
and three primary schools, one each in Pachi, Pakki and Tallo villages.
Therefore, it is proposed to make good use of basic infrastructure available and
built upon. As part of Economic Development Package (EDP) activity, it is
proposed to upgrade and provide assistance to all the five schools and provide
adequate educational facilities for all up to senior secondary level education in
the area. Following activities are proposed to be undertaken to improve the
facilities:
Assistance in up gradation of three primary schools (Pachi, Pakki and Tallo)
to middle schools level.
Assistance in upgradation of 2 middle school each (Pachi and Pakki) to
Senior Secondary level
To provide assistance to improve the buildings of all the schools; provide
adequate furniture and other facilities such as laboratory facilities for senior
school, computer center, sports facilities, etc.
Assistance for providing transportation facility for pick up and drop
A total budget outlay of Rs. 100 lacs has been made for this component.
Scholarship Grants
To improve and encourage the literacy and educational standards in the project
affected area and to create a pool of potential candidates, GMR LONDA
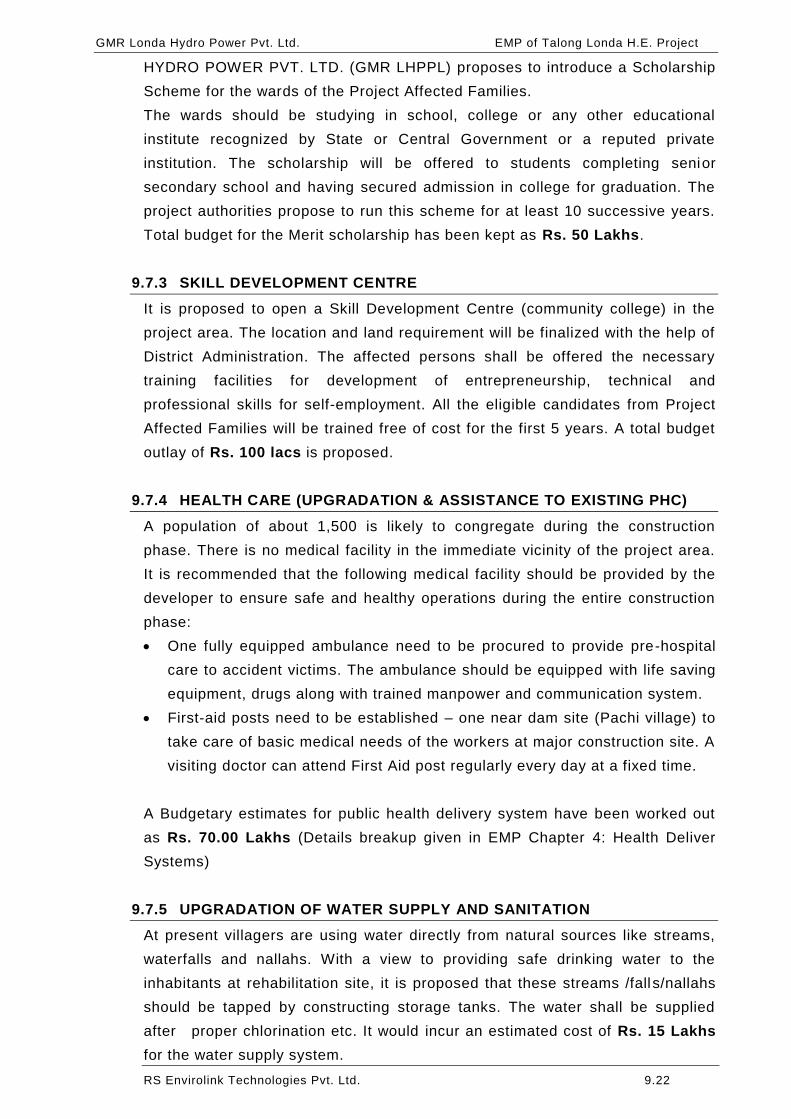
GMR Londa Hydro Power Pvt. Ltd. EMP of Talong Londa H.E. Project
RS Envirolink Technologies Pvt. Ltd. 9.22
HYDRO POWER PVT. LTD. (GMR LHPPL) proposes to introduce a Scholarship
Scheme for the wards of the Project Affected Families.
The wards should be studying in school, college or any other educational
institute recognized by State or Central Government or a reputed private
institution. The scholarship will be offered to students completing senior
secondary school and having secured admission in college for graduation. The
project authorities propose to run this scheme for at least 10 successive years.
Total budget for the Merit scholarship has been kept as Rs. 50 Lakhs.
9.7.3 SKILL DEVELOPMENT CENTRE
It is proposed to open a Skill Development Centre (community college) in the
project area. The location and land requirement will be finalized with the help of
District Administration. The affected persons shall be offered the necessary
training facilities for development of entrepreneurship, technical and
professional skills for self-employment. All the eligible candidates from Project
Affected Families will be trained free of cost for the first 5 years. A total budget
outlay of Rs. 100 lacs is proposed.
9.7.4 HEALTH CARE (UPGRADATION & ASSISTANCE TO EXISTING PHC)
A population of about 1,500 is likely to congregate during the construction
phase. There is no medical facility in the immediate vicinity of the project area.
It is recommended that the following medical facility should be provided by the
developer to ensure safe and healthy operations during the entire construction
phase:
One fully equipped ambulance need to be procured to provide pre-hospital
care to accident victims. The ambulance should be equipped with life saving
equipment, drugs along with trained manpower and communication system.
First-aid posts need to be established – one near dam site (Pachi village) to
take care of basic medical needs of the workers at major construction site. A
visiting doctor can attend First Aid post regularly every day at a fixed time.
A Budgetary estimates for public health delivery system have been worked out
as Rs. 70.00 Lakhs (Details breakup given in EMP Chapter 4: Health Deliver
Systems)
9.7.5 UPGRADATION OF WATER SUPPLY AND SANITATION
At present villagers are using water directly from natural sources like streams,
waterfalls and nallahs. With a view to providing safe drinking water to the
inhabitants at rehabilitation site, it is proposed that these streams /fall s/nallahs
should be tapped by constructing storage tanks. The water shall be supplied
after proper chlorination etc. It would incur an estimated cost of Rs. 15 Lakhs
for the water supply system.

GMR Londa Hydro Power Pvt. Ltd. EMP of Talong Londa H.E. Project
RS Envirolink Technologies Pvt. Ltd. 9.23
Towards sanitation facility, toilet facilities will be provided to all the project
affected families. A septic tank and soak pit will be provided to ensure
anaerobic treatment of the sewage. A total budget of Rs. 5 lakhs has been kept
towards sanitation facility.
9.7.6 ASSISTANCE TO ENTREPRENEURS FOR PROVIDING TRANSPORTATION
Transport services in the region depend mainly on the private light vehicles,
which are very sparse. The scanty transport facilities can be attributed to the
sparse population, however, people suffer due to the poor transport facilities.
The project authorities propose to provide financial assistance to willing
entrepreneurs to purchase transport vehicles like SUVs, etc suitable for the
area. Total cost estimated for this scheme is Rs. 200 lacs.
9.7.7 BASIC INFRASTRUCTURE
Road network
At present the villages in the vicinity of the project site are connected by
Kuchcha link roads. For the resettled village, the Kuchcha road should be
converted to Pucca roads. Project developer will construct the project roads
to ensure accessibility of different construction sites. Road requirement will be
assessed in detail, however, a budgetary estimate of Rs.100 lacs has been kept
for road construction, repair and maintenance.
Bus Shelters
On providing road infrastructure and transportation facility; people will be able
to commute comfortably. To further enhance the basic infrastructure, bus
shelters will be provided along the transportation routes especially near villages.
A budgetary estimate of Rs 10 lakhs has been kept for Bus shelter
construction.
Street Lights
As part of infrastructure development for locals, street lights will be provided at
prominent locations in the project affected villages. A budgetary estimate of Rs.
5 lakh has been kept for street light.
Market Complex
Another infrastructure activity, which is critical for the area and will help locals
set up small businesses to cater to the needs of large number of migratory
population as well as that of locals is market place. Market complex will also
have open area for weekly haats, which are quite common in the region. These
shops will be allotted to project affected families. Likely set ups include
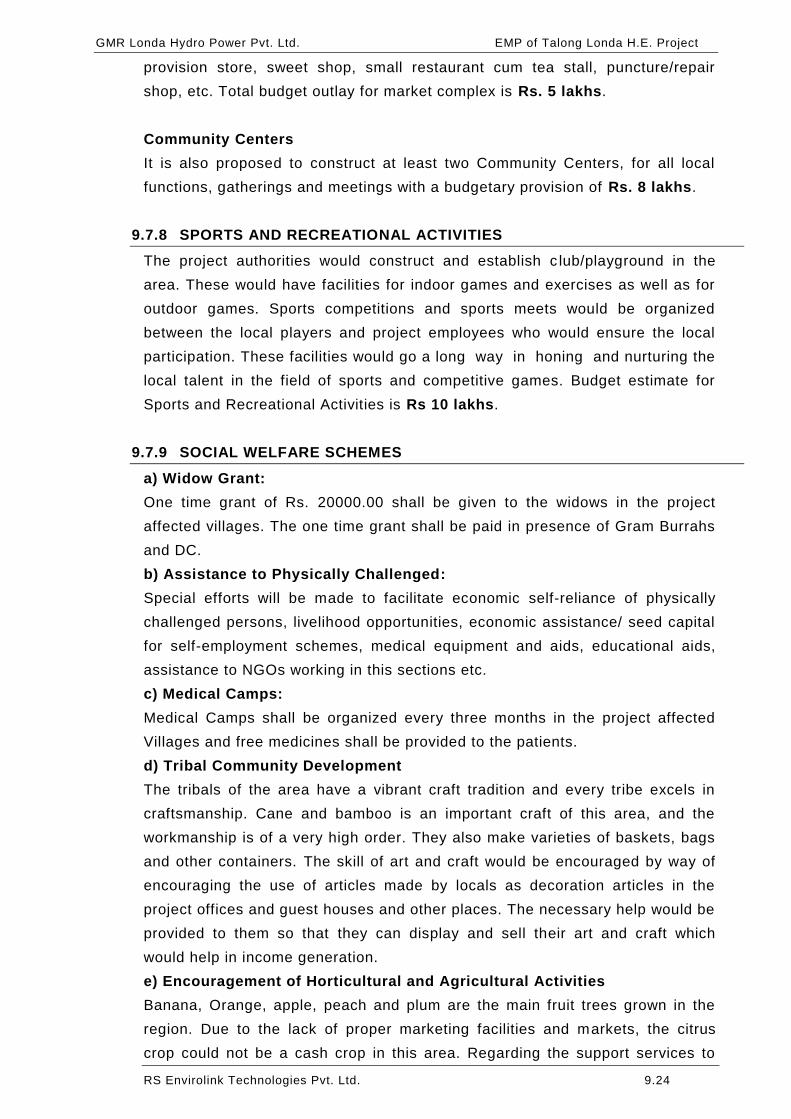
GMR Londa Hydro Power Pvt. Ltd. EMP of Talong Londa H.E. Project
RS Envirolink Technologies Pvt. Ltd. 9.24
provision store, sweet shop, small restaurant cum tea stall, puncture/repair
shop, etc. Total budget outlay for market complex is Rs. 5 lakhs.
Community Centers
It is also proposed to construct at least two Community Centers, for all local
functions, gatherings and meetings with a budgetary provision of Rs. 8 lakhs.
9.7.8 SPORTS AND RECREATIONAL ACTIVITIES
The project authorities would construct and establish c lub/playground in the
area. These would have facilities for indoor games and exercises as well as for
outdoor games. Sports competitions and sports meets would be organized
between the local players and project employees who would ensure the local
participation. These facilities would go a long way in honing and nurturing the
local talent in the field of sports and competitive games. Budget estimate for
Sports and Recreational Activities is Rs 10 lakhs.
9.7.9 SOCIAL WELFARE SCHEMES
a) Widow Grant:
One time grant of Rs. 20000.00 shall be given to the widows in the project
affected villages. The one time grant shall be paid in presence of Gram Burrahs
and DC.
b) Assistance to Physically Challenged:
Special efforts will be made to facilitate economic self-reliance of physically
challenged persons, livelihood opportunities, economic assistance/ seed capital
for self-employment schemes, medical equipment and aids, educational aids,
assistance to NGOs working in this sections etc.
c) Medical Camps:
Medical Camps shall be organized every three months in the project affected
Villages and free medicines shall be provided to the patients.
d) Tribal Community Development
The tribals of the area have a vibrant craft tradition and every tribe excels in
craftsmanship. Cane and bamboo is an important craft of this area, and the
workmanship is of a very high order. They also make varieties of baskets, bags
and other containers. The skill of art and craft would be encouraged by way of
encouraging the use of articles made by locals as decoration articles in the
project offices and guest houses and other places. The necessary help would be
provided to them so that they can display and sell their art and craft which
would help in income generation.
e) Encouragement of Horticultural and Agricultural Activities
Banana, Orange, apple, peach and plum are the main fruit trees grown in the
region. Due to the lack of proper marketing facilities and markets, the citrus
crop could not be a cash crop in this area. Regarding the support services to

GMR Londa Hydro Power Pvt. Ltd. EMP of Talong Londa H.E. Project
RS Envirolink Technologies Pvt. Ltd. 9.25
the affected area, project authorities propose to establish a small research
laboratory with staff, training center with food processing unit and seed center.
The project authorities propose to provide all the necessary infrastructures and
support to such programmes.
The break up of the Budget for Social Welfare Scheme given below in Table
9.5.
Table 9.5: Budgetary estimates for Social Welfare schemes
S. No. Programme Amount (Rs.in lakh)
1 Widow Grant 5.00 2 Assistance to Physically Handicapped 5.00 3 Medical Camps 12.00 4 Tribal Community Development 5.00 5 Support Services for Agricultural and Horticultural
Activities 15.00
Total 42.00
9.7.10 OVERALL BUDGET FOR ECO- DEVELOPMENT PACKAGE
Economic Development Package (EAP) schemes and activities have been
identified and discussed above along with quantities where ever feasible and
budgetary estimate. However, this is initial need assessment and activities have
been proposed accordingly. Before implementation of EDP activities, developer
will get a Local Area Development Committee (LADC) constituted with members
from Local Administration, Villages and project proponent. LADC will review and
prepare the detail of each scheme with quantification, budget and time schedule
for implementation. Therefore, the actual development will take place to meet all
the local requirements. Effectiveness of implementation of each scheme will be
reviewed periodically by LADC and necessary preventive and corrective actions
will be taken to ensure that benefits of such schemes is available to all the local
population in general and project affected villages/persons in particular.
Summary of schemes, and budgets as of date, is given at Table 9.6 below.

GMR Londa Hydro Power Pvt. Ltd. EMP of Talong Londa H.E. Project
RS Envirolink Technologies Pvt. Ltd. 9.26
Table 9.6: Summary of Economic – Development Package and Budget
Proposed Schemes Budget (Rs.) Education and Skill Development 1,00,00,000 Scholarship Grant 50,00,000 Skill Development Centre 1,00,00,000 Upgradation of water supply 15,00,000
Sanitation 5,00,000
Assistance to Entrepreneurs for Providing Transportation 2,00,00,000
Basic Infrastructure
Road network 1,00,00,000 Bus Shelters 10,00,000 Street Lights 5,00,000 Market Complex 5,00,000 Community Centers 8,00,000
Sports and Recreational Activities 10,00,000 Social Welfare Schemes 42,00,000 Total 6,50,00,000
9.8 INSTITUTIONAL ARRANGEMENTFOR R & R
A Resettlement and Rehabilitation Committee would be constituted in order to
sensitize implementation of R & R activities, administer financial flow, prioritize
activities, advise in project implementation, monitoring and evaluation. The
committee would decide upon, from time to time various economic rehabilitation
packages and training programmes, keeping in mind people‟s participation in
various development schemes. The committee would be as follows:
a) Supervisory Body
Commissioner for R&R
Project In Charge of GMR LHPPL
b) Implementation Body
Administrator for R&R
Nominee of Project In charge- GMR LHPPL
Representatives of Village Level Committees (VLC)
Representatives of women of the affected villages
Representatives of Nationalized Bank
Representatives of Forest Department
Representatives of Local NGOs
MLA/MP of the Area
Representative Scheduled Tribes residing in the affected area.
Land Acquisition Officer of the project
Besides the foregoing organizational arrangement, liaison should be established
by the Administrator for R&R with the other government departments, which will
extend support in the implementation of land acquisition and rehabilitation
plans. Specifically, government organizations like Department of Revenue,

GMR Londa Hydro Power Pvt. Ltd. EMP of Talong Londa H.E. Project
RS Envirolink Technologies Pvt. Ltd. 9.27
Rural Development, Agriculture, Forest, Horticulture; Rural Industries, etc. can
be contacted for dovetailing their plans for the economic rehabilitation of PAFs.
These organizations/departments shall not only extend their various
development schemes for the economic welfare of the PAFs but would also
provide technical guidance and training to PAFs in carrying out economic
activities. However, the SRRP-2008 indicates R&R Committee at Project level,
under the Chairmanship of Administrator for R&R.
9.8.1 MONITORING AND EVALUATION
Monitoring and Evaluation (M&E) must be simultaneous with the implementation
of Rehabilitation Plan. In addition to the conventional monitoring, normally
carried out by the Government machinery, an external M&E agency will also be
engaged to help in proper monitoring of land acquisition and rehabilitation
plans. The main purpose of involving such an agency is to bring the problems
and difficulties faced by the PAFs to the notice of Administrator R&R on a
regular basis for their redress as well as to help in formulating and undertaking
corrective measures. The external Monitoring and Evaluation (M&E) agency can
submit half yearly reports on the progress of implementing Rehabilitation Master
Plan (RMP) along with suggestions and corrective measures required for
improvement in the implementation of Rehabilitation Plan.
For Land Acquisition and rehabilitation plan, M&E system will consist of:
i) Administrative monitoring;
ii) Socio-economic performance and
iii) Impact evaluation.
Administrative monitoring will be conventionally carried out by the Land
Acquisition Officer of project authorities, Resettlement Commissioner and other
concerned government agencies/departments. The focus will be on physical
(like number of land holders affected, area identified for allotment to Village
Level Committee, etc.) and financial (like compensation paid, payment to M&E
agency, office establishment cost, etc.) parameters. The socio-economic
monitoring, which will be carried out concurrently is the crux of M&E exercise to
provide interim measures based on the field level situations. This along-with
impact evaluation at the end of plan period will be carried out by the M&E
agency. While covering the affected community, monitoring will focus on the
vulnerable groups like women, physically handicapped, etc. The household
information collected through the socio-economic survey will form the
benchmarks for comparison. However, these benchmarks will be supplemented
in order to create new reference points against performance, effects and
objectives.

GMR Londa Hydro Power Pvt. Ltd. EMP of Talong Londa H.E. Project
RS Envirolink Technologies Pvt. Ltd. 9.28
The Consultant will review the rehabilitation and resettlement programme every
year till the completion of the project. A total provision of lumpsum Rs. 41.58
lakhs has been kept in the cost estimate for this purpose.
9.8.2 PARTICIPATION OF PAFS
Involvement of affected communities in planning and implementation of
rehabilitation programmes according to their needs and socio-economic
conditions is of vital importance. To obtain co-operation, participation and
feedback, PAFs need to be systematically informed and consulted during
preparation and implementation of R&R plan about their options and rights. In
the proposed project, co-operation and participation of PAFs in this process
could be ensured through their involvement in each of the following s tages.
As a part of participatory planning, community meetings should be held on a
routine basis to explain about the project and the benefits of the project. Direct
communication with the PAFs will negate the politicization of the R&R process.
The communication with the PAFs can be through the Village Level Committee.
The Village Level Committee can be involved in the implementation of R&R and
other Environmental Management Plans. They should also be consulted in
finding out alternative economic opportunities to supplement their household
income. However, some NGO groups can also be associated which can interact
directly with the project authorities and the affected population.
9.9 FINANCIAL PACKAGE
The summary of the financial requirement for implementation of the
Rehabilitation and Resettlement plan and Economic Development Package is
Rs. 4042.53 lacs as per the summary given below at Table 9.7.
Table 9.7: Summary of budgetary estimates
S. No. R&R Components Cost (Rs.)
1 Rehabilitation grant 29,52,50,680.00 2 Infrastructure in Resettlement Area 4,00,00,000 3 Local Area Development 6,50,00,000
4 Monitoring and Evaluation 40,02,187 Total 40,42,53,187.00

GMR Londa Hydro Power Pvt. Ltd. EMP of Talong Londa H.E. Project
R S Envirolink Technologies Pvt. Ltd. 10.1
CHAPTER 10
ENIVRONMENTAL RISKS ASSESSMENT & MANAGEMENT
10.1 IMPACTS ON PHYSICAL ENVIRONMENT
Hydroelectric projects are generally considered cleaner source of energy as the
environmental impacts are considerably lower during the project operation phase.
However, the construction phases of such project, in ecologically rich areas, pose
serious threats to surrounding environment. Therefore, it is important to identify and
quantify such impacts and formulate mitigation measures in order to have minimum
damage to project surrounding areas during construction period.
During construction phase, the activities like site preparation, approach roads,
excavation, drilling, blasting, foundation, tunneling, deployment of machinery,
erection, transportation, dumping will be taken up. Tunneling and foundation works
will involve land excavation, affecting environment by noise and dust pollution.
Structural work, deployment of machinery, approach roads construction and erection
work will also result in dust, noise pollution and vehicular traffic. Material handling
and transportation would also lead to significant increase in air and noise pollution.
Muck generation, its transportation and disposal may pollute surface water due to the
generation of large quantities of suspended particulate matter. Wastewater from
labor camps and colonies may also pollute water bodies in the area.
The likely impacts on the physical environment during the construction phase are
listed in Table 10.1. In addition, another important aspect to be taken care of during
the construction phase of the project is that of “Safety”. Deployment of large number
of labour during the five years construction phase in difficult terrains, underground
works, use of machinery and equipment, use of explosives for blasting, etc. may lead
to serious accidents, if adequate safety measures are not adopted.
Table 10.1: Impacts during Construction Phase Construction & Operational Phase
Activity Potential Environmental Impact
a) Site work / other facilities.
i) Cleaning and grading Dust emission
ii) Temporary facilities, such as sheds, approach roads, sanitary facilities
Dust emission, water pollution and solid waste generation
iii) Earth work comprising of excavation and trenches
Soil erosion, run off, increase in traffic, dust emission
iv) Foundation work, piling and construction of check barrages
Dust, visual and noise pollution, wastewater generation
v) Construction of permanent structures like roads, colony, etc.
Dust and noise pollution and wastewater generation
vi) Mechanical erection and utility systems
Dust, noise and visual impact
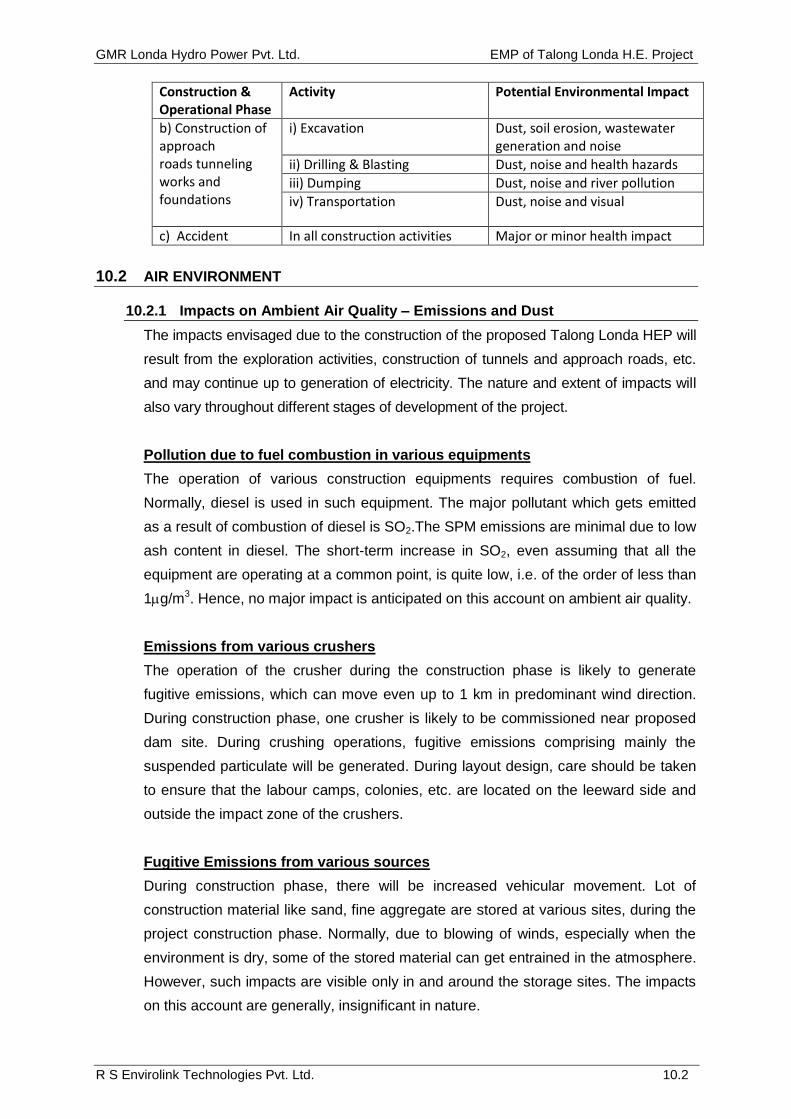
GMR Londa Hydro Power Pvt. Ltd. EMP of Talong Londa H.E. Project
R S Envirolink Technologies Pvt. Ltd. 10.2
Construction & Operational Phase
Activity Potential Environmental Impact
b) Construction of approach roads tunneling works and foundations
i) Excavation Dust, soil erosion, wastewater generation and noise
ii) Drilling & Blasting Dust, noise and health hazards
iii) Dumping Dust, noise and river pollution
iv) Transportation Dust, noise and visual
c) Accident In all construction activities Major or minor health impact
10.2 AIR ENVIRONMENT
10.2.1 Impacts on Ambient Air Quality – Emissions and Dust
The impacts envisaged due to the construction of the proposed Talong Londa HEP will
result from the exploration activities, construction of tunnels and approach roads, etc.
and may continue up to generation of electricity. The nature and extent of impacts will
also vary throughout different stages of development of the project.
Pollution due to fuel combustion in various equipments
The operation of various construction equipments requires combustion of fuel.
Normally, diesel is used in such equipment. The major pollutant which gets emitted
as a result of combustion of diesel is SO2.The SPM emissions are minimal due to low
ash content in diesel. The short-term increase in SO2, even assuming that all the
equipment are operating at a common point, is quite low, i.e. of the order of less than
1g/m3. Hence, no major impact is anticipated on this account on ambient air quality.
Emissions from various crushers
The operation of the crusher during the construction phase is likely to generate
fugitive emissions, which can move even up to 1 km in predominant wind direction.
During construction phase, one crusher is likely to be commissioned near proposed
dam site. During crushing operations, fugitive emissions comprising mainly the
suspended particulate will be generated. During layout design, care should be taken
to ensure that the labour camps, colonies, etc. are located on the leeward side and
outside the impact zone of the crushers.
Fugitive Emissions from various sources
During construction phase, there will be increased vehicular movement. Lot of
construction material like sand, fine aggregate are stored at various sites, during the
project construction phase. Normally, due to blowing of winds, especially when the
environment is dry, some of the stored material can get entrained in the atmosphere.
However, such impacts are visible only in and around the storage sites. The impacts
on this account are generally, insignificant in nature.

GMR Londa Hydro Power Pvt. Ltd. EMP of Talong Londa H.E. Project
R S Envirolink Technologies Pvt. Ltd. 10.3
10.2.2 Mitigation Measures
The best way of impact mitigation is to prevent the event occurring. All efforts should
be made to locate the developmental activities in an area free of agricultural lands,
ecologically sensitive, erosion, forests, flooding, human settlements, land slides,
natural scenic beauty, water logging. In case this is not feasible the next step is to look
at the raw materials/technologies/ processes alternatives which produce least impact
i.e. adopting or using processes or technologies which are efficient and produce
recyclable wastes/ minimum waste/wastes that can be easily disposed, without
affecting the environment. However, if the developmental activity produces the adverse
impact action has to be taken to mitigate the same. Following are some of the methods
available.
Emissions
Minor air quality impacts will be caused by emissions from construction vehicles,
equipment and DG sets, and emissions from transportation traffic. Air pollutants
typically emitted from vehicles include ozone, carbon monoxide, nitrogen dioxide,
and particulates. The frequent truck trips will be required during the construction
period for removal of excavated material and delivery of select concrete and other
equipment and materials.
The following industry standards and practices will be required of the contractors and
to be adhered to:
The contractor will be responsible for maintaining properly functioning construction
equipment to minimize exhaust.
Construction equipment and vehicles will be turned off when not used for extended
periods of time.
Unnecessary idling of construction vehicles to be prohibited.
Effective traffic management to be undertaken to avoid significant delays in and
around the project area.
Road damage caused by sub-project activities will be promptly attended to with
proper road repair and maintenance work.
The construction-related traffic is not anticipated to cause a contravention of
acceptable air quality standards based on the above mitigation measures. Over the
5 year construction period, construction vehicle-related emissions will not constitute a
significant increase in overall emissions and no significant impacts to local air quality
are expected.
Dust

GMR Londa Hydro Power Pvt. Ltd. EMP of Talong Londa H.E. Project
R S Envirolink Technologies Pvt. Ltd. 10.4
The project authorities will work closely with representatives from the community
living in the vicinity of project area to identify areas of concern and to mitigate dust-
related impacts effectively (e.g., through direct meetings, utilization of construction
management and inspection program, and/or through the complaint response
program). To minimize issues related to the generation of dust during the
construction phase of the project, the following measures have been identified:
Identification of construction limits (minimal area required for construction
activities).
When practical, excavated spoils will be removed as the contractor proceeds
along the length of the activity.
When necessary, stockpiling of excavated material will be covered or staged
offsite location with muck being delivered as needed during the course of
construction.
Excessive soil on paved areas will be sprayed (wet) and/or swept and unpaved
areas will be sprayed and/or mulched. The use of petroleum products or similar
products for such activities will be strictly prohibited.
Contractors will be required to cover stockpiled soils and trucks hauling soil,
sand, and other loose materials (or require trucks to maintain at least two feet of
freeboard).
Effective traffic management to be defined.
Dust sweeping - The construction area and vicinity (access roads, and working
areas) shall be swept with water sweepers on a daily basis or as necessary to ensure
there is no visible dust.
10.3 NOISE LEVELS
10.3.1 Noise Due To Construction Equipment
The sound will be generated during almost all the construction activities such as
tunneling, blasting, movement of vehicles, operation of construction machines and
equipments, repair and maintenance work, operation of DG sets, etc. Continuous
exposure of workers to high sound levels may result in annoyance, fatigue, and may
cause temporary shift of threshold limit of hearing and even permanent loss of
hearing. As is evident from the baseline data, in the absence of vehicular traffic,
sound levels in the area are generally low. There are no industries or any other
source of noise in the area.
Construction phase will generate noise at various locations in the project area and is
likely to affect residents and construction workers. The simultaneous operation of
some equipment may increase the noise manifolds, however, resultant increase in

GMR Londa Hydro Power Pvt. Ltd. EMP of Talong Londa H.E. Project
R S Envirolink Technologies Pvt. Ltd. 10.5
noise levels will depend upon location of such equipment with respect to habitation,
availability of the silencers/ mufflers, condition of the equipment, losses during
transmission, etc. Increase in vehicular traffic in the area will also contribute to high
sound levels in the area. Construction activities such as tunneling, blasting, etc. also
lead to high noise generation.
Sound attenuates with the distance and even if all the attenuation factors are
removed, direct sound levels reduce by 6 dB(A) with every doubling of distance.
Further, the sound level reduces substantially when the wave passes through a
barrier. Therefore, if location of construction equipment is planned keeping in view
the safe distance from habitation, impact can be greatly reduced on large section of
population. Workers who are directly exposed need to use Personal Protective
Equipments (PPEs) to reduce the impact.
10.3.2 Mitigation Measures
The contractors will be required to maintain properly functioning equipment and
comply with occupational safety and health standards. The construction equipment
will be required to use available noise suppression devices and properly maintained
mufflers.
Vehicles to be equipped with mufflers recommended by the vehicle manufacturer.
Staging of construction equipment and unnecessary idling of equipment within
noise sensitive areas to be avoided whenever possible.
Use of temporary sound fences or barriers to be evaluated.
Notification will be given to residents within 300 feet of major noise generating
activities. The notification will describe the noise abatement measures that will be
implemented.
Monitoring of noise levels will be conducted during the construction phase of the
project. In case of exceeding of pre-determined acceptable noise levels by the
machinery will require the contractor(s) to stop work and remedy the situation
prior to continuing construction.
The following Noise Standards for DG sets (15-500 KVA) are recommended for the
running of DG sets during the construction.
The total sound power level, Lw, of a DG set should be less than, 94+10 log10
(KVA), dB(A).
Noise from the DG set should be controlled by providing an acoustic enclosure or
by treating the enclosure acoustically.
The Acoustic Enclosure should be made of CRCA sheets of appropriate
thickness and structural/ sheet metal base. The walls of the enclosure should be

GMR Londa Hydro Power Pvt. Ltd. EMP of Talong Londa H.E. Project
R S Envirolink Technologies Pvt. Ltd. 10.6
insulated with fire retardant foam so as to comply with the 75 dB(A) at 1m sound
levels specified by CPCB, Ministry of Environment & Forests.
The acoustic enclosure/acoustic treatment of the room should be designed for
minimum 25 dB(A) insertion Loss or for meeting the ambient noise standards,
whichever is on the higher side.
The DG set should also be provided with proper exhaust muffler with insertion
loss of minimum 25 dB(A).
Proper efforts to be made to bring down the noise levels due to the DG set,
outside its premises, within the ambient noise requirements by proper siting and
control measures.
A proper routine and preventive maintenance procedure for the DG set should be
set and followed in consultation with the DG set manufacturer which would help
prevent noise levels of the DG set from deteriorating with use.
10.4 WATER ENVIRONMENT
Construction work require large quantities of water to be used in various processing
plants for material preparation; curing purposes, cooling water in equipments,
domestic usages in colonies, etc. wastewater will be generated in various forms
processing plants, workshops and residential areas. Additionally, during the
construction work, muck transportation and transportation of materials; large
quantities of suspended particulate matter will be generated to end up in the water
body. As the construction period is long such impacts can permanently deteriorate
the water quality in the area, if adequate mitigation measures are not adopted.
The following mitigation measures are suggested to be followed during the
construction of the project:
Minimize flow variation from the mean flow. Adequate river water will be secured
to meet the requirements of riparian people, livestock, and wild animals and to
sustain the aquatic ecosystem.
Segregation of different types of wastes at source and avoid their mixing up in the
river.
Accumulation of oil wastes in depressions should be minimised in order to avoid
possible contamination of the ground water system.
Surface runoff from oil handling areas/devices (workshops and DG operation
areas) should be treated for oil separation before discharge into the environment.
If oil wastes are combined with sanitary sewage, oil separation will be necessary
at the wastewater treatment facility.
All effluents containing acid/ alkali/ organic/ toxic wastes should be processed by
treatment methods. The treatment methods may include biological or chemical
processes.

GMR Londa Hydro Power Pvt. Ltd. EMP of Talong Londa H.E. Project
R S Envirolink Technologies Pvt. Ltd. 10.7
The impact due to suspended solids may be minimized by controlling discharge
of wastes that contain suspended solids; this includes sanitary sewage and other
wastes. Also, all activity that increases erosion or contributes nutrients to water
(thus stimulating algal growth) should be minimized.
For wastes containing high TDS treatment methods include removal of liquid and
disposal of residue by controlled land filling to avoid any possible leaching of the
fills. All surface runoffs around quarries and excavation areas should be properly
channelized and taken care of.
The growth of aquatic weeds is to be monitored in the reservoir and excess
weeds will be removed.
Fish production in the reservoir will be monitored for any possible decrease. If
any unexpected negative impact occurs, fish will be restocked. Technical support
will be provided to the fish farming activities in the reservoir.
Adequacy of the fish population will also be monitored and adequate stock of
fingerlings to be maintained in the hatchery.
10.5 ACCIDENTAL RISKS
In the hydro-electric projects, the environmental risk assessment is an important
aspect. Larger environmental risks such as dam break, land slides, etc. have been
adequately covered along with their management plan at relevant sections of
Environmental Management Plan. Some of the aspects posing accidental risk during
construction phase, where work force and surrounding population may get affected,
have been addressed below.
10.5.1 Safety in Explosive Handling
Explosives will be required to be stored at site during construction period. It is
expected to have a magazine for storing about 20 tonnes of explosives. Magazine
means a building specially constructed in accordance with a design approved by the
Chief Controller and intended for storage of more than 5 kg of explosives. Distances
between two magazines or between a magazine and other buildings, road, railway,
etc. is governed by the Safety Distances given at Schedule VIII of the Explosives
Rules, 1983 and are based on the category and quantity of explosive material stored.
For magazine to store 20T of explosive material, following safe distances are
applicable:
Quantity in Kg
To and between magazine or magazine office etc
To and between process bldgs
X Y ZZ X Y ZZ M/UM M/UM M/UM M/UM M/UM M/UM
20000 26 32 65 26 87 226

GMR Londa Hydro Power Pvt. Ltd. EMP of Talong Londa H.E. Project
R S Envirolink Technologies Pvt. Ltd. 10.8
Quantity in Kg
To railway, Road etc To Dwelling Houses, Offices, factories etc.
X Y ZZ X Y ZZ M/UM M/UM M/UM M/UM M/UM M/UM
20000 28 86 303 58 174 605 NB: M denotes Mounded; UM denotes Un mounded; Distances are in m
Explosives are divided into four categories according to the risks which they present
when initiated, namely –
Category X – Those explosives, which have a fire or a slight explosion risk or both
but the effect of which will be local.
Category Y – Those explosives, which have a mass fire risk or a moderate explosion
risk, but not the risk of mass explosion.
Category Z – Those explosives, which have a mass explosion risk and major missile,
effect.
Category ZZ – Those explosives, which have a mass explosion risk and minor
missile effect.
If any question arises as to whether any explosive belongs to Category X, Category
Y, Category Z or Category ZZ, the matter shall be referred to the Chief Controller
whose decision shall be final.
In addition to taking license and maintaining safety distances as above, all the
precaution required as the Explosive Rules need to be strictly adhered to during
transportation, storage and handling of explosives.
10.5.2 Safety during Construction
With large scale increase in construction activity of river valley projects, the number
of major accidents during construction stage has increased. Further, increased
construction activity has also created construction related hazards for persons
working on the projects. The degree of safety achieved in project constructions has a
direct bearing on the amount of effort expanded to avoid accidents by those who
control the conditions and practices on the project. In order to avoid accidents it
should be the overall responsibility of the project authorities to provide measures for
the safety of all persons working on the projects.
The standards laid down for the safety aspects should be taken during construction
work. Construction activities at the site of a hydro-electric project need to take care of
safety aspect for all the activities in general and for following critical activities in
particular:
Storage, handling, transportation and operation of explosives required for blasting
and tunnelling activities

GMR Londa Hydro Power Pvt. Ltd. EMP of Talong Londa H.E. Project
R S Envirolink Technologies Pvt. Ltd. 10.9
Underground construction work including tunnelling, excavation and other related
activities
Construction at heights
Fire safety aspects
Storage, handling, detection and safety measures for gases, chemicals and
flammable liquids
Movement of vehicles on construction site
Construction safety issues at site need to be handled in a structured manner. The
matter of safety and accident prevention has to be the responsibility of a senior
person stationed at site and his work can be supervised by a senior person from
head office.
All persons need to be made aware of the dangerous conditions and risks involved in
their activities. They should be trained to take necessary precautions for their own
safety as well as that of others working at site. This should typically involve following
the Safe Operating Procedure (SOP) wherever applicable, use of Personal Protective
Equipment (PPE) such as helmets, gloves, gum boots, safety harness, etc., remain
active and alert without any influence of alcohol or other intoxicating substances
during working hours.
The safety requirement generally vary according to the type of structure, type of
construction methodology, type of strata encountered and number of men and type of
machinery deployed at site, therefore, it is important to develop site specific
construction safety procedures. Such SOPs need to be incorporated in letter and
spirit and all the staff involved need to be sensitized to the importance of safety and
trained. It will be useful to appoint a full time safety manager, alternatively site
manager can double as safety manager with duties of monitoring and audit delegated
to other staff members.
Apart from procuring the appropriate and adequate number of PPEs it is also
important to maintain sufficient number of first aid boxes and some volunteers trained
in giving first aid treatment. Further, the outsiders coming to site such as drivers,
helpers, etc. also need to be made aware of safety requirement of their activity. This
can be achieved by putting posters carrying safety instructions for the benefit of all
and giving verbal instructions at the entry point also.
Table 10.2 gives list of BIS Standards related to safety aspects during various stages
of construction, installation, erection of different components and appurtenance of
river valley projects, including inspection, observation and maintenance aspects from
safety consideration.

GMR Londa Hydro Power Pvt. Ltd. EMP of Talong Londa H.E. Project
R S Envirolink Technologies Pvt. Ltd. 10.10
Table 10.2: List of Relevant BIS Standards IS No. Title 1 IS 10386
(Part 1):1983 Safety code for construction, operation and maintenance of river valley projects: Part 1 General aspects
2 IS 10386 (Part 2):1982
Safety code for construction, operation and maintenance of river valley projects: Part 2 Amenities, protective clothing and equipment
3 IS 10386 (Part 3):1992
Safety code for construction, operation and maintenance of river valley projects Part 3 Plant & machinery
4 IS 10386 (Part 4):1992
Safety code for construction, operation and maintenance of river valley projects Part 4 Handling, transportation and storage of explosives
5 IS 10386 (Part 5):1992
Safety code for construction, operation and maintenance of river valley projects: Part 5 Electrical aspects
6 IS 10386 (Part 6):1983
Safety code for construction, operation and maintenance of river valley projects: Part 6 Construction
7 IS 10386 (Part 7):1993
Safety code for construction, operation and maintenance of river valley projects: Part 7 Fire safety aspects
8 IS 10386 (Part 8):1995
Safety code for construction, operation and maintenance of river valley projects Part 8 Excavation
9 IS 10386 (Part 9):1998
Safety code for construction, operation and maintenance of river valley projects Part 9 Canals and cross drainage works
10 IS 10386 (Part 10):1983
Safety code for construction, operation and maintenance of river valley projects: Part 10 Storage, handling, detection and safety measures for gases, chemicals and flammable liquids
10.6 COST ESTIMATES
Various mitigation and management measures have been discussed above to
reduce the impacts of air, noise and water pollution and implement safety measures
to ensure that impacts on these counts are reduced to minimum possible during the
entire construction phase. To implement such measures, it is important to prepare a
budget of such measures and include in the project cost so that lack of fund should
not constrain their implementation.
Some of the measures suggested have already been covered under other heads of
environmental management; therefore, an estimate of only additional cost is given
below in Table 10.3.
Table 10.3: Estimated cost of implementation of mitigation and safety measures
Particulars Amount (Rs. in lacs)
Cost of setting up of Wastewater Treatment units at two main workshops, aggregate and concrete mixing plants
5.00
Operation and maintenance cost for above wastewater treatment plants for 5 years (lump sum)
5.00
Procuring and replenishing the stock of PPEs during the construction phase of five years
5.00
Training and Awareness programs for local residents, contractors labour, drivers, cleaners, etc.
1.00
Total 21.00
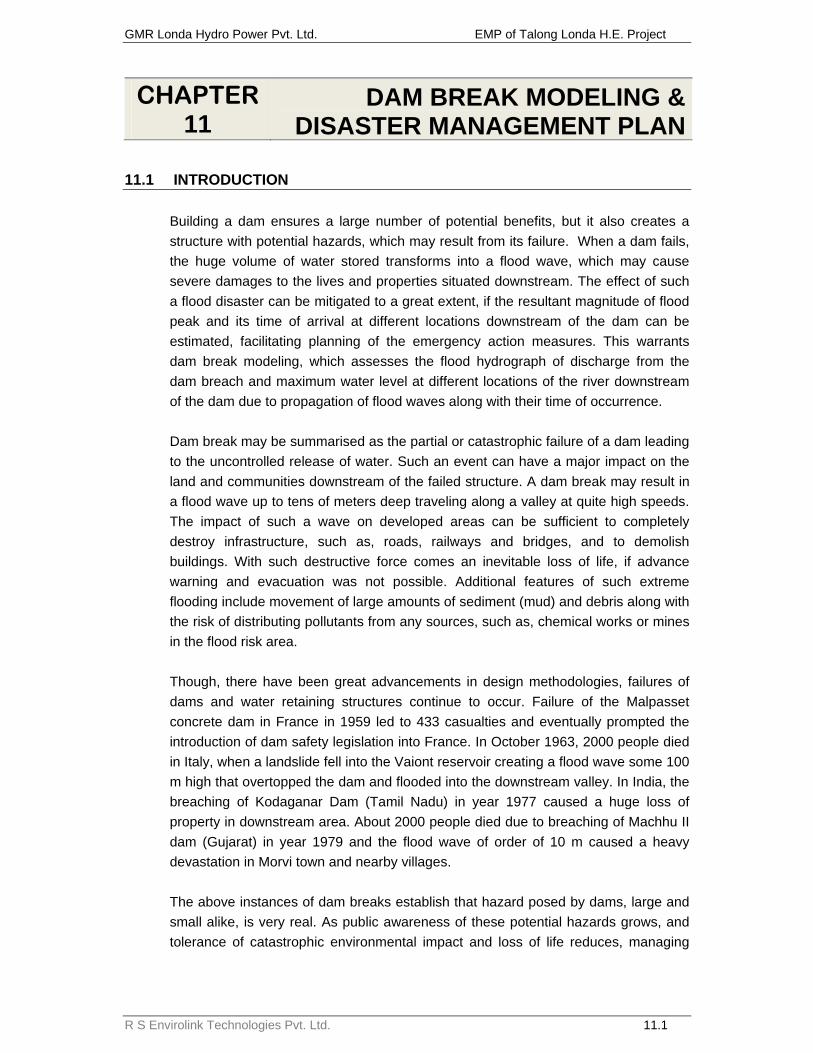
GMR Londa Hydro Power Pvt. Ltd. EMP of Talong Londa H.E. Project
R S Envirolink Technologies Pvt. Ltd. 11.1
CHAPTER 11
DAM BREAK MODELING & DISASTER MANAGEMENT PLAN
11.1 INTRODUCTION Building a dam ensures a large number of potential benefits, but it also creates a
structure with potential hazards, which may result from its failure. When a dam fails,
the huge volume of water stored transforms into a flood wave, which may cause
severe damages to the lives and properties situated downstream. The effect of such
a flood disaster can be mitigated to a great extent, if the resultant magnitude of flood
peak and its time of arrival at different locations downstream of the dam can be
estimated, facilitating planning of the emergency action measures. This warrants
dam break modeling, which assesses the flood hydrograph of discharge from the
dam breach and maximum water level at different locations of the river downstream
of the dam due to propagation of flood waves along with their time of occurrence.
Dam break may be summarised as the partial or catastrophic failure of a dam leading
to the uncontrolled release of water. Such an event can have a major impact on the
land and communities downstream of the failed structure. A dam break may result in
a flood wave up to tens of meters deep traveling along a valley at quite high speeds.
The impact of such a wave on developed areas can be sufficient to completely
destroy infrastructure, such as, roads, railways and bridges, and to demolish
buildings. With such destructive force comes an inevitable loss of life, if advance
warning and evacuation was not possible. Additional features of such extreme
flooding include movement of large amounts of sediment (mud) and debris along with
the risk of distributing pollutants from any sources, such as, chemical works or mines
in the flood risk area.
Though, there have been great advancements in design methodologies, failures of
dams and water retaining structures continue to occur. Failure of the Malpasset
concrete dam in France in 1959 led to 433 casualties and eventually prompted the
introduction of dam safety legislation into France. In October 1963, 2000 people died
in Italy, when a landslide fell into the Vaiont reservoir creating a flood wave some 100
m high that overtopped the dam and flooded into the downstream valley. In India, the
breaching of Kodaganar Dam (Tamil Nadu) in year 1977 caused a huge loss of
property in downstream area. About 2000 people died due to breaching of Machhu II
dam (Gujarat) in year 1979 and the flood wave of order of 10 m caused a heavy
devastation in Morvi town and nearby villages.
The above instances of dam breaks establish that hazard posed by dams, large and
small alike, is very real. As public awareness of these potential hazards grows, and
tolerance of catastrophic environmental impact and loss of life reduces, managing

GMR Londa Hydro Power Pvt. Ltd. EMP of Talong Londa H.E. Project
R S Envirolink Technologies Pvt. Ltd. 11.2
and minimising the risk from individual structures is becoming an essential
requirement rather than a management option.
11.2 NEED FOR DAM BREAK MODELING
The first Law on dam break was introduced in France in 1968 following the earlier
Malpasset Dam failure. Since then many countries have established requirements
for dam safety. And in some other countries, dam owners have established
guidelines for dam safety assessment. In India, Risk assessment and disaster
management plan has been made a mandatory requirement while submitting
application for environmental clearance in respect of river valley projects. Preparation
of Emergency Action Plan after detailed dam break study has become a major
component of dam safety programme of India.
The extreme nature of dam break floods means that flow conditions will far exceed
the magnitude of most natural flood events. Under these conditions, flow will behave
differently to conditions assumed for normal river flow modeling and areas will be
inundated, that are not normally considered. This makes dam break modeling a
separate study for the risk management and emergency action plan.
The objective of dam break modeling or flood routing is to simulate the movement of
a dam break flood wave along a valley or indeed any area ‘downstream’ that would
flood as a result of dam failure. The key information required at any point of interest
within this flood zone is generally:
Time of first arrival of flood water
Peak water level – extent of inundation
Time of peak water level
Depth and velocity of flood water (allowing estimation of damage potential)
Duration of flooding
The nature, accuracy and format of information produced from a dam break analysis
will be influenced by the end application of the data.
11.2.1 Emergency Planning
To reasonably prepare an emergency plan, it will be necessary for the dam break
analysis to provide:
Inundation maps at a scale sufficient to determine the extent of flooding in
relation to people at risk, properties and access routes
Identification of structures (bridges etc.) likely to be destroyed
Indication of main flow areas (damage potential of flow)
Timing of the arrival and peak of the flood wave

GMR Londa Hydro Power Pvt. Ltd. EMP of Talong Londa H.E. Project
R S Envirolink Technologies Pvt. Ltd. 11.3
Identification of features likely to affect mobility / evacuation during and after the
event including impact on infrastructure and the deposition and scour of debris
and sediment.
11.2.2 Development Control
Development control will focus mainly on the extent of possible inundation resulting
from different failure scenarios. Consideration may also be given to the
characteristics of the population at risk.
11.2.3 Insurance Companies
The aim of insurance companies will be to determine their exposure to risk through
identifying both the probability of failure and the financial impact of flooding. Modeling
and mapping will, therefore, need to be at accuracy sufficient to determine impact on
properties. An assessment of damage potential will also assist in impact assessment.
Therefore, it is the responsibility of the organizations involved with the safety of the
dams, to plan preventive measures so that in the eventuality of dam failure, the loss
can be minimized to the extent possible.
The dam failure study involves the following component steps:
Development or identification of the inflow hydrograph to the reservoir at the time
of failure.
Routing this hydrograph through the reservoirs,
Calculating the outflow hydrograph from the failed structure, and
Modeling the movement of the flood wave downstream to determine travel time,
maximum water level reached, inundated areas etc.
11.3 DAM BREAK MODEL The National Weather Service’s DAMBRK model developed by D.L. Fread has been
used in the present study. DAMBRK is used to develop the outflow hydrograph from
a dam and hydraulically route the flood through the downstream valley. The
governing equations are complete one dimensional Saint Venant equations of
unsteady flow coupled with internal boundary equations, representing rapidly varied
flow through structures (which may develop time dependent breach) and utilizes
external boundary equations at the u/s and d/s ends of the routing reach. The system
of equations is solved by a non-linear weighted 4-point implicit finite difference
method. The flow may be sub-critical or super-critical or combination of these each
varying in space and time from one to the other. Outflow hydrograph to be routed is
developed by the model using specified breach parameters. High water profiles along
the valley, Flood arrival times and hydrographs at user specified locations are
standard output.

GMR Londa Hydro Power Pvt. Ltd. EMP of Talong Londa H.E. Project
R S Envirolink Technologies Pvt. Ltd. 11.4
The model consists of two conceptual parts:
(1) Description of the dam failure mode i.e. temporal and geometrical description of
breach.
(2) A hydraulic computation algorithm for determining the time history of the
outflow through the breach as affected by the breach description, reservoir
inflow, reservoir storage characteristics, spillway outflows and d/s tail water
elevation for routing of the outflow hydrograph through the d/s valley. The
model also determines the resulting water surface elevations and flood wave
travel times.
11.4 METHODOLOGY DAMBRK model includes reservoir storage routing (level pool) to compute outflow
hydrograph from reservoir with sub-critical dynamic routing of outflow hydrograph
through entire length of d/s valley, tail water depth computed by Manning’s equation
applied to tail water section. In other words, this model simulates the failure of a dam,
computes the resultant outflow hydrograph and also simulates movement of the dam
break flood wave through the downstream river valley. The model is built around
three major capabilities, which are reservoir routing, breach simulation and river
routing. After computing the hydrograph of the reservoir outflow, the time of
occurrence of flooding in the downstream valley is determined by routing the outflow
hydrograph through the valley. The dynamic wave method based on the complete
equations of unsteady flow is the appropriate technique to route the dam break flood
hydrograph through the downstream valley.
11.5 STATEMENT OF THE PROBLEM
The computation of flood wave resulting from a dam breach basically involves solving
following problems:
(1) The outflow hydrograph from the reservoir.
(2) The routing of the flood wave downstream from the breached dam along the
river channel and the flow plain
(3) The flood hydrograph and water level at desired downstream location and its
lag with respect to inflow/ breach hydrograph at dam site.
In this case, the computation of the flood characteristics is divided into two distinct
phases: (a) the determination of outflow hydrograph (b) the routing of flood wave
downstream from the dam breach.
In this study, the problem of simulating the failure of Talong Londa H.E. Project is
considered, by computing the outflow hydrograph from the breached dam and routing
this hydrograph along the downstream channel using dynamic routing technique to
obtain the maximum water level marks reached during the passage of flood wave.

GMR Londa Hydro Power Pvt. Ltd. EMP of Talong Londa H.E. Project
R S Envirolink Technologies Pvt. Ltd. 11.5
The information regarding inflow hydrograph into the reservoir due to the storm at the
time of failure, the structural and the hydraulic characteristics details of the dam, the
channel cross sectional details, the maximum water level marks reached in the
reservoir at the time of failure and those observed in the downstream reach of the
dam due to the passage of flood wave etc. are available for the study. The following
three scenarios have been simulated in the present dam break study:
- Dam Break Simulation with impinging PMF
- Dam Break Simulation with impinging SPF
- Routing of PMF in NO DAM SCENARIO
11.6 DAM BREAK MODELING PROCESS
Generally, dam break modeling can be carried out by either i) scaled physical
hydraulic models, or ii) mathematical simulation using computer. A modern tool to
deal with this problem is the mathematical model, which is most cost effective and
reasonably solves the governing flow equations of continuity and momentum by
computer simulation.
Mathematical modeling of dam breach floods can be carried out by either one
dimensional analysis or two dimensional analyses. In one dimensional analysis, the
information about the magnitude of flood, i.e., discharge and water levels, variation of
these with time and velocity of flow through breach can be had in the direction of
flow. In the case of two dimensional analysis, the additional information about the
inundated area, variation of surface elevation and velocities in two dimension can
also be assessed.
One dimensional analysis is generally accepted, when valley is long and narrow and
the flood wave characteristics over a large distance from the dam are of main
interest. On the other hand, when the valley widens considerably downstream of dam
and large area is likely to be flooded, two dimensional analysis is necessary. In the
instant case, narrow and the flood wave characteristics over a distance from the dam
are of main interest, one dimensional modeling was adopted.
11.6.1 Hydrodynamic Modeling
The essence of dam break modeling is hydrodynamic modeling, which involves
finding solution of two partial differential equations originally derived by Barre De
Saint Venant in 1871. The equations are:
i. Conservation of mass (continuity) equation
(∂Q/∂X) + ∂ (A + A0) / ∂t - q = 0
ii. Conservation of momentum equation
(∂Q/∂t) + { ∂(Q2/A)/∂X } + g A ((∂h/∂X ) + Sf + Sc ) = 0
GMR Londa Hydro Power Pvt. Ltd. EMP of Talong Londa H.E. Project
R S Envirolink Technologies Pvt. Ltd. 11.6
where, Q = discharge;
A = active flow area;
A0 = inactive storage area;
h = water surface elevation;
q= lateral outflow;
x = distance along waterway;
t = time;
Sf = friction slope;
Sc = expansion contraction slope and
g = gravitational acceleration.
The following three approaches simulate branches as well as looped systems.
i) Kinematic wave approach: The flow is calculated from the assumption of balance
between the friction and gravity forces. The simplification implies that the
Kinematic wave approach cannot simulate backwater effects.
ii) Diffusive wave approach: In addition to the friction and gravity forces, the
hydrostatic gradient is included in this description. This allows the user to take
downstream boundaries into account, and thus, simulate backwater effects.
iii) Dynamic wave approach: Using the full momentum equation, including
acceleration forces, the user is able to simulate fast transients, tidal flows, etc., in
the system.
Depending on the type of problem, the appropriate description can be generally,
model boundaries should be chosen at points, where either water level or discharge
measurements are available so that the model is used for predictive purposes. It is
important that the selected boundary locations lie outside the range of influences of
any anticipated changes in the hydraulic system.
11.6.2 Description of Reservoir and Appurtenant Structures Reservoir
To obtain an accurate description of the reservoir storage characteristics, the
reservoir is normally modeled as a single h-point in the model. This will usually
correspond to the upstream boundary of the model, where also the inflow hydrograph
is specified.
The description of the reservoir storage is entered in the processed data. The
surface storage area of the dam is described as a function of the water level and it is
entered as additional flooded area. The lowest water level given for the reservoir
should be somewhere below the final breach elevation of the dam.

GMR Londa Hydro Power Pvt. Ltd. EMP of Talong Londa H.E. Project
R S Envirolink Technologies Pvt. Ltd. 11.7
The cross-sectional area is set to a large finite value and is used only for calculating
the inflow head loss into the breach. The inflow head loss can be calculated as:
∆H = (Vs2 /2g) Ci [1-(As / Ares )]
Where, Vs = Velocity through the breach
Ci = Inflow head loss coefficient
As = Flow area through the breach, and
Ares = Cross-sectional area of the reservoir
In order to obtain a reasonable head loss description it is only necessary that Ares >>
As so that [1-(As /Ares)] = 1. The hydraulic radius is set to any non-zero value.
The total surface area of the reservoir is calculated as:
A total = b.2∆x + Additional flooded area
Since the total surface area is already described by the additional flooded area, the
first term should be equal to zero. Therefore, the width b should be set to zero.
Dam
At the Q point, where the dam break structure is located, the momentum equation is
replaced by an equation, which describes the flow through the structure. As the
momentum equation is not used at the Q point, the ∆x – step is of no relevance. The
maximum ∆x for the river branch, where the dam is to be placed should, therefore, be
greater than the distance between two cross-sections in the reservoir branch, so that
no cross-section is interpolated between the actual cross-sections.
11.6.3 Boundary Conditions for Dam Break Modeling
The boundary conditions must be specified at both upstream and downstream limits
of the model. The upstream boundary will generally be an inflow into the reservoir at
the first reservoir. The downstream boundary will generally be a stage-discharge
relationship at the last cross section of the set up.
11.6.4 Specifications of Dam Break Structures
The following information relating to dam break structures need to be specified:
(i) Geometrical specifications
(ii) Breach characteristics
(iii) Failure moment, and
(iv) Failure mode

GMR Londa Hydro Power Pvt. Ltd. EMP of Talong Londa H.E. Project
R S Envirolink Technologies Pvt. Ltd. 11.8
11.6.5 Geometrical Specifications
The geometrical specifications for the dam break structure are taken from the
longitudinal and cross-sections of the dam.
11.6.6 Breach Characteristics
Breach characteristics, such as, breach development period, breach section profile,
etc. are very vital for dam break modeling, but at the same time very difficult to
predict. Past experiences provide clue for reasonable assessment of breach
characteristics. A range of possible values for failure time of concrete gravity dam
given by USACE is 0.1 to 0.5 hr. The breach development period may vary between
a few minutes up to a few hours, depending on amongst other, the dam geometry
and the construction material. The development of the breach determines the breach
outflow hydrograph, and an accurate description of the breach development is,
therefore, required in “near field” dam breach studies. In the “far-field” studies, an
accurate flood routing procedure is of more importance, because the outflow
variation is rapidly damped out as the flood propagates downstream.
11.6.7 Failure Moment
Like breach characteristics, prediction of failure moment is also very difficult. The
time of occurrence of failure depends on stress concentration due to structural
inconsistency, material properties, water level in the reservoir, etc. Since, no
information is generally available about stress concentration, it is quite reasonable to
assume that failure of the dam will get initiated when water level in the reservoir is at
maximum.
11.7 OVERVIEW OF THE PROJECT
The Talong Londa H.E. Project envisages the construction of a 104 m (from deepest
foundation level) high Concrete Gravity Dam. Relevant features of the Project are
given below:
HYDROLOGY Catchment area at Dam Site 2814 sq km Probable Maximum Flood Discharge (PMF) 16891 Cumec DAM AND APPURTENANT STRUCTURES DAM Type Concrete Gravity Length of dam at top 253 m Spillway Crest Level: 443 m Top level of Dam 490 m FRL 488.00 mStretch of Reservoir 12.8 km Spillway Gates No. & Size of bay 7 Nos. Sluices 9.25 m (W) x 14.9
m (H)

GMR Londa Hydro Power Pvt. Ltd. EMP of Talong Londa H.E. Project
R S Envirolink Technologies Pvt. Ltd. 11.9
1 no. Ogee 4m (W) x 4 m (H) POWERHOUSE Type Surface; Dam Toe Size 59.97 m (L) x 21 m (W) x 47 m (H) Number of units 3 Design Discharge 349.23 m3/s
11.8 INPUT DATA AND MODEL SET-UP 11.8.1 Input Data Requirement
Dam break flood analysis requires a range of data to depict accurately to the extent
possible the topography and hydraulic conditions of the river course and dam break
phenomenon. The important data required are:
(i) Cross sections of the river from dam site and up to location downstream of the
dam to which the study is required
(ii) Elevation-Volume relationship of the reservoir
(iii) Rating curve of spillway and sluices
(iv) Salient features of the all hydraulic structures at the dam site and also in the
study reach of the river
(v) Design flood hydrograph
(vi) Stage-discharge relationship at the last river cross section of the study area
(vii) Manning’s roughness coefficient for different reaches of the river under study
(viii) Rating curve of all the hydraulic structures in the study reach of the river
Where the dam break analysis includes an assessment of potential impact and is
combined with the development of an emergency action plan, then additional data
relating to the social and economic development of the area will also be required.
Spillway
The rating curve of the spillway is given in Table 11.2 while for spillway, dimensions
and crest elevation have been given above and in model.
Table 11.1: Elevation-Volume relationship of the reservoir
S No Elevation Area Capacity Capacity
Remarks m km2 Ha-m Mcum
1 413.00 0.00 0.00 0.00 2 420.00 3.13 0.00 0.00 3 425.00 12.50 100.00 1.00 4 430.00 28.13 200.00 2.00 5 435.00 46.88 400.00 4.00 6 440.00 65.63 600.00 6.00 7 445.00 81.25 1000.00 10.00

GMR Londa Hydro Power Pvt. Ltd. EMP of Talong Londa H.E. Project
R S Envirolink Technologies Pvt. Ltd. 11.10
8 450.00 100.00 1500.00 15.00 9 455.00 125.00 2100.00 21.00
10 460.00 146.88 2700.00 27.00 11 465.00 175.00 3500.00 35.00 12 470.00 203.13 4400.00 44.00 13 475.00 234.38 5500.00 55.00 14 480.00 268.75 6800.00 68.00 15 485.00 315.63 8300.00 83.00 16 486.00 326.50 8600.00 86.00 17 486.80 334.50 8840.00 88.40 M.D.D.L. 18 487.00 336.50 8900.00 89.00 19 488.00 347.00 9250.00 92.50 F.R.L. 20 489.00 358.00 9613.00 96.13 21 490.00 371.88 10000.00 100.00 22 495.00 434.38 12000.00 120.00 23 500.00 496.88 14300.00 143.00
11.8.2 Design Flood Hydrograph
Dam of the Project can be considered as large dam, hence the Probable Maximum
Flood (PMF) hydrograph has been used as design flood hydrograph for the upstream
boundary of the dam break model set up. The PMF, which has been applied at the
reservoir branch in the model set up, is given in Table 11.3.
Table 11.2: Discharge Capacity through spillway
Gate Opening in m
Discharge in m3/sec
1 1455.0 2 2896.6 3 4324.7 4 5738.95 7139.2 6 8525.3 7 9897.18 11254.2 9 12596.6
10 13923.9 11 15235.9 12 16532.5 13 17813.3 14 19078.20
14.9 20202.72

GMR Londa Hydro Power Pvt. Ltd. EMP of Talong Londa H.E. Project
R S Envirolink Technologies Pvt. Ltd. 11.11
Table 11.3: Design Flood Hydrograph (PMF)
Time Baseflow Total Time Baseflow Total
(hours) (cumecs) (cumecs) (hours) (cumecs) (cumecs)
0 140 141 32 140 11804
1 140 143 33 140 10369
2 140 150 34 140 9085
3 140 166 35 140 7998
4 140 192 36 140 7093
5 140 236 37 140 6307
6 140 304 38 140 5614
7 140 431 39 140 4979
8 140 648 40 140 4391
9 140 942 41 140 3828
10 140 1289 42 140 3286
11 140 1688 43 140 2775
12 140 2141 44 140 2291
13 140 2672 45 140 1854
14 140 3267 46 140 1467
15 140 3768 47 140 1122
16 140 4071 48 140 817
17 140 4236 49 140 570
18 140 4389 50 140 379
19 140 4802 51 140 258
20 140 5636 52 140 195
21 140 6804 53 140 162
22 140 8169 54 140 146
23 140 9715 55 140 141
24 140 11432 56 140 141
25 140 13316 57 140 141
26 140 15226 58 140 141
27 140 16544 59 140 141
28 140 16835 60 140 141
29 140 16167 61 140 141
30 140 14871 62 140 141
31 140 13336 63 140 141
The study has been carried out in case dam break simulation by impinging SPF as well. The
SPF considered is given below:
SPF TALONG
HR ordinate
0 141 1 163

GMR Londa Hydro Power Pvt. Ltd. EMP of Talong Londa H.E. Project
R S Envirolink Technologies Pvt. Ltd. 11.12
2 206 3 279 4 397 5 579 6 856 7 1253 8 1750
9 2277
10 2806
11 3313
12 3818
13 4369 14 4932 15 5442 16 5855 17 6196 18 6569 19 7105 20 7835 21 8667 22 9546 23 10414 24 11295 25 12157 26 12938 27 13454 28 13545 29 13153 30 12329 31 11228 32 10041 33 8972 34 8052 35 7264 36 6568 37 5932 38 5337 39 4782 40 4265 41 3783 42 3328 43 2893

GMR Londa Hydro Power Pvt. Ltd. EMP of Talong Londa H.E. Project
R S Envirolink Technologies Pvt. Ltd. 11.13
44 2476 45 2084 46 1721 47 1389 48 1093 49 832 50 604 51 423 52 290 53 207 54 159 55 141 56 141 57 141 58 141 59 141 60 141 61 141 62 141 63 141
11.9 DAM BREAK SIMULATION 11.9.1 Selection of Dam Breach Parameters
Prediction of the dam breach parameters and timing of the breach are very important
for any dam break study, but they are extremely difficult to predict. However,
assuming the dam fails, the important aspects to deal with are, time of failure, extent
of overtopping before failure, size, shape and time of the breach formation.
Estimation of the dam break flood will depend on these parameters.
The breach characteristics that are needed as input to the existing dam break models
are i) Initial and final breach width and level; ii) Shape of the breach; iii) Time duration
of breach development, and iv) Reservoir level at time of start of breach. The
predominant mechanism of breach formation is, to a large extent, dependent on the
type of dam and the cause due to which the dam failed.
11.9.2 Critical Condition for Dam Break Study
The critical condition for a dam break study is when the reservoir is full and design
flood hydrograph (PMF) is impinged. Accordingly, in the present study keeping the
reservoir at full level of 488 m, the PMF has been impinged keeping all the spillway
gates fully open. The maximum water level reached in the reservoir is 490 m, after
the application of PMF. It is reasonable to assume that the dam will breach when the
water level in the reservoir is at this maximum level.

GMR Londa Hydro Power Pvt. Ltd. EMP of Talong Londa H.E. Project
R S Envirolink Technologies Pvt. Ltd. 11.14
Also for various comparisons, different scenarios like impinging SPF in dam break
simulation and routing of only PMF assuming NO DAM scenario have also been
worked out.
The following parameters have been considered for breach
Breach parameters considered The Breach width considered is at weakest section of the dam at elevation 465.5 m
because presence of gallery and power intake at that part of dam section.
Reservoir level at time when breach occurs 490 m (top of dam)
Time to failure – 0.25 hr as this is concrete dam where failure occurs instantaneously
Breach width – 70 m
Bottom of breach – 465.5 m
Slope of breach – vertical because of concrete dam
Model reach –about 37 km from proposed dam site
(Refer upstream elevation view; Figure 11.1) 11.10 ASSUMPTIONS
As in the case of any other modeling process, dam break modeling has inherent
approximations through assumptions. The foremost assumptions are in the
hydrodynamic equations (Saint Venant equations), which are further derived on the
basis of the following assumptions:
(1) The water is incompressible and homogeneous i.e. without significant variation in
density.
(2) The bottom slope is small.
(3) The wave lengths are large compared to the water depth. This ensures that the
flow everywhere can be regarded as having a direction parallel to the bottom, i.e.,
vertical accelerations can be neglected and a hydrostatic pressure variation along
the vertical can be assumed.
(4) The flow is super-critical in upper reach and sub-critical in lower most.
The other assumptions are associated with the breach parameters, especially,
breach width and breach depth, which has great impact on flood peak and arrival
times. Further, the high velocity flows associated with dam break floods can cause
significant scour of channels due to bed as well as bank erosion. This enlargement in
channel cross sections is neglected due to limitations in modeling such a complicated

GMR Londa Hydro Power Pvt. Ltd. EMP of Talong Londa H.E. Project
R S Envirolink Technologies Pvt. Ltd. 11.15
Figure 11.1 Upstream Elevation View of Dam

GMR Londa Hydro Power Pvt. Ltd. EMP of Talong Londa H.E. Project
R S Envirolink Technologies Pvt. Ltd. 11.16
physical process. Moreover, this limitation has an effect on the conservative side
only.
Dam break floods create a large amount of transported debris. This may accumulate at
constricted cross sections, where it acts as a temporary dam and partially or completely
restricts the flow, resulting variation in water level at the downstream locations. This
aspect has also been neglected due to limitations in modeling of such a complicated
physical process. This limitation also has an effect on the conservative side only.
Even with the assumptions outlined above, dam break modelling serves very useful
purpose, as it provides reasonable extent of inundation under different situations
enabling preparation of Emergency Action Plan / Disaster Management Plan.
11.11 DISCUSSIONS ON RESULTS
The DAMBRK results consist of following important tables and profiles:
i. Reservoir depletion table
(It includes the outflow hydrograph at dam site)
ii. Water surface and discharge profile from dam site to desired location (up to
approx 37 km in this case)
iii. Flood level at desired locations
iv. Time lag between time of maximum breach at dam site and at desired
locations.
11.11.1 Dam Break Study for Design Flood Hydrograph
In the model the dam is made to breach at the time when inflow reaches PMF (16891
cumec). The study involves determination of the flood flow from the dam due to its
breach, and routing the same along the river channel on the downstream, to estimate
the maximum flood levels at various locations on the downstream. These variations
are shown in at Table 11.4.
The following table gives the maximum elevation, maximum flow, time to maximum
elevation and maximum velocity at various distances downstream of the dam up 37
km downstream of dam.
Table 11.4: Profile of crests and times due to breach for river below dam Distance
from Dam (km)
Max Elevation
(m)
Maximum Flow
(cumec)
Time to Max Flow (hr)
Max Velocity
(m/s)
0.05 439.66 25219 0.525 9.27 0.15 439.99 25054 0.512 5.67 0.25 440.07 24971 0.5 4.35
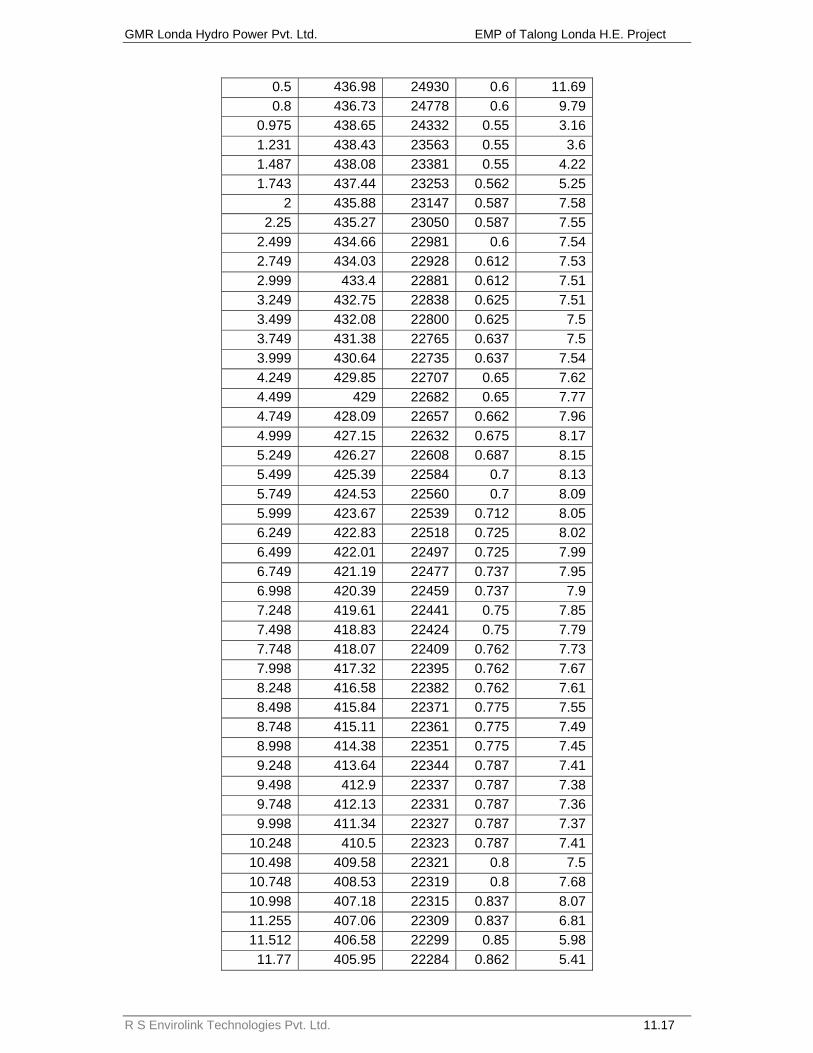
GMR Londa Hydro Power Pvt. Ltd. EMP of Talong Londa H.E. Project
R S Envirolink Technologies Pvt. Ltd. 11.17
0.5 436.98 24930 0.6 11.69 0.8 436.73 24778 0.6 9.79
0.975 438.65 24332 0.55 3.16 1.231 438.43 23563 0.55 3.6 1.487 438.08 23381 0.55 4.22 1.743 437.44 23253 0.562 5.25
2 435.88 23147 0.587 7.58 2.25 435.27 23050 0.587 7.55
2.499 434.66 22981 0.6 7.54 2.749 434.03 22928 0.612 7.53 2.999 433.4 22881 0.612 7.51 3.249 432.75 22838 0.625 7.51 3.499 432.08 22800 0.625 7.5 3.749 431.38 22765 0.637 7.5 3.999 430.64 22735 0.637 7.54 4.249 429.85 22707 0.65 7.62 4.499 429 22682 0.65 7.77 4.749 428.09 22657 0.662 7.96 4.999 427.15 22632 0.675 8.17 5.249 426.27 22608 0.687 8.15 5.499 425.39 22584 0.7 8.13 5.749 424.53 22560 0.7 8.09 5.999 423.67 22539 0.712 8.05 6.249 422.83 22518 0.725 8.02 6.499 422.01 22497 0.725 7.99 6.749 421.19 22477 0.737 7.95 6.998 420.39 22459 0.737 7.9 7.248 419.61 22441 0.75 7.85 7.498 418.83 22424 0.75 7.79 7.748 418.07 22409 0.762 7.73 7.998 417.32 22395 0.762 7.67 8.248 416.58 22382 0.762 7.61 8.498 415.84 22371 0.775 7.55 8.748 415.11 22361 0.775 7.49 8.998 414.38 22351 0.775 7.45 9.248 413.64 22344 0.787 7.41 9.498 412.9 22337 0.787 7.38 9.748 412.13 22331 0.787 7.36 9.998 411.34 22327 0.787 7.37
10.248 410.5 22323 0.787 7.41 10.498 409.58 22321 0.8 7.5 10.748 408.53 22319 0.8 7.68 10.998 407.18 22315 0.837 8.07 11.255 407.06 22309 0.837 6.81 11.512 406.58 22299 0.85 5.98
11.77 405.95 22284 0.862 5.41

GMR Londa Hydro Power Pvt. Ltd. EMP of Talong Londa H.E. Project
R S Envirolink Technologies Pvt. Ltd. 11.18
12.027 405.26 22267 0.875 4.99 12.284 404.54 22246 0.887 4.67 12.542 403.81 22222 0.9 4.42 12.799 403.09 22196 0.925 4.21 13.056 402.37 22167 0.95 4.03 13.314 401.66 22135 0.975 3.87 13.571 400.96 22098 1.012 3.73 13.829 400.57 22052 2.25 3.6 14.086 400.3 21990 2.35 3.47 14.343 400.1 21894 2.413 3.34 14.601 399.96 21744 2.45 3.17 14.858 399.85 21514 2.475 2.97 15.115 399.78 21185 2.488 2.72 15.373 399.72 20745 2.5 2.43 15.631 399.67 20210 2.5 2.3
15.89 399.63 19609 2.513 2.17 16.149 399.59 18956 2.513 2.04 16.408 399.55 18289 2.513 1.91 16.667 399.52 17690 2.513 1.78 16.925 399.48 17320 2.513 1.69 17.184 399.45 17190 2.525 1.62 17.443 399.41 17113 2.525 1.6 17.702 399.37 17063 2.525 1.62 17.961 399.31 17031 2.525 1.71
18.22 399.23 17011 2.525 1.87 18.478 399.1 16998 2.525 2.2 18.737 398.83 16990 2.538 2.87 18.996 397.97 16985 2.563 4.69 19.246 397.66 16982 2.563 4.74 19.496 397.35 16979 2.575 4.79 19.746 397.03 16976 2.575 4.85 19.996 396.7 16974 2.588 4.92 20.246 396.35 16971 2.588 5 20.496 396 16969 2.6 5.07 20.746 395.63 16967 2.6 5.16 20.995 395.25 16965 2.613 5.25 21.245 394.85 16963 2.625 5.35 21.495 394.43 16961 2.625 5.46 21.745 393.98 16959 2.638 5.57 21.995 393.52 16957 2.65 5.7 22.245 393.02 16955 2.663 5.85 22.495 392.48 16954 2.663 6.01 22.745 391.89 16952 2.688 6.2 22.995 391.25 16950 2.7 6.42 23.245 390.73 16949 2.713 6.41 23.495 390.22 16947 2.725 6.4

GMR Londa Hydro Power Pvt. Ltd. EMP of Talong Londa H.E. Project
R S Envirolink Technologies Pvt. Ltd. 11.19
23.745 389.72 16945 2.738 6.39 23.995 389.22 16943 2.75 6.37 24.245 388.73 16941 2.775 6.36 24.495 388.24 16939 2.788 6.34 24.745 387.76 16937 2.8 6.32 24.995 387.29 16934 2.813 6.3 25.245 386.82 16932 2.825 6.28 25.494 386.36 16930 2.838 6.26 25.744 385.91 16927 2.85 6.23 25.994 385.47 16925 2.875 6.2 26.244 385.04 16922 2.888 6.16 26.494 384.63 16919 2.9 6.12 26.744 384.22 16916 2.913 6.08 26.994 383.82 16914 2.938 6.04 27.244 383.43 16911 2.95 5.99 27.494 383.06 16908 2.963 5.94 27.744 382.7 16905 2.975 5.88 27.994 382.35 16902 2.988 5.83 28.244 382.02 16898 3 5.76 28.494 381.7 16895 3.013 5.7 28.744 381.39 16892 3.025 5.63 28.994 381.09 16889 3.038 5.56 29.244 380.83 16886 3.05 5.45 29.494 380.58 16882 3.05 5.34 29.744 380.33 16879 3.063 5.24 29.994 380.09 16876 3.075 5.14 30.243 379.86 16872 3.075 5.05 30.493 379.63 16869 3.088 4.96 30.743 379.41 16866 3.1 4.87 30.993 379.2 16862 3.1 4.78 31.243 378.99 16859 3.113 4.69 31.493 378.79 16855 3.113 4.61 31.743 378.59 16852 3.113 4.52 31.993 378.41 16849 3.113 4.44 32.243 378.23 16845 3.125 4.36 32.493 378.05 16842 3.138 4.29 32.743 377.88 16839 3.138 4.21 32.993 377.72 16837 3.138 4.13 33.243 377.5 16834 3.15 4.2 33.493 377.26 16832 3.15 4.27 33.743 377.01 16829 3.15 4.35 33.993 376.75 16827 3.175 4.43 34.243 376.47 16825 3.175 4.52 34.493 376.17 16823 3.163 4.61 34.742 375.86 16822 3.163 4.71 34.992 375.52 16820 3.188 4.82

GMR Londa Hydro Power Pvt. Ltd. EMP of Talong Londa H.E. Project
R S Envirolink Technologies Pvt. Ltd. 11.20
35.242 375.16 16819 3.188 4.94 35.492 374.76 16818 3.175 5.07 35.742 374.34 16816 3.213 5.22 35.992 373.87 16816 3.2 5.38 36.242 373.34 16815 3.238 5.57 36.492 372.75 16814 3.225 5.8 36.742 372.06 16814 3.213 6.08 36.992 371.22 16813 3.25 6.45
Profile of maximum elevation, maximum flow, time to maximum elevation and
maximum velocity at various distances downstream of the dam up 37 km
downstream of dam in case of SPF are given in Table 11.5 below:
Table 11.5: Profile of crests and times in case of SPF for river below dam
Distance from Dam
(km)
Max Elevation
(m)
Maximum Flow
(cumec)
Time to Max Flow (hr)
Max Velocity
(m/s)
0.05 439.01 24451 0.475 9.22 0.15 439.34 24275 0.475 5.6 0.25 439.42 24180 0.475 4.28
0.5 436.35 24150 0.55 11.47 0.8 436.18 24005 0.55 9.6
0.975 438.03 23581 0.5 3.1 1.231 437.82 22820 0.5 3.54 1.487 437.47 22430 0.512 4.17 1.743 436.84 22310 0.512 5.19
2 435.29 22205 0.537 7.49 2.25 434.69 22106 0.55 7.47
2.499 434.07 22011 0.55 7.46 2.749 433.45 21921 0.562 7.45 2.999 432.81 21842 0.562 7.43 3.249 432.16 21781 0.575 7.43 3.499 431.49 21734 0.575 7.42 3.749 430.8 21692 0.587 7.42 3.999 430.06 21655 0.587 7.46 4.249 429.28 21621 0.6 7.54 4.499 428.43 21590 0.612 7.69 4.749 427.52 21560 0.612 7.88 4.999 426.57 21528 0.625 8.09 5.249 425.68 21496 0.637 8.07 5.499 424.8 21467 0.65 8.04 5.749 423.94 21438 0.65 8.01 5.999 423.09 21410 0.662 7.97 6.249 422.25 21383 0.675 7.92 6.499 421.43 21358 0.675 7.89
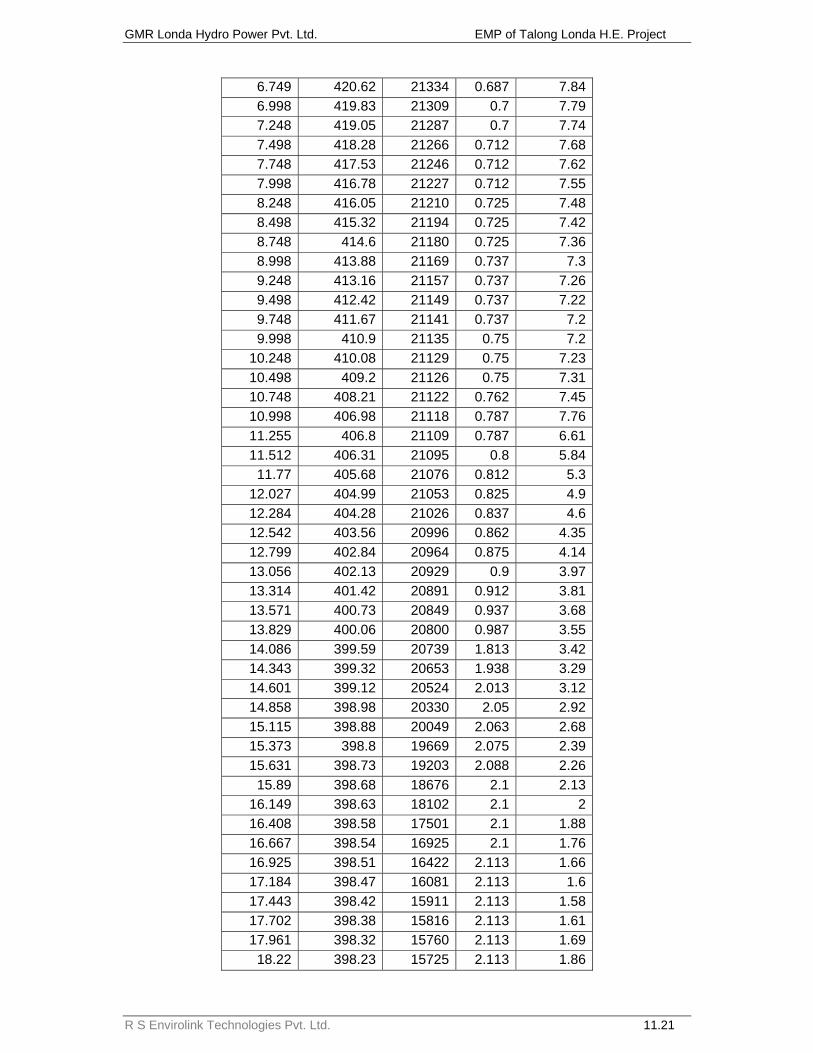
GMR Londa Hydro Power Pvt. Ltd. EMP of Talong Londa H.E. Project
R S Envirolink Technologies Pvt. Ltd. 11.21
6.749 420.62 21334 0.687 7.84 6.998 419.83 21309 0.7 7.79 7.248 419.05 21287 0.7 7.74 7.498 418.28 21266 0.712 7.68 7.748 417.53 21246 0.712 7.62 7.998 416.78 21227 0.712 7.55 8.248 416.05 21210 0.725 7.48 8.498 415.32 21194 0.725 7.42 8.748 414.6 21180 0.725 7.36 8.998 413.88 21169 0.737 7.3 9.248 413.16 21157 0.737 7.26 9.498 412.42 21149 0.737 7.22 9.748 411.67 21141 0.737 7.2 9.998 410.9 21135 0.75 7.2
10.248 410.08 21129 0.75 7.23 10.498 409.2 21126 0.75 7.31 10.748 408.21 21122 0.762 7.45 10.998 406.98 21118 0.787 7.76 11.255 406.8 21109 0.787 6.61 11.512 406.31 21095 0.8 5.84
11.77 405.68 21076 0.812 5.3 12.027 404.99 21053 0.825 4.9 12.284 404.28 21026 0.837 4.6 12.542 403.56 20996 0.862 4.35 12.799 402.84 20964 0.875 4.14 13.056 402.13 20929 0.9 3.97 13.314 401.42 20891 0.912 3.81 13.571 400.73 20849 0.937 3.68 13.829 400.06 20800 0.987 3.55 14.086 399.59 20739 1.813 3.42 14.343 399.32 20653 1.938 3.29 14.601 399.12 20524 2.013 3.12 14.858 398.98 20330 2.05 2.92 15.115 398.88 20049 2.063 2.68 15.373 398.8 19669 2.075 2.39 15.631 398.73 19203 2.088 2.26
15.89 398.68 18676 2.1 2.13 16.149 398.63 18102 2.1 2 16.408 398.58 17501 2.1 1.88 16.667 398.54 16925 2.1 1.76 16.925 398.51 16422 2.113 1.66 17.184 398.47 16081 2.113 1.6 17.443 398.42 15911 2.113 1.58 17.702 398.38 15816 2.113 1.61 17.961 398.32 15760 2.113 1.69
18.22 398.23 15725 2.113 1.86

GMR Londa Hydro Power Pvt. Ltd. EMP of Talong Londa H.E. Project
R S Envirolink Technologies Pvt. Ltd. 11.22
18.478 398.1 15704 2.125 2.18 18.737 397.84 15691 2.125 2.85 18.996 397 15684 2.15 4.63 19.246 396.7 15680 2.15 4.67 19.496 396.38 15675 2.163 4.72 19.746 396.07 15671 2.163 4.78 19.996 395.74 15667 2.175 4.84 20.246 395.4 15663 2.188 4.91 20.496 395.05 15660 2.188 4.98 20.746 394.68 15657 2.2 5.06 20.995 394.3 15654 2.2 5.15 21.245 393.91 15651 2.213 5.24 21.495 393.49 15648 2.225 5.34 21.745 393.05 15645 2.225 5.46 21.995 392.59 15643 2.238 5.58 22.245 392.1 15641 2.25 5.72 22.495 391.56 15638 2.263 5.88 22.745 390.98 15636 2.275 6.06 22.995 390.34 15633 2.288 6.28 23.245 389.82 15631 2.3 6.28 23.495 389.3 15628 2.325 6.27 23.745 388.8 15626 2.338 6.26 23.995 388.29 15623 2.35 6.24 24.245 387.79 15620 2.363 6.23 24.495 387.3 15617 2.375 6.22 24.745 386.82 15614 2.4 6.2 24.995 386.34 15611 2.413 6.18 25.245 385.87 15608 2.425 6.16 25.494 385.41 15604 2.438 6.13 25.744 384.96 15601 2.463 6.1 25.994 384.51 15597 2.475 6.07 26.244 384.08 15593 2.488 6.04 26.494 383.66 15589 2.513 6 26.744 383.25 15585 2.525 5.96 26.994 382.85 15581 2.538 5.91 27.244 382.47 15577 2.55 5.87 27.494 382.1 15572 2.563 5.81 27.744 381.74 15568 2.588 5.76 27.994 381.39 15564 2.6 5.7 28.244 381.06 15559 2.613 5.63 28.494 380.74 15555 2.625 5.56 28.744 380.44 15550 2.638 5.49 28.994 380.15 15545 2.65 5.42 29.244 379.88 15541 2.663 5.31 29.494 379.63 15536 2.663 5.21 29.744 379.39 15531 2.675 5.11

GMR Londa Hydro Power Pvt. Ltd. EMP of Talong Londa H.E. Project
R S Envirolink Technologies Pvt. Ltd. 11.23
29.994 379.15 15526 2.688 5.01 30.243 378.91 15521 2.688 4.92 30.493 378.69 15516 2.7 4.83 30.743 378.47 15511 2.7 4.74 30.993 378.25 15506 2.713 4.66 31.243 378.05 15502 2.725 4.57 31.493 377.85 15497 2.725 4.49 31.743 377.65 15492 2.725 4.41 31.993 377.46 15488 2.738 4.33 32.243 377.28 15483 2.75 4.25 32.493 377.11 15479 2.75 4.17 32.743 376.94 15475 2.763 4.09 32.993 376.78 15471 2.763 4.02 33.243 376.56 15468 2.763 4.08 33.493 376.33 15465 2.763 4.15 33.743 376.08 15461 2.763 4.23 33.993 375.83 15459 2.775 4.31 34.243 375.55 15456 2.775 4.4 34.493 375.26 15453 2.775 4.49 34.742 374.95 15451 2.8 4.59 34.992 374.62 15448 2.8 4.69 35.242 374.26 15446 2.788 4.81 35.492 373.87 15444 2.788 4.94 35.742 373.44 15443 2.813 5.08 35.992 372.98 15442 2.813 5.25 36.242 372.45 15441 2.8 5.44 36.492 371.86 15441 2.838 5.67 36.742 371.17 15439 2.875 5.96 36.992 370.32 15439 2.863 6.34
Profile of maximum elevation, maximum flow, time to maximum elevation and
maximum velocity at various distances downstream of the dam up 37 km
downstream of dam location in case of only PMF (NO DAM SCENARIO) are given in
Table 11.6 below:
Table 11.6: Profile of crests and times in case of PMF for river below dam location
Distance
from Dam (km)
Max Elevation
(m)
Maximum Flow
(cumec)
Time to Max Flow (hr)
Max Velocity
(m/s)
0.05 436.08 16834 28 14.490.15 436.13 16845 28 5.64
0.245 436.26 16855 28 3.320.5 433.67 16871 28 7.570.8 433.61 16867 28 38

GMR Londa Hydro Power Pvt. Ltd. EMP of Talong Londa H.E. Project
R S Envirolink Technologies Pvt. Ltd. 11.24
0.975 435.07 16863 28 2.331.231 434.89 16856 28 2.771.487 434.6 16849 28 3.391.743 434.04 16844 28 4.33
2 432.65 16840 28 6.222.25 432.05 16836 28 6.24
2.499 431.45 16833 28 6.262.749 430.83 16830 28 6.292.999 430.21 16827 28 6.323.249 429.57 16824 28 6.363.499 428.92 16821 28 6.413.749 428.24 16818 28 6.483.999 427.54 16815 28 6.564.249 426.78 16812 28 6.694.499 425.97 16810 28 6.864.749 425.08 16807 28 7.054.999 424.11 16804 28 7.255.249 423.24 16802 28 7.255.499 422.39 16799 28 7.255.749 421.55 16797 28 7.245.999 420.73 16794 28 7.226.249 419.92 16792 28 7.196.499 419.13 16790 28 7.166.749 418.36 16787 28 7.126.998 417.6 16785 28 7.077.248 416.85 16782 28 7.027.498 416.12 16780 28 6.977.748 415.4 16778 28 6.917.998 414.7 16775 28 6.858.248 414 16773 28 6.798.498 413.32 16770 28 6.738.748 412.63 16768 28 6.688.998 411.96 16766 28 6.629.248 411.28 16763 28 6.579.498 410.6 16761 28 6.539.748 409.92 16759 28 6.59.998 409.22 16756 28 6.48
10.248 408.5 16754 28 6.4710.498 407.76 16752 28 6.4810.748 406.97 16750 28 6.5210.998 406.11 16748 28 6.6111.255 405.78 16746 28 5.8111.512 405.27 16744 28 5.22
11.77 404.67 16740 28 4.7912.027 404.02 16735 28 4.4512.284 403.36 16730 28 4.18

GMR Londa Hydro Power Pvt. Ltd. EMP of Talong Londa H.E. Project
R S Envirolink Technologies Pvt. Ltd. 11.25
12.542 402.7 16722 28 3.9512.799 402.05 16714 28 3.7513.056 401.41 16702 29.4 3.6713.314 400.88 16687 29.4 3.6113.571 400.4 16667 29.4 3.5313.829 400 16639 29.4 3.4814.086 399.67 16600 29.4 3.4114.343 399.42 16550 29.4 3.3214.601 399.23 16485 29.4 3.2114.858 399.09 16405 29.4 3.0915.115 398.99 16310 29.4 2.9815.373 398.92 16199 29.4 2.8515.631 398.85 16077 29.4 2.84
15.89 398.79 16001 29.4 2.8316.149 398.74 15978 29.4 2.8216.408 398.7 15955 29.4 2.8116.667 398.66 15931 29.4 2.7916.925 398.62 15908 29.4 2.7717.184 398.58 15889 29.4 2.7517.443 398.54 15872 29.4 2.7217.702 398.49 15857 29.4 2.7117.961 398.43 15843 29.4 2.69
18.22 398.35 15830 29.4 2.6618.478 398.22 15821 29.4 2.6618.737 397.95 15814 29.4 2.7618.996 397.11 15809 29.4 4.5619.246 396.81 15806 29.4 4.6119.496 396.5 15803 29.4 4.6819.746 396.18 15799 29.4 4.7419.996 395.85 15796 29.4 4.8120.246 395.51 15793 29.4 4.8820.496 395.15 15790 29.4 4.9620.746 394.79 15787 29.4 5.0420.995 394.41 15784 29.4 5.1321.245 394.01 15781 29.4 5.2321.495 393.6 15778 29.4 5.3321.745 393.16 15775 29.4 5.4521.995 392.69 15772 29.4 5.5722.245 392.2 15769 29.4 5.7122.495 391.67 15766 29.4 5.8722.745 391.09 15763 29.4 6.0522.995 390.44 15760 29.4 6.2723.245 389.92 15757 29.4 6.2623.495 389.41 15754 29.4 6.2423.745 388.9 15751 29.4 6.2323.995 388.4 15748 29.4 6.22

GMR Londa Hydro Power Pvt. Ltd. EMP of Talong Londa H.E. Project
R S Envirolink Technologies Pvt. Ltd. 11.26
24.245 387.9 15745 29.4 6.224.495 387.41 15742 29.4 6.1824.745 386.93 15738 29.4 6.1624.995 386.45 15735 29.4 6.1425.245 385.98 15732 29.4 6.1225.494 385.52 15728 29.4 6.0925.744 385.07 15724 29.4 6.0625.994 384.62 15721 29.4 6.0326.244 384.19 15717 29.4 5.9926.494 383.77 15713 29.4 5.9526.744 383.36 15709 29.4 5.9126.994 382.96 15705 29.4 5.8627.244 382.57 15701 29.4 5.8127.494 382.19 15697 29.4 5.7627.744 381.83 15692 29.4 5.727.994 381.48 15688 29.4 5.6528.244 381.15 15684 29.4 5.5828.494 380.82 15679 29.4 5.5228.744 380.52 15675 29.4 5.4528.994 380.22 15670 29.4 5.3829.244 379.96 15666 30.8 5.2829.494 379.71 15661 30.8 5.1829.744 379.47 15656 30.8 5.0829.994 379.23 15651 30.8 4.9930.243 379 15645 30.8 4.8930.493 378.77 15640 30.8 4.8130.743 378.55 15634 30.8 4.7230.993 378.34 15629 30.8 4.6431.243 378.14 15623 30.8 4.5631.493 377.94 15617 30.8 4.4831.743 377.74 15610 30.8 4.431.993 377.56 15604 30.8 4.3232.243 377.38 15598 30.8 4.2532.493 377.2 15591 30.8 4.1732.743 377.03 15584 30.8 4.132.993 376.87 15577 30.8 4.0233.243 376.65 15570 30.8 4.0933.493 376.42 15563 30.8 4.1633.743 376.18 15562 30.8 4.2433.993 375.92 15565 30.8 4.3234.243 375.64 15568 30.8 4.4134.493 375.35 15571 30.8 4.534.742 375.04 15574 30.8 4.634.992 374.7 15577 30.8 4.7135.242 374.34 15579 30.8 4.8335.492 373.95 15582 30.8 4.96

GMR Londa Hydro Power Pvt. Ltd. EMP of Talong Londa H.E. Project
R S Envirolink Technologies Pvt. Ltd. 11.27
35.742 373.53 15585 30.8 5.135.992 373.05 15587 30.8 5.2736.242 372.53 15590 30.8 5.4636.492 371.93 15592 30.8 5.6936.742 371.22 15594 30.8 5.9936.992 370.36 15596 30.8 6.38
A comparison between different scenarios has been presented in the Table 11.7 below
which clearly highlights that near Seppa town location the difference between flood wave
elevations in case of PMF and Dam Break Scenario and only PMF (No Dam) scenario is
0.85 m while at the same location the difference between flood wave elevations in case of
SPF and Dam Break Scenario and only PMF (No Dam) scenario is -0.11 m i.e. the flood
level is less
Table 11.7: Profile of crests in different scenarios
Distance
from Dam (km)
Max Elevation in case of PMF
& Dam break (m)
Max Elevation in case of
SPF & Dam break
(m)
Max Elevation in case of PMF only
(NO DAM) (m)
Difference between (PMF +
Dambreak) and (PMF
only; No Dam)
Scenarios
Difference between
(SPF + Dambreak)
and (PMF only; No
Dam) Scenarios
0.05 439.66 439.01 436.08 3.58 2.930.15 439.99 439.34 436.13 3.86 3.210.25 440.07 439.42 436.26 3.81 3.16
0.5 436.98 436.35 433.67 3.31 2.680.8 436.73 436.18 433.61 3.12 2.57
0.975 438.65 438.03 435.07 3.58 2.961.231 438.43 437.82 434.89 3.54 2.931.487 438.08 437.47 434.6 3.48 2.871.743 437.44 436.84 434.04 3.4 2.8
2 435.88 435.29 432.65 3.23 2.642.25 435.27 434.69 432.05 3.22 2.64
2.499 434.66 434.07 431.45 3.21 2.622.749 434.03 433.45 430.83 3.2 2.622.999 433.4 432.81 430.21 3.19 2.63.249 432.75 432.16 429.57 3.18 2.593.499 432.08 431.49 428.92 3.16 2.573.749 431.38 430.8 428.24 3.14 2.563.999 430.64 430.06 427.54 3.1 2.524.249 429.85 429.28 426.78 3.07 2.54.499 429 428.43 425.97 3.03 2.464.749 428.09 427.52 425.08 3.01 2.444.999 427.15 426.57 424.11 3.04 2.465.249 426.27 425.68 423.24 3.03 2.44

GMR Londa Hydro Power Pvt. Ltd. EMP of Talong Londa H.E. Project
R S Envirolink Technologies Pvt. Ltd. 11.28
5.499 425.39 424.8 422.39 3 2.415.749 424.53 423.94 421.55 2.98 2.395.999 423.67 423.09 420.73 2.94 2.366.249 422.83 422.25 419.92 2.91 2.336.499 422.01 421.43 419.13 2.88 2.36.749 421.19 420.62 418.36 2.83 2.266.998 420.39 419.83 417.6 2.79 2.237.248 419.61 419.05 416.85 2.76 2.27.498 418.83 418.28 416.12 2.71 2.167.748 418.07 417.53 415.4 2.67 2.137.998 417.32 416.78 414.7 2.62 2.088.248 416.58 416.05 414 2.58 2.058.498 415.84 415.32 413.32 2.52 28.748 415.11 414.6 412.63 2.48 1.978.998 414.38 413.88 411.96 2.42 1.929.248 413.64 413.16 411.28 2.36 1.889.498 412.9 412.42 410.6 2.3 1.829.748 412.13 411.67 409.92 2.21 1.759.998 411.34 410.9 409.22 2.12 1.68
10.248 410.5 410.08 408.5 2 1.5810.498 409.58 409.2 407.76 1.82 1.4410.748 408.53 408.21 406.97 1.56 1.2410.998 407.18 406.98 406.11 1.07 0.8711.255 407.06 406.8 405.78 1.28 1.0211.512 406.58 406.31 405.27 1.31 1.04
11.77 405.95 405.68 404.67 1.28 1.0112.027 405.26 404.99 404.02 1.24 0.9712.284 404.54 404.28 403.36 1.18 0.9212.542 403.81 403.56 402.7 1.11 0.8612.799 403.09 402.84 402.05 1.04 0.7913.056 402.37 402.13 401.41 0.96 0.7213.314 401.66 401.42 400.88 0.78 0.5413.571 400.96 400.73 400.4 0.56 0.3313.829 400.57 400.06 400 0.57 0.0614.086 400.3 399.59 399.67 0.63 -0.0814.343 400.1 399.32 399.42 0.68 -0.114.601 399.96 399.12 399.23 0.73 -0.1114.858 399.85 398.98 399.09 0.76 -0.1115.115 399.78 398.88 398.99 0.79 -0.1115.373 399.72 398.8 398.92 0.8 -0.1215.631 399.67 398.73 398.85 0.82 -0.12
15.89 399.63 398.68 398.79 0.84 -0.1116.149 399.59 398.63 398.74 0.85 -0.1116.408 399.55 398.58 398.7 0.85 -0.1216.667 399.52 398.54 398.66 0.86 -0.1216.925 399.48 398.51 398.62 0.86 -0.11

GMR Londa Hydro Power Pvt. Ltd. EMP of Talong Londa H.E. Project
R S Envirolink Technologies Pvt. Ltd. 11.29
17.184 399.45 398.47 398.58 0.87 -0.1117.443 399.41 398.42 398.54 0.87 -0.1217.702 399.37 398.38 398.49 0.88 -0.1117.961 399.31 398.32 398.43 0.88 -0.11
18.22 399.23 398.23 398.35 0.88 -0.1218.478 399.1 398.1 398.22 0.88 -0.1218.737 398.83 397.84 397.95 0.88 -0.1118.996 397.97 397 397.11 0.86 -0.1119.246 397.66 396.7 396.81 0.85 -0.1119.496 397.35 396.38 396.5 0.85 -0.1219.746 397.03 396.07 396.18 0.85 -0.1119.996 396.7 395.74 395.85 0.85 -0.1120.246 396.35 395.4 395.51 0.84 -0.1120.496 396 395.05 395.15 0.85 -0.120.746 395.63 394.68 394.79 0.84 -0.1120.995 395.25 394.3 394.41 0.84 -0.1121.245 394.85 393.91 394.01 0.84 -0.121.495 394.43 393.49 393.6 0.83 -0.1121.745 393.98 393.05 393.16 0.82 -0.1121.995 393.52 392.59 392.69 0.83 -0.122.245 393.02 392.1 392.2 0.82 -0.122.495 392.48 391.56 391.67 0.81 -0.1122.745 391.89 390.98 391.09 0.8 -0.1122.995 391.25 390.34 390.44 0.81 -0.123.245 390.73 389.82 389.92 0.81 -0.123.495 390.22 389.3 389.41 0.81 -0.1123.745 389.72 388.8 388.9 0.82 -0.123.995 389.22 388.29 388.4 0.82 -0.1124.245 388.73 387.79 387.9 0.83 -0.1124.495 388.24 387.3 387.41 0.83 -0.1124.745 387.76 386.82 386.93 0.83 -0.1124.995 387.29 386.34 386.45 0.84 -0.1125.245 386.82 385.87 385.98 0.84 -0.1125.494 386.36 385.41 385.52 0.84 -0.1125.744 385.91 384.96 385.07 0.84 -0.1125.994 385.47 384.51 384.62 0.85 -0.1126.244 385.04 384.08 384.19 0.85 -0.1126.494 384.63 383.66 383.77 0.86 -0.1126.744 384.22 383.25 383.36 0.86 -0.1126.994 383.82 382.85 382.96 0.86 -0.1127.244 383.43 382.47 382.57 0.86 -0.127.494 383.06 382.1 382.19 0.87 -0.0927.744 382.7 381.74 381.83 0.87 -0.0927.994 382.35 381.39 381.48 0.87 -0.0928.244 382.02 381.06 381.15 0.87 -0.0928.494 381.7 380.74 380.82 0.88 -0.08

GMR Londa Hydro Power Pvt. Ltd. EMP of Talong Londa H.E. Project
R S Envirolink Technologies Pvt. Ltd. 11.30
28.744 381.39 380.44 380.52 0.87 -0.0828.994 381.09 380.15 380.22 0.87 -0.0729.244 380.83 379.88 379.96 0.87 -0.0829.494 380.58 379.63 379.71 0.87 -0.0829.744 380.33 379.39 379.47 0.86 -0.0829.994 380.09 379.15 379.23 0.86 -0.0830.243 379.86 378.91 379 0.86 -0.0930.493 379.63 378.69 378.77 0.86 -0.0830.743 379.41 378.47 378.55 0.86 -0.0830.993 379.2 378.25 378.34 0.86 -0.0931.243 378.99 378.05 378.14 0.85 -0.0931.493 378.79 377.85 377.94 0.85 -0.0931.743 378.59 377.65 377.74 0.85 -0.0931.993 378.41 377.46 377.56 0.85 -0.132.243 378.23 377.28 377.38 0.85 -0.132.493 378.05 377.11 377.2 0.85 -0.0932.743 377.88 376.94 377.03 0.85 -0.0932.993 377.72 376.78 376.87 0.85 -0.0933.243 377.5 376.56 376.65 0.85 -0.0933.493 377.26 376.33 376.42 0.84 -0.0933.743 377.01 376.08 376.18 0.83 -0.133.993 376.75 375.83 375.92 0.83 -0.0934.243 376.47 375.55 375.64 0.83 -0.0934.493 376.17 375.26 375.35 0.82 -0.0934.742 375.86 374.95 375.04 0.82 -0.0934.992 375.52 374.62 374.7 0.82 -0.0835.242 375.16 374.26 374.34 0.82 -0.0835.492 374.76 373.87 373.95 0.81 -0.0835.742 374.34 373.44 373.53 0.81 -0.0935.992 373.87 372.98 373.05 0.82 -0.0736.242 373.34 372.45 372.53 0.81 -0.0836.492 372.75 371.86 371.93 0.82 -0.0736.742 372.06 371.17 371.22 0.84 -0.0536.992 371.22 370.32 370.36 0.86 -0.04
The particulars of the data used are given in Annexure -I 11.12 PREPARATION OF INUNDATION MAP
An inundation map is a map depicting the d/s areas vulnerable to inundation by the
dam break flood. The DAMBRK model computes maximum flood elevation at each
original or interpolated cross-section. In present case, the cross-sections are
available up to 37 km d/s of dam. The profile of water levels below the dam at all
cross-sections (original and interpolated) is given as Table 11.4. From this profile, at

GMR Londa Hydro Power Pvt. Ltd. EMP of Talong Londa H.E. Project
R S Envirolink Technologies Pvt. Ltd. 11.31
locations below the dam & their subsequent markings on the topographic maps, it
can be seen which areas are likely to be submerged in case of dam break.
The input control parameters for dam break flood forecasting are given in Annexure-I
and the reservoir depletion tables including the outflow hydrograph at dam site have
also been appended there.
It is clear from the Figure 11.2 that in case of dam break, there would be inundation of
lower areas however no settlement will be affected.
11.13 DISASTER MANAGEMENT PLAN
From the result it is evident that up to about 37 km d/s of the dam, time required in
reaching the flood wave elevation to the maximum is of the order of about two hour. It
hardly leaves any possibility of any rescue or evacuation. Since the time available is
very short, the Disaster Management Plan should concentrate on preventive actions.
Surveillance and monitoring programmes are required to be implemented during
design and investigation, construction, first reservoir filling, early operation period and
operation & maintenance phases of the life cycle of dam. It is desirable that all gates,
electricity, public announcement system, power generator backups etc are
thoroughly checked before arrival of the monsoon. As it is clear from the results that
u/s water level has significant effect on the dam break flood, the following flood
conditions may be considered for different level of alertness:
1) If u/s water level reaches at top of the dam, it may be considered as an
emergency. At this point only a few minutes are available for taking any action.
All the staff from the dam site should be alerted to move to a safe place. The
district administration and the corporation’s head office shall be informed about
the possibility of dam failure.
2) If u/s water level rises above the dam top and dam begins to fail, it may be
considered as a disaster condition. At this stage, Information in this regard should
be given to the head office and district administration.
i) If upstream water level is at or below FRL and flood is of the order of 20% to
30% of PMF, it may be considered as normal flood condition and normal
routine may be maintained.
ii) If upstream water level is rising above FRL, it may be considered as Level-1 emergency. In this condition at least four gates must be kept fully
operational. All concerned officials should be alerted so that they may reach
at the dam site to take suitable actions. Preventive actions may be carried out
simultaneously. A suitable warning and notification procedure may be laid.
The local officials should be informed about the situation.
iii) If upstream water level reaches above MWL and still rising, it may be
considered as Level-2 emergency. It is seen from the results that around
four hour is available to carry out suitable action at this condition. All
communication systems and safety measures should be operational now.

GMR Londa Hydro Power Pvt. Ltd. EMP of Talong Londa H.E. Project
R S Envirolink Technologies Pvt. Ltd. 11.32
Public announcement system or centralized siren system may be used. A
flood warning may be issued to the public downstream so that they may reach
a higher and safe place. iv) If upstream water level reaches at the top of the dam, it may be considered as
Level-3 emergency. At this point only a few minutes are available for taking
any action. All the staff from the dam site should be alerted to move to a safe
place. The district level office and the corporation’s head office should be
informed about the possibility of dam failure.
v) If upstream water level is rising above the dam top and dam has started to
fail. It may be considered as a disaster condition. Any information in this
regard should be immediately provided to civil administration for necessary
rescue operations.
The following measures can be taken to avoid the loss of lives and property:
To establish an effective Dam Safety Surveillance and monitoring program
including rapid analysis and interpretation of instrumentation and observation
data; periodic inspection and safety reviews/evaluation by an independent panel
of experts.
To formulate and implement an Emergency Action Plan to minimize to the
maximum extent possible, the probable loss of life and damage to property in the
event of failure of dam.
11.13.1 Surveillance
The surveillance and monitoring programs are required to be implemented during
design and investigation, construction, early operation period and operation and
maintenance phases of the life cycle of the dam. An affective flood forecasting
system is required by establishing hourly gauge reading at suitable upstream
locations with real time communication at the top. An effective dam safety
surveillance, monitoring and observation along with periodic inspection, safety
reviews and evaluation must be put in place. These programs will be implemented in
five phases in the life cycle of a dam viz.,
i) design and investigation phase,
ii) construction phase,
iii) first reservoir filling,
iv) early operation period, and
iv) operation and maintenance phase.

GMR Londa Hydro Power Pvt. Ltd. EMP of Talong Londa H.E. Project
R S Envirolink Technologies Pvt. Ltd. 11.33
Figure 11.2 Inundation Map

GMR Londa Hydro Power Pvt. Ltd. EMP of Talong Londa H.E. Project
R S Envirolink Technologies Pvt. Ltd. 11.34
11.13.2 Emergency Action Plan
An emergency is defined as a condition of serious nature which develops
unexpectedly and endangers downstream property and human life and requires
immediate attention. Emergency Action Plan shall include all potential indicators of
likely failure of the dam, since the primary concern is for timely and reliable
identification and evaluation of potential emergency.
This plan presents warning and notification procedures to be followed in case of
potential failure of the dam. The purpose is to provide timely warning to nearby
residents and alert key personnel responsible for taking action in case of an
emergency.
11.13.3 Administrative and Procedural Aspects
The Administrative and Procedural Aspects of Emergency Action Plan consists of a
flowchart depicting the names, addresses and telephone numbers of the responsible
officials. In order of hierarchy, the following system will usually be appropriate. In the
event of potential emergency, the observer at the site is required to report it to the
Engineer-in-charge through a wireless system, if available, or by the fastest
communication system available. The Engineer-in-charge shall be responsible for
contacting the Civil Administration, viz. Deputy Commissioner. In order to oversee all
the operations required to tackle the emergency situations, a centralized control room
would be set up by the project authorities at Seppa.
Each person would be made aware of his/her responsibilities/ duties and the
importance of work assigned under the Emergency Action Plan. All the villages falling
under the flood prone zone or on the margins would be connected through wireless
communication system with backup of standby telephone lines. A centralized siren
alert system would be installed at all the Village Panchayats so that in the event of a
warning all villagers can be alerted through sirens rather than informing everybody
through messengers which is not feasible in such emergency situations.
11.13.4 Preventive Action
Once the likelihood of an emergency situation is suspected, action has to be initiated
to prevent a failure. The point at which each situation reaches an emergency status
shall be specified and at that stage the vigilance and surveillance shall be upgraded.
At this stage, a thorough inspection of the dam shall be carried out to locate any
visible signs of distress.
The anticipated need of equipment shall be evaluated and if these are not available
at the dam site, the exact locations and availability of these equipments shall be
identified. A plan shall be drawn on priority for inspection of the dam. The dam, its
sluices and non-overflow sections will be properly illuminated.
GMR Londa Hydro Power Pvt. Ltd. EMP of Talong Londa H.E. Project
R S Envirolink Technologies Pvt. Ltd. 11.35
11.13.5 Communication System
An efficient communication system and a downstream warning system is absolutely
essential for the success of an emergency plan especially in the present case
because of inadequacy of time. The difference between a high flood and a dam
break situation shall be made clear to the downstream people. All of the villages
falling near to the flooding zone or on margins are required to be connected through
wireless system backed by stand-by telephone lines. A centralized siren system is to
be installed at Panchayats so that in event of a warning, all villagers can be alerted,
through messengers which may not be possible in this case.
11.13.6 Merits of Satellite Communication System
Keeping the disaster scenario in mind, any terrestrial system such as land lines, etc.
is likely to be the first casualty in earthquakes or floods. The restoration of such
systems is time consuming. Moreover the maintenance of such lines becomes a
great problem in emergency even for the technical personnel who are required to
reach the site of fault, which may be struck by the disaster. So the system cannot be
put back into operation soon. The fault repairs and restoration of communication
services are usually not possible for a considerable period of time after the calamity
has struck. Moreover, it is critical that the communication systems are restored at the
earliest so that relief/medical teams and other personnel can be arranged at the
earliest possible time. All the subsidiary help depends solely on the communication
system. As this criteria is paramount, existing systems such as telephones and telex,
etc. are practically of little use in case of such events and situations. Similarly,
microwave links are expected to be down due to collapse of towers, etc. Restoration
of towers and alignment of equipment is again a time consuming activity.
Keeping in view the urgency of services and their dependability during emergency
relevant to the disaster conditions, satellite based systems present an ideal solution.
The satellite based system usually comprises following components.
i) A small dish of approximately one meter diameter
ii) Associated radio equipment
iii) A power source
The deployment of the system is not dependent on the restoration of land routes. The
existing satellite based communication systems are designed in such a manner that
they are able to withstand fairly high degree of demanding environmental conditions.
Secondly, the restoration of the satellite based system can be undertaken by carrying
maintenance personnel and equipment by helicopters at a very short notice. Even
the fresh systems could be inducted in a matter of an hour or so because most of
these are designed for transportability by air. The deployment takes usually less than

GMR Londa Hydro Power Pvt. Ltd. EMP of Talong Londa H.E. Project
R S Envirolink Technologies Pvt. Ltd. 11.36
an hour. The power requirements are not large and can be met by sources such as
UPS/batteries/ generators.
11.13.7 Financial Outlay for Installation of VSAT Communication System
The cost of deployment and maintenance of a telecommunication system in disaster
prone areas is not as important as the availability, reliability and quick restoration of
the system. The cost of both satellite bandwidth and the ground components of the
satellite communication system has been decreasing rapidly like that of V-SAT (Very
Small Aperture Terminal) based systems supporting a couple of voice and data
channels. Some highly superior communication systems in VSAT without time delay
are marketed by National agencies like HECL, HFCL and HCL Comet. There are two
different types of systems with the above mentioned capabilities available in the
market viz. SCPCDAMA and TDMA. However, the first one named SCPCDAMA has
been recommended for the Talong Londa H.E. project. One such system would be
installed in Seppa town. The estimated cost of installation of such a communication
system has been given in Table 11.5.
11.13.8 Evacuation Plans
Emergency Action Plan includes evacuation plans and procedures for
implementation based on local needs. These are:
Demarcation/prioritization of areas to be evacuated.
Notification procedures and evacuation instructions.
Safe routes, transport and traffic control.
Shelter areas
Functions and responsibilities of members of evacuation team.
The flood prone zone in the event of break of Talong Londa dam shall be marked
properly at the village locations with adequate factor of safety. As the flood wave
takes sufficient time in reaching these villages, its populace shall be informed well in
time through wireless and sirens etc. so that people may climb on hills or to some
elevated place beyond the flood zone which has been marked.
The Evacuation Team would comprise of:
i) D.M./ his Nominated Officer (To peacefully relocate the people to places at
higher elevation with state administration)
ii) Engineer-in-Charge of the Project (Team Leader)
iii) S.P./Nominated Police Officer (To maintain law and order)
iv) C.M.O. of the area (To tackle morbidity of affected people)
v) Sarpanch/ Affected Village Representative to execute the resettlement
operation with the aid of state machinery and project proponents
vi) Sub-committees at village level

GMR Londa Hydro Power Pvt. Ltd. EMP of Talong Londa H.E. Project
R S Envirolink Technologies Pvt. Ltd. 11.37
The Engineer-in-Charge will be responsible for the entire operation including prompt
determination of the flood situation from time to time. Once the red alert is declared
the whole state machinery will come into swing and will start evacuating people in the
inundation areas delineated in the inundation map. For successful execution,
annually Demo exercise will be done. DM is to monitor the entire operation.
11.13.9 Notifications
Notification procedures are an integral part of any emergency action plan. Separate
procedures shall be established for slowly and rapidly developed situations and
failure. Notifications will include communications of either an alert situation or an alert
situation followed by a warning situation. An alert situation will indicate that although
failure or flooding is not imminent, a more serious situation can occur unless
conditions improve. A warning situation will indicate that flooding is imminent as a
result of an impending failure of the dam. It will normally include an order for
evacuation of delineated inundation areas. For a regular watch on the flood level
situation, it is necessary that two or more people man the flood cell so that an
alternative person is available for notification round the clock.
In addition, a few guidelines to be generally followed by the inhabitants of flood prone
areas, which form part of public awareness for disaster mitigation include:
Listen to the radio for advance information and advice.
Disconnect all electrical appliances and move all valuable personal and
household goods and all clothing out of reach of flood water.
Move vehicles, farm animals and movable goods to the highest ground
nearby.
Move all dangerous pollutants and insecticides out of reach of water.
Do not enter flood waters on foot, if it can be avoided.
11.13.10 Cost Estimates for Disaster Management
The estimated total cost of execution of disaster management plan including the
equipment would be Rs. 97.60 lacs and it is given in Table 11.8.
Table 11.8: Estimated cost of setting up of a satellite communication system &
disaster management plan
Sl. No Product Amount (Rs. in lacs)
A. Setting up of V-SAT communication system
1. Product Name: SCPCDAMA (2 sites) 30.00
@ Rs.15.00 lakh per site
a) Antenna 2 x 2.4 M

GMR Londa Hydro Power Pvt. Ltd. EMP of Talong Londa H.E. Project
R S Envirolink Technologies Pvt. Ltd. 11.38
b) RF 2 x 2 W
c) Modem 2 x 1No.
2. Generators 2 Nos. (2 KVA) 4.00
3. UPS 2 Nos. (2 KVA) 2.00
4. Installation and maintenance of system, maintenance 21.60
and running cost of UPS, generators, etc.
@ 10% of the total cost for 6 years B. Installation of alert systems, 25.00
Setting up of control room, etc.
C. Notification and publication procedures, 15.00
Miscellaneous etc
Total 97.60

GMR Londa Hydro Power Pvt. Ltd. EMP of Talong Londa H.E. Project
R S Envirolink Technologies Pvt. Ltd. 12.1
CHAPTER 12
RESERVOIR RIM TREATMENT PLAN
12.1 INTRODUCTION
The proposed 108.5m high dam proposed on Kameng river would lead to
impoundment, with dam top El. 490 m and FRL at El 488 m. The reservoir thus formed
in the Kameng river shall extend up to a distance of 12.8 km in river Kameng and
about 7.5 km in Pachuk river. The reservoir would lead to submergence of 350 ha of
land at FRL. For reservoir rim treatment 2 m buffer zone above FRL is proposed along
reservoir periphery.
Generally construction of river valley projects may lead to sudden change in the
existing riverine lotic environment to lacustrine condition. The toe of steep hills towering
over the river bed shall be subjected to raised water surface level due to the reservoir.
The rock mass which had not before experience the flow of river shall be subjected to
hydraulic conditions apart from many other direct and indirect factors responsible for
instability of land masses. Two types of factors e.g. internal factors and external factors
are responsible for sliding in such water spread conditions.
1. The reduction in the shearing strength of the rocks, the water content of the
rock masses, change in their mineralogical composition and meteorological
character, structural features and the state of stress are some of the important
internal factors.
2. External factors include mainly vibrations either naturally by an earthquake or
artificial due to heavy traffic and rock blasting. Besides these removals of
support at the foot of the slope i.e. toe failure and toe cutting by high velocity of
flow is another cause.
Therefore, an assessment of geological conditions and geo-technical evaluation of the
reservoir area gives adequate information of the behavior of reservoir.
12.2 IMPACTS ON RESERVOIR SLOPES
The reservoir rim of Talong Londa HE Project is expected to be fairly stable in the
given geo-environment with both engineering and biological measures adopted for
treating the minor slides. Also there is no possibility of water leakage into the
adjacent valleys as the water divide is very high and extensive as compared to
reservoir size and elevation.
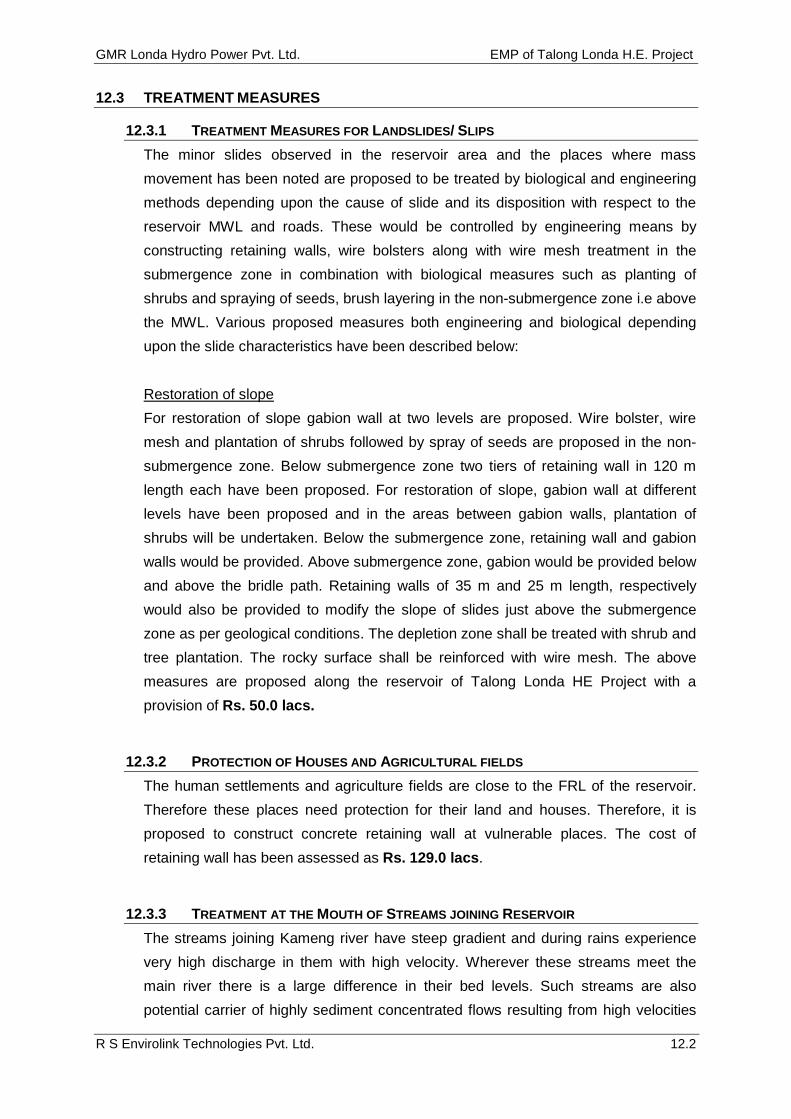
GMR Londa Hydro Power Pvt. Ltd. EMP of Talong Londa H.E. Project
R S Envirolink Technologies Pvt. Ltd. 12.2
12.3 TREATMENT MEASURES
12.3.1 TREATMENT MEASURES FOR LANDSLIDES/ SLIPS
The minor slides observed in the reservoir area and the places where mass
movement has been noted are proposed to be treated by biological and engineering
methods depending upon the cause of slide and its disposition with respect to the
reservoir MWL and roads. These would be controlled by engineering means by
constructing retaining walls, wire bolsters along with wire mesh treatment in the
submergence zone in combination with biological measures such as planting of
shrubs and spraying of seeds, brush layering in the non-submergence zone i.e above
the MWL. Various proposed measures both engineering and biological depending
upon the slide characteristics have been described below:
Restoration of slope
For restoration of slope gabion wall at two levels are proposed. Wire bolster, wire
mesh and plantation of shrubs followed by spray of seeds are proposed in the non-
submergence zone. Below submergence zone two tiers of retaining wall in 120 m
length each have been proposed. For restoration of slope, gabion wall at different
levels have been proposed and in the areas between gabion walls, plantation of
shrubs will be undertaken. Below the submergence zone, retaining wall and gabion
walls would be provided. Above submergence zone, gabion would be provided below
and above the bridle path. Retaining walls of 35 m and 25 m length, respectively
would also be provided to modify the slope of slides just above the submergence
zone as per geological conditions. The depletion zone shall be treated with shrub and
tree plantation. The rocky surface shall be reinforced with wire mesh. The above
measures are proposed along the reservoir of Talong Londa HE Project with a
provision of Rs. 50.0 lacs.
12.3.2 PROTECTION OF HOUSES AND AGRICULTURAL FIELDS
The human settlements and agriculture fields are close to the FRL of the reservoir.
Therefore these places need protection for their land and houses. Therefore, it is
proposed to construct concrete retaining wall at vulnerable places. The cost of
retaining wall has been assessed as Rs. 129.0 lacs.
12.3.3 TREATMENT AT THE MOUTH OF STREAMS JOINING RESERVOIR
The streams joining Kameng river have steep gradient and during rains experience
very high discharge in them with high velocity. Wherever these streams meet the
main river there is a large difference in their bed levels. Such streams are also
potential carrier of highly sediment concentrated flows resulting from high velocities

GMR Londa Hydro Power Pvt. Ltd. EMP of Talong Londa H.E. Project
R S Envirolink Technologies Pvt. Ltd. 12.3
attained by them during flash floods which at times becomes as high as 18m/sec.
Loose deposits or fans are therefore often observed near the confluence point of
such streams with the Kameng river. The mouth of these streams has a tendency of
sliding and widening.
These streams will be subjected to change in hydraulic conditions depending
upon the fluctuation of water level of Kameng river during different periods of
the year and abrupt water level changes brought about during monsoon. The
changed gradient of ground water affects the pore water pressure of the soil
mass of banks at the mouthing and reduces the shear strength of the rock-
mass which disintegrates.
The sediment load carried by the tributary streams gets deposited near the
confluence and thus obstruct the high flow during monsoon thereby
increasing the flow velocity near banks which cause toe-erosion.
Due to the changes in flow conditions at the mouth of streams, from super
critical to sub-critical the energy dissipation takes place and the bank material
has to bear the onslaught.
The FRL of the reservoir will fluctuate between El, 486.80 m to 488 m i.e. 1.2
m. Even though the variation is not very large and does not last over a
considerable long period/duration, there are little chances of sudden draw
down of water in the reservoir, yet due to presence of loose material at the
mouths sliding cannot be ruled out.
The mouth of the streams are generally comprised of riverine material usually
shingle, pebbles, boulder and fine sediments like clay, silt and sand which
have lower shear strength. Swelling caused due to hydration of clay might
become the main cause of mass movement.
Therefore, the mouth of these streams directly draining into reservoir require
protection against toe-erosion at the level of FRL of reservoir by retaining wall in
the immediate length of either bank followed by gabion walls. The sediment load
transported by the streams can be minimized by making check dams sizes of
suitable size in each of the streams meeting the reservoir on both the flanks. The
above measures are proposed for reservoir of Talong Londa HE Project with a
provision of Rs.67.50 lacs.
The cost of various activities involved in reservoir rim treatment plan is Rs.
246.50 lacs (Table 12.1).
Table 12.1: Cost of Reservoir Rim Treatment
S. No. Measures to be adopted Amount (Rs. in lacs)
1. Treatment of land slides 50.00
2. Protection of agricultural fields/houses 129.00
3. Treatment of major streams joining the 67.50

GMR Londa Hydro Power Pvt. Ltd. EMP of Talong Londa H.E. Project
R S Envirolink Technologies Pvt. Ltd. 12.4
reservoir directly Total 246.50

GMR Londa Hydro Power Pvt. Ltd. EMP of Talong Londa H.E. Project
R S Envirolink Technologies Pvt. Ltd. 13.1
CHAPTER 13
COMPENSATORY AFFORESTATION PROGRAMME
13.1 GENERAL
Deforestation has been the most critical environmental danger for the fragile
ecosystem of the Himalaya. The destruction of vegetation due shifting cultivation
practice in the state of Arunachal Pradesh, becomes a source of inflow of silt into the
rivers. The need for increasing agricultural production in response to the increase of
population is among the causes behind deforestation in the state, which has been
characterized by a large-scale clearance of land for cultivation. The encroachment in
the forest areas generally takes place in a variety of ways:
Families often clear forest areas for cultivation, since small family landholdings
are not sufficient for their livelihood.
Encroachment in and around the forest area for building and construction
activities has been a major menace. Many of the private land holdings in the state
are attached to forests. It makes it very difficult to monitor the extent of
encroachment due to lack of resources, manpower and technology.
In rural areas, the encroachers are cultivators who are ignorant of the laws
relating to the protection of forestlands, or people whose holdings are attached to
the boundaries of forestland. In urban areas, encroachment generally does not
take place in forestland because people are conversant with the law.
The steady deforestation is also attributed to growing energy needs, land
diversion for development activities, commercial activities, forest fires and natural
calamities.
13.2 OBJECTIVES
Basic objectives of the compensatory afforestation of state forest department are as
under:
Increasing substantially the forest / tree cover in the state through massive
afforestation, social forestry programmes especially on all denuded and degraded
slopes, regeneration of natural forests through inducing natural regeneration.
Increasing the productivity of land through improved management practices to
meet the needs of increasing human population in respect of food, timber, fuel
wood and fodder for the livestock.
Preventing the diversion of forestlands and good agriculture lands for other
purposes.
Encouraging people to use alternative sources of energy for heating and cooking
purposes.

GMR Londa Hydro Power Pvt. Ltd. EMP of Talong Londa H.E. Project
R S Envirolink Technologies Pvt. Ltd. 13.2
Discouraging shifting cultivation and encourage Wet Rice Cultivation (WRC) and
settled agricultural practices.
The Department of Environment & Forests has been carrying out forest protection,
conservation and regeneration activities in the district. Plantations have been a low
key activity in the state due to the very rich forest resources. The major plantation
schemes for the regeneration of the forest areas are Artificial Plantations, Aided
Natural Regeneration (ANR), Apnavan and others as Social forestry, Minor Forest
Produce, Minimum Needs Programme. Of these Apnavan is being undertaken by the
local villagers as beneficiaries on their private land and the other schemes by the
Department. Of late, JFM has also been initiated and plantations are being
undertaken by the community, on a micro-watershed basis, through the Village
Forest Management Committees (VFMC) under the umbrella of Division level Forest
Development Agencies (FDA).
13.2.1 The Indian Forest Conservation Act (1980)
The Indian Forest Conservation Act (1980) stipulates:
If, non-forest land is not available, compensatory plantations are to be
established on degraded forest lands, which must be twice the forest area
affected or lost, and
If, non-forest land is available, compensatory forests are to be raised over an
area equivalent to the forest area affected or lost.
The total land to be acquired for the project is about 413.10 ha and out of which
about 284 ha is the forest land. Compensatory afforestation is proposed in lieu of
acquisition of this land. It is proposed to afforest the degraded forest patches and as
per Forest Conservation Act (1980), double the amount of forest land i.e. 568 ha
would be afforested. The recommended tree species are given in Table-13.1. The
indigenous species have been selected for afforestation.
Table :13.1 Recommended tree species for afforestation Botanical name Local name Altingia excelsa Jutuli Gmelina arborea Gamari Acacia auriculiformis Akash mohni Syzygium sp. Jamun Dendrocalamus spp. - Duabanga grandiflora Khokan Bauhinia purpurea Kanchan Lagerstroemia minuticarpa Ajar Callicarpa arborea Yarpu-Changne Cyathea spinulosa - Calamus angustifolia - Ulmus longifolia - Macaranga denticulata Yah-Changne Phoebe goalparensis Mekahi
GMR Londa Hydro Power Pvt. Ltd. EMP of Talong Londa H.E. Project
R S Envirolink Technologies Pvt. Ltd. 13.3
13.3 COMPENSATORY AFFORESTATION PROGRAMME
13.3.1 Diversion of Forest Land for Talong Londa H. E. Project
The Talong Londa H.E. Project area is located in the jurisdiction of Seppa Forest
Division. The Department of Forests, Govt. of Arunachal Pradesh is responsible for
the conservation and management of forests in the project area. The Forest
Conservation Act, 1980 stipulates strict forest protection measures and procedures
for compensatory afforestation on acceptance of diversion of forestland for non-
forestry purposes. According to the scheme of this project 284 ha of forestland will
lost due to the project. Since no, non-forest land is available for raising compensatory
afforestation, double the area of lost forestland would be planted up to 284 ha of
plantations will be raised in degraded forestland available hereby. In addition to this,
efforts will be made to plant trees at appropriate places on completion of the works,
along the road.
13.3.2 Compensatory Afforestation Strategy for the Proposed Project
Need-based and time-bound programme of afforestation and tree planting is to
be launched with main emphasis on production of fuel wood and fodder on
degraded and denuded lands, both forest and non-forest. Afforestation being a
time specific activity, the government will ensure technical, administrative and
financial approval well in advance for all afforestation projects to ensure the
success of these programmes and improve the quality of works.
Common property resources/ lands to be protected from encroachment. These
lands are to be developed by planting fodder and fuel wood trees. Suitable fodder
grasses would be planted to augment the availability of fodder. The status of
these lands would be regularly monitored to avoid over-exploitation of these
lands.
The alignment of the road and transport system for the project would be planned
with minimum use of arable lands and good forest areas. The construction of
roads would have in built provision for waterways to supplement the natural
drainage system, treatment of landslides prone and fragile areas, compensation
for crop / forest / land property, etc. likely to be damaged/ destroyed and having
provision for compensatory afforestation for greater stability of the slopes.
The construction of dams and reservoirs for power generation which are
consistent with the needs for conservation of trees and forest, which involve such
diversion of forest land, shall provide in their budget, funds for regeneration/
compensatory afforestation and compensation for damage caused to the forest
crop both on government and private lands.

GMR Londa Hydro Power Pvt. Ltd. EMP of Talong Londa H.E. Project
R S Envirolink Technologies Pvt. Ltd. 13.4
The objective of the afforestation programme will be to develop natural areas in
which ecological functions could be maintained on sustainable basis. Therefore
planting of miscellaneous indigenous species would be undertaken. The
compensatory afforestation is proposed to be done mainly in those forest blocks
forests where degraded land and forest blanks are available for planting. Suitable
sites, depressions and sites along streams will planted up with appropriate species.
The plantations that would be undertaken in the highly degraded areas would have a
planting density of at least 600 plants per ha will have to be replenished.
i) Nursery Development
Nurseries would be developed with 6 to 8 seedbeds each and 6-8 beds for potted
plants. Nursery sapling would be developed for species identified for compensatory
afforestation scheme. The nursery development works should be started from the
first year so that they are able to suffice the needs of supply of plant sapling from
second year or so. The nursery area would be near to the road plantation areas and
should have irrigation facilities.
ii) Fuel Wood & Fodder Plants
With a view to conserve not only soil and water but also for fuel wood production, it is
important to raise the vegetative barrier of hedge plants. The seeds of hedges like
Dodonaea, Duranta, Spiraea, etc. will be sown in contour trenches before the onset
of monsoon. When the water of surface run-off reaches the line of ridges its speed is
checked and the hedge plants stop silt and only percolated water passes down
slowly. Hedges spread and grow well in the silt left behind and form a natural terrace.
A new nursery site will be developed at the project cost. The detailed cost analysis of
expenditure on raising of various plant species and that of afforestation has been
worked out.
iii) Fencing and Closure
Stone wall 125 cm high and 45, cm wide or 4 strand barbed wire fencing would be
erected during first year along with soil working. The cooperation of local villagers
would be sought for the success of the plantation programme.
iv) Watch & Ward/ Fire Protection
Protection of plantation is the greatest challenge in hills as villagers and their
livestock damage the plantation before it is established. Hence the protection of
plantation particularly in the juvenile stage is of paramount importance and
watchmen/ chowkidars would be engaged from the nearby villages for the required
job. Besides the above, other appropriate measures would be adopted to ward off
these potential threats.

GMR Londa Hydro Power Pvt. Ltd. EMP of Talong Londa H.E. Project
R S Envirolink Technologies Pvt. Ltd. 13.5
13.4 COST OF COMPENSATORY AFFORESTATION
The compensatory afforestation is proposed to be undertaken on degraded forest
land identified in consultation with the State Forest Department. Plant species have
been identified based on soil and climatic conditions of the proposed compensatory
afforestation area. The estimated cost of Compensatory Afforestation programme is
Rs. 332.4 Lacs, which needs to be ratified by the State Forest Department.
Table 13.2: Cost estimates of Compensatory Afforestation Plan
S. No. Particulars Area (ha) Rate
Rs./ha Amount (Rs.
in Lacs)
1.
Total area for compensatory afforestation as per the notification of Govt of Arunachal Pradesh currently considered as Rs 50000/- per Ha
568 50000/ha 284.00
2. Maintenance of afforestation area Average rate for 5 years is Rs 5000/- per Ha
568 5,000/ha 28.40
3. Charges for providing infrastructure support to the Forest Department for executing CA works
L. S. Rs. 4 lacs per year for 5 years
20.00
Total (Rs. in Lacs) 332.40
13.5 NET PRESENT VALUE (NPV)
The Hon’ble Supreme Court of India has made it mandatory vide its order dated
28.03.2008 for the user agency to compensate for the diversion of forest land for
non-forest use for developmental activities on the recommendations of Central
Empowered Committee (CEC) to make payment of Net Present Value (NPV) of such
diverted land so as to utilize this for getting back in the long run which are lost by
such diversion.
For this purpose CEC has classified the forest taking in view the ecological role and
value of the forest and the purpose of the report, 16 major forest types have been
further grouped into 6 ecological classes depending upon their ecological functions.
1. Eco-Class I- Consisting of Tropical Wet Evergreen Forests, Tropical Semi
Evergreen Forests and Tropical Moist Deciduous Forests
2. Eco-Class II –Consisting of Littoral and Swamp Forests
3. Eco-Class III – Consisting of Tropical Dry Deciduous Forests
4. Eco-Class IV- Consisting of Tropical Thorn Forests and Tropical Dry Evergreen
Forests
5. Eco-Class V – Consisting of Sub-tropical Board Leaved Hill Forests, Sub-
Tropical Pine Forests and Sub Tropical Dry Evergreen Forests
6. Eco-Class VI-Consisting of Montane Wet Temperate Forests, Himalayan Moist
Temperate Forests, Himalayan Dry Temperate Forests, Sub Alpine Forest,
Moist Alpine Scrub and Dry Alpine Scrub.

GMR Londa Hydro Power Pvt. Ltd. EMP of Talong Londa H.E. Project
R S Envirolink Technologies Pvt. Ltd. 13.6
The net present value per hectare of forest has been fixed based on this data. For
calculating the average net percent value per hectare of forest in India, the following
monetary value of goods and services provided by the forest have been considered:
(i) Value of timber and fuel
(ii) Value of Non Timber Forest Products (NTFP)
(iii) Value of fodder
(iv) Value of Eco-tourism
(v) Value of bio-prospecting
(vi) Value of Ecological services of forest
(vii) Value of Flagship Species
(viii) Carbon Sequestration Value
Based on this, the NPV was fixed and the following recommendations have been
made:
(i) For non-forestry use/diversion of forest land, the NPV may be directed to be
deposited in the Compensatory Afforestation Fund as per the rates given
below (in Rs.).
Eco-Value class Very Dense Forest Dense Forest Open Forest
Class I 10,43,000 9,39,000 7,30,000
Class II 10,43,000 9,39,000 7,30,000
Class III 8,87,000 8,03,000 6,26,000
Class IV 6,26,000 5,63,000 4,38,000
Class V 9,39,000 8,45,000 6,57,000
Class VI 9,91,000 8,97,000 6,99,000
Total forest land requirement for diversion for non-forest use i.e. for the construction
of Talong Londa H.E. Project activities is approximately 413.10 ha of land is required,
Out of this about 284 Ha is Forest Land from which 101.00 ha is coming under the
riverine zone. As the forest in the project area fall in the Eco Class VI, open forest,
therefore NPV @ Rs. 6.99 lacs/ha would be required to be deposited in the
Compensatory Afforestation Fund. The total cost of NPV has been computed as
under.
Particulars
Forest Land to be Diverted (ha) 284
Eco Class IV
Forest Density Open Forest
NPV to be deposited Rs. 6.99 lacs per ha 1985.16 lacs

GMR Londa Hydro Power Pvt. Ltd. EMP of Talong Londa H.E. Project
R S Envirolink Technologies Pvt. Ltd. 14.1
CHAPTER 14
ENVIRONMENTAL MONOTORING PROGRAMME
14.1 INTRODUCTION
Environmental Monitoring is an essential tool in relation to environmental
management as it provides the basis for rational management decisions regarding
impact control. Monitoring shall be performed during all stages of the project (namely:
construction, and operation) to ensure that the impacts are no greater than predicted,
and to verify the impact predictions. The monitoring program will indicate where
changes to procedures or operations are required, in order to reduce impacts on the
environment or local population. The monitoring program for the Talong Londa HE
Project will be undertaken to meet the following objectives:
To monitor the environmental conditions of the Kameng river and the reservoir
as impacted by the Talong Londa HE Project;
To check on whether mitigation and benefit enhancement measures have
actually been adopted, and are proving effective in practice;
To provide information on the actual nature and extent of key impacts and the
effectiveness of mitigation and benefit enhancement measures which, through a
feedback mechanism, can improve the planning and execution of future, similar
projects.
Monitoring of three basic items of air, water and noise suffices for monitoring the
environmental changes at the local level. Accordingly, it is imperative to monitor air
quality, water quality, and noise levels during the construction and operation phases.
14.2 AREAS OF CONCERN
From the monitoring point of view, the important parameters are water quality,
erosion and siltation, landuse, afforestation, etc. An attempt is made to establish
early warning of indicators of stress on the environment. Suggested monitoring
details are outlined in the following sections.
14.3 WATER QUALITY
Construction Phase
It is proposed to monitor water quality of the Kameng river at two locations –
upstream of dam site and downstream of muck disposal site/colony (downstream of
point where all project activities end); shall be on yearly basis as per State Pollution
Control Board Guidelines. Parameters to be monitored should include pH,
Temperature, Electrical Conductivity, Turbidity, Total Dissolved Solids, Calcium,
Magnesium, Total Hardness, Chlorides, Sulphates, Nitrates, DO, COD, BOD, Total
Coliforms. The analysis work can be done by any laboratory recognized by the State

GMR Londa Hydro Power Pvt. Ltd. EMP of Talong Londa H.E. Project
R S Envirolink Technologies Pvt. Ltd. 14.2
Pollution Control Board. The monitoring is proposed to be done for entire period
of construction i.e. 5 years.
Operation phase
The surface water quality of the proposed reservoir and Kameng river can be
monitored thrice a year (summer, monsoon and winter seasons). The proposed
parameters to be monitored include; pH, Temperature, Electrical Conductivity,
Turbidity, Total Dissolved Solids, Calcium, Magnesium, Total Hardness, Chlorides,
Sulphates, Nitrates, DO, COD, BOD, Iron, Zinc and Manganese.
The sampling sites shall be:
1 km upstream of the reservoir
Submergence area
1, 3 and 5 km downstream of the dam
The analysis shall be done throughout the life of the project. The analysis work can
be conducted by a reputed external agency recognized by the Arunachal Pradesh
State Pollution Control Board.
During project operation phase, an aerated lagoon is proposed to be set up to treat
the effluent from the project colony. Once every month, it is envisaged to analyse a
sample each before and after treatment from the aerated lagoon. The parameters to
be analysed include pH, Biochemical Oxygen Demand, Chemical Oxygen Demand,
Total Suspended Solids and Total Dissolved Solids.
14.4 MUCK/ DEBRIS DUMPING AND DISPOSAL
Construction Phase
In addition to the air quality, water quality and noise quality during the construction
phase, management of construction debris and muck arising out of the earth work
involved in the hydro projects is also a major environmental issue. Adopting
appropriate and well designed engineering structures for retaining the construction
debris and muck is very crucial and this needs to be monitored regularly both for
stability of the dump sites and their vulnerability to stress failures due to various
factors such as erodability, strong water currents and earth pressures. Regular
monitoring of the muck dumping will be carried out by State Pollution Control Board.
Operation Phase
No monitoring programme is suggested for operation phase as this area is
rehabilitated by plantation.

GMR Londa Hydro Power Pvt. Ltd. EMP of Talong Londa H.E. Project
R S Envirolink Technologies Pvt. Ltd. 14.3
14.5 AIR QUALITY AND METEOROLOGY
Construction Phase
The ambient air quality monitoring during construction phase can be carried out by
an external agency, approved by State Pollution Control Board at two stations. Every
year monitoring is to be done for three seasons namely, winter, summer and
monsoon.
The frequency of monitoring could be twice a week for four consecutive weeks at
each station for each season. The parameters to be monitored are SPM and RPM,
Sulphur-dioxide (SO2) and Nitrogen Oxides (NOx).
Operation Phase
Air quality will be monitored regularly during operation phase also for parameters –
SPM, SO2 and NOx for first 3 years.
14.6 NOISE
Construction Phase
Noise emissions from vehicular movement, operation of various construction
equipments may be monitored during construction phase at major construction sites.
The frequency of monitoring could be once every month. For monitoring of noise
generators an integrating Sound Level Meter will be required.
Operation Phase
Noise monitoring will continue during operation phase also for first 3 years.
14.7 MINIMUM ENVIRONMENTAL FLOW
Operation Phase
During operation phase of the project, most crucial environmental aspect is the
monitoring of flow released from the hydel project to ensure that minimum flow is
maintained at all times especially during lean season. Therefore, monitoring
mechanism will be established as per the requirement of State Pollution Control
Board to monitor river flow immediately downstream of the dam complex.
14.8 AQUATIC ECOLOGY AND FISHERIES
Construction Phase
No monitoring programme has been suggested for the project construction phase.
Operation Phase
Monitoring of fisheries in the reservoir will be essential to achieve sustainable yield of
fish. Some of the parameters to be monitored are phytoplanktons, zooplanktons,

GMR Londa Hydro Power Pvt. Ltd. EMP of Talong Londa H.E. Project
R S Envirolink Technologies Pvt. Ltd. 14.4
benthic life and fish composition, etc. Based on human resources and facilities
available, monthly observations in time and space need to be made.
The parameters can be monitored twice at the water sampling sites given in Section-
14.3 of this Chapter. The monitoring can be conducted by a reputed external agency.
14.9 INCIDENCE OF WATER-RELATED DISEASES
Construction Phase
During project construction phase, the incidence of various water-related diseases
can be monitored. The various parameters to be covered include various diseases
cause and control measures. The monitoring can be conducted by the medical staff
posted at the dispensary near construction site.
Operation Phase
Various parameters to be covered included various disease cause and control
measure. The monitoring can be conducted by Environmental Cell.
14.10 FINANCIAL REQUIREMENT
A sum of Rs. 65.60 lacs has been allocated to implement various activities and
programme envisaged under EMP and the details are given in Table 14.1.
Table 14.1: Cost estimates for Environmental Monitoring Programme Sl. No.
Items to be Monitored Parameters Monitoring Agency
Budget (Rs. In lacs)
CONSTRUCTION PHASE 48.10 1 Ambient Air Quality SO2, NOx, SPM SPCB 2 Ambient Sound Levels Sound Levels SPCB 3 Water -Sewage Effluent
From Colonies BOD, COD, TSS, O&G, pH SPCB
4 Surface Water Quality pH, TSS, DO and Conductivity SPCB 5 Ground Water Quality BOD, COD, DO, pH SPCB 6 Muck/Debris Dumping
and Disposal Muck Quantity, Dumping Process, Engineering and Biological Measures implementation
SPCB
OPERATION PHASE 1 Ambient Air Quality SO2, NOx, SPM SPCB 2 Ambient Sound Levels Sound Levels SPCB 3 Water -Sewage Effluent
From Colonies BOD, COD, TSS, O&G, pH SPCB
4 Surface Water Quality pH, TSS, DO and conductivity SPCB 5 Ground Water Quality BOD, COD, DO, pH SPCB 6 Release of Minimum
Flow Inflow and release in river at diversion structure
SPCB
Other Monitoring Activities 1 Awareness programmes 2.50 2 Meetings with Stakeholders, etc. 7.50 3 Reporting, documentation of various activities 7.50
TOTAL (In Rs. Lacs) 65.60

GMR Londa Hydro Power Pvt. Ltd. EMP of Talong Londa H.E. Project
R S Envirolink Technologies Pvt. Ltd 14.5
Table 14.2: Matrix of Environmental Monitoring Plan
Sl. No. Aspect Source of Impact Monitoring Methods & Parameters 1.0 Construction Phase 1.1 Local manpower
absorption Construction works Contractor’s report No. of people working in the project
1.2 Erosion and landslides Excavation, disposal, cut & fill and land clearing activities for access roads, disposal
Survey & observation Extent and degree of landslides and erosion
1.3 Biodiversity Land clearing activities fauna in the project area for access roads, colonies
Composition of flora and fauna
1.4 Revegetation & Afforestation
Land clearing, disposal works Survey & observation Density of vegetation Survival rate of species planted
1.5 Soil erosion control measures
Excavation, landslides, cut & fill for road construction
Status/ Survival rate of bio-engineering and engineering structures for controlling soil erosion
1.6 Water Quality Excavation, disposal, sewage disposal, land clearing activities and other chemical parameters
Surveys & sample collection and field measurements Turbidity, pH, T.D.S., D.O., Total Coliform and E. coli
1.7 Air Quality Operation of DG sets, transportation of muck, road construction, mobilization of material, running of crushers
Survey & observation Levels of SPM, SOx, NOx,
1.8 Public Health Dust, noise, influx to labour Regular medical checkups and camps
1.9 Health Delivery System
Influx of labour Status of water and vector borne diseases, improvement observed, if any, status of women and child health
1.10 Fish Management Construction Activities Impact of project construction on fish, and aquatic life, if any
Status of infrastructure developed for fish management like hatcheries
1.11 Restoration of Muck Disposal sites, construction areas
Muck generation, transportation and dumping
Status of protection measures at the dumping sites. Whether dumping is done so as to avoid spillage of muck into the river, especially during rains Leveling and slope stabilization works at dumping sites. Status of afforestation/ turfing works on the dumping sites
2.0 Operation Phase
2.1 Water Quality and Quantity (for irrigation & domestic use)
Reservoir water regulation Diversion of water for power generation
Surveys, sample collection & field measurement Water discharge d/s of dam Water quality (turbidity, coliform bacteria and others

GMR Londa Hydro Power Pvt. Ltd. EMP of Talong Londa H.E. Project
R S Envirolink Technologies Pvt. Ltd 14.6
Sl. No. Aspect Source of Impact Monitoring Methods & Parameters
2.2 Air Quality Increased activities in the area including movement of vehicles, air pollution from colony, etc.
Survey & observation Levels of SPM, SOx, NOx
2.3 Noise Levels Noise due to operational activities including that from housing colony
Sound Levels using sound level meter
2.4 Fish production Reservoir regulation Survey & observation
2.5 Aquatic weeds Surveys & sample collection Kinds of species 2.6
Catchment conditions Deforestation Survey & observation of Barren areas for Afforestation
2.7 Accidents Sudden discharge of water for power generation
Surveillance
2.8
Disaster
Heavy rainfall, flash flood situation
Surveillance and disaster management exercises, Regular information to people

GMR Londa Hydro Power Pvt. Ltd. EMP of Talong Londa H.E. Project
R S Envirolink Technologies Pvt. Ltd. 15.1
CHAPTER 15 SUMMARY OF COST ESTIMATES
15.1 COST FOR IMPLEMENTING ENVIRONMENTAL MANAGEMENT PLAN
The total amount to be spent for implementation of Environmental Management Plan
(EMP) would be Rs. 10613.69 lacs. The cost is exclusive of the cost to be provided
as compensation for acquisition of land for the project. The details of the cost are
given in Table 15.1.
Table 15.1: Cost for Implementing Environmental Management Plan S. No. Management Plan Rs. in Lacs
1 Biodiversity Conservation & Management Plan 77.00 2 Catchment Area Treatment Plan 688.92 3 Fisheries Conservation Plan 65.00 4 Public Health Delivery System 70.00 5 Solid Waste Management Plan 65.21 6 Muck Disposal Plan 275.77 7 Landscaping & Restoration Plan 60.00 8 Forest Protection Plan 21.00 9 Rehabilitation & Resettlement Plan 4042.53
10 Environmental Risk Assessment and Management 21.00
11 Reservoir Rim Treatment Plan 246.50 12 Compensatory Afforestation Plan 332.40 13 NPV 1985.16 14 Disaster Management Plan 97.60 15 Environmental Monitoring Programme 65.60 16 Cost of Trees 2500.00
TOTAL (in lacs) 10613.69

GMR Londa Hydro Power Pvt Ltd EIA study of Talong Londa H.E. Project
R S Envirolink Technologies Pvt. Ltd. 16.1
16 Public Hearing Issues and Response
Pubic Hearing for the Talong Londa HEP was conducted by Arunachal Pradesh State
Pollution Control Board (APSPCB) on July 28, 2014. Proceedings of the Public Hearing
have been prepared by APSPCB and are enclosed as a separate document. Major
issues raised by the local people during the meeting have been tabulated below along
with the response of the project proponent for ready reference.
Sl. No. Questions by Local Person Replies by the Project Proponent
01.
Identification/ survey of exact
land owners and displaced
families
In consultation with District Administration, Forest
Department and local community, the land re-surveys and
identification of land owners shall be carried out.
02.
Land /property compensation
rates to be fixed in due
consultations with land owners
under the banner of TLHEPAPC
(PAF community)
The land rates and compensation will be fixed as per the
LARR Act 2013 or as per the prevailing State Government
law(s) as may be applicable. The entire process shall be
facilitated as per LARR Act 2013 / State Government’s
applicable law(s) by the District Administration in
consultation with land / property owners.
03.
Compensation to be paid in
single instalment within a year
after assessment
The compensation will be paid as per the LARR Act 2013 or
as per the prevailing relevant State Government Law(s).
04. Clarity over forest and private
land. No land belongs to forest
This issue will be resolved as per the guidelines of Forest
Department and Revenue Department.
05.
Forest compensation not to be
paid to the forest department
and shall be paid to the Project
Affected Families (PAFs).
The compensation will be paid as per decision of GoAP.
06.
GoAP to make provision of 2%
as a free power to local area
development rather than State
policy of 1%
The Project Proponent clarified that they will adhere to the
MoA conditions.
07.
Project Proponent to contribute
Rs. 5 lakh annually to project
affected village for festivals
Project Proponent clarified that, during project construction
and operation, possible contribution shall be made to the
project affected villages.
08. Job reservations for project
affected people
The job reservation for Project Affected Families (PAFs) will
be followed as per the State Government Policies.
09.
Award of contract work to PAFs/
affected villages
Preference shall be given to the PAFs/affected villagers for
award of miscellaneous contracts duly considering the
capability of such contractors.
10. Senior Secondary school to be
established with boarding facility
As per the formalised R&R package, required school shall
be established based on the feasibility.
11. Hospital with 50 beds in project As per the formalised R&R package, Primary health centre

GMR Londa Hydro Power Pvt Ltd EIA study of Talong Londa H.E. Project
R S Envirolink Technologies Pvt. Ltd. 16.2
affected area shall be established.
12.
Provision of insurance to local
community in case of death/
accident due to project related
activity
As per the State Government policy.
13.
Motorable road construction
from Dam site to Liya village
Project Proponent agreed to carryout feasibility study based
on the need. If the village connectivity is adversely affected
on account of the project, required alternate arrangements
shall be made for establishing the connectivity.
14.
Construction of Community Hall
with 200 Seating capacity with
kitchen facility.
Based on the need, required community hall shall be
established during project execution phase.
15.
Concrete embankments on both
banks of Kameng river and in
landslide prone area.
During the project construction and operation, the land slide
prone zones will be identified and proper slope stabilisation
measures will be implemented. The Reservoir Rim
Treatment Plan is proposed in EMP Report.
16.
Proper management of migrant
labours during construction to
avoid antisocial activity
All the adequate measures as per prevailing labour law will
be taken to avoid such antisocial activity by migratory
labours.
17.
R&R Policy to be properly
implemented in transparent
manner as per LARR Act, 2013
Will be implemented as per approved R&R plan.
18.
Provision of Solar lighting to all
households of project affected
villages immediately prior to the
construction of project.
Rural electrification shall be implemented as per the
approved R&R plan.
19.
Review the cost structure of
R&R Plan and Economic
Development Package
The R&R and Economic Development package is based on
the LARR Act, 2013 and prevailing State Government policy.
20.
Permanent colony and office to
be established in Project
affected area
The project proponent clarified that, the permanent project
colony shall be located in the vicinity of project affected area
duly considering the project operational requirement and
feasibility in consultation with project affected community.
21.
Immediate constitution of R&R
and land acquisition Committee
with representative of PAFs
representatives
R&R implementation committee shall be constituted as per
the prevailing State & Central Government policies. During
land acquisition due consultation shall be carried out with the
project affected community.
22.
TLHEPAPC to be made a nodal
agency for implementing CSR
programs in the area
The CSR activity will be implemented through GMRVF. The
CSR Plan will duly consider the local project affected needs
in the area of health, education and livelihood promotion.It
will be formalised in due consultation with project affected
villages and people.
23.
Downstream impact of TLHEP Downstream impacts are carefully studied as a part of EIA
and suitable management plan has been already formalised
in the EMP Report.
24. Impact on Fishes and
Management Plan
Required studies were carried out and suitable management
plan are in place for implementation.

GMR Londa Hydro Power Pvt Ltd EIA study of Talong Londa H.E. Project
R S Envirolink Technologies Pvt. Ltd. 16.3
25. Construction of Prayer Centre Suitable replacement shall be carried out at appropriate
stage.
26.
Compensation for crops and
Plants
The compensation for trees and crops will be finalised by
District Administration in consultation with project affected
families.
27.
Impact of Air and water quality Environment Management Plan duly addresses these issues
and the air and water quality shall be maintained as per the
prescribed environmental law.
28.
Reasons of delay in project Project Proponent explained that there were extensive
investigation and studies involved for preparation of DPR &
EIA/EMP and also approval of DPR from CEA also took
about 2 to 3 years. Besides the above, there were many
salutatory clearances & approvals required for setting-up
such project.
29.
Impact on water quality in
downstream of dam
Environment Management Plan duly addresses these
issues. Water quality shall be maintained as per the
prescribed Environmental law.
30.
Assessment of PAFs from
Meora village
In SIA survey, PAFs of Meora village were considered as a
Hamlet in the village provinces of Rikhung & Tallo. However,
compensation package shall be implemented as per the
approved R&R plan.
31.
Compensatory Afforestation Implementation of Compensatory Afforestation is carried by
the Forest Department as per the State Government
policies.
32.
Safety measures in downstream
of Dam.
A comprehensive disaster management plan shall be
developed and implemented. A Dam is designed considering
required factor of safety.
Adequate budgetary provisions have already been made under various heads for
implementation of above suggested measures. Therefore, no additional budgetary
provisions are required.

ANALYSIS OF THE DOWNSTREAM FLOOD HYDROGRAPH PRODUCED BY THE DAM BREAK (PMF) OF TALONG DAM ON KAMENG RIVER ANALYSIS BY RSET BASED ON PROCEDURE DEVELOPED BY DANNY L. FREAD, PH.D., SR. RESEARCH HYDROLOGIST QUALITY CONTROL TESTING AND OTHER SUPPORT BY JANICE M. LEWIS, RESEARCH HYDROLOGIST HYDROLOGIC RESEARCH LABORATORY W23, OFFICE OF HYDROLOGY NOAA, NATIONAL WEATHER SERVICE SILVER SPRING, MARYLAND 20910

******************************* ******************************* *** *** *** SUMMARY OF INPUT DATA *** *** *** ******************************* ******************************* INPUT CONTROL PARAMETERS FOR TALONG DAM PARAMETER VARIABLE VALUE *************************************************** ****** ******* NUMBER OF DYNAMIC ROUTING REACHES KKN 1 TYPE OF RESERVOIR ROUTING KUI 0 MULTIPLE DAM INDICATOR MULDAM 0 PRINTING INSTRUCTIONS FOR INPUT SUMMARY KDMP 3 NO. OF RESERVOIR INFLOW HYDROGRAPH POINTS ITEH 36 INTERVAL OF CROSS-SECTION INFO PRINTED OUT WHEN JNK=9 NPRT 0 FLOOD-PLAIN MODEL PARAMETER KFLP 0 METRIC INPUT/OUTPUT OPTION METRIC 1 TALONG DAM RESERVOIR TABLE OF ELEVATION VS SURFACE AREA SURFACE AREA (SQ KM) ELEVATION (M) SA(K) HSA(K) ************************* **************** 3.7 490.00 2.7 480.00 2.0 470.00 1.5 460.00 1.0 450.00 .7 440.00 .3 430.00 .0 413.00 TALONG DAM RESERVOIR AND BREACH PARAMETERS PARAMETER UNITS VARIABLE VALUE ******************************************* ******* ****** *********** LENGTH OF RESERVOIR KM RLM 12.80 ELEVATION OF WATER SURFACE M YO 490.00 SIDE SLOPE OF BREACH Z .00 ELEVATION OF BOTTOM OF BREACH M YBMIN 465.50

WIDTH OF BASE OF BREACH M BB 70.00 TIME TO MAXIMUM BREACH SIZE HOUR TFH .25 ELEVATION (MSL) OF BOTTOM OF DAM M DATUM 413.00 VOLUME-SURFACE AREA PARAMETER VOL .00 ELEVATION OF WATER WHEN BREACHED M HF 490.00 ELEVATION OF TOP OF DAM M HD 490.00 ELEVATION OF UNCONTROLLED SPILLWAY CREST M HSP .00 ELEVATION OF CENTER OF GATE OPENINGS M HGT 450.45 DISCHARGE COEF. FOR UNCONTROLLED SPILLWAY CS .00 DISCHARGE COEF. FOR GATE FLOW CG 657.09 DISCHARGE COEF. FOR UNCONTROLLED WEIR FLOW CDO 258.54 DISCHARGE THRU TURBINES CMS QT 349.23 DHF(INTERVAL BETWEEN INPUT HYDROGRAPH ORDINATES) = 1.00 HRS. TEH(TIME AT WHICH COMPUTATIONS TERMINATE)= 36.0000 HRS. BREX(BREACH EXPONENT) = .000 MUD(MUD FLOW OPTION) = 0 IWF(TYPE OF WAVE FRONT TRACKING) = 0 KPRES(WETTED PERIMETER OPTION) = 0 KSL(LANDSLIDE PARAMETER) = 0 DFR(WINDOW FOR CRITICAL FROUDE NO. IN MIX FLOW ALGORITHM)= .050 INFLOW HYDROGRAPH TO TALONG DAM ******************************************* 16835.00 16167.00 14871.00 13336.00 11804.00 10369.00 9085.00 7998.00 7093.00 6307.00 5614.00 4979.00 4391.00 3828.00 3286.00 2775.00 2291.00 1854.00 1467.00 1122.00 817.00 570.00 379.00 258.00 195.00 162.00 146.00 141.00 141.00 141.00 141.00 141.00 141.00 141.00 141.00 141.00 TIME OF INFLOW HYDROGRAPH ORDINATES .0000 1.0000 2.0000 3.0000 4.0000 5.0000 6.0000 7.0000 8.0000 9.0000 10.0000 11.0000 12.0000 13.0000 14.0000 15.0000 16.0000 17.0000 18.0000 19.0000 20.0000 21.0000 22.0000 23.0000 24.0000 25.0000 26.0000 27.0000 28.0000 29.0000 30.0000 31.0000 32.0000 33.0000 34.0000 35.0000

CROSS-SECTIONAL PARAMETERS FOR KAMENG RIVER BELOW TALONG DAM PARAMETER VARIABLE VALUE *************************************************** ****** ******* NUMBER OF CROSS-SECTIONS NS 14 MAXIMUM NUMBER OF TOP WIDTHS NCS 6 NUMBER OF CROSS-SECTIONAL HYDROGRAPHS TO PLOT NTT 5 TYPE OF OUTPUT OTHER THAN HYDROGRAPH PLOTS JNK 1 CROSS-SECTIONAL SMOOTHING PARAMETER KSA 0 NO. OF LATERAL INFLOW HYDROGRAPHS LQ 0 NO. OF POINTS IN GATE CONTROL CURVE KCG 0 NUMBER OF CROSS-SECTION WHERE HYDROGRAPH DESIRED (MAX NUMBER OF HYDROGRAPHS = 6) ************************************************** 2 4 7 10 13 CROSS-SECTIONAL VARIABLES FOR KAMENG RIVER BELOW TALONG DAM PARAMETER UNITS VARIABLE ****************************************** ******* ****** LOCATION OF CROSS-SECTION KM XS(I) ELEVATION(MSL) OF FLOODING AT CROSS-SECTION M FSTG(I) ELEV CORRESPONDING TO EACH TOP WIDTH M HS(K,I) TOP WIDTH CORRESPONDING TO EACH ELEV M BS(K,I) (ACTIVE FLOW PORTION) TOP WIDTH CORRESPONDING TO EACH ELEV M BSS(K,I) (OFF-CHANNEL PORTION) NUMBER OF CROSS-SECTION I NUMBER OF ELEVATION LEVEL K CROSS-SECTION NUMBER 1 ************************* XS(I) = .050 FSTG(I) = .00 HS ... 412.5 420.0 430.0 440.0 450.0 454.0 BS ... .0 60.0 160.0 190.0 210.0 230.0 BSS ... .0 .0 .0 .0 .0 .0 CROSS-SECTION NUMBER 2 ************************* XS(I) = .200 FSTG(I) = .00 HS ... 411.5 412.0 423.0 437.5 467.5 498.0 BS ... 185.0 190.0 200.0 230.0 295.0 344.0

BSS ... .0 .0 .0 .0 .0 .0 CROSS-SECTION NUMBER 3 ************************* XS(I) = .500 FSTG(I) = .00 HS ... 410.3 416.0 424.0 436.0 438.0 445.0 BS ... .0 60.0 125.0 170.0 190.0 320.0 BSS ... .0 .0 .0 .0 .0 .0 CROSS-SECTION NUMBER 4 ************************* XS(I) = .800 FSTG(I) = .00 HS ... 409.5 410.0 415.0 425.0 450.0 475.0 BS ... .0 65.0 90.0 120.0 205.0 291.0 BSS ... .0 .0 .0 .0 .0 .0 CROSS-SECTION NUMBER 5 ************************* XS(I) = .975 FSTG(I) = .00 HS ... 409.2 425.0 435.0 440.0 450.0 465.0 BS ... 253.0 280.0 320.0 368.0 470.0 556.0 BSS ... .0 .0 .0 .0 .0 .0 CROSS-SECTION NUMBER 6 ************************* XS(I) = 2.000 FSTG(I) = .00 HS ... 406.0 410.0 415.0 425.0 450.0 475.0 BS ... .0 30.0 80.0 140.0 314.0 377.0 BSS ... .0 .0 .0 .0 .0 .0 CROSS-SECTION NUMBER 7 ************************* XS(I) = 5.000 FSTG(I) = .00 HS ... 399.0 405.0 410.0 412.0 415.0 430.0 BS ... .0 55.0 80.0 100.0 112.0 220.0 BSS ... .0 .0 .0 .0 .0 .0 CROSS-SECTION NUMBER 8 ************************* XS(I) = 11.000 FSTG(I) = .00

HS ... 389.0 395.0 400.0 405.0 410.0 424.0 BS ... .0 150.0 190.0 210.0 230.0 270.0 BSS ... .0 .0 .0 .0 .0 .0 CROSS-SECTION NUMBER 9 ************************* XS(I) = 15.376 FSTG(I) = .00 HS ... 376.0 380.0 390.0 395.0 400.0 430.0 BS ... .0 70.0 200.0 1370.0 2380.0 3217.0 BSS ... .0 .0 .0 .0 .0 .0 CROSS-SECTION NUMBER 10 ************************* XS(I) = 19.000 FSTG(I) = .00 HS ... 369.5 375.0 380.0 385.0 387.0 405.0 BS ... .0 75.0 119.0 135.0 145.0 285.0 BSS ... .0 .0 .0 .0 .0 .0 CROSS-SECTION NUMBER 11 ************************* XS(I) = 23.000 FSTG(I) = .00 HS ... 365.0 370.0 375.0 380.0 385.0 400.0 BS ... .0 60.0 90.0 112.0 145.0 200.0 BSS ... .0 .0 .0 .0 .0 .0 CROSS-SECTION NUMBER 12 ************************* XS(I) = 29.000 FSTG(I) = .00 HS ... 356.5 360.0 365.0 368.0 375.0 386.0 BS ... .0 95.0 120.0 134.0 150.0 190.0 BSS ... .0 .0 .0 .0 .0 .0 CROSS-SECTION NUMBER 13 ************************* XS(I) = 33.000 FSTG(I) = .00 HS ... 353.0 355.0 360.0 370.0 381.0 383.0 BS ... .0 80.0 150.0 200.0 250.0 265.0 BSS ... .0 .0 .0 .0 .0 .0 CROSS-SECTION NUMBER 14 ************************* XS(I) = 37.000 FSTG(I) = .00

HS ... 347.0 350.0 355.0 360.0 365.0 375.0 BS ... .0 50.0 82.0 102.0 160.0 210.0 BSS ... .0 .0 .0 .0 .0 .0 MANNING N ROUGHNESS COEFFICIENTS FOR THE GIVEN REACHES (CM(K,I),K=1,NCS) WHERE I = REACH NUMBER ******************************************************** REACH 1 ... .045 .045 .045 .045 .045 .045 REACH 2 ... .045 .045 .045 .045 .045 .045 REACH 3 ... .045 .045 .045 .045 .045 .045 REACH 4 ... .045 .045 .045 .045 .045 .045 REACH 5 ... .045 .045 .045 .045 .045 .045 REACH 6 ... .045 .045 .045 .045 .045 .045 REACH 7 ... .045 .045 .045 .045 .045 .045 REACH 8 ... .045 .045 .045 .045 .045 .045 REACH 9 ... .045 .045 .045 .045 .045 .045 REACH 10 ... .045 .045 .045 .045 .045 .045 REACH 11 ... .045 .045 .045 .045 .045 .045 REACH 12 ... .045 .045 .045 .045 .045 .045 REACH 13 ... .045 .045 .045 .045 .045 .045 CROSS-SECTIONAL VARIABLES FOR KAMENG RIVER BELOW TALONG DAM PARAMETER UNITS VARIABLE ****************************************** ******* ****** MINIMUM COMPUTATIONAL DISTANCE USED KM DXM(I) BETWEEN CROSS-SECTIONS CONTRACTION - EXPANSION COEFFICIENTS FKC(I) BETWEEN CROSS-SECTIONS REACH NUMBER DXM(I) FKC(I) ************** ******** ******** 1 .100 -.750 2 .250 .200 3 .250 .000 4 .250 .000 5 .250 .000

6 .250 .000 7 .250 .000 8 .250 .000 9 .250 .000 10 .250 .000 11 .250 .000 12 .250 .000 13 .250 .000 DOWNSTREAM FLOW PARAMETERS FOR KAMENG RIVER BELOW TALONG DAM PARAMETER UNITS VARIABLE VALUE ****************************************** ******* ****** ************* MAX DISCHARGE AT DOWNSTREAM EXTREMITY CMS QMAXD .0 MAX LATERAL OUTFLOW PRODUCING LOSSES CMS /M QLL .000 INITIAL SIZE OF TIME STEP HOUR DTHM .0000 DOWNSTREAM BOUNDARY PARAMETER M YDN .000000 SLOPE OF CHANNEL DOWNSTREAM OF DAM % SOM .50 THETA WEIGHTING FACTOR THETA .00 CONVERGENCE CRITERION FOR STAGE M EPSY .000000 TIME AT WHICH DAM STARTS TO FAIL HOUR TFI .00 COMPUTATIONS WILL USE THE FOLLOWING DXM VALUES .100 .250 .250 .250 .250 .250 .250 .250 .250 .250 .250 .250 .250

******************************** ******************************** *** *** *** SUMMARY OF OUTPUT DATA *** *** *** ******************************** ******************************** BOTTOM REACH CROSS-SECTION ELEVATION LENGTH SLOPE NO. KM M REACH NO. KM % 1 .05 412.50 2 .25 411.50 1 .20 .50 3 .50 410.30 2 .25 .48 4 .80 409.50 3 .30 .27 5 .97 409.20 4 .17 .17 6 2.00 406.00 5 1.02 .31 7 5.00 399.00 6 3.00 .23 8 11.00 389.00 7 6.00 .17 9 15.38 376.00 8 4.38 .30 10 19.00 369.50 9 3.62 .18 11 23.00 365.00 10 4.00 .11 12 29.00 356.50 11 6.00 .14 13 33.00 353.00 12 4.00 .09 14 37.00 347.00 13 4.00 .15 TOTAL VOLUME IN RESERVOIR BEHIND TALONG DAM = 100.8 CU. M (MILLION) DEFINITION OF VARIABLES IN RESERVOIR DEPLETION TABLE PARAMETER UNITS VARIABLE ****************************************** ******* ****** TIME STEP FROM START OF ANALYSIS I ITERATIONS NECESSARY TO SOLVE FLOW EQUATIONS K ELAPSED TIME FROM START OF ANALYSIS HOUR TTP(I) TOTAL OUTFLOW FROM DAM CMS Q(I) ELEVATION OF WATER SURFACE AT DAM M H2 ELEVATION OF BOTTOM OF BREACH M YB EST DEPTH OF FLOW IMMEDIATELY DOWNSTREAM M D SUBMERGENCE COEFFICIENT SUB VELOCITY CORRECTION VCOR TOTAL VOLUME DISCHARGED FROM TIME OF BREACH MILLION CU M OUTVOL BREACH WIDTH M BB RECTANGULAR BREACH DISCHARGE COEFFICIENT COFR INFLOW TO RESERVOIR CMS QI(I) BREACH OUTFLOW CMS QBRECH SPILLWAY OUTFLOW CMS QSPIL

RESERVOIR DEPLETION TABLE I K TTP(I) Q(I) H2 YB D SUB VCOR OUTVOL BB COFR QI(I) QBRECH QSPIL *** ** ****** ******** ******* ******* ******* **** **** ********* **** **** ***** ****** ***** 1 0 .000 10454 490.00 490.00 431.13 1.00 1.00 .0 .0 3.10 16835. 0. 10455. 2 2 .005 10454 489.99 489.51 431.13 1.00 1.06 .2 1.4 3.10 16832. 1. 10454. 3 2 .010 10463 490.02 489.02 431.13 1.00 1.03 .4 2.8 3.10 16828. 5. 10458. 4 1 .015 10478 490.05 488.53 431.14 1.00 1.02 .6 4.2 3.10 16825. 14. 10465. 5 1 .020 10499 490.08 488.04 431.15 1.00 1.01 .8 5.6 3.10 16822. 29. 10471. 6 1 .025 10528 490.11 487.55 431.17 1.00 1.01 .9 7.0 3.10 16818. 50. 10479. 7 1 .030 10565 490.14 487.06 431.19 1.00 1.01 1.1 8.4 3.10 16815. 79. 10487. 8 1 .035 10610 490.17 486.57 431.21 1.00 1.01 1.3 9.8 3.10 16812. 116. 10495. 9 1 .040 10664 490.20 486.08 431.24 1.00 1.01 1.5 11.2 3.10 16808. 162. 10503. 10 1 .045 10728 490.23 485.59 431.28 1.00 1.01 1.7 12.6 3.10 16805. 217. 10511. 11 1 .050 10802 490.26 485.10 431.32 1.00 1.01 1.9 14.0 3.10 16802. 283. 10520. 12 1 .055 10887 490.29 484.61 431.37 1.00 1.01 2.1 15.4 3.10 16798. 359. 10528. 13 1 .060 10983 490.32 484.12 431.42 1.00 1.00 2.3 16.8 3.10 16795. 446. 10537. 14 1 .065 11076 490.35 483.63 431.47 1.00 1.00 2.5 18.2 3.10 16792. 545. 10532. 15 1 .070 11167 490.37 483.14 431.52 1.00 1.00 2.7 19.6 3.10 16788. 656. 10512. 16 1 .075 11271 490.40 482.65 431.58 1.00 1.00 2.9 21.0 3.10 16785. 779. 10493. 17 1 .080 11388 490.43 482.16 431.65 1.00 1.00 3.1 22.4 3.10 16782. 915. 10473. 18 1 .085 11517 490.45 481.67 431.72 1.00 1.00 3.3 23.8 3.10 16778. 1064. 10453. 19 1 .090 11660 490.48 481.18 431.79 1.00 1.00 3.5 25.2 3.10 16775. 1227. 10433. 20 1 .095 11817 490.50 480.69 431.88 1.00 1.00 3.7 26.6 3.10 16772. 1404. 10413. 21 1 .100 11988 490.52 480.20 431.97 1.00 1.00 3.9 28.0 3.10 16768. 1596. 10392. 22 1 .105 12173 490.55 479.71 432.07 1.00 1.00 4.2 29.4 3.10 16765. 1802. 10372. 23 1 .110 12372 490.57 479.22 432.17 1.00 1.00 4.4 30.8 3.10 16762. 2022. 10350. 24 1 .115 12587 490.59 478.73 432.29 1.00 1.00 4.6 32.2 3.10 16758. 2258. 10329. 25 1 .120 12816 490.61 478.24 432.41 1.00 1.00 4.8 33.6 3.10 16755. 2510. 10307. 26 1 .125 13061 490.63 477.75 432.53 1.00 1.00 5.1 35.0 3.10 16751. 2777. 10284. 27 1 .130 13350 490.64 477.26 432.68 1.00 1.00 5.3 36.4 3.10 16748. 3061. 10289. 28 1 .135 13653 490.66 476.77 432.84 1.00 1.00 5.5 37.8 3.10 16745. 3360. 10294. 29 1 .140 13973 490.67 476.28 433.00 1.00 1.00 5.8 39.2 3.10 16741. 3676. 10298. 30 1 .145 14309 490.68 475.79 433.16 1.00 1.00 6.0 40.6 3.10 16738. 4008. 10301. 31 1 .150 14661 490.70 475.30 433.34 1.00 1.00 6.3 42.0 3.10 16735. 4358. 10303. 32 1 .155 15029 490.70 474.81 433.52 1.00 1.00 6.6 43.4 3.10 16731. 4724. 10305. 33 1 .160 15413 490.71 474.32 433.70 1.00 1.00 6.8 44.8 3.10 16728. 5107. 10306. 34 1 .165 15814 490.72 473.83 433.89 1.00 1.00 7.1 46.2 3.10 16725. 5508. 10307. 35 1 .170 16232 490.72 473.34 434.09 1.00 1.00 7.4 47.6 3.10 16721. 5925. 10307. 36 1 .175 16666 490.72 472.85 434.29 1.00 1.00 7.7 49.0 3.10 16718. 6361. 10306. 37 1 .180 17117 490.72 472.36 434.50 1.00 1.00 8.0 50.4 3.10 16715. 6814. 10304. 38 1 .185 17585 490.72 471.87 434.71 1.00 1.00 8.3 51.8 3.10 16711. 7284. 10302.

39 1 .190 18070 490.71 471.38 434.93 1.00 1.00 8.7 53.2 3.10 16708. 7772. 10298. 40 1 .195 18572 490.70 470.89 435.15 1.00 1.00 9.0 54.6 3.10 16705. 8278. 10294. 41 1 .200 19091 490.69 470.40 435.38 1.00 1.00 9.3 56.0 3.10 16701. 8802. 10290. 42 1 .205 19627 490.68 469.91 435.61 1.00 1.00 9.7 57.4 3.10 16698. 9343. 10284. 43 1 .210 20180 490.67 469.42 435.85 1.00 1.00 10.0 58.8 3.10 16695. 9903. 10278. 44 1 .215 20750 490.65 468.93 436.09 1.00 1.00 10.4 60.2 3.10 16691. 10480. 10271. 45 1 .220 21337 490.63 468.44 436.33 1.00 1.01 10.8 61.6 3.10 16688. 11075. 10263. 46 1 .225 21942 490.60 467.95 436.58 1.00 1.01 11.2 63.0 3.10 16685. 11687. 10255. 47 1 .230 22563 490.58 467.46 436.83 1.00 1.01 11.6 64.4 3.10 16681. 12318. 10246. 48 1 .235 23202 490.55 466.97 437.09 1.00 1.01 12.0 65.8 3.10 16678. 12966. 10236. 49 2 .240 23857 490.52 466.48 437.35 1.00 1.01 12.4 67.2 3.10 16675. 13632. 10226. 50 2 .245 24529 490.48 465.99 437.61 1.00 1.01 12.8 68.6 3.10 16671. 14315. 10215. 51 2 .250 25219 490.44 465.50 437.87 1.00 1.01 13.3 70.0 3.10 16668. 15016. 10203. 52 1 .255 25175 490.40 465.50 437.86 1.00 1.01 13.7 70.0 3.10 16665. 14983. 10192. 53 1 .260 25127 490.36 465.50 437.84 1.00 1.01 14.2 70.0 3.10 16661. 14946. 10182. 54 1 .265 25081 490.32 465.50 437.82 1.00 1.01 14.6 70.0 3.10 16658. 14910. 10172. 55 1 .270 25034 490.28 465.50 437.80 1.00 1.01 15.1 70.0 3.10 16655. 14873. 10162. 56 1 .275 24989 490.24 465.50 437.79 1.00 1.01 15.5 70.0 3.10 16651. 14837. 10152. 57 1 .280 24944 490.20 465.50 437.77 1.00 1.01 16.0 70.0 3.10 16648. 14801. 10143. 58 1 .285 24899 490.16 465.50 437.75 1.00 1.01 16.4 70.0 3.10 16645. 14765. 10135. 59 1 .290 24855 490.12 465.50 437.73 1.00 1.01 16.9 70.0 3.10 16641. 14729. 10126. 60 1 .295 24812 490.08 465.50 437.72 1.00 1.01 17.3 70.0 3.10 16638. 14694. 10119. 61 1 .300 24770 490.04 465.50 437.70 1.00 1.01 17.8 70.0 3.10 16635. 14659. 10112. 62 1 .305 24728 490.00 465.50 437.69 1.00 1.01 18.2 70.0 3.10 16631. 14623. 10105. 63 1 .310 24688 489.96 465.50 437.67 1.00 1.01 18.7 70.0 3.10 16628. 14588. 10100. 64 1 .315 24649 489.92 465.50 437.65 1.00 1.01 19.1 70.0 3.10 16625. 14554. 10095. 65 1 .320 24609 489.88 465.50 437.64 1.00 1.01 19.6 70.0 3.10 16621. 14519. 10091. 66 1 .325 24569 489.84 465.50 437.62 1.00 1.01 20.0 70.0 3.10 16618. 14484. 10086. 67 1 .330 24530 489.81 465.50 437.61 1.00 1.01 20.4 70.0 3.10 16615. 14450. 10081. 68 1 .335 24491 489.77 465.50 437.59 1.00 1.01 20.9 70.0 3.10 16611. 14416. 10076. 69 1 .340 24452 489.73 465.50 437.58 1.00 1.01 21.3 70.0 3.10 16608. 14381. 10071. 70 1 .345 24413 489.69 465.50 437.56 1.00 1.01 21.8 70.0 3.10 16605. 14347. 10066. 71 1 .350 24374 489.65 465.50 437.55 1.00 1.01 22.2 70.0 3.10 16601. 14314. 10061. 72 1 .355 24336 489.61 465.50 437.53 1.00 1.01 22.6 70.0 3.10 16598. 14280. 10056. 73 1 .360 24297 489.58 465.50 437.52 1.00 1.01 23.1 70.0 3.10 16595. 14246. 10051. 74 1 .365 24259 489.54 465.50 437.50 1.00 1.01 23.5 70.0 3.10 16591. 14213. 10046. 75 1 .370 24221 489.50 465.50 437.49 1.00 1.01 24.0 70.0 3.10 16588. 14180. 10042. 76 1 .375 24183 489.46 465.50 437.47 1.00 1.01 24.4 70.0 3.10 16585. 14147. 10037. 77 1 .380 24145 489.43 465.50 437.46 1.00 1.01 24.8 70.0 3.10 16581. 14114. 10032. 78 1 .385 24108 489.39 465.50 437.44 1.00 1.01 25.3 70.0 3.10 16578. 14081. 10027. 79 1 .390 24070 489.35 465.50 437.43 1.00 1.01 25.7 70.0 3.10 16574. 14048. 10022. 80 1 .395 24033 489.32 465.50 437.41 1.00 1.01 26.1 70.0 3.10 16571. 14016. 10018. 81 1 .400 23996 489.28 465.50 437.40 1.00 1.01 26.6 70.0 3.10 16568. 13983. 10013.

82 1 .405 23959 489.24 465.50 437.39 1.00 1.01 27.0 70.0 3.10 16564. 13951. 10008. 83 1 .410 23922 489.21 465.50 437.37 1.00 1.01 27.4 70.0 3.10 16561. 13919. 10004. 84 1 .415 23885 489.17 465.50 437.36 1.00 1.01 27.8 70.0 3.10 16558. 13887. 9999. 85 1 .420 23848 489.13 465.50 437.34 1.00 1.01 28.3 70.0 3.10 16554. 13855. 9994. 86 1 .425 23812 489.10 465.50 437.33 1.00 1.01 28.7 70.0 3.10 16551. 13823. 9989. 87 1 .430 23776 489.06 465.50 437.31 1.00 1.01 29.1 70.0 3.10 16548. 13791. 9985. 88 1 .435 23740 489.03 465.50 437.30 1.00 1.01 29.6 70.0 3.10 16544. 13760. 9980. 89 1 .440 23704 488.99 465.50 437.29 1.00 1.01 30.0 70.0 3.10 16541. 13729. 9976. 90 1 .445 23668 488.95 465.50 437.27 1.00 1.01 30.4 70.0 3.10 16538. 13697. 9971. 91 1 .450 23632 488.92 465.50 437.26 1.00 1.01 30.8 70.0 3.10 16534. 13666. 9966. 92 1 .455 23597 488.88 465.50 437.24 1.00 1.01 31.3 70.0 3.10 16531. 13635. 9962. 93 1 .460 23561 488.85 465.50 437.23 1.00 1.01 31.7 70.0 3.10 16528. 13605. 9957. 94 1 .465 23526 488.81 465.50 437.22 1.00 1.01 32.1 70.0 3.10 16524. 13574. 9953. 95 1 .470 23491 488.78 465.50 437.20 1.00 1.01 32.5 70.0 3.10 16521. 13543. 9948. 96 1 .475 23456 488.74 465.50 437.19 1.00 1.01 33.0 70.0 3.10 16518. 13513. 9944. 97 1 .480 23421 488.71 465.50 437.17 1.00 1.01 33.4 70.0 3.10 16514. 13483. 9939. 98 1 .485 23387 488.67 465.50 437.16 1.00 1.01 33.8 70.0 3.10 16511. 13453. 9935. 99 1 .490 23352 488.64 465.50 437.15 1.00 1.01 34.2 70.0 3.10 16508. 13423. 9930. 100 1 .495 23318 488.60 465.50 437.13 1.00 1.01 34.6 70.0 3.10 16504. 13393. 9926. 101 1 .500 23284 488.57 465.50 437.12 1.00 1.01 35.1 70.0 3.10 16501. 13363. 9921. 102 1 .505 23250 488.54 465.50 437.11 1.00 1.01 35.5 70.0 3.10 16498. 13333. 9917. 103 2 .510 23212 488.50 465.50 437.09 1.00 1.01 35.9 70.0 3.10 16494. 13301. 9912. 104 2 .517 23171 488.46 465.50 437.07 1.00 1.01 36.4 70.0 3.10 16490. 13265. 9907. 105 2 .523 23127 488.41 465.50 437.06 1.00 1.01 37.0 70.0 3.10 16485. 13226. 9901. 106 2 .531 23078 488.36 465.50 437.04 1.00 1.01 37.6 70.0 3.10 16481. 13184. 9894. 107 2 .539 23024 488.31 465.50 437.02 1.00 1.01 38.3 70.0 3.10 16475. 13138. 9887. 108 2 .547 22966 488.25 465.50 436.99 1.00 1.01 39.0 70.0 3.10 16469. 13087. 9880. 109 2 .557 22902 488.19 465.50 436.97 1.00 1.01 39.8 70.0 3.10 16463. 13032. 9871. 110 2 .568 22833 488.12 465.50 436.94 1.00 1.01 40.7 70.0 3.10 16456. 12971. 9862. 111 2 .580 22757 488.04 465.50 436.91 1.00 1.01 41.7 70.0 3.10 16448. 12905. 9852. 112 2 .593 22675 487.96 465.50 436.88 1.00 1.01 42.7 70.0 3.10 16439. 12834. 9841. 113 2 .607 22585 487.87 465.50 436.84 1.00 1.01 43.9 70.0 3.10 16430. 12756. 9829. 114 2 .623 22487 487.77 465.50 436.80 1.00 1.01 45.2 70.0 3.10 16419. 12672. 9816. 115 2 .640 22382 487.66 465.50 436.76 1.00 1.01 46.6 70.0 3.10 16408. 12580. 9802. 116 2 .659 22267 487.54 465.50 436.71 1.00 1.01 48.1 70.0 3.10 16395. 12481. 9787. 117 2 .680 22143 487.42 465.50 436.66 1.00 1.01 49.8 70.0 3.10 16381. 12374. 9770. 118 2 .703 22009 487.28 465.50 436.61 1.00 1.01 51.6 70.0 3.10 16366. 12258. 9752. 119 2 .728 21865 487.13 465.50 436.55 1.00 1.01 53.6 70.0 3.10 16349. 12133. 9732. 120 2 .756 21710 486.97 465.50 436.48 1.00 1.01 55.8 70.0 3.10 16330. 11999. 9711. 121 2 .786 21543 486.80 465.50 436.41 1.00 1.01 58.1 70.0 3.10 16310. 11855. 9688. 122 2 .820 21364 486.62 465.50 436.34 1.00 1.01 60.7 70.0 3.10 16287. 11702. 9663. 123 2 .857 21174 486.42 465.50 436.26 1.00 1.01 63.6 70.0 3.10 16263. 11537. 9637. 124 2 .898 20971 486.21 465.50 436.18 1.00 1.01 66.7 70.0 3.10 16235. 11363. 9609.

125 2 .942 20755 485.98 465.50 436.09 1.00 1.01 70.0 70.0 3.10 16205. 11177. 9578. 126 2 .992 20527 485.74 465.50 435.99 1.00 1.01 73.7 70.0 3.10 16173. 10982. 9546. 127 2 1.046 20286 485.49 465.50 435.89 1.00 1.01 77.7 70.0 3.10 16108. 10775. 9511. 128 2 1.105 20031 485.21 465.50 435.78 1.00 1.01 82.0 70.0 3.10 16030. 10557. 9474. 129 2 1.171 19762 484.93 465.50 435.67 1.00 1.01 86.7 70.0 3.10 15945. 10327. 9435. 130 2 1.243 19479 484.62 465.50 435.54 1.00 1.01 91.8 70.0 3.10 15852. 10086. 9394. 131 2 1.322 19182 484.30 465.50 435.42 1.00 1.01 97.3 70.0 3.10 15749. 9833. 9349. 132 2 1.410 18873 483.97 465.50 435.28 1.00 1.01 103.3 70.0 3.10 15636. 9571. 9303. 133 2 1.506 18552 483.61 465.50 435.14 1.00 1.01 109.7 70.0 3.10 15512. 9298. 9254. 134 2 1.611 18219 483.25 465.50 434.99 1.00 1.01 116.7 70.0 3.10 15375. 9017. 9202. 135 2 1.727 17875 482.86 465.50 434.84 1.00 1.01 124.3 70.0 3.10 15224. 8727. 9148. 136 2 1.855 17521 482.47 465.50 434.68 1.00 1.01 132.4 70.0 3.10 15059. 8429. 9092. 137 2 1.996 17158 482.06 465.50 434.52 1.00 1.01 141.2 70.0 3.10 14877. 8125. 9034. 138 2 2.150 16784 481.63 465.50 434.34 1.00 1.01 150.6 70.0 3.10 14640. 7812. 8972. 139 2 2.320 16395 481.18 465.50 434.16 1.00 1.01 160.8 70.0 3.10 14379. 7488. 8907. 140 2 2.507 15990 480.70 465.50 433.97 1.00 1.01 171.7 70.0 3.10 14092. 7152. 8839. 141 2 2.713 15567 480.21 465.50 433.77 1.00 1.01 183.4 70.0 3.10 13777. 6802. 8765. 142 2 2.939 15126 479.68 465.50 433.56 1.00 1.01 195.9 70.0 3.10 13429. 6439. 8687. 143 2 3.188 14664 479.12 465.50 433.34 1.00 1.01 209.2 70.0 3.10 13048. 6061. 8603. 144 2 3.462 14179 478.52 465.50 433.10 1.00 1.01 223.4 70.0 3.10 12628. 5666. 8513. 145 2 3.763 13666 477.87 465.50 432.84 1.00 1.01 238.5 70.0 3.10 12167. 5251. 8415. 146 2 4.095 13121 477.18 465.50 432.56 1.00 1.01 254.5 70.0 3.10 11668. 4814. 8307. 147 2 4.459 12544 476.42 465.50 432.26 1.00 1.01 271.3 70.0 3.10 11145. 4355. 8189. 148 2 4.860 11932 475.60 465.50 431.94 1.00 1.01 289.0 70.0 3.10 10570. 3874. 8058. 149 2 5.301 11286 474.71 465.50 431.59 1.00 1.01 307.4 70.0 3.10 9983. 3372. 7914. 150 2 5.786 10610 473.74 465.50 431.21 1.00 1.01 326.6 70.0 3.10 9360. 2856. 7755. 151 2 6.320 9913 472.70 465.50 430.81 1.00 1.01 346.3 70.0 3.10 8738. 2334. 7580. 152 2 6.907 9204 471.59 465.50 430.40 1.00 1.01 366.5 70.0 3.10 8100. 1816. 7388. 153 2 7.552 8501 470.42 465.50 429.96 1.00 1.01 387.0 70.0 3.10 7498. 1321. 7181. 154 2 8.262 7819 469.20 465.50 429.45 1.00 1.01 407.9 70.0 3.10 6887. 861. 6958. 155 2 9.044 7158 467.89 465.50 428.92 1.00 1.02 429.0 70.0 3.10 6277. 448. 6711. 156 2 9.903 6540 466.45 465.50 428.40 1.00 1.04 450.2 70.0 3.10 5681. 113. 6428. 157 11 10.848 5348 461.53 465.50 427.32 1.00 .99 470.4 70.0 3.10 5075. 0. 5349. 158 9 11.888 650 450.61 465.50 419.27 1.00 1.00 481.6 70.0 3.10 4457. 0. 650. 159 0 14.18 585 160 0 15.43 526 161 0 16.82 473 162 0 18.34 426 163 0 20.01 383 164 0 21.86 345 165 0 23.88 310 166 0 26.11 279 167 0 28.56 251

168 0 31.26 226 169 0 34.23 203 170 0 37.49 183

PARAMETER UNITS VARIABLE VALUE ******************************************* ******* ****** *********** INITIAL FLOW CMS Q(1) 10455. MAX FLOW CMS QM 25219. FINAL FLOW CMS Q(NU) 184. TIME TO MAX FLOW HRS TP .25 NUMBER OF TIME STEPS NNU 170 TOTAL VOLUME DISCHARGED FROM RESERVOIR MILLION CU M DISVOL 482. TIME PARAMETERS OF OUTFLOW HYDROGRAPH IMMEDIATELY DOWNSTREAM OF DAM PARAMETER UNITS VARIABLE VALUE ******************************************* ******* ****** *********** TIME TO FAILURE HR TFH .250 TIME TO START OF RISING LIMB OF HYDROGRAPH HR TFO .000 TIME TO PEAK HR TP .250 TIME STEP SIZE HR DTHI .013 ROUTING COMPLETED. PROFILE OF CRESTS AND TIMES FOR KAMENG RIVER BELOW TALONG DAM
Distance from Dam
(km)
Max Elevation
(m)
Maximum Flow
(cumec)
Time to Max
Flow (hr)
Max Velocity
(m/s)
0.05 439.66 25219 0.525 9.27
0.15 439.99 25054 0.512 5.67
0.25 440.07 24971 0.5 4.35
0.5 436.98 24930 0.6 11.69
0.8 436.73 24778 0.6 9.79
0.975 438.65 24332 0.55 3.16
1.231 438.43 23563 0.55 3.6
1.487 438.08 23381 0.55 4.22
1.743 437.44 23253 0.562 5.25
2 435.88 23147 0.587 7.58
2.25 435.27 23050 0.587 7.55
2.499 434.66 22981 0.6 7.54
2.749 434.03 22928 0.612 7.53
2.999 433.4 22881 0.612 7.51

3.249 432.75 22838 0.625 7.51
3.499 432.08 22800 0.625 7.5
3.749 431.38 22765 0.637 7.5
3.999 430.64 22735 0.637 7.54
4.249 429.85 22707 0.65 7.62
4.499 429 22682 0.65 7.77
4.749 428.09 22657 0.662 7.96
4.999 427.15 22632 0.675 8.17
5.249 426.27 22608 0.687 8.15
5.499 425.39 22584 0.7 8.13
5.749 424.53 22560 0.7 8.09
5.999 423.67 22539 0.712 8.05
6.249 422.83 22518 0.725 8.02
6.499 422.01 22497 0.725 7.99
6.749 421.19 22477 0.737 7.95
6.998 420.39 22459 0.737 7.9
7.248 419.61 22441 0.75 7.85
7.498 418.83 22424 0.75 7.79
7.748 418.07 22409 0.762 7.73
7.998 417.32 22395 0.762 7.67
8.248 416.58 22382 0.762 7.61
8.498 415.84 22371 0.775 7.55
8.748 415.11 22361 0.775 7.49
8.998 414.38 22351 0.775 7.45
9.248 413.64 22344 0.787 7.41
9.498 412.9 22337 0.787 7.38
9.748 412.13 22331 0.787 7.36
9.998 411.34 22327 0.787 7.37
10.248 410.5 22323 0.787 7.41
10.498 409.58 22321 0.8 7.5
10.748 408.53 22319 0.8 7.68
10.998 407.18 22315 0.837 8.07
11.255 407.06 22309 0.837 6.81
11.512 406.58 22299 0.85 5.98
11.77 405.95 22284 0.862 5.41
12.027 405.26 22267 0.875 4.99
12.284 404.54 22246 0.887 4.67
12.542 403.81 22222 0.9 4.42
12.799 403.09 22196 0.925 4.21
13.056 402.37 22167 0.95 4.03
13.314 401.66 22135 0.975 3.87
13.571 400.96 22098 1.012 3.73
13.829 400.57 22052 2.25 3.6
14.086 400.3 21990 2.35 3.47
14.343 400.1 21894 2.413 3.34
14.601 399.96 21744 2.45 3.17
14.858 399.85 21514 2.475 2.97
15.115 399.78 21185 2.488 2.72
15.373 399.72 20745 2.5 2.43

15.631 399.67 20210 2.5 2.3
15.89 399.63 19609 2.513 2.17
16.149 399.59 18956 2.513 2.04
16.408 399.55 18289 2.513 1.91
16.667 399.52 17690 2.513 1.78
16.925 399.48 17320 2.513 1.69
17.184 399.45 17190 2.525 1.62
17.443 399.41 17113 2.525 1.6
17.702 399.37 17063 2.525 1.62
17.961 399.31 17031 2.525 1.71
18.22 399.23 17011 2.525 1.87
18.478 399.1 16998 2.525 2.2
18.737 398.83 16990 2.538 2.87
18.996 397.97 16985 2.563 4.69
19.246 397.66 16982 2.563 4.74
19.496 397.35 16979 2.575 4.79
19.746 397.03 16976 2.575 4.85
19.996 396.7 16974 2.588 4.92
20.246 396.35 16971 2.588 5
20.496 396 16969 2.6 5.07
20.746 395.63 16967 2.6 5.16
20.995 395.25 16965 2.613 5.25
21.245 394.85 16963 2.625 5.35
21.495 394.43 16961 2.625 5.46
21.745 393.98 16959 2.638 5.57
21.995 393.52 16957 2.65 5.7
22.245 393.02 16955 2.663 5.85
22.495 392.48 16954 2.663 6.01
22.745 391.89 16952 2.688 6.2
22.995 391.25 16950 2.7 6.42
23.245 390.73 16949 2.713 6.41
23.495 390.22 16947 2.725 6.4
23.745 389.72 16945 2.738 6.39
23.995 389.22 16943 2.75 6.37
24.245 388.73 16941 2.775 6.36
24.495 388.24 16939 2.788 6.34
24.745 387.76 16937 2.8 6.32
24.995 387.29 16934 2.813 6.3
25.245 386.82 16932 2.825 6.28
25.494 386.36 16930 2.838 6.26
25.744 385.91 16927 2.85 6.23
25.994 385.47 16925 2.875 6.2
26.244 385.04 16922 2.888 6.16
26.494 384.63 16919 2.9 6.12
26.744 384.22 16916 2.913 6.08
26.994 383.82 16914 2.938 6.04
27.244 383.43 16911 2.95 5.99
27.494 383.06 16908 2.963 5.94
27.744 382.7 16905 2.975 5.88

27.994 382.35 16902 2.988 5.83
28.244 382.02 16898 3 5.76
28.494 381.7 16895 3.013 5.7
28.744 381.39 16892 3.025 5.63
28.994 381.09 16889 3.038 5.56
29.244 380.83 16886 3.05 5.45
29.494 380.58 16882 3.05 5.34
29.744 380.33 16879 3.063 5.24
29.994 380.09 16876 3.075 5.14
30.243 379.86 16872 3.075 5.05
30.493 379.63 16869 3.088 4.96
30.743 379.41 16866 3.1 4.87
30.993 379.2 16862 3.1 4.78
31.243 378.99 16859 3.113 4.69
31.493 378.79 16855 3.113 4.61
31.743 378.59 16852 3.113 4.52
31.993 378.41 16849 3.113 4.44
32.243 378.23 16845 3.125 4.36
32.493 378.05 16842 3.138 4.29
32.743 377.88 16839 3.138 4.21
32.993 377.72 16837 3.138 4.13
33.243 377.5 16834 3.15 4.2
33.493 377.26 16832 3.15 4.27
33.743 377.01 16829 3.15 4.35
33.993 376.75 16827 3.175 4.43
34.243 376.47 16825 3.175 4.52
34.493 376.17 16823 3.163 4.61
34.742 375.86 16822 3.163 4.71
34.992 375.52 16820 3.188 4.82
35.242 375.16 16819 3.188 4.94
35.492 374.76 16818 3.175 5.07
35.742 374.34 16816 3.213 5.22
35.992 373.87 16816 3.2 5.38
36.242 373.34 16815 3.238 5.57
36.492 372.75 16814 3.225 5.8
36.742 372.06 16814 3.213 6.08
36.992 371.22 16813 3.25 6.45

DISCHARGE HYDROGRAPH FOR KAMENG RIVER ... STATION NUMBER 3
BELOW TALONG DAM AT KM .25 GAGE ZERO = 411.50 M MAX ELEVATION REACHED BY FLOOD WAVE = 440.07 M MAX STAGE = 28.57 M AT TIME = .500 HOURS MAX FLOW = 24971 CMS AT TIME = .287 HOURS TIME STAGE FLOW HR M CMS 0 5000 10000 15000 20000 25000 .0 19.6 10455 . . .* . . . .1 20.4 11811 . . . * . . . .2 24.0 18496 . . . . * . . .3 27.6 24896 . . . . . * .4 28.4 23977 . . . . . * . .5 28.6 23282 . . . . . * . .6 28.5 22647 . . . . . * . .7 28.3 22054 . . . . . * . .8 28.0 21503 . . . . . * . .9 27.7 20994 . . . . . * . 1.0 27.5 20523 . . . . .* . 1.1 27.2 20086 . . . . * . 1.2 26.9 19678 . . . . *. . 1.3 26.7 19295 . . . . *. . 1.4 26.4 18935 . . . . * . . 1.5 26.2 18597 . . . . * . . 1.6 26.0 18279 . . . . * . . 1.7 25.8 17980 . . . . * . . 1.8 25.6 17697 . . . . * . . 1.9 25.4 17427 . . . . * . . 2.0 25.2 17169 . . . . * . . 2.1 25.0 16926 . . . . * . . 2.2 24.8 16689 . . . . * . . 2.3 24.7 16460 . . . . * . . 2.4 24.5 16240 . . . . * . . 2.5 24.4 16024 . . . . * . . 2.6 24.2 15817 . . . . * . . 2.7 24.1 15611 . . . .* . . 2.8 23.9 15414 . . . .* . . 2.9 23.8 15219 . . . * . . 3.0 23.6 15029 . . . * . . 3.1 23.5 14844 . . . * . . 3.2 23.3 14659 . . . *. . . 3.3 23.2 14481 . . . *. . . 3.4 23.1 14304 . . . *. . . 3.5 22.9 14129 . . . * . . . 3.6 22.8 13959 . . . * . . . 3.7 22.7 13789 . . . * . . . 3.8 22.5 13620 . . . * . . . 3.9 22.4 13456 . . . * . . . 4.0 22.3 13291 . . . * . . . 4.1 22.1 13127 . . . * . . . 4.2 22.0 12968 . . . * . . . 4.3 21.9 12810 . . . * . . . 4.4 21.7 12652 . . . * . . . 4.5 21.6 12495 . . . * . . . 4.6 21.5 12343 . . . * . . . 4.7 21.3 12190 . . . * . . . 4.8 21.2 12037 . . . * . . . 4.9 21.1 11887 . . . * . . . 5.0 21.0 11740 . . . * . . .

DISCHARGE HYDROGRAPH FOR KAMENG RIVER ... STATION NUMBER 5 BELOW TALONG DAM AT KM .80 GAGE ZERO = 409.50 M MAX ELEVATION REACHED BY FLOOD WAVE = 436.73 M MAX STAGE = 27.23 M AT TIME = .600 HOURS MAX FLOW = 24779 CMS AT TIME = .275 HOURS TIME STAGE FLOW HR M CMS 0 5000 10000 15000 20000 25000 .0 19.6 10455 . . .* . . . .1 19.8 11576 . . . * . . . .2 21.4 17636 . . . . * . . .3 25.0 24249 . . . . . * . .4 26.6 23784 . . . . . * . .5 27.1 23218 . . . . . * . .6 27.2 22661 . . . . . * . .7 27.1 22105 . . . . . * . .8 27.0 21569 . . . . . * . .9 26.7 21065 . . . . . * . 1.0 26.5 20595 . . . . .* . 1.1 26.3 20155 . . . . * . 1.2 26.1 19743 . . . . *. . 1.3 25.8 19358 . . . . *. . 1.4 25.6 18995 . . . . * . . 1.5 25.4 18654 . . . . * . . 1.6 25.2 18333 . . . . * . . 1.7 25.1 18031 . . . . * . . 1.8 24.9 17746 . . . . * . . 1.9 24.7 17473 . . . . * . . 2.0 24.5 17213 . . . . * . . 2.1 24.4 16969 . . . . * . . 2.2 24.2 16731 . . . . * . . 2.3 24.1 16501 . . . . * . . 2.4 24.0 16279 . . . . * . . 2.5 23.8 16062 . . . . * . . 2.6 23.7 15854 . . . . * . . 2.7 23.6 15648 . . . .* . . 2.8 23.4 15450 . . . .* . . 2.9 23.3 15254 . . . .* . . 3.0 23.2 15064 . . . * . . 3.1 23.1 14877 . . . * . . 3.2 22.9 14692 . . . *. . . 3.3 22.8 14514 . . . *. . . 3.4 22.7 14337 . . . *. . . 3.5 22.6 14162 . . . * . . . 3.6 22.5 13991 . . . * . . . 3.7 22.3 13820 . . . * . . . 3.8 22.2 13652 . . . * . . . 3.9 22.1 13487 . . . * . . . 4.0 22.0 13322 . . . * . . . 4.1 21.9 13158 . . . * . . . 4.2 21.8 12999 . . . * . . . 4.3 21.6 12841 . . . * . . . 4.4 21.5 12682 . . . * . . . 4.5 21.4 12526 . . . * . . . 4.6 21.3 12373 . . . * . . . 4.7 21.2 12220 . . . * . . . 4.8 21.1 12068 . . . * . . . 4.9 21.0 11917 . . . * . . . 5.0 20.8 11770 . . . * . . .

DISCHARGE HYDROGRAPH FOR KAMENG RIVER ... STATION NUMBER 22 BELOW TALONG DAM AT KM 5.00 GAGE ZERO = 399.00 M MAX ELEVATION REACHED BY FLOOD WAVE = 427.15 M MAX STAGE = 28.15 M AT TIME = .675 HOURS MAX FLOW = 22633 CMS AT TIME = .600 HOURS TIME STAGE FLOW HR M CMS 0 5000 10000 15000 20000 25000 .0 20.8 10455 . . .* . . . .1 20.8 10482 . . .* . . . .2 21.3 11495 . . . * . . . .3 24.0 16673 . . . . * . . .4 26.6 20975 . . . . . * . .5 27.7 22346 . . . . . * . .6 28.1 22633 . . . . . * . .7 28.1 22475 . . . . . * . .8 28.0 22121 . . . . . * . .9 27.9 21688 . . . . . * . 1.0 27.6 21233 . . . . . * . 1.1 27.4 20783 . . . . . * . 1.2 27.2 20348 . . . . .* . 1.3 27.0 19935 . . . . * . 1.4 26.8 19543 . . . . *. . 1.5 26.6 19174 . . . . * . . 1.6 26.4 18827 . . . . * . . 1.7 26.2 18499 . . . . * . . 1.8 26.0 18189 . . . . * . . 1.9 25.8 17896 . . . . * . . 2.0 25.7 17619 . . . . * . . 2.1 25.5 17354 . . . . * . . 2.2 25.4 17102 . . . . * . . 2.3 25.2 16860 . . . . * . . 2.4 25.1 16626 . . . . * . . 2.5 24.9 16401 . . . . * . . 2.6 24.8 16182 . . . . * . . 2.7 24.7 15971 . . . . * . . 2.8 24.5 15763 . . . . * . . 2.9 24.4 15563 . . . .* . . 3.0 24.3 15365 . . . .* . . 3.1 24.2 15174 . . . * . . 3.2 24.0 14986 . . . * . . 3.3 23.9 14801 . . . * . . 3.4 23.8 14621 . . . *. . . 3.5 23.7 14443 . . . *. . . 3.6 23.6 14268 . . . *. . . 3.7 23.5 14095 . . . * . . . 3.8 23.4 13925 . . . * . . . 3.9 23.2 13756 . . . * . . . 4.0 23.1 13590 . . . * . . . 4.1 23.0 13426 . . . * . . . 4.2 22.9 13262 . . . * . . . 4.3 22.8 13102 . . . * . . . 4.4 22.7 12943 . . . * . . . 4.5 22.6 12785 . . . * . . . 4.6 22.5 12629 . . . * . . . 4.7 22.3 12475 . . . * . . . 4.8 22.2 12323 . . . * . . . 4.9 22.1 12170 . . . * . . . 5.0 22.0 12020 . . . * . . .

DISCHARGE HYDROGRAPH FOR KAMENG RIVER ... STATION NUMBER 77 BELOW TALONG DAM AT KM 19.00 GAGE ZERO = 369.50 M MAX ELEVATION REACHED BY FLOOD WAVE = 397.97 M MAX STAGE = 28.47 M AT TIME = 2.563 HOURS MAX FLOW = 16986 CMS AT TIME = 2.388 HOURS TIME STAGE FLOW HR M CMS 0 5000 10000 15000 20000 25000 .0 23.2 10455 . . .* . . . .2 23.2 10455 . . .* . . . .4 23.2 10455 . . .* . . . .6 23.3 10668 . . .* . . . .8 24.3 12390 . . . * . . . 1.0 25.6 14126 . . . * . . . 1.2 26.6 15201 . . . * . . 1.4 27.3 15897 . . . . * . . 1.6 27.7 16364 . . . . * . . 1.8 28.1 16673 . . . . * . . 2.0 28.3 16863 . . . . * . . 2.2 28.4 16960 . . . . * . . 2.4 28.5 16985 . . . . * . . 2.6 28.5 16953 . . . . * . . 2.8 28.4 16875 . . . . * . . 3.0 28.4 16759 . . . . * . . 3.2 28.3 16611 . . . . * . . 3.4 28.2 16437 . . . . * . . 3.6 28.1 16242 . . . . * . . 3.8 27.9 16028 . . . . * . . 4.0 27.7 15800 . . . . * . . 4.2 27.6 15558 . . . .* . . 4.4 27.4 15306 . . . .* . . 4.6 27.2 15044 . . . * . . 4.8 27.0 14775 . . . * . . 5.0 26.8 14500 . . . *. . . 5.2 26.6 14220 . . . * . . . 5.4 26.4 13936 . . . * . . . 5.6 26.1 13649 . . . * . . . 5.8 25.9 13361 . . . * . . . 6.0 25.7 13071 . . . * . . . 6.2 25.4 12780 . . . * . . . 6.4 25.2 12491 . . . * . . . 6.6 24.9 12220 . . . * . . . 6.8 24.7 11979 . . . * . . . 7.0 24.5 11767 . . . * . . . 7.2 24.3 11583 . . . * . . . 7.4 24.2 11422 . . . * . . . 7.6 24.0 11283 . . . * . . . 7.8 23.9 11162 . . . * . . . 8.0 23.8 11058 . . . * . . . 8.2 23.7 10969 . . . * . . . 8.4 23.6 10892 . . . * . . . 8.6 23.6 10826 . . . * . . .

DISCHARGE HYDROGRAPH FOR KAMENG RIVER ... STATION NUMBER 133 BELOW TALONG DAM AT KM 32.99 GAGE ZERO = 353.00 M MAX ELEVATION REACHED BY FLOOD WAVE = 377.72 M MAX STAGE = 24.72 M AT TIME = 3.138 HOURS MAX FLOW = 16837 CMS AT TIME = 2.988 HOURS TIME STAGE FLOW HR M CMS 0 5000 10000 15000 20000 25000 .0 19.9 10455 . . .* . . . .2 19.9 10455 . . .* . . . .4 19.9 10455 . . .* . . . .6 19.9 10455 . . .* . . . .8 19.9 10481 . . .* . . . 1.0 20.2 10988 . . . * . . . 1.2 20.9 12141 . . . * . . . 1.4 21.7 13359 . . . * . . . 1.6 22.6 14388 . . . *. . . 1.8 23.2 15195 . . . * . . 2.0 23.7 15803 . . . . * . . 2.2 24.1 16237 . . . . * . . 2.4 24.4 16531 . . . . * . . 2.6 24.6 16715 . . . . * . . 2.8 24.7 16812 . . . . * . . 3.0 24.7 16837 . . . . * . . 3.2 24.7 16806 . . . . * . . 3.4 24.7 16728 . . . . * . . 3.6 24.6 16612 . . . . * . . 3.8 24.6 16465 . . . . * . . 4.0 24.4 16292 . . . . * . . 4.2 24.3 16098 . . . . * . . 4.4 24.2 15886 . . . . * . . 4.6 24.0 15659 . . . .* . . 4.8 23.9 15419 . . . .* . . 5.0 23.7 15169 . . . * . . 5.2 23.5 14911 . . . * . . 5.4 23.4 14646 . . . *. . . 5.6 23.2 14374 . . . *. . . 5.8 23.0 14099 . . . * . . . 6.0 22.8 13820 . . . * . . . 6.2 22.6 13538 . . . * . . . 6.4 22.3 13255 . . . * . . . 6.6 22.1 12970 . . . * . . . 6.8 21.9 12691 . . . * . . . 7.0 21.7 12426 . . . * . . . 7.2 21.5 12182 . . . * . . . 7.4 21.3 11959 . . . * . . . 7.6 21.1 11761 . . . * . . . 7.8 21.0 11584 . . . * . . . 8.0 20.8 11428 . . . * . . . 8.2 20.7 11292 . . . * . . . 8.4 20.6 11173 . . . * . . . 8.6 20.5 11070 . . . * . . .

ANALYSIS OF THE DOWNSTREAM FLOOD HYDROGRAPH PRODUCED BY THE DAM BREAK (SPF) OF TALONG DAM ON KAMENG RIVER ANALYSIS BY RSET BASED ON PROCEDURE DEVELOPED BY DANNY L. FREAD, PH.D., SR. RESEARCH HYDROLOGIST QUALITY CONTROL TESTING AND OTHER SUPPORT BY JANICE M. LEWIS, RESEARCH HYDROLOGIST HYDROLOGIC RESEARCH LABORATORY W23, OFFICE OF HYDROLOGY NOAA, NATIONAL WEATHER SERVICE SILVER SPRING, MARYLAND 20910

INFLOW HYDROGRAPH TO TALONG DAM ******************************************* 13545.00 13153.00 12329.00 11228.00 10041.00 8972.00 8052.00 7264.00 6568.00 5932.00 5337.00 4782.00 4265.00 3783.00 3328.00 2893.00 2476.00 2084.00 1721.00 1389.00 1093.00 832.00 604.00 423.00 290.00 207.00 159.00 141.00 141.00 141.00 141.00 141.00 141.00 141.00 141.00 141.00 TIME OF INFLOW HYDROGRAPH ORDINATES .0000 1.0000 2.0000 3.0000 4.0000 5.0000 6.0000 7.0000 8.0000 9.0000 10.0000 11.0000 12.0000 13.0000 14.0000 15.0000 16.0000 17.0000 18.0000 19.0000 20.0000 21.0000 22.0000 23.0000 24.0000 25.0000 26.0000 27.0000 28.0000 29.0000 30.0000 31.0000 32.0000 33.0000 34.0000 35.0000

RESERVOIR DEPLETION TABLE I K TTP(I) Q(I) H2 YB D SUB VCOR OUTVOL BB COFR QI(I) QBRECH QSPIL *** ** ****** ******** ******* ******* ******* **** **** ********* **** **** ***** ****** ***** 1 0 .000 10454 490.00 490.00 431.13 1.00 1.00 .0 .0 3.10 13545. 0. 10455. 2 2 .005 10453 489.98 489.51 431.12 1.00 1.06 .2 1.4 3.10 13543. 1. 10453. 3 2 .010 10459 490.00 489.02 431.13 1.00 1.03 .4 2.8 3.10 13541. 5. 10454. 4 1 .015 10470 490.01 488.53 431.13 1.00 1.02 .6 4.2 3.10 13539. 13. 10457. 5 1 .020 10486 490.03 488.04 431.14 1.00 1.01 .8 5.6 3.10 13537. 27. 10459. 6 1 .025 10510 490.04 487.55 431.16 1.00 1.01 .9 7.0 3.10 13535. 48. 10462. 7 1 .030 10540 490.06 487.06 431.17 1.00 1.01 1.1 8.4 3.10 13533. 75. 10465. 8 1 .035 10579 490.07 486.57 431.20 1.00 1.01 1.3 9.8 3.10 13531. 111. 10468. 9 1 .040 10626 490.09 486.08 431.22 1.00 1.01 1.5 11.2 3.10 13529. 155. 10472. 10 1 .045 10682 490.10 485.59 431.25 1.00 1.01 1.7 12.6 3.10 13527. 208. 10475. 11 1 .050 10748 490.11 485.10 431.29 1.00 1.01 1.9 14.0 3.10 13525. 271. 10478. 12 1 .055 10824 490.13 484.61 431.33 1.00 1.01 2.1 15.4 3.10 13523. 344. 10481. 13 1 .060 10911 490.14 484.12 431.38 1.00 1.00 2.3 16.8 3.10 13521. 427. 10484. 14 1 .065 10994 490.15 483.63 431.43 1.00 1.00 2.5 18.2 3.10 13520. 521. 10474. 15 1 .070 11076 490.16 483.14 431.47 1.00 1.00 2.7 19.6 3.10 13518. 627. 10449. 16 1 .075 11168 490.17 482.65 431.52 1.00 1.00 2.9 21.0 3.10 13516. 745. 10424. 17 1 .080 11273 490.19 482.16 431.58 1.00 1.00 3.1 22.4 3.10 13514. 876. 10398. 18 1 .085 11391 490.20 481.67 431.65 1.00 1.00 3.3 23.8 3.10 13512. 1018. 10373. 19 1 .090 11522 490.21 481.18 431.72 1.00 1.00 3.5 25.2 3.10 13510. 1174. 10348. 20 1 .095 11665 490.22 480.69 431.80 1.00 1.00 3.7 26.6 3.10 13508. 1344. 10322. 21 1 .100 11822 490.22 480.20 431.88 1.00 1.00 3.9 28.0 3.10 13506. 1527. 10296. 22 1 .105 11993 490.23 479.71 431.97 1.00 1.00 4.1 29.4 3.10 13504. 1724. 10270. 23 1 .110 12178 490.24 479.22 432.07 1.00 1.00 4.3 30.8 3.10 13502. 1935. 10244. 24 1 .115 12378 490.24 478.73 432.18 1.00 1.00 4.6 32.2 3.10 13500. 2161. 10217. 25 1 .120 12592 490.25 478.24 432.29 1.00 1.00 4.8 33.6 3.10 13498. 2402. 10190. 26 1 .125 12820 490.25 477.75 432.41 1.00 1.00 5.0 35.0 3.10 13496. 2658. 10163. 27 1 .130 13092 490.26 477.26 432.55 1.00 1.00 5.3 36.4 3.10 13494. 2929. 10164. 28 1 .135 13379 490.26 476.77 432.70 1.00 1.00 5.5 37.8 3.10 13492. 3216. 10164. 29 1 .140 13681 490.26 476.28 432.85 1.00 1.00 5.7 39.2 3.10 13490. 3518. 10163. 30 1 .145 13999 490.25 475.79 433.01 1.00 1.00 6.0 40.6 3.10 13488. 3836. 10163. 31 1 .150 14332 490.25 475.30 433.17 1.00 1.00 6.2 42.0 3.10 13486. 4171. 10161. 32 1 .155 14681 490.25 474.81 433.35 1.00 1.00 6.5 43.4 3.10 13484. 4522. 10160. 33 1 .160 15046 490.24 474.32 433.52 1.00 1.00 6.8 44.8 3.10 13482. 4889. 10158. 34 1 .165 15427 490.23 473.83 433.71 1.00 1.00 7.0 46.2 3.10 13480. 5272. 10155. 35 1 .170 15824 490.22 473.34 433.90 1.00 1.00 7.3 47.6 3.10 13478. 5672. 10152. 36 1 .175 16238 490.21 472.85 434.09 1.00 1.00 7.6 49.0 3.10 13476. 6089. 10149. 37 1 .180 16668 490.19 472.36 434.29 1.00 1.00 7.9 50.4 3.10 13474. 6523. 10145. 38 1 .185 17115 490.18 471.87 434.50 1.00 1.00 8.2 51.8 3.10 13472. 6974. 10141.

39 1 .190 17578 490.16 471.38 434.71 1.00 1.00 8.5 53.2 3.10 13471. 7441. 10137. 40 1 .195 18057 490.14 470.89 434.92 1.00 1.00 8.8 54.6 3.10 13469. 7926. 10132. 41 1 .200 18554 490.12 470.40 435.14 1.00 1.00 9.2 56.0 3.10 13467. 8428. 10127. 42 1 .205 19067 490.09 469.91 435.37 1.00 1.00 9.5 57.4 3.10 13465. 8947. 10121. 43 1 .210 19598 490.06 469.42 435.60 1.00 1.00 9.9 58.8 3.10 13463. 9482. 10116. 44 1 .215 20145 490.03 468.93 435.83 1.00 1.00 10.2 60.2 3.10 13461. 10035. 10110. 45 1 .220 20710 490.00 468.44 436.07 1.00 1.01 10.6 61.6 3.10 13459. 10605. 10105. 46 1 .225 21292 489.96 467.95 436.31 1.00 1.01 11.0 63.0 3.10 13457. 11192. 10100. 47 1 .230 21891 489.92 467.46 436.56 1.00 1.01 11.4 64.4 3.10 13455. 11796. 10095. 48 1 .235 22507 489.88 466.97 436.81 1.00 1.01 11.8 65.8 3.10 13453. 12417. 10090. 49 2 .240 23139 489.83 466.48 437.06 1.00 1.01 12.2 67.2 3.10 13451. 13055. 10084. 50 2 .245 23787 489.78 465.99 437.32 1.00 1.01 12.6 68.6 3.10 13449. 13710. 10078. 51 2 .250 24451 489.73 465.50 437.58 1.00 1.01 13.0 70.0 3.10 13447. 14381. 10071. 52 1 .255 24400 489.68 465.50 437.56 1.00 1.01 13.5 70.0 3.10 13445. 14336. 10064. 53 1 .260 24346 489.62 465.50 437.54 1.00 1.01 13.9 70.0 3.10 13443. 14289. 10057. 54 1 .265 24292 489.57 465.50 437.52 1.00 1.01 14.3 70.0 3.10 13441. 14242. 10051. 55 1 .270 24238 489.52 465.50 437.49 1.00 1.01 14.8 70.0 3.10 13439. 14195. 10044. 56 1 .275 24184 489.47 465.50 437.47 1.00 1.01 15.2 70.0 3.10 13437. 14148. 10037. 57 1 .280 24131 489.41 465.50 437.45 1.00 1.01 15.6 70.0 3.10 13435. 14101. 10030. 58 1 .285 24078 489.36 465.50 437.43 1.00 1.01 16.1 70.0 3.10 13433. 14055. 10023. 59 1 .290 24025 489.31 465.50 437.41 1.00 1.01 16.5 70.0 3.10 13431. 14009. 10017. 60 1 .295 23972 489.26 465.50 437.39 1.00 1.01 16.9 70.0 3.10 13429. 13962. 10010. 61 1 .300 23919 489.20 465.50 437.37 1.00 1.01 17.4 70.0 3.10 13427. 13917. 10003. 62 1 .305 23867 489.15 465.50 437.35 1.00 1.01 17.8 70.0 3.10 13425. 13871. 9997. 63 1 .310 23815 489.10 465.50 437.33 1.00 1.01 18.2 70.0 3.10 13423. 13826. 9990. 64 1 .315 23763 489.05 465.50 437.31 1.00 1.01 18.7 70.0 3.10 13422. 13780. 9983. 65 1 .320 23711 489.00 465.50 437.29 1.00 1.01 19.1 70.0 3.10 13420. 13735. 9977. 66 1 .325 23660 488.95 465.50 437.27 1.00 1.01 19.5 70.0 3.10 13418. 13691. 9970. 67 1 .330 23609 488.89 465.50 437.25 1.00 1.01 19.9 70.0 3.10 13416. 13646. 9963. 68 1 .335 23558 488.84 465.50 437.23 1.00 1.01 20.4 70.0 3.10 13414. 13602. 9957. 69 1 .340 23507 488.79 465.50 437.21 1.00 1.01 20.8 70.0 3.10 13412. 13557. 9950. 70 1 .345 23456 488.74 465.50 437.19 1.00 1.01 21.2 70.0 3.10 13410. 13513. 9944. 71 1 .350 23406 488.69 465.50 437.17 1.00 1.01 21.6 70.0 3.10 13408. 13469. 9937. 72 1 .355 23356 488.64 465.50 437.15 1.00 1.01 22.1 70.0 3.10 13406. 13426. 9931. 73 1 .360 23306 488.59 465.50 437.13 1.00 1.01 22.5 70.0 3.10 13404. 13382. 9924. 74 1 .365 23256 488.54 465.50 437.11 1.00 1.01 22.9 70.0 3.10 13402. 13339. 9918. 75 1 .370 23207 488.49 465.50 437.09 1.00 1.01 23.3 70.0 3.10 13400. 13296. 9911. 76 1 .375 23157 488.44 465.50 437.07 1.00 1.01 23.7 70.0 3.10 13398. 13253. 9905. 77 1 .380 23108 488.39 465.50 437.05 1.00 1.01 24.1 70.0 3.10 13396. 13211. 9898. 78 1 .385 23059 488.35 465.50 437.03 1.00 1.01 24.6 70.0 3.10 13394. 13168. 9892. 79 1 .390 23011 488.30 465.50 437.01 1.00 1.01 25.0 70.0 3.10 13392. 13126. 9885. 80 1 .395 22962 488.25 465.50 436.99 1.00 1.01 25.4 70.0 3.10 13390. 13084. 9879. 81 1 .400 22914 488.20 465.50 436.97 1.00 1.01 25.8 70.0 3.10 13388. 13042. 9873.

82 1 .405 22866 488.15 465.50 436.95 1.00 1.01 26.2 70.0 3.10 13386. 13000. 9866. 83 1 .410 22818 488.10 465.50 436.93 1.00 1.01 26.6 70.0 3.10 13384. 12958. 9860. 84 1 .415 22770 488.05 465.50 436.91 1.00 1.01 27.0 70.0 3.10 13382. 12917. 9854. 85 1 .420 22723 488.01 465.50 436.89 1.00 1.01 27.4 70.0 3.10 13380. 12876. 9847. 86 1 .425 22676 487.96 465.50 436.88 1.00 1.01 27.9 70.0 3.10 13378. 12835. 9841. 87 1 .430 22629 487.91 465.50 436.86 1.00 1.01 28.3 70.0 3.10 13376. 12794. 9835. 88 1 .435 22582 487.86 465.50 436.84 1.00 1.01 28.7 70.0 3.10 13374. 12754. 9829. 89 1 .440 22535 487.82 465.50 436.82 1.00 1.01 29.1 70.0 3.10 13373. 12713. 9823. 90 1 .445 22489 487.77 465.50 436.80 1.00 1.01 29.5 70.0 3.10 13371. 12673. 9816. 91 1 .450 22442 487.72 465.50 436.78 1.00 1.01 29.9 70.0 3.10 13369. 12633. 9810. 92 1 .455 22396 487.68 465.50 436.76 1.00 1.01 30.3 70.0 3.10 13367. 12593. 9804. 93 1 .460 22351 487.63 465.50 436.74 1.00 1.01 30.7 70.0 3.10 13365. 12553. 9798. 94 1 .465 22305 487.58 465.50 436.73 1.00 1.01 31.1 70.0 3.10 13363. 12514. 9792. 95 1 .470 22259 487.54 465.50 436.71 1.00 1.01 31.5 70.0 3.10 13361. 12474. 9786. 96 1 .475 22214 487.49 465.50 436.69 1.00 1.01 31.9 70.0 3.10 13359. 12435. 9780. 97 1 .480 22169 487.44 465.50 436.67 1.00 1.01 32.3 70.0 3.10 13357. 12396. 9773. 98 1 .485 22124 487.40 465.50 436.65 1.00 1.01 32.7 70.0 3.10 13355. 12357. 9767. 99 1 .490 22080 487.35 465.50 436.63 1.00 1.01 33.1 70.0 3.10 13353. 12319. 9761. 100 1 .495 22035 487.31 465.50 436.62 1.00 1.01 33.5 70.0 3.10 13351. 12280. 9755. 101 1 .500 21991 487.26 465.50 436.60 1.00 1.01 33.9 70.0 3.10 13349. 12242. 9749. 102 1 .505 21947 487.22 465.50 436.58 1.00 1.01 34.3 70.0 3.10 13347. 12204. 9743. 103 2 .510 21899 487.17 465.50 436.56 1.00 1.01 34.7 70.0 3.10 13345. 12162. 9737. 104 2 .517 21846 487.11 465.50 436.54 1.00 1.01 35.2 70.0 3.10 13343. 12117. 9730. 105 2 .523 21788 487.05 465.50 436.52 1.00 1.01 35.7 70.0 3.10 13340. 12067. 9722. 106 2 .531 21725 486.99 465.50 436.49 1.00 1.01 36.3 70.0 3.10 13337. 12012. 9713. 107 2 .539 21656 486.92 465.50 436.46 1.00 1.01 36.9 70.0 3.10 13334. 11953. 9704. 108 2 .547 21580 486.84 465.50 436.43 1.00 1.01 37.6 70.0 3.10 13330. 11887. 9693. 109 2 .557 21498 486.75 465.50 436.40 1.00 1.01 38.4 70.0 3.10 13327. 11817. 9682. 110 2 .568 21408 486.66 465.50 436.36 1.00 1.01 39.2 70.0 3.10 13322. 11739. 9669. 111 2 .580 21311 486.56 465.50 436.32 1.00 1.01 40.1 70.0 3.10 13318. 11655. 9656. 112 2 .593 21204 486.45 465.50 436.27 1.00 1.01 41.1 70.0 3.10 13313. 11564. 9641. 113 2 .607 21089 486.33 465.50 436.23 1.00 1.01 42.2 70.0 3.10 13307. 11464. 9625. 114 2 .623 20963 486.20 465.50 436.17 1.00 1.01 43.4 70.0 3.10 13301. 11356. 9607. 115 2 .640 20827 486.06 465.50 436.12 1.00 1.01 44.7 70.0 3.10 13294. 11239. 9588. 116 2 .659 20680 485.90 465.50 436.06 1.00 1.01 46.1 70.0 3.10 13287. 11113. 9568. 117 2 .680 20521 485.73 465.50 435.99 1.00 1.01 47.6 70.0 3.10 13279. 10977. 9545. 118 2 .703 20349 485.55 465.50 435.92 1.00 1.01 49.3 70.0 3.10 13270. 10830. 9520. 119 2 .728 20165 485.36 465.50 435.84 1.00 1.01 51.2 70.0 3.10 13260. 10671. 9494. 120 2 .756 19966 485.15 465.50 435.75 1.00 1.01 53.2 70.0 3.10 13249. 10502. 9465. 121 2 .786 19754 484.92 465.50 435.66 1.00 1.01 55.4 70.0 3.10 13237. 10320. 9434. 122 2 .820 19526 484.67 465.50 435.57 1.00 1.01 57.7 70.0 3.10 13224. 10126. 9401. 123 2 .857 19284 484.41 465.50 435.46 1.00 1.01 60.3 70.0 3.10 13209. 9920. 9365. 124 2 .898 19027 484.13 465.50 435.35 1.00 1.01 63.1 70.0 3.10 13193. 9702. 9326.

125 2 .942 18755 483.84 465.50 435.23 1.00 1.01 66.2 70.0 3.10 13176. 9471. 9285. 126 2 .992 18468 483.52 465.50 435.10 1.00 1.01 69.5 70.0 3.10 13156. 9228. 9241. 127 2 1.046 18167 483.19 465.50 434.97 1.00 1.01 73.0 70.0 3.10 13115. 8973. 9194. 128 2 1.105 17851 482.84 465.50 434.83 1.00 1.01 76.9 70.0 3.10 13066. 8707. 9145. 129 2 1.171 17521 482.47 465.50 434.68 1.00 1.01 81.1 70.0 3.10 13012. 8429. 9092. 130 2 1.243 17179 482.08 465.50 434.52 1.00 1.01 85.6 70.0 3.10 12953. 8142. 9037. 131 2 1.322 16824 481.67 465.50 434.36 1.00 1.01 90.4 70.0 3.10 12887. 7846. 8979. 132 2 1.410 16461 481.25 465.50 434.19 1.00 1.01 95.7 70.0 3.10 12815. 7543. 8918. 133 2 1.506 16089 480.82 465.50 434.02 1.00 1.01 101.3 70.0 3.10 12736. 7234. 8856. 134 2 1.611 15713 480.38 465.50 433.84 1.00 1.01 107.3 70.0 3.10 12649. 6923. 8791. 135 2 1.727 15334 479.93 465.50 433.66 1.00 1.01 113.8 70.0 3.10 12554. 6610. 8724. 136 2 1.855 14955 479.47 465.50 433.48 1.00 1.01 120.8 70.0 3.10 12448. 6299. 8656. 137 1 1.996 14581 479.01 465.50 433.30 1.00 1.01 128.3 70.0 3.10 12333. 5994. 8588. 138 1 2.150 14210 478.56 465.50 433.11 1.00 1.01 136.3 70.0 3.10 12164. 5692. 8519. 139 2 2.320 13839 478.09 465.50 432.93 1.00 1.01 144.9 70.0 3.10 11976. 5391. 8448. 140 2 2.507 13467 477.62 465.50 432.74 1.00 1.01 154.0 70.0 3.10 11771. 5092. 8376. 141 2 2.713 13095 477.14 465.50 432.55 1.00 1.01 163.9 70.0 3.10 11544. 4794. 8302. 142 2 2.939 12721 476.65 465.50 432.36 1.00 1.01 174.4 70.0 3.10 11295. 4496. 8226. 143 2 3.188 12340 476.15 465.50 432.16 1.00 1.01 185.6 70.0 3.10 11005. 4194. 8146. 144 2 3.462 11946 475.62 465.50 431.95 1.00 1.01 197.6 70.0 3.10 10680. 3885. 8062. 145 2 3.763 11535 475.05 465.50 431.73 1.00 1.01 210.3 70.0 3.10 10322. 3565. 7971. 146 2 4.095 11103 474.45 465.50 431.49 1.00 1.01 223.8 70.0 3.10 9940. 3232. 7872. 147 2 4.459 10653 473.80 465.50 431.24 1.00 1.01 238.1 70.0 3.10 9550. 2889. 7765. 148 2 4.860 10184 473.11 465.50 430.97 1.00 1.01 253.1 70.0 3.10 9122. 2536. 7649. 149 2 5.301 9697 472.37 465.50 430.69 1.00 1.01 268.9 70.0 3.10 8695. 2175. 7523. 150 2 5.786 9198 471.58 465.50 430.39 1.00 1.01 285.4 70.0 3.10 8249. 1812. 7386. 151 2 6.320 8689 470.74 465.50 430.08 1.00 1.01 302.6 70.0 3.10 7800. 1451. 7238. 152 2 6.907 8176 469.85 465.50 429.72 1.00 1.01 320.4 70.0 3.10 7338. 1099. 7078. 153 2 7.552 7664 468.91 465.50 429.33 1.00 1.01 338.8 70.0 3.10 6880. 762. 6903. 154 2 8.262 7159 467.89 465.50 428.92 1.00 1.02 357.8 70.0 3.10 6401. 449. 6710. 155 2 9.044 6661 466.76 465.50 428.50 1.00 1.03 377.2 70.0 3.10 5906. 172. 6489. 156 11 9.903 6136 465.04 465.50 428.04 1.00 .92 397.0 70.0 3.10 5395. 0. 6137. 157 11 10.848 3823 456.11 465.50 425.68 1.00 1.00 414.0 70.0 3.10 4866. 0. 3823. 158 11 11.888 0 423.08 465.50 412.54 1.00 1.00 421.1 70.0 3.10 4323. 0. 0. 159 0 12.93 12 160 0 14.07 12 161 0 15.33 12 162 0 16.71 12 163 0 18.24 12 164 0 19.91 12 165 0 21.75 12 166 0 23.78 12 167 0 26.01 12

168 0 28.46 12 169 0 31.16 12 170 0 34.12 12 171 0 37.39 12

PARAMETER UNITS VARIABLE VALUE ******************************************* ******* ****** *********** INITIAL FLOW CMS Q(1) 10455. MAX FLOW CMS QM 24452. FINAL FLOW CMS Q(NU) 12. TIME TO MAX FLOW HRS TP .25 NUMBER OF TIME STEPS NNU 171 TOTAL VOLUME DISCHARGED FROM RESERVOIR MILLION CU M DISVOL 421.
PROFILE OF CRESTS AND TIMES FOR KAMENG RIVER BELOW TALONG DAM
Distance from Dam
(km)
Max Elevation
(m)
Maximum Flow
(cumec)
Time to Max
Flow (hr)
Max Velocity
(m/s)
0.05 439.01 24451 0.475 9.22
0.15 439.34 24275 0.475 5.6
0.25 439.42 24180 0.475 4.28
0.5 436.35 24150 0.55 11.47
0.8 436.18 24005 0.55 9.6
0.975 438.03 23581 0.5 3.1
1.231 437.82 22820 0.5 3.54
1.487 437.47 22430 0.512 4.17
1.743 436.84 22310 0.512 5.19
2 435.29 22205 0.537 7.49
2.25 434.69 22106 0.55 7.47
2.499 434.07 22011 0.55 7.46
2.749 433.45 21921 0.562 7.45
2.999 432.81 21842 0.562 7.43
3.249 432.16 21781 0.575 7.43
3.499 431.49 21734 0.575 7.42
3.749 430.8 21692 0.587 7.42
3.999 430.06 21655 0.587 7.46
4.249 429.28 21621 0.6 7.54
4.499 428.43 21590 0.612 7.69
4.749 427.52 21560 0.612 7.88
4.999 426.57 21528 0.625 8.09
5.249 425.68 21496 0.637 8.07
5.499 424.8 21467 0.65 8.04
5.749 423.94 21438 0.65 8.01
5.999 423.09 21410 0.662 7.97
6.249 422.25 21383 0.675 7.92
6.499 421.43 21358 0.675 7.89
6.749 420.62 21334 0.687 7.84
6.998 419.83 21309 0.7 7.79
7.248 419.05 21287 0.7 7.74

7.498 418.28 21266 0.712 7.68
7.748 417.53 21246 0.712 7.62
7.998 416.78 21227 0.712 7.55
8.248 416.05 21210 0.725 7.48
8.498 415.32 21194 0.725 7.42
8.748 414.6 21180 0.725 7.36
8.998 413.88 21169 0.737 7.3
9.248 413.16 21157 0.737 7.26
9.498 412.42 21149 0.737 7.22
9.748 411.67 21141 0.737 7.2
9.998 410.9 21135 0.75 7.2
10.248 410.08 21129 0.75 7.23
10.498 409.2 21126 0.75 7.31
10.748 408.21 21122 0.762 7.45
10.998 406.98 21118 0.787 7.76
11.255 406.8 21109 0.787 6.61
11.512 406.31 21095 0.8 5.84
11.77 405.68 21076 0.812 5.3
12.027 404.99 21053 0.825 4.9
12.284 404.28 21026 0.837 4.6
12.542 403.56 20996 0.862 4.35
12.799 402.84 20964 0.875 4.14
13.056 402.13 20929 0.9 3.97
13.314 401.42 20891 0.912 3.81
13.571 400.73 20849 0.937 3.68
13.829 400.06 20800 0.987 3.55
14.086 399.59 20739 1.813 3.42
14.343 399.32 20653 1.938 3.29
14.601 399.12 20524 2.013 3.12
14.858 398.98 20330 2.05 2.92
15.115 398.88 20049 2.063 2.68
15.373 398.8 19669 2.075 2.39
15.631 398.73 19203 2.088 2.26
15.89 398.68 18676 2.1 2.13
16.149 398.63 18102 2.1 2
16.408 398.58 17501 2.1 1.88
16.667 398.54 16925 2.1 1.76
16.925 398.51 16422 2.113 1.66
17.184 398.47 16081 2.113 1.6
17.443 398.42 15911 2.113 1.58
17.702 398.38 15816 2.113 1.61
17.961 398.32 15760 2.113 1.69
18.22 398.23 15725 2.113 1.86
18.478 398.1 15704 2.125 2.18
18.737 397.84 15691 2.125 2.85
18.996 397 15684 2.15 4.63
19.246 396.7 15680 2.15 4.67
19.496 396.38 15675 2.163 4.72
19.746 396.07 15671 2.163 4.78

19.996 395.74 15667 2.175 4.84
20.246 395.4 15663 2.188 4.91
20.496 395.05 15660 2.188 4.98
20.746 394.68 15657 2.2 5.06
20.995 394.3 15654 2.2 5.15
21.245 393.91 15651 2.213 5.24
21.495 393.49 15648 2.225 5.34
21.745 393.05 15645 2.225 5.46
21.995 392.59 15643 2.238 5.58
22.245 392.1 15641 2.25 5.72
22.495 391.56 15638 2.263 5.88
22.745 390.98 15636 2.275 6.06
22.995 390.34 15633 2.288 6.28
23.245 389.82 15631 2.3 6.28
23.495 389.3 15628 2.325 6.27
23.745 388.8 15626 2.338 6.26
23.995 388.29 15623 2.35 6.24
24.245 387.79 15620 2.363 6.23
24.495 387.3 15617 2.375 6.22
24.745 386.82 15614 2.4 6.2
24.995 386.34 15611 2.413 6.18
25.245 385.87 15608 2.425 6.16
25.494 385.41 15604 2.438 6.13
25.744 384.96 15601 2.463 6.1
25.994 384.51 15597 2.475 6.07
26.244 384.08 15593 2.488 6.04
26.494 383.66 15589 2.513 6
26.744 383.25 15585 2.525 5.96
26.994 382.85 15581 2.538 5.91
27.244 382.47 15577 2.55 5.87
27.494 382.1 15572 2.563 5.81
27.744 381.74 15568 2.588 5.76
27.994 381.39 15564 2.6 5.7
28.244 381.06 15559 2.613 5.63
28.494 380.74 15555 2.625 5.56
28.744 380.44 15550 2.638 5.49
28.994 380.15 15545 2.65 5.42
29.244 379.88 15541 2.663 5.31
29.494 379.63 15536 2.663 5.21
29.744 379.39 15531 2.675 5.11
29.994 379.15 15526 2.688 5.01
30.243 378.91 15521 2.688 4.92
30.493 378.69 15516 2.7 4.83
30.743 378.47 15511 2.7 4.74
30.993 378.25 15506 2.713 4.66
31.243 378.05 15502 2.725 4.57
31.493 377.85 15497 2.725 4.49
31.743 377.65 15492 2.725 4.41
31.993 377.46 15488 2.738 4.33

32.243 377.28 15483 2.75 4.25
32.493 377.11 15479 2.75 4.17
32.743 376.94 15475 2.763 4.09
32.993 376.78 15471 2.763 4.02
33.243 376.56 15468 2.763 4.08
33.493 376.33 15465 2.763 4.15
33.743 376.08 15461 2.763 4.23
33.993 375.83 15459 2.775 4.31
34.243 375.55 15456 2.775 4.4
34.493 375.26 15453 2.775 4.49
34.742 374.95 15451 2.8 4.59
34.992 374.62 15448 2.8 4.69
35.242 374.26 15446 2.788 4.81
35.492 373.87 15444 2.788 4.94
35.742 373.44 15443 2.813 5.08
35.992 372.98 15442 2.813 5.25
36.242 372.45 15441 2.8 5.44
36.492 371.86 15441 2.838 5.67
36.742 371.17 15439 2.875 5.96
36.992 370.32 15439 2.863 6.34

DISCHARGE HYDROGRAPH FOR KAMENG RIVER ... STATION NUMBER 3 BELOW TALONG DAM AT KM .25 GAGE ZERO = 411.50 M MAX ELEVATION REACHED BY FLOOD WAVE = 439.42 M MAX STAGE = 27.92 M AT TIME = .475 HOURS MAX FLOW = 24180 CMS AT TIME = .263 HOURS TIME STAGE FLOW HR M CMS 0 5000 10000 15000 20000 25000 .0 19.6 10455 . . .* . . . .1 20.3 11661 . . . * . . . .2 23.7 17986 . . . . * . . .3 27.2 24049 . . . . . * . .4 27.9 22910 . . . . . * . .5 27.9 22003 . . . . . * . .6 27.7 21177 . . . . . * . .7 27.4 20412 . . . . .* . .8 27.0 19706 . . . . *. . .9 26.6 19058 . . . . * . . 1.0 26.2 18466 . . . . * . . 1.1 25.9 17922 . . . . * . . 1.2 25.5 17423 . . . . * . . 1.3 25.2 16962 . . . . * . . 1.4 24.9 16536 . . . . * . . 1.5 24.6 16144 . . . . * . . 1.6 24.3 15784 . . . . * . . 1.7 24.0 15452 . . . .* . . 1.8 23.8 15145 . . . * . . 1.9 23.6 14860 . . . * . . 2.0 23.4 14594 . . . *. . . 2.1 23.2 14352 . . . *. . . 2.2 23.0 14122 . . . * . . . 2.3 22.8 13903 . . . * . . . 2.4 22.6 13699 . . . * . . . 2.5 22.5 13500 . . . * . . . 2.6 22.3 13317 . . . * . . . 2.7 22.2 13135 . . . * . . . 2.8 22.0 12967 . . . * . . . 2.9 21.9 12801 . . . * . . . 3.0 21.7 12643 . . . * . . . 3.1 21.6 12489 . . . * . . . 3.2 21.5 12337 . . . * . . . 3.3 21.3 12193 . . . * . . . 3.4 21.2 12049 . . . * . . . 3.5 21.1 11907 . . . * . . . 3.6 21.0 11771 . . . * . . . 3.7 20.9 11634 . . . * . . . 3.8 20.7 11500 . . . * . . . 3.9 20.6 11370 . . . * . . . 4.0 20.5 11239 . . . * . . . 4.1 20.4 11109 . . . * . . . 4.2 20.3 10986 . . . * . . . 4.3 20.2 10862 . . . * . . . 4.4 20.0 10739 . . .* . . . 4.5 19.9 10618 . . .* . . . 4.6 19.8 10501 . . .* . . . 4.7 19.7 10455 . . .* . . . 4.8 19.6 10455 . . .* . . . 4.9 19.6 10455 . . .* . . . 5.0 19.6 10455 . . .* . . .

DISCHARGE HYDROGRAPH FOR KAMENG RIVER ... STATION NUMBER 5 BELOW TALONG DAM AT KM .80 GAGE ZERO = 409.50 M MAX ELEVATION REACHED BY FLOOD WAVE = 436.18 M MAX STAGE = 26.68 M AT TIME = .550 HOURS MAX FLOW = 24006 CMS AT TIME = .275 HOURS TIME STAGE FLOW HR M CMS 0 5000 10000 15000 20000 25000 .0 19.6 10455 . . .* . . . .1 19.8 11445 . . . * . . . .2 21.2 17167 . . . . * . . .3 24.7 23417 . . . . . * . .4 26.2 22751 . . . . . * . .5 26.6 21975 . . . . . * . .6 26.6 21224 . . . . . * . .7 26.4 20493 . . . . .* . .8 26.2 19798 . . . . * . .9 25.8 19154 . . . . * . . 1.0 25.5 18560 . . . . * . . 1.1 25.2 18013 . . . . * . . 1.2 24.9 17507 . . . . * . . 1.3 24.6 17043 . . . . * . . 1.4 24.3 16613 . . . . * . . 1.5 24.1 16216 . . . . * . . 1.6 23.8 15850 . . . . * . . 1.7 23.6 15514 . . . .* . . 1.8 23.4 15203 . . . * . . 1.9 23.2 14914 . . . * . . 2.0 23.0 14645 . . . *. . . 2.1 22.8 14400 . . . *. . . 2.2 22.6 14166 . . . * . . . 2.3 22.5 13945 . . . * . . . 2.4 22.3 13739 . . . * . . . 2.5 22.2 13539 . . . * . . . 2.6 22.0 13353 . . . * . . . 2.7 21.9 13171 . . . * . . . 2.8 21.8 13001 . . . * . . . 2.9 21.6 12834 . . . * . . . 3.0 21.5 12674 . . . * . . . 3.1 21.4 12520 . . . * . . . 3.2 21.3 12367 . . . * . . . 3.3 21.2 12222 . . . * . . . 3.4 21.1 12078 . . . * . . . 3.5 21.0 11936 . . . * . . . 3.6 20.9 11799 . . . * . . . 3.7 20.7 11662 . . . * . . . 3.8 20.6 11527 . . . * . . . 3.9 20.5 11397 . . . * . . . 4.0 20.4 11266 . . . * . . . 4.1 20.3 11136 . . . * . . . 4.2 20.2 11012 . . . * . . . 4.3 20.1 10888 . . . * . . . 4.4 20.0 10765 . . . * . . . 4.5 19.9 10643 . . .* . . . 4.6 19.8 10526 . . .* . . . 4.7 19.7 10456 . . .* . . . 4.8 19.7 10455 . . .* . . . 4.9 19.6 10455 . . .* . . . 5.0 19.6 10455 . . .* . . .
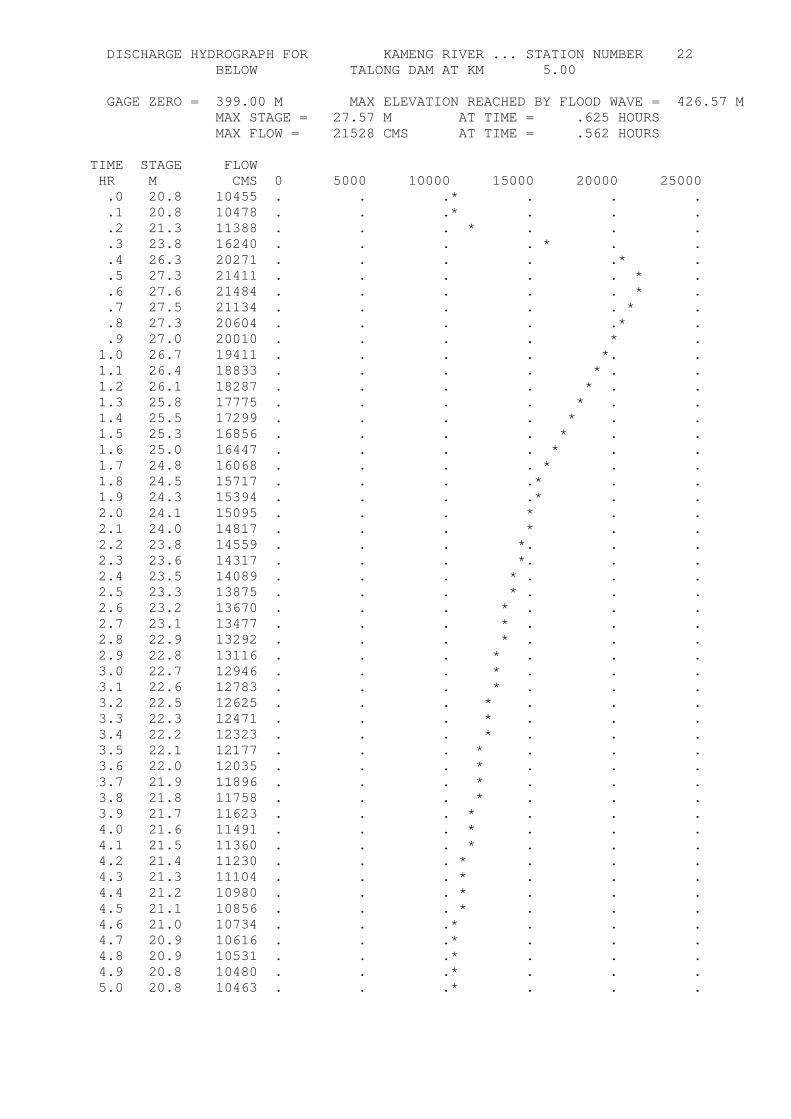
DISCHARGE HYDROGRAPH FOR KAMENG RIVER ... STATION NUMBER 22 BELOW TALONG DAM AT KM 5.00 GAGE ZERO = 399.00 M MAX ELEVATION REACHED BY FLOOD WAVE = 426.57 M MAX STAGE = 27.57 M AT TIME = .625 HOURS MAX FLOW = 21528 CMS AT TIME = .562 HOURS TIME STAGE FLOW HR M CMS 0 5000 10000 15000 20000 25000 .0 20.8 10455 . . .* . . . .1 20.8 10478 . . .* . . . .2 21.3 11388 . . . * . . . .3 23.8 16240 . . . . * . . .4 26.3 20271 . . . . .* . .5 27.3 21411 . . . . . * . .6 27.6 21484 . . . . . * . .7 27.5 21134 . . . . . * . .8 27.3 20604 . . . . .* . .9 27.0 20010 . . . . * . 1.0 26.7 19411 . . . . *. . 1.1 26.4 18833 . . . . * . . 1.2 26.1 18287 . . . . * . . 1.3 25.8 17775 . . . . * . . 1.4 25.5 17299 . . . . * . . 1.5 25.3 16856 . . . . * . . 1.6 25.0 16447 . . . . * . . 1.7 24.8 16068 . . . . * . . 1.8 24.5 15717 . . . .* . . 1.9 24.3 15394 . . . .* . . 2.0 24.1 15095 . . . * . . 2.1 24.0 14817 . . . * . . 2.2 23.8 14559 . . . *. . . 2.3 23.6 14317 . . . *. . . 2.4 23.5 14089 . . . * . . . 2.5 23.3 13875 . . . * . . . 2.6 23.2 13670 . . . * . . . 2.7 23.1 13477 . . . * . . . 2.8 22.9 13292 . . . * . . . 2.9 22.8 13116 . . . * . . . 3.0 22.7 12946 . . . * . . . 3.1 22.6 12783 . . . * . . . 3.2 22.5 12625 . . . * . . . 3.3 22.3 12471 . . . * . . . 3.4 22.2 12323 . . . * . . . 3.5 22.1 12177 . . . * . . . 3.6 22.0 12035 . . . * . . . 3.7 21.9 11896 . . . * . . . 3.8 21.8 11758 . . . * . . . 3.9 21.7 11623 . . . * . . . 4.0 21.6 11491 . . . * . . . 4.1 21.5 11360 . . . * . . . 4.2 21.4 11230 . . . * . . . 4.3 21.3 11104 . . . * . . . 4.4 21.2 10980 . . . * . . . 4.5 21.1 10856 . . . * . . . 4.6 21.0 10734 . . .* . . . 4.7 20.9 10616 . . .* . . . 4.8 20.9 10531 . . .* . . . 4.9 20.8 10480 . . .* . . . 5.0 20.8 10463 . . .* . . .

DISCHARGE HYDROGRAPH FOR KAMENG RIVER ... STATION NUMBER 77 BELOW TALONG DAM AT KM 19.00 GAGE ZERO = 369.50 M MAX ELEVATION REACHED BY FLOOD WAVE = 397.00 M MAX STAGE = 27.50 M AT TIME = 2.150 HOURS MAX FLOW = 15685 CMS AT TIME = 1.975 HOURS TIME STAGE FLOW HR M CMS 0 5000 10000 15000 20000 25000 .0 23.2 10455 . . .* . . . .1 23.2 10455 . . .* . . . .2 23.2 10455 . . .* . . . .3 23.2 10455 . . .* . . . .4 23.2 10455 . . .* . . . .5 23.2 10471 . . .* . . . .6 23.3 10647 . . .* . . . .7 23.6 11301 . . . * . . . .8 24.2 12222 . . . * . . . .9 24.8 13091 . . . * . . . 1.0 25.4 13778 . . . * . . . 1.1 25.9 14296 . . . *. . . 1.2 26.3 14686 . . . *. . . 1.3 26.6 14984 . . . * . . 1.4 26.8 15210 . . . * . . 1.5 27.0 15382 . . . .* . . 1.6 27.2 15509 . . . .* . . 1.7 27.3 15597 . . . .* . . 1.8 27.4 15652 . . . .* . . 1.9 27.4 15680 . . . .* . . 2.0 27.5 15684 . . . .* . . 2.1 27.5 15668 . . . .* . . 2.2 27.5 15634 . . . .* . . 2.3 27.5 15586 . . . .* . . 2.4 27.5 15525 . . . .* . . 2.5 27.4 15453 . . . .* . . 2.6 27.4 15373 . . . .* . . 2.7 27.3 15284 . . . .* . . 2.8 27.3 15188 . . . * . . 2.9 27.2 15087 . . . * . . 3.0 27.1 14980 . . . * . . 3.1 27.0 14869 . . . * . . 3.2 27.0 14754 . . . * . . 3.3 26.9 14637 . . . *. . . 3.4 26.8 14516 . . . *. . . 3.5 26.7 14393 . . . *. . . 3.6 26.6 14269 . . . *. . . 3.7 26.5 14142 . . . * . . . 3.8 26.4 14014 . . . * . . . 3.9 26.3 13885 . . . * . . . 4.0 26.2 13755 . . . * . . . 4.1 26.1 13624 . . . * . . . 4.2 26.0 13494 . . . * . . . 4.3 25.9 13362 . . . * . . . 4.4 25.8 13230 . . . * . . . 4.5 25.7 13098 . . . * . . . 4.6 25.6 12966 . . . * . . . 4.7 25.4 12833 . . . * . . . 4.8 25.3 12700 . . . * . . . 4.9 25.2 12568 . . . * . . . 5.0 25.1 12436 . . . * . . .

DISCHARGE HYDROGRAPH FOR KAMENG RIVER ... STATION NUMBER 133 BELOW TALONG DAM AT KM 32.99 GAGE ZERO = 353.00 M MAX ELEVATION REACHED BY FLOOD WAVE = 376.78 M MAX STAGE = 23.78 M AT TIME = 2.763 HOURS MAX FLOW = 15471 CMS AT TIME = 2.600 HOURS TIME STAGE FLOW HR M CMS 0 5000 10000 15000 20000 25000 .0 19.9 10455 . . .* . . . .2 19.9 10455 . . .* . . . .4 19.9 10455 . . .* . . . .6 19.9 10455 . . .* . . . .8 19.9 10479 . . .* . . . 1.0 20.1 10939 . . . * . . . 1.2 20.8 11979 . . . * . . . 1.4 21.6 13054 . . . * . . . 1.6 22.3 13926 . . . * . . . 1.8 22.8 14571 . . . *. . . 2.0 23.2 15016 . . . * . . 2.2 23.5 15290 . . . .* . . 2.4 23.7 15431 . . . .* . . 2.6 23.8 15471 . . . .* . . 2.8 23.8 15435 . . . .* . . 3.0 23.7 15340 . . . .* . . 3.2 23.7 15201 . . . * . . 3.4 23.6 15028 . . . * . . 3.6 23.4 14831 . . . * . . 3.8 23.3 14615 . . . *. . . 4.0 23.1 14385 . . . *. . . 4.2 23.0 14145 . . . * . . . 4.4 22.8 13898 . . . * . . . 4.6 22.6 13647 . . . * . . . 4.8 22.4 13391 . . . * . . . 5.0 22.2 13133 . . . * . . . 5.2 22.0 12874 . . . * . . . 5.4 21.8 12617 . . . * . . . 5.6 21.6 12367 . . . * . . . 5.8 21.5 12133 . . . * . . . 6.0 21.3 11918 . . . * . . . 6.2 21.1 11726 . . . * . . . 6.4 21.0 11554 . . . * . . . 6.6 20.8 11403 . . . * . . . 6.8 20.7 11270 . . . * . . . 7.0 20.6 11154 . . . * . . . 7.2 20.5 11054 . . . * . . . 7.4 20.4 10967 . . . * . . . 7.6 20.4 10886 . . . * . . . 7.8 20.3 10826 . . . * . . . 8.0 20.2 10772 . . . * . . . 8.2 20.2 10719 . . .* . . . 8.4 20.2 10683 . . .* . . . 8.6 20.1 10650 . . .* . . .

ANALYSIS OF THE DOWNSTREAM FLOOD HYDROGRAPH PRODUCED PMF IN A “NO DAM SCENARIO” ON KAMENG RIVER ANALYSIS BY RSET BASED ON PROCEDURE DEVELOPED BY DANNY L. FREAD, PH.D., SR. RESEARCH HYDROLOGIST QUALITY CONTROL TESTING AND OTHER SUPPORT BY JANICE M. LEWIS, RESEARCH HYDROLOGIST HYDROLOGIC RESEARCH LABORATORY W23, OFFICE OF HYDROLOGY NOAA, NATIONAL WEATHER SERVICE SILVER SPRING, MARYLAND 20910

******************************* ******************************* *** *** *** SUMMARY OF INPUT DATA *** *** *** ******************************* ******************************* INPUT CONTROL PARAMETERS FOR TALONG DAM PARAMETER VARIABLE VALUE *************************************************** ****** ******* NUMBER OF DYNAMIC ROUTING REACHES KKN 9 TYPE OF RESERVOIR ROUTING KUI 0 MULTIPLE DAM INDICATOR MULDAM 0 PRINTING INSTRUCTIONS FOR INPUT SUMMARY KDMP 3 NO. OF RESERVOIR INFLOW HYDROGRAPH POINTS ITEH 64 INTERVAL OF CROSS-SECTION INFO PRINTED OUT WHEN JNK=9 NPRT 0 FLOOD-PLAIN MODEL PARAMETER KFLP 0 METRIC INPUT/OUTPUT OPTION METRIC 1 DHF(INTERVAL BETWEEN INPUT HYDROGRAPH ORDINATES) = .00 HRS. TEH(TIME AT WHICH COMPUTATIONS TERMINATE)= 63.0000 HRS. BREX(BREACH EXPONENT) = .000 MUD(MUD FLOW OPTION) = 0 IWF(TYPE OF WAVE FRONT TRACKING) = 0 KPRES(WETTED PERIMETER OPTION) = 0 KSL(LANDSLIDE PARAMETER) = 0 DFR(WINDOW FOR CRITICAL FROUDE NO. IN MIX FLOW ALGORITHM)= .050 INFLOW HYDROGRAPH ******************************************* 141.00 143.00 150.00 166.00 192.00 236.00 304.00 431.00 648.00 942.00 1289.00 1688.00 2141.00 2672.00 3267.00 3768.00 4071.00 4236.00 4389.00 4802.00 5636.00 6804.00 8169.00 9715.00 11432.00 13316.00 15226.00 16544.00 16835.00 16167.00 14871.00 13336.00 11804.00 10369.00 9085.00 7998.00 7093.00 6307.00 5614.00 4979.00 4391.00 3828.00 3286.00 2775.00 2291.00 1854.00 1467.00 1122.00 817.00 570.00 379.00 258.00 195.00 162.00 146.00 141.00 141.00 141.00 141.00 141.00 141.00 141.00 141.00 141.00

TIME OF INFLOW HYDROGRAPH ORDINATES .0000 1.0000 2.0000 3.0000 4.0000 5.0000 6.0000 7.0000 8.0000 9.0000 10.0000 11.0000 12.0000 13.0000 14.0000 15.0000 16.0000 17.0000 18.0000 19.0000 20.0000 21.0000 22.0000 23.0000 24.0000 25.0000 26.0000 27.0000 28.0000 29.0000 30.0000 31.0000 32.0000 33.0000 34.0000 35.0000 36.0000 37.0000 38.0000 39.0000 40.0000 41.0000 42.0000 43.0000 44.0000 45.0000 46.0000 47.0000 48.0000 49.0000 50.0000 51.0000 52.0000 53.0000 54.0000 55.0000 56.0000 57.0000 58.0000 59.0000 60.0000 61.0000 62.0000 63.0000 CROSS-SECTIONAL PARAMETERS FOR KAMENG RIVER PARAMETER VARIABLE VALUE *************************************************** ****** ******* NUMBER OF CROSS-SECTIONS NS 14 MAXIMUM NUMBER OF TOP WIDTHS NCS 6 NUMBER OF CROSS-SECTIONAL HYDROGRAPHS TO PLOT NTT 5 TYPE OF OUTPUT OTHER THAN HYDROGRAPH PLOTS JNK 1 CROSS-SECTIONAL SMOOTHING PARAMETER KSA 0 NO. OF LATERAL INFLOW HYDROGRAPHS LQ 0 NO. OF POINTS IN GATE CONTROL CURVE KCG 0 NUMBER OF CROSS-SECTION WHERE HYDROGRAPH DESIRED (MAX NUMBER OF HYDROGRAPHS = 6) ************************************************** 2 4 7 10 13 CROSS-SECTIONAL VARIABLES FOR KAMENG RIVER BELOW TALONG DAM PARAMETER UNITS VARIABLE ****************************************** ******* ****** LOCATION OF CROSS-SECTION KM XS(I) ELEVATION(MSL) OF FLOODING AT CROSS-SECTION M FSTG(I) ELEV CORRESPONDING TO EACH TOP WIDTH M HS(K,I) TOP WIDTH CORRESPONDING TO EACH ELEV M BS(K,I) (ACTIVE FLOW PORTION) TOP WIDTH CORRESPONDING TO EACH ELEV M BSS(K,I) (OFF-CHANNEL PORTION) NUMBER OF CROSS-SECTION I NUMBER OF ELEVATION LEVEL K

PROFILE OF CRESTS AND TIMES FOR KAMENG RIVER
BELOW TALONG DAM LOCATION
Distance from Dam
(km)
Max Elevation
(m)
Maximum Flow
(cumec)
Time to Max
Flow (hr)
Max Velocity
(m/s)
0.05 436.08 16834 28 14.49
0.15 436.13 16845 28 5.64
0.245 436.26 16855 28 3.32
0.5 433.67 16871 28 7.57
0.8 433.61 16867 28 38
0.975 435.07 16863 28 2.33
1.231 434.89 16856 28 2.77
1.487 434.6 16849 28 3.39
1.743 434.04 16844 28 4.33
2 432.65 16840 28 6.22
2.25 432.05 16836 28 6.24
2.499 431.45 16833 28 6.26
2.749 430.83 16830 28 6.29
2.999 430.21 16827 28 6.32
3.249 429.57 16824 28 6.36
3.499 428.92 16821 28 6.41
3.749 428.24 16818 28 6.48
3.999 427.54 16815 28 6.56
4.249 426.78 16812 28 6.69
4.499 425.97 16810 28 6.86
4.749 425.08 16807 28 7.05
4.999 424.11 16804 28 7.25
5.249 423.24 16802 28 7.25
5.499 422.39 16799 28 7.25
5.749 421.55 16797 28 7.24
5.999 420.73 16794 28 7.22
6.249 419.92 16792 28 7.19
6.499 419.13 16790 28 7.16
6.749 418.36 16787 28 7.12
6.998 417.6 16785 28 7.07
7.248 416.85 16782 28 7.02
7.498 416.12 16780 28 6.97
7.748 415.4 16778 28 6.91
7.998 414.7 16775 28 6.85
8.248 414 16773 28 6.79
8.498 413.32 16770 28 6.73
8.748 412.63 16768 28 6.68
8.998 411.96 16766 28 6.62
9.248 411.28 16763 28 6.57
9.498 410.6 16761 28 6.53

9.748 409.92 16759 28 6.5
9.998 409.22 16756 28 6.48
10.248 408.5 16754 28 6.47
10.498 407.76 16752 28 6.48
10.748 406.97 16750 28 6.52
10.998 406.11 16748 28 6.61
11.255 405.78 16746 28 5.81
11.512 405.27 16744 28 5.22
11.77 404.67 16740 28 4.79
12.027 404.02 16735 28 4.45
12.284 403.36 16730 28 4.18
12.542 402.7 16722 28 3.95
12.799 402.05 16714 28 3.75
13.056 401.41 16702 29.4 3.67
13.314 400.88 16687 29.4 3.61
13.571 400.4 16667 29.4 3.53
13.829 400 16639 29.4 3.48
14.086 399.67 16600 29.4 3.41
14.343 399.42 16550 29.4 3.32
14.601 399.23 16485 29.4 3.21
14.858 399.09 16405 29.4 3.09
15.115 398.99 16310 29.4 2.98
15.373 398.92 16199 29.4 2.85
15.631 398.85 16077 29.4 2.84
15.89 398.79 16001 29.4 2.83
16.149 398.74 15978 29.4 2.82
16.408 398.7 15955 29.4 2.81
16.667 398.66 15931 29.4 2.79
16.925 398.62 15908 29.4 2.77
17.184 398.58 15889 29.4 2.75
17.443 398.54 15872 29.4 2.72
17.702 398.49 15857 29.4 2.71
17.961 398.43 15843 29.4 2.69
18.22 398.35 15830 29.4 2.66
18.478 398.22 15821 29.4 2.66
18.737 397.95 15814 29.4 2.76
18.996 397.11 15809 29.4 4.56
19.246 396.81 15806 29.4 4.61
19.496 396.5 15803 29.4 4.68
19.746 396.18 15799 29.4 4.74
19.996 395.85 15796 29.4 4.81
20.246 395.51 15793 29.4 4.88
20.496 395.15 15790 29.4 4.96
20.746 394.79 15787 29.4 5.04
20.995 394.41 15784 29.4 5.13
21.245 394.01 15781 29.4 5.23
21.495 393.6 15778 29.4 5.33
21.745 393.16 15775 29.4 5.45
21.995 392.69 15772 29.4 5.57

22.245 392.2 15769 29.4 5.71
22.495 391.67 15766 29.4 5.87
22.745 391.09 15763 29.4 6.05
22.995 390.44 15760 29.4 6.27
23.245 389.92 15757 29.4 6.26
23.495 389.41 15754 29.4 6.24
23.745 388.9 15751 29.4 6.23
23.995 388.4 15748 29.4 6.22
24.245 387.9 15745 29.4 6.2
24.495 387.41 15742 29.4 6.18
24.745 386.93 15738 29.4 6.16
24.995 386.45 15735 29.4 6.14
25.245 385.98 15732 29.4 6.12
25.494 385.52 15728 29.4 6.09
25.744 385.07 15724 29.4 6.06
25.994 384.62 15721 29.4 6.03
26.244 384.19 15717 29.4 5.99
26.494 383.77 15713 29.4 5.95
26.744 383.36 15709 29.4 5.91
26.994 382.96 15705 29.4 5.86
27.244 382.57 15701 29.4 5.81
27.494 382.19 15697 29.4 5.76
27.744 381.83 15692 29.4 5.7
27.994 381.48 15688 29.4 5.65
28.244 381.15 15684 29.4 5.58
28.494 380.82 15679 29.4 5.52
28.744 380.52 15675 29.4 5.45
28.994 380.22 15670 29.4 5.38
29.244 379.96 15666 30.8 5.28
29.494 379.71 15661 30.8 5.18
29.744 379.47 15656 30.8 5.08
29.994 379.23 15651 30.8 4.99
30.243 379 15645 30.8 4.89
30.493 378.77 15640 30.8 4.81
30.743 378.55 15634 30.8 4.72
30.993 378.34 15629 30.8 4.64
31.243 378.14 15623 30.8 4.56
31.493 377.94 15617 30.8 4.48
31.743 377.74 15610 30.8 4.4
31.993 377.56 15604 30.8 4.32
32.243 377.38 15598 30.8 4.25
32.493 377.2 15591 30.8 4.17
32.743 377.03 15584 30.8 4.1
32.993 376.87 15577 30.8 4.02
33.243 376.65 15570 30.8 4.09
33.493 376.42 15563 30.8 4.16
33.743 376.18 15562 30.8 4.24
33.993 375.92 15565 30.8 4.32
34.243 375.64 15568 30.8 4.41

34.493 375.35 15571 30.8 4.5
34.742 375.04 15574 30.8 4.6
34.992 374.7 15577 30.8 4.71
35.242 374.34 15579 30.8 4.83
35.492 373.95 15582 30.8 4.96
35.742 373.53 15585 30.8 5.1
35.992 373.05 15587 30.8 5.27
36.242 372.53 15590 30.8 5.46
36.492 371.93 15592 30.8 5.69
36.742 371.22 15594 30.8 5.99
36.992 370.36 15596 30.8 6.38
37.242 369.69 15598 30.8 6.39
37.492 369.02 15600 30.8 6.41
37.742 368.36 15602 30.8 6.42
37.992 367.71 15604 30.8 6.44