Human Resource Management Strategic Human Resource Management
Upload
khangminh22Category
view
1download
0
Volume 43 Number 4December 2018
Volum
e 43 Num
ber 4D
ecember 2018
BANGLADESH JO
URNAL OF AG
RICULTURAL RESEARCH
Please visit our website : www.bari.gov.bd
ISSN 0258 - 7122 (Print)2408 - 8293 (Online)


Bangladesh
Journal of
AGRICULTURAL
RESEARCH Volume 43 Number 4
December 2018

Editorial Board
Editor-in Chief
Abul Kalam Azad, Ph. D.
Associate Editors
Md. Shoeb Hassan
Md. Lutfur Rahman, Ph. D.
Paritosh Kumar Malaker, Ph. D,
M. Zinnatul Alam, Ph. D.
M. Mofazzal Hossain, Ph. D.
Hamizuddin Ahmed, Ph. D.
M. Matiur Rahman, Ph. D.
B. A. A. Mustafi, Ph. D.
M. A. Quayyum, Ph. D.
A. J. M. Sirajul Karim, Ph. D.
Editor (Technical)
Md. Hasan Hafizur Rahman
B. S. S. (Hons.), M. S. S. (Mass Com.)
Address for Correspondence
Editor (Technical)
Editorial and Publication Section
Bangladesh Agricultural Research Institute
Joydebpur, Gazipur 1701
Bangladesh
Phone : 88-02-49270038
E-mail : [email protected]
Rate of Subscription
Taka 100.00 per copy (home)
US $ 10.00 per copy (abroad)
Cheque, Money Orders, Drafts or Coupons,
etc. should be issued in favour of the
Director General, Bangladesh Agricultural
Research Institute
Contributors To Note Bangladesh Journal of Agricultural Research (BJAR) is a quarterly journal highlighting original contributions on all disciplines of agricultural research (crop agriculture) conducted in any part of the globe. The 1st issue of a volume comes out in March, the 2nd one in June, the 3rd one in September, and the 4th one in December. The full text of the journal is visible in www.banglajol.info. Contributors, while preparing papers for the journal, are requested to note the following:
Paper(s) submitted for publication must contain original unpublished material.
Papers in the journal are published on the entire responsibility of the contributors.
Paper must be in English and typewritten with double space.
Manuscript should be submitted in duplicate.
The style of presentation must conform to that followed by the journal.
The same data must not be presented in both tables and graphs.
Drawing should be in Chinese ink. The scale of figure, where required, may be indicated by a scale line on the drawing itself.
Photographs must be on glossy papers.
References should be alphabetically arranged conforming to the style of the journal.
A full paper exceeding 12 typed pages and a short communication exceeding eight typed pages will not be entertained.
Principal author should take consent of the co-author(s) while including the name(s) in the article.
The article prepared on M.S/Ph.D. thesis should be mentioned in the foot note of the article.
Authors get no complimentary copy of the journal. Twenty copies of reprints are supplied free of cost to the author(s).
Bangladesh Agricultural Research Institute (BARI) Joydebpur, Gazipur 1701
Bangladesh

BANGLADESH JOURNAL OF AGRICULTURAL RESEARCH
Vol. 43 December 2018 No. 4
C O N T E N T S
Maniruzzaman, M. G. Azam, S. Islam, M. G. Hossain and M. M. Rohman
Molecular assessment of maize inbred lines (Zea mays L.) Using
microsatellite markers
533
M. A. Quddus, M. A. Hossain, H. M. Naser, N. Naher and F. Khatun
Response of chickpea varieties to boron application in calcareous and
terrace soils of Bangladesh
543
M. J. Hussain, A. J. M. S. Karim, A. R. M. Solaiman, M. S. Islam and M.
Rahman Response of broccoli to USG and prilled urea in shallow red-
brown terrace soil under Madhupur tract
557
P. Hajong, B. Sikder, S. Mondal and M. A. Islam Adoption and
profitability of summer tomato cultivation in Jashore district of
Bangladesh
575
M. S. Rahman, M. T. Islam, M. Z. H. Prodhan, M. K. Hasan and A. S. M.
M. R. Khan Productivity and profitability of improved versus existing
cropping pattern in Kushtia region
587
A. N. M. S. Karim, S. Ahmed, A. H. Akhi, M. Z. A. Talukder and A.
Karim Combining ability and heterosis studyin maize inbreds
throughout diallel mating design
599
E. Mandal, M. R. Amin, H. Rahman and A. M. Akanda Infestation level
and population dynamics of aphid on mustard
611
S. Talukder, M. M. H. Khan, J. Ferdous and M. O. Faruq Integrated
management of tobacco caterpillar and cabbage butterfly with host plant
resistant and organic amendment
619
M. A. Hoque, M. Z. Hossain and M. A. Hossain Design and
development of a power groundnut sheller
631
M. R. Amin, M. S. Miah, H. Rahman, N. P. Nancy and M. K. A. Bhuiyan
Functional and group abundance of insects on eggplant
647
M. S. Islam, H. Saif, M. R. Islam, Q. Naher and A. S. M. M. R. Khan
Soil salinity management for increasing potato yield in the coastal area of
southern Bangladesh
655

M. S. Rahman, M. Khatun, M. L. Rahman and S. R. Haque Assessment
of training needs on crop production for farmers in some selected areas of
Bangladesh
669
M. A. H. Khan, N. Sultana, N. Akter, M. S. Zaman and M. R. Islam
Intercropping gardenpea (Pisium sativum) with Maize (Zea mays) at
farmers’ field
691
K. T. Akter and M. A. Hoque In vitro shoot regeneration of mint
(Mentha sp. L.) Using different types of explants and levels of
benzylaminopurine
703

ISSN 0258-7122 (Print), 2408-8293 (Online)
Bangladesh J. Agril. Res. 43(4): 533-542, December 2018
MOLECULAR ASSESSMENT OF MAIZE INBRED LINES (Zea Mays L.)
USING MICROSATELLITE MARKERS
MANIRUZZAMAN1, M. G. AZAM2, S. ISLAM3
M. G. HOSSAIN2 AND M. M. ROHMAN1
Abstract
Genetic diversity analysis and germplasm characterization are essential steps in
plant breeding and molecular markers are proved tool to accomplish. The
present study was undertaken at the Molecular Breeding Lab of Plant Breeding
Division, Bangladesh Agricultural Research Institute (BARI) to determine the
genetic relatedness and molecular characterization of 15 maize inbred lines of
BARI. In present study, genetic diversity analysis was performed by using 10
SSR primers to evaluate the polymorphisms, among them six primers showed
distinct polymorphism between the maize inbred lines. The maize genotypes
E81, E144, E08, E167, E102, E142 and E121 were found more diverged
(0.9003) compared to other inbred lines. On the other hand, the lowest genetic
distance values (0.1501) were found between the genotype E140 and genotype
E80 followed by genotype E126 and genotype E140; genotype E140 and
genotype E65; genotype E65 and genotype E80 values were identical (0.4502).
The genotypes viz. E81, E144, E08, E167, E102, E142 and E121 were found far
away from centroid of the cluster and rest of the genotypes were placed around
the centroid. The Principal Coordinate Analysis (PCO) helped to visualize four
major clusters and showed that seven maize inbred lines (E81, E58, E08, E167,
E102, E142 and E121) were far away from the other genotypes. In conclusion,
SSR markers enabled discrimination among accessions and provided valuable
information for future use in improvement of these genomic resources.
Keywords: Molecular Diversity, Microsatellite Marker and Inbred Maize
Introduction
Diversity of maize (Zea mays L.) inbreds has major importance in the process of
maize improvement. The narrow genetic base of the modern highly yielding
maize hybrids is problematic in breeding for adaptation to biotic and abiotic
stresses, including chilling, drought, heat or salt tolerance. Knowledge on the
genetic diversity and relationships among maize inbred lines is helpful in
identifying promising combinations for exploitation of heterosis and
establishment of heterotic groups for use as source materials in a breeding
program. Morphological characteristics are often influenced by the environment
1Senior Scientific Officer, Plant Breeding Division, 2Scientific Officer, Plant Breeding
Division, 3Scientific Officer, Biotechnology Division, Bangladesh Agricultural Research
Institute (BARI), Gazipur-1701, Bangladesh.
DOI: http://dx.doi.org/10.3329/bjar.v43i4.39151

534 MANIRUZZAMAN et al.
and therefore, they do not always express genetic relationships. Besides, these
traits reveal differences that are not comprehensible in terms of genetic distances.
Molecular markers have proven valuable for genetic diversity analysis of many
crop species. Their expression, unlike morphological markers, is not influenced
by environmental factors; hence reflect the actual level of genetic difference
existing between genotypes (Smith and Smith 1992, Westman and Kresovich
1997). In maize, microsatellites have proved to be a valuable tool for genome
mapping (Taramino and Tingey 1996). Microsatellites or simple sequence
repeats (SSRs) are DNA markers with short stretches of tandemly repeated di-,
tri- or tetra-nucleotide motifs (Weber 1990). SSRs are characterized by a great
abundance (Matsuoka et al. 2002), high variability (Tautz 1989, Schug et al.
1998) and even distribution throughout a wide range of genomic regions (Liu et
al. 1996, Senior et al. 1996). They are codominant, highly polymorphic, multi-
allelic and have become the marker of choice for genetic analysis in crops (Gupta
and Varshney 2000). The objective of the present study was to use microsatellite
markers for assessment of genetic diversity among the maize variety and inbred
lines.
Materials and Methods
A total of 15 inbred lines of maize were randomly selected from BARI maize
inbred lines. Seeds were grown in plastic pots. Then the pots were kept in the net
house. After fifteen to twenty days (3 or 4 leaf stage) the fresh leaf was used for
DNA isolation. Total DNA was isolated by CTAB method with slight
modifications according to Maaß and Klass (1995). After treatment with 10µg/ml
RNase A for half an hour at 37ºC, the DNA was purified with propanol. The
purified DNA was dissolved in TE buffer and stored at -20ºC and the
concentration was determined fluorometrically (Nano drop).
Ten SSR primer pairs were chosen (p-umc1354,p-umc1566,p-umc1292,p-
bnlg1124,p-bnlg1179,phi002,phi037,phi038, phi039and bnlg565) to evaluate the
polymorphism among the inbred lines. PCR conditions were optimized according
to Hoxha et al. (2003). Here amplifications were performed in 20μl volumes
containing 100ng genomic DNA, 2.5 mMdNTPs, 1.5mM MgCl2 , 10 pmol each
forward and reverse primers, 3U TaqDNA polymerase and 10X PCR buffer
(Genei). Thermal cycling consisted of initial denaturation at 95ºC for 3min, 30
cycles of 95ºC for 1 min, annealing temperature 55ºC for 1 min and 72ºC for 1
min, followed by a final extension at 72ºC for 5 min. PCR products were stored
at 4ºC until use. The PCR products were visualized in Polyacrylamide gel
electrophoresis (PAGE).
Molecular weight for each amplified allele was measured in base pair using
Alpha-Ease FC 5.0 software. The allele frequency data from Power Marker

MOLECULAR ASSESSMENT OF MAIZE INBRED LINES 535
version 3.25 (Liu and Muse, 2005) was used to export the data in binary format
(allele presence="I" and allele absence = "0") for analysis with NTSYS-pc
version 2.2 (Rohlf, 2002).
The summary statistics including the number of alleles per locus, major allele
frequency, gene diversity, polymorphism information content (PIC) values were
determined using Power Marker version 3.25 (Liu and Muse, 2005). A similarity
matrix was calculated with the Simqual subprogram using the Dice coefficient,
followed by cluster analysis with the SAHN subprogram using the Unweighted
Pair Group Method with Arithmetic Mean (UPGMA) clustering method as
implemented in NTSYS-pc was used to construct a dendrogram showing
relationship among the genotypes. The similarity matrix was also used for
principal coordinate analysis (PCA) with the D Center, Output, and MXPlot
subprograms in computer program Numerical Taxonomy and Multivariate
Analysis System (NTSYS-pc).
Results and Discussions
Microstallites displayed a high level of polymorphism.Out of 10 SSR markers
employed to investigate the polymorphism, six markers (p-umc1354, p-umc1566,
p-umc1292, phi037, phi039 and bnlg565) revealed clear and consistent
amplification profiles. Among these, four markers (phi038, bnlg1179, bnlg1124,
phi002) showed monomorphic pattern and hence were not included in further
analysis.
A total of 48 alleles were detected at 10 SSR markers among 15 maize inbred
lines with an average of 8 alleles per-microsatellite/genotypes locus (Table
1).The highest number of alleles per locus/genotype was detected using SSR
primer set bnlg565, showing 12 alleles with an average of 0.8 alleles per
genotype (Table 1). The lowest allele number per locus among the homologous
chromosomes was observed using SSR primer set p-umc1566, showing a total of
4 with an average of 0.27 alleles per genotype (Table 1). The average number of
alleles obtained in the present study was higher than those reported in previous
maize diversity studies (Lu and Bernardo, 2001, Enoki et al. 2002, VazPatto et
al. 2004). Lu and Bernardo (2001) reported 4.9 alleles per SSR locus for a
sample of 40 US inbreds analyzed by 83 SSR markers; Warburton et al. (2002)
investigating 57 CML lines with 85 SSR markers reported 4.9 alleles per marker;
Senior et al. (1998) found 5.0 alleles/locus in a study of 94 elite US maize
inbreds with 70 SSR markers, and Vaz Patto et al. (2004) reported 5.33 alleles
per locus in 104 Portuguese and inbreds using 15 SSRs. In addition, Pejic et al.
(1998) reported 6.8alleles/locus in 33 inbreds from US corn belt using 27 SSRs;
Enoki et al. (2002), studying 65 inbred lines adapted to cold regions of Japan and
imported American materials with 60 SSRs reported 7.3 alleles per locus and Xia

536 MANIRUZZAMAN et al.
et al. (2004) reported 7.4 alleles per locus in 155 tropical lowland inbreds using
79 SSRs. On the other hand, Liu et al. (2003) reported average 21.7 alleles per
locus in a study including 260 US inbreds analyzed at 94 SSR loci. It is important
to note that the total number of alleles reported in diversity studies is usually
proportional to sample size, and some differences seen here may be attributable
to sampling differences. However, another factor influencing the number of
alleles is the use of di-nucleotide repeat SSRs, which can produce large number
of alleles. However the more diverse set of inbreds from the gene bank
collections included in the study may also contribute to the observed higher
allelic richness. Range of allele size (bp) was from 4 (p-umc1566) to 12
(bngl565) (Table 1). The highest allele size difference in phi039 followed by
bnlg565 and lowest in p-umc1566. According to Nei’s (1973) the highest level of
gene diversity value (0.8991) was observed in loci bnlg565 and the lowest of
gene diversity value (0.6234) was observed in loci p-umc1566 with a mean
diversity of 0.7773 (Table 2). It was observed that marker detecting the lower
number of alleles showed lower gene diversity than those detected the higher
number of alleles showed higher gene diversity. This result is consistent with
previous work done by Herrera et al. (2008).
Table 1. Number of alleles, range of allele (bp) and gene diversity (GD) found in 15
maize inbred lines for 6 SSR markers.
Sl.
No. Markers
Chroa
No. Repeat type
Allele
number
Range of
allele size (bp)
Diffb (bp) Gene
diversity
1 p-umc1354 1.01 (CCG)5 6 36-62 26 0.7556
2 p-umc1566 1.01 (GCC)6 4 65-68 3 0.6756
3 p-umc1292 1.01 (TGG)6 8 68-100 32 0.8356
4 phi037 1.08 (AG) 8 131-164 33 0.8356
5 phi039 1.08 (ATT) 10 78-129 51 0.8000
6 bnlg565 3 (CT)21 12 47-92 45 0.9067
Mean 8 0.8015
The frequency of the most common allele at each locus ranged from 13.33 %
(bnlg565) to 46.66% (p-umc1566). On an average, 32.22% of the 15 maize
inbred lines shared common major allele at any given locus (Table 2).
The polymorphic information content (PIC) values ranged from 0.6234 to 0.8991
with an average of 0.7733. The highest PIC value (0.8991) was obtained for
bnlg565 followed by p-umc1292 (0.8159), phi37 (0.8159) respectively. The
lowest PIC value (0.6234) was obtained for p-umc1566 (Table 2). PIC value
revealed that bnlg565 was considered as the best marker for 15 maize inbred

MOLECULAR ASSESSMENT OF MAIZE INBRED LINES 537
lines followed by p-umc1292 and phi37. P-umc1566 could be considered as least
powerful marker.
The average PIC value determined in our investigation agreed well with the
earlier findings reported based on SSR marker in maize inbred lines (Senior et al.
1998, Heckenberger et al. 2002 and VazPatto et al. 2004). Dinucleotide SSR loci
(phi 037, nc003, bnlg619, phi054) identified the largest mean number of alleles
(4.8) and mean PIC (0.67) as compared to tri, tetra and penta nucleotide repeats
in this study, which is also in close agreement with previous observations for
maize (Smith et al. 1997, Senior et al. 1998 and Enoki et al. 2002).
Table 2. Data on sample size, No. of observation, major alleles frequencies and
Polymorphism information content (PIC) found among 15 maize inbred
lines.
Sl. No. Locus No. of observation
Major allele
frequencies
(%)
PIC Mean PIC
1 p-umc1354 15 0.40 0.7237
0.7773
2 p-umc1566 15 0.47 0.6234
3 p-umc1292 15 0.27 0.8159
4 phi037 15 0.27 0.8159
5 phi039 15 0.40 0.7858
6 bnlg565 15 0.13 0.8991
The UPGMA clustering system also generated four genetic clusters with
similarity coefficient of 15%. Maize inbred line E58 alone formed a single
cluster named cluster III which showed 88% dissimilarity with the cluster IV
(E121, E144, E142, E132, E139, and E89) and 79% dissimilarity with cluster II
(E102, E126, E140, E80, E65 and E81).
Two inbred lines form a single cluster I where E08 and E167 are closed to each
other. In cluster II inbred lines E140 and E80 showed maximum similarity 83%
followed by E132, E139; E121, E144 (34% similar and 66% dissimilar). Cluster
IV and Cluster II had maximum six inbred lines. In cluster IV all inbred were
closed to each other by about 26%.
The pair-wise genetic dissimilarity coefficients based on 6 SSR marker indicated
that the maximum genetic distance values (0.9003) was recognized between
genotype E08 and genotype E121, genotype E08 and genotype E102, genotype
E102 and genotype E121, genotype 139 and genotype E65, genotype E140 and
genotype E132, genotype E58 and genotype E126, genotype E80 and genotype
E144, genotype E81 and genotype E142, genotype E89 and genotype E81 and so
on (Table 3). These results were in agreement with findings of Principal

538 MANIRUZZAMAN et al.
Coordinate Analysis and suggested that these genotypes were diversed. The
lowest genetic distance values (0.1501) were found between the genotype E140
and genotype E80 followed by genotype E126 and genotype E140; genotype
E140 and genotype E65; genotype E65 and genotype E80 values were identical
(0.4502).
Each lower and higher intergenotypic distances between pairs of maize inbred
lines based on 6 SSR markers were given in the (Table 3) on the basis of Nei
distance (Nei, 1973). Future breeding program for crop improvement could
choose these genetically diversed parents for crossing program to create genetic
variability and transgressive segregants.
Fig. 1. Associations among maize inbred lines revealed by cluster analysis of SSR
distance databased on the alleles detected by 6 SSR markers.
The two dimensional graphical view of Principal Coordinate Analysis (PCO)
showed the spatial distribution of the 15 maize inbred lines along the two
principal axes. The genotypes viz. E81, E144, E08, E167, E102, E142 and E121
were found far away from centroid of the cluster and rest of the genotypes were
placed around the centroid (Fig.2). The genotypes were placed far away from the
centriod were more genetically diverged compared to the genotypes placed near
the centriod were likely to be genetically more similar. However, centriod may
be defined as the vector representing the middle point of the cluster which
contained at least one number for each variable. The connecting line between the
each genotype and the centriod represented eigen vectors for the respective
genotypes.

MOLECULAR ASSESSMENT OF MAIZE INBRED LINES 539
Ta
ble
3.
Lo
wer
an
d h
igh
er i
nte
r g
eno
typ
ic d
ista
nce
s (N
ei,
19
73)
bet
wee
n p
air
s o
f M
aiz
e in
bre
d l
ines
ba
sed
on
6 S
SR
ma
rk
ers
E
08
E1
02
E1
21
E1
26
E1
32
E1
39
E1
40
E1
42
E1
44
E1
67
E5
8
E6
5
E8
0
E8
1
E8
9
E0
8
E1
02
0.9
003
E1
21
0.9
003
0.9
003
E1
26
0.7
503
0.7
503
0.6
002
E1
32
0.7
503
0.7
503
0.7
503
0.6
002
E1
39
0.9
003
0.9
003
0.7
503
0.7
503
0.6
002
E1
40
0.9
003
0.6
002
0.7
503
0.4
502
0.9
003
0.7
503
E1
42
0.7
503
0.9
003
0.7
503
0.7
503
0.7
503
0.7
503
0.9
003
E1
44
0.9
003
0.9
003
0.6
002
0.7
503
0.7
503
0.7
503
0.9
003
0.6
002
E1
67
0.7
503
0.7
503
0.9
003
0.7
503
0.9
003
0.7
503
0.7
503
0.7
503
0.9
003
E5
8
0.9
003
0.9
003
0.7
503
0.9
003
0.7
503
0.7
503
0.7
503
0.9
003
0.9
003
0.9
003
E6
5
0.7
503
0.7
503
0.7
503
0.6
002
0.9
003
0.9
003
0.4
502
0.7
503
0.9
003
0.7
503
0.6
002
E8
0
0.9
003
0.6
002
0.6
002
0.6
002
0.9
003
0.7
503
0.1
501
0.9
003
0.9
003
0.7
503
0.7
503
0.4
502
E8
1
0.9
003
0.7
503
0.7
503
0.9
003
0.9
003
0.9
003
0.6
002
0.9
003
0.9
003
0.9
003
0.7
503
0.7
503
0.6
002
E8
9
0.7
503
0.9
003
0.7
503
0.7
503
0.7
503
0.6
002
0.7
503
0.7
503
0.7
503
0.9
003
0.9
003
0.9
003
0.7
503
0.9
003

540 MANIRUZZAMAN et al.
Fig. 2. Two-dimensional view of principal coordinate analysis (PCO) with 6 SSR
markers over 15 maize inbred lines.
References
Enoki, H., H. Sato and K. Koinuma. 2002. SSR analysis of genetic diversity among
maize inbred lines adapted to cold regions of Japan. Theor. App. Genet.104: 1270-
1277.
Gupta, P.K., and R.K.Varshney.2000.The development and use of microsatellite markers
for genetic analysis and plant breeding with emphasis on bread wheat. Euphytica.
113: 163-185.
Heckenberger, M., M. Bohn, J. Zeigle and S. East. 2002. Variation of DNA fingerprints
among accessions within maize inbred lines and implications for identification of
essentially derived varieties. Genetic and technical sources of variation in SSR data.
Mole. Breed.10: 181-191.
Herrera, T.G., D.P. Duque, I.P. Almeida, G.T. Nunez, A.J. Pieters, C.P. Martinej and
J.M. Tohme. 2008. Assement on genetic diversity in Venezuelan rice cultivars using
simple sequence repeats markers. Electro. J. of Biotech. 11(5): 215-226.
Hoxha, S., M.R. Shariflou and P. Sharp. 2003. Evaluation of genetic diversity in
Albanian maize using SSR markers. Maydica. 49(2): 97-103.
Liu, K., and S. V. Muse. 2005. Power Marker: Integrated analysis environment for
genetic marker data. Bioinformatics. 21: 2128-2129.
Liu, Z.W., R. Biyashev. And M. Saghai-Maroof. 1996. Development of simple sequence
repeats DNA markers and their integration into a barley linkage map. Theor. App.
Genet. 93: 869-876.

MOLECULAR ASSESSMENT OF MAIZE INBRED LINES 541
Liu, K., M. Goodman, S. Muse, J. Smith, E. Buckler and J. Doebley. 2003. Genetic
structure and diversity among maize inbred lines as inferred from DNA
microsatellites. Genetics. 165: 2117-2128.
Lu, H., and R. Bernardo. 2001. Molecular markers diversity among current and historical
maize inbreds. Theor. App. Genet.100: 552-556.
Maaß, H.I. and M. Klass. 1995. Infraspecific differentiation of garlic (Allium sativum L.)
by isozyme and RAPD markers. Theor. Appl. Genet. 91(1):89-97.
Matsuoka, Y., S.E. Mitchell and S. Kresovich. 2002. Microsatellites in Zea variability,
patterns of mutations and use for evolutionary studies. Theor. App. Genet.104: 436-
450.
Nei, M. 1973. Analysis of gene diversity in subdivided populations. Proceedings of the
National Academy of Sciences USA 70: 3321-3323.
Pejic, I., P.A .Marsan, M. Morgante, V. Kozumplick, P. Castiglioni, G. Taramino and M.
Motto. 1998. Comparative analysis of genetic similarity among maize inbred lines
detected by RFLPs, RAPDs, SSRs, and AFLPs. Theor. App. Genet. 97: 1248-1255.
Rohlf, F. 2002. NTSYS-pc: Numerical taxonomy and multivariate analysis system, 2.2
edn. Department of Ecology and Evolution, State University of NY, Stony Brook.
Schug, M.D., C.M. Hutter and K.A.Wetterstr. 1998. The mutation rate of di, tri and tetra-
nucleotide repeats in Drosophila melanogaster. Mol. Bio.Evol.15: 1751-1760.
Senior, M.L., J.P. Murphy, M.M. Goodman and C.W. Stuber. 1998. Utility of SSRs for
determining genetic similarities and relationships in maize using an agarose gel
system. Crop Sci. 38:1088-1098.
Senior, M.L., E.C.L. Chin and M. Lee. 1996. Simple sequences repeat markers developed
from maize sequences found in the GENEBANK database: map construction. Crop
Sci. 36: 1676-1683.
Smith, J.S.C. and O.S. Smith.1992.Fingerprinting crop varieties. Rev. Agric. Acad. Press,
USA. pp: 85-140.
Smith, J.S.C., E.C.L.Chin,H. Shu, O.S. Smith, S.J. Wall, M.L. Senior, S.E. Mitchell, S.
Kresovitch andJ. Ziegle. 1997. An evaluation of the utility of SSR loci as molecular
markers in maize (Zea mays L.): Comparisons with data from RFLPs and pedigree.
Theor. App. Genet. 95: 163–173.
Tautz, D. 1989. Hypervariablity of simple sequences as a general source of polymorphic
DNA markers. Nucleic Acids Res. 17: 6463-6471.
Taramino, G. and S. Tingey. 1996. Simple sequence repeats for germplasm analysis and
mapping in maize. Genome. 39: 277-287.
Vaz patto, M., C.Z. Satovic, S. Peg and O.P. Fevereiro.2004. Assessing the genetic
diversity of Portuguese maize germplasm using microsatellite markers. Euphytica.
137: 63-72.
Warburton, M.L., X.Xianchun and J. Crossa. 2002. Genetic characterization of CIMMYT
inbred maize lines and open pollinated populations using large scale fingerprinting
methods. Crop Sci. 42: 1832-1840.

542 MANIRUZZAMAN et al.
Weber, J.L. 1990. Informativeness of human (dC - dA)n. (dG -dT)n polymorphisms.
Genomics. 7: 524-530.
Westman, A.L. and S.Kresovich. 1997. Use of molecular marker techniques for
description of plant genetic variation. In: Callow, J. L., Ford-Lloyd, B. V. and and.
Newburry, H. J (eds), Biotechnology and plant genetic resources. CAB Int. p: 9-45.
Xia, X.C., J.C. Reif, D.A.Hoisington, A.E. Melchinger, M.Frisch and
M.L.Warburton.2004. Genetic diversity among CIMMYT maize inbred lines
investigated with SSR markers: I. Lowland tropical maize. Crop Sci. 44: 2230-2237.

ISSN 0258-7122 (Print), 2408-8293 (Online)
Bangladesh J. Agril. Res. 43(4): 543-556, December 2018
RESPONSE OF CHICKPEA VARIETIES TO BORON APPLICATION IN
CALCAREOUS AND TERRACE SOILS OF BANGLADESH
M. A. QUDDUS1, M. A. HOSSAIN2, H. M. NASER3
N. NAHER4 AND F. KHATUN5
Abstract
An experiment was conducted at Madaripur and Gazipur during rabi (winter)
season of 2012-13 and 2013-14 to determine the optimum dose of B for
different varieties of chickpea (Cicer arietinum L.). There were 12 treatment
combinations comprising three varieties (BARI Chola-5, BARI Chola-8 and BARI
Chola-9) and four levels of boron (0, 1, 1.5 and 2 kg ha-1) along with a blanket
dose of N20P20K25S10Zn2 kg ha-1. Boron was applied as H3BO3. Results showed
BARI Chola-9 with 1.5 kg B ha-1 produced the highest seed yield of 1338 kg ha-
1 at Madaripur and 2218 kg ha-1 at Gazipur. Nodulation, nitrogen (N) and protein
contents were also found highest for the same variety and B treatment. The other
two varieties (BARI Chola-5 and BARI Chola-8) also performed higher yield in
the plot receiving 1.5 kg B ha-1 compared to 1 kg B ha-1 or 2 kg B ha-1 at both
locations. The results suggest that BARI Chola-9 and 1.5 kg B ha-1 along with
N20P20K25S10Zn2 kg ha-1 could be used for achieving higher yield of chickpea in
calcareous and terrace soils of Bangladesh.
Keywords: Chickpea, boron, yield, nodulation, protein content
Introduction
Chickpea (Cicer arietinum L.) commonly known as gram, is the third most important pulse crop in the world and stands 5th in respect of area (8250 ha) and production (6488 tons) in Bangladesh, with an average yield of 786 kg ha-1 (BBS, 2012). It is an important source of protein and is rich in fiber, minerals (phosphorus, calcium, magnesium, iron and zinc) and β-carotene (Legesse Hidoto et al., 2017). Chickpea as a legume crop plays a significant role in improving soil fertility by fixing the atmospheric nitrogen (Kuldeep Balai, 2017). It leaves substantial amount of residual nitrogen for subsequent crops and adds huge amount of organic matter to improve soil health. Due to deep tap root system, chickpea can withstand drought conditions by extracting water from deeper layers in the soil profile.
The soils of different parts of Bangladesh are deficient in B and nitrogen fixing
bacteria (Rhizobium sp.) which causes low yield of crops (Quddus et al., 2014).
1Senior Scientific Officer, Soil and Water Management Section, HRC, Bangladesh
Agricultural Research Institute (BARI), Gazipur, 2Chief Scientific Officer, 3Principal
Scientific Officer, 2,3Soil Science Division, BARI, Gazipur, 4Scientific Officer, Pulses
Research Sub-Station, BARI, Gazipur, 5Principal Scientific Officer, Oilseed Research
Centre, BARI, Gazipur, Bangladesh.
DOI: http://dx.doi.org/10.3329/bjar.v43i4.39152

544 QUDDUS et al.
Boron deficiency is more common in winter crops (Jahiruddin, 2015). General fertility levels of calcareous soils are low to medium. Terrace soils are acidic in
reaction with low organic matter, moisture holding capacity and fertility level. The soils are mainly phosphate fixing, and low in P, K, S, Zn and B levels (FRG,
2012). Boron plays a vital role for chickpea growth especially flowering, fruit and seed set and yields (Ahlawat et al., 2007). Boron influences the absorption of
N, P, K and its deficiency affects the optimum levels of these three macronutrients (Raj, 1985). So, use of suitable variety and B dose can ensure
higher yield of chickpea.
The present study was undertaken to evaluate the response of chickpea varieties
to boron application and to find out the suitable dose of boron for yield
maximization of chickpea in calcareous and terrace soils of Bangladesh.
Materials and Methods
Field experiments were conducted in two locations for two consecutive years (winter season of 2012-13 and 2013-14): (i) research field of Regional Pulses
Research Station, Bangladesh Agricultural Research Institute (BARI), Madaripur and (ii) Pulses Research Sub-Station, BARI, Gazipur. Madaripur is medium high
land with loamy textured calcareous soils. It belongs to Gopalpur series (Soil taxonomy: Aquic Eutrochrepts) under the agro-ecological zone of Low Ganges
River Floodplain (AEZ-12). Gazipur is medium high land with fine-textured (clay loam) terrace soils. It belongs to Chhiata series (Soil taxonomy: Udic
Rhodustalf) under the agro ecological zone - Madhupur Tract (AEZ-28). The Madaripur area got average rainfall from 7.6 to 80.2 mm during November to
April. The mean minimum and maximum air temperatures during November to March of the experiment were 10.3 and 34.8°C, respectively. Gazipur area
received average rainfall from 1.2 to 34.8 mm during November to April. The mean minimum and maximum air temperatures during November to March of
the experiment were 9.23 and 34.2°C, respectively. Before starting the
experiment initial soil (0-15 cm) samples of both locations were analyzed. The chemical properties are shown in Table 1.
There were 12 treatment combinations comprising three varieties of chickpea (V1= BARI Chola-5, V2= BARI Chola-8 and V3= BARI Chola-9) and four levels
of boron (0, 1, 1.5 and 2 kg ha-1) along with a blanket dose of N20P20K25S10Zn2 kg ha-1. Treatment combinations were arranged as T1= V1B0; T2= V1B1; T3= V1B1.5;
T4= V1B2; T5= V2B0; T6= V2B1; T7= V2B1.5; T8= V2B2; T9= V3B0; T10= V3B1; T11= V3B1.5; and T12= V3B2. The experiment was laid out in a split-plot design with
three replicates. The main plot was considered as variety factor and sub-plot was as B factor. Each sub-plot size was 4 m × 3 m. The land was first opened by a
tractor and prepared thoroughly by ploughing with a power tiller followed by laddering and leveling. Boron was applied as boric acid (17% B). Each plot
received an equal amount of fertilizers N20P20K25S10Zn2 kg ha-1 as urea, TSP,

RESPONSE OF CHICKPEA VARIETIES TO BORON APPLICATION 545
Table 1. Soil fertility status of experimental field at Madaripur and Gazipur
Location pH OM
(%)
Total
N (%)
Ca K P S Zn B
meq. 100
g-1 µg g-1
Madaripur
(result) 7.3 1.22 0.058 11.4 0.13 16 14 0.50 0.12
Critical level - - 0.12 2.0 0.12 10 10 0.60 0.20
Interpretation slightly
alkaline low
very
low high low medium medium low low
Gazipur
(result) 6.2 1.28 0.061 6.55 0.11 13 13.5 0.65 0.16
Critical level - - 0.12 2.0 0.12 7 10 0.60 0.20
Interpretation acidic low very
low high low medium medium low low
(Interpretation source: FRG 2012)
MoP, gypsum and zinc sulphate, respectively during final plot preparation. Two
types of chickpea like Desi chickpea (brown to yellow brown seed coat with various shaped- generally small or medium small and angular with a rough
surface) e.g. BARI Chola-5 and BARI Chola-9, and Kabuli chickpea (white thin
seed coat with bigger round shape and smooth surface) e.g. BARI Chola-8 were used. Seeds of chickpeas were sown @ 40-45 kg ha-1 with a spacing of 50 cm ×
10 cm in mid-November in both locations. Two hand weedings were done at 25 and 50 days after sowing. The disease (BGM) was controlled by spraying Secure
fungicide @ 0.2% two times at an interval of 10 days. The first at flowering stage and insects (pod borer and aphid) were controlled by spraying Karate @ 0.2%
two times at 10 day intervals during podding stage. Crop was harvested at maturity. Maturity refers to chickpea pods to be brown or yellow brown coloured
as well as the seed become hard containing 12-16% moisture. The data of nodules per plant was recorded at flowering stage in each plot by selecting 5
plants randomly. The chickpea plants were smoothly uprooted and the soil was carefully removed from roots by water. Then the roots were washed with distilled
water, blotted with tissue paper and the number of nodules was counted. For measuring yield attributes viz. plant height, pods per plant and seeds per pod,
mature ten plants of chickpea were randomly selected and uprooted from each plot at the harvest time. Plant height was recorded from above ground part and
averaged. Pods were detached from every plant and the number of pods per plant
was counted and averaged. Ten pods were separated randomly from composite pods of 10 plants from each plot. The number of seeds per pod was counted on
ten pods and averaged. For stover yield (kg ha-1), mature plants were collected from 1-m2 in each plot at harvest time. The harvested plants were sun dried and
seeds were separated. The dry stovers were weighed and the weight was

546 QUDDUS et al.
converted to kg ha-1. The seed yield (kg ha-1) was measured based on whole plot (4 m× 3 m) technique. The 100- seed weight (g) was determined by randomly
counting of 100- seed from the whole seeds from each plot and weighed. Initial soil samples (0-15 cm depth) of two locations were collected and brought to the
laboratory and spread on a brown paper for air drying. The air-dry soil samples were ground and passed through a 2-mm sieve. After sieving, the prepared soil
samples were kept into plastic containers with proper label for chemical analysis. Soil pH was measured by glass electrode pH meter using soil: water ratio of 1:2.5
(Page et al., 1982) and organic matter by Nelson and Sommers (1982) method; total N by Microkjeldahl method (Bremner and Mulvaney, 1982); exchangeable
K by 1N NH4OAc method (Jackson, 1973); exchangeable Ca by 1N NH4OAc
method (Gupta, 2004); available P by Olsen and Sommers (1982) method for calcareous soil and Bray and Kurtz (1945) method for terrace soil; available S by
turbidity method using BaCl2 (Fox et al., 1964); available Zn by DTPA method (Lindsay and Norvell, 1978); available B by azomethine-H method (Page et al.,
1982). Plant samples (stover and seed) against each treatment were oven-dried at 70°C for 48 h and were finely ground using CyclotecTM 1093 sample Mill (Made
in Sweden). An amount of 0.1 g ground sample (stover and seeds) was analyzed for N using the Kjeldahl method FOSS (Persson et al., 2008). Protein content in
chickpea seed was calculated by considering the pulses food factor 5.30 (FAO, 2018). The protein content was estimated by multiplying the %N content of seed
with pulses food factor 5.30 that means (%N × 5.30). Analysis of variance (ANOVA) for the yield, yield attributes, nodulation and N and protein contents
were done following the Statistix 10 package (Statistix 10., 1985). Data of yield attributes, nodules per plant, N and protein content were computed averaged of
two study years in each location. Averaged data of all parameter were also statistical analyzed through ANOVA procedure using a split-plot design with
three replicates considering main-plot factor variety and sub-plot for factor B.
Then multiple comparisons like all-pairwise comparisons i.e. the means of treatment tested by LSD method at 5% (LSD 0.05) and level of significance
(Statistix 10., 1985).
Results and Discussion
Effects of varieties and boron
The interaction between variety and boron showed significant variation in seed
yield of chickpea over the years and locations (Table 2). The mean seed yield varied from 865 kg ha-1 to 1338 kg ha-1 at Madaripur and 1121 kg ha-1 to 2218 kg
ha-1 at Gazipur across the treatments. The highest seed yield (1649 kg ha-1 in the 1st year and 1026 kg ha-1 in the 2nd year) at Madaripur was found in the treatment
V3B1.5 which was statistically similar to V1B1.5 and V1B2 in the 1st year and V3B2 & V3B1 in the 2nd year. At Gazipur, the highest seed yield of 1965 kg ha-1 in the
1st year and 2471 kg ha-1 in the 2nd year was found in the treatment V3B1.5 followed by V3B2 in the 1st year. Positive response of pulse crops to B application

RESPONSE OF CHICKPEA VARIETIES TO BORON APPLICATION 547
Ta
ble
2.
Eff
ects
of
bo
ron
ra
tes
on
th
e se
ed
an
d s
tov
er y
ield
s o
f ch
ick
pea
va
riet
ies
Tre
atm
ent
See
d y
ield
(kg h
a-1
) S
tover
yie
ld (
kg h
a-1
)
Mad
arip
ur
Gaz
ipur
Mad
arip
ur
Gaz
ipur
1st y
r 2
nd y
r M
ean
1
st y
r 2
nd y
r M
ean
1
st y
r 2
nd y
r M
ean
1
st y
r 2
nd y
r M
ean
v1B
0
12
56
cde
77
4c-
f 1
01
5
11
72
fg
13
52
cd
12
62
29
89d
e 1
65
4c
23
22
28
50
c 3
11
4fg
2
98
2
v1B
1
13
85b
cd
77
7b
-f
10
81
13
29d
ef
15
08
c 1
41
9
31
25
cd
17
45b
c 2
43
5
35
21
a 3
74
5d
36
33
v1B
1.5
16
41
a 7
92
b-e
1
21
7
14
57d
e 1
78
2b
16
20
34
68
a 1
81
2b
c 2
64
0
36
56
a 3
82
4cd
3
74
0
v1B
2
15
43
ab
81
2b
cd
11
78
14
04d
e 1
76
6b
15
85
33
14
abc
19
64b
26
39
36
12
a 3
67
8d
e 3
64
5
v2B
0
11
22
e 6
08
g
86
5
10
34
g
12
08d
11
21
27
45
f 1
61
0c
21
78
29
10
c 3
04
5g
29
78
v2B
1
11
81
e 6
25
fg
90
3
11
58
fg
12
69d
12
14
28
79
ef
17
98b
c 2
33
9
31
23b
c 3
25
8fg
3
19
1
v2B
1.5
13
74b
cd
65
7d
-g
10
16
12
86d
ef
13
47
cd
13
17
32
54b
c 1
80
0b
c 2
52
7
34
89
a 3
41
5ef
3
45
2
v2B
2
12
44
cde
65
0ef
g
94
7
12
75d
ef
13
19
cd
12
97
31
24
cd
16
97
c 2
41
1
34
25
ab
33
56
fg
33
91
v3B
0
12
23d
e 8
91
abc
10
57
14
86
cd
18
00b
16
43
28
33
ef
27
02
a 2
72
3
31
24b
c 3
84
5cd
3
48
5
v3B
1
14
17b
c 9
38
ab
11
78
16
74b
c 1
87
4b
17
74
28
45
ef
27
89
a 2
81
7
35
47
a 4
05
6b
c 3
80
2
v3B
1.5
16
49
a 1
02
6a
13
38
19
65
a 2
47
1a
22
18
34
21
ab
29
41
a 3
18
1
36
14
a 4
45
6a
40
35
v3B
2
14
54b
98
9a
12
22
17
88
ab
18
92b
18
40
33
10
abc
28
12
a 3
06
1
35
89
a 4
26
7ab
3
92
8
CV
(%
) 8
.14
12
.8
- 8
.73
8.8
7
- 3
.58
6.6
1
- 5
.88
5.4
4
-
LS
D0
.05
19
2
17
5
- 2
12
24
8
- 1
91
23
9
- 3
40
34
2
-
Val
ues
wit
hin
the
sam
e co
lum
n w
ith a
co
mm
on l
ette
r d
o n
ot
dif
fer
sig
nif
ican
tly (
P<
0.0
5).

548 QUDDUS et al.
(0.5 to 2.5 kg B ha-1) was reported by Ceyhan and Onder (2007). Among the treatments, the lowest seed yield was observed in V2B0 in both years and
locations. The stover yield (mean of two years) of chickpea ranged from 2178 to 3181 kg ha-1 at Madaripur and 2978 to 4035 kg ha-1 at Gazipur. The V3B1.5
treatment showed the highest stover yield across the years and locations (Table 2). The results indicate that every variety at 1.5 kg ha-1 B rate demonstrated
positive effect on the yields of chickpea. The seed yield of chickpea was found comparatively lower in the 2nd year at Madaripur. This variation might be due to
infestation of chickpea plants by Fusarium wilt in the 2nd year.
Table 3. Effects boron rates on the yield attributes (pooled data of two years) of
chickpea varieties
Treatment Plant height (cm) Pods plant-1 Seeds pod-1
100 seed weight (g)
Madaripur Gazipur Madaripur Gazipur Madaripur Gazipur Madaripur Gazipur
v1B0 32.1e 43.6e 27.9de 37.1fg 1.12bcd 1.13 13.0e 13.2c
v1B1 33.0de 46.1de 29.1cd 42.2cd 1.15a-d 1.21 13.4e 13.6c
v1B1.5 35.7cde 49.4abc 31.7b 43.1cd 1.24ab 1.26 13.3e 13.8c
v1B2 34.7cde 47.9bcd 30.7bc 43.4c 1.21a-d 1.23 13.0e 13.4c
v2B0 34.9cde 45.4de 21.2i 36.5g 1.06d 1.09 24.5b 25.6a
v2B1 36.2cd 47.6bcd 22.2hi 38.0fg 1.08cd 1.11 25.0ab 26.2a
v2B1.5 37.4bc 49.5abc 25.0fg 39.3ef 1.17a-d 1.13 25.3a 26.8a
v2B2 36.7cd 46.7cd 24.0gh 38.4efg 1.12bcd 1.11 24.9ab 26.2a
v3B0 36.8c 47.2bcd 26.5ef 40.7de 1.19a-d 1.19 20.7cd 20.7b
v3B1 37.9bc 50.0ab 28.6d 48.5b 1.23abc 1.22 21.0cd 21.4b
v3B1.5 41.6a 51.0a 33.6a 51.9a 1.30a 1.27 21.2c 21.7b
v3B2 40.8ab 49.4abc 30.9bc 49.0b 1.24ab 1.23 20.6d 20.9b
CV (%) 5.79 3.86 4.38 3.00 7.26 10.8 1.51 4.31
LSD0.05 3.6 3.2 2.1 2.2 0.15 ns 0.5 1.5
Values within the same column with a common letter do not differ significantly (P<0.05)
Yield attributes of chickpea viz. plant height, number of pods per plant, number
of seeds per pod and 100-seed weight were influenced significantly by the treatments of varieties and B rates in both locations except number of seeds per
pod at Gazipur. The tallest plant was found in the treatment V3B1.5 followed by V3B2 and dwarf plant was observed in the treatment V1B0 in both Madaripur
and Gazipur (Table 3). The maximum number of pods per plant (33.6 at Madaripur and 51.9 at Gazipur) was recorded in the treatment V3B1.5 which was
significantly different from the other treatments at Madaripur and Gazipur. The highest number of seeds per pod was counted in the treatment V3B1.5 which
showed significant variation between the treatments but not at Gazipur. Ceyhan

RESPONSE OF CHICKPEA VARIETIES TO BORON APPLICATION 549
and Onder (2007) reported significant variation in varietal response to different B
rates. The highest 100-seed weight was observed in V2B1.5 which was significantly different from other treatments, however, statistically similar for
V2B2 and V2B1 (Table 3). Among the three varieties of chickpea, BARI Chola-8 under Kabuli type and the seed size was inherently bigger than other two
varieties. Every variety at 1.5 kg B ha-1 gave better contribution compared to 1 kg B ha-1 or 2 kg B ha-1.
Table 4. Effects of varieties and B rates on the number of nodules per plant,
nitrogen (N) and protein contents of chickpea (pooled data of two years)
Treatment No. of nodules plant-1 N content (%) Protein content (%)
Madaripur Gazipur Madaripur Gazipur Madaripur Gazipur
v1B0 22.5de 23.4d 3.25c 3.12b 17.2c 16.5b
v1B1 24.3cde 27.8c 3.67abc 3.45ab 19.5abc 18.3ab
v1B1.5 25.6abc 29.4bc 3.85abc 3.50ab 20.4abc 18.6ab
v1B2 25.0bcd 28.1c 3.69abc 3.46ab 19.6abc 18.3ab
v2B0 22.3e 24.3d 3.26c 3.06b 17.3c 16.2b
v2B1 23.0de 27.6c 3.45abc 3.25ab 18.3abc 17.2ab
v2B1.5 27.4ab 30.2b 3.99ab 3.78ab 21.1ab 20.0ab
v2B2 24.9b-e 28.7bc 3.76abc 3.55ab 19.9abc 18.8ab
v3B0 23.4cde 25.1d 3.33bc 3.18ab 17.7bc 16.9ab
v3B1 25.9abc 29.3bc 3.67abc 3.56ab 19.5abc 18.9ab
v3B1.5 27.8a 32.4a 4.05a 3.98a 21.5a 21.1a
v3B2 26.1abc 30.5ab 3.66abc 3.65ab 19.4abc 19.3ab
CV (%) 6.79 4.33 10.8 13.9 10.7 14.0
LSD0.05 2.9 2.1 0.68 0.83 3.56 4.41
Values within the same column with a common letter do not differ significantly (P<0.05)
Presence of favorable soil environment and B nutrient along with other macro
and micro nutrients might have promoted the nodule formation of chickpea
varieties. Chickpea varieties and B rates demonstrated significantly a good
number of active nodules per plant (Table 4). The number of nodules per plant
ranged from 22.3 to 27.8 across the treatments. The maximum number of nodules
per plant was counted from the treatment V3B1.5 which was significantly different
from other treatments. The minimum number of nodules per plant was counted in
V2B0 (Table 4). Alam et al. (2017) reported that the interaction between variety
and boron level created significant variation in respect of number of nodules
plant-1. In contrast with our result, Alam et al. (2017) found the maximum
number of nodules plant-1 (30.8) in BARI Chola-8 with 3 kg B ha-1. The variation

550 QUDDUS et al.
in the number of nodules per plant over the varieties might be due to variation in
microbes and edhaphic condition of that area. The whole nodulation process is
regulated by highly complex chemical communications between the plant and the
bacteria. The protein content varied between 17.2 to 21.5% at Madaripur and
16.2 to 21.1% at Gazipur across the varieties and B rates. The highest protein
content (21.5% at Madaripur and 21.1 at Gazipur) was measured from the
treatment V3B1.5 which showed in most cases significantly similar with the other
treatments. The lowest protein content in seed (17.2% at Madaripur and 16.2% at
Gazipur) was measured from V1B0 treatment.
Effects of varieties
Chickpea yield in both locations was significantly different between the varieties
(Table 5). The mean seed yield (mean of two years) ranged from 933 to 1198 kg
ha-1 in Madaripur and 1237 to 1869 kg ha-1 in Gazipur across the varieties. The
highest seed yield (1435 kg ha-1 in the 1st year and 961 kg ha-1 in the 2nd year at
Madaripur and 1728 kg ha-1 in the 1st year and 2009 kg ha-1 in the 2nd year at
Gazipur) was obtained from V3 (BARI Chola-9) which was significantly higher
than other varieties. The lowest mean seed yield of 933 kg ha-1 at Madaripur and
1237 kg ha-1 at Gazipur were recorded with the variety BARI Chola-8 (Table
5).The stover yield showed significant variation during two consecutive years in
both the locations due to different chickpea varieties. The highest mean stover
yield (2957 kg ha-1 in Madaripur and 3813 kg ha-1 in Gazipur) was recorded from
BARI Chola-9 and the lowest stover yield of 2364 kg ha-1 at Madaripur and 3252
kg ha-1 at Gazipur was found in BARI Chola-8 (Table 5). This variation might be
due to varietal characters; as a result BARI Chola-9 gave the highest yield. Boron
doses exerted significant influence on the seed yield of chickpea. This result is
supported by Alam et al. (2017) conducted in Rajshahi region of Bangladesh that
BARI Chola-8 produced the highest seed yield. Plants must adapt their growth by
sensing and responding to surrounding conditions like availability of nutrients in
the soil for ensuring successful reproduction and yield.
Yield attributes showed significant variation due to chickpea varieties at the
locations of Madaripur and Gazipur (Table 6). The highest plant height (39.3 cm
at Madaripur and 49.4 cm at Gazipur) was recorded from V3 (BARI Chola-9)
which was significantly different from other varieties. The maximum number of
pods per plant (29.9 at Madaripur and 47.5 at Gazipur) was found in V3 which
was significantly different to other, but statistically similar to BARI Chola-5 at
Madaripur. The maximum number of seeds per pod (1.24 at Madaripur and 1.23
at Gazipur) was recorded from BARI Chola-9 followed by BARI Chola-5. The
highest seed weight (24.9 g at Madaripur and 26.2 g at Gazipur) was obtained in
BARI Chola-8 which was significantly different over other varieties (Table 6).

RESPONSE OF CHICKPEA VARIETIES TO BORON APPLICATION 551
Ta
ble
5.
Eff
ects
of
chic
kp
ea v
ari
etie
s o
n y
ield
s
Chic
kp
ea
var
iety
See
d y
ield
(kg h
a-1
) S
tover
yie
ld (
kg h
a-1
)
Mad
arip
ur
Gaz
ipur
Mad
arip
ur
Gaz
ipur
1st y
r 2
nd y
r m
ean
1
st y
r 2
nd y
r m
ean
1
st y
r 2
nd y
r m
ean
1
st y
r 2
nd y
r m
ean
V1
14
56
a 7
89
b
11
23
13
41b
16
02b
14
72
32
24
a 1
79
4b
25
09
34
10
a 3
59
0b
35
00
V2
12
30b
63
5c
93
3
11
88
c 1
28
6c
12
37
30
01b
17
26b
23
64
32
37b
32
67
c 3
25
2
V3
14
35
a 9
61
a 1
19
8
17
28
a 2
00
9a
18
69
31
02b
28
11
a 2
95
7
34
69
a 4
15
6a
38
13
CV
(%
) 5
.09
6.5
2
- 6
.52
5.0
4
- 3
.17
3.6
3
- 2
.63
1.6
9
-
LS
D0
.05
79
.2
58
.7
- 1
04
93
.2
- 1
11
86
.8
- 1
00
70
.4
-
Val
ues
wit
hin
the
sam
e co
lum
n w
ith a
co
mm
on l
ette
r d
o n
ot
dif
fer
sig
nif
ican
tly (
P<
0.0
5)
V1=
BA
RI
Cho
la-5
, V
3=
BA
RI
Cho
la-9
, V
2=
BA
RI
Cho
la-8
Ta
ble
6.
Eff
ects
of
chic
kp
ea v
ari
etie
s o
n t
he
yie
ld a
ttri
bu
tes
(po
ole
d d
ata
of
two
yea
rs)
Chic
kp
ea
var
iety
Pla
nt
hei
ght
(cm
) N
o.
of
po
ds
pla
nt-1
N
o.
of
seed
s p
od
-1
10
0 s
eed
wei
gh
t (g
)
Mad
arip
ur
Gaz
ipur
Mad
arip
ur
Gaz
ipur
Mad
arip
ur
Gaz
ipur
Mad
arip
ur
Gaz
ipur
V1
33
.9c
46
.7b
2
9.8
a 4
1.5
b
1.1
8ab
1
.21
a 1
3.2
c 1
3.5
c
V2
36
.3b
47
.3b
2
3.1
b
38
.1c
1.1
1b
1
.11
b
24
.9a
26
.2a
V3
39
.3a
49
.4a
29
.9a
47
.5a
1.2
4a
1.2
3a
20
.9b
21
.2b
CV
(%
) 4
.98
1.8
3
1.2
7
3.7
2
6.5
4
6.4
6
2.2
6
2.9
6
LS
D0
.05
2.1
0
.99
0.4
0
1.7
8
0.0
9
0.0
9
0.5
0
0.6
8
Val
ues
wit
hin
the
sam
e co
lum
n w
ith a
co
mm
on l
ette
r d
o n
ot
dif
fer
sig
nif
ican
tly (
P<
0.0
5)
V1=
BA
RI
Cho
la-5
, V
3=
BA
RI
Cho
la-9
, V
2=
BA
RI
Cho
la-8

552 QUDDUS et al.
Chickpea varieties influenced significantly on the number of nodules per plant. The highest number of nodules per plant (25.8 at Madaripur and 29.3 at
Gazipur) was counted in BARI Chola-9. This variation might be inherent characters of BARI Chola-9. Nitrogen and protein contents showed non-
significant variation across chickpea varieties. BARI Chola-9 assimilated the highest protein content (19.9% at Madaripur and 19.0% at Gazipur) than the
rest of the varieties (Table 7).
Table 7. Effects of chickpea varieties on the number of nodules plant-1, N and
protein content (pooled data of two years)
Chickpea variety No. of Nodules plant-1 N content (%) Protein content (%)
Madaripur Gazipur Madaripur Gazipur Madaripur Gazipur
V1 24.3b 27.2b 3.62 3.38 19.2 17.9
V2 24.4b 27.7b 3.61 3.41 19.2 18.1
V3 25.8a 29.3a 3.68 3.59 19.5 19.0
CV (%) 2.90 3.41 8.84 10.2 8.80 10.3
LSD0.05 0.8 1.1 ns ns ns ns
Values within the same column with a common letter do not differ significantly (P<0.05)
V1=BARI Chola-5, V3=BARI Chola-9, V2=BARI Chola-8
Table 8. Effects of different levels of boron on the yields of chickpea
Boron
levels
(kg ha-1)
Seed yield (kg ha-1) Stover yield (kg ha-1)
Madaripur Gazipur Madaripur Gazipur
1st yr 2nd yr mean 1st yr 2nd yr mean 1st yr 2nd yr mean 1st yr 2nd yr mean
0 1200c 758 979 1231c 1453c 1342 2856c 1989b 2423 2961b 3335c 3148
1 1328b 780 1054 1387b 1550bc 1469 2950c 2111ab 2531 3397a 3686b 3542
1.5 1555a 825 1190 1569a 1867a 1718 3382a 2184a 2783 3586a 3898a 3742
2 1414b 817 1116 1489ab 1659b 1574 3249b 2158a 2704 3542a 3767ab 3655
CV
(%) 5.09 6.52 - 6.52 5.04 - 3.17 3.63 - 2.63 1.69 -
LSD0.05 110 ns - 122 143 - 110 138 - 196 198 -
Values within the same column with a common letter do not differ significantly (P<0.05)
Effects of boron application
Yields of chickpea varieties increased markedly due to application of boron. The mean seed yield at Madaripur ranged from 979 to 1190 kg ha-1 and at Gazipur
ranged from 1342 to 1718 kg ha-1 due to application of different rates of B. The highest seed yield (1555 kg ha-1 in the 1st year & 825 kg ha-1 in the 2nd year at

RESPONSE OF CHICKPEA VARIETIES TO BORON APPLICATION 553
Madaripur and 1569 kg ha-1 in the 1st year & 1867 kg ha-1 in the 2nd year at
Gazipur) obtained in the plot receiving of 1.5 kg B ha-1 which was significantly different with the other plot receiving of 2.0 kg B ha-1 or 1.0 kg B ha-1 except the
2nd year at Madaripur that was showed non-significant (Table 8). Khanam et al. (2000) reported that the seed yield of chickpea was affected significantly due to
different rates of boron application. The stover yield of chickpea varieties across the rates of boron showed in some exception almost similar trend of seed yield
(Table 8).The seed yield (mean of two years) of chickpea in Gazipur was observed higher over the yield of Madaripur. Because chickpea plants in the 2nd
year were infested by the disease Fusarium wilt in Madaripur. The weather of 2nd year and soil condition might be favoured for the disease Fusarium wilt.
Different boron fertilization showed significant effect on yield attributes of
chickpea varieties except seeds per pod at Gazipur (Table 9). The highest plant height (38.2 cm at Madaripur and 49.9 cm at Gazipur) was noted from the rate of
B 1.5 kg ha-1 followed by 2.0 kg ha-1 in both locations. The maximum number of pods per plant (30.1 at Madaripur and 44.8 at Gazipur) was counted from
application of 1.5 kg B ha-1 followed by 2.0 kg B ha-1. The maximum number of seeds per pod was recorded from application of 1.5 kg B ha-1 in both locations
(Table 9). Similar results were also reported by Alam et al. (2017). The highest 100-seed weight (19.9 g at Madaripur and 20.8 g at Gazipur) was obtained from
application of 1.5 kg B ha-1. In most of the cases, the lowest yield attributes of chickpea varieties were found in B0 treatment (Table 9).
Table 9. Effect of different rates of boron on the yield attributes of chickpea (pooled
data of two years)
Boron
levels
(kg ha-1)
Plant height (cm) No. of pods plant-1 No. of seeds pod-1 100 seed weight (g)
Madaripur Gazipur Madaripur Gazipur Madaripur Gazipur Madaripur Gazipur
0 34.6c 45.4c 25.2d 38.1c 1.12b 1.14 19.4b 19.8b
1 35.7bc 47.9b 26.6c 42.9b 1.15ab 1.18 19.8a 20.4ab
1.5 38.2a 49.9a 30.1a 44.8a 1.24a 1.22 19.9a 20.8a
2 37.4ab 48.0b 28.5b 43.6ab 1.19ab 1.19 19.5b 20.2ab
CV
(%) 4.98 1.83 1.27 3.72 6.54 6.46 2.26 2.96
LSD0.05 2.09 1.83 1.20 1.26 0.08 ns 0.29 0.87
Values within the same column with a common letter do not differ significantly (P<0.05)
The number of nodules per plant increased with the increasing rates of boron
application (Table 10). The highest number of nodules per plant (26.9 at Madaripur and 30.7 at Gazipur) was achieved by the application of 1.5 kg B ha-1
554 QUDDUS et al.
which showed significant variation with other B application rates but statistically identical to application of 2 kg B ha-1 at Madaripur (Table 10).
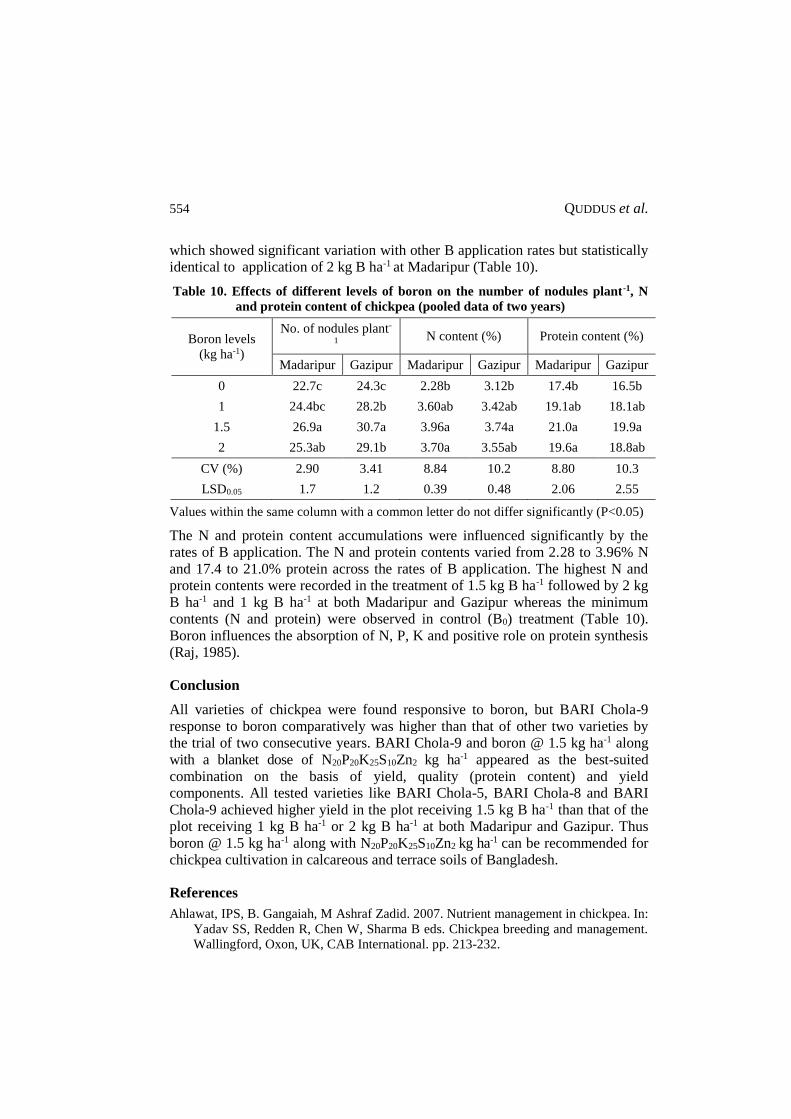
Table 10. Effects of different levels of boron on the number of nodules plant-1, N
and protein content of chickpea (pooled data of two years)
Boron levels
(kg ha-1)
No. of nodules plant-
1 N content (%) Protein content (%)
Madaripur Gazipur Madaripur Gazipur Madaripur Gazipur
0 22.7c 24.3c 2.28b 3.12b 17.4b 16.5b
1 24.4bc 28.2b 3.60ab 3.42ab 19.1ab 18.1ab
1.5 26.9a 30.7a 3.96a 3.74a 21.0a 19.9a
2 25.3ab 29.1b 3.70a 3.55ab 19.6a 18.8ab
CV (%) 2.90 3.41 8.84 10.2 8.80 10.3
LSD0.05 1.7 1.2 0.39 0.48 2.06 2.55
Values within the same column with a common letter do not differ significantly (P<0.05)
The N and protein content accumulations were influenced significantly by the rates of B application. The N and protein contents varied from 2.28 to 3.96% N
and 17.4 to 21.0% protein across the rates of B application. The highest N and protein contents were recorded in the treatment of 1.5 kg B ha-1 followed by 2 kg
B ha-1 and 1 kg B ha-1 at both Madaripur and Gazipur whereas the minimum contents (N and protein) were observed in control (B0) treatment (Table 10).
Boron influences the absorption of N, P, K and positive role on protein synthesis (Raj, 1985).
Conclusion
All varieties of chickpea were found responsive to boron, but BARI Chola-9
response to boron comparatively was higher than that of other two varieties by the trial of two consecutive years. BARI Chola-9 and boron @ 1.5 kg ha-1 along
with a blanket dose of N20P20K25S10Zn2 kg ha-1 appeared as the best-suited
combination on the basis of yield, quality (protein content) and yield components. All tested varieties like BARI Chola-5, BARI Chola-8 and BARI
Chola-9 achieved higher yield in the plot receiving 1.5 kg B ha-1 than that of the plot receiving 1 kg B ha-1 or 2 kg B ha-1 at both Madaripur and Gazipur. Thus
boron @ 1.5 kg ha-1 along with N20P20K25S10Zn2 kg ha-1 can be recommended for chickpea cultivation in calcareous and terrace soils of Bangladesh.
References
Ahlawat, IPS, B. Gangaiah, M Ashraf Zadid. 2007. Nutrient management in chickpea. In:
Yadav SS, Redden R, Chen W, Sharma B eds. Chickpea breeding and management.
Wallingford, Oxon, UK, CAB International. pp. 213-232.

RESPONSE OF CHICKPEA VARIETIES TO BORON APPLICATION 555
Alam, M. S., K. J. Ali and A. Hoque. 2017. Yield and yield component of chickpea as
affected by boron application. Journal of Experimental Agriculture International,
15(2): 1-9; Article no.JEAI.8944. DOI: 10.9734/JEAI/2017/8944
BBS (Bangladesh Bureau of statistics). 2012. Bulletin of tropical legume Bangladesh.
Stat. Div. Ministry Plann. Govt. People’s Repub. of Bangladesh, 150-160.
Bray, R.H. and L.T. Kurtz. 1945. Determination of total, organic and available forms of
phosphorus in soils.Ibid. 59:39-45.
Bremner, J.M. and C.S. Mulvaney. 1982. Total nitrogen. In A. L. Page, R. H. Miller, D.
R. Keeney (Eds.), Methods of Soil Analysis (Part 2, 2nd ed., pp. 599-622). Am. Soc.
Agron., Madison, USA.
Ceyhan, E., and M. Onder. 2007. Response of chickpea cultivars to application of boron
in boron- deficient calcareous soils. Communications in Soil Science Plant Analysis.
38: 2381-2399.
FAO., 2018. Analysis of Protein. Food and agriculture Origination publication, FAO
Food and Nutrition Paper 14/7. Centre for Food Safety, UN.
http://www.cfs.gov.hk/english/programme/programme_nifl/files/Analysis_of_Protei
n.pdf (accessed on 08 January 2018)
Fox, R.L., R.A. Olsen, H.F. Rhoades. 1964. Evaluating the sulphur status of soil by plant
and soil test. Soil Science Society of America Proc, 28, 243-246.
https://doi.org/10.2136/sssaj1964.03615995002800020034x
FRG (Fertilizer Recommendation Guide). 2012. Fertilizer Recommendation Guide,
Published by Bangladesh Agricultural Research Council, Dhaka, Bangladesh.
Gupta, P.K. 2004. Soil, Plant, Water and Fertilizer Analysis. Department of Agricultural
Chemistry and Soil Science, Maharana Pratap University of Agriculture &
Technology, Rajasthan, India. Pp. 168-170.
Jackson, M.L. 1973. Soil Chemical Analysis (p. 498). Prentice Hall of India Private
Limited, New Delhi.
Jahiruddin, M., 2015. Book. Zinc and boron deficiency in crops and their management in
Bangladesh. Department of Soil Science, Bangladesh Agricultural University,
Mymensingh, Pp 1-27.
Khanam R, M. S. Arefin, M. R. Haque, M. A. Islam, M. Jahiruddin. 2000. Effects of
magnesium, boron and molybdenum on the growth, yield and protein content of
chickpea and lentil. Progress. Agric. 11(1-2):77-80.
Kuldeep Balai, Y. Sharma, M. Jajoria, P. Deewan and R. Verma. 2017. Effect of
phosphorus, and zinc on growth, yield and economics of chickpea (cicer aritinum l.).
Int.J.Curr.Microbiol.App.Sci. 6(3): 1174-1181. https://doi.org/10.20546/ijcmas.2017.
603.136
Legesse Hidoto, Bunyamin Tar’an, Walelign Worku, and Hussein Mohammed. 2017.
Towards zinc biofortification in chickpea: performance of chickpea cultivars in
response to soil zinc application. Agronomy. 7(11): 1-14. doi:10.3390/
agronomy7010011
Lindsay, W.L., W.A. Norvell. 1978. Development of DTPA soil test for zinc, iron,
manganese and copper. Soil science Society of American. J. 42: 421-8.

556 QUDDUS et al.
Nelson, D.W., L.E. Sommers. 1982. Total carbon, organic carbon and organic matter. In
A. L. Page, R. H. Miller, & D. R. Keeney (Eds.), Methods of Soil Analysis (Part 2,
2nd ed., pp. 539-580). Am. Soc. of Agron., Madison, USA.
Olsen, S., L.E. Sommer. 1982. Phosphorus. In A. L. Page, R. H. Miller, & D. R. Keeney
(Eds.), Methods of Soil Analysis (Part 2, 2nd ed., pp. 403-427). Am. Soc. of Agron.,
Madison, USA.
Page, A.L., R.H. Miller and D.R. Keeney (Eds.). 1982. Agronomy Series 9 ASA, SSSA.
Methods of Soil Analysis (Part 2, 2nd ed., Pp. 403-427). Am. Soc. of Agron.,
Madison, USA.
Persson, Jan-Ake, M. Wennerholm and S. O’Halloram. 2008. Handbook for Kjeldahl
Digestion. Published by FOSS, DK-3400 Hilleroed, Denmark. ISBN 91-630-3471-9.
Quddus, M.A., H.M. Naser, M.A. Hossain, M. Abul Hossain. 2014. Effect of zinc and
boron on yield and yield contributing characters of lentil in low Ganges river
floodplain soil at madaripur, bangladesh. Bangladesh J. Agril. Res. 39(4): 591-603.
Raj, S. 1985. An introduction to physiology of field crops, Oxford and IBH Publishing
Co., New Delhi. Pp. 94-97.
Statistix 10., 1985. An Anlytical Software, Po Box 12185, Tallahassee, FL 32317, Copy
right © 1985-2013

ISSN 0258-7122 (Print), 2408-8293 (Online)
Bangladesh J. Agril. Res. 43(4): 557-574, December 2018
RESPONSE OF BROCCOLI TO USG AND PRILLED UREA IN
SHALLOW RED-BROWN TERRACE SOIL UNDER
MADHUPUR TRACT
M. J. HUSSAIN1, A. J. M. S. KARIM2, A. R. M. SOLAIMAN2
M. S. ISLAM2 AND M. RAHMAN3
Abstract
A field experiment was conducted at Bangabandhu Sheikh Mujibur Rahman
Agricultural University, Gazipur during the period from 2012-13 to verify the
effectiveness of urea super granule (USG) and prilled urea (PU) on the yield and
quality of broccoli, to assess the comparative performance of USG and PU on
nutrient uptake and nitrogen use efficiency and to evaluate the effect of USG
and PU on post-harvest nutrient status in Shallow Red-Brown Terrace Soil of
Madhupur Tract (AEZ-28). The experiment was designed in a randomized
complete block with three replications having 5 treatments as T1: Control, T2:
USG-N140, T3: USG-N160, T4: USG-N180 and T5: PU-N180. Result showed that
USG performed better than PU. The comparative performance of USG in
relation to yield, head quality (ascorbic acid, β-carotene and chlorophyll
content), SPAD value, nutrient (NPKS) uptake and N use efficiency was found
higher as compared to PU. USG treated broccoli plants gave significantly higher
yield where the highest yield (13.49 ton ha-1) was recorded with USG-N160 kg
ha-1. Moreover, USG showed higher β-carotene and chlorophyll content over PU
and those were increased with increasing levels of N. However, ascorbic acid
content was slightly decreased with increasing rate of N fertilizer. Nitrogen,
phosphorus and potassium uptake increased with increasing N rate upto USG-
N180 but sulphur uptake was increased upto USG-N160. Nitrogen use efficiency
was higher in USG treated plots than that of PU having the highest value of
111.71% with USG-N160 kg ha-1. Post-harvest soil nutrient status was not
significantly influenced by the treatments although it was slightly higher in USG
as compared to PU. Considering all, USG @ 160 kg N ha-1 (USG-N160) with
other recommended fertilizers (@ 53 kg P, 83 kg K, 20 kg S, 2.0 kg Zn, 1 kg B
and 0.8 kg Mo ha-1) could be the best USG based fertilizer dose for quality
broccoli production in Shallow Red-Brown Terrace Soil of Madhupur Tract.
Keywords: Broccoli, USG, head quality, chlorophyll content, nitrogen use efficiency, soil nutrient status.
1Senior Scientific Officer, Soil & Water Management Section, Horticulture Research
Centre, Bangladesh Agricultural Research Institute (BARI), Gazipur, 2Professor,
Department of Soil Science, Bangabandhu Sheikh Mujibur Rahman Agricultural
University (BSMRAU), Gazipur, 3Professor, Department of Hoticulture, BSMRAU,
Gazipur, Bangladesh.
DOI: http://dx.doi.org/10.3329/bjar.v43i4.39153

558 HUSSAIN et al.
Introduction
Broccoli (Brassica oleracia var. italica L.) is one of the winter vegetables
belonging to the family Cruciferae. It is a beneficial and more nutritious vegetable than any other of the same genus (Yoldas et al., 2008). It is well known
that, broccoli has enormous nutritional and medicinal values due to its high contents of vitamins (A, B1, B2, B5, B6 and E), minerals (Ca, Mg, Zn and Fe) and
antioxidant substances which prevent the formation of cancer causing agents (Beecher, 1994). Broccoli contains a higher rate of sulforaphane that prevents
Helicobacter pylori which are responsible for stomach cancer (Fahey et al., 2002). Nitrogen plays an important role in broccoli production and broccoli is
highly dependent on N fertilization to achieve a good yield (Babik and Elkner,
2002). At present, different sources of N fertilizer are available in the market which may improve fertilizer use efficiency. Among these, USG is used by the
farmers for upland vegetable crops like tomato, cabbage, broccoli, papaya, banana etc (Hussain et al., 2003; Nazrul et al., 2006). Total yield of broccoli is
greatly influenced by the different doses of nitrogenous fertilizer (Bélec et al., 2001). Zaman et al. (1993) reported that N is an important plant nutrient and is
the most limiting one due to its high mobility and different types of losses. To control such losses, USG application may be a good practice to minimize
production cost as well as to increase N use efficiency, yield and quality of the crop.
On the other hand, leaf greenness is closely related to chlorophyll contents which is related to leaf N and the SPAD values- that is proportional to the chlorophyll
content of leaves (Kapotis et al., 2003). Yoldas et al. (2008) reported that application of N increased N, P, K and Fe concentrations in broccoli head.
Evaraarts and Willigen (1999) found that band placement of N influenced N uptake positively. The increase rate of N fertilizer induces increase of nitrate
content in plant tissue of broccoli (Zebarth et al., 1995). As nitrogen plays a
major role in agriculture and is also responsible for a number of environmental problems, nitrogen management is indispensable for maximizing broccoli yield
and minimizing N loss and cultivation cost. Therefore, it is essential to evaluate the different forms of N and levels of USG and PU application for sustainable
crop cultivation. To attain this goal the present study was undertaken to verify the effectiveness of USG and PU on the yield and quality of broccoli, to assess the
comparative performance of USG and prilled urea on nutrient uptake and N use efficiency and to evaluate the effect of USG and PU on post-harvest nutrient
status in Shallow Red-Brown Terrace Soil under Madhupur Tract (AEZ-28).
Materials and Methods
A field experiment was conducted at Bangabandhu Sheikh Mujibur Rahman Agricultural University during rabi season of 2012 – 2013. The soil of the
experimental field belongs to Salna series representing the Shallow Red-Brown

RESPONSE OF BROCCOLI TO USG AND PRILLED UREA IN SHALLOW 559
Terrace which falls under the order Inceptisols (FAO, 1988) representing
Madhupur Tract (AEZ-28). Before setting up of the experiment, soil samples were collected from the experimental plots and different physico-chemical
properties were analyzed as presented in Table 1a and 1b.
Table 1a. Physical properties of initial soil of the experimental plot
Soil properties (0-15 cm soil
depth) Analytical value
Particle size distribution of soil:
Sand (%)
Silt (%)
Clay (%)
17.8
45.6
36.6
Texture Silty clay loam
Bulk density (g cm-3) 1.34
Particle density (g cm-3) 2.61
Porosity (%) 47.47
Field capacity (%) 28.67
Table 1b. Chemical properties of initial soil of the experimental plot
Soil properties
(0-15 cm soil
depth)
Soil
pH
Organic
carbon
Total
N
Exchangeable
K CEC
Available
P
Available
S
Available
B
% meq/100g soil µg g-1
Analytical
value
5.97 0.96 0.10 0.32 12.67 14.18 13.78 0.21
The experiment was laid out in a randomized complete block design with three
replications having 5 treatments comprised of different levels of USG and PU as-
T1: Control (0 kg N), T2: USG-N140 (140 kg N as USG), T3: USG-N160 (160 kg N as USG), T4: USG-N180 (180 kg N as USG) and T5: PU-N180 (180 kg N as PU).
Besides these, a blanket dose of nutrients @ 53 kg P, 83 kg K, 20 kg S, 2.0 kg Zn, 1 kg B and 0.8 kg Mo ha-1 in the forms of TSP, MoP, gypsum, boric acid,
zinc oxide and sodium molybdate, respectively were applied mostly on the basis of initial soil test value following FRG, 2012 to all plots except the control.
Nitrogen was applied as per treatment in two forms as USG and PU. “Premium Crop” a high yielding variety of broccoli (Brassica oleracea var. italica L.)
collected from Taki seed company, Japan was used as a test crop. The unit plot size was 2.4 m × 2.7 m (6.48 m2) having plot to plot and block to block distances

560 HUSSAIN et al.
0.75 m and 1.0 m, respectively. After proper land preparation, 25-day-old seedlings were transplanted in lines on November 20, 2012 maintaining a row to
row and plant to plant distance 0.60 m and 0.45 m, respectively. Each plot was irrigated uniformly at every alternate day by watering can to bring the soil
moisture at desired level. Weeding was done twice before first and second top dress. Earthing up was done to make a continuous line of ridges and furrows. For
the establishment of crop, furrow irrigation was given at an interval of 7 days. MoP 50% and all other fertilizers except PU and USG were applied as
broadcasting and incorporated in soil during final land preparation. Prilled urea was top-dressed in two equal splits at 15 and 35 DAT in a ring method. At 15
DAT, USG was placed at 7-8 cm below the surface and 9-10 cm apart from
broccoli plant. The remaining 50% MoP was top-dressed at 15 DAT followed by irrigation. Harvesting was started on 25th January and continued up to 5th
February, 2013. Data on yield and other parameters were collected as outlined by Liu et al. (1993). Initial and post-harvest soil samples were collected and
analyzed for both physical and chemical properties. Plant samples were also collected and analyzed for N, P, K, S and B contents. SPAD reading using the
instrument Minolta SPAD-502 meter were recorded at 5 days interval after the application of USG and PU. SPAD readings were taken on the tip of the leaf
along with the midrib (mid-point) of the three youngest but fully expanded leaves of five randomly selected plants. Fifteen leaves were measured at random from
each plot and a mean SPAD value was calculated according to Costa et al. (2003). Post-harvest soil analysis was done to assess soil nutrient status. Total N
of soil was determined following the micro-Kjeldahl method according to Jackson et al. (1973). Available P was determined following the sodium
bicarbonate extraction using Colorimetric method (Olsen et al., 1954). Exchangeable potassium of soil was determined from ammonium acetate (1N
NH4OAC) extract as described by Jackson (1973) using flame-photometer.
Available sulphur in soil was determined by extracting the samples with CaCl2 (0.15%) solution (Page et al., 1982) using spectrophotometer at 420 nm wave
length followed by turbidimetrical method. Total B content was measured by colorimetric method (Hunter, 1980) measuring concentration using double beam
spectrophotometer. (Model no. 200-20, Hitachi, Japan) at 555 nm wave length.
Ascorbic acid (vitamin C) was determined by the Iodate method described by
Samotus et al. (1982) using the formula as stated below:
Ascorbic acid (mg/100g FW) = 13
21
V W
100 V Vf
Where,
V2= Total volume of blended sample (100ml)
V3= Volume of sample extract taken (5ml)

RESPONSE OF BROCCOLI TO USG AND PRILLED UREA IN SHALLOW 561
W= Weight of fresh head sample (20g)
V1 =Titrated volume of KIO3 (ml)
Chlorophyll a, Chlorophyll b and β-carotene were determined following acetone-
haxen method as stated by Masayasu and Yamashita (1992). The chlorophyll a, chlorophyll b and β-carotene contents were estimated using the formula as
follows:
Chlorophyll a (mg/100 ml) = 0.999A663 - 0.0989A645
Chlorophyll b (mg/100 ml) = 0.328A663 + 1.77A645
β-carotene (mg/100 ml) = 0.216A663 - 1.22A645 - 0.304A505 +
0.452A453
*A663, A645, A505, A453 are absorbance at 663 nm, 645 nm, 505 nm and 453 nm,
respectively.
Plant biomass was estimated by oven dry method. Samples were dried at 65°-70° C for 72 hours and weighted. The biomasses per plant, per plot and per hectare
were calculated by the following formula:
a). Biomass per plant (g)= 100
(g) plants 10 of yield biological ground above (Total
b). Biomass per hectare (kg)=Biomass yield per plant (kg) × Number of plants ha-1
To evaluate leaf nutrient content, leaf samples were collected from matured leaf
of five randomly selected plants at harvesting stage which were then oven dried and ground for analyses. To estimate the head quality, samples were collected
from the head of five randomly selected plants from each treatment. Collected
samples were analyzed for vitamin-C, β-carotene and chlorophyll content. Plant nitrogen in leaf, stem and head samples were determined following the Micro-
Kjeldahl method and phosphorus was determined after digestion with HNO3 and HClO4 mixture followed by ammonium vana-molybdate method colorimetrically
with the help of a spectrophotometer at 660 nm wavelength. Potassium contents were determined directly with the help of flame photometer after digesting the
samples with di-acid mixture and sulphur content was measured by adding 6N HCl plant extract with BaCl2 outlined by Black, 1965.
Nutrient uptake from the soil was calculated by using the formula:
Nutrient uptake (kg ha-1) = 100
)ha (kg Y×Nutrient (% -1
Here,
% Nutrient = Average nutrient content (%) of plant or head biomass
Y (kg ha-1) = Total dry matter production of plant or head biomass

562 HUSSAIN et al.
Nitrogen use efficiency (NUE) was determined by the equation stated by Craswell and Godwin (1984):
Nitrogen use efficiency (NUE) = applied N Fertilizer
C) uptake N - F uptake (N×100
Where,
F and C denote fertilized crop and unfertilized (control), respectively.
The collected data were then compiled and statistical analyses were done by
using the statistical package, MSTATC. Mean separation was done by DMRT at 5% level of probability. Computation and preparation of graphs were made using
Microsoft Excel 2003 program.
Results and Discussion
Effect of USG and PU on yield and yield attributes of broccoli
Plant height
Plant height was significantly influenced due to different forms and levels of
nitrogen and it was increased with increasing rate of N fertilizer (Table 2). At harvest, the highest plant height (67.10 cm) was recorded from USG-N180 which
was statistically identical with USG-N160 (65.28 cm) and PU-N180 (64.77 cm) (Table 2). This phenomenon might be due to continuous supply, higher
availability and uptake rate of N from USG for its longer retention in soil than that of PU, which is vulnerable to loss in many ways. The minimum plant height
(44.98 cm) was recorded from N-control. These results are similar to the findings of Hala and Nadia (2009) who observed the highest plant height and number of
leaves plant-1 with the minimum dose of N along with P and K.
Number of leaves plant-1
Number of leaves plant-1 significantly increased due to different forms and levels of N (Table 2). The maximum number of leaves (14.30 plant-1) was recorded
with USG-N180 followed by USG-N160 (14.10 plant-1). The minimum number of leaves (11.63 plant-1) was obtained from the control. These results are in
accordance with the findings of Ouda and Mahadeen (2008). Such effect of N on number of leaves plant-1 was also reported by Nasreen et al. (1992) and Masson
et al. (1991). Thakur et al. (1991) reported that increasing rate of N application
delayed head maturity and increased the number of leaves plant-1, leaf area, gross plant weight, stalk length, dry matter content and head yield of cauliflower.
Head length
The highest head length (14.07 cm) was recorded from USG-N140 followed by USG-N160 which was statistically identical with PU-N180 and USG-N180 (Table 2)

RESPONSE OF BROCCOLI TO USG AND PRILLED UREA IN SHALLOW 563
but significantly higher over N-control. The head length recorded in PU-N180 was higher than that of USG-N180 which might be due to lower flow of translocates to cell development in comparison to cell elongation. The lowest head length (10.4 cm) was observed in N-control. Chao-Jiong et al. (2010) also reported similar result in case of broccoli.
Head diameter
Head diameter was significantly affected by the different levels of N where the maximum head diameter (19.47 cm) was recorded from USG160, which was statistically similar to USG-N180 (18.67 cm) but significantly higher than all other treatments (Table 2). This might be due to continuous and balanced supply of assimilates from leaf to floret. The lowest diameter (9.83 cm) was recorded from N-control. This finding is in agreement with the findings of Yoldas et al. (2008) who reported that increased N rates significantly increased yield, average weight of main and lateral heads, and the diameter in broccoli compared to control.
Head weight
Individual head weight was also significantly influenced by the application of different N levels. It was increased with increasing level of N fertilizer upto 160 kg N ha-1 where the highest head weight (364.3 g plant-1) was obtained from USG-N160 followed by USG-N180 which was statistically identical with PU180 (Table 2). This might be due to maximum translocation of carbohydrate from leaf to head which increased size, shape and head compactness with an optimum vegetative growth. The minimum head weight (131.8 g plant-1) was recorded from N-control. Similar results were obtained by Chao-Jiong (2010) in broccoli. Rickard (2008) reported that N had a curvilinear effect on marketable yield and an increase was seen up to application of 165 kg N ha-1 which may justify the present findings.
Table 2. Effect of different forms and levels of N-fertilizer on yield components of
broccoli
Treatment Plant height
(cm)
Number of
leaves plant-1
Head length
(cm)
Head
diameter
(cm)
Head weight
(g plant-1)
Control
USG-N140
USG-N160
USG-N180
PU-N180
51.64 c
62.14 b
65.28 ab
67.10 a
64.77 ab
11.63 b
13.56 a
14.10 a
14.30 a
13.93 a
10.40 b
14.07 a
14.00 a
13.07 a
13.47 a
9.83 d
17.43 bc
19.47 a
18.67 ab
17.20 c
131.8 c
316.3 b
364.3 a
349.0 ab
325.3 ab
CV (%) 2.45 4.41 8.58 4.04 6.88
SE (±0.05) 0.8809 0.3440 0.6439 0.3851 11.82
Means followed by uncommon letters are statistically different from each other at 5%
level of provability by DMRT.

564 HUSSAIN et al.
Head yield
The head yield of broccoli was significantly influenced by the different forms
and levels of N. It was increased with increasing rate of N up to USG-N160 kg ha-1 and then declined. The highest head yield (13.49 ton ha-1) was obtained with
USG-N160 followed by USG-N180 (12.93 ton ha-1) (Fig.1). Prilled urea treated plot (PU-N180) gave 12.05 ton ha-1 head yield which was statistically identical with
USG-N140. This might be due to maximum translocation of carbohydrate from leaf to head that increased size and head compactness optimizing vegetative
growth for higher N supply. USG-N180 also produced more yield than that of PU-N180 which indicated the superiority of USG over PU. The minimum head yield
(4.88 ton ha-1) was recorded from N-control. This result is in agreement with the
findings of Greenwood et al. (1980) where the maximum broccoli yield was obtained with the recommended doses from 175-252 kg N ha-1. Zebarth et al.
(1995) found that marketable yield of broccoli increased with increasing N rate in a curvilinear pattern. Similar results were reported by Goodlass et al. (1997) and
Chao-Jiong (2010) in broccoli. The low crop yield from the control treatment is due to the insufficient supply of N in plants, leading to limit the carbon
assimilation, resulting in reduction of plant productivity (Lawlor, 2002).
Fig. 1. Effect of different forms and levels of N-fertilizer on head yield of broccoli
(Vertical bar showing the SE; CV: 6.88 %).
Effect of USG and PU on quality attributes of broccoli
SPAD value
Results on SPAD (Soil Plant Analysis Development) value was recorded to
determine the leaf greenness and to compare leaf chlorophyll content as affected by different forms and levels of urea N and presented in Table 3. At initial stage
up to 35 DAT, no significant variation was found with the SPAD values of the broccoli leaf (Table 3) although it was slightly higher in PU-N180. However, at

RESPONSE OF BROCCOLI TO USG AND PRILLED UREA IN SHALLOW 565
later stages from 40 DAT, a significant variation was observed among the
treatments and it was increased with increasing levels of urea N. At these stages the highest SPAD values were recorded with USG-N180 which was slightly
higher than that of PU-N180. The maximum increase of SPAD values (11.59 %) was noted at 60 DAT over 25 DAT for the control. But it was 25.03 and 18.27 %
at 60 DAT over 25 DAT for USG-N180 and USG-N180, respectively. Perhaps this phenomenon was due to rapid availability of N at initial stage as it was closer and
adjacent to the root zone in case of PU, but at later stages availability of N from USG increased over time and ensured a continuous supply upto harvest (70
DAT). On the other hand, supply of N from PU became limiting at later stages. Maximum SPAD values were recorded at 60 DAT and then decreased slightly.
At 60 DAT, the maximum SPAD value (74.73) was recorded from USG-N180
followed by USG-N160 (73.10) and PU-N180 (Table 3). However, at harvest (70 DAT) the highest SPAD value (73.93) was recorded with USG-N180 followed by
USG-N160 (72.23) but it was 72.07 for PU-N180 treatment (Table 3). Perhaps this was due to higher N content in leaf. The minimum SPAD value was recorded in
N-control. Similar results were also reported by Bullock and Anderson (1998), Kantety et al. (1996) and Wang et al. (2004). Varvel et al. (1997) demonstrated
that N fertilizer significantly increased both corn grain yield and SPAD readings.
Table 3. SPAD values as affected by different forms and levels of N-fertilizer at
different days after transplanting
Treatment 25
DAT
30
DAT 35 DAT 40 DAT 45 DAT
50
DAT
55
DAT
60
DAT
65
DAT
70
DAT
Control
USG-N140
USG-N160
USG-N180
PU-N180
56.07
56.90
59.27
59.77
62.17
56.20
56.93
59.57
60.67
62.47
57.20
57.13
60.53
61.30
63.80
58.20 c
59.93 bc
64.47 ab
65.80 a
64.50 ab
60.07 b
66.40 a
67.17 a
68.77 a
67.33 a
60.30 b
68.63 a
69.23 a
71.10 a
70.53 a
61.47 b
71.67 a
71.67 a
73.00 a
72.97 a
62.57 b
72.27 a
73.10 a
74.73 a
73.53 a
62.23 b
71.70 a
72.77 a
74.10 a
72.37 a
62.30 b
71.50 a
72.23 a
73.93 a
72.07 a
CV (%) 4.82 6.18 3.94 3.82 3.43 3.33 2.19 3.56 3.59 4.02
SE (±0.05) 1.642 2.121 1.360 1.380 1.306 1.306 0.8884 1.464 1.462 1.632
Means followed by uncommon letters are statistically different from each other at 5%
level of probability by DMRT
Compactness coefficient
The higher the head compactness the better the head quality of broccoli. Head
compactness significantly increased with increasing levels of N and the highest
compactness coefficient (18.91) was found from PU-N180 followed by USG-N160 (18.71) which were statistically similar to all other treatments except control with
the lowest compactness coefficient (13.41) (Fig. 2). It was due to higher supply of translocates but lower cell elongation which might have caused maximum

566 HUSSAIN et al.
accumulation of assimilates as well as higher head compactness. This finding is in agreement with the result of Renata et al. (2005) in broccoli.
Fig. 2. Effect of different forms and levels of N-fertilizer on compactness coefficient
of broccoli head (Vertical bar showing the SE; CV: 7.53 %).
Ascorbic acid and β-carotene content
A significant difference was observed with ascorbic acid (Vitamin C) content. The highest ascorbic acid content (84.28 mg 100g-1 FW) was found with USG-
N140 which was followed by USG-N160 (83.60 mg 100g-1 FW) but identical with N-control (79.93 mg 100g-1 FW). The lowest ascorbic acid content (66.33 mg
100g-1 FW) was recorded with PU-N180 (Table 4). This might be due to the higher nitrogen doses produced higher fresh but reduced dry matter content which
resulted in less ascorbic acid. Karitonas (2001) reported that an increased level of N supply slightly reduced the vitamin C content from 83 to 73 mg 100 g-1 FW in
broccoli flowers. Similar result was also reported by Chao-Jiong et al. (2010). Beta-carotene content was significantly influenced by different treatments and
the highest β-carotene content was recorded with USG-N160 (0.384 mg/100g FW) followed by USG-N180 (0.373 mg 100g-1 FW) but statistically identical with PU-
N180 and USG-N140 (Table 4). The minimum and significantly different β-carotene content (0.312 mg 100g-1 FW) was recorded with control treatment.
Chlorophyll-a and chlorophyll-b content
Chlorophyll-a content was significantly higher at higher level of USG and 0.738
mg 100g-1 FW was recorded with USG-N180 which was statistically identical with
USG-N160 (0.0.736 mg 100g-1 FW), PU-N180 (0.707 mg 100g-1 FW) and USG-N140 (0.685 mg 100g-1 FW) (Table 4). Statistically the lowest chlorophyll-a
content (0.671 mg 100g-1 FW) was noted with control treatment. Chlorophyll-b

RESPONSE OF BROCCOLI TO USG AND PRILLED UREA IN SHALLOW 567
content was also higher at higher levels of USG and the highest chlorophyll-b
content (1.1154 mg 100g-1 FW) was observed with USG-N180, which was statistically identical with USG-N160. However, the statistically lowest
chlorophyll-b content (0.7709 mg 100g-1 FW) was recorded in N control, which was significantly lower than USG treated plant but identical to PU-N180 (Table
4). The plants under PU-N180 always contained lower chlorophyll-b than that of USG-N180. Ouda and Mahadeen (2008) reported that head number per plant, head
diameter and chlorophyll content were higher when a combination of organic and inorganic fertilizers was added compared with their individual addition.
Table 4. Effect of different forms and levels of N-fertilizer on the head quality of
broccoli
Treatment Ascorbic acid
(mg 100g-1 FW)
β-carotene
(mg 100g-1 FW)
Chlorophyll-a
(mg 100g-1 FW)
Chlorophyll-b
(mg 100g-1
FW)
Control
USG-N140
USG-N160
USG-N180
PU-N180
79.93 ab
84.28 a
83.60 a
75.10 b
66.33 c
0.312 b
0.346 ab
0.384 a
0.373 ab
0.346 ab
0.671 b
0.685 ab
0.736 a
0.738 a
0.707 ab
0.7709 c
0.9743 bc
1.0359 ab
1.1154 a
0.9813 bc
CV (%) 5.39 6.81 3.68 7.36
SE (±0.05) 2.420 0.01826 0.01826 0.03873
Means followed by uncommon letters are statistically different from each other at 5%
level of provability by DMRT
Effect of USG and PU on nutrient uptake by broccoli
Nitrogen uptake
Nitrogen uptake increased with the increasing levels of urea N and the highest N
uptake (273.65 kg ha-1) was found with USG-N180 followed by USG-N160 (267.02 kg ha-1) and PU-N180 showed the third highest N uptake (235.70 kg ha-1).
However, the higher N uptake was found from USG treated plots as compared to PU (Table 5). This might be due to continuous supply, higher N retaining
capacity in the soil and greater fertilizer-N recovery in case of USG than that of PU. The possible reason for higher uptake is that as USG placed at deeper zone
the limited number of nitrifying bacteria present at the premise of USG and converts a limited portion of urea to NO3
-1 –N. Consequently, takes more time to
convert whole USG to available N as compared to PU resulted in greater opportunity for plants to take up N from soil. This result is in agreement with the
findings of Rashid et al. (1996). They reported that the use of N as USG was more effective than that of PU and they also stated that deep placement of USG
was an effective means of increasing N use efficiency of rice as compared to the

568 HUSSAIN et al.
traditional split application of PU. Khalil et al. (2011), Zebarth et al. (1995) and Rickard (2008) also reported the similar findings.
Nitrogen use efficiency
From the study, it was found that the N use efficiency was increased with
increasing levels of N upto USG-N160 (111.71%) and then decreased with the further increased rate of N fertilizer (Fig. 3). The lowest N use efficiency was
found from PU-N180 (81.90%). Overall N use efficiency was higher with USG than that of PU. This result was more or less similar to that of the findings of
Khalil et al. (2011). The apparent N recovery decreased with increasing rate of fertilizer N application for several vegetable crops (Greenwood and Draycott,
1988). Rashid et al. (1996) reported that the use of N as USG was more effective
than that of PU and they also stated that the deep placement of USG was an effective means of increasing N use efficiency of rice as compared to the
traditional split application of PU. Zebarth et al. (1995) reported that the apparent fertilizer-N recovery in the aboveground portion of the plant decreased linearly
from between 46 and 93% at a N rate of 125 kg N ha-' to between 20 and 45 % at a N rate of 625 kg N ha- I. Letey et al. (1983) reported 76 % N use efficiency and
Thompson et al. (2002) found 87.4, 69.0 and 81.3 %, N use efficiency with 13.0, 18.9 and 11.5 ton yield ha-1 of broccoli for different years. Accordingly, N use
efficiency (NUE) of broccoli decreased with increasing amount of fertilizer (Riley and Vagen, 2003; Tremblay and Beaudet, 2006). Lower N rates affected
crop growth and reduced N uptake while the higher N rates caused losses through the root zone. Another fact to the higher NUE is the less root disturbance, since
there was no lateral dressing in case of USG and it was placed only once at a cropping season. A larger root system, and possibly a stronger plant, could have
contributed to better N uptake by USG treated plots.
Fig. 3. Effect of different forms and levels of N-fertilizer on N use efficiency of
broccoli.

RESPONSE OF BROCCOLI TO USG AND PRILLED UREA IN SHALLOW 569
Table 5. Effect of different forms and levels of N-fertilizer on N, P, K and S uptake
by broccoli
Treatment N uptake
(kgha-1)
P uptake
(kg ha-1)
K uptake
(kg ha-1)
S uptake
(kg ha-1)
N-control
USG-N140
USG-N160
USG-N180
PU-N180
88.28 c
226.42 b
267.02 a
273.65 a
235.70 b
8.03 c
25.22 b
27.37 a
29.08 a
25.54 b
73.17 c
186.09 b
197.20 a
207.19 a
192.66 b
0.48 d
1.48 c
1.85 a
1.77 a
1.66 b
CV (%) 4.43 5.46 3.88 6.23
SE (±0.05) 5.575 0.7230 3.836 0.05164
Means followed by uncommon letters are statistically different from each other at 5%
level of provability by DMRT
Phosphorus and potassium uptake
Phosphorus uptake increased significantly with increasing levels of urea N in the
form of USG and the highest 29.08 kg ha-1 was found with USG-N180 which was followed by USG-N160 (27.37 kg ha-1), but this was statistically identical (Table
5). Third highest P uptake 25.54 kg ha-1 was with PU-N180 and significantly identical with USG-N140. USG performed better than PU. The highest K uptake
(207.19 kg ha-1) was noted with USG-N180 which was statistically identical with
USG-N160 (197.20 kg ha-1). Significantly lower K uptake was observed with PU-N180 (Table 5). This result was supported by Yoldas et al. (2008). They reported
that the application of N increased N, P, K and Fe concentrations in broccoli head. Similar results were also reported by Abdelrazzag (2002) and Magnusson
(2002) on several vegetable crops. The synergistic effect between N and K resulted in higher K uptake with increasing levels of N.
Sulphur uptake
Sulphur uptake also increased significantly with increasing levels of urea N upto
USG-N160 and then it was decreased and showed a curvilinear fashion (Table 5). The highest S uptake 1.85 kg ha-1 was noted from USG-N160 followed by USG-
N180 (1.77 kg ha-1) but statistically identical. A lower S uptake (1.66 kg ha-1) was obtained with PU-N180 than that of USG-N180. Therefore, it was observed that a
higher uptake of S from USG treated plots than that of PU (Table 5). This is due to continuous supply, higher S use efficiency and greater fertilizer S recovery in
case of USG.
Effect of USG and PU on post-harvest soil nutrient status of broccoli field
Statistically significant variation was observed for post harvest nutrient status of
soil due to different forms and levels of N (Table 6). The highest N content

570 HUSSAIN et al.
(0.101%) was found in USG-N180 treated plant which was followed by PU-N180 (0.099%), but statistically identical with each other (Table 6). The lowest N
content (0.077%) was found in N-control, which was significantly lower than USG-N180 and PU-N180. This finding was supported by Evaraarts and Willigen
(1999) who reported that the amount of mineral N in the soil at harvest generally increased with increasing amounts of N applied. Result revealed that USG
addition exhibited more residual effect on soil-N content than that of PU. Phosphorus content did not follow any pattern although the highest P content
(17.59 µg g-1) was found in control plot (Table 6). A significant variation was observed in post harvest soil K content and the highest K content (0.188
me/100g) was recorded from control which was followed by USG-N140 > USG-
N160 > PU-N180 > USG-N180, respectively (Table 6). The lowest K content (0.138 me/100g) was found with USG-N180. It might be due to higher uptake and
removal of K by the crop. Similarly a significant variation was observed in post harvest soil S content and the highest S content (10.06 µg g-1) was recorded with
USG-N140 which was followed by USG-N160, PU-N180 and USG-N180, but statistically identical with USG-N160 (Table 6). This might be due to higher plant
growth as well as higher nutrient uptake by the plant. The minimum S content (7.06 µg g-1) was found in the control plot. Variation in B content in post harvest
soil was also found significant and the highest B content (0.296 µg g-1) was recorded in USG-N140. This was also statistically similar to USG-N160 and was
followed by and PU-N180 (Table 6). It may be due to higher absorption and higher growth of the plant as promoted by N. The minimum B content (0.115 µg
g-1) was found with N-control. The minimum S and B content in control plot may be due to no addition of those fertilizers.
Table 6. Effect of different levels of USG and PU on post-harvest soil nutrient status
of broccoli field
Treatment Total N Exchangeable
K
Available nutrient
P S B
(%) (me/100g) (µg g-1)
Control
USG-N140
USG-N160
USG-N180
PU-N180
0.077 b
0.096 ab
0.096 ab
0.101 a
0.099 a
0.188 a
0.172 ab
0.156 bc
0.138 c
0.157 bc
17.59 a
16.78 ab
16.04 b
14.10 c
15.64 b
7.06 c
10.06 a
9.39 a
7.89 bc
9.01 ab
0.115 c
0.296 a
0.294 a
0.202 b
0.207 b
CV (%) 5.93 9.63 4.61 7.50 7.38
SE
(±0.05)
0.005774 0.005774 0.4270 0.0.3737 0.00577
Means followed by uncommon letters are statistically different from each other at 5%
level of probability by DMRT

RESPONSE OF BROCCOLI TO USG AND PRILLED UREA IN SHALLOW 571
Conclusion
From the above study it appeared that USG-N is superior to PU-N in terms of yielding ability and quality parameters (Vitamin-C, β-carotene, and chlorophyll
content) of broccoli. Nutrient uptake, nitrogen use efficiency and post harvest soil-N were also found to be higher with the use of USG-N. Such performance of
USG-N was better with USG-N160. Nitrogen application @ 160 kg-N ha-1 in the form of USG along with recommended dose of other fertilizers may be suggested
as the best combination of N rate and form of application for maximizing the yield and quality of broccoli in Silty Clay Loam Soil under Madhupur Tract
(AEZ-28).
References
Abdelrazzag, A. 2002. Effect of chicken manure, sheep manure and inorganic fertilizers
on yield and nutrient uptake by onion. Pakistan J. Biol. Sci. 5: 266–268.
Babik, I. and K. Elkner, 2002. The effect of nitrogen fertilization and irrigation on yield
and quality of broccoli. Acta Horticulture. 571: 33-43.
Beecher, C. 1994. Cancer preventive properties of varieties of Brassica oleracea: A
review. Amer. J. Clin. Nutri. 59: 1166-1170.
Bélec, C., S. Villeneuve, J. Coulombe and N. Tremblay. 2001. Impact of nitrogen
fertilization on yield, hollow stem incidence and sap nitrate concentration in
broccoli. Can. J. Plant Sci. 81: 765–772.
Black, C. A. 1965. Methods of soil analysis, Part-I and II. Amer. Soc. Agron. Inc. Pub.
Madison, Wisconsin, U.S.A: 30-48.
Bullock D. G. and D. S. Anderson. 1998. Evaluation of the Minolta SPAD-502
chlorophyll meter for nitrogen management in corn. Journal of Plant Nutrition.
21(4): 741-755.
Chao-Jiong Xu, Rong-Fang Guo, Hui-Zhuan Yan, Jing Yuan, Bo Sun, Gao-Feng Yuan
and Qiao-Mei Wang. 2010. Effect of nitrogen fertilization on ascorbic acid,
glucoraphanin content and quinine reductase activity in broccoli floret and stem.
Journal of Food, Agriculture & Environment. 8 (1): 179–184.
Costa, C., D. Frigon, P. Dutilleul, L. M. Dwyer, V. D. Pillar, D. W. Stewart and D. L.
Smith. 2003. Sample size determination for chlorophyll meter readings on maize
hybrids with a broad range of canopy types. J. Plant Nutr. 26:1117-1130.
Craswell, E. T. and D. C. Godwin. 1984. The efficiency of nitrogen fertilizers applied to
cereals in different climates. In: Tinker, P.B. and äuchli, A. (eds.): Advances in Plant
Nutrition, vol. I. Praeger Publishers, New York. 1-55 Pp.
Everaarts A. P. and P. de Willigen. 1999. The effect of the rate and method of nitrogen
application on nitrogen uptake and utilization by broccoli (Brassica oleracea var.
italica). Netherlands Journal of Agricultural Science. 47: 201-214.
Fahey, J. W., X. Haristoy, P. M. Dolan, T. W. Kensler, I. Scholtus, K. K. Stephenson, P.
Talalay and A. Lozniewski. 2002. Sulforaphane inhibits extracellular, intracellular
and antibiotic-resistant strains of Helicobacter pylori and prevents benzo[a]pyrene-

572 HUSSAIN et al.
induced stomach tumors. Proceedings of the National Academy of Sciences of the
United States of America. 99(11): 7610–7615.
FAO, 1988. Production year book.Food and Agricultural Organization. Rome, 157-158 Pp.
Goodlass, G., C. Rahn, M. A. Shepherd, A. G. Chalmers and F. M. Seeney. 1997. The
nitrogen requirement of vegetables: comparisons of yield response models and
recommendation systems. J. Hort. Sci. 72(2): 239-254.
Greenwood, D. J. and A. Draycott. 1988. Recovery of fertilizer-N by diverse vegetable
crops: Process and models. In: Nitrogen efficiency in agricultural soils (Jenkinson D.
S. and K. A. Smith Eds) Elsevier, London and New York, 46-61 Pp.
Greenwood, D. J., T. J. Cleaver, M. K. Turner, J. Hunt, K. B. Niendorf and S. M. H.
Loquens. 1980. Comparison of the effects of nitrogen fertilizer on the yield, nitrogen
content and quality of 21 different vegetable and agricultural crops. Journal of
Agricultural Science. 95: 471-585.
Hala Kandil, Nadia Gad. 2009. Effects of inorganic and organic fertilizers on growth and
production of brocoli (Brassica Oleracea L.). Factori şi Procese Pedogenetice din
Zona Temperată S. nouă 8: 61-69.
Hunter, A. H. 1980. ‘Soil fertility Analytical Service in Bangladesh’ consultancy report,
BJRI project phase II, BARC, Dhaka, Bangladesh.
Hussain, M. J., M. Y.Ali, M. A. Rahman, M. A. Helim Khan and M. M. Rahman. 2003.
Application of urea super granule (USG) in vegetable crops: a profitable technology.
Bangladesh Agricultural Research Institute and SFFP, Department of Agricultural
Extension, 1-10 Pp.
Jackson, M. L. 1973. Soil Chemical Analysis. Prentice Hall of India Pvt. Ltd. New Delhi,
India.
Kantety, R. V., E. van Santen, F. M. Woods and C. W. Wood. 1996. Chlorophyll meter
predicts nitrogen status of tall fescue. Journal of Plant Nutrition. 19(6): 881-899.
Kapotis, G., G. Zervoudakis, T. Veltsistas and G. Salahas. 2003. Chlorophyll
concentration in Amaranthusvlitus: correlation with physiological processes. Russ. J.
Plant Physiol. 50: 442-444.
Karitonas R. 2001. Effect of nitrogen supply on yield and quality of broccoli. (Edn.
Horst, W. J.; Schenk, M. K.; Bürkert, A.; Claassen, N.; Flessa, H.; Frommer, W. B.;
Goldbach, H.; Olfs, H. W.; Römheld, V. et al., 2001. Plant nutrition: food security
and sustainability of agro-ecosystems through basic and applied research. Fourteenth
International Plant Nutrition Colloquium, Hannover, Germany 2001 pp. 298-299.
Khalil, M. I., U. Schmidhalter, R. Gutser and H. Heuwinkel. 2011. Comparative efficacy
of urea fertilization via super granules versus prills on nitrogen distribution, yield
response and nitrogen use efficiency of spring wheat. Journal of Plant Nutrition. 34
(6): 779-797.
Letey, J., W. M. Jarrell, N. Valoras and R. Beverly. 1983. Fertilizer application and
irrigation management of broccoli production and fertilizer use efficiency. Agronomy
Journal. 75:502-507.

RESPONSE OF BROCCOLI TO USG AND PRILLED UREA IN SHALLOW 573
Liu, L., B. J. Shelp and G. A. Spiers. 1993. Boron distribution and translocation in field-
grown broccoli (Brassica oleracea var. Italica). Canadian Journal of Plant Science.
73: 587-600.
Lawlor, D. W. 2002. Carbon and nitrogen assimilation in relation to yield: mechanisms
are the key to understanding production systems. Journal of Experimental Botany.
53(370): 773-787.
Magnusson, M. 2002. Mineral fertilizers and green mulch in Chinese cabbage (Brassica
PekinensisRupr): effect on nutrient uptake, yield and internal tipburn. Soil Plant Sci.
52: 25–35.
Masayasu Nagata and Ichiji Yamashita. 1992. Simple method for simultaneous
determination of chlorophyll and carotinoids in tomato fruit. J. Iapan. Soc. Food Sci.
Technol. 39(10), 925-928.
Masson, J., N. Trimbley and A. Gosselin, 1991. Effect on nitrogen fertilization and HPS
supplementary lighting on vegetable transplant production. 1. Transplant growth. 2.
Yield. Journal of the American Society for Horticulture Science. 116: 594-602.
Nasreen, Shamima, M. S. Haq, and M. S. Islam, 1992. Response of broccoli to N, P, K,
S and Mo fertilization. Bangladesh J. Sci. Res. 10: 253-256.
Nazrul, M. I., M. J. Hussain, M. Y. Ali, and R. U. Shahmim. 2006. Use of urea super
granule (USG) in vegetables cultivation: A profitable technology (Booklet).
Published by Bangladesh Agricultural Research Institute, Gazipur. 8p.
Olsen, S. R, C. V. Cole, F. S. Watanable and L. A. Dean. 1954. Estimation of available
phosphorus in soils by extraction with sodium bicarbonate. U. S., Dept. Agric.
Circular: 207-215.
Ouda, B. A. and A. Y. Mahadeen. 2008. Effect of fertilizers on growth, yield, yield
components, quality and certain nutrient contents in broccoli (Brassica oleracea). Int.
J. Agri. Biol., 10(6): 627–32.
Page, A. L., R. H. Miller and D.R. Keeney. 1982. Methods of soil analysis. Part 2, 2nd ed.
Amar. Soc. Agron., Inc. Madi, Wis, USA.
Rashid, M. A., K. A. Billah, M. A. Mazid and F. Jameel. 1996. Nitrogen use efficiency of
urea super granules and prilled urea in irrigated rice cultivation. Bangladesh Rice
Journal. 7: 41-44.
Renata Wojciechowska, Stanisław RoŜek, Agata Rydz. 2005. Broccoli yield and its
quality in spring growing cycle as dependent on nitrogen fertilization. Folia
Horticulturae Ann. 17 (2): 141-152.
Rickard Mellgren. 2008. Effect of irrigation and nitrogen treatments on yield, quality,
plant nitrogen uptake and soil nitrogen status and the evaluation of sap test, SPAD
chlorophyll meter and Dualex to monitor nitrogen status in broccoli. Master thesis in
the Horticultural Science Programme. 2008:4 45 hp.
Riley, H. and I. Vågen. 2003. Critical N-concentration in broccoli and cauliflower,
evaluated in field trials with varying levels and timing of fertilizer. Acta
Horticulturae. 627: 241-249.

574 HUSSAIN et al.
Samotus, B., M. Leja and A. Scigalski. 1982. Porównanie czterech metod oznaczania
kwasu askorbinowego w owocach i warzywach. Acta Agr. Silv., Ser. Agr. 21: 105-
122.
Thakur, O. P., P. P. Sharma and K. K. Singh. 1991. Effect of nitrogen and phosphorus
with and without boron on head yield and stalk-rot incidence in cauliflower.
Vegetable Sc. 18: 115-121.
Thompson, T. L., T. A. Doerge, R. E. Godin. 2002. Subsurface drip irrigation and
fertigation of broccoli: I. Yield, quality, and nitrogen uptake. Soil Science Society of
America Journal. 66: 186-192.
Tremblay, N. and P. Beaudet. 2006. Soil Nmin content and P2O5 export from vegetable
crops in Quebec (Canada). Acta Horticulture. 700: 185-189.
Varvel, G. E., J. S. Schepers and D. D. Francis. 1997. Ability for in season correction of
nitrogen deficiency in corn using chlorophyll meters. Soil Sci. Soc. Am. J. 61:1233-
1239.
Wang, Q., J. Chen, and Y. Li. 2004. Nondestructive and rapid estimation of leaf
chlorophyll and nitrogen status of peace lily using a chlorophyll meter. Journal of
Plant Nutrition. 27(3): 557-569.
Yoldas, F., S. Ceylan, B. Yagmur, and N. Mordogan. 2008. Effect of nitrogen fertilizer
on yield quality and nutrient content in broccoli. Journal of Plant Nutrition.31:
1333–1343.
Zaman, S. K., M. A. Razzaque, S. M. R. Karim and A. U. Ahmed. 1993. Evaluation of
prilled urea and urea super granule as nitrogen sources for upland aus rice.
Bangladesh Rice Journal. 4:42-46.
Zebarth, B. J., P. A. Bowen and P. M. A. Toivonen. 1995. Influence of nitrogen
fertilization on broccoli yield, nitrogen accumulation and apparent fertilizer-nitrogen
recovery. Canadian Journal of Plant Science. 75(3): 717-725.

ISSN 0258-7122 (Print), 2408-8293 (Online)
Bangladesh J. Agril. Res. 43(4): 575-585, December 2018
ADOPTION AND PROFITABILITY OF SUMMER TOMATO
CULTIVATION IN JASHORE DISTRICT OF BANGLADESH
P. HAJONG1, B. SIKDER2, S. MONDAL3 AND M. A. ISLAM4
Abstract
The study assessed the level of adoption and profitability of summer tomato
varieties at farm level. Data were collected from 90 randomly selected tomato
farmers of Bagherpara, Jashore Sadar and Jhikorgacha upazila of Jashore
district. The results indicated that BARI Hybrid Tomato-4 was highly adopted
summer tomato variety (75%) followed by BARI Hybrid Tomato-8 (16%) and
ACI summer king tomato variety (9%). The adoption level of ploughing,
manure and fertilizer use were low, whereas planting time and irrigation were
high. Total cost of production of summer tomato was Tk 584822 per hectare
whereas Tk 507355 per hectare was variable cost and fixed cost was Tk 77467
per hectare. Among the cost items mancha preparation cost was the highest
(26.89 %) and 26.10 % cost was for labor. The average yield of summer
tomato was 50.41 t/ha and gross return was 1542300 tk/ha. On the average,
benefit cost ratio was found to be 2.64 on full cost basis and 3.04 on cash cost
basis. MoP, zipsum and manure were significant effect on summer tomato
cultivation. Attack by pest and disease, lack of seed at proper time, lack of
agricultural credit and high cost of production were the major constraints for the
adoption of summer tomato.
Keywords: Adoption, Profitability, Summer Tomato.
1. Introduction
Bangladesh is an agro-based country where agriculture is considered as backbone of her economy. About 45 percent of total labor force were engaged in
agriculture (BBS, 2016). Agriculture plays a vital role through employment generation, poverty alleviation, food security, enhance standard of living by
increasing income level of rural population. Many developing countries like Bangladesh benefited from the green revolution in cereal production in the past
but were not able to substantially reduce poverty and malnutrition. Vegetable production can help farmers to generate income which eventually alleviate
poverty.
1Scientific Officer, Agricultural Economics Division, Regional Agricultural Research
Station, Bangladesh Agricultural Research Institute (BARI), Jessore-7400, 2Ex-Post
graduate student, Department of Genetics and Plant Breeding, Patuakhali Science and
Technology University, Dumki, Patuakhali-8602, 3Scientific Officer, Soil Science
Division, Agricultural Research Station, BARI, Banerpota, Satkhira, 4Scientific Officer,
Entomology Division, Regional Agricultural Research Station, BARI, Jessore-7400
Bangladesh.
DOI: http://dx.doi.org/10.3329/bjar.v43i4.39154

576 HAJONG et al.
Among the vegetables tomato (Solanum Lycopersicun) is one of the most
important vegetables in terms of acreage, production, yield, commercial use and
consumption. It is the most consumable vegetable crop after potato and sweet
potato occupying the top of the list of canned vegetable (Chowdhury, 1979). It is
cultivated all over the country due to its adaptability to wide range of soil and
climate (Ahmed, 1976). However, the yield of the crop is very low compared to
those obtained in some advanced country (Sharfuddin and Siddique, 1985). In
Bangladesh congenial atmosphere remains for tomato production during low
temperature winter season that is early November is the best time for tomato
planting in our country (Hossain et al., 1999). It is a good source of vitamin C
(31 mg per 100g), vitamin A, calcium, iron etc (Matin et al., 1996). Although
tomato plants can grow under a wide range of climatic conditions, they are
extremely sensitive to hot and wet growing conditions, the weather which
prevails in the summer to rainy season in Bangladesh. But limited efforts have
been given so far to overcome the high temperature barrier preventing fruit set in
summer-rainy (hot-humid) season. Its demand for both domestic and foreign
markets has increased manifold due to its excellent nutritional and processing
qualities (Hossain et al., 1999).
Considering the growing demand and importance of tomato, Bangladesh
Agricultural Research Institute (BARI) has taken initiative to develop off-season
summer and rainy season tomatoes. So far BARI has developed and released 3
hybrid tomato varieties i.e. BARI Hybrid Tomato-3, BARI Hybrid Tomato-4 and
BARI Hybrid Tomato-8 which can be grown during summer and rainy season
under poly tunnel. The average yield of BARI Hybrid Tomato was 32.78 t/ha in
the Jessore district (Karim et al, 2009). But very little information has been
generated about the profitability and adoption of hybrid tomato cultivation
technologies by the farmers in the country. Generalization from studies
conducted in home and abroad (Mohiuddin et al., 2007; Zaman et al., 2006;
Islam, 2005; Rahman et al., 1998; Ali and Gupta, 1978; Gupta and Rao, 1978)
regarding the tomato production may not be always applicable due to
considerable variation in attributes of the technologies and for various others
factors. Fortunately, the farmers of Bagharpara upazila under Jashore district
started to adopt this technology as a pioneer farmer since 2005 (Karim et al.,
2009). It is recognized that in order to expand the area of this crop as well as to
fit this crop in the farmers cropping system, studies are needed to ascertain its
cost and return situation in relation to profitability, input use and farmer's
resource use efficiency. Keeping all these factors in consideration, the present
study was undertaken to provide information through fulfillment of the following
objectives.

ADOPTION AND PROFITABILITY OF SUMMER TOMATO CULTIVATION 577
Objectives
i. To know the adoption status of summer tomato variety along with its cultivation technologies at farm level and to find out the factors affecting
their adoptions.
ii. To estimate the input use pattern and profitability of summer tomato
cultivation.
iii. To identify the constraints to summer tomato production at farm level.
2. Methodology
2.1 Sample size and sampling technique
The present study was conducted at three upazila namely Bagherpara, Sadar and
Jhikorgacha upazila of Jashore district. The study area was purposively selected
considering the higher concentration of BARI Hybrid Tomato cultivation during
summer season. The study was carried out by using formal survey method. A
total of 90 farmers taking 30 from each upazila was randomly selected for
interview. Necessary information regarding this study was also collected on input
costs, price, yields etc.
2.2 Method of data collection
Data were collected through pre-designed interview schedule during the summer
season of 2014. Field investigators under the direct supervision of the researcher
collected field level data using pre-tested interview schedule. The unit of data
collection was a single hybrid tomato plot of each selected farmers where
detailed information regarding this crop cultivation were taken and analysis was
done on per hectare basis. Although some of the selected farmers continued to
harvest the crop up to December but yield data and other information were taken
up to last week of October considering summer period.
2.3 Analytical techniques
Both fixed cost and variable cost were taken into account in calculating cost of
summer tomato cultivation. Land use cost was calculated on the basis of per year
existing lease value of land. The profitability of tomato cultivation was examined
on the basis of gross margin, net return and benefit cost ratio analysis. The
adoption categories were developed based on the percentage of respondent
farmers with respect to each technology. Adoption level was categories into
three: 70-100% as high, 50-69% as medium and <50% as low level of adoption.
Collected data were edited, summarized, tabulated and analyzed to fulfill the
objectives of the study. Descriptive statistics using different statistical tools like
averages, percentages and ratios were used in presenting the results of the study.

578 HAJONG et al.
Cobb-Douglas production function was used to estimate the contribution of
factors to a tomato. The functional form of the Cobb-Douglas production
function model was given below.
Y = uibn
n22
1b1 eX.....................XAX
The production function was converted to logarithmic form so that it could be
solved by least square method i.e.
In Y = a + b1 InX1 + B2 InX2 .................... + bn InXn + Ui
The empirical function model is as follows:
In Y = a+ b1 InX1 + b2 InX2 + b3 InX3 + b4 InX4 + b5 InX5 + b6 InX6 + b7 InX7 +
b8 InX8 + Ui
Where, Y= Yield of tomato (ton/ha)
X1 = Human labour (man-days/ha) ,
X2 = Seed (kg/ha)
X3 = Urea (kg/ha)
X4 = TSP (kg/ha)
X5 = MoP (kg/ha)
X6 = Zipsum (kg/ha)
X7 = Boron (kg/ha)
X8 = Manure (kg/ha)
a = Intercept,
b1, b2 ... ... ... ... b8 + Coefficients of the respective variables to be
estimated,
Ui = Error term.
3. Results and Discussions
3.1 Adoption of summer tomato variety
An attempt was made to assess the level of adoption in terms of percent of
farmers adopted summer tomato variety at farm level. The scientists of BARI developed some variety of tomato for summer season. But from the study it was
appeared that BARI Hybrid Tomato-4 was mostly cultivated in the study area. About 75% farmer cultivates BARI Hybrid Tomato-4 (Table 1). After that BARI
Hybrid Tomato-8 was 16% and ACI summer king was 9% also cultivated in the summer season.
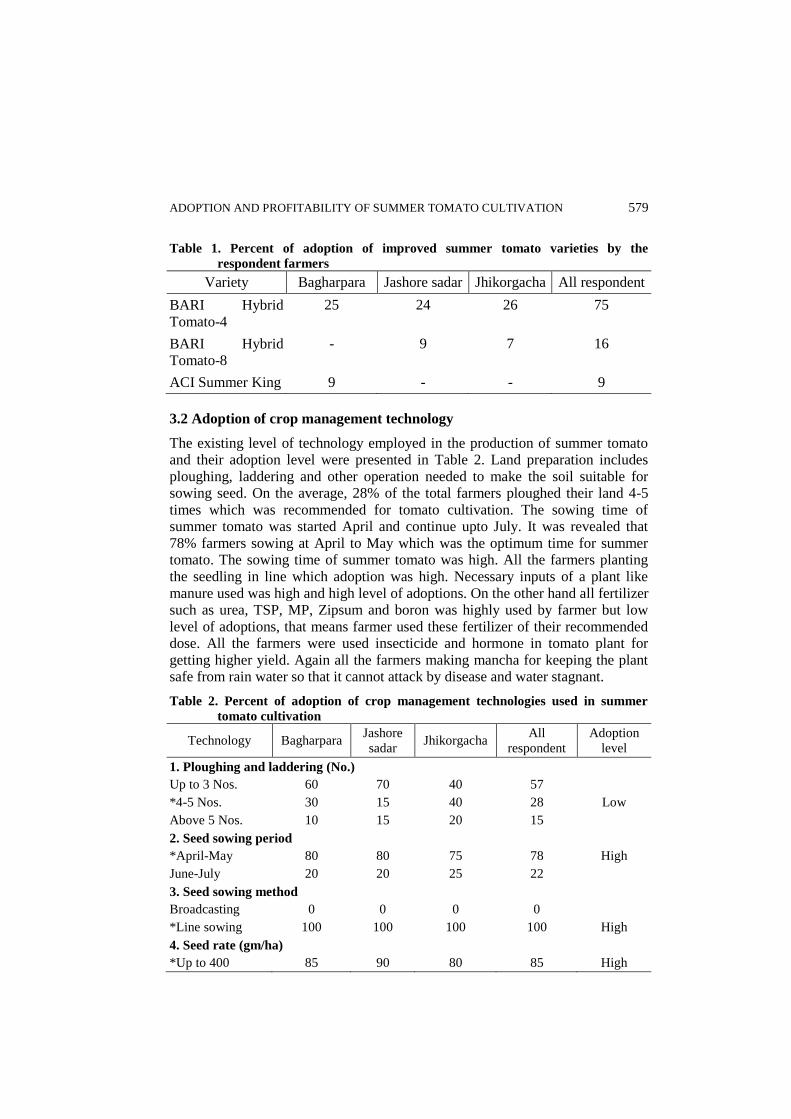
ADOPTION AND PROFITABILITY OF SUMMER TOMATO CULTIVATION 579
Table 1. Percent of adoption of improved summer tomato varieties by the
respondent farmers
Variety Bagharpara Jashore sadar Jhikorgacha All respondent
BARI Hybrid
Tomato-4
25 24 26 75
BARI Hybrid Tomato-8
- 9 7 16
ACI Summer King 9 - - 9
3.2 Adoption of crop management technology
The existing level of technology employed in the production of summer tomato and their adoption level were presented in Table 2. Land preparation includes
ploughing, laddering and other operation needed to make the soil suitable for sowing seed. On the average, 28% of the total farmers ploughed their land 4-5
times which was recommended for tomato cultivation. The sowing time of summer tomato was started April and continue upto July. It was revealed that
78% farmers sowing at April to May which was the optimum time for summer tomato. The sowing time of summer tomato was high. All the farmers planting
the seedling in line which adoption was high. Necessary inputs of a plant like
manure used was high and high level of adoptions. On the other hand all fertilizer such as urea, TSP, MP, Zipsum and boron was highly used by farmer but low
level of adoptions, that means farmer used these fertilizer of their recommended dose. All the farmers were used insecticide and hormone in tomato plant for
getting higher yield. Again all the farmers making mancha for keeping the plant safe from rain water so that it cannot attack by disease and water stagnant.
Table 2. Percent of adoption of crop management technologies used in summer
tomato cultivation
Technology Bagharpara Jashore
sadar Jhikorgacha
All
respondent
Adoption
level
1. Ploughing and laddering (No.)
Up to 3 Nos. 60 70 40 57
*4-5 Nos. 30 15 40 28 Low
Above 5 Nos. 10 15 20 15
2. Seed sowing period
*April-May 80 80 75 78 High
June-July 20 20 25 22
3. Seed sowing method
Broadcasting 0 0 0 0
*Line sowing 100 100 100 100 High
4. Seed rate (gm/ha)
*Up to 400 85 90 80 85 High

580 HAJONG et al.
Technology Bagharpara Jashore
sadar Jhikorgacha
All
respondent
Adoption
level
Above 400 15 10 20 15
6. Manure (kg/ha)
*Up to 14000 76 82 85 81 High
Above 14000 24 18 15 19
7. Urea (kg/ha)
Below 550 90 87 95 91
*Above 550 10 13 5 9 Low
8. TSP (kg/ha)
*Up to 500 32 40 48 40 Low
Above 500 68 60 52 60
9. MoP (kg/ha)
*Up to 300 30 40 36 35 Low
Above 300 70 60 64 65
10. Zipsum (kg/ha)`
*Up to 70 12 15 10 12 Low
Above 70 88 85 90 88
11. Boron (kg/ha)
*Up to 7 42 45 43 Low
Above 7 58 55 57
12. Pesticide
Do not use
pesticide
0 0 0 0
*Used pesticides 100 100 100 100 High
13. Hormone
Do not use
hormone
0 0 0 0
*Used hormone 100 100 100 100 High
*Mancha
preparation
100 100 100 100 High
Note: Technology adoption was categorized by percentage of respondent
farmers such as 70-100% as high; 50-69% as medium and <50% as low adoption. * Recommended use or dose
3.3 Input use pattern
Input was the main elements for producing something. In tomato production
there need different types of input for getting higher production. The human labor used for producing summer tomato was found to be 838 man-days per
hectare (Table 3). Land preparation cost was 9183 Tk./ha. Seed was used 421 gm/ha for cultivating summer tomato. The total quantity of fertilizer required was

ADOPTION AND PROFITABILITY OF SUMMER TOMATO CULTIVATION 581
1977 kg/ha of which urea, TSP, MoP, Zipsum and Boron were 330 kg/ha, 646
kg/ha, 530 kg/ha, 454 kg/ha and 17 kg/ha respectively. These were equal to the recommended doses. Total cow dung used was 14804 kg per hectare when land
was prepared. For better production farmers applied hormone and pesticide at the rate of 24742 Tk./ha and 36505 Tk./ha respectively. Its cultivation needs to
prepare mancha which was most costly where bamboo, polithin, nylon rope and sutli incurred 75799 Tk./ha, 65227 Tk./ha, 5825 Tk./ha and 10421 Tk./ha
respectively.
Table 3. Input use pattern for cultivating summer tomato
Items Quantity
Human labour (man-day/ha) 813
Family 610
Hired 203
Land preparation cost (Tk./ha) 9183
Seed (gm/ha) 421
Cowdung (kg/ha) 14804
Fertilizer (kg/ha) 1977
Urea (kg/ha) 330
TSP (kg/ha) 646
MoP (kg/ha) 530
Zipsum (kg/ha) 454
Boron (kg/ha) 17
Hormone (Tk./ha) 24742
Pesticide (Tk./ha) 36505
Irrigation (Tk./ha) 8079
Bamboo (Tk./ha) 75799
Polythene (Tk./ha) 65227
Nylon rope (Tk./ha) 5825
Sutli (Tk./ha) 10421
3.4 Cost and return
For calculating the cost of cultivation of summer tomato, all variable costs like
human labour, land preparation, seed, manures, fertilizers, pesticide, hormone, irrigation, mancha preparation were calculated on per hectare basis. The fixed

582 HAJONG et al.
cost of tomato cultivation included cost of land use and interest on operating capital. The total cost included fixed cost and variable cost. Total cost of
production of summer tomato was 584822 Tk./ha where as 507355 Tk./ha was variable cost and fixed cost was 77467 Tk. per hectare (Table 4). The cost of
family labour, hired labour, land preparation, seed, fertilizer, manures, hormone, pesticides, irrigation and mancha were 26.10%, 8.67%, 1.57%,
1.97%, 7.17%, 2.53%, 4.23%, 6.24%, 1.38% and 26.89% respectively. Among the cost items mancha preparation was the highest (26.89 %) followed by
labour cost (26.10 %).
Table 4. Cost of summer tomato cultivation in the study area
Particular Cost (Tk./ha) % of cost
A. Variable cost
Family labour 152624 26.10
Hired labour 50690 8.67
Land preparation 9183 1.57
Seed 11497 1.97
Fertilizer 41959 7.17
Manures 14804 2.53
Hormone 24742 4.23
Pesticides 36505 6.24
Irrigation 8079 1.38
Mancha preperation 157272 26.89
Total variable cost 507355 86.75
B. Fixed cost
Land use 52734 9.02
Interest on operating capital 24733 4.23
Total fixed cost 77467 13.25
C. Total cost (A+B) 584822 100.00
3.5 Profitability of hybrid tomato cultivation
Return was calculated by multiplying yield with its price. Return per hectare of
tomato cultivation was shown in Table 5. The average yield of summer tomato
was 50.41 t/ha. The average gross return was calculated as Tk. 1542300 per
hectare. The average price of hybrid tomato upto last week of October was Tk.
30 per kilogram. The average net return was observed to be Tk. 957478. On the
average, benefit cost ratio was found to be 2.64.

ADOPTION AND PROFITABILITY OF SUMMER TOMATO CULTIVATION 583
Table 5: Profitability of summer tomato production
Particulars Cost and return (Tk./ha)
Total Variable cost 507355
Total cost 584822
Yield (ton/ha) 50.41
Average selling price (Tk/kg) 30.00
Gross return 1542300
Gross margin 1034945
Net margin 957478
Benefit cost ratio 2.64
3.6 Contribution of different inputs to hybrid tomato production
For producing hybrid tomato different types of variable inputs were employed. Initially 8 variables were included in the model. Estimated values of coefficients and related statistics of Cobb-Douglas production function were presented in
Table 6. The coefficient of determination (R2) tells how well the sample
regression line fits the data (Gujarati, 1995). Zipsum had positive and significant at 1% level, indicated that 1% increase in the use of zipsum, keeping all other factors remaining constant would increase the yield of tomato by 0.005%. Manure use had negative but significant impact on the yield of tomato. The
coefficient of determination (R2) was 0.58, which indicates that around 58
percent of the variations in gross return were explained by the independent variables included in the model. The F-value of the equation is significant at 1% level implying that the variation in return from summer tomato production mainly depends upon the independent variables included in the model.
Table 6. Estimated coefficients and their related statistics of production
function for summer tomato
Explanatory variables Co-efficient t-values
Intercept 2.25*** 5.65
Human labor (X1) 0.011 1.55
Seed (X2) 0.008 0.35
Urea (X3) 0.002 0.65
TSP (X4) 0.001 1.45
MoP (X5) 0.004** 2.55
Zipsum (X6) 0.005*** 4.35
Boron (X7) 0.015 0.25
Manure (X8) -0.005*** -3.25
R2 0.58
F value 12.25***
Note: ***, ** indicate significant at 1% and 5% level respectively

584 HAJONG et al.
3.7 Constraints to hybrid tomato cultivation
Although hybrid tomato cultivation was opined to be a profitable crop, there
were several constraints to its higher production. It was observed from Table 8 that about one half of the farmers reported high price of mancha making
materials which was increased their production cost. Most of the farmers (100%) reported that they faced attack of insect and diseases in the summer tomato field
which hamper their production as well as their income. Eighty percent farmers opined that timely non-availability of seed, 60% opined on non-availability of
agricultural credit, and 50 % farmer opined on high price of input materials.
Table 8: Constraints to summer tomato cultivation in different study areas
Particulars Percent of responses
1.Attack of insect and disease infestation 100
2. Non-availability of seed in time 80
3. Non-availability of agriculture credit 60
4. High price of input 50
5. High cost of production 50
4. Conclusion
The study assessed the level of adoption and profitability of summer tomato varieties at farm level. Three summer tomato varieties namely BARI Hybrid
Tomato-4, BARI Hybrid Tomato-8 and ACI Summer King were found to adopt by the farmers. The levels of adoption of most crop management technologies
were found to be high. The productivity of summer tomato variety was high. The gross margin, net return and BCR are high. Attack by pest and disease, lack of
seed at proper time, lack of agricultural credit and high cost of production were the major constraints for the adoption of summer tomato. The farmer had no
marketing problem in the study area due to high demand of tomato at this season.
5. Recommendations
The following recommendations were forward to increase adoption of summer
tomato variety at farmer’s level:
BARI has developed three summer tomato varieties, but its area coverage was very limited. Research organization should take initiatives
to disseminate those varieties to the farmers.
Farmers need proper training to increase summer tomato production. DAE should take initiative to motivate the farmers to cultivate BARI
developed varieties and technology through providing training.

ADOPTION AND PROFITABILITY OF SUMMER TOMATO CULTIVATION 585
Related organization should ensures supply of proper amount of seed to
the farmer for increase cultivation.
Government should ensure credit facilities through institutional sources for summer tomato cultivation.
References
Ahmed, K. U. 1976. “Phul Phal O Shak Shabji (in Bangla)”. 2nd Edition, Alhaj
Kamaluddin Ahmed, Banglow No. 2, Farm Gate, Dhaka, Bangladesh. p.470.
Ali, S. M. and B. K. Gupta. 1978. Effect of N, P and K Fertilization on Tomato.
Horticulture Abstract, 48(12), 92.
BBS, 2016. Yearbook of Agricultural Statistics of Bangladesh. Planning Division,
Ministry of Planning, Govt. of the People's Republic of Bangladesh, Dhaka.
Chowdhury, B. 1979. Vegetables. 6th Edition, The Director, National Book trust, New
Delhi, India. P. 46.
Gupta, A. and G.G. Rao. 1978. Note of response of Spring Planted Tomato to Irrigation
and Nitrogen. Indian Journal Agric. Sci. 48: 183-184.
Gujarati, D.N. 1995. Basic Econometrics. Third Edition, New York, McGraw Hill
Kogakusha Ltd.
Hossain, M.A., M.A. Goffer, J.C.S. Chowdhury, M.S. Rahman and Hossain, M.I. 1999.
A study on postharvest practices and Loss of Tomato in Some selected Areas of
Bangladesh. Bangladesh J. Agril. Res. 24(2), 299.
Islam, M.A. 2005. Economic Analysis of Some Selected Crops Under Different
Treatment in Saline Soil at Charmajid, Noakhali. Annual research Report, Agril.
Economics Division, BARI, Gazipur.
Matin, M.A., A.S.M.A. Huq, M.R. Karim and E. Baksha. 1996. Farm level yield analysis
of tomato cultivation in selected areas of Bangladesh: An Economic Profile.
Bangladesh J. Agril. Res. 21(1), 50-57.
Mohiuddin, M., M.S. Uddin, M.H. Rashid, K.M.F. Hossain and M.A. Matin. 2007.
Adoption and profitability of Improved tomato variety in the Chittagong Region of
Bangladesh. Journal of Soil and Nature, 1(3).pp.52-58.
Karim, M.A., M.S. Rahman and M.S. Alam. 2009. Profitability of summer tomato
cultivation in Jessore District of Bangladesh. J Agric Rural Dev 7(1&2), 73-79.
Rahman, M.A., J. Haider, U.K. Shaha, A.R. Chowdhury and M.M.U. Chowdhury. 1998.
Economically viable rate of fertilizer and manure for maximizing growth and yield
of year round tomato. Bangladesh J. Agril. Res. 23(3).
Sharfuddin, A.F.M. and M.A. Siddique. 1985. Sabji Bigyan. 1st Edition, Bangladesh
Agricultural University, Mymensingh. P.4.
Zaman, M.M., A.S.M. Anawarul Huq and M.J.A. Chowdhury. 2006. Production
potentiality of summer tomato in Jamalpur region. Int. J. Sustain. Crop Production,
1(2), 12-15.

586 HAJONG et al.

ISSN 0258-7122 (Print), 2408-8293 (Online)
Bangladesh J. Agril. Res. 43(4): 587-598, December 2018
PRODUCTIVITY AND PROFITABILITY OF IMPROVED VERSUS
EXISTING CROPPING PATTERN IN KUSHTIA REGION
M. S. RAHMAN1, M. T. ISLAM2, M. Z. H. PRODHAN3
M. K. HASAN4 AND A. S. M. M. R. KHAN5
Abstract
The trial was conducted at Multi Location Testing (MLT) site under On-Farm
Research Division, BARI, Kushtia during the last week of February, 2015 to
second week of February, 2017 at farmers’ field condition to cover two cropping
cycle of four crops. The main objectives of the trial were to verify the feasibility
of growing improved cropping pattern Mustard-Mungbean-T.Aus-T.Aman rice
and to compare its productivity and profitability with existing cropping pattern
Lentil-Sesame-T.Aman rice. The varieties BARI Sarisha-15, BARI Mung-6,
BRRI dhan48 and Binadhan-7 were used for the crop Mustard, Mungbean,
T.Aus and T.Aman rice, respectively in the improved cropping pattern, while in
case of existing pattern, the varieties were BARI Masur-6, BARI Till-3 and
Binadhan-7 for Lentil, Sesame and T.Aman rice, respectively. Findings revealed
that the mean crop duration of 340 days were required for one cycle in a year in
improved cropping pattern which implied that four crop based cropping pattern
was agronomically feasible to replace existing cropping pattern. Total seed/grain
yield in terms of REY of improved cropping pattern was 14.85 t ha-1 year-1
which was 44% higher than that of existing pattern (10.30 t ha-1 year-1). Mean
production efficiency (35.78 kg ha-1 day-1), land use efficiency (93.15%) and
labour employment (589 mandays ha-1 year-1) of improved cropping pattern was
51%, 16% and 62%, higher, respectively than that of existing cropping pattern.
The mean net economic advangaes of improved cropping pattern was Tk 12677
ha-1 year-1 which implied that the improved cropping pattern was economically
viable. Moreover, the improved cropping pattern increased cropping intensity,
farmers knowledge, skill, and income as well as employment. It also maintained
soil health by incorporating mungbean stover and T.Aus rice straw in the soil.
Therefore, farmers in Kushtia region of Bangladesh could follow the improved
cropping pattern in their high and medium high land for higher productivity and
profitability as well as employment generation over existing cropping pattern.
Keywords: Four crops, grain yield, production efficiency, rice equvalent yield,
profitability
1Senior Scientific Officer, Agricultural Economics, Regional Agricultural Research
Station, Bangladesh Agricultural Research Institute (BARI), Jessore, 2Scientific Officer,
Pomology Division, Horticulture Research Centre, BARI, Gazipur; 3Principal Scientific
Officer, Tuber Crops Research Sub-Centre, BARI, Bogra, 4Principal Scientific Officer
and 5Chief Scientific Officer, On-Farm Research Division (OFRD), BARI, Gazipur,
Bangladesh.
DOI: http://dx.doi.org/10.3329/bjar.v43i4.39157

588 RAHMAN et al.
Introduction
Bangladesh is the most densely populated (about 1033 persons per sq. km)
country in the world with a population of 152.40 million, which is increasing annually at the rate of about 1.37 per cent (BBS, 2016). By the year 2030, the
population will increase to about 186 million (United Nations, 2017). At present total cultivable land of the country is about 8.44 million hectares and it is
shrinking day by day. Demographic pressures and increased urbanization have caused cultivated area to decline at a rate of about 1 percent per year. Food
requirement of the country is estimated to be doubled in the next 25 years (Islam and Haq, 1999).The demand has to be met from our limited and shrinking land
resources. There is very little scope of increasing cultivable land but there are
some scopes of increasing cropping intensity from existing level of 192% by improving the existing cropping patterns by including short duration crops viz.,
mustard, potato, mungbean and T.Aus rice in the rice based cropping system (Mondal et al., 2015).
Kushtia district is located under Agro Ecological Zone (AEZ) 11. The soil is calcareous under High Ganges River Floodplain. About 76% lands are under
high and medium high land which has a great potential to produce four crops in a year. Total cultivable land of the district is 162125 ha in which 10835 ha were
single cropped, 25960 ha was double cropped and 76375 ha was triple cropped land (47% of total cultivable land). The cropping intensity of this area is 263%
and about 93% lands are under irrigation (DAE, 2016).It is possible to increase cropping intensity in this area by using short duration crop varieties which is
developed by BARI and other research institutes. The lentil production hampers due to foot and root rot and stemphylium blight disease. Besides, the sesame
production hampers due to early monsoon at harvesting stag. Moreover, the price of lentil fluctuates every year. So, the farmers in Kushtia face economic loss in
the existing lentil and sesame based cropping patterns. Therefore, it is needed a
better cropping pattern which is more benefitted to the farmers of Kushtia against.
Recently BARI has developed few four crop based cropping patterns which could give more benefit to the farmers. Mustard-Mungbean-T.Aus-T.Aman is
one of them. This cropping pattern is needed to verify in farmers field of Kushtia against existing Lentil-Sesame-T.Aman cropping pattern.
Mondal et al. (2015) reported that T.Aman rice (var: Binadhan-7) - Mustard (var: BARI Sarisha-15) -Mungbean (var: BARI Mung-6) -T.Aus rice (var: Parija)
cropping pattern gave higher benefit with less cost of production and could be easily fitted in the existing pattern. Hossain et al. (2014) also reported that
T.Aman rice (var: Binadhan-7) - Mustard (var: BARI Sarisha-15) -Mungbean (var: BARI Mung-6) – T.Aus rice (var: Parija) are agronomically feasible and
economically profitable compared to the existing pattern.Due to growing four crops in a year in the same piece of land more employment opportunity could be

PRODUCTIVITY AND PROFITABILITY OF IMPROVED VERSUS EXISTING 589
created and at the same time due to increased production of crops, food and
nutritional security could be ascertained for the farmers and at the same time cropping intensity and productivity could be increased (Mondal et al., 2015;
Hossain et al., 2014).
Nazrul et al. (2017) found that improved pattern (Mungbean-T.Aus -T.Aman
rice) provided higher grain yield, contributed more REY, gave maximum sustainable index, production efficiency, land use efficiency and higher profit
compared to farmers pattern (Fallow- T.Aus-T.Aman rice). Moreover, a number of reports on different cropping pattern are available in Bangladesh and India that
an additional crop could be introduced without much changes or replacing the existing ones for considerable increases of productivity as well as profitability of
the farmers (Azad et al., 1982; Malavia et al., 1986; Soni and Kaur, 1984; Khan
et al., 2005; Nazrul et al., 2013; Kamrozzaman et al., 2015).
Farmers in Kushtia have been facing problem in existing patterns, whereas they
have a great potential to conduct four crops in a same piece of land in a year because 76% lands are under high and medium high land and 93% lands are
under irrigation. But, no attempt has been made for on-farm verification of four crops based improved cropping pattern Mustard-Mungbean-T.Aus-T.Aman rice
in Kushtia. With this view in mind, the present study was therefore, undertaken in the following objectives.
Objectives:
i. to document the agronomic practices of growing Mustard-Mungbean-
T.Aus-T.Aman rice cropping pattern;
ii. to verify the feasibility of growing Mustard-Mungbean-T.Aus-T.Aman
rice cropping pattern in farmers field condition;
iii. to compare its productivity and profitability against farmer’s existing
cropping pattern Lentil- Sesame-T.Aman rice; and
iv. To determine the land use efficiency, production efficiency and labour
employment generation of improved and existing cropping pattern.
Materials and Methods
The trial was conducted at Multi Location Testing (MLT) site under On-Farm
Research Division (OFRD), BARI, Kushtia during the last week of February, 2015 to second week of February, 2017 at farmers’ field condition to cover two
cropping cycle of four crops. Before setting up and end of two cycle of the experiment, soil samples were taken separately over 0-15 cm depth to determine
baseline and post soil properties, respectively. Soil samples were air-dried, crushed, and analyzed separately in SRDI laboratory.

590 RAHMAN et al.
The experiment was laid out in block approach for maintaining all activities one after another at a time. There were two blocks consisting of one hectare in each cropping pattern of 8 farmers. One block was under the improved cropping pattern and the other was farmer’s existing pattern. In the improved cropping pattern, Mustard (var. BARI Sarisha-15) - Mungbean (var. BARI Mung-6) - T.Aus rice (var. BRRI dhan48) - T.Aman rice (var. Binadhan-7) was cultivated against existing pattern Lentil (var. BARI Masur-6) - Sesame (var. BARI Till-4) - T.Aman rice (var. Binadhan-7). The trial was started by mungbean cultivation in improved cropping pattern. Lentil, sesame, mustard and mungbean seed was sown in broadcasting method and the rice seedling was transplanted 20 x 15 cm. All fertilizers were applied as basal and top dressing by following improved management practices. The agronomic parameters and inter-cultural operation for crop production under improved and farmer’s existing practices are presented in Table 2. In T.Aus and T.Aman rice, stem borer and sheath blight was observed in some plots. Folicur @ 0.5 ml/L was sprayed to control sheath blight and Virtako 40 WG @1.5g/10 L for stem borer. In Mustard, Rovral-50 wp @ 2 g/L was sprayed at early stage for controlling alternaria blight disease. In mungbean, Tafgor (2ml/L) and Imitaf 20 SL (0.5ml/L) were sprayed for controlling aphid and thrips. All field operation and management practices of both improved and farmer’s pattern were closely monitored and the data were recorded for observing agro-economic performance. The yield data of product and by-product were recorded from 1 m2 in 3 areas from each block.
Agronomic performance viz., land use efficiency, production efficiency and rice equivalent yield of cropping patterns were calculated.
Land use efficiency: It is worked out by taking total duration of individual crop in a pattern divided by 365 days as Tomer and Tiwari, (1990) as follows:
Land use efficiency =653
di100
Where,
di = duration of the ith crop i = 1, 2, 3 and 4
Production efficiency: Production efficiency in terms of Kg ha-1day-1was calculated by total production in a cropping pattern divided by total duration of
crops in that pattern (Tomer and Tiwari. 1990).
Production efficiency =
di
yi
Where, Yi = Yield of the ith crop
di = duration of the ith crop i = 1, 2, 3 and 4

PRODUCTIVITY AND PROFITABILITY OF IMPROVED VERSUS EXISTING 591
Rice equivalent yield: For comparison between cropping patterns, the yield of
all crops was converted into rice equivalent yield (REY) on the basis of prevailing market price of individual crop (Verma and Modgal, 1983).
Rice equivalent yield (t ha-1) = rice of priceMarket
crop that of priceMarket × crop individual of Yield
Profitability analysis: The economic indices like total variable cost and gross
return were also calculated on the basis of prevailing market price of the produces. For economic evaluation of two tested cropping patterns, average data
of two crop cycles were used. Gross return was calculated on the basis of taka per hectare of product and by-product. Total variable cost of different crops was
calculated on the basis of taka per hectare of different operations performed and materials used for raising the crops. Partial budgeting was used to compare the
advantage in between improved and existing cropping pattern. Net economic advantage was derived by subtracting of total economic disadvantage from total
economic advantage.
Results and Discussion
Changes in soil properties: The result of nutrient status of initial and post soil is
presented in Table 1. Initially, the soil was slightly alkaline (7.8-8.1), medium in organic matter and K content. The contents of S and B were also in medium
level. Total N, P and Zn contents were found low. After completion of two cycles, soil was also tested. Post soil chemical analysis result revealed that the
mean pH was slightly lower than initial value whereas OM increased due to incorporation of mungbean in the soil of improved cropping pattern. The contents
of K, Zn and B increased in post soil compared to initial soil while the contents of P and S decreased in post soil than initial soil. Total N is same in post and
initial soil. This result is supported by the result of Mondal et al.(2015).
Crop management: Crop management practices include date of
sowing/transplanting, date of harvesting, fertilizer dose used, irrigation, weeding and application of pesticides etc. of improved and existing cropping pattern
which is shown in Table 2. The crop (field) duration of improved cropping pattern (Mustard-Mungbean-T.Aus-T.Aman rice) took 339 and 341 days for
completion of 1st and 2nd cycle, respectively. While, existing cropping pattern
(Lentil-Sesame-T.Aman rice) required 290 and 296 days for completion of 1st and 2nd cycle, respectively. Turnaround time in four crops based improved
cropping pattern for completion of 1st and 2nd cycle was 26 and 24 days, respectively whereas it was 75 and 69 days, respectively for completion of 1st and
2nd cycle in existing cropping pattern. This indicates that four crops based improved cropping pattern is easily fitted in a piece of land in a year instead of
three crops existing pattern.

592 RAHMAN et al.
Table 1. Chemical properties of initial and post soil (0-15 cm depth) of the
experimental field at Kushtia sadar, Kushtia during 2014-15 and 2016-17
Replication pH
Organic
matter (%)
K Total
N (%)
P S Zn B
meq/100
g soil µg g-1
Initial:
R1 7.8 2.17 0.24 0.11 11.70 20.40 0.87 0.47
R2 8.1 1.97 0.27 0.10 10.70 18.21 0.87 0.41
R3 7.9 1.88 0.28 0.09 8.80 18.40 0.72 0.54
R4 7.8 1.82 0.23 0.09 13.40 22.47 0.97 0.35
R5 7.9 2.10 0.18 0.10 14.60 26.45 0.72 0.41
Mean/Range 7.8-8.1 1.99 0.24 0.10 11.84 21.19 0.83 0.44
Critical limit - - 0.12 0.12 10.00 10.00 0.60 0.20
Interpretation Slightly Alkaline
Medium Medium Low Low Medium Low Medium
Post:
R1 7.7 1.92 0.25 0.09 8.45 15.24 0.75 0.58
R2 7.2 2.28 0.22 0.11 11.25 22.48 0.92 0.58
R3 8.0 1.97 0.32 0.10 9.17 14.57 0.85 0.58
R4 7.2 1.97 0.27 0.10 14.21 20.24 0.95 0.58
Mean/Range 7.2-8.0 2.04 0.27 0.10 10.77 18.13 0.87 0.58
Critical limit - - 0.12 0.12 10.00 10.00 0.60 0.20
Interpretation Slightly Alkaline
Medium Medium Low Low Medium Low Medium
Seed/Grain yield: The mean seed/grain yield of mustard, mungbean, T.Aus and
T.Aman were 1.35, 1.14, 5.10 and 4.59 t ha-1, respectively in improved cropping pattern while mean seed/grain yield of lentil, sesame and T.Aman were 0.78,
1.25 and 4.90 t ha-1, respectively in the existing cropping pattern (Table 3). The stover/straw yield of the cited crops is presented in the Table 3. The yield of
T.Aus rice was found to be very good which might be occurred due to residual effect of mungbean stover. The yield of lentil in existing cropping pattern was
low due to attack of foot and root rot and stemphylium disease. In improved cropping pattern, seed/grain yield of mustard, mungbean, T.Aus and T.Aman
were 1.20, 1.15, 4.97 and 4.59 t ha-1, respectively for 1st cycle while seed/grain
yield of lentil, sesame and T.Aman were 0.75, 1.20 and 4.70 tha-1, respectively in the existing pattern. In the 2nd cycle of improved cropping pattern, seed/grain
yield of mustard, mungbean, T.Aus and T.Aman were 1.49, 1.12, 5.22 and 4.59 tha-1, respectively while in the existing pattern seed/grain yield of lentil, sesame
and T.Aman were 0.80, 1.30 and 5.10 tha-1, respectively. Similar findings were found in Mondal et al. (2015) and Hossain et al. (2014).

PRODUCTIVITY AND PROFITABILITY OF IMPROVED VERSUS EXISTING 593
Ta
ble
2.
Cro
p m
an
ag
em
ent
pra
ctic
es o
f ex
isti
ng
(L
enti
l-S
esa
me-T
.Am
an
) a
nd
im
pro
ved
(M
ust
ard
-Mu
ng
bea
n-T
.Au
s-T
.Am
an
)
cro
pp
ing
pa
tter
n i
n t
he
1st a
nd
2n
d c
ycl
e a
t K
ush
tia
sa
da
r, K
ush
tia
Par
amet
ers
Exis
tin
g C
ropp
ing P
atte
rn
Imp
roved
C
rop
pin
g P
atte
rn
Cro
p
Len
til
Ses
ame
T.A
man
M
ust
ard
Mu
ngb
ean
T.A
us
T.A
man
Var
iety
B
AR
I
Mas
ur-
6
BA
RI
Til
-3
Bin
adh
an-7
B
AR
I S
aris
ha-
15
BA
RI
Mu
ng-6
B
RR
I d
han
48
Bin
adh
an-7
1st c
ycl
e:
Fer
tili
zer
do
se (
CD
th
a-1,
NP
KS
Zn
Bkgh
a-1)
17
.15
-18.7
-5
-0-0
86
.5-1
8-2
6-9
.5-0
1
03.4
-22.5
-3
7.5
-9.5
-2.6
1
26-3
5-4
6-
29
.5-2
.5-2
.12
17-1
7-1
8-1
0-0
-1
86
-22
.5-3
7.5
-9
.5-2
.15
-0.6
8
6-2
2.5
-37
.5-9
.5-
1.6
1-0
Dat
e o
f so
win
g/
tran
spla
nti
ng
18
/11
/15
18
/3/1
5
2/8
/15
14
-15
/1
1/1
5
27
-28
/0
2/1
5
13
-14
/0
5/1
5
10
-12
/0
8/1
5
Dat
e o
f h
arves
tin
g
03
/03
/16
11
/6/1
5
07
/11
/15
7-9
/2/1
6
1-1
0/5
/15
6-8
/08
/15
11
-12
/1
1/1
5
Irri
gat
ion
(n
o.)
-
- -
1
- 1
0
-
Wee
din
g (
no
.)
- 1
2
1
1
1
1
Fie
ld d
ura
tio
n(d
ay)
10
6
86
98
86
73
86
94
Tu
rnar
ou
nd
tim
e (d
ay)
10
14
51
18
02
4
2
2n
d c
ycl
e:
Fer
tili
zer
do
se (
CD
th
a-1,
NP
KS
Zn
Bkgh
a-1)
17
.15
-18.7
-
5-0
-0
86
.5-1
8-2
6-9
.5-0
1
03.4
-22.5
-
37
.5-9
.5-2
.6
12
6-3
5-4
6-
29
.5-2
.5-2
.12
17
-17
-18
-10
-0-
1
86
-22
.5-3
7.5
-
9.5
-2.1
5-0
.6
86
-22
.5-3
7.5
-9.5
-
1.6
1-0
Dat
e o
f so
win
g/
tran
spla
nti
ng
15
/11
/16
15
/03
/16
04
/08
/16
12
-14
/1
1/1
6
26
-28
/0
2/1
6
12
-14
/0
5/1
6
10
-12
/0
8/1
6
Dat
e o
f h
arves
tin
g
5-7
/03
/17
14
/06
/16
04
/11
/16
08
-10
/02
/17
01
-08
/0
5/1
6
06
-08
/0
8/1
6
11
-12
/1
1/1
6
Irri
gat
ion
(n
o.)
-
- -
1
1
10
-
Wee
din
g (
no
.)
- 1
2
1
1
1
1
Fie
ld d
ura
tio
n (
day
s)
11
1
92
93
89
72
87
93
Tu
rnar
ou
nd
tim
e 1
0
9
50
17
3
3
2

594 RAHMAN et al.
Table 3. Yield of existing (Lentil-Sesame-T.Aman) and improved (Mustard-
Mungbean-T.Aus-T.Aman) cropping pattern at Kushtia sadar, Kushtia
Parameters Existing Cropping Pattern Improved Cropping Pattern
Crop Lentil Sesame T.Aman Mustard Mungbean T.Aus T.Aman
Variety BARI
Masur-6
BARI
Til-3
Binadhan-
7
BARI
Sarisha-15
BARI
Mung-6
BRRI
dhan48
Binadhan-
7
1st cycle
Seed/grain
yield (t ha-1)
0.75 1.20 4.70 1.20 1.15 4.97 4.59
Stover/straw
yield (t ha-1)
1.10 2.30 4.20 2.00 1.24 4.16 4.12
2nd cycle
Seed/grain
yield (t ha-1)
0.80 1.30 5.10 1.49 1.12 5.22 4.59
Stover/straw
yield (t ha-1)
1.11 2.15 4.03 1.92 1.22 3.54 3.08
Mean
Seed/grain
yield (t ha-1)
0.78 1.25 4.90 1.35 1.14 5.10 4.59
Stover/straw
yield (t ha-1)
1.11 2.23 4.12 1.96 1.23 3.85 3.60
Rice Equivalent Yield: The mean rice equivalent yield (REY) of improved cropping pattern was 14.85 tha-1year-1 which was 44% higher over existing cropping pattern (10.30 tha-1year-1). The REY of improved cropping pattern was 15.15 tha-1year-1 which was 37% higher against existing cropping pattern (11.03 tha-1year-1) in 1st cycle. While REY of improved cropping pattern was 14.55 tha-
1year-1, which was 52% higher over existing cropping pattern (9.57 tha-1year-1) in 2nd cycle. Higher rice equivalent yield was obtained in improved cropping pattern due to inclusion of new crops and varieties. It is evident from the above findings that improved cropping pattern gave higher yield compared to existing pattern (Table 4). This finding was supported by Mondal et al.,(2015); Hossain et al.(2014); Nazrul et al. (2017) and Nazrul et al. (2013).
Land use efficiency: Land use efficiency is the effective use of land in a cropping year, which mostly depends on crop duration. The mean land-use efficiency of improved cropping pattern was higher (93.15%) than that of existing pattern (80.28%). Improved cropping pattern utilized the land by 92.88% and 93.42% for 1st and 2nd cycle, respectively, whereas existing pattern utilized the land by 79.45% and 81.10% for 1st and 2nd cycle, respectively (Table 4). The land use efficiency was higher in improved cropping pattern due to cultivation of more component crops in the pattern. The similar trend of the findings was cited by Nazrulet al. (2017) and Nazrul et al. (2013).
Production efficiency: Maximum production efficiency was obtained from improved cropping pattern over existing cropping pattern (Table 4). The higher

PRODUCTIVITY AND PROFITABILITY OF IMPROVED VERSUS EXISTING 595
production efficiency of improved cropping pattern might be due to inclusion of four crops and new modern varieties as well as improved management practices. The mean production efficiency of improved cropping pattern was found to be 35.78 kg ha-1 day-1which was 51% higher over existing cropping pattern (23.63 kg ha-1 day-1). Production efficiency of improved cropping pattern and existing cropping pattern was found to be 35.13 and 22.93 kg ha-1 day-1, respectively in 1st cycle, while it was found to be 36.42 and 24.32kg ha-1 day-1 for improved cropping pattern and existing cropping pattern, respectively in 2nd cycle (Table 4). Production efficiency of improved cropping pattern was 53% and 50% higher than that of existing pattern in 1st and 2nd cycles, respectively. Finding revealed that maximum production efficiency was found in improved cropping pattern against existing pattern in all the cycles. Similar findings were cited by Nazrul et al. (2017), Nazrul et al. (2013) and Khan et al. (2005) in case of improved cropping patterns.
Labour employment generation: Human labour was employed for land preparation, sowing/transplanting, fertilizing, weeding, pesticide application, harvesting, carrying, threshing, cleaning and drying. It is observed that the mean total number of human labour used for crops cultivation under improved cropping pattern was 589 man-days ha-1 year-1 (Table 4) which was generated 62% higher labour employment than that of existing cropping pattern (363 man-days ha-1 year-1). It was also generated employment of women, children and aged people due to inclusion of mungbean.
Table 4. Rice equivalent yield, production efficiency, land use efficiency and labour
employment of existing (Lentil-Sesame-T.Aman) and improved (Mustard-
Mungbean-T.Aus-T.Aman) cropping pattern at Kushtia sadar, Kushtia
Cycles Cropping
pattern
Rice
equivalent
yield (tha-1)
Land use
efficiency (%)
Production
efficiency (Kg
ha-1day-1)
Labour
employment (man-
days ha-1 year-1)
1st
Existing 11.03 79.45 22.93 361
Improved 15.15 92.88 35.13 586
2nd
Existing 9.57 81.10 24.32 364
Improved 14.55 93.42 36.42 592
Mean Existing 10.30 80.28 23.63 363
Improved 14.85 93.15 35.78 589
Profitability analysis: The study revealed that the mean gross return of
improved and existing cropping pattern was Tk. 282244 ha-1 and Tk. 200966 ha-1, respectively (Table 5). The mean gross return of improved cropping pattern was
40% higher than that of existing cropping pattern. The higher gross return of improved cropping pattern might be due to inclusion of new crops and new high
yielding varieties. The mean total variable cost of improved and existing
cropping pattern was Tk. 174638 ha-1 and Tk. 106037 ha-1, respectively (Table 5). The mean gross margin of alternate cropping pattern was 13% higher (Tk.
107607 ha-1) than that of existing cropping pattern (Tk. 94929 ha-1).

596 RAHMAN et al.
Table 5. Gross return, total variable cost and gross margin of existing (Lentil-
Sesame-T.Aman) and alternate (Mustard-Mungbean-T.Aus-T.Aman)
cropping pattern at Kushtia sadar, Kushtia
Cycles Cropping
pattern
Gross return
(Tk. ha-1)
Total variable cost
(Tk. ha-1)
Gross margin
(Tk.ha-1)
1st
Existing 188197 107478 80719
Alternate 252619 175175 77444
2nd
Existing 213734 104595 109139
Alternate 311869 174100 137769
Mean Existing 200966 106037 94929
Alternate 282244 174638 107607
Price of produce (1st cycle) (Tk. kg-1): Lentil- 85.00, Stover-2.00, Mustard- 46.50, Straw-
1.00, Mungbean- 47.50, T.Aman-15.75, Straw-2.91, T.Aus-11.25, Sesame-30.00.
Price of produce (2nd cycle) (Tk. kg-1): Lentil-65.00, Stover-2.00, Mustard-42.50, Straw-
1.00, Mungbean-50.00, T.Aman-20.50, Straw-3.80, T.Aus-16.25, Sesame-30.50.
Table 6. Partial budgeting of existing (Lentil-Sesame-T.Aman) and improved
(Mustard-Mungbean-T.Aus-T.Aman) cropping pattern at Kushtia sadar,
Kushtia
Cycles Economic disadvantage Tk. ha-1 year-1
Economic Advantage Tk. ha-1 year-1
1st (a) Gross return of existing cropping pattern
188197 (e) Gross return from improved cropping pattern
252619
(b) Total variable cost of improved cropping pattern
175175 (f) Total variable cost of existing cropping pattern
107478
(c) Total (a+b) 363372 (g) Total (e+f) 360097
(d) Net disadvantage (g-c) -3275
2nd (a) Gross return of existing cropping pattern
213734 (e) Gross return from improved cropping pattern
311869
(b) Total variable cost of improved cropping pattern
174100 (f) Total variable cost of existing cropping pattern
104595
(c) Total (a+b) 387834 (g) Total (e+f) 416464
(d) Net disadvantage (g-c)
28630
Mean (a) Gross return of existing cropping pattern
200966 (e) Gross return from improved cropping pattern
282244
(b) Total variable cost of improved cropping pattern
174638 (f) Total variable cost of existing cropping pattern
106037
(c) Total (a+b) 375604 (g) Total (e+f) 388281
(d) Net disadvantage (g-c) 12677

PRODUCTIVITY AND PROFITABILITY OF IMPROVED VERSUS EXISTING 597
Economic advantage: The mean net economic advantage was Tk. 12677 ha-1 year-1 which implied that four crop based improved cropping was economically viable than that of existing cropping pattern (Table 6). Similar trend was found in 2nd (Tk. 28630 ha-1 year-1) cycle. But net economic disadvantage was found in 1st cycle (Tk. 3275 ha-1 year-1), because farm gate price of lentil in existing cropping pattern was high whereas T.Aus price in improved cropping pattern was lower. In the 2nd cycle, lentil price became lower and T.Aus price became higher which increased net advantage in improved cropping pattern.
Conclusion
The trial was conducted to verify the feasibility of growing improved cropping pattern Mustard-Mungbean-T.Aus-T.Aman rice and to compare its productivity and profitability with existing cropping pattern Lentil-Sesame-T.Aman rice. After completion of two cycles, soil was also tested. Post soil chemical analysis result revealed that the mean pH was slightly lower than initial value whereas organic matter content increased due to incorporation of mungbean in the soil of improved cropping pattern. The contents of K, Zn and B increased in post soil compared to initial soil while the contents of P and S decreased in post soil than initial soil. Total N is same in post and initial soil. The mean crop duration was 340 days for improved cropping pattern which implied that four crop based improved pattern is agronomically feasible to replace existing cropping pattern. Total seed/grain yield in terms of REY of improved cropping pattern was 14.85 t ha-1 year-1 which was 44% higher than that of existing pattern (10.30 t ha-1 year-
1). Mean production efficiency (35.78 kg ha-1 day-1), land use efficiency (93.15%) and labour employment (589 mandays ha-1 year-1) of improved cropping pattern was 51%, 16% and 62%, higher, respectively than that of existing cropping pattern. The mean net economic advangaes of improved cropping pattern was Tk 12677 ha-1 year-1 which implied that the improved cropping pattern was economically viable. Moreover, the improved cropping pattern increased cropping intensity, farmers knowledge, skill, and income as well as employment. The food and nutritional security will be ensured for the farmers of Kushtia region due to increase production of crops. It also maintained soil health by incorporating mungbean stover and T.Aus straw in the soil of improved cropping pattern. Farmers in Kushtia region of Bangladesh could follow Mustard (var. BARI Sarisha-15) - Mungbean (var. BARI Mung-6) - T.Aus rice (var. BRRI dhan48) - T.Aman rice (var. Binadhan-7) cropping pattern in their high and medium high land for higher productivity and profitability against existing pattern Lentil (var. BARI Masur-6) – Sesame (var. BARI Till-4) - T.Aman rice (var. Binadhan-7).
References
Azad, A. K., F. A. H. Talukdar, M. A. Wahhab and M. A. Khan. 1982. Progress and
prospect of jute based cropping systems research in Bangladesh. Proc. Expert Cons.
Jute and Kenaf Improvement: Pp. 244-267.

598 RAHMAN et al.
BBS. 2016. Statistical year book of Bangladesh. Bangladesh Bureau of Statistics,
Statistics Division, Ministry of Planning, Dhaka, Bangladesh.
DAE. 2016. Department of Agriculture Extension, Paper presented in the regional
research extension review and program planning workshop, Kushtia.
Hossain, I., M. R. I. Mondal, M. J. Islam, M. A. Aziz, A. S. M. M. R. Khan, and F.
Begum. 2014. Four crops based cropping pattern studies for increasing cropping
intensity and productivity in Rajshahi region of Bangladesh. Bangladesh Agron.J.
17(2): 55-60.
Islam M.F. and Haq M.F. 1999.Integrated nutrient management with inorganic fertilizers
and green manure in some dominant cropping patterns. Pp. 55–72 in ‘Proceedings of
the national workshop on integrated nutrient management for crop production and
soil fertility’, ed. by M.F. Islam, D.A. Choudhury, G.M. Panaullah, M.U. Miah, J.
Rijpma and M.F. Haque. Bangladesh Agricultural Research Institute: Gazipur,
Bangladesh
Kamrozzaman, M. M., M. A. H. Khan, S. Ahmed, and A. F. M. Ruhul Quddus. 2015.On-
farm evaluation of production potential and economics of Wheat-Jute-T. Aman rice-
based cropping system; J. Bangladesh Agril. Univ. 13(1): 93–100.
Khan, M. A. H., M. A. Quayyum, M. I. Nazrul, N. Sultana and M. R. A. Mollah.
2005.On-farm evaluation of production potential and economics of mustard-rice
based improved cropping system. J. Socio. Res. Dev. 2(1): 37-42.
Malavia, D. D., M. P. Singh, M. M. Vyas, J. C. Patel and K. K. Kalaria. 1986. Production
potential and economic feasibility of different crop sequences. Indian J. Argon.31(1):
75-78.
Mondal, R. I., F. Begum, A. Aziz and S. H. Sharif. 2015. Crop sequences for increasing
cropping intensity and productivity. SAARC J. Agri., 13(1):135-147.
Nazrul, M. I., M. K. Hasan, and M. R. I. Mondal. 2017. Production potential and
economics of mungbean in rice based cropping pattern in Sylhet region under AEZ
20. Bangladesh J. Agril. Res. 42(3): 413-424.
Nazrul, M. I., M. R. Shaheb, M. A. H. Khan and A. S. M. M. R. Khan. 2013. On-farm
evaluation of production potential and economic returns of Potato-Rice Based
improved cropping system. Bangladesh J. Agril. Res. 16(2): 41-50.
Soni, P. N and R. Kaur. 1984. Studies on production potential of different cropping
systems. Indian J. Agron.29(3): 367-78.
Tomer, S. S and A. S. Tiwari. 1990. Production potential and economics of different crop
sequences. Indian J. of Agron.35(1, 2): 30-35.
United Nations. 2017. United Nations, Department of Economic and Social Affairs,
Population Division. World Population Prospects: The 2017 Revision. New York.
Verma, S. P and S. C. Modgal. 1983. Production potential and economics of fertilizer
application as resources constraints in maize, wheat crop sequence. Himachal
J.Agric. Res. 9(2): 89-92.

ISSN 0258-7122 (Print), 2408-8293 (Online)
Bangladesh J. Agril. Res. 43(4): 599-609, December 2018
COMBINING ABILITY AND HETEROSIS STUDYIN MAIZE INBREDS
THROUGHOUT DIALLEL MATING DESIGN
A. N. M. S. KARIM1, S. AHMED2, A. H. AKHI3
M. Z. A. TALUKDER4 AND A. KARIM5
Abstract
Combining ability effects were estimated for grain yield and some other
important agronomic traits of maize in a 7×7 diallel analysis excluding
reciprocals. The variances for general combining ability (GCA) were
found significant for yield, days to pollen shedding, days to silking and
ear height while it was found non-significant for plant height and number
of kernels/ear. Non-significant general combining ability (GCA) variance
for plant height and number of kernels/ear indicates that these two traits
were predominantly controlled by non- additive type of gene action.
Specific combining ability (SCA) was significant for all the characters
except yield and days to silking. Non-significant specific combining
ability (SCA) variance for yield and days to silking suggests that these
two traits were predominantly controlled by additive type of gene action.
Both GCA and SCA variances were found significant only in days to
pollen shedding and ear height indicated the presence of additive as well
as non additive gene effects for controlling the traits. However, relative
magnitude of these variances indicated that additive gene effects were
more prominent for all the characters studied except days to silking.
Parent BIL95 was the best general combiner for both high yield and
number of kernels/ear and parent BML4 for dwarf plant type. Two
crosses (BML4× BML36 and BIL114× BIL31) exhibited significant and
positive SCA effects for grain yield involved low × average and average
× average general combining parents. The range of heterosis expressed
by different crosses for grain yield and days to silking was from -65.83 to
21.26 percent and -17.85 to 8.22 percent, respectively.. The better
performing three crosses (BIL114×BIL31, BIL138×BIL95 and
BIL31×BIL95) can be utilized for developing high yielding hybrid
varieties as well as for exploiting hybrid vigour.
Keywords: Combining ability,heterosis, maize, GCA, SCA
1,3Scientific Officer, Plant Breeding Division, Bangladesh Agricultural Research Institute
(BARI), Gazipur, 2Principal Scientific Officer, Plant Breeding Division, BARI, Gazipur, 4Senior Scientific Officer, Plant Breeding Division, BARI, Gazipur, 5Senior Scientific
Officer, Seed Technology Division, BARI, Gazipur, Bangladesh.
DOI: http://dx.doi.org/10.3329/bjar.v43i4.39158

600 KARIM et al.
Introduction
Maize is one of the oldest and key cereal crops in the world. It is the highest
yielding grain crop having multiple uses. A great combination of high market demand with comparatively low production cost, ready market and high yield has
generated great interest among the farmers in maize cultivation. Day by day it is gaining popularity in the country due to vast demand, particularly for poultry
industry. In Bangladesh it is the third most important crop after rice and wheat and it accounts for 4.8% of the total cropped land area and 3.5% of the value of
agricultural output (Ahmad et al., 2011). In 2014-15, maize was cultivated in 3.25 lac hectares of land and yielded 22.72 lac tons (BBS, 2016).
The effects of General Combining Abilities (GCA) and Specific Combining
Abilities (SCA) are important indicators of potential value for inbred lines in hybrid combinations. Differences in GCA effects have been attributed to
additive, the interaction of additive x additive, and the higher-order interactions of additive genetic effects in the base population, while differences in SCA
effects have been attributed to non-additive genetic variance (Falconer, 1981). The concept of GCA and SCA has become increasingly important to plant
breeders because of the widespread use of hybrid cultivars in many crops (Wilson et al., 1978). The evaluation of crosses among inbred lines is an
important step towards the development of hybrid varieties in maize (Hallauer, 1990). This process ideally should be through the evaluation of all possible
crosses (diallel crosses), where the merits of each inbred line can be determined. A diallel analysis provides good information on the genetic identity of genotypes
especially on dominance-recessive relations and some other genetic interactions. Diallel crosses have been used in genetic research to determinate the inheritance
of a trait among a set of genotypes and to identify superior parents for hybrid or cultivar development (Yan and Manjit, 2003). The present study involving a 7×7
diallel analysis designed to find out the better general combining parents and for
isolating good cross combinations in maize for developing suitable hybrid(s) locally.
Materials and Methods
Seven inbred lines of maize viz. P1(BML4), P2(BML36), P3(BIL106),
P4(BIL114), P5(BIL138), P6(BIL31) and P7(BIL95) collected from CIMMYT-
Mexico, CIMMYT-ARMP, and locally developed were crossed in all possible
combinations (excluding reciprocals) in the rabi season of 2012-2013 at
Joydebpur. During rabi 2013-2014, crossed 21 F1’s and along with three
commercial hybrids were grown following Randomized Complete Block Design
(RCBD) with three replications were sown on 24 November 2013. Each plot
involved of 2 rows 5.0 m long. The unit plot size was 5.0 m x 0.75 m. Spacing
adopted was 75 cm × 20 cm between rows and hills, respectively. One healthy
seedling per hill was kept after proper thinning. Fertilizers were applied @ 250,

COMBINING ABILITY AND HETEROSIS STUDYIN MAIZE INBREDS 601
55, 110, 40, 5 and 1.5 kg/ha of N, P, K, S, Zn, B, respectively. Standard
agronomic practices were followed and plant protection measures were taken
when required. Data on days to 50% pollen shedding and silking were recorded
on whole plot basis. Ten randomly selected plants were used for recording
observations on plant height and ear height. All the plants in 2 rows were
considered for plot yield which was later converted to t/ha. The combining ability
analysis was carried out following Model I (fixed effects) and Method IV (one
set of F1’s but neither parents nor reciprocal F1’s is included) described by
Griffing (1956) using a software ‘diallel analysis’ by Mark D. Burrow and James
G. Coors, version 1.1.
Results and Discussion
Analysis of variances for combining ability (Table1) revealed that variances for
general combining ability (GCA) were significant for yield, days to pollen
shedding, days to silking and ear height while it was found non-significant for
plant height and number of kernels/ear. Non-significant general combining
ability (GCA) variance for plant height and number of kernels/ear suggested
that these two traits were predominantly controlled by non- additive type of
gene action. Specific combining ability (SCA) was significant for all the
characters except yield and days to silking. Non-significant specific combining
ability (SCA) variance for yield and days to silking suggested that these two
traits were predominantly controlled by additive type of gene action.Both GCA
and SCA variances were found significant in days to pollen shedding and ear
height indicated the presence of additive as well as non additive gene effects
for controlling the traits. Importance of both GCA and SCA variances for yield
and yield contributing traits in maize was reported by Ahmed et al. (2008),
Gurung et al. (2008) and Abdel-Moneam et al. (2009). However, in the present
study variances due to GCA were much higher in magnitude than SCA for all
the characters except days to silking indicating preponderance of additive gene
effects for the inheritance of these traits. Malik et al. (2004) in their study also
found higher GCA variances than SCA for days to pollen shedding, plant
height, ear height, 1000-kernel weight and grain yield. Predominance of
additive gene action for various quantitative traits in maize was reported by
Muraya et al. (2006), Ahmed et al. (2008), Alam et al. (2008) and
Amiruzzaman (2010). The current result was in contrast with Abdel-Moneam et
al. (2009) who observed GCA/SCA ratio was less than unity for kernels/row,
100-kernels weight and ear yield/plant, indicating non additive gene action
were controlling the traits. Kadir (2010) in his study showed that the non-
additive effects (SCA) were more important than additive effects (GCA) for
plant height, ear height, days to pollen shedding, days to silking, seeds/row,
100-seed weight and grain yield/plant.

602 KARIM et al.
Table 1. Analysis of variance for combining ability of seven characters of maize in a
7×7 diallel cross
Source of
variation df
Yield
(t/ha)
Pollen
shedding
(Days)
Silking
(Days)
Plant
Height
(cm)
Ear
height
(cm)
No. of
kernels/
ear
1000-
kernel
wt.(g)
GCA 6 30.70** 50.86** 47.86* 4869.71 2422.31* 18406.89 6314.28
SCA 14 7.38 6.38** 68.10 2529.84** 804.60** 7937.64** 2744.44**
Error 40 4.17 1.73 56.11 412.00 145.03 2664.03 880.39
GCA/SCA - 4.16 7.97 0.70 1.92 3.01 2.32 2.30
**P=0.01,*P=0.05
General combining ability (GCA) effects
The GCA effects are shown in Table 2. None of the parents were found to be a good general combiner for all the characters under consideration. A wide range
of variability of GCA effects was observed among the parents. In the present study, for days to pollen shedding, silking, plant height and ear height the inbred
lines with significant and negative GCA effects were considered as good general combiners. Significant and negative GCA for days to pollen shedding and use of
these parents might be useful in developing early hybrid variety(s). On the other hand, for yield and other yield components those with significant and positive
GCA effects were considered as good general combiners.
For grain yield, parent BIL95 showed significant and positive GCA effect. In
addition to grain yield, parent BIL95 was also good general combiner for days to pollen shedding and no. of kernels/ear. Sharma et al. (1982) reported that parents
with good general combiners for grain yield generally shows good performance
for various yield components. Similar views have been given by Malik et al. (2004), Uddin et al.(2006), Ahmed et al. (2008) and Abdel-Moneam et al.
(2009). So, parent BIL95 could be used extensively in hybrid breeding program with a view to increase the yield level. Parent BML4, BML36 andBIL95 showed
significant and negative GCA for days to pollen shedding though they did not posses significant for days to silking but they showed negative values. So, these
parents might be useful in developing early hybrid variety(s). Parent BML4 exhibited significant and negative GCA effect both for plant and ear height.
Uddin et al. (2006) and Ahmed et al. (2008) also found inbred line(s) as good general combiner for short plant type in their study. Significant and negative
GCA for ear height was observed by Roy et al.(1998), Malik et al. (2004), Alam et al. (2008) and Amiruzzaman (2010) in their study.
Regarding number of kernels/ear, two parents viz. BIL138 and BIL95showed significant and positive GCA effect for this trait. These two parents are expected
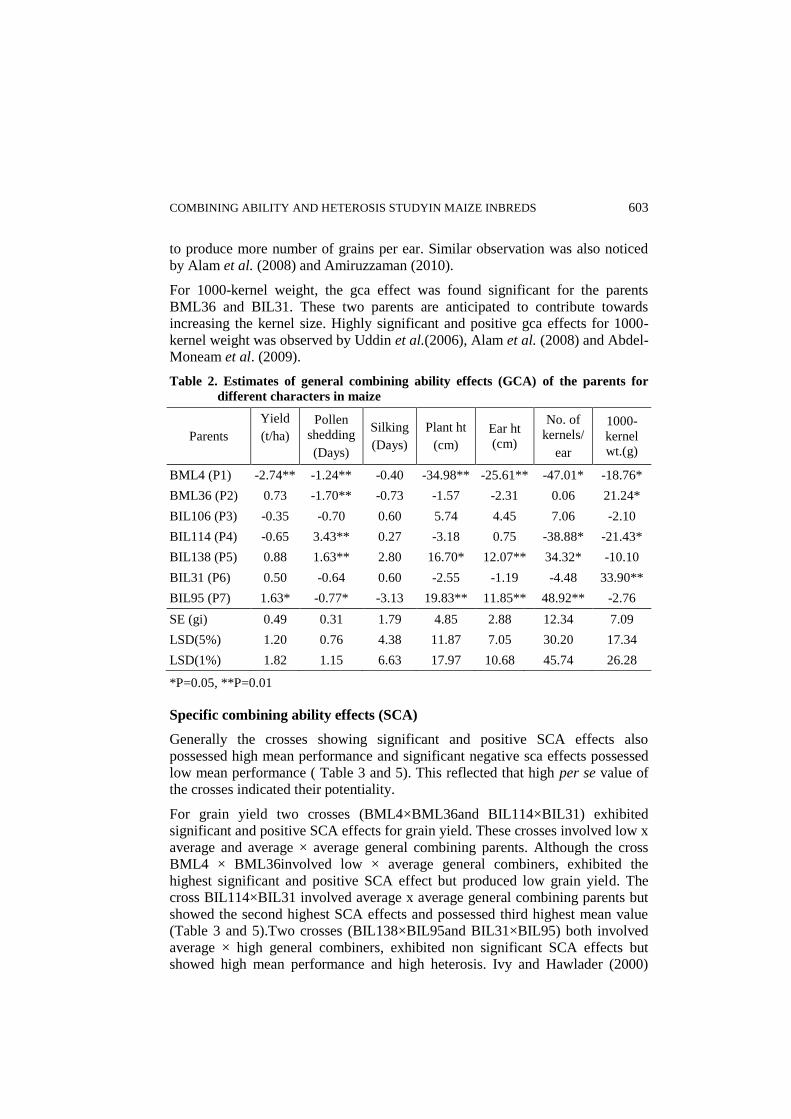
COMBINING ABILITY AND HETEROSIS STUDYIN MAIZE INBREDS 603
to produce more number of grains per ear. Similar observation was also noticed
by Alam et al. (2008) and Amiruzzaman (2010).
For 1000-kernel weight, the gca effect was found significant for the parents
BML36 and BIL31. These two parents are anticipated to contribute towards increasing the kernel size. Highly significant and positive gca effects for 1000-
kernel weight was observed by Uddin et al.(2006), Alam et al. (2008) and Abdel-Moneam et al. (2009).
Table 2. Estimates of general combining ability effects (GCA) of the parents for
different characters in maize
Parents
Yield
(t/ha)
Pollen
shedding
(Days)
Silking
(Days)
Plant ht
(cm)
Ear ht
(cm)
No. of
kernels/
ear
1000-
kernel wt.(g)
BML4 (P1) -2.74** -1.24** -0.40 -34.98** -25.61** -47.01* -18.76*
BML36 (P2) 0.73 -1.70** -0.73 -1.57 -2.31 0.06 21.24*
BIL106 (P3) -0.35 -0.70 0.60 5.74 4.45 7.06 -2.10
BIL114 (P4) -0.65 3.43** 0.27 -3.18 0.75 -38.88* -21.43*
BIL138 (P5) 0.88 1.63** 2.80 16.70* 12.07** 34.32* -10.10
BIL31 (P6) 0.50 -0.64 0.60 -2.55 -1.19 -4.48 33.90**
BIL95 (P7) 1.63* -0.77* -3.13 19.83** 11.85** 48.92** -2.76
SE (gi) 0.49 0.31 1.79 4.85 2.88 12.34 7.09
LSD(5%) 1.20 0.76 4.38 11.87 7.05 30.20 17.34
LSD(1%) 1.82 1.15 6.63 17.97 10.68 45.74 26.28
*P=0.05, **P=0.01
Specific combining ability effects (SCA)
Generally the crosses showing significant and positive SCA effects also
possessed high mean performance and significant negative sca effects possessed
low mean performance ( Table 3 and 5). This reflected that high per se value of the crosses indicated their potentiality.
For grain yield two crosses (BML4×BML36and BIL114×BIL31) exhibited significant and positive SCA effects for grain yield. These crosses involved low x
average and average × average general combining parents. Although the cross BML4 × BML36involved low × average general combiners, exhibited the
highest significant and positive SCA effect but produced low grain yield. The cross BIL114×BIL31 involved average x average general combining parents but
showed the second highest SCA effects and possessed third highest mean value (Table 3 and 5).Two crosses (BIL138×BIL95and BIL31×BIL95) both involved
average × high general combiners, exhibited non significant SCA effects but showed high mean performance and high heterosis. Ivy and Hawlader (2000)

604 KARIM et al.
also reported that good general combining parents do not always show high SCA effects in their hybrid combinations. On the contrary, Paul and Duara (1991)
reported that the parents with high GCA always produce hybrids with high estimates of SCA. Thus the SCA effect of the crosses was not reflected through
the GCA effects of the parents. Roy et al.(1998) and Ivy and Hawlader (2000) also found the similar result.
Table 3. Specific combining ability effects (SCA) of the crosses for different
characters in maize
Crosses
Yield
(t/ha)
Pollen
shedding
(Days)
Silking
(Days)
Plant ht.
(cm)
Ear ht.
(cm)
No. of
kernels/
ear
1000-
kernel wt.(g)
P1XP2 2.57* 1.24 0.80 36.22** 20.58** 54.44* 9.11
P1XP3 0.52 -1.42* -2.87 20.58* 11.16 44.78 12.44
P1XP4 -2.63* -1.89** 1.13 -59.44** -38.42** -90.62** -64.89**
P1XP5 1.04 -0.76 -2.40 7.95 4.53 13.18 30.44*
P1XP6 -2.12* 1.51* 0.13 -14.13 -2.74 -26.69 6.44
P1XP7 0.61 1.31 3.20 8.82 4.89 4.91 6.44
P2XP3 -0.52 1.71* -0.20 -21.50* -6.14 -36.62 -34.22*
P2XP4 0.24 0.24 2.80 22.42* 10.22 35.98 1.78
P2XP5 0.06 -1.96** -3.40 -24.66* -3.56 18.11 3.78
P2XP6 -1.12 -0.36 -1.87 -8.54 -9.90 2.58 19.78
P2XP7 -1.24 -0.89 1.87 -3.93 -11.20 -74.49** -0.22
P3XP4 0.21 1.24 4.47 26.44* 20.13** -29.02 58.44**
P3XP5 0.30 -0.29 -1.40 -23.77* -20.52** 7.11 7.11
P3XP6 0.69 -0.69 -1.87 7.02 0.54 12.58 -33.56*
P3XP7 -1.20 -0.56 1.87 -8.77 -5.16 1.18 -10.22
P4XP5 -0.57 2.24** 4.60 -15.18 -4.76 5.04 -6.89
P4XP6 2.49* -1.49 0.80 19.07 6.44 69.84* 2.44
P4XP7 0.26 -0.36 -13.80** 6.68 6.40 8.78 9.11
P5XP6 -1.16 0.64 -0.73 27.52* 12.45* -80.69** -12.22
P5XP7 0.34 0.11 3.33 28.14 11.88 37.24 -22.22
P6XP7 1.23 0.38 3.53 -30.94** -6.79 22.38 17.11
SE (ij) 0.96 0.63 3.53 9.56 5.68 24.33 13.99
LSD(5%) 2.06 1.35 7.57 20.51 12.18 52.19 30.01
LSD(1%) 2.86 1.88 10.51 28.46 16.91 72.43 41.65
*P=0.05, **P=0.01
P1=BML4, P2=BML36, P3=BIL106, P4=BIL114, P5=BIL138, P6=BIL31 and
P7=BIL95

COMBINING ABILITY AND HETEROSIS STUDYIN MAIZE INBREDS 605
Significant and negative SCA effects for days to pollen shedding and silking are
desirable for selection of early maturing hybrids. Three crosses (P1 × P3, P1 × P4and P2× P5) exhibited significant and negative sca effects for days to pollen
shedding and one cross (P4 × P7) for days to silking. These crosses mostly involved high × average, high × low and average × average general combining
parents. These findings are consistent with the results of Ahmed et al.(2008).
Five crosses exhibited significant and negative SCA effects for plant height and
two crosses for ear height indicating short statured plant. These two crosses (P1 × P4, P3 × P5) exhibited significant and negative SCA effects both for plant and ear
height and are desirable for exploiting non additive gene. These crosses involved high × average, average × average, average × low general combining
parents (Table 2 and 3). In this study, the cross BML4 × BIL114 showed
significant and negative SCA effect both for plant and ear height and also possessed the lowest mean value. Although the cross BIL106 × BIL138 showed
significant and high negative SCA effect both for plant and ear height but possessed high mean value (Table 3 and 5).
In case of number of kernels ear-1, two crosses expressed significant and positive SCA effect involving average × low general combining parents. Two crosses
(BIL36 × BIL95,BIL138 × BIL31) involved high × average combiners and exhibited significant and negative SCA effects but possessed high mean value.
On the other hand, cross (BML4 × BIL114) involved low × low general combiners and simultaneously possessed the lowest significant and negative sca
effects and the lowest number of kernels/ear (Tables 3 and 5).
For 1000-kernel weight, two crosses showed significant and positive SCA effects
involved low × average combining parents. The SCA values for this character ranged from -64.89 (for BML4×BIL114)to 58.44 (for BIL106×BIL114).
Heterosis
The standard/economic heterosis expressed by the F1 hybrids over the
commercial check variety NK 40 for yield and yield related traits are shown in Table 4. All the traits showed significant heterosis in different crosses.
For grain yield/plant only three crosses showed significant and positive heterosis
over the standard check variety NK-40 which was found in the range of -65.83 to 21.26 % (Table 4). It appears that among the 21 F1s, only three crosses exhibited
significant and positive heterosis and the others showed significant and negative heterosis for this trait. Amiruzzaman (2010) and Kadir (2010) foundstandard
heterosis for karnel yield were -17.60 to 9.71 % and -15.21 to 27.97 % , respectively.
Significant and negative heterosis was exhibited by six crosses for days to pollen shedding and four crosses for days to silking indicating earliness (Table 4). Malik
et al. (2004) also observed crosses with significant and negative heterosis in their

606 KARIM et al.
study. None of the crosses showed significant and positive heterosis for grain yield coupled with significant and negative heterosis for days to silking. Ahmed
et al. (2008) reported significant and negative heterosis for days to silking in maize.
Table 4.Heterosis of the crosses over NK-40 for different characters in maize
Cross Yield
(t/ha)
Pollen
shedding
(Days)
Silking
(Days)
Plant ht
(cm)
Ear ht
(cm)
No. of
kernels/ear
1000-
kernel
wt.(g)
P1X P2 -4.64 -0.74 -0.35 18.89** 13.66** 29.62** -10.83**
P1X P3 -33.80** -2.58** -2.85** 13.52** 10.20* 28.84** -15.83**
P1X P4 -65.83** 1.47** 1.07* -43.73** -58.86** -19.07** -40.00**
P1X P5 -17.55** 0.73 0.00 12.45** 11.50** 27.74** -13.33**
P1X P6 -50.42** 0.73 0.36 -14.16** -15.12** 6.92** -8.33**
P1X P7 -14.58** 0.36 -0.35 15.03** 11.67** 29.41** -17.50**
P2X P3 -11.14** 0.36 -0.35 7.94* 17.98** 19.79** -17.50**
P2X P4 -6.87 3.31** 2.51* 30.48** 34.40** 26.88** -13.33**
P2X P5 5.57 -1.10* -1.43 12.97** 31.20** 41.50** -10.00**
P2X P6 -8.82* -1.84** -2.14* 10.94** 5.79 27.13** 5.00*
P2XP7 0.46 -2.58 -2.14* 28.33** 21.00** 20.85** -9.17**
P3XP4 -17.27** 5.51** 5.72** 37.77** 56.00** 11.46** -5.00*
P3X P5 -2.23 1.83** 2.14* 18.25** 17.98** 40.46** -15.00**
P3X P6 -2.14 -1.10* -0.71 25.67** 28.09** 31.58** -14.17**
P3X P7 -9.19* -1.10* -0.71 29.92** 37.59** 42.70** -17.50**
P4X P5 -13.00** 9.19** 8.22** 18.03** 33.63** 27.76** -23.33**
P4X P6 11.79** 2.57** 1.79 27.68** 30.94** 34.61** -10.00**
P4X P7 1.58 3.67** -17.85** 34.12** 47.80** 32.54** -17.50**
P5X P6 -7.80* 2.93** 2.86** 45.93** 53.41** 14.18** -10.83**
P5X P7 16.53** 2.21** 3.21** 60.74** 69.58** 59.48** -22.50**
P6X P7 21.26** 0.00 1.07 10.30** 28.18** 45.28** -1.67
Mean 15.36 2.19 2.75 24.61 30.22 29.42 12.54
LSD(5%) 7.46 0.95 1.81 6.33 8.24 5.57 4.82
LSD(1%) 10.18 1.29 2.47 8.64 11.24 7.60 6.58
*P=0.05, **P=0.01
P1=BML4, P2=BML36, P3=BIL106, P4=BIL114, P5=BIL138, P6=BIL31 and
P7=BIL95
Negative heterosis is desirable for plant height which helps to develop short stature plant leading to tolerant to lodging. Heterosis for different crosses ranged
from -43.73 to 60.74 percent and -58.86 to 69.58 percent, respectively, for plant and ear height. Two crosses exhibited significant and negative heterosis both for
plant and ear height and except one cross (BML36 x BIL31) in respect to ear height, rest of the crosses showed significant and positive heterosis. Significant
and negative heterosis for both these traits were reported by Uddinet al. (2006), Alam et al. (2008) and Amiruzzaman (2010).

COMBINING ABILITY AND HETEROSIS STUDYIN MAIZE INBREDS 607
Except one cross (BML4 × BIL114), rest of the crosses showed significant and
positive heterosis for number of kernels ear-1. The value of heterosis ranged from -19.07 to 59.48 % in the cross BML4 × BIL114and BIL138× BIL95,
respectively.
Out of 21 F1’s, only one cross (BML36 × BIL31) expressed significant and
positive heterosis for 1000-kernel wt. (Table 4). This finding was similar with Shewangizaw (1983) and Nigussie and Zelleke (2001) who observed heterosis
only in few crosses.
Table 5. Mean performance of the single crosses evaluated at Joydebpur during rabi
2013-2014.
Genotypes
Yield/
plant
(g)
Pollen
shedding
(Days)
Silking
(Days)
Plant ht
(cm)
Ear ht
(cm)
Number
of kernels/
ear
1000-
kernel
wt.(g)
P1X P2 10.27 90 93 185 88 490 357
P1X P3 7.13 88 91 176 85 487 337
P1X P4 3.68 92 94 87 31 306 240
P1X P5 8.88 91 93 175 86 483 347
P1X P6 5.34 91 94 133 65 404 367
P1X P7 9.20 91 93 179 86 489 330
P2X P3 9.57 91 93 168 91 453 330
P2X P4 10.03 94 96 203 104 479 347
P2X P5 11.37 90 92 175 101 535 360
P2X P6 9.82 89 91 172 82 480 420
P2XP7 10.82 88 91 199 93 457 363
P3XP4 8.91 96 99 214 120 421 380
P3X P5 10.53 92 95 184 91 531 340
P3X P6 10.54 90 93 195 99 497 343
P3X P7 9.78 90 93 202 106 539 330
P4X P5 9.37 99 101 183 103 483 307
P4X P6 12.04 93 95 198 101 509 360
P4X P7 10.94 94 77 208 114 501 330
P5X P6 9.93 93 96 227 118 431 357
P5X P7 12.55 93 96 250 131 603 310
P6X P7 13.06 91 94 171 99 549. 393
NK40 10.77 91 93 155 77 378 400
Pioneer 10.46 91 95 193 84 439 347
BHM9 10.69 91 934 215 116 484 327
Mean 9.82 91 93 185 94.66 476 346
LSD(5%) 0.87 1.02 1.79 13.46 8.57 25.77 14.92
LSD(1%) 1.18 1.38 2.43 18.26 11.62 34.98 20.25
F-test ** ** ns ** ** ** **
CV 19.82 1.66 7.55 10.48 12.34 10.82 8.72
*P=0.05, **P=0.01, ns= non significant

608 KARIM et al.
Conclusion
Parents with good positive gca for yield (BIL95), number of
kernels/ear(BIL138and BIL95) and 1000- kernel wt. (BML36andBIL31) and negative gca for days to pollen shedding (BIL95), plant height and ear height
(BML4) may be extensively used in hybridization program as a donor. The better performing three crosses (BIL114 × BIL31, BIL138 × BIL95 and BIL31 ×
BIL95) can be utilized for developing high yielding hybrid varieties as well as for exploiting hybrid vigour.
References
Abdel-Moneam, M.A., A.N. Attia, M.I. El-Emery and E.A. Fayed. 2009. Combining
ability and heterosis for some agronomic traits in crosses of maize.Pakistan J. Biolo.
Sci. 12(5): 433-438.
Ahmed, S., F. Khatun, M.S. Uddin, B.R. Banik and N. A. Ivy. 2008. Combining ability
and heterosis in maize (Zea mays L.).Bangladesh J. Pl. Breed.Genet. 21(2): 27-32.
Ahmad. S.Q., S. Khan, M. Ghaffar and P. Ahmad. 2011. Genetic diversity analysis for
yieldand other parameters in maize (Zea mays L.) genotype. Asian J. Agril. Sci. 3(5):
385-388.
Alam, A.K.M.M., S. Ahmed, M. Begum and M.K. Sultan. 2008. Heterosis and
combining ability for grain yield and its contributing characters in maize.Bangladesh
J. Agril. Res. 33 (3): 375-379.
Amiruzzaman, M. 2010. Exploitation of hybrid vigour from normal and quality protein
maize crosses. Ph.D Dissertation, Dept. Genetics and Plant Breeding, Bangladesh
Agricultural University, Mymensingh, P. 200.
Bangladesh Bureau of Statistics (BBS). Statistical year book of Bangladesh. Statistic
Division, Ministry of Planning, Dhaka, Bangladesh. 2016. P. 92.
Falconer, D.S. 1981.Introduction of quantitative genetics. Agric. Res. Coun. Unit
Amin.Genet., Univ., Edinburg. p
Griffings, B. 1956.Concept of general and specific combining in relation of diallel
crossing systems. Aus. J. Bio. Sci. 9:463-93.
Gurung, D.B., M.L.C. George and Q.D. Delacruz. 2008. Heterosis and combining ability
of Nepalese Yellow maize Populations. Book of Abstracts. The 10th Asian Reg.
Maize Workshop. October 20-23, Makassar, Indonesia. P. 88.
Haluuauer, A.R. 1990. Germplasm sources and breeding strategies for line development
in the 1990’s.Annu. Corn Shorghum Res. Proc. 45: 64-79.
Ivy, N.A. and M.S. Howlader. 2000. Combining ability in maize. Bangladesh J. Agril.
Res. 25: 385-392.
Kadir, M.M. 2010. Development of quality protein maize hybrids and their adaptation in
Bangladesh. PhD Dissertation, Dept. Genetics & Plant Breeding, Bangladesh
Agricultural University, Mymensingh.

COMBINING ABILITY AND HETEROSIS STUDYIN MAIZE INBREDS 609
Malik S.I., H.N. Malik, N.M. Minhas and M. Munir. 2004. General and specific
combining ability studies in maize diallel crosses. Intl. J. of Agric. and Biology. 6(5):
856-859.
Nigussie, M. and H. Zelleke. 2001. Heterosis and combining ability in a diallel among
eight elite maize populations. African J. Crop Sci. 9: 471-479.
Paul, S.K. and R.K. Duara. 1991. Combining ability studies in maize (Zea mays L.). Intl.
J. Tropic. Agric. 9: 250-254.
Roy, N.C., S.U. Ahmed, S.A. Hussain and M.M. Hoque. 1998. Heterosis and combining
ability analysis in maize (Zea mays L.). Bangladesh J. Pl. Breed. Genet. 11: 35-41.
Sharma, S.R., A.S. Khera, B.S. Dhillion and V.V. Malhotra. 1982. Evaluation of S1 lines
of maize crossed in a diallel system. CropImprov. 9(1): 42-47.
Shewangizaw, A. 1983.Heterosis and combining ability in a 7×7 diallel cross of selected
inbred lines of maize (Zea mays L.). M.Sc. thesis, Addis Ababa University, Ethiopia.
Uddin, S.M., F. Khatun, S. Ahmed, M.R. Ali and S.A. Begum. 2006. Heterosis and
combining ability in corn (Zea mays L.). Bangladesh J. Bot. 35: 109-116.
Wilson, N.D., D.E. Eeibel and McNew. 1078. Diallel analysis of grain yield, percent
protein in grain sorghum. Crop Sci. 18: 491-494.
Yan, W. and K. Manjit. 2003. GGE Biplot Analysis. Pp.207-228.

610 KARIM et al.

ISSN 0258-7122 (Print), 2408-8293 (Online)
Bangladesh J. Agril. Res. 43(4): 611-618, December 2018
INFESTATION LEVEL AND POPULATION DYNAMICS OF APHID ON
MUSTARD
E. MANDAL1, M. R. AMIN1, H. RAHMAN1 AND A. M. AKANDA2
Abstract
Mustard (Brassica juncea) variety BARI Shorisha-11 was cultivated during
September 2016 to March 2017 in Gazipur, Bangladesh to find out the
population dynamics of aphid and its infestation level on mustard. The aphid
Lipaphis erysimi (Homoptera: Aphididae) was abundant in the field and caused
infestation. The population of aphid in the mustard field showed fluctuation and
reached to the peak at 22 December which was 289 per plant. Inflorescence had
significantly higher level of infestation compared to individual siliqua and leaf.
The daily mean temperature had significant negative, light intensity had
insignificant negative and relative humidity had insignificant positive correlation
with the abundance of aphid. The multiple linear regression analysis showed that
the weather parameters namely temperature, light intensity and relative humidity
individually as well as combindly contributed on the abundance of aphid, but the
temperature had greater effect than other factors.
Keywords: Abundance, Brassica juncea, infestation, Lipaphis erysimi.
Introduction
Mustard (Brassica spp.) is one of the first domesticated crops which has wide
dispersal, and has been grown as herb in Asia, North Africa and Europe for thousands of years (Oplinger et al., 2016). It ranks world’s third important oil
crop in terms of production and area, and in Bangladesh, it is the first in ranking.
Among the three species of brassica, Brassica napus and Brassica campestris are regarded as rape seed and Brassica juncea is regarded as mustard. Mustard oil is
one of the healthiest edible oils as it has no trans fat, has low saturated fats, high mono-unsaturated and poly-unsaturated fats like omega-3 (Das et al., 2009).
Many insect pests like aphid, sawfly and leaf hopper damage the crop by feeding on leaves, stems, flowers and fruits causing serious yield loss. Aphid Lipaphis
erysimi Kalt. (Homoptera: Aphididae) is the most destructive insect pest of mustard (Das, 2002). It is a cosmopolitan insect and found on both the leaf
surfaces and in leaf folds of developing heads, on leaf stalks, and on leaf axles. They are found primarily on the growing points of the host plants, including tips,
flowers and developing pods and cover the whole plant with high density (Nelson and Rosenheim, 2006). They suck sap from the hosts and infested plants become
stunted and distorted. Their infestation causes wilting, yellowing and stunting of
1Department of Entomology, 2Department of Plant Pathology, Bangabandhu Sheikh
Mujibur Rahman Agricultural University (BSMRAU), Gazipur 1706, Bangladesh.
DOI: http://dx.doi.org/10.3329/bjar.v43i4.39160

612 MANDAL et al.
plants (Khan et al., 2015). The avoidable yield losses at anywhere due to aphid infestation may be 20 to 50%, and it could be as high as 78% (Prasad and
Phadke, 1983). Vekaria and Patel (2000) reported that weather plays an important role on the appearance, multiplication and disappearance of aphid.
Two model studies indicated that temperature was highly linked with the density of aphid or other sucking insects (Zhou et al., 1997; Whittaker and Tribe, 1998).
Bale et al. (2002) reported that increased temperature could decrease growth of some aphid species depending on their thermal requirements and host specificity.
Though aphid has been identified as a major pest of mustard in Bangladesh but information on its infestation and population dynamics in respect of weather
factors are very scanty. In this study infestation level of aphid L. erysimi on
different parts of the mustard (B. juncea) plant BARI Shorisha-11, and the population dynamics of aphid in relation to weather factors namely temperature,
humidity and rainfall were studied under field condition.
Materials and Method
The study was conducted during September 2016 to January 2017 in the Experimental Field of the Department of Entomology, Bangabandhu Sheikh
Mujibur Rahman Agricultural University (BSMRAU), Gazipur. The study site is located at 25°25′ North latitude and 89°5′ East longitude, which is in the middle
of Bangladesh. The study area has subtropical climate having annual mean maximum and minimum temperatures, relative humidity and rainfall of 36.0 and
12.7 oC, 65.8% and 237.6 cm, respectively. The mustard Brassica juncea variety BARI Shorisha11 seeds were collected from Oil Seed Research Center,
Bangladesh Agricultural Research Institute (BARI), Joydebpur, Gazipur. The crop was cultivated following randomized complete block design comprising 4.0
m × 4.0 m plots. The distance between block to block and plot to plot was 60 cm. Mustard seeds were sown on 30 October 2016 in rows. The distance from row to
row was 45 cm and plant to plant was 5 cm. Intercultural operations such as
irrigation and weeding were done whenever necessary. Fertilizers were applied according to Fertilizer Recommendation Guide (N- 40 kg, P- 12 kg, K- 30 kg, S-
9 kg per hectare). After emergence of seedlings, weekly field inspection was carried out to record the data of aphid abundance. At each inspection, three
plants from each plot were randomly selected and the numbers of aphid nymphs and adults per plant were counted. The population of aphid was counted with the
help of a magnifying glass (FD75, Ballon Brand, China). The data of the abundance of aphid were recorded from 28 November to 28 December 2016.
During inspection, the total number of leaves, inflorescence and silique as well as the number of infested leaves, inflorescence and silique of the plants were
counted and percent infestations were calculated. Light intensity in the field during insect collection was measured with a digital light meter (Model 401025,
Extech Instruments Corporation, USA). Data were collected weekly and in between 10.0 and 13.00 h at the canopy area of the plots. Mean daily temperature

APHID POPULATION ON MUSTARD 613
and relative humidity data were collected from the weather station of BSMRAU.
Aphid abundance during the crop growth stages and their infestation levels on leaf, inflorescence and siliqua were analyzed by Chai statistics. The mean
infestation level on leaf, inflorescence and siliqua were analyzed by analysis of variance (ANOVA) followed by Tukey HSD posthoc statistics. Correlation
coefficients were calculated for aphid abundance with meteorological parameters. All the analyses were performed using IBM SPSS 21.1 software.
Results and Discussion
Aphid population in mustard field showed significant variations (χ2 = 506.1, df =
5, p < 0.001) during the crop growth stages (Fig. 1). The population showed an increasing trend from 20 November and reached the peak on 22 December and
again declined on 28 December. The highest mean abundance of aphid per plant
was found on 22 December which was 289 per plant.
Fig. 1. Population dynamics of aphid in mustard field in Gazipur, Bangladesh
during November to December 2016.
The abundance of aphid on mustard crop varies with geographic location and climatic condition of the cropping season. In this study, aphid appearance was
first recorded on 20 November but Shahoo (2012) observed the appearance of aphid in the mustard field of West Bengal, India from last week of December and
1st week of January in the year 2009-10 and 2011-12, respectively, but the aphid abundance reached the peak on 6th week of crop cultivation in both the years.
Infestation of aphid on mustard leaf during the growth stages of the crop showed significant difference (χ2 = 13.3, df = 5, p < 0.001, Fig. 2). Aphid started leaf
infestation from 20 November and it was highest on 14 December. The inflorescence and siliqua infestation was noticed during 01 December to 28
December and in both cases infestation was highest on 7 December. However,

614 MANDAL et al.
the inflorescence infestation did not show significant difference (χ2 = 5.0, df = 4, p = 0.29) but siliqua infestation differed significantly (χ2 = 18.2, df = 4, p < 0.01).
The mean infestation level of leaf, inflorescence and siliqua ranged from 34.1 to 59.3% and the results differed significantly (Fig. 3, F2,13 = 8.4, p < 0.01). Among
the plant parts, inflorescence revealed significantly higher level of infestation compared to leaf and siliqua. In India aphids alone attribute 30-70% losses in
rape seed yield in different agro climatic conditions with an average loss of 52.2% (Roy and Baral, 2002). Under favorable circumstances, aphid population
increase very rapidly by making dense colonies on all parts of plants. In India, aphid has attained the key pest status in mustard because of its prolific
multiplication and severe damage, resulting curling of the leaf, stunting and
drying up of the plants (Rana et al., 2007). In Pakistan, cabbage aphid and mustard aphid are important pests of Brassica (Razaq et al., 2011).
Fig. 2. Infestation level of aphid on different plant parts of mustard during
November to December 2016.
Fig. 3. Mean infestation level of aphid (%mean ± SE) on different plant parts of
mustard. Bars with common letter are not significantly different by Tukey
HSD posthoc statistic at p≤ 0.05.

APHID POPULATION ON MUSTARD 615
Fig. 4. Relationship between temperature and aphid abundance in mustard field
during November to December 2016.
Seasonal variations of the weather factors play a vital role in multiplication, growth, development and distribution of insects, and influence on their population dynamics (Dhaliwal and Arora, 2001). Aphid population build up was regulated by temperature and time and population was relatively short in warm humid climates than in cool climates (Rao et al., 2013). The present study showed that the daily mean temperature had significant negative correlation (Fig. 4: y = 2025 – 91.503x, r = 0.882, F1, 4 = 14.1, p < 0.05), light intensity had insignificant negative correlation (Fig. 5: y = 142.12 - 0.065x, r = 0.055, F1, 4 = 0.012, p = 0.92), relative humidity had insignificant positive correlation (Fig. 6: y = -576.01 + 7.7912x, r = 0.473, F1, 4 = 1.2, p = 0.34) with abundance of aphid. Amin et al. (2017) showed that weather parameters had insignificant effect on the population abundance of aphid on cotton plant in Bangladesh. They also reported that the aphid population started to build up at the end of October when the maximum and minimum temperatures decreased, the relative humidity slightly declined, and there was little rainfall.
Fig. 5. Relationship between light intensity and aphid abundance in mustard field
during November to December 2016.

616 MANDAL et al.
Fig. 6. Relationship between relative humidity and aphid abundance in mustard
field during November to December 2016.
Table 1 showed that temperature individually exerted 77.9 % effect on population abundance of aphid on mustard and the effect was significant. The
temperature with combination of light intensity provided 81.3% abundance, which was not statistically significant. The individual effect of light intensity
demonstrated 3.4% abundance. The combination effect of temperature, light intensity and relative humidity depicted 81.7% abundance and the result was not
statistically significant. The individual effect of humidity was 0.4%. The multiple linear regression analysis showed that the three weather parameters together
contributed on the abundance of mustard aphid, but the temperature had the greater effect than others.
Table 1. Multiple regression models along with coefficients of determination (R2)
regarding the impact of weather parameters on abundance of aphid in
mustard field
Regression equation R2 100 R2
%Role of
individual
factor
F statistic
Y = 2025.07 – 91.50 X1 0.779 77.9 77.9 F1,4= 14.1 P < 0.05
Y = 2194.6 – 94.324 X1 – 0.219X2
0.813 81.3 3.4 F2,3= 6.5 P = 0.08
Y = 2473.2 – 99.71X1 – 0.277X2– 1.546X3
0.817 81.7 0.4 F3,2= 2.98 P = 0.26
Y, insect population /plant; X1, temperature (oC); X2, light intensity(lux); X3, relative
humidity (%).

APHID POPULATION ON MUSTARD 617
Weather factors greatly influenced the population dynamics of insects. A study
by Namni et al. (2016) showed that weather parameters contributed 61.7%
abundance of hopper on mango plant. Dhaliwal et al. (2007) stated that the
incidence, growth and multiplication of mustard aphid are largely influenced by
meteorological parameters like temperature, relative humidity, rainfall, wind
speed and cloudiness.
Ansari et al. (2007) observed that the appearance of mustard aphid on Brassica
germplasm occurred on 11th January at 60 days after sowing and disappeared
after 2nd March at 110 days after sowing. Ansari et al. (2007) also reported that
the peak aphid population was found at a maximum, minimum and average
temperature of 23.37°, 6.87° and 15.76°C, respectively and mean relative
humidity of 54.75% on 10th February at 90 days after sowing. The present
findings showed that the weather factors during November to December
remained conducive for the rapid multiplication of aphid. Moreover, the aphid
population reached peak level coinciding with the flowering stage of the crop
which was similar to those found by Shahoo (2012). However, the present
findings provide information on the seasonal abundance of aphid as well as its
level of infestation on different parts of mustard plant, which might be helpful to
growers to escape the possible time of infestation.
References
Amin, M. R., R. Afrin, M. Z. Alam, M. M. Hossain and Y. J. Kwon. 2017. Effect of leaf
trichomes and meteorological parameters on population dynamics of aphid and jassid
in cotton. Bangladesh J. Agril. Res. 42: 13-25.
Ansari, M. S., H. Barkat and N. A. Qazi. 2007. Influence of abiotic environment on the
population dynamics of mustard aphid, Lipaphis erysimi (Kalt.) on Brassica
germplasm. J. Biol. Sci. 7: 993-996.
Bale, J. S., G. J. Masters, I. D. Hodkinson, C. Awmack, T. M. Bezemer, V. K. Brown, J.
Butterfield, A. Buse, J. C. Coulson, J. Farrar, J. E. G. Good, R. Harrington, S.
Hartley, T. H. Jones, R. L. Lindroth, M. C. Press, I. Symrnioudis, A. D. Watt and J.
B. Whittaker. 2002. Herbivory in global climate change research: direct effects of
rising temperature on insect herbivores. Global Change Biol. 8: 1-16.
Das, B. C. 2002. Ecology and diversity of agricultural crop infesting aphids (Homoptera:
Aphididae). Bangladesh J. Aphidol. 16: 51-57.
Das, M., D. J. Wiley, X. Chen, K. Shah and F. Verde. 2009. The conserved NDR kinase
or b6 controls polarized cell growth by spatial regulation of the small GTPase Cdc42.
Current Biol. 19:1314-1319.
Dhaliwal, G. S. and R. Arora. 2001. Integrated Pest Management Concepts and
Approaches. Kalyani Pulishers, New Delhi, India. pp. 27-60.
Dhaliwal, G. S., A. K. Dhawan and R. Singh. 2007. Biodiversity and ecological
agriculture: issues and perspectives. Indian J. Ecol. 34: 100-109.

618 MANDAL et al.
Khan, I. A., M. Ahmad, R. Akbar, S. Hussain, M. Saeed, A. Farid, R. A. Shah, W. Fayaz,
B. Shah and M. M. U. Din. 2015. Study on Aphids density and yield components of
12 brassica genotypes under field conditions in Peshawar, Pakistan. J. Ent. Zool.
Stud. 3: 11-15.
Namni, S., M. R. Amin, M. R. U. Miah, M. F. Rahman and S. J Suh. 2016. Role of
weather parameters on seasonal abundance of insects in a mango-based agroforestry
in Bangladesh, with particular reference to mango hopper. Bangladesh J. Agril. Res.
42: 197-205.
Nelson E. H. and J. A. Rosenheim. 2006. Encounters between aphids and their predators:
the relative frequencies of disturbance and consumption. Ent. Exp. Appl. 118: 211-
219.
Oplinger, E. S., E. A. Oelke, D. H. Putnam, K. A. Kelling, A. R. Kaminsid, T. M.
Teynor, J. D. Doll and B. R. Durgan. 2016. Mustard: Alternate Field Crops Manual.
Minnesota and Wisconsin Extension Services.
Prasad, S. K. and K. G. Phadke. 1983. Effect of the period of crop exposure to aphid
attack on the yield of brown seeded rapeseed. Indian J. Agril. Sci. 53: 1046-1047.
Rana, M. C., S. S. Rana, S. K. Sharma, S. Kumar and G. D. Sharma. 2007. Influence of
seed soaking with phosphorus, neem and seaweed extract on the productivity of pea
under Lahaul valley conditions of Himachal Pradesh. Himachal J. Agril. Res. 33:
280-281.
Rao, B. B., V. U. M. Rao, L. Nair, Y. G. Prasad, A. P. Ramaraj and C. Chattopadhyay.
2013. Assessing aphid infestation in Indian mustard (Brassica juncea L.) under
present and future climate scenarios. Bangladesh J. Agril. Res. 38: 373-387.
Razaq, M., A. Mehmod, M. Aslam, M. Ismail, M. Afzal and S. A. Shad. 2011. Losses in
yield and yield components caused by aphids to late sown Brassica napus L.,
Brassica juncea L. and Brassica carrinata A. Braunat Multan, Punjab (Pakistan).
Pak. J. Bot. 43: 319-324.
Roy S. K. and K. Baral. 2002. Role of weather parameters on population build up of
mustard aphid, Lipaphis erysimi (Kaltenbach). J. Oilseeds Res. 19: 86-89.
Shahoo, S. K. 2012. Incidence and management of mustard aphid (Lipaphis erysimi
Kaltenbach) in West Bengal. J. Plant Protection Sci. 4: 20-26.
Vekaria, M. V. and G. M. Patel. 2000. Screening of promising Brassica and allied
genotypes for resistance against mustard aphid, Lipaphis erysimi Kalt. (Homoptera:
Aphididae). Appl. Biol. Res. 4: 75-77.
Whittaker, J. B. and N. P. Tribe. 1998. Predicting numbers of an insect (Neophilaenus
lineatus: Homoptera) in a changing climate. J. Anim. Ecol. 67: 987-991.
Zhou, X., J. N. Perry, I. P. Woiwod, R. Harrington, J. S. Bale and S. J. Clark. 1997.
Temperature change and complex dynamics. Oecologia. 112: 543-550.

ISSN 0258-7122 (Print), 2408-8293 (Online)
Bangladesh J. Agril. Res. 43(4): 619-630, December 2018
INTEGRATED MANAGEMENT OF TOBACCO CATERPILLAR AND
CABBAGE BUTTERFLY WITH HOST PLANT RESISTANT AND
ORGANIC AMENDMENT
S. TALUKDER1, M. M. H. KHAN2, J. FERDOUS3 AND M. O. FARUQ4
Abstract
Field study was conducted at Patuakhali Science and Technology University,
Patuakhali during 2013-2014 to know the effect of cabbage variety and organic
agriculture on the damage potential of Spodoptera litura F. and Pieris brassicae
L. Two cabbage varieties viz., Atlas-70 (V1) and Super tropic (V2), and organic
agriculture like, M0 = control, M1 = cowdung @ 6 kgplot-1, M2 = mustard
oilcake @ 750gplot-1, M3 = Vermicompost @ 3 kgplot-1 and M4 = Trichoderma
@ 3 kgplot-1 were included in this study. Treatment combinations were V1M0,
V1M1, V1M2, V1M3, V1M4, V2M0, V2M1, V2M2, V2M3 and V2M4. Results
revealed that the lowest number of infested plants/plot and percent infested
leavesplant-1 were found in variety Super tropic and trichoderma (V2M4) applied
plots followed by variety Atlas-70 and vermicompost (V1M3) applied plots on
different dates of observation while the highest number of infested plantsplot-1
and percent infested leaves plant-1 were in variety Super tropic and mustard oil
cake (V2M2) applied plots followed by variety Atlas-70 and control (V1M0)
applied plots. The highest number and percent (4.00 plot-1) and (20.00% plot-1)
of infested heads were found in variety Super tropic and mustard oil cake
(V2M2) applied plots followed by variety Atlas-70 and control plots (V1M0)
(16.65%). The highest number of healthy heads plot-1 (19.67), healthy head yield
(71.47 t ha-1) and total head yield (72.14 t ha-1) were recorded in variety Super
tropic and Tricoderma (V2M4) applied plots followed by variety Atlas-70 and
vermicompost (V1M3) (70.53 t ha-1) applied plots while the lowest number of
healthy heads per plot, healthy head yield and total head yield were recorded in
in variety Super tropic and mustard oil cake (V2M2) applied plots followed by
variety Atlas-70 and control plots (V1M0).
Keywords: Atlas-70, organic materials, trichoderma, Super tropic, vermicompost.
Introduction
Cabbage (Brassica oleracea L. var. capitata) is one of the most popular vegetables in the world. It is mostly grown in winter throughout Bangladesh. In Bangladesh, the annual production of cabbage is 217 thousand tons (BBS, 2014). The production and yield of cabbage is greatly hampered by many insect pests. Cabbage is also known to be infested by several insect pests viz., tobacco caterpillar, Spodoptera litura (Fab.), cabbage butterfly (Pieris brassicae),
1,2&4Department of Entomology, Patuakhali Science and Technology University, Dumki,
Patuakhali-8602, 3Scientific Officer, Bangladesh Jute Research Institute, Dhaka,
Bangladesh.
DOI: http://dx.doi.org/10.3329/bjar.v43i4.39161

620 TALUKDER et al.
diamond back moth (Plutella xylostella Linnaeus) and cabbage aphid (Brevicoryne brassicae L.). Out of these, cabbage butterfly, diamond back moth and tobacco caterpillar are the most destructive pests causing severe yield loss to cabbage every year (Rao and Lal, 2005; Mahla et al., 2005; Kumar et al., 2007). Tobacco caterpillar is the most destructive insect pest sometimes cause complete failure of the crop. After hatching, the caterpillars start feeding on the under surface of the leaves. Leaves of heavily damaged plants have many feeding holes and sometimes the leaves take a ‘sieve-like’ appearance. It also destroys the leaves of cabbage by making holes in the head and greatly reduces its market value. As a result of feeding, the plants either fail to form compact cabbage heads or produce deformed heads (Uddin et al., 2007).
The indirect effects of fertilization practices acting through changes in the nutrient composition of the crop have been reported to influence plant resistance to many insect pests. Vermicompost are produced through the interactions between earthworms and microorganism in the breakdown of organic wastes and to convert into nutritional rich humus (Sinha et al., 2010). The vermicompost promote growth from 50-100% over conventional compost and 30-40% over chemical fertilizers (Sinha et al., 2010). Crop losses due to insects and diseases are reduced with organic farming (Merrill, 1983). Vermicomposts are rich in humic acid and phenolic compounds. Phenolic compounds act as feeding deterrents and hence significantly influence pest infestation (Mahanil et al., 2008; Bhonwong et al., 2009). Stevenson et al. (1993) reported that inhibition of S. litura development by phenolic compound from the wild groundnut. Meyer (2000) argues that soil nutrient availability not only affects the amount of damage that plants receive from herbivores but also increase the ability of plants to recover from herbivory; however, these two factors are rarely considered together. Describing the effects of soil fertility on both the degree of defoliation and compensation for herbivory for Brassica nigra plants damaged by Pieris rapae caterpillars (Meyer, 2000). Keeping these views in mind, the present study was conducted to evaluate the combine effect of varieties of cabbage and organic agriculture on the damage potential of S. litura and P. brassicae infesting cabbage.
Materials and Methods
The study was conducted at the agricultural farm of Patuakhali Science and Technology University, Dumki, Patuakhali during rabi season of 2013-2014. Two cabbage varieties viz., Atlas-70 (V1) and Super tropic (V2) were included in this study. Organic agricultural components were used as treatments were M0 = control, M1 = cowdung @ 6 kgplot-1, M2 = mustard oilcake @ 750gplot-1, M3 = Vermicompost @ 3 kgplot-1 and M4 = Trichoderma @ 3 kgplot-1. Treatment combinations were V1M0, V1M1, V1M2, V1M3, V1M4, V2M0, V2M1, V2M2, V2M3 and V2M4. Experiment was laid out in randomized complete block design (RCBD) with three replications. The entire field was divided into three blocks and each block was again divided into ten plots. The distance between both

INTEGRATED MANAGEMENT OF TOBACCO CATERPILLAR AND CABBAGE 621
blocks and plots was 1.0 m. The area of each experimental plot was 9 m2. Seeds of the selected cabbage cultivars were sown in the month of November and were transplanted in December. Thirty day-old cabbage seedlings were transplanted in the plot of 9 m2 area with 45cm × 45cm spacing on 29 December, 2013. The chemical fertilizers viz., urea, TSP and MP were applied at the rate of 285, 145 and 218 kgha-1. Fertilizer, irrigation and all other agronomic practices were carried out in the experimental field whenever necessary. Harvesting of cabbage heads were started on 02 February and continued till 28 February 2014. Weekly observations were done since one week of transplanting till maturity of the crop. The number of infested plants plot-1, the number infested leaves plant-1 and infested head were separated carefully and healthy and infested leaves were counted and recorded. After each harvest, the number of healthy and infested heads were sorted, counted and recorded separately. The weight of healthy and infested heads per plot was recorded separately for each treatment replicates. Treatment wise percent head infestation was calculated from the pooled data of ten observations. The total yield of cabbage ha-1 for each treatment was calculated in tons from cucmulative head harvested from a plot. Data were analyzed after appropriate transformation following RCBD using computer MSTAT C and MS excel programs. Means were compared by DMRT.
Results and Discussion
Combined effects of cabbage varieties and organic agriculture on the number of infested plants plot-1 varied significantly on different dates of observations (Table 1). On 8th January, the number of infested plants plot-1 ranged from 1.50 -3.50. The lowest number of infested plants plot-1 was 1.50 for the treatment combination of V2M4 (Super tropic + trichoderma) which was statistically identical to V1M1 (1.50) and V2M1 (1.50). The highest number of infested plant plot-1 was 3.50 for the treatment combination of V2M2 (Super tropic + mustard oil cake) which was statistically similar to V2M0 (Super tropic + control).
On 15 January, the number of infested plants plot-1 ranged from 1.00 to 3.50. The lowest number of infested plants plot-1 was recorded for the treatment combination of V1M3 (var. Atlas + vermicompost) which were statistically similar to V2M4 (Super tropic + trichoderma). The highest number of infested plant plot-1 was for variety Super tropic and mustard oil cake (V2M2) applied plots which were statistically similar to V2M0
(Super tropic and control).
On day 22 June 2014, the number of infested plants plot-1 ranged from 0.50 to 3.00. Significantly the lowest number of infested plants plot-1 was for the treatment combination of V1M3 (Atlas + vermicompost). The higher number of infested plants plot-1 was recorded in V2M1 (Super tropic + cowdung) which was statistically similar to remaining all other treatment combinations.
On 29 January 2014, no significant differences were observed among different treatment combinations in respect of the number of infested plants plot-1 (Table 1).
On 5 February 2014, number of infested plants plot-1 ranged from 0.0 to 3.00. No plant was infested in treatment combinations of V2M4 (Super tropic +

622 TALUKDER et al.
trichoderma) and the lowest number was recorded in V1M4 (0.50) (Atlas + trichoderma) applied plots. The higher number of infested plants/plot was in V1M0 applied plots which was statistically identical to V1M1 (Atlas + cowdung) (3.00) but statistically similar to treatment combinations of V1M0 V1M2 on the same date.
On 12 February 2014, the number of infested plants plot-1 ranged from 2.00 to 6.50. The lowest number of infested plants plot-1 was observed in variety supertropic and trichoderma (V2M4) applied plots which was statistically identical to V1M4 (2.00) and V2M0 (2.00) applied plots. The higher number of infested plants/plot was found in variety Atlas-70 and mustard oil cake (V1M2) applied plots which was statistically similar to V1M1 (5.50) i.e., variety Atlas -70 and cowdung plot followed by V1M0 (5.00) i.e., variety Atlas-70 and untreated control plot (Table 1).
Table 1. Combined effects of cabbage varieties and organic manures on the number
of infested plants plot-1 by S. litura and P. brassicae on different dates of
observations
Treatment
combinations
Number of infested plants plot-1 observed on Average
number of
infested plants plot-1
8 Jan. 15 Jan. 22 Jan. 29 Jan. 05 Feb. 12 Feb.
V1M0 2.50ab 2.50b 1.50b 2.00 3.00a 5.00b 2.75
V1M1 1.50c 2.50b 2.50a 2.50 3.00a 5.50ab 2.92
V1M2 2.00b 2.00c 2.50a 2.00 2.50a 6.50a 2.92
V1M3 2.50ab 1.00d 0.50c 0.50 0.00d 2.50de 1.67
V1M4 2.00b 2.50b 2.50a 1.50 0.50cd 2.00e 1.83
V2M0 3.00a 3.00a 1.50b 1.00 1.00c 2.00e 1.92
V2M1 1.50c 2.50b 3.00a 1.00 2.00b 3.00d 2.17
V2M2 3.50a 3.50a 3.00a 1.50 2.50a 4.00c 3.00
V2M3 2.50ab 2.00c 3.00a 2.00 1.50bc 3.50cd 2.42
V2M4 1.50c 1.50cd 1.00b 0.50 0.00d 2.00e 1.08
LSD 0.502 0.499 0.610 - 0.562 0.611 -
Level of
significance ** ** ** NS ** ** -
CV (%) 4.75 3.80 3.76 6.48 1.65 5.40 -
Values are averages of 3 replications
Means within a column followed by different letters are significantly different from each
other at 5% (*) and 1% (**) level of probability by DMRT
V1=var. Atlas-70; V2 = Super tropic;
M0 = control, M1 = cowdung @ 6 kg plot-1, M2 = mustard oilcake @ 750g plot-1, M3 =
Vermicompost @ 3 kg plot-1 and M4 = Trichoderma @ 3 kg plot-1

INTEGRATED MANAGEMENT OF TOBACCO CATERPILLAR AND CABBAGE 623
On day 8 January 2014, the percentage of infested leaves plant-1 varied from
7.79% to 58.69% but significantly the lowest percenatge of infested leaves plant-1
was recorded in variety Super tropic and trichoderma (V2M4) applied plots and
the highest percentage of infested leaves plant-1 was observed in variety Super
tropic and mustard oil cake (V2M2) applied plots (Table 2).
On 15 January 2014, significantly the lowest percenatge of infested leaves plant-1
(4.17%) was recorded in variety Super tropic and trichoderma (V2M4) applied
plots and the highest percentage of infested leaves plant-1 (66.67%) was observed
in variety Atlas-70 and untreated control plot (V1M0)
On 22 January 2014, the lowest percenatge of infested leaves plant-1 (3.34%) was
recorded in variety Super tropic and trichoderma (V2M4) applied plots which was
statistically similar to V2M3 (3.57%) applied plots. The highest percentage of
infested leaves plant-1 (61.61%) was observed in variety Super tropic and
mustard oil cake (V2M2) applied plots which was statistically similar to V1M0
(58.93%) (Atlas-70 + untreated control plot).
On 29 January 2014, significantly the lowest percenatge of infested leaves plant-1
(4.17%) was obtained in variety Atlas-70 and vermicompost applied plots and the
highest (53.96%) was observed in variety Super tropic and mustard oil cake
(V2M2) applied plots.
On 5 February 2014, significantly the highest percentage of infested leaves plant-
1 (61.67%) was observed in variety super tropic and mustard oil cake (V2M2)
applied plots which differed significantly from all other remaining treatments.
The lowest percenatge of infested leaves plant-1 (3.57%) was recorded in variety
Atlas-70 and trichoderma (V1M4) applied plots (Table 2). No leaf infestation was
observed in variety Atlas-70 and vermicompost (V1M3) (0.00%) and variety
Super tropic and trichoderma (V2M4) (0.00%) applied plots.
On 12 February 2014, the lowest percenatge of infested leaves plant-1 (18.18%)
was recorded in variety Atlas-70 and vermicompost applied plots which was
statistically similar to V1M1 (22.35%). The highest percentage of infested leaves
plant-1 (76.93%) was observed in variety Super tropic and mustard oil cake
(V2M2) applied plots followed by variety Super tropic and cowdung (V2M1)
(62.15%) applied plots (Table 3). No significant differences were observed
among variety Atlas-70 and control plots (V1M0) (55.77%), V1M2 (54.95%) and
V2M0 (51.25%) applied plots (Table 2).

624 TALUKDER et al.
Table 2. Combined effects of cabbage varieties and organic manures on the
percentage of infested leaves plant-1 caused by S. litura and P. brassicae
on different dates of observations
Treatment combinations
Percentage of infested leaves plant-1 on Mean percentage of
infested leaves plant-1
8 Jan. 15 Jan. 22 Jan. 29 Jan. 05 Feb. 12 Feb.
V1M0 51.12b 66.67a 58.93a 46.88b 36.64b 55.77c 52.05
V1M1 31.45d 36.67c 28.57d 36.36c 39.56b 22.35f 32.08
V1M2 40.41c 43.69b 34.88c 39.74c 29.12c 54.95c 40.45
V1M3 12.78f 25.00e 19.23e 4.17g 0.00e 18.18f 13.05
V1M4 17.45e 11.31g 15.11f 17.86e 3.57d 43.34d 17.85
V2M0 36.14c 31.22d 30.77d 34.38cd 36.36b 51.25c 36.47
V2M1 40.36c 42.86b 41.19b 20.83e 38.92b 62.15b 40.78
V2M2 58.69a 46.88b 61.61a 53.96a 61.67a 76.93a 59.45
V2M3 30.19d 17.86f 3.57g 27.09d 39.74b 41.67d 31.07
V2M4 7.79g 4.17h 3.34g 7.69f 0.00e 31.47e 8.59
LSD 4.40 3.84 2.62 3.61 3.12 4.30 -
Level of
significance
** ** * ** * * -
CV (%) 8.52 7.31 4.80 5.90 6.74 5.12 -
Values are averages of 3 replications
Means within a column followed by different letters are significantly different from each
other at 5% (*) and 1% (**) level of probability by DMRT
V1=var. Atlas-70; V2 = Supertropic;
M0 = control, M1 = cowdung @ 6 kg plot-1, M2 = mustard oilcake @ 750g plot-1, M3 =
Vermicompost @ 3 kg plot-1 and M4 = Trichoderma @ 3 kg plot-1
Significantly the highest number of healthy heads plot-1 (19.67) was found in
variety Super tropic and trichoderma (V2M4) applied plots which was statistically similar to V1M3 (19.33) (Atlas-70 + vermicompost). The lowest healthy heads
(16.00) was in variety supertropic and mustard oil cake (V2M2) applied plots which was statistically similar to V1M0 (16.67) (Table 3). On the contrary, the
lowest number of infested heads plot-1 (0.33) was observed in variety Super tropic and trichoderma (V2M4) applied plots which was statistically similar to
V1M3 (0.67) (Atlas-70 + vermicompost) applied plots. The highest number of infested heads per plot (4.00) was found in variety Super tropic and mustard oil
cake (V2M2) applied plots followed by variety Atlas-70 and control plots (V1M0) (3.33) and variety Atlas-70 and mustard oil cake (V1M2) (2.67) applied plots. No

INTEGRATED MANAGEMENT OF TOBACCO CATERPILLAR AND CABBAGE 625
significant differences were observed among variety Atlas -70 and cowdung
(V1M1) (2.33), variety Super tropic and control (V2M0) (2.00), variety Super tropic and cowdung (V2M1) (2.12) and variety supertropic and vermicompost
(V2M3) (1.67) applied plots in respect of number of infested heads per plot. In case of percent head infestation by number, the lowest percent (1.65%) was
recorded in variety Super tropic and trichoderma (V2M4) applied plots followed by V1M3 (3.35%) and V1M4 (6.65%) applied plots. The highest percent (20.00%)
head infestation by number was recorded in variety Super tropic and mustard oil cake (V2M2) applied plots followed by variety Atlas-70 and control plots (V1M0)
(16.65%). No significant difference was observed among variety Atlas -70 and cowdung (V1M1) (11.65%), variety Super tropic and cowdung (V2M1) (10.60%),
variety Super tropic and control (V2M0) (10.00%) in respect of the percentage of
infested heads by number (Table 3).
Table 3. Mean number of healthy and infested head plot-1 and percent head
infestation (by number) caused by S. litura and P. brassicae as
influenced by treatment combinations
Treatment combinations
No. of healthy heads plot-1
No. of infested heads
plot-1
Percent head infestation by
number
V1M0 16.67e 3.33ab 16.65ab
V1M1 17.67cd 2.33cd 11.65cd
V1M2 17.33d 2.67bc 13.35bc
V1M3 19.33ab 0.67f 3.35fg
V1M4 18.67b 1.33e 6.65ef
V2M0 18.00bc 2.00cde 10.00cde
V2M1 17.88bd 2.12cde 10.60cd
V2M2 16.00e 4.00a 20.00a
V2M3 18.33bc 1.67de 8.35de
V2M4 19.67a 0.33f 1.65g
LSD 0.874 0.854 4.472
V1=var. Atlas-70; V2 = Super tropic;
M0 = control, M1 = cowdung @ 6 kg plot-1, M2 = mustard oilcake @ 750g plot-1, M3 =
Vermicompost @ 3 kg plot-1 and M4 = Trichoderma @ 3 kg plot-1
Head yield of cabbage varied significantly among different treatment combinations applied in cabbage field under the present trial. The highest healthy
head yield (71.47 ton ha-1) was recorded in variety Super tropic and trichoderma
(V2M4) applied plots which was statistically similar to V1M3 (69.23 ton ha-1) applied plots but significantly different from all other treatment combinations

626 TALUKDER et al.
while the lowest head yield (50.40 ton ha-1) was recorded in variety Super tropic and mustard oil cake (V2M2) treated plot. However, no significant difference was
observed among variety Super tropic and untreated control (V2M0) (59.20 ton ha-
1) and variety Super tropic and cowdung (V2M1) (58.78 ton ha-1) treated plots in
respect of healthy head yield by weight (Table 4). In contrast, the highest infested head yield (8.11 ton ha-1) was recorded in variety Super tropic plus mustard oil
cake (V2M2) applied plots followed by variety Atlas-70 plus control plots (V1M0) (6.13 ton ha-1). No significant differences were observed among variety Atlas -70
plus cowdung (V1M1) (4.22 ton ha-1), variety Super tropic plus cowdung (V2M1) (4.21 ton ha-1), variety super tropic plus control (V2M0) (4.10 ton ha-1) and
variety super tropic plus vermicompost (V2M3) applied plots in respect of
infested head yield by weight.
Table 4. Mean healthy, infested and total yield of cabbage and percent head
infestation (by weight) caused by S. litura and P. brassicae as influenced
by treatment combinations
Treatment combinations
Head yield (t ha-1) Percent head
infestation by weight Healthy Infested Total
V1M0 53.65ef 6.13b 59.78ef 10.25b
V1M1 57.60d 4.22cd 61.82def 6.83c
V1M2 56.30de 4.37bc 60.67ef 7.20c
V1M3 69.23a 1.30ef 70.53ab 1.84ef
V1M4 64.63b 2.63cde 67.26bc 3.91de
V2M0 59.20cd 4.10cd 63.30cde 6.48c
V2M1 58.78cd 4.21cd 62.99de 6.68c
V2M2 50.40f 8.11a 58.51f 13.86a
V2M3 62.13bc 3.17cd 65.30cd 4.85cd
V2M4 71.47a 0.67f 72.14a 0.93f
LSD 3.614 1.827 4.143 2.512
V1=var. Atlas-70; V2 = Super tropic;
M0 = control, M1 = cowdung @ 6 kg plot-1, M2 = mustard oilcake @ 750g plot-1, M3 =
Vermicompost @ 3 kg plot-1 and M4 = Trichoderma @ 3 kg plot-1
The total head yield was the highest (72.14 ton ha-1) in variety Super tropic and
trichoderma (V2M4) applied plots which was statistically similar to V1M3 (70.53 ton ha-1) applied plots but significantly higher from all other treatment
combinations. On the other hand the lowest total head yield (58.51 ton ha-1) was recorded in variety Super tropic and mustard oil cake (V2M2) applied plots
followed by variety Atlas-70 plus control plots (V1M0) (59.78 ton/ha) which was

INTEGRATED MANAGEMENT OF TOBACCO CATERPILLAR AND CABBAGE 627
statistically similar to V1M2 (60.67 ton ha-1) treated plots. In terms of percent
head infestation by weight, the lowest percent (0.93%) was recorded in variety Super tropic plus trichoderma (V2M4) applied plots followed by V1M3 (1.84%)
treated plots. The highest percent (13.86%) head infestation by weight was recorded in variety Super tropic plus mustard oil cake (V2M2) applied plots
followed by variety Atlas-70 plus control plots (V1M0) (10.25%). No significant difference was observed among variet Atlas-70 plus mustard oil cake (V1M2)
(7.20%), variety Atlas -70 plus cowdung (V1M1) (6.83%), variety Super tropic plus cowdung (V2M1) (6.68%), variety Super tropic plus control (V2M0) (6.48%)
in respect of percent infested heads by weight (Table 4).
From the results of Table 4, it is evident that the healthy head weight and total
head yield of cabbage was increased in variety Super tropic plus trichoderma
(V2M4), and variety Atlas-70 plus vermicompost (V1M3) treated cabbage plots compared to control group and remaining other treatment combinations.
There are many reports highlights the improvement of crop yield by applying vermicompost. Getnet and Raja (2013) observed significant differences in the
growth and development of cabbage and pest infestation level between vermicompost applied and control plants. Uptake of soluble phenolic compounds
from vermicompost, by the plant tissues makes them unpalatable there by affecting the rates of reproduction and survival of pest (Edwards et al., 2010a;
Edwards et al., 2010b). The integration of vermicompost, chemical fertilizer and biofertilizer increased the rice yield by 15.9% over the use of chemical fertilizer
alone (Jeyabal and Kuppusamy, 2001). The garden pea (Pisum sativum) grown by using vermicompost produce higher green pods, higher green grain weight
plant-1 (Meena et al., 2007). In the present study the cabbage plant grown in vermicompost applied plot received all the essential nutrients there by cabbage
head weight was increased significantly compared to untreated control. From the results of the present study, it is evident that the lowest number of infested plant
plot-1 and lowest percentage of infested leaves plant-1 were found in variety Atlas-70 plus varmicompost (V1M3), and variety Super tropic plus trichoderma
(V2M4) applied plots. Likewise, the lowest number of infested heads plot-1 and
lowest percentage of infested head by number and weight, respectively were recoreded for variety Super tropic plus trichoderma (V2M4), and variety Atlas-70
plus vermicompost (V1M3) applied plots. On the other hand, the highest number of healthy heads plot-1, highest yield of healthy head were obtained from variety
Super tropic plus trichoderma (V2M4) applied plots followed by variety Atlas-70 plus vermicompost (V1M3) applied plots. It is assumed that both varieties have
the ability to withstand the infestation caused by S. litura and P. brassicae caterpillars. On the other hand, the levels of the infestation on cabbage and the
yield of cabbage were also influenced by the application of organic fertilizers. Khan (2007) reported that the variety Atlas-70 showed higher susceptibility to
common cutworm in respect of head infestation, it gave higher yield. Khan (2006) reported that the weight of infested and healthy heads varied

628 TALUKDER et al.
insignificantly by the combined effect of variety and nitrogen fertilizer level. He obtained the highest yield from the treatment combination V1N1 (V1= Variety
Atlas-70; N1 = 260kg N ha-1). This might be due to addition of organic amendments that helped in suppressing various insect pests such as European
corn borer (Phelan et al., 1996), other corn insect pests (Birader et al., 1998), aphids and scale insects (Huelsman et al., 2000) and brinjal shoot and fruit borer
(Sudhakar et al., 1998). Several authors reported that the addition of vermicompost decreased the incidence of S. litura, Helicoverpa armigera, leaf
miner (Apoaerema modicella), jassids (Empoasca kerri), aphids (Aphis craccivora) and spider mites on groundnuts (Rao et al., 2001; Rao, 2002; 2003).
Significantly resulted lower number of leaf hoppers and thrips in chilli (Ramesh,
2000) and their damage in field crops. Vermicompost substitution to soil reduced the damage to cabbage seedlings by Myzus persicae and cabbage white
caterpillars (P. brassicae) (Arancon et al. 2005). Plant grown in inorganic fertilizers is more prone to pest attack than those grown on organic fertilizers
(Yardim and Edwards, 2003). Phelan (2004) reported that plant grown with organic fertilizers usually attacked by fewer arthropod pests and can resist pest
attack much better than plants received inorganic fertilizers.
Variety Super tropic of cabbage grown in trichoderma (V2M4), and var. Atlas-70
plus vermicompost (V1M3) applied plots were found to be less infested by S. litura and P. brassicae in respect of number of infested plants plot-1, number and
percent of infested leaves plant-1 on different dates of observation. The highest healthy heads (by number), healthy head yield (by weight) and total head yield
were obtained from combined effect of variety Super tropic plus trichoderma (V2M4) as well as variety Atlas-70 plus vermicompost (V1M3) applied plots while
the lowest healthy heads (by number), healthy head yield (by weight) and total head yield were found from variety Super tropic plus mustard oil cake (V2M2)
applied plots as well as variety Atlas-70 plus control plots (V1M0).
References
Arancon, N. Q., P. A. Galvis and C. A. Edwards. 2005. Suppression of insect pest
populations and damage to plants by vermicomposts. Bioresour Technol. 96:1137-
1142.
BBS. 2014. Staistical Pocket Book Bangladesh, Bangladesh Bureau of Statistics.
Statistics Division, Ministry of Planning, Government of the People’s Republic of
Bangladesh, Dhaka. pp. 384.
Bhonwong, A., M. J. Stout, J. Attajarusit and P. Tantasawat. 2009. Defensive role of
tomato polyphenoloxidases against cotton bollworm (Helicoverpa armigera) and
beet army worm (Spodoptera exigua). J Chem Ecol. 35:28-38
Biradar, A. P., N. D. Sunita, R. G. Teggel and S. B. Devaradavadgi. 1998. Effect of
vermicompost on the incidence of subabul psyllid. Insect- Environ 4:55-56
Edwards, C. A., N. Q. Arancon, M. V. Bennett, A. Askar, G. Keeney and B. Little.
2010a. Suppression of green peach aphid (Myzus persicae) (Sulz.), citrus mealybug

INTEGRATED MANAGEMENT OF TOBACCO CATERPILLAR AND CABBAGE 629
(Planococcus citri) (Risso), and two spotted spider mite (Tetranychus urticae)
(Koch.) attacks on tomatoes and cucumbers by aqueous extracts from
vermicomposts. Crop. Prot. 29:80-93
Edwards, C. A., N. Q. Arancon, M. V. Bennett, A. Askar and G. Keeney. 2010b. Effect
of aqueous extracts from vermicomposts on attacks by cucumber beetles (Acalymna
vittatum) (Fabr.) on cucumbers and tobacco hornworm (Manduca sexta) (L.) on
tomatoes. Pedobiologia. 53:141-148.
Getnet, M. and N. Raja. 2013. Impact of vermicompost on growth and development of
cabbage, Brassica Linn. and their sucking pest, Brevicoryne brassicae Linn.
(Homoptera: Aphididae). Res. J. Environ. Earth Sci. 5(3): 104-112.
Huelsman, M. F., C. A. Edwards, J. L. Lawrence and D. O. Clarke-Harris 2000. A study
of the effect of soil nitrogen levels on the incidence of insect pests and predators in
Jamaican sweet potato (Ipomoea batatus) and Callaloo (Amaranthus). Proc Brighton
Pest Control Conference: Pests and Diseases 8D–13:895-900.
Jeyabal, A. and G. Kuppusamy. 2001. Recycling of organic wastes for the production of
vermicompost and its response in rice–legume cropping system and soil fertility.
Eur. J. Agron. 15(13): 153-170.
Khan, M. M. H. 2006. Influence of variety and nitrogen fertilizer levels on the infestation
of the cabbage caterpillar, Pieris Brassicae (L.) (Lepidoptera: Pieridae). Bangladesh
J. entomol. 16 (2): 91-98.
Khan, M. M. H. 2007. Field evaluation of some cabbage varieties against common
cutworm, Spodoptera litura (F.). J. Bangladesh Agril. Univ. 5 (1): 31-35.
Kumar, P., C. S. Prasad and G. N. Tiwari. 2007. Population intensity of insect pests of
cabbage in relation to weather parameters. Ann. Plant. Protect. Sci. 15: 245-246.
Mahanil, S., J. Attajarusit, M. J. Stout and P. Thipayong. 2008. Over expression of
tomato phenol oxidase increases resistance to the common cutworm. Plant Sci.
174:456-466.
Mahla, R. S., S. Singh and P. Chaudhary. 2005. Management of diamondback moth,
Plutella xylostella (L.) larvae by entomopathogenic fungus, Metarhizium anisopliae.
Indian J. Ent. 67: 342-344.
Meena, R. N., Y. Singh, S. P. Singh, J. P. Singh and K. Singh. 2007. Effect of sources
and level of organic manure on yield, quality and economics of garden pea (Pisum
sativam L.) in eastern uttar pradesh. Vegetable Sci. 34:60-63.
Merrill, M. C. 1983. Eco-agriculture: a review of its history and philosophy. Biol. Agric.
Hort. 1: 181-210.
Meyer, G. A. 2000. Interactive effects of soil fertility and herbivory on Brassica nigra.
Oikos. 22: 433-441.
Phelan, P. L., K. H. Norris and J. F. Mason. 1996. Soil management history and host
preference by Ostrinia nubilatis: evidence for plant mineral balance mediating insect-
plant interactions. Environ. Entom. 25:1329-1336
Phelan, P. L. 2004. Connecting below-ground and above-ground food webs: the role of
organic matter in biological buffering. In: Magadoff F, Well RR (eds) Soil Organic
Matter in sustainable agriculture, CRC Press, Boca Raton. pp 199-226.

630 TALUKDER et al.
Ramesh, P. 2000. Effects of vermicomposts and vermicornposting on damage by sucking
pests to ground nut (Arachis hypogea). Indian J. Agri. Sci. 70:334.
Rao, K. R., P. A. Rao and K. T. Rao. 2001. Influence of fertilizers and manures on the
population of coccinellid beetles and spiders in groundnut ecosystem. Ann. Plant.
Protect. Sci. 9:43-46.
Rao, K. R. 2002. Induce host plant resistance in the management sucking pests of
groundnut. Ann. Plant. Protect. Sci. 10:45-50.
Rao, K. R. 2003. Influence of host plant nutrition on the incidence of Spodoptera litura
and Helicoverpa armigera on groundnuts. Indian J. Entomol. 65:386-392.
Rao, S. R. K. and O. P. Lal. 2005. Seasonal incidence of mustard aphid, Lipaphis erysimi
(Kalt) and diamondback moth, Plutella xylostella (L.) on cabbage. J. Insect Sci.
18(2): 106-110.
Sinha, R. K., S. Agarwal, K. Chaudhan and D. Valani. 2010. The wonders of earthworms
and its vermicomposting in farm production: Charles Darwin’s friends of farmers’,
with potential to replace destructive chemical fertilizers from agriculture. Agri. Sci.
1(2): 76-94.
Stevenson, P. C., J. C. Anderson, W. M. Blaney and M. S. J. Simmonds. 1993.
Development inhibition of Spodoptera litura (Fab.) larvae by a novel caffeoylquinic
acid from the wild groundnut, Arachis paraguariensis (chhod et Hassl.). J. Chem.
Ecol. 19: 2917-2933.
Sudhakar, K., K. C. Punnaiah and P. V. Krishnayya. 1998. Influence of organic and
inorganic fertilizers and certain insecticides on the incidence of shoot and fruit borer,
Leucinodes orbonalis Guen, infesting brinjal. J. Entomol. Res. 22:283-286.
Uddin, M. N., M. M. Hoque, S. M. M. Hossain, S. N. Alam, A. K. M. S. R. Mollik, A. K.
M. Khorsheduzzaman, S. Alam, M. M. Rahman, A. N. M. R. Karim, E. G. Rajotte
and G. C. Luther. 2007. IPM approach for controlling two lepidopteran pests of
cabbage in Bangladesh. Bangladesh J. entomol. 17 (1): 19-29.
Yardim, E. N. and C. A. Edwards. 2003. Effects of organic and synthetic fertilizer
sources on pest and predatory insects associated with tomatoes. Phytoparasitica.
31:324-329.

ISSN 0258-7122 (Print), 2408-8293 (Online)
Bangladesh J. Agril. Res. 43(4): 631-645, December 2018
DESIGN AND DEVELOPMENT OF A POWER GROUNDNUT
SHELLER
M. A. HOQUE1, M. Z. HOSSAIN2 AND M. A. HOSSAIN3
Abstract
In Bangladesh groundnut shelling is done manually which is laborious, time
consuming and costly. Shelling of groundnut pod with the help of mechanical
power can be a probable solution of this problem. A power groundnut sheller
was designed and fabricated in Farm Machinery and Postharvest Process
Engineering (FMPE) Division, Bangladesh Agricultural Research Institute
(BARI), Gazipur during 2011-13. The sheller was made of Mild Steel (MS)
angle bar, MS flat bar, MS rod, MS sheet, MS sieve, rubber pad etc. The
shelling capacities of power groundnut sheller were 110 and 115 kg/h for
Dhaka-1 and BARI Badam-8, respectively. Average breakage of groundnut
kernel was 2% at 7.5% moisture content (wb). The maximum and minimum
unshelled pods were about12.4% and 9.18% for Dhaka -1 and BARI Badam-8,
respectively. The shelling efficiency of the power groundnut sheller for Dhaka-1
and BARI Badam-8 were 86.6 and 88.82% respectively at 11.5% moisture
content (wb). Winnowing efficiency was found to be 99% in the power
groundnut sheller. The use of power groundnut sheller can reduce the cost of
shelling by 76% over the manual groundnut sheller. This power groundnut
sheller is recommended for shelling of groundnut at farm level and small
industry level in Bangladesh.
Keywords: Groundnut, Power Sheller, Design, Fabrication and Performance.
Introduction
In Bangladesh, groundnut (Arachis hypogaea L.) is one of the important crops
which can be cultivated round the year. The total cultivated area of groundnut
was 35,726 ha with the total production of 62,264 t (BBS, 2016). Groundnut is
the sixth most important oilseed crop in the world (Naim et al., 2010). Its world-
wide production is more than 10 million tons per year (Bano and Negi, 2017).
Developing countries constitute 97% of the global area and 94% of the global
production of this crop (FAO, 2011). Groundnut kernel is contained in the pod
which usually grown underground. The pod is harvested by hand or by a hoe.
Sometimes, they are harvested by country plough. Later the pod is washed, dried
and shelled or stored.
Shelling of the pod is laborious, time consuming and cost involving operation.
Traditionally groundnut pods are shelled through manual operation in
1Senior Scientific Officer, 2Scientific Officer and 3Principle Scientific Officer, FMP
Engineering Division, Bangladesh Agricultural Research Institute, Gazipur-1701.
DOI: http://dx.doi.org/10.3329/bjar.v43i4.39162

632 HOQUE et al.
Bangladesh. As a result, the shelling of groundnut pod has constituted a
bottleneck to the large-scale production and processing of the crop. Shelling is
one of the main constraints of groundnut production in Bangladesh. Shelling is
the process of grains subtraction from pod, either by stripping, impact action and
rubbing or any combination of these methods. In Bangladesh, shelling is usually
done by pressing the pod between the thumb and the finger to break off the pods
and release the seed. This method has low efficiency, time consuming, and has
high demand of energy. In addition, the output per-man hour is very low.
Paramawati et al. (2006) noted that quick postharvest handling could reduce the
contamination of aflatoxin on groundnut. When groundnuts are intended to be
used as kernels, the peeling process needs to be conducted rapidly. They also
stated that using machines in postharvest handling, processing of groundnut
makes it free from aflatoxin contamination. Atiku et al. (2004) evaluated a
groundnut sheller and reported that the moisture content, material feed and the
interaction between them had significant effect on the quantity of shelled,
unshelled and partially shelled pods as well as that of damaged seeds. Winnowed
chaffs at 1% level of significance and winnowing efficiencies decreased while
percentage of partially shelled and unshelled pods increased with increase in
moisture content and feed rate. The maximum shelling and winnowing
efficiencies were 80 and 79.5%, respectively at the moisture content of 5% (wb)
over a feed rate of 93.6 kg/h. The Percentage of seed damage increased with
increase in moisture content between 5 and 10% (wb) to a maximum value of
38% and decreased with further increase in moisture content. The broken pods
are susceptible to aflatoxin contamination hence minimum breakage is desirable
(Rahmianna et al., 2015).
A good numbers of groundnut sheller machines are available in the market but
they are large in size, costly and not suitable for domestic applications. They are
suitable for industrial applications where mass production is required (Walke et
al., 2017). In most of the cases the postharvest manual shelling operation of
groundnut is done by women in rural area. BARI has developed a manual
groundnut sheller in 2010-11 (Hoque et al., 2011). Power groundnut sheller was
designed and fabricated executing the recommendation after development of
manual sheller (Hoque et al., 2011). Operation of manual groundnut sheller was
generating human drudgery for which it required 5 minutes rest after every 10-15
minutes operation. The manual sheller was also unable to separate husk from the
grain and also unable to clean the grain from the unshelled groundnut. At present,
there is no power groundnut sheller at farm level in Bangladesh. The
development of small, power sheller have a good scope for shelling of groundnut
at farm level and small-scale processing level. Therefore, this study has been
undertaken to develop a suitable power groundnut sheller for farm level and

DESIGN AND DEVELOPMENT OF A POWER GROUNDNUT SHELLER 633
industrial uses. The machine was designed having the strength and stability of
materials of construction in mind so as to meet up with the required standard.
(Fadele and Aremu, 2016; Pradhan et al., 2010). The main objectives of this
study were to design and development of a power groundnut sheller and to test
the performance of the sheller.
Materials and Methods
Design and fabrication
A power groundnut sheller was designed for shelling about 100 kg groundnut per
hour. The engineering drawing of the sheller was drawn with SolidWorks
Software 2013 (Fig. 1) and fabricated (as shown in Fig. 2) at the workshop of the
Farm Machinery and Postharvest Process Engineering Division of Bangladesh
Agricultural Research Institute, Joydebpur, Gazipur during 2011-2012. It was
made of locally available materials. Mild Steel (MS) angle bar, MS flat bar, MS
rod, MS sheet, MS shaft, rubber pad, ball-bearing, 0.37 kW electric motor and
other small parts were used to fabricate the groundnut sheller. Design and
drawing of various parts are necessary for fabrication of quality machine.
Different parts of the power maize Sheller are described below. The detailed
specification of the groundnut sheller is given in Table 1.
Table 1. Specifications of power groundnut sheller
Item Specification
Length (mm)
Width (mm)
Height (mm)
Weight (kg)
Length of shelling arm (mm)
Concave inner length (mm)
Concave radius (mm)
Rubber pad size (mm)
Sieve size (mm)
Hopper capacity (kg)
Clearance (mm)
Mode of operation
Source of power (kW)
1060
410
1010
74
520
460
260
220 x 60 x 37
10 x 24
8-10
11-13
Power operated
0.37

634 HOQUE et al.
Fig. 1. Orthographic projections (OP) of power groundnut sheller.
3D isometric view Photographic view
Fig. 2. Isometric and photographic views of the power groundnut sheller.

DESIGN AND DEVELOPMENT OF A POWER GROUNDNUT SHELLER 635
1. Hopper: The hopper of the sheller was fabricated with MS sheet. The
sheller hopper was designed to hold 8-10 kg groundnut. Overall dimension of the hopper is 676 x 260 x 235 mm as shown in Fig. 3.
Fig.3. Orthographic projections (OP) of hopper.
Fig.4. OP of pressing component.

636 HOQUE et al.
Fig.5. OP of shelling concave.
Fig.6. OP of blower.
2. Pressing component: A half cylinder rotating pressing component was
fabricated (Fig. 4). Eight pressing arms was uniformly distributed on the peripheral diameter of the cylinder. Soft rubber sheet having zigzag bits
were used for making rubber pad to press on the groundnut. This part

DESIGN AND DEVELOPMENT OF A POWER GROUNDNUT SHELLER 637
was reciprocating within the shelling concave powered by 0.37 kW
electric motor. Clearance between rubber pad and shelling concave can be adjusted using screw.
3. Shelling concave: Half circular threshing concave with 230 mm radius was fabricated with MS sheet and flat bar (Fig. 5). Width of the concave
was 260 mm. The flat bars were uniformly spaced at 11-13 mm interval over the peripheral diameter of the threshing cylinder. Selection of the
opening depends on variety of groundnut.
4. Blower: A blower (Fig. 6) was fabricated with MS sheet which was
operated with the same 0.37 kW electric motor. The speed of the fan was 450 rpm. Due to high velocity air flow, the shelled husk of the groundnut
was separated from the kernel during falling from shelling concave.
Fig.7. OP of cleaning sieve
5. Cleaning sieve: A sieve having 9 mm diameter hole was used for cleaning of the groundnut kernel. The sieve was operated with a cam to
move in the horizontal motion. The dimension of the sieve was 420 x 280 mm as shown in Fig. 7.
Operation Principle
The machine was operated with a single phase electric motor. Unshelled
groundnut pod was fed in the feeding hopper. The sheller was started with a
switch after giving due connection of this sheller with domestic electric line of 220 V of AC power. With the electric motor, the movable threshing pad was
operated within threshing cylinder. The groundnut was inserted in the threshing cylinder and after shelling fell into the sieving tray. The broken husk of

638 HOQUE et al.
groundnut was separated with air blow which was flown from the blower. The shelled grain was separated with the sieve by shaking with a rotating cam.
Experimental Procedure
The length, width and thickness of Dhaka-1 and BARI Badam-8 variety were measured with slide calipers of 0.02 mm accuracy. Randomly selected 50
samples from each variety were taken for the measurement. The length, width and thickness of whole groundnut and kernel were measured. Performance
evaluation of the groundnut sheller was done with replicated experiments during 2012-13 in the laboratory of Farm Machinery and Postharvest Process
Engineering Division, BARI, Gazipur. The performance of the power groundnut
sheller and manual groundnut sheller (Fig. 8) was tested with Dhaka-1 and BARI Badam-8 collected from local market of Gazipur Sadar.
Fig.8. A photographic view of the manual groundnut sheller.
Moisture content of the groundnut was measured by oven dry method drying for
72 hours at 103oC (Koushkaki et al. 2017). Initial moisture content of the groundnut was around 7% which was reduced by oven and then packet in poly
bags. The moisture content of the groundnut during testing was maintained at around 7.50% (wb) since Kushwah et al. (2016) and Oluwole et al. (2007) found
better dehulling efficiency and crackability of groundnut with similar moisture content. Sample size of each batch was 10 kg. The testing was replicated five
times for each variety. The weight of shelled grain, weight of unshelled grain,

DESIGN AND DEVELOPMENT OF A POWER GROUNDNUT SHELLER 639
weight of cracked grain, frequency of oscillation of the shelling pad, time of
operation and moisture content of grain were recorded during testing of the groundnut sheller. Capacity, breakage and efficiency of the groundnut sheller
were calculated. The power groundnut sheller was then tested at two upazilla (Nagarbari and Sujanagar) of Pabna district. The machine was evaluated with
Dhaka-1 and BARI Badam-8 similarly. The following parameters were calculated using the standard formula as given below
i) Shelling capacity, Sc = T
60W2
Where,
Sc = Shelling capacity, kg/h
Ws = Weight of shelled grain, kg
T = Operating time, minutes
ii) Breakage percentage, Br = 100W
W
s
b
Where,
Br = Breakage percentage
Wb = Weight of broken grain, kg
iii) Unshelled grain, Ung = 100W
W
g
u
Where,
Ung = Unshelled grain, %
Wu = Weight of unshelled groundnut, kg
Wg = Weight of total feed, kg
iv) Shelling efficiency, Ws = 100 - Br - Ung
v) Winnowing efficiency, Es = hc
c
WW
W
Where,
Ec = Winnowing efficiency, %
Wc = Weight of cleaned groundnut, kg
Wh = Weight of husk mixed with cleaned kernel, kg

640 HOQUE et al.
vi) Separation efficiency, Es = ut
f
WW
W
Where,
Wf = Weight of the fresh grain in pan, kg
Wt = Weight of total grain in pan, kg
Wu = Weight of unshelled grain in pan, kg
Results and Discussion
The length, width and thickness of pod of Dhaka-1 variety were 20.00±2.72,
11.20±1.24, 10.46±0.99 mm, respectively (Fig. 9). The pod length, width
and thickness of BARI Badam-8 were 23.98±3.20, 12.44±1.09, 11.88±1.20
mm, respectively (Fig. 10). Kernel length, width and thickness of Dhaka-1
and BARI Badam-1 were 13.27±1.55, 8.59±1.02, 8.18±0.99 mm and
11.24±1.13, 8.02±1.09, 7.12±0.83 mm, respectively. Based on pod and
kernel size, the opening of the threshing cylinder sieve was selected as
11mm for which most of the pod of the both variety were threshed with
minimum breakage of grain.
Fig.9. Length (L), width (W) and thickness (T) of some sample of Dhaka-1
groundnut.

DESIGN AND DEVELOPMENT OF A POWER GROUNDNUT SHELLER 641
Fig.10. Length (L), width (W) and thickness (T) of some sample of BARI Badam-8
groundnut.
The developed groundnut sheller was capable to work continuously and facilitate winnowing. Moreover, this can separate unshelled groundnut from the shelled groundnut using same with simple 0.37 kW electric motor. Comparative performance of the power groundnut sheller and manual sheller for Dhaka-1 and BARI Badam-8 is shown in Table 2. It was observed from Table 2 that the shelling capacities of power groundnut sheller were 110 and 114.72 kg/h for Dhaka-1 and BARI Badam-8, respectively whereas 84.50 and 80 kg/h for manual sheller. Similar and even less capacity was found by Atiku et al. (2004). The shelling capacity of the manual sheller was lower than that of power groundnut sheller due to less stroke number per minute. Higher breakage percentages of the manual sheller were observed for both Dhaka-1 and BARI Badam-8 than those of power sheller. It might be due to longer stroke length in manual sheller. Average breakage of groundnut pod was found to be 2% at 11.5% moisture content (wb) in the lab test. The maximum and minimum unshelled percentage in power sheller was found to be12.4% for Dhaka-1 and 9.18% for BARI Badam-8, respectively. Unshelled nuts were found due to less diameters of groundnut than the opening of the shelling sieve (10 mm). Unshelled percentage of the tested power sheller was found more for Dhaka-1 since the diameter of the grain was less than opening of the shelling concave. This unshelling could be reduced by changing shelling concave with less opening. It was also found that the shelling efficiency of the power groundnut sheller for Dhaka-1 and BARI Badam- 8 were 86.6 and 88.82%, respectively at 11.5% moisture content (wb) which is similar with Ugwuoke et al. (2014). Winnowing efficiency of the power groundnut sheller was found to be 99% which was acceptable as reported by (Atiku et al.,

642 HOQUE et al.
2004). Separation of fresh shelled kernel from unshelled groundnut was found from power groundnut sheller and separation efficiency was 97 and 98% for Dhaka-1 and BARI Badam-8 variety, respectively.
Table 2. Comparative performance of the power groundnut sheller and manual
sheller for Dhaka-1 and BARI Badam-8 tested in the laboratory of FMPE
Division, BARI, Gazipur
Parameters Dhaka-1 BARI Badam-8
Power Manual Power Manual
Moisture content (wb, %) 7.50 7.49 7.51 7.52
Weight of sample (kg) 10 10 10 10
Time required, minutes 5.5 7.1 5.23 7.5
Stroke (no/minutes) 100 50 98 43
Shelling capacity (kg/h) 110 84.50 114.72 80
Broken grain (%) 1.00 2.00 2.00 2.00
Unshelled grain (%) 12.40 13.00 9.18 10.85
Shelling efficiency (%) 86.6 85 88.82 87.15
Winnowing efficiency (%) 99 0 99 0
Separation efficiency (%) 97 0 98 0
Performance of power groundnut sheller at Pabna is given in Table 3. Shelling
capacities of the groundnut sheller were found to be 124 and 128 kg/h at Nagarbari and Sujanagar of Pabna district, respectively. Broken grain (4 to 5%)
and unshelled grain (13 to 15%) were more in the field test than those of the laboratory test due to uneven size, non-graded sample and high moisture content
of groundnut samples. Thus, the shelling efficiencies were 83% and 80.0% in Nagarbari and Sujanagar, respectively. Winnowing efficiency was found 100%
in both the locations. However, farmers showed their interest in power operated groundnut sheller for confectionary purposes.
Table 3. Performance of power groundnut sheller for shelling Dhaka-1 groundnut
in Pabna
Parameters Nagarbari Sujanagar
Weight of sample (kg) 85 120
Moisture content, (wb, %) 9.50 9.75
Time required (minutes) 41 56
Stroke (no/minutes) 100 100
Shelling capacity (kg/h) 124 128
Broken grain (%) 04 05
Unshelled grain (%) 13 15
Shelling efficiency (%) 83 80
Winnowing efficiency (%) 100 100

DESIGN AND DEVELOPMENT OF A POWER GROUNDNUT SHELLER 643
Financial analysis
Cost analysis was done after the satisfactory performance evaluation of the power groundnut sheller. Different costs of the power and manual groundnut
shellers are shown in Table 4. The price of the power and manual groundnut sheller was Tk. 25000 and Tk. 7500, respectively. The cost of the groundnut
shelling was 590 Tk/t for power groundnut. On the other hand, shelling, cost by manual groundnut sheller was 2450 Tk/t. Therefore, the use of power groundnut
sheller would reduce the cost of shelling by 76% over the manual groundnut sheller.
Table 4. Different costs of the power and manual groundnut shellers
Sl.
No. Cost factors and items
Costs
Power Manual
1 Price of the groundnut sheller (Tk/unit) 25000 7500
2 Life of the groundnut sheller (Years) 5 5
3 Annual use (Hours) 240 240
4 Annual fixed cost
a) Depreciation (Tk/yr)
b) Interest (12%) (Tk/yr)
c) Repair, maintenance and shelter (Tk/yr)
4500
1375
875
1350
412.5
262.5
Total fixed cost (Tk/yr) 6750 2025
Total fixed cost (Tk/h) 28.13 8.44
5 Operating cost
a) Electricity (Tk/h)
b) Labour for shelling (Tk/h)
c) labour for winnowing (Tk/h)
d) labour for separation of unshelled pods
(Tk/h)
2.16
37.50
0
0
37.50
37.50
112.50
Total operating cost (Tk/h) 39.66 187.50
6 Total cost (Tk/h) 67.79 195.94
8 Shelling cost (Tk/t) 590 2450
Conclusion
The power groundnut sheller was operated without any trouble of the machine.
The shelling capacities of power groundnut sheller were 110 and 115 kg/h for Dhaka-1 and BARI Badam-8, respectively. The maximum breakage of groundnut
was found to be 2% at 11.5% moisture content (wb) in laboratory test at FMPE Division, BARI, Gazipur. The maximum and minimum unshelled percentage in
power sheller was found to be 12.4% for Dhaka-1 and 9.18% for BARI Badam-8, respectively. The shelling efficiency of the power groundnut sheller for Dhaka-1
and BARI Badam-8 were 86.6 and 88.82%, respectively at 7.5% moisture content (wb). Winnowing efficiency was found to be 99% in the power

644 HOQUE et al.
groundnut sheller. Shelling capacities of the groundnut sheller were found to be 124 and 128 kg/h at Nagarbari and Sujanagar of Pabna district, respectively.
Broken grain (4 to 5%) and unshelled grain (13 to 15%) were more in the field test than those of the laboratory test due to uneven size and high moisture content
of groundnut samples. The performance of the groundnut could be improved by feeding uniform sized pods. The use of power groundnut sheller can reduce the
cost of shelling by 76% over the manual groundnut sheller.
Acknowledgement
The authors are highly grateful to Farm Machinery and Postharvest Process Engineering Division, Bangladesh Agricultural Research Institute, Gazipur for
financial and technical support.
References
Atiku, A., N. Aviara and M. Haque. 2004. Performance evaluation of a bambara
groundnut sheller. Agricultural Engineering International: the CIGR Journal of
Scientific Research and Development. Manuscript PM 04 002(4):1-18.
Bano, S. and Y.S. Negi. 2017. Studies on cellulose nano crystals isolated from groundnut
shells, Carbohydrate Polymers. 157: 1041–1049. http://dx.doi.org/10.1016/j.carbpol.
2016.10.069.
BBS, 2016. Statistical Pocket Book. Bangladesh Bureau of Statistics. Peoples Republic
of Bangladesh. Pp. 150.
Fadele, O.K. and A.K. Aremu. 2016. Design, construction and performance evaluation of
a Moringa oleifera seed shelling machine. Engineering in Agriculture, Environment
and Food, 9: 250-256. http://dx.doi.org/10.1016/j.eaef.2016.01.002.
FAO, 2011. Food and Agriculture Organization of the United Nations,
http://www.fao.org/home/en/
Hoque, M.A., M.A. Hossain, M.A. Wohab, M.N. Amin and M.S. Hassan. 2011. Design
and development of manual groundnut sheller. Annual Research Report of Farm
Machinery and Postharvest Process Engineering Division, BARI, Gazipur. Pp. 13-
17.
Ibrahim, U.B.T., H. Ayinde and Dauda Mukhtar. 2013. Socio-economic factors affecting
groundnut production in sabongari local government state, Nigeria. International
Journal of Food and Agricultural Economics. 1(1): 41-48.
Koushkaki, H.R., A.N. Moghadami, D. Zare and G. Karimi 2017. Experimental and
theoretical investigation of hot air-infrared thin layer drying of corn in a fixed and
vibratory bed dryer. Engineering in Agriculture, Environment and Food. 10: 191-
197.
Kushwah, O.S., B.S. Gholap and M. Singh. 2016. Studies on effect of moisture content
on dehulling efficiency of groundnut testa remover for groundnut kernels. Ecology,
Environment and Conservation paper. 22(2): 791-796.
Naim, A.M.E., M.A. Eldouma and A.E. Abdalla. 2010. Effect of weeding frequencies
and plant population on vegetative growth characteristic in groundnut (Arachis

DESIGN AND DEVELOPMENT OF A POWER GROUNDNUT SHELLER 645
hypogaea L.) in North Kordofan of Sudan. International Journal of Applied Biology
and Pharmaceutical Technology. 1(3): 1188-93.
Oluwole, F.A., A.T. Abdulrahim and R.K. Olalere. 2007. Effect of moisture content on
crackability of bambara groundnut using a centrifugal cracker. Int. Agrophysics. 21:
179-184.
Paramawati, R, P. Widodo, U. Budiharti and Handaka. 2006. The role of postharvest
machineries and packaging in minimizing aflatoxin contamination in peanut.
Indonesian Journal of Agricultural Science. 7(1):15-19.
Pradhan, R.C., S.N. Naik, N. Bhatnagar and V.K. Vijay. 2010. Design, development and
testing of hand- operated decorticator for jatropha fruit. Appl. Energy. 87: 762-768.
Rahmianna, A.A., J. Purnomo and E. Yusnawan. 2015. Assessment of groundnut varietal
tolerant to aflatoxin contamination in indonesia. The First International Symposium
on Food and Agro-biodiversity (ISFA 2014). Procedia Food Science. 3 (2015): 330 –
339.
Ugwuoke, I.C., O.J. Okegbile and I.B. Ikechukwu. 2014. Design and fabrication of
groundnut shelling and separating machine. International Journal of Engineering
Science Invention. 3(4): 60-66.
Walke, T., P. Gadge, G. Gohate and R. Banpurkar. 2017. Design and fabrication of
groundnut sheller machine. International Research Journal of Engineering and
Technology (IRJET). 04(03): 1606-1610.

646 HOQUE et al.

ISSN 0258-7122 (Print), 2408-8293 (Online)
Bangladesh J. Agril. Res. 43(4): 647-653, December 2018
FUNCTIONAL AND GROUP ABUNDANCE OF INSECTS ON
EGGPLANT
M. R. AMIN1, M. S. MIAH2, H. RAHMAN3
N. P. NANCY4 AND M. K. A. BHUIYAN5
Abstract
The eggplants (Solanum melongena L.) were cultivated in the field to investigate
the abundance and diversity of insects. In total 488 insects were collected from
the eggplant field during May to August 2016, which belonged to 20 species in
21 families and 10 orders. Among the taxonomic orders, Hemiptera was the
most dominant followed by Coleoptera, Hymenoptera, and Diptera. The order
Thysanoptera revealed the lowest abundance. The abundance, richness and
diversity of pest, predator, pollinator and other categories of insects differed
significantly and the pest revealed the highest abundance and richness compared
to others. In total 9 species of insects belonged to 7 families of 4 orders were
found as pest and their abundance varied from 0.1±0.1 to 4.6±0.9 /30 sweeps. In
total 8 species of insects belonged to 8 families of 7 orders were found as
predator and their abundance varied from 0.3±0.1 to 2.0±0.3/30 sweeps. Among
the predator insects, lady bird beetle showed the highest abundance. In eggplant
field, insects were highest and lowest abundant at 11.00 and 13.00 h of the day,
respectively.
Keywords: Abundance, richness, diversity, pest, predator, pollinator, Solanum melongena.
Introduction
Eggplant is one of the widely grown Solanaceous vegetables incredibly contains
various constituents belonging to the category of the flavenoid, alkaloid, oleic, palmitic and linoleic acids (Yadav et al., 2010). It is extensively cultivated in
Bangladesh throughout the year. But the major constraint to sustainable productivity is the high incidence of insect pests.
Eggplants are infested by a number of pests such as brinjal shoot and fruit borer, aphid, jassid, whitefly, epilachna beetle, leaf hopper etc. Among them brinjal
shoot and fruit borer is the most devastating pest in many parts of the world
which may cause more than 60% loss of yield (Kapoor, 1993). Nayer et al. (1995) reported 53 species of insects pests cause damage to eggplant in India.
Bhadauria et al. (1999) reported that shoot and fruit borer, jassid, aphids, leaf roller and stem borer were the most common pest of eggplant in Madhay
Pradesh, India.
1-4Department of Entomology, 5Department of Plant Pathology, Bangabandhu Sheikh
Mujibur Rahman Agricultural University, Gazipur, Bangladesh.
DOI: http://dx.doi.org/10.3329/bjar.v43i4.39163
648 AMIN et al.
Predator species play significant role in reducing pest population and they are free living organisms in both their immature and adult stages. About 167 families
of 14 orders contain predatory insects. However, the orders Coleoptera, Neuroptera, Hymenoptera, Diptera and Hemiptera provide a very large number
of individuals which frequently control the pest population. The lady bird beetles are well known beneficial arthropods found in many habitats (Ali and Rizvi,
2009). The adults and larvae of lady bird beetles found to be an effective predatory fauna in eggplant ecosystem (Ali et al., 2009). El-Shafie (2001)
reported that Coleoptera had occupied 60 % of the total plant dwelling predators in brinjal agroecosystem in Sudan.
Different categories or species of insects in certain habitat interact among them
for food and shelter, and eventually influence on their abundance, richness and diversity. Vergara and Badano (2009) reported that 12 species of insects are
found as pollinators in eggplant field and they are linked as the functional component of the eggplant ecosystem. Functional diversity is an important
component of diversity which is a common approach to test the effects of diversity on ecosystem. In the present study insect pest, predator and pollinator
abundance and diversity were investigated to find out their functional group status in eggplant ecosystem.
Materials and Method
The study was conducted during March to August 2016 in the Field Laboratory
of the Department of Entomology, Bangabandhu Sheikh Mujibur Rahman Agricultural University (BSMRAU), Gazipur, Bangladesh.
Study location and climatic conditions: The study site is located at 25°25′ North latitude and 89°5′ East longitude, which is in the middle of Bangladesh.
The study area has a subtropical climate having mean maximum and minimum temperatures 36.0 oC and 12.7 oC, respectively, and relative humidity and rainfall
are 65.8% and 237.6 cm, respectively (Amin et al., 2015).
Collection of eggplant seeds and cultivation of crop: Seeds of eggplant namely BARI begun 8 were collected from the Horticulture Research Center, Bangladesh
Agricultural University, Gazipur, Bangladesh and were sown on 2 March 2016 in poly bags. For transplanting seedlings, plots having 4.0 m × 4.0 m followed by
randomized complete block design were used. The spacing between block to block and plot to plot were 60 cm × 60 cm. Eggplant seedlings were transplanted
60 cm apart on 21 March 2016, in rows. The distance from row to row was 60 cm. Each plot has five rows and each row contained 5 plants. Fertilizers were
applied according to Fertilizer Recommendation Guide (N- 78 kg, P- 36 kg, K- 66 kg, S- 17 kg per hectare). Intercultural operations such as irrigation and
weeding were done whenever necessary.

FUNCTIONAL AND GROUP ABUNDANCE OF INSECTS ON EGGPLANT 649
Insect collection and identification: Free-living insects were collected from
flower initiation to fruit maturation stage using a 30 cm diameter sweep net having 1.5 mm mesh, and attached with a 2 m long rod. Every week sweeping
was done in between 09.00 to 11.00 am, and each sample was consisted of 30 sweeps covering an area from ground level to the top of the trees. The collected
insects were brought to the Entomology Laboratory of BSMRAU for identification and counting. They were killed by storage in a freezer for a few
hours, mounted on points, dried and morphotyped. Insects were identified to species or genus level and also was separated as pest, predator, pollinator and
other categories. Identified specimens were deposited in the insect museum of BSMRAU.
Observation of insect abundance and foraging behavior of pollinators: Peak
foraging time of the frequently abundant insect species was observed. To find out peak foraging time, weekly collection was conducted at 7.0 h, 9.0 h, 11.0 h and
13.0 h in a day, and number of insects per sample were counted. The insects collected at 11.0 am were grouped as pest, predator, pollinator and other
category. Landing duration of the pollinators on eggplant flowers were measured using a stop watch. Observations were done in between 10:00 to 11:30 am and
data were recorded 7 times for each species.
Statistical analysis: One way analysis of variance (ANOVA) followed by Tukey
HSD posthoc test was employed for analyzing richness (total number of species), abundance (total number of individuals), diversity (Simpson Index of Diversity),
abundance of pest and predator, and distribution of the insects. Diversity was calculated following the formula of Simpson (1949). Chi statistics was applied to
find out significant difference in percent of insects among various orders. All the analyses were performed using IBM SPSS 21.0. (IBM SPSS statistics 21,
Georgia, USA).
Results and Discussion
In the present study, in total 488 insects were collected from the eggplant field. The collected insects belonged to 20 species of 21 families and 10 orders. The
percent of insects in different taxonomic orders varied from 0.4 to 33.6 (Fig. 1).
Among the taxonomic orders, Hemiptera(33.6) was the most dominant followed by Coleoptera (28.3%), Hymenoptera (12.7%), Diptera (8.8%), Lepidoptera
(7.6%), Odonata (2.6%) and Dermaptera (2.5%). Other orders namely Orthoptera (2%), Dictyoptera (1.2%) and Thysanoptera (0.4%) showed very lower
percentages of abundance.
Table 1 showed that the abundance, richness, and diversity of pest, predator,
pollinator and other categories of insects varied from 5.2±0.6 to 14.4±1.1, 1.5±0.1 to 5.0±0.2, 0.2±0.03 to 5.0±0.2 /30 sweeps, respectively and the results
differed significantly (abundance: F3,80=39.1, P < 0.001; richness: F3,80=43.3, P < 0.001; diversity: F3,80= 3.9, P<0.01). The abundance and richness of insect pest

650 AMIN et al.
was higher compared to predator, pollinator and other categories. The insects in other categories revealed the lowest abundance, richness but showed highest
diversity.
Fig. 1. Insects (%) belong to different taxonomic orders found in the eggplant field
Fig. 2. Distribution of insect counts (mean ± SE) in eggplant field during full
blooming period. Bars with common letter(s) are not significantly different
by Tukey HSD posthoc statistic at P < 0.05.

FUNCTIONAL AND GROUP ABUNDANCE OF INSECTS ON EGGPLANT 651
Klein et al. (2007) reported the abundance, richness and diversity of insect pest,
predator and pollinators and found significant variations. Insect species in eggplant field in different climatic and habitat conditions varied significantly.
Vergara and Badano (2008) reported the richness of pollinator species in eggplant field and found the highest richness in rustic shaded site followed by
commercial poly culture sites, and the lowest species richness was recorded in the specialized shaded plantations
Table 1. Average abundance, richness and diversity of insects in eggplant field
Insect Pests Predators Pollinators Others
Abundance 14.4±1.1 a 5.8±0.6 b 5.4±0.5 b 5.2±0.6b
Richness 5.0±0.2 a 3.4±0.3 b 3.7±0.3 b 1.5±0.1 c
Diversity 0.4±0.2 ab 0.2±0.04b 0.2±0.03 b 5.0±0.2 a
Data expressed as mean ± SE. Means per insect group are taken from 30 sweeps per total
collection. Means within a row followed by same letter(s) are not significantly different by Tukey HSD posthoc statistic at < 0.05.
Table 2. Insect pests along with their abundance in eggplant field
Pest Taxonomic profile Abundance
Epilachna beetle Epilachna dodecastigma (Coleoptera:Coccinellidae) 4.6±0.9 a
Jassid Amrasca biguttula (Hemiptera:Cicadellidae) 4.6±0.4 a
White fly Bemisia tabaci (Hemiptera:Aleurodidae) 2.6±0.2 b
Shoot and fruit borer Leucinodes orbonalis (Lepidoptera: Pyralidae) 1.0±0.2 bc
Rice bug Leptocorisa acuta (Hemiptera:Coriedae) 0.2±0.1c
Aphid Aphis gossypii (Hemiptera: Aphididae) 0.9±0.2c
Thrips Thrips hawaiiensis (Thysanoptera: Thripidae) 0.1±0.1 c
Leaf hopper Amrasca devastans (Hemiptera: Cicadellidae) 0.3±0.1 c
Data expressed as mean ± SE. Mean of each pest was taken from 30 sweeps per total
collection. Means in the column followed by same letter(s) are not significantly different by Tukey HSD posthoc statistic at < 0.05.
In total, 9 species of insects belonged to 7 families of 4 orders (Coleoptera,
Lepidoptera, Hemiptera and Thysanoptera) were found as pest (Table 2). Their abundance varied from 0.1±0.1 to 4.6±0.9 /30 sweeps and the results differed
significantly (F7, 160 = 24.2, p < 0.001). Among the pest insects, epilachna beetle showed the highest abundance while thrips showed the lowest abundance. In
India, 53 species of insects were reported as pest of eggplant of which shoot and fruit borer was the most destructive (Nayer et al., 1995). Aganon et al. (1997)
reported that shoot and fruit borer, jassid (leaf hopper) and thrips (Thrips tabaci) were the common pests of brinjal in the field. Several researchers reported the
severity of attack of jassid and white fly in brinjal (Bhadauria et al., 1999, Alam et al., 2004).

652 AMIN et al.
Table 3. Insect predators along with their abundance in eggplant field
Predator Taxonomic profile Abundance
Preying mantid Mantis regiosa (Dictyoptera:Mantidae) 0.3±0.1 c
Dragon fly Aeshna verticalis (Odonata:Aeshnidae) 0. 3±0.1 c
Short horn
grasshopper
Oxya velox(Orthoptera: Acrididae) 0.5±0.1 c
Ichneumonid wasp Megarhyssa macrurus(Hymenoptera :Ichneumonidae)
0.4±0.2c
Ant Formica rubra (Hymenoptera:Formicidae) 1.3±0.2 ab
Lady bird beetle
Coccinella septempunctata
(Coleoptera:Coccinellidae)
Coccinella transversalis (Coleoptera:Coccinellidae)
2.0±0.3 a
-
Earwig Forficula auricularia(Dermaptera :Forficulidae) 0.6±0.1bc
Damselfly Coenagrion puella (Odonata :Coenagrionidae) 0.3±0.1c
Data expressed as mean ± SE. Mean of each pest was taken from 30 sweeps per total
collection. Means in the column followed by same letter(s) are not significantly different by Tukey HSD posthoc statistic at < 0.05.
In total, 8 species of insects belonged to 8 families of 7 orders (Dictyoptera,
Odonata, Orthoptera, Hymenoptera, Coleoptera, Dermaptera, Odonata) were found as predator (Table 3). Their abundance varied from 0.3±0.1 to 2.0±0.3/30
sweeps and the results differed significantly (F7, 160 = 12.1, p < 0.001). Among the predator insects, lady bird beetle showed the highest abundance, while preying
mantid, dragon fly, damselfly, short horned grasshopper and ichneumonid wasp showed the lowest and statistically similar abundance. Latif et al. (2009) reported
that predaceous arthropods in brinjal field were grouped in 10 families under 7 taxonomic orders of which Coleoptera was the most important which occupied
42.4% of the total predators under 3 different families such as Coccinellidae, Carabidae and Staphylinidae. The plant dwelling insects in the brinjal field of
Bangladesh other than Coleoptera were Hymenoptera, Hemiptera, Neuroptera, Diptera and Dictyoptera which contributed 27.3% of the total arthropods (Latif et
al., 2009).
References
Aganon, T. M., M. G. Patricio, J. I. Calderon, J. S. Soriano and M. L. J. Sison. 1997.
Development of vegetable IPM program in a rice-based cropping systems. Kasetsart
J. Natl. Sci. 32: 32-36.
Alam, S. N., G. J. U. Ahmed, A. K. M. Khorseduzzaman, A. N. M. R. Karim and E. G.
Rajotte. 2004. Survey of vegetable insect pests in rice-vegetable cropping system in
Bangladesh. Annual Research Report. 2003-2004. Entomology Division, Bangladesh
Agricultural Research Institute, Joydebpur, Gazipur, Bangladesh. PP. 44-46.

FUNCTIONAL AND GROUP ABUNDANCE OF INSECTS ON EGGPLANT 653
Ali, A. and P. Q. Rizvi. 2009. Life table studies of Menochilus sexmaculatus Fabr.
(Coleoptera: Coccinellidae) at varying temperature on Lipaphis erysimi Kalt. World
Appl. Sci. J. 7: 897-901.
Amin, M. R., S. Namni, M. R. U. Miah, M. G. Miah, M. Zakaria, S. J. Suh and Y. J.
Kwon. 2015. Insect inventories in a mango-based agroforestry area in Bangladesh:
foraging behavior and performance of pollinators on fruit set. Ent. Res. 45: 217-224.
Bhadauria, N. K. S., N. S. Bhadauria and S. S. Jakmola. 1999. Insect pest complex of
brinjal, Solanum melongena Linn. In north-west Madhya Pradesh. Adv. Plant Sci.
12: 607-608.
El-Shafie, H. A. F. 2001. The use of neem products for sustainable management of
homopterous key pests on potato and eggplant in the Sudan. Ph. D. Thesis,
University of Giessen, Germany.
Kapoor ,V. C. 1993. Indian Fruit Flies. Oxford and IBH Publishing Co. Ltd. New Delhi,
India. pp. 228-277.
Klein, A. M., B. E. Vaissiere, J. H. Cane, I. Steffan-Dewenter, S. A. Cunningham, C.
Kremen and T. Tscharntke. 2007. Importance of pollinators in changing landscapes
for world crops. Proc. Royal Soc. Lond. B Biol. Sci. 274: 303-313.
Latif, M. A., M. M. Rahman, M. R. Islam and M. M. Nuruddin. 2009. Survey of
arthropod biodiversity in the brinjal field. J. Entomol. 6: 28-34.
Nayar, K. K., T. N. Ananthakrishnan and B. V. David. 1995. General and Applied
Enotmology. 11th edn. Tata MeGraw-Hill Publ. Co. Ltd. 4/12, Asaf Ali Road, New
Delhi-110002. pp. 557.
Simpson, E. H. 1949. Measurement of diversity. Nature. 163, 688.
Vergara, H. C. and E. I. Badano. 2009. Pollinator diversity increases fruit production in
Mexican coffee plantations: The importance of rustic management systems. Agric.
Ecosyst. Environ. 129: 117-123.
Yadav, M., S. Jain, R. Tomar, G.B. Prasad and H. Yadav. 2010. Medicinal and biological
potential of eggplant: an updated review. Nature. 23: 184-190.

654 AMIN et al.

ISSN 0258-7122 (Print), 2408-8293 (Online)
Bangladesh J. Agril. Res. 43(4): 655-668, December 2018
SOIL SALINITY MANAGEMENT FOR INCREASING POTATO YIELD
IN THE COASTAL AREA OF SOUTHERN BANGLADESH
M.S. ISLAM1, H. SAIF2, M. R. ISLAM3, Q. NAHER4
AND A. S. M. M. R. KHAN5
Abstract
The study was conducted at farmers’ field of Charfashion upazila in Bhola
district under AEZ-18 during the Rabi season of 2015-2016 and 2016-2017 to
find out suitable soil salinity management practice(s) for maximizing potato
yield as well as farmers’ income. Two planting systems viz. raised bed and flat
land, and four management systems with fertilizers and mulching were
considered in a factorial experiment. The rate of increase in soil salinity in raised
beds was significantly lower than that of flat land. On an average, raised bed
planting produced 13.04% higher tuber yield than flat land planting. The
combination of raised bed + recommended fertilizer (RF) with cowdung @ 5 t
ha-1 as IPNS+ straw mulch (@ 3.5 t ha-1) produced the highest tuber yield in
both the years (average 21.66 t ha-1) and it was 75.10% higher than flat planting
system with no mulch. This treatment combination also provided the highest
average gross margin (Tk. 115945 ha-1) and BCR (2.26). Besides, combination
of raised bed + RF+25% K+ straw mulch provided average tuber yield (20.91 t
ha-1), gross margin (Tk. 110969 ha-1) and BCR (2.25), which were very close to
above treatment combination. The lowest average potato yield (12.51 t ha-1),
gross margin (Tk. 39835 ha-1) and BCR (1.50) were obtained from combination
of flat land planting + RF +no mulching. So, combination of raised bed +
mulching+ RF along with IPNS basis cowdung @ 5 tha-1 or 25% extra K can
help minimize soil salinity and produce significantly higher potato yield in the
coastal areas.
Keywords: Coastal area, soil salinity, raised bed, flat land, mulching, potato
Introduction
Soil salinity is one of the major environmental hazards to global agriculture (Zhang et al., 2007).The saline area in Bangladesh is about 0.83 million hectares
and presently estimated that it has increased up to 1.2 m ha (Islam et al.,
2008).The coastal area of the country constitutes about 20% of the country of which about 53% are affected by different degrees of salinity (Haque, 2006). Soil
salinity in Bangladesh is a seasonal problem that affects crop production severely in the saline belt during rabi season whereas in Kharif-II season soil
salinity reaches about neutral and does not affect crop production (Khan et al.,
1Senior Scientific Officer, On-Farm Research Division (OFRD), Bangladesh Agricultural
Research Institute (BARI), Bhola, 2Scientific Officer, Planning and Evaluation Wing,
BARI, Gazipur; 3Chief Scientific Officer, 4Senior Scientific Officer, 5Chief Scientific
Officer & Head, OFRD, BARI, Gazipur, Bangladesh.
DOI: http://dx.doi.org/10.3329/bjar.v43i4.39164

656 ISLAM et al.
2008). Soil salinity affects crop growth, yield and quality (Razzouk and Whittington, 1991; Dong et al., 2008). The salinity causes unfavorable
environment and hydrological situation restricting the normal crop production throughout the year (Amin et al., 2008) and very few crops/cultivars could
survive or produce economic yield in severe soil salinity environment (Shrivastava and Kumar, 2015). The severity of soil salinity problem in the
coastal areas of Bangladesh increases with the desiccation of the soil (Haque, 2006). It affects crops depending on degree of salinity at the critical stages of
growth, which reduces yield and in severe cases total yield loss (Rasel et al., 2013). The dominant crop grown in the saline areas is local T.Aman rice (Var.
Sadamota, Rajashail, Kajalshail, Lalmota, etc.) and yield is comparatively lower
than high yielding modern varieties. The main cropping pattern practiced in coastal areas is Fallow-Fallow-T.Aman rice. Late harvest of T.Aman rice (up to
the first week of January) and delay receding of tidal flood water are the main causes of fallow land in this region. That is why about 40-45% and 30-35% of
lands remain fallow in rabi and kharif-1 seasons, respectively in southern region (Rafiquzzaman et al., 2010). The increasing pressure of growing population in
the country demand more food. That is why it has become imperative to explore the possibilities of increasing productivity in saline areas through proper
management practices.
Raised bed planting for row-spaced crops in many parts of the world is gaining
importance (Sayre, 2007). It can save 25–30% irrigation water, increasing water use efficiency (Hassan et al., 2005; Malik et al., 2005; Choudhary et al., 2008;
Ahmad et al., 2009) and providing better opportunities to leach salts from the furrows (Bakker et al., 2010). Under saline conditions, increased salt
accumulation on top of the bed has also been reported by Choudhary et al. (2008) due to the upward movement of salts through capillary rise in response to
evaporation gradients. Mulching is one the effective and promising management
practices to reduce dry season salinity and conserve moisture in plant root zone, as it can decrease soil water evaporation, increase infiltration and regulate soil
water and salt movement (Huang et al., 2001; Deng et al., 2003; Qiao et al., 2006; Devkota et al., 2015).It can reduce up to 30% salinity increase as
compared to normal flat system with no mulch (BARI, 2008). Besides, potash fertilizer has an added advantage for controlling the soil salinity. It reduces
sodium uptake by plants and of course increases potassium uptake. Thus potassium fertilization protects crops from harmful effects of sodium (Haque,
2006). Potato is mainly used as a vegetable in Bangladesh and grown all over the country. Bhola district is an important area for potato production among the
coastal areas of Bangladesh. About 5660 ha land in Bhola district was under potato cultivation in 2014-2015, of which a major portion was under saline
environment (DAE, 2014). As potato is cultivated in Rabi season, it provides very poor yields in saline coastal areas compared to its potential as soil salinity
reaches to maximum during rabi season. Cultivation of potato in Rabi season

SOIL SALINITY MANAGEMENT FOR INCREASING POTATO YIELD 657
with improved management practices including mulching could increase tuber
yield significantly compared to traditional method under saline ecosystem. Thus the experiment was undertaken to find out improved management practices to
reduce the adverse effect of soil salinity for maximizing yield of potato as well as farmers’ income in coastal areas of Bhola district.
Materials and Methods
The experiment was conducted at farmers’ field of Charfashion upazila under
Bhola district under AEZ-18 in the rabi season of 2015-2016 and 2016-2017. The land type was medium highland with soil salinity 2.43 and 2.16 dSm-1 at the
time of planting in 2015-2016 and 2016-2017, respectively. The treatments comprise of planting method P1: Raised bed and P2: Flat land and four
management practices, viz., M1: recommended fertilizer (RF) for potato
production, M2: RF + straw mulch (3.5 t ha-1), M3: RF + 25% K + straw mulch (3.5 t ha-1) and M4: RF with cowdung @ 5 t ha-1in IPNS + straw mulch (3.5 t ha-
1). Potato variety was BARI Alu-7 (Diamant) and sowing date was 30 November 2015 and 05 December 2016, respectively. The experiment was laid out in
factorial randomized complete block (RCB) design with six replications. Unit plot size was 4 m × 5 m. Recommended fertilizers (RF) for potato was 115-30-
125-19-3.5-1.7 N-P-K-S-Zn-B kgha-1 (FRG, 2012). Raised beds were made at the time of potato planting and beds were covered with rice straw (3.5 t ha-1) mulch
just after planting. Whole tuber of ‘A’ grade was planted at a spacing of 60 cm × 25 cm. Hand weeding was done twice at 20 and 45 days after planting. Furadan
(Carbofuran) 5G @ 20 kg ha-1 was applied at the time of final land preparation for controlling cut warm. Single light irrigation was done at 38 days after
planting. Secure @ 2g Lit-1 water was sprayed twice at 52 and 63 days after planting as a preventive measure against late blight infestation due to foggy
weather. Soil salinity of the experimental plots was recorded at 15 days interval from planting to harvest of potato. It started on 30 November and ended on 01
March both the years. Soil samples were also collected before planting and after harvest of potato to determine the nutrient status of the experimental plots’ soil.
Harvesting was done on 20 March 2016 and 23 March 2017. Yield and yield
components data of potato and cost of all inputs and operations were recorded. Economic performance was also calculated. Data were analyzed following the
computer program MSTAT-C (Freed, 1985).
Results and Discussion
Effect of planting systems
Tubers plant-1 and tuber yield differed significantly due to different planting
system in both the years (Table 1). Though all yield contributing characters did not differ significantly, their cumulative effect contributed higher tuber yield in
raised bed system than normal flat system potato planting. The highest tuber

658 ISLAM et al.
yield of 18.28 t ha-1 in 2015-2016 and 19.19 t ha-1 in 2016-2017 was found in raised bed planting system. Raised bed and at the same time mulching reduced
soil salinity considerably (BARI, 2008; Bashar et al., 2014). Similar results were also reported by Muromota et al. (1991). The lowest tuber yield (15.98 t/ha and
17.16 t/ha, respectively in 2015-16 and 2016-17) was obtained from flat land planting because of lower number of tubers per plant and lower number of plants
per sq. meter. Higher level of soil salinity in flat land system compared to raise bed system might have affected plant growth and yield of potato. On an average,
raised bed increased potato yield by 13.04% compared to flat system.
Table 1. Tuber yield and yield attributes of potato under different planting systems
in saline soil at Charfashion, Bhola during 2015-2016 and 2016-2017
Treatment Plant height
(cm)
Plants m-2
(No.)
Tubers plant-1
(No.)
Individual tuber wt. (g)
Tuber yield
(t ha-1)
2015-2016
Raised bed (P1)
40.95 6.91 5.92 45.15 18.28
Flat land (P2) 39.9 6.72 5.31 46.37 15.98
T-test NS NS 3.86 NS 4.39
2016-2017
Raised bed (P1) 42.9 7.01 6.00 45.22 19.19
Flat land (P2) 42.3 6.65 5.60 47.13 17.16
T-test NS NS 2.82 NS 5.14
Mean
Raised bed (P1) 41.9 6.96 5.96 45.19 18.73
Flat land (P2) 41.1 6.69 5.46 46.75 16.57
P1: Raised bed, P2: Flat system, NS= non-significant
Effect of management practices
Management practices i.e. fertilizers and mulching influenced plant height,
individual tuber weight and tuber yield significantly in both the years while number of tubers plant-1 only in 2015-2016 (Table 2). The highest plant height
(42.5 cm) in 2015-2016 was recorded in M4 (recommended fertilizers + cowdung 5.0 t ha-1 in IPNS + straw mulch) and similar trend was recorded in 2016-2017
but M4 and M3 treatments at par in 2016-2017. Individual tuber weight was maximum in M3 that was statistically identical to M4 in 2015-2016 but
insignificant in 2016-2017. Numerically higher number of plants m-2 was

SOIL SALINITY MANAGEMENT FOR INCREASING POTATO YIELD 659
observed in all treatments having mulch than that of non-mulched treatment
(M1). Mulching reduced increase in soil salinity (Table 6, Table 7 and Table 8) that might have facilitated better crop stands establishment. Thus mulching along
with 25% extra K or cowdung @5 t ha-1 contributed to higher no. of tubers plant-1 and individual tuber weight in treatment M3 and M4, respectively. Although all
yield contributing characters did not differ significantly, their cumulative effect made difference in tuber yield in different management practices. The maximum
tuber yield (19.92 and 21.22 t ha-1 in 2015-2016 and 2016-2017, respectively) was obtained from Recommended fertilizer + cowdung 5 t ha-1in IPNS + straw
mulch (M4 treatment) which was statistically similar to M3: Recommended fertilizer + 25% extra K + straw mulch practices (19.39 and 20.39 t ha-1 in 2015-
2016 and 2016-2017, respectively). These results were obtained might be due to
the cumulative effect of higher number of tubers plant-1 and individual tuber wt. Moreover, reason might be such that cowdung retained moisture in the soil for
longer period that reduced soil salinity and ultimately increased tuber yield. Bezborodov et al. (2010) reported an approximately 20% increase in surface soil
salinity of the non-mulch treatments compared to a surface mulching with 1.5 t ha1 wheat residues under conventional tillage. Maintaining a higher K+/Na+ ratio
by applying potassium in saline soils helps in plant growth and yield (Tanji and Kielen, 2002; Takahashi et al., 2007; Peter et al., 2010; Yue et al., 2012).
Table 2. Tuber yield and yield attributes of potato under different management
practices in saline soil condition at Charfashion, Bhola in 2015-2016 and
2016-17
Treatment Plant height
(cm)
Plants m-2
(No.)
Tubers plant-1
(No.)
Individual
tuber wt. (g)
Tuber yield
(t ha-1)
2015-2016
M1 37.7c 6.56 5.14c 40.96c 13.06c
M2 40.5b 6.84 5.48b 44.20b 16.15b
M3 41.3b 6.84 5.82a 49.28a 19.39a
M4 45.2a 7.02 6.02a 48.62a 19.92a
CV (%) 7.44 6.19 7.69 10.12 11.03
LSD0.05 3.6 NS 0.31 3.28 1.92
2016-2017
M1 38.2c 6.50 5.72 40.48c 14.09c
M2 42.4b 6.94 5.57 45.06b 17.00b
M3 43.3ab 6.83 5.85 49.56a 20.39a
M4 46.5a 7.06 6.07 49.61a 21.22a

660 ISLAM et al.
CV (%) 9.08 8.65 10.04 5.74 10.76
LSD0.05 4.0 NS NS 4.46 2.08
Mean (Pooled)
M1 38.0c 6.53 5.43 40.72b 13.58c
M2 41.4b 6.89 5.52 44.63b 16.58b
M3 42.3ab 6.84 5.83 49.42a 19.89a
M4 45.8a 7.04 6.05 49.12a 20.57a
CV (%) 8.20 7.54 11.36 6.53 11.52
LSD0.05 4.19 NS NS 4.38 2.13
M1: Recommended Fertilizers (RF): @ 115-30-125-19-3.5-1.7 N-P-K-S-Zn-B
kg ha-1, M2: RF + Straw mulch, M3: RF + 25% extra K + Straw mulch, M4: RF with cowdung @ 5t ha-1 in IPNS + Straw mulch
Interaction effect of planting systems and different management practices
Plant height, number of tubers plant-1, individual tuber weight and tuber yield
differed significantly due to the interaction effect of planting systems (raised bed and flat system) and different management practices (fertilizers and
mulching) in both the years (Table 3, Table 4 and Table 5). The highest plant height was observed in P2M4 which was statistically identical with P1M4 in both
the years (average 47.0 cm and 44.7 cm in P2M4 and P1M4, respectively). The highest number of tubers plant-1 was observed in P1M4 in both the years
(average 6.14) that was statistically identical to P1M3 and P2M4. The maximum
individual tuber weight was found in P1M3 followed by P1M4, P2M3 and P2M4 in 2015-2016. In 2016-2017, the maximum individual tuber weight was found in
P1M4 (50.17 g) and it was statistically identical to P1M3, P2M4, P2M3 and P2M2. Though all yield attributes did not differed significantly due to the interaction
effect but their cumulative effect made difference in tuber yield in both the years. In 2015-2016, the highest tuber yield (21.13 t ha-1) was obtained in P1M4
which was statistically identical with P1M3. But in 2016-2017, P1M4, P1M3 and P2M4 gave statistically identical tuber yield. In 2016-2017, tuber yield in all the
treatments was slightly higher compared to 2015-16 due to lower soil salinity in 2016-2017. The highest average tuber yield was obtained in P1M4 (21.66 t ha-1).
Treatment combinations having raised bed with straw mulch + cowdung or extra K might have conserved soil moisture for longer period and thus reduced
soil salinity to some extent that favoured better growth and yield. This finding is in agreement with Muromota et. al. (1991) and Mahmood et al. (2002).
Application of potassium and different mulches had positive effect on growth characters and yield and economic analysis of potato (Pulok et al., 2016). In
both the years all yield attributes and tuber yield (average 12.37 t ha -1) was
lowest in P2M1 (flat system planting and no mulch).

SOIL SALINITY MANAGEMENT FOR INCREASING POTATO YIELD 661
Table 3. Tuber yield and yield attributes of potato as influenced by interaction of
planting systems and management practices in saline soil of Charfashion,
Bhola in 2015-2016
Treatment Plant height
(cm)
Plants m-2
(No.)
Tubersplant-1
(No.)
Individual
tuber wt. (g)
Tuber yield
(t ha-1)
P1 M1 36.8d 6.65 5.74c 37.78e 14.04c
M2 40.8c 7.00 5.88b 42.98d 17.28b
M3 42.2bc 6.92 6.00a 49.95a 20.65a
M4 44.0ab 7.06 6.12a 49.90a 21.13a
P2 M1 32.6c 6.07 5.54c 42.13d 12.08d
M2 40.2c 6.68 5.16d 45.41bcd 15.01c
M3 40.4c 6.76 5.63c 48.61ab 18.12b
M4 46.4a 6.98 5.91ab 47.33abc 18.70b
CV (%) 9.3 7.16 8.32 11.54 9.58
LSD0.05 3.1 NS 0.28 3.42 1.63
P1: Raised bed, P2: Flat bed, M1: Recommended Fertilizers (RF): @ 115-30-125-19-3.5-
1.7 N-P-K-S-Zn-B kg ha-1, M2: RF + Straw mulch, M3: RF + 25% Extra K + Straw
mulch, M4: IPNS with cowdung @ 5 t ha-1 + Straw mulch
Table 4. Tuber yield and yield attributes of potato as influenced by interaction of
planting systems and management practices in saline soil of Charfashion,
Bhola in 2016-2017
Treatment Plant height
(cm)
Plants m-2
(No.)
Tubers plant-1
(No.)
Individual tuber wt. (g)
Tuber yield
(t ha-1)
P1 M1 38.9cd 6.91 5.81bc 37.8d 15.53de
M2 42.9b 7.14 5.93ab 42.79c 17.87cd
M3 44.3bb 6.89 6.09a 50.13a 21.16ab
M4 45.4ab 7.11 6.16a 50.17a 22.19a
P2 M1 37.5d 6.09 5.62c 43.16bs 12.65f
M2 41.8c 6.74 5.20d 47.32ab 16.13de
M3 42.3bc 6.77 5.60c 48.98a 19.61bc
M4 47.5a 7.01 5.98ab 49.05a 20.24ab
CV (%) 7.9 8.12 6.65 8.67 10.08
LSD0.05 3.6 NS 0.25 4.21 2.08

662 ISLAM et al.
Table 5. Mean tuber yield and yield attributes of potato as influenced by interaction
of planting systems and management practices in saline soil of Charfashion,
Bhola in 2015-2016 and 2016-2017 (Pooled)
Treatment Plant height
(cm)
Plants m-2
(No.)
Tubers plant-1
(No.)
Individual tuber wt. (g)
Tuber yield
(t ha-1)
P1 M1 37.9de 6.78 5.78bc 37.79c 14.79e
M2 41.9bc 7.07 5.91abc 42.89b 17.58cd
M3 43.3bc 6.91 6.05a 50.04a 20.91ab
M4 44.7ab 7.09 6.14a 50.04a 21.66a
P2 M1 35.1e 6.08 5.58c 42.65b 12.37f
M2 41.0cd 6.71 5.18d 46.37ab 15.57de
M3 41.4c 6.77 5.62bc 48.80a 18.87bc
M4 47.0a 7.00 5.95ab 48.19a 19.47abc
CV (%) 7.86 8.35 7.97 10.32 10.64
LSD0.05 3.28 NS 0.32 4.09 2.20
Soil Salinity
There was no significant difference in soil salinity level of different treatments on
15 December in both the years (Table 6, Table 7 and Table 8).Increase in soil
salinity started from 31 December (i.e. about one month after planting) in both
the years and the rate of increase was significant. Significantly the highest
salinity level was observed in flat system planting with no mulch (P2M1) (average
salinity level was 4.15, 5.42, 6.64, 7.44 and 8.07 dSm-1 on 31 December, 15
January, 31 January, 15 February and 01 March, respectively). Soil salinity
increase in raised bed with mulching was very close to flat system with
mulching. It indicates that mulching in saline soils is more important than
planting in raised bed. This might be due to capillary movement of soil water that
was higher in open land than mulched land (Devkota et al., 2015). Raised bed
also reduced soil salinity increase than plain or flat land (Choudhary et al., 2008).
In raised bed capillary movement of water increases in the furrow than top of the
bed. Rahman et. al. (2006) observed that salinity was higher in no mulch
treatment than treatments with different mulch materials. So, potato could be
cultivated in coastal saline area minimizing soil salinity through raised bed with
mulching.

SOIL SALINITY MANAGEMENT FOR INCREASING POTATO YIELD 663
Table 6. Salinity levels (dSm-1) at potato experimental plots under different
management practices at Charfashion, Bhola during 2015-2016
Treatments Soil salinity monitoring dates
30 Nov’15 15 Dec’15 31 Dec’15 15 Jan’16 31 Jan’16 15 Feb’16 01 Mar’16
P1 M1 2.43 2.91 3.33bc 3.96bc 4.32bc 5.06b 5.82b
M2 2.43 2.68 2.96c 3.46c 3.93c 4.15c 4.56c
M3 2.43 2.65 2.92c 3.41c 3.88c 4.07c 4.50c
M4 2.43 2.64 2.92c 3.40c 3.87c 4.00c 4.31c
P2 M1 2.43 3.06 4.55a 5.98a 6.83a 7.75a 8.24a
M2 2.43 3.12 3.98ab 4.56b 4.98b 5.13b 5.28bc
M3 2.43 2.76 3.10c 3.68c 4.12bc 4.69bc 5.12bc
M4 2.43 2.80 3.17c 3.65c 4.07c 4.68bc 5.03bc
CV(%) - 4.23 8.51 6.37 7.12 8.00 6.17
LSD0.05 - NS 0.68 0.71 0.87 0.95 0.97
P1: Raised bed, P2: Flat bed, M1: Recommended Fertilizers (RF): @ 115-30-125-19-3.5-
1.7 N-P-K-S-Zn-B kg ha-1, M2: RF + Straw mulch, M3: RF + 25% Extra K + Straw
mulch, M4: IPNS with cowdung @ 5 t ha-1 + Straw mulch
Table 7. Salinity levels (dSm-1) at potato experimental plots under different
management practices at Charfashion, Bhola duirng 2016-2017
Treatments
Soil salinity monitoring dates
30 Nov’16 15 Dec’16 31 Dec’16 15 Jan’17 31 Jan’17 15 Feb’17 01 Mar’17
P1 M1 2.16 2.88 3.23abc 3.76bc 4.22b 4.89b 5.40b
M2 2.16 2.51 2.96c 3.26bc 3.63b 4.10bc 4.37bc
M3 2.16 2.40 2.82c 3.20c 3.55b 4.01bc 4.26c
M4 2.16 2.41 2.78c 3.12c 3.42b 3.83c 4.15c
P2 M1 2.16 3.14 3.75a 4.86a 6.44a 7.12a 7.90a
M2 2.16 3.09 3.65ab 3.96b 4.00b 4.78b 5.07bc
M3 2.16 2.78 3.11abc 3.56bc 3.94b 4.62bc 4.93bc
M4 2.16 2.76 3.05bc 3.58bc 3.91b 4.47bc 4.82bc
CV(%) - 3.88 7.12 5.43 7.84 6.92 8.31
LSD0.05 - NS 0.66 0.75 0.82 0.92 1.06

664 ISLAM et al.
Table 8. Average salinity levels (dSm-1) at potato experimental plots under different
management practices at Charfashion, Bhola during 2015-2016 and 2016-17
Treatments Soil salinity monitoring dates
30 Nov 15 Dec 31 Dec 15 Jan 31 Jan 15 Feb 01 Mar
P1 M1 2.30 2.90 3.28 3.55 4.27 4.98 5.61
M2 2.30 2.60 2.96 3.36 3.78 4.13 4.47
M3 2.30 2.53 2.87 3.31 3.72 4.04 4.38
M4 2.30 2.53 2.85 3.26 3.65 3.92 4.23
P2 M1 2.30 3.10 4.15 5.42 6.64 7.44 8.07
M2 2.30 3.11 3.82 4.26 4.49 4.96 5.18
M3 2.30 2.77 3.11 3.62 4.03 4.66 5.03
M4 2.30 2.78 3.11 3.62 3.99 4.58 4.93
Soil Nutrient Status
Analysis of soil samples (composite) taken across the experimental plots before
planting and after harvest of the crop did not show significant variation in soil
nutrient status (Table 9). However, slight increase in organic matter, total N (%)
and K while slight decrease in soil pH, P, S and B was found in soils after harvest
(Table 9). Increase of organic matter might be due to addition of mulch materials.
Negative balance of K is common in Bangladesh soils (Hossain et al., 2016).
Proper dose of K and 25% extra K in two plots might have influenced this
slightly positive K balance. Application of recommended fertilizer in proper
method can help in soil nutrient status degradation.
Table 9. Initial and post-harvest soil nutrient status of the experimental plots
(average of 2015-2016 and 2016-2017)
pH OM
(%)
Total N
(%)
K (meq/
100 g soil)
P S Zn B
(µg/g soil)
Initial status 7.94 1.25 0.072 0.17 5.84 34.15 0.65 0.47
Interpretation SA L VL L VL H L Opt
Post-harvest status 7.95 1.26 0.073 0.18 5.81 34.08 0.65 0.45
Interpretation SA L VL L VL H L Opt
Increase (+)/
decrease (-)
(+)0.01 (+)0.01 (+)0.001 (+)0.01 (-)0.03 (-)0.07 - (-)0.02

SOIL SALINITY MANAGEMENT FOR INCREASING POTATO YIELD 665
Cost and Return analysis
Cost and return of potato was influenced by planting systems and management practices in saline soil condition (Table 10). Gross return (GR) varied due to
variation of tuber yield as farm gate price of potato from different treatments was same. On an average, the highest GR (Tk. 208288 ha-1) was obtained from the
treatment raised bed + RF with 5 t ha-1 cowdung in IPNS + mulching (P1M4). Total variable cost (TVC) varied due to different management practices and the
lowest average TVC (Tk. 79010 ha-1) was found in flat land with no mulch system (P2M1). TVC increased mainly due to mulch material and additional
labour for preparing raised bed and spreading of rice straw (mulch). The highest average TVC (Tk. 92343 ha-1) was recorded in the treatment P1M4 due to cost of
cowdung and transport and application in the field. Although TVC was highest in
P1M4, gross margin (GM) was also the highest (Tk. 115945 ha-1) in the same treatment as it provided the highest tuber yield. GM produced by P1M3 (Tk.
110969 ha-1) was very close to P1M4 whereas GM was the lowest in P2M1 (Tk. 39835 ha-1) due to the lowest tuber yield. Benefit cost ratio (BCR) is an indicator
of profitability of a production activity. BCR was the highest (2.26) in P1M4 and it was very close to P1M3 (2.25). Other treatments such as P2M3, P2M4 and P1M2
also produced a considerable BCR. Treatment P2M1 (Flat land and no mulch) provided the lowest BCR 1.50 which indicated that flat land with no mulch is not
suitable for potato cultivation in saline area.
Table 10. Average cost and return of potato as influenced by planting systems and
management practices at saline area of Charfashion, Bhola during 2015-
2016 and 2016-2017
Treatment Yield
(t ha-1)
Gross return
(Tkha-1)
Total variable cost
(Tkha-1)
Gross margin
(Tkha-1) BCR
P1 M1 15.16 144020 84503 59518 1.70
M2 17.73 168388 87890 80498 1.92
M3 21.04 199833 88864 110969 2.25
M4 21.93 208288 92343 115945 2.26
P2 M1 12.51 118845 79010 39835 1.50
M2 15.85 150575 82635 67940 1.82
M3 19.24 182780 83626 99155 2.19
M4 19.47 184965 86935 98030 2.13
P1: Raised bed, P2: Flat bed, M1: Recommended Fertilizers (RF): @ 115-30-125-19-3.5-
1.7 N-P-K-S-Zn-B kg ha-1, M2: RF + Straw mulch, M3: RF + 25% Extra K + Straw
mulch, M4: IPNS with cowdung @ 5 t ha-1 + Straw mulch

666 ISLAM et al.
Conclusion
Crop production in the coastal saline areas particularly during Rabi season (dry
season) is very limited due to rise in soil salinity. From this study it is revealed that, raised bed and mulching (with rice straw) both minimizes rise in soil salinity
significantly. Besides, use of cowdung or extra amount of potassium (K) with recommended fertilizers along with raised bed and mulching helps to reduce soil
salinity and increased crop yield. Thus treatment comprised of raised bed + mulching + recommended fertilizers with cowdung (5 tha-1 as IPNS) or 25%
additional K produced higher yield of potato in coastal saline environment. Farmers of coastal saline areas of Bhola district can adopt the technology for
higher yield and economic return from potato.
Acknowledgement
Special thanks to Ministry of Science and Technology, People’s Republic of
Bangladesh for providing financial support to carry out this piece of research work. We are grateful to all cooperator farmers for providing their lands for this
experimentation and also for their active participation in the research work from beginning to end.
References
Ahmad, I.M., B. Qubal, G. Ahmad and N. H. Shah. 2009. Maize yield, plant tissue and
residual soil N as affected by nitrogen management and tillage system. J. Agric. Biol.
Sci. 1(1): 19-29.
Amin, M., M. A. Rahman, S. M. Zaman, M. I. A. Howlader, M. Z. Hossain and M. S.
Islam. 2008. Cropping system in coastal and Barind area. Paper presented in
National workshop on Multiple Cropping held at BARC, Farmgate, Dhaka on 23-24
April 2008.
Bakker, D., M. Hamilton, G. J. Hetherington and R. Spann. 2010. Salinity dynamics and
the potential for improvement of water logged and saline land in a Mediterranean
climate using permanent raised beds. Soil Tillage Res. 110(1): 8-24.
BARI (Bangladesh Agricultural Research Institute). 2008. Annual report (2007-2008),
BARI, Joydebpur, Gazipur. Pp. 228-229.
Bashar, H.M.K., G. N. Hasan, J. U. Sarker, F. Rahman and I. Uddin. 2014. Evaluation of
tillage and planting system of upland crops during dry season. Bangladesh Agron. J.
17(2):29-37.
Bezborodov, G.A., D. K. Shadmanov, R. T. Mirhashimov, T. Yuldashev, A. S. Qureshi,
A. D. Noble and M. Qadir. 2010. Mulching and water quality effects on soil salinity
and sodicity dynamics and cotton productivity in Central Asia. Agric. Ecosyst.
Environ. 138: 95-102.
Choudhary, M.R., A. Munir and S. Mahmood. 2008. Field soil salinity distribution under
furrow-bed and furrow-ridge during wheat production in irrigated environment. Pak.
J. Water Res. 12(2): 33-40.

SOIL SALINITY MANAGEMENT FOR INCREASING POTATO YIELD 667
DAE (Department of Agriculture Extension). 2014. Annual report, DAE, Bhola
Deng, L., M. Chen, Z. Liu, Q. Shen, H. Wang and J. Wang. 2003. Effects of different
ground covers on soil physical properties and crop growth on saline–alkaline soil.
Chin. J. Soil Sci. 34(2): 93-97.
Devkota, M., C. Martius, R.K. Gupta, K.P. Devkota, A. J. McDonald and J.P.A. Lamers.
2015. Managing soil salinity with permanent bed planting in irrigated production
systems in Central Asia. Agriculture, Ecosystems and Environ. 202: 90-97.
Dong, H., W. Li, W. Tang, and D. Zhong. 2008. Furrow seeding with plastic mulching
increases stand establishment and lint yield of cotton in saline field. Agron. J. 100:
1640-1646.
Freed, R.D. 1985. MSTAT-C Statistical Package, Version 2.0.0. Crop and Soil Science
Department, Michigan State University, East Lansing.
FRG (Fertilizer Recommendation Guide). 2012. Bangladesh Agricultural Research
Council, Farmgate, New Airport Road, Dhaka-1215.
Haque, S.A. 2006. Salinity problems and crop production in coastal regions of
Bangladesh. Pakistan J. Bot. 38(5): 1359-1365.
Hassan, I., Z. Hussain and G. Akbar. 2005. Effect of permanent raised beds on water
productivity for irrigated maize-wheat cropping system. Evaluation and performance
of permanent raised bed cropping systems in Asia, Australia and Mexico edited by
C.H. Roth, R.A. Fischer and C.A. Meisner ACIAR Proceedings. 121:59-65.
Hossain, S. W., A. Hossain, M. A. R. Sarker, M. Jahiruddin, A. Jaime, T. D. Silva, M. I.
Hossain. 2016. Productivity and soil fertility of the rice-wheat system in the High
Ganges River Floodplain of Bangladesh is influenced by the inclusion of legumes
and manure. Agric. Ecosys. Environ. 218: 40-52.
Huang, Q., Z. Yin and C. Tian. 2001. Effect of two different straw mulching methods on
soil solute salt concentration. Arid Land Geogr. 24: 52-56.
Islam, M. B., M. Y. Ali, S. M. Zaman, M. Amin, M. S. Islam and M. S. Islam. 2008.
Climatic Variations: Farming Systems and livelihoods in the High Barind Tract and
Coastal areas of Bangladesh. Paper presented in the International Symposium on
Climate Change and Food Security in South Asia held on 25-29 August 2008 in
Dhaka, Bangladesh.
Khan, M. S., M. M. Rahman, R. A. Begum, M. K. Alam, A. T. M. A. I. Mondol, M. S.
Islam and N. Salahin. 2008. Research experiences with problem soils of Bangladesh.
Soil Science Division, BARI, Joydebpur, Gazipur. Pp. 5-25.
Mahmood, M. M., K. Farooq, A. Hussain and R. Sher. 2002. Effect of Mulching on
Growth and Yield of Potato Crop. Asian J. Plant Sci. 1: 132-133.
Malik, R.K., A. Yadav and S. Singh. 2005. Resource conservation technologies in rice-
wheat cropping system of Indo-Gangetic plains. In: Abrol, I.P., Gupta, R.K., Malik,
R.K. (Eds.), Conservation agriculture: Status and prospects Centre for advancement
of sustainable agriculture, New Delhi. Pp. 13-23.
Muromota, T. M., Y. Aoki, T. Suzuki, J. C. Kusaka, W. Kheng and T. Higushi. 1991.
Effect of rhyzosphere conditions on the growth of straw berry. Bulletin 39.Facult
Agric., Yamaguchi Univ. Yamaguchi. Pp. 23-25.

668 ISLAM et al.
Peter, D., I. Tomasek and K. Hamouz. 2010. Cultivation of organic potatoes with the use
of mulching materials. Zeszyty Problem owe Postqpow Nauk Rolniczych. 557: 95-
102.
Pulok, M. A. I., T. S. Roy, M. S. R. Bhuiyan, M. N. Haque and Nur-unnahar. 2016.Effect
of potassium and mulches on growth, yield and economics of potato. Potato J. 43(2):
200-210.
Qiao, H., X. Liu, W. Li, W. Huang, C. Li and Z. Li. 2006. Effect of deep straw mulching
on soil water and salt movement and wheat growth. Chin. J. Soil Sci. 37(5): 885-889.
Rafiquzzaman, S., M.M.R. Talukder and M.H. Ullah. 2010. Constraints and Prospects of
Crop Production in Southern Region. Seminar paper presented at RARS, Rahmatpur,
Barisal.
Rahman, M.J., M.S. Uddin, S.A. Bagum, A.T.M.A.I. Mondol and M.M. Zaman. 2006.
Effect of mulches on the growth and yield of tomato in the coastal area of Bangladesh
under rainfed condition. International J. Sustain. Crop Prodn.1(1): 06-10.
Rasel, H. M., M. R. Hasan, B. Ahmed and M. S. U. Miah. 2013. Investigation of soil and
water salinity, its effect on crop production and adaptation strategy. International J.
Water Res. and Environ. Eng. 5(8): 475-481.
Razzouk, S. and W. J. Whittington.1991. Effects of salinity on cotton yield and quality.
Field Crops Res. 26(3-4): 305-314.
Sayre, K. 2007. Conservation agriculture for irrigated agriculture in Asia. In: Lal, R.,
Suleimenov, M., Stewart, B.A., Hansen, D.O., Doraiswamy, P. (Eds.), Climate
change and terrestrial carbon sequestration in central Asia. Taylor and Francis, The
Netherlands, Pp. 211-242.
Shrivastava, P. and R. Kumar. 2015. Soil salinity: A serious environmental issue and
plant growth promoting bacteria as one of the tools for its alleviation. Saudi J. Biol.
Sci. 22(2): 123-131.
Takahashi, R., T. Nishio, N. Ichizen and T. Takano. 2007. High-affinity K+ transporter
PhaHAK5 is expressed only in salt-sensitive reed plants and shows Na+ permeability
under NaCl stress. Plant Cell Rep. 26: 1673-1679.
Tanji, K. and N. C. Kielen. 2002. Agricultural drainage water management in arid and
semi-arid areas. Irrigation and Drainage. Paper No. 61. Food and Agriculture
Organization of the United Nations, Rome, Italy.
Yue Y., M. Zhang, J. Zhang, L. Duanand Z. Li. 2012. SOS1 gene over expression
increased salt tolerance in transgenic tobacco by maintaining a higher
K+/Na+ ratio. J. Plant Physiol. 169: 255-261.
Zhang, H.J., H. Z. Dong, Y. J. Shi, S. Y. Chen and Y. H. Zhu. 2007. Transformation of
cotton (Gossypium hirsutum) with AbCMO gene and the expression of salinity
tolerance. Acta Agron. Sin. 33: 1073-1078.

ISSN 0258-7122 (Print), 2408-8293 (Online)
Bangladesh J. Agril. Res. 43(4): 669-690, December 2018
ASSESSMENT OF TRAINING NEEDS ON CROP PRODUCTION FOR
FARMERS IN SOME SELECTED AREAS OF BANGLADESH
M. S. RAHMAN1, M. KHATUN2, M. L. RAHMAN3
AND S. R. HAQUE4
Abstract
The study attempts to determine the training needs of the farmers emphasizing
nine selected major thematic areas. Under each major component, specific and
relevant training needs item were collected and systematically incorporated into
an interview schedule and administered in terms of frequency of training
imparted. Four districts were purposively selected for the study and a total of
eighty farmers were randomly selected from four districts. Primary data were
analyzed using descriptive statistics. The study revealed that more male was
involved in farming and 45% farmers were middle age category (30-39 years).
Majority of the farmers completed primary level of education compared to other
categories and family size of more than half (60 %) of the respondents was
three. Majority number of respondents (57%) had more than 10 years farming
experience. A small number of farmers (8.75%) had owned agricultural land and
45% had land between 0.50- 1 hectare. More than 75% of annual gross income
of 57.50% farmers came from agricultural activities. More than half (55%) of
the respondents collected information on crop and its varieties by own attempt
while about 34% was informed from seed seller or dealer. Farmers in
Chattogram district had first priority to get training on integrated pest and
diseases management, production of bio control agents and bio pesticides,
marketing and transportation. Water management, integrated pest and disease
management, vermi-compost production, marketing and transportation ranked
first in Khagrachori district. The areas of priority for training in Rajshahi district
were production and management technology, processing and value addition,
marketing and transportation, integrated pest and disease management, water
management and vermi-compost production. Training on integrated pest and
disease management, bio-control of pests and diseases, production of bio control
agents and bio pesticides, production of off-season vegetables, vermi-compost
production, marketing and transportation were most emphasized by the
respondents in Rangpur district. Respondents defined identification of
adulterated fertilizer, insecticide and pesticide application, disease and insects of
mango varieties and fruit bagging system of mango as very good type of
training. The study concluded that there is an urgent need to design regular
training programs in identified thematic areas to fulfill the knowledge gap
among the farmers of Bangladesh.
1Scientific Officer, Agricultural Economics Division, Bangladesh Agricultural Research
Institute (BARI), Joydebpur, Gazipur-1701, 2Assistant Professor, Department of
Agricultural Finance, Bangladesh Agricultural University (BAU), Mymensingh-2202, 3Director (Research), BARI, Joydebpur, Gazipur-1701, 4Scientific Officer, Training and
Communication Wing, BARI, Joydebpur, Gazipur-1701, Bangladesh.
DOI: http://dx.doi.org/10.3329/bjar.v43i4.39165

670 RAHMAN et al.
Keywords: Training needs, Crop production, Socio-demographics, Farmers,
Bangladesh.
Introduction
Training is a process of acquisition of new skills, attitude and knowledge in the
context of preparing for entry into a vocation or improving one’s productivity in an organization or enterprise. Effective training requires a clear picture of how
the trainees will need to use information after training in place of local practices what they have adopted before in their situation. Training does not mean
knowing more but behaving differently. Again training is acquisition of the best way of utilizing knowledge and skill (Sajeev and Singha, 2010; Ajayi, 1995).
Training of farmers essentially contributes to human resource development in
agriculture. The basic needs of farmers are crop wise information viz., improved seed, inter cultural operation, fertilizers, soil testing, irrigation, new implements,
plant protection measures, mushroom cultivation, poultry, animal husbandry and credit information (Babu and Singh, 1986). Majority of the farmers had low
extension contact, poor credit orientation and medium farming knowledge. The farmers had high need for training in agronomical practices for 2 to 4 days just
before the Kharif and rabi season (Chauhan and Kokate, 1986).
Bangladesh is an agro-based developing country and sustainability of agricultural
production is prerequisite for attaining the rate of overall growth of the economy. Now, the question is how to increase the production. There can be two possible
approaches to enhance the production either by increasing the area under the crop and by increasing the productivity per unit area per unit time. Since the crop area
expansion is not feasible anymore the only alternative is to adopt the better management practices and use certain modern agricultural technologies which
include better seed technology, better fertilizer application, better pest control measure and irrigation management through imparting need based training.
Training is an integral part of any development activity (Pandey et al., 2015).
Knowledge and skills of the farmers in agricultural technologies are important factors for increased agricultural production. The factors like hard working,
dignity of labour and affection for the land are genetically prevailing among them which are considered to be the fundamental assets of farmer. However, in spite of
high social values prevailing in these communities, they have remained backward, underdeveloped or neglected due to the factor like lack of ambition,
lack of initiative, inadequate land holding, limited needs and orthodox behavior (Barman et al., 2013). Most of the farmers do not possess adequate knowledge
about the methods of modern agriculture. They often become frustrated with new practices in agriculture due to lack of proper understanding of the relevant
factors. As a result, they are often skeptical towards new ideas and practices in agriculture.

ASSESSMENT OF TRAINING NEEDS ON CROP PRODUCTION 671
National Agriculture Policy -2013 has asserted on the necessity of trained and
efficient farmer in order to assure crop production and food security issues of Bangladesh. It also gave forces to facilitate training of farmers on modern crop
production techniques. It identified the paucities of farmers training as a strong weakness of agriculture sector in Bangladesh. One of the mandates of
Bangladesh Agricultural Research Institute is to provide farmers with information necessary for carrying out their farming business efficiently and
profitably. In this respect farmers training has no alternative. Different divisions of BARI are providing a lot of training to farmers in each year in order to
disseminate new varieties and technologies at field level. The Department of Agriculture Extension (DAE) has been working with a view to providing
agricultural knowledge and skills to the farmers in Bangladesh.
Training needs assessment is one of the crucial steps towards identifying the area of farmers’ interest, design and development of curriculum that can best suit to the existing real conditions of farmers. Pholonngoe and Richard (1995) underscored the necessity of need assessment while stating that if non-formal education trainers hope to foster meaningful development, they should bear in mind that the needs of adults constantly change. Thus, training assessment has to be carried out to design relevant and need based training programs that can accommodate changes over time. Barbazett (2006) noted that before any actual training is conducted, the training institution must determine who, what, when, where, why and how of training. Training needs assessment process helps determine the priority of changes in knowledge, skill, attitude and behavior that will provide the greatest impact on achieving organizational or individual goals. Caffarela (2002) noted that a systematic process of farmers’ training must include needs assessment, goal and objectives setting, organizing instructional methods and techniques, monitoring and evaluation. Meenambigai and Seetharaman (2003) asserted that training is the most singular factor affecting individuals’ attitude, productivity, improvement, minimization of risks. So, adequate training is essential for farmers to acquire necessary knowledge and skills in different aspects of farming.
But very little research has been conducted regarding training need assessment of farmers in Bangladesh. In view of the above discussion, the study attempted to achieve the following specific objectives-
i. To examine the socio-demographic characteristics of farmers and
ii. To determine the extent of training needs of farmers’ in relation to agriculture
Methodology
Description of the study area
The study had covered 4 districts of Bangladesh namely Rangpur, Rajshahi, Chattogram and Khagrachori. These were purposively selected based on the

672 RAHMAN et al.
agro-ecological zones, and production potentials in diversified farming. Rangpur is known as major vegetable growing district situated in northern part of Bangladesh. The district is renowned in crop production for a number of reasons viz., high cropping intensity (251%), acceptance of hybrid crop variety, skilled farmer and availability of modern crop production techniques. Rajshahi is located within Barind Tract, 23 m (75 ft) above sea level and has been built on the alluvial planes of the Padma River. Apart from the usual agricultural products of Bangladesh, such as rice, wheat, potatoes and lentils, Rajshahi is specially suited for various crops such as mangoes, litchis, sugarcane, tomatoes and watermelons. It’s cropping intensity is 190%. Chattogram is a major coastal city and financial center in southeastern Bangladesh. It is situated on the banks of the Karnaphuli River between the Chittagong Hill Tracts and the Bay of Bengal. Though the economy of Chittagong district is predominantly non-agricultural but it is also enriched with a number of crops such as paddy, betel leaf, potato, corn, turmeric, tea, peanut, mustard, pointed gourd, brinjal, ginger, cucumber and vegetables. Khagrachori is a hilly area and includes a number of ethnic communities such as Tripura, Chakma, Marma and Tanchangya. Most of the people live on Jhum cultivation and 59.92% income come from agriculture (Wikipedia).
Sampling procedure
A multi stage stratified random sampling technique was followed to collect farm level data. From each district one upazila and from each selected upazila one village based on production potential of the different farming system was drawn up purposively for inclusion in the present study. Farmers were selected based on their intimacy with the DAE and BARI to ensure the farmers of this area well exposed about various agricultural development and latest technologies. On consultation with DAE and BARI personnel, a list of farmers representing different categories was prepared for each village. From the individual list of farmers from selected village, five farmers were randomly selected which made twenty farmers from each district. They were different in farming activities, land holding size and also in different socioeconomic attributes. Thus a total of 80 farmers were finally selected for data collection from 4 districts. The identified districts were coming from six agro-climatic zones of Bangladesh (Table 1).
Table 1. Agro-ecological zone wise coverage of the selected districts
Agro-ecological zone (AEZ) AEZ No. Districts
Active Tista Floodplain
North Eastern Barind Tract
AEZ 2
AEZ 27
Rangpur
Lower Atrai Basin
High Barind Tract
AEZ 5
AEZ 26
Rajshahi
Chittagong Coastal Plains AEZ 23 Chattogram
Northern and Eastern Hill AEZ 29 Khagrachori
Source: BBS, 2017

ASSESSMENT OF TRAINING NEEDS ON CROP PRODUCTION 673
Analytical procedure
Data collection from randomly selected respondents was done by using pre-tested
structured schedule through personal interview method. The duration of data
collection was February to March 2016. For analyzing the data, descriptive
statistics such as percentages, rank order and scoring techniques were used to
achieve the objectives and to get meaningful results. In most cases, tabular
method of analysis supported with appropriate statistical parameters was used to
present the results of the study. A list of thematic areas and specific and relevant
training need items under each area was prepared and collected through different
review of literature, discussion with DAE and BARI staff as well as own field
experiences
In this study, the farmer’s responses were collected in a 3– point continuum scale
as Very Important (VI), Important (I) and Not Important (NI) by assigning scores
3, 2 and 1 respectively. The results were calculated as weighted score for each of
the thrust area identified for the training.
Weighted score (WS) = NI + I + VI of No. Total
1)× NI of (No. + 2)× I of (No. + 3)× VI of (No.
Where,
VI = Very Important, I = Important and NI = Not Important
Weighted Score ranged from 1 to 6.
Results and Discussions
Socio-demographic characteristics of the respondents
Table 2 shows that majority of respondents (97.50%) were male. The age
distribution of respondents was fairly evenly spread over the various age groups,
with the highest (45%) representation found in the 30 to 39 categories. Table 2
also shows that only 8.75% were above 50 years. It revealed that most of the
farmers belonged to active age group.
About 16.25% of the respondents had no formal education, 36.25% had not
completed primary school, 45% had completed primary school and 2.50% had
completed secondary school. No respondents reported having tertiary education.
These findings suggest that many farmers in the target groups were illiterate or
have low literacy levels, which will impact on their ability to access different
types of crop production training and information. This should be important to
consider when developing training modules for farmers. The Table 2 also
revealed that 60% of the farmers had three family members which is lower than
average size of households (4.06) in Bangladesh (HIES, 2016). The reduction in
the household size indicates that respondents prefer smaller families.

674 RAHMAN et al.
Table 2. Profile of the respondent farmers in the survey areas
Characteristics Frequency % of
respondents
Sex
Male 78 97.50
Female 2 2.50
Age (years)
Less than 30 11 13.75
30-39 36 45.00
40-49 26 32.50
Above 50 07 8.75
Education
No formal education 13 16.25
Not finished primary school 29 36.25
Completed primary school 36 45.00
Completed secondary school 2 2.50
Household size (No. of members)
2 17 21.25
3 48 60.00
4 or more 15 18.75
Source: Field survey 2016
Farming experience varied among the sample respondents. About 40% had been
farming for 10-20 years and 31.25% had more than 20 years farming experience (Table 3).Majority of the respondents (45%) had 0.5 to 1 hectares of agricultural
land while 36.25% of the respondents were having less than half hectares’ agricultural land in the survey area. In terms of ownership status, 8.75% of
respondents owned their agricultural land, while 71.25% part own and part lease
basis (Table 3). This clearly shows that a large proportion of respondents are smallholders and lease farmers, thus they would not be likely to invest in training
and technology if other conditions are right.
The survey revealed a significant difference in the percentage of annual income
gained from agricultural activities by the respondents. About 3.75% of
respondents obtained less than 25% of their income from agriculture, 12.50 %
obtained between 25 to 50 %, 26.25 % acquired between 51 to 75 %, and 57.50
% gained more than 75 % of their annual income from agriculture (Table 3).

ASSESSMENT OF TRAINING NEEDS ON CROP PRODUCTION 675
Sources of other means of income were not explored in the survey, but during
focus group discussions participants shared that the other source of income in the
survey areas was mainly business. The proportion of income coming from other
off-farm sources remains limited. Households diversified their income and were
less reliant on agriculture day by day for economic development. While this is
perhaps positive, it also means that farmers whose total household income is less
reliant on agriculture may be less likely to invest time and money in training and
technology. Most of the respondents (55%) gathered information by their own
attempts and 27 % got information from seed dealer and only 3% from officials
of BARI. Department of Agricultural Extension is working relentlessly for the
overall agricultural development of Bangladesh. It is also an important source to
get a wide variety of knowledge by farmers while the figure for the present study
was only 7.5%.
Training needs of the sample households
The major training needs components identified for the study were field crop
production, crop protection, soil health and fertility management, vegetable
production, plantation crops, tuber crops, on farm production of inputs,
agricultural engineering, marketing and transportation etc. The district-wise
training needs of the farmers are presented in the form of weighted scores in the
Tables 4-7. Weighted Scores in the range of 1 – 3 were ranked within each
discipline and the first six rankings were identified as training needs of the
farmers of the area. The areas which got 1, 2 and 3 rank orders were considered
as main important areas of training. The following are the thematic areas where
there are high training needs among the farmers of Chattogram, Khagrachori,
Rajshahi and Rangpur district of Bangladesh.
Field Crop Production: It refers to acquire knowledge and skill about
principals and practice of crop production, protecting from weeds and field
management. Training on seed production was the most sought after by farmers
in Chattogram district followed by water management of the field crops and
training on crop diversification (Table 4). Training on weed management in
field crops, nursery management practice, integrated farming and cropping
systems also closely followed. In Khagrachori district water management and
integrated farming were the most important need in crop production area (Table
5) which was also burning issue in Rajshahi district (Table 6). Integrated
farming was regarded as the most important training area under crop production
in Rangpur district (Table7). Development of quality training on integrated
farming system is, therefore, a prerequisite for profitable farming in these
regions.

676 RAHMAN et al.
Table 3. Distribution of respondents according to selected farming characteristics
Characteristics Frequency %
Farming experience (years)
Less than 10 years 23 28.75
10-20 years 32 40.00
Above 20 years 25 31.25
Size of agricultural land (hectares)
No land - 0.00
Less than half 29 36.25
0.5 to 1 36 45.00
More than 1 15 18.75
Land ownership status
Own all 7 8.75
Lease all 16 20.00
Part own/part lease 57 71.25
Percentage of yearly income from agricultural activities
Less than 25 per cent 3 3.75
25 to 50 per cent 10 12.50
51 to 75 per cent 21 26.25
More than 75 per cent 46 57.50
Ways of information about crops and varieties
Own Attempts 44 55.00
Seed Seller or dealer in the area 27 33.75
DAE through SAAO 6 7.50
Officials of BARI 3 3.75
Source: Field survey 2016
Crop Protection: It refers to one's need for gaining understanding and skill
about the different aspects of insect control, namely, name of insect and
disease, symptoms of attack, and nature of damage and control measures
against each insect and disease pest (Alam, 2006). Training on integrated pest
and disease management of the crops was the most important training need in
plant protection followed by control of pest and disease by use of biological
agents among the respondents of four districts (Table 4, 5, 6 & 7). This is

ASSESSMENT OF TRAINING NEEDS ON CROP PRODUCTION 677
attributed to the fact that farmers resort to over usage of fertilizers and
pesticides/fungicides. Impact of excess application of those chemicals in the
long run is ignored by them. But the farmers in the study area have realized the
importance of integrated pest management in agriculture for sustainable
production and development.
Soil Health and Fertility Management: The term refers to one's need for
gaining understanding and skill about the different aspects of soil and
fertilizer, namely, soil and water conservation, use of fertilizers, functions of
different fertilizers, doses of fertilizers and procedure for applying fertilizers
which are necessary for successful cultivation (Alam, 2006). Under Soil
health and fertility management in Chattogram district, technologies for soil
and water conservation and management of problematic soils were the most
needed followed by technology for soil fertility management (Table 4). In
Khagrachori district soil fertility management and management of
problematic soils were regarded very important. On the other hand,
respondents of Rajshahi and Rangpur districts select soil and water
conservation as their training need in this area of interest. This isdue to
continuous practice of unscientific methods of farming coupled with
injudicious use of chemical fertilizers that led to soil degradation. This calls
for immediate control measures and proper management practices against
further degradation of soil fertility.
Vegetable Production: In vegetables sector of Chattogram and Khagrachori
district, production of off-season vegetables and vegetables grading and
standardization topped the list whereas in Rajshahi and Rangpur the important
training need were producing off season vegetables and production of low
volume and high value crops (Table 4, 5, 6 & 7). The identified training needs of
farmers under vegetable sector in these areas shouldfind a place in planning and
designing training programmes.
Plantation Crops: Processing and value addition was the most desired training
rather production and management technology of plantation crops in Chattogram
district followed by Rangpur district (Table 4&7). But this is totally ignored by
the respondents of other two districts.
Tuber crops: Training on tuber crop production technology and it’s processing
and value addition were regarded important among the respondents of all the
districts (Table 4, 5, 6 & 7).
On farm production of agricultural inputs: Training on production of Vermi-
compost, bio fertilizers and bio pesticides were still hot topics among the
farmers. These reflect that farmers are so much reluctant to use chemical
fertilizers, insecticides and pesticides in farming. So they demanded more and

678 RAHMAN et al.
more training on these areas as day by day they are informed about the bad
effects of these chemicals.
Agricultural engineering: Training on post-harvest technology of vegetables
and fruits was the most important need under agricultural engineering in Rangpur district.
Besides these, curiosities to learn how to make efficient marketing was also very high among the respondents of all the four districts (Table 4, 5,6 & 7). Every
respondent wants a suitable market in which they can sell their product safely and free from the middlemen.
Table 4. Training needs of farmers in Chattogram district
Thematic Area Chittagong district (n = 20)
VI I NI WS
Field Crop Production
Weed Management 0 3 17 1.15
Cropping system 4 6 10 1.70
Water management 10 6 4 2.30
Integrated farming 6 9 5 2.05
Seed production 12 5 3 2.45
Crop diversification 8 7 5 2.15
Nursery management practice 0 9 11 1.45
Crop Protection
Integrated pest management 20 0 0 3.00
Integrated disease management 20 0 0 3.00
Bio-control of pests and diseases 19 1 0 2.95
Production of bio control agents and bio pesticides 20 0 0 3.00
Soil health and fertility management
Soil fertility management 16 4 0 2.80
Soil and Water conservation 20 0 0 3.00
Management of problematic soils 18 2 0 2.90
Soil and water testing 2 7 11 1.55
Integrated nutrient management 6 3 11 1.75

ASSESSMENT OF TRAINING NEEDS ON CROP PRODUCTION 679
Thematic Area Chittagong district (n = 20)
VI I NI WS
Fertilizer Application 16 4 0 2.80
Vegetable production
Production of low volume and high value crops 5 8 7 1.90
Production of off-season vegetables 16 4 - 2.80
Exotic vegetables production 2 6 12 1.50
Seedling raising 0 5 12 1.10
Export potential vegetables 12 5 3 2.45
Vegetables grading and standardization 16 4 0 2.80
Protective cultivation(green house, shade house) 0 7 13 1.35
Training and pruning 0 5 15 1.25
Plantation crops
Production and management technology 4 11 5 1.95
Processing and value addition 18 2 0 2.90
Tuber crops
Production and management technology 19 1 0 2.95
Processing and value addition 19 1 0 2.95
On farm production of inputs
Bio-agents production 13 6 1 2.60
Bio-pesticides production 14 5 1 2.65
Bio-fertilizer production 15 5 0 2.75
Vermi-compost production 18 2 0 2.90
Agricultural Engineering
Repair and maintenance of farm machinery and
implements
0 2 18
1.10
Post-harvest technology of vegetables and fruits 0 12 8 1.60
Marketing and Transportation 20 0 0 3.00
Source: Field survey 2016
(-) indicates not under ranking

680 RAHMAN et al.
Table 5. Training Needs of farmers in Khagrachori district
Thematic Area Khagrachori district (n =20)
VI I NI WS
Crop Production
Weed Management 0 0 20 1.00
Cropping system 13 5 2 2.55
Water management 20 0 0 3.00
Integrated farming 14 6 0 2.70
Seed production 1 14 5 1.80
Crop diversification 0 9 11 1.45
Nursery management practice 0 4 16 1.20
Crop Protection
Integrated pest management 20 0 0 3.00
Integrated disease management 20 0 0 3.00
Bio-control of pests and diseases 13 7 0 2.65
Production of bio control agents and bio pesticides 16 4 0 2.80
Soil health and fertility management
Soil fertility management 17 3 0 2.85
Soil and Water conservation 5 12 3 2.10
Management of problematic soils 20 0 0 3.00
Soil and water testing 0 0 20 1.00
Integrated nutrient management 0 13 7 1.65
Fertilizer application 19 1 0 2.95
Vegetable production
Production of low volume and high value crops 0 5 15 1.25
Production of off-season vegetables 12 4 4 2.40
Exotic vegetables production 0 0 20 1.00
Seedling raising 0 9 11 1.45
Export potential vegetables 0 0 20 1.00
Vegetables grading and standardization 10 3 7 2.15
Protective cultivation(green house, shade house) 0 7 13 1.35
Training and pruning 0 5 15 1.25
Plantation crop

ASSESSMENT OF TRAINING NEEDS ON CROP PRODUCTION 681
Thematic Area Khagrachori district (n =20)
VI I NI WS
Production and management technology 0 0 20 1.00
Processing and value addition 0 0 20 1.00
Tuber crops
Production and management technology 14 6 0 2.70
Processing and value addition 11 3 6 2.25
On farm production of inputs
Bio-agents production 14 2 4 2.50
Bio-pesticides production 15 2 3 2.60
Bio-fertilizer production 15 5 0 2.75
Vermi-compost production 20 0 0 3.00
Agricultural Engineering
Repair and maintenance of farm machinery and implements
0 6 14 1.30
Post-harvest technology of vegetables and fruits 8 0 12 1.80
Marketing and Transportation 20 0 0 3.00
Source: Field survey 2016
(-) indicates not under ranking
Table 6. Training needs of farmers in Rajshahi District
Thematic Area Rajshahi district (n = 20)
VI I NI WS
Crop Production
Weed Management 0 0 20 1.00
Cropping system 0 11 9 1.55
Water management 16 4 0 2.80
Integrated farming 13 4 3 2.50
Seed production 0 8 12 1.40
Crop diversification 0 13 7 1.65
Nursery management practice 0 0 20 1.00
Crop Protection
Integrated pest management 16 4 0 2.80
Integrated disease management 19 1 0 2.95

682 RAHMAN et al.
Thematic Area Rajshahi district (n = 20)
VI I NI WS
Bio-control of pests and diseases 8 11 1 2.35
Production of bio control agents and bio pesticides
9 7 4 2.25
Soil health and fertility management
Soil fertility management 0 10 10 1.50
Soil and Water conservation 12 4 4 2.40
Management of problematic soils 9 11 0 2.45
Soil and water testing 0 0 20 1.00
Integrated nutrient management 0 7 13 1.35
Fertilizer application 7 13 0 2.35
Vegetable production
Production of low volume and high value crops 15 5 0 2.75
Production of off-season vegetables 11 4 5 2.30
Exotic vegetables production 0 0 20 1.00
Seedling raising 0 0 20 1.00
Export potential vegetables 0 0 20 1.00
Vegetables grading and standardization 0 7 13 1.35
Protective cultivation(green house, shade house) 0 13 7 1.65
Training and pruning 0 0 20 1.00
Plantation crop
Production and management technology 0 0 20 1.00
Processing and value addition 0 0 20 1.00
Tuber crops
Production and management technology 20 0 0 3.00
Processing and value addition 20 0 0 3.00
On farm production of inputs
Bio-agents production 5 7 8 1.85
Bio-pesticides production 12 5 3 2.45
Bio-fertilizer production 3 11 6 1.85
Vermi-compost production 16 4 0 2.80
Agricultural Engineering

ASSESSMENT OF TRAINING NEEDS ON CROP PRODUCTION 683
Thematic Area Rajshahi district (n = 20)
VI I NI WS
Repair and maintenance of farm machinery and
implements
0 6 14
1.30
Post-harvest technology of vegetables and fruits 4 13 3 2.05
Marketing and Transportation 20 0 0 3.00
Source: Field survey 2016
(-) indicates not under ranking
Table 7. Training needs of farmers in Rangpur district
Thematic Area Rangpur district (n = 20)
VI I NI WS
Crop Production
Weed Management 0 3 17 1.15
Cropping system 12 8 0 2.60
Water management 0 14 6 1.70
Integrated farming 16 4 0 2.80
Seed production 11 9 0 2.55
Crop diversification 0 13 7 1.65
Nursery management practice 0 9 11 1.45
Crop Protection
Integrated pest management 20 0 0 3.0
Integrated disease management 20 0 0 3.0
Bio-control of pests and diseases 20 0 0 3.0
Production of bio control agents and bio pesticides 20 0 0 3.0
Soil health and fertility management
Soil fertility management 4 16 0 2.20
Soil and Water conservation 11 9 0 2.55
Management of problematic soils 3 14 3 2.00
Soil and water testing 0 0 20 1.00
Integrated nutrient management 0 11 9 1.55
Fertilizer Application 16 4 0 2.80
Vegetable production
Production of low volume and high value crops 9 8 3 2.30

684 RAHMAN et al.
Thematic Area Rangpur district (n = 20)
VI I NI WS
Production of off-season vegetables 20 0 0 3.00
Exotic vegetables production 0 0 20 1.00
Seedling raising 0 8 12 1.40
Export potential vegetables 7 6 7 2.00
Vegetables grading and standardization 7 8 5 2.10
Protective cultivation(green house, shade house) 0 0 20 1.00
Training and pruning 0 0 20 1.00
Plantation crop
Production and management technology 0 11 9 1.55
Processing and value addition 8 5 7 2.05
Tuber crops
Production and management technology 13 7 0 2.65
Processing and value addition 13 7 0 2.65
On farm production of inputs
Bio-agents production 8 8 4 2.20
Bio-pesticides production 6 5 9 1.85
Bio-fertilizer production 18 2 0 2.90
Vermi-compost production 20 0 0 3.00
Agricultural Engineering
Repair and maintenance of farm machinery and
implements
0 2 18 1.10
Post-harvest technology of vegetables and fruits 17 3 0 2.85
Marketing and Transportation 20 0 0 3.00
Source: Field survey 2016
(-) indicates not under ranking
Comparative evaluation of training needs of farmers
Training needs on integrated pest and diseases management, production of bio
control agents and bio pesticides, marketing and transportation ranked top followed by bio-control of pests and diseases, production and management
technology, processing and value addition, vermi-compost production while soil fertility management, fertilizer application, production of off-season vegetables,
vegetables grading and standardization come last on the ranking list in

ASSESSMENT OF TRAINING NEEDS ON CROP PRODUCTION 685
Chattogram district (Table 9).One the other hand water management, integrated
pest and disease management, vermi-compost production, marketing and transportation were main training areas in Khagrachori district as it is apparent
from the weighted score values likewise, the training needs areas ranked in descending order were fertilizer application, soil fertility management,
production of bio control agents and bio pesticides respectively (Table 9).
Besides areas of training needs indicated by the respondents of Rajshahi district
in order of preference were production and management technology, processing and value addition, marketing and transportation, integrated disease management,
water management, integrated pest management, vermi-compost production and production of low volume and high value crops in descending order (Table 8). In
Rangpur district, integrated pest and disease management, bio-control of pests
and diseases, production of bio control agents and bio pesticides, production of off-season vegetables, vermi-compost production, marketing and transportation
were topped the list while training on bio-fertilizer production was the most sought after one (Table 8). Comparing training needs of four districts, integrated
pest and diseases management, vermi-compost production, marketing and transportation areas emerged as important ones. Similar finding was observed in
Barman et al. (2013) who reported fertilizer management, seed treatment, pest and disease management, water management and marketing were the important
training need area where majority farmers had high level of training need.
Table 8. Comparative evaluation of training needs of farmers in four districts
Thematic Area Chattogram Khagrachori Rajshahi Rangpur
WS Rank WS Rank WS Rank WS Rank
Field Crop Production
Weed Management 1.15 - 1.00 - 1.00 - 1.15 -
Cropping system 1.70 - 2.55 - 1.55 - 2.60 6
Water management 2.30 - 3.00 1 2.80 3 1.70 -
Integrated farming 2.05 - 2.70 6 2.50 5 2.80 4
Seed production 2.45 - 1.80 - 1.40 - 2.55 -
Crop diversification 2.15 - 1.45 - 1.65 - 1.65 -
Nursery management practice 1.45 - 1.20 - 1.00 - 1.45 -
Crop Protection -
Integrated pest management 3.00 1 3.00 1 2.80 3 3.0 1
Integrated disease management 3.00 1 3.00 1 2.95 2 3.0 1
Bio-control of pests and diseases 2.95 2 2.65 - 2.35 - 3.0 1
Production of bio control agents
and bio pesticides
3.00 1 2.80 4 2.25 - 3.0 1
Soil health and fertility
management
Soil fertility management 2.80 4 2.85 3 1.50 - 2.20 -

686 RAHMAN et al.
Thematic Area Chattogram Khagrachori Rajshahi Rangpur
WS Rank WS Rank WS Rank WS Rank
Soil and Water conservation 3.00 - 2.10 - 2.40 - 2.55 -
Management of problematic soils 2.90 3 3.00 1 2.45 6 2.00 -
Soil and water testing 1.55 - 1.00 - 1.00 - 1.00 -
Integrated nutrient management 1.75 - 1.65 - 1.35 - 1.55 -
Fertilizer Application 2.80 4 2.95 2 2.35 - 2.80 4
Vegetable production
Production of low volume and
high value crops
1.90 - 1.25 - 2.75 4 2.30 -
Production of off-season
vegetables
2.80 4 2.40 - 2.30 - 3.00 1
Exotic vegetables production 1.50 - 1.00 - 1.00 - 1.00 -
Seedling raising 1.10 - 1.45 - 1.00 - 1.40 -
Export potential vegetables 2.45 - 1.00 - 1.00 - 2.00 -
Vegetables grading and standardization
2.80 4 2.15 - 1.35 - 2.10 -
Protective cultivation (green house, shade house)
1.35 - 1.35 - 1.65 - 1.00 -
Training and pruning 1.25 - 1.25 - 1.00 - 1.00 -
Plantation crops
Production and management technology
1.95 - 1.00 - 1.00 - 1.55 -
Processing and value addition 2.90 3 1.00 - 1.00 - 2.05 -
Tuber crops
Production and management technology
2.95 2 2.70 - 3.00 1 2.65 5
Processing and value addition 2.95 2 2.25 - 3.00 1 2.65 5
On farm production of inputs
Bio-agents production 2.60 - 2.50 - 1.85 - 2.20 -
Bio-pesticides production 2.65 6 2.60 - 2.45 6 1.85 -
Bio-fertilizer production 2.75 5 2.75 5 1.85 - 2.90 2
Vermi-compost production 2.90 3 3.00 1 2.80 3 3.00 1
Agricultural Engineering
Repair and maintenance of farm
machinery and implements
1.10 - 1.30 - 1.30 - 1.10 -
Post-harvest technology of
vegetables and fruits
1.60 - 1.80 - 2.05 - 2.85 3
Marketing and Transportation 3.00 1 3.00 1 3.00 1 3.00 1
Source: Field survey 2016. (-) indicates not under ranking

ASSESSMENT OF TRAINING NEEDS ON CROP PRODUCTION 687
Training received by the respondents
A limited number of training was provided by the Department of Agricultural Extension and Bangladesh Agricultural Research Institute (BARI). The present
study was identified randomly some of the training that was provided by the DAE and BARI among the respondents of four districts. Duration of most of the
training was one day mainly. In Rangpur district, the number of respondents received training was highest. Out of 20 respondents in Rajshahi district, only 9
received training whereas it is only 4 to the other two districts out of 20 respondents (Table 9). But the current study found their deep interest on
receiving training on different crops. Respondents of Rajshahi district wanted training on papaya, wheat, eggplant and chili production practices. Training on
tomato, bitter gourd, cauliflower, felon, coriander was demanded by the
respondents of Chittagong region. At the same time respondents of Khagrachori district demanded training on turmeric, zinger, mango cultivation following by
litchi, mango, zinger, turmeric, and groundnut and potato production practices in Rangpur district (Table 9).
Table 9. Training received and demand for training by the sample farmers
Name of
District
Total no. of
respondents
No. of respondents
received training
Crops on which training should
be delivered
Rajshahi 20 9 Papaya, Wheat, Eggplant, Chili,
Potato
Chittagong 20 4 Tomato, Bitter gourd,
Cauliflower, Felon, Coriander
Khagrachori 20 4 Turmeric, Zinger, Eggplant,
Mango, Rice, Bitter gourd
Rangpur 20 13 Litchi, Mango, Zinger, Turmeric,
Groundnut and Potato
Source: Field survey 2016
Respondents of the present study received a number of training from DAE and BARI. Table 10 shows a list of different training programs received by
the sample farmers and their ranking as very good, good and poor. Identification of adulterated fertilizer, insecticide and pesticide, disease and
insects of mango varieties, bagging system of mango, insecticide and pesticide application, vegetables production techniques as very good type of
training (Table 10). Beside this, production technology of potato and pumpkin and seedlings preparation considered as poor type of training among the
survey respondents.
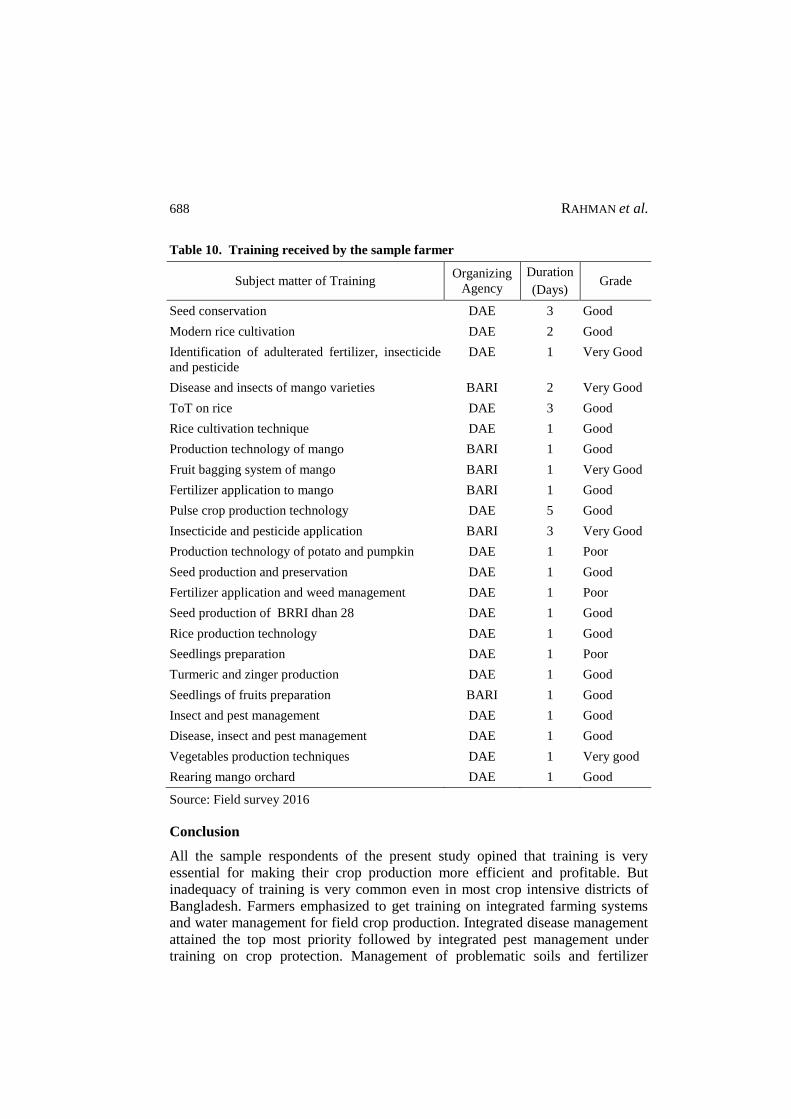
688 RAHMAN et al.
Table 10. Training received by the sample farmer
Subject matter of Training Organizing
Agency
Duration
(Days) Grade
Seed conservation DAE 3 Good
Modern rice cultivation DAE 2 Good
Identification of adulterated fertilizer, insecticide
and pesticide
DAE 1 Very Good
Disease and insects of mango varieties BARI 2 Very Good
ToT on rice DAE 3 Good
Rice cultivation technique DAE 1 Good
Production technology of mango BARI 1 Good
Fruit bagging system of mango BARI 1 Very Good
Fertilizer application to mango BARI 1 Good
Pulse crop production technology DAE 5 Good
Insecticide and pesticide application BARI 3 Very Good
Production technology of potato and pumpkin DAE 1 Poor
Seed production and preservation DAE 1 Good
Fertilizer application and weed management DAE 1 Poor
Seed production of BRRI dhan 28 DAE 1 Good
Rice production technology DAE 1 Good
Seedlings preparation DAE 1 Poor
Turmeric and zinger production DAE 1 Good
Seedlings of fruits preparation BARI 1 Good
Insect and pest management DAE 1 Good
Disease, insect and pest management DAE 1 Good
Vegetables production techniques DAE 1 Very good
Rearing mango orchard DAE 1 Good
Source: Field survey 2016
Conclusion
All the sample respondents of the present study opined that training is very
essential for making their crop production more efficient and profitable. But inadequacy of training is very common even in most crop intensive districts of
Bangladesh. Farmers emphasized to get training on integrated farming systems and water management for field crop production. Integrated disease management
attained the top most priority followed by integrated pest management under training on crop protection. Management of problematic soils and fertilizer

ASSESSMENT OF TRAINING NEEDS ON CROP PRODUCTION 689
application were most needed training under soil health and fertility management
while training with respect to production of off-season vegetables was the most important one under vegetable production. Training on tuber crops cultivation
was also in high demand for areas of production and management technology, processing and value addition of tuber crops. Vermi-compost production secured
the top most position in the list under on- farm production of inputs followed by bio-pesticides and bio-fertilizers production. Marketing and transportation
accorded highest response from the farmers in four districts in the assessment of training needs. A number of training in the survey area was identified as very
useful for the farmer while some were regarded as poor in quality and necessity. It indicates a gap in farmer’s knowhow and actual information which needs to be
addressed through designing and developing a training module. The BARI and
DAE can reorient their training schedule and subject matter based on these findings to enrich farmer’s knowledge on improved crop production techniques.
Recommendations
Based on the findings of the study, the following recommendations are
suggested:
An extensive research programme should be conducted covering all the
intensive crop growing areas of Bangladesh to identify the appropriate crop production needs of farmers.
DAE should arrange training progrmme based on the necessity of the farmers. Otherwise, it will not bring any positive outcome in the crop
production systems of Bangladesh. Training identified as not very good should be discarded and good one should be developed with current
information and knowledge.
Much emphasis should be paid on integrated farming systems, integrated pest
and disease management and technologies for soil and water conservation while planning and designing training programmes for farmers.
Both extensive and intensive hand on-training programmes should be emphasized for farmers through proper assessment of their training needs.
The concerned different centers and divisions of BARI should pay relatively
higher emphasis and care on those specific most important needs, as identified by this study through concerted efforts while formulating different
training module for the farmers in hills and plain areas as well as different agro-climatic and farming system areas of Bangladesh.
Farmers regular contact with BARI avail themselves with latest crop production techniques and information. So, BARI should increase their
farmers training and field day workshops in different agro ecological zone of Bangladesh.

690 RAHMAN et al.
References
Ajayi, A.O. 1995. Identification of Training Needs of Women Farmers in Oye State. Un
publised M.Sc. Thesis, Agric. Extension and Rural Sociology, O.A.U.Ile-Ife
Alam, A. M. 2006. Training needs of farmers on rice production in Dhamrai upazila
under Dhaka district. M.S. Thesis, Department of Agricultural Extension and
Information System, Sher-e-Bangla Agricultural University, Dhaka.
Babu, A. R. and R. P. Singh. 1986. Training Your Farm Man power of Extension
Education. Indian Journal of Extension Education. 22(3&4): 33-39.
Barbazette, J. 2006. Training Needs Assessment: Methods, Tools, and Techniques. San
Francisco: Pfeiffer CaffarelaRoaemary S 2002.
Barman, S. K. Pathak and. P.K. Pathak. 2013.Journal of Academic and Industrial
Research. 1(11), 686.
BBS. 2017. Statistical Yearbook of Bangladesh, Bangladesh Bureau of Statistics,
Ministry of Planning, Government of the People’s Republic of Bangladesh.
Caffarela R. S. 2002. Planning Programmes for Adult Learners. A Practical Guide for
Educators, Trainersand Staff Developers. 2nd Edition. San Francisco: John Wiley
and Sons.
Chauhan, K. N. K. and K. D. Kokate. 1986. Training Stratey for Farmers of Arid zone.
Aperceptual Study. Indian Journal of Extension Education. 22 (3&4): 43-45.
HIES. 2016. Household Income and Expenditure Survey, Bangladesh Bureau of
Statistics,Government of the People’s Republic of Bangladesh.
Meenanbigai, J. and R K. Seetharamen. 2003. Training Needs of Extension Personnel in
Communication and Transfer of Technology. Agriculture Newsletter, No.48:19.
National Agriculture Policy. 2013. Ministry of Agriculture, Government of the People’s
Republic of Bangladesh.
Pandey R.K., et al. 2015. A Critical Analysis on Training Needs of Farmers About
Mustard Production Technology. International Journal of Agriculture Sciences,
ISSN: 0975-3710 & E-ISSN: 0975-9107, Volume 7, Issue 14, pp.-892-895.
Pholonngoe, M.B. and L. Richard. 1995. Training Manual for Non formal and Adult
Education Trainers. Extension Educator, Maseru: Lesotho Association of NFP.
Sajeev, M.V. and A.K. Singha. 2010. “Capacity building through KVKs: Training Needs
Analysis of Farmers of Arunachal Pradesh” Indian Res. J. Ext. Edu. 10 (1): 83-90.
Wikipedia: https://en.m.wikipedia.org accessed on 15/10/2018.

ISSN 0258-7122 (Print), 2408-8293 (Online)
Bangladesh J. Agril. Res. 43(4): 691-702, December 2018
INTERCROPPING GARDENPEA (Pisium sativum) WITH
MAIZE (Zea mays) AT FARMERS’ FIELD
M. A. H. KHAN1, N. SULTANA1, N. AKTER2
M. S. ZAMAN3 AND M. R. ISLAM4
Abstract
An experiment was conducted at the farmers’ field of Phulpur MLT site of On-
Farm Research Division, Bangladesh Agricultural Research Institute (BARI),
Mymensingh during 2015-16 and 2016-17 to find out a suitable intercrop
combination of garden pea with maize for higher productivity and profitability.
Five treatments, viz. T1= Maize (100%) + one row garden pea (33%) in between
maize lines, T2= Maize (100%) + two row garden pea (66%) in between maize
lines, T3= Maize (100%) + garden pea broadcast (100%) in between maize lines,
T4= Sole maize and T5= Sole garden pea were tested following RCB design with
six dispersed replications. Maize var. BARI Hybrid Maize-9 and garden pea var.
BARI Motorshuti-3 were used in monoculture as well as in intercropping
situations. Intercropping of garden pea improved the yield components of maize
and offered some additional yield. The highest maize grain yield (8.62 t ha-1)
and maize equivalent yield (20.22 t ha-1 yr-1) were recorded with maize (100 %)
+ two rows of garden pea (66 %) in between maize lines (T2). The values of all
the competition functions were greater than unity and maize (100 %)+ two rows
of garden pea (66 %) in between maize lines (T2) showed higher values of land
equivalent ratio (1.56), gross return (Tk. 311920 ha-1), gross margin (Tk. 175697
ha-1) and BCR (2.29) as compared to other treatments.
Keywords: Maize, gardenpea, intercropping, land equvalent ratio, benfit-cost
Introduction
Bangladesh is an agricultural country and about 14.22 % of the gross domestic product (GDP) comes from agriculture (BBS, 2017). But the cultivable land area
is decreasing with the increase in population and subsequent urbanization and industrialization in Bangladesh. Increasing food demand for additional
population is creating challenge to the country for increasing productivity of the
limited land. Intercropping system is one of the most common practice used more than one crop together in sustainable agricultural system to increase the
productivity and stability of yield in order to improve resource utilization and environmental factors (Alizadeh et al., 2010). The main concept of intercropping
is to get increased total productivity per unit area and time, besides equitable and judicious utilization of land resource. Intercropping brings an increase in
1Senior Scientific Officer, 2Scientific Officer, 3Principal Scientific Officer, OFRD,
Bangladesh Agricultural Research Institute (BARI), Mymensingh, 4Chief Scientific
Officer, OFRD, BARI, Joydebpur, Gazipur, Bangladesh.
DOI: http://dx.doi.org/10.3329/bjar.v43i4.39166

692 KHAN et al.
production or yield benefits, more efficient use of water, land, nutrients and labors reduction in problems caused by pests, diseases and weeds (Awal et al.,
2006).
Maize is ranked third after rice and wheat among the most important cereal crops
in Bangladesh. Maize is normally grown in wider row spacing (60 cm) and inter row space can profitably be utilized for higher returns. So, farmers can easily
grow a short duration crop as intercrop with maize at early growth stage. Garden pea is an important legume crop as well as a primary source of plant protein for
human and animals. Garden pea is a short duration (60-70 days), high value rabi crop suitable for the farmers’ to earn quick return as well as cropping intensity
will be increased without hampering the growth and yield of maize.
Hybrid maize covers a vast area of Mymensingh district as a single crop in rabi season. Moreover, garden pea as a leguminous crop, incorporation of green
biomass of garden pea into soil after harvest of pods may increase soil fertility and soil organic matter. Legume in an intercropping system not only provides
nitrogen to the associated crops but also increase the amount of humus in the soil due to decaying crop remains. Legumes as intercrop with maize instead of
showing any adverse effect on maize increase its yield (Singh and Bajpai, 1991 and Mucheru et al., 2010). Better intercrop production could be achieved with
the choice of appropriate crops, population density and planting geometry of component crops (Santalla et al., 2001). In this context, the experiment was
undertaken to find out the suitable intercrop combination of garden pea with maize for increasing total productivity and profitability.
Materials and Methods
The experiment was conducted at the farmers’ field of Phulpur MLT site, On-Farm Research Division, Bangladesh Agricultural Research Institute (BARI), Mymensingh during 2015-16 and 2016-17. The experimental site was situated at approximately 24038/N and 90016/E with the altitude of 19 m above sea level. Mean annual precipitation was 2212 mm, most of which (90 %) was received during May to September due to monsoon. The soil was typical Dark Grey Floodplain with sandy loam to silty loam in texture of the medium highland having pH 6.2 to 6.5 under the Agro-ecological Zone-9 (AEZ-9). The experiment consisted of five treatments, viz. T1= Maize (100%) + one row garden pea (33%) in between maize lines, T2= Maize (100%) + two row garden pea (66%) in between maize lines, T3= Maize (100%) + garden pea broadcast (100%) in between maize lines, T4= Sole maize and T5= Sole garden pea. The maize var. BARI Hybrid Maize-9 and garden pea var. BARI Motorshuti-3 were used in the experiment. The experiment was laid out in randomized complete block design with six dispersed replications. The unit plot size was 8.0 m × 5.0 m. Maize was the main crop and garden pea was grown as intercrop in the study. Garden pea was intercropped in between maize row @ 33, 66 and 100% plant population. Maize seeds were sown at 60 cm × 20 cm spacing both in sole and intercrop

INTERCROPPING GARDENPEA (Pisium sativum) WITH MAIZE 693
situation. Except broadcasting, garden pea seeds were sown maintaining 25 cm row to row and 12 cm plant to plant spacing both in sole and intercrop. The crops maize and garden pea were sown on 20 November, 2015 and 12 November, 2016. The recommended doses of fertilizers such as, 250-55-120-50-5-1 kg NPKSZnB ha-1 and 45-30-45 kg NPK ha-1 for sole crop of maize and garden pea, respectively were applied separately in sole crop. In intercropping maize was fertilized with 250-55-120-50-5-1 kg NPKSZnB ha-1 in the form of urea, triple super phosphate, muriate of potash, gypsum, zinc sulphate and boric acid, respectively. One third of N and all other fertilizers were applied as basal during final land preparation by broadcasting method. Remaining two-third of N was split equally and applied at 8-10 leaves stage after harvesting of garden pea and tasseling stage beside maize rows. Mulching and hand weeding were done as and when required to keep the field reasonable weed free. Drasban was sprayed at 15-20 days intervals as precautionary measure against insects attack. Garden pea was harvested on 23 January 2016 and 15 January 2017 and maize was also harvested on 17 April 2016 and 05 April 2017, respectively. The yield contributing characters of garden pea and maize were recorded from 10 randomly selected plants in both the years. Harvest index (HI) was calculated as per following equation:
HI (%) = 100yield Biological
yield Economic
Yield of individual crop was converted into equivalent yield on the basis of the prevailing market price of individual crop (Prasad and Srivastava, 1991).
Maize equivalent yield (MEY) = Yim + Pm
PgYig , and
Garden pea equivalent yield (GEY) = Yig + Pg
PmYim
Where, Yim= Yield of intercrop maize, Pg= Price of garden pea, Pm= Price of
maize and Yig= Yield of intercrop garden pea
Various competition functions viz., land equivalent ratio (LER), area time
equivalent ratio (ATER), system productivity index (SPI), replacement value of intercropping (RVI), monetary advantage index (MAI), aggressivity index (A),
competitive ratio (CR) and relative crowding coefficient (RCC) were worked out
by using following formula to find out the benefit of intercropping and the effect of competition between the treatments used in this experiment.
ATER= TTYsg
YiT
Ys
Yig
gm
m
m
, Where Yim= Yield of maize in
intercropping, Ysm=yield of maize in sole cropping, Yig= yield of garden pea in

694 KHAN et al.
intercropping, Ysg= yield of garden pea in sole cropping, Tm= Duration of maize, Tg= Duration of garden pea and T= Total duration of intercropping system.
RVI =smmsm
gigmim
CPY
PYPY
Where Yim & Yig are the yield of intercrops, Pm &
Pg are the respective market price of these crops, Ysm & Csm are the yield and
input cost of the main crop in sole stand.
MAI= 1)(LERLER
yield intercrops combined of alueMonetary v
Relative crowding coefficient (RCC): RCCmaize ×, RCCgarden pea,
Where, RCC maize =ZmpYim)-(Ysm
ZgiYim
, and
RCCgarden pea =ZgpYig)-(Ysg
ZmpYig
where Zmp and Zgp are the proportion of maize
and garden pea in the mixture, respectively.
Aggressivity (A) index:
Amaize=ZgpYsg
Yig
ZmpYsm
Yim
and Agardenpea=
ZmpYsm
Yim
ZgpYsg
Yig
.
Competitive Ratio (CR):
CR maize= mp
gp
peagarden
maize
Z
Z
LER
LER
and CR garden pea= gp
mp
maize
peagarden
Z
Z
LER
LER
SPI= gg
mYi
Ys
Ys +Yim, Where Ysm and Ysg= Mean yield of maize and garden
pea in sole cropping, Yim and Yig= Mean yield of maize and garden pea in
intercropping.
Data on yield and yield contributing characters were collected properly. Data
were statistically analyzed using analysis of variance technique with the help of computer package MSTAT-C and mean comparison among the treatments were
made by Least Significant Difference (LSD) test at 5% level of significance (Gomez and Gomez, 1984). Pooled analysis was done as because there was no
significant variation in yield and yield parameters between the years. Finally, benefit cost ratio was calculated based on prevailing local market price.

INTERCROPPING GARDENPEA (Pisium sativum) WITH MAIZE 695
Results and Discussion
Yield attributes of maize
Number of grains cob-1 and grain yield of maize were significantly influenced by
maize+garden pea intercropping systems (Table 1). The number of cobs plant-1 was not influenced significantly and similar trend was followed in case of plant
height. There was trend to increase grains cob-1 in intercropping situation than sloe crop. Increased number of grains cob-1 of maize was also reported in maize-
soybean intercropping system by Zhang and Li (1987) and Rana et al. (2001). Thousand grains weight of maize was not significantly influenced due to
intercropping but there was an increasing trend when garden pea was intercropped with maize. Increased thousand grains weight was also noticed by
Zhang and Li (1987) when maize was intercropped with leguminous crop like
soybean. Singh et al. (2000) also reported that inclusion of legumes as intercrops increased the yield attributes viz., number of cobs plant-1, grains cob-1 and
thousand grains weight of maize.
Grain yield of maize
Grain yield of maize was influenced when intercropped with garden pea. Maize gained yield advantage of 1.83 to 5.12 % due to legume association as compared
to sole maize (Table 1). The highest maize grain yield (8.62 tha-1) was recorded when maize (100 %) + two rows of garden pea (66 %) intercropped in between
maize lines (T2) with 5.12 % increment in yield as compared to sole maize. The yield advantage of maize in intercropping systems might be resulted from maize-
legume association due to symbiotic nitrogen fixation by garden pea and current transfer of nitrogen to the associated maize plants. This result corroborates with
the findings of Rana et al. (2001) who reported that grain yield of maize was increased 2.32 to 7.50 % over sole cropping when it was intercropped with grain
legumes (soybean, urdbean and cowpea). Kheroar and Patra (2013) also reported that the highest maize grain yield was recorded with maize + green gram
intercropping system. The harvest index (HI) of maize did not differ by the intercropping systems. The harvest index of maize had higher value in T3>T2>T1
>T4.
Yield and yield attributes of garden pea
Yield and yield contributing characters of garden pea were significantly
influenced by maize+garden pea intercropping systems (Table 2). All the intercrops grown with maize were shorter in height than sole crop. Garden pea in
association with maize decreased 25.89 to 31.33 % pods plant-1 and 3.94 to 12.11 % seeds pod-1. Sole garden pea (T5) produced higher number of pods (16.34)
plant-1 as well as seeds (3.55) pod-1. Significant differences in thousand seeds weight and harvest index were noticed. The entire intercrops garden pea was
recorded lower 1000-seeds weight than sole crop. The higher pod yield (6.45 tha-

696 KHAN et al.
1) was produced in sole garden pea (T5) which was statistically different with intercrops yield due to cumulative effect of yield attributes. Lower yield was
obtained from all the intercrops than sole crop might be due to lower plant population and yield attributes.
Table1. Yield attributes, grain yield and harvest index of maize as influenced by
different intercropping systems at Mymensingh during 2015-16 and 2016-
17 (pooled)
Treatment
Plant
height (cm)
Cob plant-
1
(no.)
Grains cob-1
(no.)
1000-
grains
weight (g)
Grain yield
(t ha-1)
Harvest
index (%)
T1 202.11 1.43 616 325.40 8.35 41.47
T2 200.40 1.44 629 322.10 8.62 41.52
T3 198.35 1.39 612 325.50 8.40 41.76
T4 202.30 1.35 609 320.90 8.20 39.50
LSD(0.05) NS NS 8.49 NS 0.31 -
CV (%) 8.52 7.29 4.99 5.41 6.59 -
T1= Maize (100%) + one row garden pea (33%) in between maize lines, T2= Maize
(100%) + two row garden pea (66%) in between maize lines, T3= Maize (100%) + garden
pea broadcast (100%) in between maize lines and T4= Sole maize
Yield of garden pea was reduced due to reduction in plant population in intercropping situations. Garden pea yield was decreased by 32.59 to 54.41 %
than sole crop due to receipt lower amount of incoming solar radiation as well as lower number of plants in intercropping systems. Yield was mostly affected due
to tall maize plants shaded the short statured garden pea plants which affected the rate of photosynthesis and thereby translocation of photosynthates from source to
sink. Patra et al. (2000) also recorded lower number of pods plant-1, seeds pod-1 and decreased in yield of soybean, green gram, groundnut and black gram due to
intercropping legumes with maize as compared to their monoculture which
corroborated the present findings. Sole crop of garden pea recorded the highest harvest index (31.80 %) among the treatments. The harvest index of garden pea
had higher value in T5>T2>T3 >T1.
Maize and garden pea equivalent yield
Maize and garden pea equivalent yield were recorded to be higher in all intercropping systems with respect to pure stand yield of their corresponding sole
crops yields (Table 3). The highest maize equivalent yield (20.22 t ha-1yr-1) as well as garden pea equivalent yield (7.58 t ha-1yr-1) were recorded from maize
(100 %) + two rows of garden pea (66 %) in between maize lines (T2) which covered the yield advantages of 147 and 18 % over their respective sole crops.
Such yield advantage might be due to combined yield of both the crops. Similarly, Chalka and Nepalia (2005) also observed that introduction of different

INTERCROPPING GARDENPEA (Pisium sativum) WITH MAIZE 697
legume crops did not affect yield attributes and yield of maize but significantly
increased maize equivalent yield.
Table 2. Yield attributes, pod yield and harvest index of garden pea as influenced by
different intercropping systems at Mymensingh during 2015-16 and 2016-
17 (pooled)
Treatment Plant height
(cm)
Pods plant-1
(no.)
Seeds pod-1
(no.)
1000-seeds
weight (g)
Pod yield
(t ha-1)
Harvest index (%)
T1 43.33 12.11 3.41 284.35 2.94 23.35
T2 38.39 11.98 3.24 296.57 4.35 27.43
T3 37.43 11.22 3.12 284.31 3.86 26.10
T5 56.68 16.34 3.55 322.18 6.45 31.80
LSD(0.05) 5.38 1.18 0.68 3.14 0.83 -
CV (%) 7.12 5.46 6.68 6.12 6.84 -
T1= Maize (100%) + one row garden pea (33%) in between maize lines, T2= Maize
(100%) + two row garden pea (66%) in between maize lines, T3= Maize (100%) + garden
pea broadcast (100%) in between maize lines and T5= Sole garden pea
Cost-benefit analysis
An increase in gross return and gross margin was found due to intercropping of garden pea with maize as compared with sole crop. Maize (100 %) + two rows
of garden pea (66 %) in between maize lines (T2) was recorded the highest monetary advantage Tk. 175697 ha-1 which gave an additional income of Tk.
1,21,648 ha-1 over sole maize and Tk. 50,448 ha-1 over sole garden pea (Table 3). Total cultivation cost was lower in sole crop and higher in intercropping
treatments might be due to inclusion of component crop. Intercropping of garden pea brought about an increase in return per taka investment. It was
evident that intercropping was always beneficial and recorded higher benefit cost ratio (BCR) with respect to monoculture of maize and garden pea. Among
the intercropping systems, maize (100 %) + two rows of garden pea (66 %) in between maize lines (T2) obtained the highest benefit cost ratio of 2.29 which
further indicated the superiority to T2 over other treatments. These results are in
agreement with the findings of Bharati et al. (2007) who stated that maize based intercropping gave higher net return than sole crop of maize. Similarly,
Maize+legume intercropping was more productive and remunerative as compared to sole cropping stated by Kamanga et al. (2010), which was in close
agreement with the present findings.
Land Equivalent Ratio (LER): The values of land equivalent ratio (LER) in
different intercropping systems were found to be greater than unity indicating higher land use efficiency of intercropping systems over the respective
monoculture (Table 4). Yield advantages occurred in intercropping was mainly due to the development of both temporal and spatial complementarities.

698 KHAN et al.
However, the total LER value (1.56) was highest in maize (100 %) + two rows of garden pea (66%) in between maize lines (T2), where maize and garden pea
achieved 89 and 67 % of their sole yields, respectively indicating higher biological and economic efficiency. It also expressed that by intercropping maize
with garden pea, a farmer can produce 8.62 tons maize and 4.35 tons garden pea in one hectare of land instead of growing them separately as sole crop. Nurbaksh
et al. (2013) also found similar results in intercropping of sesame and bean.
Table 3. Equivalent yield and cost benefit analysis of maize + garden pea
intercropping systems at Mymensingh (average 2015-16 and 2016-17)
Treatment
Equivalent Yield
(t ha-1 yr-1) Gross return
(Tk. ha-1)
Total cost
(Tk. ha-1)
Gross
margin (Tk. ha-1)
BCR
Maize Garden pea
T1 16.19 6.07 251200 126869 124331 1.98
T2 20.22 7.58 311920 136223 175697 2.29
T3 18.69 7.01 288800 135660 153140 2.13
T4 8.20 - 131200 77151 54049 1.70
T5 - 6.45 258000 132751 125249 1.94
Input and output Price: Urea=Tk.16.00 kg-1, TSP= Tk. 23.00 kg-1, MoP= Tk. 16.00 kg-
1, Gypsum = Tk. 10.00 kg-1, Zinc sulphate= Tk. 180.00kg-1, Boric acid= Tk. 220.00 kg-1,
Maize grain= Tk. 15.00 kg-1 and Garden pea (green pod) = Tk. 40.00 kg-1
Area Time Equivalent Ratio (ATER): The area time equivalent ratio (ATER)
included the duration of the intercrops in intercropping systems in the field and
also evaluated the crop yield per day basis. ATER values were found greater than unity in all the intercropping systems. Maize (100%) + garden pea (66 %) in
between two lines of maize intercropping system (T2) showed higher ATER value (1.28) which was about 8.0 and 6.0 % higher than that of ATER values
obtained from T1 and T3 which indicating higher yield per day (Table 4). So, the intercropping system was found to be advantageous in comparison to sole crop.
This was achieved due to the development of temporal as well as spatial complementary. Mohan et al. (2005) also reported that the LER and ATER were
higher in maize + legume in 1:2 proportion than in 1:1 proportion.
System Productivity Index (SPI): The system productivity index (SPI) which
standardized the yield of the secondary crop (garden pea) in terms of the primary crop (maize) and also identified the combinations that utilized the growth
resources most effectively and maintained a stable yield performance (Tajudeen, 2010). The results showed that maize 100% + two rows of garden pea (66 %) in
between two maize lines (T2) intercropping system gave the highest SPI value (14.21) than other intercropping systems (Table 4). The values of SPI were
higher and largely determined by maize intercrop yields which were not much
reduced by intercropping with garden pea.

INTERCROPPING GARDENPEA (Pisium sativum) WITH MAIZE 699
Replacement Value of Intercropping (RVI): Replacement value of
intercropping (RVI) is one of the better measures of economic advantage of intercropping. Maximum value (6.62) of RVI was observed in maize (100 %) +
two rows of garden pea (66 %) in between maize lines (T2) intercropping system (Table 4). This implies that, farmers who practice intercropping of two rows of
garden pea in between maize lines (T2) could make 562% more profit than the farmers who are involved in maize or garden pea monoculture.
Monetary Advantage Index (MAI): The monetary advantage index (MAI) values were positive in all intercropping systems (Table 4). The result also gives
an indication of the yield and economic advantages in maize-garden pea intercropping systems over their sole cropping. The highest MAI (Tk. 1,11,971
ha-1) was obtained in maize (100 %) + two rows of garden pea (66 %) in between
maize lines (T2), which implied that the planting pattern was highly economical and advantageous for the mixtures. The results are in agreement with the finding
of Islam et al. (2016) who reported that higher MAI values found in turmeric-sesame intercropping systems compared to sole cropping system. Dhima et al.
(2007) reported that if LER and relative crowding coefficient (RCC) values were higher than there was an economic benefit expressed with MAI values such as
obtained in the present study.
Table 4. Competition functions as influenced by maize + garden pea intercropping
systems at Mymensingh (average of 2015-16 and 2016-17)
Treatment LER values
ATER SPI RVI MAI
(Tk. ha-1) Maize Garden pea Total
T1 0.93 0.46 1.39 1.18 12.09 5.30 70,481
T2 0.89 0.67 1.56 1.28 14.21 6.62 1,11,971
T3 0.86 0.60 1.46 1.21 13.31 6.12 90,992
T4 1.00 00 1.00 - - - -
T5 00 1.00 1.00 - - - -
Aggressivity (A): The competitive ability of the component crops in an
intercropping system is determined by its aggressivity value. Regardless of the
intercropping system, there was a positive sign for maize and a negative sign for garden pea indicating that maize was dominant crop (+ve) while garden pea
appeared as dominated crop (-ve). Higher aggressivity value (0.426) was calculated with maize (100 %) + broadcast of garden pea (100%) in between
maize lines (Table 5). Results showed positive aggressivity for maize at (100%) + two rows of garden pea (66%) in between maize lines and maize (100%) +
broadcast of garden pea (100%) in between maize lines planting pattern while it proved less competitive and was dominated by garden pea at maize (100 %) +
one line garden pea (33%) in between maize lines.

700 KHAN et al.
Competitive Ratio (CR): The competitive ratio values showed variation among
the intercropping indicating differential competitive ability of component crop as
influenced by intercrops of garden pea (Table 5). Garden pea showed higher
value of CR (0.70-1.50) than maize (0.67-1.43) indicating garden pea as the best
competitor than maize. Consequently, maize (100%) + one row of garden pea
(33%) in between two maize lines (T1) intercropping system with higher
difference of CR (0.83) exhibited dissimilarities in competitiveness between the
component crops. However, Maize (100%) + two rows of garden pea (66%) in
between maize lines (T2) intercropping system with lower difference of CR
(0.56) showed merely similar competitiveness between the component crops. The
results expressed that similar competitiveness with minimum CR between
component crops provided complementary utilization of growth resources for
better performance of intercropping with higher productivity. These results are in
agreement with the findings of Islam et al. (2016).
Table 5. Aggressivity index (A), competitive ratio (CR) and relative crowding
coefficient (RCC) of maize and garden pea in maize + garden pea
intercropping systems at Mymensingh (average of 2015-16 and 2016-17)
Treatment
Aggressivity
index (A) Competitive ratio (CR)
Relative Crowding
Coefficient (RCC)
Maize Garden
pea Maize
Garden
pea Differences Maize
Garden
pea Total
T1 -0.024 0.024 0.67 1.50 0.83 -18.37 2.54 46.66
T2 0.003 -0.003 0.88 1.14 0.56 -13.55 3.14 42.55
T3 0.420 -0.420 1.43 0.70 0.73 -42.00 1.49 62.58
T4 - - - - - - - -
T5 - - - - - - - -
T1= Maize (100%) + one row garden pea (33%) in between maize lines, T2= Maize
(100%) + two row garden pea (66%) in between maize lines, T3= Maize (100%) + garden
pea broadcast (100%) in between maize lines and T5= Sole garden pea
Relative Crowding Coefficient (RCC): Relative crowding coefficient (RCC) of
maize and garden pea was more than unity indicating greater non-competitive
interference than the competitive one. The intercropped garden pea had higher
relative crowding coefficient values than the intercropped maize. Negative
relative crowding coefficient values for maize were obtained in all intercropping
systems (Table 5). In this study, 100 % maize + 100 % garden pea (T3) had the
maximum RCC value (62.58) and after that 100% maize + 33% garden pea (T1)
and100% maize + 66 % garden pea (T2) with 46.66 and 42.55, respectively.

INTERCROPPING GARDENPEA (Pisium sativum) WITH MAIZE 701
Conclusion
From the experimental findings it can be concluded that the productivity of unit land area is increased by intercropping rather than monocultures. Maize
intercropped with garden pea produced higher grain yield than maize sole crop. The competitive functions also showed that intercropping had a major advantage
over sole cropping. So, for optimum and sustainable productivity and profitability of maize-garden pea intercrop combinations, a planting pattern
comprising of maize (100 %) + two rows of garden pea (66%) in between maize lines (T2) could be suitable combination in Old Brahmaputra Floodplain (AEZ-9)
to increase land use efficiency and maximum profit.
Acknowledgements
The authors are grateful to On-Farm Research Division, Bangladesh Agricultural
Research Institute (BARI) for all sorts of support pertaining to the experimentation. The authors offer special thanks to field staffs and cooperator
farmers of Mymensingh for their help and cooperation during the period of the study.
References
Alizadeh, Y., A. Koocheki and M. N. Mahallati. 2010. Yield, yield components and
potential weed control of intercropping bean (Phaseolus vulgaris L.) with sweet basil
(Ocimum basilicum L.). Iranian J. of Field Crops Res. 7 (2): 541-553.
Awal, M. A., H. Koshi and T. Ikeda. 2006. Radiation interception and use by
maize/peanut intercrop canopy. Agricultural and Forest Meteorology. 139: 74-83.
BBS (Bangladesh Bureau of Statistics). 2017. Statistical Year Book of Bangladesh,
Statistics Division, Ministry of Planning, Government People’s Republic of
Bangladesh, Dhaka.
Bharati, V., R. Nandan, V. Kumar, I. B. Pandy. 2007. Effect of irrigation levels on yield,
water use efficiency and economics of winter maize (Zea mays) based intercropping
systems. Indian J. Agron. 52 (1):27-30.
Chalka, M. K. and V. Nepalia. 2005. Production potential and economics of maize
intercropped with legumes as influenced by weed control. Indian J. Agron., 50
(2):119-120.
Dhima, K. V., A. A. Lithourgidis, I. B. Vasilakoglou and C. A. Dordas. 2007.
Competition indices of common vetch and cereal intercrops in two seeding ratio.
Field Crop Research. 100: 249-256.
Gomez, K. A., and A. A. Gomez. 1984. Statistical procedure for agricultural research, 2nd
ed. John Willey and Sons, New York, USA. Pp. 241-271.
Islam, M. R., M. S. M. Molla and M. A. K. Main. 2016. Productivity and profitability of
intercropping sesame with turmeric at marginal farmers level of Bangladesh. SAARC
J. Agril. 14(1):47-58.

702 KHAN et al.
Kamanga, B. C. G., S. R. Waddington, M. J. Robertson and K. E. Giller. 2010. Risk
analysis of maize-legume crop combination with small holder farmers varying in
resource endowment in Central Malawi. Expt. Agric. 46 (1): 1-21.
Kheroar, S., and B. C. Patra. 2013. Advantages of maize-legume intercropping systems.
J. of Agril. Sci. and Tech. 3(3): 733-744.
Mohan, H. M., B. M. chittapur, S. M. Hiremath and V. P. Chimmad. 2005. Performance
of maize under intercropping with grain legumes. Karnataka J. Agril. Sci. 18 (2):
290-293.
Mucheru, M. M., P. Pypers, D. Mugendi, J. Mugwe, R. Merckx and B. Vanlauwe. 2010.
A staggered maize-legume intercrop arrangement robustly increases crop yields and
economic returns in the highlands of Central Kenya. Field Crop Res. 115 (2): 132-
139.
Nurbakhsh, F., A. Koocheki and M. Nassiri Mahallati. 2013. Evaluation of yield, yield
components and different intercropping indices in mixed and row intercropping of
sesame (Sesamum indicum L.) and bean (Phaseolus vulgaris L.). International J.
Agric. Crop Sci., 5 (17): 1958-1965.
Patra, B. C., B. K. Mandal and A. L. Padhi. 2000. Production potential of winter maize
(Zea mays) based intercropping systems. Indian J. Agril. Sci., 70 (4):203-206.
Prasad, K., and R. C. Srivastava. 1991. Pigeon pea (Cajanus cajan) and (Glycine max)
intercropping system under rainfed situation. Indian J. Agric. Sci. 61: 243-246.
Rana, R. S., B. Singh and S. C. Negi. 2001. Management of maize/legume intercropping
under mid-hill sub-humid conditions. Indian J. Agril. Res. 35: 100-103.
Santalla, M., A. P. Rodino, P. A. Casquero and A. M. De Ron. 2001. Interactions of bush
bean intercropped with field and sweet maize. European J. Agron. 15: 185-196.
Singh, D P., N. S. Rana and R. P. Singh. 2000. Planting geometry in maize and
blackgram intercropping system under rainfed low hill valley of Kumaon. Indian J.
Agron. 45: 274-278.
Singh, V. K., and R. P. Bajpai. 1991. Intercropping in maize under rainfed condition.
Indian J. Agron. 36 (3):398-399.
Tajudeen Olusegun Osen. 2010. Evaluation of sorghum-cowpea intercrops productivity
in savanna agro-ecology using competition indices. J. Agril. Sci. 2 (3): 229-234.
Zhang, X. L. and B. H. Li. 1987. A study on the complementary and competitive effects
induced by intercropping and mixed cropping of maize and soybean on fertile land.
Scientia Agricultura Sinica. 20 (2): 34-42.

ISSN 0258-7122 (Print), 2408-8293 (Online)
Bangladesh J. Agril. Res. 43(4): 703-716, December 2018
IN VITRO SHOOT REGENERATION OF MINT (Mentha sp. L.) USING
DIFFERENT TYPES OF EXPLANTS AND LEVELS OF
BENZYLAMINOPURINE
K. T. AKTER1 AND M. A. HOQUE2
Abstract
An experiment was conducted in the Tissue Culture Laboratory of the
Department of Horticulture, Bangabandhu Sheikh Mujibur Rahman Agricultural
University, Salna, Gazipur-1706 from March 2013 to February 2014 for in vitro
shoot regeneration of mint using different explants and levels of
benzylaminopurine (BAP) in full strength MS media. Three different types of
explants viz. nodal segment, shoot tip and leaf were evaluated using three levels
of BAP (1.0, 2.0 and 3.0 mg/l) along with control for shoot regeneration. Results
revealed that shoot tip and nodal segments performed better than leaf as explants
in almost all the characters studied. Shoot tip and nodal segments initiated shoot
within the shortest time of 9.6 and 10.6 days, respectively with 1.0 mg/l of BAP.
Regarding number of shoot per explant and number of node/shoot, shoot tip and
nodal segments along with 1.0 mg/l of BAP performed superior at almost all
days after inoculation. In case of interaction of explants and BAP, better
performance was recorded in most of the studied parameters from shoot tip and
nodal segments alongwith 1.0 mg/l BAP. Therefore, for in vitro shoot
regeneration of mint, shoot tip or nodal segment may be used with 1.0 mg/l of
BAP.
Keywords: In vitro shoot, BAP, Explants, Mint., Mentha.
Introduction
Mint (Mentha sp) is an aromatic plant that contains volatile essential oils, used fresh or dried as flavoring agent in a wide variety of foods. Mint oils are used in
making different dental and medicinal products as well as in cosmetic industries.
It is commonly known as pudina having dark green leaves and is usually found near ponds and other humid places of homestead. This perennial plant belongs to
the family Lamiaceae and has approximately 25 species (Bhat et al., 2002). Mint cultivation is widely distributed around the world. The United States of America
is the main producer of peppermint and spearmint followed by India. The average yield range of mint is 5.35-11.40 MT/ha where maximum yield is 13.75
MT/ha in some cultivars (Anon., 2008).
Mints are mainly propagated vegetatively rather than by seeds (Safaeikhorram et
al., 2008). Programs for crop improvement via conventional breeding have been
1Lecturer (Agricultural Studies), Uttara Residential College, Uttara, Dhaka-1230, 2Professor, Department of Horticulture, Bangabandhu Sheikh Mujibur Rahman
Agricultural University (BSMRAU), Gazipur-1706, Bangladesh.
DOI: http://dx.doi.org/10.3329/bjar.v43i4.39167
704 AKTER AND HOQUE
unsuccessful in mint because commercial cultivars are pollen-sterile and have a high ploidy number. Only some mints, such as M. arvensis L., M. pulegonium L.
and M. spicata L., are propagated by seed (Heidari et al., 2012). In our climatic conditions, poor overwintering may occasionally produce an insufficient number
of seedlings. However, this conventional process of vegetative propagation through stolon is a slow process and they are susceptible to many diseases
(Safaeikhorram et al., 2008). To overcome these problems, in vitro propagation of mint may be beneficial. It also offers year-round production, precise crop
production scheduling and reduce stock plant space of crops. The main advantage of in vitro propagation lies not only in the mass scale production but also in the
production of high quality and uniform planting material that can be multiplied
on a year-round basis under disease-free conditions anywhere irrespective of the season and weather.
As an important medicinal plant, mint may be a source of income for domestic use as well as for export. Therefore, attempt was made to develop protocols for
large-scale in vitro propagation of locally available Mentha sp. So far, several works have been done in Bangladesh scatteredly on in vitro propagation of this
plant. Considering the above facts, the present investigation has been undertaken to find out the performance of different explants with the optimum level of BAP
for in vitro shoot regeneration of mint.
Materials and Methods
The experiment was conducted in the Tissue Culture Laboratory of the Department of Horticulture, Bangabandhu Sheikh Mujibur Rahman Agricultural
University (BSMRAU), Salna, Gazipur-1706, from March 2013 to February 2014. Explants of mint were taken from previously collected genotype (MP-12)
grown in the Research Field of Department of Horticulture, BSMRAU, Gazipur. The genotype was collected from Mymensingh under a completed project of
Ministry of Science and Technology, GoB. Tender and actively growing nodal
segments (E1), shoot tips (E2) and leaves (E3) were used as explants. Three levels of BAP (mg/l) viz. B2-1.0, B3-2.0 and B4-3.0 alongwith control (B1- no BAP),
were included in the experiment. Two factors experiment was laid out in Completely Randomized Design (CRD) with ten replications, where one (1)
culture tube represented one replication.
Preparation of stock solution of BAP (6- Benzyl-aminopurine)
For preparing stock solution, 10 mg of BAP was weighed by an electric balance and placed on a clean beaker and then dissolved by few drops of 0.1 N HCl. The
mixture was then collected in a 100 ml measuring cylinder and volume was made up to 100 ml by addition of distilled water. The strength of prepared stock
solution was 100.0 mg/l. The prepared solution was then poured into a glass bottle, labeled properly and then stored in a refrigerator at 4°C.

IN VITRO SHOOT REGENERATION OF MINT 705
Preparation of culture media
The medium contained full strength (4405.19 mg/l) Murashige and Skoog’s (MS) inorganic salts and vitamins. To prepare 400 ml of the MS medium; 1.76 g MS
powder was weighed and dissolved in 300 ml of distilled water in a 1.0 L beaker. Therefore, 24 g sucrose along with treatment wise different concentrations of
hormonal supplements of BAP were added to the solution in the beaker and the mixture was mixed properly by using magnetic stirrer. The pH of the medium
was adjusted to 5.7±1 with a pH meter by using 0.1 N sodium hydroxide (NaOH) or 0.1 N HCl and finally the volume of the solution was made to 400 ml with
further addition of distilled water. In order to solidify the media, high brand agar of 2.8 g (@ 7%) was added to the solution and then thoroughly mixed and gently
boiled in a microwave oven for 10–12 min. until the agar was dissolved
completely. After that, about 10 ml prepared melted media was dispensed into each culture tube while the medium was still hot. The culture tubes were sealed
with aluminum foil and marked with glass marker pen to indicate specific treatment. The culture tubes were then sterilized at 1.06 kg/cm2 pressure at 121°C
for 25 min. in an autoclave. After autoclaving, the culture media was left overnight within the autoclave to become cool and solid and were taken out.
Inoculation was done in the following day.
Preparation of explants and inoculation
For establishing the plant in media, the tender actively growing mint shoots were collected and used in this study. The collected explants were taken in a beaker
and washed in running tap water for 15 min. The explants were the sterilized with 1% osbam for 15 min and were again washed with tap water three times.
Finally, sterilization was carried out in the aseptic condition under a laminar flow cabinet. Previously prepared materials were taken in a sterile pot and suspended
in 0.1% HgCl2 solution for 10 min. to ensure contamination free explants. Then the explants were washed for 3–4 times with double distilled water to remove all
traces of HgCl2. Therefore, the leaves around the shoot tips were carefully removed and shoot tips were placed inside the test tubes carefully. After placing
the explants in the test tubes, they were kept inside the growth chamber where,
physical condition for growth and development of cultures were maintained. The temperature was set to 22±1°C with a light intensity of 2000–3000 lux from
fluorescent tubular lamps and the photoperiod maintained generally 16 h light and 8 h dark (16L/8D) with 60–70% relative humidity.
Successful shoot formation becomes evident when small green fresh leaves began to emerge. It was the first sign of regeneration. So, each test tube was
observed regularly and the days to shoot initiation was recorded for the respective test tube. Other data were collected from 25 to 65 days after
inoculation (DAI) at 10 days interval on number of shoot per explant, length of the longest shoot and number of node per shoot. Collected data were analyzed

706 AKTER AND HOQUE
using MSTAT-C statistical package programme. Differences among the means were compared following Duncan’s Multiple Range Tests (DMRT) at 1% level
of significance.
Results and Discussion
Results regarding response of types of explants, levels of BAP and their interaction on different aspects of in vitro shoot regeneration of mint are
presented in the following heads.
Days to shoot initiation
Response of explants regarding days required for in vitro regeneration of shoot showed significant variation in mint. The highest number of days (46.15)
required for shoot initiation in leaf whereas, shoot tip and node required
relatively shorter period of 18.85 and 17.10 days, respectively (Fig. 1.) which were statistically similar. This finding corroborated with Ghanti et al. (2004) who
also reported a non-significant difference regarding days required for shoot initiation in mint from shoot tip and nodal segment in vitro. The lowest number
of days required for in vitro shoot regeneration in shoot tip and node might be due to higher totipotency of shoot tip and node having dormant bud which is
absent in leaf, or might be due to different cytokinin complements of the shoot tip, nodal segment and leaves (Van, 2009). Heidari et al. (2012) opined that shoot
meristems and nodes were more potent for shoot regeneration compared to leaf disk explants which agreed the present findings. Range of days required for shoot
initiation from shoot tip, nodal segment and leaf was 17.10- 46.15 in the present study which differed from the findings of Samantaray et al. (2012) who reported
a range of 22.6-26.0 days required for shoot initiation in mint.
Different concentration of BAP showed significant variation in mint regarding
days required for in vitro shoot initiation (Fig. 2). The highest days (35.53) required in control followed by BAP at 3.0 (27.33 days), 2.0 (24.73 days) and 1.0
mg/l (21.87 days) (Fig. 2). It was observed that days required for shoot initiation
increased with the increase of BAP concentration. It might be due to inhibition characteristic of BAP on shoot initiation (Van, 2009). The highest days required
in control reflected the positive effect of BAP on shoot initiation.
The interaction effect of explants and levels of BAP on days required for shoot
regeneration in vitro also showed significant variation (Fig. 3). The highest number of days required (47.80 days) in the combination of leaf without BAP
(E1B1) followed by E3B4 (46.80 days), E3B2 (45.40 days) and E3B3 (44.60 days). The lowest number of days required for in vitro shoot regeneration was in E2B2
(9.60 days) followed by E1B2 (10.60 days) where shoot tip and nodal segments were used with 1.0 mg/l of BAP, respectively. It might be due to higher rate of
growth and regeneration of shoot tip and nodal segment and best performance of BAP at 1.0 mg/l in mint. Present findings provide evidence that a further increase

IN VITRO SHOOT REGENERATION OF MINT 707
in concentration of BAP showed some adverse effect and subsequently increased
number of days required for shoot development which corroborated with the findings of Samantary et al. (2012), Xiao et al. (2007), Shawl et al. (2006) and
Godoy et al. (2005). It is also revealed from Fig. 3 that days required for in vitro shoot regeneration increased with the increased concentration of BAP. Inhibiting
criteria of cytokinin at higher concentration on shoot initiation and shoot elongation might be the reason behind this (Van, 2009).
explants
Fig. 1. Response of explants on days required for shoot initiation in mint
after inoculation. Significant differences (p<0.01) among the explants
are indicated by different letters according to DMRT.
Level of BAP (mg/l)
Fig. 2. Fig. 2. Effect of BAP on days required for shoot initiation in mint
after inoculation. Significant differences (p <0.01) among the
explants are indicated by different letters according to DMRT.

708 AKTER AND HOQUE
explants
Fig. 3. Effect of BAP on days required for shoot initiation in mint after inoculation.
Significant differences (p<0.01) among the explants are indicated by different
letters according to DMRT.
E1= Node, E2= Shoot tip and E3= Leaf; B1= 0.0, B2= 1.0, B3= 2.0 and B4= 3.0 mg/l of
BAP.
Number of shoots per explant
Results presented in Fig. 4 revealed that the number of shoots increased among
the explants with the increase of days after inoculation (DAI). Shoot tip was found to be more responsive regarding number of shoots followed by node and
leaf. At 25 days after inoculation, number of shoots produced by shoot tip and node were 0.95 and 0.80, respectively produced shoot but leaf started to produce
shoot (0.10) at 45 DAI. Statistically similar numbers of shoots were produced by shoot tip and nodal segment of mint till 55 DAI in in vitro condition. However, at
65 DAI, shoot tip produced the highest number of shoots (3.35) per explant and this was statistically different from other two explants. Node produced the second
highest number of shoots (2.45) per explant, which differed significantly from the leaf (Fig. 4). The better performance of shoot tip and node in producing the
highest number of shoots might be due to presence of apical bud in those explants. Dhawan et al. (2003), Chaturvedi et al. (2007), Sujana and Naidu
(2011a, 2011b) and Heidari et al. (2012) also reported the better performance of node and shoot tip as explant for in vitro shoot regeneration in mint. On the other
hand, Eck and Kitto (1992) successfully regenerated shoots from peppermint and
orange mint using leaf as explants which differed from the present findings.
BAP exhibited significant influence on in vitro shoot regeneration in mint in
respect of number of shoots/explant at different DAI (Fig. 5). At 25 DAI, the
highest number of shoots (1.27) was recorded from BAP at 1.0 mg/l followed
by 0.67 and 0.40 at 2.0 and 3.0 mg/l, respectively. Similar trend was also
observed at 35, 45, 55 and 65 DAI. No shoot was found upto 35 DAI in control.

IN VITRO SHOOT REGENERATION OF MINT 709
Number of shoots was found to be decreased with the increase of BAP
concentration at all the studied days after inoculation. However, the best
performance was observed with the BAP at 1.0 mg/l concentration in all the
studied days after inoculation. This result is consistent with the findings of
Ghanti et al. (2004) who reported that the highest number of shoots per explant
in mint using 1.0 mg/l of BAP. They also found the number of shoots to be
decreased with the increase of BAP concentration from 1.0 mg/l. This indicated
the upper limit of the concentration of BAP for mint. This result slightly
differed from Heidari et al. (2012), who recorded the highest number of shoots
with 1.5 mg/l of BAP in Mentha longifolia explants under 24 hours photoperiod
in culture condition. This discrepancy might be due to the difference between
explants and culture condition. Many other researchers also documented the
response of BAP in shoot regeneration of mint (Chishti et al., 2006; Bolouk et
al., 2013; Bariya and Pandya, 2014 and Shasany et al., 1998). George (1993)
stated that cytokinins, especially BAP are reported to overcome apical
dominance, release lateral buds from dormancy and promote shoot formation.
The result differed from Bolouk et al. (2013) who reported that using Mentha
piperita explants produced the highest number of shoots in those receiving a
treatment of 2.0 mg/l of BAP. This disparity might be due to species or explant
or culture condition differences between two experiments.
Regarding interaction effect of explants and different concentrations of BAP, it
was observed that shoot number per explant was increased gradually from 25 to
65 DAI in all the treatment combinations. However, no shoot was found to be
produced upto 35 DAI in the treatment combinations E1B1, E2B1, E3B1, E3B2,
E3B3 and E3B4 (Table 1). No shoot formation in E1B1, E2B1 and E3B1 treatment
combinations might be due to the absence of BAP in the medium, as BAP have
effective role in DNA synthesis and mitosis (Sujana and Naidu, 2011b). While,
no shoot in E3B2, E3B3 and E3B4 treatment combinations might be due to the
absence of any apical buds in leaves. Shoot tip with 1.0 mg/l of BAP (E2B2)
produced the highest number of shoots in all the recorded DAI, which were
statistically similar with E1B2 upto 55 DAI. At 65 DAI, although, the treatment
combination E2B2 produced significantly the highest number of shoot per explant
(5.20) but the treatment combination E1B2 produced the 2nd highest number of
shoots (3.80) per explant. This results authenticated the superiority of shoot tip
and node as explant with 1.0 mg/l of BAP for in vitro regeneration of shoot in
mint, which corroborate the findings of Ghanti et al. (2004) and Heidari et al.
(2012), who recorded the highest number of shoots using 1.0 mg/l of BAP in
both shoot tip and nodal explant of mint in vitro.

710 AKTER AND HOQUE
Days after inoculation
Fig. 4. Response of explants on number of shoot regeneration in mint at
different days after inoculation. Vertical bars indicate SE.
Days after inoculation
Fig. 5. Effect of BAP on number of shoot regeneration in mint at different
days after inoculation. Vertical bars indicate SE.
Number of node per shoot
While studying the effect of explant on number of node, it was found that the number of node increased among the explants with the increase of days after
inoculation (Fig. 8). Shoot tip performed better regarding the number of node per shoot followed by nodal segment and leaf. At 25 DAI, shoot tip (1.85) and nodal
segment (1.25) produced node but leaf started to produce node at 45 DAI (0.20)

IN VITRO SHOOT REGENERATION OF MINT 711
as it started to produce shoot at 45 DAI. The highest number of node produced by
shoot tip and nodal segment of mint showing statistically similar result from 25 to 65 DAI in in vitro condition. However, at 65 DAI, nodal segment produced the
highest number of nodes (9.15) per shoot, which was statistically similar with shoot tip (8.90) and significantly different from leaf (1.30). More number of node
is important for in vitro culture, as it may be used as explants in further multiplication of plant through subculture, which is one of the main objectives of
in vitro propagation from a single plant at the shortest time. So, from this point of view, shoot tip and node performed better.
Table 1. Interaction effect of explants and BAP on number of shoot per explant in
mint at different days after inoculation
Treatment combination
Number of shoots/explant at
25 DAI 35 DAI 45 DAI 55 DAI 65 DAI
E1B1
E1B2
E1B3
E1B4
E2B1
E2B2
E2B3
E2B4
E3B1
E3B2
E3B3
E3B4
0.00 d
1.60 ab
1.00 bc
0.60 cd
0.00 d
2.20 a
1.00 bc
0.60 cd
0.00 d
0.00 d
0.00 d
0.00 d
0.00 c
2.80 a
1.40 b
1.40 b
0.00 c
3.00 a
1.20 b
1.00 bc
0.00 c
0.00 c
0.00 c
0.00 c
1.20 bcd
3.40 a
1.80 bc
1.60 bc
2.00 b
3.80 a
1.60 bc
1.80 bc
0.00 d
0.00 d
0.00 d
0.40 d
1.80 bc
3.80 a
2.00 b
2.00 b
2.40 b
4.40 a
2.40 b
2.00 b
0.20 d
0.00 d
0.40 d
0.60 cd
1.80 de
3.80 b
2.00 d
2.20 d
2.60 cd
5.20 a
3.40 bc
2.20 d
0.20 f
0.20 f
0.60 f
0.80 ef
Mean 0.58 0.90 1.47 1.83 2.08
Means followed by same letter(s) in a column do not differ significantly at 1% level by DMRT.
E1= Node, E2= Shoot tip and E3= Leaf; B1= 0.0, B2= 1.0, B3= 2.0 and B4= 3.0 mg/l of BAP.
Results presented in Fig. 9 revealed that the effect of BAP on in vitro
regeneration of mint regarding the number of node was significant in different concentrations at each day of data recorded (25, 35, 45, 55 and 65 DAI). While
studying the effect of BAP on in vitro regenerated mint at 25 DAI statistically similar rank was found regarding the number of node per shoot at 1.0 mg/l (1.80)
and 2.0 mg/l (1.40) which was significantly different from 0.93 at 3.0 mg/l of BAP. However, no node was produced at 25 DAI without BAP. Similar trend
was observed at 35, 45, 55 and 65 DAI where number of node per shoot produced using 1.0, 2.0 and 3.0 mg/l of BAP occupied the statistically similar
rank and that was significantly different from control. However, the highest

712 AKTER AND HOQUE
number of node per shoot produced when BAP was used @ 1.0 mg/l at all the studied days.
Days after inoculation
Fig. 8. Response of explant on number of node in mint at different days after
inoculation. Vertical bars indicate SE.
Days after inoculation
Fig. 9. Effect of BAP on number of node in mint at different days after inoculation.
Vertical bars indicate SE.
In case of interaction of explants with different concentrations of BAP on number
of node per shoot, it was observed that node number increased gradually from 25
to 65 DAI in all the treatment combinations (Table 3). However, no nodes were

IN VITRO SHOOT REGENERATION OF MINT 713
found to be produced upto 25 DAI in the treatment combinations E1B1, E2B1,
E3B1, E3B2, E3B3 and E3B4; upto 35 DAI in the treatment combinations E2B1,
E3B1, E3B2, E3B3 and E3B4; upto 45 DAI in the treatments E3B1, E3B2 and E3B3;
and upto 55 DAI in the treatment combination E3B2. As in these days, no shoot
was produced and therefore, no node was observed in these treatments. Shoot tip
with 1.0 mg/l of BAP (E2B2) produced the highest number of nodes per shoot at
all recorded days (3.40 at 25 DAI, 5.60 at 35 DAI, 7.60 at 45 DAI, 9.60 at 55
DAI and 12.00 at 65 DAI), which were statistically similar with some other
combinations of shoot tip and nodal segment with different concentrations of
BAP. A similar trend of decreasing number of node with higher concentration of
BAP (2.0 and 3.0 mg/l) than at 1.0 mg/l was observed in shoot tip and leaf. But
in case of leaf, it performed better regarding number of node per shoot at higher
concentration of BAP at 3.0 mg/l than other concentrations of BAP at each day
of data recorded. It might be due to lack of cytokinin in leaf showing the higher
requirement of BAP for better performance of leaf in in vitro condition.
Table 3. Interaction effect of explants and BAP on number of node in mint at
different days after inoculation
Treatment combination
Number of node/shoot at
25 DAI 35 DAI 45 DAI 55 DAI 65 DAI
E1B1
E1B2
E1B3
E1B4
E2B1
E2B2
E2B3
E2B4
E3B1
E3B2
E3B3
E3B4
0.00 c
2.00 ab
1.80 b
1.20 bc
0.00 c
3.40 a
2.40 ab
1.60 b
0.00 c
0.00 c
0.00 c
0.00 c
0.40 c
4.80 ab
4.80 ab
3.20 b
0.00 c
5.60 a
5.20 ab
4.20 ab
0.00 c
0.00 c
0.00 c
0.00 c
1.60 b
7.60 a
6.80 a
5.20 a
1.60 b
7.60 a
6.60 a
6.80 a
0.00 b
0.00 b
0.00 b
0.80 b
3.20 bc
9.40 a
8.40 a
7.20 a
3.80 b
9.60 a
8.40 a
8.20 a
0.40 cd
0.00 d
0.80 bcd
1.60 bcd
5.00 b
11.80 a
10.80 a
9.00 a
4.60 b
12.00 a
9.20 a
9.80 a
0.60 c
0.60 c
1.60 bc
2.40 bc
Mean 1.03 2.35 3.72 5.08 6.45
Means followed by same letter(s) in a column do not differ significantly at 1% level by DMRT.
E1= Node, E2= Shoot tip and E3= Leaf; B1= 0.0, B2= 1.0, B3= 2.0 and B4= 3.0 mg/l of
BAP.
Conclusions
Full strength MS media along with 1.0 mg/l of BAP can be used for in vitro shoot
regeneration of mint; where, the explants may be shoot tip or nodal segment.

714 AKTER AND HOQUE
Acknowledgement
The authors acknowledge the Ministry of Science and Technology (MoST), GoB for
providing fund to carry out the research work successfully.
Fig. 10. In vitro regeneration of shoot in mint (a, b and c= explant from nodal
segment, shoot tip and leaf, respectively; a1, b1 and c1 is regenerated shoot
from nodal segment, shoot tip and leaf, respectively).
a b c
a1 b1 c1

IN VITRO SHOOT REGENERATION OF MINT 715
References
Anonymous. 2008. Final Report on Cultivation of mint as a viable alternative livelihood
in East and North East of Afghanistan (RALF 02-011). International Center for
Agricultural Research in the Dry Areas; Ministry of Agriculture, Irrigation &
Livestock and Faculty of Agriculture, Kabul University. pp.1-44
Bariya, R. R. and H. A. Pandya. 2014. Evaluation and establishment of promising large-
scale in vitro production of corn mint. Intl. J. Recent Scientific Res. 5(2): 509-512
[Cited from browsing website: http://www.recentscientific.com. Visited on
10/09/2014].
Bhat, S., P. Maheshwari, S. Kumar and A. Kumar. 2002. Mentha species: In vitro
Regeneration and Genetic Transformation. Molecular Biol. Today. 3(1): 11-23.
Bolouk, S. G., S. K. Kazemitabar and J. M. Sinaki. 2013. In vitro culture of the
peppermint plant (Mentha piperita) without the use of hormones. Intl. J. Agril. Crop
Sci. 6(18): 1279-1283.
Chaturvedi, H.C., M. Jain and N.R. Kidwai. 2007. Cloning of medicinal plants through
tissue culture- A review. Ind. J. Experimental Biol. 45: 937-948.
Chishti, N., A.S. Shawl, Z.A. Kaloo, M.A. Bhat and P. Sultan. 2006. Clonal propagation
of Mentha arvensis L. through nodal explant. Pakistan J. Biol. Sci. 9(8): 1416-1419.
Dhawan, S., A.K. Shasany, A.A. Naqvi, S. Kumar and S.P.S. Khanuja. 2003. Menthol
tolerant clones of Mentha arvensis: Approach for in vitro selection of menthol rich
genotypes. Plant Cell Tissue Org. Cult. 75:87.
Eck, V.J.M. and S.L. Kitto. 1992. Regeneration of peppermint and orangemint from leaf
disks. Plant Cell Tissue Org. Cult. 30(1):41-49.
George, E.F. 1993. Plant propagation by tissue culture. part-1. The Technology Exegetics
Ltd., Edington.
Ghanti, K., C. P. Kaviraj, R. B. Venugopal, F. T. Z. Jabeen and S. Rao. 2004. Rapid
regeneration of Mentha pipertia L. from shoot tip and nodal explants. Indian J.
Biotech. 3: 594-598.
Godoy, L., E. Hector, B. Diaz, A. Chea and A. Torres. 2005. The effect of growth
regulators on the in vitro multiplication of Mentha piperita and Mentha citrata.
Cultivos Tropicales. 26(1): 73-75.
Heidari, F., S. Jahanbakhsh, M. Talebi, C. Ghobadi and M. A. S. Kandi. 2012.
Regeneration and in vitro cultivation of three Iranian Mentha species using
meristem, node and leaf disk cultures. Intl. J. Farming Allied Sci. 1(2):48-53.
Safaeikhorram, M.S., S. Jafarneha and S. Khosroshahi. 2008. The world's most important
medicinal plants. Compilation Eric von Ben Vick, Michael Vynk. Iran Releases
Green Farm Training Complex : 422.
Samantaray, A., P. Sial and M. Kar. 2012. Micro-propagation and biochemical analysis
of Spear Mint (Mentha spicata). Indian J. Innovations Dev. 1(7): 489-493.
Shasany, A.K., S.P.S. Khanuja, S. Dhawan, U. Yadav, S. Sharma and S. Kumar. 1998.
High regenerative nature of Mentha arvensis internodes. J. BioSci. 23(5): 641-646.

716 AKTER AND HOQUE
Shawl N.C, A.S. Kaloo, Z.A. Bhat and M.A.P. Sultan. 2006. Clonal propagation of
Mentha arvensis L. through nodal explant. Pakistan J. Biol. Sci. 9(8): 1416-1419.
Sujana, P. and C.V. Naidu. 2011a. High frequency rapid plant regeneration from shoot tip
and nodal explants of Mentha piperita L.- an important multipurpose medicinal
plant. J. Phytology. 3(5): 9-13.
Sujana, P. and C.V. Naidu. 2011b. Indirect plant regeneration from leaf explants of
Mentha piperita L. – an important multipurpose medicinal plant. J. Phytology. 3(5):
19-22.
Van. L.B. 2009. Plant tissue culture (overview) Part II. Plant Biotechnology. University
of Science. Vietnam Open Course Ware.
Xiao L., D. C. Zhi, H. W. Zhi, H. W. Chen and R. Cong. 2007. Tissue culture and
plantlet regeneration of penny royal mint (Mentha pulegium). J. Northwest A.F. Univ
– Nat. Sci. Edi. 35(1): 87-90.

M. S. Islam, H. Saif, M. R. Islam, Q. Naher and A. S. M. M. R. Khan − Soil salinity management for increasing potato yield in the coastal area of southern Bangladesh
M. S. Rahman, M. Khatun, M. L. Rahman and S. R. Haque − Assessment of training needs on crop production for farmers in some selected areas of Bangladesh
M. A. H. Khan, N. Sultana, N. Akter, M. S. Zaman and M. R. Islam − Intercropping gardenpea (Pisium sativum) with Maize (Zea mays) at farmers’ field
K. T. Akter and M. A. Hoque − In vitro shoot regeneration of mint (Mentha sp. L.) Using different types of explants and levels of benzylaminopurine
655
669
691
703
C O N T E N T S

Maniruzzaman, M. G. Azam, S. Islam, M. G. Hossain and M. M. Rohman − Molecular assessment of maize inbred lines (Zea mays L.) Using microsatellite markers
M. A. Quddus, M. A. Hossain, H. M. Naser, N. Naher and F. Khatun − Response of chickpea varieties to boron application in calcareous and terrace soils of Bangladesh
M. J. Hussain, A. J. M. S. Karim, A. R. M. Solaiman, M. S. Islam and M. Rahman − Response of broccoli to USG and prilled urea in shallow red-brown terrace soil under Madhupur tract
P. Hajong, B. Sikder, S. Mondal and M. A. Islam − Adoption and profitability of summer tomato cultivation in Jashore district of Bangladesh
M. S. Rahman, M. T. Islam, M. Z. H. Prodhan, M. K. Hasan and A. S. M. M. R. Khan − Productivity and profitability of improved versus existing cropping pattern in Kushtia region
A. N. M. S. Karim, S. Ahmed, A. H. Akhi, M. Z. A. Talukder and A. Karim − Combining ability and heterosis studyin maize inbreds throughout diallel mating design
E. Mandal, M. R. Amin, H. Rahman and A. M. Akanda − Infestation level and population dynamics of aphid on mustard
S. Talukder, M. M. H. Khan, J. Ferdous and M. O. Faruq − Integrated management of tobacco caterpillar and cabbage butterfly with host plant resistant and organic amendment
M. A. Hoque, M. Z. Hossain and M. A. Hossain − Design and development of a power groundnut sheller
M. R. Amin, M. S. Miah, H. Rahman, N. P. Nancy and M. K. A. Bhuiyan − Functional and group abundance of insects on eggplant
(Cont’d. inner back cover)
BANGLADESH JOURNAL OF AGRICULTURAL RESEARCH
Vol. 43 December 2018 No. 4
533
543
557
575
587
599
611
619
631
647
Published by the Director General, Bangladesh Agricultural Research Institute (BARI), Gazipur 1701, Bangladesh. Printed at Rita Art Press, 13/ka/1/1, K. M. Das Lane, Tikatuly, Dhaka-1203, Phone: 47112756.
Copyright © 2022 FDOKUMEN