Beyond a Reasonable Productivity
11
ISSN: 2278-3369 International Journal of Advances in Management and Economics Available online at www.managementjournal.info RESEARCH ARTICLE Iris A Mihai July-August 2014 | Vol.3 | Issue 4|150-160 150 Beyond a Reasonable Productivity Iris A Mihai* West University of Timisoara *Corresponding Author: E-mail: [email protected] Abstract Productivity is a totem of economic performance; depending on the perspective one wants to capture, productivity can reflect the performance of the labor force, capital, know-how, time, financial resources etc. In this paper we have chosen to analyze the productivity of the twelve most unsustainable economies worldwide: United Arab Emirates, Qatar, Belgium, Kuwait, Singapore, Netherlands, Republic of Korea, Israel, Saudi Arabia, Macedonia, Japan and the United States of America. The research is based on statistical data provided by the World Bank, the United Nations Development Program and the Global Footprint Network. The research is based on economical, environmental and development indexes used to evaluate productivity adjusted by the ecological deficit of the nations. The fundamental research hypothesis of this paper is how productive would actually be the selected countries if their economies would be responsible enough to resume themselves to their own biocapacities. The secondary hypothesis is what global impact has the complete disregard of the planet‟s limited capacity to support social and economical activities. The empirical analysis will provide answers to both questions, emphasizing once more the interdependencies between the global actors and the need to incorporate the environmental perspective when analyzing the economic performance of a country. Keywords: Economic productivity, Social fairness, Biocapacity, sustainability. JEL Codes: F62, F63 Introduction and Literature Review Economic productivity and its continuously growth are seen as imperatives of our modern society, but how reasonable is this growth induced by the steroids of deficit? In this paper we analyze the 12 twelve countries most indebted to the pool of global resources, focusing on their economic performance, but taking into account also their biological capacity, their ecological footprint of consumption and also their ecological deficit. The idea behind the study appeared after a similar research in which we adjusted productivity by ecological deficit and GINI index, but in a completely different manner. The findings of the current research are consistent with the findings in the previous study, emphasizing the need for a more rational approach of the economy and its growth. The rational perspective is endorsed by the use of the biocapacity concept, the ecological footprint of consumption and the relation between them reflected in the ecological deficit. The biocapacity of a country is a measure of its ability to produce and store what it produces, together with the associated wastes. The area used to support the human activity, the country‟s consumption and also to absorb, process or store the CO2 emissions and any other greenhouse gases (GHG) is measured through the ecological footprint of consumption index. By deducting the ecological footprint of consumption from the biocapacity of a country, we obtain its reserve or deficit, depending on the size of the two. For this research, we have selected only countries with ecological deficits in order to prove the lack of sustainability in their productive processes. Modern economic theories explain the differences in productivity and economic growth across countries by differences in political and economic institutions, and differences in culture, geographical position, policies and law. The success of any of these theories in explaining the gap in productivity between any two countries, depends on the countries in the sample [1]. In the twentieth century, economists defined productivity as the relationship between the output produced and the inputs necessary to produce it [2,3]. This definition is attractive in its simplicity because it stands invariable no matter the political system, social milieu or production apparatus; it captures the efficiency with which
-
Upload
independent -
Category
Documents
-
view
1 -
download
0
Transcript of Beyond a Reasonable Productivity

ISSN: 2278-3369 International Journal of Advances in Management and Economics
Available online at www.managementjournal.info RESEARCH ARTICLE
Iris A Mihai July-August 2014 | Vol.3 | Issue 4|150-160 150
Beyond a Reasonable Productivity
Iris A Mihai*
West University of Timisoara
*Corresponding Author: E-mail: [email protected]
Abstract
Productivity is a totem of economic performance; depending on the perspective one wants to capture, productivity
can reflect the performance of the labor force, capital, know-how, time, financial resources etc. In this paper we have
chosen to analyze the productivity of the twelve most unsustainable economies worldwide: United Arab Emirates,
Qatar, Belgium, Kuwait, Singapore, Netherlands, Republic of Korea, Israel, Saudi Arabia, Macedonia, Japan and
the United States of America. The research is based on statistical data provided by the World Bank, the United
Nations Development Program and the Global Footprint Network. The research is based on economical,
environmental and development indexes used to evaluate productivity adjusted by the ecological deficit of the
nations. The fundamental research hypothesis of this paper is how productive would actually be the selected
countries if their economies would be responsible enough to resume themselves to their own biocapacities. The
secondary hypothesis is what global impact has the complete disregard of the planet‟s limited capacity to support
social and economical activities. The empirical analysis will provide answers to both questions, emphasizing once
more the interdependencies between the global actors and the need to incorporate the environmental perspective
when analyzing the economic performance of a country.
Keywords: Economic productivity, Social fairness, Biocapacity, sustainability.
JEL Codes: F62, F63
Introduction and Literature Review
Economic productivity and its continuously
growth are seen as imperatives of our modern
society, but how reasonable is this growth induced
by the steroids of deficit? In this paper we analyze
the 12 twelve countries most indebted to the pool
of global resources, focusing on their economic
performance, but taking into account also their
biological capacity, their ecological footprint of
consumption and also their ecological deficit.
The idea behind the study appeared after a
similar research in which we adjusted
productivity by ecological deficit and GINI index,
but in a completely different manner. The
findings of the current research are consistent
with the findings in the previous study,
emphasizing the need for a more rational
approach of the economy and its growth.
The rational perspective is endorsed by the use of
the biocapacity concept, the ecological footprint of
consumption and the relation between them
reflected in the ecological deficit. The biocapacity
of a country is a measure of its ability to produce
and store what it produces, together with the
associated wastes. The area used to support the
human activity, the country‟s consumption and
also to absorb, process or store the CO2 emissions
and any other greenhouse gases (GHG) is
measured through the ecological footprint of
consumption index. By deducting the ecological
footprint of consumption from the biocapacity of a
country, we obtain its reserve or deficit,
depending on the size of the two. For this
research, we have selected only countries with
ecological deficits in order to prove the lack of
sustainability in their productive processes.
Modern economic theories explain the differences
in productivity and economic growth across
countries by differences in political and economic
institutions, and differences in culture,
geographical position, policies and law. The
success of any of these theories in explaining the
gap in productivity between any two countries,
depends on the countries in the sample [1].
In the twentieth century, economists defined
productivity as the relationship between the
output produced and the inputs necessary to
produce it [2,3]. This definition is attractive in its
simplicity because it stands invariable no matter
the political system, social milieu or production
apparatus; it captures the efficiency with which

Available online at www.managementjournal.info
Iris A Mihai July-August 2014 | Vol.3 | Issue 4|150-160 151
the productive factors are used [4]. However,
current economic realities (liberalized and
dynamic markets, constantly changing customer
preferences, new structure of production and
work, etc.) are leading to a rethinking of the
notion of productivity. Whereas traditionally,
productivity was viewed mainly as a concept of
efficiency, it is now viewed both as an efficiency
and effectiveness concept, effectiveness being how
the enterprise meets the dynamic needs and
expectations of customers [5]. Productivity
appears to be dependent on the value of the
products and services (utility, uniqueness,
quality, convenience, availability etc.) and the
efficiency with which they are produced and
delivered to the customers [6].
Productivity gaps between countries have always
been an interesting problem for economists and
policy makers. The literature is extensive and has
several different stands. The neoclassical
explanation of productivity gaps focuses on
exogenous Total Factor Productivity shifts [7-12].
The more recent perspective focuses on the
endogenous factors that may influence the Total
Factor Productivity, as the role of input factors
(capital, labor, know how, materials, energy,
intermediate inputs etc.) in explaining the gap in
economic performance between countries.
The discussion about the relationship between
openness and economic growth is still open. The
dissent is about the theoretical foundation of the
relationship and about the robustness of the
positive effect that is presented in the empirical
arena. Among the benefits of openness are
frequently mentioned the existence of
technological spillovers, the exploitation of
comparative advantages, scale effects, reduction
of the inefficiencies and so on [13].
Although productivity does not represent a
country's economic prosperity, living standards
and the only measure of competitiveness per se, it
has been the most widely accepted measure for at
least the past 20 years [14]. During the last half of
century, international bodies together with
national governments and several activists
mainstreamed the need to approach the
environment as the main casualty of the economic
activity. Resource-responsible and environment-
friendly, sustainable social development issues
have become hot topics of general interest that
resulted into a bulk of research that has been
concerned about the environmental controls for
the impact of conventional total factor
productivity [15]. Traditional methods of
measuring productivity take into account only the
desired output, without considering the
undesirable outputs, such as CO2 emissions.
Therefore, traditional methods of measuring
productivity and productivity growth are telling
just one side of the story [16].
The rapidly rising level of economic integration,
stimulated by advances in Information and
Communication Technology (ICT), renders
technology adoption, coming from foreign
developed countries, a matter of great importance
for economic growth and productivity
improvement. As economic theory suggests,
learning through international economic activity
might be particularly important for all countries,
especially for those lagging behind the most
developed ones. Foreign Direct Investment (FDI)
is considered, among others, an important
channel for technology diffusion, which in turn
raises the host country‟s productivity growth [17].
On the other hand, the new „information economy‟
of the past decades is associated with increased
diffusion of ICTs, which are expected to deliver
higher productivity gains and enhanced growth
[18].
Gaps in productivity can be explained by several
theories: those considering the size of a country or
of an economy, the openness to the international
trade, the optimization of endogenous factors,
advances in ICT, economic and fiscal policies etc.,
but the truth is that economic productivity is one
of the most complex simple concept there is. When
analyzing productivity one needs to consider all
these factors, in addition, the sustainability of the
economic processes that generate the respective
levels of economic performance. For this scope we
have developed a methodology that takes into
account not only what a country produces, but
also how it produces it and whether it will be able
to continue that given trend. The results
emphasize the need for raising awareness and for
identifying more sustainable alternatives. The
biocapacity of a country is given and it cannot be
increased significantly, but an area where it can
be intervened, is the consumption and its
ecological footprint. Our economic performance
needs to be captured in a wiser way, a way that
incorporates also the ecological perspective and
not only the financial one. The short life span of
the current economic development trends is
emphasized by the already exceeded biocapacity
of the world. If a country exceeds its own
biocapacity is a problem because that means that
it can no longer rely on its own resources for the
well being of its people, but it can rely on the
resources of the other countries, resources
incorporated in the global stock; but when the

Available online at www.managementjournal.info
Iris A Mihai July-August 2014 | Vol.3 | Issue 4|150-160 152
global stock is already effete, on whose resources
can one rely on?
Methodology
In order to analyze the sustainability adjusted
productivity of the chosen countries, we have
developed the following equation:
= GNI( + )*; = (1- )
where:
- Biocapacity-adjusted Economic Productivity
GNI -Gross National Income
EMPC -Compensation of Employees
GCF - Gross Capital Formation
ED -Ecological Deficit
EFC -Ecological Footprint of Consumption
The equation represents the labor and capital
productivity, calculated as a GNI ratio, adjusted
by the own biocapacity of each country.
Gross National Income, as defined by Eurostat,
represents total primary income receivable by
resident institutional units: compensation of
employees, taxes on production and imports less
subsidies, property income (receivable less
payable), gross operating surplus and gross mixed
income. It is equal to: GDP (Gross Domestic
Product) + primary incomes receivable from the
rest of the world - primary incomes payable to the
rest of the world. Values are seasonally adjusted
(SA). The ESA 95 (European System of Accounts)
regulation may be referred to for more specific
explanations on methodology. In order to compute
the labor productivity, we have divided GNI to the
compensation of employees (EMPC). The World
Bank defines the compensation of employees as
all payments in cash, as well as in kind (such as
food and housing), to employees in return for
services rendered, and government contributions
to social insurance schemes such as social security
and pensions that provide benefits to employees.
In order to compute the capital productivity, we
have divided GNI to the gross capital formation.
Gross capital formation (formerly gross domestic
investment) consists of outlays on additions to the
fixed assets of the economy plus net changes in
the level of inventories. Fixed assets include land
improvements (fences, ditches, drains, and so on);
plant, machinery, and equipment purchases; and
the construction of roads, railways, and the like,
including schools, offices, hospitals, private
residential dwellings, and commercial and
industrial buildings. Inventories are stocks of
goods held by firms to meet temporary or
unexpected fluctuations in production or sales,
and "work in progress." According to the 1993
SNA, net acquisitions of valuables are also
considered capital formation (World Bank). We
have chosen to compute productivity as a ration of
GNI rather than GDP because due to
globalization there are often large differences
between the income of a country‟s residents and
its domestic production. Some of the income
residents earn is sent abroad, some residents
receive international remittances and some
countries receive sizeable aid flows.
The second part of the equation captures how
responsible the productivity of a country is.
Productivity is obtained by exploiting a certain
biocapacity. As the Global Footprint Network has
proven, sometimes, the countries exploit a
biocapacity greater than their own, either for
production or for storing waste. In order to
analyze how much productivity would each
country obtain if they limited themselves to their
own biocapacity, we calculated how much
productivity is obtained via an ecological deficit
and deducted it from the whole productivity of the
country. Biocapacity or biological capacity, as
defined in the Global Footprint Network Glossary,
represents the capacity of ecosystems to produce
useful biological materials and to absorb waste
materials generated by humans, using current
management schemes and extraction
technologies. “Useful biological materials” are
defined as those demanded by the human
economy. Hence what is considered “useful” can
change from year to year (e.g. use of corn (maize)
stover for cellulosic ethanol production would
result in corn stover becoming a useful material,
and thus increase the biocapacity of maize
cropland). The biocapacity of an area is calculated
by multiplying the actual physical area by the
yield factor and the appropriate equivalence
factor. Biocapacity is usually expressed in global
hectares. The global hectare (gha) is a
productivity weighted area used to report both the
biocapacity of the earth, and the demand on
biocapacity (the Ecological Footprint). The global
hectare is normalized to the area-weighted
average productivity of biologically productive
land and water in a given year. Because different
land types have different productivity, a global
hectare of, for example, cropland, would occupy a
smaller physical area than the much less
biologically productive pasture land, as more
pasture would be needed to provide the same
biocapacity as one hectare of cropland. Because
world bioproductivity varies slightly from year to
year, the value of a gha may change slightly from

Available online at www.managementjournal.info
Iris A Mihai July-August 2014 | Vol.3 | Issue 4|150-160 153
year to year. The Ecological Footprint of
consumption is defined as the area used to
support a defined population's consumption. The
consumption Footprint (in gha) includes the area
needed to produce the materials consumed and
the area needed to absorb the carbon dioxide
emissions. The consumption Footprint of a nation
is calculated in the National Footprint Accounts
as a nation's primary production Footprint plus
the Footprint of imports minus the Footprint of
exports, and is thus, strictly speaking, a Footprint
of apparent consumption. The national average or
per capita Consumption Footprint is equal to a
country's Consumption Footprint divided by its
population [19].
The difference between the Biocapacity and the
Ecological Footprint of consumption can result
either in ecological deficit, when the Ecological
Footprint of consumption exceeds the Biocapacity,
either in ecological reserve when the Biocapacity
exceeds the Ecological Footprint of consumption.
If there is a regional ecological deficit, it means
that the region or the country imports biocapacity
through trade or liquidating regional ecological
assets, or emitting wastes into a global commons
such as the atmosphere. In contrast to the
national scale, the global ecological deficit cannot
be compensated for through trade, and is
therefore equal to overshoot by definition.
The countries we have chosen for the analysis
have been selected on the basis of their per capita
ecological deficit. Each one of them has an per
capita ecological deficit higher than 4 gha,
regardless of their population, GDP or GNI,
geographical position or any other factors.
Empirical Analysis
As mentioned before, for the scope of the
empirical analysis, we have chosen all the
countries with a per capita ecological deficit
higher than 4 gha. This resulted into a pool of
twelve countries from all the continents: United
Arab Emirates, Qatar, Belgium, Kuwait,
Singapore, Netherlands, Republic of Korea, Israel,
Saudi Arabia, Macedonia, Japan and the United
States of America. Their cumulated ecological
deficit is 2.42 billion gha. What does this mean?
Well, it means that these twelve countries are
responsible for almost a half of the world
ecological deficit.
These countries differ in size, geographical
position, GDP, GNI, cultural background; what
they have in common is the huge per capita
ecological deficit and the fact that except from
Macedonia, they all belong to the High Income
group of countries. Also, they all have high and
very high level of development captured by the
HDI.
We will begin by presenting some general
information about the countries in order to
establish the context for the productivity analysis.
The table bellow presents the size of population in
each selected country. The largest in size is the
US, with a population of 308.7 million
inhabitants, while Qatar is the smallest, with a
population of only 1.1 million inhabitants. As we
can see, most of the selected countries are small
ones, with the obvious exceptions of the US,
Japan, Korea and Saudi Arabia, which have a
population larger than 20 million inhabitants.
The population of the group represents
approximately 8% of the world population.
Table 1: Population
Be
lgiu
m
Isra
el
Ja
pa
n
Ko
re
a,
Re
pu
b
lic o
f
Ku
wa
i
t Ma
ce
d
on
ia
Ne
the
rla
nd
s
Qa
tar
Sa
ud
i
Ara
bia
Sin
ga
po
re
Un
ite
d
Ara
b
Em
ira
tes
Un
ite
d
Sta
tes
of
Am
eri
ca
Popul
ation
(millio
n)
10.5
6.9
127.4
48.0
2.9
2.0
16.5
1.1
24.7
4.5
6.2
308.7
Source: World Bank
Next we will introduce the economic perspective.
The chart below presents the levels of GDP and
GNI in the selected countries. As we can see, the
levels of the economic development are consistent
with the information provided by the size of
population. The most rich countries are those
with the largest population, respectively, the US,
Japan and Korea, with the exception that the
Netherlands has higher levels o both GNI and
GDP than Saudi Arabia, even if it is much smaller
than the last one.

Available online at www.managementjournal.info
Iris A Mihai July-August 2014 | Vol.3 | Issue 4|150-160 150
Chart 1: Levels of GDP and GNI
Source: World Bank
When we shift from analyzing the economic
performance of the country as a whole, to
analyzing the per capita performance, the picture
changes completely. The chart below presents the
levels of GNI and GDP per capita. Surprisingly,
the highest values belong to Qatar, whose per
capita GDP exceeds the threshold on 70.000 $,
while its per capita GNI exceeds 60.000$.
Macedonia had the lowest levels, with a per capita
GNI of only 3482 $ and a per capita GDP of little
below 4000 $. The Netherlands and the United
States present very similar levels, with
Netherland having the per capita GDP higher
than the one of the US, and the US having the per
capita GNI higher than the Netherlands. The
chart presents a much more balanced picture
than the previous one did.
Chart 2: Levels of GNI per capita and of GDP per capita Source: World Bank
Both charts show very similar levels of the GDP
and the GNI for all the countries. In previous
analyzes, we have dealt with countries that
presented important differences between the
levels of the two variables.
The next step in our analysis is to measure the
economic productivity of the selected countries.
Unquestionably, the group consists of rich, strong
countries, except from Macedonia and maybe
Saudi Arabia, but how productive are their
economies? The chart below presents the levels of
productivity. Unfortunately, due to lack of data,
we could not measure the productivity of Saudi
Arabia and the United Arab Emirates; from this
point forward, our analysis will continue only for
the other ten countries.
The most productive country of the group is
Japan, with a 95.84 score, much more productive
than any other country in the group. It is
seconded by the US and Korea, with 50.33,
respectively 49.66 scores. The least productive
countries in the group are Israel – with a score of
14.73, Macedonia – with a score of 15.48 and
Qatar – with 17.26. While Macedonia doesn‟t
come as a surprise, Qatar loses its leading
position, revealing a country with a productivity
level much smaller than expected.

Available online at www.managementjournal.info
Iris A Mihai July-August 2014 | Vol.3 | Issue 4|150-160 155
Chart 3: Levels of economic productivity
Further in our analysis we have checked if there
was any correlation between productivity and the
other variables measuring economic performance.
The table below shows the values of the Pearson‟s
r, together with the significance for each result.
As mentioned before, the analysis includes only
the ten countries for which we have all the needed
data.
Table 2: Correlations between GNI, per capita GNI, GDP, per capita GDP and economic productivity
GNI_$ GNI_per capita_$ GDP_$
GDP_per
capita_$ W
W Pearson Correlation .482 .121 .461 .008 1
Sig. (2-tailed) .159 .740 .180 .982
N 10 10 10 10 10
**. Correlation is significant at the 0.01 level (2-tailed).
As we can see, there is no significant correlation
between economic productivity and the other
economic performance variables. This reads that
an economy can have a high or low productivity,
regardless of its size. We wanted to make sure
that this was true also for the size of population,
so we have checked whether there is any
correlation between productivity and population.
SPSS retrieved the following values: 0.556 for
Pearson‟s r and 0.095 for the significance. Neither
result is relevant. This reinforces the former
result: productivity is not size sensitive. This is a
first important finding of the paper.
Further we will introduce the ecological
perspective. Table 3 presents the population of
the selected countries, their per capita ecological
footprint of consumption, per capita biocapacity
and their per capita deficit, The countries are
arranged by size of the ecological deficit, from
largest to smallest.
Table 3: Population, ecological footprint of consumption, total biocapacity and ecological deficit or
Reserve of the selected countries Population
(million)
Ecological Footprint of
Consumption
Total
Biocapacity
Ecological
Deficit
United
Arab
Emirates
6.2 10.7 0.8 (9.8)
Qatar 1.1 10.5 2.5 (8.0)
Belgium 10.5 8.0 1.3 (6.7)
Kuwait 2.9 6.3 0.4 (5.9)
Singapore 4.5 5.3 0.0 (5.3)
Netherland
s 16.5 6.2 1.0 (5.2)
Korea,
Republic of 48.0 4.9 0.3 (4.5)
Israel 6.9 4.8 0.3 (4.5)
Saudi
Arabia 24.7 5.1 0.8 (4.3)
Macedonia
TFYR 2.0 5.7 1.4 (4.2)
Japan 127.4 4.7 0.6 (4.1)
United
States of
America
308.7 8.0 3.9 (4.1)
Available online at www.managementjournal.info
Iris A Mihai July-August 2014 | Vol.3 | Issue 4|150-160 156
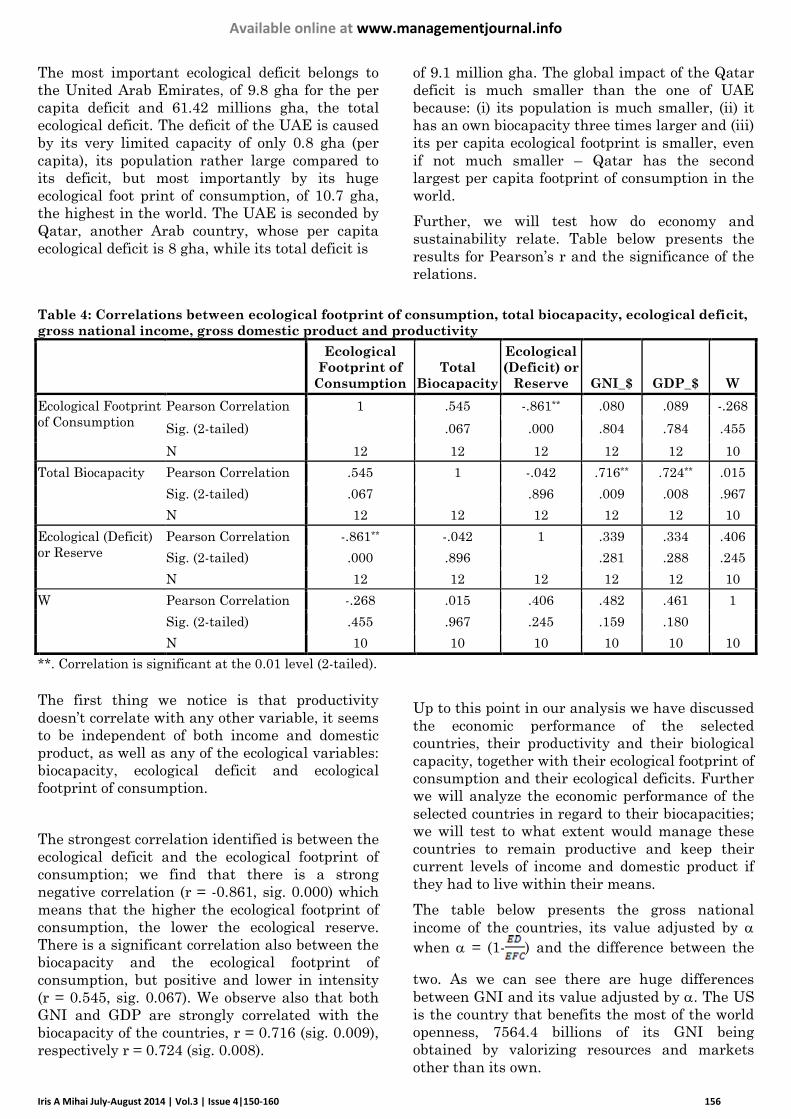
The most important ecological deficit belongs to
the United Arab Emirates, of 9.8 gha for the per
capita deficit and 61.42 millions gha, the total
ecological deficit. The deficit of the UAE is caused
by its very limited capacity of only 0.8 gha (per
capita), its population rather large compared to
its deficit, but most importantly by its huge
ecological foot print of consumption, of 10.7 gha,
the highest in the world. The UAE is seconded by
Qatar, another Arab country, whose per capita
ecological deficit is 8 gha, while its total deficit is
of 9.1 million gha. The global impact of the Qatar
deficit is much smaller than the one of UAE
because: (i) its population is much smaller, (ii) it
has an own biocapacity three times larger and (iii)
its per capita ecological footprint is smaller, even
if not much smaller – Qatar has the second
largest per capita footprint of consumption in the
world.
Further, we will test how do economy and
sustainability relate. Table below presents the
results for Pearson‟s r and the significance of the
relations.
Table 4: Correlations between ecological footprint of consumption, total biocapacity, ecological deficit,
gross national income, gross domestic product and productivity
Ecological
Footprint of
Consumption
Total
Biocapacity
Ecological
(Deficit) or
Reserve GNI_$ GDP_$ W
Ecological Footprint
of Consumption
Pearson Correlation 1 .545 -.861** .080 .089 -.268
Sig. (2-tailed) .067 .000 .804 .784 .455
N 12 12 12 12 12 10
Total Biocapacity Pearson Correlation .545 1 -.042 .716** .724** .015
Sig. (2-tailed) .067 .896 .009 .008 .967
N 12 12 12 12 12 10
Ecological (Deficit)
or Reserve
Pearson Correlation -.861** -.042 1 .339 .334 .406
Sig. (2-tailed) .000 .896 .281 .288 .245
N 12 12 12 12 12 10
W Pearson Correlation -.268 .015 .406 .482 .461 1
Sig. (2-tailed) .455 .967 .245 .159 .180
N 10 10 10 10 10 10
**. Correlation is significant at the 0.01 level (2-tailed).
The first thing we notice is that productivity
doesn‟t correlate with any other variable, it seems
to be independent of both income and domestic
product, as well as any of the ecological variables:
biocapacity, ecological deficit and ecological
footprint of consumption.
The strongest correlation identified is between the
ecological deficit and the ecological footprint of
consumption; we find that there is a strong
negative correlation (r = -0.861, sig. 0.000) which
means that the higher the ecological footprint of
consumption, the lower the ecological reserve.
There is a significant correlation also between the
biocapacity and the ecological footprint of
consumption, but positive and lower in intensity
(r = 0.545, sig. 0.067). We observe also that both
GNI and GDP are strongly correlated with the
biocapacity of the countries, r = 0.716 (sig. 0.009),
respectively r = 0.724 (sig. 0.008).
Up to this point in our analysis we have discussed
the economic performance of the selected
countries, their productivity and their biological
capacity, together with their ecological footprint of
consumption and their ecological deficits. Further
we will analyze the economic performance of the
selected countries in regard to their biocapacities;
we will test to what extent would manage these
countries to remain productive and keep their
current levels of income and domestic product if
they had to live within their means.
The table below presents the gross national
income of the countries, its value adjusted by
when = (1- ) and the difference between the
two. As we can see there are huge differences
between GNI and its value adjusted by . The US
is the country that benefits the most of the world
openness, 7564.4 billions of its GNI being
obtained by valorizing resources and markets
other than its own.

Available online at www.managementjournal.info
Iris A Mihai July-August 2014 | Vol.3 | Issue 4|150-160 157
Table 5: Values of gross national income, adjusted gross national income and the difference between
the two
GNI GNI_adjusted Difference
Belgium 440,283,225,823.81 73,911,877,438.33 366,371,348,385.48
Israel 167,275,363,782.99 11,032,190,641.94 156,243,173,141.04
Japan 4,812,118,504,650.81 609,654,587,609.20 4,202,463,917,041.61
Korea, Republic of 1,091,724,432,505.02 75,067,976,623.78 1,016,656,455,881.24
Kuwait 119,171,302,572.80 7,451,562,623.27 111,719,739,949.54
Macedonia TFYR 7,104,059,800.29 1,799,230,146.60 5,304,829,653.68
Netherlands 758,663,878,173.47 125,965,336,136.90 632,698,542,036.57
Qatar 70,704,948,706.42 16,884,837,701.84 53,820,111,004.58
Saudi Arabia 412,762,521,417.80 67,407,931,524.25 345,354,589,893.55
Singapore 163,610,302,253.11 568,568,876.72 163,041,733,376.39
United Arab Emirates 244,417,704,106.41 19,398,825,984.36 225,018,878,122.05
United States of America 14,652,712,112,200.20 7,088,305,584,815.64 7,564,406,527,384.54
The second exploiter of the world resources is
Japan whose GNI owes 4202.4 billion to the world
resources, followed by Korea with 1016.6 billion.
Though the value of the difference between the
GNI and the adjusted GNI is higher for the US,
the difference for Japan is much more important
if considered as percentage of GNI – about 87%,
compared to 51% in the case of US.
We have performed the same operations with the
GDPs of the countries and the results were very
similar, with the US owing 7475.4 of its GDP to
the world biocapacity, followed by Japan and
Korea, with 3804.4 billion, respectively 1045.4
billion. This was an expected outcome due to the
very similar levels of the GDP and GNI observed
earlier in the section dedicated to the analysis of
the economic performance.
As far as productivity is concerned, we observe
again very important differences between
productivity and adjusted productivity. If in the
case of GNI and GDP, the differences were self-
explanatory, in the case of productivity we felt the
need to calculate also the share represented by
the difference between the two variables, in the
productivity index. The last column in the table
below includes these shares.
Table 6: Values for the economic productivity, the adjusted economic productivity, the difference
between the two and the share of the difference in relation to productivity
Productivity
Productivity_
adjusted Difference
Percentage of
difference
Belgium 38.60 6.48 32.12 0.83
Israel 14.73 0.97 13.76 0.93
Japan 95.84 12.14 83.70 0.87
Korea, Republic of 49.67 3.42 46.25
0.93
Kuwait 19.61 1.23 18.38 0.94
Macedonia TFYR 15.48 3.92 11.56 0.75
Netherlands 36.25 6.02 30.23 0.83
Qatar 17.27 4.12 13.15 0.76
Saudi Arabia Missing values Missing values Missing values
Missing values
Singapore 27.09 0.09 27.00 0.99
United Arab Emirates Missing values Missing values Missing values Missing values
United States of America 50.33 24.35 25.98 0.52
They highlight the dependence of these countries
on the world biocapacity more obvious than any
other variable before in the analysis. The most
striking difference is in the case of Singapore,

Available online at www.managementjournal.info
Iris A Mihai July-August 2014 | Vol.3 | Issue 4|150-160 158
whose economic productivity is obtained almost
entirely by valorizing a foreign biocapacity. For
Kuwait 94% of its productivity is explained by
foreign resources, for Korea and Israel, 93% of
their productivity is reliant on the world
resources. The US appears to be the least
dependent country in the list, counting for half of
its productivity on its own biocapacity and for the
other half on the biological capacity of the world.
The analysis was focused on the world most
irresponsible countries when it comes to living
within their own means. But equally true and
accurate is the fact that these are the most
skillful countries when it comes to valorizing
available resources, either their own or belonging
to others.
Conclusions
The complexity of the productivity concept
emphasizes a research area with unlimited
potential for development. Researchers from all
over the world have exploited the concept from
the most diverse perspectives and yet it continues
to be an area that we know little about and that
we can control even less.
In this paper we have analyzed how productive
are the most unsustainable countries, based on
their ecological deficit, and also how productive
would be their economies if, in fact, they would be
responsible enough to resume themselves to their
own biocapacities. In our attempt to answer this
research hypothesis, we have tried to answer a
secondary question as well: what global impact
has the complete disregard of the planet‟s limited
capacity to support social and economical
activities.
For the empirical analysis we have chosen all the
countries with a per capita ecological deficit
higher than 4 gha. This resulted into a pool of
twelve countries from all the continents: United
Arab Emirates, Qatar, Belgium, Kuwait,
Singapore, Netherlands, Republic of Korea, Israel,
Saudi Arabia, Macedonia, Japan and the United
States of America. Their cumulated ecological
deficit is 2.42 billion gha, which means that these
twelve countries are responsible for almost a half
of the world ecological deficit. The countries differ
in size (from Qatar with a population of 1.1
million inhabitants to the US with a population of
308.7 million inhabitants), geographical position
(each continent being represented), political
system (republic – parliamentary representative
democratic; presidential representative
democratic; federal constitutional-, monarchy –
absolute; federal presidential absolute; federal
parliamentary representative democratic
constitutional; hereditary; constitutional; or
multiparty parliamentary representative
democratic constitutional-, or parliamentary
democracy), cultural background, GDP (from 8.1
billion $ for Macedonia to 14480.3 billion $ for US)
etc. Their two common areas being the lack of
sustainability of their economical processes
considered in regard to their ecological deficit and
the fact that they are all, except from Macedonia,
strong economies, included in the High Income
Group of countries according to the World Bank
classification.
The most productive country of the group proved
to be Japan, with a 95.84 score, much more
productive than any other country in the group. It
is seconded by the US and Korea, with 50.33,
respectively 49.66 scores. The least productive
countries in the group are Israel – with a score of
14.73, Macedonia – with a score of 15.48 and
Qatar – with 17.26. Further in our analysis we
have checked if there was any correlation between
economic productivity and the other economic
performance variables. The test showed no
significant correlation, which means that an
economy can have a high or low productivity,
regardless of its size.
The sustainability perspective was captured in
the paper via three indexes: total biocapacity,
ecological footprint of consumption and ecological
deficit. The countries vary significantly across
each index. The most important ecological deficit
belongs to the United Arab Emirates, of 9.8 gha
for the per capita deficit and 61.42 millions gha,
the total ecological deficit. The deficit of the UAE
is caused by its very limited capacity of only 0.8
gha (per capita), its population rather large
compared to its deficit, but most importantly by
its huge ecological foot print of consumption, of
10.7 gha, the highest in the world. The UAE is
seconded by Qatar, another Arab country, whose
per capita ecological deficit is 8 gha, while its total
deficit is of 9.1 million gha. The global impact of
the Qatar deficit is much smaller than the one of
UAE because: (i) its population is much smaller,
(ii) it has an own biocapacity three times larger
and (iii) its per capita ecological footprint is
smaller, even if not much smaller – Qatar has the
second largest per capita footprint of consumption
in the world.
Furthermore we have adjusted the economic
performance variables by = (1- ), in order to
reveal how much of the economic result is
obtained via a sustainable use of the biocapacity
and how much is obtained through exploitation of
the global stock of the resources. The values

Available online at www.managementjournal.info
Iris A Mihai July-August 2014 | Vol.3 | Issue 4|150-160 159
obtained are significantly different from the
official records of each country, the differences
counting for up to 99.65% in the case of
Singapore. As far as absolute values are
concerned, the US has the highest differences
between the economic performance indexes and
their adjusted values, while Singapore has the
highest shares.
The cumulated difference of the GDP and its
adjusted value of the 12 countries equals the GDP
of the US, respectively 14.4 thousand billion $.
This means that these twelve countries manage to
exploit/valorize the stock of the global resources in
such an extensive manner that can obtain the
economic performance of the US, the strongest
economy in the world, without having any of its
resources.
The results brought to light several important
findings, but most importantly it proved the
validity of the equation developed with the
purpose of testing the sustainability of the
economic productivity. The results still leave room
for a lot of interpretation. The productivity levels
of the 12 countries are way beyond reasonable,
reflecting a lack of common global initiatives able
to protect the common stock of resources and able
to protect the smaller national players. The
current pattern of economic development is one
tailored by the big players for the big players with
a complete and utter disregard of the wellbeing of
mankind.
Scope for Future Research
Future works will extend the pool of countries
selected for the empirical analysis in order to
identify the differences in productivity intensity
for the bulk of cross-country variations.
Furthermore, we hope to identify some thresholds
to divide the countries in categories according to
their level of productivity (high, medium or low)
and their responsibility (social and
environmental). Both inter- and intra- categories
analyses are required in order to ensure the
robustness of the partitioning. Moreover, we want
to identify alternative measurements for labor
and capital compensation to make possible the
analysis over a longer period of time, to identify
trends and to be able to predict future
developments.
Acknowledgement
This work was supported by the European Social
Fund through Sectorial Operational Programme
Human Resources Development 2007 – 2013,
project number POSDRU/159/1.5/S/142115,
project title “Performance and Excellence in
Postdoctoral Research in Romanian Economics
Science Domain”.
Reference
1. Razzak W (2006) Explaining the gaps in labor
productivity in some developed countries, MPRA
paper no. 1888.
2. Antle MJ, Capalbo S (1988) An introduction to
recent development in production theory and
productivity measurement in S. Capalbo & M.J.
Antle (Eds.), Agricultural productivity.
Measurement and explanation, Washington, DC:
Resources for the Future, 17-95
3. Manoilescu M (1986) Forţele naţionale productive şi
comerţul exterior, Teoria protecţionismului şi a
schimbului international; Bucureşti: Editura
Ştiinţifică şi Enciclopedică.
4. Samuelson P, Nordhaus W (1995) Economics (15th
ed.) New York: McGraw-Hill.
5. Durdyeva S, Ihtiyarb A, Ismailc S, Ahmadd FS,
Bakare NA (2014) Productivity and service quality:
Factors affecting in service industry. Procedia -
Social and Behavioral Sciences 109:487-491.
6. Tolentini A (2004) New concepts of productivity and
its improvement. European productivity network
seminar, Budapest.
7. Kenlow PJ, Rodriguez-Clare A (1997) The
Neoclassical Revival of Growth Economics: Has It
Gone Too Far?” in Ben Bernanke and Julio
Rotemberg (eds.), NBER Macroeconomics Annual,
MIT Press, Cambridge, MA.
8. Hall R, Jones C (1999) Why do some countries
produce so much more output per worker than
others? Quarterly Journal of Economics 114(1):83-
116.
9. Parente S, Rogerson LR, Wright R (2000)
Homework in development economics: Household
production and the wealth of nations. Journal of
Political Economy, 108(4):680-687.
10. Prescott EC (1997) Needed: A Theory of Total
Factor Productivity, Federal Reserve Bank of
Minneapolis Research Department Staff Report
No. 242.
11. Prescott EC (1998). Needed: A theory of total
factor productivity. International Economic
Review, 93(3):525-551.
12. Prescott EC (2002) Prosperity and Depression:
2002 Richard T Ely Lecture, The American
Economic Review in Razzak, W. (2006).
Explaining the gaps in labor productivity in some
developed countries, MPRA paper no. 1888
13. Gonzales G, Constantin S (2008) Explaining TFP
Productivity Rates: Dissimilar effect of openness

Available online at www.managementjournal.info
Iris A Mihai July-August 2014 | Vol.3 | Issue 4|150-160 160
between different income groups of countries.
MPRA paper no. 17584.
14. Lall P, Featherstone AM, Norman DW (2002)
Productivity growth in the Western Hemisphere
(94): the Caribbean in perspective. Journal of
Productivity Analysis, 17:213-231.
15. Jaffe AB, Peterson S, Portney P, Stavins R (1995)
Environmental regulation and the competitiveness
of U.S. manufacturing:What does the evidence tell
us? Journal of Economic Literature, 33:132-163.
16. Zhao C (2012) Does Regulation on CO2 Emissions
Influence Productivity Growth? The Empirical
Test Based on DEA Analysis, Energy Procedia 16
:667-672
17. Yazdan GF, Hossein SSM (2012) FDI and ICT
effects on productivity growth, Procedia-Social and
Behavioral Sciences, 93:1710-1715
18. Dimelisa PS, Papaioannou, KS (2010) FDI and
ICT Effects on productivity growth: A comparative
analysis of developing and developed countries.
European Journal of Development Research.
22:79-96.
19. Global Footprint Network (2010). Glossary,
retrieved July 28, 2014, from
http://www.footprintnetwork.org/ar/index.php/GF
N/page/glossary/