A systems approach to analysing environmental decisions in the automotive industry
Upload
khangminh22Category
view
0download
0
Analysing and exploring land use decisions by smallholder agrowetland
households in rural areas of East Africa
Nomé Sakané

Thesis committee
Thesis supervisor Prof. dr. K.E. Giller Professor of Plant Production Systems Wageningen University
Thesis co-supervisors
dr. M.T. van Wijk Assistant professor, Plant Production Systems Group Wageningen University Prof. dr. M. Langensiepen Professor, Institute of Crop Science and Resource Conservation, INRES University of Bonn Other members
Prof. dr. ir. A.K. Bregt, Wageningen University Dr. S.M. Visser, Wageningen University Dr. ir. G.E. van Halsema, Wageningen University Dr. K. Kok, Wageningen University
This research was conducted under the auspices of the C.T. de Wit graduate school of Production Ecology and Resource Conservation.

Analysing and exploring land use decisions by smallholder agrowetland
households in rural areas of East Africa
Nomé Sakané
Thesis
submitted in fulfilment of the requirements for the degree of doctor at Wageningen University
by the authority of the Rector Magnificus Prof. dr. M.J. Kropff,
in the presence of the Thesis Committee appointed by the Academic Board
to be defended in public on Monday 5th December 2011
at 1.30 p.m. in the Aula.

Nomé Sakané Analysing and exploring land use decisions by smallholder agrowetland households in rural areas of East Africa. Thesis Wageningen University, Wageningen, NL (2011) With references, with summaries in English, French and Dutch
ISBN 978-94-6173-029-9

v
To my late father, my late mother, late Mrs Jeannine Gundermann who had
unshakable faith in what I could achieve, and to the women all over the
world who have been playing a motherly role in my life...

vi

vii
Abstract
Small wetlands become increasingly important for agricultural production of rural households in sub-Saharan Africa. Changes in wetland systems are event driven and a cumulative result of individual farmer’s decisions of land uses. The overall objective of this dissertation was to develop a method that takes account of individual decision-making to study the current uses of wetlands by smallholder rural farmers and how wetlands may develop in the future. Diverse methods that include rapid rural and participative approaches, wetland mapping and classification, farm typologies, identification of drivers of land use change and farmers’ decision-making were used to develop a decision tree. This model was then used for scenario analyses.
Case study wetlands were surveyed within a total area of 484 km2. The wetlands were located in contrasting landscape units (lowland, midland, and highland) in Central Kenya and Laikipia plateau in Kenya and Usambara mountains and Pangani basin in northeastern Tanzania. Fifty-one (51) wetlands were characterised to identify and understand the drivers of diversity of wetlands and uses. Based on wetland type, shape, size, hydrological regime, soil fertility indicators, drainage patterns, use intensity, fertiliser, and market opportunity, wetland-units were categorised into five wetland cluster groups (WCGs). These groups were: 1. Largely unused narrow permanently flooded inland valleys; 2. Extensively used wide permanently flooded inland valleys and highland floodplains; 3. Seasonally flooded and moderately used wide inland valleys and lowland floodplains; 4. completely drained and intensively used wide inland valleys and highland floodplains; and 5. narrow valleys drained for continuous high-value crops production. Case study farms from four WGCs (2-5) were characterised to identify the diversity of production systems and drivers of wetland use decisions by smallholder farmers in contrasting rural areas. Using a combination of production systems (livestock ownership, type, and its integration with crops), land resource (upland, wetland, and their combination), and production objectives (subsistence, cash, and cultural), households were grouped into 12 Farm Types. Based on these two typologies and their relationships with environmental and socio-economic drivers of wetland use, a decision tree model framework was developed to

Abstract
viii
represent the diversity of farmers’ decision-making and analyse the effects of such diversity on current land uses in the wetlands. The framework was then used to explore changes in land use in scenario-driven analysis. Increasing land scarcity coupled with improved markets could increase the dependency of household’s livelihood on cropland in the wetland up to 100% (e.g. for FT2). This increase would also decrease pastoralism in semi-arid areas (87%) as well as stimulate livestock integration by crop-based farms. Land use intensification across wetlands and specification in midland valleys could accompany such changes. Furthermore, land use displacement from traditional floodplain to rangeland grazing is an unavoidable consequence of land use intensification. Agricultural use of small wetlands offers opportunities to diversify rural livelihood systems. However, wetland farming is challenged by various hazards and shocks such as conflicts, abiotic, biotic, and socio-economic factors that constrain crop production. Small wetland agricultural systems are complex and characterised by interactions between heterogeneous human decision-makers (i.e. farmers) and their biophysical environment (wetland systems). Changes in these systems are event driven and cumulatively results from individual farmer’s decisions of land use in response to endogenous and exogenous drivers. Reconciling livelihood benefits with sustainable land use and natural resource conservation in rural areas is thus a complex and challenging social task that requires the development of an adaptive co-management process with the active participation of all stakeholders.
Key words: Farm(er) typologies, farmers’ decision-making, floodplain, households’ production systems, human-environment interactions, inland valley, Kenya, land use decisions, land use model, rural livelihood, scenario, simulation, Tanzania, uplands, wetland, wetland typology.

ix
Contents
Chapter 1. General introduction 11
Chapter 2. Classification, characterisation, and use of small wetlands in East Africa
25
Chapter 3. Typology of agrowetland smallholder production systems of East Africa
57
Chapter 4. Modelling land use decisions by smallholder agrowetland households in rural areas of East Africa
97
Chapter 5. Exploring the effects of endogenous and exogenous processes on the diversity of agrowetland farmer’s decision-making on land use change in rural areas of Kenya and Tanzania
129
Chapter 6. General discussion and conclusions 165
References 187
Appendices 201
Summary 211
Résumé 217
Samenvatting 225
Acknowledgements 231
List of publications 237
PE&RC PhD Education Certificate 239
Curriculum Vitae 241
Funding 243


Chapter 1
General introduction


Chapter 1
4
Chapter 1
1. Wetlands, uses, and agricultural production in East Africa
Wetlands are a common landscape feature in sub-Saharan Africa covering about 4.7% of the total land area (Matthew and Fung, 1987; Bergkamp et al., 2000). Wetlands play an important role in rural livelihood systems of sub-Saharan Africa (SSA), providing critical resources for the everyday lives of rural communities with access to such areas (Silvius et al., 2000). Wetlands are a source of drinking water and natural products that include thatching and craft materials and medicinal plants (McCartney and van Koppen, 2004). Besides the natural products, wetlands are valuable agricultural resources due to their function as reservoirs of soil moisture. Depending on their ecohydrological regimes, wetlands have been inextricably linked to cropping and livestock management systems (Scoones, 1990; Adams, 1993; Woodhouse et al., 2000). Agricultural activities often carried out in small wetlands that can be managed by the local community or external investment (Wood and Dixon, 2001).
Wetland definitions vary depending on the need, interest, and the user (Tiner, 1999). According to the Ramsar Convention, wetlands are “areas of marsh,
fen, peat land, or water, whether natural or artificial, permanent or temporary,
with water that is static or flowing, fresh, blackish, or salt, including areas of
marine water, the depth of which at low tide does not exceed six meters” (Ramsar Convention Secretariat, 2006:49). In this study, small wetlands are regarded as: “land units of less than 500 ha that are characterised by
permanent or seasonal flooding or by soil moisture availability higher than that
of the surrounding uplands” (Becker et al., 2006).
Eastern Africa region has various wetland types (Harper and Mavuti, 1996; Wood and Dixon, 2002; van der Heyden, 2004) but small wetlands (≤ 500 ha) constitute a greater proportion (80%) of the total wetland area (Wood and Dixon, 2002) covering about 12 million ha in Kenya and Tanzania (Kalinga and Shayo, 1998; Kiai and Mailu, 1998). Wetlands, as part of the natural ecosystems perform various ecological and socio-economic functions, which are valued differently by different user groups with diverse interest (MEA, 2005). Their multiple uses and their role in supporting large populations are increasingly recognised (Barbier et al., 1997). Ecological functions include climatic regulation, nutrient retention regulation of water quality, flood control and biodiversity maintenance, whereas natural or productive uses, such as

General introduction
5
Cha
pter
1 water, plants, crops, and grazing dominate socio-economic services (MEA,
2005).
The origins of wetland cultivation have been attributed to food shortages caused by erratic rainfall and/or severe drought (e.g. Wood and Halsema, 2008). Since the 1970s, wetland cultivation has extended beyond the use of wetland margins to include large areas, and the drainage and cultivation of whole wetlands (Dixon, 2002). Cultivation expansion and intensification has often resulted from socio-economic, environmental, and political change that has driven local livelihood diversification across the region (Dugan, 1990; Schuyt, 2005). These changes have led to a shift from subsistence production towards more economically productive activities (Hollis, 1990; Dugan, 1990) to boost household income. The resulting pressure on wetlands coupled with emerging evidence of reduction in wetland area, has heightened concerns over the sustainability of wetland-based environmental services and livelihood benefits (Junk, 2002; Schuyt, 2005). It is accepted that wetland services as part of ecosystem services play an important role in poverty reduction (Silvius et al., 2000; WRI et al., 2005), addressing Millennium Development Goal number one (MDG 1) - to reduce rural poverty and social inequity and eradicate hunger, particularly in SSA. However, wetland degradation and loss have been largely attributed to agriculture (Foley et al., 2005; MEA, 2005). The Millennium Ecosystem Assessment concluded that any failure to tackle the decline in ecosystem services could seriously erode efforts to attain MDG 1 in SSA (WRI et al., 2005). Therefore, pursuing policy options for food production by the smallholder households and wetland conversation (i.e. efforts to address MDG 7 - to ensure the environmental sustainability) in rural areas are crucial.
2. Smallholder agrowetland farmers
Food production in sub-Saharan Africa (SSA) has not kept pace with population growth (Breman and Debrah, 2003). While food production defies the Malthusian theory at a global scale, per capita food production has declined in SSA (Boserup, 1965) due to decrease in per capita land productivity. Efforts to maintain land productivity are constrained by several challenges that include degradation of arable land due to restricted technological innovations and continuous cultivation (Lal, 1987; Vanlauwe and Giller, 2006), population growth and increasing shortages of arable land (Cleaver and Schreiber, 1994). Thus population growth and its interaction with
Chapter 1
6
Chapter 1
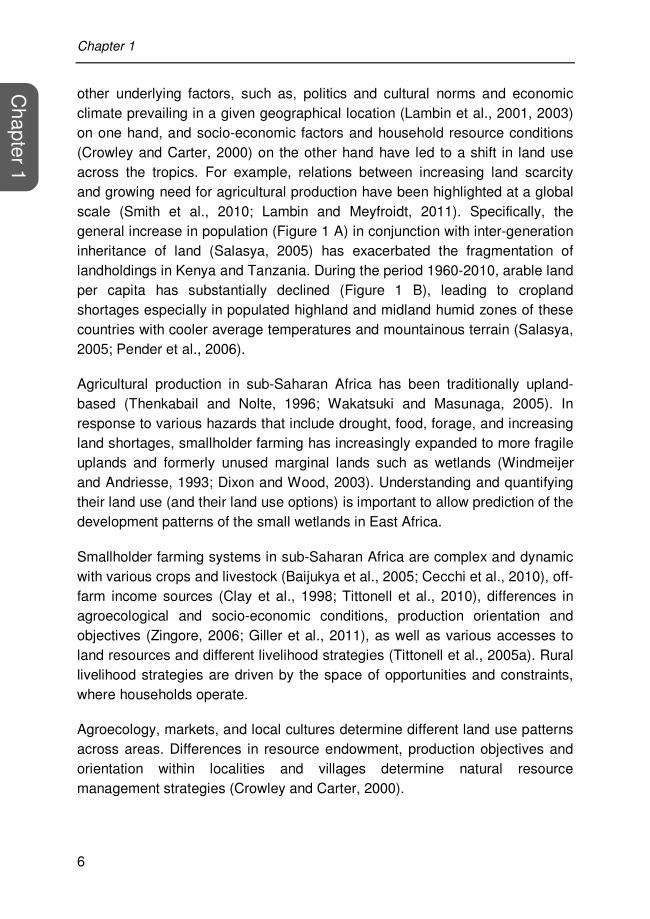
other underlying factors, such as, politics and cultural norms and economic climate prevailing in a given geographical location (Lambin et al., 2001, 2003) on one hand, and socio-economic factors and household resource conditions (Crowley and Carter, 2000) on the other hand have led to a shift in land use across the tropics. For example, relations between increasing land scarcity and growing need for agricultural production have been highlighted at a global scale (Smith et al., 2010; Lambin and Meyfroidt, 2011). Specifically, the general increase in population (Figure 1 A) in conjunction with inter-generation inheritance of land (Salasya, 2005) has exacerbated the fragmentation of landholdings in Kenya and Tanzania. During the period 1960-2010, arable land per capita has substantially declined (Figure 1 B), leading to cropland shortages especially in populated highland and midland humid zones of these countries with cooler average temperatures and mountainous terrain (Salasya, 2005; Pender et al., 2006).
Agricultural production in sub-Saharan Africa has been traditionally upland-based (Thenkabail and Nolte, 1996; Wakatsuki and Masunaga, 2005). In response to various hazards that include drought, food, forage, and increasing land shortages, smallholder farming has increasingly expanded to more fragile uplands and formerly unused marginal lands such as wetlands (Windmeijer and Andriesse, 1993; Dixon and Wood, 2003). Understanding and quantifying their land use (and their land use options) is important to allow prediction of the development patterns of the small wetlands in East Africa.
Smallholder farming systems in sub-Saharan Africa are complex and dynamic with various crops and livestock (Baijukya et al., 2005; Cecchi et al., 2010), off-farm income sources (Clay et al., 1998; Tittonell et al., 2010), differences in agroecological and socio-economic conditions, production orientation and objectives (Zingore, 2006; Giller et al., 2011), as well as various accesses to land resources and different livelihood strategies (Tittonell et al., 2005a). Rural livelihood strategies are driven by the space of opportunities and constraints, where households operate.
Agroecology, markets, and local cultures determine different land use patterns across areas. Differences in resource endowment, production objectives and orientation within localities and villages determine natural resource management strategies (Crowley and Carter, 2000).

General introduction
7
Cha
pter
1
0
20
40
60
80
1950 1975 2000 2025
To
tal p
op
ula
tio
n(M
illio
ns o
f pe
rson
s)
Year
Kenya
Tanzania
2010
0.0
0.2
0.4
0.6
1960 1970 1980 1990 2000 2010
Ara
ble
la
nd
pe
r c
ap
ita
(ha
pers
on-1
)
Year
Kenya Tanzania
Figure 1: General trends of: (A) population growth; and (B) decline in arable land per
capita between 1960 and 2010 for Kenya and Tanzania. The dotted line separates the
trends for the past 50 years with the estimated projections from 2010 to 2025; Source: Population Division of the Department of Economic and Social Affairs of the United Nations Secretariat, World Population Prospects: The 2010 Revision,
http://esa.un.org/unpd/wpp/index.htm and Food and Agriculture Organization of the United Nations, http://faostat.fao.org/site/377/default.aspx.
(A)
(B)

Chapter 1
8
Chapter 1
At individual farm level, access to natural resources opens opportunities to farmers to expand farming activities across different landscape positions for livelihood diversification. Finally, interactions between these factors influence land use decisions of smallholder farmers who operate in rural areas (Ruthenberg, 1976; Giller et al., 2011). The complexity leads to diversity and heterogeneity of farming households, land use decisions, options, and strategies: within a certain locality, different farm types may be identified and within these diverse decision-making and hence heterogeneous land use patterns may be recognised.
Identifying diversity in decision-making among farms and across localities is an important step in land use research (Lambin et al., 2001). Farmers’ decision-making is influenced by various internal and external factors that include personal, socio-economic and biophysical contexts inherent to the farmer, the farming system, the institutions, and policies (IIbery, 1978). Therefore, including farmers’ decision-making processes and their interactions with their socio-economic and biophysical contexts in land use change analysis is seen to play a substantial role when modelling land use change (e.g. Verburg et al., 2004).
3. Research Objectives
The overall aim of this study was to develop a method to study the current uses of wetlands by smallholders and how wetlands may develop in the future.
The specific objectives of the study were to:
1. identify the drivers of diversity of wetlands and uses, classify and characterise identified wetlands and better understand their use under different biophysical conditions and varying socio-economic environments;
2. identify and categorise the drivers of farm heterogeneity in different wetland systems, assessing the influence of household diversity, access to cropland of uplands, access to markets, and potential of rural livelihood diversification on wetland agricultural use, and characterising the diversity of farmers’ decision-making with respect to the different land uses;
3. develop a framework for representing and simulating land use changes as a result of farmers’ decision-making; and

General introduction
9
Cha
pter
1 4. apply this framework for exploring and analysing the effects of
endogenous and exogenous processes on the diversity of agrowetland farmers’ decision-making on land use change in four contrasting study areas.
Various activities were carried out to achieve these objectives that included rapid rural surveys, semi-structured and structured interviews, focus group discussions, wetland and field surveys, and modelling exercises.
4. Study area
Major land units within which wetlands occur in East Africa comprise highlands and lowlands in the semi-arid, sub-humid and humid zones and are found on diverse base rock materials. For the present study, the following landscape units and associated study sites were selected: (1) the humid highlands on volcanic material (e.g. Nyeri, Mount Kenya, Central Kenya); (2) the semi-arid highlands on granite (e.g. Laikipia plateau, Aberdares, Rift Valley, Kenya); (3) the humid midlands on gneiss (e.g. Lushoto, West Usambara mountains, Tanzania); and (4) the sub-humid lowlands on fluvial sediments (e.g. Korogwe, Pangani plain, Tanzania) (Figure 2). These landscape units are estimated to cover about 70% of the East African land area and are hence representative of the environmental and agroecological diversity of the region.
Areas under study were located in four contrasting rural areas in Kenya and Tanzania, with altitude ranging between 280 and 2300 m asl. In addition to the climate and the parent rock, sites differed in population density, average farm size and market accessibility. Therefore, sites were selected based on differences in landscape topography and rainfall patterns to cover dominant wetland types that occur in East Africa (Windmeijer and Andriesse, 1993; Dixon, 2002). The four sites were: Nyeri district on the slopes of Mt. Kenya, Laikipia West district in Laikipia plateau in Kenyan highlands, Lushoto district in Usambara highlands and Korogwe districts in the Pangani basin of Tanzania.
Selected sites differed in agroecological conditions, market opportunities, and population densities (Jaetzold and Schmidt, 1982; Kohler, 1987; MOA-URT, 2006). Contrasting agroecologies resulted in differences in agricultural potential that was high for humid highland and midland and low for sub-humid lowland and semi-arid highland of the area (Jaetzold et al., 2006). The rainfall

Chapter 1
10
Chapter 1
distribution across the area is bimodal, characterised by a long and short rains that allow two cropping seasons per year. However, variability and unreliability characterise the rainfall pattern in the sub-humid and semi-arid areas (Jaetzold and Schmidt, 1982). Population densities are high in mountainous areas with high rainfall in Nyeri and Lushoto leading to small farm sizes (Tenge, 2005; Pender et al., 2006).
A wide variability in these factors has resulted in different land use systems among sites. Such systems range from subsistence oriented systems based on staple food crops to large scale export-oriented horticulture, large scale ranching and pastoralism, through market-oriented smallholder coffee, tea, and dairy systems (Braun et al., 1997; Thenya, 2001). Livestock systems are linked to land availability where intensive zero-grazing dairy (complemented with cut-and-carry in the wetland) prevails in humid areas and free grazing in communal grasslands (upland and wetland) in dry areas (Pender et al., 2006).
Pangani basin
Usambara highlands
Mt. Kenya highlands
Laikipia plateau
Laikipia
Nyeri
Kenya
Lushoto
Korogwe
Tanzania
Study sites
Kilometers
Figure 2: Location of study sites in Kenya (Aberdares range: Rift Valley and Mount Kenya
highlands: Central Kenya and) and Tanzania (Usambara highlands and Pangani basin: Tanga region) with a false colour Landsat image at the background.
Pangani basin

General introduction
11
Cha
pter
1 Crop and livestock integrated systems differed among sites and farmers of
different social status. Cultural medium- to large-holdings livestock oriented farms dominate land use systems in the semi-arid highland areas of Laikipia West (Jaetzold et al., 2006; Kohler, 1987).
5. Addressing the diversity of small wetland agricultural systems
Following Valbuena et al. (2008), land use change processes can be investigated using an actor-based approach. Actor-based approaches offer the possibility to represent and link different decision-makers and their environment units (i.e. farm, field, and wetland). Individual (farmer’s) decision-making, interactions, and the diversity of decision-makers can be further simplified, included, and represented. Therefore, this dissertation focuses on generating and applying an actor-based technique to represent, to analyse and explore the decision-making processes of diverse smallholder farming households and their interactions with heterogeneous socio-economic and biophysical contexts in rural areas in East Africa. Specifically, the analysis focuses on individual decision-making of agrowetland households and their environment (i.e. small wetlands). Different analyses were performed following various steps that are described and shown in Figure 3.
System analysis, aided by modelling, helps to consider the diversity and heterogeneity that characterise complex systems; and the possibility to perform scenario analysis with prospective and explorative purposes. The system analysis methods employed in this dissertation combine rapid rural and participative approaches, wetland mapping and classification, farm typologies, identification of drivers of land use change, farmers’ decision-making, and modelling framework to analyse and explore changes in small wetland uses. Different steps are articulated using the ‘DEED’ approach (Tittonell, 2008). The development of the four research chapters in this dissertation follows the three different steps of this approach as described below.
6. Outline of the thesis
This dissertation consists of six Chapters (Figure 4), including this general introduction. The four research Chapters (i.e. 2 to 5) are interrelated and have been developed following the first three steps of the DEED methodology by Tittonell (2008). This was done to guide the selection of representative

Chapter 1
12
Chapter 1
wetlands for multi-disciplinary detailed studies and to define socio-ecological niches for specific wetland uses for the overall project.
Step 2. Detailed system characterisation : production systems of agrowetland household; Farm typologies (FTs)
Step 4. Scenario and explorations: Effects of endogeneous and exogeneous processes (i.e. land scarcity and national policies ) on the diversity of farmers' land use decision-
making
Step 3. Quantitative and qualitative systems analysis: Individual land use decision-
making, options, and actions
Reconnaissance and wetland surveys: rapid rural appraisal
Biophysical and socio-economic clustering
Multivariate statistics (PCA) & Expert-knowledge
Wetland, farm, and household surveys (detailed sample)
Decisions analyses (actor-based approach)
Wetland field, household surveys, farmers' group discussions: participatory rural appraisal
(detailed sample)
Step 1. Rapid system characterisation : Wetland classification and cluster groups
definition (WCGs)
Sample of wetlands (nw = 51)
Case study wetlands and households(nw = 4, nh = 275)
Selected wetlands and households for model parameterisation
(nw = 4, nh = 252) and model application
(nw = 1, nh = 98)
Wetlands and householdsincluded (nw = 4, nh = 262)
Problem analysis and objective formulation
Model conceptualisation
Theoretical model framework
Data collection and analyses
Scenario analysis (model application)
On
-we
tla
nd
\fa
rm m
eth
od
s(T
yp
olo
gy fo
rmu
lati
on
)C
om
pu
ter-
bas
ed
(Mo
de
l lin
g e
xe
rcis
e)
Contribution to policy making
Livelihood strategies, land development and use, crop
management (detailed sample)
Figure 3: Steps in the analysis of land development and use change processes, integrating the classification of wetland, the analysis of smallholder farming systems, the diversity of individual decision-making, and modelling framework in small wetland agricultural systems. Detailed system characterisation is done on a sub-sample of wetlands selected to represent
different wetland use systems. nw represents the number of wetlands and nh that of households considered in the analysis.

General introduction
13
Cha
pter
1
For this specific research, wetland classification and characterisation was done to include wetland-agriculture diversity in the modelling framework. Diversity in rural smallholder production systems results from differences in resources endowment, accesses to production land and how people apply these resources in pursuance of a living. Other factors like agroecological potential, population densities, and market and off-farm income opportunities contribute to shaping livelihood strategies and hence reinforce household diversity. All these differences are further reflected in the diversity of land use decisions by smallholder farmers who operate in rural areas. Thus, Chapter 3 illustrates the use of agrowetland farm(er)s’ typologies to link land use decision units to the environment. In the second step (Explain), key processes of land development and uses and influential factors governing the decision-making of land use and change are analysed. This is done in Chapter 4 that illustrates the use of typologies to simply and to include the diversity of wetlands and farmers’ decision-making described in Chapter 2 and 3. The use of a generic decision-tree model to analyse and simulate land use change as the results of diverse land use decisions was demonstrated in the same chapter for Malinda lowland floodplain in northerneasten Tanzania. In the third step (Explore), the concepts previously described and the decision tree model are used to explore how the response of farmers to changes in household characteristics (i.e. upland per capita), changes in agricultural and development policies at national levels (i.e. markets and irrigated agriculture) can affect wetland agricultural use at local level. This was done in Chapter 5 for four contrasting study sites with two inland valleys and two floodplains using scenario analysis. Key aspects that
Ge
ne
ral i
ntr
od
uc
tio
n
(Ch
ap
ter 1
)
Description (Describe)
Rapid wetland-agriculturesystems characterisation
(Chapter 2)
Detailed characterisation of agrowetland households'
production systems (Chapter 3)
Modelling framework andanalysis of land use decisions
(Chapter 4)
Integrated scenarios(Chapter 5)
Ge
ne
ral d
isc
us
sio
n a
nd
co
nc
lusio
n
(Ch
ap
ter 6
)
Concept & Application(Explain-Explore)
Figure 4: Schematic representation of the dissertation outline.

Chapter 1
14
Chapter 1
were not included in the analyses of Chapters 2 - 5 (hazards and shocks, soil fertility, effects of land use on natural vegetation and water use) are discussed in Chapter 6, the General Discussion. The main findings of this dissertation in relation to the application of the decision tree are also presented and discussed in the same chapter with emphasis on methodological approaches, as well as the contribution of this dissertation to land use research in wetland studies and policy-making processes.

Chapter 2
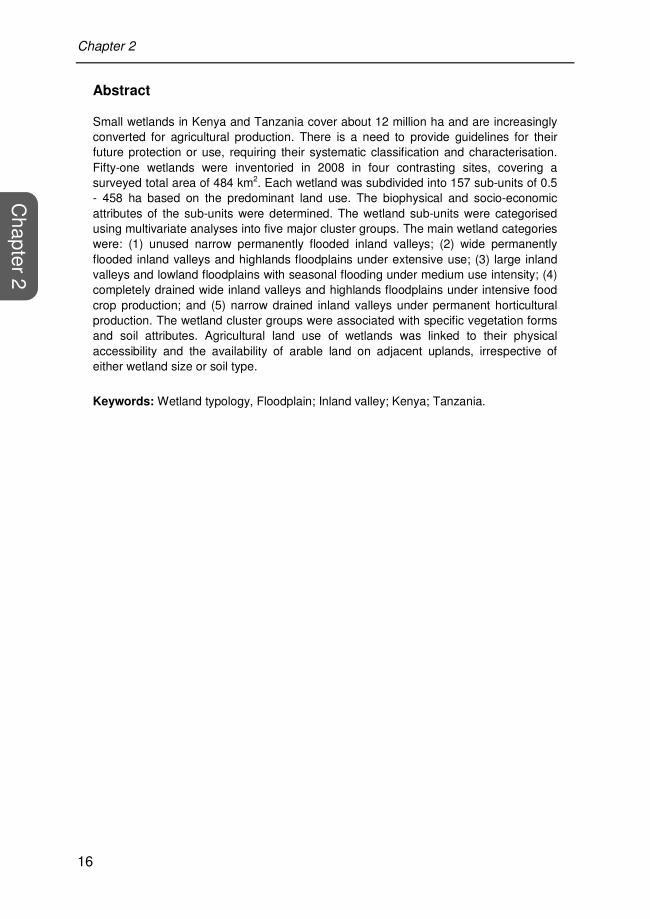
Classification, characterisation, and use of small wetlands in East Africa
Adapated from: Sakané, N., Alvarez, M., Becker, M., Böhme, B., Handa, C., Kamiri, H.W., Langensiepen, M., Menz, G., Misana, S., Mogha, N.G., Möseler, B., Mwita, E.J., Oyieke, A.H., van Wijk, M.T., 2011. Classification, characterisation, and use of small wetlands in East Africa. Wetlands, DOI 10.1007/s13157-011-0221-4.
Rice fields
Natural vegetation
Seasonal grazing, small fields
Overview of the wetland
Livestock grazing and watering ground
Open water body (Kilemere)
Rain-fed rice, fallow fields and trees
River tributary
Mixed agriculture
River diversion for irrigation
Chapter 2
16
Chapter 2
Abstract
Small wetlands in Kenya and Tanzania cover about 12 million ha and are increasingly converted for agricultural production. There is a need to provide guidelines for their future protection or use, requiring their systematic classification and characterisation. Fifty-one wetlands were inventoried in 2008 in four contrasting sites, covering a surveyed total area of 484 km2. Each wetland was subdivided into 157 sub-units of 0.5 - 458 ha based on the predominant land use. The biophysical and socio-economic attributes of the sub-units were determined. The wetland sub-units were categorised using multivariate analyses into five major cluster groups. The main wetland categories were: (1) unused narrow permanently flooded inland valleys; (2) wide permanently flooded inland valleys and highlands floodplains under extensive use; (3) large inland valleys and lowland floodplains with seasonal flooding under medium use intensity; (4) completely drained wide inland valleys and highlands floodplains under intensive food crop production; and (5) narrow drained inland valleys under permanent horticultural production. The wetland cluster groups were associated with specific vegetation forms and soil attributes. Agricultural land use of wetlands was linked to their physical accessibility and the availability of arable land on adjacent uplands, irrespective of either wetland size or soil type.
Keywords: Wetland typology, Floodplain; Inland valley; Kenya; Tanzania.

Drivers of small wetlands and uses diversity
17
Cha
pter
2
1. Introduction
Wetlands cover about 4.7% (≈ 228 million ha) of the total land area in sub-Saharan Africa (SSA) (Matthew and Fung, 1987; Bergkamp et al., 2000; Rebelo et al., 2009). SSA has diverse wetlands that include large wetlands of international interest such as the Lake Victoria basin, the Nile catchment, or the saline coastal swamps and marshes as well as small wetlands in eastern Africa that have received little international research attention (Finlayson et al., 2001). The latter comprises spring-fed valley head and mid-section swamps of inland valleys (van der Heyden, 2004), peat swamps of the East African highlands (Josten and Clarke, 2002), and small lake and river floodplains (Harper and Mavuti, 1996). Such small wetlands (≤ 500 ha; Dixon, 2002) constitute a greater proportion (80%) of eastern African total wetland area, covering about 12 million ha in Kenya and Tanzania (Kalinga and Shayo, 1998; Kiai and Mailu, 1998). They present local hotspots for biodiversity (Chapman et al., 2001), fulfil buffering functions (Denny and van Steveninck, 2001) and are important sites for a wide range of socio-cultural activities (Gopal et al., 2000). Prolonged periods of water availability and inherent soil fertility make wetland areas suitable for agricultural production (van der Heyden and New, 2003). Consequently, wetlands have been linked to cropping and livestock management systems, thereby contributing to the livelihood of rural communities with access to such areas (Adams, 1993).
Agriculture has long been practised on wetlands. However, wetland farming in inland valleys is a more recent activity as compared with that in the floodplains in general (Roberts, 1988; Verhoeven and Setter, 2009). Small wetlands have also been used for agricultural purposes besides non-agricultural uses for hunting, drinking water collection, and harvesting of thatching materials (e.g. Wood et al., 2002). As reservoirs of soil moisture, these areas have been traditionally used, albeit on a small-scale, to cultivate upland food crops, alleviating food shortages caused by erratic rainfall and/or severe drought (e.g. Wood and Halsema, 2008). Other forms of traditional cultivation include rain-fed rice grown during the rainy season and flood-tolerant root crops (i.e. arrow root) planted in the wet sections of the valleys. Such seasonal and extensive farming activities have been practiced on wetland fringes or small sections of the wetland area (Dixon and Wood, 2003). However, socio-economic, environmental, and political change across the SSA region has driven local livelihood diversification, and wetlands have assumed a new significance as agricultural resources (Dugan, 1990; Schuyt, 2005). Since the 1970s, wetland

Chapter 2
18
Chapter 2
cultivation has extended beyond the use of wetland margins to include large areas, and the drainage and cultivation of whole wetlands (Dixon, 2002). The resulting wetland cultivation expansion and intensification contribute significantly to local and regional food security (Wood, 1997) as well as to improve rural livelihood systems through more economically productive activities (Olindo, 1992; Silvius et al., 2000). However, many of the drained wetlands show declining productivity and, after several years of intense use, have been abandoned to fallow or extensive grazing (McCartney et al., 2005). Drivers of this vulnerability of wetland sites or their sensitivity to anthropogenic interventions are not well understood.
Considering the current rate of wetland conversion for agricultural production and the diverse ecological, social, and production functions that wetlands fulfil, there is a need to provide guidelines for their future protection or use. Such decision support requires a systematic classification and characterisation of wetlands by identifying the extent and the drivers of wetlands and uses diversity, while providing a better understanding of the physical (e.g. landforms, climate, soils, and hydrology), biotic (e.g. vegetation), and socio-economic environments within which small wetlands occur.
In the context of wetland classification, both geographical and environmentally-based approaches have been explored (Omernik, 1987). A combination of both approaches has been used to classify inland valleys in West Africa (Windmeijer and Andriesse, 1993). Limited studies have also included socio-economic conditions in the classification of wetland production systems (Becker and Diallo, 1992) or of wetland types (Andriesse et al., 1994). There is limited prior research that explicitly considers both biophysical circumstances and varying socio-economic contexts in the development of wetland classification systems in land use studies.
The different biophysical circumstances under which small wetlands occur and varying socio-economic conditions of their surrounding environments determine the diversity of wetland use (types, intensity, and duration). This chapter presents the results of research conducted to understand wetland uses under varying socio-ecological conditions in rural areas. The objectives were to: (1) identify the diversity of wetlands and uses in contrasting landscape units in Central Kenya and Rift Valley in Kenya and Lushoto and Korogwe districts in northeastern Tanzania; (2) classify and characterise identified

Drivers of small wetlands and uses diversity
19
Cha
pter
2
wetlands; and (3) better understand their use under different biophysical conditions and varying socio-economic environments.
2. Materials and methods
2.1 The study area and sites selection
Major land units within which wetlands occur in East Africa comprise highlands and lowlands in the semi-arid, sub-humid, and humid zones and are found on diverse base rock materials. For the present study, the following landscape units and associated study sites were selected: (1) the humid highlands on volcanic material (e.g. Nyeri, Mount Kenya, Central Kenya); (2) the semi-arid highlands on granite (e.g. Laikipia plateau, Aberdares, Rift Valley, Kenya); (3) the humid midlands on gneiss (e.g. Lushoto, West Usambara mountains, Tanzania); and (4) the sub-humid lowlands on fluvial sediments (e.g. Korogwe, Pangani plain, Tanzania). These landscape units covered about 70% of the East African land area and are hence representative of the environmental and agroecological diversity of the region. In addition to the climate and the parent rock, sites differed in population density, market opportunity, and average farm size. Population densities are high and market opportunities are good at the two mountainous (Mount Kenya and Usambara Mountains) sites, consequently with land shortages (Tenge, 2005). In contrast, the two floodplain environments are located in less populated rural environments and hence farm sizes are large.
Agriculture is the main economic activity across sites. The dominant crops differed as a result of altitude and rainfall (Jaetzold and Schmidt, 1982; Pfeiffer, 1990). Thus, maize (Zea mays) and beans (Phaseolus vulgaris) dominate food crops grown in high-altitude wetlands, while rice (Oryza sativa) and cassava (Manihot esculenta) are specifically grown in the lowlands. Main cash or industrial crops cultivated on uplands adjacent to the wetlands comprise coffee (Coffea robusta) and tea (Camellia sinensis) in the high rainfall environments. Sisal (Agave sisalana) and cotton (Gossypium hirsutum) constitute major cash crops in the semi-arid and sub-humid zones. Livestock systems depend on land availability with zero-grazing dairy systems in densely populated Central Kenya (Pender et al., 2006) and the Usambara Mountains (e.g. Tenge, 2005) and free grazing in the Rift Valley and the Pangani plain (e.g. Kohler, 1987). Details on biophysical and socio-economic indicators and dominant agricultural activities for each site are presented in Table 1.

Chapter 2
20
Chapter 2
Study area Kenya Tanzania Mount Kenya: Central Kenya
Aberdares: Rift Valley
West Usambara:
Tanga
West Usambara:
Tanga
Location (district) Nyeri Laikipia West Lushoto Korogwe
Biophysical attributes
Geographical position • Latitude (WGS 84) 0˚53’26”N 0˚02’03”N 4˚10’20”S 5˚08’00”S • Longitude (WGS 84) 37˚24’30”E 36˚33’51”E 38˚05’02”E 38˚55’00”E • Altitude (m asl) 1570 - 2354 1780 - 2600 600 - 2300 300 - 1200
Rainfall
• annual (mm) 1400 - 2000 400 - 1000 600 - 2000 700 - 1100 • distribution Bimodal Unimodal Bimodal Bimodal
Dominant soil types
a
• Uplands
Nitisols, Andosols
Luvisols, Planasols
Nitisols Nitisols
• Wetlands Gleysols,
Histosols Fluvisols Gleysols Ferrasols
Landscape
Undulating, slopes up to 45%
Elevated plateau, gently undulating
Mountainous, slopes up to 80%
Flat to gently undulating
Wetland type Narrow inland valleys
Floodplains and inland valleys
Narrow inland valleys
Floodplains and inland valleys
Socio-economic attributes
Population density (persons km-2)
192 - 603 40 - 160 133 - 241 74 - 83
Farm size (ha) 0.5 - 4.0 0.4 - 41 0.4 - 3.2 0.5 - 2.0 Market accessibilityb High Low High High
Upland agricultural activities Major food crops
Maize, beans, sweet potato
Maize, beans, sweet potato
Maize, potato, beans
Maize, rice, cassava
Major cash crops
Coffee, pyrethrum, vegetable
Wheat, barley, vegetable
Coffee, tea, vegetable
Sisal, cotton, citrus
Livestock system
Zero grazing dairy production
Free grazing in ranches and in communal lands
Zero grazing dairy production
Free grazing in communal lands
Table 1: Main characteristics of the selected study sites in East Africa
Source: Sombroek et al. (1982); De Puaw, (1984); FAO, 1998. a FAO-UNESCO, 1997; b Based on access to market centers with population >= 50,000 (HarvestChoice. www.harvestchoice.org. 2008; market accessibility: High (0-2 hours); medium (2-4 hours); low (4-8 hours); remote (>8 hours).
Drivers of small wetlands and uses diversity
21
Cha
pter
2
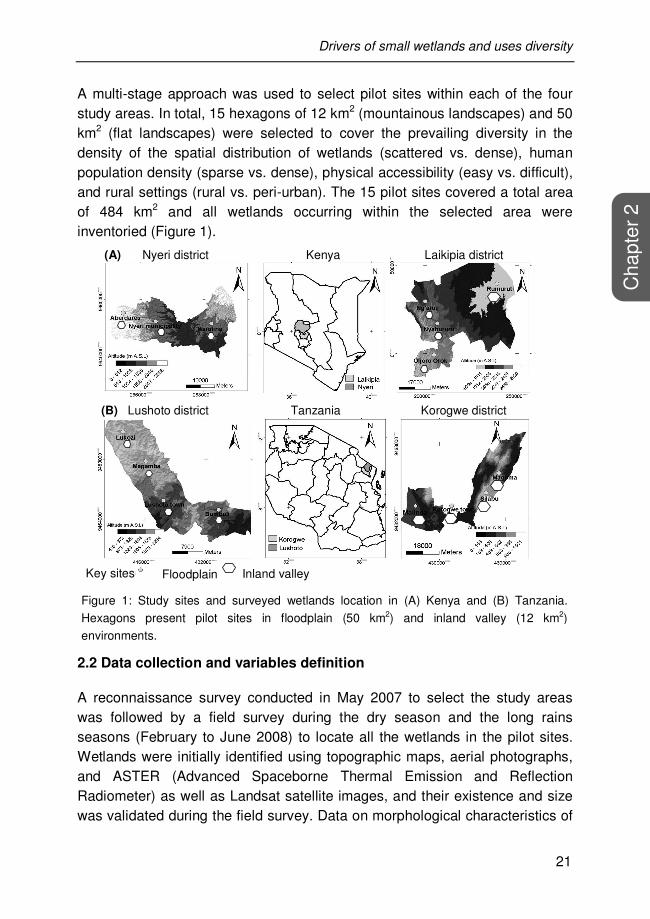
A multi-stage approach was used to select pilot sites within each of the four study areas. In total, 15 hexagons of 12 km2 (mountainous landscapes) and 50 km2 (flat landscapes) were selected to cover the prevailing diversity in the density of the spatial distribution of wetlands (scattered vs. dense), human population density (sparse vs. dense), physical accessibility (easy vs. difficult), and rural settings (rural vs. peri-urban). The 15 pilot sites covered a total area of 484 km2 and all wetlands occurring within the selected area were inventoried (Figure 1).
2.2 Data collection and variables definition
A reconnaissance survey conducted in May 2007 to select the study areas was followed by a field survey during the dry season and the long rains seasons (February to June 2008) to locate all the wetlands in the pilot sites. Wetlands were initially identified using topographic maps, aerial photographs, and ASTER (Advanced Spaceborne Thermal Emission and Reflection Radiometer) as well as Landsat satellite images, and their existence and size was validated during the field survey. Data on morphological characteristics of
Laikipia district Kenya Nyeri district (A)
(B) Tanzania Lushoto district Korogwe district
Key sites Floodplain Inland valley Key sites Floodplain Inland valley
Nyeri district Kenya Laikipia district (A)
Lushoto district Tanzania Korogwe district (B)
Figure 1: Study sites and surveyed wetlands location in (A) Kenya and (B) Tanzania.
Hexagons present pilot sites in floodplain (50 km2) and inland valley (12 km2)
environments.

Chapter 2
22
Chapter 2
these wetlands were obtained from the field survey and from digital elevation maps, following the approach by Windmeijer and Andriesse (1993). In total, 51 wetlands were identified and used for wetland characterisation. Identified wetlands, with size between 5 and 500 ha, were delineated and mapped using a global positioning system device and ARC-GIS. During the mapping, each wetland was divided into sub-units with a minimal size of 0.5 ha, based on the dominant land use that include unused, grazed, and cropped areas, totalling 157 sub-units identified in 51 wetlands.
The detailed data collection on soil, vegetation, and land use characteristics, as well as attributes of the land users and other socio-economic conditions were based on the 157 identified wetland sub-units. Composite soil samples were taken from eight points along a diagonal of each sub-unit to a depth of 20 cm. Soils were air-dried, ground and sieved (2 mm) prior to analysis. Soil samples were analysed for organic C, total N, available P, pH (H2O), and particle size distribution following standard methods (ICRAF, 1995) and near-infrared spectroscopy (Shepherd and Walsh, 2007).
The abundance, prevalence, and relative ground cover of dominant vegetation forms and plant species were determined following the approaches of Mack (2007). Within sub-units under cultivation, major crops and dominant associated weed species were recorded.
The type and history of wetland use, wetland hydrological behaviour, and the importance of the wetland to the local communities in relation to the surrounding environment were assessed by Rapid Rural Appraisal (RRA). The information was gathered from small groups of five to fifteen farmers for each wetland, totalling 51 RRA sessions during the survey. Information on the wetlands original vegetation, flooding regimes, history and duration of use, as well as land and crop management practices were obtained from key informants in each area. Thereafter, a sample of structured questionnaires was administered to village elders, areas chiefs, and to farmers and other wetland users. Secondary data on rainfall, temperature, major crops of the area, demography, and market opportunity were obtained from provincial administrations and other government / and or non-governmental institutions.
The physical and legal accessibility of wetland sub-units was defined based on land tenure / ownership and protection status of the wetlands, as well as the ease with which the sub-unit was physically accessible (duration and depth of

Drivers of small wetlands and uses diversity
23
Cha
pter
2
waterlogging, presence of fences, and prevalence of wildlife). The level of wetland disturbance (hemeroby) was assessed according to Pickett and White (1985), referring mainly to anthropologically-influenced factors such as the presence of drainage infrastructure, the extent of cropland, and absence of natural vegetation. It was estimated by comparing the sub-unit conditions to largely unused sections of the wetland and classified as low for unused and high for completely drained, cultivated or degraded / abandoned sub-units. An index of the flooding regime was developed using information collected from the key informants on flooding depth and frequency in combination with field observations. The land use intensity was classified using information from key informants and farmers on the duration of land use and the number of cropping seasons per year, in combination with production orientation (subsistence vs. cash), the number and type (manual vs. mechanical) of tillage operations, and the use of external inputs (fertilisers and pesticides). Finally, the market access was defined based on the physical market proximity and the available infrastructure (number and condition of roads).
Nominal versus ordinal level scale was employed for variable definition. Wetland type (2 categories), flooding regime (3 categories), and the dominant current land use of the wetland (6 categories), as well as that of the adjacent uplands (6 categories) were defined at nominal level. Variables on wetland accessibility, flooding regime, hemeroby, use intensity, and market accessibility were defined at an ordinal level along the variable gradient.
2.3 Data analysis
The 157 wetland sub-units were treated as independent sites for the statistical analyses. To ensure a relative independence, selected sub-units within the same wetland were at least 50 m apart and were in the case of cultivated sites isolated from the surrounding wetland area by canals, ditches or fences. Tests of significance were carried out using the SPSS-Inc. version 17.0. Bivariate analyses of the variables were carried using Chi-square and t-test. Significance of differences between wetland sub-units for numeric variables was determined using the non-parametric Kruskal-Wallis test. Nominal variables were simultaneously scaled and assessed for significant differences using categorical regression analysis (Meulman and Heiser, 2005). The comparison of wetland uses and sub-unit areas was done by univariate analysis of variance using the Tamhane test for post-hoc comparisons. Finally,

Chapter 2
24
Chapter 2
regression analysis was used to test for differences of the numeric and categorical variables between wetland sub-units.
Relationships between land use and socio-economic attributes as well as biophysical characteristics were analysed by multivariate techniques in three steps. First, cluster analysis was used to derive a typology of wetland sub-units based on independent variables. Second, this typology was related to the independent variable on current land use. Third, the dependent variable on current wetland land use was related to independent variables using non-parametric correlations. Based on a factor correlation matrix derived from the principal component analysis (Jongman et al., 1995), 14 independent variables related to wetland geomorphology, land use, and socio-economic attributes (excluding land use itself) were selected for further analyses (Table 2). Land use was linked to the extracted principal components using six categories of the dependent variable. Relationships between land use categories were determined by redundancy analysis (RDA) in combination with Monte Carlo permutation testing (Lepš and Šmilauer, 2003). Finally, data-sets on dependent and independent variables were subjected to Spearman non-parametric correlation analysis to explore the relationships between land use categories and, the biophysical and socio-economic drivers.
3. Results
3.1. Inventory and distribution of small wetlands
Fifty-one wetlands were inventoried, totalling 157 wetland sub-units across sites. The occurrence, density of distribution, as well as the type and size of the wetlands varied between sites. Inland valleys and floodplains were the main wetland types. Inland valley swamps dominated the humid midlands and highlands, whereas floodplains were the most common wetland types in the semi-arid and sub-humid zones. Inland valleys accounted for 87% of all surveyed wetlands, covering 58% (2115 ha) of the surveyed total wetland area. Wetland sub-unit size differed significantly (P < 0.001) between wetland types ranging, from 0.5 to 458 ha. Inland valley wetlands were narrow (≤ 35 ha), whereas floodplain wetlands were larger (10 and 458 ha).

Drivers of small wetlands and uses diversity
25
Cha
pter
2
Variable Scale type Scale class
Independent variables Geomorphology
Wetland type (morphological)a Nominal Inland valley, floodplain
Cross-sectional shapeb Nominal convex, concave, flat
Wetland size (ha) numeric -
Steepness of slope Ordinal None, gentle, steep Flooding regime Ordinal Sporadic, seasonal, permanent Soil organic C and total N (g kg-1), Available P (mg kg-1)
Numeric -
Land use factors and socio-economic attribute Wetland accessibilityc Ordinal Easy, medium, difficult
Drainage / irrigation infrastructure Binary No drainage, presence of canals
for drainage and / or irrigation
Mineral or organic input use Binary No fertiliser, mineral and / or organic fertiliser use
Land use intensity Ordinal Low, medium, high
Hemerobyd Ordinal Low, moderate, high disturbance
Land use of adjacent upland areas Nominal Unused, grazing, forest, food crops, high-value crops, settlements
Market opportunitye Ordinal Low, medium, high Dependent variable Wetland use type Nominal Unused, grazing, fallow, upland
food crops, high-value crops, settlements
Table 2: Definition and description of variables used in the development of clusters of
wetland sub-units cluster groups
a Wetland type adopted from Windmeijer and Andriesse (1993); b Shape follows the description by Raunet (1985); c Referring to difficulties in accessibility that are linked to waterlogging, vegetation, fences, and wildlife; d Hemeroby adapted from Pickett and White (1985) referring to the level of disturbance from the steady state through anthropogenic influences; e Estimated based on physical distance to the market, the type of roads (tarmac, passable in all weather, seasonally passable), and the availability of local marketing institutions.

Chapter 2
26
Chapter 2
The per cent area share of wetlands in the total land area per site was about 0.5% and was lower in the humid areas with high altitude than in the semi-arid and sub-humid environments (Table 3).
Variable Inland valley Floodplain F value Geomorphology / Hydrology Sample size 87%; n = 136 13%; n = 21
Altitude (masl) 1490 ± 58 887 ± 163 13.96***
Area size (ha) 17.0 ± 2 79.9 ± 23.2 37.12***
Wetland shape Concave (72) Flat (100) 0.142ns
Adjacent uplands slope
Gentle (44) None (100) 0.715ns
Main water source Runoff (37), spring (34), river (15) River (39), runoff (31) 0.522ns
Flooding regime Permanent (48) Sporadic (57), seasonal (24) 0.248ns
Vegetation / Soil
Dominant natural
vegetation
Cyperus spp. (57), Typha spp.
(10)
Cyperus spp. (71), C. papyrus
(24)
0.005ns
Soil type (FAO ) Gleysols, Histosols Fluvisols, Vertisols
Parent material Gneiss, granite and volcanic
material
Sediments, granite
Texture Sandy clay (57), Clayey loam
(24)
Clay (53), Loamy clay (47) 0.127ns
Organic C (g kg-1) 23.8 ± 0.12 15.4 ± 0.08 7.67**
Total N (g kg-1) 2.5 ± 0.02 1.4 ± 0.01 5.41***
Available P (mg kg-1) 10.1 ± 0.49 14.1 ± 1.02 2.22*
pH (H2O:1: 2.5) 6.0 ± 0.06 7.0 ± 0.1 33.04***
Table 3: Proportions and mean of biophysical characteristics per wetland type in the rapid
survey (sample size = 157) conducted in Kenya and Tanzania
* P ≤ 0.05, ** P ≤ 0.01, ***P ≤ 0.001, ns: not significant; Numbers in parentheses represent the percentage of the indicated attribute in the total sample; ± Standard error of the mean; m asl: meters above sea level.

Drivers of small wetlands and uses diversity
27
Cha
pter
2
3.2. Biophysical characteristics of wetlands
Differences in geomorphology between inland valleys and floodplains were reflected in a wide variability in the types and inherent properties of soils, hydrological regimes, and associated vegetation. Most inland valleys developed on gneiss and volcanic base rock, were characterised by permanent to seasonal flooding regimes with water from springs or (subsurface) inter-flow. Dominant soil types were sandy loam to clay loam Gleysols or Histosols. In contrast, floodplains that developed on fluvial sediments or granite were sporadically or seasonally flooded from overflowing rivers. Clay or loamy clay Fluvisols and Vertisols dominated soil types in floodplain wetlands. The topsoil of inland valleys had higher contents of organic carbon (23.8 g kg-1) and total nitrogen (2.5 g kg-1) and lower contents of available phosphorus (10 mg kg-1) than floodplain wetlands (average of 15.4 and 1.4 g kg-1 for C and N and 14 mg kg-1 for P) (Table 3).
More than 340 plant species were recorded at the study sites. Across wetland types, Cyperaceae and Typhaceae families dominated the natural vegetation. Cyperus papyrus was associated with less-disturbed and permanently flooded sections of oligotrophic floodplains, whereas Typha capensis dominated permanently flooded sections of eutrophic valley bottoms and floodplains. In seasonally flooded wetlands that were largely unused, common species included Paspalum vaginatum in inland valleys and Cyperus exaltatus in the floodplains. In grazed and fallow sections within seasonally flooded wetlands, Cyperus rotundus and Cynodon dactylon dominated the vegetation species. Leersia hexandra and Fimbristylis buchananii were found in extensively cultivated wetlands with seasonal flooding in both valley swamps and floodplains, whereas Chenopodium spp., Bidens pilosa, and Commelina
benghalensis were encountered in completely drained inland valleys under continuous crop production.
3.3. Socio-economic attributes
Next to agroecology, variability in market opportunities, population density, access to wetland area, and opportunities for rural livelihood diversification was observed within and between sites. The interaction of these factors influenced land use in the wetlands. Population density was high in humid midland and highland areas (133 - 603 persons km-2) and low in the semi-arid highlands and the sub-humid lowlands (40 - 160 persons km-2). Despite
Chapter 2
28
Chapter 2
differences in population density and market opportunities across sites, wetlands exhibited similar land use patterns. For instance, more than 80% of the unused wetland sub-units were located in areas with medium to high population densities. Location attributes that drive livelihood strategies showed variability between and within locations. These attributes comprised infrastructure (e.g. road conditions, electricity availability), physical accessibility (e.g. remoteness of the area, presence of fences, and depth of flooding) and services availability. Wetlands in urban and peri-urban settings (e.g. Nyeri-Municipality and Lushoto Township) had better infrastructure and better market access than the others in rural and remote areas (e.g. Rumuruti and Magoma). Most of the surveyed wetlands (64%; n = 100) were located in rural areas, with only one-third (n = 52) in peri-urban areas. Livelihood and location attributes influenced wetland use type and use intensity. More than 98% of the unused or extensively grazed wetland sub-units were located in rural settings while intensive high-value crop production was generally associated with medium livelihood level and market access. Market access alone did not explain wetland use as about 70% of extensively used wetland sub-units were found in good market locations. A low agricultural use of these wetlands was related to an unfavourable hydrology with prolonged and deep flooding.
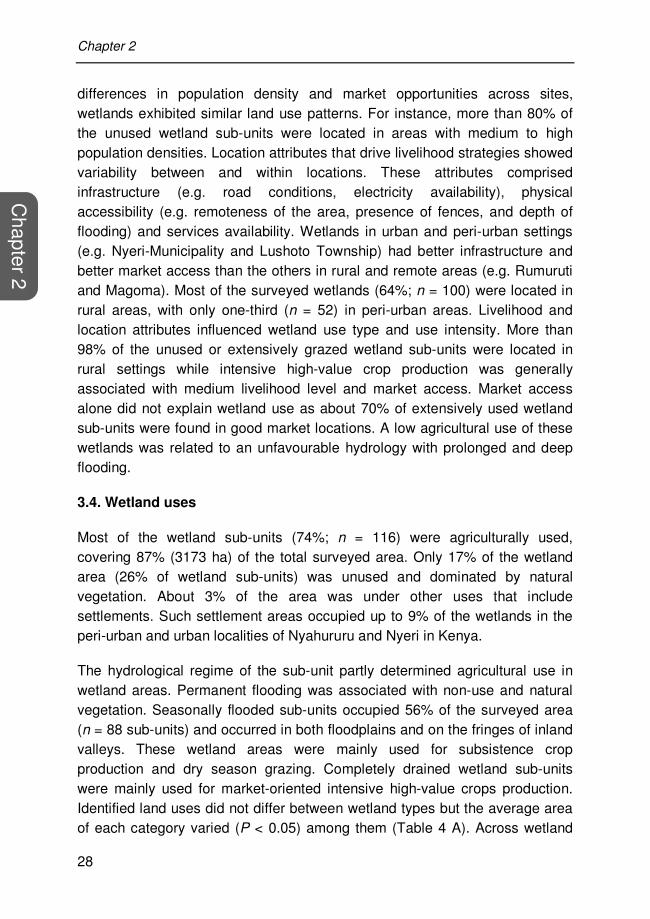
3.4. Wetland uses
Most of the wetland sub-units (74%; n = 116) were agriculturally used, covering 87% (3173 ha) of the total surveyed area. Only 17% of the wetland area (26% of wetland sub-units) was unused and dominated by natural vegetation. About 3% of the area was under other uses that include settlements. Such settlement areas occupied up to 9% of the wetlands in the peri-urban and urban localities of Nyahururu and Nyeri in Kenya.
The hydrological regime of the sub-unit partly determined agricultural use in wetland areas. Permanent flooding was associated with non-use and natural vegetation. Seasonally flooded sub-units occupied 56% of the surveyed area (n = 88 sub-units) and occurred in both floodplains and on the fringes of inland valleys. These wetland areas were mainly used for subsistence crop production and dry season grazing. Completely drained wetland sub-units were mainly used for market-oriented intensive high-value crops production. Identified land uses did not differ between wetland types but the average area of each category varied (P < 0.05) among them (Table 4 A). Across wetland
Drivers of small wetlands and uses diversity
29
Cha
pter
2
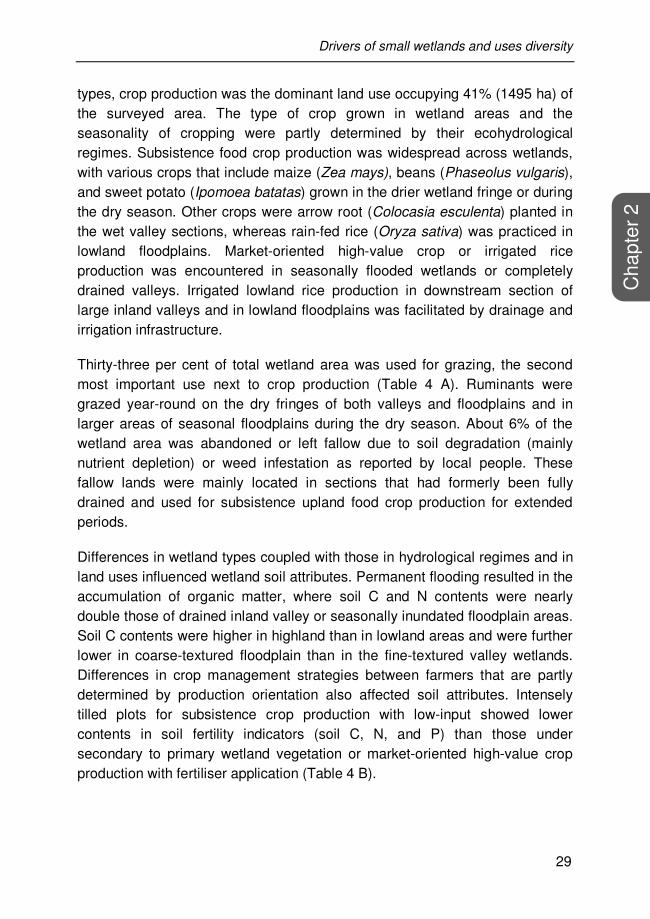
types, crop production was the dominant land use occupying 41% (1495 ha) of the surveyed area. The type of crop grown in wetland areas and the seasonality of cropping were partly determined by their ecohydrological regimes. Subsistence food crop production was widespread across wetlands, with various crops that include maize (Zea mays), beans (Phaseolus vulgaris), and sweet potato (Ipomoea batatas) grown in the drier wetland fringe or during the dry season. Other crops were arrow root (Colocasia esculenta) planted in the wet valley sections, whereas rain-fed rice (Oryza sativa) was practiced in lowland floodplains. Market-oriented high-value crop or irrigated rice production was encountered in seasonally flooded wetlands or completely drained valleys. Irrigated lowland rice production in downstream section of large inland valleys and in lowland floodplains was facilitated by drainage and irrigation infrastructure.
Thirty-three per cent of total wetland area was used for grazing, the second most important use next to crop production (Table 4 A). Ruminants were grazed year-round on the dry fringes of both valleys and floodplains and in larger areas of seasonal floodplains during the dry season. About 6% of the wetland area was abandoned or left fallow due to soil degradation (mainly nutrient depletion) or weed infestation as reported by local people. These fallow lands were mainly located in sections that had formerly been fully drained and used for subsistence upland food crop production for extended periods.
Differences in wetland types coupled with those in hydrological regimes and in land uses influenced wetland soil attributes. Permanent flooding resulted in the accumulation of organic matter, where soil C and N contents were nearly double those of drained inland valley or seasonally inundated floodplain areas. Soil C contents were higher in highland than in lowland areas and were further lower in coarse-textured floodplain than in the fine-textured valley wetlands. Differences in crop management strategies between farmers that are partly determined by production orientation also affected soil attributes. Intensely tilled plots for subsistence crop production with low-input showed lower contents in soil fertility indicators (soil C, N, and P) than those under secondary to primary wetland vegetation or market-oriented high-value crop production with fertiliser application (Table 4 B).

Chapter 2
30
Chapter 2
Wetland type Use type Distribution of uses Area (ha)
aArea share (%)
(n) (%)
Inland valley Unused 38 28 14 13.4 Grazing 29 21 20 14.5 Fallow 7 5 34 6.0 Upland food crops 33 24 13 10.6 Lowland rice 4 3 55 5.5 High-value crops 16 12 12 5.0 Other uses 9 7 14 3.1 SED (Use type) 2.0
Floodplain Unused 3 14 48 3.6 Grazing 6 29 125 18.8 Fallow 0 0 0 0.0 Upland food crops 6 29 49 7.3 Lowland rice 5 24 83 10.4 High-value crops 1 5 76 2.0 Other uses 0 0 0 0.0 SED (Use type) 23.2
Significance (P values) Use type (U) 0.031 Wetland Type (WT) <0.001 Interaction U x WT 0.054
Table 4: Main wetland use categories identified during the field survey in Kenya and
Tanzania: (A) distribution, area size and share per wetland type and; (B) effects of
hydrological regimes and land use on wetland soil characteristics (soil C, N, and P contents) (A)
a Calculated as the percentage of area size per land use type over the surveyed total area size; SED: Standard error of the differences; ns: not significant.
Flooding regime
Use type Sample size (n)
Soil C (g kg-1)
Soil N (g kg-1)
Soil P (mg kg-1)
Permanently flooded Unused 38 25.4 3.2 12.5 Cropped 13 16.2 1.4 10.3 SED (Use type) 1.81 0.34 0.67
Use type (P values) 0.020 0.012 ns Seasonally flooded Unused 3 14.0 1.2 12.6 Cropped 51 22.1 1.8 12.2 SED (Use type) 1.46 0.14 0.83
Use type (P values ) ns ns ns Significance (P values)
Flooding regime (FR)) ns ns ns Use type (U) ns ns ns Interaction FR x U 0.030 0.053 ns
(B)

Drivers of small wetlands and uses diversity
31
Cha
pter
2
3.5. Categorisation of wetlands
3.5.1 Variables selection
Based on geomorphological characteristics of wetlands and socio-economic attributes of their environments, identified wetland sub-units (n = 157) were categorised into homogeneous cluster groups. Main indicators were derived from the principal component analysis. The first four principal components (PCs) explained 69% of the biophysical and socio-economic variation within the dataset. PC1 was the most important component, explaining 33% of the variability, and loaded with geomorphological characteristics and market access. PC2 explained 17% of the variability and loaded to land use factors such as wetland use intensity, flooding regime, and land use of adjacent upland areas. The prevailing type of wetland use significantly (P < 0.001) positively correlated with wetland size (r = 0.36) and negatively with market accessibility (r = -0.23) and the steepness of upland slope (r = -0.35). The wetland use intensity correlated with the flooding regime (r = 0.51) and the physical accessibility of the wetland (r = 0.39), implying their importance as drivers of wetland cultivation.
3.5.2 Wetland typlogy
Five major wetland cluster groups were identified by hierarchical cluster analysis (Figure 2). These cluster groups comprised: (1) narrow permanently flooded inland valleys under secondary - to primary vegetation (16%; n = 25); (2) wide permanently flooded inland valleys and highland floodplains that are extensively used for grazing and subsistence food crop production (26%; n = 41); (3) large inland valleys and lowland floodplains with sporadic to seasonal flooding under medium land use intensity for subsistence food crops, lowland rice, and grazing (24%; n = 37); (4) wide completely drained valley bottoms and highland floodplains under intensive food crop production (17% n = 26), and (5) narrow inland valleys that are completely drained for continuous high-value crop production (18%; n = 28). The adequacy of the classification scheme was tested using discriminant analysis. Results confirmed 96% of the membership of the sub-units to previously derived wetland cluster groups. The percentages of their predicted group membership were 96, 95, 93, 96 and 100% for cluster groups 1, 2, 3, 4 and 5, respectively.

Chapter 2
32
Chapter 2
3.5.3 Characterisation of wetland cluster groups
Wetland cluster groups and their main distinctive characteristics are presented in Table 5. Cluster 1 consisted of narrow, permanently flooded inland valleys under secondary vegetation with limited access. These included small (average = 12 ha) convex valley heads and concave midstream sections in the humid highlands with gentle slopes. Small sections, mainly accessible fringes of some of these wetlands, had been encroached in the past for subsistence crop production and then abandoned for more than 10 years. These areas were covered by a regenerated vegetation, dominated by Typha capensis, Cyperus laevigatus and Polygonum spp.. Due to extended fallow periods and the permanent soil flooding regime, the fertility of the generally coarse-textured soils had time to regenerate, showing mean values of 36.9 g kg-1 of organic C,
Clu
ster
dis
tanc
e (%
dis
sim
ilarit
y)
0 10
20
30
40
1 2 3 4 5
Permanently flooded wetlands
Unused or extensively grazed
Seasonally flooded, drained wetlands
Moderate to intensive agricultural uses
1 2 3 4 5 Permanently flooded wetlands
Unused or extensively grazed
Seasonally flooded, drained wetlands
Moderate to intensive agricultural uses
Clu
ster
dis
tanc
e (%
dis
sim
ilarit
y)
0 10
20
30
40
Figure 2: Average linkage dendrogram using dissimilarity index for biophysical, socio-economic
and land use attributes data of small wetlands and their agricultural use typologies in the rapid
survey sample (n = 157). Wetland cluster groups: (1) narrow permanently flooded inland valleys
that are largely unused; (2) wide permanently flooded inland valleys and highlands floodplains
under extensive use; (3) large inland valleys and lowland floodplains with seasonal flooding under
medium use intensity; (4) completely drained wide inland valleys and highlands floodplains under
intensive food crop production; and (5) narrow drained inland valleys under permanent horticultural
production.

Drivers of small wetlands and uses diversity
33
Cha
pter
2
4.6 g kg-1 of total N, and 26 mg kg-1 of available P. These wetlands were mainly located in rural areas with low to moderate population density and poor market access. Most of the adjacent upland areas were covered by forest.
Cluster 2 grouped wide, permanently flooded inland valleys in the highlands (1800 - 2400 m) and seasonally flooded lowland floodplains (200 - 400 m). Wetland fringes were extensively used for grazing and for subsistence crops cultivation during the dry season. These wetlands had an average area of about 21 ha. Soil texture was mixed sandy clay to clay loam and the common soil types were Vertisols and Fluvisols in the lowland floodplain and Gleysols in the highland inland valley. The soil organic C content ranged between 8.0 to 69.6 g kg-1, whereas total N contents ranged from 0.9 to 10.9 g kg-1. The availability of soil P was moderate with an average of 15 mg kg-1. Inaccessible sections of these wetlands (22%) were permanently flooded and covered by Cyperus papyrus in oligotrophic and by Typha domingensis in eutrophic environments. Accesiblesections of their areas (46%) were extensively grazed or partially drained for subsistence crop cultivation. In these parts, the vegetation was dominated by Cyperus laevigatus, Leersia hexandra and Fimbristylis buchananii. These wetlands were mainly located in rural areas (83%) where the adjacent uplands were largely unused or extensively grazed by nomadic pastoralists, and in few cases, cultivated with upland food crops.
Cluster 3 comprised both large downstream sections of inland valleys in the semi-arid to humid highland as well as large floodplains in the lowland areas. With flat landscape, wetlands were dominated by heavy clay Dystric Fluvisols and Vertisols. Most parts of these wetlands were seasonally flooded (92%), generally by overflowing of a river or the stream during the rainy season or by surface run-off from adjacent uplands. Average area size was the largest (56 ha) of that of the five WCGs. The anthropogenic use pressure was relatively low, with subsistence food crops cultivated on the wetland fringes during the dry season and rain-fed lowland rice towards the wetland centre during the long rains season. Mean soil C and N contents were low with 17.3 g C kg-1 and 1.6 g N kg-1,whereas soil P content was relatively high (averaged at 16 mg kg-
1). Associated vegetation species varied with the uses. Polygonum spp., Pennisetum mezianum, Cyperus exaltatus, and Sporobolus pyramidalis dominated the largely unused sections and rain-fed rice fields, whereas Cyperus rotundus and Cynodon dactylon were encountered in the fringes with upland food crop fields.

Chapter 2
34
Chapter 2
Wet
land
type
In
land
val
leys
and
hi
ghla
nd fl
oodp
lain
s
Nar
row
val
leys
in m
id-
hills
and
hig
hlan
ds
Inla
nd v
alle
ys a
nd
low
land
floo
dpla
ins
Inla
nd v
alle
ys a
nd
flood
plai
ns
Nar
row
val
leys
in m
id-
hills
and
hig
hlan
ds
Use
inte
nsity
E
xten
sive
E
xten
sive
M
ediu
m
Inte
nsiv
e In
tens
ive
a Clu
ster
gro
up
1
2
3
4
5
Sam
ple
size
(n)
25
41
26
37
28
S
ites
in K
enya
N
yeri
Nya
huru
ru, R
umur
uti
Nya
huru
ru
Kar
atin
a, R
umur
uti
Kar
atin
a, N
yeri
Site
s in
Tan
zani
a A
reas
Lush
oto,
Mag
amba
C
entr
al K
enya
, U
sam
bara
Mou
ntai
ns
Mag
oma,
Mal
inda
R
ift V
alle
y,
Usa
mba
ra M
ount
ains
Mal
inda
, Sila
bu
Pan
gani
bas
sin,
R
ift V
alle
y
Kor
ogw
e to
wns
hip
Cen
tral
Ken
ya, R
ift
Val
ley,
Pan
gani
ba
ssin
Bum
buli,
Luk
ozi
Cen
tral
Ken
ya,
Usa
mba
ra M
ount
ains
Geom
orp
ho
logy / H
ydro
log
y
Mor
phol
ogy
Con
vex
valle
y he
ads
with
gen
tle s
lope
s C
onca
ve v
alle
ys a
nd
flood
plai
ns
Fla
t dow
nstr
eam
va
lley
sect
ions
C
onca
ve h
ighl
and
valle
ys a
nd p
lain
s C
onca
ve v
alle
ys w
ith
gent
le s
lope
s W
etla
nd s
ize
(ha)
20
.7 ±
4.8
12
.4 ±
2.4
56
± 1
1.5
25.8
± 1
2.4
15.1
± 3
.5
Hyd
rolo
gica
l reg
ime
P
erm
anen
t
Per
man
ent
S
pora
dic
to s
easo
nal
S
easo
nal
N
o flo
odin
g S
ourc
e of
wat
er
Spr
ing
Run
-off
and
river
ov
erflo
w
Run
-off
and
river
ov
erflo
w
Run
-off
and
river
ov
erflo
w
Spr
ings
and
run
-off
Soils
/ V
eg
eta
tion
S
oil t
ype
(FA
O)
Gle
ysol
s G
leys
ols
and
Luvi
sols
F
luvi
sols
and
V
ertis
ols
Gle
ysol
s an
d Lu
viso
ls
Flu
viso
ls
pH
(H
2O: 1
:2.5
) 5
.6 ±
0.2
6
.2 ±
0.1
6
.6 ±
0.2
6
.1 ±
0.1
6
.1 ±
0.1
S
oil o
rgan
ic C
(g
kg-1
) 36
.7 ±
0.3
19
.2 ±
0.2
17
.3 ±
0.2
17
.1 ±
0.1
26
.4 ±
0.2
S
oil t
otal
N
(g
kg-1
) 4
.6 ±
0.0
6 2
.6 ±
0.0
3 1
.6 ±
0.0
1 1
.6 ±
0.0
1 1
.9 ±
0.0
2 A
vaila
ble
P
(mg
kg-1
) 11
±
0.9
14
±
0.8
16
±
1.0
11
±
1.0
10
±
0.8
Tab
le 5
: E
colo
gica
l ch
arac
teris
tics
and
soci
o -ec
onom
ic a
ttrib
utes
of
wet
land
sub
-uni
ts c
lust
er g
roup
s id
entif
ied
in t
he s
tudy
area
s in
Eas
t Afr
ica
(Ken
ya a
nd T
anza
n ia)

Drivers of small wetlands and uses diversity
35
Cha
pter
2
Ext
ensi
on o
f Tab
le 5
Dom
inan
t veg
etat
ion
Cyp
era
ceae
, T
yph
aceae, a
nd
Poly
gon
um
spp
.
Cype
raceae, L
eers
ia
hexandra
, and
F
imbristy
lis b
uchana
nii
Poly
gon
um
spp
., C
ynodon
dacty
lon,
Pen
nis
etu
m
mezia
num
and
S
poro
bolu
s
pyra
mid
alis
Paspa
lum
vag
inatu
m,
Bid
ens p
ilosa, L
eers
ia
hexandra
, and
Ip
om
oea a
qua
tica)
Galin
soga p
arv
iflo
ra,
Ch
enopo
diu
m s
pp.,
Co
mm
elin
a
beng
hale
nsis
, C
yperu
s r
otu
ndus,
and
Bid
ens p
ilosa
Socio
-econo
mic
attrib
ute
s a
nd lan
d u
ses
Dra
inag
e pa
ttern
s N
one
N
one,
par
tial
N
one,
par
tial
P
artia
l, co
mpl
ete
C
ompl
etel
y
Loca
tion
char
acte
ristic
s M
oder
ate
acce
ssib
ility
R
ural
, per
i-urb
an a
reas
Poo
r ac
cess
ibili
ty
Rem
ote
rura
l are
as
Eas
y ac
cess
R
ural
are
as
Eas
y ac
cess
, R
ural
are
as
Eas
y ac
cess
P
eri-u
rban
are
as
W
etla
nd u
se
Larg
ely
unus
ed o
r ex
tens
ivel
y gr
azed
Larg
ely
unus
ed o
r ex
tens
ivel
y gr
azed
Low
-inpu
t ric
e,
graz
ing
and
fallo
w
Foo
d cr
ops,
inpu
ts
Mar
ket-
orie
nted
hig
h-va
lue
crop
s, h
igh
inpu
t use
U
plan
ds u
se
Agr
ofor
estr
y U
nuse
d un
der
natu
ral
vege
tatio
n, g
razi
ng
Foo
d cr
ops,
gra
zing
F
ood
and
cash
cro
ps,
garz
ing
Foo
d an
d ca
sh c
rops
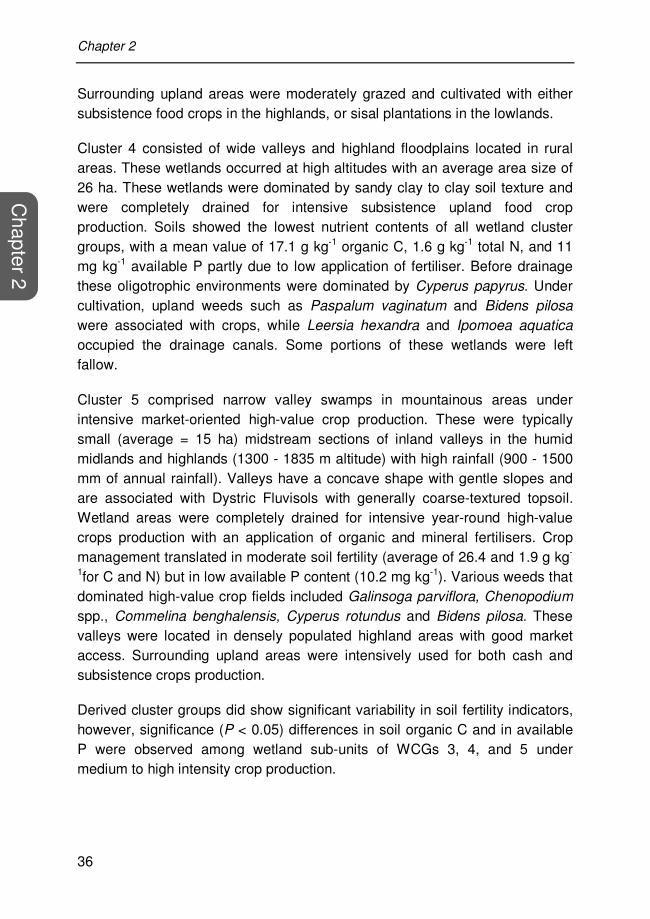
Chapter 2
36
Chapter 2
Surrounding upland areas were moderately grazed and cultivated with either subsistence food crops in the highlands, or sisal plantations in the lowlands.
Cluster 4 consisted of wide valleys and highland floodplains located in rural areas. These wetlands occurred at high altitudes with an average area size of 26 ha. These wetlands were dominated by sandy clay to clay soil texture and were completely drained for intensive subsistence upland food crop production. Soils showed the lowest nutrient contents of all wetland cluster groups, with a mean value of 17.1 g kg-1 organic C, 1.6 g kg-1 total N, and 11 mg kg-1 available P partly due to low application of fertiliser. Before drainage these oligotrophic environments were dominated by Cyperus papyrus. Under cultivation, upland weeds such as Paspalum vaginatum and Bidens pilosa were associated with crops, while Leersia hexandra and Ipomoea aquatica
occupied the drainage canals. Some portions of these wetlands were left fallow.
Cluster 5 comprised narrow valley swamps in mountainous areas under intensive market-oriented high-value crop production. These were typically small (average = 15 ha) midstream sections of inland valleys in the humid midlands and highlands (1300 - 1835 m altitude) with high rainfall (900 - 1500 mm of annual rainfall). Valleys have a concave shape with gentle slopes and are associated with Dystric Fluvisols with generally coarse-textured topsoil. Wetland areas were completely drained for intensive year-round high-value crops production with an application of organic and mineral fertilisers. Crop management translated in moderate soil fertility (average of 26.4 and 1.9 g kg-
1for C and N) but in low available P content (10.2 mg kg-1). Various weeds that dominated high-value crop fields included Galinsoga parviflora, Chenopodium spp., Commelina benghalensis, Cyperus rotundus and Bidens pilosa. These valleys were located in densely populated highland areas with good market access. Surrounding upland areas were intensively used for both cash and subsistence crops production.
Derived cluster groups did show significant variability in soil fertility indicators, however, significance (P < 0.05) differences in soil organic C and in available P were observed among wetland sub-units of WCGs 3, 4, and 5 under medium to high intensity crop production.
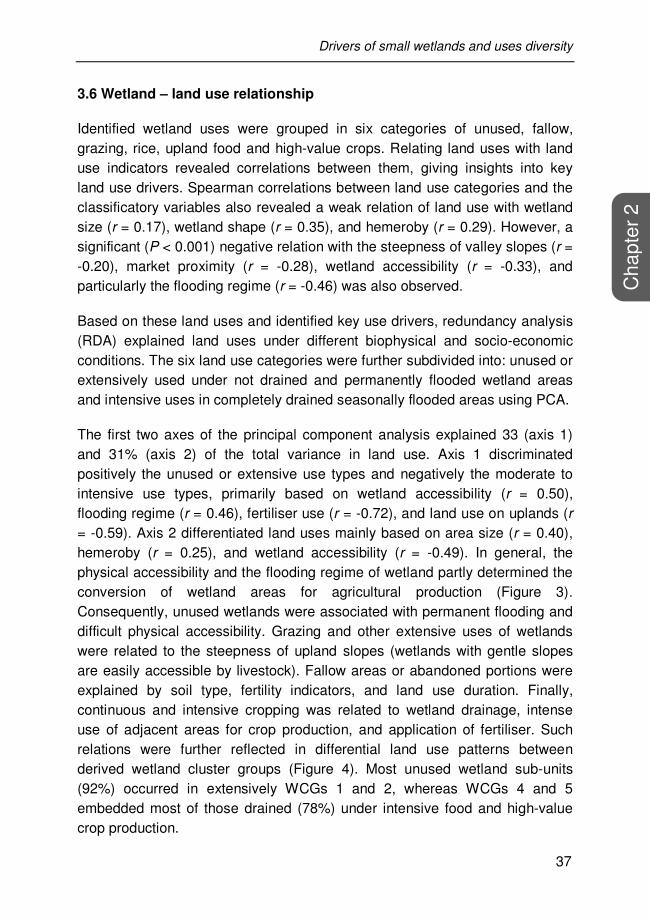
Drivers of small wetlands and uses diversity
37
Cha
pter
2
3.6 Wetland – land use relationship
Identified wetland uses were grouped in six categories of unused, fallow, grazing, rice, upland food and high-value crops. Relating land uses with land use indicators revealed correlations between them, giving insights into key land use drivers. Spearman correlations between land use categories and the classificatory variables also revealed a weak relation of land use with wetland size (r = 0.17), wetland shape (r = 0.35), and hemeroby (r = 0.29). However, a significant (P < 0.001) negative relation with the steepness of valley slopes (r = -0.20), market proximity (r = -0.28), wetland accessibility (r = -0.33), and particularly the flooding regime (r = -0.46) was also observed.
Based on these land uses and identified key use drivers, redundancy analysis (RDA) explained land uses under different biophysical and socio-economic conditions. The six land use categories were further subdivided into: unused or extensively used under not drained and permanently flooded wetland areas and intensive uses in completely drained seasonally flooded areas using PCA.
The first two axes of the principal component analysis explained 33 (axis 1) and 31% (axis 2) of the total variance in land use. Axis 1 discriminated positively the unused or extensive use types and negatively the moderate to intensive use types, primarily based on wetland accessibility (r = 0.50), flooding regime (r = 0.46), fertiliser use (r = -0.72), and land use on uplands (r = -0.59). Axis 2 differentiated land uses mainly based on area size (r = 0.40), hemeroby (r = 0.25), and wetland accessibility (r = -0.49). In general, the physical accessibility and the flooding regime of wetland partly determined the conversion of wetland areas for agricultural production (Figure 3). Consequently, unused wetlands were associated with permanent flooding and difficult physical accessibility. Grazing and other extensive uses of wetlands were related to the steepness of upland slopes (wetlands with gentle slopes are easily accessible by livestock). Fallow areas or abandoned portions were explained by soil type, fertility indicators, and land use duration. Finally, continuous and intensive cropping was related to wetland drainage, intense use of adjacent areas for crop production, and application of fertiliser. Such relations were further reflected in differential land use patterns between derived wetland cluster groups (Figure 4). Most unused wetland sub-units (92%) occurred in extensively WCGs 1 and 2, whereas WCGs 4 and 5 embedded most of those drained (78%) under intensive food and high-value crop production.

Chapter 2
38
Chapter 2
-1.0 1.0
-1.0
1.0
Unused
High-value cropsSubsistence crops
Grazing
RiceFallow
Wetland type
SizeShape
Upland slope
Flooding regime
Soil N
Soil P
Wetland accessibility
Disturbance level
Drainage patterns
Fertiliser application
Use intensity
Uplands use
Market access
Axis 1
Axis 2
Figure 3: Redundancy analysis ordination diagrams of the major land use categories with the independent variables for small wetlands characteristics. Land use categories are
represented by bold solid arrows and the explanatory variables are in dashed arrows.
Figure 4: Percentage of wetlands allocation to defined land uses per wetland typology in the study area. Colour and pattern gradients denote the intensity of land use intensity from
unused (plain white) to intensive use (plain black).
1 2 3 4 5
Wetland cluster group
High-value crops Subsistence crops Other usesRice Fallow Grazing
100
80
60
40
20
0
Wet
land
sub
-uni
ts n
umbe
r (%
)

Drivers of small wetlands and uses diversity
39
Cha
pter
2
4. Discussion
The typology developed in this study combined rapid rural and participative approaches, wetland mapping, and multivariate analysis techniques to unravel the complexity in heterogeneous small wetland systems for better understanding of their agricultural use. The use of different approaches for data collection and analyses was important to relate the wetland systems to their use by the local people who live in these rural areas. The combination of social and environmental approaches for collecting data contributed to improve the understanding of wetland functioning critical for future management initiatives. For example, the use of the Rapid Rural Appraisal (RRA) approach, which emerged in the late 1970s in social sciences, helped to quickly collect, analyse, and evaluate information of the rural conditions of the study area (cf. data collection section in materials and methods). The approach was efficient in collecting relevant information on the wetland uses at the different study sites (51 RRA sessions) within the short time period of the survey. This confirms the primary objective of the RRA development as a way to reduce the cost and the time consuming factors of other research procedures (Cernea, 1991). Furthermore, the local knowledge of wetland communities on the flooding behaviour of the wetland and changes in land use over time and space highly contributed to defining land use determinants.
The development of wetland typology is a step forward to identify key drivers of diversity of wetlands and uses and to understand the small wetland systems under different biophysical conditions and varying socio-economic environments. By combining environmental and socio-economic indicators of land use in the analysis, the typology allowed linking identified drivers, creating socio-ecological niches for specific wetland uses in the study area. The typology used various dimensions in geomorphology, agroecology, population density, markets, and management strategies to explain differences in land uses across sites. Agroecology, markets, and population density partly explain the diversity of rural livelihood strategies across and within locations in SSA, besides determining different land use patterns across areas. Furthermore, diversity of livelihood strategies represent to a large extent production orientation and objectives of rural farming households. The interaction of these factors influences farmers’ actions, land use decisions, and management options (Kobrich et al., 2003; Siebert et al., 2006; Tittonell et al., 2010; Giller et al., 2011). The variability in socio-economic attributes coupled with the biophysical differences leads to different intensities of land use and associated

Chapter 2
40
Chapter 2
management practices. Different practices can in turn affect the hydrology of the wetland (i.e. drainage or irrigation infrastructure - IVC / WARDA, 1997) and soil characteristics (i.e. soil improvement by farmers’ investment in organic amendments or soil nutrient depletion (Roberts, 1988; Dixon and Wood, 2003). The wetland typology thus shows the scope for linking the heterogeneous wetland systems to land users (i.e. farmers) in order to explain the diversity observed in small wetland systems.
4.1. Diversity of wetland uses and use drivers
Different wetland uses by local people were identified in contrasting rural areas. Such differences may reflect the heterogeneous ecological units that can be encompassed by distinct geomorphological units of a given wetland (Roggeri, 1995, Schuyt, 2005). The interaction between geomorphology and agroecological potential may further determine the suitability of these areas for specific uses such as rain-fed rice cultivation in lowland floodplains in sub-humid areas (cf. Figure 5). These geomorphological and agroecological indicators constitute the biophysical drivers of wetland agricultural uses that have been assessed in wetland studies in SSA (e.g. Jogo and Hassan, 2010). Relating wetland uses to its environment suggest that wetland uses are largely determined by the ecohydrological conditions of their areas. This was illustrated by the relation between the two land use categories with the hydrological regime and access to the wetland area (cf. Figure 4). These findings confirm the key role the ecohydrological conditions of wetland areas plays in their cultivation (e.g. Woodhouse et al., 2000). Traditional uses for small-scale subsistence food crops (i.e. maize, beans, and sweet potato) and /or seasonal grazing are common in seasonally flooded wetlands or accessible fringes of their permanently flooded areas. In contrast, root crops such as arrow root are commonly planted in the wetter parts of valleys. Traditional uses identified are consistent with those reported in similar wetlands in Ethiopia (Wood, 1996). In most cases, wetland cultivation intensifies with multiple cropping of rice, upland food and / high-value crops after the regulation of water level in wetland areas. Depending on the wetland type and the subsequent hydrological regime, two main infrastructure measures that involve drainage (small vs. large scale) and the provision of irrigation can be used to purposely regulate water in wetland areas. Small wetlands such as those under study can be easily drained by local communities (Wood and Dixon, 2002), whereas lowland development for irrigated rice production often requires external aid for the establishment of an

Drivers of small wetlands and uses diversity
41
Cha
pter
2
irrigation scheme (e.g. Ereinstein, 2006). The influence of the identified key drivers on the kind, diversity, and intensity of land use between wetland types are reported in prior wetland research in SSA (Adams, 1993; Wood, 1996; Rebelo et al., 2010).
Besides the biophysical drivers, differences in land use patterns may also reflect the heterogeneous rural (i.e. peri-urban vs. remote) areas where most wetland users operate. For example, the development of co-operative societies in the marketing of horticultural crops in Lushoto offers opportunities for high-value crop production in the valleys (e.g. WGC 5), while subsistence farming and grazing are likely to be the major uses in the remote rural areas of Rumuruti, Magoma, and Malinda (e.g. WCGs 2 and 3). Next to market opportunity, population density and the subsequent land shortages contribute to shaping land uses in the wetlands. Population growth in East African humid midlands and highlands has often led to land shortages in these areas (Salasya, 2005; Pender et al., 2006) and hence has increased the need for agricultural production land. This has resulted in the expansion of cropland to wetland areas where these are accessible. Land shortages of arable land coupled with good market opportunity can explain the intensive and continuous high-value crop production in wetlands (e.g. WCG 5) in humid midland and highland zones. Intensive high-value crop production in valleys can be viewed as mechanism to boost household income and hence to maximise returns from limited land. Good market opportunity creates an outlet for farm outputs (i.e. high-value crops) and for farm inputs (i.e. fertilisers and pesticides) that often characterise intensive agricultural production. Still in densely populated but peri-urban areas, wetlands can be drained to achieve other objectives than the common agricultural uses. Such non-agricultural uses include settlements like those observed in Nyahururu and Nyeri towns in Kenya. Market opportunity and rural population density are frequently related to each other and their importance as wetland use drivers have been highlighted in prior wetland studies in the region (Drechsel et al., 2001; Balasubramanian et al., 2007). Thus the socio-economic drivers such as land shortages, population density, and market opportunity coupled with the biophysical drivers partly explain agricultural use and use intensity of small wetlands.
However, differences in land uses and intensities were observed between sites with high population densities. This is the case of arrow root crop planted in partially drained valleys in highland humid areas in Nyeri and market-

Chapter 2
42
Chapter 2
oriented and continuous high-value crops grown in completely drained valleys in midland humid areas in Lushoto. Thus, the drivers identified in the current study do not fully explain the diversity of land uses in studied wetlands. Such factors fall into the category of the common drivers of land use changes that have been highlighted by Lambin et al. (2001) in land use changes studies. There is a need to examine the drivers of small wetland agricultural in the light of the factors that influence land use decisions of rural smallholder farmers to unravel further the complexity in various wetland systems for better understanding of small wetland agricultural systems in different rural areas. Rural population growth and the subsequent increasing land shortages, as well as improved market access are likely to exacerbate pressure on wetlands through cropland expansion and/or land use intensification in midland and highland humid areas.
An additional factor of intensive but low-input use of wetlands is linked to agro-climatic conditions of the rural areas. In semi-arid areas such as the semi-arid highlands, with prolonged drought seasons wetland agricultural use can intensify even in remote areas. Such land use trends are likely to exacerbate under increasing future climatic variability in semi-arid areas (Smith et al., 2001).
Wetlands and/or sub-units that are covered by secondary and primary vegetation (i.e. WCG 1) have in common a difficult access to their area probably due to the waterlogging conditions of their soils. Such wetland areas can assume significance as biodiversity conservation and ecological regulatory functions resources.
The study shows that wetlands are biophysically complex and heterogeneous and their agricultural uses depend on farmers who can decide to extend, intensify, and/or diversify land uses in wetland areas. Thus, wetland agricultural use is likely a reflection of the interactions between the biophysical conditions of the wetland areas, socio-economic circumstances of their environments, and factors related to farmers’ characteristics.
Differences in soil fertility indicators between wetland sub-units that are moderately to intensively cultivated with rain-fed rice, upland food and / or high-value crops (i.e. WCGs 3 - 5) may indicate a difference in the ability to sustain intensive crop production. Such variability in soils may have resulted from natural processes (Brady and Weil, 2002) and reinforced by differences

Drivers of small wetlands and uses diversity
43
Cha
pter
2
in management practices (non- vs. use of fertiliser). Such differences were shown by the variability observed between intensive cultivated systems (i.e. WCGs 4 and 5) with application of organic and /or inorganic fertiliser and the traditional rain-fed rice systems (WCG 3) without fertiliser. Despite the general coarse-textured soils with low nutrient reserves, wetlands of cluster group 5 appear to better sustain crop production than the other wetlands. The situation is different for wetlands of cluster group 4 where the low farm input in intensive crop production coupled with the low nutrient reserves (coarse-textured-soil) can result in negative effects on soil properties. This may lead to nutrient loss undermining long-term crop production in these systems. This broadly shows different trends in wetland suitability for agricultural production under current uses and practices.
Permanent soil flooding can relieve agricultural use pressure on wetlands and contributes to wetland conservation. Complete drainage and intensive cultivation in most instances result in low contents of soil fertility indicators. But the vulnerability of wetlands to cultivation appears to be linked to soil fertility and to crop management. Low-input crop production can only be sustained at a reasonable level on deep clay soils, whereas coarse-textured poorer soils under intensive production require intensive use of farm inputs and consequently the proximity to a market. Remediation of adverse effects of drainage and integrated nutrient application are needed to replenish nutrient losses and sustain crop production in wetland agricultural systems.
4.2. Wetland categorisation
Based on wetland type, shape, size, hydrological regime, soil fertility indicators, drainage patterns, use intensity, fertiliser, and market opportunity, wetland sub-units were categorised into five wetland cluster groups. The biophysical and socio-economic attributes used for the categorisation are reflected in different proportions of wetland uses across cluster groups. Thus the typology helps to identify both biophysical and economic conditions that are associated with identified current wetland uses. The interactions between agroecological, biophysical, socio-economic and the identified used can be used to define potential hotspots of biodiversity (e.g. unused wetland sub-units under primary and secondary vegetation and waterlogged conditions thus with difficult access; WCG 1) as well as significant agricultural resources for food production (i.e. wetlands with fertile clay soils and seasonal floods). The typology distinguished wetland sub-units under food crop production that

Chapter 2
44
Chapter 2
differed in management-induced soil variability and in soil carbon per use intensity. However, the definition of these systems remains biased as the current study does not explicitly consider factors related to land users (i.e. rural farming households) in the diversity of wetland uses. These findings can guide policy decisions while providing guidelines for wetland protection or agricultural use in rural areas.
In considering both social and biophysical attributes, the proposed typology provides not just a classification of environments but also considers land uses and production potential of wetland areas under different agroecological and socio-economic environments as well as varying managerial circumstances in rural areas. The typology linked biophysical and socio-economic factors to define specific conditions for wetland uses, partly unravelling the complexity and heterogeneity in the small wetland systems. The typology thus contributes to the definition of social-ecological niche of current and future land use (Gunderson et al., 2006). Each category combines the biophysical conditions and the socio-economic circumstances where small wetlands occur, providing a more comprehensive socio-ecological classification of wetlands than those in prior wetland research in SSA. Various schemes that have been developed for wetland classification in SSA include: those based mainly on land use factors (Andriesse and Fresco, 1991), those focusing on crop management practices in rice (Becker and Diallo, 1992), or on ecosystem classification (Andriesse et al., 1994) and those providing a hydro-geomorphological classification (Windmeijer and Andriesse, 1993). The proposed typology will be used to guide the selection of representative wetlands for multi-disciplinary in-depth studies and to define socio-ecological niches for specific wetland uses.
5. Conclusions
The identified wetland types differed in social-ecological attributes and hence in their use contexts. Wetland type and hydrological regime were associated with specific vegetation forms and soil attributes. Their agricultural use depends on the ecohydrological regime and accessibility, besides the population growth, market opportunity, and shortage of arable land. The analyses presented in this study can provide the framework for a comprehensive assessment of wetland diversity and a tool for the targeting of technology interventions. While the findings are based on only four areas in East Africa, the study sites are representative of the major biophysical and socio-economic attributes of the region. In addition identified current wetland

Drivers of small wetlands and uses diversity
45
Cha
pter
2
uses have also been reported from West Africa (Becker and Diallo, 1992), southern Africa (Gopal, 2001) and parts of Central Africa (Hughes and Hughes, 1992). The proposed characterisation and typology of small wetlands can be applicable to a wider range of environments and be extrapolated and scaled up to other areas within sub-Saharan Africa. The wetland typology showed the scope for linking heterogeneous wetland systems to land users (i.e.), which can be used to identify drivers of land uses that are related to farmer’s decisions and to explain better the diversity of land uses.


Chapter 3
Typology of agrowetland smallholder production systems of East Africa
This article will be submitted as:
N. Sakané, M. Becker, M. Langensiepen, M.T. van Wijk, 2011. Typology of agrowetland smallholder production systems in Kenya and Tanzania. Human Ecology

Chapter 3
48
Chapter 3
Abstract
Small wetlands increasingly become important agricultural production niches for rural households in sub-Saharan Africa (SSA) due to environmental, socio-economic, and political change as well as livelihood dynamics across SSA region. Small wetlands have thus assumed a new significance as agricultural resources where their various uses bring another dimension of diversity to rural livelihood systems. Understanding the diversity of livelihood strategies of wetland-dependent households may help to develop guidelines for their future protection or sustainable use. In this chapter, household diversity resulting from differences in agricultural production strategies, livelihood contribution, and access to wetlands were characterised using case studies from Kenya and Tanzania. A combined data driven and expert-knowledge method was applied to categorise 275 farms randomly selected in four study sites. Based on a combination of production systems (livestock ownership, type, and its integration with crops), land resource (upland, wetland, and their combination), and production objectives (subsistence, cash, and cultural), households were categorised into 12 Farm Types: 1 and 2. Wetland mixed- and wetland cash-upland-subsistence-based crop farms; 3, 4, 5, and 6. Wetland-cash, wetland-cash and upland-subsistence, wetland-mixed and upland-cash, and wetland-water withdrawal and upland-horticultural crop-dairy-based farms; 7, 8, 9, and 10. Wetland-subsistence, wetland-semi-market and upland-subsistence, wetland-cash, and wetland-upland-mixed crop-non-dairy-based farms; 11. Wetland-subsistence crop-wetland-upland cultural oriented livestock-based farms; and 12. Wetland-upland cultural oriented livestock-based farms. Differences in production resources, access to cropland on uplands, access to markets, and non-wetland related livelihood strategies among farm types translated in differential land use patterns in wetlands These farm types differed in livestock, land, land, and financial resources as well as access to cropland on uplands, access to markets, and potential livelihood diversification, which affect land use and production objectives in wetlands. Smallholder agrowetland households were highly diverse, heterogeneous, and dynamic, operating in complex socio-ecological environments. Farm types were further linked to the wetland environment (through wetland cluster groups), relating the land user to the prevailing heterogeneous small wetland systems (diverse land uses driven by different biophysical and varying socio-economic conditions). Relating wetland and household typologies showed that wetland-agricultural systems are complex and characterised by interactions between heterogeneous human decision-makers (i.e. the farmers) and their biophysical environment (i.e. the wetlands units). Furthermore, household typologies captured various dimensions in values, attitudes, and goals of farmers, besides defining their preferences that influence their actions and land use decisions. Such associations can be used to analyse and explore changes and dynamics in land use decisions by smallholder farmers.
Keywords: Farm categorisation; Floodplain; Inland valley; Kenya; Livelihood diversity; Rural households; Uplands, Tanzania.
Drivers of farm heterogeneity operating in wetland systems
49
Cha
pter
3
1. Introduction
In sub-Saharan Africa, food production has not kept pace with population growth (Breman and Debrah, 2003). Food production does not defy the Malthusian theory in SSA where per capita food production has declined (Boserup, 1965) due to decrease in per capita land productivity. Efforts to maintain productivity and hence to meet food requirement are constrained by several challenges that include population growth and increasing shortages of arable land (Cleaver and Schreiber, 1994) and degradation of arable land due to restricted technological innovations and continuous cultivation (Lal, 1987; Vanlauwe and Giller, 2006). Traditionally, agricultural production in sub-Saharan Africa has been upland-based (Thenkabail and Nolte, 1996; Wakatsuki and Masunaga, 2005).
Climate change models predict increasing drought conditions as a factor exacerbating food shortages in this region. In response to these hazards, smallholder farming households have increasingly expanded production to more fragile uplands and formerly unused marginal lands, such as, wetlands (Windmeijer and Andriesse, 1993; Dixon and Wood, 2003). Wetlands are found throughout eastern Africa, and are estimated to cover 3-5% of the total land area in the Mt. Kenya highlands and Laikipia plateau in Kenya and in Usambara highlands and Pangani basin in Tanzania. Such wetlands are generally small in area size, rarely exceeding 500 ha (Mwita, 2010; Chapter 2; Sakané et al., 2011), and mainly comprise narrow inland valleys (Wood and Dixon, 2002) and some floodplains (Harper and Mavuti, 1996). Wetlands support livelihoods of rural communities who gain access to these areas and make diverse use of them. Irrespective of their area, wetlands have been used for crop production, providing rapid responses to rainfall and food shortages in the dry parts of the region (Scoones, 1991; Adams, 1993). These uses have been recently extended to the wetter highland areas that experience land shortages and good market opportunity (Olindo, 1992; Wood and Dixon, 2001). With rich soils and year-round water and / or soil moisture availability, small wetlands provide smallholder farmers with opportunities to produce crops all year-round or during the dry season and particularly during drought years, thereby mitigating food shortages from upland fields and improving farmers’ incomes (Dixon, 2002; McCartney and van Koppen, 2004). Furthermore, their ability to retain moisture during the dry season supports biomass production and provision of pastures for livestock grazing when forage shortage occurs in the sub-humid and semi-arid areas (Roberts, 1988;

Chapter 3
50
Chapter 3
Rebelo et al., 2009). Crop production, which includes intensive rice cultivation, upland food crops, and high-value crop farming, has been practiced in floodplain and inland valley wetland types, whereas dry season grazing has been specific to floodplains (Balasubramanian et al., 2007; Rebelo et al., 2010). Various agronomic methods that have been developed in wetland farming include expansion of cultivated area through drainage of swampy valleys, increase in the frequency of cropping seasons, and use of farm inputs. Such methods have resulted to extension, intensification and / or diversification of agricultural use of these areas, reflecting biophysical characteristics of wetlands and socio-economic factors of farmers and thus underpinning the transitions of farming systems (Izac et al., 1991; Meinzen-Dick and Bakker, 1999; Crowley and Carter, 2000).
Several studies characterised the smallholder farming systems in eastern Africa revealing their dynamism and heterogeneity (e.g. Baijukya et al., 2005; Cecchi et al., 2010; Tittonell et al., 2010). The observed heterogeneity has been attributed to the diversity of biophysical and socio-economic environments in which farmers operate (Giller et al., 2006). The diversity of smallholder farming systems is related to variability in production objectives and resource endowment status of individual farm households (Zingore, 2006) in addition to their access to land resources, markets, and other institutions. Such diversity occurs even when farm households reside under similar agroecological conditions (Belzlepkina et al., 2004). Little is known about the production systems, the patterns of diversity, and their relationship with livelihood strategies and production objectives in smallholder farming systems in small wetlands agriculture. These wetlands occur in contrasting agroecological zones that exhibit diversity in terms of agricultural potential (Jaetzold et al., 2006; MOA-URT, 2006). Variability in population density, land availability, and market opportunities results in the intensification of certain agricultural practices. This specialisation can form the basis for typology of these small wetland agricultural areas. In addition, the variability in drivers of agricultural systems across sites and in production resources (upland vs. lowland or inland valley land) have resulted into differences in rural livelihoods, access to, and or assets among farmers within and between countries at study sites (Ellis and Mdoe, 2003; Freeman et al., 2004).
The study aimed to unravel further the complexity in small wetland agricultural systems in Chapter 2 for better understanding of cross-scale interaction between the major determinants of diversity and heterogeneity of these

Drivers of farm heterogeneity operating in wetland systems
51
Cha
pter
3
systems, from areas to individual households through wetlands. The objectives were to: (i) identify and categorise the biophysical and socio-economic heterogeneity of the production systems of agrowetland households; (ii) assess the influence of household diversity on wetland agricultural uses in contrasting rural areas; and (iii) characterise the diversity of farmers’ decision-making with respect the different land uses.
2. Materials and methods
2.1 Study sites, wetlands, and farms selection
Four study sites were selected in East Africa. Two were in Kenya: Nyeri North in Mt. Kenya highlands and Laikipia West district in Laikipia plateau, and two were in Tanzania: Lushoto district in the Usambara highlands and Korogwe district in the Pangani basin. The study sites comprised contrasting features (see Table 1) resulting in differences in agricultural potential (i.e. high for humid highland and midland and low for sub-humid lowland and semi-arid highland). Such differences have resulted in diverse land uses, which range from: (i) market-oriented smallholder coffee on upland and high-value crop production and commercial dairy systems in valley bottoms (Pender et al., 2006), through (ii) semi-market-oriented lowland rice and non-dairy livestock production (Mghase et al., 2010) to (iii) subsistence-oriented food crops on both uplands and in wetlands, to cultural and subsistence-oriented livestock systems (Kohler, 1987). The type of wetland embedded differed by site. Wetlands consisted of two inland valleys (Karatina and Lukozi), which occurred in humid highland and midland and two floodplains (Rumuruti and Malinda) that were associated with semi-arid highland and sub-humid lowland environments, respectively. The selection of wetlands considered differences in agroecological zones within which these occur, socio-economic gradients of their surrounding environments, and their land use diversity. Wetland area size varied with wetland type (Chapter 2; Sakané et al., 2011). Floodplains were large and extensive across countries and accounted for 5 and for 25 times the size of inland valley areas in Tanzania and in Kenya, respectively.
In an earlier study inland valley and floodplain wetland types were further differentiated into wetland cluster groups (WCG) based on area size, flooding regime, physical accessibility, land use intensity, and market access using multivariate analyses techniques (Chapter 2; Sakané et al., 2011).

Chapter 3
52
Chapter 3
Tab
le 1
: M
ain
biop
hysi
cal
char
acte
ristic
s, s
ocio
-eco
nom
ic a
ttrib
utes
and
stu
died
wet
land
cha
ract
eris
tics
and
thei
r su
b -un
its d
istr
ibut
ion
in th
e w
etla
nd b
asel
ine
surv
ey
typo
logy
of t
he s
elec
ted
wor
king
site
s
Stu
dy a
rea
Cou
ntry
K
enya
T
anza
nia
Lo
catio
n M
t. K
enya
La
ikip
ia
Usa
mba
ra
Pan
gani
D
istr
ict
Nye
ri N
orth
La
ikip
ia W
est
Lush
oto
Kor
ogw
e
Bio
physic
al ch
ara
cte
ristics
Agr
o-ec
olog
ical
Hig
hlan
d H
ighl
and
Mid
land
Lo
wla
nd
a Dom
inan
t ag
ro c
limat
ic
zone
s
U
M2-
3,
LH1,
UM
4 LH
5,
UM
6-5,
LH
4-3
E12
E
3
Rai
nfal
l
Ann
ual (
mm
)
900-
1500
b 40
0-85
0 90
0-12
00
800-
1000
Dis
trib
utio
n
Bim
odal
B
imod
al
Bim
odal
B
imod
al
Dom
inan
t soi
l typ
e (F
AO
)
Upl
and
H
umic
N
itiso
ls,
And
osol
s
Lith
osol
s,
Pha
eoze
ms
Acr
isol
s,
Fer
rals
ols
Acr
isol
s,
Ver
tisol
s
Wet
land
Dys
tric
F
luvi
sols
X
eros
ols,
F
luvi
sols
G
leys
ols,
Lu
viso
ls /
Flu
viso
ls
Luvi
sols
, F
luvi
sols
/ V
ertis
ols,
gl
eyso
ls
Par
ent
mat
eria
l
Vol
cani
c an
d m
etam
orph
ic
rock
s
Gra
nite
, al
luvi
al
depo
sits
Gra
nite
and
G
neis
s U
ncon
solid
ated
al
luvi
al
sedi
men
ts
Land
scap
e
Str
ongl
y un
dula
ting
mou
ntai
n sl
opes
Gen
tly
undu
latin
g,
elev
ated
pl
atea
u
Mou
ntai
nous
, st
rong
ly
undu
latin
g
Gen
tly
undu
latin
g to
ro
lling
pla
ins

Drivers of farm heterogeneity operating in wetland systems
53
Cha
pter
3
Ext
ensi
on o
f Tab
le 1
Socio
-econ
om
ic a
ttrib
ute
s
Ave
rage
farm
si
ze (
ha)
0.
5-4
0.4-
41
0.41
-3
0.5-
2
c Pop
ulat
ion
dens
ity
(per
son
km-2 )
32
7-24
37
6-69
13
1 21
Fam
ily s
ize
3.
7 5.
0 5.
0 4.
2 d M
arke
t ac
cess
ibili
ty
G
ood
Rel
ativ
ely
good
G
ood
Rel
ativ
ely
good
Maj
or e
thni
c gr
oups
Kik
uyu
Sam
buru
K
alen
jin,
Kik
uyu,
T
urka
na
Sam
baa,
Z
igua
S
amba
a, P
are
We
tland
envir
on
ment
attri
bute
s
Wet
land
nam
e
Kar
atin
a R
umur
uti
Luko
zi
Mal
inda
e D
omin
ant w
etla
nd
clus
ter
grou
p (W
CG
) N
arro
w
inla
nd
valle
y (1
, 4)
Flo
odpl
ain
and
wid
e in
land
va
lley
(2, 4
)
Nar
row
inla
nd
valle
y (2
, 3)
Flo
odpl
ain
and
wid
e in
land
va
lley
(1, 5
)
Geo
grap
hica
l loc
atio
n an
d ex
tent
Latit
ude
(WG
S 8
4)
0˚27
’58”
–
0˚28
’51”
S
0˚19
’16”
–
0˚15
’17”
N
4˚38
’18”
–
4˚40
’12”
S
5˚4’
29”
– 5˚
6’57
”S
Long
itude
(W
GS
84)
37
˚6’7
” –
37˚5
’57”
E
36˚3
4’59
” –
36˚3
2’26
”E
38˚1
3’54
” –
38˚1
6’22
”E
38˚1
9’32
” –
38˚2
1’28
”E
Ave
rage
alti
tude
(m
asl)
1725
18
20
1890
36
0
Tot
al a
rea
(ha)
2
8 7
46
105
51
4

Chapter 3
54
Chapter 3
Sou
rce:
Som
broe
k et
al.
(198
2), J
aetz
old
and
Sch
mid
t (19
82),
De
Pua
w (
1984
), F
AO
(19
88),
and
Pfe
iffer
(19
90).
a T
he a
gro-
ecol
ogic
al z
ones
are
arr
ange
d ac
cord
ing
to t
heir
impo
rtan
ce o
f oc
curr
ence
in t
he s
tudy
are
a. T
hese
are
des
crib
ed b
y Ja
etzo
ld a
nd
Sch
mid
t, 19
82 a
re a
s fo
llow
s: U
M2:
Mai
n co
ffee
zone
; U
M3:
Mar
gina
l co
ffee
zone
; U
M4:
Sun
flow
er-M
aize
zon
e; U
M5:
Liv
esto
ck-S
orgh
um
zone
; an
d U
M6:
Upp
er m
idla
nd r
anch
ing
zone
; LH
1: T
ea-D
airy
zon
e; L
H3:
Whe
at/
(Mai
ze)-
Bar
ley
zone
; LH
4: C
attle
-She
ep-B
arle
y zo
ne;
and
LH5:
Low
er h
ighl
and
ranc
hing
zon
e in
Ken
ya.
On
Tan
zani
an s
ide,
the
se a
re d
escr
ibed
by
De
Pua
w a
nd P
feiff
er a
s fo
llow
s: E
12:
Hum
id w
arm
zo
ne; a
nd (
4) E
3: G
ently
und
ulat
ing
to r
ollin
g pl
ains
and
pla
teau
x de
velo
ped
on g
neis
s
b The
rai
nfal
l pat
tern
is b
imod
al;
how
ever
, its
dis
trib
utio
n is
too
unr
elia
ble
and
scat
ted
durin
g th
e ye
ar.
It is
sub
divi
ded
into
thr
ee s
easo
ns:
first
ra
ins
in A
pril-
May
hav
e a
relia
bilit
y of
abo
ut 1
00 m
m o
nly,
the
mid
dle
rain
s in
Jun
e-Ju
ly e
xpec
t m
ore
than
120
mm
and
the
thi
rd r
ains
fro
m
Oct
ober
to N
ovem
ber
mor
e th
an 6
0 m
m (
Jaet
zold
and
Sch
mid
t, 19
82).
c P
opul
atio
n de
nsity
was
cal
cula
ted
at a
div
isio
n le
vel.
d Mar
ket
acce
ss (
low
, m
ediu
m,
and
high
) w
as d
efin
ed b
y th
e ty
pe o
f ro
ads
(tar
mac
, pa
ssab
le i
n al
l w
eath
er,
seas
onal
ly p
assa
ble)
and
the
av
aila
bilit
y of
mar
ketin
g in
stitu
tions
(lo
cal m
arke
t, br
oker
s, tr
ader
s, e
xpor
ts c
ompa
ny, e
tc.)
. e W
etla
nd c
lust
er g
roup
s (W
CG
): (
1) n
arro
w p
erm
anen
tly f
lood
ed in
land
val
leys
tha
t ar
e la
rgel
y un
used
(W
CG
1);
(2)
wid
e pe
rman
ently
flo
oded
in
land
val
leys
and
hig
hlan
d flo
odpl
ains
und
er e
xten
sive
use
(W
CG
2);
(3)
lar
ge i
nlan
d va
lleys
and
low
land
flo
odpl
ains
tha
t ha
ve s
easo
nal
flood
ing
patte
rns
and
are
unde
r m
ediu
m u
se i
nten
sity
for
upl
and
food
cro
ps a
nd l
owla
nd r
ice
(WC
G 3
); (
4) c
ompl
etel
y dr
aine
d w
ide
inla
nd
valle
ys a
nd h
ighl
and
flood
plai
ns u
nder
int
ensi
ve f
ood
crop
pro
duct
ion
(WG
C 4
); a
nd (
5) n
arro
w i
nlan
d va
lleys
tha
t ar
e dr
aine
d an
d us
ed f
or
inte
nsiv
e an
d ye
ar-r
ound
hor
ticul
tura
l pro
duct
ion
(WC
G 5
) by
Sak
ané
et a
l. (2
011)
.
Ext
ensi
on o
f Tab
le 1

Drivers of farm heterogeneity operating in wetland systems
55
Cha
pter
3
By using additional information on land uses and drainage patterns, derived cluster groups were characterised as follows: (1) narrow permanently flooded inland valleys that are largely unused (WCG 1); (2) wide permanently flooded inland valleys and highland floodplains under extensive use (WCG 2); (3) large inland valleys and lowland floodplains that have seasonal flooding patterns and are under medium use intensity for upland food crops and lowland rice (WCG 3); (4) completely drained wide inland valleys and highland floodplains under intensive food crop production (WGC 4); and (5) narrow inland valleys that are drained and used for intensive and year-round horticultural production (WCG 5).
The farms within four wetland cluster groups were analysed in detail in this study. Land units that fell within largely unused wetlands of cluster group 1 were discarded from farm typification, as these were mainly source of water, located in valley heads and dominated by natural vegetation species (e.g. Typha capensis, Cyperus spp.). Thus, only the four agriculturally used wetland cluster groups were considered in the classification exercise.
2.2 Farm household survey
Two hundred and seventy-five farms were randomly selected across the four wetland cluster groups to cover the diversity exhibited in the production systems. The surveys were conducted during the dry season (January and February) and the long rains seasons (from March to July) 2009. Farms consisted mostly of: (i) small wetland fields in Rumuruti floodplain; (ii) large farms on adjacent upland of this floodplain; and (iii) a combination of upland and wetland fields in Nyeri, Lushoto, and in Korogwe. Farms were managed by smallholder households, forming wetland rural communities and settled in 18 villages around the wetlands. Prior to individual interviews, farmers’ group discussions were organised at each village independently to capture the history and diversity of wetland use. Wetland users (men and women) discussed major livelihood strategies and contribution of wetland farming to food security. Questions asked during individual interviews provided information on socio-economic attributes, including characteristics of farm household head (name, village, age, gender, tribe, education level, leadership position, marital and migration status, years of and reasons for migration, and wetland farming experience), family structure (size, active, and dependents), food security, land (upland) and labour availability, land tenure/ownership, mode of land acquisition in the wetland, distance from homestead to wetland

Chapter 3
56
Chapter 3
field (walking minutes), land use patterns, history of wetland field, access to market, production orientation, and livestock systems. Biophysical information on wetland field included flooding regime, soil fertility assessment (e.g. vegetation species indicators), and its management aspect (use of farm inputs, mode of land preparation, weeding, etc.). Questions on land use patterns, production orientation and use of farm inputs differentiated wetland fields from upland ones. Different wetland fields were identified and mapped using GPS.
2.3 Formulation of farm typology
Production structure as suggested by Norman et al. (1995) was used as the conceptual basis for household categorisation. Production system was defined and structured based on expert-knowledge (Valbuena et al., 2008) to develop a classification hierarchy for farm(er)s surveyed. The production structure was defined for existing production resources (upland, wetland, and their combination) across sites, in order to encompass the high variability in agroecological gradients, differences in farm households’ assets and in rural livelihoods. Furthermore, key resources and production systems were considered for each site. Prior to the definition of the production structure, principal components analysis (PCA) was used to examine patterns across sites and at each site independently, to understand the variation within the dataset, and to identify potential indicators for classification criteria. Quantitative variables on socio-economic information were log or square root transformed and/or standardised for comparability reasons. The understanding gained from PCA was combined with field surveyor expert-knowledge to develop the classification hierarchy across sites, at each site, and for each wetland cluster group independently. Based on these results, dominant farm household’s production systems were defined according to livestock ownership, type of cattle owned and its integration with cropping. Dominant production systems were further refined into twelve categories by taking into account major crops grown by smallholder farmers on specific production resource (upland, wetland, and their combination) and farmers’ production objectives (cultural, subsistence, cash). The resulting twelve categories formed a farm(er) typology to which individual farm household was assigned by examining indicator variables of classification with respect to the criteria of the typology proposed. Detailed characterisation of derived farm types was done using information on other resource endowment (land, labour, and other ruminants owned by the household), land availability (total land and upland per capita), wetland field: farm size ratio, family structure (e.g. age of household

Drivers of farm heterogeneity operating in wetland systems
57
Cha
pter
3
head, family size, and dependency ratio), food security factors, distance from homestead to wetland-plot, farming experience in the wetland, and wetland use duration. Statistical analyses of variance were done on the quantitative variables and on combinations of some of these variables (e.g. land: labour ratio) to examine differences among farm types, and production systems for each variable. Tukey’s test was used for post-hoc means separation where differences occurred.
3. Results
3.1 Production resource (land, livestock, and labour) availability and
accessibility
Total land availability in terms of upland and wetland areas available for farming varied among sites, but most of the common indicators of land availability per farm did not vary. Farm size, cultivated area, and upland per capita did not differ among sites, except wetland field size that varied significantly (P < 0.001) between wetland types (Figure 1). Farm size of wetland farmers ranged between 0.03 ha to 20.7 ha and averaged 1.87 ha. Across sites, 55% of the farms (n = 184) had less than 2.0 ha, and only 4% (n = 10) had above 5.0 ha (Figure 1 A). The largest farms (49.5 ha) were export-oriented horticultural ones that were adjacent to Rumuruti floodplain where farmers abstracted irrigation water from the wetland. Geomorphological differences between floodplains and inland valleys translated in wide variability in associated field sizes. Farmers had small fields on average (0.35 ha; SD = 0.4) in inland valleys than in floodplains (1.17 ha; SD = 1.5) across sites (Figure 1 B).The contribution of wetland area in household farming land (or ‘wetland field: farm size ratio’) varied significantly (P < 0.001) among sites, following the patterns observed in wetland field size, with the highest ratio observed in Rumuruti floodplain in semi-arid highlands (0.93). Sites with inland valleys shared the same ratio at 0.2 (Figure 1 C).
Total number of livestock owned and species diversity varied significantly (P < 0.001) among sites, their associated environments, and wetland types. For example, sites in the semi-arid and sub-humid areas were endowed with large herd size, which consisted mainly of non-dairy cattle and small ruminants, with the largest size observed in semi-arid areas (9.78 TLU per farm for Laikipia West), indicating the role of floodplain wetland in livestock management. In contrast, sites in humid environments with inland valleys were less endowed in

Chapter 3
58
Chapter 3
livestock but had most of the dairy cattle, with the highest average observed in humid highland areas in Nyeri North (1.43 TLU per farm) (Figure1 D).
Household average size, family dependency, and labour available varied significantly (P < 0.001) among sites; however, age of household head did not differ between them, indicating wide variability within each individual site. For most sites, patterns observed in the age of the household head were opposite to those observed in the average of household size. The oldest farmers (average = 54 years) were found at the humid highland site, where the smallest household size was also observed (average = 5 persons). The humid midland site had averaged the highest household size at 9.4 persons and the highest dependency ratio of 2.9. Family labour seemed to have been affected by age of household head and the rate of education of the country. The largest average of family labour was observed in sub-humid lowland area (3.1 persons) and the smallest observed in humid highlands (1.0 person). Land per capita, which is an indicator for measuring land availability, did not differed significantly among sites but varied with the wetland type and thus, the corresponding population density. Sites with inland valley averaged the smallest ratio at 0.28 ha person-1, indicating the land shortages in the highlands with high population density, while the site in the lowlands averaged the largest ratio at 0.45 ha person-1. But, land: labour ratio varied widely within sites and differed significantly (P < 0.001) across these (Figure 1 E). Large ratios indicate labour limitation, whereas small ratios indicate land imitation. Family dependents: size ratio varied significantly (P < 0.001) among sites and was higher in Tanzania (e.g. 3.0 for Lushoto) than in Kenya (e.g. 0.4 for Nyeri North), reflecting the number of months each adult feeds and indicating the families in expansion.
Land tenure system differed between and within countries, shaping the mode of land acquisition in the wetland. Land on upland was privately (freehold or leasehold) owned in Central Kenya, where every farm had a title deed, resulting in inheritance ownership. In Laikipia district, trust land tenure system was observed in addition to the private ownership. Wetlands were legally owned by government in Kenya, but at the humid highland site, farmers extended their farm to the valley stream, making wetland private ownership illegal. Across Tanzanian study sites, traditional land tenure systems prevailed.
Farmers initially accessed land through the village chief, which thereafter became a family’s private property but without title deed. In all sites,

Drivers of farm heterogeneity operating in wetland systems
59
Cha
pter
3
inheritance, allocation, rent-in, and purchase were observed in land tenure systems of wetland with their distributions varying among them. Allocation was high at the site in the semi-arid highland where migrants or squatters (80%, n = 70) could temporally access land in the floodplain through the local government authority for small-scale farming (Figure 1 F). Half of fields surveyed in Karatina valley were inherited by male and female farmers. Purchase competed highly with inheritance (up to 46 versus 42%) in Malinda and Lukozi wetlands which can be explained by the income generation character attached to these areas. Unlike in Kenya, farmer’s gender was a contributor towards land ownership in these areas.
The percentage of households that had some off- or non-farm income varied among sites and between countries (Figure 1 G). In all sites, 52% of households had some off- or non-farm income, where only 5 and 14% had permanent employment in Tanzania and in Kenya, respectively. Off/non-farm income sources ranged from remittances by members of the extended family living in cities through petty trading or food aid to employment outside the farm. In most households in all sites, cases with family members engaged in non-farm activities were few, explaining their reliance on temporally off-farm income generation alternatives. Farmers also sold their labour locally to other (wealthier) farmers to generate cash, particularly in the semi-arid area where 30% of the households had at least one member who temporally does casual work in neighbouring horticultural farms.
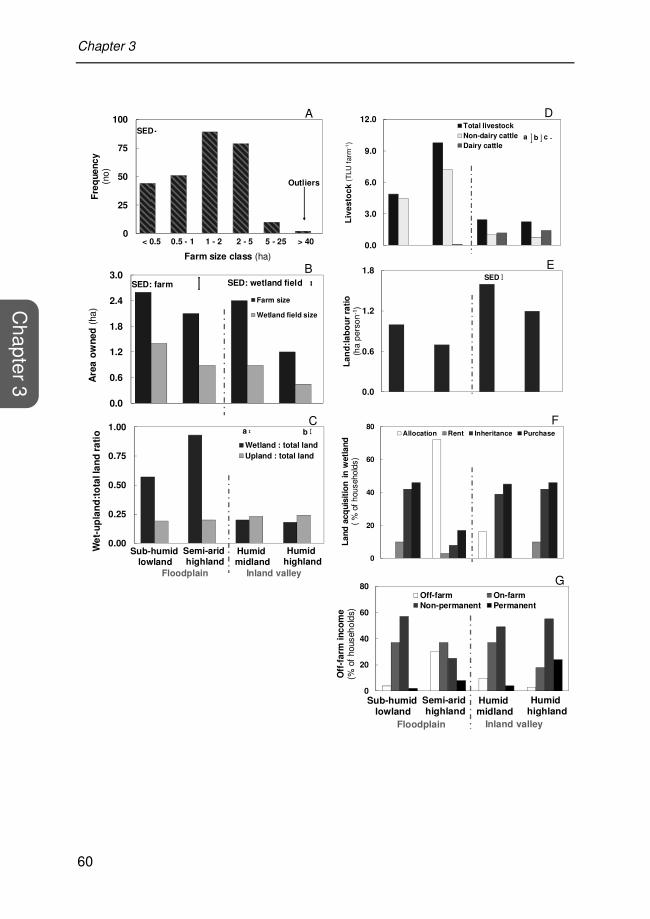
Chapter 3
60
Chapter 3
0
25
50
75
100
< 0.5 0.5 - 1 1 - 2 2 - 5 5 - 25 > 40
Fre
qu
en
cy
(no)
Farm size class (ha)
SED
Outliers
0.0
3.0
6.0
9.0
12.0
Liv
es
toc
k (
TLU
far
m-1
)
Total livestock
Non-dairy cattle
Dairy cattleb a c
0.0
0.6
1.2
1.8
2.4
3.0
Are
a o
wn
ed
(ha
)
Farm size
Wetland field size
SED: farm SED: wetland field
0.0
0.6
1.2
1.8
La
nd
:la
bo
ur
rati
o
(ha
per
son
-1)
SED
0.00
0.25
0.50
0.75
1.00
We
t-u
pla
nd
:to
tal la
nd
ra
tio
Wetland : total land
Upland : total land
a
Sub-humid lowland
b
Semi-arid highland
Humid midland
Humidhighland
Floodplain Inland valley
0
20
40
60
80
La
nd
acq
uis
itio
n i
n w
etl
an
d
( %
of h
ouse
hold
s)
Allocation Rent Inheritance Purchase
0
20
40
60
80
Off
-fa
rm i
nc
om
e
(% o
f ho
useh
olds
)
Off-farm On-farm
Non-permanent Permanent
Sub-humid lowland
Semi-arid highland
Humid midland
Humidhighland
Floodplain Inland valley
D
F
E B
A
C
G
Drivers of farm heterogeneity operating in wetland systems
61
Cha
pter
3
Figure 1: Land, land availability, mode of acquisition, livestock, labour, family size and
socio-economic indicators. (A): Frequency distribution of farm sizes per class,
considering possible classes: less than 0.5; between 0.5 and 1; between 1 and 2; between 2 and 5, between 5 and 25 and above 40 ha. Outliers indicate 2 farmers who
practice large scale commercial farming on adjacent upland, using wetland as source of
irrigation water; (B) land resource for wetland farmers (n = 273) per district : Area owned (average farm and wetland field sizes); (C) land availability per resource type:
wetland/upland field: farm size ratios (average). Bars show standard error of differences
(SEDs) for different factors: (a) wetland field, (b) upland field; (D) livestock ownership and types per site (average). Bars show SEDs for different factors: (d) total livestock
which include small and large ruminants, (e) non-dairy cattle, and (f): dairy-cattle; (E)
land : labour ratios (average) per site; and (F and G) Mode of land acquisition in wetland and off-income availability per site: percentage of households. TLU: tropical livestock
units. Dashed dotted lines separate sites with floodplain from those with inland valley
wetland type.
Figure 1 continued ...

Chapter 3
62
Chapter 3
3.1 Characterisation of household’s production systems and farm
typology
In the principal component analysis (PCA) done on quantitative variables for the entire sample (n = 275 farms) the first two principal components (PCs) explained 95% of the variance across sites. Small ruminants and non-dairy cattle alternatively dominated PC1 with loading values of up to 85%. PC2 was associated with cultivated area and with wetland field size at 88%. The main results of the PCA on livestock and land indicators were complemented with field surveyor expert-knowledge to structure the production system across sites. Farm households’ production systems were characterised by diverse crop types, livestock species, and their combinations. Four major production systems were defined using this information and these can be described as follows:
(i) Crop-based production (31%; n = 85): farm household does not own livestock and mainly derives his livelihood from on-farm activities (e.g. cropping);
(ii) Mixed crop-dairy-based production (28%; n = 78): farm household integrates dairy farming with crop enterprises;
(iii) Mixed crop-non-dairy-based production (34%; n = 93): farm household grows crops and keep ruminants as a capital asset and viewed as saving mechanism to buffer against crop failures and serve as a reserve easily convertible to cash; and
(iv) Livestock-based farming production (7%; n = 19): farm household relies mainly on livestock (cattle) as a capital (source of food and cash) and cultural asset.
These four production systems were refined into 12 farm types by taking into account differences in availability of production resources (upland vs. wetland) and the related production orientation (Figure 2).
Production factors on livestock, land, and labour varied significantly (P <
0.001) among production systems and derived farm types. The number of livestock owned increased from the dairy system to the livestock-based one through the mixed crop-non-dairy system (data not shown).

Drivers of farm heterogeneity operating in wetland systems
63
Cha
pter
3
Far
m p
rodu
ctio
n st
ruct
ure
(FP
S)
Cro
pC
rop-
dairy
cat
tleLi
vest
ock
Cro
p-no
n-da
iry c
attle
Upl
and-
Wet
land
Wet
land
Wet
land
ve
geta
ble
Upl
and
food
cro
p -
Wet
land
veg
etab
leU
plan
d co
ffee-
Wet
land
mix
ed
Upl
and
horti
cultu
re -
Wet
land
wat
er a
bstra
ctio
nW
etla
nd
food
cro
pU
plan
d fo
od c
rop
-W
etla
nd p
addy
rice
Wet
land
ve
geta
ble
Upl
and
& W
etla
nd
mix
ed c
rops
PS
1
Wet
land
cro
pN
o cr
op
PS
2P
S 3
PS
4
FT
12
FT
11
FT
10
FT
9F
T8
FT
7F
T6
FT
5F
T4
FT
3
FT
1F
T2
Production systems(PS)
Farm Type (FT)
Fig
ure
2: P
rodu
ctio
n st
ruct
ure
desc
ribed
at f
our
stud
y si
tes
(Nye
ri N
orth
and
Lai
kipi
a W
est,
Lush
oto
and
Kor
ogw
e di
stric
ts)
loca
ted
in h
umid
and
sem
i -arid
hig
hlan
ds in
Ken
ya a
nd h
umid
mid
land
and
sub
-hum
id lo
wla
nd a
reas
in T
anza
nia.
Eac
h si
te is
end
owed
with
eith
er a
n in
land
val
ley
or a
flo
odpl
ain
wet
land
typ
e w
ith r
espe
ct t
o do
min
ant
land
scap
e un
its.
Wet
land
s ex
hibi
ted
dive
rsity
in
uses
(e.
g. g
razi
ng a
nd c
rop
prod
uctio
n) b
y ru
ral s
mal
lhol
der
hous
ehol
ds t
hat
was
cap
ture
d by
sel
ecte
d fa
rms
( n =
275
) us
ed t
o de
fine
the
hous
ehol
d pr
oduc
tion
syst
em. T
he d
ashe
d an
d do
tted
line
sepa
rate
s th
e fo
ur m
ajor
pro
duct
ion
syst
ems
(PS
1, 2
, 3, a
nd
4) fr
om w
hich
cor
resp
ondi
ng fa
rm ty
pes
wer
e de
rived
(F
T 1
, 2, 3
, 4, 5
, 6, 7
, 8, 9
, 10,
11, a
nd 1
2).

Chapter 3
64
Chapter 3
Variable on wetland dependency ratio, which indicates the contribution of wetland area in the household farm size was high (≥ 0.7) for most production systems, except for the mixed crop-dairy-based farms (0.2). Moreover, differences in proportions of land uses on upland and in wetland were observed among production systems where food crop farming dominated upland fields (at least 15%). Such proportions were generally low in wetland uses (≤ 9%) that were more market-oriented for either paddy rice cultivation (17% for individual crop-based and mixed crop-non-dairy systems), or high-value crop production (19%) for mixed crop-dairy farms. In general, crop-based production systems predominated in sparsely populated areas (average ≤ 32 person km-2), whereas mixed crop-dairy farming prevailed the production systems at highly populated sites. Off-farm income was a significant component of rural livelihoods and access to market influenced the production system. Proportions of farm households that earned off-farm income and had access to market varied significantly (X2 = 96.5, DF = 2; Pr < 0.001) and the highest proportions were observed in the mixed crop-dairy cattle production system.
Average values of key socio-economic indicators for each farm type are summarised in Table 2.
Type 1 farms represent the poorest farmers depending mainly on crop production in small-allocated wetland plots (average = 0.9 ha) for own consumption (upland food crops, 56%) and some cash generation (high-value crops, 28%). Farmers are immigrant upland-landless who do not own livestock and do not meet household’s food requirements despite their small family size. They are mostly land constrained and thus, labour self-sufficient. Crop production is mainly complemented by off-farm earnings that consist of petty trading, shop keeping, or temporary labour selling to the neighbouring wealthier farmers.
Type 2 farms have similar main livelihood strategies to those of Farm Type 1 but are better endowed in land, and hence half-dependent on cropping land in the wetland, as they own land on upland and diversify their crop production activities. Food crops are grown on upland (100%) for own consumption while semi-market to market oriented paddy rice is cultivated in inherited or purchased wetland-plots in the large lowland floodplain. Family size is medium but in expansion with high family size: dependents ratio. Despite the availability of complementary off-farm income, yearly food insecurity prevails.

Drivers of farm heterogeneity operating in wetland systems
65
Cha
pter
3
Type 3 farms constitute another category of wetland-dependent farmers who migrated from the land-constrained areas of the humid highlands, bringing along with them their traditional mixed crop-dairy farming system. They have recently settled in Laikipia and were allocated land in the wetland. With high monetary resource earned from off/non-farm employment, farmers mostly generate more cash from market-oriented high-value crops (with high farm inputs), milk production that allowed them to achieve food security. Farms are characterised by mid-aged household head, medium families mainly constrained by family labour and thus hire-in some for high-value crop production.
Type 4 farms have similar land size and upland use type as Type 2 ones, had the lowest wetland field:farm size ratio (average = 0.2 ha) and made intensive use of their small valley-plots through market-oriented year-round high-value crop farming. Farmers diversify their livelihood strategies through integration of crops and dairy farming. Land was initially allocated to old farmers who have been practicing valley high-value crop farming for more than 25 years. Interestingly, land acquisition is gradually changing from allocation to inheritance and purchase. Farmers are better endowed in livestock than those of Type 3 farms. Mainly land constrained (land fragmentation owing to inheritance patterns and population increase), they are old wetland farmers but have large families in expansion, and are thus food insecure.
Type 5 farms comprise the oldest farmers in general, having similar farming systems and wetland farming experience as Type 4 farmers, but are less endowed in land (with the lowest wetland field:farm size ratio like farm Type 4) and in family labour. They generate cash from permanent off-farm activities (e.g. pension and salary) and from perennial cash crop (coffee) that is grown on upland. The close integration of crops and dairy on one side and the small family size on the other hand provide Type 4 farmers with the best strategy to food security. Land access in the valley follows the land tenure system on upland, whereas some few wealthier farmers rent-out small-plots to women for arrow root cultivation.
Type 6 farms represent typical export-oriented commercial immigrant farmers, having off-farm income, renting-in large scale farms from the former ranchers of Rumuruti for high-value crop production. They make intensive water abstraction from the wetland for adjacent upland irrigation and temporarily employ labourer from agro-pastoralist and pastoralist families.

Chapter 3
66
Chapter 3
Far
m ty
pe
Hou
seho
ld
dist
ribut
ion
Land
(ha
) La
nd a
vaila
ble
(ha)
Li
vest
ock
(TLU
)
#
%
Ow
ned
F
arm
ed
Wet
land
R
atio
wet
land
tota
l lan
d
Tot
al p
er
capi
ta
Upl
and
per
capi
ta
k Tot
al
Impr
oved
dairy
cattl
e
Non
-
dairy
cattl
e
Sm
all
rum
inan
t
1
36
13
0.90
a 0.
60a
0.9a,
b 1.
00b
0.20
a 0.
00
0.00
0.
0 0.
00
0.00
2
49
18
2.30
b 1.
60b
1.1b,
c 0.
5a,b
0.50
b 0.
2a,b
0.00
0.
0 0.
00
0.00
3
3
1
1.2a,
b 0.
9a,b
1.2b,
c 1.
00b
0.20
a 0.
00
2.1a,
b 2.
1b 0.
00
0.00
4
41
15
2.3a,
b 2.
1b,c
0.5b
0.20
a 0.
30a
0.2a,
b 2.
4a,b
1.5a,
b 0.
6a,b
0.3a,
b
5
32
12
1.3a,
b 1.
20b
0.2a
0.20
a 0.
30a
0.30
b 2.
3a,b
1.6a,
b 0.
00
0.10
a
6
2
1
49.5
d 33
.8d
0.00
0.
00
8.30
c 8.
30c
1.6a,
b 1.
6a,b
0.00
0.
00
7
24
9
0.90
a 0.
60a
0.9a,
b 0.
90b
0.20
a 0.
00
3.7b,
c 0.
0 2.
9a,b
0.5a,
b
8
47
17
3.0a,
b 2.
2b,c
1.60
c 0.
6a,b
0.40
b 0.
2a,b
9.90
d 0.
0 9.
00c
0.9c,
d
9
19
7
2.3a,
b 1.
60b
1.0b,
c 0.
6a,b
0.3a,
b 0.
10a
5.6c,
d 0.
0 4.
0a,c
1.0c,
d
10
3
1
1.1a,
b 1.
0a,b
0.7a,
b 0.
5a,b
0.2a,
b 0.
10a
2.9a,
b 0.
0 2.
1a,b
0.2a,
b
11
9
3
1.2a,
b 0.
50a
1.0b,
c 0.
90b
0.3a,
b 0.
00
41.2
f 0.
0 26
.0d
13.3
0f
12
10
4
0.60
c 0.
0 0.
6a,b
0.9b
0.10
a 0.
00
32.7
e 0.
0 24
.6d
6.80
e
Sig
nific
ance
(P
val
ues)
Far
m ty
pe (
FT
) <0
.001
<0
.001
<0
.001
<0
.001
<0
.001
<0
.001
<0
.001
<0
.001
<0
.001
<0
.001
(A) T
able
2:
Hou
seho
ld c
ateg
oris
atio
n an
d ke
y so
cio-
econ
omic
ind
icat
ors
for
the
twel
ve f
arm
typ
es (
with
in c
olum
n m
eans
with
diffe
rent
sup
ersc
ripts
are
diff
eren
t at
P <
0.0
5) a
cros
s si
tes
( n =
275
): (
A)
aver
age
of t
otal
land
, m
anag
ed,
wet
land
land
are
a an
d w
etla
nd:to
tal
land
rat
io,
land
ava
ilabi
lity
(tot
al l
and
and
upla
nd la
nd p
er c
apita
) an
d liv
esto
ck o
wne
rshi
p (im
prov
ed d
airy
,
non -
dairy
cat
tle a
nd s
mal
l rum
inan
ts);
(B
): a
vera
ge o
f fa
mily
siz
e an
d la
bour
, la
bour
: s
ize
ratio
, m
onth
s of
food
sel
f-su
ffici
ency
per
year
, age
of h
ead
of h
ouse
hold
, wet
land
farm
ing
expe
rienc
e, w
etla
nd u
se d
urat
ion
and
wal
king
min
utes
from
hom
este
ad to
w
etla
nd fi
eld

Drivers of farm heterogeneity operating in wetland systems
67
Cha
pter
3
H
ouse
hold
dist
ribut
ion
Fam
ily s
ize
labo
ur
Dep
ende
ncy
ratio
Foo
d
secu
rity
(mon
ths)
Age
of t
he
head
of
hous
ehol
d
Far
min
g
expe
rienc
e
Wet
land
use
dura
tion
Dis
tanc
e to
wet
land
Far
m ty
pe
# %
1
36
13
5.7a,
b
1.5a,
c 1.
1a
10.4
a 47
.4a
21.1
d,h
27.0
b,c
22.6
d,e
2
49
18
6.2a,
b
2.6a,
d
1.4a
10
.3a
49.8
a
18.7
c,g
32.9
e,f
21.6
d,e
3
3
1
8.0a,
c 1.
3a,c
0.6a
11
.7a
44.7
a
9.0a,
d
20.3
a,b
16.7
c,e
4
41
15
8.9a,
c 2.
0a,d
3.1a
,b
10.4
a 47
.7a
25.5
f,h
33.4
e,f
11.9
b,d
5
32
12
4.8a
1.
0a,b
0.4c
11.3
a 54
.0a
27.4
h 43
.8g
17.1
c,e
6
2
1
6.0a,
b
0.0a
0.
2a,c
12.0
a 44
.5a
2.5a,
b
15.0
a
60.0
f
7
24
9
7.0a,
b
2.1a,
d
1.4a
10
.1a
46.4
a
19.3
c,g
23.6
b,c
18.7
c,e
8
47
17
7.5a,
b
3.5a,
d
1.5a
,c,d
10
.6a
45.9
a
19.0
c,g
33.5
e,f
22.4
d,e
9
19
7
7.9a,
c 2.
5a,d
1.2a
,c
10.3
a 42
.7a
15.5
b,f
22.8
a,c
20.4
d,e
10
3
1
7.0a,
b
1.3a,
c 1.
3a,c
11.3
a 54
.3a
13.3
b,e
29.7
d,e
3.70
a
11
9
3
14.6
c 4.
8d
1.3a
,c
9.80
a 45
.9a
19.0
c,g
23.4
b,c
5.2a
,c
12
10
4
12.3
b,c
4.2c,
d 1.
4a
9.10
a 50
.8a
19.6
c,g
21.4
a,b
22.7
d,e
Sig
nific
ance
(P
val
ues)
Far
m ty
pe (
FT
) <0
.001
<
0.00
1 <0
.001
ns
ns
<0
.001
<0
.001
<0
.001
(B)
ns:
not
sign
ifica
nt;
k Cal
cula
ted
on t
otal
num
ber
of r
umin
ants
tha
t in
clud
e la
rge
(e.g
. ca
ttle,
cam
el,
and
donk
ey)
and
smal
l on
es (
e.g.
pig
, da
iry
goat
s, lo
cal g
oats
and
she
ep).
Thi
s m
akes
the
sum
of
thre
e la
st c
olum
ns o
n im
prov
ed d
airy
cat
tle,
non-
dairy
cat
tle,
and
smal
l rum
inan
ts le
ss o
r eq
ual t
o to
tal l
ives
tock
.
Ext
ensi
on o
f Tab
le 2

Chapter 3
68
Chapter 3
Originally land-constrained, farmers are medium-aged who have been very recently involved in export-oriented horticultural production. They represent the wealthier farmers in land resource endowment due to their large-scale farming systems.
Type 7 farms consist also of wetland-dependent farmers, mainly immigrants, growing upland food crop in small allocated plots in floodplain, keeping few heads of non-dairy cattle and small ruminants that are freely grazed in communal grasslands, and mostly engage in selling labour to generate cash.
Type 8 farms constitute subsistence-oriented on upland and half-dependent semi-market lowland paddy rice farmers. They own relatively large farms in general and the largest wetland farm size in specific (average = 1.6 ha), keeping relatively large number of non-dairy cattle and small ruminants. They have varying age ranges, large families and thus sufficient family labour. With some kind of some temporary non-farm earnings, they nearly enjoy year-round food security. They are indigenous households that have acquired land in the floodplain through purchased and inheritance for rice farming for more than 20 years.
Type 9 farms have similar livestock production system, but own less cattle and smaller farm size than Type 8 farms and cultivate high-value crop in wetland for cash generation. They earn income from off-farm activities but are food unsecured due to their relatively large families. Land acquisition in floodplains varies from inheritance to purchase through allocation. Market-oriented farming in the wetland for either high-value crop or rice is a recent activity.
Type 10 and Type 3 farms have similar farm size and cattle number but the Type 10 own some small ruminants, make mixed uses of land on uplands and in wetlands, and are settled very close to the wetland. They are old farmers with relatively small families who usually hire-in labour to complement family labour. They have been involved in floodplain farming for about twenty years.
Type 11 farms consist of agro-pastoralists who own the largest herd size (small ruminants and non-dairy cattle) and small farm size, and gain free access to wetland and upland communal grassland for grazing and animal watering. They are immigrants who have been settled and allocated land in the wetland where they mainly grow food crops to source for grain. They are polygamous households with large families with excess labour that is

Drivers of farm heterogeneity operating in wetland systems
69
Cha
pter
3
sporadically sold to the commercial farmers for income generation. Cattle is kept as a capital, prestige, and cultural (e.g. used for dowry) asset and small ruminants are kept for sale to obtain food and financial security.
Type 12 farms have similar heads of cattle, livestock production systems, and income generation strategies but are less endowed in small ruminants and in land as they do not grow any crops. Livestock-based farms rarely achieve household’s food security. Besides crop and livestock production, most households of Farm Types 1, 8, 11, and 12 mainly rely on the wetland for settlement and for roof thatching materials. A schematic representation of derived 12 farm types for the four production systems is presented in Figure 3.
Although 12 strategies were identified across sites, the occurrence of farm types at each individual site and the distribution of households falling in each category varied between sites. This is mainly due to the regional variability of the main criteria used for structuring the production systems that is linked to the agroecological zone, the related production resource and type, and induced-livelihood strategies. Consequently, most farm types were specific to either the dry environment (e.g. 80% for Types 1 and 2), the wetter zones (e.g. 95% for Types 4 and 5), or to the combination of wetland type and the agroecology of the area (e.g. crop-non-dairy and livestock-based strategies).
3.3 Linking farm types to existing wetland cluster groups
The proportional distribution of farm types within the production systems for each wetland cluster group is summarised in Table 3. Mostly, individual farm types are occurring in all of these except for farm types 4 and 5 that were specific to WCG 5 and 4, respectively. This is due to the variability of landscape and agroecology of the wetland environment, to the potential of the area for non-wetland related livelihood strategy diversification, and of the main criteria used for wetland clustering. Each wetland cluster group was associated with various farm types (between 4 and 10), reflecting their use diversity and thus the related livelihood diversification. In general, this association was mainly related to two key wetland classification indicators of physical accessibility and flooding patterns, and to some extent to wetland category, area size, and use intensity. The former group of indicators reflects the hydrological characteristics of the ecological units, influencing their agricultural uses and production orientation through land use intensity.

Chapter 3
70
Chapter 3
Ho
useh
old
Fo
od
Off
-farm
Ho
use
UF
C
0.9
ha
Ho
use
HV
C,R
IC
Farm
Typ
e 1
Ho
use
ho
ld
Fo
od
Off
-fa
rm
Ho
use
UP
R,
RIC
, U
FC
1.1
ha
UF
C
1.2
ha
Farm
Typ
e 2
Ho
us
eh
old
Fo
od
Off
-farm
Ho
use
HV
C,
FD
C
1.2
ha
DC
: 3
Ho
use
Farm
Typ
e 3
Ho
us
eh
old
Fo
od
Off
-farm
Ho
use
HV
C
Ho
use
UF
C,
FD
C
Fa
rm T
yp
e 4
1.8
ha
0.5
ha
DC
: N
DC
:3
SR
U:1
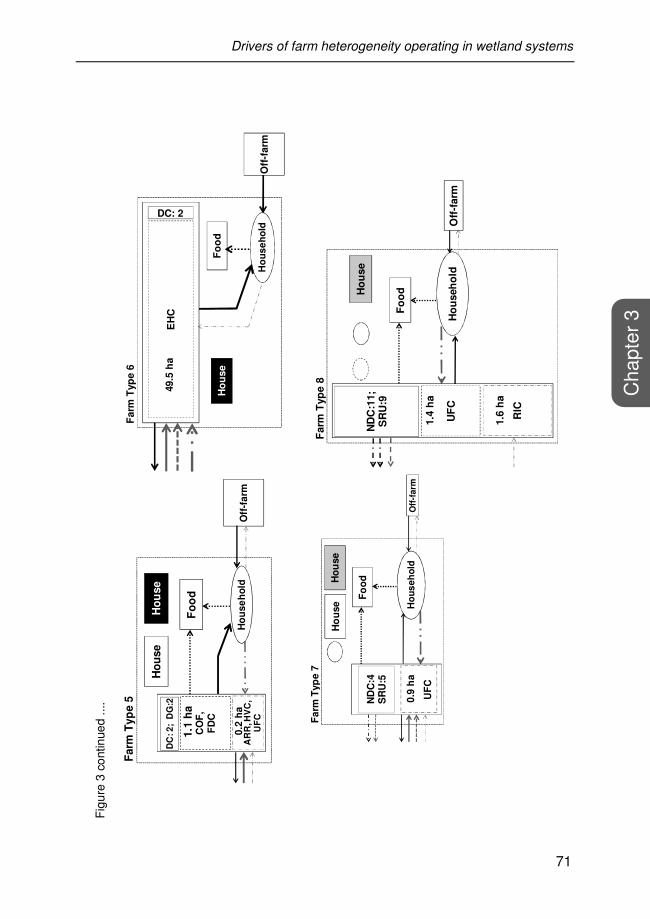
Drivers of farm heterogeneity operating in wetland systems
71
Cha
pter
3
Fig
ure
3 co
ntin
ued
....
Ho
us
eh
old
Fo
od
Off
-fa
rm
Ho
use
0.2
ha
DC
: 2
; D
G:2
Ho
use
CO
F,
FD
C
1.1
ha
Farm
Typ
e 5
AR
R, H
VC
, U
FC
H
ou
se
ho
ld
Fo
od
Off
-farm
DC: 2H
ou
se
EH
C49.5
ha
Farm
Typ
e 6
Ho
us
eh
old
Fo
od
Off
-farm
Ho
use
0.9
ha
ND
C:4
SR
U:5
Ho
use
Fa
rm T
yp
e 7
UF
C
H
ou
seh
old
Fo
od
Off
-farm
Ho
use
RIC
ND
C:1
1;
SR
U:9
UF
C
1.4
ha
1.6
ha
Farm
Typ
e 8
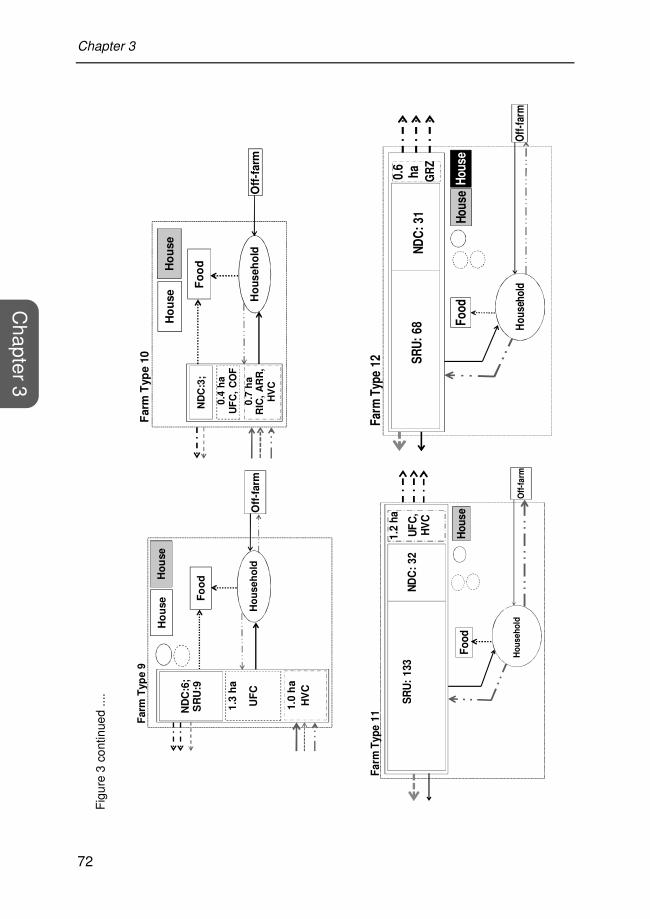
Chapter 3
72
Chapter 3
Fig
ure
3 co
ntin
ued
....
Ho
us
eh
old
Fo
od
Off
-farm
Ho
use
HV
C
ND
C:6
; S
RU
:9
UF
C
1.3
ha
1.0
ha
Ho
use
Farm
Typ
e 9
Ho
us
eh
old
Fo
od
Off
-farm
Ho
use
ND
C:3
;
0.4
ha
0.7
ha
Ho
use
Farm
Typ
e 1
0
UF
C,
CO
F
RIC
, A
RR
, H
VC
Fa
rm T
ype
11
Far
m T
ype
12
Ho
us
eh
old
Fo
od
Off
-fa
rm
1.2
ha
ND
C:
32
SR
U:
133
Ho
us
e
Fa
rm T
yp
e 1
1
UF
C,
HV
C
Ho
use
ho
ld
Fo
od
Off
-far
m
Ho
use
GR
ZN
DC
:31
SR
U:
68
Ho
use
Far
m T
ype
12
0.6
h
a

Drivers of farm heterogeneity operating in wetland systems
73
Cha
pter
3
Fig
ure
3 co
ntin
ued
....
Fig
ure
3: F
unct
iona
l typ
olog
y: s
chem
atic
and
gen
eric
rep
rese
ntat
ion
of r
esou
rce
avai
labi
lity,
pro
duct
ion
activ
ity, a
nd r
esou
rce
allo
catio
n pa
ttern
s in
sel
ecte
d fa
rm ty
pes
deriv
ed a
cros
s si
tes.
The
siz
e of
the
reso
urce
com
pone
nts
(wet
land
vs.
upl
and
field
siz
e, li
vest
ock
size
, fa
mily
siz
e, n
umbe
r of
mon
ths
of fo
od s
ecur
ity)
and
the
boun
darie
s in
dica
te th
eir
rela
tive
impo
rtan
ce in
rea
lity.
The
wei
ght o
f the
arr
ows
sym
boliz
es t
he i
mpo
rtan
ce o
f th
e re
late
d flo
w.
The
com
pone
nts
of h
ousi
ng r
epre
sent
the
typ
e of
hou
se w
ithou
t co
nsid
erin
g th
e si
ze.
Hou
seho
ld: f
amily
siz
e; F
ood:
num
ber
of m
onth
s th
e ho
useh
old
enjo
ys fo
od s
ecur
ity in
a y
ear;
Hou
se: d
wel
ling
plac
e of
hou
seho
ld; O
ff-fa
rm: o
ff- a
nd n
on-f
arm
sou
rces
of
inco
me.
The
pro
duct
ion
activ
ity in
dica
tes
the
maj
or o
ne w
ith r
egar
ds t
o th
e av
aila
ble
reso
urce
s. T
he
arro
ws
on c
omm
unal
gra
ssla
nds
graz
ing
indi
cate
the
acc
essi
bilit
y an
d us
e of
adj
acen
t up
land
are
as t
hat
are
com
mon
ly o
wne
d. T
he
thic
knes
s an
d nu
mbe
r of
arr
ows
indi
cate
the
pre
ssur
e of
the
liv
esto
ck o
n th
e gr
azin
g gr
assl
ands
. T
he f
igur
es i
ndic
ated
in
the
com
pone
nts
repr
esen
t the
siz
e of
the
rela
ted
com
pone
nts
(ha
for
field
siz
e an
d he
ads
for
lives
tock
). I
n th
e cu
rren
t re
pres
enta
tion,
onl
y ru
min
ants
wer
e co
nsid
ered
in th
e liv
esto
ck c
ompo
nent
s.
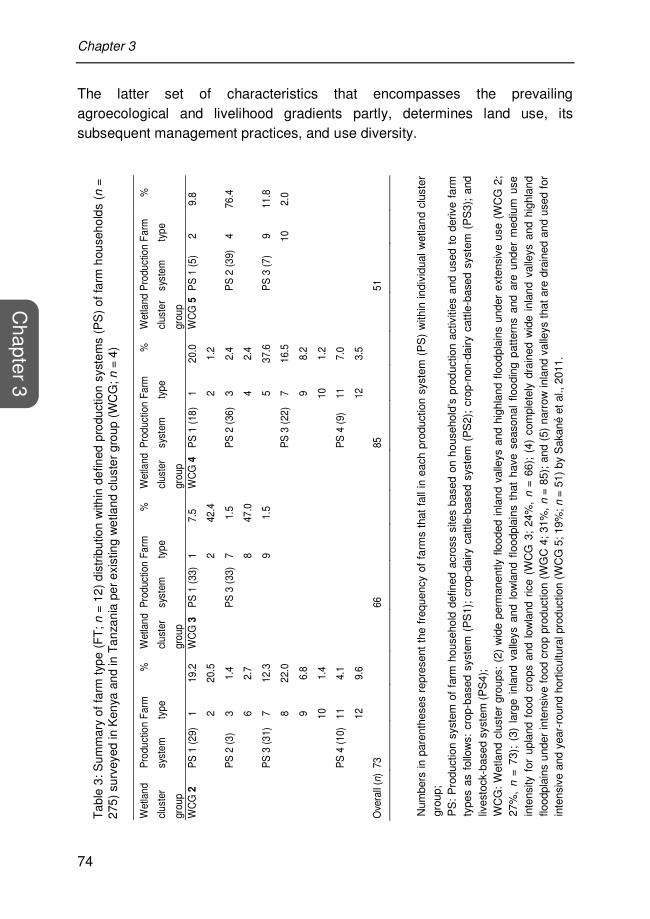
Chapter 3
74
Chapter 3
The latter set of characteristics that encompasses the prevailing agroecological and livelihood gradients partly, determines land use, its subsequent management practices, and use diversity.
Tab
le 3
: Sum
mar
y of
farm
typ
e (F
T; n
= 1
2) d
istr
ibut
ion
with
in d
efin
ed p
rodu
ctio
n sy
stem
s (P
S)
of fa
rm h
ouse
hold
s (n
=
275)
sur
veye
d in
Ken
ya a
nd in
Tan
zani
a pe
r ex
istin
g w
etla
nd c
lust
er g
roup
(W
CG
; n =
4)
Wet
land
clus
ter
grou
p
Pro
duct
ion
syst
em
Farm
type
%
Wet
land
clus
ter
grou
p
Pro
duct
ion
syst
em
Farm
type
%
Wet
land
clus
ter
grou
p
Pro
duct
ion
syst
em
Farm
type
%
Wet
land
clus
ter
grou
p
Pro
duct
ion
syst
em
Farm
type
%
WC
G 2
P
S 1
(29)
1
19
.2
WC
G 3
P
S 1
(33)
1
7.5
WC
G 4
P
S 1
(18)
1
20
.0
WC
G 5
P
S 1
(5)
2
9.8
2
20.5
2
42.4
2
1
.2
PS
2 (3
) 3
1
.4
PS
3 (3
3)
7 1
.5
PS
2 (3
6)
3
2.4
P
S 2
(39)
4
76
.4
6
2.7
8
47.0
4
2
.4
PS
3 (3
1)
7
12.3
9
1.5
5
37
.6
PS
3 (7
) 9
11
.8
8
22.0
PS
3 (2
2)
7
16.5
10
2
.0
9
6.8
9
8.2
10
1.4
10
1.2
PS
4 (1
0)
11
4.1
PS
4 (9
) 11
7
.0
12
9.6
12
3.5
Ove
rall
(n)
73
66
85
51
Num
bers
in p
aren
thes
es r
epre
sent
the
fre
quen
cy o
f fa
rms
that
fal
l in
each
pro
duct
ion
syst
em (
PS
) w
ithin
indi
vidu
al w
etla
nd c
lust
er
grou
p;
PS
: P
rodu
ctio
n sy
stem
of
farm
hou
seho
ld d
efin
ed a
cros
s si
tes
base
d on
hou
seho
ld’s
pro
duct
ion
activ
ities
and
use
d to
der
ive
farm
ty
pes
as f
ollo
ws:
cro
p-ba
sed
syst
em (
PS
1);
crop
-dai
ry c
attle
-bas
ed s
yste
m (
PS
2);
crop
-non
-dai
ry c
attle
-bas
ed s
yste
m (
PS
3);
and
lives
tock
-bas
ed s
yste
m (
PS
4);
WC
G:
Wet
land
clu
ster
gro
ups:
(2)
wid
e pe
rman
ently
flo
oded
inla
nd v
alle
ys a
nd h
ighl
and
flood
plai
ns u
nder
ext
ensi
ve u
se (
WC
G 2
; 27
%,
n =
73)
; (3
) la
rge
inla
nd v
alle
ys a
nd l
owla
nd f
lood
plai
ns t
hat
have
sea
sona
l flo
odin
g pa
ttern
s an
d ar
e un
der
med
ium
use
in
tens
ity f
or u
plan
d fo
od c
rops
and
low
land
ric
e (W
CG
3;
24%
, n =
66)
; (4
) co
mpl
etel
y dr
aine
d w
ide
inla
nd v
alle
ys a
nd h
ighl
and
flood
plai
ns u
nder
inte
nsiv
e fo
od c
rop
prod
uctio
n (W
GC
4;
31%
, n =
85)
; an
d (5
) na
rrow
inla
nd v
alle
ys t
hat
are
drai
ned
and
used
for
in
tens
ive
and
year
-rou
nd h
ortic
ultu
ral p
rodu
ctio
n (W
CG
5; 1
9%; n
= 5
1) b
y S
akan
é et
al.,
201
1.

Drivers of farm heterogeneity operating in wetland systems
75
Cha
pter
3
3.4 Determinant factors of household’s livelihood strategy and its
relation to wetland farming
Derived agrowetland households types operated in varying socio-economic environments, where wetland use depends on interplay of access rights to land, markets, and the diversity of non-wetland related activities (Figure 4). Differences in land use and production orientation and objectives were reflected in in the definition of the different farm types (Figure 4 A). These uses comprised arrow root and rice, upland food and high-value crops as well as grazing. Land acquisition differed significantly (X2 = 40.1, DF = 2; Pr < 0.001) between farm types (Figure 4 B). Differential modes in access to land affected land uses and production orientation across farm types where a greater proportion (89%; n = 77) of households purchased land for high-value and rice production. In contrast, upland food crop- and livestock-based farmers depend mostly (three-fifths) on land allocation. The distance from the homestead to the field location contributed to shaping differential land use patterns (X2 = 53.1, DF = 5; Pr < 0.001) between farm types (Figure 4 C). On average, high-value crop- and livestock-based households were located closer to their fields (≈ 14 minutes’ walk) than rice and upland-food crop farmers (≈ 25 minutes’ walk). Access to non-farm income through pension, salary, or petty trading had important implications for production orientation in the wetland (Figure 4 D). Most farmers who earned off-farm income invested their financial resources in rice and high-value crops production (62%; n = 89). Furthermore, market-oriented production in the wetland created opportunities for off-farm earnings to households of Farm Types 7, 9, and 11 that often sell their own labour locally to high-value crop farmers. Access to market affected the production orientation of different farm types (e.g. relatively good access for rice and high-value crops producers; Figure 4 E), reinforcing the importance of market access on wetland use diversity (cf. Chapter 2). Finally, land use on uplands that was used to distinguish the different farm types played a key role in wetland use (Figure 4 F), beside all other factors. Upland land use and the production orientation partly explained differences in uses and production orientation in wetland where upland landless households mainly practiced upland food crops compared to high-value crops cultivated by farmers who owned fields on uplands. The identified factors show that that the functioning of farms in the small wetlands cannot be understood without taking into account the non-wetland related activities.

Chapter 3
76
Chapter 3
0
25
50
75
100
1 2 3 4 5 6 7 8 9 10 11 12
Wetl
an
d a
gri
cu
ltu
ral u
ses
(% o
f far
ms)
Horticulture Rice Upland food crop Flood-tolerant root crop Grazing
Outliers
0
25
50
75
100
1 2 3 4 5 6 7 8 9 10 11 12
Lan
d a
cq
uis
itio
n in
wetl
an
d(%
of f
arm
s)
Purchase Rent Allocation Inheritance
0
25
50
75
100
1 2 3 4 5 6 7 8 9 10 11 12
Ho
me
ste
ad
-we
tla
nd
plo
t d
ista
nc
e(%
of f
arm
s)
Above 60 mn 31 - 60 mn 15 - 30 mn Less than 15 mn
A)
B)
C)

Drivers of farm heterogeneity operating in wetland systems
77
Cha
pter
3
0
25
50
75
100
1 2 3 4 5 6 7 8 9 10 11 12
Off
-no
n f
arm
in
co
me
(% o
f fa
rms)
Permanent non-farm Non-permanent non-farmOff-farm: selling labour None: On-farm
0
25
50
75
100
1 2 3 4 5 6 7 8 9 10 11 12
Mark
et
access
(% o
f far
ms)
High Medium Low
0
25
50
75
100
1 2 3 4 5 6 7 8 9 10 11 12
Up
lan
d u
ses
(% o
f fa
rms)
Coffee Horticulture Food crop Grazing None
Crop-dairy cattle-based
Crop-non-dairy-cattle
Livestock-based
Crop-based
D)
E)
F)
Figure 4 continued ...

Chapter 3
78
Chapter 3
Spearman correlation analysis done on wetland uses and socio-economic and production variables partly explained factors affecting livelihood activities in relation to wetland farming. In general, the diversity of existing non-wetland related livelihood activities shaped the household reliance on wetland farming. Paddy rice farming was positively correlated with: non-wetland related livelihood strategies, such as, off-farm income (r = 0.32) and upland food crop production (r = 0. 25); some production factors, including cultivated farm size (r = 0.34), wetland field size (r = 0.28), and family labour (r = 0.27); and production resource accessibility through cropping land purchase in the wetland (r = 0. 27). Such correlations partly explained the significant role played by lowland paddy rice farming on income generation for households that experience a lack of permanent off-farm opportunities and practice staple food crops on upland. Nevertheless, households must be self-sufficient on labour to cover the demands of upland and wetland farming. Moreover, land purchase indicates the importance of income generating power that farmers attached to rice production.
Wetland drainage for upland food crop cultivation was largely determined by upland landlessness (r = 0.70) and easy land access on upland for free livestock grazing (r = 0.68), illustrating the primary role of food production in wetland use by farmers who live in dry areas with land scarcity and its second role behind livestock grazing for the pastoralist communities. Horticultural crop production in wetland can be explained by land scarcity through upland per capita (r = -0.80) and market access (r = 0.41) at sites in the humid highland and midland areas where farmers can diversify into non-wetland related livelihood strategies (e.g. dairy farming (r = 0.60)). It also plays a fundamental role of income generation for farmers who reside in remote areas with limited
Figure 4: Wetland major uses and external factors affecting the different uses: (A) percentage of wetland major uses per farm type; (B, C, D, E, and F): percentage of mode
of land acquisition in wetland, walking distance from homestead to wetland-plot per four
classes: less than 15, between 15 and 30, between 30 and 60 and above 60 minutes; off-farm income; market accessibility; and major upland use per farm type respectively.
Combined dashed and dotted lines delineate the four major production systems defined
across sites (e.g. crop-, crop-dairy-, crop-non-dairy-, and livestock-based systems). Outliers represent the two farmers who use wetland for commercial farms irrigation water
abstraction.
Figure 4 continued...

Drivers of farm heterogeneity operating in wetland systems
79
Cha
pter
3
availability of off-farm opportunities (e.g. off-farm income (r = 0.77)). The partial drainage of highland inland valleys for arrow root cultivation was fundamentally related to major cash crop production on upland field (r = 0.76) and dairy cattle (r = 0.35), indicating the tertiary role of wetland farming for farmers who can diversify their livelihood through coffee and dairy farming. The correlation with land renting-in (r = 0.66) reflect the high land demand in the narrow valleys by farmers, in particular women who do not own land in the valley.
Finally, livestock grazing by pastoralist communities with large herd size of small ruminants (e.g. total small ruminants (r = 0.89)), reflecting the search for forage by pastoralists and the importance of wetland in livestock management in the semi-arid areas (e.g. wetland sub-unit group 2 in Rumuruti). The negative and strong correlation with cultivated area (r = -0.86) and with family labour (r = 0.60) emphasise the pastoral character of the livelihood of the area and the self-sufficiency of labour of pastoralists who reside in remote areas (e.g. market access (r = -0.21)).
4. Discussion and conclusions
The development of a household typology is a step forward to capture key characteristics distinguishing agrowetland households, their production systems and livelihood strategies, their land use decisions and strategies. The typology allows the linkage between household diversity and existing heterogeneous wetland systems under agricultural use. The typology helps to define and to parameterise different agent types in order to simplify diversity in land use. Decisions and strategies in farmers-based systems can easily be facilitated by typology. The typology enabled characterisation and simplification of the variability in smallholder farming activities in small wetlands in East Africa. In total, 12 different farm types were identified; key factors in the analysis were livestock, and land use outside of the wetland and production orientation (food or cash crop production). The 12 types defined are larger than often found in other typology studies that do not involve wetlands (e.g. Tittonell et al., 2005a; Zingore, 2006), reflecting the large diversity of farming activities in small wetlands.
This study provides an empirical basis to categorise smallholder wetland farms into groups, which show similar production patterns. The proposed typology and its relation to existing wetland cluster group may be used to explore the
Chapter 3
80
Chapter 3
relevance of typologies to analyse land use decisions by smallholder households (Valbuena et al., 2008). This may help to understand the nature of drivers and decision factors of smallholder households whose livelihoods are largely dependent on small wetlands. This can be further seen as one of the key requirement in the implementation of appropriate adaptation options for wetland-dependent communities.
The four contrasting research sites illustrate the variety of production systems in East Africa, whereas the formulation of a farm(er) typology based on an expert classification informed by statistical analyses helped to disaggregate the system into its main components. No single production system and the corresponding farm types fully capture neither all dimensions of wetland use nor the diversity of the smallholder livelihood strategies. The crop-based indicator primary reflects the inherent risk in single production enterprise of rural smallholder households. Ellis (1998) and Barret et al. (2001) suggest a livelihood diversification as a coping strategy that enables such households to ensure food security. Moreover, within the scope of our study, the same factor explains the entire dependence of these households on wetland for cropping; reflecting the determinants of wetland use such as land availability on adjacent upland, migrants, or the aridity of the areas. These factors have been identified as socio-economic or agroecological determinants of land use and reported in wetland studies in sub-Saharan Africa by Schuijt (2002) and in its western region by Ereinstein et al. (2006). The variation observed in the production orientation towards wetland cultivation reflects differences in off-farm income opportunities among households. In addition, crop diversity can be explained by market opportunity as high-value crops are primary produced for the market (e.g. tomato grown in Rumuruti for urban cities like Nyahururu, Nanyuki, Mombasa, or even Nairobi, Thenya, 2001). The preference for rice over high-value crops by crop-based household in sub-humid lowlands is similar to that observed by Balasubramanian et al. (2007) in Tanzania, indicating the suitability of the lowland wetland agro-ecosystem for traditional rain-fed rice production. Rice is primarily grown by households who practice subsistence farming on upland to generate cash. But it partly covers their consumption needs as observed in Mali by De Groote et al. (1998). In terms of the relation between production systems and the environment, results showed that crop-based systems concentrated more in dry areas than in the humid ones. Several factors like those on the aridity, the remoteness and its induced limited options for livelihood diversification can explain such relation. Further

Drivers of farm heterogeneity operating in wetland systems
81
Cha
pter
3
differences in proportional distributions of these production systems within studied wetlands pertain to key clustering indicators (e.g. flooding patterns, land use intensity, etc.) of these wetlands. Revealed intertwined relationships between production systems, farm types, and the wetland environment added some unique explanatory power to understanding the wetland-smallholder system. Taken together, various components and methods help to disentangle the complexity of small wetland-agriculture in Kenya and in Tanzania. Results highlight that the diversity among rural households is primarily related to livelihood strategy, which is not new but such diversity influences wetland use, exerting different pressure on these areas. The relation between farm types with the environment is determined by the agroecological gradient and production objective of household, socio-economic factors like population-growth induced land scarcity, labour availability, market and off-farm income opportunities, and government resettlement or development policies.
4.1 Developing a wetland farm(er)s typology based on an expert-based
production system classification informed by statistical analyses
The results highlight the applicability of the combined data driven and field surveyor expert knowledge-based methods in developing a farm(er) typology in the small wetland-agriculture system. The categorisation of household diversity is associated with livestock, crop production activities and their combinations and the production resources (upland, wetland, and upland-wetland). Such combinations generate four dominant production systems of rural households, reducing the variability observed in existing farming systems across sites. The expert knowledge classification rules formulated based on the system understanding that is derived from the production systems enables farms categorisation into groups that show the same production pattern (e.g. Households of Farm Type 2 that grown staple food crops on upland fields for own consumption while cultivating semi-market oriented rice in wetland fields). Such methods have been used elsewhere according to the study objectives to classify farming households (e.g. Ruthenberg, 1976; Daskalopoulou and Petrou, 2002; Valbuena et al., 2008). Moreover, such a classification provides an understanding and an encompassing categorisation of farms and farming strategies (Riveiro, 2008; Valbuena et al., 2008).
The results separate the prestige or cultural-oriented livestock-based households (i.e. Farm Type 12) from other existing systems in the study area. This supports the statement by Hobbs (1964) which defined production
Chapter 3
82
Chapter 3
structure embodies the heterogeneity of farmers’ behaviour and decisions in the context of their values, attitudes, and goal orientations. Such a production orientation overlapped with the large-scale market-oriented high-value crop production system (i. e. Farm Type 6) in our first attempt to classify the farm(er)s using formal clustering methods based on PCA suggested results on land and livestock resource endowments.
The use of production system in the farm(er) categorisation enables the consideration of rural livelihood strategy (as defined by Ellis, 1998) and household production orientations that are seen to improve farmer’s categorisation. Such considerations provide a functional typology that encompasses some aspects of structural typologies as suggested by Mettrick (1993) and Tittonell et al. (2010). This is illustrated in the functioning by Farm Types 3, 6, 5, and 9 with clearly defined livelihood strategies, whereas Farm Types 1, 2, 4, 7, 8, and 10 showed wide variation in terms of resource endowment and income strategies. Market orientation increased from single to diversified livelihood strategy and is mainly influenced by off-farm income and market opportunities, and land scarcity on upland.
Despite the lack of any conclusive results for small wetland in East Africa, the present study suggests positive correlations between household access to off-farm employment and wetland uses and between wetland production orientation and upland uses. Upland landless households are more likely to orient wetland farming towards primary food production (e.g. farm Types 1, 7, and 11) as compared to other farm types. But in instances of cash availability, upland-landless households like those of farm Types 3, and 9 choose to migrate from the population-growth induced land scarcity humid highlands to the low populated semi-arid areas where land is available and can be easily accessed in the wetland (Thenya, 2001). They temporally settle in this environment and invest in market-oriented high-value crop farming for the urban centres. They develop a high-dependence on wetland for cropping as an income enterprise portfolio diversification strategies as observed in southern Ethiopia by Wood and van Halsema (2008). The migration factor and the production objectives of migrant farmers are consistent with those of Ereinstein et al. (2006) in the lowland use in West Africa, however, their access to land differ between cases. Thus, the scarcity of the key resource endowment (land and livestock), as well as, the inability to ensure non-farm alternatives to the diminishing farm opportunities shape wetland uses. Furthermore, the conjunction of resource and income scarcity with increasing

Drivers of farm heterogeneity operating in wetland systems
83
Cha
pter
3
market opportunities through the growing food demands of urban centres (Lynch, 1999) may have implications for wetland use intensification.
The approach provides more insights on wetland farmer’s categories, their production strategies, and some factors that embody the context of their decisions than the existing structural typologies that have been so far used to capture the wetland contribution to rural livelihoods of sub-Saharan communities (e.g. Kangalawe and Liwenga, 2005; Mwakaje, 2009; Rebelo et al., 2010). Nevertheless, it was difficult to provide a clear description of household resources and assets among derived farm types except for the key classification variable on total number of livestock owned that increased from crop-based to livestock-based production systems.
The wetland field: farm size ratio (wetland dependency ratio) that is the common denominator to households clustering exercise in wetland studies (e.g. Rebelo et al., 2010) was properly quantified and differed significantly among the explanatory factors. This ratio increased with the lack of land for cropping on adjacent upland, from high, medium, to low agricultural potential of derived production systems, along agroecological and market opportunity gradients. Such differences reflect the variation in land access, the potential of the area for non-wetland related livelihood diversification, and income strategies. The observed differences are reflected in various wetland uses and use intensities, production orientations that may have a great impact on wetland management (Solomon et al., 2000). Nevertheless, the indicators confirm the significant role of wetland contribution to rural livelihood diversification that has been highlighted by previous authors in the dry parts and in the wetter highland areas of sub-Saharan Africa (e.g. Scoones, 1991; Wood and Dixon, 2001; Rebelo et al., 2010). The farming of small wetlands contributes to the improvement of food security by either increasing primary food production, or through purchase of foodstuffs with cash generated from livestock, dairy product, and / or high-value crop sale, or even income generated from casual labour on wetland related on-farm activities. These findings are consistent with those of Adekola (2007) on farming in the Limpopo wetland in the dry part of southern Africa and those by Dixon and Wood (2003) in the wetter highlands in western Ethiopia. Consequently, there is a need to provide guidelines for their future in a more sustainable way and its associated management practices or for protection by creating off-farm income strategies for rural wetland-dependent communities.

Chapter 3
84
Chapter 3
4.2 Relations between wetland environment and farm types
The present study shows farm types are associated with the agroecological gradient, and by extension to associated wetland types and to existing wetland cluster groups. The agroecological gradient in terms of agro-climatic conditions has a strong influence on agricultural production activities determining the production systems hence the corresponding farm types. The distribution of the production systems in the study environment are mainly determined by agroecological factors like the agro-climate and rainfall patterns that partly drive land uses. Crop and mixed crop non-dairy-based production systems are associated with “mixed sub-humid and semi-arid” areas, whereas livestock-based system concentrate in semi-arid zones. The mixed crop-dairy system tend to dominate the wetter parts of the study sites that are located in humid midland and highland areas. The results on the environmental association of both mixed and livestock systems are consistent with findings in eastern Africa by Staal et al. (2001) and Cecchi et al. (2010). Moreover, the integration of livestock by more than 70% of the households at the study sites supports its importance to income strategies of smallholder rural communities in the region (Sandford and Ashley, 2008). The association of livestock-based systems with the driest environment reflects the aridity, erratic rainfall, and frequent drought in the area, all factors that together make rain-fed agriculture a risky enterprise in these areas (Chilonda et al., 2010). Thus, such an association determines the suitability of the environment for large scale ranching or nomadic pastoralism, which is considered as the most important and sustainable livelihood system in semi-arid to arid areas in Africa (Reid et al., 2008).
The environmental association of either the farm type or the production system is further linked, either directly or indirectly, to population density and its subsequent land scarcity, market opportunity, the relative value of non-wetland related livelihood strategies with respect to wetland-agriculture, and the access to wetlands. Most factors constitute wetland use modifiers that have been observed elsewhere (e.g. Erenstein et al., 2006; Wood and van Halsema, 2008) and are reflected in wetland cluster groups. Crop-based production systems dominate the dry environments with low population density whereby concentrate in floodplains, supporting the use their large areas for crop production (Schuijt, 2002). Factors resulted from population modifier of wetland use, such as, land shortages and immigration are seen to accelerate wetland conversion (Oucho and Gould, 1993; Sakané et al., 2011), shaping the specific relation between farm types and wetland cluster groups. The

Drivers of farm heterogeneity operating in wetland systems
85
Cha
pter
3
agroecological gradient is reflected in wetland types whereby the rainfall patterns partly influences the occurrence of floodplain and inland valley in different landscapes (Windmeijer and Andriesse, 1993; Dixon, 2002). Wetland uses, in terms of diversity and use intensity that partly determine a household’s production system, vary with wetland type, the prevailing hydrological regime, and the physical accessibility (Rebelo et al., 2010; Sakané et al., 2011).
Moreover, the production objectives of migrant farmers in conjunction with market access are likely to increase the wetland conversion for food and production of high-value crops. This supports the capacity of large semi-arid floodplain to use diversification as suggested by (Rebelo et al., 2010) but implies the increase in land use intensity of related wetland land units like those of cluster group 2 in our study. Consequently, possible transitions between wetland cluster groups through the corresponding farm types can be expected in the future. The study suggest that such modifiers in combination with free access rights to land in the wetland will exacerbate the pressure on wetland production resources in semi-arid environments. Land use changes are being observed in such areas where floodplains are traditionally considered as back-falls grazing by the local pastoralist communities (Thenya, 2001). Moreover, migrant modifier is likely to influence the socio-cultural nature of local communities, implying changes in household’s production system where livestock herders integrate crop production in the foreseeable future. This may result in transition between farm types like those of the agro-pastoralists within the same production system. Consequently, transitions are likely to occur at different levels of aggregation with respect to the scale of interest.
A key lesson is the importance of farmers’ characteristics and the relative importance of wetland-related livelihood strategies in the relation between farm types and wetland cluster groups rather than the commonly known land use modifiers. Noteworthy is that this was observed in the wetter parts of the study sites where factors on favourable agroecological conditions, good market opportunity, and agricultural population density are met for dairy farming and crop integration (van de Steeg et al., 2010). Moreover, the population growth-induced land scarcity did result in land fragmentation, whereby the ratio of wetland field to farm size had its lowest value. Furthermore, associated wetlands to these environments were all narrow inland valleys that support either a more or a moderate intensity use of wetlands. Factor on land use

Chapter 3
86
Chapter 3
intensity did discriminate wetland land units; hence wetland cluster groups (Sakané et al., 2011). The analyses show that the scarcity of family labour, aging of household head, and cash generating power of non-wetland related strategies reduces the market orientation and thus reduces land use intensity and inland valley development. This leads to a more subsistence oriented farming in partially drained valleys practiced by households in complement to the prevailing intensive zero-grazing livestock systems.
Nevertheless, in absence of non-wetland related income strategies, combined factors on the growing food demands by urban centres (Lynch, 1999) and the potential of income generation of wetlands (Olindo, 1992) are expected to increase market orientation of wetland related production activities. This may result in increasing land use intensity of narrow valleys through several seasons of market-oriented high-value crops production. Such land use intensification contributes to livelihood diversification, hence to the food security of the young and middle age families in expansion.
In conclusion, the twelve farm types identified in the smallholder wetland-agriculture system in eastern Africa differed in endowment and access to key production (livestock, land, and labour), financial resources, access to market, and the potential to diversify. This typology of farm(er)s distinguished households that differed in wetland field: farm size ratio, hence in their dependence on wetland area for cropping land. All these factors have influence on wetland agricultural use, whereas some specific factors determine changes in land use. Moreover, the derived farm types were linked to the wetland environment (through wetland cluster groups), relating the land user to the prevailing land use factors (use type and use intensity) and biophysical characteristics of the wetland. Such associations revealed the interactions between decision-making units and their environment, which can be used to analyse and explore changes and dynamics in land use.

Chapter 4
Modelling land use decisions by smallholder agrowetland households in rural areas of East Africa
This article is to be submitted as: Sakané N., van Wijk, M.T., Langensiepen M., Becker,. M., 2011a. Modelling land use decisions by smallholder agrowetland households in rural areas of East Africa. Environmental Modelling and Software.

Chapter 4
88
Chapter 4
Abstract
Land use change in rural areas often result from the decision-making of individual farming households. Land use change is a complex process that includes actors and factors at different scales (social and spatial). Main factors that drive wetland conversion for agricultural production and those influencing its land use change in sub-Saharan Africa (SSA) have been explored in the lights of common drivers. But often the actors have not been explicitly considered in the analysis. To understand and simulate land use change as the result of individual decisions, tools and concepts that include farmer’s decision-making processes have become common approaches. This chapter describes an empirical framework that was developed to analyse land development and use processes in SSA small wetlands. By combining information on drivers of land use change, landscape classification, household typologies and estimation of land conversion, probabilistic and heuristic decision-making processes were used to represent the conceptual framework. The framework is illustrated with a case study in the sub-humid lowland floodplain in Tanzania, where land conversion, fallow, and use change processes are shaping the structure of the wetland. The scenario of increasing land scarcity on upland was simulated to explore how defined processes will respond to the increasing pressure exerted on the wetland. Results showed 10% increase in rate of land conversion, 30 - 50% decrease in fallow practices and a decline in wetland field size as more farmers become wetland-dependent. Shifts in relative distributions of farm types were simulated within and between wetland cluster groups, where all upland dependent crop-based farmers disappeared. The results show the relevance of including the individual decision-making in investigating changes in land use processes of small wetland agricultural systems. The application also shows the added value of including individual decision-making in understanding the heterogeneity and functioning of such systems. The application possibilities and limitations of the model as well as challenges to model complex interactions in land use systems are discussed.
Keywords: Land use model, Decision-making, Human-environment interactions, Kenya, Tanzania, Wetland.

Model framework
89
Cha
pter
4
1. Introduction
Sub-Saharan Africa (SSA) is endowed with diverse wetland types that include alluvial lowlands and small valley swamps, which are characterised by respective periodical and permanent flooding regimes (Roggeri 1995). Both wetland types occur in East Africa, reflecting the prevailing gradients in topography, climate, geomorphology, and hydrology (Wood and Dixon, 2002). They are mostly small in area, rarely exceeding 500 ha (van der Heyden, 2004; Rebelo et al., 2009). However, they are vital resources in many parts of the region, where livelihoods are closely linked to natural capital. Beyond the provision of ecosystem services they support crop and livestock production and hence improve food security and incomes of rural communities with access to such areas (Dugan, 1990; Silvius et al., 2000). Conversion of wetland areas for agricultural production in the wetter highland areas has increased during the last three decades (Mwita, 2010). The changes have involved the complete transformation of wetlands to multi-cropping and / or market-oriented agricultural exploitation of these areas. These changes have led in most cases to a gradual degradation of wetland resources (Wood and van Halsema, 2008).
Main factors that influence agricultural production in wetlands in the region
include natural resource dynamics, and market opportunity (Wood and van Halsema, 2008). These factors are interrelated with common drivers of land use such as population growth, biophysical constraints and subsequent increase in food demand, climatic variability, government policy and cultural norms (Sanchez et al., 1997) as well as socio-economic factors and household resource conditions (Crowley and Carter, 2000). Factors that are internal to wetland resources include carrying capacity, land availability, water availability, and soil fertility (van der Heyden and New, 2003).
Smallholder wetland agricultural systems are characterised by interactions between farmers and their biophysical environment (Parker et al., 2008). Changes in these systems are event-driven and often result from multiple interactions between socio-economic and biophysical processes (Reenberg and Paarup-Laursen, 1997). Land use decisions are complex as these are influenced by diverse (internal and external) interactive factors that include personal, socio-economic and biophysical contexts inherent to the farmer, the farming system, the institutions, and policies (e.g. Ilbery, 1978; Giller et al., 2011).
Chapter 4
90
Chapter 4
Many empirical studies have examined factors that influence wetland agricultural use in East Africa (Schuijt, 2002; Schuyt, 2005). Such studies have successfully explained the origins of wetland agriculture (Dixon and Wood, 2003), captured and categorised wetland farming households (Rebelo et al., 2010; Chapter 3), identified both common and perceived drivers of land use and changes (e.g. Solomon et al., 2000; Wood and van Halsema, 2008), and characterised the impact of such changes on wetland resources with computer models (Dixon, 2002, 2008). The decision-makers of land use (i.e. farmers) have not been explicitly considered in most of these studies. There is a need, therefore, to consider decision-making of individual farmers as an additional driver of wetland use changes (Busck, 2002; Köbrich et al., 2003).
Land use changes in rural areas can be investigated using an actor-based approach (Valbuena et al., 2008). Actor-based approaches offer the possibility to represent and link different decision-makers and their environment units (i.e. farm, field, and wetland). Individual (farmers’) decision-making, interactions, and the diversity of decision-makers can be further simplified, included, and represented. A study was therefore initiated to develop a framework for representing and simulating land use changes in small wetland agricultural systems in East Africa as a result of farmers’ decision-making. The specific objectives were to: (i) define key decision-making processes in wetland agricultural systems; (ii) identify options, decisions, and strategies farmers face in their wetland use and use change decision-making that reinforce the effects of household heterogeneity; (iii) explicitly include the diversity of farmers’ decision-making in defined processes; and (iv) represent part of the diversity of decision-making at the farm level within different wetland systems. Based on the approach by Valbuena et al. (2008), a simple decision tree model was developed to simulate agricultural land use in these systems. Accounting explicitly for the diversity of farmers’ decision-making that was characterised in Chapter 3 was deemed a necessary step in contributing to better explaining land use changes. Based on wetlands and households’ typologies, a probabilistic model was used to represent the diversity of decision-making strategies at the farm type level, whereas heuristic processes (i.e. sequential decisions following a decision tree or a rule set for selected options based on current conditions) were used to formulate decision-making mechanisms. The framework is presented and application options are illustrated with a case study in a lowland floodplain that is located in sub-humid area of Korogwe in Tanzania.
Model framework
91
Cha
pter
4
2. Materials and methods
2.1 Study area
Four study sites were selected within agroecological gradients and in varying socio-economic environments in Kenya and in Tanzania. Each site embeds a wetland with distinguished biophysical properties defined by rainfall patterns, topography, and common soil characteristics. Wetlands were humid highland and midland inland valleys that are located in Karatina (0˚27’58”S, 37˚05’57”E) and Lukozi (04˚39’15”S, 38˚15’38”E), respectively, a semi-arid highland floodplain in Rumuruti (0˚19’16”N, 36˚32’26”E) in Kenya and sub-humid lowland floodplain in Malinda (05˚04’29”S, 38˚21’28”E) in Tanzania. Next to the duration of growing period and rainfall, livelihood zone (mixed crop-dairy and -non-dairy, pastoral), population density, land tenure system, availability of or access to land for crop production, and market and off-farm employment opportunities were identified as the most discriminating factors amongst sites (Jaetzold et al. 2006; Kohler, 1987; Chapter 3).
Differences in the growing period and temperature among sites impose rigid but relatively high upper bounds on the agricultural potential of the area (Jaetzold et al., 2006). Most sites have a bimodal rainfall patterns with long rains from March to May and short rains from October to December, allowing two cropping seasons a year. Average farm sizes are small (from 0.03 to 2.0 ha) and the contribution of wetland area to these sizes range up to 93 per cent (Chapter 3). Land shortages and subsequent lack of communal grazing land characterise the humid highland and midland sites with high population density. Consequently, farm sizes and the contribution of wetland area to farm size are very small compared with those in the dry and sparsely populated environments (Chapter 3).
Land use systems in the areas are diversified and range from subsistence smallholdings to cash-crop oriented farms. Livestock systems are linked to land availability where intensive zero-grazing dairy prevails in the humid areas and free grazing in the drier sites (Pender et al., 2006). Moreover, crop and livestock integrated systems differ amongst sites and between farmers of different social status. Medium- to large-holdings livestock oriented farms dominate the land use systems in the semi-arid highland zones of Laikipia West (Jaetzold et al. 2006; Kohler, 1987; Chapter 3).

Chapter 4
92
Chapter 4
2.2 Structure of decision-making model
The model combined several concepts that are illustrated in Figure 1 A. The conceptual framework described approaches used to represent decision-making processes by households in heterogeneous wetland units. Internal and external driving factors that influence decisions of land use, changes and the dynamics of land development in the short-term were referenced against current land uses. The model is made of four key interactive entities: wetland households (i.e. ‘farm types’), wetland units (i.e. ‘wetland cluster groups’), land development (e.g. conversion and fallow), and current land uses (‘i.e. cropping
systems’). Model variables are presented in Table 1.
The structure of the model is shown in Figure 1 B. The diversity of farmer’s decisions was captured by considering the extent of land they convert and the way they use land. Land development and uses were quantified for heterogeneous households based on farm type. The relation between farmers and their environment was established via the proportional distribution of farm types among existing wetland cluster groups (WCGs). The diversity and importance of farm types within a wetland cluster group was used to elucidate the heterogeneity of household types in the wetland environment. Each wetland is a collection of specific wetland cluster groups. As illustrated in Figure 1 B, the model used the wetland as well as external biophysical and socio-economic drivers as inputs, which further determine the occurrence of certain wetland cluster groups. Land use decisions at the individual wetland scale are also influenced by internal socio-economic and biophysical states. The proportional distribution of farm types within wetland cluster groups is affected by external drivers such as land availability, market access, and environmental conditions. This setup of the model facilitated the use of existing empirical data for model parameterisation and scenario analysis.
Previous studies were conducted in the study area to derive wetland cluster groups and farm typologies that are used in this study (Chapter 2; Sakané et al., 2011; Chapter 3). Five wetlands cluster groups (WCGs) were identified: 1. Narrow permanently flooded inland valleys that are largely unused; 2. Wide permanently flooded inland valleys and highland floodplains under extensive use; 3. Large inland valleys and lowland floodplains with seasonal flooding under medium use intensity; 4. Completely drained wide inland valleys and highland floodplains under intensive food crop production; and 5. Narrow drained inland valleys under continuous horticultural production.

Model framework
93
Cha
pter
4
Figure 1: Diagram of the method. (A) schematic representation of the modelling method; and (B) conceptual framework of farmer’s decision-making: influences on land use and
changes and interactions with the wetland system (adapted from Geist and Lambin
(2002); Le (2005), Tittonell (2008), and Valbuena et al. (2010a)). The conceptual model was split in two components on land development over time and on land use decisions by
farming households.
Household
Upland per capita
Family labour Decisions
Options
Biophysical changes
Stocking rate
Flooding patterns
Livestock
Land availability
Wetland cluster group (WCG)Farm type (FT)
Internal factors Internal factors
Wetland scaleActions
(land uses)Feedback
Land use patternFeedback
Age of HH head
Field size
External factors
Land shortage
Access to land
Market access
In-migration
Development (policies)
Institutions, policies, natural variability
Off-farm income
Flooding duration
(B)
Wetland(e.g. sub-humid lowland floodplain)
Wetland cluster groups (e.g. WCG 2 )
Typ
olo
gy f
orm
ula
tio
nC
on
ce
ptu
al m
od
el
Farm types (e.g. FT 8)
Land development over time (LDT)
Current land use (CLU)
(A)
I II
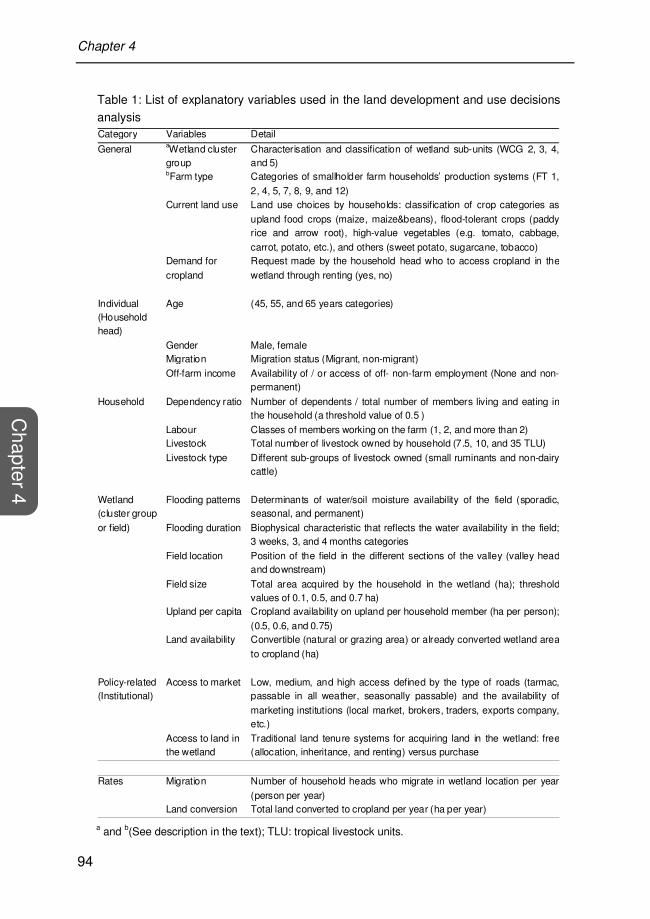
Chapter 4
94
Chapter 4
Category Variables Detail
General aWetland cluster group
Characterisation and classification of wetland sub-units (WCG 2, 3, 4, and 5)
bFarm type Categories of smallholder farm households’ production systems (FT 1,
2, 4, 5, 7, 8, 9, and 12) Current land use Land use choices by households: classification of crop categories as
upland food crops (maize, maize&beans), flood-tolerant crops (paddy rice and arrow root), high-value vegetables (e.g. tomato, cabbage,
carrot, potato, etc.), and others (sweet potato, sugarcane, tobacco) Demand for
cropland
Request made by the household head who to access cropland in the
wetland through renting (yes, no)
Individual (Household head)
Age (45, 55, and 65 years categories)
Gender Male, female Migration Migration status (Migrant, non-migrant)
Off-farm income Availability of / or access of off- non-farm employment (None and non-permanent)
Household Dependency ratio Number of dependents / total number of members living and eating in the household (a threshold value of 0.5 )
Labour Classes of members working on the farm (1, 2, and more than 2) Livestock Total number of livestock owned by household (7.5, 10, and 35 TLU)
Livestock type Different sub-groups of livestock owned (small ruminants and non-dairy cattle)
Wetland (cluster group
or field)
Flooding patterns Determinants of water/soil moisture availability of the field (sporadic, seasonal, and permanent)
Flooding duration Biophysical characteristic that reflects the water availability in the field; 3 weeks, 3, and 4 months categories
Field location Position of the field in the different sections of the valley (valley head and downstream)
Field size Total area acquired by the household in the wetland (ha); threshold values of 0.1, 0.5, and 0.7 ha)
Upland per capita Cropland availability on upland per household member (ha per person);
(0.5, 0.6, and 0.75) Land availability Convertible (natural or grazing area) or already converted wetland area
to cropland (ha)
Policy-related (Institutional)
Access to market Low, medium, and high access defined by the type of roads (tarmac, passable in all weather, seasonally passable) and the availability of
marketing institutions (local market, brokers, traders, exports company, etc.)
Access to land in the wetland
Traditional land tenure systems for acquiring land in the wetland: free (allocation, inheritance, and renting) versus purchase
Rates Migration Number of household heads who migrate in wetland location per year
(person per year) Land conversion Total land converted to cropland per year (ha per year)
Table 1: List of explanatory variables used in the land development and use decisions
analysis
a and b(See description in the text); TLU: tropical livestock units.
Model framework
95
Cha
pter
4
Land development strategies and land uses were initialized at the farm level. Four production systems were defined from which 12 farm types were distinguished (Chapter 3). Key characteristics of these production systems and farm types are summarised in Table 2. Decision trees were developed for each farm type. They determine actual agricultural land use based on key characteristics of the farm type. Rates of land conversion were calculated based on information about past land use and developments. The latter comprised two processes: (i) the conversion of wetland natural area into farming areas (i.e. cropland and grazing ground); and (ii) the land use change from cultivation to fallow / pasture. An important assumption in this typology based approach is that households with similar characteristics exhibit similar perceptions with respect to wetland agricultural use, preferences (for choice of options), and behaviour to changes of external factors.
2.3 Model quantification
The general structure of the decision-making processes is presented in Figure 2. Based on spatial analyses and field observations, dominant land uses comprised natural area (unused and covered with natural vegetation), grazing, fallow, and cropland. Processes, which were accounted for in the model include continuous scale choices such as the conversion of a certain wetland portion into cropland, or discrete decisions about crop selection, fertilisation, and irrigation. Land use decisions included claims and uses of acquired wetland areas for crop and livestock production depending on household type. Each process consists of a set of options that are characteristics for defined farm types and wetland cluster groups. Three processes of land conversion, fallow / pasture, and uses were defined to improve the understanding of wetland-agricultural system functioning. A decision-making mechanism was described for each process prior to its representation in the model. Heuristic approaches (i.e. sequential decisions following a decision tree or a rule set for selected options based on current conditions) were used to formulate the described decision-making mechanisms. Based on wetland classification and households’ typologies, a probabilistic approach was used to represent the diversity of decision-making strategies for each household category. Information gained from the representation of the decisions and actions for land conversion (Figure 2 A) and land fallow / pasture (Figure 2 B) processes were further used to estimate the rates of conversion and fallow for each farm type.
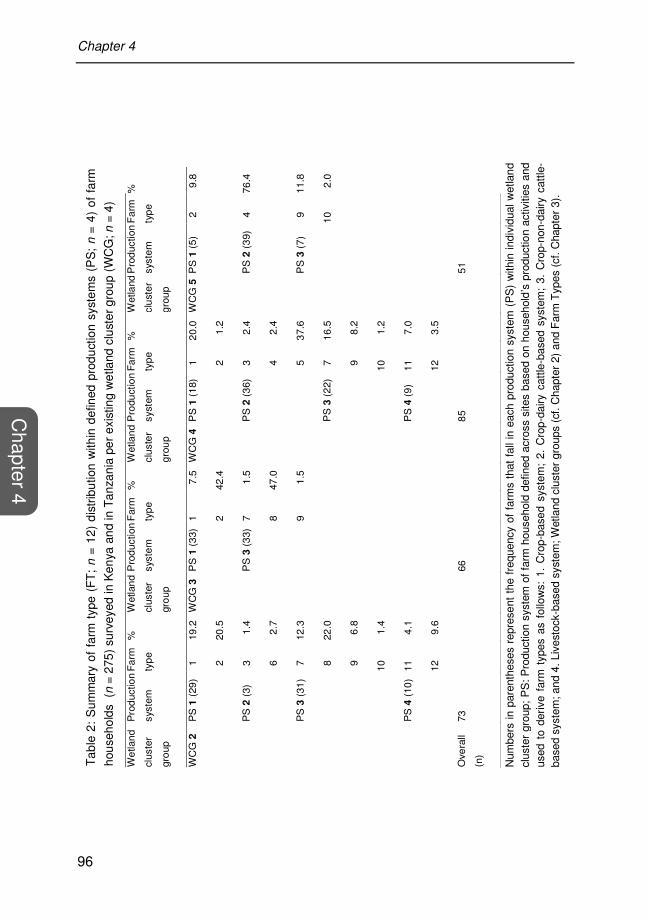
Chapter 4
96
Chapter 4
Tab
le 2
: S
umm
ary
of f
arm
typ
e (F
T;
n =
12)
dis
trib
utio
n w
ithin
def
ined
pro
duct
ion
syst
ems
(PS
; n
= 4
) of
far
m
hous
ehol
ds (
n =
275
) su
rvey
ed in
Ken
ya a
nd in
Tan
zani
a pe
r ex
istin
g w
etla
nd c
lust
er g
roup
(W
CG
; n =
4)
Num
bers
in p
aren
thes
es r
epre
sent
the
fre
quen
cy o
f fa
rms
that
fal
l in
each
pro
duct
ion
syst
em (
PS
) w
ithin
indi
vidu
al w
etla
nd
clus
ter
grou
p; P
S: P
rodu
ctio
n sy
stem
of f
arm
hou
seho
ld d
efin
ed a
cros
s si
tes
base
d on
hou
seho
ld’s
pro
duct
ion
activ
ities
and
us
ed t
o de
rive
farm
typ
es a
s fo
llow
s: 1
. C
rop-
base
d sy
stem
; 2.
Cro
p-da
iry c
attle
-bas
ed s
yste
m;
3. C
rop-
non-
dairy
cat
tle-
base
d sy
stem
; and
4. L
ives
tock
-bas
ed s
yste
m; W
etla
nd c
lust
er g
roup
s (c
f. C
hapt
er 2
) an
d F
arm
Typ
es (
cf. C
hapt
er 3
).
We
tlan
d
clus
ter
gro
up
Pro
duc
tion
syst
em
Fa
rm
typ
e
%
Wet
lan
d
clus
ter
gro
up
Pro
duc
tion
syst
em
Far
m
typ
e
%
Wet
lan
d
clu
ste
r
gro
up
Pro
duct
ion
syst
em
Fa
rm
typ
e
%
Wet
land
clu
ste
r
gro
up
Pro
duc
tion
syst
em
Fa
rm
typ
e
%
WC
G 2
P
S 1
(29
) 1
19
.2
WC
G 3
P
S 1
(3
3)
1 7
.5
WC
G 4
P
S 1
(1
8)
1
20
.0
WC
G 5
PS
1 (
5)
2
9
.8
2
20.5
2
42.4
2
1.2
PS
2 (
3)
3
1.4
P
S 3
(3
3)
7 1
.5
PS
2 (
36)
3
2.4
P
S 2
(3
9)
4
76
.4
6
2.7
8
47.0
4
2.4
PS
3 (
31)
7
12.3
9
1.5
5
3
7.6
P
S 3
(7
)
9
11.8
8
22.0
PS
3 (
22)
7
1
6.5
1
0
2.0
9
6.8
9
8
.2
10
1.4
10
1
.2
PS
4 (
10)
11
4.1
PS
4 (
9)
11
7
.0
12
9.6
12
3
.5
Ove
rall
(n)
73
66
85
51

Model framework
97
Cha
pter
4
A combination of participatory rural appraisals (focus farmer-group discussions and key informant interviews), formal methods (household surveys), field visit, and land use mapping were used for data collection. Surveys were used to: (i) gain a baseline understanding of the diversity and uses of wetland systems; (ii) capture the heterogeneity of smallholder wetland households in terms of rural livelihood strategies and contribution of wetland farming to such strategies; (iii) identify, explain, and analyse factors and decisions of households under particular production constraints; and (iv) parameterise the conceptualised decision tree model.
Prior to individual interviews and field visits, thirteen focus farmer-group discussions were carried out with wetland rural communities at each village independently to understand land use history. Histories of the agricultural uses were traced through farmer-group discussions and interviews with key informants according to Parker et al. (2002).
Land availability and accessibility in the wetland
YesNo
Do not access land in the wetland
HH has access to cropland and / or grazing land on adjacent uplands
NoYes
Decide to migrate
Acquire land in the wetland(be allocated, rent-in, purchase)
Use land for free grazing
Convert land into cropland
Choose crops to grow
Acquire land in the wetland(be allocated, inherit, rent-in, purchase)
Check land holdings per household member
Decide to expand farm
Produce food and / or generate income from crop sale
(A)

Chapter 4
98
Chapter 4
Thereafter, 275 farm households were randomly selected across four wetlands and interviewed during the dry and long rains seasons from January to July 2009. Information collected included: socio-economic and personal attributes of farming household (e.g. structure, labour, cash availability, etc.); social-ecological contexts of household decision-making (e.g. perceived drivers of wetland agricultural use and motivations of use change); and the biophysical and geographic characteristics of wetlands. Information about land use histories, cropping sequence and agronomic management practices (e.g. crop variety, cropping calendar, fallow, source and use of farm inputs, etc.) was recorded at the farm level for cultivated wetland fields. Finally, spatial data on
Figure 2: Decision and activity diagram representing the processes of land development
by households with different livelihood systems: (A) conversion of natural wetland area
into crop and livestock production sites; and (B) change in land use from cultivation to fallow / pasture.
HH main livelihood strategy
PastoralismCrop production
Increase of the stocking rate
Opt to have a private grazing ground
Experience production constraints
Change land use from cultivation to fallow / pasture
Biotic (e.g. weed invasion, incidence of pests & diseases, etc.)
Socio-economic (e.g. labour & input
scarcities)
Abiotic (e.g. flood, drought, salinity, etc.)
Crop failure and / or loss
Decide to fallow the wetland field
YesNo
Continuous cultivation
Incidence of abiotic stress
Abandon cultivation
Use field for dry season grazing
(B)
Figure 2 continued...

Model framework
99
Cha
pter
4
land use cover change were provided in form of maps for each independent wetland.
Drivers of land use decisions and motivational changes were quantified using combinations of frequency and probability distributions, regression analysis, significance test of differences, and analysis of variance. Differences in farmer’s motivations for land use, cultivation cessation, use strategy, and crop management were grouped per wetland cluster group (WCG) and farm type (FT). Differences were tested using categorical regression analysis with optimal scaling and non-parametric Kruskal-Wallis methods (Green and Salkind, 2008). For the latter method, the means were separated using post-hoc separation of means in step-down Bonferroni multi-test procedure in SAS. Socio-economic indicators of land use choices by specific farm type were derived using logistic regression analysis on previously transformed variables (Dale et al., 1993). Geographical location, wetland cluster group, farm type, and crop category were chosen as explanatory factors.
2.4 Model application: Rain-fed rice production and dry season grazing
in sub-humid lowland floodplain)
The model application is illustrated with a case study conducted in a sub-humid lowland floodplain located in Korogwe in northeastern Tanzania where land conversion processes are reshaping the wetland area. The objective was to analyse and explore to what extent land availability affects land use change.
The wetland was subdivided into two cluster groups of WCG 2 (33%; ≈ 170 ha) and WCG 3 (67%; ≈ 344 ha). Flooding patterns and soil properties differed between these groups that showed similar patterns of market access. WCG 2 was characterised by fine soils under permanent flooding conditions. Unused, fallow, and flooded rice areas were represented as land use types. In contrast, WCG 3 comprised sporadic to seasonally flooded areas on coarse soils that were used for grazing, rain-fed lowland rice, and maize crops cultivation. Based on empirical data, farming households owned one or several fields. According to the area chief who served as the key informant, grazing area was delineated and made accessible to livestock owners without any restriction. The common grazing area was located in WCG 3. Accessible portions of WCG 2 were also grazed during the dry season. Proportional distributions of farm types, flooding patterns, market opportunities, and dominant uses were

Chapter 4
100
Chapter 4
determined for each WCG separately. Flooding duration and the field size were also determined for cultivated areas of each WCG.
Application of the land use model for scenario analyses was illustrated by simulating the effects of increased upland land scarcity on land development and use. Five levels of increasing land scarcity on uplands were considered based on empirical analyses of field survey data. Rates of land conversion and changes in uses were evaluated for each level of land scarcity based on probabilistic distributions of households within and between household categories (i.e. Farm Types).
3. Results
3.1 Current land use systems
Twenty eight different crops were identified and grouped into five main crop categories (Table 3). The various crops are presented in Appendix 4.1. The average area of each category varied significantly (P < 0.001) among households, whereas the total area under cultivation did not differ among crop categories. High-value cash crops (37%) followed by rice (36%) and upland food crops (21%) dominated cultivated crops. Farmers combined or rotated different crops or even cultivated only one crop, which resulted in different cropping systems across study sites.
Although main land uses were similar across the different WCGs, the area used per household varied significantly (P < 0.001) among them (Table 4). The total used area did not vary between WCGs. The variability in crop categories was high (X2 = 115.4; DF = 4; Pr < 0.001) within WCGs. High-value crops were common to all WCGs, whereas arrow root and rice were specifically grown in certain WCGs with suitable conditions for this purpose. Livestock grazing was practiced only in floodplains and the numbers of livestock kept by individual households differed within each WCG.

Model framework
101
Cha
pter
4
3.2. Model quantification
3.2.1 Farm type distribution
Both the wetland field: farm size ratio and the relative distribution of farm types change strongly depending on the availability of upland (Figure 3). The dependency of household on land in the wetland increased with deceasing upland availability (Figure 3 A). The probability of a household belonging to the upland crop-based farm type decreased with increasing upland scarcity (Figures 3 B and C). An upland-wetland-based household is thus more likely to become wetland-crop-based, implying a shift between farm types over time. The relationships presented in this figure were used to simulate changes in relative distributions of farm types in the scenario analyses that are presented below.
Table 3: Households distribution, average acreage, and total area under each of the major crops grown in the wetland across sites (within column means with different superscripts are
different at P < 0.05)
Crop category Distribution of
households (%)
Average area per
household (ha)
Total area per crop
(ha)
Arrow root 5 0.19a 2.4 cUpland food crop 21 0.75a 41.1
Rice 36 1.41b 134.1 dHigh-value vegetable cash crop
37 0.67a 65.8
eOthers 1 0.90a,b 0.9 Significance (P value) < 0.001 ns c The category comprises maize and beans crops, which are either monocropped or intercropped and grown by households in the wetland to source for coarse grains as their staple food; d Assorted vegetable cash crops, which include brassicas (e.g. cabbage, kale, cauliflower, and broccoli), tomato, green pepper, onion, leek, lettuce, and snow peas practiced in the wetland by smallholder farmer in response to the market demand; e This includes other cash crops such as sugarcane and tobacco, which are practiced by very few farmers in the wetland; and ns: not significant.

Chapter 4
102
Chapter 4
Wet
land
cl
uste
r gr
oup
Use
H
ouse
hold
di
strib
utio
n (%
)
Ave
rage
per
ho
useh
old
Tota
l ar
ea p
er
use
(ha)
Tota
l liv
esto
ck
per
use
(TLU
)
Wet
land
cl
uste
r gr
oup
Use
H
ouse
hold
di
strib
utio
n (%
)
Ave
rage
per
ho
useh
old
Tota
l ar
ea p
er
use
(ha)
Tota
l liv
esto
ck
per
use
(TLU
) C
ultiv
ated
ar
ea (h
a) Li
vest
ock
(TLU
) C
ultiv
ated
ar
ea (h
a) Li
vest
ock
(TLU
) W
CG
2
Upl
and
food
cro
p 21
0.
6 7.
0 8
.9
7.
0 W
CG
3 U
plan
d fo
od c
rop
3
1.5
0.0
3
.0
0.
0
R
ice
44
1.8
4.6
58.9
14
7.2
R
ice
95
1.2
5.0
75
.3
318.
5
H
igh-
valu
e cr
op
25
0.8
1.5
13.6
27
.6
H
igh-
valu
e cr
op
2
2.4
13.8
2
.4
13.
8
G
razi
ng
11
0.5
34.0
3.
7 27
2.1
Sig
nific
ance
(P
va
lues)
<
0.00
1 <
0.00
1
ns
ns
WC
G 4
U
plan
d fo
od c
rop
45
0.7
7.8
27
.2
299.
7 W
CG
5 H
igh-
valu
e cr
op
100
0.5
2.4
23.0
12
4.5
H
igh-
valu
e cr
op
33
0.9
5.4
25
.2
152.
2
A
rrow
ro
ot
15
0.2
2.0
2
.1
25.
8
O
ther
1
0.9
0.0
0
.9
0
.0
G
razi
ng
6 1.
0 12
.8
5.0
6
4.0
Sig
nific
ance
(P
va
lues)
<0
.001
<0
.001
TLU
: tro
pica
l liv
esto
ck u
nit;
ns: n
ot s
igni
fican
t; a D
efin
ed fr
om th
e m
ost i
mpo
rtan
t far
min
g ac
tiviti
es c
arrie
d ou
t in
the
wet
land
acc
ordi
ng to
farm
ers’
ran
king
.
Tab
le 4
: D
omin
ant
land
use
s fo
r th
e fo
ur a
gric
ultu
ral
used
wet
land
clu
ster
gro
ups
acro
ss s
ites:
dis
trib
utio
n of
hous
ehol
ds in
eac
h ca
tego
ry,
aver
age
culti
vate
d ar
ea a
nd li
vest
ock
owne
rshi
p, t
otal
are
a an
d liv
esto
ck p
er u
se
type
for
each
gro
up
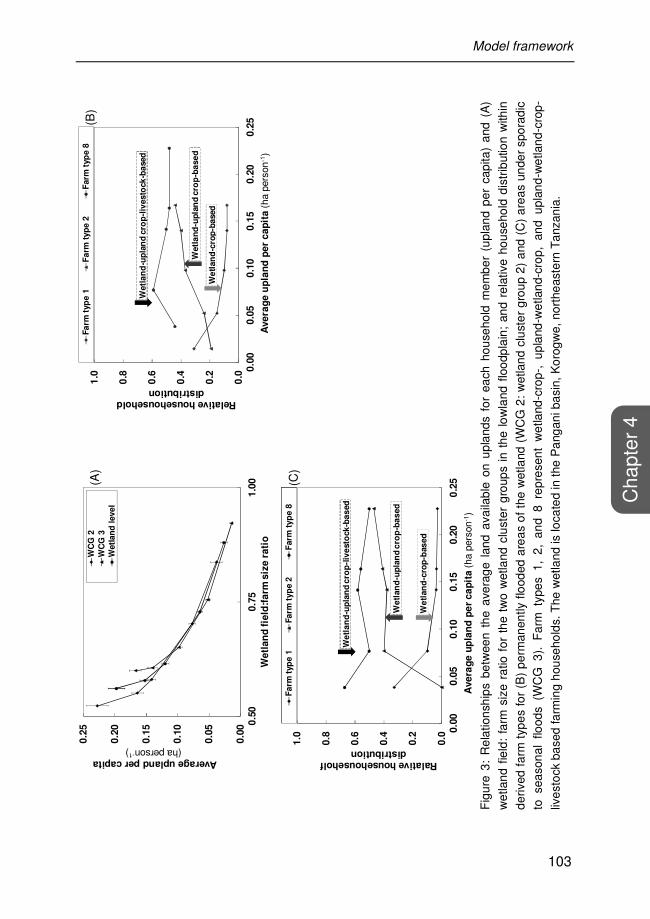
Model framework
103
Cha
pter
4
Fig
ure
3: R
elat
ions
hips
bet
wee
n th
e av
erag
e la
nd a
vaila
ble
on u
plan
ds f
or e
ach
hous
ehol
d m
embe
r (u
plan
d pe
r ca
pita
) an
d (A
)
wet
land
fie
ld:
farm
siz
e ra
tio f
or t
he t
wo
wet
land
clu
ster
gro
ups
in t
he lo
wla
nd f
lood
plai
n; a
nd r
elat
ive
hous
ehol
d di
strib
utio
n w
ithin
deriv
ed f
arm
typ
es fo
r (B
) pe
rman
ently
flo
oded
are
as o
f th
e w
etla
nd (
WC
G 2
: w
etla
nd c
lust
er g
roup
2)
and
(C)
area
s un
der
spor
adic
to
sea
sona
l flo
ods
(WC
G 3
). F
arm
typ
es 1
, 2,
and
8 r
epre
sent
wet
land
-cro
p-,
upla
nd-w
etla
nd-c
rop,
and
upl
and-
wet
land
-cro
p-
lives
tock
bas
ed fa
rmin
g ho
useh
olds
. The
wet
land
is lo
cate
d in
the
Pan
gani
bas
in, K
orog
we,
nor
thea
ster
n T
anza
nia.
0.0
0
0.0
5
0.1
0
0.1
5
0.2
0
0.2
5 0.5
00
.75
1.0
0
Average upland per capita(ha person-1)
We
tla
nd
fie
ld:f
arm
siz
e r
ati
o
WC
G 2
WC
G 3
Wetl
an
d leve
l
(A)
0.0
0.2
0.4
0.6
0.8
1.0
0.0
00
.05
0.1
00
.15
0.2
00
.25
Ralative househouseholf distribution
Ave
rag
e u
pla
nd
pe
r c
ap
ita
(ha
per
son-
1 )
Fa
rm t
yp
e 1
Fa
rm t
yp
e 2
Farm
typ
e 8
We
tla
nd
-up
lan
d c
rop
-liv
esto
ck
-ba
sed
We
tlan
d-u
pla
nd
cro
p-b
as
ed
We
tlan
d-c
rop
-bas
ed
(C)
0.0
0.2
0.4
0.6
0.8
1.0
0.0
00
.05
0.1
00
.15
0.2
00
.25
Relative househousehold distribution
Ave
rag
e u
pla
nd
pe
r c
ap
ita
(ha
pers
on-1
)
Fa
rm t
yp
e 1
Fa
rm t
yp
e 2
Farm
typ
e 8
Wetl
an
d-u
pla
nd
cro
p-l
ivesto
ck
-ba
sed
Wetl
an
d-u
pla
nd
cro
p-b
ase
d
We
tlan
d-c
rop
-based
(B)

Chapter 4
104
Chapter 4
3.2.2 Land conversion decision-making mechanism
Rates of land conversion did neither vary significantly among farm types nor wetland cluster groups (P > 0.05) across sites (Table 5 A). However, significant differences in land conversion (P < 0.05) were observed between small inland valleys with intensive high-value crops production (WCG 5) and large inland valleys and lowland floodplains under medium use intensity (WCG 3). On average, farmers in WCG 5 converted about one-half of the area than those of WCG 3 per year. Corresponding values of conversion rates reflect differences in biophysical characteristic of wetlands and socio-economic attributes. Low conversion rates were found in WCG 5 and resulted from narrow geomorphological characteristics of inland valleys and the prevailing land scarcity in the densely populated humid midland areas. Significant differences (P < 0.05) in conversion rates were also observed between farmer types. Farm types with diversified livelihoods (e.g. Farm Type 5) exhibited smaller conversion rates compared to those with less diversity (e.g. Farm Type 8). Thus, socio-ecological conditions of the wetland and livelihood strategies play a key role in land conversion by rural households.
3.2.3 Land fallow / pasture decision-making mechanism
Rates of land fallow / pasture did not neither differ significantly across wetland cluster groups nor among farm types (P > 0.05), in contrast to total fallow area that varied significantly (P < 0.001) between farm types. Furthermore, differences in access to production resources (upland vs. wetland) were reflected in the rates of land fallowing between households. Wetland-dependent farmers (i.e. FTs 1, 7, and 9) converted a third of the area into fallow compared to wetland-upland farmers (e.g. FTs 2, 5, and 8) per year (Table 5 B). At the cluster group level, average rate of fallowing inversely reflected the intensity of land use. The least disturbed wetland cluster group had the highest rate (1.5 ha year-1), whereas the most intensively used exhibited the lowest rate (0.1 ha year-1). This partly reflects the difficult physical accessibility of extensive used areas under permanent floods as compared with the completely drained wetlands.
3.2.4 Current land use decision-making mechanism
Based on the analysis of driving factors of land use a decision tree with defined land use probabilities was developed for each farm type separately.

Model framework
105
Cha
pter
4
Decision trees for the three main farm types that occur in the case study wetland are shown in Figure 4. Decision trees for the other five farm types (4, 5, 7, 9, and 12) are shown in Appendix 4.2. The probabilistic choice of a certain option for land use was estimated by using the proportional distribution of farmers of the same farm type for each wetland cluster group in general. Furthermore, the final decision-making on land use was affected by the WCG in which the farm type occurs. For example, if a farmer belongs to wetland-dependent crop-based households of Farm Type 1, the likelihood that this farmer focuses on vegetable production was higher for sandy fields located in areas with good market access (e.g. WCG 4) than for those located in remote areas (other WCGs) (Figure 4 A). In terms of choice probability, 43% of the half wetland-dependent upland-crop-based households (i.e. FT 2) would practice rain-fed rice followed by an off-season fallow under existing circumstances in WCG 3 would opt for the same cropping practice (Figure 4 B). In contrast, 70% of the half wetland-dependent upland-crop-livestock-based households would opt for the same cropping practice (Figure 4 C). Therefore, the probability to practice a single rice system in dry areas of WCG 3 is higher for crop-livestock- (0.7) than for the crop-based farm types (0.4). However, in terms of double cropping systems, the probability of a household practicing rice-rice was the highest under existing circumstances but did not differ between crop- and crop-livestock- based farm types in swampy areas of WCG 2.
The set of options that affect farmers’ decisions vary among farm types. Wetland crop-based farmers with no upland per capita (i.e. 0 ha person-1) decided whether to practice a single maize or rice-maize system depending on the position of the wetland field within a given section of the wetland. Half-wetland-dependent upland farmers would practice single rice instead of maize, or rice-rice rather than rice-maize cropping under wetter hydrological conditions. Additional internal factors substantially influenced the probability of rice double systems establishment. The more land is acquired in a wetland the more likely the chance rises that a rice system is established. Land acquisition can be estimated based on calculated rates of land development and on spatial land use cover change analyses. The probability of any options for double cropping varied with average upland availability per capita. The proportion of households practicing double cropping was higher for wetland-dependent (75%) than for other farmers (≈ 50%). The higher the wetland field: farm size ratio, the more likely a farmer would thus double his/her cropping

Chapter 4
106
Chapter 4
system. These ratios were inversely proportional to those of upland per capita. Changes in upland per capita are expected to modify the whole probability distribution within or between farm types.
Tab
le 5
: S
umm
ary
of l
and
deve
lopm
ent
over
tim
e fo
r ex
istin
g w
etla
nd c
lust
er g
roup
s (n
= 4
): (
A)
aver
age
rate
of w
etla
nd a
rea
conv
erte
d in
to c
ropl
and
betw
een
1960
s –
2009
est
imat
ed a
t far
m ty
pe le
vel (
n =
8),
and
(B
) av
erag
e ra
te o
f cro
plan
d co
nver
ted
to e
ither
fallo
w o
r pa
stur
e la
nd b
etw
een
2004
and
200
9 pe
r fa
rm ty
pe
( n =
6)
We
tla
nd
clu
ste
r
gro
up
Fa
rm
typ
e
aR
ate
of
lan
d
con
ve
rsio
n
(ha /
ye
ar)
Wetla
nd
clu
ste
r
gro
up
Fa
rm
typ
e
Ra
te o
f
lan
d
co
nve
rsio
n
(ha
/ y
ea
r)
Wetla
nd
clu
ste
r
gro
up
Fa
rm
typ
e
Ra
te o
f
lan
d
co
nvers
ion
(ha
/ y
ea
r)
We
tla
nd
clu
ste
r
gro
up
Fa
rm
typ
e
Ra
te o
f
lan
d
co
nve
rsio
n
(ha
/ y
ea
r)
WC
G 2
1
0.7
W
CG
3
1
1.5
W
CG
4
1
1
.3
WC
G 5
2
0
.3
2
1.4
2
1.2
2
0
.5
4
1
.25
7
1.4
7
1.1
4
0
.2
9
0
.3
8
1.5
8
1.7
5
0
.3
9
1.6
9
1.6
7
1
.6
1
2
0.5
9
2.4
1
2
0.6
Ove
rall
(n)
66
66
7
6
50
Ove
rall
me
ans
1
.2
1.4
1
.0
0.6
SE
D (
WC
G)
0.2
0
.1
0.3
0
.3
(A)

Model framework
107
Cha
pter
4
a Cal
cula
ted
as t
he a
vera
ge o
f w
etla
nd a
rea
conv
erte
d to
cro
plan
d or
indi
vidu
al p
astu
re b
y ho
useh
old
base
d on
tota
l lan
d ac
quire
d by
eac
h ho
useh
old
over
the
time
perio
d of
wet
land
farm
ing;
b C
alcu
late
d by
div
idin
g th
e to
tal
culti
vate
d ar
ea l
and
aban
done
d by
hou
seho
lds
per
farm
typ
e ov
er f
ive
year
s. S
ED
: Sta
ndar
d er
ror
of d
iffer
ence
s.
Wet
lan
d
clu
ster
gro
up
Fa
rm
typ
e
bR
ate
of
lan
d
cha
ng
e
(ha
/
yea
r)
Wet
lan
d
clu
ste
r
gro
up
Fa
rm
typ
e
Ra
te o
f
lan
d
cha
ng
e
(ha
/
yea
r)
Wet
lan
d
clu
ste
r
gro
up
Fa
rm
typ
e
Ra
te o
f
lan
d
cha
ng
e
(ha
/
yea
r)
We
tlan
d
clu
ste
r
gro
up
Fa
rm
typ
e
Ra
te o
f
lan
d
cha
ng
e
(ha
/
yea
r)
WC
G 2
1
0.2
W
CG
3
1
0.0
W
CG
4
1
0
.3
WC
G 5
2
0.0
2
5.0
2
0.5
2
0
.0
4
0.1
7
0.0
7
0.0
4
0
.0
9
0.0
8
0.3
8
0.8
5
1
.0
9
0.0
9
0.0
7
0
.1
1
2
0.6
9
0
.0
1
2
0.5
Ove
rall
(n)
17
2
15
1
Ove
rall
me
an
s
1
.5
0.7
0
.5
0.1
SE
D (
WC
G)
1.2
0
.2
0.2
-
(B)
Ext
ensi
on o
f Tab
le 5

Chapter 4
108
Chapter 4
FT
1:H
Hh
asn
oac
cess
tola
nd
on
the
adja
cen
tu
pla
nd
for
cro
pp
rod
uct
ion
and
do
esn
ot
ow
nli
vest
ock
WC
G 2
(37
%)
Wet
lan
d c
lust
er g
rou
p (
WC
G):
So
cio
-eco
log
ical
ch
arac
teri
stic
s an
d u
se f
acto
r
So
il te
xtu
re,
flo
od
ing
an
d d
rain
age
pat
tern
s
Per
man
entl
y fl
oo
ded
un
dra
ined
cl
ay t
o l
oam
y so
ils
(8%
)S
easo
nal
ly f
loo
ded
dra
ined
san
dy
clay
so
ils
(92%
)
Hig
h-v
alu
e cr
op
sy
stem
sT
rad
itio
nal
irr
igat
ed
rice
-bas
ed s
yste
m
(42%
)(5
8%)
WC
G 4
(49
%):
co
mp
lete
ly
dra
ined
san
dy
soil
s
Hh
ag
e > 4
5 (7
1%)
≤ 4
5 (2
9%)
Hig
h-v
alu
e cr
op
sys
tem
Up
lan
d f
oo
d
cro
p s
yste
mU
pla
nd
fo
od
& h
igh
-va
lue
cro
p r
ota
tio
n
(45%
)(5
5%)
WC
G 3
(14
%):
sea
son
ally
fl
oo
ded
san
dy
clay
so
ils
Mix
ed u
pla
nd
fo
od
&
hig
h-v
alu
e cr
op
s
Lo
wla
nd
rai
nfe
d
rice
-bas
ed s
yste
m
A)

Model framework
109
Cha
pter
4
FT 2
: H
H h
as a
cces
s to
agr
icul
tura
lly l
and
on u
plan
d fo
r st
aple
foo
d cr
op p
rodu
ctio
n, u
plan
d pe
r ca
pita
<=
0.5
ha p
er p
erso
n, a
nd d
oes
not o
wn
lives
tock
nor
hav
e pe
rman
ent
off-f
arm
inc
ome
Low
to m
oder
ate
(88%
)G
ood
(12%
)
Floo
ding
pat
tern
s an
d so
il te
xtur
e of
wet
land
clu
ster
gro
up
(WC
G)
& f
lood
ing
dura
tion
of fi
eld
Cla
y to
cla
y lo
amy
soils
und
er s
easo
nal
to
perm
anen
t flo
ods
of W
CG
2 &
> 3
mon
ths
(32%
)S
andy
cla
y so
ils u
nder
spo
radi
c to
sea
sona
l flo
ods
of W
CG
3 &
≤ 3
mon
ths
(68%
)
Acc
ess
to m
arke
t
Inte
nsiv
e hi
gh-
valu
e cr
op-b
ased
Wet
land
fie
ld s
ize
≤ 0
.5 (2
5%)
> 0.
5 (7
5%)
Wet
land
fie
ld s
ize
≤ 0
.5 (3
3%)
> 0.
5 (6
7%)
Ric
e-ri
ce a
nd r
ice-
non
rice
cro
p-ba
sed
Rai
nfed
ric
e-of
f-se
ason
okr
a-ba
sed
Com
plet
ely
drai
ned
clay
and
san
dy c
lay
loam
y so
ils (W
CG
4&
5)
Ric
e-no
n ri
ce c
rop
and
rice
-fallo
w-b
ased
R
ainf
ed r
ice-
fallo
w-
base
d
B)
Fig
ure
4 co
ntin
ued
...

Chapter 4
110
Chapter 4
FT
8:
HH
has a
ccess to
ag
ricu
ltu
rall
y l
an
d o
n u
pla
nd
fo
r sta
ple
fo
od
cro
p p
rod
ucti
on
, u
pla
nd
per
cap
ita <
= 0
.75 h
a p
er
pers
on
ow
ns l
ivesto
ck b
ut
do
es n
ot
have p
erm
an
en
t o
ff-f
arm
in
co
me
Bio
ph
ysic
al
ch
ara
cte
risti
cs o
f w
etl
an
d c
luste
r g
rou
p (
WC
G )
Cla
y t
o c
lay l
oam
so
ils u
nd
er
seaso
nal
to p
erm
an
en
t fl
oo
ds:
WC
G 2 (
34%
)
San
dy c
lay s
oil
s w
ith
sp
ora
dic
to
seaso
nal
flo
od
s:
WC
G 3
(6
6%
)
Flo
od
ing
du
rati
on
of
field
≥ 4
mo
nth
s
(70%
)<
4 m
on
ths (
30%
)
Ric
e-n
on
-ric
e
cro
p-b
ased
(27%
)
Ric
e-f
all
ow
syste
mR
ice-n
on
-ric
e
cro
p
(60%
)(4
0%
)
Ric
e-r
ice
syste
m
(37%
)
Flo
od
ing
du
rati
on
of
field
≤ 3
mo
nth
s
Ric
e-f
all
ow
(seaso
nal
gra
zin
g)
(70%
)(3
0%
)
Ric
e-f
all
ow
syste
m
(36%
)
Ric
e-n
on
-ric
e
cro
p-b
ased
C)
Fig
ure
4: L
and
use
deci
sion
dia
gram
rep
rese
ntin
g m
ain
land
use
s, f
acto
rs d
rivin
g su
ch c
hoic
es,
thre
shol
ds
and
met
hods
to
unde
rtak
e fa
rmin
g ac
tiviti
es c
arrie
d ou
t in
the
sub
-hum
id l
owla
nd f
lood
plai
n by
diff
eren
t
hous
ehol
d ty
pes.
(A
): F
arm
Typ
e 1:
wet
land
-dep
ende
nt c
rop-
base
d, (
B)
Far
m T
ype
2: h
alf-
wet
land
-dep
ende
nt
upla
nd s
ubsi
sten
ce a
nd w
etla
nd s
emi-m
arke
t-or
ient
ed c
rop-
base
d, a
nd (
C)
Far
m T
ype
8: U
plan
d fo
od c
rop-
wet
land
pa
ddy
and
non-
dairy
ca
ttle-
base
d pr
oduc
tion
syst
ems.
T
he
wet
land
is
lo
cate
d in
K
orog
we,
nort
heas
tern
Tan
zani
a an
d is
mai
nly
used
for
low
land
rai
n-fe
d pa
ddy
rice.
Fig
ure
4 co
ntin
ued
...
Model framework
111
Cha
pter
4
3.3 Land development and uses response to increasing land scarcity on
uplands
3.3.1 Changes in land development
Simulated proportional distributions of households among three different farm types, weighted average land conversion rates and average farm size per household are shown in Table 6. A comparison between the baseline and critical scenarios showed that the proportional distribution of wetland-dependent crop-based farm types increased about eight times from its original value. Half-wetland-upland-crop-based households of FT 2 were more sensitive to such increase as these were reclassified in FTs 1 and 8 (Table 6 A). An increase in land scarcity resulted also in decreased rates of land conversion. Similarly, average wetland field size per household declined in response to increases in land scarcity. A higher increase in upland scarcity resulted in a smaller decrease in land conversion for both wet and dry sections of the wetland. The rate of fallow / pasture conversion was higher and responded differently to similar increases for these WCGs. This rate was reduced by 40% from its initial value for WGC 2, implying less fallow practice in swampy areas of the wetland (Table 6 B). Similar trends in decrease were also observed for the average wetland field size per household for upland-wetland-based household categories. Fields in WCG 3 were reduced by 41% from the converted area in response to household reclassification. Swampy fields decreased by 14% before the disappearance of Farm Type 2 (Table 6 C).
3.3.2 Changes in land uses
Identified land uses varied between the baseline and critical scenarios (Figure 5). Rice-arrow-root was specifically practiced in swampy areas (WCG 2), whereas rice-grazing was found in accessible dry areas (WCG 3). In the lowland cropping system, increasing land scarcity resulted in shifts from fallow and grazing to crop production. Households of Farm Type 1 were not affected by the increase of land scarcity as they did not have access to land on uplands. However, differences were observed between wetland cluster groups. Rice-vegetable systems increased at the expense of rice-fallow and other rice-non-market-oriented crop systems in swampy areas (Figure 5 A). Furthermore, initial wetland-upland-based households became wetland-dependent of Farm Type 1. Double rice and rice-vegetable thus predominated
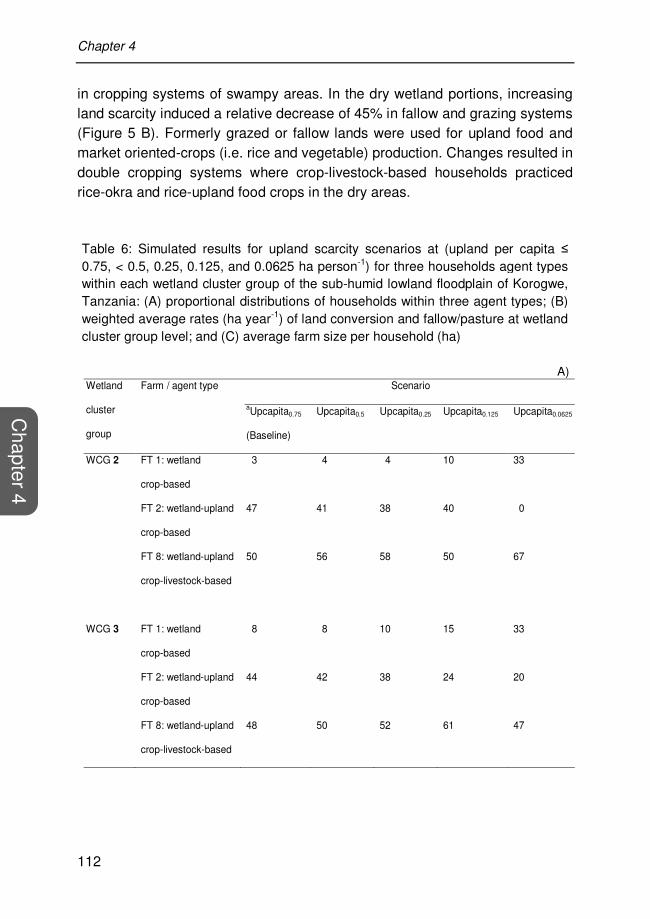
Chapter 4
112
Chapter 4
in cropping systems of swampy areas. In the dry wetland portions, increasing land scarcity induced a relative decrease of 45% in fallow and grazing systems (Figure 5 B). Formerly grazed or fallow lands were used for upland food and market oriented-crops (i.e. rice and vegetable) production. Changes resulted in double cropping systems where crop-livestock-based households practiced rice-okra and rice-upland food crops in the dry areas.
Table 6: Simulated results for upland scarcity scenarios at (upland per capita ≤ 0.75, < 0.5, 0.25, 0.125, and 0.0625 ha person-1) for three households agent types within each wetland cluster group of the sub-humid lowland floodplain of Korogwe, Tanzania: (A) proportional distributions of households within three agent types; (B) weighted average rates (ha year-1) of land conversion and fallow/pasture at wetland cluster group level; and (C) average farm size per household (ha)
Wetland
cluster
group
Farm / agent type
Scenario
aUpcapita0.75
(Baseline)
Upcapita0.5 Upcapita0.25 Upcapita0.125 Upcapita0.0625
WCG 2 FT 1: wetland
crop-based
3 4 4 10 33
FT 2: wetland-upland
crop-based
47 41 38 40 0
FT 8: wetland-upland
crop-livestock-based
50 56 58 50 67
WCG 3 FT 1: wetland
crop-based
8 8 10 15 33
FT 2: wetland-upland
crop-based
44 42 38 24 20
FT 8: wetland-upland
crop-livestock-based
48 50 52 61 47
A)

Model framework
113
Cha
pter
4
Extension of Table 6 Scenario Wetland
cluster group
Rate Wetland
cluster group
Rate
WCG 2 Conversion Fallow/pasture WCG 3 Conversion Fallow/pasture
aUpcapita0.75
(Baseline)
1.28 0.63 1.25 0.59
Upcapita0.5 1.30 0.61 1.25 0.59
Upcapita0.25 1.29 0.59 1.24 0.56
Upcapita0.125 1.24 0.57 1.23 0.50
Upcapita0.0625 1.14 0.34 1.10 0.40
B)
Subscripts are critical values of upland per capita, expressed in hectares per person for which simulations were run. Figures within columns add up to 100 for each wetland cluster group. aUpland per capita calculated as an indicator of land scarcity on uplands for each member of a certain household.
Wetland
cluster
group
Agent type Scenario
aUpcapita0.75
(Baseline)
Upcapita0.5 Upcapita0.25 Upcapita0.125 Upcapita0.0625
WCG 2 FT 1: wetland
crop-based
0.68 0.68 0.68 0.68 0.68
FT 2: wetland-upland
crop-based
1.37 1.19 1.20 1.18 0.00
FT 8: wetland-upland
crop-livestock-based
2.51 2.51 2.60 1.71 1.58
WCG 3 FT 1: wetland
crop-based
1.22 1.22 1.22 1.22 1.22
FT 2: wetland-upland
crop-based
1.15 1.05 1.11 1.49 0.68
FT 8: wetland-upland
crop-livestock-based
1.25 1.19 1.19 1.26 1.40
C)

Chapter 4
114
Chapter 4
Figure:5 Simulated probabilistic land use changes induced by increasing land scarcity via
upland per capita on upland: Comparison of land use distribution between the baseline (A) and critical (B) scenarios for three farm types. Average values of upland per capita was set at 0.75
ha person-1 for the baseline scenario and at 0.0625 ha person-1 for the critical scenario. Results
are presented separately for the permanent flooded area (A: WCG 2) and the seasonally flooded area (B: WCG 3) of Malinda lowland floodplain. Horizontal arrows indicate the
transition from the baseline scenario to the final scenario, whereas vertical arrows indicate the
shift in proportional distributions of land use within the same Farm Type.
0
25
50
75
100
Pro
port
iona
l dis
trib
utio
n of
la
nd u
se c
hang
e (%
)
Rice-vegetable Rice-upland food cropUpland food crop-vegetable Rice-grazingRice-fallow Upland food crop-fallow
Wetland crop-based: FT 1Wetland-upland crop livestock-based: FT 8
(a) (a)(b) (b)
Transition FT 1
Transition FT 8
(B)
0
25
50
75
100
Pro
port
iona
l dis
trib
utio
n of
la
nd u
se c
hang
e (%
)
Rice-vegetable Rice-upland food cropUpland food crop-vegetable Rice-grazingRice-fallow Upland food crop-fallow
Wetland crop-based: FT 1Wetland-upland crop livestock-based: FT 8
(a) (a)(b) (b)
Transition FT 1
Transition FT 8
(A)

Model framework
115
Cha
pter
4
4. Discussion
In this study we presented and applied a simple land use model to simulate agricultural land use in small wetlands in East Africa. The approach is empirically based, and thereby depends on the data available. The model application showed that the approach, through a hierarchically nested design, was able to simulate reasonable outcomes for different scenarios in semi-humid floodplain in Tanzania. The results showed the importance of using multiple approaches to understand individual decision-making and specifically, the variability of decision strategies used in the abstract and real-world contexts. We found that shifts in smallholder heterogeneity (i.e. the distribution of farm types) can produce significant changes at the landscape level in these small wetlands.
The developed model framework used simple decision trees that account for individual decision-making to characterise land use changes (Parker et al., 2002). The conceptual framework allowed a comprehensive representation of the socio-ecological human-environment systems in wetland agriculture. By combining different concepts of individual households, households’ typologies, probabilistic and heuristic decision-making approaches, and wetland classification, the hierarchical framework captured the diversity of farmer-environmental interactions. Key decision-making processes of land development and land use change were defined, improving the understanding of the functioning of the wetland agricultural systems. Factors governing such processes were reflected in model parameterisation.
The relations between driving factors and land use change, those among these factors and those related to farmers’ behavioural patterns in land uses, have been conceptualized as in land use change theory (Overmars and Verburg, 2005). However, the model did not include direct interactions between individual farms, because it is not an agent based model as such, of which these interactions are a key characteristic. This can limit the application possibilities of the model, especially to conflict situations where these interactions play an important role (Hauge and Elligsen, 1998). There is a need to consider these interactions in the future development of the land use model in order to analyse potential occurrence of conflicts in wetland systems. However, the results emphasize the added value of using a simple empirical approach to study land use change. By estimating changes in land development through this simple approach, we are able to quantitatively
Chapter 4
116
Chapter 4
predict land use change under different scenarios that can be used for policy analyses.
4.1 Land use changes and cropping systems at study site
Simulation results for the semi-humid floodplain in Tanzania suggest an increased pressure on wetlands. This pressure coupled with the current trend of land use intensification may lead to land degradation and the wetland loss (Dixon and Wood, 2003). The same scenario may also result in limitations of the wetland natural resources to support livelihoods of the smallholder agrowetland households.
Changes in land uses were reported during the last three decades (1976 - 2003), during which 87 ha of the natural wetland and 31 ha of the grazing areas have been converted for crop production (Mwita, 2010). Based on information from spatial analyses conducted in 2009, the natural wetland area was reported to be equal to 75 ha and the grazing area to 199 ha in 2003. The area of wetland converted for crop production grows over time at the expense of the natural wetland and the fallow areas. Thus a change in wetland area converted to cropland is a function of convertible land availability in the wetland (swampy areas) and already converted areas (fallow). These areas evolve in time based on the rates of conversion and land fallow / pasture by individual households. These households are represented by farmers who move into the wetland to cultivate paddy rice to source for cash and complement their food requirement (Chapter 3).
Simulation results suggest land use intensification towards double rice and rice-vegetable cropping systems. However, the predicted land use intensification can only take place if certain conditions are fulfilled. In the current situation, agricultural intensification is probably unattainable in the area due to a certain number of factors. The current rice cropping practices are deficient in agronomic inputs such as farm operations (i.e. timely and poor land preparation and weeding) and application of fertiliser and pesticides. Rice cropping is traditional, whereby land preparation and weeding are done using hand-hoe with non-use of fertiliser. Only nine per cent of the rice farmers could afford to hire a tractor for land preparation against eleven per cent who applied small amounts of manure and mineral fertiliser. Additional use of low yielding traditional varieties characterise the agronomic deficiency in the wetland (survey data 2009, Table not shown). All these factors in combination with

Model framework
117
Cha
pter
4
floods and drought occurrence and poor soil fertility limit rice production in the area (Mghase et al., 2010). In terms of production per time, a large extent of the wetland (> 400 ha) is flooded for about three months during the long rains season. The available water sustains rain-fed crop growth but does not allow off-season farming. The suggested double cropping, therefore, calls for an improved water productivity that usually opens a window for irrigation. Irrigation has great potential in increasing agricultural productivity and has often trigged the intensification of rice production in sub-Saharan Africa (Becker and Johnson, 1999, 2001). Irrigation development implies the establishment of structures to control water at the lowland level. In lowland use, water is often controlled via the establishment of surface irrigation schemes based on stream diversion or by a dam and storage reservoir (Scoones, 1991). The establishment of such schemes calls for the intervention of the government as most existing irrigation schemes were established with the help of foreign assistance (e.g. Ikegami, 1994). Past experiences from West Africa also showed that the availability of road infrastructure and proximity to markets are crucial for the intensification of lowland agriculture (Erenstein et al., 2006). Taken all together, the suggested land use intensification cannot be implemented without a raft of policies, act, and interventions at a national level.
5. Conclusions
The model is useful in describing the decision-making processes that drive agricultural use and change in small wetland systems. It linked the land users with their environment on one hand and provided insights into the key influential factors of changes in land development and uses on the other hand. The linkage was possible through the development of typologies, which separately captured the heterogeneity of the wetland agricultural and human systems. It further allowed the simplification of the diversity of individual decision-making. Increasing land shortages on uplands suggested the exacerbation of the current pressure on wetlands through increase in uplandless households, reduction of wetland field size, and intensification of current land uses. Pressure on existing natural resources in Tanzania as part of SSA is predicted to worsen with observed recent demographic changes and unfavourable global climatic and economic conditions. The implications are expected to be particularly severe for lowland wetlands that are known to have great potential for irrigation. Moreover, Tanzania launched a National Irrigation Master Plan in 2007, which targets poverty reduction and agricultural
Chapter 4
118
Chapter 4
development. The major justification for the establishment of small irrigation schemes is to improve water productivity, to increase commercialised irrigated rice production, so as to increase food security at community and household level, improve rural livelihoods and national food security. Individual land use decisions are influenced by internal and external factors. The fact that internal factors change in response to that in external ones calls for the use of scenario analysis that will probably best serve the objective of improving understanding of land use change processes and exploring pathways for the foreseeable future.

Chapter 5
Exploring the effects of endogenous and exogenous processes on the diversity of agrowetland farmer’s decision-making on land use change in rural areas of Kenya and Tanzania
This article will be submitted as: Sakané N., van Wijk, M.T., Langensiepen M., Becker,. M., 2011b. A simple decision model for simulating land development and use change in small wetland agricultural systems in East Africa. A scenario-based application for exploring the effects of farmers’ responses to exogenous and endogenous processes on current uses and future development. Environmental Modelling and Software.

Chapter 5
120
Chapter 5
Abstract
Small wetlands in East Africa increasingly become important agricultural production niches for rural households due to increasing drought conditions, demographic change and the resultant increasing land pressure, technological innovation, commercialisation and government policies. This study applies the land use decision model developed in Chapter 4 to explore how responses of scenario-driven changes in land use drivers and in policy will affect land development and use in inland valleys and floodplains. Four scenarios (business as usual, increase upland scarcity, improved market access and new irrigation schemes), and several of their possible combinations, were analysed for four contrasting wetlands in Kenya and Tanzania. Increasing upland scarcity and improved market access would lead to an increase in the dependency of livelihoods on cropland in the wetland (up to 100% for upland-wetland-crop-based production systems), a substantial decrease in livestock-based production systems in the semi-arid areas (87%). Changes could also stimulate livestock integration by crop-based farmers. Land use intensification across wetlands and specification in midland valleys could accompany such changes. Furthermore, land use displacement from traditional floodplain to rangeland grazing is an unavoidable consequence of land use intensification.
Keywords: Land use model; Decision-making; Human-environment interactions; Scenario; Simulation; Wetland.

Model application – Policy change
121
Cha
pter
5
1. Introduction
Wetlands, as part of the natural ecosystems perform various ecological and socio-economic functions, which are valued differently by different user groups with diverse interest (MEA, 2005). Their multiple uses and their role in supporting large populations are increasingly recognized (Barbier et al., 1997). Wetlands, as part of these ecosystems, have been converted for agricultural production in many parts of the world with ever more effective drainage and land amelioration measures. Wetlands increasingly become important agricultural production niches for rural households in sub-Saharan due to increasing drought conditions, natural resource dynamics, and population pressure (Wood and van Halsema, 2008). Such importance has been extended to the small inland valleys and floodplains in eastern Africa, where heterogeneous smallholder households make diverse uses of these areas (Chapter 2; Sakané et al., 2011; Chapter 3). In the region, prior researches on land use studies have often excluded the decision-maker. Thus, the diversity of decision-making is not explicitly addressed in these studies (Verburg, 2006). Therefore, previous land change research did not investigate how farmers’ responses to the exogenous processes that occur at a higher level can influence the diversity of decisions made by smallholder farmers at a local level.
Decision-making processes of individual rural farmers are not homogeneous because of the diversity of decision-makers among smallholder farming households (Le et al., 2010; Chapter 4), the heterogeneity of their farming systems (Giller et al., 2011) and that of the rural areas where they operate (Wiggins and Proctor, 2001). Access to wetlands brings a new dimension to the decision making process (Chapter 4). In an earlier study we developed a land use model by combining different concepts and methods that include wetland classification and farm typology to simulate land use decision-making of rural farmers (Chapter 3). The decision-making of the farmers in this approach is influenced by both endogenous and exogenous processes. Endogenous processes relate to socio-economic and political factors (e.g. population, rights to land access, local and regional governments) and biophysical (topography, land and water availability) conditions of a location (van den Bor et al., 1997). Exogenous processes are those occurring at a higher level (national and global), varying from global market to climate change (e.g. Lambin and Meyfroidt, 2011). Endogenous processes often determine how local communities, especially farming households, respond to

Chapter 5
122
Chapter 5
the exogenous processes by changing their decision-making (van der Bor et al., 1997).
This study applies the land use decision-model developed in Chapter 4 to explore how responses of scenario-driven changes in land use drivers and in policy will affect land development and use in inland valleys and floodplains. The study aimed to analyse and explore the effects of endogenous and exogenous processes on the diversity of heterogeneous agro-wetland farmers’ decision-making of land use and change in rural areas in East Africa. The objective was to explore how the identified key drivers of wetland uses (land scarcity on upland, improved market opportunity, and government policies on development and environment protection) will affect future land use. A modelling approach that combines typologies, probabilistic, and heuristic decision-making concepts was used to account for the heterogeneity of both human and wetland-agriculture systems and the diversity of decision-making. Farm(er) typologies link decision-makers to their environment. Scenarios (or ‘alternative futures’) are multiple possible future pathways of the system evolution under a spectrum of conditions that are hypothesized as drivers of changes (Maak, 2001). Scenarios are tools that are often used to cope with the uncertainty attached to the future dynamics of human-environmental systems. The future system dynamics include land use decisions and the developments in their influential factors (i.e. endogenous and exogenous processes) (Le et al., 2010; Alcamo et al., 2011). Scenarios were, therefore, used in the modelling processes to explore different potential changes in the endogenous and exogenous processes in four contrasting rural areas.
2. Materials and methods
2.1 Study area
The study area is located in rural Kenya and Tanzania. The study area comprised four contrasting sites in terms of agroecological conditions, landscape units, and socio-economic characteristics (Jaetzold and Schmidt, 1982; Kohler, 1987; MOA-URT, 2006). Sites were: Nyeri North in Mt. Kenya, Laikipia West in Laikipia plateau in Kenyan highlands, Lushoto district in Usambara midlands and Korogwe districts in the Pangani basin both in Tanzania (Figure 1). Agricultural potential is high for humid highland and midland and low for sub-humid lowland and semi-arid highland) of the area (Jaetzold et al., 2006).
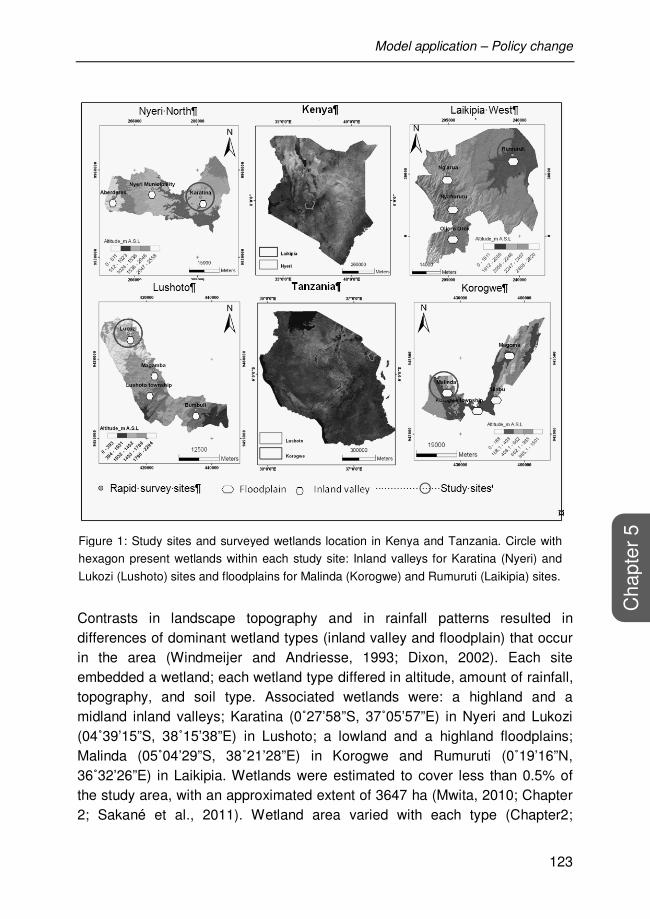
Model application – Policy change
123
Cha
pter
5
Contrasts in landscape topography and in rainfall patterns resulted in differences of dominant wetland types (inland valley and floodplain) that occur in the area (Windmeijer and Andriesse, 1993; Dixon, 2002). Each site embedded a wetland; each wetland type differed in altitude, amount of rainfall, topography, and soil type. Associated wetlands were: a highland and a midland inland valleys; Karatina (0˚27’58”S, 37˚05’57”E) in Nyeri and Lukozi (04˚39’15”S, 38˚15’38”E) in Lushoto; a lowland and a highland floodplains; Malinda (05˚04’29”S, 38˚21’28”E) in Korogwe and Rumuruti (0˚19’16”N, 36˚32’26”E) in Laikipia. Wetlands were estimated to cover less than 0.5% of the study area, with an approximated extent of 3647 ha (Mwita, 2010; Chapter 2; Sakané et al., 2011). Wetland area varied with each type (Chapter2;
Figure 1: Study sites and surveyed wetlands location in Kenya and Tanzania. Circle with
hexagon present wetlands within each study site: Inland valleys for Karatina (Nyeri) and
Lukozi (Lushoto) sites and floodplains for Malinda (Korogwe) and Rumuruti (Laikipia) sites.

Chapter 5
124
Chapter 5
Sakané et al., 2011). The size of floodplains was fivefold that of inland valleys in Tanzania and twenty-five fold that of inland valleys in Kenya.
The study sites exhibited differences in land use systems as a result of differences in population density, access to production land and markets, off-farm employment opportunities, and heterogeneity in farmers. Total available land for farming on upland and in wetland varied among sites. Farm size was generally small (average = 1.87 ha) across sites. Land shortages are characteristic of humid highland and midland sites. Wetland field size and its contribution to household cropland varied significantly (P < 0.001) among sites (Chapter 3).
2.1.1 Biophysical characteristics of wetlands under study
The two categories of wetlands differed in biophysical characteristics (i.e. geomorphology, soil types, hydrology, and dominant vegetation species). Inland valleys, which were developed on gneiss and volcanic base rock, were characterised by seasonal to permanent floods on sandy loam to clay loam Gleysols or Luvisols. Floodplains were developed on fluvial sediments or granite and mainly characterised by sporadic to seasonally flooded clayey or loamy clay Fluvisols and Vertisols. The average value of main soil fertility indicators varied between wetland types, following major biophysical gradients. Soil organic C and total N contents were greater in inland valleys with finer-textured soils and higher rainfall, whereas available P was higher in floodplain with coarse soils. In terms of vegetation, Cyperaceae and Typhaceae families dominated natural vegetation forms across wetlands. But dominant vegetation species varied between wetlands; Cyperus papyrus was associated with oligotrophic floodplains, whereas Typha capensis occurred in eutrophic inland valleys and floodplains. Further details on wetland characterisation are given in Chapter 2; Sakané et al. (2011).
2.2 Characterisation of study cases
The characterisation of the study cases is summarised in Figure 2. Study cases consisted of two inland valley and two floodplain wetland types, which were located in contrasting sites in Kenya and in Tanzania.

Model application – Policy change
125
Cha
pter
5
Su
b-h
um
id lo
wla
nd
s
We
tla
nd
clu
ste
r g
rou
ps
(W
CG
s)
•W
CG
2 (2
8%
; are
a s
ize
= 1
45
ha)
•W
CG
3 (7
2%
; are
a s
ize
= 3
69
ha)
Do
min
an
t fa
rm t
yp
es
•F
T 8
(4
8%
, n
= 4
7)•
FT
2 (
44
%,
n=
43)
•F
T 1
(
6%
, n
=
6)
Ma
in a
gri
cu
ltu
ral
use
s•
Rai
n-f
ed
low
land
rice
an
d u
pla
nd
foo
d
(ma
ize
, ca
ssa
va)
cro
ps,
off
-se
aso
n
tra
diti
on
al i
rrig
ate
d r
ice
an
d o
kra
;•
Gra
zin
g a
nd
live
sto
ck w
ate
rin
gN
on
-ag
ric
ult
ura
l u
se
s•
Dom
est
ic w
ate
r co
llect
ion
•T
ha
tch
ing
ma
teri
al (
Cyp
eru
sa
nd
T
yp
ha
spp
.);
•F
ish
ing
;•
Cla
y h
arv
est
ing
Ma
in u
se
s o
n u
pla
nd
•R
ain
-fe
d fo
od
(ma
ize
, be
ans,
an
d
cass
ava
) cr
op
s;•
Com
mu
na
l gra
zin
gL
ive
sto
ck
sy
ste
ms
•N
on-d
air
y ca
ttle
an
d sm
all
rum
ina
nts
•F
ree
gra
zin
g in
co
mm
un
al g
rass
lan
ds
on
up
lan
d a
nd
in fl
oo
dp
lain
Hu
mid
mid
lan
ds
We
tla
nd
clu
ste
r g
rou
ps (W
CG
s)
•W
CG
1 (
23%
; a
rea
siz
e =
24
ha
)•
WC
G 5
(7
7%;
are
a s
ize
= 9
1 h
a)
Do
min
an
t fa
rm t
yp
es
•F
T 4
(7
6%
, n
= 3
9)
•F
T 9
(1
2%
, n
=
6)
•F
T 2
(1
0%
, n
=
5)
Ma
in a
gri
cu
ltu
ral
us
es
•Y
ear
-ro
un
d h
igh
-val
ue
(Bra
ssic
a,
tom
ato
, a
nd
po
tato
) cr
op
pro
du
ctio
n•
Tem
po
rary
cu
t-a
nd
ca
rry
fora
ge
No
n-a
gri
cu
ltu
ral u
se
s
•T
hat
chin
g m
ate
rial
(Typ
ha
sp
p.)
•S
ettl
em
en
tsM
ain
us
es
on
up
lan
d•
Ra
in-f
ed
food
(ma
ize
, be
an
s) c
rops
;•
Lon
g ra
ins
hig
h-v
alu
e (B
rass
ica
an
d
pot
ato
) cr
op
s;•
Fo
dde
r cr
op
s (N
ap
ier
gra
ss a
nd
g
uat
em
ala
);•
Ag
rofo
rest
ry (
fru
its a
nd
tim
be
r)L
ive
sto
ck
sy
ste
ms
•D
air
y ca
ttle
(ze
ro g
razi
ng
) w
ith c
ut-
an
d ca
rry;
•F
ree
gra
zin
g o
f so
me
few
no
n-d
air
y ca
ttle
an
d s
ma
ll ru
min
ants
(sh
eep
) in
th
e f
ore
stry
Hu
mid
hig
hla
nd
s
We
tla
nd
clu
ste
r g
rou
ps
(W
CG
s)
•W
CG
1 (
17
%;
are
a s
ize
=
4.4
ha
)•
WC
G 4
(8
3%
; a
rea
siz
e =
22
ha
)D
om
ina
nt
farm
ty
pe
s•
FT
5 (
84%
, n
= 3
2)
•F
T 4
( 5
%,
n=
2
)•
FT
7 (
5%
, n
=
2)
Ma
in a
gri
cu
ltu
ral
us
es
•Y
ea
r-ro
un
d h
igh
-va
lue
(Bra
ssic
a,
fre
sh b
ea
ns,
an
d g
ree
n p
ep
pe
r) c
rop
pro
du
ctio
n;
•Y
ea
r-ro
un
d a
rro
w r
oo
t;•
Ra
in-f
ed
up
land
foo
d (m
aiz
e, b
ea
ns,
a
nd
sw
ee
t po
tato
) cr
op
;•
Te
mp
ora
ry c
ut-
an
d ca
rry
fora
ge
;N
on
-ag
ric
ultu
ral
us
es
•D
om
est
ic u
se w
ate
r co
llect
ion
;•
Ind
ust
ria
l use
wa
ter
ab
stra
ctio
n
(co
ffe
e fa
cto
ries)
;•
Ha
rve
st o
f mu
lch
ing
ma
teri
als
(C
yp
eru
ssp
p.)
Ma
in u
se
s o
n u
pla
nd
•P
ere
nn
ial c
ash
cro
p (c
offe
e)
•R
ain
-fe
d fo
od
(ma
ize
, be
an
s) c
rop
s;•
Irri
gat
ed
hig
h-v
alu
e (B
rass
ica
an
d
po
tato
) cr
ops;
•P
ere
nn
ial f
odd
er c
rop
s (N
ap
ier
gra
ss)
•A
gro
fore
stry
(fr
uits
an
d ti
mb
er)
Liv
es
toc
k s
ys
tem
s•
Da
iry
go
ats
an
d c
attl
e (
zero
gra
zin
g)
with
cu
t-a
nd
ca
rry
•G
razi
ng
in p
riva
te l
an
d
Se
mi-
ari
d h
igh
lan
ds
We
tla
nd
clu
ste
r g
rou
ps (W
CG
s)
•W
CG
2 (
67%
; a
rea
siz
e =
50
3 h
a)
•W
CG
4 (
33%
; a
rea
siz
e =
24
3 h
a)
Do
min
an
t fa
rm t
yp
es
•F
T
1 (
33%
, n
= 2
9)
•F
T
7 (
24%
, n
= 2
1)
•F
T
9 (
14%
, n
= 1
2)
•F
T 1
2 (
11%
, n
= 1
0)
•F
T 1
1 (
10%
, n
=
9)
Ma
in a
gri
cu
ltu
ral
us
es
•Y
ear
-ro
un
d h
igh
-val
ue
(Bra
ssic
a, f
resh
be
an
s,
an
d g
ree
n p
ep
pe
r) c
rop
pro
du
ctio
n;
•Y
ear
-ro
un
d a
rro
w r
oo
t;•
Ra
in-f
ed
up
lan
d fo
od
(ma
ize
& b
ea
ns)
cro
p;
•T
emp
ora
ry c
ut-
an
d c
arr
y fo
rag
e;
•Ir
riga
tion
wa
ter a
bst
ract
ion
No
n-a
gri
cu
ltu
ral u
se
s•
Do
me
stic
use
wa
ter
colle
ctio
n;
•T
hat
chin
g m
ate
rial
s (C
yp
eru
ssp
p.)
•W
ild v
eg
eta
ble
s a
nd
me
deci
na
l pla
nts
co
llect
ion
;•
Se
ttle
me
nts
;•
Wild
life
(bu
ffal
o, b
ush
bo
ck, h
yppo
po
tatm
us,
m
on
keys
, ele
ph
an
ts, e
tc.)
Ma
in u
se
s o
n u
pla
nd
•R
an
chin
g;
•A
grib
usi
nes
s fa
rm (f
ore
ign
inve
ste
d la
rge
sca
le
exp
ort
-ori
en
ted
irrig
ate
d c
ut-
flo
we
r an
d v
eg
eta
ble
fa
rms)
;•
An
nu
al u
pla
nd
fod
cro
ps
Liv
es
toc
k s
ys
tem
s•
Fre
e g
razi
ng
in c
om
mu
nal
gra
ssla
nd
s a
nd
in
we
tlan
d;
•O
cca
sio
na
l gra
zin
g in
ren
ted
ran
che
s;•
Se
aso
nal
mig
ratio
n to
mo
un
tain
ou
s a
rea
s
Inla
nd
va
lle
yF
loo
dp
lain
Fig
ure
2: C
hara
cter
isat
ion
of t
he h
uman
-wet
land
agr
icul
tura
l sy
stem
s at
the
stu
dy s
ite.
The
wet
land
sys
tem
s co
mpr
ised
tw
o m
ain
cate
gorie
s (i.
e. i
nlan
d va
lley
and
flood
plai
n) o
f w
etla
nd t
ypes
. E
ach
wet
land
typ
e is
mad
e of
a c
olle
ctio
n of
WC
Gs
(i.e.
2 t
o 5)
, w
hich
furt
her
embe
ds d
iffer
ent
Far
m T
ypes
(i.e
. 1,
2,
4, 5
, 7,
8,
9, 1
1, a
nd 1
2).
Mai
n us
es b
y th
e fa
rmer
s ar
e di
stin
guis
hed
betw
een
the
prod
uctio
n re
sour
ces
(upl
and
vs. w
etla
nd)
and
furt
her
betw
een
agric
ultu
ral a
nd n
on-a
gric
ultu
ral p
urpo
ses
for
wet
land
use
s.

Chapter 5
126
Chapter 5
2.2.1 Karatina humid highland inland valley
Karatina valley is located in the highlands (i.e. ≥ 1200m above sea level) of Central Kenya with high agroecological potential. The area is densely populated (i.e. 327-2437 persons km-2) with good market opportunities. Nevertheless, human population growth of 3% annually and inter-generation inheritance of land have resulted in farm size reduction through subdivision and land fragmentation (Pender et al., 2006). Most of the land was used by smallholders, farming small pieces of land (i.e. 1.2 ha on average; Chapter 3). Rainfall is bimodal ranging between 900 and 1500 mm year-1, allowing two cropping seasons (the long and short rains) a year. Dominant soil types include deep reddish Nitisols on uplands and blackish to brownish Gleysols in the valley. Farms are predominantly integrated crop-livestock systems. Upland fields were cultivated with cash (i.e. Coffee, Coffea robusta), upland food (i.e. maize, Zea mays and beans, Phaseolus vulgaris), and fodder (i.e. Napier grass, Pennisetum purpureum) crops. Greater than four-fifths of the valley (i.e. 24 ha) were drained for arrow root (Colocasia esculenta), upland food and high-value crops production.
2.2.2 Rumuruti semi-arid highland floodplain
Rumuruti floodplain is located in Laikipia West district, on the lee ward side of Mt. Kenya and Aberdares. The floodplain occurs on the highland (i.e. 1800 m above sea level on average) of a saucer-shaped plateau (Thenya, 2001), with good agroecological potential for ranching or nomadic pastoralism (Jaetzold and Schmidt, 1982). The area was sparsely populated (between 6 and 69 persons km-2), with poor market opportunities. The population density in the area increased in 1970s as a result of in-migration (owing to the resettlement of land-scarce crop farmers from the central highlands in the district). The resettlement was accompanied by land subdivision in the 1970s and hence land use transformation from large scale ranching to small-scale farming (Thenya, 1998). Rainfall is bimodal but characterised by high variability, with on average less than 500 mm year-1. Relatively coarse-textured Planasols are predominant in upland soil types, with more fertile Fluvisols in the floodplain. Farms are diverse with different crop - livestock systems. Crop-non-dairy systems (39%) coexist with both crop- and livestock-based systems (34 and 22%, respectively). About two-third (475 ha) of the floodplain was used for grazing, upland food and high-value crops production by upland landless
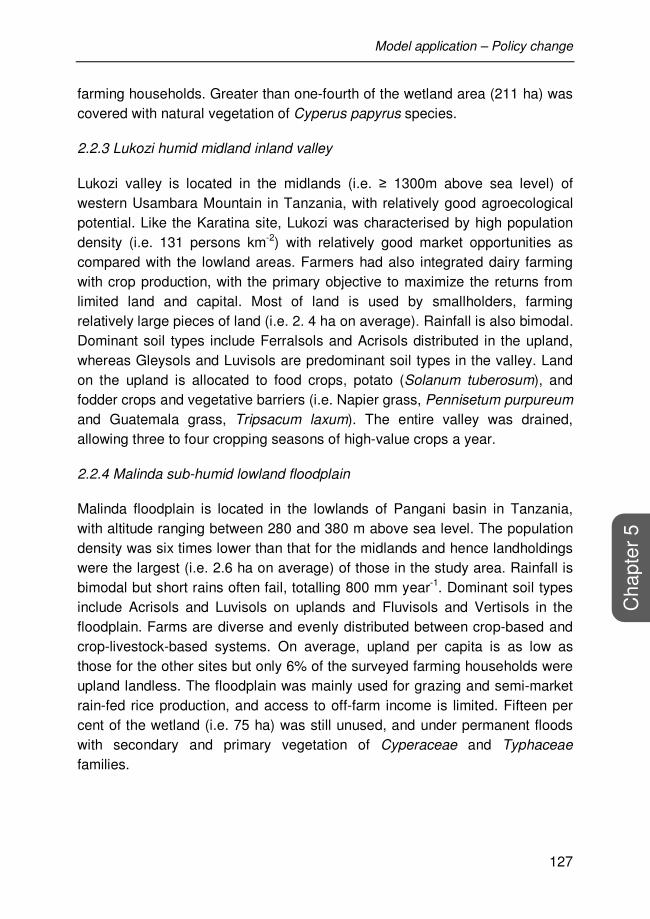
Model application – Policy change
127
Cha
pter
5
farming households. Greater than one-fourth of the wetland area (211 ha) was covered with natural vegetation of Cyperus papyrus species.
2.2.3 Lukozi humid midland inland valley
Lukozi valley is located in the midlands (i.e. ≥ 1300m above sea level) of western Usambara Mountain in Tanzania, with relatively good agroecological potential. Like the Karatina site, Lukozi was characterised by high population density (i.e. 131 persons km-2) with relatively good market opportunities as compared with the lowland areas. Farmers had also integrated dairy farming with crop production, with the primary objective to maximize the returns from limited land and capital. Most of land is used by smallholders, farming relatively large pieces of land (i.e. 2. 4 ha on average). Rainfall is also bimodal. Dominant soil types include Ferralsols and Acrisols distributed in the upland, whereas Gleysols and Luvisols are predominant soil types in the valley. Land on the upland is allocated to food crops, potato (Solanum tuberosum), and fodder crops and vegetative barriers (i.e. Napier grass, Pennisetum purpureum and Guatemala grass, Tripsacum laxum). The entire valley was drained, allowing three to four cropping seasons of high-value crops a year.
2.2.4 Malinda sub-humid lowland floodplain
Malinda floodplain is located in the lowlands of Pangani basin in Tanzania, with altitude ranging between 280 and 380 m above sea level. The population density was six times lower than that for the midlands and hence landholdings were the largest (i.e. 2.6 ha on average) of those in the study area. Rainfall is bimodal but short rains often fail, totalling 800 mm year-1. Dominant soil types include Acrisols and Luvisols on uplands and Fluvisols and Vertisols in the floodplain. Farms are diverse and evenly distributed between crop-based and crop-livestock-based systems. On average, upland per capita is as low as those for the other sites but only 6% of the surveyed farming households were upland landless. The floodplain was mainly used for grazing and semi-market rain-fed rice production, and access to off-farm income is limited. Fifteen per cent of the wetland (i.e. 75 ha) was still unused, and under permanent floods with secondary and primary vegetation of Cyperaceae and Typhaceae families.
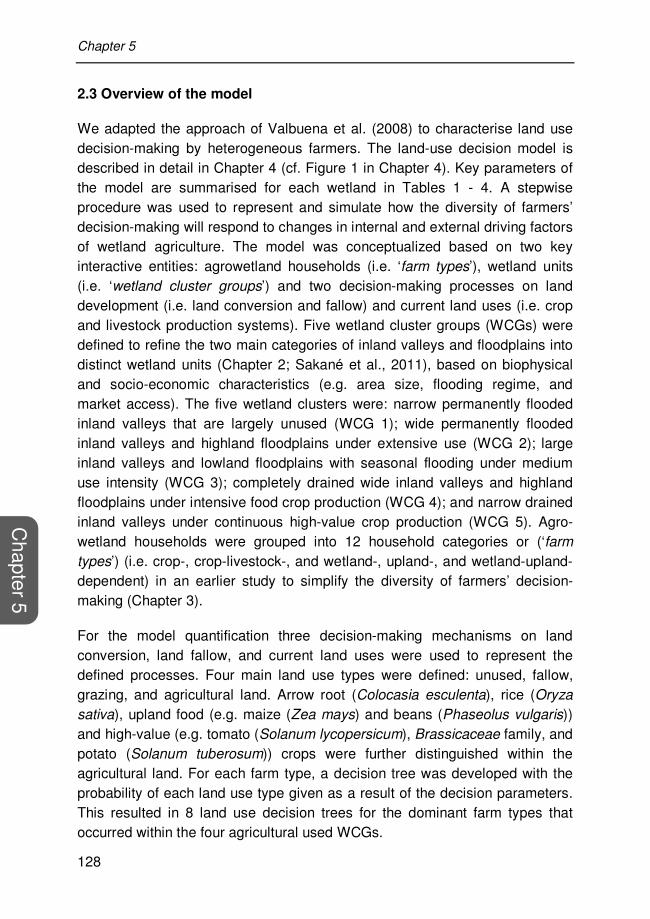
Chapter 5
128
Chapter 5
2.3 Overview of the model
We adapted the approach of Valbuena et al. (2008) to characterise land use decision-making by heterogeneous farmers. The land-use decision model is described in detail in Chapter 4 (cf. Figure 1 in Chapter 4). Key parameters of the model are summarised for each wetland in Tables 1 - 4. A stepwise procedure was used to represent and simulate how the diversity of farmers’ decision-making will respond to changes in internal and external driving factors of wetland agriculture. The model was conceptualized based on two key interactive entities: agrowetland households (i.e. ‘farm types’), wetland units (i.e. ‘wetland cluster groups’) and two decision-making processes on land development (i.e. land conversion and fallow) and current land uses (i.e. crop and livestock production systems). Five wetland cluster groups (WCGs) were defined to refine the two main categories of inland valleys and floodplains into distinct wetland units (Chapter 2; Sakané et al., 2011), based on biophysical and socio-economic characteristics (e.g. area size, flooding regime, and market access). The five wetland clusters were: narrow permanently flooded inland valleys that are largely unused (WCG 1); wide permanently flooded inland valleys and highland floodplains under extensive use (WCG 2); large inland valleys and lowland floodplains with seasonal flooding under medium use intensity (WCG 3); completely drained wide inland valleys and highland floodplains under intensive food crop production (WCG 4); and narrow drained inland valleys under continuous high-value crop production (WCG 5). Agro-wetland households were grouped into 12 household categories or (‘farm
types’) (i.e. crop-, crop-livestock-, and wetland-, upland-, and wetland-upland-dependent) in an earlier study to simplify the diversity of farmers’ decision-making (Chapter 3).
For the model quantification three decision-making mechanisms on land conversion, land fallow, and current land uses were used to represent the defined processes. Four main land use types were defined: unused, fallow, grazing, and agricultural land. Arrow root (Colocasia esculenta), rice (Oryza
sativa), upland food (e.g. maize (Zea mays) and beans (Phaseolus vulgaris)) and high-value (e.g. tomato (Solanum lycopersicum), Brassicaceae family, and potato (Solanum tuberosum)) crops were further distinguished within the agricultural land. For each farm type, a decision tree was developed with the probability of each land use type given as a result of the decision parameters. This resulted in 8 land use decision trees for the dominant farm types that occurred within the four agricultural used WCGs.

Model application – Policy change
129
Cha
pter
5
Tab
le 1
: Typ
olog
ies
for
wet
land
cla
ssifi
catio
n an
d ho
useh
old
cate
goris
atio
n fo
r K
arat
ina
hum
id h
ighl
and
inla
nd v
alle
y in
Nye
ri, C
entr
al
Ken
ya (
Cha
pter
s 2,
3, a
nd 4
)
WC
G 4
: com
plet
ely
drai
ned
wid
e in
land
val
leys
and
hig
hlan
ds fl
oodp
lain
s un
der
inte
nsiv
e fo
od c
rop
prod
uctio
n;
SE
D: S
tarn
dard
err
or o
f diff
eren
ces.
Site
/ W
etla
nd
Wet
land
ty
pe
Wet
land
clu
ster
gr
oup
Farm
ty
pe
Dist
ribut
ion
of
hous
ehol
ds (%
)
Land
and
labo
ur, p
er fa
rm
Live
stoc
k ow
ned
(TLU
)
Rate
of c
hang
e
(ha
year
-1)
Farm
size
(h
a)
Wet
land
fie
ld
size
(h
a)
Wet
land
fie
ld:fa
rm
size
ratio
Upla
nd p
er
capi
ta
(ha
pers
on-1
)
Labo
ur
Dai
ry
cattl
e N
on-
dairy
ca
ttle
Smal
l ru
mi-
nant
s
Conv
er-
sion
Fallo
w
Nye
ri:
Hum
id
high
land
K
arat
ina
Inla
nd
valle
y W
CG 4
4
5
0.57
0.
08
0.15
0.
12
1.0
1.2
0.0
0.05
0.
17
0.0
5
84
1.20
0.
25
0.16
0.
26
1.0
1.6
0.0
0.07
0.
35
1.0
7
5
0.68
0.
09
0.13
0.
14
1.0
0.0
0.0
0.3
0.17
0.
0
Ove
rall
mea
ns
1.02
0.
22
0.18
0.
24
1.0
1.43
0.
0 0.
07
0.16
0.
20
SE
D (
Far
m T
ype)
0.
14
0.06
0.
02
0.03
0.
08
0.13
0.
00
0.02
0.
06
0.20
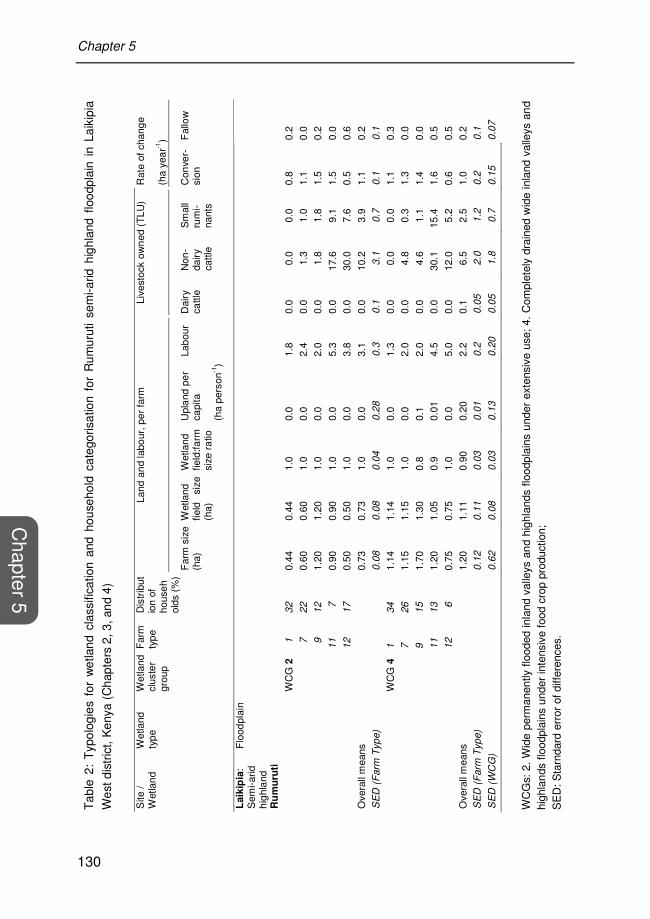
Chapter 5
130
Chapter 5
Tab
le 2
: T
ypol
ogie
s fo
r w
etla
nd c
lass
ifica
tion
and
hous
ehol
d ca
tego
risat
ion
for
Rum
urut
i se
mi-a
rid h
ighl
and
flood
plai
n in
Lai
kipi
a
Wes
t dis
tric
t, K
enya
(C
hapt
ers
2, 3
, and
4)
WC
Gs:
2.
Wid
e pe
rman
ently
flo
oded
inla
nd v
alle
ys a
nd h
ighl
ands
flo
odpl
ains
und
er e
xten
sive
use
; 4.
Com
plet
ely
drai
ned
wid
e in
land
val
leys
an
d hi
ghla
nds
flood
plai
ns u
nder
inte
nsiv
e fo
od c
rop
prod
uctio
n;
SE
D: S
tarn
dard
err
or o
f diff
eren
ces.
Site
/ W
etla
nd
Wet
land
ty
pe
Wet
land
cl
uste
r gr
oup
Far
m
type
D
istr
ibut
ion
of
hous
ehol
ds (
%)
Land
and
labo
ur, p
er fa
rm
Live
stoc
k ow
ned
(TLU
)
Rat
e of
cha
nge
(ha
year
-1)
Far
m s
ize
(ha)
W
etla
nd
field
si
ze
(ha)
Wet
land
fie
ld:fa
rm
size
rat
io
Upl
and
per
capi
ta
(ha
pers
on-1
)
Labo
ur
Dai
ry
cattl
e N
on-
dairy
ca
ttle
Sm
all
rum
i-na
nts
Con
ver-
sion
F
allo
w
Laik
ipia
: S
emi-a
rid
high
land
R
um
uru
ti
Flo
odpl
ain
WC
G 2
1
32
0.44
0.
44
1.0
0.0
1.8
0.0
0.0
0
.0
0.8
0.2
7
22
0.60
0.
60
1.0
0.0
2.4
0.0
1.3
1
.0
1.1
0.0
9
12
1.20
1.
20
1.0
0.0
2.0
0.0
1.8
1
.8
1.5
0.2
11
7
0.90
0.
90
1.0
0.0
5.3
0.0
17.6
9
.1
1.5
0.0
12
17
0.50
0.
50
1.0
0.0
3.8
0.0
30.0
7
.6
0.5
0.6
Ove
rall
mea
ns
0.73
0.
73
1.0
0.0
3.1
0.0
10.2
3
.9
1.1
0.2
SE
D (
Farm
Typ
e)
0.0
8
0.0
8
0.0
4
0.2
8
0.3
0.1
3.1
0.7
0.1
0
.1
WC
G 4
1
34
1.14
1.
14
1.0
0.0
1.3
0.0
0.0
0
.0
1.1
0.3
7
26
1.15
1.
15
1.0
0.0
2.0
0.0
4.8
0
.3
1.3
0.0
9
15
1.70
1.
30
0.8
0.1
2.0
0.0
4.6
1
.1
1.4
0.0
11
13
1.20
1.
05
0.9
0.01
4.
5 0.
0 30
.1
15.4
1.
6 0.
5
12
6
0.75
0.
75
1.0
0.0
5.0
0.0
12.0
5
.2
0.6
0.5
Ove
rall
mea
ns
1.20
1.
11
0.90
0.
20
2.2
0.1
6.5
2
.5
1.0
0.2
SE
D (
Farm
Typ
e)
0.1
2
0.1
1
0.0
3
0.0
1
0.2
0.0
5
2.0
1.2
0.2
0
.1
SE
D (
WC
G)
0.6
2
0.0
8
0.0
3
0.1
3
0.2
0
0.0
5
1.8
0.7
0.1
5
0.0
7
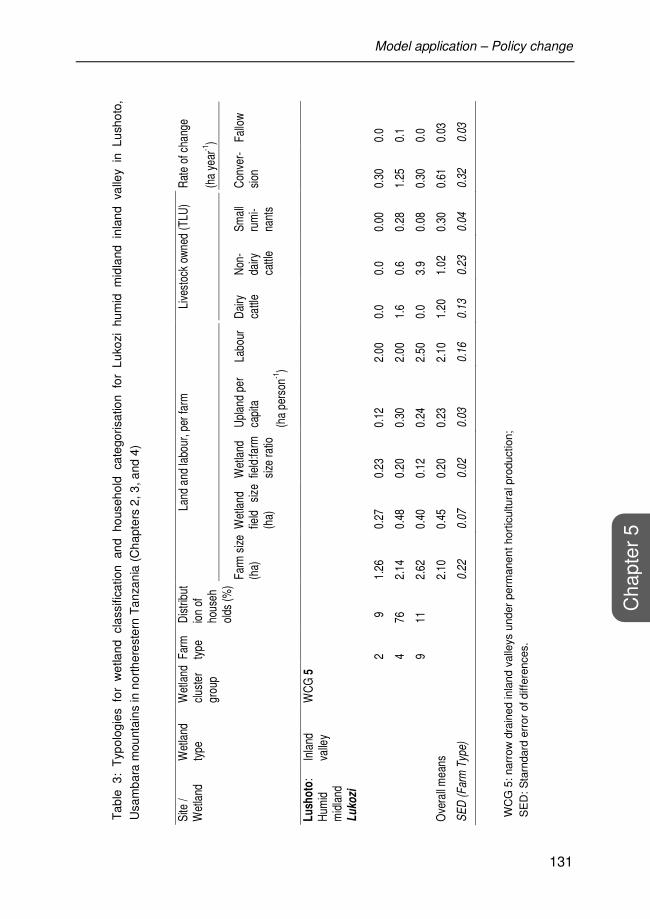
Model application – Policy change
131
Cha
pter
5
Tab
le 3
: T
ypol
ogie
s fo
r w
etla
nd c
lass
ifica
tion
and
hous
ehol
d ca
tego
risat
ion
for
Luko
zi h
umid
mid
land
inl
and
valle
y in
Lus
hoto
,
Usa
mba
ra m
ount
ains
in n
orth
eres
tern
Tan
zani
a (C
hapt
ers
2, 3
, and
4)
WC
G 5
: nar
row
dra
ined
inla
nd v
alle
ys u
nder
per
man
ent h
ortic
ultu
ral p
rodu
ctio
n;
SE
D: S
tarn
dard
err
or o
f diff
eren
ces.
Site
/ W
etla
nd
Wet
land
ty
pe
Wet
land
cl
uste
r gr
oup
Farm
ty
pe
Dis
tribu
tio
n of
ho
useh
olds
(%)
Land
and
labo
ur, p
er fa
rm
Live
stoc
k ow
ned
(TLU
)
Rat
e of
cha
nge
(ha
year
-1)
Farm
size
(h
a)
Wet
land
fie
ld
size
(h
a)
Wet
land
fie
ld:fa
rm
size
ratio
Upl
and
per
capi
ta
(ha
pers
on-1
)
Labo
ur
Dai
ry
cattl
e N
on-
dairy
ca
ttle
Smal
l ru
mi-
nant
s
Con
ver-
sion
Fa
llow
Lu
sho
to:
Hum
id
mid
land
L
uko
zi
Inla
nd
valle
y W
CG
5
2
9
1.26
0.
27
0.23
0.
12
2.00
0.
0 0.
0 0.
00
0.30
0.
0
4
76
2.14
0.
48
0.20
0.
30
2.00
1.
6 0.
6 0.
28
1.25
0.
1
9
11
2.62
0.
40
0.12
0.
24
2.50
0.
0 3.
9 0.
08
0.30
0.
0
Ove
rall
mea
ns
2.10
0.
45
0.20
0.
23
2.10
1.
20
1.02
0.
30
0.61
0.
03
SE
D (
Far
m T
ype)
0.
22
0.07
0.
02
0.03
0.
16
0.13
0.
23
0.04
0.
32
0.03

Chapter 5
132
Chapter 5
Tab
le 4
: T
ypol
ogie
s fo
r w
etla
nd c
lass
ifica
tion
and
hous
ehol
d ca
tego
risat
ion
for
Mal
inda
sub
-hum
id f
lood
plai
n in
Kor
ogw
e di
stric
t,
Pan
gani
bas
in in
nor
thea
ster
n T
anza
nia
(Cha
pter
s 2,
3, a
nd 4
)
WC
Gs:
2.
Wid
e pe
rman
ently
flo
oded
inla
nd v
alle
ys a
nd h
ighl
ands
flo
odpl
ains
und
er e
xten
sive
use
; 3.
Lar
ge in
land
val
leys
and
low
land
flo
odpl
ains
w
ith s
easo
nal f
lood
ing
unde
r m
ediu
m u
se in
tens
ity;
SE
D: S
tarn
dard
err
or o
f diff
eren
ces.
Site
/ W
etla
nd
Wet
land
ty
pe
Wet
land
cl
uste
r gr
oup
Far
m
type
D
istr
ibut
ion
of
hous
ehol
ds (
%)
Land
and
labo
ur, p
er fa
rm
Live
stoc
k ow
ned
(TLU
)
Rat
e of
cha
nge
(ha
year
-1)
Far
m s
ize
(ha)
W
etla
nd
field
si
ze
(ha)
Wet
land
fie
ld:fa
rm
size
rat
io
Upl
and
per
capi
ta
(ha
pers
on-1
)
Labo
ur
Dai
ry
cattl
e N
on-
dairy
ca
ttle
Sm
all
rum
i-na
nts
Con
ver-
sion
F
allo
w
Ko
rog
we
: S
ub-h
umid
lo
wla
nd
Ma
lin
da
Flo
odpl
ain
WC
G 2
1
3
0.
68
0.68
1.
00
0.00
3.
0 0.0
0.
0 0.
0 0.
6 0.
0
2
47
1.
37
1.31
0.
47
0.37
2.
8 0.0
0.
0 0.
0 1.
2 0.
8
8
50
2.
57
2.41
0.
51
0.19
3.
6 0.0
8.
3 0.
9 1.
4 0.
5
2.
00
1.84
0.
51
0.26
3.
2 0.0
4.
2 0.
5 1.
1 0.
3
0
.41
0
.55
0.0
4
0.0
4
0.4
0.0
1.1
0
.2
0.2
0
.1
WC
G 3
1
8
1.
22
1.22
1.
0 0.
0 1.
4 0.0
0.
0 0.
0 1.
5 0.
0
2
42
1.
67
1.15
0.
53
0.22
2.
5 0.0
0.
0 0.
0 1.
2 0.
5
8
47
1.
95
1.25
0.
60
0.14
3.
5 0.0
9.
4 0.
8 1.
7 0.
7
Ove
rall
mea
ns
1.72
1.
22
0.60
0.
17
3.0
0.0
4.
6 0.
4 1.
4 0.
3
SE
D (
Farm
Type
) 0
.12
0
.10
0.0
3
0.0
1
0.3
0.0
1.1
0
.1
0.1
0
.2
SE
D (
WC
G)
0.1
5
0.2
0
0.0
3
0.0
2
0.2
4
0.0
0.8
0
.1
0.3
2
0.0
3

Model application – Policy change
133
Cha
pter
5
Specific rates of land development and land use distribution patterns were quantified using empirical data. The consequences of changes on the occurrence of WCGs and the related farm types can be simulated based on these rates. An important relationship between the distribution of farm types and the level of dependency of their associated livelihoods on the wetland was shown in Chapter 4. Differences in upland availability resulted in shifts in different household types. These relationships (see Appendix 5.1) were incorporated in the model and used to simulate changes in the relative distributions of household types in the upland scenario analyses (see below) for three study cases, with the exception for the highland floodplain that already exhibited very high dependency on the wetland.
2.4 Scenario description
Scenarios were formulated bearing in mind the global changes and issues on food production and population growth (e.g. Angelsen, 2010; Godfray et al., 2010b), globalisation and land scarcity (e.g. Lambin and Meyfroidt, 2011), impacts of climate change in semi-arid areas (MEA, 2005), liberalisation of markets (including land) and the rapid increase in foreign direct investment in the agricultural sector (Zoomers, 2010). The global changes and issues will lead to an accelerating expansion of agricultural land at the expense of natural ecosystems, including marginal lands. Such changes will result in detrimental environmental impacts (Foley et al., 2005; MEA, 2005), asserting the need for sound policies and innovation to reconcile ecosystems conservation with food production. Four scenarios were developed and analysed for each of the four wetlands. These scenarios were based on land use drivers, current uses and farmers’ livelihood strategies, the production constraints that experience farmers, and the effects of land use on wetland ecosystems (Figure 3). At a farm type level, variables were related to available cropland and the extent of area converted for cultivation (e.g. upland per capita and wetland field: farm size ratio). Variables for WCGs and wetland were more related to the biophysical characteristics (available land, carrying capacity, and flooding patterns) and socio-economic conditions of their environment (i.e. market access).

Chapter 5
134
Chapter 5
C
urr
en
tu
se
sR
ela
ted
ru
ral live
lih
oo
d
str
ate
gie
s
Ch
an
ges
in la
nd
-us
e
•E
xpan
sion
of c
ropl
and
at th
e ex
pen
se o
f na
tura
l veg
etat
ion
thro
ugh
drai
nage
and
cu
ltiva
tion
in w
etla
nd;
•C
han
ge in
spa
tial d
istri
butio
n (c
onve
rsio
n of
w
hole
wet
land
are
a fo
r ag
ricul
tura
l pro
duct
ion)
;
•La
nd u
se e
xpan
sion
from
sca
ttere
d to
mas
sive
cu
ltiva
tion;
•A
rtifi
cial
exp
ansi
on o
f wet
land
are
a th
roug
h cu
tting
-bac
k of
the
edge
s;
•La
nd u
se in
ten
sific
atio
n fr
om
ext
ensi
ve u
se o
f gr
azin
g an
d s
ubs
iste
nce
farm
ing
tow
ard
m
arke
t-or
ient
ed h
igh
-val
ue
crop
farm
ing
(cro
ppin
g fr
eque
ncy,
use
of f
arm
inpu
ts);
•A
gri-
busi
ness
farm
dev
elop
men
t on
adja
cent
up
land
s (f
orei
gn in
vest
ed la
rge
sca
le e
xpor
t-or
ient
ed ir
riga
ted
cut-f
low
er a
nd v
eget
able
fa
rms)
.
Ch
an
ges
in th
e s
tate
of
the
we
tla
nd
•D
ecre
ase
in w
etla
nd n
atu
ral a
rea;
•D
eple
tion
of a
vaila
ble
soil n
utrie
nts,
lead
ing
to la
nd
deg
rada
tion;
•S
edim
enta
tion
of w
ater
cour
ses;
•S
oil c
ompa
ctio
now
ing
to o
ver-
graz
ing;
•L
owe
red
wat
er ta
ble
an
d dr
ying
up o
f spr
ings
;
•L
oss
of b
iodi
vers
ity (n
atur
al v
ege
tatio
n a
nd
faun
a);
•P
estic
ide
pois
oni
ng;
•L
oss
of w
etla
nd;
•In
crea
sed
con
flict
s (f
arm
er-fa
rmer
,far
mer
-her
der,
and
farm
er-w
ildlif
e)ov
er l
and
and
wat
er r
eso
urce
s;
•D
ispl
ace
men
tof l
and
use
with
in th
e w
etla
nd lo
catio
n vi
a co
nver
sion
of r
anch
land
for h
igh-
valu
e cr
op p
rodu
ctio
n;
•In
crea
sed
pre
ssur
e on
upl
and
ecos
yste
ms
(cut
-flo
wer
fa
rms)
.
Pro
du
cti
on
c
on
str
ain
tsL
an
d-u
se
dri
ve
rs
Bio
ph
ys
ica
l ch
ara
cte
ris
tics
of
the
fie
ld:
we
tla
nd
re
so
urc
es
•
Lan
d su
itabi
lity
for c
ash
cro
ps
(ric
e a
nd v
eget
able
) pro
duct
ion
•S
oil f
ertil
ity•
Wat
er s
oil/m
oist
ure
ava
ilabi
lity
Clim
ate
ch
an
ge/v
ari
ab
ilit
y
•D
roug
ht o
ccur
renc
e•
Rai
nfal
l sca
rcity
•U
nrel
iabl
e ra
infa
ll pat
tern
s
Cu
ltu
ral, p
oliti
ca
l, a
nd
in
sti
tuti
on
al c
on
dit
ion
s
•A
gric
ultu
ral d
evel
opm
ent
pol
icy
•Im
prov
ed
ma
rket
acc
ess
for f
arm
in
puts
an
d o
uput
es•
Lan
d av
aila
bilit
y in
and
acc
ess
to
the
wet
land
•P
opul
atio
n re
settl
emen
t pol
icy
Pe
rso
na
l an
d s
oc
io-e
co
no
mic
c
ha
rac
teri
sti
cs
of fa
rme
rs
•N
eed
for f
ood
•In
com
e ge
nera
tion
oppo
rtuni
ty
Up
lan
d re
so
urc
es
•
Cro
plan
d sc
arci
ty•
Lan
d de
grad
atio
n
Ab
ioti
c
•F
lood
•S
eas
onal
dro
ught
•S
oil
acid
ity /
salin
ity
Bio
cti
cfa
cto
rs
•W
eed
s•
Pe
sts
and
dis
eas
es•
Nem
atod
es
Co
nfl
ict
•F
arm
er-f
arm
er•
Far
mer
-her
der
•F
arm
er-w
ildlif
e
Ma
rke
t po
lic
y
•H
igh
inpu
t pric
es•
Non
-reg
ulat
ed o
utpu
t pric
ing
polic
ies
Po
or
ac
ce
ss to
te
ch
no
log
y
•Li
mite
d a
cces
s to
cer
tifie
d se
eds
•P
oor
tra
nsp
orta
tion
infr
astru
ctur
e•
Inad
equ
ate
acce
ss to
ferti
liser
So
cio
-ec
on
om
ic c
ha
rac
teri
sti
cs
•La
bou
r sho
rtage
•La
ck o
f cap
ital
•R
emot
enes
s of
wet
land
fiel
d
No
n-a
gri
cu
ltu
rals
erv
ice
s•
Wat
erfo
r dom
estic
use
;•
Tha
tchi
ng m
ater
ial (
e.g.
C
yp
eru
san
d T
yp
ha
spp.
);•
Wild
ve
geta
bles
;•
Med
icin
al p
lant
s;•
Fis
h;
•La
nd fo
r set
tlem
ent;
•H
abita
t for
wild
life.
Cro
p a
nd
live
sto
ck
pro
du
cti
on
•C
ropl
and;
•G
razi
ng
past
ure
and
anim
al
wat
erin
g po
int;
•F
ood;
•C
ash
from
cro
p or
live
stoc
k sa
le;
•C
rop
dive
rsity
;•
Wat
er fo
r upl
and
irrig
atio
n;
•F
ora
ge re
sour
ces
enha
nced
(cut
-an
d-c
arry
, cro
p by
-pro
duct
s)
•Im
pro
ved
food
sec
urity
(fo
od
crop
s pr
oduc
tion
or p
urch
ase
of
food
stuf
fs fr
om v
ege
tabl
e sa
le);
•Im
pro
ved
hous
ehol
d in
com
e (c
ash
avai
labi
lity
for s
choo
l fe
es, f
arm
inpu
ts);
•D
iver
sific
atio
n op
tion
s (o
ff-
farm
em
ploy
men
t,cr
op-
lives
tock
inte
grat
ion)
Fig
ure
3: L
and
use
driv
ers,
cur
rent
use
s an
d fa
rmer
s’ l
ivel
ihoo
d st
rate
gies
, an
d th
e pr
oduc
tion
cons
trai
nts
used
in
the
scen
ario
dev
elop
men
t. D
river
s an
d co
nstr
aint
s w
ere
liste
d by
far
mer
s du
ring
field
sur
veys
con
duct
ed in
tw
o in
land
val
leys
and
two
flood
plai
ns in
Ken
ya a
nd T
anza
nia.

Model application – Policy change
135
Cha
pter
5
Scenarios and the entry points in the model are summarised in Table 5.
Scenario Entry point(s) Driver(s) in the model
Baseline (business-as-usual trend)
Wetland, wetland cluster group, and/or farm type
Upland per capita, wetland area, market and wetland accessibilities, and land uses
‘Upland’ Increasing land scarcity on uplands
Farm type Upland per capita, wetland dependency ratio, rates of conversion and fallow, wetland field size, household distribution within farm types, and land uses
‘Market’ Improved market network infrastructure
Wetland and/or wetland cluster group
Market access, rates of conversion and fallow, household distribution within farm types, farm type distribution within and between wetland cluster groups, and land uses
‘Irrigation’ Improved water availability in the wetland
Wetland cluster group
Flooding regime and duration, rates of land conversion and fallow, and land uses
‘Upland scarcity with Market’ Increasing production land shortages with improved market network infrastructure
Farm type and wetland cluster group
Upland per capita, market access, proportional distributions of households within farm types and of farm types within and between wetland cluster groups, rates of land conversion and fallow, and land use
‘Upland with Irrigation’ Increasing production land shortages with improved water availability
Farm type and wetland cluster group
Upland per capita, flooding regime and duration, proportional distributions of households within farm types and of farm types within and between wetland cluster groups, rates of land conversion and fallow, and land uses
‘Irrigation with Market’ Improved water availability with market proximity
Farm type and wetland cluster group
Flooding regime and duration, market access, rates of land conversion and fallow, and land uses
Table 5: Description of scenarios for wetland uses based on current development and future uses. Entry point(s) and driver(s) used in the model are specified for each
scenario

Chapter 5
136
Chapter 5
2.4.1 The business-as-usual scenario (Baseline)
The (Baseline) scenario is the status quo policy in the situation in 2009. The scenario envisions a continuation of the current trends on land conversion in the wetland for agricultural production in the study area. Historical analyses on wetland use suggest a recent expansion of cropland and land use intensification. Wetland conversion for cultivation is assumed to be maintained or increase unless appropriate measures are taken with all stakeholders.
2.4.2 Increasing land shortages on upland (i.e. ‘Upland’) scenario
The scenario of increasing land shortages on upland examines the impacts of further increase in cropland shortages on uplands. The scenario is based on reports from previous studies on the upland-based traditional agriculture in sub-Saharan Africa (Thenkabail and Nolte, 1996; Wakatsuki and Masunaga, 2005). Therefore, the increasing population growth-induced land shortages are expected to lead to increasing expansion of production on marginal lands and wetlands. Five levels of land shortage were implemented based on empirical analyses. The levels are upland075, upland05, upland025, upland0125, and upland00625, where the figures indicate the corresponding value of land per
capita.
2.4.3 Economic development policy improved market network infrastructure
(i.e. ‘Market’) scenario
The ‘Market’ scenario describes a situation of market-driven economic development. Previous studies in the region have confirmed the substantial influencing capacity of improved market networks on the production orientation among wetland-dependent households (Wood and Halsema, 2008; Chapter 3). We defined three scales of market access based on the physical market proximity and the available infrastructure (number and roads condition) to the market: low, medium, and good access. We assume that establishing new or improving existing roads opens new areas, reduces transport costs, provides market access, and thereby creating incentives for an input and output markets. Roads can further assist in land use intensification and economic development.
2.4.4 Agricultural development policy via the establishment of an irrigation
scheme (i.e. ‘Irrigation’) scenario

Model application – Policy change
137
Cha
pter
5
The (Irrigation) scenario was defined during focus group discussions held with lowland rice farmers in Malinda floodplain in Korogwe. Malinda floodplain is located in the sub-humid area and rural households rely mainly on rain-fed farming for food and their livelihoods. Rice is primary grown to generate cash while complementing the upland farming that mainly source for grains. This scenario is further supported by the National Irrigation Policy and Strategy that targets poverty reduction and the agricultural sector development programme (National Investment Brief-Tanzania, 2008). The scenario suggests a lowland development via the establishment of a small surface irrigation scheme based on the Mkomazi River diversion or by a dam. The scenario examines how possible changes in flooding patterns of the wetland will affect land uses made by rice farmers.
2.4.5 Combined scenarios
Besides these four main scenarios also three combined scenarios were explored. These were:
(i) ‘Upland’ with ‘Market’ scenario: Market responses with land scarcity are likely to stimulate land conversion of existing natural area, or land use intensification, or even their combination. It is expected that it will lead to improve rural livelihoods (food and incomes), changes in agricultural systems, and to exacerbate pressure on the wetland;
(ii) ‘Upland’ with ‘Irrigation’ scenario: allows multi-cropping (i.e. more than one crop per year) by landless farmers and hence brings a new dimension for food security and even diversity for rural livelihoods; and
(iii) ‘Irrigation’ with ‘Market’ scenario: wetland development is often accompanied by market proximity and the availability of road infrastructure is seen as crucial for agricultural and economic development. It is expected to bring along the appropriate technology, required for the development of irrigation scheme. Changes in the extent, diversity, and intensity of lowland use are among expected outcomes. It will create sources of activities for the rain-fed-based rural poor. It will open widows for livelihood diversification and hence poverty reduction, whereby improving food security.

Chapter 5
138
Chapter 5
3. Results
Given the different trends in the scenarios for each of the four sites, four cases are presented in this Chapter to cover: (i) the contrasting features of the sites; (ii) the heterogeneity of the wetland systems; and (iii) the diversity of agrowetland households and their land use decisions. The case studies were selected because they show the most important effects of the scenarios. In all scenarios, there are changes in the proportional distributions of farm types, land development, and land uses and/or the combination of those. Changes in the probabilistic distribution of households within farm types for the selected scenarios are presented in Table 6. The effects of all simulated scenarios across the wetlands are summarised at the end of the results section (see Table 7).
3.1 Highland humid inland valley under increasing upland scarcity
(‘Upland’) scenario
Increasing upland scarcity resulted in shifts in farm types, implying reclassification of households between existing categories (Table 6 A). Farm Type (FT 1) increased 3.7-fold and FT 5 0.04-fold. The substantial increase in the proportional distribution of FT 1 indicates the high likelihood of the wetland-dependent crop-livestock-based households of FT 7 to become crop-based. These households cultivated small wetland plots and only kept few non-dairy cattle and small ruminants. Farms of FT 10 that already had a small coffee plot on upland and kept non-dairy cattle are likely to adopt dairy farming and hence to belong to FT 5. Shifts in farm types were also accompanied by changes in land development. At a wetland level, the rate of fallow declined by 14%, that of land conversion rose slightly by 2% and wetland field size was halved in response to critical upland scarcity. The resulted land development implies that the pressure on wetland can be exacerbated in the future.
Table 6: Simulated results for the probabilistic distributions of households within Farm Types under selected scenarios: (A) (Upland) for Karatina inland valley and (B) (Market) for
Rumuruti floodplain in Kenyan highlands; (C) (Upland) with (Market) for Lukozi inland valley,
and (D) (Upland) with (Irrigation) and (E) (Market) with (Irrigation) for Malinda floodplain in
northeastern Tanzania

Model application – Policy change
139
Cha
pter
5
Scenario Wetland Wetland cluster group
Proportional distribution of households within farm types (%)
(A) Karatina
highland inland valley
WCG 4 FT 1 FT 4 FT 5 FT 7 FT 9
Baseline 3 5 83 6 3 ‘Upland’ scenario 14 0 86 0 0
(B)
Rumuruti highland floodplain
WCG 2 FT 1 FT 7 FT 9 FT 11 FT 12
Baseline 18 27 10 18 27 ‘Market’ scenario 42 24 23 4 7 WCG 4 FT 1 FT 7 FT 9 FT 11 FT 12 Baseline 13 25 19 25 20 ‘Market’ scenario 50 14 29 7 0
(C)
Lukozi midland inland valley
WCG 5 FT 2 FT 4 FT 9 FT 10
Baseline 10 78 9 3 ‘Upland’ with ‘Market’ scenario
14 86 0 0
(D)
Malinda lowland floodplain
FT 1 FT 2 FT 8
Baseline WCG 2 8 54 38 ‘Upland’ with ‘Irrigation’ scenario
20 40 40
Baseline WCG 3 7 48 45 ‘Upland’ with ‘Irrigation’ scenario
50 0 50
(E)
Malinda lowland floodplain
FT 1 FT 2 FT 8
Baseline WCG 2 8 54 38 ‘Market’ with ‘Irrigation’ scenario
0 44 56
Baseline WCG 3 0 67 33 ‘Market’ with ‘Irrigation’ scenario
17 0 83
Extension of Table 6
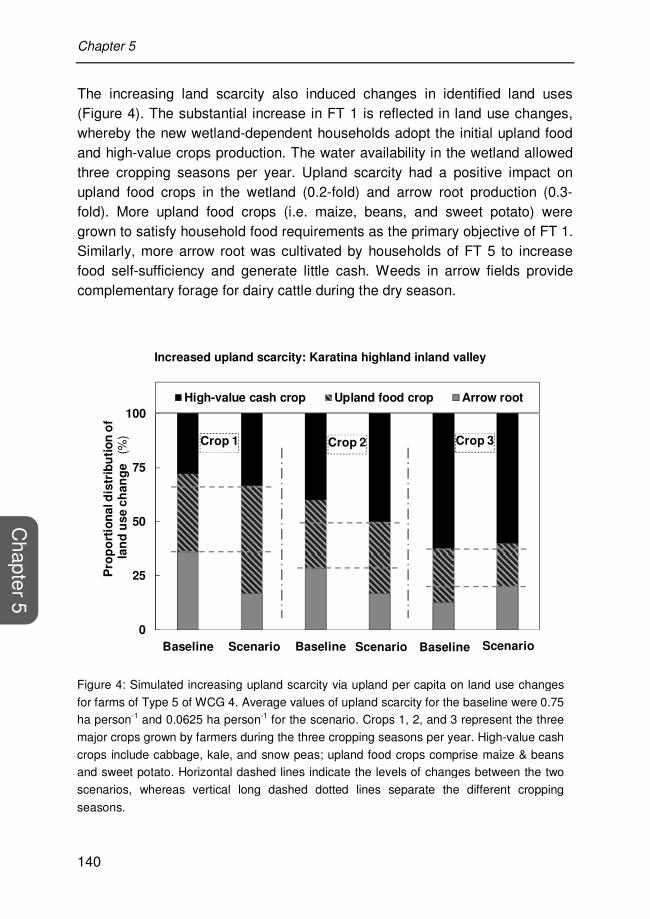
Chapter 5
140
Chapter 5
The increasing land scarcity also induced changes in identified land uses (Figure 4). The substantial increase in FT 1 is reflected in land use changes, whereby the new wetland-dependent households adopt the initial upland food and high-value crops production. The water availability in the wetland allowed three cropping seasons per year. Upland scarcity had a positive impact on upland food crops in the wetland (0.2-fold) and arrow root production (0.3-fold). More upland food crops (i.e. maize, beans, and sweet potato) were grown to satisfy household food requirements as the primary objective of FT 1. Similarly, more arrow root was cultivated by households of FT 5 to increase food self-sufficiency and generate little cash. Weeds in arrow fields provide complementary forage for dairy cattle during the dry season.
Figure 4: Simulated increasing upland scarcity via upland per capita on land use changes
for farms of Type 5 of WCG 4. Average values of upland scarcity for the baseline were 0.75 ha person-1 and 0.0625 ha person-1 for the scenario. Crops 1, 2, and 3 represent the three
major crops grown by farmers during the three cropping seasons per year. High-value cash
crops include cabbage, kale, and snow peas; upland food crops comprise maize & beans and sweet potato. Horizontal dashed lines indicate the levels of changes between the two
scenarios, whereas vertical long dashed dotted lines separate the different cropping
seasons.
Increased upland scarcity: Karatina highland inland valley
0
25
50
75
100
Pro
po
rtio
na
l dis
trib
uti
on
of
lan
d u
se
ch
an
ge
(
%)
High-value cash crop Upland food crop Arrow root
Crop 1
Baseline Scenario Baseline Scenario Baseline Scenario
Crop 2 Crop 3

Model application – Policy change
141
Cha
pter
5
Taken separately, changes in upland food and high-value crops and in arrow root responded inversely to the increasing land scarcity, reflecting the seasonal water availability. Upland food crops increased 0.2-fold during the first two seasons and declined by 0.4-fold during the last season. The fluctuation of food crop production can be explained by the fact of farmers could expand perennial cash (Coffee, Coffea robusta) by 0.1-fold and fodder (mostly Napier grass, Pennisetum purpureum Schumach) crop fields by more than one-half on uplands at the expense of maize-beans fields. High-value crops increased during the three seasons, with the highest increase (0.4-fold) during the second season, indicating the high demand of high-value crops during this period of the year. Arrow root production was halved during the first two seasons and increased 1.5-fold from the baseline scenario during the last season, implying long-rainy season cultivation.
3.2 Highland semi-arid floodplain under the improved market (‘Market’)
scenario
The change from low to good market opportunities under the ‘Market’ scenario led to shifts in the distributions of FTs 1, 7, 9, 11, and 12 (Table 6 B). At a wetland level, wetland-dependent crop-based households of FT 1 increased by more than twofold from the baseline scenario. Similar trends were observed with crop-livestock-based households of FTs 7 9 that increased 0.3-fold. In contrast, livestock-based FTs 11 and 12 showed substantial decline by more than 0.8-fold from the baseline scenario. The wetland cluster groups portrayed similar trends; however, farm types within each WCG showed differential distributions, reflecting the different market conditions of these wetland cluster groups. For instances, the decline in farms of upland food crop-livestock-based FT 7 for WGC 4 with better market opportunities was four times that for WCG 2 with low market opportunities. In contrast, high-value crop-livestock-based farms of FT 9 increased more than twofold in WCG 2 than in WCG 4. This implies that WGC 4 would not sustain the pastoral livestock-systems as compared to WCG 2 under improved market scenario. In addition, improved market influenced land development, with rising rate of land conversion and declining rate of fallow. More land (average of 0.48 ha year-1) could be brought in crop production in WCG 2, whereas less land could be put in fallow (-0.03 ha year-1), implying land expansion and land use intensification.
Beside shifts between farm types and changes in land development, the improved market scenario had important influences on current cropping

Chapter 5
142
Chapter 5
patterns (Figure 5). At a wetland level, changes showed a clear shift towards the production of high-value crops such as tomato (Solanum lycopersicum L.), cabbage (Brassica oleracea L.), kale (Brassica oleracea var. acephela DC.), and tobacco (Nicotiana tabacum L.) from the staple food (i.e. maize and beans) production. Such trends showed differences between wetland cluster groups, reflecting the aforementioned differences in market-induced shifts in farm types within each WCG. Similar decline by 0.4-fold was observed in lower-value field crops (i.e. maize and beans) for both WCGs, whereas the increase in high-value crops was relatively higher for WCG 4 (0.3-fold) than for WCG 2 (0.2-fold). These results imply that market access did not have any effects on WGCs when all cropping seasons are aggregated, but per season there were changes. Upland food crop production declined more than six-fold in the second season as compared with the first season for WCG 2. In contrast, high-value crop increased five-fold between the first and third seasons. New high-value crops of tobacco and flowers were grown in the third season, implying crop diversification (Figure 5 A). Similarly, the decline in food crop production for the third season was more than threefold that for the second and more than twofold that for the first season in WCG 4. The trends in high-value crops between the three seasons were inversed as compared with those in upland food crops (Figure 5 B). Farmers grow specific high-value crops in the third season rather than the usual diversified cropping.
3.3 Midland inland valley under (‘Upland’) with (‘Market’) scenario
The increasing upland scarcity coupled with improved market access caused a shift in the distribution of FTs 2, 4, 9, and 10 in Lukozi (Table 6 C). The crop-based and crop-dairy-based households of FT1 and FT4 increased at the expense of those of the crop-non-dairy households of FTs 9 and 10. The rate of fallow (0.6-fold) and the average area of the wetland field (0.4-fold) showed higher decline in contrast with the relative increase in the total number of dairy cattle (0.1-fold). This implies that under good market conditions with reducing wetland field, farmers keep a dairy cow in order to maintain the productivity per capita. The improved market access could create incentives to adopt and intensify dairy farming, where Napier grass and Guatemala grass could be fed in combination with concentrates and crop residues.

Model application – Policy change
143
Cha
pter
5
Figure 5: Simulated probabilistic land use changes under improved market access scenario
for farms of Type 1, 7, 9, 11, and 12 of wetland cluster groups 2 and 4. Results are presented separately for WCG 2 (A) and WCG 4 (B). The baseline scenario represents the
current trend, whereas scenario indicates good market access conditions. Upland food
crops include maize & beans. Horizontal dashed lines indicate the levels of changes between the two scenarios, whereas vertical long dashed dotted lines separate the different
cropping seasons.
Improved market access: Rumuruti highland floodplain
0
25
50
75
100
Pro
po
rtio
na
l dis
trib
uti
on
of
lan
d u
se
ch
an
ge
(
%)
High-value crop Upland food crop Tobacco and flowers
Crop 1
Baseline Scenario Baseline Scenario Baseline Scenario
Crop 2 Crop 3
A)
0
25
50
75
100
Pro
po
rtio
na
l dis
trib
uti
on
of
lan
d u
se
ch
an
ge
(
%)
High-value crop Upland food crop Tobacco and flowers
Crop 1
Baseline Scenario Baseline Scenario Baseline Scenario
Crop 2 Crop 3
B)

Chapter 5
144
Chapter 5
Increased upland scarcity in combination with improved markets also caused changes in cropping patterns (Figure 6). In addition to the initial land use intensification, farmers shifted production from diversified crops to more specific crops over the year. Crops cultivated under the baseline scenario included beetroot (Beta vulgaris L.), carrot (Daucus carota L.), green pepper (Capsicum annuum L.), leek (Allium porrum L.), and salad (Poterium
sanguisorba L.), which would be abandoned under the scenario. Farmers would first practice tomato, which increased 3.5-fold from the baseline scenario. The second crops could include Brassica (i.e. cabbage, cauliflower, and broccoli) crops and potato, which increased 0.6- and 0.5-fold, respectively. Finally, they could choose between Brassica crops and tomato in the third and last season of the year.
Figure 6: Simulated increasing upland scarcity with improved market access on land use
changes for farms of Type 2, 4, and 9 of WCG 5. Average values of upland per capita were set at 0.75 ha person-1 for the baseline scenario with low market access and at 0.0625 ha
person-1 with good market access. Crops 1, 2, and 3 represent the most important crops or
crop categories that are practiced by farmers in the wetland. Brassica crops consist of cabbage, cauliflower, and broccoli, whereas other vegetables include beetroot, carrot,
cucumber, green pepper, leek, lettuce, and parsley. Horizontal dashed lines indicate the
levels of changes between the two scenarios, whereas vertical long dashed dotted lines
separate the different cropping seasons.
Upland scarcity with improved market access: Lukozi midland inland valley
0
25
50
75
100
Pro
po
rtio
na
l dis
trib
uti
on
of
lan
d u
se
cn
ah
ge
(%
)
Tomato Potato Brassica Other vegetabes
Crop 1
Baseline Scenario Baseline Scenario Baseline Scenario
Crop 2 Crop 3
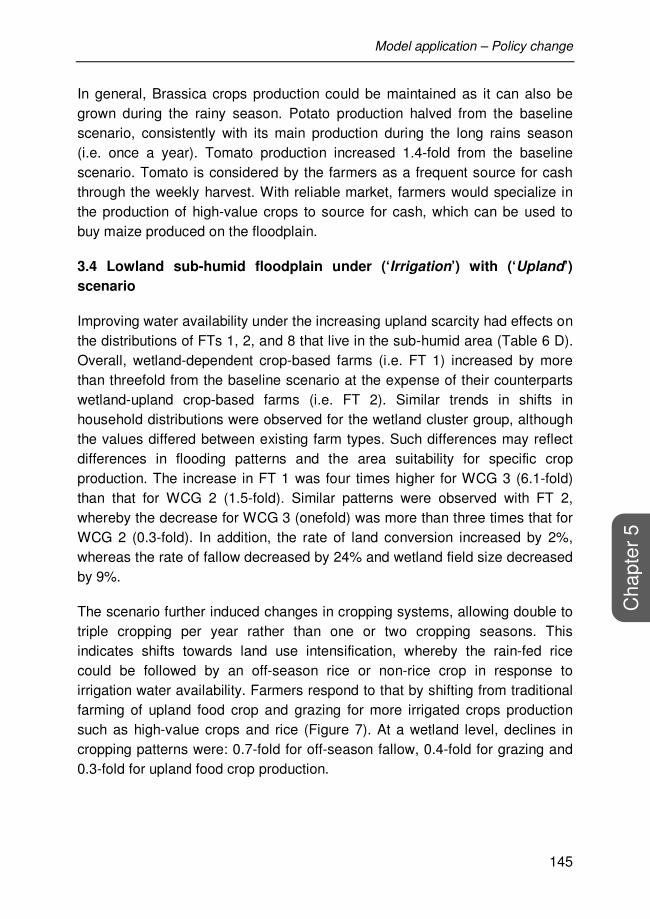
Model application – Policy change
145
Cha
pter
5
In general, Brassica crops production could be maintained as it can also be grown during the rainy season. Potato production halved from the baseline scenario, consistently with its main production during the long rains season (i.e. once a year). Tomato production increased 1.4-fold from the baseline scenario. Tomato is considered by the farmers as a frequent source for cash through the weekly harvest. With reliable market, farmers would specialize in the production of high-value crops to source for cash, which can be used to buy maize produced on the floodplain.
3.4 Lowland sub-humid floodplain under (‘Irrigation’) with (‘Upland’)
scenario
Improving water availability under the increasing upland scarcity had effects on the distributions of FTs 1, 2, and 8 that live in the sub-humid area (Table 6 D). Overall, wetland-dependent crop-based farms (i.e. FT 1) increased by more than threefold from the baseline scenario at the expense of their counterparts wetland-upland crop-based farms (i.e. FT 2). Similar trends in shifts in household distributions were observed for the wetland cluster group, although the values differed between existing farm types. Such differences may reflect differences in flooding patterns and the area suitability for specific crop production. The increase in FT 1 was four times higher for WCG 3 (6.1-fold) than that for WCG 2 (1.5-fold). Similar patterns were observed with FT 2, whereby the decrease for WCG 3 (onefold) was more than three times that for WCG 2 (0.3-fold). In addition, the rate of land conversion increased by 2%, whereas the rate of fallow decreased by 24% and wetland field size decreased by 9%.
The scenario further induced changes in cropping systems, allowing double to triple cropping per year rather than one or two cropping seasons. This indicates shifts towards land use intensification, whereby the rain-fed rice could be followed by an off-season rice or non-rice crop in response to irrigation water availability. Farmers respond to that by shifting from traditional farming of upland food crop and grazing for more irrigated crops production such as high-value crops and rice (Figure 7). At a wetland level, declines in cropping patterns were: 0.7-fold for off-season fallow, 0.4-fold for grazing and 0.3-fold for upland food crop production.
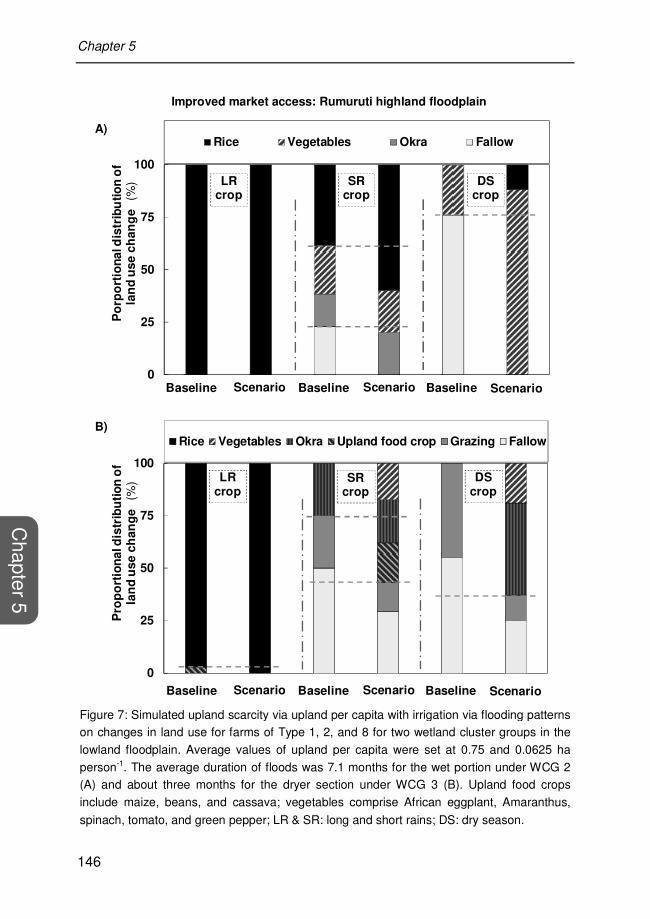
Chapter 5
146
Chapter 5
Figure 7: Simulated upland scarcity via upland per capita with irrigation via flooding patterns on changes in land use for farms of Type 1, 2, and 8 for two wetland cluster groups in the
lowland floodplain. Average values of upland per capita were set at 0.75 and 0.0625 ha
person-1. The average duration of floods was 7.1 months for the wet portion under WCG 2 (A) and about three months for the dryer section under WCG 3 (B). Upland food crops
include maize, beans, and cassava; vegetables comprise African eggplant, Amaranthus,
spinach, tomato, and green pepper; LR & SR: long and short rains; DS: dry season.
Improved market access: Rumuruti highland floodplain
0
25
50
75
100
Po
rpo
rtio
na
l dis
trib
uti
on
of
lan
d u
se
ch
an
ge
(%
)Rice Vegetables Okra Fallow
LR crop
SR crop
Baseline Scenario Baseline Scenario Baseline Scenario
DS crop
A)
0
25
50
75
100
Pro
po
rtio
na
l dis
trib
uti
on
of
lan
d u
se
ch
an
ge
(%
)
Rice Vegetables Okra Upland food crop Grazing Fallow
LR crop
SR crop
DS crop
Baseline Scenario Baseline Scenario Baseline Scenario
B)

Model application – Policy change
147
Cha
pter
5
In contrast, farmers increased high-value crops production by 1.1-fold and rice and okra (Abelmoschus esculentus Moench) production by 0.5-fold each. Changes in cropping systems; however, varied between wetland cluster groups, reflecting the baseline flooding patterns. With the improved irrigation conditions, farmers abandoned fallow systems by increasing high-value crops and rice production in WCG 2 by 1.3- and 0.5-fold, respectively (Figure 7 A). This irrigated production could be practiced during short rains and dry season, following the long rains rice cultivation. Similarly, high-value crops and okra increased by onefold and 0.4-fold at the detriment of upland food production, livestock grazing, and fallow in WCG 3 (Figure 7 B). On average, this traditional farming declined by 0.7-fold from the baseline scenario. The scenario causes a shift out of subsistence and semi-market-oriented productions in remote and rural areas, indicating a need to create market outlets for the irrigated crops.
3.5 Lowland sub-humid floodplain under (‘Irrigation’) with (‘Market’)
scenario
The increasing irrigation water availability and improved market access resulted in increase in wetland-dependent crop-based farms (i.e. FT 1) and wetland-upland crop-livestock-based farms (i.e. FT 8) by at least onefold each from the baseline scenario. In contrast, wetland-upland crop-based farms (i.e. FT 2) declined by 0.6-fold, implying either rising wetland-dependency level or the integration of crop and livestock farming as an alternative of livelihood diversification. FT 2 showed declining trends while FT 8 increased in both WCGs. FT 1 showed opposite trends between the WCGs (Table 6 E). The scenario eliminated wetland-dependent FT 1 in WCG 2, whereas it created farms of the same type in WCG 3. The shifts in farm distributions were accompanied by an increase in the rate of land conversion and hence an expansion of wetland field size by 15%. Traditional wetland cultivation strategies were abandoned in favour of more intensive and market-oriented crop production (Figure 8). Irrigated crop production increased twofold during the dry season, while grazing and fallow declined 0.8-fold during the same season. Irrigated rice production increased in both wetland cluster groups. Irrigated high-value crops and okra production during the short rains and dry season was new in WCG 3 (Figure 8 A), whereas its production increased in WCG 2 (Figure 8 B). Changes resulted in triple cropping systems, where the formerly grazing land and off-season fallow fields were cropped during the dry season.
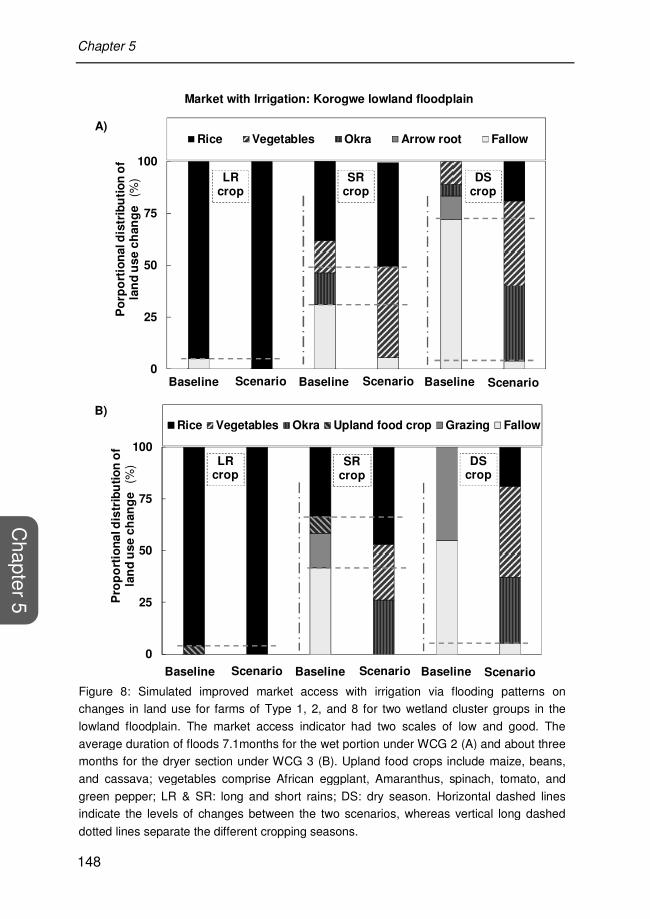
Chapter 5
148
Chapter 5
Market with Irrigation: Korogwe lowland floodplain
0
25
50
75
100
Po
rpo
rtio
nal d
istr
ibu
tio
n o
fla
nd
us
e c
han
ge
(%
)Rice Vegetables Okra Arrow root Fallow
LR crop
SR crop
DS crop
Baseline Scenario Baseline Scenario Baseline Scenario
A)
Figure 8: Simulated improved market access with irrigation via flooding patterns on changes in land use for farms of Type 1, 2, and 8 for two wetland cluster groups in the
lowland floodplain. The market access indicator had two scales of low and good. The
average duration of floods 7.1months for the wet portion under WCG 2 (A) and about three months for the dryer section under WCG 3 (B). Upland food crops include maize, beans,
and cassava; vegetables comprise African eggplant, Amaranthus, spinach, tomato, and
green pepper; LR & SR: long and short rains; DS: dry season. Horizontal dashed lines indicate the levels of changes between the two scenarios, whereas vertical long dashed
dotted lines separate the different cropping seasons.
0
25
50
75
100
Pro
po
rtio
na
l dis
trib
uti
on
of
lan
d u
se c
han
ge
(%)
Rice Vegetables Okra Upland food crop Grazing Fallow
LR crop
SR crop
DS crop
Baseline Scenario Baseline Scenario Baseline Scenario
B)

Model application – Policy change
149
Cha
pter
5
4. Discussion
The study quantified land use by heterogeneous farming households that operate in contrasting rural areas in humid and semi-arid Kenyan highlands and in humid and sub-humid northeastern Tanzania. The contrasting landscape features of study sites illustrate the diversity of wetland categories that occur in East Africa, whereas the heterogeneity in the wetland cluster groups mainly reveals the variety of wetland agricultural systems in the region. Differential patterns observed in land uses among WCGs reflect the variability in the inherent nature of the land units within the wetland, reinforcing the heterogeneity of land users in terms of access to and availability of production resource and objectives (cf. Figure 2). As an example, the permanent flooding conditions of WCG 2 allowed two rice cropping seasons a year, whereas the portion under seasonal floods could support a single cropping system during the long rains, followed by off-season fallow and livestock grazing in Malinda floodplain. Wetland-dependent households of the defined Farm Type 1 engage in cropping activities in the wetland but exhibit contrasting patterns of production orientations. Wealthier farmers with better access to off-farm income sources have had financial resources that they invest in high-value crop production, whereas the poor farmers practiced upland food crops. This is consistent with the fact that wetland farming is resource sensitive, where agrowetland farmers of different wealth classes have had contrasting primary wetland farming objectives in the region (Wood and van Halsema, 2008). These differences further depict the contrasting agroecological potential and the varying socio-economic circumstances of the study area. As an example, the semi-arid floodplain supports livestock grazing in the pastoral livelihood and low populated zone of Laikipia, whereas the inland valley in the densely populated midlands is exploited for market-oriented crops production. Such differences are affected by external factors influencing land use decisions, strategies, and options of the smallholder farming households. Taken all together, the observed differences are reflected in various uses and use intensities that may have a great impact on wetland management (Solomon et al., 2000).
The empirical model helped to explain a significant part of the functioning of the socio-ecological character of the systems. No single land development or use indicator and the corresponding processes fully capture all dimensions of the aforementioned system. The conversion and fallow indicators only reflect the extent of natural area converted for agricultural purposes or non-use,

Chapter 5
150
Chapter 5
double and triple cropping the intensity and grazing and cultivation of other crops the diversity.
4.1 Differences in responses to different scenarios between wetlands
All wetlands showed roughly the same patterns of change in land use; however, the sensitivity of each wetland to change differed between scenarios (Table 7). For example, despite the rising cropland scarcity on upland and the general resultant increase in household’s livelihood dependence on the wetland, converting new land remained unchanged in all three wetlands except in the highland inland valley. The indicator of upland scarcity belongs to the category of internal factors that include those inherent to the farmer and to the farming system. Internal factors include farm type, amount of land, and environmental constraints and possibilities that determine the ability of the farmers to take certain actions (Siebert et al., 2006).
In the model conceptualisation, land conversion is conditioned by the availability of convertible land in the wetland and the access right to that land. Thus, differences in available land and land tenure system between the inland valleys could partly explain the different behavioural patterns of land conversion in response to upland scarcity. Both inland valleys embedded convertible land (i.e. fallow land under regenerated Cyperaceae and Typhaceae; cf. Figure 2) that showed differences in access rights. The fallow land is individually owned in the highland valley where land owners would decide to cultivate their pieces of land under the rising upland scarcity conditions. On the contrary, the similar fallow land in the midland valley has been protected by the local government authority and hence limiting access to land by individual farmers. Most of the land falls within the valley head sections, which embed the water source (cf. Table 5 in Chapter 2). The protection was thus adopted as a community-based wetland management strategy, with the social objectives of meeting the irrigation water demand for the year-round high-value crops production in the valley.
The unchanged land conversion in the floodplains (Table 7), however, is more related to the reasons given by farmers for wetland cultivation. Most reasons were related to the water availability and soil fertility in the wetland (more than two-thirds of surveyed households; Table not shown) for the lowland floodplain.

Model application – Policy change
151
Cha
pter
5
Table 7: Summary of the changes in land use and land development induced by the scenario
analyses across the four study sites. Arrows indicate differences relative to the baseline trend
Wetland Scenario
‘Upland’ ‘Market’ ‘Upland with Market’
‘Irrigation’ ‘Upland with Irrigation’
‘Irrigation with Market’
Karatina highland inland valley
ARR ↓
HVC ↑
UFC −
FAL ↓
LCV ↑
Rumuruti highland floodplain
HVC −
UFP −
FAL −
LCV −
HVC ↑
UFP ↓
FAL ↓
LCV ↑
HVC −
UFP −
FAL ↓
LCV ↑
Lukozi midland inland valley
TOM ↑
POT −
BRA −
FAL ↓
LCV −
TOM ↑
POT −
BRA ↓
FAL ↓
LCV −
TOM ↑
POT ↓
BRA −
FAL ↓
LCV ↑
Malinda lowland floodplain
HVC ↑
RIC −
UFP −
FAL ↓
GRZ −
LCV −
HVC ↑
RIC ↑
UFP ↓
FAL −
GRZ ↑
LCV ↑
HVC ↑
RIC ↑
UFP −
FAL ↓
GRZ ↓
LCV ↑
HVC ↑
RIC −
UFP ↑
FAL ↓
GRZ ↑
LCV ↑
HVC ↑
RIC ↑
UFP ↓
FAL ↓
GRZ ↓
LCV −
HVC ↑
RIC ↑
UFP ↓
FAL ↓
GRZ ↓
LCV ↑
ARR: arrow root, BRA: Brassicaceae; HVC: High-value (cash) crops; GRZ: Grazing; POT: potato; RIC: rice; TOM: tomato; UFP: upland food crop; FAL: fallow; LCV: land conversion; Upwards arrows indicate an increase, whereas downwards arrows indicate a decline. The double low (horizontal) line indicates no change.
Chapter 5
152
Chapter 5
These key drivers of wetland cultivation consistently reflect the suitability of wetland areas for specific crop production with the findings by van der Heyden and New (2003) rather than the limited cropland on the upland. The reasons differed slightly for the semi-arid floodplain where land scarcity was secondary to land suitability. But the weak response of that floodplain to upland scarcity is due to the limited number (i.e. 7%) of households who had crop fields on the upland in the baseline scenario (cf. Table 2). Different trends of upland food and high-value crops production between scenarios may also be explained by the motives behind crop selection by the farmers. These motives, however, are more related to the production orientation (food and cash crop production) rather than the wetland characteristics mentioned above. Such reasons are referred as cultural, social, and economic factors by Siebert et al. (2006) and influence crop choice (Lynch, 1999). Increasing upland scarcity and/or improving market access generate a significant increase in crop production as a whole, although high-value crop production comes at the cost of upland food and arrow root crop production.
4.2. Intensification pathways
Simulation results suggest various pathways of land use changes in wetland agriculture. Main pathways include: (i) the transition of households within farm types or between them and the corresponding change in production systems; (ii) shifts from the current subsistence farming and grazing strategies towards a more market-oriented production; (iii) land use intensification; and (iv) land use specialisation of the current intensified systems. Land use intensification is suggested through a decline in or the abandonment of fallow and grazing systems, or change in the cropping systems toward multiple cropping seasons rather than single cropping system. In most cases combined scenarios showed clearer trends for land use change than the single scenario. Nevertheless, the different pathways showed some opportunities and limitations that need to be discussed. Given the contrasting features of the study sites, discussion points will focus on key pathways for the five selected scenarios.
Most important outcomes of the scenarios were an increase in the dependency of livelihoods on cropland in the wetland, a substantial decrease in livestock-based production systems in the semi-arid areas and a trend towards crop - livestock integration due to land scarcity and improved market opportunities. Changes in production systems of smallholder households are

Model application – Policy change
153
Cha
pter
5
in line with predictions by Thornton (2010) on future livestock production in the developing countries. The predicted crop-livestock integration will be accompanied with intensive dairy systems in humid areas with good markets as well as intensified non-dairy livestock production in the sub-humid grazing systems.
The various farm types thus defined have different accesses to key production resources and engage in different production activities. They exhibited different patterns of changes in resource endowment and hence in production systems. The positive relationship between the relative distributions of wetland-dependent farm types and decreasing upland per capita is consistent with the prediction by Smith et al. (2011) for cropland expansion in response to exacerbated shortages of suitable cropland in sub-Saharan Africa by 2050. Assuming that convertible land is available in the wetland, some households from the two-thirds (Survey data), who initially had access to cropland on upland will become upland landless. This affects the likelihood to increase the proportional distribution of households within farms of Type 1 (cf. Table 6).
Increasing land scarcity may also have implications on livestock production systems. Therefore, an increase in livestock production in mixed systems requires substantial resource use efficiencies, as growing scarcities of water and land can cause feed shortages. Increase in dairy cattle number can help crop-dairy-based farmers in the humid areas with relatively good market opportunities to maintain their productivity per capita under the limited land conditions. The good market opportunities will provide market outlets for feed supplements, providing them with an alternative to complement the forage shortages. Feed from crop residues, crop by-products and cut-and-carry systems from small pieces of land can help the intensive livestock systems face the predicted feed constraints by Herrero et al. (2009).
Notably, the simulation results suggest a substantial decrease in livestock-based production systems in the semi-arid areas (cf. Table 6 D). Floodplains have been traditionally considered as back-falls grazing by the local pastoralist communities that live in the semi-arid areas. Due to their ability to retain soil moisture during the dry season, these areas support biomass production and pastures provision when forage shortage occurs on other grasslands. Land scarcity is seen to make it difficult for pastoralists to gain access to the feed and water resources that they have traditionally been able to access. An assessment by Herrero (2010) predicts range-lands fragmentation in the semi-

Chapter 5
154
Chapter 5
arid areas where livestock are a mechanism for risk management. Our results imply land use displacement, where the available range-lands will serve more for livestock grazing. Local pastoralists have reported seasonal migration into the mountainous areas like Mt. Kenya during severe drought for the search of pastures. In sum, predicted structural changes in the cropping and livestock systems cannot be attained unless sound agricultural and development policies are formulated and implemented in close proximity with the smallholder farmers. Such policies should target a more sustainable farming system of smallholder farming households that operate in rural areas.
5. Conclusions
The study explored changes in the human-wetland agricultural use systems under increasing land scarcity, improved market opportunity, and government policies on development in contrasting rural areas in East Africa. Pressure on existing small wetlands in the study areas is predicted to worsen with the global effects of increasing cropland scarcity, market liberalization, and agricultural development policies. Existing crop-based systems are expected to integrate livestock while the current crop-livestock systems will be intensified. Multiple cropping and cash crop production are expected to increase at the cost of current fallow and grazing systems. The implications are expected to impede the implementation of small wetland conservation and hence increase detrimental environmental impacts (Foley et al., 2005; MEA, 2005), and raise conflicts over the access of the scarce resources. Although the study did not explicitly explore options for wetland conservation, the implications of expected intensification and wetland conservation policy serve conflicting objectives and often work in opposite directions. There is, therefore, a need for sound policies and innovation to reconcile wetland conversation with food production.

Chapter 6
General discussion and conclusions
Chapter 6
156
Chapter 6

General discussion & conclusions
157
Cha
pter
6
1. Introduction
Wetlands play an important role in rural livelihood systems of sub-Saharan Africa (SSA), providing environmental services and socio-economic benefits to local communities with access to such areas (Silvius et al., 2000). Socio-economic, environmental, and political change across the SSA region has driven local livelihood diversification, and wetlands have assumed a new significance as agricultural resources. The resulting pressure on wetlands, along with emerging evidence of wetland loss, has heightened concerns over the future sustainability of wetland-based environmental services and livelihood benefits (Junk, 2002; Schuyt, 2005). To explain land use changes, many studies examined main factors in the light of common drivers described by Lambin et al. (2001). Main factors that influence agricultural production in wetlands in the region include population growth, natural resource dynamics, and market opportunity (Wood and van Halsema, 2008). There is limited prior research that explicitly considers land use decision-makers in their studies.
This dissertation focused on generating and applying a proof of concept approach to analyse and explore land use change in response to rural farmers’ decisions to endogenous and exogenous drivers in small wetland agriculture in eastern Africa. This was based on the objectives formulated in Chapter 1. Diverse methodologies were used for that purpose and described in Chapter 2 to 5. In Chapter 2, attributes of the rural small wetland agricultural systems were explored and five types identified with varying socio-ecological conditions for wetland uses. The influential factors of the diversity in categorised systems that relate to the decisions of land users (i.e. farming households) were then identified at farm level. The influences of household diversity and that of the decision-making of individual farmers needed to be assessed in relation to the different uses. In Chapter 3, twelve household categories (i.e. ‘farm types’) were identified with varying production resource endowment and different production activities under various landscape positions. They further operated in areas with contrasting agroecologies and market opportunities. The diversity of decision-making was then simplified, represented, and then used to analyse the effects of such diversity on changes in land conversion, fallow, and use processes of wetland systems (Chapter 4). The effects of changes in socio-economic processes and policies that can influence wetland agriculture were explored to gain insights into farmers’ responses to such changes in relation to their decision-making (Chapter 5). The analyses showed the importance of

Chapter 6
158
Chapter 6
including land use decision-making by farmers in understanding wetland use in these areas.
The model framework was applied to test it as a proof of concept. The application therefore gave insights into the strengths and weaknesses of the framework. It further allowed us to gain insights into types of knowledge-base that are needed to further improve its application possibilities and the robustness of the predictions. The different concepts used in the framework proved useful either to understand the current systems and their interactions, the heterogeneity and their functioning (Describe), or to represent the system reality, explain land use decisions and explore options for future land uses in response to changes in endogenous and exogenous processes (Explain-Explore). One key lesson learnt is that the small wetland-agricultural systems are complex and characterised by interactions between heterogeneous human decision-makers (i.e. the farmers) and their biophysical environment (i.e. the wetlands units). Changes in the system are event-driven and cumulatively results from individual farmer’s decisions of land uses. These may be seen as lessons learnt in terms of approaches for land use decision analysis and will be discussed in relation to the findings of the thesis.
The purpose of this chapter is to synthesize the main findings of the other chapters and discuss the related approaches. The main findings are placed in a broader context by also looking at hazards faced by agrowetland farmers. The most important hazards and vulnerabilities as listed by agrowetland farmers themselves, and the adaptive strategies currently employed are assessed. The overall aim is to introduce and discuss effects of agricultural use on the wetland systems which were not explicitly included in the modelling approach. Identified options of agricultural and non-agricultural uses will be discussed in relation to ecosystem conservation.
2. Methodological approach
The approach used in this thesis relies on typologies at wetland and farm level. Typologies have been formulated to analyse the diversity of decision-making in rural areas. The main aim is to simplify and compare different farming strategies within a region. Typologies are often used in studies of smallholder farming systems in sub-Saharan Africa (e.g. Giller et al., 2011). Next to rural studies, households’ typologies can be used in land use studies to relate the land users (i.e. farmers) with their environment (cf. Chapters 2

General discussion & conclusions
159
Cha
pter
6
and 3), revealing the interactions between decision-making units and the heterogeneous land use system. Such typologies have used various dimensions in resource endowment of individual farm household, access to land resources, markets and other institutions, agroecology, and population density to explain differences in land use outcomes across sites. In land use studies, typologies are used to simplify and investigate the interactions between the diversity of decision-making and land use change processes (Chapter 4; Valbuena et al., 2008). This is possible by considering households’ production structure in the formulation of households’ types. The production structure of household embodies the heterogeneity of farmer’s behaviour and decisions in the context of their values, attitudes and goals, besides defining farmers’ preferences that influence their actions and land use decisions (Kobrich et al., 2003; Siebert et al., 2006). This is the case of cultural-oriented livestock-based farms of Type 12 that are separated from other existing systems in Chapter 3. It further supports livestock-based households’ decisions to ensure a minimum availability of pasture for livestock grazing by creating their own private grazing ground (cf. Figure 2 in Chapter 4).
In this dissertation household and wetland typologies are used to simplify and represent land uses and households’ decision-making. The approach used was based on Valbuena et al. (2008). The use of the framework made it possible to simulate wetland land use change processes in rural areas by developing an empirical decision tree model. Moreover, this framework explicitly linked farmers’ decision-making and land development and use processes at farm and wetland level. Further, the framework was applied to explore how farmers’ response to changes in national socio-economic process and policies can influence land use in the wetland (Chapter 5). To achieve this, different scenarios were simulated to explore the effect of exogenous processes on the diversity of farmer’s decision-making at each specific site. This resulted in a generic and flexible framework that can be adapted and applied to different regions and to different land use change processes. The results describe interactions between national development and agricultural policies, the heterogeneity of smallholder farming systems, the diversity of decision-making, changes in farm types and in production systems and changes in small wetland agricultural systems. The inherent ‘static nature’ of typologies was avoided by linking them to environmental and socio-economic drivers, thereby allowing shifts in the distributions of farm types.

Chapter 6
160
Chapter 6
The framework uses a probabilistic approach (Chapter 4) similar to that described by Valbuena et al. (2010a). This allows the quantification and inclusion of the effect of endogenous and exogenous factors on farmers’ land use choice. The approach is flexible and facilitates the empirical model parameterisation. These further allow processes at farm level to be mimicked and to simulate the emergent pattern for wetland cluster group and/or wetland level (e.g. changes in land uses). Such approaches can hence help to understand how the variation in decision-making can lead to emergent land use patterns, considering non-linear interactions. The use of probabilistic approaches is recommended over that of the aggregated-level modelling to explain land use change processes. This particularly holds when considering the drivers of land use change as defined by Lambin et al. (2001). Finally, the use of qualitative data (e.g. structured interviews and focus group discussion) can improve the understanding, as well as decrease the uncertainty attached to probabilistic approaches. However, the approach used is data intensive, and the reliability of future explorations can be debatable. In the model applications shown in Chapter 5, we implicitly assume that the relationships found in the datasets used for the model formulations (see Chapter 4), can be used for predictions of the future. Rates of change and drivers of the farm and wetland classification are assumed to hold also under different conditions. A way to test this assumption is to study another set of wetlands under comparable socio-economic and agroecological conditions and to apply the tool to ‘predict’ current land use. Of course, the challenge will be to find wetlands under these comparable conditions, but even if conditions are different it will be interesting to study how much and why predictions of the land use model do not represent what happens in practice (are of high uncertainty).
3. Extreme hazards and vulnerability of agrowetland households at study sites
Important factors that are not studied in this dissertation are hazards and shocks, and the consequences of land use and the vulnerability of smallholder farmers. Small wetland farming offers opportunities for rural livelihood diversification (Chapter 3), but also has its risks. Because of the heterogeneity that characterises household and wetland systems (Chapters 2 and 3), adaptive strategies currently employed are expected to differ among them. Although we did not study hazards in the previous chapters of this dissertation, we assessed their importance for wetland farmers in a questionnaire. Forty-
General discussion & conclusions
161
Cha
pter
6
eight constraints were listed by farmers and main categories include constraints related to: conflict (28%; n = 76), socio-economic (19%; n = 51), abiotic (18%; n = 49), and biotic (17%; n = 47 Table not shown) factors across sites. Identified constraints are consistent with those that farmers experience in rainfed wetlands in sub-Saharan Africa (e.g. Balasubramanian et al., 2007). Constraints did not differ significantly between the four different production systems but varied within each of them, reflecting the high diversity of cropping patterns and management within them. Such hazards expose most upland landless farmers of Types 1, 7, 9, 11 and 12 to hunger as they meet less than 10 months of their food requirements per year (Table 2 A in Chapter 3). Therefore, hazards render them more vulnerable to poverty. Important hazards faced by agrowetland households in rural areas are shown and described in Table 1.
3.1 Damage causing animals as a source of conflicts
Damage causing animals like livestock and wildlife like elephants, buffalos, bushbucks, hippopotamus, monkeys, otters, many birds and rodents are considered to be hazardous across sites. Mostly, crop- and crop-non-dairy-based households (64%; n = 178) suffer because of crop and livestock integration or of their close proximity with either livestock-based households or with the wetland. Damage causing livestock mainly occur in floodplains due to the capacity of their extensive areas to support diverse uses (Chapter 3; Rebelo et al., 2010). This generates conflicts on the access to increasingly scarce land- and water-bound resources. For instances, Rumuruti floodplain that is traditionally considered as back-fall grazing land by local community of pastoralists, is regarded to be a crucial productive area for upland food and high-value crops by immigrant smallholder farmers. Major conflicts thus exist between the socio-cultural values and livelihoods of local and migrant populations. Such conflicts become acute during the dry season of a normal year or throughout the year in case of severe drought, where crop farmers and livestock herders compete over access and use of land and water resources in the wetland.
Wetland-dependent households also rarely obtain adequate yields on the semi-arid floodplain because of losses due to crop-raiding wildlife from the swampy area. Rumuruti floodplain provides an important habitat, watering and grazing ground for birds and mammals species.
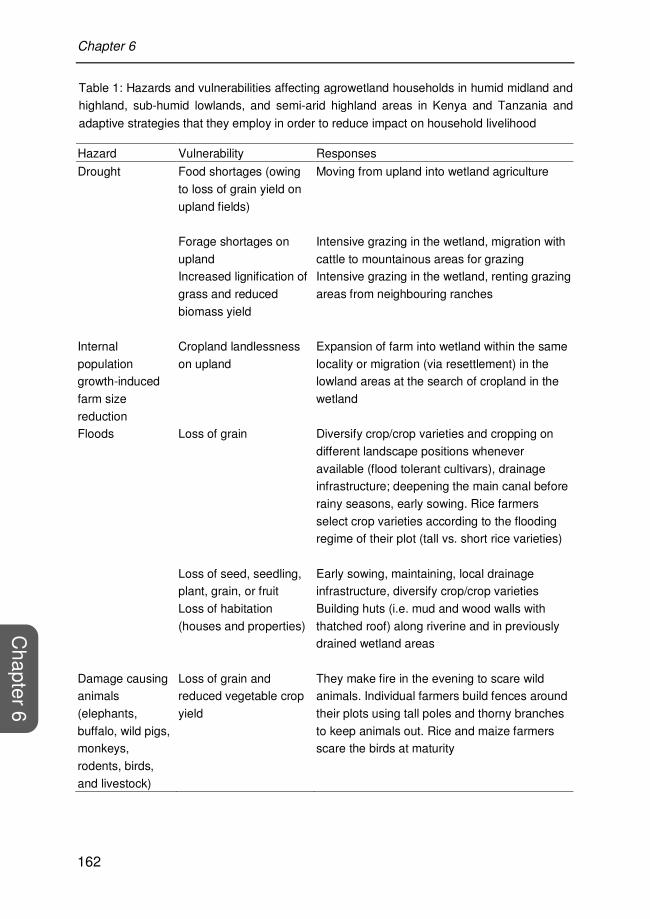
Chapter 6
162
Chapter 6
Table 1: Hazards and vulnerabilities affecting agrowetland households in humid midland and
highland, sub-humid lowlands, and semi-arid highland areas in Kenya and Tanzania and
adaptive strategies that they employ in order to reduce impact on household livelihood
Hazard Vulnerability Responses
Drought Food shortages (owing
to loss of grain yield on
upland fields)
Moving from upland into wetland agriculture
Forage shortages on
upland
Intensive grazing in the wetland, migration with
cattle to mountainous areas for grazing Increased lignification of
grass and reduced
biomass yield
Intensive grazing in the wetland, renting grazing
areas from neighbouring ranches
Internal
population growth-induced
farm size
reduction
Cropland landlessness
on upland
Expansion of farm into wetland within the same
locality or migration (via resettlement) in the lowland areas at the search of cropland in the
wetland
Floods Loss of grain Diversify crop/crop varieties and cropping on
different landscape positions whenever
available (flood tolerant cultivars), drainage infrastructure; deepening the main canal before
rainy seasons, early sowing. Rice farmers
select crop varieties according to the flooding regime of their plot (tall vs. short rice varieties)
Loss of seed, seedling, plant, grain, or fruit
Early sowing, maintaining, local drainage infrastructure, diversify crop/crop varieties
Loss of habitation
(houses and properties)
Building huts (i.e. mud and wood walls with
thatched roof) along riverine and in previously drained wetland areas
Damage causing animals
(elephants,
buffalo, wild pigs, monkeys,
rodents, birds,
and livestock)
Loss of grain and reduced vegetable crop
yield
They make fire in the evening to scare wild animals. Individual farmers build fences around
their plots using tall poles and thorny branches
to keep animals out. Rice and maize farmers scare the birds at maturity
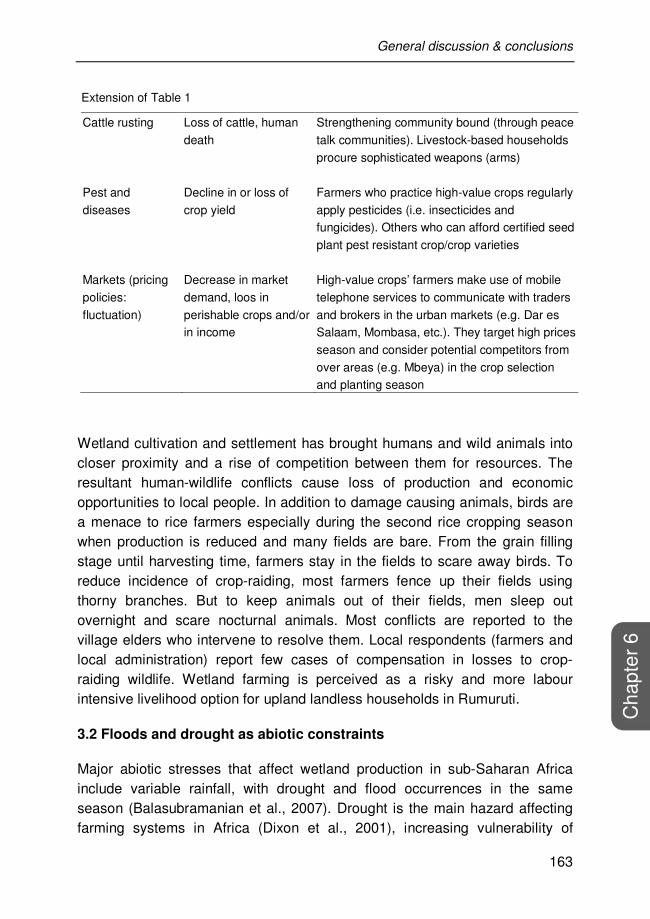
General discussion & conclusions
163
Cha
pter
6
Wetland cultivation and settlement has brought humans and wild animals into closer proximity and a rise of competition between them for resources. The resultant human-wildlife conflicts cause loss of production and economic opportunities to local people. In addition to damage causing animals, birds are a menace to rice farmers especially during the second rice cropping season when production is reduced and many fields are bare. From the grain filling stage until harvesting time, farmers stay in the fields to scare away birds. To reduce incidence of crop-raiding, most farmers fence up their fields using thorny branches. But to keep animals out of their fields, men sleep out overnight and scare nocturnal animals. Most conflicts are reported to the village elders who intervene to resolve them. Local respondents (farmers and local administration) report few cases of compensation in losses to crop-raiding wildlife. Wetland farming is perceived as a risky and more labour intensive livelihood option for upland landless households in Rumuruti.
3.2 Floods and drought as abiotic constraints
Major abiotic stresses that affect wetland production in sub-Saharan Africa include variable rainfall, with drought and flood occurrences in the same season (Balasubramanian et al., 2007). Drought is the main hazard affecting farming systems in Africa (Dixon et al., 2001), increasing vulnerability of
Cattle rusting Loss of cattle, human
death
Strengthening community bound (through peace
talk communities). Livestock-based households
procure sophisticated weapons (arms)
Pest and
diseases
Decline in or loss of
crop yield
Farmers who practice high-value crops regularly
apply pesticides (i.e. insecticides and fungicides). Others who can afford certified seed
plant pest resistant crop/crop varieties
Markets (pricing
policies:
fluctuation)
Decrease in market
demand, loos in
perishable crops and/or in income
High-value crops’ farmers make use of mobile
telephone services to communicate with traders
and brokers in the urban markets (e.g. Dar es Salaam, Mombasa, etc.). They target high prices
season and consider potential competitors from
over areas (e.g. Mbeya) in the crop selection and planting season
Extension of Table 1

Chapter 6
164
Chapter 6
people to poverty. Drought can cause poor harvest on upland whenever accessible and hence exacerbate pressure on wetland areas for crop production (Chapter 4; Wood and Halsema, 2008). Wetlands are therefore important for reducing the vulnerability of rural smallholder households to drought, enhancing their capacity to cope with erratic rain conditions experienced in the semi-arid areas (Scoones, 1991). Severe or prolonged drought cause forage shortages on common grasslands, forcing livestock-based farmers to fall back on wetlands for grazing. However, in wetland agriculture abiotic constraints are perceived differently by different households. Only livestock-based households (6%; n = 19, Table not shown) perceive drought as the major threat to their livelihood. During drought, respondents report limited access to wetland due to the expansion of cropland. But the movement of livestock to alternative grazing (i.e. mountainous) areas dominates the management strategies used by livestock-based household to ensure cattle survival. Local chiefs report that during severe drought livestock-based farmers forcefully graze in crop fields, increasing conflicts between farmers and herders.
Floods affect the majority (94%; n = 256, Table not shown) who crop because of waterlogging and direct damage from flooding in their field. Floods are, however, perceived differently among the different households. Crop-dairy-based households constitute the greater proportion (48%) of those affected by floods. Heavy-clayey to clay-loamy and poorly drained soils (Kirk, 2004) of the inland valleys exacerbate the impact of flood on high-value crop farmers. Respondents in the midland valleys report an increase in pesticide application during the long rains season than in any other period of the year. For example, if a farmer plants tomatoes in time to harvest at the peak in Dar es Salaam’s market prices (usually at the end of the long rains in May), then he will need to invest considerable amount of money in fungicide. From the survey, the frequency of fungicide application during this period increases 1.6-fold for the dry season and 4.4-fold for any other period of the year. Also during floods respondents reported difficulties in accessing health care services and local markets because the crossing points are closed by flooding rivers. Only farmers from the remote areas with poor road networks of Malinda floodplain (Mafuleta and Majengo hamlets) and of Rumuruti (i.e. four villages in Salaama location) suffer because of the flooding rivers. Restricted movement leads to the loss of markets making wetland-dependent-crop-based farmers more vulnerable to poverty.
General discussion & conclusions
165
Cha
pter
6
3.3 Other hazards
Next to conflicts and abiotic constraints, biotic and socio-economic constitute other hazards that agrowetland farmers face. Farmers report yield reduction because of weeds, pests and diseases in highlands inland valley and in lowland floodplains. High-value crop farmers report plant parasitic nematodes in their valley plots. Arrow root producers in Karatina valley and rain-fed rice farmers perceive weeds as the major threat to their production. This supports the time-consuming and labour-intensive nature of rice and arrow root production in fields that are maintained under waterlogged conditions. In addition, timely but manual weeding is required in direct-seeded rice because of the high weed competition. Labour shortage and the lack of capital are also constraints that farmers experience in combination with the abiotic ones. Labour shortage becomes acute during the long rains for activities such as land preparation, planting and weeding for most famers in Tanzania. Farmers, however, have developed different mechanisms to cope with labour shortage. In areas of flatter topography such as Korogwe, where wetland fields can be accessed by tractor, some farmers (only 14 farmers, survey data) can afford to hire a tractor for land preparation. The majority (86%; n = 84) prepare their fields during the dry season and sow before the first rains. In the site of steeper topography such as Lushoto, small valley field plots that are perceived as source of income are managed by the household head (mostly men), while women are confined to upland farming activities. In addition, wealthier farmers hire labour from the poor households who sometimes employ their children in wetland farming activities. High productivity of small valley plots strongly influences the management of production resources by men and women, increasing school absenteeism and child labour in humid midlands.
Finally, high volatility of input and output prices makes high-value crop and rice production a risky activity for agrowetland households. Low output prices vis-à-vis high and rising input prices reduce profit and the competitiveness of smallholder farms in local market. High-value crop farmers usually report decrease in crop profitability due to unstable markets. This reflects the inefficient marketing systems in SSA, which efficiency requires the intervention and collaboration of government, farmers and traders.

Chapter 6
166
Chapter 6
4. Effects of wetland agricultural uses on wetland systems
Small wetlands have been used for crop farming partly because of their inherent high production potential. This potential for crop production depends on interplay of factors including geology, climate, soil types, hydrology, and vegetation (cf. Chapter 2). Factors like carrying capacity, land availability, water availability, and soil fertility are considered in the modelling framework but to a limited extent (cf. Chapter 4). The interplay of soils, hydrology, and vegetation enables the functioning of the wetland ecosystems, performing various ecological and socio-economic functions to different user groups. This is further reflected in the current study, where the agricultural use of small wetlands contributes to the livelihood systems of rural households from twelve different categories. However, wetland cultivation has shown negative effects on soil fertility, hydrology, and corresponding vegetation form (cf. Table 4 in Chapter 2). These interactions are not included explicitly in the current version of the land use model, but can be related to the different land use types included in the model. Therefore, the outcomes of the model can be indirectly used to indicate certain expected changes in the important variables. This will be discussed in detail to assess the consequences of specific land use types.
4.1 Response of soil fertility indicators to land use changes
The effects of the agricultural wetland use on soil fertility indicators are shown in Figure 1. The response of soil organic carbon, total nitrogen, available phosphorus, and exchangeable potassium vary widely between wetland types. In their natural or semi-natural states, inland valley and floodplain show differences in soil fertility contents. This partly reflects the differences in the parental materials on which these soils were developed and the climatic conditions (cf. Chapter 2; Sakané et al., 2011). Despite such differences, smallholder farms in the midlands are clearly market-oriented with use of farm inputs (fertiliser), although the type and quantities applied vary between uses (Figures 1 A-D). On average, agricultural uses increased in contents of soil carbon, nitrogen, phosphorus, and potassium of 1.3- to 3.5-fold more than those of the secondary vegetation. This confirms the high contents in soil carbon, nitrogen, and potassium of the intensive wetlands of cluster group 5 under high-value crop production (cf. Table 4 in Chapter 2). This shows that increasing land use intensity does not necessarily leads to degradation of wetlands.

General discussion & conclusions
167
Cha
pter
6
0
20
40
60
80
Unused Fallow High-value crop
Soil organic C (g kg-1)
SVG FAL HVC0
20
40
60
80
Natural vegatation Grazing Fallow U pland food cro p High-value crop
Soil organic C (g kg-1)
PVG GRZ HVCFAL UPC
0.0
1.5
3.0
4.5
6.0
U nused Fallow High-value crop
Total N (g kg-1)
SVG FAL HVC0.0
1.5
3.0
4.5
6.0
Natural vegatation Grazing Fallow Upland food crop High-value crop
Total N (g kg-1)
PVG GRZ HVCFAL UPC
0
15
30
45
Unused Fallow High-value crop
Available P (mg kg-1)
SVG FAL HVC0
15
30
45
Natural vegatation Grazing Fallow U pland food cro p High-value crop
Available P (mg kg-1)
PVG GRZ HVCFAL UPC
0.0
0.5
1.0
1.5
2.0
U nused Fallow High-value crop
Exchangeable K (cmol kg-1)
SVG FAL HVC0.0
0.5
1.0
1.5
2.0
Natural vegatation Grazing Fallow Upland food crop High-value crop
Exchangeable K (cmol kg-1)
PVG GRZ HVCFAL UPC
Figure 1: Soil fertility indicators measured in the various land uses of the four case study
wetlands. (A-D) Lukozi humid midland inland valley in northeastern Tanzania, and (E-H) Rumuruti semi-arid highland floodplain in Rift Valley, Kenya. Land uses are ordered
according to the level of use intensity of anthropologic disturbance of the wetland from its
natural state: P/SVG: Primary/Secondary vegetation, GRZ: free grazing livestock systems, FAL: fallow fields, UPC: upland food crops (i.e. maize, beans, cassava, and sweet potato),
and HVC: high-value crops under market-oriented conditions. Bars represent the standard
errors of differences between means. Dashed horizontal lines indicate differences between
the natural or ‘semi-natural’ conditions with those of other uses.
(A) (E)
(B) (F)
(C) (G)
(D) (H)

Chapter 6
168
Chapter 6
In contrast, contents in soil carbon and nitrogen declined by 0.2- to 0.4-fold under grazing and cultivation from the primary vegetation (Figures 1 E and F) on average. However, available phosphorus and exchangeable potassium increased under the same use patterns (Figures 1 G and H). In addition, impacts vary between uses, reflecting differences in crop management and hence the diversity of households on such management. General differences in change patterns between wetlands can be explained by differential production orientations of agrowetland households, supporting the usual preferences of smallholder farmers in SSA to invest their scarce resources in cash crops than in subsistence farming (e.g. Tittonell et al., 2010). In addition, differential patterns induced by high-value crops between these wetlands may confirm the effects of land tenure on land management. Most agro-wetland households in the semi-arid floodplain are squatters to whom land was temporary allocated for crop production, whereas their counterparts farmers in Lukozi midlands own the small plots. Thus in instances where smallholder lacks propriety rights on their land, they may lack motivation to invest in soil improvement. Such differences give incentives on likely factors to consider in wetland management initiative, as these go beyond the suggested household diversity (Solomon et al., 2000). Some changes highlight the negative impacts of agriculture on the ecological functions of the wetland natural area like nutrient retention.
4.2 Changes in wetland vegetation
Wetland vegetation changed under different uses across wetlands, although the magnitude varied widely between uses for each wetland (Table 2). Typha capensis in the form of secondary vegetation usually dominates the permanently flooded sections of eutrophic bottom valley (cf. Chapter 2). Such vegetation is completely absent in high-value crop and fallow fields that are invaded by weeds such as Bidens pilosa, Chenopodium, Galinsoga, and Sonchus spp.. Vegetation species changed gradually in large floodplains that are dominated by Cyperus papyrus in their natural states (cf. Chapter 2). The primary vegetation is successively replaced by other Cyperus spp. in fallow fields as reported by agrowetland farmers. The secondary or tertiary vegetation then extinguished with the increasing intensity in land use, where field crops are dominated by invasive weed species like Commelina
benghalensis and Trifolium rueppellianum.
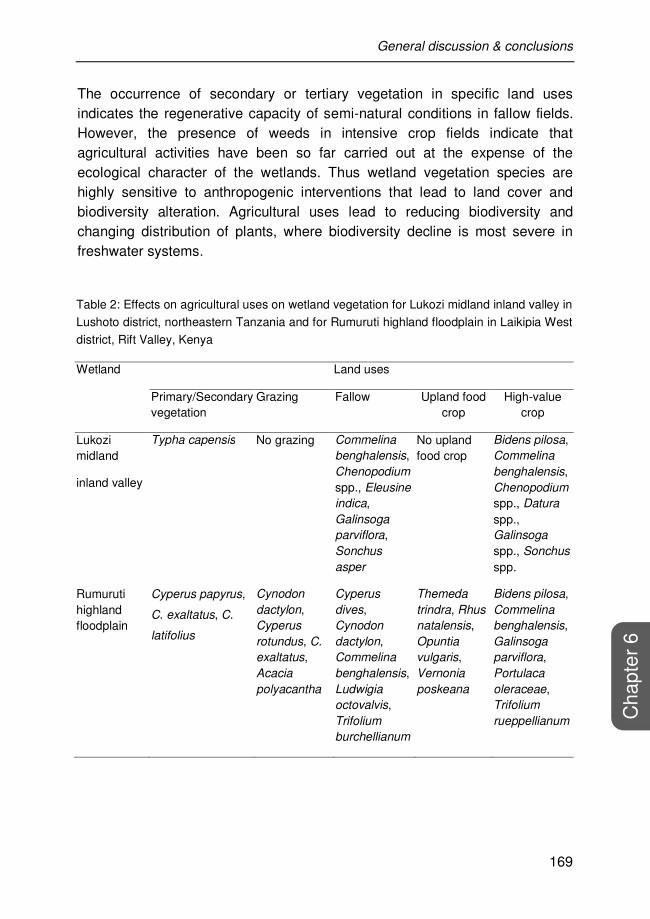
General discussion & conclusions
169
Cha
pter
6
The occurrence of secondary or tertiary vegetation in specific land uses indicates the regenerative capacity of semi-natural conditions in fallow fields. However, the presence of weeds in intensive crop fields indicate that agricultural activities have been so far carried out at the expense of the ecological character of the wetlands. Thus wetland vegetation species are highly sensitive to anthropogenic interventions that lead to land cover and biodiversity alteration. Agricultural uses lead to reducing biodiversity and changing distribution of plants, where biodiversity decline is most severe in freshwater systems.
Table 2: Effects on agricultural uses on wetland vegetation for Lukozi midland inland valley in
Lushoto district, northeastern Tanzania and for Rumuruti highland floodplain in Laikipia West
district, Rift Valley, Kenya
Wetland Land uses
Primary/Secondary vegetation
Grazing Fallow Upland food crop
High-value crop
Lukozi midland
inland valley
Typha capensis No grazing Commelina
benghalensis, Chenopodium spp., Eleusine
indica, Galinsoga
parviflora, Sonchus
asper
No upland food crop
Bidens pilosa, Commelina
benghalensis, Chenopodium spp., Datura spp., Galinsoga spp., Sonchus spp.
Rumuruti highland floodplain
Cyperus papyrus,
C. exaltatus, C.
latifolius
Cynodon
dactylon, Cyperus
rotundus, C. exaltatus, Acacia
polyacantha
Cyperus
dives, Cynodon
dactylon, Commelina
benghalensis, Ludwigia
octovalvis, Trifolium
burchellianum
Themeda
trindra, Rhus
natalensis, Opuntia
vulgaris, Vernonia
poskeana
Bidens pilosa, Commelina
benghalensis, Galinsoga
parviflora, Portulaca
oleraceae, Trifolium
rueppellianum

Chapter 6
170
Chapter 6
4.3 Water uses and related conflicts over increasing scare resources
Although the current study explicitly excluded open water bodies (cf. wetland definition in Chapter 1), field surveys revealed that agricultural uses of small wetlands are related to uses of water. Identified agricultural water uses are shown in Figure 2. Such farm-water uses comprised: (i) small-scale traditional furrow and/or pump irrigation in the wetland for rice and / or high-value crop production by farms of Type 1, 2, 3, 4, 5, 7, and 8 (e.g. Figure 2 A); large-scale pump irrigation for exported-oriented high-value crop production on adjacent uplands by farms of Type 6 (Figure 2 B); and large-scale irrigation for export-oriented cut-flower farms within the catchment of main rivers like Ewaso Ng’iro in Kenya (Figure 2 C). Although these were not quantified, they are indicative of intensive withdrawals of water in the wetland ecosystems. This corroborates the statement by Bossio and co-authors (2007) that ‘Every land use decision is
a water use decision’. It further supports the global assessments on the large share of irrigation on all water withdrawals (Scanlon et al., 2007) and its largest share of consumptive water use (Falkenmark and Lannerstad, 2005).
Agricultural water uses exist alongside with non-farm water uses in the small wetland-agricultural systems. Valley head springs and seasonal to permanent streams and rivers are linked to domestic and industrial (e.g. coffee processing) water withdrawals (cf. Chapter 2). However, evidences suggest that the resultant agriculture from changes in land use, land cover, and irrigation has substantially modified the global hydrological cycle in terms of both water quality and quantity (e.g. Foley et al., 2005). This has caused changes to river flow patterns and wetlands (e.g. Finlayson and D’Cruz, 2005) and has led to river depletion affecting several large rivers around the world (Falkenmark and Lannerstad, 2005). This is exemplified by Ewaso Ng’iro River in Kenya that wasted and went dry in September 2009 (Figure 2 D). Ewaso Narok River, source of water of Rumuruti floodplain is one of the main tributaries to Ewaso Ng’iro River. The river flows down from Mt. Kenya to water the dry plains that stretch east from the Great Rift Valley in Kenya, providing water for people, livestock, and wildlife in the semi-arid areas. A portion of the river was reported to have gone dry for at least six months in 2009. This decimated herds of livestock among pastoralists in northern Kenya, heightening food insecurity in the semi-arid areas, and the death of wildlife (BBC News, October 17 2009).

General discussion & conclusions
171
Cha
pter
6
Agricultural water uses and abstraction
Water deviation
A)
B)
D) C)
Figure 2: Plate on water abstraction and use: (A) in the wetland for small-scale crop
production using small irrigation pump; (B) large scale exported-oriented vegetables
production by farm type 6 on the adjacent upland areas; (C) export-oriented cut-flowers production within the catchment of Ewaso Ng’iro river in Kenya; and (D) true-colour image,
captured by the Advanced Land Imager on NASA’s EO-1 satellite on September 27, 2009,
showing the drying-up of Ewaso Ng’iro river in Kenya(http://earthobservatory.nasa.gov/IOTD/view.php?id=40781). Dashed oval circumference
shows the cut-flower farms that withdraw irrigation water from the wetlands.

Chapter 6
172
Chapter 6
These effects that affect the spatial water distribution reflect the impacts of agricultural-induced changes in water quality and quantity in downstream systems and local livelihoods. Some issues that emerge from this analysis include the growing and urgent problem: water scarcity especially in developing countries (Rosegrant et al., 2002). Other issues that need more attention include how agriculture-driven hydrological changes can increase the risk of regime shifts in ecosystems, their impacts on agricultural production itself, and how they relate to poverty of local people.
The projected population growth and the increasing need for non-farm water uses (Rosegrant et al., 2002); more consumptive agricultural (crops and livestock) water use for food production (e.g. Falkenmark et al., 2009; Angelsen, 2010; Godfray et al., 2010a); the need to maintain food security under growing water scarcity (Rosegrant et al., 2009b); and the decreasing water resources for natural ecosystems (e.g. Foley et al., 2005; MEA, 2005) calls for the need to make water use sustainable and advert a water crisis. Water management in agriculture is a key component in solving some of the most key pressing trade-offs between an increasing agricultural production that can contribute to food security and improved incomes on one hand, and dealing with losses of important wetland ecosystem benefits that also sustain human well-being and livelihoods on the other hand.
In addition, increasing conflicts over access to scarce land- and water-bound resources in the wetland reinforce the need to understand and manage agriculture-induced changes as the key to reduce trade-offs and finding synergies among ecosystem services. Associated conflicts include farmer-herder in small-scale agriculture, farmer-farmer (i.e. upstream and downstream users) over water distribution; and human-wildlife conflicts (e.g. crop-raiding). Different types of conflicts reflect the diversity of interests of wetland users. Increasing conflicts may raise (sub)national interest for nature conservation and tourism development. Such conflicts are found to hinder the development of management options to achieving sustainable use of natural resources (Giller et al., 2008).
Wetland conservation is not assessed in the current study but results suggest that land can be spared from current non- and agricultural uses in a large portion of Rumuruti floodplain in Kenya (Figure 3). The section falls under the extensively used wetlands of cluster group two (cf. Chapter 2) and covered as estimated area of 503 ha. The area is largely dominated by Cyperus papyrus
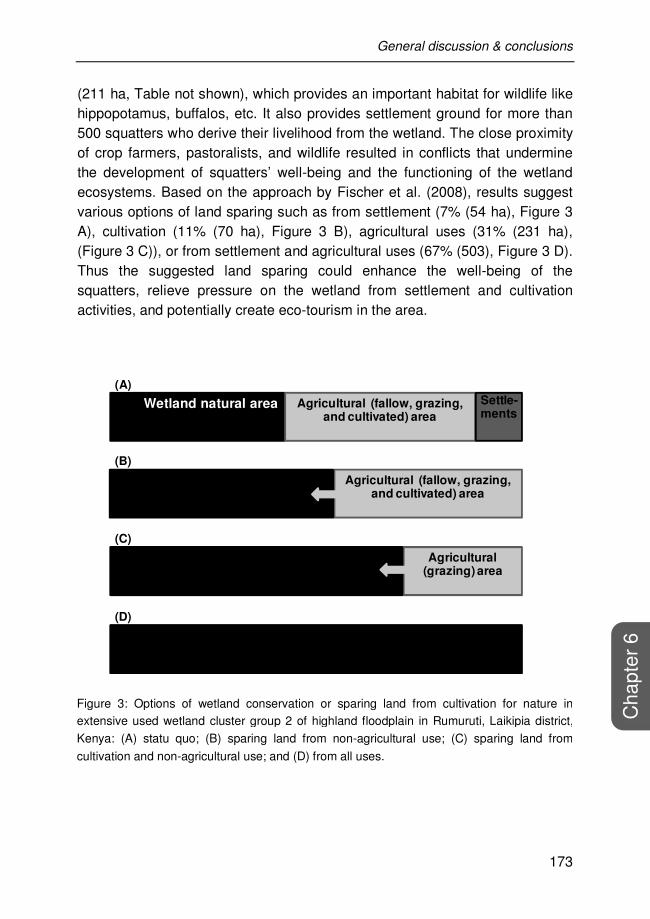
General discussion & conclusions
173
Cha
pter
6
(211 ha, Table not shown), which provides an important habitat for wildlife like hippopotamus, buffalos, etc. It also provides settlement ground for more than 500 squatters who derive their livelihood from the wetland. The close proximity of crop farmers, pastoralists, and wildlife resulted in conflicts that undermine the development of squatters’ well-being and the functioning of the wetland ecosystems. Based on the approach by Fischer et al. (2008), results suggest various options of land sparing such as from settlement (7% (54 ha), Figure 3 A), cultivation (11% (70 ha), Figure 3 B), agricultural uses (31% (231 ha), (Figure 3 C)), or from settlement and agricultural uses (67% (503), Figure 3 D). Thus the suggested land sparing could enhance the well-being of the squatters, relieve pressure on the wetland from settlement and cultivation activities, and potentially create eco-tourism in the area.
Figure 3: Options of wetland conservation or sparing land from cultivation for nature in extensive used wetland cluster group 2 of highland floodplain in Rumuruti, Laikipia district,
Kenya: (A) statu quo; (B) sparing land from non-agricultural use; (C) sparing land from
cultivation and non-agricultural use; and (D) from all uses.
Natural Wetland natural area Agricultural (fallow, grazing,and cultivated) area
Settle-ments
Agricultural (fallow, grazing,and cultivated) area
Natural
Natural
Agricultural (grazing) area
Natural
(a)
(b)
(c)
(d)
(A)
(B)
(C)
(D)

Chapter 6
174
Chapter 6
5. Conclusions and implications
The main contribution of this study is to include explicitly heterogeneous smallholder farming households and the diversity of their land use decision-making in the study of wetland use. Compared with participatory approaches, this decision-based approach can be used to explain land use change processes in rural areas as the result of the diversity in decision-making. To include explicitly these different decision options improves our understanding of the interactions between smallholder households and wetland environmental systems.
Other contributions of this dissertation are: (i) the development of a generic and flexible approach that can be applied to different rural areas and different land use change processes; (ii) the characterisation and typology of small wetlands to define different socio-ecological niches of current and future land uses that may be applicable to different environments and / or be extrapolated and scaled up to other regions in sub-Saharan Africa; and (iii) the generation of a framework to policy analysis at a regional level. The analysis shows that typologies can facilitate the use of farmers’ decision-based approaches in wetland use research. The development of wetland and household’s typologies help to unravel part of the complexity of the human-wetland agricultural systems. The classification of wetlands based on biophysical and socio-economic indicators helps to identify socio-ecological niches for wetland specific uses in rural areas. Production systems-based categorisation of rural households helps to reveal the high heterogeneity of rural smallholders beyond the resource endowment-based categorisation. Considering the production structure of smallholder in household’s typologies separates them into numerous and specific groups in relation to their behaviour and decisions in the context of their values, attitudes, and goals. It therefore provides opportunities to identify different land use patterns, farmers’ production strategies and hence the diversity of their decision-making. This was illustrated by the 12 farm types identified in this study that are far beyond the common three to five types often identified with various resource endowment in African rural farming systems. Cultural-oriented livestock-based farms of type 12 and export-oriented large-scale high-value crops farms of type 6 are separated from the other farm types (Figure 4). Their decisions to ensure a minimum available grazing ground and to withdraw water for upland agriculture confirm the clear separation and hence the relevance of the typologies (cf. Figure 2 in Chapter 4).

General discussion & conclusions
175
Cha
pter
6
These methodological contributions are also related to the combination of concepts and methods of different disciplines. In fact, land use change is the result and the driver of social and environmental processes, representing a common ground for both social and natural sciences. Land use change analysis and exploration show that additional factors can potentially contribute to land conversion expansion and / or land use intensification and hence exacerbate pressure on small wetlands. Such factors suggest the need for policies relating to: (i) the institutional arrangements that regulate access and allocation of natural resources (i.e. equitable land distribution); the enforcement of the regulations of wetland use (i.e. implementation of the ratified Ramsar Convention); (ii) promotion of the economic development of rural areas through improved rural-urban connections and creation of off-farm income opportunities; (iii) and the improperly planned population resettlement programmes. Analysis suggests that these factors can strongly aggravate the effects of common and external influences such as drought, demographic change, natural resource dynamics, and markets.
This dissertation thus illuminates the terrain of land use studies in small wetland agricultural systems with emphasis on alternative development paths that can exacerbate the existing pressure on wetland and even lead to more wetland loss. These impacts, therefore, assert the urgent need to reconcile agricultural production with sustainable use and/or environment considerations
+
-
La
nd
us
e i
nte
ns
ity
Very low
Low
Medium
High
A
+
-L
an
d u
se
in
ten
sit
y
B
WCG 1
WCG 2
WCG 3
WCG 4&5
Ma
rke
t ori
en
tati
on
-
+
- +Livelihood dependence on wetland
Upland per capita-+
FT 12
FT 1
FT 11
FT 9
FT 2
FT 5
FT 4
FT 10
FT 8
FT 3
FT 7
FT 6
Figure 4: Schematic conceptualisation of pathways towards land use intensification for the
twelve farm types in the derived five wetland cluster groups across sites.

Chapter 6
176
Chapter 6
for wetland protection and conservation. Environmental considerations should consider reconciliation of conservation, food security, development, univocal use, and equity. In the light of the analysis performed in the four chapters and this thesis and the conclusions derived from them, a reconciliation initiative necessitates political-economic changes such as land redistribution, research and development in sustainable agricultural technologies, negotiation and conflict management, food safety, and even regulated markets.
Potential conflicts between production and conservation exist in the wetlands. Stimulating agriculture and development in wetland rich-areas through, for example, better technologies and improved roads to “reduce the need for new agricultural land” is a highly risky conservation strategy. Development policies that target off-farm income opportunities on one hand and agricultural policies that target crops, livestock, and production systems at the other hand are more likely to reduce pressure on wetlands.
The approach presented in this dissertation represents land use changes as a multi-level process. Changes are event-driven and cumulatively results from individual farmers’ decisions of land use. The small wetland agricultural systems are thus complex and characterised by interactions between heterogeneous human decision-makers (i.e. farmers) and their socio-economic and biophysical environment (wetland systems). The application shows the added value of including individual decision-making in understanding the heterogeneity and functioning of such systems. It further emphasizes the relevance of including the diversity of decision-making in investigating changes in land use processes, specifically how individual farmers can respond differently to changes in resource dynamics and policy, and how such responses can have consequences in future wetland development, smallholder production systems, and pressure on other natural ecosystems. Wetland agricultural use brings another dimension of livelihood diversification to rural smallholders. The various associated production constraints and vulnerabilities of both people and wetlands heighten concerns over sustainable non- and agricultural uses of wetland resources. Political and economic changes are needed to secure adequate food production without undermining the ecological life support systems that also sustain human well-being and livelihoods.
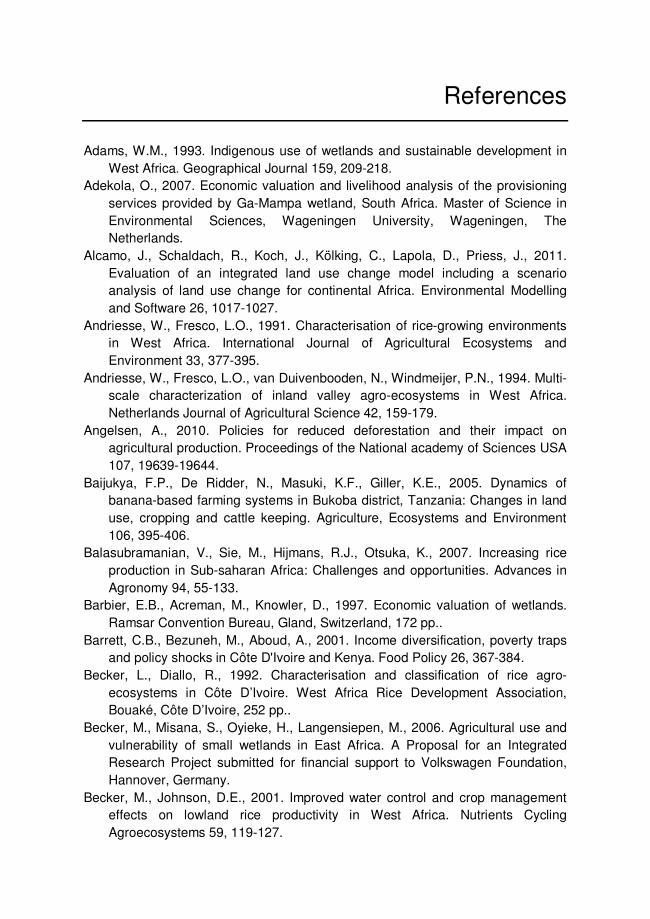
References
Adams, W.M., 1993. Indigenous use of wetlands and sustainable development in West Africa. Geographical Journal 159, 209-218.
Adekola, O., 2007. Economic valuation and livelihood analysis of the provisioning services provided by Ga-Mampa wetland, South Africa. Master of Science in Environmental Sciences, Wageningen University, Wageningen, The Netherlands.
Alcamo, J., Schaldach, R., Koch, J., Kölking, C., Lapola, D., Priess, J., 2011. Evaluation of an integrated land use change model including a scenario analysis of land use change for continental Africa. Environmental Modelling and Software 26, 1017-1027.
Andriesse, W., Fresco, L.O., 1991. Characterisation of rice-growing environments in West Africa. International Journal of Agricultural Ecosystems and Environment 33, 377-395.
Andriesse, W., Fresco, L.O., van Duivenbooden, N., Windmeijer, P.N., 1994. Multi-scale characterization of inland valley agro-ecosystems in West Africa. Netherlands Journal of Agricultural Science 42, 159-179.
Angelsen, A., 2010. Policies for reduced deforestation and their impact on agricultural production. Proceedings of the National academy of Sciences USA 107, 19639-19644.
Baijukya, F.P., De Ridder, N., Masuki, K.F., Giller, K.E., 2005. Dynamics of banana-based farming systems in Bukoba district, Tanzania: Changes in land use, cropping and cattle keeping. Agriculture, Ecosystems and Environment 106, 395-406.
Balasubramanian, V., Sie, M., Hijmans, R.J., Otsuka, K., 2007. Increasing rice production in Sub-saharan Africa: Challenges and opportunities. Advances in Agronomy 94, 55-133.
Barbier, E.B., Acreman, M., Knowler, D., 1997. Economic valuation of wetlands. Ramsar Convention Bureau, Gland, Switzerland, 172 pp..
Barrett, C.B., Bezuneh, M., Aboud, A., 2001. Income diversification, poverty traps and policy shocks in Côte D'Ivoire and Kenya. Food Policy 26, 367-384.
Becker, L., Diallo, R., 1992. Characterisation and classification of rice agro-ecosystems in Côte D’Ivoire. West Africa Rice Development Association, Bouaké, Côte D’Ivoire, 252 pp..
Becker, M., Misana, S., Oyieke, H., Langensiepen, M., 2006. Agricultural use and vulnerability of small wetlands in East Africa. A Proposal for an Integrated Research Project submitted for financial support to Volkswagen Foundation, Hannover, Germany.
Becker, M., Johnson, D.E., 2001. Improved water control and crop management effects on lowland rice productivity in West Africa. Nutrients Cycling Agroecosystems 59, 119-127.
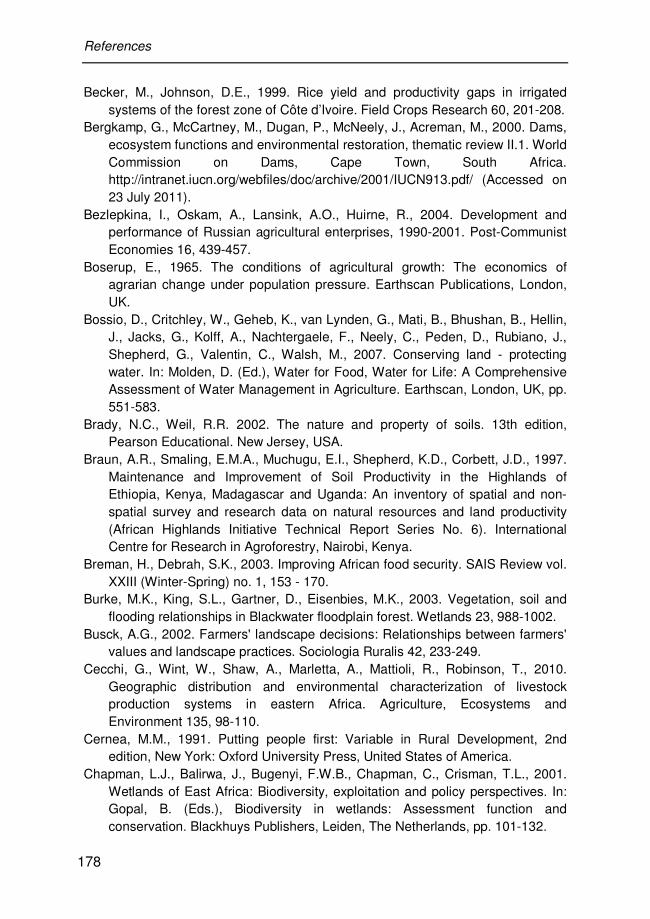
References
178
Becker, M., Johnson, D.E., 1999. Rice yield and productivity gaps in irrigated systems of the forest zone of Côte d’Ivoire. Field Crops Research 60, 201-208.
Bergkamp, G., McCartney, M., Dugan, P., McNeely, J., Acreman, M., 2000. Dams, ecosystem functions and environmental restoration, thematic review II.1. World Commission on Dams, Cape Town, South Africa. http://intranet.iucn.org/webfiles/doc/archive/2001/IUCN913.pdf/ (Accessed on 23 July 2011).
Bezlepkina, I., Oskam, A., Lansink, A.O., Huirne, R., 2004. Development and performance of Russian agricultural enterprises, 1990-2001. Post-Communist Economies 16, 439-457.
Boserup, E., 1965. The conditions of agricultural growth: The economics of agrarian change under population pressure. Earthscan Publications, London, UK.
Bossio, D., Critchley, W., Geheb, K., van Lynden, G., Mati, B., Bhushan, B., Hellin, J., Jacks, G., Kolff, A., Nachtergaele, F., Neely, C., Peden, D., Rubiano, J., Shepherd, G., Valentin, C., Walsh, M., 2007. Conserving land - protecting water. In: Molden, D. (Ed.), Water for Food, Water for Life: A Comprehensive Assessment of Water Management in Agriculture. Earthscan, London, UK, pp. 551-583.
Brady, N.C., Weil, R.R. 2002. The nature and property of soils. 13th edition, Pearson Educational. New Jersey, USA.
Braun, A.R., Smaling, E.M.A., Muchugu, E.I., Shepherd, K.D., Corbett, J.D., 1997. Maintenance and Improvement of Soil Productivity in the Highlands of Ethiopia, Kenya, Madagascar and Uganda: An inventory of spatial and non-spatial survey and research data on natural resources and land productivity (African Highlands Initiative Technical Report Series No. 6). International Centre for Research in Agroforestry, Nairobi, Kenya.
Breman, H., Debrah, S.K., 2003. Improving African food security. SAIS Review vol. XXIII (Winter-Spring) no. 1, 153 - 170.
Burke, M.K., King, S.L., Gartner, D., Eisenbies, M.K., 2003. Vegetation, soil and flooding relationships in Blackwater floodplain forest. Wetlands 23, 988-1002.
Busck, A.G., 2002. Farmers' landscape decisions: Relationships between farmers' values and landscape practices. Sociologia Ruralis 42, 233-249.
Cecchi, G., Wint, W., Shaw, A., Marletta, A., Mattioli, R., Robinson, T., 2010. Geographic distribution and environmental characterization of livestock production systems in eastern Africa. Agriculture, Ecosystems and Environment 135, 98-110.
Cernea, M.M., 1991. Putting people first: Variable in Rural Development, 2nd edition, New York: Oxford University Press, United States of America.
Chapman, L.J., Balirwa, J., Bugenyi, F.W.B., Chapman, C., Crisman, T.L., 2001. Wetlands of East Africa: Biodiversity, exploitation and policy perspectives. In: Gopal, B. (Eds.), Biodiversity in wetlands: Assessment function and conservation. Blackhuys Publishers, Leiden, The Netherlands, pp. 101-132.

References
179
Chilonda, P., van Hulenbroeck, G., D'Haese, L., Musaba, E.C., Samui, K.L., 2000. Attitude towards and uptake of veterinary services by small-scale cattle farmers in the eastern Province of Zambia. Outlook on Agriculture 30, 213-218.
Clay, D., Reardon, T., Kangasniemi, J., 1998. Sustainable intensification in the highland tropics: Rwandan farmers’ investments in land conservation and soil fertility. Economic Development and Cultural Change 46, 351-377.
Cleaver, K., and Schreiber, G. A., 1994. Reversing the spiral. The population, agriculture and environment nexus in sub-Saharan Africa. Directions in development. Washington: The World Bank.
Crowley, E.L., Carter, S.E., 2000. Agrarian change and the changing relationships between toil and soil in Maragoli, western Kenya (1900 - 1994). Human Ecology 28, 383 - 414.
Dale, V.H., Southworth, F., O'Niell, R.V., Rosen, A., Frohn, R., 1993. Simulating spatial patterns of land use change in Rondinia, Brazil. Lectures on Mathematics in the Life Sciences 23, 30-55.
Daskalopoulou, I., Petrou, A., 2002. Utilising a farm typology to identify potential adopters of alternative farming activities in Greek agriculture. Journal of Rural Studies 18, 95-103.
De Groote, H., Djouara, H., Fomba, B., 1998. Les femmes et riziculture de bas-fonds: les déterminants socio-économiques. In: Ahmadi, N., Teme, B. (Eds.), Aménagement et mise en valeur des bas-fonds au Mali. Bilan et perspectives nationales pour la zone de savane ouest-africaine. Colloques. IER-CIRAD-CMDT-CBF, Montpellier, France, pp. 121-132.
De Puaw, 1984. Soils, physiographic and agro-ecological zones of Tanzania. Crop Monitoring and early warning systems project GCS/URT/047.NET. Ministry of Agricultural, Dar Es Salaam, Tanzania.
Denny, P., van Steveninck, E., 2001. Integrated wetland and water resources management capacity building, with special reference to Africa. In: Bergkamp, G. (Eds.), Integrated wetlands and water resources management. IUCN, Gland, Switzerland, pp. 29-36.
Dixon, A.B., 2008. The resilience and sustainability of local wetland management institutions in Illubabor and Western Wellega, Ethiopia. Singapore Journal of Tropical Geography 29, 341-356.
Dixon, A.B., 2002. The hydrological impacts and sustainability of wetland drainage cultivation in Illubabor, Ethiopia. Land Degradation and Development 13, 17-31.
Dixon, A.B., Wood, A.P., 2003. Wetland cultivation and hydrological management in eastern Africa: Matching community and hydrological needs through sustainable wetland use. Natural Resources Forum 27, 117-129.
Dixon, J., Gulliver, A., Gibbon, D., 2001. Farming Systems and Poverty: Improving Farmers Livelihoods in a Changing World. FAO, Rome, Italy and World Bank, Washington, D.C., USA.
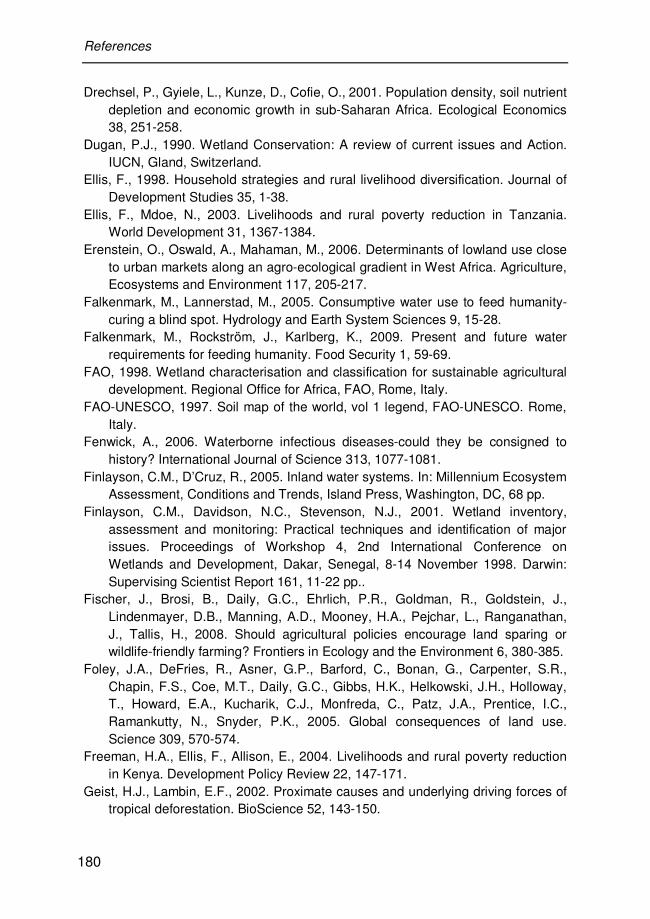
References
180
Drechsel, P., Gyiele, L., Kunze, D., Cofie, O., 2001. Population density, soil nutrient depletion and economic growth in sub-Saharan Africa. Ecological Economics 38, 251-258.
Dugan, P.J., 1990. Wetland Conservation: A review of current issues and Action. IUCN, Gland, Switzerland.
Ellis, F., 1998. Household strategies and rural livelihood diversification. Journal of Development Studies 35, 1-38.
Ellis, F., Mdoe, N., 2003. Livelihoods and rural poverty reduction in Tanzania. World Development 31, 1367-1384.
Erenstein, O., Oswald, A., Mahaman, M., 2006. Determinants of lowland use close to urban markets along an agro-ecological gradient in West Africa. Agriculture, Ecosystems and Environment 117, 205-217.
Falkenmark, M., Lannerstad, M., 2005. Consumptive water use to feed humanity-curing a blind spot. Hydrology and Earth System Sciences 9, 15-28.
Falkenmark, M., Rockström, J., Karlberg, K., 2009. Present and future water requirements for feeding humanity. Food Security 1, 59-69.
FAO, 1998. Wetland characterisation and classification for sustainable agricultural development. Regional Office for Africa, FAO, Rome, Italy.
FAO-UNESCO, 1997. Soil map of the world, vol 1 legend, FAO-UNESCO. Rome, Italy.
Fenwick, A., 2006. Waterborne infectious diseases-could they be consigned to history? International Journal of Science 313, 1077-1081.
Finlayson, C.M., D’Cruz, R., 2005. Inland water systems. In: Millennium Ecosystem Assessment, Conditions and Trends, Island Press, Washington, DC, 68 pp.
Finlayson, C.M., Davidson, N.C., Stevenson, N.J., 2001. Wetland inventory, assessment and monitoring: Practical techniques and identification of major issues. Proceedings of Workshop 4, 2nd International Conference on Wetlands and Development, Dakar, Senegal, 8-14 November 1998. Darwin: Supervising Scientist Report 161, 11-22 pp..
Fischer, J., Brosi, B., Daily, G.C., Ehrlich, P.R., Goldman, R., Goldstein, J., Lindenmayer, D.B., Manning, A.D., Mooney, H.A., Pejchar, L., Ranganathan, J., Tallis, H., 2008. Should agricultural policies encourage land sparing or wildlife-friendly farming? Frontiers in Ecology and the Environment 6, 380-385.
Foley, J.A., DeFries, R., Asner, G.P., Barford, C., Bonan, G., Carpenter, S.R., Chapin, F.S., Coe, M.T., Daily, G.C., Gibbs, H.K., Helkowski, J.H., Holloway, T., Howard, E.A., Kucharik, C.J., Monfreda, C., Patz, J.A., Prentice, I.C., Ramankutty, N., Snyder, P.K., 2005. Global consequences of land use. Science 309, 570-574.
Freeman, H.A., Ellis, F., Allison, E., 2004. Livelihoods and rural poverty reduction in Kenya. Development Policy Review 22, 147-171.
Geist, H.J., Lambin, E.F., 2002. Proximate causes and underlying driving forces of tropical deforestation. BioScience 52, 143-150.
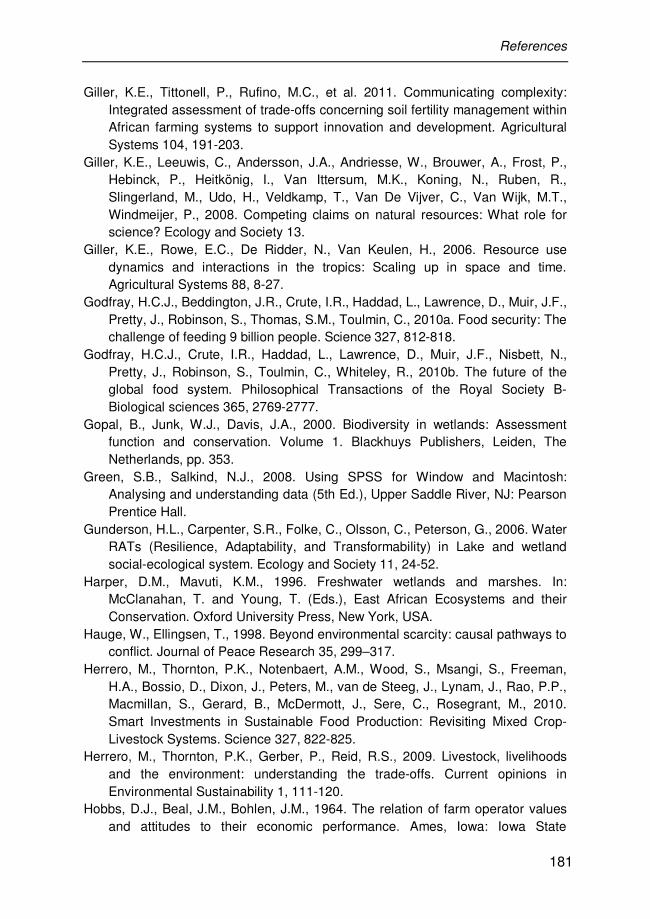
References
181
Giller, K.E., Tittonell, P., Rufino, M.C., et al. 2011. Communicating complexity: Integrated assessment of trade-offs concerning soil fertility management within African farming systems to support innovation and development. Agricultural Systems 104, 191-203.
Giller, K.E., Leeuwis, C., Andersson, J.A., Andriesse, W., Brouwer, A., Frost, P., Hebinck, P., Heitkönig, I., Van Ittersum, M.K., Koning, N., Ruben, R., Slingerland, M., Udo, H., Veldkamp, T., Van De Vijver, C., Van Wijk, M.T., Windmeijer, P., 2008. Competing claims on natural resources: What role for science? Ecology and Society 13.
Giller, K.E., Rowe, E.C., De Ridder, N., Van Keulen, H., 2006. Resource use dynamics and interactions in the tropics: Scaling up in space and time. Agricultural Systems 88, 8-27.
Godfray, H.C.J., Beddington, J.R., Crute, I.R., Haddad, L., Lawrence, D., Muir, J.F., Pretty, J., Robinson, S., Thomas, S.M., Toulmin, C., 2010a. Food security: The challenge of feeding 9 billion people. Science 327, 812-818.
Godfray, H.C.J., Crute, I.R., Haddad, L., Lawrence, D., Muir, J.F., Nisbett, N., Pretty, J., Robinson, S., Toulmin, C., Whiteley, R., 2010b. The future of the global food system. Philosophical Transactions of the Royal Society B-Biological sciences 365, 2769-2777.
Gopal, B., Junk, W.J., Davis, J.A., 2000. Biodiversity in wetlands: Assessment function and conservation. Volume 1. Blackhuys Publishers, Leiden, The Netherlands, pp. 353.
Green, S.B., Salkind, N.J., 2008. Using SPSS for Window and Macintosh: Analysing and understanding data (5th Ed.), Upper Saddle River, NJ: Pearson Prentice Hall.
Gunderson, H.L., Carpenter, S.R., Folke, C., Olsson, C., Peterson, G., 2006. Water RATs (Resilience, Adaptability, and Transformability) in Lake and wetland social-ecological system. Ecology and Society 11, 24-52.
Harper, D.M., Mavuti, K.M., 1996. Freshwater wetlands and marshes. In: McClanahan, T. and Young, T. (Eds.), East African Ecosystems and their Conservation. Oxford University Press, New York, USA.
Hauge, W., Ellingsen, T., 1998. Beyond environmental scarcity: causal pathways to conflict. Journal of Peace Research 35, 299–317.
Herrero, M., Thornton, P.K., Notenbaert, A.M., Wood, S., Msangi, S., Freeman, H.A., Bossio, D., Dixon, J., Peters, M., van de Steeg, J., Lynam, J., Rao, P.P., Macmillan, S., Gerard, B., McDermott, J., Sere, C., Rosegrant, M., 2010. Smart Investments in Sustainable Food Production: Revisiting Mixed Crop-Livestock Systems. Science 327, 822-825.
Herrero, M., Thornton, P.K., Gerber, P., Reid, R.S., 2009. Livestock, livelihoods and the environment: understanding the trade-offs. Current opinions in Environmental Sustainability 1, 111-120.
Hobbs, D.J., Beal, J.M., Bohlen, J.M., 1964. The relation of farm operator values and attitudes to their economic performance. Ames, Iowa: Iowa State
References
182
University, Department of Economics and Sociology, Rural Sociology Report No. 33, Iowa, USA.
Hollis, G.E., 1990. Environmental impact of development on wetlands in arid and semi-arid lands. Hydrological Sciences Journal 35, 411-428.
Hughes, R.H., Hughes, J.S., 1992. A directory of African wetlands. IUCN Publication Services Unit, Cambridge, UK, 805 pp.
ICRAF (World Agroforestry Centre) ,1995. Laboratory methods of soil and plant analysis. International Centre for Research in Agroforestry, Nairobi, Kenya.
Ikegami, K., 1994. The traditional agrosilvipastoral complex system in the Kilimanjaro region, and its implications for the Japanese assisted Lower Moshi Irrigation Project, African Study Monographs, 15, 189-209.
Ilbery, B.W., 1978. Agricultural decision-making: a behavioural perspective. Progress in Human Geography 2, 448-466.
IVC/WARDA (Inland Valley Consortium/West African Rice Development Association), 1997. A framework for regional cooperation for the sustainable development of inland valley agro-ecosystems in Sub-Saharan Africa. Inland Valley Consortium, West African Rice Development Association, Bouake, Côte d’Ivoire.
Izac, A. M., Swift, M. J., and Andriesse, W., 1991. A strategy for inland valley agro - ecosystem research in west and central Africa. RCMP Research Monograph No. 5, Resource and Crop Management Programme, Ibadan, Nigeria, 24 pp..
Jaetzold, R., Schmidt, H., Hornetz, B., Shisanya, C., 2006. Farm management handbook of Kenya, revised edition vol. II. Ministry of Agriculture, Nairobi, Kenya.
Jaetzold, R., Schmidt, H., 1982. Farm Management Handbook of Kenya, vol. II: Natural Conditions and Farm Management Information. Part B: Central Kenya, Kenya Ministry of Agriculture, Nairobi, Kenya.
Jogo, W., Hassan, R., 2010. Balancing the use of wetlands for economic well-being and ecological security: The case of the Limpopo wetland in southern Africa. Ecological Economics 69, 1569-1579.
Jongman, R.H.G., ter Braak, C.J.F., Van Tongeren, O.F.R., 1995. Data analysis in community and landscape ecology. Cambridge University Press, New York, USA, 299 pp.
Josten, H., Clarke, D., 2002. Wise use of mires and peatlands: Background and principles including a framework for decision making. International Mire Conservation Group. International Peat Society, Jyväskylä, Finland, 304 pp..
Junk, W.K., 2002. Long-term environmental trends and the future of the tropical wetlands. Environmental conservation 29, 414-435.
Kalinga. G.M., Shayo, E. 1998. Agriculture in the Tanzania wetlands. In FAO (Ed.), Wetland characterization and classification for sustainable agricultural development. Rome, Italy.

References
183
Kangalawe, R.Y.M., Liwenga, E.T., 2005. Livelihoods in the wetlands of Kilombero valley in Tanzania: Opportunities and challenges to integrated water resource management. Physics and Chemistry of the Earth 30, 968-975.
Kiai, S.P.M., Mailu, G.M., 1998. Wetland classification for agricultural development in Eastern and Southern Africa. In: FAO (Ed.), Wetland characterization and classification for sustainable agricultural development. Rome, Italy.
Kirk, G.J.D., 2004. The biogeochemistry of submerged soils. John Wiley and Sons. Chichester, UK.
Köbrich, C., Rehman, T., Khan, M., 2003. Typification of farming systems for constructing representative farm models: Two illustrations of the application of multivariate analyses in Chile and Pakistan. Agricultural Systems 76, 141-157.
Kohler, T., 1987. Land use in transition: Aspects and problems of small-scale farming in new environment, the example of Laikipia district. In: A5, A.S.S. (Eds.), Geographica Bernensia, Institute of Geography, University of Bern, Switzerland.
Lal, R., 1987. Managing the soils of sub-Saharan Africa. Science 236, 1069-1076. Lambin, E.F., Meyfroidt, P., 2011. Global land use change, economic globalization,
and the looming land scarcity. Proceedings of the National Academy of Sciences 108, 3465-3472.
Lambin, E.F., Geist, H.J., 2003. Regional differences in tropical deforestation. Environment 45, 22-36.
Lambin, E.F., Geist, H.J., Lepers, E., 2003. Dynamics of land-use and land-cover change in tropical regions, Annual Review of Environment and Resources, pp. 205-241.
Lambin, E.F., Turner, B.L., Geist, H.J., et al., 2001. The causes of land-use and land-cover change: Moving beyond the myths. Global Environmental Change 11, 261-269.
Le, Q.B., Park, S.J., Vlek, P.L.G., 2010. Land Use Dynamic Simulator (LUDAS): A multi-agent system model for simulating spatio-temporal dynamics of coupled human-landscape system. 2. Scenario-based application for impact assessment of land-use policies. Ecological Informatics 5, 203-221.
Le, Q.B., 2005. Multi-agent System for Simulation of Land-use and Land-cover Change: A theoretical framework and its first implementation for an upland watershed in the Central Coast of Vietnam. Ecology and Development Series, 29. Cuvillier Verlag Göttingen, Göttingen.
Lepš, J., Šmilauer, P., 2003. Multivariate analysis of ecological data using Canoco. University of Cambridge. The Pitt Building, Trumpington Street, Cambridge, UK.
Lynch, K., 1999. Commercial horticulture in rural Tanzania - an analysis of key influences. Geoforum 30, 171-183.
Maack, J.N., 2001. Scenario analysis: a tool for task managers. In: Krueger, R., Cassey, M., Donner, J., Kirch, S., Maack, J.N. (Eds.), Social analysis: Selected

References
184
Tools and Techniques. Social Development Paper 36. Social Development Department. World Bank, Washington DC, USA.
Mack, J.J., 2007. Developing a wetland IBI with statewide application after multiple testing iterations. International Journal of Ecological Indicators 7, 864-881.
Matthew, E., Fung, X., 1987. Natural wetlands. NASA/ Goddard Institute of Space Studies (GISS), Columbia University, New York, USA.
McCartney, M.P., Musiyandima, M,. Houghton-Carr, H.A., 2005. Working wetlands: Classifying wetland potential for agriculture. International Water Management Institute (IWMI), Research Report 90, Colombo, Sri Lanka, 35 pp..
McCartney, M.P., van Koppen, B., 2004. Sustainable Development and Management of Wetlands. Wetlands contributions to livelihoods in United Republic of Tanzania. IUCN, IWMI, FAO, FAO-Netherlands Partnership Programme, Rome, Italy, 42 pp..
Meinzen-Dick, R., Bakker, M., 1999. Irrigation systems as multiple-use commons: Water use in Kirindi Oya, Sri-lanka. Agriculture and Human Values 16, 281-293.
Mettrick, H., 1993. Development Oriented Research in Agriculture: an ICRA textbook. The International Centre for development oriented Research in Agriculture (ICRA), Wageningen, The Netherlands, 290 pp..
Meulman, J.J., Heiser, W.J., 2005. SPSS Categories 14.0. Chicago, IL: SPSS Inc. Available via SPSS at http://www.spss.com/SPSS Categories 14.0.
Mghase, J.J., Shiwachi, H., Nakasone, K., Takahashi, H., 2010. Agronomic and socio-economic constraints to high yield of upland rice in Tanzania. African Journal of Agricultural Research 5, 150-158.
Millennium Ecosystem Assessment (MEA), 2005. Ecosystems and human well-being: wetlands and water synthesis. World Resources Institute, Washington DC, USA.
MOA-URT, 2006. Soils of Tanzania and their potential for agriculture development. Mlingano agricultural research institute and department of research and training, ministry of agriculture, food security and cooperatives, Tanga, Tanzania.
Mwakaje, A.G., 2009. Wetlands, livelihoods and sustainability in Tanzania. African Journal of Ecology 47, 179-184.
Mwita, E.J., 2010. Remote sensing based assessment of small wetlands in East Africa. Bonn University, Bonn, Germany 190 pp..
National Investment Brief Tanzania, 2008. High-level conference on: water for agriculture and energy in Africa: the challenges of climate change. Sirte, Libyan Arab Jamhiriya, 15-17 December, 2008 at http://www.sirtewaterandenergy.org/docs/reports/Tanzania-Draft2.pdf.
Norman, D.W., Worman, F.D., Siebert, J.D., Modiakglota, E., 1995. The farming systems approach to development and appropriate technology generation. FAO Farm Systems Management Series Nr.10, Rome, Italy.

References
185
Olindo, P., 1992. Food policy and wetlands. In: Crafter, S.A., Njuguna, S.G., Howard, G.W. (Eds.), Wetlands of Kenya, Proceedings of the KWWG Seminar on Wetlands of Kenya, Nairobi, Kenya, 3-5 July 1991. IUCN, Gland, Switzerland, pp.173-174.
Omernik, J.M., 1987. Map Supplement: Ecoregions of the conterminous United States. Map (scale 1:7,500,000). Annals of the Association of American Geographers 77, 118-125.
Oucho J.O., Gould, W.T.S., 1993. Internal migration, urbanization and population distribution. pp. 256-296. In: Foote, K.A., Hill, K.H., Martin, L.G. (Eds.), Demographic change in sub-Saharan Africa. National Academic Press, Washington DC, USA.
Overmars, K.P., Verburg, P.H., 2005. Analysis of land use drivers at the watershed and household level: Linking two paradigms at the Philippine forest fringe. International Journal of Geographical Information Science 19, 125-152.
Parker, D.C., Hessl, A., Davis, S.C., 2008. Complexity, land-use modeling, and the human dimension: Fundamental challenges for mapping unknown outcome spaces. Geoforum 39, 789-804.
Parker, D.C., Berger, T., Manson, S.M., 2002. Agent-based models of land-use/land-cover change: report and review of an international workshop. LUCC Focus 1 Publication 6: Bloomington, USA.
Pender, J., Place, F., Ehui, S. (Eds.), 2006. Strategies for sustainable land management in the East African Highlands Washington, DC: International Food Policy Research Institute (IFPRI) and World Bank, 483 pp., Washington, DC, USA.
Pfeiffer, R., 1990. Sustainable agriculture in practice-the production potential and the environmental effects of macro-contourlines in the West Usambara Mountains, PhD thesis, University of Hohnenheim, Germany.
Pickett, S.T.A., White, P.S., 1985. The ecology of natural disturbance and patch dynamics. Academic Press, New York, USA.
Ramsar Convention Secretariat (Eds.), 2006. The Ramsar Convention Manual: a guide to the Convention on Wetlands (Ramsar, Iran, 1971). 4th edition, Ramsar Convention Secretariat Gland, 118 pp..
Raunet, M., 1985. Bas-fonds et riziculture en Afrique. Approche structurale et comparative. L'Agronomie Tropicale 40, 181-201.
Rebelo, L.M., McCartney, M.P., Finlayson, C.M., 2010. Wetlands of sub-Saharan Africa: distribution and contribution of agriculture to livelihoods. Journal of Wetland Ecology and Management 18, 557-572.
Rebelo, L.M., Finlayson, M., Nagabhatla, N., 2009. Remote sensing and GIS for wetland inventory, mapping and change analysis. Journal of Environmental Management, 90 2234-2242.
Reenberg, A., Paarup-Laursen, B., 1997. Determinants for land use strategies in a Sahelian agro-ecosystem - Anthropological and ecological geographical aspects of natural resource management. Agricultural Systems 53, 209-229.

References
186
Reid, R.S, Galvin, K.A., Kruska, R.S., 2008. Global significance of extensive grazing lands and pastoral societies: an introduction. In Galvin, K.A., Reid, R.S., Behnke, R.H., Tobbs, N.T. (Eds.), Fragmentation in semi-arid and arid landscapes: Consequences for human and natural systems, Springer, Dorthecht, The Netherlands, pp.1-24.
Riveiro, J.A., Marey, M.F., Marco, J.L., Alvarez, C.J., 2008. Procedure for the classification and characterization of farms for agricultural production planning: Application in the Northwest of Spain. Computers and Electronics in Agriculture 61, 169-178.
Roberts, N., 1988. Dambos in development: management of a fragile ecological resource. Journal of Biogeography 15, 141-148.
Roggeri, H., 1995. Tropical freshwater wetlands: a guide to current knowledge and sustainable management. Kluwer Academic Publishers, Dordecht, The Netherlands, pp. 341.
Rosegrant, M. W., Fernandez, M., Sinha, A., et al., 2009b. Looking into the future for agriculture and AKST (Agricultural Knowledge Science and Technology). Chapter 5 (pp. 307-376) in Agriculture at a Crossroads (Eds., B D McIntyre, H R Herren, J Wakhungu, R T Watson), Island Press, Washington D.C., USA.
Rosegrant, M.W., Cai, X.M., 2002. Global water demand and supply projections: part 2. Results and prospects to 2025. Water International 27, 170-182.
Rosegrant, M.W., Ringler, C., Zhu, T., 2009. Water for agriculture: Maintaining food security under growing scarcity. Annual Review of Environment and Resources, pp. 205-222.
Ruthenberg, H., 1976. Farming systems in the tropics. 2nd edition. Clarendon Press, Oxford, U.K. pp. 104-116.
Sakané, N., Alvarez, M., Becker, M., Böhme, B., Handa, C., Kamiri, H.W., Langensiepen, M., Menz, G., Misana, S., Mogha, N.G., Möseler, B., Mwita, E.J., Oyieke, A.H., van Wijk, M.T., 2011. Classification, characterisation, and use of small wetlands in East Africa. Wetlands (WELA395R3).
Salasya, B.D.S., 2005. Crop Production and Soil Nutrient Management: An Economic Analysis of Households in Western and Central Kenya. PhD Thesis Development Economics, Wageningen University, The Netherlands, 185 pp..
Sanchez, P.A., Shepherd, K.D., Soule, M.J., Place, F.M., Buresh, R.J., Izac, A.-M.N., Mokwunye, A.U., Kwesiga, F.R., Ndiritu, C.G., Woomer, P.L., 1997. Soil fertility replenishment in Africa: an investment in natural resource capital. In: Buresh, R.J., Sanchez, P.A. Calhoun, F. (Eds.), Replenishing soil fertility in Africa. Soil Science Society of America, Inc. and American Society of Agronomy, Inc.
Sandford, J., Ashley, S., 2008. Livestock livelihoods and institutions in the IGAD region. IGAD Livestock Policy Initiative working paper 10 2008. www.igad-lpi.org.

References
187
Scanlon, B.R., Jolly, I., Sophocleous, M., Zhang, L., 2007. Global impacts of conversions from natural to agricultural ecosystems on water resources: Quantity versus quality. Water Resource Research 43 (3), art. no. W03437.
Schuijt, K., 2002. Land and water use of wetlands in Africa: Economic values of
African wetlands, Interim Report IR-02-063. International Institute for Applied Systems Analysis, Luxemburg, Austria, 46 pp..
Schuyt, K.D., 2005. Economic consequences of wetland degradation for local populations in Africa. Ecological Economics 53, 177-190.
Scoones, I., 1991. Wetlands in drylands: Key resources for agricultural and pastoral production in Africa. Ambio 20, 366-371.
Shepherd, K.D., Walsh, M.G., 2007. Infrared spectroscopy-enabling an evidence-based diagnostic surveillance approach to agricultural and environmental management in developing countries. Journal of Near Infrared Spectroscopy 15, 1-19.
Siebert, R., Toogood, M., Knierim, A., 2006. Factors affecting European farmers’ participation in biodiversity policies. Sociologia Ruralis 46, 318-340.
Silvius, M.J., Oneka, M., Verhagen, A., 2000. Wetlands: Lifeline for people at the edge. Physics and Chemistry of the Earth, Part B: Hydrology, Oceans and Atmosphere 25, 645-652.
Smith, J.B., Schnellnhuber, H.J., Qader Mirza, M. et al., 2001. Vulnerability to climate change and reasons for concern: A synthesis. In: McCarthy, J.J. (Ed.), Climate change, 2001: Impacts, adaptation and vulnerability. Cambridge University Press, Cambridge, UK, pp. 913-967.
Smith, P., Gregory, P.J., van Vuuren, D., Obersteiner, M., Havlík, P., Rounsevell, M., Woods, J., Stehfest, E., Bellarby, J., 2010. Competing for land. Philosophical Transactions of the Royal Society B: Biological Sciences B 2010 365, 2941-2957.
Solomon M., Abbott, P., Sishaw, T., Afework, H., 2000. Socio-economic determinants of wetland use in Metu and Yayu-Hurumu weredas, Illubabor. Report 1 for Objective 3. Ethiopian Wetlands Research Project: Metu, Ethiopia and Huddersfield.
Sombroek, W.G., Braun, J.P., van der Pouw, B.J.A., 1982. Exploratory Soil Map and Agro-climatic zone map of Kenya, scale 1:1000000. Exploratory soil survey report No. E1. Kenya Soil Survey, Nairobi, Kenya.
Staal, S.J., Owango, M., Muruiki, H., et al., 2001. Dairy systems characterisation of greater Nairobi milk shed. SDP (Smallholder Dairy (R&D) Project) Research Report, Ministry of Agriculture, Kenya Agricultural Research Institute and International Livestock Research Institute, Nairobi, Kenya, 73 pp..
Tenge, A.J.M., 2005. Participatory appraisal for farm level soil and water conservation planning in West Usambara highlands, Tanzania. PhD Thesis, Tropical Resource Management Papers, No. 63. Wageningen University, Wageningen, The Netherlands.
References
188
Thenkabail, P.S., Nolte, C., 1996. Capabilities of landsat-5 thematic mapper (tm) data in regional mapping and characterization of inland valley agro-ecosystems in West Africa. International Journal of Remote Sensing 17, 1505-1538.
Thenya, T., 2001. Challenges of conservation of dryland shallow waters, Ewaso Narok swamp, Laikipia district, Kenya. Hydrobiologia 458, 107-119.
Thenya, T., 1998. Some ecological aspects, bio-economic values and human impact of a tropical papyrus wetland, Ewaso Narok swamp, Laikipia District, Kenya. MSc. Thesis Department of Geography, University of Nairobi, Kenya.
Thornton, P.K., 2010. Livestock production: recent trends, future prospects. Philosophical Transactions of the Royal Society B-Biological sciences 365, 2853-2867.
Tiner, R.W., 1999. Wetland indicators. A guide to wetland identification, delineation, classification, and mapping. Lewis Publishers, Boca Raton, Florida, USA.
Tittonell, P., Muriuki, A., Shepherd, K.D., Mugendi, D., Kaizzi, K.C., Okeyo, J., Verchot, L., Coe, R., Vanlauwe, B., 2010. The diversity of rural livelihoods and their influence on soil fertility in agricultural systems of East Africa - a typology of smallholder farms. Agricultural Systems 103, 83-97.
Tittonell, A.P., 2008. Msimu wa Kupanda: Targeting Resources within Diverse, Heterogeneous and Dynamic Farming Systems of East Africa. PhD Thesis, Wageningen University, The Netherlands.
Tittonell, P., Vanlauwe, B., Leffelaar, P., Rowe, E. and Giller, K., 2005a. Exploring diversity in soil fertility management of smallholder farms of western Kenya I. Heterogeneity at region and farm scales. Agriculture, Ecosystems and Environment 110, 149-165.
Valbuena, D., Verburg, P.H., Bregt, A.K., Ligtenberg, A., 2010a. An agent-based approach to model land-use change at a regional scale. Landscape Ecology 25, 185-199.
Valbuena, D., Verburg, P.H., Bregt, A.K., 2008. A method to define a typology for agent-based analysis in regional land-use research. Agriculture, Ecosystems and Environment 128, 27-36.
Van de Steeg, J.A., Verburg, P.H., Baltenweck, I., Staal, S.J., 2010. Characterization of the spatial distribution of farming systems in the Kenyan highlands. Applied Geography 30, 239-253.
van den Bor, W., Bryden, J.M., Fuller, A.M., 1997. Rethinking rural human resource management: the impact of globalisation and rural restructuring on rural education and training in Western Europe. In: Mansholt Studies. Mansholt Institute, Wageningen, pp. 241.
van der Heyden, C.J., 2004. The hydrology and hydrogeology of dambos: A review. Progress in Physical Geography 28, 544-564.

References
189
van der Heyden, C.J., New, M.G., 2003. The role of a dambo in the hydrology of a catchment and the river network downstream. Hydrology and Earth System Sciences 7, 339-357.
Vanlauwe, B., Giller, K.E., 2006. Popular myths around soil fertility management in sub-Saharan Africa. Agriculture, Ecosystems and Environment 116, 34-46.
Verburg, P.H., 2006. Simulating feedbacks in land use and land cover change models. Landscape Ecology 21, 1171-1183.
Verburg, P.H., Schot, P.P., Dijst, M.J., Veldkamp, A., 2004. Land use change modelling: current practice and research priorities. GeoJournal 61, 309-324.
Verhoeven, J.T.A., Setter, T.L., 2009. Agricultural use of wetlands: Opportunities and limitations. Annals of Botany 105, 155-163.
Wakatsuki, T., Masunaga, T., 2005. Ecological engineering for sustainable food production and the restoration of degraded watersheds in tropics of low pH soils: Focus on West Africa. Soil Science and Plant Nutrition 51, 629-636.
Wiggins, S., Proctor, S., 2001. How special are rural areas? The economic implications of location for rural development. Development Policy Review Journal 19, 427-436.
Windmeijer, P.N., Andriesse, W., 1993. Inland valleys in West Africa: An agro-ecological characterization of rice-growing environments. ILRI Publication No. 52, Vol. 52. International Institute for Land Reclamation and Improvement, Wageningen, The Netherlands, 160 pp.
Wood, A., van Halsema, G.E., 2008. Scoping agriculture-wetland interactions: towards a sustainable multiple-response strategy. FAO Water Report 33, Food and Agriculture Organization of the United Nations, Rome, Italy.
Wood, A.P., Dixon, A.B., 2002. Sustainable wetland management in Illubabor zone: Research Report Summaries. The University of Huddersfield and Wetland Action, Huddersfield, UK.
Wood, A., Hailu, A., Abbot, P., Dixon, A. 2002. Sustainable management of wetlands in Ethiopia: Local knowledge vs. government policy. In: Gawler, M. (Ed.), Strategies for wise use of wetlands. Best practices in participatory management. IUCN, WWF Publication No. 56, Wageningen, The Netherlands, pp. 81-88.
Wood, A.P., Dixon, A.B., 2001. Sustaining the flow: community management of highland wetlands in south-west Ethiopia. In Mountains of the World: Community Development between Subsidy, Subsidiarity and Sustainability, Proceedings of the World Mountain Symposium, 30th September - 4th October 2001, Interlaken, Switzerland, Berne, Swiss Development Cooperation. www.wms2001.ch/cd/publications/publication-100.html.
Wood, A.P., 1996. Wetlands in the Highlands: The search for sustainable use of the valley bottom swamp in the highlands of south-west Ethiopia. Department of Geographical and Environmental Science, University of Huddersfield, UK.
Woodhouse, P., Bernstein, H., Hulme, D., 2000. African enclosures? The social dynamics of wetlands in drylands. James Currey, Oxford, UK.

References
190
WRI (World Resources Institute), 2005. UNDP (United Nations Development Programme), UNEP (United Nations Environment Programme), World Bank, World resources 2005: The wealth of the poor-Managing ecosystems to fight poverty. World Resources Institute, Washington, DC.
Zingore S., 2006. Exploring diversity within smallholder farming systems in Zimbabwe: Nutrient use efficiencies and resource management strategies for crop production, Wageningen University, Wageningen, The Netherlands.
Zoomers, A., 2010. Globalisation and the foreignisation of space: Seven processes
driving the current global land grab. Journal of Peasant Studies 37, 429-447.
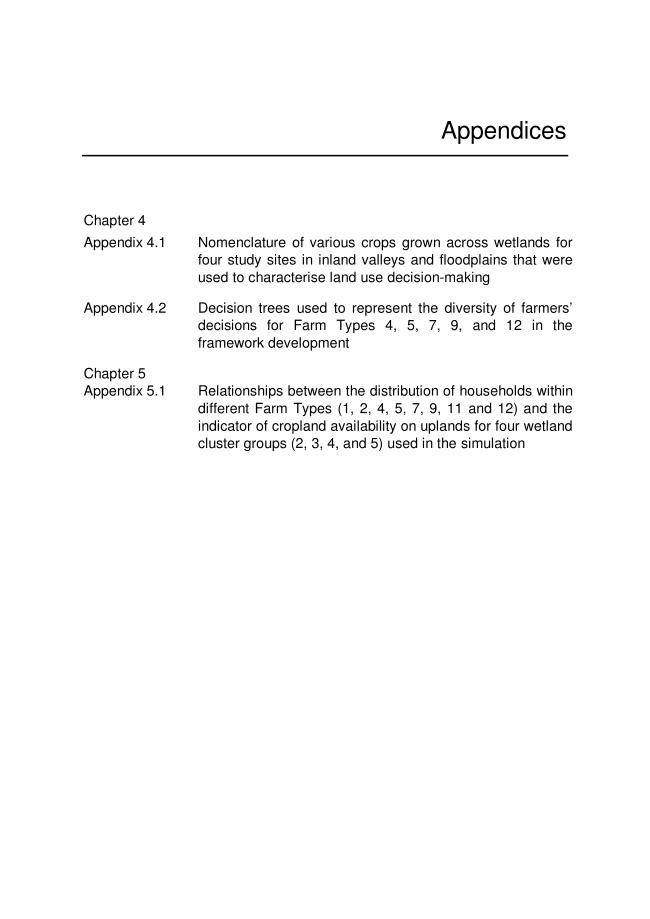
Appendices
Chapter 4
Appendix 4.1 Nomenclature of various crops grown across wetlands for four study sites in inland valleys and floodplains that were used to characterise land use decision-making
Appendix 4.2 Decision trees used to represent the diversity of farmers’ decisions for Farm Types 4, 5, 7, 9, and 12 in the framework development
Chapter 5 Appendix 5.1 Relationships between the distribution of households within
different Farm Types (1, 2, 4, 5, 7, 9, 11 and 12) and the indicator of cropland availability on uplands for four wetland cluster groups (2, 3, 4, and 5) used in the simulation

Appendices
192
Appendix 4.1 – Nomenclature of various crops grown across wetlands
for four study sites in inland valleys and floodplains that were used to
characterise land use decision-making in Chapter 4
Summary of identified crops per category practiced by farmers in their wetland fields during
field surveys conducted between January and July 2009 in Kenya and in Tanzania
Crop category English name Scientific name Family High-value cash crop
Tomato Solanum lycopersicum L. Solanaceae Potato Solanum tuberosum L. Solanaceae Cabbage Brassica oleracea L. Brassicaceae Cauliflower Brassica oleracea L. var. botrytis
L. Brassicaceae
Broccoli Brassica oleracea L. var. botrytis L.
Brassicaceae
Kale Brassica oleracea var. acephala DC.
Brassicaeae
Carrot Daucus carota L. Apiaceae Eggplant Solanum melongena L. Solanaceae Fresh baby / sweet corn Zea mays L. Gramineae PoaceaeGreen bean Phaseolus vulgaris L. Papilionaceae Green pepper Capsicum annuum Piperaceae Leek Allium porrum L. Lilliaceae Onion Allium cepa (L.) var ascalonicum
(L.) Backer Lilliaceae
Snow peas Pisum sativum L. Fabaceae Amaranth Amaranthus spp. Amaranthaceae Salad Poterium sanguisorba L. Rosaceae Spinach Spinacea oleracea L. Chenopodiaceae
Rice Rice Oryza sativa L. Gramineae Poaceae Upland food crop
Maize Zea mays L. Gramineae PoaceaeBeans Phaseolus vulgaris L. Papilionaceae Cassava Manihot esculenta Crantz Euphorbiaceae Sweet potato Ipomoea batatas L. Convolvulaceae
Traditional vegetable
African eggplant Solanum aethiopicum L. Solanaceae Okra Abelmoschus esculentus (L.)
Moench Malvaceae
Fodder crop Napier grass Pennisetum purpureum
Schumach Poaceae
Others Balloon milkweed or
balloon wild cotton or hairy balls
Gomphocarpus physocarpus E. Mey.
Apocynaceae
Sugarcane Saccharum officinarum Poaceae Tobacco Nicotiana tabacum L. Solanaceae

Appendices
193
Appendix 4.2 – Decision trees used to represent the diversity of
farmers’ decisions for Farm Types 4, 5, 7, 9, and 12 in the framework
development (Chapter 4)
Soil texture of wetland cluster group (WCG) & HH dependency
Clay soils of WCG 4 & ≤ 0.5 (5%) Sandy clay loamy soils of WCG 5 & > 0.5 (95%)
Intensive high-value crop-based
Narrow inland valleys with good access to market
FT 4: HH has access to agriculturally land on upland for staple food crop production in integration with dairy farming
Drainage patterns & Hh gender
Complete drainage & Male (50%)
Partial drainage & Female (50%)
Intensive upland food crop-based
Extensive arrow root-based
A

Appendices
194
B
Wetland field size
< 0.5 (97%)
Hh Age & gender
< 55 & Male (37%) ≥ 55 & Female (50%)
HH labour ≤ 1 & demand for land
WCG 4 (100%)
Wetland cluster group (WCG) with clay soils
Good access to market
FT 5: HH has access to agriculturally land on upland for primary cash crop production in integration with dairy farming
≥ 0.5 (3%)
Intensive high-value upland food crops rotation
Extensive arrow root-based
55%
Intensive upland-food crop-base
Renting-out land and fallow-based
< 55 & Female (13%)
45%
Appendix 4.2 continued ...

Appendices
195
App
endi
x 4.
2 co
ntin
ued
... Cla
y l
oam
y s
oil
s o
f W
CG
2:
low
to
mo
dera
te
ac
cess
to
mark
et
(38%
)
FT
7:
HH
ha
s n
o a
cces
s t
o l
an
d o
n t
he
ad
jac
en
t u
pla
nd
fo
r c
rop
pro
du
cti
on
bu
t o
wn
s l
ivesto
ck
San
dy c
lay s
oil
s u
nd
er
se
aso
nal
flo
od
s o
f W
CG
3:
mo
dera
te
ac
cess
to
mark
et
(4
%)
So
cio
-eco
log
ical
ch
ara
cte
ris
tic
s o
f w
etl
an
d c
luste
r g
rou
p (
WC
G)
Rain
fed
ric
e-
fall
ow
syste
m
Flo
od
ing
du
rati
on
of
wetl
an
d f
ield
&
HH
no
n-d
air
y c
att
le o
wn
ers
hip
> 3
week
s &
no
Wetl
an
d f
ield
siz
e &
HH
no
n-d
air
y c
att
le o
wn
ers
hip
Co
mp
lete
ly d
rain
ed
cla
y
so
ils o
f W
CG
4:
go
od
ac
ces
s t
o m
ark
et
(58%
)
Hh
ow
ns
sm
all
ru
min
an
ts
Wetl
an
d f
ield
siz
e
≤ 0
.1 h
a (
14%
)
Up
lan
d f
oo
d c
rop
-arr
ow
ro
ot-
ba
sed
> 0
.1 h
a (
86
%)
no
(75%
)y
es (
25%
)
Inte
nsiv
e u
pla
nd
fo
od
&
hig
h v
alu
e c
rop
s
Inte
nsiv
e
up
lan
d f
oo
d
≤ 0
.7 h
a &
yes (
78%
)
Hig
h-v
alu
e c
rop
-g
raz
ing
based
≤ 0
.7 h
a &
no
(22
%)
Up
lan
d f
oo
d
cro
p-g
raz
ing
Up
lan
d f
oo
d &
hig
h-
va
lue
cro
ps-g
razin
g
(50%
)(5
0%
)
(C)

Appendices
196
FT
9:
HH
ow
ns l
ivescto
k (
no
n-d
air
y-c
att
le
an
d /
or
sm
all
ru
min
an
ts)
an
d h
as l
imit
ed
access t
o
ag
ricu
ltu
rall
y l
an
d o
n u
pla
nd
fo
r sta
ple
fo
od
cro
p (
up
lan
d p
er
cap
ita <
= 0
.6 h
a p
er
pers
on
)
Wetl
an
d f
ield
siz
e
> 0
.5 h
a (
68%
)≤ 0
.5 h
a (
32%
)
HH
access t
o c
rop
lan
d o
n u
pla
nd
&
HH
to
tal
nu
mb
er
of
livesto
ck
no
& l
ivesto
ck n
um
ber
≤ 7
.5 T
LU
(62%
)yes &
liv
esto
ck n
um
ber
> 7
.5 T
LU
(23%
)
Hig
h-v
alu
e c
rop
-g
razin
g s
yste
m
yes &
liv
esto
ck n
um
ber
≤7.5
TL
U (
15%
)
Do
ub
le h
igh
-valu
e
cro
p-b
ased
Inte
nsiv
e h
igh
-valu
e c
rop
syste
m
No
ne (
88%
)
HH
off
-farm
in
co
me
No
n-p
erm
an
en
t (1
2%
)
Up
lan
d f
oo
d &
hig
h-
valu
e c
rop
s-b
ased
Do
ub
le h
igh
-valu
e
cro
p-b
ased
(D)
App
endi
x 4.
2 co
ntin
ued
...

Appendices
197
WCG 4 & > 0.01 ha/TLU (30%)
FT 12: HH relies on free access to land in the wetland and on adjacent grassland for livestock production
Wetland cluster group (WCG)
Stocking rate
WCG 2 & ≤ 0.01 ha/TLU (70%)
Intensive grazing land systems
Rate of increase in livestock size (25.6% TLU per year)
Extensive grazing land systems
Land use decision diagram representing main land uses, factors driving such choices, thresholds and methods to undertake farming activities carried out in the wetland by the households typologies for five Farm Types: 4. Upland food crop and market-oriented high-value crop-dairy cattle- (A), 5. Upland cash crop-wetland mixed uses and dairy cattle- (B), 7. Wetland-dependent upland food crop- non-dairy cattle- (C), 9. Wetland-dependent market-oriented high-value crop-non-dairy cattle- (D), and 12. Wetland-upland-dependent livestock-based systems (E).
(E)
Appendix 4.2 continued ...
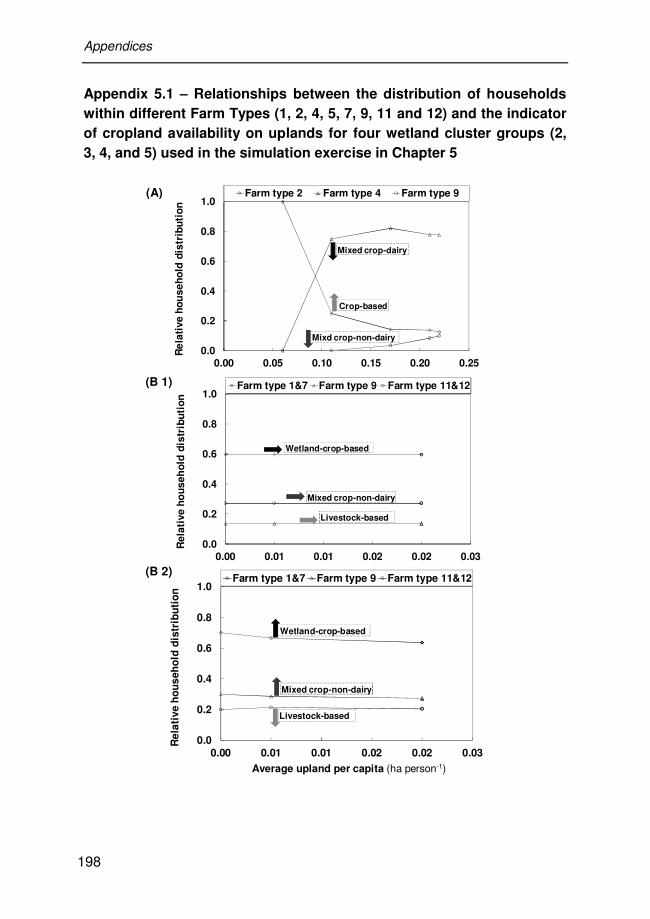
Appendices
198
Appendix 5.1 – Relationships between the distribution of households
within different Farm Types (1, 2, 4, 5, 7, 9, 11 and 12) and the indicator
of cropland availability on uplands for four wetland cluster groups (2,
3, 4, and 5) used in the simulation exercise in Chapter 5
0.0
0.2
0.4
0.6
0.8
1.0
0.00 0.05 0.10 0.15 0.20 0.25
Re
lati
ve
ho
us
eh
old
dis
trib
uti
on
Average upland per capita (ha person-1)
Farm type 2 Farm type 4 Farm type 9
Mixed crop-dairy
Mixd crop-non-dairy
Crop-based
0.0
0.2
0.4
0.6
0.8
1.0
0.00 0.01 0.01 0.02 0.02 0.03
Re
lati
ve
ho
us
eh
old
dis
trib
uti
on
-1
Farm type 1&7 Farm type 9 Farm type 11&12
Mixed crop-non-dairy
Livestock-based
Wetland-crop-based
0.0
0.2
0.4
0.6
0.8
1.0
0.00 0.01 0.01 0.02 0.02 0.03
Re
lati
ve h
ou
seh
old
dis
trib
uti
on
Average upland per capita (ha person-1)
Farm type 1&7 Farm type 9 Farm type 11&12
Mixed crop-non-dairy
Livestock-based
Wetland-crop-based
(A)
(B 1)
(B 2)

Appendices
199
0.0
0.2
0.4
0.6
0.8
1.0
0.00 0.05 0.10 0.15 0.20 0.25
Re
lati
ve h
ou
seh
old
dis
trib
uti
on
Farm type 1 Farm type 5 Farm type 7
Mixed crop-dairy
Mixed crop-non-dairy
Wetland crop-based
0.0
0.2
0.4
0.6
0.8
1.0
0.00 0.05 0.10 0.15 0.20 0.25Re
lati
ve
ho
us
eh
old
dis
trib
uti
on
Average upland per capita (ha person-1)
Farm type 1 Farm type 2 Farm type 8
Mixed crop-non-dairy
Wetland-upland-crop-based
Wetland-crop-based
0.0
0.2
0.4
0.6
0.8
1.0
0.00 0.05 0.10 0.15 0.20 0.25
Re
lati
ve
ho
us
eh
old
dis
trib
uti
on
Average upland per capita (ha person-1)
Farm type 1 Farm type 2 Farm type 8
Mixed crop-livestock-based
Wetland-upland crop-based
Wetland-crop-based
Relationships between the average land available on uplands for each household member
(upland per capita) and relative household distribution within derived Farm Types for: WCG 4 (A) in the highland inland valley; WCG 2; (B 1) and WCG 4 (B 2) in the highland floodplain in
Kenya; WCG 5 (C) in the midland inland valley; WCG 2 (D 1) and WCG 3 (D 2); and in the
lowland floodplain in Tanzania.
(C)
(D 1)
(D 2)
Appendix 5.1 continued ...


201
Sum
mar
y
Summary
Small wetlands increasingly become important agricultural production niches for rural households in sub-Saharan African (SSA). Efforts to meet food production from decreasing arable land and to diversify rural livelihood systems lead to cropland expansion on traditionally unused wetland areas. Wetlands perform various ecological functions and provide a wide range of social and economic benefits to different users with diverse interests. Specifically, wetlands play a vital role in rural livelihood systems in SSA where their use provides drinking water and thatching materials, food, and income to local communities with access to such areas. Particularly, small wetlands (≤ 500 ha) are traditionally linked to crop and livestock systems in East Africa, providing options to address food and forage shortages caused by drought. Changes in wetland systems are event-driven and a cumulative result of individual farmer’s decisions of land uses. Therefore, the overall objective of this dissertation was to develop a method that takes account of individual decision-making to study the current uses of wetlands by smallholders and how wetlands may develop in the future.
Wetlands occur in contrasting landscape units (i.e. lowlands vs. midlands. vs. highlands) in East Africa that characterise the environmental and agroecological diversity of the region. Narrow inland valleys and floodplains dominate the resulting diversity of wetlands associated with these contrasting features. Specifically, small wetlands constitute a greater proportion (80%) of the total wetland area, covering about 12 million ha in Kenya and Tanzania. Agroecology coupled with differences in markets and population density of the rural areas determines different land uses patterns across them. Furthermore, social diversity, farmer’s production orientations and objectives, access to land resources, and livelihood strategies contribute to shaping agricultural production diversities across wetlands. Finally, the interactions of local factors with socio-economic change and national policies substantially influence changes in land use decisions by smallholders. A framework (decision tree) in which systems analysis is aided by surveys and modelling is used to analyse changes in land uses as the response farmers’ decisions to socio-economic, environmental, and political changes. The study is based on data collected through rapid rural and participative approaches and wetland mapping in small wetlands environments in Kenya (Mount Kenya, Central Kenya and

Summary
202
Sum
mary
Aberdares, Rift Valley) and in northeastern Tanzania (West Usambara mountains and Pangani plain, Tanga region) in 2008-2009. Diverse methods that include wetland classification, farm typologies, identification of drivers of land use change and farmers’ decision-making are employed in the system analysis.
A case study from 51 wetlands identified within a total area of 484 km2 in contrasting landscape units (lowland, midland, and highland) at the study sites were characterised to identify and understand the drivers of diversity of wetlands and uses (Chapter 2). These wetlands comprised inland valleys and floodplains that covered about 0.5% (≈ 3647 ha) of the total land area at the study sites. The two wetland categories differed in geomorphology (e.g. size (≤ 35 ha vs. 10 – 458 ha), altitude (280 vs. 2300 m), shape (concave vs. flat), and soil types (e.g. Gleysols and Histosols vs. Fluvisols and Vertisols). Geomorphological and agroecological differences resulted in wide variability in the inherent properties of soils (e.g. high vs. low organic C and N and low vs. high available P), hydrological regimes (e.g. permanent vs. seasonal. vs. sporadic), and associated vegetation (e.g. Typha capensis vs. Cyperus papyrus) between wetland types across sites. Despite differences in population density and market opportunities across sites, wetlands exhibited similar land use patterns, with 87% of their total area under agricultural production and only 17% under semi-natural to natural vegetation.
Based on the dominant use types, each wetland was subdivided into sub-units of ≥ 0.5 ha of area size. The resultant 157 wetland sub-units were categorised into five wetland cluster groups (WCGs) using multivariate analysis based on geomorphology (e.g. wetland type, shape, size, hydrological regime, and soil fertility indicators), land use factors (e.g. drainage patterns, use intensity, and fertiliser) and market opportunity. Derived WCGs were: 1. Narrow permanently flooded inland valleys that are largely unused; 2. Wide permanently flooded inland valleys and highland floodplains under extensive use; 3. Large inland valleys and lowland floodplains with seasonal flooding under medium use intensity; 4. Completely drained wide inland valleys and highland floodplains under intensive food crop production; and 5. Narrow valleys drained for continuous high-value crops production. These WGCs differed in land uses and socio-ecological conditions. Access to wetland area, available arable land on upland coupled with population growth, markets, government policies, and rural livelihood dynamics influenced wetland agricultural use in rural areas.

Summary
203
Sum
mar
y
This wetland typology guided the selection of representative wetlands for the modelling exercise.
Case study farms (n = 275) from four WGCs (2-5) of two inland valleys and two floodplains from humid and semi-arid highlands in Kenya and humid midlands and sub-humid lowlands in Tanzania were characterised to identify the diversity of production systems and farmers’ land use decisions and to understand the main drivers of farm heterogeneity and the diversity of farmers’ decision-making of wetland uses (Chapter 3). The four wetlands covered 38% (≈ 1393 ha) of the total wetland area surveyed. Wetland size differed with each type (e.g. floodplain size was 5- to 25-fold more than that of inland valley). Across sites, differences in agroecology, markets, and population density coupled with those in access to production land, off-farm income, and livelihood strategies translated in subsistence and cash-crop smallholdings in wetland and wetland-upland to large scale export-oriented farming on upland resources. Specifically, wide diversity was observed in wetland field size and its contribution to farm size per family across and within sites. The dependency ratio (i.e. wetland field size: farm size) differed between wetland types and decreased with the potential of the area for agricultural production (e.g. 0.2 for humid areas vs. ≥ 0.6 for drier areas). Crop and livestock integrated systems differed among sites and farmers of different social status. Land use systems varied between production resources (upland vs. wetlands), reflecting the various biophysical and socio-economic conditions and differences in production factors, orientation, and objectives among farmers. Such differences were captured in four main production systems: crop-, crop-dairy-, crop-non-dairy-, and livestock-based systems. The occurrence of these systems varied with the population density and its subsequent land shortage at study sites (e.g. crop-based systems in dry areas with low population (i.e. ≤ 32 person km-2) vs. crop-dairy integration in humid areas with dense population). Based on a combination of production systems (livestock ownership, type, and its integration with crops), land resource (upland, wetland, and their combination), and production objectives (subsistence, cash, and cultural), households were categorised into 12 Farm Types: 1 and 2. Wetland mixed- and wetland cash-upland-subsistence-based crop farms; 3, 4, 5, and 6. Wetland-cash, wetland-cash and upland-subsistence, wetland-mixed and upland-cash, and wetland-water withdrawal and upland-horticultural crop-dairy-based farms; 7, 8, 9, and 10. Wetland-subsistence, wetland-semi-market and upland-subsistence, wetland-cash, and wetland-upland-mixed crop-non-
Summary
204
Sum
mary
dairy-based farms; 11. Wetland-subsistence crop-wetland-upland cultural oriented livestock-based farms; and 12. Wetland-upland cultural oriented livestock-based farms. Differences in production resources, access to cropland on uplands, access to markets, and non-wetland related livelihood strategies among farm types translated in differential land use patterns in wetlands. Smallholder agrowetland households were therefore highly diverse, heterogeneous, and dynamic, operating in complex socio-ecological environments. Relating wetland and household typologies showed that wetland-agricultural systems are complex and characterised by interactions between heterogeneous human decision-makers (i.e. the farmers) and their biophysical environment (i.e. the wetlands units). Furthermore, household typologies captured various dimensions in values, attitudes, and goals of farmers (e.g. cultural-oriented production of livestock-based farms of Type 12). Such factors determine the heterogeneity of farmer’s behaviour and decisions as they define farmers’ preferential choice options and hence influence their actions and land use decisions. Thus, typologies help to simplify and represent land uses and households’ decision-making.
A hierarchical nested decision-tree model was developed to represent the diversity of decision-making and used to analyse the effects of such diversity on changes in land conversion, fallow, and use processes of wetland systems. Diverse methods that include wetland classification, farm typologies, identification of key drivers of land use decisions and motives for crop choice, estimation of land conversion and fallow, probabilistic and heuristic decision-making by farmers were used for the framework development. The explicit description of the decision-making mechanisms of land development and use processes that drive agricultural use and change in wetland systems improved the understanding of the system functioning. Livelihood strategies, land scarcity, access to land, land and water availability, soil properties, resource endowment, and markets substantially influenced land use decisions in the wetlands. Differential patterns in the interactions between these factors led to wide variability in rates of land conversion between wetland cluster groups (e.g. 0.6 vs. 1.4 ha year-1 for WCG 5 and 3) and in fallow rates between farm types (e.g. 0.0 vs. 0.8 ha year-1 for Farm Type 1 and 8). This was illustrated by the decisions of cultural-oriented livestock-based farms of Type 12 that ensured a minimum available grazing ground.

Summary
205
Sum
mar
y
Identified factors that influence decision-making were categorised into internal (e.g. livelihood strategies, land scarcity, and water availability) and external (e.g. markets) factors and then used to simulate changes in land use processes. Based on scenario-driven analyses, the developed framework was applied to explore how responses of farmers to changes in land use drivers and in policy will influence future wetland development. Four scenarios (business as usual, increasing upland scarcity, improved market, and establishment of irrigation scheme) and several of their possible combinations were simulated to study how each wetland may develop in the future. This resulted in a generic and flexible framework that can be adapted and applied to different regions and to different land use change processes. The results described interactions between driving factors, the heterogeneity of smallholder farming systems, the diversity of decision-making, changes in farm types and in production systems and those in wetland systems. The functional nature of derived typologies was used to link them to environmental and socio-economic drivers, thereby allowing shifts in relative distributions of households within and between farm types across and within wetland cluster groups. The results showed that increasing land scarcity coupled with improved markets would (i) increase the dependency of household livelihood on cropland in the wetland (e.g. up to 100% for FT 2), (ii) substantially decrease pastoralist livelihood systems in the semi-arid areas (87%), and (iii) stimulate crop-livestock integration in sub-humid and humid areas. Land use intensification across wetlands and specification in midland valleys with prevailing intensified high-value crop systems could accompany such changes. Furthermore, land use displacement from traditional floodplain to rangeland grazing is an unavoidable consequence of land use intensification.
The application shows the added value of including individual decision-making in: (i) understanding of current wetland-agricultural systems and their interactions, the heterogeneity and their functioning; (ii) representing the system reality; (iii) explaining changes in land use as event-driven and cumulatively results from individual farmer’s decisions of land uses; and (iv) investigating changes in land use processes, specifically how individual farmers can respond differently to changes in resource dynamics and policy, and how such responses can have consequences in future wetland development, smallholder production systems, and pressure on other natural ecosystems. The dissertation further shows that an initiative for wetland conservation necessitates political-economic changes such as land

Summary
206
Sum
mary
redistribution, research and development in sustainable agricultural technologies, negotiation and conflict management, food safety, and even regulated markets.
Agricultural production in small wetlands offers opportunities to diversify livelihood systems. However, wetland farming is challenged by several hazards and shocks that include conflicts (farmer-herder and human-wildlife), abiotic, biotic, and socio-economic constraints. Reconciling livelihood benefits with sustainable land use and natural resource conservation in rural territories is a complex and challenging social task that requires the development of an adaptive co-management process with the active participation of all stakeholders.

207
Rés
umé
Résumé
Les petites zones humides revêtent une importance de plus en plus grande en termes de production agricole pour les ménages ruraux d’Afrique Sub-Saharienne (ASS). Les efforts déployés pour répondre à la production alimentaire dans un contexte de diminution des terres arables et pour diversifier les systèmes de subsistance ruraux conduisent à l'expansion des terres cultivées sur les zones humides, traditionnellement inutilisées. Les zones humides remplissent diverses fonctions écologiques et fournissent une vaste gamme d'avantages sociaux et économiques aux différents utilisateurs ayant des intérêts divers. Plus précisément, les zones humides jouent un rôle vital dans les systèmes de subsistance en milieu rural d’ASS en fournissant eau potable et matériaux de chaume, nourriture et revenus monétaires aux communautés locales. En particulier, les zones humides de petite taille (≤ 500 ha) sont traditionnellement liées à des systèmes de cultures et d'élevage qui en Afrique orientale offrent des options pour répondre aux déficits alimentaire et de fourrage causés par la sécheresse. Les changements dans les systèmes des zones humides sont évènementiels et résultent du cumule des décisions individuelles des exploitants concernant l'utilisation des terres. Par conséquent, l'objectif général de cette thèse est de développer une méthode prenant en compte la décision individuelle des petits exploitants et qui permette d‘étudier l’utilisation actuelle des zones humides ainsi que les potentielles évolutions futures.
En Afrique Orientale, les zones humides apparaissent sur des unités de paysage contrastées (c'est-à-dire des plaines vs. haut plateaux vs. montagnes) qui caractérisent la diversité environnementales et agro-écologiques de la région. D’étroits bas-fonds et des plaines inondables dominent la diversité des zones humides associées à ces traits contrastés. Spécifiquement, les petites zones humides constituent une grande proportion (80%) des types de zones humides, couvrant environ 12 millions d'hectares au Kenya et en Tanzanie. Le contexte agro-écologique, couplé aux différences d’accès aux marchés et démographique, déterminent les différents types d’utilisations rencontrés dans ces zones humides. En outre, la diversité sociale, les orientations de production et les objectifs des agriculteurs, l'accès aux ressources foncières, et les stratégies de subsistance contribuent à façonner les diversités agricoles des zones humides. Enfin, les interactions

Résumé
208
Résum
é
entre les facteurs locaux, les changements socio-économiques et les politiques nationales influencent substantiellement les décisions d'utilisation des terres par les petits exploitants. Un cadre (arbre de décision), dans lequel l'analyse des systèmes est aidée par les enquêtes et la modélisation, est utilisé pour analyser les changements de décision d’utilisation des terres par les exploitants en réponse aux changements socio-économiques, environnementaux et politiques. L'étude est basée sur les données collectées en 2008-2009 au Kenya (Mont Kenya, le Kenya Central et Aberdares, la vallée du Rift) et dans le nord-est de la Tanzanie (Ouest montagne Usambara et plaine Pangani, la région de Tanga) par le biais d'approches participatives en milieu rural et par la cartographie des zones humides. Diverses méthodes incluant la classification des zones humides, la typologie d'exploitations, l'identification des facteurs de changement d'utilisation des terres et les règles de prise de décision des exploitants sont employées dans l'analyse du système.
Une étude de cas de 51 zones humides, identifiées au sein d'une superficie totale de 484 km² dans les unités de paysage contrastées (plaines, hauts plateaux et montagnes), ont été caractérisées pour identifier les facteurs de diversité des zones humides et leurs différents usages (Chapitre 2). Ces zones humides comprennent les bas-fonds et les plaines inondables qui couvrent environ 0,5% (≈ 3647 ha) de la superficie totale des terres sur les sites d'étude. Les deux types de zones humides différaient par la géomorphologie (ex. la taille (≤ 35 vs. 10 à 458 ha), par l'altitude (280 vs. 2300 m), par la forme (concave vs. plat), et par les types de sol (Gleysols et Histosols vs. Fluvisols et Vertisols). Les différences géomorphologiques et agro-écologiques aboutissent à une grande variabilité au niveau des propriétés inhérentes des sols (taux élevés en C et N organique, faible à forte disponibilité en P), des régimes hydrologiques (régime permanent vs. saisonnier vs. sporadique), et de la végétation associée (Typha capensis vs. Cyperus papyrus). Malgré les différences de densité de population et des opportunités de marché, les zones humides présentent une utilisation similaire, avec 83% de leur superficie totale en production agricole et seulement 17 % en condition semi-naturelle à naturelle.
Sur la base des types d'utilisation dominants, chaque zone humide a été subdivisée en sous-unités d’au moins de 0,5 ha. Les 157 sous-unités résultantes ont été classées en cinq groupes (WCGs) par une analyse
Résumé
209
Rés
umé
multivariée basée sur la géomorphologie (type de zone humide, forme, taille, régime hydrologique, indicateurs de la fertilité des sols), sur les facteurs d'utilisation des terres (drainage, intensité d’utilisation, et l’apport d’intrants comme la fumure organique et les engrais minéraux) et sur les opportunités de marché. Les cinq groupes sont: 1. Etroits bas-fonds qui sont permanemment inondés et largement inexploités; 2. Large bas-fonds et plaines inondables des hauts plateaux, inondées en permanence et en utilisation extensive; 3. Large bas-fonds et plaines inondables à faible altitude avec un régime hydrologique saisonnier et une intensité d'utilisation moyenne; 4. Larges bas-fonds et plaines en zone montagneuse, complètement drainée et à forte production vivrière; et 5. Étroits bas-fonds drainées à forte et en continu production maraîchère. Ces groupes différaient par le type d’utilisations des terres et par les conditions socio-écologiques. L'accès aux zones humides, la disponibilité des terres arables sur les plateaux couplée à la croissance démographique, les marchés, les politiques gouvernementales, et la dynamique des moyens de subsistance influencent l’utilisation agricole des zones humides. Cette typologie de milieux humides a guidé la sélection des zones humides représentatives pour l'exercice de modélisation.
Un cas d’études de 275 exploitations appartenant aux groupes 2 à 5 des WCGs situés dans deux bas-fonds et deux plaines des zones montagneuses humides et semi-arides du Kenya et des hauts plateaux humides et vallées subhumides de la Tanzanie, ont été caractérisées pour identifier la diversité des systèmes de production et celle de la prise de décisions des exploitants (Chapitre 3). Les quatre zones humides étudiées couvraient 38% (≈ 1393 ha) de la surface totale de zones humides inventoriées. La surface des zones humides diffèrent avec chaque type (la superficie des plaines était de 5 à 25 fois celle des bas-fonds). À travers les sites, les différences en terme d'agro écologie, de marchés et de densité de population couplées avec la variabilité dans l'accès aux terres de production, les revenus financiers, et les stratégies de production se traduisent par de petites exploitations de subsistance et commerciales dans les zones humides et par de grandes exploitations destinée à l’exportation sur les hauts plateaux. Spécifiquement, une grande diversité de la taille des champs dans les zones humides et leur contribution à la taille des exploitations individuelles a été observée. Le ratio de dépendance (surface cultivée dans la zone humide / surface totale de l’exploitation) différaient entre les types de zones humides et diminuaient avec le potentiel de la zone de production agricole (0,2 en zone humide avec forte pluviosité

Résumé
210
Résum
é
annuelle contre ≥ 0,6 en zones sèches). Les systèmes intégrés, cultures - élevage, diffèrent en fonction des sites d’études et du statut social des exploitants individuels. Les systèmes de production (d’utilisation des terres) ont varié entre les ressources de production (plateaux contre zones humides), reflétant les différentes conditions biophysiques et socio-économiques, et les différences dans les facteurs de production, l'orientation et les objectifs des exploitants. Ces différences ont été capturées dans quatre principaux systèmes de production: cultures, cultures-élevage laitier, cultures-élevage non-laitier, et élevage bovin. L’apparition de ces systèmes a varié avec la densité de population et de son manque ultérieur de terres de culture sur les sites d'étude (par exemple des systèmes de cultures en zone sèches avec faible densité de population ((≤ 32 personne km-2) contre systèmes d’intégration de cultures-élevage laitier dans les zones humides densément peuplées). Sur la base d’une combinaison de systèmes de production (la possession d’animaux, le type, et son intégration avec les cultures), la dotation en ressources de terres (plateau, zone humide, et leur combinaison), et les objectifs de production (de subsistance, commerciale, et culturelle), les ménages ont été classés en 12 Types d’Exploitation (FTs): 1 et 2. Cultivateurs focalisés autour de cultures mixtes dans les terres cultivées des zones humides et cultivateurs avec des cultures de rente dans les zones humides et vivrières sur les plateaux; 3, 4, 5 et 6. Agro-éleveurs laitiers focalisés autour des cultures de rente dans les zones humides, cultures de rente dans les zones humides et vivrières sur les plateaux, en cultures mixtes dans les zones humides et culture de rente sur plateau, et production horticole irriguée sur plateau; 7, 8, 9 et 10. Agro-éleveurs non-laitiers focalisés autour de cultures vivrières dans les zones humides, semi-vivrières en zone humide et de subsistance sur plateau, cultures de rente en zone humide, et cultures mixtes en zone humide et sur plateau; 11. Agro-pasteurs pratiquant la culture vivrière dans les zones humides et un système d’élevage transhumant, et 12. Pasteurs utilisant les zones humides et les plateaux comme ressources fourragères. Les variabilités en ressources de production, l'accès aux terres cultivées sur les plateaux, l'accès aux marchés, et des stratégies de production de subsistance non connexes aux zones humides entre les différents types d'exploitations sont traduites par différentes utilisations des terres dans les zones humides. Les petites exploitations qui utilisent les zones humides étaient donc très diversifiées, hétérogènes et dynamiques, opérant dans un environnement socio-écologique complexe. La liaison créée entre les zones humides et la typologie des exploitations a montré que le système de

Résumé
211
Rés
umé
production agricole dans ces zones humides est complexe et caractérisé par des interactions entre les acteurs (Ex. les agriculteurs) et leur environnement biophysique (Ex. les unités des zones humides). En outre, la typologie des exploitations a permis de mettre en évidence les différentes dimensions en termes de valeurs, d’attitudes et objectifs de production des paysans (par exemple la production pastorale dans les exploitations de Type 12 qui revêt un caractère exceptionnellement culturel). De tels facteurs déterminent l'hétérogénéité des décisions et du comportement des agriculteurs et définissent leurs préférences d’utilisation des terres. Ainsi, la typologie permet de simplifier et de représenter les utilisations des terres et les prises de décisions des agriculteurs.
Un arbre de décision hiérarchique a été développé pour représenter la diversité de la prise de décision. Il a été utilisé pour analyser les effets d'une telle diversité sur l'évolution de la conversion des terres en friche, en jachère et le processus d'utilisation des zones humides. Diverses méthodes qui incluent la classification des zones humides, la typologie d'exploitations, l'identification des facteurs clés des décisions de l'utilisation des terres et les motivations pour le choix des cultures, l'estimation de la conversion des terres et la jachère, la prise de décision probabiliste et heuristiques ont été utilisés pour l'élaboration du cadre. La description explicite des mécanismes de prise de décisions pour l'aménagement du territoire a permis d'améliorer la compréhension du fonctionnement du système. Les stratégies de subsistance, la rareté des terres de culture, l'accès à la terre, la disponibilité en eau, les propriétés du sol, la dotation en ressources de production et les marchés influencent fortement les décisions d'utilisation des terres dans les zones humides. Des schémas différentiels des interactions entre ces facteurs ont conduit à une grande variabilité dans les taux de conversion des terres humides entre les groupes de zones humides (par exemple 0,6 contre 1,4 ha an-1 pour les groupes 5 et 3). Différents taux de jachère ont été également observés entre les types d’exploitations agricoles (par exemple 0,0 contre 0,8 ha l'an-1 pour les Types d’exploitation 1 et 8). Cela a été illustré par les décisions des pasteurs de Type 12 qui assurent un minimum de pâture disponible.
Les facteurs identifiés qui influencent la prise de décision ont été classés en facteurs internes (par exemple les stratégies de subsistance, la rareté des terres, et la disponibilité de l'eau) et en facteurs externes (marchés, par
Résumé
212
Résum
é
exemple) puis utilisés pour simuler les changements dans les processus d'utilisation des terres. Sur la base de différents scénarios, le cadre élaboré a été appliqué pour explorer la réponse des agriculteurs aux changements de contexte qui influencent l’utilisation des zones humides. Quatre scénarii («scénario de base», la raréfaction des terres de culture sur les plateaux, l’amélioration des marchés, le développement des systèmes d'irrigation) et plusieurs de leurs combinaisons possibles ont été simulés pour étudier comment chaque zone humide pourrait se développer dans l'avenir. Il en est résulté un cadre générique et flexible qui peut être adapté et appliqué à différentes régions et aux différents processus de changement de l'utilisation des terres. Les résultats décrivent les interactions entre les facteurs moteurs, l'hétérogénéité des petites exploitations agricoles, la diversité de la prise de décision individuelle, les changements dans les types d’exploitation et dans les systèmes de production et ceux de systèmes de zones humides. La nature fonctionnelle des typologies a été utilisée pour les relier aux facteurs environnementaux et socio-économiques, permettant ainsi des changements dans les distributions relatives des ménages au sein et entre les types d'exploitation agricole à travers et au sein des groupes de zones humides. Les résultats ont montré que l'augmentation de la rareté des terres, couplée à l'amélioration des marchés: i) augmenterait la dépendance des moyens de subsistance des ménages sur les terres cultivées dans les zones humides (par exemple jusqu'à 100% pour FT 2), ii) diminuerait sensiblement les systèmes de subsistance pastoraux dans les zones semi-arides (87%) et iii) stimulerait l’intégration cultures-élevage dans les zones humides et sub-humides. L’intensification de l'utilisation des terres dans les zones humides et les spécifications dans les bas-fonds des hauts plateaux avec des systèmes intensifiés de cultures maraîchères orientées vers le marché pourraient accompagner ces changements. Par ailleurs, le changement de l’utilisation des plaines inondables comme ressource de pâturage traditionnel vers l’accès au pâturage dans les grandes réserves naturelles est une conséquence inévitable de l'intensification de l'utilisation des terres.
L'application montre la valeur ajoutée apportée par l'inclusion de prise de décision individuelle dans: (i) la compréhension de l’utilisation des terres, de l'hétérogénéité et du fonctionnement actuels des zones humides ainsi que des interactions existantes entre les systèmes agricoles; (ii) la représentation simplifiée du système; (iii) l'explication des changements d'utilisation des terres considérés comme évènementiels et étant le résultat des décisions

Résumé
213
Rés
umé
individuelles des agriculteurs; et (iv) l’investigation des changements d'utilisation des terres, en particulier comment les agriculteurs répondent-ils différemment aux changement d’allocation de ressources et comment ces réponses, en retour, impactent le développement des zones humides, le système de production des petits exploitants et la pression sur les autres écosystèmes. La thèse montre en outre que l'initiative pour la conservation des zones humides nécessite des changements politico-économiques tels que la redistribution des terres, la recherche et le développement de technologies agricoles durables, un processus de négociation pour la gestion des conflits, un certain niveau de sécurité alimentaire, et une réglementation des marchés.
La production agricole dans les petites zones humides offre des possibilités de diversifier les systèmes de subsistance. Cependant, elle doit faire face à de nombreux défis incluant les conflits d’utilisation des ressources (cultivateur-éleveur et hommes-animaux sauvages), les contraintes biotiques, abiotiques et socio-économiques. Concilier moyens de subsistance avec l'utilisation durable des terres et la conservation des ressources naturelles dans les territoires ruraux est une tâche complexe et socialement exigeante qui nécessite le développement d'une co-gestion adaptative avec la participation active de tous les acteurs des zones humides.


215
Sam
enva
tting
Samenvatting
Kleine waterrijke gebieden worden steeds belangrijker voor de agrarische productie van rurale huishoudens in Afrika ten zuiden van de Sahara (SSA – Afrika bezuiden de Sahara). Dit komt gedeeltelijk door de afname van productiviteit in SSA als gevolg van landdegradatie, beperkte technologische innovaties, beheerspraktijken, maar ook door bevolkingsgroei en de hiermee samenhangende toenemende druk op natuurlijke hulpbronnen. Deze onderliggende oorzaken vallen uiteen in twee brede categorieën van factoren: de eerste gerelateerd aan lokatie-specifieke sociaaleconomische, omgevings en politieke condities, de tweede gerelateerd aan de productie van rurale huishoudens. Veranderingen in deze factoren samen met dynamiek in de rurale huishoudens hebben geleid tot een verandering van landgebruik in de tropen. Pogingen om voldoende voedsel te produceren op minder landbouwgrond en om meer verscheidenheid te creeren in rurale huishoudens hebben geleid tot uitbreiding van landbouwareaal naar traditioneel ongebruikte waterrijke gebieden.
Waterrijke gebieden vervullen verschillende ecologische functies en voorzien in een breed spectrum van sociale en economische functies voor verschillende gebruikers, met elk hun verschillende behoeften. Meer specifiek spelen waterrijke gebieden een essentiële rol voor rurale huishoudens in SSA m.b.t. drinkwatervoorziening, bouwmateriaal, voedsel en inkomen voor lokale gemeenschappen met toegang tot deze gebieden. Met name kleine waterrijke gebieden (≤ 500 ha) zijn traditioneel gekoppeld aan landbouw en veeteelt in Oost Afrika, en bieden mogelijkheden om met voedsel- en voedertekorten tijdens droogte om te gaan. Veranderingen in waterrijke gebieden worden vaak bepaald door specifieke gebeurtenissen en door het cumulatieve effect van landbeheer door individuele boeren. Vanwege deze problematiek is de globale doelstelling van deze dissertatie het ontwikkelen van een methode die de besluitvorming van individuele boeren meeneemt in de bestudering van het huidige gebruik van waterrijke gebieden en in de analyse van de toelomstige ontwikkeling van waterrijke gebieden.
Waterrijke gebieden komen voor in contrasterende landschappen (bv. hooglanden en laaglanden) in Oost Afrika die de omgevings- en agro-ecologische diversiteit van de regio karakteriseren. Smalle binnenlandse

Samenvatting
216
Sam
envatting
valleien en overstromingsvlaktes domineren de resulterende variatie van waterrijke gebieden. Meer specifiek vormen kleine waterrijke gebieden het grootste deel van alle waterrijke gebieden (80%), met een totaal oppervlak van 12 miljoen ha in Kenia en Tanzania. Agro-ecologische omstandigheden bepalen samen met verschillen in markt en bevolkingsdichtheden het landgebruik van de gebieden. Verder zijn sociale diversiteit, de productie-oriëntatie en doelstellingen van de boeren, toegang tot land en huishoud strategieën belangrijk voor de vorming van diversiteit in agrarische productie methoden in de waterrijke gebieden. Ten slotte bepalen ook interacties tussen lokale actoren en sociaaleconomische veranderingen/beleid de landgebruiksbeslissingen van kleine boeren substantieel. Een raamwerk waarin systeemanalyse samen met vraaggesprekken en modelontwikkeling wordt gecombineerd is gebruikt om de veranderingen in landgebruik als gevolg van de reactie van boeren op sociaaleconomische, omgevings- en politieke veranderingen te analyseren. De studie is gebaseerd op data verzameld in kleine waterrijke gebieden in Kenia (Mount Kenya, Centraal Kenia en de Aberdares, in de Rift Vallei) en in noordoost Tanzania (West Usambara bergen en de Pangani vlakte in de Tanga regio) in 2008-2009. Diverse methoden zoals de classificatie van waterrijke gebieden, typologieën van groepen van boeren en de bepaling van sturende factoren in landgebruiksveranderingen en de besluitvorming van boeren zijn gebruikt.
Studielokaties in 51 waterrijke gebieden met een totale oppervlakte van 484 km2 werden geïdentificeerd in uiteenlopende landschappen. De studiegebieden werden gekarakteriseerd om de sturende factoren voor de diversiteit en het landgebruik in waterrijke gebieden te bepalen en te begrijpen (Hoofdstuk 2). De waterrijke gebieden omvatten binnenlandse valleien en overstromingsgebieden die ongeveer 0.5% (≈ 3647 ha) van het totale landoppervlak van de studielokaties omvatten. De twee categorieën van waterrijke gebieden verschilden in geomorfologie (d.w.z. grootte (≤ 35 ha versus 10 – 458 ha), hoogte (280 versus 2300 m), vorm (concaaf versus plat), en bodem type (bv. Gleysols en Histosols versus Fluvisols and Vertisols)). Geomorfologische and agro-ecologische verschillen resulteerden in een grote variatie in bodemvruchtbaarheid (bv. hoge versus lage gehalten aan organisch koolstof (C), stikstof (N) en beschikbare fosforus (P)), hydrologische omstandigheden (bv. permanente versus seizoensgebonden versus sporadische overstromingen), en geassocieerde vegetatie-typen (bv. Typha
capensis versus Cyperus papyrus) in de typen waterrijke gebieden in de

Samenvatting
217
Sam
enva
tting
lokaties. Ondanks verschillen in bevolkingsdichtheid en marktopties tussen de studielokaties, lieten de waterrijke gebieden vergelijkbare patronen van landgebruik zien, met 87% van hun totale oppervlakte onder agrarisch gebruik, en maar 17% semi-natuurlijke of natuurlijke vegetatie.
De waterrijke gebieden werden verdeeld in eenheden van minimaal 0.5 ha op basis van dominant landgebruik. De resulteren 157 eenheden werden gecategoriseerd in 5 cluster groepen m.b.v. multivariate analyses op basis van geomorfologie, landgebruik en markt. De clustergroepen (WCGs) waren: 1. Smalle, permanent overstroomde binnenlandse valleien die weinig gebruikt worden; 2. Brede permanent overstroomde binnenlandse valleien en hooggelegen overstromingsgebieden onder extensief gebruik; 3. Grote binnenlandse valleien en laagland overstromingsgebieden met seizoensgebonden overstromingen in matig intensief gebruik; 4. Compleet gedraineerde, brede binnenlandse valleien en hooggelegen overstromingsgebieden met intensieve gewasproductie; en 5. Smalle valleien die gedraineerd zijn voor continue productie van gewassen met hoge marktwaarde. Deze clustergroepen verschilden in landgebruik en sociaal-ecologische condities. Toegang tot het waterrijke gebied, beschikbare akkerbouwgrond direct buiten het gebied gekoppeld aan bevolkingsgroei, markten, beleid en rurale dynamiek in huishoudens beïnvloedden het agrarisch landgebruik van de waterrijke gebieden. Deze typologie van waterrijke gebieden bepaalde de selectie van representatieve waterrijke gebieden voor de modelanalyse.
Studieboerderijen (n = 275) van 4 cluster groepen (WGCs 2-5) van 2 binnenlandse valleien en 2 overstromingsgebieden van humide en semi-aride hooglanden in Kenia en humide medium hooglanden en sub-humide laaglanden in Tanzania werden gekarakteriseerd om de diversiteit in productiesystemen en de landgebruiksbeslissingen van boeren te bepalen en om de belangrijkste sturende factoren van zowel boerderij-heterogeniteit als de verschillen in besluitvorming door boeren te begrijpen (Hoofdstuk 3). De 4 waterrijke gebieden vormden 38% (≈ 1393 ha) van het totale oppervlak van de waterrijke gebieden. De grootte van de gebieden varieerde per type (bv. De grootte van de overstromingsgebieden was 5- tot 25-keer die van binnenlandse valleien). Over de lokaties heen resulteerden verschillen in agro-ecologie, markt en bevolkingsdichtheid in combinatie met toegang tot productieve grond, niet boerderij gerelateerd inkomen en huishoud-strategieën in eigen voedsel producerende of markt georiënteerde boeren, of in
Samenvatting
218
Sam
envatting
grootschalige export georiënteerde boerderijen met veel land ook buiten de waterrijke gebieden. Er waren grote versschillen in zowel de veldgrootte als in de contributie daarvan aan het totale boerderij oppervlak binnen en tussen verschillende lokaties. De afhankelijkheidsratio (dit is de ratio tussen veld oppervlak in een waterrijk gebied en totale boerderij oppervlak) verschilde tussen WCGs en nam af met de potentie van het gebied voor agrarische productie (bv. 0.2 voor humide gebieden versus ≥ 0.6 voor drogere gebieden). Geïntegreerde gemengde bedrijven verschilden tussen de lokaties en tussen boeren van verschillende sociale status. De landgebruikssystemen varieerden met beschikbare productiemiddelen (in en buiten het waterrijke gebied), sociaaleconomische en biofysische condities, verschillen in productiefactoren, productie-oriëntatie, en doelen van de boeren. Deze verschillen werden gerepresenteerd in 4 belangrijke productiesystemen: gewas, gewas - melkvee, gewas – niet melkvee, en vee gebaseerde systemen. Het voorkomen van deze systemen varieerde met bevolkingsdichtheid en het daarmee samenhangende landtekort (bv. gewas-systemen in droge gebieden met lage bevolkingsdichtheden (i.e. minder dan 32 personen per km2) versus gewas – melkvee systemen in humide gebieden met hoge bevolkingsdichtheden. Op basis van combinaties van productiesystemen (vee in eigendom, type vee en de mate van integratie met gewasproductie), beschikbaar land (binnen of buiten het waterrijke gebied) en de productiedoelstellingen (eigen voedsel productie, geld, cultuur bepaald) werden huishoudens ingedeeld in 12 bedrijfstypes: 1. Gemengde bedrijven in het waterrijke gebied met vooral focus op gewasproductie; 2. Bedrijven in het waterrijke gebied met oriëntatie op gewasproductie voor de markt met land buiten het gebied voor eigen voedselproductie; 3. Gewas – melkvee bedrijven in het waterrijke gebied met productie voor de markt; 4. Boerderijen die gewasproductie voor de markt in het waterrijke gebied combineren met voedselproductie en melk productie buiten het gebied; 5. Gewas-melkvee bedrijven met markt – oriëntatie die beperkt afhankelijk zijn van het waterrijke gebied; 6. Export georiënteerde bedrijven die alleen water onttrekken aan de waterrijke gebieden; 7. Bedrijven die afhankelijk zijn van voedselproductie voor eigen consumptie in het waterrijke gebied en die niet-melkvee hebben; 8. Bedrijven die vooral afhankelijk zijn van rijstproductie voor inkomen in combinatie met gewasproductie voor eigen consumptie buiten het gebied en in het bezit van niet-melkvee; 9. Bedrijven die marktgeoriënteerde gewassen produceren in het gebied in combinatie met niet-melkvee in eigendom; 10. Gemengde bedrijven zonder melkvee met variabel gebruik van velden binnen en buiten

Samenvatting
219
Sam
enva
tting
het waterrijke gebied; 11. Gebiedsafhankelijke agro-pastorale boeren; en 12. Waterrijk gebiedsafhankelijke cutureel-georienteerde veebedrijven. Verschillen tussen boeren in productiemiddelen, toegang tot akkerbouwland buiten het waterrijke gebied, toegang tot markten en niet-gebied gerelateerde strategieën vertaalden zich in verschillend landgebruik in de waterrijke gebieden. Kleine huishoudens in de waterrijke gebieden waren daardoor erg divers, en opereerden in complexe sociaal-ecologische omgevingen. Het koppelen van de clustergroepen en de huishoud typen liet zien dat het land gebruik sterk bepaald wordt door de interacties tussen de boeren en hun biofysische omgeving. De bedrijfstypen waren sterk gerelateerd aan verschillen in waarden, houding en doelstellingen van boeren. Deze factoren zijn bepalend voor de heterogeniteit in het gedrag van boeren omdat deze hun voorkeuren bepalen en daarmee hun gedrag en landgebruik beïnvloeden. Daarmee zijn deze typologieën behulpzaam in het vereenvoudigen en representeren van verschillen in landgebruik en besluitvorming in agrarische huishoudens.
Een hiërarchisch genest beslissingsmodel werd ontwikkeld om de diversiteit aan landgebruiksbeslissingen te representeren en om effecten van deze diversiteit op landconversie, rotatie en landgebruik in waterrijke gebieden te analyseren. Diverse methoden zoals gebiedsclassificatie, bedrijfstypologieën en bepaling van de belangrijkste sturende factoren van beslissingen omtrent landgebruik werden gebruikt voor de ontwikkeling van het modelraamwerk. De expliciete beschrijving van de beslis-mechanismen omtrent landgebruik verbeterden ons begrip van het functioneren van het algehele systeem. Huishoud strategieën, tekort aan land, toegang tot land, land en water beschikbaarheid, bodemeigenschappen, rijkdom en aanwezigheid van afzetmarkten waren bepalend voor beslissingen omtrent landgebruik in de waterrijke gebieden. Verschillen in deze factoren leidden tot verschillen in land conversie, rotatie en intensiteit van landgebruik.
De factoren die het landgebruik beïnvloedden werden ingedeeld in interne (bv huishoud strategieën, land tekort en water beschikbaarheid) en externe (bv afzetmarkten) factoren en daarna gebruikt om veranderingen in land gebruik te voorspellen. Op basis van verschillende scenario’s werd het raamwerk gebruikt om te verkennen hoe boeren zouden kunnen reageren in landgebruik op veranderingen in sturende factoren en in beleid. Vier scenario’s werden gedefinieerd (voortzetting van huidige ontwikkelingen, groter tekort aan land buiten de waterrijke gebied, verbeterde marktomstandigheden en opzetten van irrigatie programma’s) en deze werden evenals diverse combinaties

Samenvatting
220
Sam
envatting
geanalyseerd met behulp van het model. De resultaten lieten zien dat bij toenemende schaarste van land in combinatie met verbeterde marktomstandigheden de afhankelijkheid van boeren van gewasproductie in waterrijke gebieden sterk zou toenemen (bv tot 100% voor bedrijfstype 2), het pastorale type sterk zou afnemen in semi-aride gebieden en integratie van gewas en vee in sub-humide en humide gebieden gestimuleerd zou worden. Intensivering van landgebruik zou plaatsvinden in alle waterrijke gebieden, dit zou samengaan met een toename in productie van marktgeoriënteerde gewassen. Een onafwendbaar gevolg zou de verschuiving van traditioneel natuurlijk overstromingsgebied naar begrazingsgebied zijn.
De toepassing van het model liet het belang van de representatie van de besluitvorming van individuele boeren zien voor: (i) het begrip van de huidige agrarische systemen in waterrijke gebieden, hun interacties, hun functioneren en hun heterogeniteit; (ii) de representatie van het hele systeem; (iii) het verklaren van veranderingen in landgebruik als gebeurtenis gestuurd en gestuurd door de accumulatie van landgebruiksbeslissingen door individuele boeren; en (iv) het onderzoeken van veranderingen in landgebruik, en meer specifiek om inzicht te verkijgen in hoe individuele boeren zullen reageren op veranderingen in beschikbare middelen en beleid, en hoe deze reacties gevolgen kunnen hebben voor de toekomstige ontwikkeling van waterrijke gebieden, van kleine boeren, en van natuurlijke ecosystemen in en om waterrijke gebieden. Het proefschrift laat verder zien dat initiatieven voor de bescherming van waterrijke gebieden politiek economische veranderingen nodig hebben, zoals herverdeling van land, onderzoek naar en ontwikkeling van duurzame agrarische productie technologieën, onderhandelingen en management van conflicten, voedselzekerheid en zelfs gereguleerde markten.
Agrarische productie in kleine waterrijke gebieden biedt mogelijkheden om productiesystemen meer divers te maken. Echter, dit type productie heeft te maken met verschillende risico’s zoals conflicten (tussen akkerbouwers en pastorale boeren en tussen mensen en wilde dieren) en beperkingen van abiotische, biotische en sociaal-economische aard. Het concentreren van agrarische productie en het belang hiervan voor rurale huishoudens met duurzaam landgebruik en bescherming van natuur is een complexe en uitdagende taak die de ontwikkeling van een adaptief en gezamenlijk beheer van natuurlijke hulpbronnen behoeft, waarbij alle betrokken partners actief bijdragen.

221
Acknowledgements
Studying for a PhD, what a very long, arduous, rough, stressful journey and a sacrificial offering! But it has also been an exciting, happy and enthusiastic, rich and learning stepwise journey. It is hence a journey worth enduring to the end. Various individuals and institutions have contributed towards the completion of this study and it is not easy to mention every one here. I sincerely acknowledge and appreciate valuable individual and institutional contributions without which this work would have not come to fruition. Since I do not want to omit anybody (although, involuntarily, I might anyway), I decided to reduce the font size of the following paragraphs with advance apologies for any inconvenience.
This study was developed within the concepts of the Agricultural Use and Vulnerability of
Small Wetlands in East Africa (SWEA) framework. The SWEA project aimed to provide a quantitative basis for assessing the current and future potential of wetlands in East Africa
and to develop tools to guide decision-makers and planners on wetland use. The initial
phase of my study was funded by the German Volkswagen Foundation (Stiftung) through the Crop Science and Resource Conservation institute (INRES) of Bonn University. The final
phase of the study in Wageningen was made possible with funds from the Department of
Plant Production Systems (PPS) of Wageningen University (WUR). The timely available of funds allowed me to complete the write-up peacefully. I am very grateful for the financial
support from these institutions.
I sincerely acknowledge the guidance and encouragement from my supervisory team made up of Prof. dr. Ken Giller, dr. Mark van Wijk, Prof. dr. Matthias Langensiepen as well as Prof.
dr. Mathias Becker, Prof. dr. Misana Salome and dr. Oyieke Helida. It was a challenge but
exciting to experience Dutch and German supervisions. The team was a pillar of support all the way from the proposal phase, fieldwork, and thesis write-up. My special and sincere
thanks to my promoter Prof. dr. Ken Giller and co-promoter dr. Mark van Wijk for your tireless
support during my thesis write-up while in Wageningen University. I will never forget your hard work toward the completion of this thesis. I appreciate your invaluable comments,
criticism and guidance to my work. Each of you had a unique support and efforts towards my
success, which will always be remembered and appreciated.
The saying that “the end of the matter is more important that its beginning” is an established
fact. What this statement does not encompass however is that God always appoints right
people in right time to be instrumental in bringing the matter to its completion. I considered myself privileged to have been in the safe hands of Ken. He has been the God sent during
the write-up phase – when I was brought in a foreign land with virtually no one around; he
came in, stretched his loving hand and rescued me from sinking. “... Do not worry Naomie...
we will provide all needed support for the completion of your study...”. I met Ken the first time
Acknowledgements
222
in 2006 during his trip with dr. Peter Leffelaar to Senegal while visiting one of their PhD
student (dr. Michiel de Vries). Michiel was based at the Sahel Station of Africa Rice where we carried out the field work for his thesis. At this time, little did I know that my burning desire
to become a doctor would materialise under his supervision. His guidance and advice during
the study period are greatly appreciated. During the write-up of the thesis, I benefited a lot from his comments and editing on the papers and the thesis. Amazingly but not surprisingly,
his human and social skills are as invaluable as the scientific ones. Irene and Ken, you
always seized every opportunity to make us fill at home by organising dinners at your home for the international students. These were platforms for socialisation, learning about different
cultures and lifestyles and sharing experiences from across the world. To you and Irene,
thank you very much for your hospitality and parental care. May the Lord reward you tremendously!!!
I thank Professor Mathias Becker, the SWEA project main coordinator, and Professor
Matthias Langensiepen for their valuable efforts in handling my case besides supervising my work. Your rigorous and challenging criticisms were instrumental in shaping the scope of the
study. But managing our different temperaments and personalities was at times more
challenging than the study itself. The divergent thinking with the very little flexibility in decision-making has contributed to my personal and professional growths. I am grateful to
you for the negotiation with the Volkswagen Stiftung and the authorisation to finalise my
study at a non-German University - Vielen Danke and God bless you richly.
My heartfelt appreciation goes to Mark for the day-to-day supervision at PPS. “... Naomie,
carry out the analysis for the three main Farm Types in wetland cluster group (WCG 3) under
rice... Goed!!! now try to present them in simple figures, these look nice but very busy, try
turn this particular one into a Table...yes the Tables and Figures are nice. Good!, Well done!,
Très bien!!! ... complete the analysis for the five other Farm Types in each of WCGs 2, 4, and
5 for each of the different four use categories and let’s see what the results tell us...you just
need to plug on your headset with very good music, by the time you realise, it is done. Well, I
am very happy with these results but we cannot present them all...”, and here he deletes
them. I was really humbled by his encouragement and assistance as well as the constant positive comments. He has always been my source of inspiration and motivation. He has
been there to solve what (to me) looked like the most difficult problem ever. I could always
pop-up in his office with my ups-and-downs and he will take time to listen to me. His input to my work has been enormous, crucial, and strongly influencing my way of doing science. His
critical view on approaches and methodologies led to preparation of the manuscripts and this
thesis. With his sense of humour, he always takes things easy and turns the most challenging issues into feasible ones. Mark, I admire your high level of intelligence and yet
humility, your capacity of understanding and analysing a situation and the breadth of your
knowledge. Our meetings and discussions had been fruitful, bearing great ideas and resulted in progress. We have one particular thing in common with him: we both are perfectionist (and
it requires a lot of creativity and hard work to meet our very high expectations!!!). It was
extremely challenging for me in early 2010 but it was really fun toward the end and worthwhile working together. Through this perfectionism, he has taught me to be more

Acknowledgements
223
rigorous in science. I will remember you for all you did for me (especially your untiring efforts
for several trips to Bonn as well as the successful completion of my registration) - Dank u
wel. May the blessings in Numbers 6:24-26 be your portion!!!
I had other “unofficial” supervisors, advisors or collaborators, dr. Helida Oyieke, Prof. Misana
Salome, Prof. Menz Gunta and dr. Bodo Moseler. They have always been around for help and lifting me up when I was going down. I thank you for the helpful comments and
constructive criticisms. I am indebted to the African coordinators of the SWEA projects,
Wamaama Helida and Misana for their support during the field work in Kenya and Tanzania. My special thanks go to Maama Helida who ensured a safe accommodation for me at the
young women hostel (YWCA) in Nairobi between August 2007 and October 2009. She also
provided space in her office to lock up my belongings during the several field trips and specifically during the post-election violence in Nairobi end 2007 and early 2008. Shukrani na
Mungu awabariki.
Much appreciation goes to SWEA PhD scholars and post-doc fellows. Drs Miguel Alvarez and Christine Kreye, thanks for your critical and constructive comments on Chapter 2. I
profoundly express my sincere thanks to my dear friends and fellow travellers on the very
interesting SWEA PhD journey - “wetlanders” - for the nice experiences we shared. It was a real pleasure to work alongside Beate Boëme, Emiliana Mwita, Hellen Kamiri, Neema Mogha
and Collins Handa. I really enjoyed the family atmosphere created by all of you and the
wonderful time spent with your respective families. From Nairobi and Dar es Salam to Berlin, Bonn and Wageningen via Maralaal, the journey had been extremely long and tough for the
group. You are part of my international family. Your reliable assistance, jokes, social and
academic discussions, love and prayers made my burden light and my heart glow. Remember that we still have a long way to travel through successfully. God bless you all.
Field work was possible because of co-operation with farmers and livestock herders who
availed their land for field survey and their time for household survey and group discussion. My great thanks should go to the wetland farming communities in the 13 villages of Makuyuni
and Lukozi wards in Tanzania and in Karatina and Rumuruti in Kenya. This book would have
not been written if it had not been for their hospitality, willingness and cooperation to talk freely and provide valuable information about their activities, households and farms.
Organising and mobilisation of farmers and field assistants was with the help of the village
government leaders and agricultural officers and extension agents. I have no word to express the contribution of Freddy Msaki, Gibson Manyeke, Manyeke Jesse, Peter Komotho
Mberi, Robert Moris, and William Njoroge whoe tirelessly assisted me in the field work. I
cannot forget Ibahati Mtangi, Kasim Mtali, Patrick Kithinji, and Thewuri John for the long and late drives and long time spent in the field. My special thanks go to Mr Njema Charles
Mweta, Mrs Mary Rimoe, Mr Sadiki Kissimbo, and Mr Muya who have been keen and
interested in the research work. I am grateful for the enthusiasm and commitment you showed to the very end of the field work. Mungu abariki kila moja wenu.
The burden of writing this thesis was lessened by the support and company of wonderful
people who created a friendly working environment in the “Radix”. I cannot forget Martin,
Acknowledgements
224
Peter, Nico, Bert Jansen, Bert Rijk, Joost, Marcel, Aad, Lammert and Sjanie. Your
encouragements, support, and social discussions were a consistent source of comfort. I thank you for your care especially when I was without supervision in early 2010. You also
ensured company in the last phase of write-up especially when my fellow students had left
PPS. My special thanks go to Joost who would always make positive comments to encourage us in the evening hours on his way back home. “... do not work too hard... try to
get some rest...”. Thank you very much and you will always be remembered. Sjanie my
Dutch mum, you are a very special person. Your moral support, warm hugs, motherly love and prayers are highly appreciated. Words may not be enough to express, but I pray that
God will reward you a hundred folds for what you have done to me. I am indebted to Ria van
Dijk and Charlotte Schilt for their professionalism and hard word in handling the administrative matters during my stay at PPS. I also appreciate Gijsbertje Berkhout and later
Alex who assisted with financial arrangements at PPS. Your reliable support in personal
matters was highly valued. Dank julie wel and may God bless you all abundantly.
I also thank my friends and colleagues with whom we shared the open space in the Radix,
late working hours, coffee, cakes and other social events: Abdul Aziz (Marabout), Alba, Ali,
Akpo, Argyris, Andre, André, Benjamin, Belai, Bouba, Charles, Diogo, Gisella, Godfrey, Idsert, Jairos, Juliana, Junfei, Lenny, Lotte, Lydia, Madeleine, Marcia, Marieke, Maryia,
Massood, Mink, Moritz and Sara, Muhammad, Murilo, Mwalimu, Ousmane, Sanders, Sheida,
Stella, Suzy, Thomas, and Wenfeng. I deeply appreciate the interactions with the international fellows in Wageningen: Augustin, Book, Jackson, Julienne, Ekaete, Eugène,
Koro Jack, Mama Regina, Mariame, Pushpa, Zacharie and the WUR Nigerian students. Your
salutations, smiles, jokes, encouragements, social and academic discussions were simply infectious. God richly bless you.
To my fellow African PhD sister and brothers, Aisha (Maama 9ja), Chris (Half-muslim), Sam
(Mzee), Bernard (Prof.) and Nurudeen (Young man), you were simply Godsend in my stay in Wageningen. I am very grateful for just being a member of your families. You provided
laughter, the best medicine for the stress, challenges and frustrations of PhD life in
Wageningen, brotherly love, and assorted African food on order. May the God Almighty remember you all and keep the spirit of progress afloat.
Michiel, Sara, Stan and Tobias; Tata Oumy; Marieke and family; Dick van Braak and family...
that’s my Dutch family - bedankt voor alles -, you untiringly provided support, mentorship, prayers and encouragements that kept me going. You took good care of me and eased the
pains of settling-in. Michiel and family, you further provided accommodation for me and gave
me the opportunity to experience the real Dutch culture and made me feel at home. I am indebted to you and Sara for perfecting the translation of the Dutch summary. Tata Oumy,
thanks for the many family functions you have included me. It was heart warming to cook and
to eat spiced food such as yassa and tieb reminiscing about N’dar, Dieuredieuf waii! May the Lord reward you all!
I have special thanks for my mentors who have played a key role in my life and career. Mr
Malick Diallo from UEMOA and Joseph Ouédraogo from UNICEF back in Ouagadougou
Acknowledgements
225
guided the first steps of my career. Drs Sibiry Traore, Jawoo Koo, and Richard Kablan
enormously guided my initial research activities back in Mali. Dr Vincent Bado and his team members have influenced my experience in soil fertility experiments with rice farmers along
the Senegal River. Solenn, I thank you for the encouragements and perfecting the translation
of the French summary. Prof. Mama Pléa, my former chemistry teacher; Mrs Cissé Jénéba Sow and Mrs Miga from Winrock International, I thank you for supporting my application for
the BSc. scholarship back in Bamako. Dr Gérard Kientéga and dr Balira O. Konfé, you ably
handled my application for the MSc scholarship back in Ouagadougou when I was still in Bamako. I wholeheartedly thank you for the mentorship and support rendered. Sincères
remerciements.
It has been a journey of trusting God and many have prayed with me. I owe much to all men and women who contributed spiritually, morally, financially and/or physically toward this
achievement. Mrs and Mr Bellagamba, Ms Ghislaine Bonammy and Ms Mariette Cizauskas
my boarding school teachers, I am grateful for all you did for me. You relentlessly taught us the spirit of hard work, striving for excellence while maintaining our integrity. You rebuked us
but with tenderness and you taught us to be contented with the little we have. These
platforms helped me to stand upright and overcome most of the challenges I face. You showed me true and tender love when all my parents passed away. You further organised
some moral and financial support for me through Mrs Jeannine Gundermann, from Grand
Quevilly in France. Soyez-en gratifiés. Abdou, Achille, Barry, Claude, Klaingar, Mrs Djeneba Bakiono and family, Mrs Ngoma Kia and family, Tantie Nicole, Tonton Jo, Pastor Guindo and
family, it has been wonderful being part of you and to be involved in one way or the other in
your lives as a daughter and/or a friend. Other supporters: André, Andy, Bayili, Carine, Daouda, Dieudonné, Fadima, Fif and Yvon, Fatim, Marie Jeanne, Reason, Sally, Sékou,
Tégessa and Théos. You have been great friends to me and now sisters and brothers. Thank
you for your prayers, encouragements and the many phone calls that helped me cope with homesickness. I am especially indebted to Claude for the times of prayer over the phone –
thank you for the sharpening. My heartfelt thanks go to Pastor Farai and Busi Maphosa and
fellows at Amazing Grace Parish for their spiritual and moral supports. For this few mentioned and a host not mentioned, God bless you for your wonder working prayers.
I am indebted to West African community in Nairobi – Uncle Joseph Guiébo, Mrs&Mr
Badiane and family, Mr Jeremy Bazye, Sister Georgette Sawadogo, for helping understand my way around and for the many functions you have included me. You were my family far
away from home and helped me to break with the monotony of work. I am grateful for all you
did. Dieu rende à chacun le centuple de ses bienfaits. My profound thanks go to Sarah Kasule (Ugandan mum) and Tim for the support. Mum, you patiently travelled this journey
with me, always helping me when falling. Your motherly love, lessons of endurance and
prayers I always cherish. Mungu awabariki.
I profoundly express my sincere thanks to my family and relatives – Vieux Yielisida, elder
brothers and sister: Daniel, Tembvia, Pierre, Philippe, Samuel, David, Paul, and Rachel,
nephews, nieces, cousins and in-laws, for the parental role you have played in my life,

Acknowledgements
226
support and prayers. You have also endured my part time responsibility as a sister and aunt.
I owe much to Mrs Edwige Sakana for her constant care. May the Lord reward all!
My siblings Sidibé, Wendtoin and Wendinda, you have been strong and wonderful. Thanks
for being there throughout, holding forth alone and for accepting me as a career developing
elder sister and my success as a challenge. You silently endured my absence from home for the last 15 years and you had to adapt and to manage all situations. It is because of your
love, prayers and tolerance that I have been able to accomplish this last stage of education
that I expect you to surpass somehow. I hope this achievement becomes the platform for better opportunities to us. God richly bless you.
Last but not least I would like to thank the special three people in my life: both my late
parents and late Mrs Jeannine Gundermann for their efforts and encouragements to pursue high education. I would have loved that you see this achievement. Mbaba and Mmaa, (before
you die, some 21 years ago), you relentlessly taught me the spirit of integrity, hard work, and
independence. This helped me complete this PhD program. They have missed seeing me through this final hurdle but may they rest in peace, knowing that their inputs and sacrifices
have not been in vain. I dedicate this work to three of you. I love you.
Above all, I give all the praise, honour and glory to God who “is the Lord, the God of all flesh:
to whom nothing is too hard...”. His mercy, grace and faithfulness have been of constant
comfort throughout this long journey that was embedded in mysterious trials and testimonies.

227
List of Publications
1. Journal papers
Sakané, N., Alvarez, M., Becker, M., Böhme, B., Handa, C., Kamiri, H.W., Langensiepen, M., Menz, G., Misana, S., Mogha, N.G., Möseler, B., Mwita, E.J., Oyieke, A.H., van Wijk, M.T., 2011. Classification, characterisation, and use of small wetlands in East Africa. Wetland, DOI 10.1007/s13157-011-0221-4.
Alvarez, M., Becker, M., Böhme, B., Handa, C., Josko, M., Kamiri, H., Langensiepen, M., Menz, G., Misana, S., Mogha, N., Möseler, B.M., Mwita, E., Oyieke, H., Sakané, N., 2011. Floristic classification of the vegetation in small wetlands of Kenya and Tanzania. Biodiversity and Ecology, (in press).
de Vries, M.E., Leffelaar, P.A., Sakané, N., Bado, B.V., Giller, K.E., 2011. Adaptability of irrigated rice to temperature change in Sahelian environments. Experimental Agriculture 47, 408 69-87.
Alvarez, M., Becker, M., Böhme, B., Handa, C., Josko, M., Kamiri, H., Langensiepen, M., Menz, G., Misana, S., Mogha, N., Möseler, B.M., Mwita, E., Oyieke, H., Sakané, N., 2010. SWEA-Dataveg: vegetation of small wetlands in East Africa. Biodiversity and Ecology, (in press).
Traoré, P.C.S., N. Sakané, B. Gérard, K. Goïta, Y. Toloba, 2005. Landscape-level mapping of West African soil properties using modern EOS sensors. Geoderma, (in press).
2. Participation in conferences
Sakané, N., Becker, M., Langensiepen, M., van Wijk, M.T., 2010. Agricultural use and vulnerability of small wetlands in East Africa. Oral presentation at the interdisciplinary congress on Our Common Future: Climate Change and Energy II section. October 2-6, 2010, Hannover-Essen, Germany.
Handa, C., Mogha, N.G., Mwita, E.J., Böhme, B., Kamiri, H.W., Sakané, N., 2010. Agricultural use and vulnerability of small wetlands in East Africa: Wetland typology; and
Mwita, E.J., Sakané, N., 2010. Agricultural use and vulnerability of small wetlands in East Africa: Detection, uses, and driving forces. Oral presentation at the Volkswagen Stiftung Grantees meeting, 2010 on “Resources, their Dynamics and Sustainability: Capacity-Development in Comparative and Integrated Approaches”. September 20-24, Witzenhausen, Germany.
Alvarez, M., Mogha, N.G., Möseler, B., Handa, C., Kamiri, H.W., Becker, M., Sakané, N., Langensiepen, M., 2010. Vegetation analysis to assess the

228
impact of land use history and intensity on the resilience of small wetlands in East Africa. Poster presented at the Tropentag Conference on “Research for Development in Agriculture and Forestry, Food and Natural Resource Management” September 14-16, Zurich, Switzerland.
de Vries, M.E., Sow, A., Bado, V.B., Sakané, N., 2010. Prediction of potential yields of new rice varieties in the Senegal River Valley using simulation models. Oral presentation at the Africa Congress, 2010. Innovation and Partnerships to Realize Africa’s Rice Potential. March 22-26, Bamako, Mali.
Sakané, N., Langensiepen, M., 2009. Agent-based simulation of human-environment interactions in small wetlands in Kenya and Tanzania. Poster presented at the Tropentag “Biophysical and Socio-economic Frame Conditions for the Sustainable Management of Natural Resources”. October 6-8, Hamburg, Germany.
Sakané, N., Langensiepen M., 2009. Agricultural use and vulnerability of small wetland in East Africa: Human-Environment System: What are the interactions? Oral presentation at the Volkswagen Stiftung Grantees meeting, 2009 on “Resources, their Dynamics and Sustainability: Capacity-Development in Comparative and Integrated Approaches” (R+S). January 5-8, Dar es Salam, Tanzania.
Handa, C., Sakané, N., Mogha, N.G., Böhme, B., Kamiri, H.W., Mwita, E.J., 2009. Typology and characterisation of small wetlands in East Africa. Presented at the Volkswagen Stiftung workshop on (R+S). January 5-8, Dar es Salam, Tanzania.
Langensiepen, M., Sakané, N., Mogha, N.G., 2009. Functional and behavioural ecology of small wetlands: an adaptive modelling approach. Poster presented at the Volkswagen Stiftung workshop on (R+S). January 5-8, Dar es Salam, Tanzania.
de Vries, M.E., Bado, B.V., Sakané, N., Sow, A., 2008. Prediction of phenology and potential yield of irrigated rice in the West African Sahel using ORYZA and DSSAT models. submitted for DSSAT workshop, Georgia, USA.
Traoré P.C.S., N. Sakané, M.D. Doumbia, R.S. Yost, 2004. Accuracy assessment of ASTER digital elevation models for topography extraction at field and watershed levels, MSAS’2004, Bamako, Mali.
3. Book chapter
de Vries, M.E., Sow, A., Bado, B. V., Sakané, N., 2011. Simulation of potential yields of new rice varieties in the Senegal River Valley. In: Kihara, J., Fatondji, Jones, J., Gerrit, Tabo, R. and Bationo, A. (Eds.), Improving Soil Fertility Recommendations to Smallholder Farmers in Africa through the Use of Decision Support Tools. Springer, Dordrecht (submitted).

229
PE&RC PhD Education Certificate
With the educational activities listed below the PhD candidate has complied with the educational requirements set by the C.T. de Wit Graduate School for Production Ecology and Resource Conservation (PE&RC) which comprises of a minimum total of 32 ECTS (= 22 weeks of activities)
Review of Literature (4.2 ECTS)
- Analysis of human-environment interactions in small wetlands using spatially explicit actor-based modelling (2007)
Writing of project proposal (4.5 ECTS)
- Actor-based model for characterising human-environment interactions in small wetland agriculture in East Africa (2007)
Post-graduate courses (6.3 ECTS)
- Multivariate analysis; PE&RC (2010) - Bayesian statistics; PE&RC (2010) - Agricultural and natural resources management: a multi-criteria approach; WGS & PE&RC (2010) - Methodological training workshops; Lushoto, Tanzania, and Nanyuki, Kenya; DISTL/Germany, DUCE, Tanzania
and NMK, Kenya (2008)
Competence strengthening / skills courses (2.1 ECTS)
- Information literacy for PhD students including; WUR library (2010) - PhD Competence assessment; WGS (2010) - Techniques for writing and presenting a scientific paper; WGS (2010
PE&RC Annual meetings, seminars and the PE&RC weekend (1.5 ECTS)
- PE&RC Seminar on “Global soil fertility”(2011) - PE&RC Day (2010) - The PE&RC weekend (2010)
Discussion groups / local seminars / other scientific meetings (6.6 ECTS)
- Small wetland project meetings and discussions (Humboldt and Bonn Universities, Germany; National Museums of Kenya, Nairobi, and Dar es Salaam University College of Education, Tanzania, 2007-2010)
- Small wetland project workshop on system conceptualisation (Zanzibar, Tanzania, 2009) - Mid-term meeting organized by Volkswagen Foundation for the preparation of the meeting on “Our Common
Future” (Essen, Germany, 2010)
International symposia, workshops and conferences (9.0 ECTS)
- The interdisciplinary congress for a cross-generated dialogue about issues of our common future presented by Volkswagen Foundation, Deutsche Mess and Stiftung Mercator in cooperation with the City of Hannover and the European Capital of Culture RUHR: “Our Common Future: Climate Change and Energy II section”; Hannover-Essen, Germany (2010)
- The Volkswagen Stiftung Grantees meeting. “Resources, their Dynamics and Sustainability: Capacity-Development in Comparative and Integrated Approaches”; Witzenhausen, Germany (2010)
- The Tropentag Conference on “Research for Development in Agriculture and Forestry, Food and Natural Resource management”; Zurich, Switzerland (2010)
- The Tropentag “Biophysical and Socio-economic in Frame Conditions for the Sustainable Management of Natural Resources”; Hamburg, Germany (2009)
- The Volkswagen Stiftung workshop on “Resources, their Dynamics and Sustainability: Capacity-Development in Comparative and Integrated Approaches”; Dar es Salam, Tanzania (2009).

230

231
Curriculum Vitae
Nomé Sakané was born on the 27th of March 1976 in Koubri, Kadiogo, Burkina Faso. She attended the Protestant Private Primary Schools in Koubri and Ouagadougou. She was at Protestant Missionary Girl’s Secondary Boarding School (Loumbila) for her secondary education followed by Industrial and Technical High School (LTO, Ouagadougou) for ‘A’ level (Form 5 to 7) on a government scholarship. After completing her ‘A’ level in 1996, she joined the Private Institute for Precious Metals, for professional jewellery training (gold and silver smithing) in Ouagadougou and later in Bamako but the latter closed down in 1998 before the end of the training. She then proceeded to University of Bamako in 1999 for her undergraduate studies where she graduated in Applied Mathematics on a WINROCK-AWLAE (African Women Leaders in Agriculture and the Environment) scholarship in 2002. She then joined the 2IE (International Institute for Water and Environmental Engineering) in Ouagadougou to pursue a Master degree on a WAEMU/UEMOA (West African Economic and Monetary Union) sponsored capacity development programme and graduated in Computer and Environmental Sciences in 2004. She briefly worked as a temporary IT assistant at the Department of Operations at UNICEF (The United Nations Children's Fund) in Ouagadougou. In 2005, she was employed by ICRISAT-Mali where she worked for the NASA-USAID funded CRSP (Collaborative Research Project Programme) project on “Soil carbon Sequestration”. She assisted in different capacities that included field surveys in Mali (cotton-belt) and in Ghana (Wa and Volta Region), GIS and remote sensing analysis, and supervision of Engineering students. She was then awarded a Norman Borlaug scholarship and she joined the IFAS (International Food and Agricultural Sciences) group of Florida University as a visiting scholar. Upon return from Florida, she was employed by Africa-Rice Centre where she worked as a research assistant at the Agronomy Department for the ICM (Integrated Crop Management) programme in Saint-Louis. Together with three agronomists and in collaboration with national institutes they conducted on station and field trials on rice cropping along the Senegal River in Senegal and Mauritania. In September 2007, she enrolled for her PhD research at Humboldt-University in Germany. On completion of data collection in Kenya and Tanzania, she joined the Department of Plant Production Systems of Wageningen UR in October 2009 to finalise her thesis work. She can be reached at [email protected].

232

233
Funding
The research described in this thesis was financially supported by:
• Volskwagen Stiftung through funding from Africa Initiative Projects ‘Agricultural use and vulnerability of of small wetlands in East Africa’.
• The Plant Production Systems Group, Wageningen University and
Research Centre, The Netherlands.

Copyright © 2022 FDOKUMEN