Enhancing Smallholder Farmers' Access to Seed of Improved ...
Upload
khangminh22Category
view
1download
0
Lincoln University Digital Thesis
Copyright Statement
The digital copy of this thesis is protected by the Copyright Act 1994 (New Zealand).
This thesis may be consulted by you, provided you comply with the provisions of the Act and the following conditions of use:
you will use the copy only for the purposes of research or private study you will recognise the author's right to be identified as the author of the thesis and
due acknowledgement will be made to the author where appropriate you will obtain the author's permission before publishing any material from the
thesis.

MODELLING LAND USE DECISIONS OF SMALLHOLDER FARMERS IN TONGA
FOR AGRICULTURAL POLICY AND PLANNING
A thesis
submitted in partial fulfilment of
the requirements for the Degree
of
Doctor of Philosophy
by
ViUami T. Fakava
Lincoln University
Christchurch, New Zealand
2000
Abstract of a thesis submitted in partial fulfilment of the
requirements for the degree of PhD.
MODELLING LAND USE DECISIONS OF SMAllHOLDER FARMERS IN TONGA
FOR AGRICULTURAL POLICY AND PLANNING
by V.T. Fakava
The main objective of the study was to develop an understanding of Tongan smallholder farmers'
decision making regarding the utilisation of their limited land resources. This enables assisting
planners and policy makers in their assessment and evaluation of government policy measures. A
secondary, but associated objective, was to analyse and describe the Tongan household farming
system and aspects of the goals, priorities, and constraints that influence the decisions. The objective
was to be more realistic than past studies by improving the ways in which social and cultural values,
beliefs, attitudes, and intentions can be incorporated. In particular, the multiple goals and preferences
of Tongan smallholders, and behaviour related to non-economic goals such as socio-cultural and
church obligations, were incorporated.
Some inSight is provided into the physical, economic, and social environment of the farming
systems. Using a systems research framework, the dynamics of the smallholder farming system, its
structure, decision making processes and the environment within which decisions are made, were
explored. A cohesive conceptual framework for linking social, cultural and psychological processes
to land use decisions was developed and allowed the development of a goal programming (GP)
model to portray the decision-making process of three main farm types of Tongan smallholder
farmers (progressive, emergent and marginal). This involved identifying and quantifying the
resources, objectives, constraints and the many demands on the farmers' available time and limited
resources that influence decision-making. In addition, three agro-ecological zones were identified
and a total of eight representative models developed to describe the different farm situations.
The models were subjected to validation and verification before being used to explore the effects of
a number of agricultural policies. It was concluded that the models, as developed, were effective as
policy analysis tools and adequate for modelling the different farm types and different agro-
ecological zones which characterise Tongan agriculture. Particular attention was paid to government
policies which might facilitate the successful implementation of a development strategy for
increasing productivity. The main instruments explored included (a) regulations on farm size and
tenure security, (b) investment in agricultural research and extension for generating improved

technology, (c) market and institutional supports for market prices (changes in market prices as well
as market avenue), and credit policies, and (d) influencing farmer's goals and priorities.
The result of this research clearly shows that the production plans are determined not only by the
resources available, the technology and the institutional constraints, but also by the preferences and
importance attached to the farmers' objectives and goals. Modelling experiments for different
policies concluded that feasible policy options do exist and these should help to improve the
performance of the agricultural sector in Tonga, and of the smallholders in particular. The results
suggest the key areas for the Government to address in enhancing agricultural growth. These
include (a) facilitating access to land under a secure tenure, (b) orienting the national agricultural
research program towards more adaptive research, (c) improving the marketing system, (d)
improving the skills and motivation of smallholders through education, training, and incentives, and
(e) encouraging the development of farmers' groups.
Keywords: Tongan smallholders; Subsistence farmers' goals; Policy Analysis; Tongan Farming
Systems; Goal Programming; Model; Adaptive Research; Land Tenure; Multiple
Goals; Farmers' Groups
ii

ACKNOWLEDGEMENTS
Numerous people have made intellectual and personal contributions to the preparation of this study,
without their assistance this achievement would not have been possible. Of all, I do, however, want
to give a special recognition to several key supporters.
I would firstly wish to express my utmost appreciation to my chief supervisor, Dr. Peter Nuthall for the
innumerable contributions he has made to this dissertation. Peter has provided me with valuable
knowledge and ideas, and helped streamline the focus of this researyh. His friendly advice, constant
encouragement, criticism and the confidence he showed in me during this study are sincerely
appreciated. I am also grateful for the helpful advice and valuable comments provided by my associate
supervisor, Dr. Gilbert Nartea. I wish to thank Peter McNaughton who assisted the processing and
analysis of my research data, and to Ms Caitriona Cameron for her support in the English editing of the
manuscript.
I would like to thank the following organisations for the financial support and contributions they gave,
without which, the planning and execution of this study would not have been possible: The Ministry
of Foreign Affairs and Trade, Wellington; the Lincoln fund for Excellence, Lincoln University; the
Davidson Te Hiroa Fund, Australian National University; the Arthington Davy Fund, England; and the
Pacific Island Education Fund, Ministry of Pacific Island Affairs.
I would also like to acknowledge the support given by the Govemment of Tonga and the Ministry of
Agriculture and Forestry in granting the study leave to complete this study venture. A special
acknowledgement to the Director of Agriculture and Forestry, Mr Haniteli Fa'anunu, Head of Policy
and Planning, Mr Viliami Tiseli, MAF Officers-in-Charge of MAF offices in Vava'u and Ha'apai, Mr
Mana'ia Halafihi and Vaea 'Anitoni, and their respective staff for their pervasive support and valuable
contributions in my fieldwork. Special acknowledgements, however, are given to my field assistants,
Piliu Kailahi, Mikaele Saipa'ia, Ika Katoa, Maka Sitaleki, and Koniseti Politoni.
I am also grateful to Dr. Nick Taylor, Max Cunliffe, Gerald Fitzgerald, Dr. Garth Cant and Mr 'Aleki
Sisifa, who shared their experience and assisted me in many ways throughout the duration of this
study. I wish to thank Dr. 'Amanaki Havea of the Free Wesleyan Church; Seini Filiai from the
Statistics Department, Tukua Tonga of the Ministry of Finance, Lisia Muller of the Central Planning
Department, and Siola'a Tu'itupou of the Tonga Development Bank, who willingly provided
information sought for this thesis.
iii

Special acknowledgement must be made of the help received from district and village officers and
numerous key informants, farmers and people of the villages of Navutoka, Masilamea, Ha'ano,
Koulo, Tefisi and Feletoa. The warm welcome, time and perseverance in dealing fully with the
questions during the survey have made the gathering of required primary and secondary information
both possible and pleasurable.
I would like to express my sincere thanks to Siale and Milika Faitotonu, 'Emeline Finlayson, Viliami and
Lavi Moala, Viliami and 'liaise Puakahuhua, Rev. 'Inoke Siulangapo and the Tongan Methodist Church,
and to all our friends in Christchurch who have willingly supported us during the last four years.
Finally I would like to especially thank our parents, Mosese and Siesia Fakava, Sione and Sisilia
Tu'ipulotu and the rest of my family, for their moral support, prayers and encouragement during the
study period. Special thanks to Loutoa and Tony Albrecht, without whose help I would not have had
the opportunity to study in New Zealand. Last. but not the least, I would like to acknowledge the
constant support and encouragement of my wife Tufitaufa'ao, without her understanding and
patience this study would not have been possible.
Malo 'aupito
iv

TABLE OF CONTENTS
CHAPTER 1 INTRODUCTION ................................................................................................... 1
1.1 Smallholder Agriculture Development in Tonga .................................................... 1
1.2 Research Rationale ............................................................................................... 2
1.3 Research Objectives ............................................................................................. 5
1.4 Outline of Thesis .................................................................................................... 7
CHAPTER 2 A REVIEW OF DECISION MODELLING METHODOLOGY ............................. 10
2.1 Introduction .......................................................................................................... 10
2.2 Modelling Approaches to Household Studies ...................................................... 10
2.2.1 Economic approach ................................................................................... 11
2.2.2 Sociological approach ............................................................................... 12
2.2.3 Psychological approach ............................................................................ 13
2.2.4 Integrated approach .................................................................................. 14
2.2.5 Farm household systems .......................................................................... 15
2.2.6 Modelling smallholder farming system - A Brief Review ......................... 16
2.3 A Review of Mathematical Programming Models ................................................ 18
2.3.1 Linear programming .................................................................................. 18
2.3.2 Multiple objective programming models .................................................... 19
2.3.2.1 Multi-Objective Programming Model.. ........................................ 21
2.3.2.2 Compromise Programming ........................................................ 23
2.3.2.3 Goal Programming ..................................................................... 24 2.3.2.3.1 Applications of goal programming ......................................... 27
2.3.2.3.2 Critical issues concerning the use of GP ............................... 27
2.4 Conclusion ........................................................................................................... 29
CHAPTER 3 THE STUDY AREA ................................................................................. ............ 31
3.1 Introduction .......................................................................................................... 31
3.2 General Background ............................................................................................ 31
3.2.1 Physical setting ......................................................................................... 31
3.2.1.1 Geographical Background ......................................................... 31
3.2. 1.2 Geology/Geomorphology ........................................................... 33
3.2.1.3 Soils ........................................................................................... 34
3.2.1.4 Climate ....................................................................................... 34
3.2.2 Social background ..................................................................................... 35
3.2.2.1 The Household ........................................................................... 35
3.2.2.2 The Village ................................................................................. 36 v

3.2.2.3 The Church ................................................................................ 36
3.2.3 Land tenure system ................................................................................... 37
3.2.4 Economic background ............................................................................... 38
3.2.4.1 The Tongan Economy ................................................................ 38
3.3 The Agriculture Sector ......................................................................................... 39
3.3.1 The importance of agriculture ................................................................... 39
3.3.2 Performance of the agriculture sector ....................................................... 40
3.3.3 The Tongan farming systems ................................................................... .42
3.3.3.1 Food and Cash Crops Component.. ......................................... .43
3.3.3.2 Livestock Component ................................................................ 44
3.3.3.3 Handicraft Component ............................................................... 44
3.4 Conclusions ......................................................................................................... 44
CHAPTER 4 FIELD RESEARCH METHODOLOGY ............................................................... 46
4.1 Introduction .......................................................................................................... 46
4.2 Research Approach ............................................................................................. 46
4.3 Field Visits ........................................................................................................... 48
4.3.1 Initial visit ................................................................................................... 48
4.3.2 Main research visit .................................................................................... 49
4.4 Data Collection .................................................................................................... 50
4.4.1 Farming system household survey ........................................................... 50
4.4.2 Interviews of key informants ...................................................................... 50
4.4.3 Direct observation ..................................................................................... 51
4.4.4 Village studies ........................................................................................... 52
4.5 Selection of Sample Households ........................................................................ 54
4.6 Conclusions ......................................................................................................... 55
CHAPTER 5 ORGANISATION OF TONGAN AGRICULTURE .............................................. 56
5.1 Introduction .......................................................................................................... 56
5.2 Agricultural Policy and Development Planning .................................................... 57
5.3 The Formulation of Government Policy in Tonga ................................................ 58
5.4 Government Support Programs and Development Initiatives .............................. 60
5.5 Past Development Schemes ............................................................................... 62
5.5.1 Banana rehabilitation scheme ................................................................... 62
5.5.2 Coconut replanting scheme ...................................................................... 63
5.5.3 Coffee development project ...................................................................... 64
5.5.4 Livestock development programs ............................................................. 64
5.5.5 Vanilla development project ...................................................................... 65
5.5.6 Squash development project. .................................................................... 66 vi
5.5.7 Kava development project ......................................................................... 67
5.6 Agricultural Marketing .......................................................................................... 67
5.6.1 Domestic marketing ................................................................................... 67
5.6.2 Export marketing ....................................................................................... 69
5.6.2.1 Squash ...................................................................................... 70
5.6.2.2 Vanilla ........................................................................................ 72
5.6.2.3 Kava ........................................................................................... 73
5.6.2.4 Root Crops ................................................................................. 73
5.6.2.5 Watermelon ............................................................................... 74
5.6.3 Marketing organisations ............................................................................ 74
5.6.4 National market information system .......................................................... 75
5.7 Agricultural Credit ................................................................................................ 75
5.7.1 Tonga Development Bank ......................................................................... 76
5.8 Agricultural Input Supply ...................................................................................... 78
5.9 Conclusion ........................................................................................................... 78
CHAPTER 6 ANALYSIS OF SMALLHOLDERS' GOALS AND OBJECTIVES ..................... 81
6.1 Introduction .......................................................................................................... 81
6.2 Goal SpeCification of Tongan Smallholder Farmers ............................................ 82
6.3 Achievement of Goals ......................................................................................... 85
6.4 Major Constraints to Achieving Objectives .......................................................... 86
6.4.1 Inadequate marketing opportunities .......................................................... 86
6.4.2 Limited access to crediVcapital ................................................................. 88
6.4.3 Ineffective MAF research and extension services .................................... 88
6.4.4 Socia-cultural values and beliefs as constraints ....................................... 89
6.4.5 Absence, or inadequacy of infrastructures ................................................ 90
6.5 Farm Household Decision Making ...................................................................... 91
6.5.1 Farmers' group .......................................................................................... 92
6.5.2 Village committees .................................................................. : ................. 92
6.5.3 Other factors .............................................................................................. 92
6.6 Risk Assessment ................................................................................................. 93
6.6.1 Crops and enterprise diversification .......................................................... 94
6.6.2 Modify planting times ................................................................................. 94
6.6.3 Diversify production practices or technology ............................................. 94
6.6.4 Market information ..................................................................................... 95
6.7 Summary ............................................................................................................. 95
vii

CHAPTER 7 ANALYSIS OF HOUSEHOLD LAND RESOURCES AND PRODUCTION ....... 98
7.1 Introduction ......................................................................................................... 98
7.2 Access to Land .................................................................................................... 98
7.2.1 Cropping pattern ..................................................................................... 101
7.2.2 Agricultural technology ........................................................................... 109
7.2.3 Indigenous knowledge ............................................................................ 109
7.3 Significance of Domesticated livestock ........................................................... 112
7.3.1 Pigs ......................................................................................................... 112
7.3.2 Poultry ..................................................................................................... 114
7.3.3 Cattle ....................................................................................................... 114
7.3.4 Goats ...................................................................................................... 115
7.3.5 Horses ..................................................................................................... 116
7.3.6 Disposition of livestock ........................................................................... 116
7.3.7 Marketing livestock ................................................................................. 118
7.4 Conclusions ....................................................................................................... 119
CHAPTER 8 ANALYSIS OF HOUSEHOLD INCOME AND LABOUR USE ......................... 122
8.1 Introduction ....................................................................................................... 122
8.2 Household Cash Income ................................................................................... 122
8.2.1 Source of income .................................................................................... 122
8.2.1.1 Sales of Agricultural Produce .................................................. 123
8.2. 1.2 Wages and Salary Earnings .................................................... 124 8.2.1.3 Gifts and Remittances ............................................................. 124
8.2.1.4 Business .................................................................................. 125 8.2. 1.5 Exchange of Handicrafts ......................................................... 125
8.2.2 Variation in income among villages ........................................................ 126
8.3 Household Cash Expenditure ........................................................................... 127
8.3.1 Home Consumption ................................................................................ 128
8.3.2 Church obligations .................................................................................. 129
8.3.3 Social obligations .................................................................................... 129
8.3.4 Education ................................................................................................ 130
8.3.5 Utilities .................................................................................................... 130
8.3.6 Other ....................................................................................................... 130
8.3.7 Cash savings .......................................................................................... 130
8.3.8 Cashflow ................................................................................................. 130
8.4 Household Labour Utilisation ............................................................................ 131
8.4.1 Occupation of household heads ............................................................. 131
8.4.2 Agricultural labour ................................................................................... 132
viii
8.5 Conclusions ....................................................................................................... 135
CHAPTER 9 ANALYSIS OF THE SOCIO-CUL TURAL ENVIRONMENT ............................ 136
9.1 Introduction ........................................................................................................ 136
9.2 Christian Church Activities ................................................................................. 136
9.2.1 Cash donations ....................................................................................... 137
9.2.2 Feasting ................................................................................................... 138
9.2.3 Contributed labour and time .................................................................... 139
9.2.4 Leadership role ........................................................................................ 139
9.2.5 Motives .................................................................................................... 139
9.3 Cultural Values - wealth. prestige and respect.. ............................................... 140
9.3.1 Social and kinship ties ............................................................................. 140
9.3.2 Perception of wealth ................................................................................ 141
9.3.3 Prestige and respect ............................................................................... 142
9.4 Village Organisations ......................................................................................... 142
9.4.1 District agricultural committee (DAC) ...................................................... 142
9.4.2 Women's role in Agriculture .................................................................... 143
9.5 Major Support Services ..................................................................................... 144
9.5.1 Isolation from Support Services .............................................................. 144
9.5.2 Urban migration ....................................................................................... 145
9.5.3 Input supplies .......................................................................................... 145
9.6 Other key issues ................................................................................................ 146
9.6.1 Macro-economic issues ........................................................................... 146
9.6.2 Willingness to try new crops and new technology ................................... 147
9.7 Conclusions ....................................................................................................... 148
CHAPTER 10 CONCEPTUAL FRAMEWORK AND MODEL DESCRIPTION ...................... 150
10.1 Introduction ........................................................................................................ 150
10.2 DeCision-Making Conceptual Framework .......................................................... 150
10.2.1 Production objectives .............................................................................. 152
10.2.2Resources availability .............................................................................. 152
10.2.3The Constraints ....................................................................................... 152
10.2.4 The Production strategy .......................................................................... 153
10.3 Model Development. .......................................................................................... 153
10.3.1 Basic Model: Typical emergent farmer in Masilamea vlllage ................. 153
10.3.1.1 Household Component ........................................................... 153
10.3.1.2 Farm Component: crops and livestock activities .................... 153 ix

10.3.20utline of the matrix ................................................................................ 155
10.3.2.1 Goal Specifications ................................................................. 155
10.3.2.2 The Combined Objective Function ......................................... 161
10.4 Modelling Production Activities ......................................................................... 162
10.5 Modelling Production Constraints ..................................................................... 163
10.5.1 Modelling decision problems involving land ........................................... 163
10.5.2Modelling decision problems involving labour ........................................ 165
10.5.3Modelling decision problems involving working capital .......................... 166
10.5.4Selling and buying activities .................................................................... 166
10.6 Summary ........................................................................................................... 167
CHAPTER 11 MODEL VALIDATION AND VERIFICATION .................................................. 168
11.1 Introduction ....................................................................................................... 168
11.2 Model Verification .............................................................................................. 168
11.3 Model Validation ................................................................................................ 169
11.4 Model Results and Analysis .............................................................................. 171
11.4.1 Achievement of goals ............................................................................. 172
11.4.2Farm Operating Plans ............................................................................. 172
11.4.2. 1 Analysis of land use ............................................................... 173
11.4.2.2 Analysis of labour use ............................................................ 176
11.4.2.3 Analysis of cash flow .............................................................. 176
11.5 Conclusion ....................................................................................................... 177
CHAPTER 12 MODEL IMPLEMENTATION AND APPLICATION ......................................... 183
12.1 Introduction ....................................................................................................... 183
12.2 Modelling Different Policies ............................................................................... 183
12.2.1 Modelling land reform policies ............................................................... 184
12.2.2 Impact of market policies ...................................................................... 190
12.2.2. 1 Output prices .......................................................................... 190
12.2.2.2 Market Avenues ..................................................................... 192
12.2.3 Effects of Improved Technology ............................................................ 196
12.2.4 Effects of Labour Policies ...................................................................... 199
12.2.5 Effects of Off-farm Earnings .................................................................. 201
12.2.6 Effects of Credit policies ........................................................................ 204
12.2.7 Modelling risk ......................................................................................... 205
12.3 Modelling farmers goals and priorities ............................................................. 208
12.3.1 Modelling the significance of church and social obligations .................. 208
12.4 Aggregation for macro-policy consideration ..................................................... 214 x

12.4.1 Indicative investment in the interventions ............................................... 215
12.4.2Indicative project benefits ....................................................................... 216
12.5 Summary ........................................................................................................... 218
CHAPTER 13 CONCLUSIONS AND SCOPE FOR FURTHER RESEARCH ........................ 222
13.1 Summary ........................................................................................................... 222
13.2 Conclusions ....................................................................................................... 224
13.3 Implications for Further Research ..................................................................... 226
REFERENCES ................................................................................................................................ 227
LIST OF APPENDiCES ................................................................................................................... 242
xi
LIST OF TABLES
Table Page
1.1 Projected and actual export returns (in T$m) from agriculture products 1991 - 1995 ............ 3
3.1 Geographical distribution of the population in 1986 and 1996 ........................................... 33
3.2 Mean annual temperatures and total rainfall for the three main island groups .................. 34
3.3 Balance of payments (T$ million; fiscal years ending June 30th) ........................................... 39
3.4 Contribution of agriculture to gross domestic product (GOP) ..................................... .40
3.5 Production estimates of major crops grown in Tonga in 1993 .......................................... .40
3.6 Contribution of agriculture to Tongan export earnings ........................................................... 41
4.1 Population of the six villages by sex, 1986 and 1996 ............................................................. 54
5.1 Supplies of major agricultural commodities at T alamahu Market (1990 - 1996) ............... 69
5.2 Major agricultural export crop earnings (1991 - 1996) .......................................................... 70
5.3 Major root crop exports for 1991-1996 ............................................................................... 74
6.1 Importance weighting of objectives by each farm category ................................................... 83
6.2 Goal achievement satisfaction levels for each farm category ................................................ 85
6.3 Main source of technical information for each farm category (column percentages) ............ 89
6.4 The main decision maker and decision influencers ........................................................... 91
7.1 Percentage of farmed tax allotments for the three main island groups in 1992 ............... 99
7.2 Land tenure status and access .......................................................................................... 99
7.3 Crops grown in the six villages ......................................................................................... 104
7.4 Crop types produced in the six villages ............................................................................ 105
7.5 Distribution of farmers by crop area size (%) ....................................................................... 105
7.6 Distribution of livestock among the six different villages ...................................................... 113
xii
7.7 Composition of household pig herds among the six different villages ................................. 113
7.8 Pig management systems at different villages ................................................................. 114
7.9 Disposal of pigs among the six different villages ............................................................. 117
7.10 Value of meat imported to Tonga in 1990 - 1996 ............................................................ 118
8.1 Average household cash income by source by village .................................................... 123
8.2 Wage employment incomes ................................................................................................. 124
8.3 Percentage households by income category ................................................................... 126
8.4 Distribution of major household expenditure per village .................................................. 127
8.5 Percentage distribution of household heads by occupations ........................................... 132
8.6 Percentage of farms with farm labour sources from various sources .............................. 133
9.1 Distribution of religious affiliation among the population .................................................. 137
9.2 Annual donation to the Free Wesleyan Churches in the studied villages ........................ 138
10.1 Outline of matrix activities and constraints ....................................................................... 156
10.2 Annual minimum requirement for the objective components for emergent farmers in
Tongatapu ........................................................................................................................ 157
10.3 Summary of input and output requirements for each enterprise .......................................... 162
10.4 Monthly labour requirement per ha for major production activities ............................. 165
11.1 Achievement status for the goals in each model solution ......................................... 174
11.2 Summary of optimal farm plans compared for different farm types in model solutions
and actual survey results ................................................................................................. 175
11.3 Average monthly area of cultivated land per month by farm types in model solutions
and actual survey results ................................................................................... 178
11.4 Summary of family labour use for agricultural purposes (in hours and percent) in
each month ................................................................................................... 179
xiii
11.5 Summary of annual cash flow in the representative farms model solutions compared
to the actual survey results ............................................................................... 180
11.6 Percentage composition of agricultural income for each representative farm in the
model solutions compared to actual results .......................................................... 181
12.1 Goals achievement status for parametric variation in land sizes for an emergent
farmer in Tongatapu ......................................................................................... 187
12.2 Summary of Tongatapu emergent farmers' farm plan under different allotment sizes .... 187
12.3 Effects of reducing allotment size on progressive farm households' land use plan ....... 189
12.4 Effects of squash price variations on progressive and emergent farms ......................... 191
12.5 Effects of yam price variations on the three main farm types in Tongatapu .................... 193
12.6 Effects of yam price variations on emergent farm types ................................................ 193
12.7 Summary of emergent farmers' land use under different market avenues ..................... 194
12.8 Summary of farmers' lands use under improved technologies ....................................... 197
12.9 Achievement status for goals for variation in family labour supply ............................. 200
12.10 Summary of emergent farm plan under different family labour supply levels .................. 201
12.11 Summary of production and economic effects under different off-farm earnings for the
three representative farms in Tongatapu ........................................................................ 202
12.12 Effect of varying off-farm income levels on the achievement of goals for the three main
farm types in Tongtapu ..................................................................................... 203
12.13 Effects of variation in interest rates on total cropped area and surplus cash ................. 205
12.14 Effects of yield risk on different farm types in Tongatapu ............................................... 207
12.15 Effects of altering the weight on church obligation on farmer's production plans ........... 209
12.16 Effects of altering the weight on social obligations on different farm type production
plans ........................................................................................................... 209
xiv
12.17 Effects of altering the leisure weights on the production plans of the different farm
types ............................................................................................................................... 210
12.18 Affect of concentrating on a simple profit maximising objective for the three main
farm types in Tongatapu .................................................................................................. 213
12.19 Summary of proposed intervention cost estimates (T$) .................................................. 215
12.20 Summary of proposed project benefits (T$) .................................................................... 216
12.21 Summary of the projected changes in representative farm land use patterns ................ 217
xv
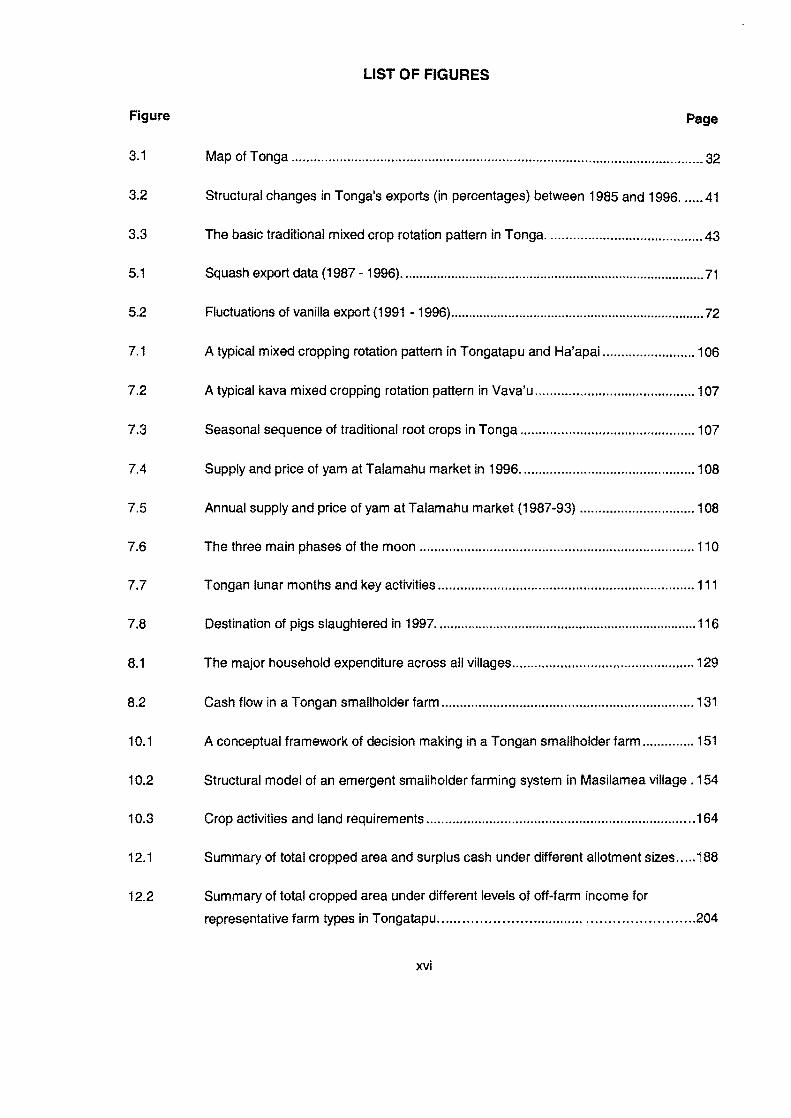
LIST OF FIGURES
Figure Page
3.1 Map of Tonga ............................................................................................................... 32
3.2 Structural changes in Tonga's exports (in percentages) between 1985 and 1996 ...... 41
3.3 The basic traditional mixed crop rotation pattern in Tonga ......................................... .43
5.1 Squash export data (1987 - 1996) ..................................................................................... 71
5.2 Fluctuations of vanilla export (1991 - 1996) ....................................................................... 72
7.1 A typical mixed cropping rotation pattern in Tongatapu and Ha'apai ......................... 106
7.2 A typical kava mixed cropping rotation pattern in Vava'u ........................................... 107
7.3 Seasonal sequence of traditional root crops in Tonga ............................................... 107
7.4 Supply and price of yam at Talamahu market in 1996 ............................................... 108
7.5 Annual supply and price of yam at Talamahu market (1987-93) ............................... 108
7.6 The three main phases of the moon .......................................................................... 110
7.7 Tongan lunar months and key activities ..................................................................... 111
7.8 Destination of pigs slaughtered in 1997 ......................................................................... 116
8.1 The major household expenditure across all villages ................................................. 129
8.2 Cash flow in a Tongan smallholder farm .................................................................... 131
10.1 A conceptual framework of decision making in a Tongan smallholder farm .............. 151
10.2 Structural model of an emergent smallholder farming system in Masilamea village. 154
10.3 Crop activities and land requirements ........................................................................ 164
12.1 Summary of total cropped area and surplus cash under different allotment sizes ..... 188
12.2 Summary of total cropped area under different levels of off-farm income for
representative farm types in Tongatapu ............................................................ 204
xvi

12.3 Percentage reduction in surplus cash when varying goal weights for social and
church obligations in an emergent farm households in Tongatapu ........................ 211
12.4 Effects of varying the goal weight on the cash surplus objective in emergent
farm households in Tongatapu ...................................................................... 212
xvii

CHAPTER 1
INTRODUCTION
In this introductory chapter the broad perspective within which the present study is located together
with the objectives of the study, its research subject and theoretical orientation are described and
the thesis outline presented.
1.1 Smallholder Agriculture Development in Tonga
In Tonga, the agriculture sector forms a substantial part of the national economy. Characterised by
its smallness in terms of population, land area and per capita income, it is geographically
fragmented and vulnerable to natural disasters. The smallness and lack of natural resources have
led to its economy being overwhelmingly rural and agricultural. Most households derive a major part
of their basic requirements from the cultivation and utilisation of land resources.
The role of agricultural production is manifested in several ways: as a source of food, employment,
cash income, foreign exchange and as a source of raw materials for processing (World Bank,
1991). It contributes substantially to the general economy of Tonga, as clearly indicated by the
sector's contribution of about 40 to 50 percent of gross domestic product (GDP). As a source of
foreign exchange through exports, agriculture is by far the most important sector and accounts for
the majority of the value of the Kingdom's total exports. Agricultural products have comprised about
70 percent of average total exports over the last ten years (Ministry of Finance, 1998).
Smallholder production is the main mode of agricultural production in Tonga. The 1993 Land Use
and Crop Survey conducted by the Ministry of Agriculture and Forestry reported that of the 6665 tax
allotments 1 surveyed, 88 percent were farmed by a single farmer and only 12 percent by multiple
operators. The survey also showed that 75 percent of the farmers in Tonga farmed less than one
hectare of crops and 19 percent farmed between one to 2.5 hectares (MAF, 1994b). The majority of
agricultural smallholder producers in Tonga are semi-subsistence farm households. Thus, part of
the total product is retained within the household for home consumption and for social and religious
obligations. The remainder is sold.
1 A tax allotment is a parcel of land (normally 3.3ha) for farming registered under a male citizen over the age of 18

1.2 Research Rationale
Agriculture development is fundamental to a strong Tongan economy. It is the dominant productive
sector and holds good prospects for growth. Historically, it is quite evident that as agriculture goes,
so goes the nation. The complicated nature of agricultural development in Tonga stems from the
fact that government, in an effort to meet the aspirations of their citizens, is compelled to accelerate
the pace of agricultural developments. The present state of the economy requires smallholder
farmers to commercialise further, and it is believed there is an increased role for the private sector
('Akolo, 1997). The Government is currently looking for opportunities to diversify the economy
particularly within the agricultural sector. The Government accords high priority to export crop
diversification in order to move toward more marketable crops, to increase foreign exchange
earnings, to further develop a significant agricultural base, and to increase the degree of food
security and self-reliance by exploiting the resources more rationally and sustainably. The realisation
of these opportunities is, however, constrained by a number of production, marketing and
institutional factors, coupled with an unfavourable macroeconomic environment. Tonga must
therefore prioritise its needs and focus on the development of strategies for growth, diversification
and intensification of agriculture. 'Akolo (1997) recommends that the development of agricultural
policy should focus on encouraging entrepreneurial activity among farmers and agricultural service
industries, and on building a private sector capacity in areas such as marketing and delivery of
services to farmers.
Dillon and Hardaker (1993) note that those responsible for formulating development plans and
policies, however, make few of the day-to-day decisions that affect agricultural performance.
Agricultural growth and development depends upon the production decisions and actions of the
smallholder farm households. Most production decisions on how to allocate resources among
different farming activities are taken by individual households. So, too, are decisions on the disposal
of farm produce, and on how much commodity to sell into alternative markets. The success of
efforts by agricultural planners to ensure that these decisions are made in accordance with
development objectives in the agricultural sector depends on understanding the decision making
process and strategies of smallholder farm households.
Over the years, the Government and foreign donor agencies have put a lot of effort into the
development of agriculture in Tonga. Development programs in the past were mainly commodity
oriented and targeted export potential crops. Examples include the banana rehabilitation scheme,
the coconut replanting scheme, vanilla development, the squash development project, coffee, yam
bean, and other programmes. Ranges of policy instruments have supported these projects in
attempts to promote the growth of the agriculture sector and the economy. Instruments include
direct expenditure on MAF services, institutional strengthening and the provision of infrastructure
facilities, market information, education, and economic incentives in the form of credit and subsidies.
2
These policies have been aimed at enhancing and promoting the productivity of smallholder farmers
in the hope of increased export production through new crops and technologies.
Experience with agricultural development programs in Tonga, however, has been chequered.
Tonga's agricultural economy has failed to expand production to its potential and to keep pace with
the growth in imports. The balance of payments situation is structurally weak with too much reliance
being placed on foreign remittances and aid to meet the persistent and growing trade deficit. It is
evident that development efforts in the agricultural sector have produced little substantive
development, and smallholder production has not fully responded. A significant proportion of
agricultural development projects intended to assist smallholder agriculture development in Tonga
have been uniformly unsuccessful in achieving their objectives of sustained increases in production
and productivity (MAF, 1994a). Lavulo (1988) noted that the economic growth targets set by the
National Development Plans have not been achieved. For example, the annual growth rate targets
set by the Development Plan III (1980/85) and the Plan IV (1985/90), were 5.5 percent and 5.7
percent in their respective planning periods but the achievements were 4.5 percent and 3.4 percerlt
respectively. The agricultural sector, however, was the biggest single contributor to this growth.
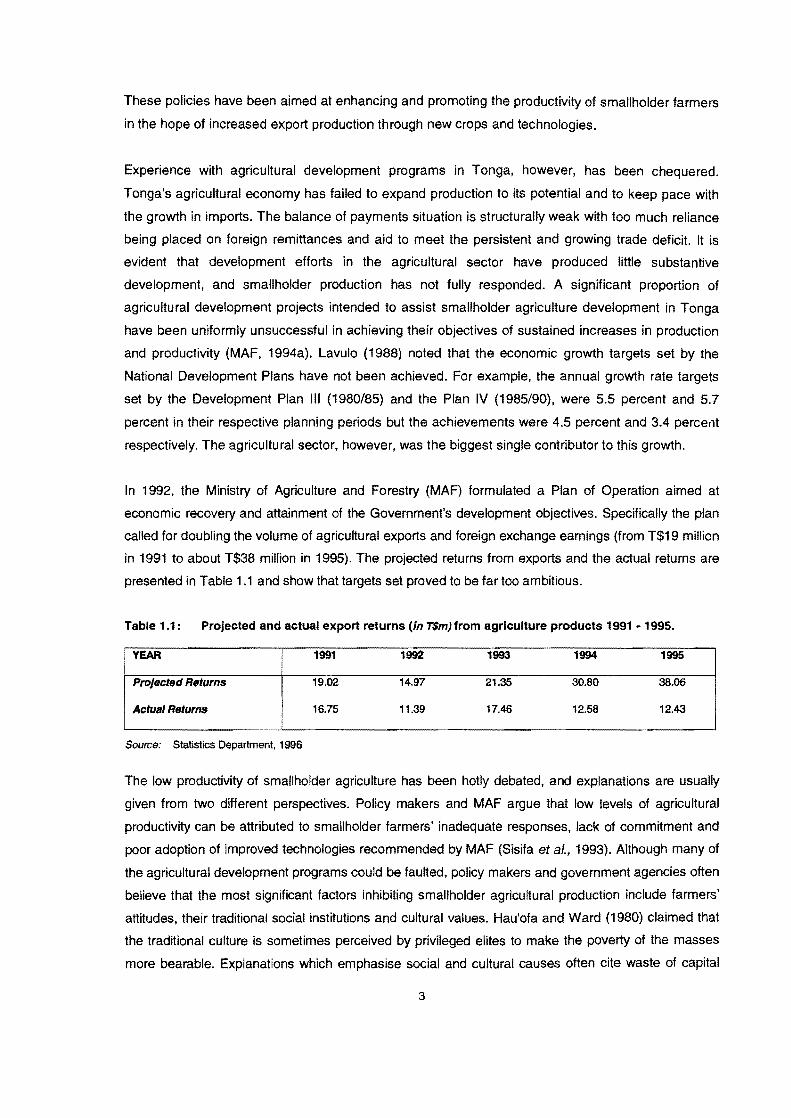
In 1992, the Ministry of Agriculture and Forestry (MAF) formulated a Plan of Operation aimed at
economic recovery and attainment of the Government's development objectives. Specifically the plan
called for doubling the volume of agricultural exports and foreign exchange earnings (from T$19 million
in 1991 to about T$38 million in 1995). The projected returns from exports and the actual returns are
presented in Table 1.1 and show that targets set proved to be far too ambitious.
Table 1.1: Projected and actual export returns (in T$m) from agriculture products 1991 - 1995.
YEAR 1991 1992 1993 1994 1995 i
Projected Returns 19.02 14.97 21.35 30.80 38.06
Actual Returns 16.75 11.39 17.46 12.58 12.43
Source: Statistics Department, 1996
The low productivity of smallholder agriculture has been hotly debated, and explanations are usually
given from two different perspectives. Policy makers and MAF argue that low levels of agricultural
productivity can be attributed to smallholder farmers' inadequate responses, lack of commitment and
poor adoption of improved technologies recommended by MAF (Sisifa et a/., 1993). Although many of
the agricultural development programs could be faulted. policy makers and government agencies often
believe that the most significant factors inhibiting smallholder agricultural production include farmers'
attitudes, their traditional social institutions and cultural values. Hau'ofa and Ward (1980) claimed that
the traditional culture is sometimes perceived by privileged elites to make the poverty of the masses
more bearable. Explanations which emphasise social and cultural causes often cite waste of capital
3

and labour in social and religious events and the resulting inability to save and invest, the low status of
agriculture, or a preference for leisure as specific factors which have a negative effect on smallholder
agriculture. Sevele (1983) argued that motivation is one of the major social constraints to development
of agriculture in Tonga. He raised a conventional view that traditional institutions and behaviour are
responsible for agricultural stagnation and that Tongan farmers do respond to market incentives in a
predictable way. However, they rarely respond as fully as they could, given their social and resource
situations.
The major proposition of this study is that relatively little attention has been paid to decision-makers at
the micro-level, and not enough is known of their decision-making processes and strategies. The target
group, the smallholder farmers are by far the most important element of agriculture development in
Tonga, but there is little prior analysis of their needs and capabilities by planning bureaucracies in
designing development projects. Agricultural development planners and policy makers from
government departments, overseas expatriates and donor agencies have a limited understanding of
smallholder farmers' goals, priorities, values and resource limitations, all of which are key aspects of
their land use decision making. Many decisions made are based on insufficient and inaccurate
assumptions of how farmers make decisions in response to various circumstances. Taylor (1980)
pointed out that behaviour and social relationships in a small society are complex and outsiders from
metropolitan countries can easily mis-interpret many social situations. From a planning viewpoint, there
is evidence of inadequate elaboration of development goals and objectives, superficial identification of
resources and insufficient knowledge concerning resource interactions. These have all created
confusion and uncertainty, particularly as regards the role of agriculture in the Kingdom's development.
Most of the policymakers have essentially an economic approach; the importance of the socio-cultural
dimension of agricultural development is usually grossly underestimated. In the traditional economic
approach, agricultural policies have been developed on the premise that farmers' main objective is to
maximise profits. This approach also assumes that improved technology and education leads to
improved decision making at the farm level and will automatically improve agriculture. However,
development programs based on such approaches have inevitably failed. It is argued that traditional
development projects have erred by focusing unduly on technical and economic prescriptions, ignoring
the need to adapt development assistance to the local cultural and social environment and ensure that
the target beneficiaries identify with such assistance efforts. Traditional economic theory provides
limited guidance in the selection of variables to explain the land use decisions of smallholder farmers.
A strict profit maximisation framework fails to encompass attitudinal variables as profit maximisation is
a minor farm objective in developing countries. There are other important factors, institutional, social,
and political, that tend to impede decision-making for agricultural development.
Some observers (eg. Beets, 1990; Dia, 1991; De Wilde, 1967; Hau'ofa and Ward, 1980) have argued
that apart from the many physical, economic and technical factors there are many socio-cultural and
4

psychological considerations involved in the way a smallholder makes decisions. They attribute the
failure of many previous agricultural development programs to a lack of an appreciation of the socio-
cultural and traditional cultural values as well as a poor understanding of the inherent social norms and
obligations of target beneficiaries that influence economic farm decision-making. The smallholders'
social decision-making environment is prescribed by their culture, which determines values, cognition,
beliefs, and experiences which are all important components of their decision-making frame of
reference. These values strongly influence the behaviour and decision making strategies of the target
beneficiaries or farmers and are crucial aspects of development. Schoeffel (1991) suggested that the
technical design of agriculture development policies and technologies should incorporate a well-
informed social and cultural analysis to achieve more realistic projections of outcomes and more
effective and sustainable results. According to Gaul (1993), macro and micro-economic, socio-
economic, cultural, familial, communal and societal factors affect all development projects. He
proposed that an understanding of these factors and their linkages is a necessary ingredient in
successful development. Development that ignores them is less likely to be successful and
sustainable, both from the viewpoint of the planners and the recipients.
Research and studies in decision making for agricultural development in Tonga have been neglected in
the past primarily because of the expense and the lack of well-trained personnel from various
disciplines required to carry out appropriate research. Generally, amongst the vast literature published
on smallholder farming development, only a few are directly relevant to the smaller South Pacific Island
nations. Although much has been written about Tongan traditional agriculture (Delforce, 1990;
Hardaker, 1975; Sevele, 1973; Thaman, 1976) relatively few detailed microanalyses and
management studies have been undertaken to understand the decision making strategy of
smallholders farmers to develop guidelines for policymakers and change agents in the development
of agriculture. While some headway has been made in this behavioural research area for
smallholder farmers (Hardaker, 1975; Delforce, 1990), much more attention is needed to
understand the decision making process and to incorporate multiple goals and social factors in the
overall production decision system of a Tongan smallholder farmer. A major weakness of the
literature reviewed is the absence of a cohesive conceptual framework for linking social, cultural and,
psychological processes to economic decisions of smallholder farmers. There is no literature available
to focus exclusively on Tongan smallholder farmer's decision making processes and strategies and to
take account of the social and cultural dimensions that are highly significant in Tongan society.
1.3 Research Objectives
Tongan smallholders have limited resource endowments and multiple goals or objectives. Within this
framework, the smallholder farmers are faced with a range of constraints that will influence their
decisions on utilising their land. The study will address the following questions: How do smallholder
5
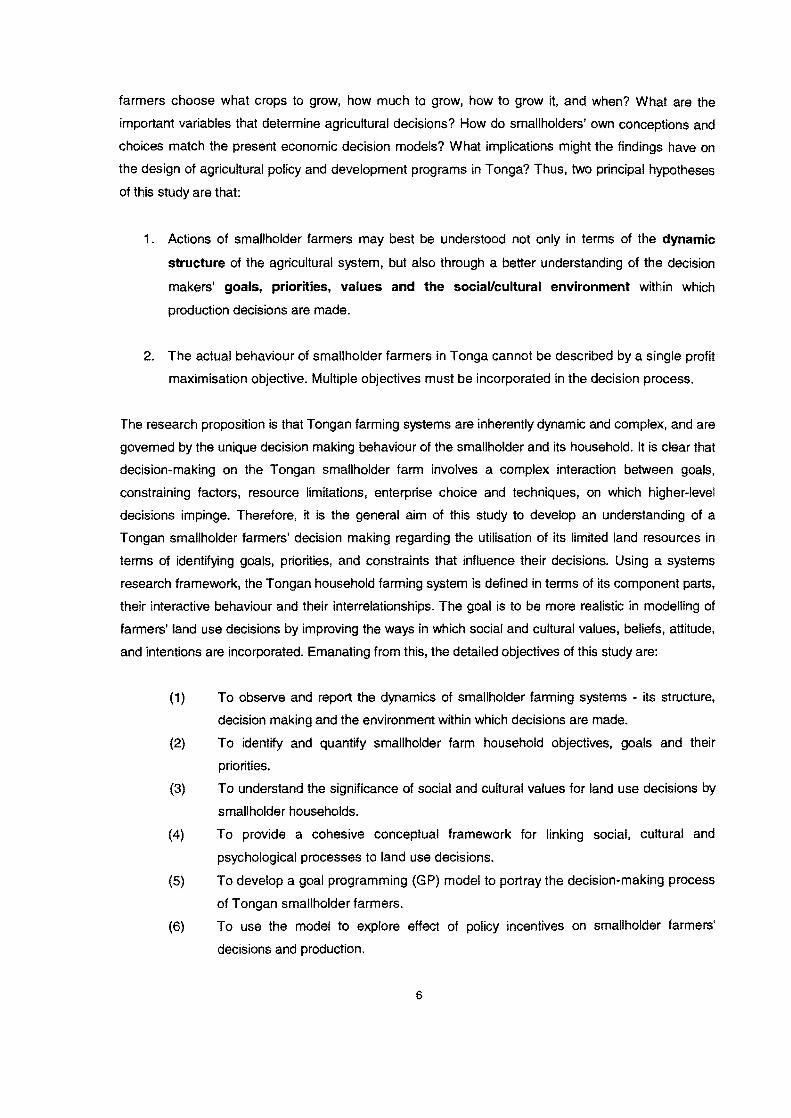
farmers choose what crops to grow, how much to grow, how to grow it, and when? What are the
important variables that determine agricultural decisions? How do smallholders' own conceptions and
choices match the present economic decision models? What implications might the findings have on
the design of agricultural policy and development programs in Tonga? Thus, two principal hypotheses
of this study are that:
1. Actions of smallholder farmers may best be understood not only in terms of the dynamic
structure of the agricultural system, but also through a better understanding of the decision
makers' goals, priorities, values and the social/cultural environment within which
production decisions are made.
2. The actual behaviour of smallholder farmers in Tonga cannot be described by a single profit
maximisation objective. Multiple objectives must be incorporated in the decision process.
The research proposition is that Tongan farming systems are inherently dynamic and complex, and are
governed by the unique decision making behaviour of the smallholder and its household. It is clear that
decision-making on the Tongan smallholder farm involves a complex interaction between goals,
constraining factors, resource limitations, enterprise choice and techniques, on which higher-level
decisions impinge. Therefore, it is the general aim of this study to develop an understanding of a
Tongan smallholder farmers' decision making regarding the utilisation of its limited land resources in
terms of identifying goals, priorities, and constraints that influence their decisions. Using a systems
research framework, the Tongan household farming system is defined in terms of its component parts,
their interactive behaviour and their interrelationships. The goal is to be more realistic in modelling of
farmers' land use decisions by improving the ways in which social and cultural values, beliefs, attitude,
and intentions are incorporated. Emanating from this, the detailed objectives of this study are:
(1) To observe and report the dynamics of smallholder farming systems - its structure,
decision making and the environment within which decisions are made.
(2) To identify and quantify smallholder farm household objectives, goals and their
priOrities.
(3) To understand the significance of social and cultural values for land use decisions by
smallholder households.
(4) To provide a cohesive conceptual framework for linking social, cultural and
psychological processes to land use decisions.
(5) To develop a goal programming (GP) model to portray the decision-making process
of Tongan smallholder farmers.
(6) To use the model to explore effect of policy incentives on smallholder farmers'
decisions and production.
6
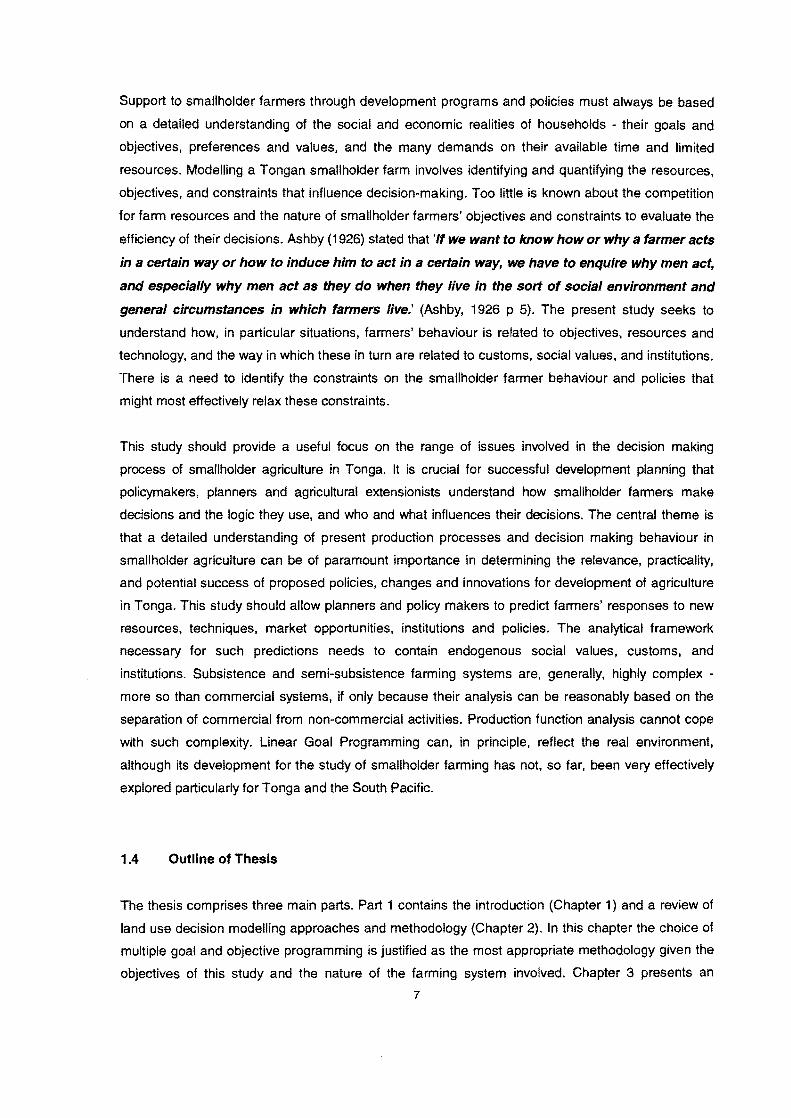
Support to smallholder farmers through development programs and policies must always be based
on a detailed understanding of the social and economic realities of households - their goals and
objectives, preferences and values, and the many demands on their available time and limited
resources. Modelling a Tongan smallholder farm involves identifying and quantifying the resources,
objectives, and constraints that influence decision-making. Too little is known about the competition
for farm resources and the nature of smallholder farmers' objectives and constraints to evaluate the
efficiency of their decisions. Ashby (1926) stated that 'If we want to know how or why a farmer acts
in a certain way or how to induce him to act in a certain way, we have to enquire why men act,
and especially why men act as they do when they live in the sort of social environment and
general circumstances in which farmers live.' (Ashby, 1926 p 5). The present study seeks to
understand how, in particular situations, farmers' behaviour is related to objectives, resources and
technology, and the way in which these in turn are related to customs, social values, and institutions.
There is a need to identify the constraints on the smallholder farmer behaviour and policies that
might most effectively relax these constraints.
This study should provide a useful focus on the range of issues involved in the decision making
process of smallholder agriculture in Tonga. It is crucial for successful development planning that
policymakers, planners and agricultural extensionists understand how smallholder farmers make
decisions and the logic they use, and who and what influences their decisions. The central theme is
that a detailed understanding of present production processes and decision making behaviour in
smallholder agriculture can be of paramount importance in determining the relevance, practicality,
and potential success of proposed poliCies, changes and innovations for development of agriculture
in Tonga. This study should allow planners and policy makers to predict farmers' responses to new
resources, techniques, market opportunities, institutions and policies. The analytical framework
necessary for such predictions needs to contain endogenous social values, customs, and
institutions. Subsistence and semi-subsistence farming systems are, generally, highly complex -
more so than commercial systems, if only because their analysiS can be reasonably based on the
separation of commercial from non-commercial activities. Production function analysis cannot cope
with such complexity. Linear Goal Programming can, in principle, reflect the real environment,
although its development for the study of smallholder farming has not, so far, been very effectively
explored particularly for Tonga and the South Pacific.
1.4 Outline of Thesis
The thesis comprises three main parts. Part 1 contains the introduction (Chapter 1) and a review of
land use decision modelling approaches and methodology (Chapter 2). In this chapter the choice of
multiple goal and objective programming is justified as the most appropriate methodology given the
objectives of this study and the nature of the farming system involved. Chapter 3 presents an 7

overview of the study area, that is background information on the Tongan economy, agriculture and
farming systems. Chapter 4 explains the methodology and research design employed in this
research. It also includes a brief description of the approach and methods used in the study.
Part 2 is a system analysis covering the initial analytical stage of the modelling process to determine
the nature and behaviour of the system components and sUb-systems. The interaction between
components is considered. The systems analysis stage of this study involves the use of ideas from
the literature, data analysis and subjective observations and assessments.
Chapter 5 provides a review and analysis of the agriculture organisation, institutional and economic
environment. Major emphasis is given to policy formulation in agricultural development planning in
developing countries and outlines how policies and development plans are being formulated in
Tonga, and discusses their impacts. The analysis of the existing institutional and economic
environment, including government support services, marketing infrastructures and channels and
credit facilities, which have a significant impact on smallholder production decisions, are all
presented. The key poliCies described will be addressed in the model application.
Chapter 6 provides the analysis of smallholder farming households' goals and objectives. The main
objective of this analysis is to identify and evaluate the goals and objectives, and to derive an
objective function suitable for the Tongan smallholder goal-programming model.
Chapter 7 provides an understanding of the land resource endowments of different smallholder
types in terms of their access to land, and how it is being used. This allows decision variables and
resource constraints to be derived. Chapter 8 provides an understanding of the resource
endowments of different smallholder household's types in terms of access to labour and capital, and
how they are being utilised.
Chapter 9 presents a review and analysis of the socio-economic environment in which smallholder
farmers operate. The main objective is to investigate and understand the significance of social and
cultural values for land use decision behaviour and the relationship to the decision-makers. It also
analyses the influence of village or community groups and other organisations on individual
household decision making.
PART 3 is the system synthesis, model development and evaluation phase. System synthesis
involves providing a coherent and logical conceptual framework and the implementation of this
framework into a working computer model. It involves explicit consideration of the multiple objectives
smallholder farmers have and the characteristics of the system, thus aI/owing the development of
appropriate procedures for representing these aspects.
8
Chapter 10 provides the detailed design and development of a Multiple Objective Goal Programming
(MOGP) model to portray the decision-making process of Tonga smallholder farmers. Chapter 11
includes the results from testing and assessing the usefulness of the model. An important part is
model validation while involves the testing of the verified model's ability to mimic the operation of the
real world situation. In Chapter 12, the models are put to their intended purpose with a series of
experiments to examine and explore the effects of policy instruments on the different smallholder
farm types' achieving their goals and objectives as well as the nation's goals.
Chapter 13 gives a summary of the research findings and conclusions are drawn. The overall value
of the study is discussed and consideration given to the implementation of the model for the
assessment of different policies under a range of farming conditions and situations. The scope for
further research is discussed. The reference list and appendices complete the thesis.
9
CHAPTER 2
A REVIEW OF DECISION MODELLING METHODOLOGY
2.1 Introduction
Decision-making is an integral part of the management of any kind of organisation. It is an ongoing
process in which the decision-maker evaluates the available alternatives and selects a course of
action. The basic steps involved in any decision-making process, outlined by Harrison (1987), include
(i) defining the objective(s}, (ii) identifying possible choices, (iii) collection of relevant information, and
(iv) drawing of appropriate inferences. Success involves interdisciplinary knowledge and these
aspects of decision making are best illustrated within the framework of a set of models as
demonstrated below. Ideally, a decision making model should include variables that will help explain
the real world phenomenon being modelled and assist the decision-maker to predict real world
phenomena with sufficient consistency and accuracy to be of considerable value.
In this chapter the literature related to modelling of farm level decision-making methods, including
the history and comments on developments to date, is reviewed. A brief overview of multiple
objective programming techniques is also provided and the choice of Goal Programming modelling
is justified as the most appropriate methodology given the objective of this study and the nature of
the Tongan smallholder farming system.
2.2 Modelling Approaches to Household Studies
Over the last three decades there has been increased recognition of the importance of household
farm decisions. Researchers have focussed on understanding the process and strategies of farm
households' decision-making in terms of land use and production decisio~ (Upton and Dixon,
1994). While many decisions are made without much consideration of alternatives, important
decisions require careful evaluations. Farmers must decide what to produce, what technology to
use, and how to allocate their resources of land, labour and capital among the alternatives open to
them as well as make decisions on marketing. It is in regard to these important and crucial decisions
that analysis of alternatives and actions is invaluable.
10
The development of appropriate models of choice is central to the study of farm decision making (Ellis,
1988). Modelling behaviour is fairly advanced, with various models having been used and new ones
constantly being developed for agriculture in the developed and in developing world. In the literature,
three main approaches have been used to analyse farm households in farm systems modelling,
each derived from a different perspective: the economic, sociological and psychological.
2.2.1 Economic approach
The economic approach to farm household decision making is based on the classical theory of the
firm. Here the farm is seen as no different from any other large or small-scale business with the
assumption that the underlying objective of the farm decision-making complex is to allocate
resources in such a way as to maximise profit, at least in the short term (Barnard and Nix, 1973).
Therefore, economic land use models assume that farmers are highly responsive to the demands of
the market and, operating in an environment of perfect information, make land use decisions based
solely upon the principles of profit maximisation. As a result, agricultural land use patterns are
determined purely by economic factors, such as market prices and gross margins. To maximise profits
within resource constraints is to achieve the economic optimum. Any deviation from a strategy of
economic optimisation may be quantified in terms of profit foregone. For example if a farmer chooses
to allocate limited resources to a less profitable enterprise (for reasons of preference, subsistence
output or prestige), the effect of that decision can be quantified in terms of potential profit sacrificed. In
this way, profitability has tended to become a yardstick by which all other production motives are
evaluated.
A wide range of mathematical programming techniques which optimise a single objective function
with or without risk and uncertainty have been reported in the literature (for example, Amir et al.,
1991; Ghadim et al., 1991; Wossink et a/., 1992). These modelling attempts have failed to
accurately reflect the realities of decision making. This is partly because of the restrictions of the
modelling framework adopted and partly because the models make basic assumptions about
rationality that is not upheld in the real world. For example. studies of farmers' economic rationality
in developing countries using Cobb-Douglas production functions and cross-section data have
concluded that farmers act as profit maximisers within their technological and institutional
constraints (Hopper, 1965). This approach has been criticised because methodologies explicitly
incorporating risk considerations are probably a more realistic basis for making policy
recommendations directed at the modernisation of traditional agriculture (Dillon and Anderson,
1971; Wolgin. 1975).
The failure of traditional economic models of land use to correspond to the reality of poor resource
farmers has led to the acceptance of the significance of other important factors involved in decision
making processes (Nowak, 1987; Strauss et aI., 1991). Most important is the human factor which is
11
vital in the land and resource use decisions of farmers (McRae, 1993; Reid et al., 1993). Farmers
make decisions with respect to the multiple goals they have and the physical, economic and the socio-cultural environment in which they operate.
2.2.2 Sociological approach
The sociological approach acknowledges the fact that economic and ecological conditions are not
the only factors guiding farmer choices and decisions in a production system. The nature of social
systems, such as norms, beliefs, cultural values and communication patterns, have a significant
influence on farmers' production decisions. It would be pointless to promote crops or techniques that
do not correspond to the true interest of the farmers or for which the needed resources are
unavailable.
Rogers and Shoemaker (1971) described two different social systems, a traditional and a modern
social system. The traditional social system is characterised by a less developed or simple
technology. a relatively low level of education, little communication with outsiders, and a lack of
favourable orientation to change. These attributes account for a low adoption of improved
technology and innovations among farmers. In contrast, the modern social system, which features in
developed countries, is characterised by a well-developed technology with a complex division of
labour, a high value on education and sciences (extension and research). rational and business like social relationships and a generally positive attitude to change. It is important for development
planning to ensure that policies and technology are compatible with the existing social system. Reid et al., (1993) point out that new technology should address farmers' constraints and their
circumstances in order to ensure that they are relevant to their farming systems. Parker and
Townsley (1995) also note the importance of a qualitative approach to studying human behaviour
pertaining to farmers' circumstances and goals on decision making which reflect the close
association between farm management and the disciplines of behaviour and social psychology.
Numerous sociological studies have clearly demonstrated that economic profitability is not
necessarily the main motivating factor. Farmers also attach high value to the social and "lifestyle"
aspects of farming, such as independence, following family traditions and being able to work
outdoors (Gasson, 1973; Greer, 1982; Fairweather and Keating, 1994; Austin et al., 1998).
Dasgupta (1989) for instance, found that Punjab farmers in India attached greater importance to
social approval and less to financial return. These studies strongly suggest that purely economic
models cannot capture the full complexity of farmers' motivation and behaviour. Technical and
economic factors are extremely important. but not necessarily the only factors, and in some
deCisions not really critical. This has led to the consideration of social factors, including demographic
variables such as age, education, marital status, family size and structure, in later studies (Feder, et
al., 1985; Nowak, 1987; Lynne et al., 1988; Strauss et al., 1991). These factors were incorporated to
12

improve the predictive ability of these models but, to date, confirmation of this in the literature is
sparse and the empirical modelling reported has failed to explain more than 60 percent of actions, at
best.
2.2.3 Psychological approach
The third perspective on understanding and modelling farm decisions adopts a psychological-
behaviourist approach. Behavioural models are founded upon the premise that there is often a
significant differential response among farmers to actual or potential opportunities in the economic
sphere. Their socio-personal characteristics, rather than economic forces, therefore largely
determine the degree to which farmers respond to economic stimuli. To date, the approach has
been limited to investigating farmers' perceptions of the quality of life, farming values, satisfaction
with farming, and risk taking but, generally without the credibility of well validated tests and often
without reference to behaviour. This approach could be improved by introducing personality and
work style factors in addition to cognitive ability tests and closer correlation of attitudes with
behaviour. However, psychological variables such as perceptions, values and attitudes on their own
are insufficient for general modelling decision making. According to Linder (1987), the decision
making process requires the individual to search and evaluate information before choice can be
made. Such a process depends on individual's ability and preferences based on past experience;
factors such as cognitive ability, personality and preferred style of working should be included in the
model under this approach.
A behavioural approach to the study of agricultural land use patterns involves, amongst many other
components, the use of concepts from "decision theorY'. The proponents of decision theory have
attempted systematically to describe those variables that influence entrepreneurial choices by
farmers. Early attempts to model agricultural land use patterns through a behavioural perspective
revolved around the work of von Neumann and Morgenstern (1944), who constructed the foundation
of game theory. Game theory maintains a normative theory of behaviour while recognising the
presence of uncertainty in the decision-maker's environment. This involves the construction of a
payoff matrix. This matrix illustrates possible outcomes of various strategies available to the farmer,
given a number of possible circumstances (Halter and Dean, 1971). The optimal decision, at least in
the farmer's mind, may be selected according to various criteria. Halter and Dean (1971) review the
various criteria such as Wald's "standard of judgement" and the Laplace criterion. According to Wald's
standards, a farmer selects a strategy based on a pessimistic forecast and, accordingly, chooses the
least risky farming practice. In contrast, according to the Laplace criterion a farmer selects a strategy
based on the assumption that each possible circumstance (eg. weather or market conditions) is just as
likely as the next. The latter criterion is commonly referred to as the average approach. These criteria
have been incorporated into various linear programming models for whole farm planning (Anderson et
al.,1977).
13
The role of risk in agricultural behavioural and decision models is generally recognised today.
Agricultural production is a typically risky business. Farmers face a variety of price, yield, and
resource risks, which result in unstable income and production from year to year (Mapp et al., 1979).
Empirical applications of behavioural models and theoretical considerations indicate the importance
of incorporating risk into the analysis of farmer's decision making (Anderson et al., 1977;
Roumasset, 1976; Barry, 1984). The omission of risk in farm-level decision models of traditional
agriculture may lead to results that bear little, if any, semblance to farmers' actual behaviour.
Agricultural decision models that fail to not include risk considerations may overestimate output
levels of risky crops and fail to recognise the importance of diversification in traditional agricultural
production systems (Wolgin, 1975). Hazell and Norton (1986) also pointed out that ignoring risk may
also lead to an overvaluation of some inputs, and an incorrect prediction of technology choices.
2.2.4 Integrated approach
The literature acknowledges the fact that deCision-making in agriculture is a complex process
involving a large number of factors. Apart from the sociological and psychological factors, there are
many physical and economic considerations involved in the way a farmer makes his decisions
(Beets, 1990). Astroth (1990) point to the existence of numerous causal factors and that, attempting to
model agricultural land-use decisions is a difficult task. He further noted that, any theoretical model
developed to explain agricultural land use economic decisions must take account of psychological and
sociological realities provided by models of behaviour. While each of the three modelling approaches
has its own particular strengths, there is a need for a more holistic approach to modelling decision
making and farm households' behaviour. The most successful approach may well come from
combining the three approaches into a single integrated framework. Such an integrated approach will
be more realistic and greatly assists policy making, enabling the identification of possible trade offs
between economic and non-economic objectives. It would also assess the impact of government
interventions through development policies in market, land inputs, products, technologies and
infrastructure on farmers' decisions on resource utilisation.
With the construction and empirical testing of analytical models, many researchers have been
concemed with the empirical testing of such models in various economic settings throughout the world.
No attempt has been made, however, to develop a behavioural model specifically tailored to the
characteristics of smallholder farmers in developing smaller island nations. As a result, land use
models from developed and larger developing countries have had limited success in modelling land
use pattems of smallholder agriculture in developing countries (Upton and Dixon, 1994). It is evident
that both behavioural and economic forces greatly influence the patterns of agricultural land use in less
developed economies. Therefore the construction of a land use decision model requires the selective
integration of economic and behavioural paradigms. An integrated approach to modelling smallholder
farming land use can incorporate a variety of goals and risk aversion behaviour, while at the same time
14

recognising the importance of, for example, marketing and economic factors in the decision making
process of smallholder farmers. It was this need for a more appropriate smallholder land use model
that prompted this study. From its inception, the primary goal of this research has been to develop a
behavioural land use model specifically designed to fit the characteristics of the smallholder agricultural
system in Tonga.
2.2.5 Farm household systems
In terms of agricultural development planning, a good understanding of farm household systems is
an essential prerequisite for effective policy prescriptions (Dillon and Hardaker, 1993). In general,
modelling appears to provide a cost-effective way of understanding farm-household systems and
assessing a wide range of possible system changes which may occur as a result of government
policy interventions (Upton and Dixon, 1994). Agricultural system research modelling to date has
tended to mimic the biological sciences by concentrating on the detail of either the individual
production system or production from the whole farm system. According to Dent et al., (1986), a
large proportion of these models exist for the simulation of crop and livestock growth, herd
dynamics, animal welfare and crop protection, and therefore have limited utility (Doyle et al., 1989;
Sorensen, 1989; Lopez-Tirado and Jones, 1991). Very few models represent the agricultural system
in its entirety and address the socio-economic element of the farming system. Applications of these
models are limited by a suitable degree of understanding of the decision-making complex in which
the models are formulated and set.
When modelling the dynamiCS of agricultural systems, economists recognise that farms vary but,
rather than attribute this variation to social factors, they concentrate on defining farm types by
structural variables such as farm size and enterprise mix. The socio-economic element of these
farms has been assumed to be constant, and all farm-decision making units have been assumed to
act as rational financial maximisers (Amir et al., 1991; Ghadim et al., 1991; Wossink et a/., 1992).
However, common sense suggests that not all farmers or farm households within any given farm
type are similar, and it is becoming increasingly apparent that few individuals maximise financial
gain. Rather decisions are influenced by a range of factors including objectives, personality,
attitudes and experience (Gasson and Errington, 1993; Duff et a/., 1991). The objectives and
attitudes of farm households are shaped by the resources they possess or have access to, by past
activities and policies that have, or are, influencing development and by their perceptions of what the
future may hold (Phelan, 1994).
This review highlights the fact that many approaches have been used to understand the principles
and decision-making process of farmers without a single approach being superior in all situations.
While it is possible to develop a mathematical model incorporating all relevant issues, such a model
will be complex and costly in resources and time. The nature and complexity of social interactions
15

render the task of documenting and understanding the decision-making process very complex.
These difficulties may explain why, to date, scientists, economists and policymakers have largely
ignored, or oversimplified, the role of the farm household in agricultural systems. The social aspects
of agricultural systems have not received as much attention as the other areas. Consequently
models of farm-household decision making are neither powerful nor transferable. This is unfortunate
because models of whole farm systems are becoming increasingly desirable for policy assessment
and their utility in this context is currently limited by the relatively poor quality of socia-economic
models.
2.2.6 Modelling smallholder farming system - A Brief Review
Decision-making model builders in the field of farm management are aware that smallholder farm
households in developing nations operate a complex reality (Hardaker. 1975; Lee et al., 1994). This
reality constitutes what social scientists divide neatly into areas of farm decisions - farm
management, general production economics, political parameters, social interaction patterns and
institutions, public relations, religious beliefs and behaviours. Smallholder farm households both
produce and consume agricultural products, and operate in a myriad of biophysical, socia-cultural
and economic environments (Beets, 1990). In addition. domestic tasks, social commitments and
non-farm earning activities are integrated into the life of the farm household, competing with and
contributing to agricultural activities.
Modelling of smallholder farming systems often involves a greater degree of complexity than is
encountered with large-scale commercial systems (Bollard, 1977; Norman, 1974; Hardaker, 1975;
Delforce, 1990; Upton and Dixon, 1994). Analysis of semi-subsistence production modes must take
account of the strong interactions between the major system components - household, farm and
off-farm. In particular, there is competition between the three for resources (land, capital, labour). In
addition, the production system itself is also quite complex as smallholders often grow a diverse
number of crops and have mixed cropping patterns; often mixtures of annual and perennial crops
are grown and usually a few animals are also kept. Another important issue confronting the analyst
of smallholder farming systems is the measurement of farming system performances. Dimensions
other than profit maximisation loom large in many smallholders' objectives and the existence of
multiple objectives and different priorities is common. Realistic monetary valuations of farm inputs
and outputs can be difficult (Dixon et al., 1994). Moreover, the decision-making strategy varies as
influences of groups and village objectives are significant. An appreciation of this heterogeneity,
complexity, and interdependence is necessary if the responses of smallholders and village
communities to planned interventions are to be anticipated.
Clearly, the perceptions of policy makers concerning the realities of small-scale agriculture will
condition their views about the priority issues to be addressed in development programs. For this
16
reason, the analysis of different types of smallholder farm households is important for effective
agricultural policy design. Upton and Dixon (1994) note that various models have been used for
such micro-level analysis, ranging from qualitative informal frameworks to more complex and
complicated quantitative models involving computer analysis. The increasing development of
microcomputer software and programs has allowed the development and use of far more
sophisticated models than were previously feasible. Some of these models include econometric,
simulation and mathematical programming models.
Traditionally, predictive models in the form of econometrically estimated supply response models
and production functions have been used. These models were based on the neo-classical theory,
which implied the existence of, or at least the rationality of profit maximising behaviour. In terms of
allocative efficiency there has been a recurring debate on the extent to which farmers allocate their
resources to maximise profit. Upton and Dixon (1994) point out a major limitation of using
econometrical models and analysis for policy formulation in that many studies do not present the risk
inherent in the model specifications, and only a few variables are considered with most factors being
assumed to be fixed. Policy briefs based on the results of these studies rarely contain the basic
assumptions, and therefore bear the risk of being interpreted too literally. Econometric models
described above, while sometimes useful for expost policy analysiS, are of limited value in the
evaluation of new policy measures.
Simulation models have been used to explain real world systems. Simulation of time-dependent
processes involves the specification of stated variables together with the flows of change, which
may be either controlled by the decision-maker or subject to a pre-determined relationship (Upton
and Dixon, 1994). Such models have proved valuable in exploring these processes over time,
especially with the likely variability of perennial crop performance. As shown by Dent and Blackie
(1979), price data can be incorporated to provide estimates of costs and returns for individual
enterprises over and time profiles, and also show investment needs for individual enterprises.
However, Dent (1991) noted that models that incorporate the complex dynamics and uncertainty of
the biology, sociology and economics of whole farm household systems are rare and less likely to be
used in the future. This is because the construction of whole farm simulation models, built up from
basic biological and human behavioural relationships is a very costly and time-consuming process.
In this study attention has been directed to the modelling of farm-level decisions in semi-subsistence
smallholder agriculture. It is through the construction and use of farm models that policymakers can
better understand the options open to farm decision-makers, appreciate the effects of farmers'
attitude, and help farmers to make better decisions. These judgements, however, require a better
understanding of the nature and characteristics of the smallholder farming system. With a complex
system of mixed cropping and livestock production, managed by farm households who must cope
with a range of uncertain factors, including market prices, weather, pest and diseases, and
17
government policies, the analysis is difficult but clearly important. This better understanding can
improve the diagnosis of agricultural development problems and constraints, and the formulation of
policy alternatives. The ex ante assessments of the likely responses to, and impacts of, alternative
agricultural policies and programs will also be enhanced.
2.3 A Review of Mathematical Programming Models
Mathematical programming models are particularly well adapted to the identification of critical
constraints and the set of feasible alternative farm enterprises. In the policy analysis context,
mathematical programming can be used to find the optimal farm plans for conditions with and
without a given program or policy, and thus estimate the potential impact of the proposed change.
Thus, assumptions about behaviour can be built into the model with a defined objective function and
constraints. It can also calculate the relative value of scarce resources. Following the first application
to agricuiture that focused on maximising farm income subject to limited resource constraints (or
minimising costs), the method has been modified and developed in various ways. The input-output
coefficients, constraint levels and prices are often derived from farm and enterprise surveys.
2.3.1 Linear programming
In the early days of management science, and especially with regard to practical applications, the
multiple objective nature of decision problems was largely avoided. Instead, the conventional linear
programming (LP) approach, which optimises a single objective, was predominantly used. Linear
programming is a mathematical programming technique for solving a problem of allocative choice of
scarce fixed resources. The objective of linear programming is to maximise or minimise a linear
function subject to a number of linear constraints. Resources in terms of land, capital and labour are
scarce and limited factors in agricultural production. The study of linear programming enables an
appreciation of the complex manner in which prices, yields and scarce resources interact during
critical seasons to determine the best farm plan (Nuthall, 1996). The great advantage of linear
programming is that it allows one to test a wide range of alternative adjustments and to analyse their
consequences thoroughly with a small input of managerial time (Beneke and Winterboer, 1973). This
single objective approach, usually in the context of a linear programming model, resulted in a large
number of successful practical applications, which in turn stimulated greater research in this area
(Piech and Rehman, 1993).
Hardaker (1975) developed a linear programming model of the production and consumption I
opportunities of a typical rural household in Tongatapu. Tonga. The model explored opportunities for
use of the fixed resources (land and labour) in agricultural production. The product utilisation activities
included food consumption alternatives along with specified minimal nutritional needs for the farm
18
family. Cash constraints were also incorporated, so the model represented the farm household
interrelationships through the provision of family food supplies, the generation of cash and a minimal
level of cash surplus. The objective function was specified as the maximisation of net cash surplus,
after essential living costs had been met. On the basis of the linear programming results, Hardaker
deduced that most Tongan farmers were using their resources efficiently in the sense that they
appeared to allocate them in a manner consistent with their beliefs and preferences. Although the
linear programming results indicated that it would be theoretically feasible to produce a substantially
greater agricultural output from Tongan farms, this would entail encouraging changes in farmer
behaviour. Because such changes are notoriously difficult to bring about, Hardaker (1975) concluded
the scope for intensification of Tongan agriculture with the present production technology and within the
existing socio-economic environment and institutional framework was limited. In terms of the model of
smallholder farmer decision making, Hardaker suggested that extension methods be viewed as a
means of modifying farmer beliefs by firstly bringing these beliefs more into line with reality, and
secondly reducing the degree of uncertainty in the farmers mind. Hardaker recommended that since,
in the traditional-type Tongan society, the views of older people are well respected, agricultural
extension should involve the whole community, especially through group methods of extension.
Despite this empirical evidence, policy analyst and modellers in agricultural economics have not paid
too much attention to the crucial role that should be given to several objectives and goals in building
decision-making models. A major limitation of using a linear programming model in natural resources
allocation and management decisions is that only a single criterion for determining the optimal strategy
is used. In most cases, however, decision-makers, as noted before, have a number of objectives which
they try to meet simultaneously. A major limitation of Hardaker's research is the failure to consider the
multiple objective nature of Tongan farm households, and incorporate the social and cultural aspects
that influence decision-making.
This section has presented some aspects and limitations of conventional linear programming
models to describe smallholder farmers. Because of these limitations the next subsection will review
the potential of multiple objectives and goal programming modelling to be used in this research to
study the decision processes of smallholder farmers in Tonga.
2.3.2 Multiple objective programming models
It is increasingly accepted that multiple objectives are the rule rather than the exception in taking
farm-level decisions (Gasson, 1973; Romero and Rehman, 1985; Dent and Jones, 1993). The
limitations of linear programming and the recognition given to the existence of multiple objectives in
decision making have led to the development of multicriteria decision making methods (Romero and
Rehman, 1985; Flinn et al., 1980; Piech and Rehman, 1993). These researchers showed that
Multicriteria Decision-Making (MCDM) models could be applied as practical and realistic
19
representations of real farm planning problems. This supports the view that decision-making in
agriculture involves several objectives or goals rather than the pursuit and maximisation of a single
one. Romero and Rehman (1985) claimed multiple objective models give better results than single
objective models.
Over the decade many strategies and modelling approaches have been devised to solve problems
characterised by multiple objectives, or multiple criteria (Easton, 1973; Thampapilli, 1978) in
agricultural decision making. However, the literature reviewed gives little guide as to the choice of
the appropriate model for any given situation. The choice of technique generally has been left to the
skills of the researcher or analyst who must consider the cost and time of achieving output and the
availability of data required for model implementation. However, there are two main contrasting
approaches to building multiple objectives decision models.
The first and most rigorous approach consists of defining a utility function comprising all relevant
objectives for a given decision problem. Keeney and Raiffa (1976) chiefly developed this kind of
methodology, known as Multi-Attribute Utility Theory (MAUT). MAUT is a theoretically sound
approach based on the assumption of rationality underlying the classic paradigm of expected utility
created by von Neumann and Morgenstern (1944). However, its applicability poses many difficulties.
A major problem associated with the formulation of a MAUT model lies with the high degree of
decision-maker interaction required to develop the function. This issue is particularly important in
agriculture, where the cultural and educational background of the decision-maker may not be
suitable for undertaking such an interactive process. Thus, within the context of a peasant economy,
to question a person in charge of a family farm thoroughly about his/her preferences concerning
different random lotteries and similar hypothetical questions in order to test independence conditions
or assess utility functions can be problematic. Thus, very few applications of MAUT in the
agricultural field can be reported (eg. Hearth, 1981; Delforce and Hardaker, 1985; Foltz et al .• 1995).
The second direction consists of looking for multi-criteria approaches without the theoretical
soundness of MAUT, but which can accommodate in a realistic manner the multiplicity of criteria
inherent to most agricultural planning problems. Among the possible substitutes of MAUT, the most
widely used in the agricultural field are goal programming. multiobjective programming and
compromise programming. Rehman and Romero (1993) analyse the pros and cons of these
surrogates in agriculture. These methodologies were selected as appropriate for the purpose of this
study. The general principles. assumptions and theory behind each modelling methodology are
discussed below. The structure of the models and also the application of the model in decision
making highlights some of the limitations of each methodology.
20
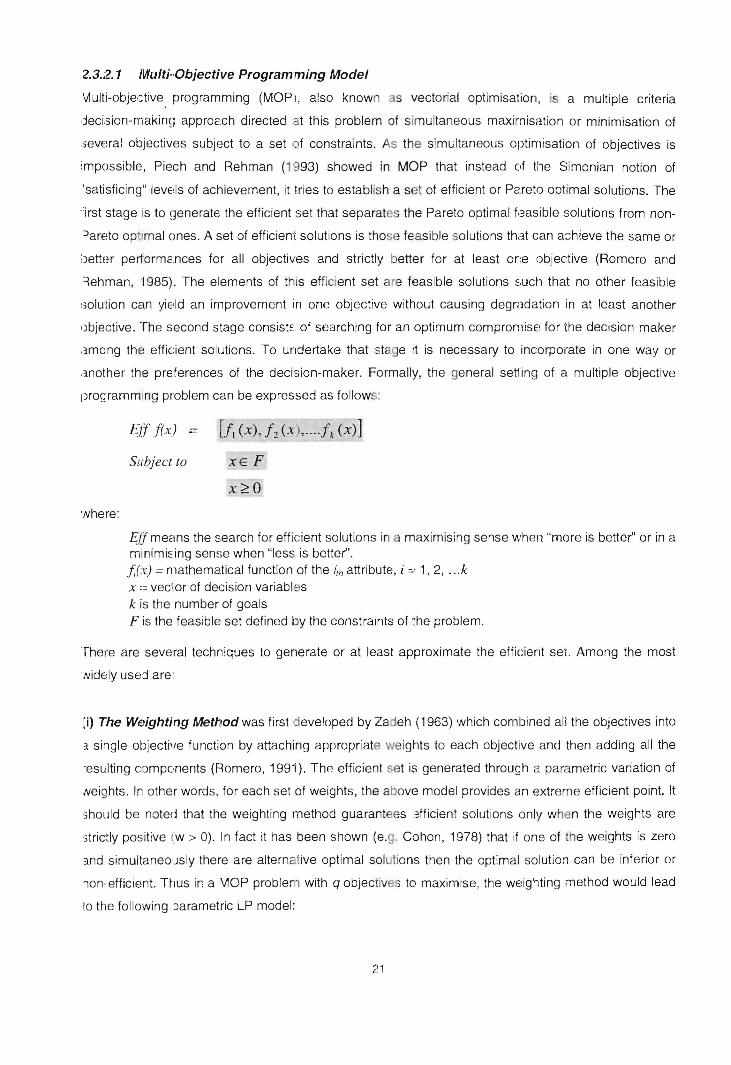
.2.3.2.1 /VIu/ti··Objective Programming Model
\i1ulti-objectlve programming (MOPI, also known as vectorial optimisation, is a multiple criteria
,jeci:sion-makin~l approach directed at this problem of simultaneous maxirnisation or minimisation of
:,everal objectives subject to a set of constraints. As the simultaneous optimisation of objectives is
;mpossible, Piech and Rehman (1993) showed in MOP that instead of the Simonian notion of
'satisficing" levEds of achievement, it tries to establish a s t of efficient or Pareto optimal solutions. The
irst stage is to !Jenerate the efficient set that separates the Pareto optimal feasible solutions from non
::Jareto op 'mal ones. A set of efficient solutions is those feasible solutions that can achieve the same or
;)etter penormEnces for all objectives and strictly better for at least one objective (Romero and
=lehman, '1985). The elements of t IS efficient set are feasible solutions such that no other feasible
:,>olution can yield an improvement in one objective without causing degradation in at least another
.)bjective. The second stage consist~ of searching for an optimum compromise for the decision-maker
among the efficient solutions. To undertake that stage it is necessary to incorporate in one way or
another the preferences of the decision-maker. Formally, the general set1ing of a multiple objective
l)rogrammmg problem can be expressed as follows:
'Nhere:
Elf j(x) = [I, (x), 12 (x '· ... Ik (x)]
Subject to x E F
x~o
Effmeclns the search for efficient solutions in maximising sense when "more is better" or in a minimi~ing sense when "less is better". j.(x) = mathematical function of the ith attribute, i "" 1 , 2, ... k x == vector of decision variables k is the number of goals F is the feasible set defined by the constraints of the problem.
There are several techniques to generate or at least approximate the efficient set. Among the most
Nidely used are :
:i) The Weighting Method was first developed by Zadeh (1963) which combined al i the objectives into
3. single objecti'le function by attaching appropriate weights to each objective and then adding all the
'esulting components (Romero, 1991). The efficient set is generated through a. parametric variation of
Neights . In other words, for each set of weights, the above model provides an extreme efficient point. It
3hould be noted that the weighting method guarantees afficient solutions only when the weights are
3trictly positive (w > 0). In fact it has been shown (e.g. Cohon, 1978) that if ons of the weights is zero
3.nd simultaneo·Jsly there are alternative optimal solutions then the optimal solution can be inferior or
lon· efficient. Thus in a MOP proble, with q objectives to maximise, the wE!igt1ting method would lead
to the following )arametric LP model:
21
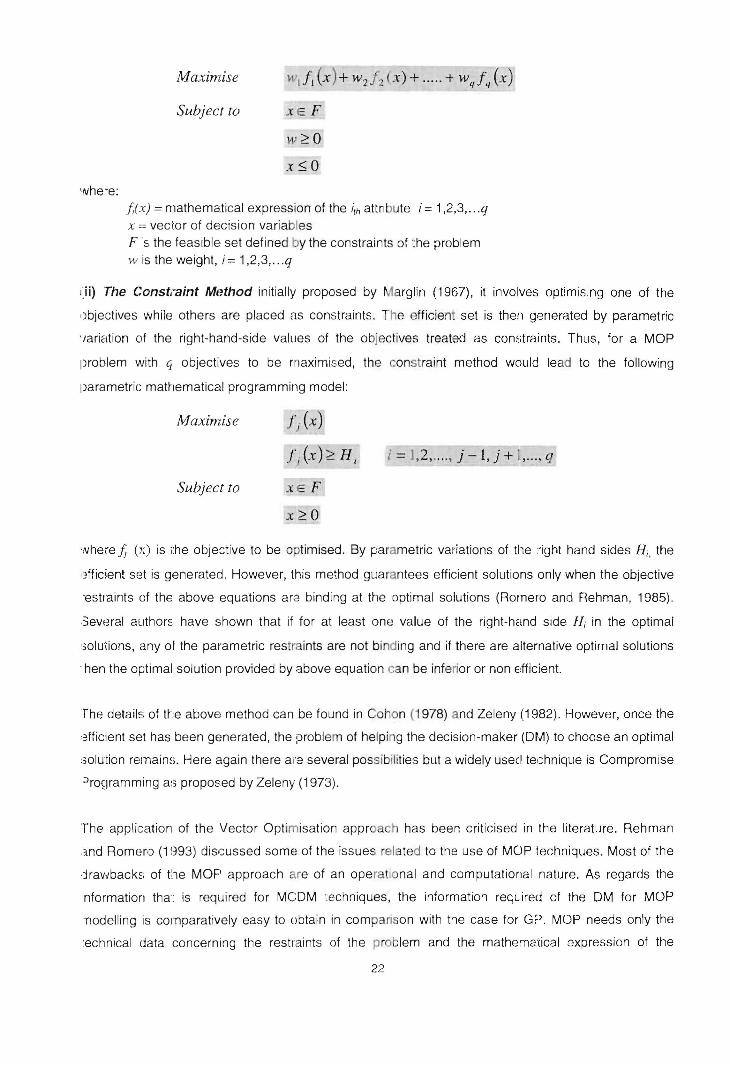
where:
Maximise
Subject to
\'v ~o
x~o
j,(x) = mathematical expression of the i1h attribute i = 1,2,3, ... q x :: vector of decision variables Fs the feasible set defined by the constraints of the problem w is the weight, i = 1,2,3, ... q
(ii) The Consttaint Method initially proposed by Marglin (1967), it involves optimising one of the
,)bjectives while others are placed ClS constraints . The efficient set is then generated by parametric
'/ariation of the right-hand-side val lies of the objec tives treated as constraints. Thus, for a MOP
problem with Cj objectives to be maximised, the constraint method would lead to the following
parametric mathematical programming model:
Maximise
Subject to
f j (x)
fi (X)~ Hi
XE F
x~o
i = 1,2, ... , .i - 1, j + i , ... , q
'Nhere 1; ex) is the objective to be 0 timised. By parametric variations of the ,'ight hand sides Hi. the
,~fficient set is generated . However, this method guarantees efficient solutions only when the objective
'estraints of the above equations ara binding at the optimal solutions (Romero and Rehman, 1985) .
.. 3everal author~. have shown that if for at least one value of the right-hand side Hi in the optimal
:30Iutions, any or the parametric rest ints are not binding and if there are alternative optimal solutions
'hen the optimal solution provided by above equation can be inferior or non efficient.
The details of the above method can be found in Cohan (1978) and Zeleny (1982). However, once the
, ~fficient set has been generated, the problem of helpi g the decision-maker (OM) to choose an optimal
:;olution relTlain~;. Here again there an:~ several possibilities but a widely useel technique is Compromise
:Jro~lramming a:3 proposed by Zeleny (1973).
The application of the Vector Optimisation approach has been criticised in the literature. Rehman
and Romero (1993) discussed some of the issues related to the use of MOP techniques. Most of the
,jrawback~; of t:,e MOP approach are of an operational and computational nature. As regards the
nformation tha is required for MCOM techniques, the information reqLired of the OM for MOP
nodelling is comparatively easy to obtain in comparison with the case for Gr), MOP needs only the
:echnical data concerning the restr'aints of the problem and the mathematical expression of the
22
objectives. However, no knowledge of the OM's preferences is required. There is nothing wrong with
this approach. MOP is just a technical device to separate feasible and efficient solutions from those
which are simply feasible.
MOP has a more complicated procedure of obtaining solutions, but appropriate software packages
now exist for generating the efficient solution set. In terms of output produced, MOP models generate
abundant and very useful information to analyse any decision-making problem. In fact, the decision-
maker is presented with a set of efficient solutions (farm plans), from which the decision-maker can
pick and implement the most suitable one. This set represents the transformation curve or production
possibility frontier making it possible to derive the trade-offs between the objectives under
consideration. This advantage of MOP is significant when two objectives are involved, as it is possible
to display the transformation curve graphically. Rehman and Romero (1993) noted that several
authors have reported applications where there are few objectives and the inpuUreport matrix size is
about 50 or so variables. However, one of the major operational problems associated with larger
MOP models is that the amount of output (efficient sets) produced can be excessive thus making it
extremely difficult for a OM to make a choice from such an array of information. Steur (1994) reports
results obtained through a simulation of MOP problems where models with 40 constraints, 50 decision
variables and 5 objectives generate almost 3000 extreme points. Thus the MOP technique is not
recommended for larger models as it could lead to computational difficulties or result in too many
solutions to choose from.
The problem of too much output in this situation can, however, be mitigated in several ways. The
size of the efficient set can be reduced by establishing compromise sets for different sets of weights
that reflect the OM's preferences. Another possibility is to use criterion weights rather than fixed
ones, as first developed by Steur (1976). This method is very effective in generating only that part of
the efficient set, which is of actual interest to the OM. Steur and Harris (1980) proposed using
filtering techniques to reduce the number of extreme efficient points by discarding efficient solutions
that are not sufficiently different from other efficient solutions already retained by the filter. This
saved a substantial amount of computer time and allows the size of the efficient set to be reduced
considerably.
2.3.2.2 Compromise Programming
The MOP approach presented above can be regarded as the first stage of a decision making process.
In fact, MOP divides the feasible set of solutions into two subsets: the subset of Paretian efficient
solutions and the subset of inferior solutions (Romero, 1991). This division of the feasible set is herein
undertaken in a mechanistic way without considering at all the preference structures of the OM. Once
the nonefficient solutions have been eliminated, the second stage of the decision making process
starts. The purpose of this stage is to determine the optimum solution from the efficient set. For this
23
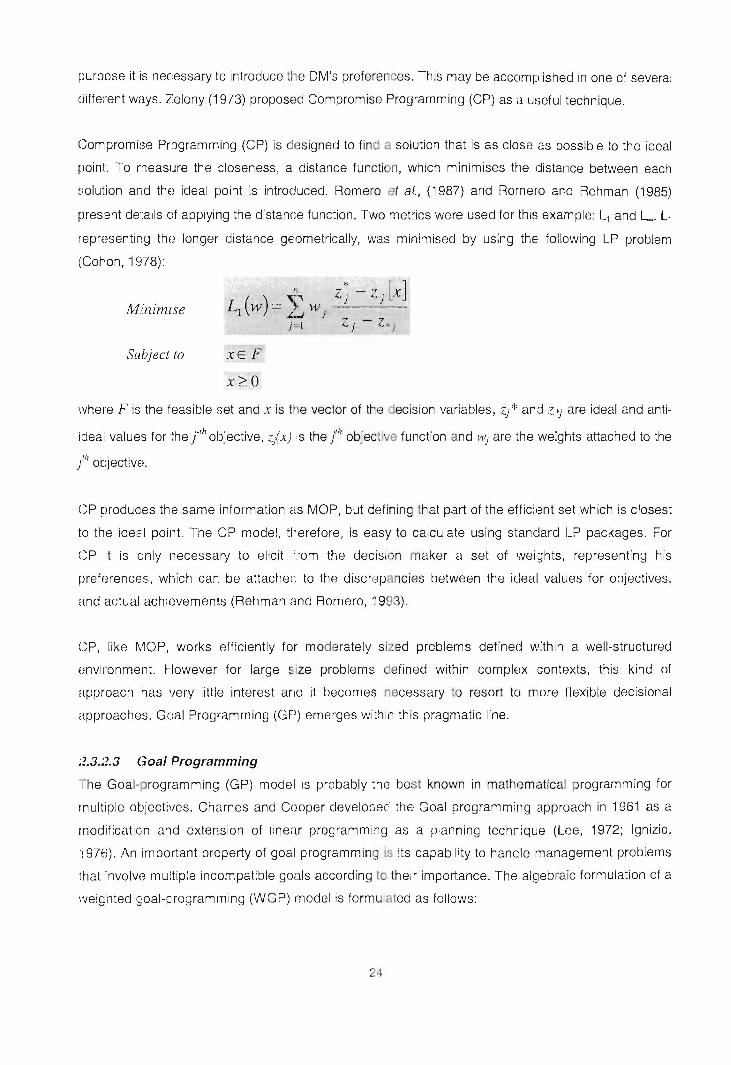
purpose it is necessary to introduce the OM's preferenceso This may be accomplished in one of several
cJiffemnt ways. Zeleny (1973) proposEld Compromise Programming (CP) as a useful technique.
Compromise Pr::lgramming (CP) is designed to find a solution that is as close as possible to the ideal
point. To measure the closeness, a distance function , \Nhich minimises the distance between each
~;olution and the ideal point is introduced. Romero et a!., (1987) and Rornero and Rehman (1985)
pres',mt de:alls of applying the distance function. Two rnetrics were used for this example: L1 and L. L,
repmsenting the longer distance geometrically, was minimised by using the following LP problem
(Coron, 1978):
Minimise
Subject to xE F
x:2:0
\Vhere F is the feasible set and x is t e vector of the decision variables, z/' and .~ j are ideal and anti
ijeal values for the f'h objective, zix) is the t objective function and Wj are the weights attached to the
lobjective.
CP produces the same information as MOP, but defining that part of the efficient set which is closest
to the ide;:: I point. The CP model, H'erefore, is easy to calculate using standard LP packages. For
CP it is only Ilecessary to elicit'om the decision maker a set of weicghts, representing his
preferences, which car, be attachec to the discrepancies between the ideal values for objectives,
and actual achinvements (Rehman and Romero, 1993).
CP, like MOP, works efficiently fot" moderately sized problems defined within a well-structured
E)Ilvironment. However for large size problems defined within complex contexts, this kind of
approach has '/ery little interest and it becomes necessary to resort to more flexible decisional
approaches. Goal Programming (GP) emerges within this pragmatic line.
;?3.2.3 Goal Programming
The Goal-p rogramming (GP) model is probably ~he best known in mathematical programming for
rnultiple objectives. Charnes and Cooper developed the Goal programming approach in 1961 as a
modification and extension of linear programming as a panning techrique (Lee, 1972; Ignizio,
! 976). An important property of goal programming is its capability to hanale management problems
that involve multiple incompatible goals according to their importance. The al~lebra ic formulation of a
weighted ~:oal-programming (WGP) model is formul ated as follows:
24

Minimize
Subject to :
and
where:
a,i
c C
'I
z ~ [(W/o/ ±Wj-ci j- ] ;;1
!L
L {l;Jx j - 8;+ + 8;- = 8i j;1
~ r i 0=], 2, . .... , q.
ex ~ c (system constraints)
x j' 8;~ , Oi- ~ 0 for i = 1,2,_ .... , q. andj = 1,2, .. . n.
the goal associated with an objective; ( x" Xl, ... , x1 ):a n-dimensional vector of decision variables;
technological parameters related to the system constraints; the resources available; the coefficients related to the system constraints; the importa ce coefficient associated with the positivE! deviations; the importance coefficient associated with the negative deviations .
During the last two decades the GP model has be n frequently used as an aic: t.o decision making
with multiple objectives. Available ir several versions, this model has been applied in various fields.
Tarniz ancl Jonl~s (1996) note that ~Ioal program mi 9 is popular due to the fact trat it is simple and
2as~1 to understand and to apply. The Goal Programming (GP) model enables the decision-maker to
lake many goals into account in a problem where he or she has chosen the most satisfactory action
3mong a set of acceptable options . Practically, this is expressed by searching the most satisfactory
:::ompromi::;e among several objectives which are often conflicting (Romero, 1991) . In fact, the GP
'TIodel is basec on concept of satisficing objectives (Simon, 1955) which differs considerably from
the optimisation philosophy generally adopted in mathematical programming (Zele!lY, 1982).
A.ccording to Hwang et al., (1980), CP belongs to the category of the multi.Jle objective programming
'nodels with a priori articulation of the decision-maker's preferences. That is, each goal under
:::onsideration (profit, safety, production level, etc.) is given a target or noal value to be achieved
Nithin the given set of constraints. T e models, however, do not maximise or minimise the objective
iunction in the I near programming sense; rather, they minimise the deviations, or differences among
;Joals. ThE! goal deviations are represented in one or two directions, namely, positive or negative.
The unwanted deviations from these goals (under profit, under or over production , etc) are then
'ninimised, considering the relative priority, or weight, assigned to the various goals (Tamiz and
Jones, 1996). This is accomplished by minimising the deviations among 1 he desired goals or target
evels and the actual equalities through the addition of positive and negative deviation variables
Jerrnitting either the under or over-achievement of each goal. Also, for each goal at least one of the
!wo variables rlas to be zero. So the overall purpose of Goal Prograrnming is to minimise the
Jeviations between acllievement 0-: the goals and the ~ r aspiration level ~;; that is, to minimise the
:.Jnwanted deviational variables. The minimisation process can be accomplished by several
25
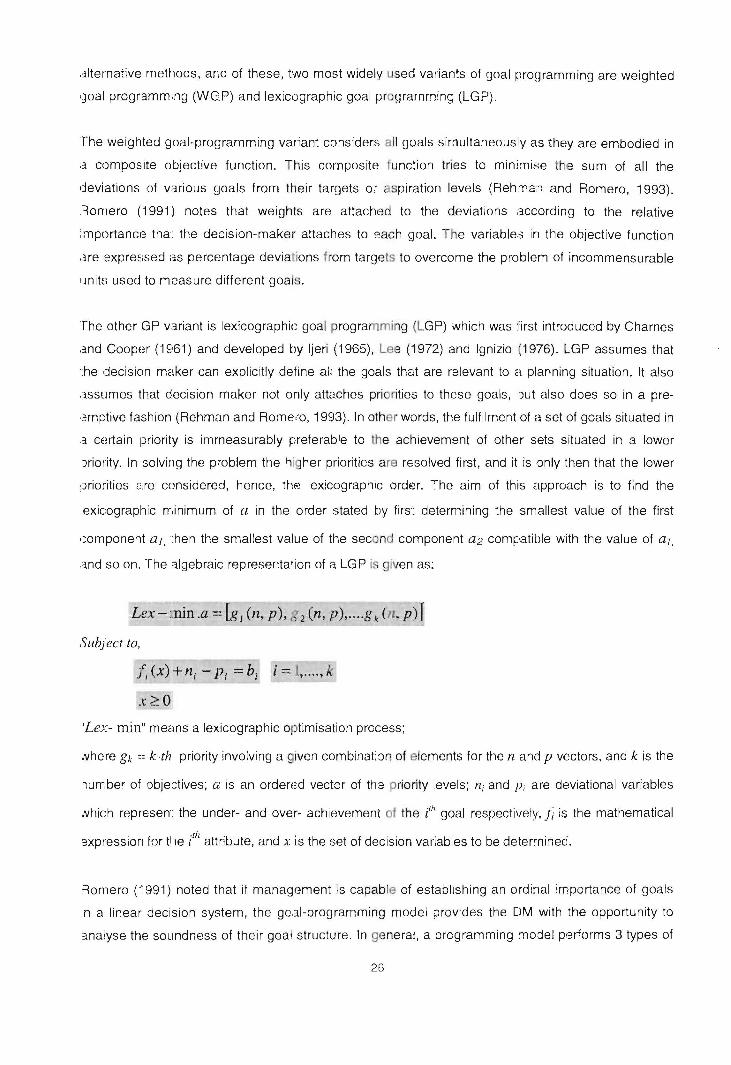
.3.lternative methods, and of these, two most widely used varian~s of goal pro(lramming are weighted
qoal programming (WGP) and lexicographic goal programmin(; (LGP).
The weighted goal-programming variant considers all goals simultaneously as they are embodied in
d composite objective function. T his composite function tries to minimise the sum of all the
deviations of various goals from their targets 0; aspiration levels (RehTlen and Romero, 1993) .
. =!ornero (1991) notes that weights are attached to the deviations according to the relative
;mportance tha: the decision-maker attaches to each goal. The variables in the objective function
dre expre~;sed as percentage deviations f rom targets to overcome the problem of incommensurable
IJnits used to measure different goals .
The other GP variant is lexicographic goal programming (LGP) which was first introduced by Charnes
a.nd Cooper (1 S'61) and developed by Ijeri (1965), Lee ('1972) and Ignizio (1976). LGP assumes that
'he decision maker can explicitly define all the goals that are relevant to a plarning situation. It also
a.ssumes that decision maker not only attaches pl"iorities to these goals, but also does so in a pre
~mptive fashion (Rehman and Romero, 1993). In other words, the fulfilment of a set of goals situated in
a certain priority is imrneasurably preferable to the achievem~mt of other sets situated in a lower
Jriolity. In solving the problem the hi her priorities are resolved first, and it is only then that the lower
:Jriorities eire considered, hence, the lexicographic order. The aim of this approach is to find the
exicographic minimum of a in the order stated by firs~ determining the smallest value of the first
,~omponent aj,:hen the smallest value of the second component a2 compatible with the value of al.
and so on. The algebraic representation of a. LGP is given as:
Lex - :nin.a =: [g I (n, p), l 2 (n, p), ... . g k ( Il , p)1
Subject to,
f;(X)+fl i - Pi =b; i = l , .... , k
x~o
'Lex- min" means a lexicographic optimisation process;
Nhere gk =: k-th priority involving a given combination of elements for the nand p vectors, and k is the
lumbe' of obje:tives; a is an ordemd vector of the priority :evels; ni and Pi are deviational variables
Nhich represen: the under- and over'- achievement of the /" goal respectively, Ji is the mathematical
3xpression for tile /" attribute, and x is the set of decision variables to be determined.
:~ornero ("i 991) noted that if management is capable of establishing an ordinal importance of goals
n a linear decision system, the goal-programming model provides the DM with the opportunity to
analyse the soundness of their goal structure. In ge eral, a programming model performs 3 types of
26

analysis: (i) it determines the input requirement to achieve a set of goals; (ii) it determines the
degree of attainment of defined goals with given resources; and (iii) it provides the optimum solution
under varying inputs and goal structures. The most important advantage of goal programming is it's
great flexibility, which allows model simulation with numerous variations of constraints and goal
priorities.
2.3.2.3.1 Applications of goal programming
In agricultural planning most goal programming (GP) applications have addressed the problem of
determining an optimal cropping pattern by taking into account several goals. Wheeler and Russel
(1977) analysed the planning problem of a hypothetical 600 acre mixed farm in the United Kingdom
using a GP model. They considered goals of maximum gross margin, minimum seasonal cash
exposure and the provision of stable employment for labour throughout the year. In subsistence
agriculture there are two examples of interest. Flinn et al., (1980) analysed a decision-making
problem in the Phillipines where six goals were taken into account including the production of rice for
family ::;ubsistence through to the generation of sufficient cash surplus. He concluded that there
seems to be a misconception among many users of linear programming that Linear Goal
Programming (LGP) structures and philosophy developed by Ijeri (1965) is simply linear
programming with certain specialised constraints and activities. Rather. such a linear programming
formulation of a problem is a subset of the more general multiple objective. LGP problem. A
limitation of LGP is the monotonic ordering of goals, with no facility for a trade off between goals of
different rank. Nonetheless, goal ordering has proved a useful approximation in empirical decision
models as discussed by Roumasset et al., (1979). Barnett et al., (1982) uses a similar approach to
research a decision-making problem in Senegal.
2.3.2.3.2 Critical issues concerning the use of GP
GP is the most widely used MCDM technique but despite the success of its application which
combines the logic of optimisation in linear programming with the decision-maker's desire to satisfy
several objectives, it is has some limitations. Rehman and Romero (1993) note that the GP model
simply provides the best solution under the given set of constraints and priority structure. Clearly, if the
decision maker's goal priorities are not in accordance with those used in the model, the solution will not
be the global optimum. For an effective application of GP, a clear understanding of the assumptions
and limitations of the technique is a prerequisite.
Rehman and Romero (1993) noted the large amount of very precise information that is required for
the decision-maker, such as objectives and target values, weights to be attached to each unwanted
deviational variable, pre-emptive ordering of preferences and so on. Its critics have recognised this
aspect of the use of GP as a weakness. However, Romero and Rehman (1989) discussed methods
available to help reduce the problems encountered with GP such as the use of sensitivity analysiS
27

during model implementation. The interactive use of GP described by Rehman and Romero (1993)
is another approach to improve the reliability of the information acquired from the decision-maker.
There are, however, some serious problems when GP is applied mechanically without being aware
of the logic underlying the approach. Romero and Rehman (1989) note certain situations where
using GP techniques for decision making will either produce unexpected results or they will be
inappropriate. The possibility of generating identical solutions from conventional linear programming
and goal programming under certain circumstances means the analysts using GP techniques can
conclude that either GP is superfluous, or is of limited usefulness. Romero and Rehman (1985)
argued this is a misleading observation as the equivalence of solutions is to do with the formulation
of the problem rather than the nature or potential usefulness of GP. That kind of problem occurred in
some real applications of GP in agricultural planning problems (Flinn et a/., 1980; Barnett et al., 1982) as has been pointed out elsewhere (Romero and Rehman, 1983).
Secondly, GP assumes infinite trade-ofts between goals situated in different priorities. The inherent
assumption of linear goal programming is that although trade-ofts between goals can take place
within a given priority, they cannot be traded-off across the boundaries of different priorities. In this
context the idea of a trade-off implies the achievement of a goal, say G1, will have to be sacrificed
for a unitary increase in another goal, G2, as compensation. In lexicographic structures of GP
models, the trade-off among goals is possible only when they are in the same priority. This
possibility is not allowed across different priorities as they are assumed to be independent of each
other in a pre-emptive way. This appears to make the LGP model rather restricted but in fact this
situation is not very different from the conventional LP structure where no trade-off is assumed to
exist between the objective and the restraint set. However, in practical applications of LGP when a
decision-maker is not confident about the pre-emptive ordering of priorities, a sensitivity analysis of
the final solution should be given greater significance than is normally accorded to this activity.
Thirdly, there is a tendency for GP to produce non-efficient optimal solutions where the target levels
have been set at very pessimistic levels (Zeleny and Cochrane, 1973; Cohon, 1978). This is more
likely to occur where the optimal solution includes a large number of deviational variables. A
possible remedy is to carry out a parametric analysis of the aspiration levels used in the model. This
would show whether or not it is possible to increase the satisfaction of some goals without reducing
the achievement of others.
Finally, a practical problem inherent in LGP occurs when the number of priorities is excessive so
that a naive prioritisation occurs. This eventuates because the algorithms designed to solve GP
problems assume that the first problem of the sequence has alternative optimal solutions. When
there are no alternative optimal solutions, goals in the lower priorities are ignored. Romero and
28
Rehman (1985) noted that 'naive prioritisation' can be a serious weakness when the size of the
problem is small in relation to the number of priorities
2.4 Conclusion
The main objective of this study was to devise and implement an approach which would allow the
understanding and modelling of the decision making process used in Tongan smallholder farm
households. The approach adopted was to study broad strategic aspects of decision-making and
the behaviour of farmers rather than to focus on specific farming decision scenarios in order to
develop a model giving a more realistic portrayal of the behaviour of Tongan smallholder farmers to
changes in the environment. To be successful, the model must be consistent not only with the
physical view of the farm, but also with the way decision makers behave or react to stimuli and
changes over time with respect to agricultural development policies.
This review of methodology and farm decision modelling indicates the range of structures and
approaches possible in modelling multiple objective decisions. No single approach is superior in all
situations and different models have been used under different circumstances. Ignizio (1983)
claimed there is not now, and probably never shall be, one single "best approach" to all types of
multiple objective mathematical programming problems. The main features of the problem situation will
lead the analyst towards the best approach from an analytical point of view. The choice depends on
the situation of the problem, the nature of the system being modelled and the purpose of the model.
Hazell and Norton (1986) note the important aspects in building a decision model: the decision-
maker must identify the decision problem, select an appropriate model and adjust it to the particular
problem. This is a crucial process, as errors made during this phase cannot be corrected during
computations even if the best and most sophisticated mathematical algorithm is used.
Tongan agriculture is dominated by smallholder production. Decision modelling must therefore
account for the complexity of smallholder farming systems characterised by the existing mix of
enterprises (and alternatives to them) and the way these enterprises compete for the use of the
limited resources available to farmers. It must take account of important differences between the
various types of resources such as land, labour and capital. To gain a view of smallholder farm
behaviour, the model must be consistent with the multiple objectives and preferences of the
smallholder and be able to mimic the way in which these objectives are attained and measured.
Therefore, on the basis of these criteria and the problem identified, the choice of a methodology
favours a GP and MOP model. Goal Programming (GP) offers a number of appealing features in
tackling the complexities of smallholder farming system discussed above. Tongan smallholder
farmers operate within severe resource and other constraints to achieve multiple goals, and the
29
goal-programming model appears to be well suited to the problem. A detailed analysis of the
Tongan smallholder farming system was undertaken and is described in Part 2 of this study.
30

CHAPTER 3
THE Sl"UDY AREA
3.1 Introduction
This chapter contains a general overview of the study area and associated farming systems with
general background information on Tonga, with particular attention being given to the features of the
smallholder agriculture sector and traditional farming systems.
3.2 General Background
3.2.1 Physical setting
3.2.1.1 Geographical Background
The Kingdom of Tonga is an archipelago of 172 coral and volcanic islands, of which 36 are
inhabited, spread over 360,000 km2 of territorial seas in the South Pacific. It is a small country,
physically isolated from the main centres of the world population and trade by thousands of
kilometres of ocean. The majority of the islands are very small in size, ranging from those of only a
few hectares to Tongatapu, the largest island, with an area of 265 km2• The total land area is 747
km2 aggregated into the four major groups of Tongatapu and 'Eua (370 km\ Ha'apai (119 km\
Vava'u (143 km2) and the two small Niuas (71 km2
) (see Figure 3.1). The largest of these is
Tongatapu on which is located Nuku'alofa, the capital, where about 68 percent of the total
population live.
The geographical distribution of the population in the main island groups is shown in Table 3.1. The
1996 population census reported a total popUlation of 97,446 broken down into 49,395 males and
48,051 females. There was an annual average population growth of only 0.3 percent in the ten years
since the previous census, when the population was 94,649 (Statistics Department, 1996). It was
recorded that 68 percent of the total population were residing in the main island, Tongatapu, 16.2
percent in Vava'u, 8.4 percent in Ha'apai, 5 percent in 'Eua and 2.1 percent from the Niuas. The
average population density for the Kingdom was 150 persons per square kilometre, which is high
compared to other islands in the Pacific, although it varies considerably over the Kingdom.
31
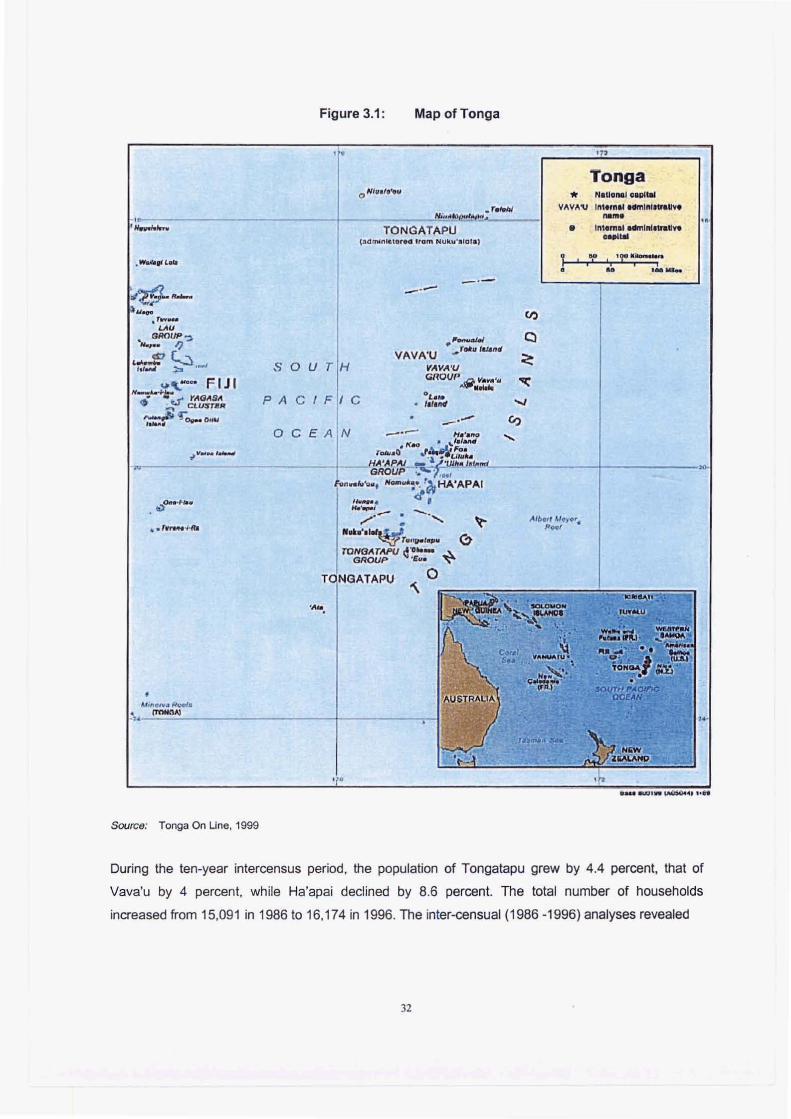
.r .... _ LAU
GR()UP ., H.,.. /) ,...:e ~ '''w .:::. ,-
N----
Source: Tonga On Une, 1999
Figure 3.1: Map of Tonga
TONGATAPU (IIClrnlnll. ored Irom III!JkU 'SIQI.)
- '--'-."--'-
VAVA'U .... r .. IIIII4".
SO U T VAV ... ·U GROUP..sii', v .... ,, -., ......
C 0,.,. . ,.,.,.., PAC ' F -.-De E AN -.-
• <-1'_.0
......
• 1 •
II:)
0 ~
'I;:
" '" .....
,Alb", M{I){lr~ R"I
Tonga
.. ~. In'ema' ..,,11 ..... ".,. . ......
.fI:' , lr"~ I~ I • .to .....
....-..:I1W
During the ten-year intercensus period, the population of Tongatapu grew by 4.4 percent, that of
Vava'u by 4 percent, while Ha'apai declined by 8.6 percent. The total number of households
increased from 15,091 in 1986 to 16,174 in 1996. The inter-censual (1986 -1996) analyses revealed
32
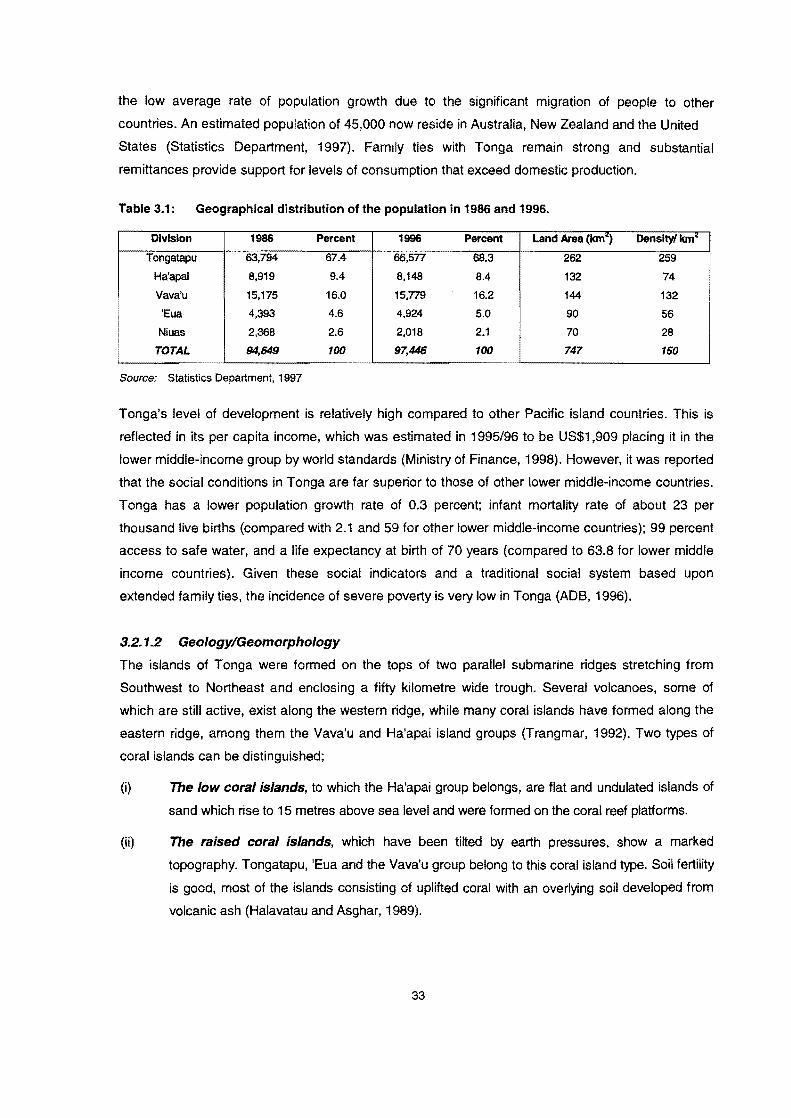
the low average rate of population growth due to the significant migration of people to other
countries. An estimated population of 45,000 now reside in Australia, New Zealand and the United
States (Statistics Department, 1997). Family ties with Tonga remain strong and substantial
remittances provide support for levels of consumption that exceed domestic production.
Table 3.1: Geographical distribution of the population in 1986 and 1996.
Division 1986 Percent 1996 Percent Land Area (Ian") Density! Ian~
Tongatapu 63,794 67.4 66,577 68.3 262 259 Ha'apal 8,919 9.4 8,148 8.4 132 74 Vava'u 15,175 16.0 15,779 16.2 144 132 'Eua 4,393 4.6 4,924 5.0 90 56 Niuas 2.368 2.6 2,018 2.1 70 28
TOTAL 94,649 100 97,446 100 747 150
Source: Statistics Department, 1997
Tonga's level of development is relatively high compared to other Pacific island countries. This is
reflected in its per capita income, which was estimated in 1995/96 to be US$1,909 placing it in the
lower middle-income group by world standards (Ministry of Finance, 1998). However, it was reported
that the social conditions in Tonga are far superior to those of other lower middle-income countries.
Tonga has a lower population growth rate of 0.3 percent; infant mortality rate of about 23 per
thousand live births (compared with 2.1 and 59 for other lower middle-income countries); 99 percent
access to safe water, and a life expectancy at birth of 70 years (compared to 63.8 for lower middle
income countries). Given these social indicators and a traditional social system based upon
extended family ties, the incidence of severe poverty is very low in Tonga (ADB, 1996).
3.2.1.2 Geology/Geomorphology
The islands of Tonga were formed on the tops of two parallel submarine ridges stretching from
Southwest to Northeast and enclosing a fifty kilometre wide trough. Several volcanoes, some of
which are still active, exist along the western ridge, while many coral islands have formed along the
eastern ridge, among them the Vava'u and Ha'apai island groups (Trangmar, 1992). Two types of
coral islands can be distinguished;
(i) The low coral islands, to which the Ha'apai group belongs, are flat and undulated islands of
sand which rise to 15 metres above sea level and were formed on the coral reef platforms.
(ii) The raised coral islands, which have been tilted by earth pressures, show a marked
topography. Tongatapu, 'Eua and the Vava'u group belong to this coral island type. Soil fertility
is good, most of the islands consisting of uplifted coral with an overlying soil developed from
volcanic ash (Halavatau and Asghar, 1989).
33
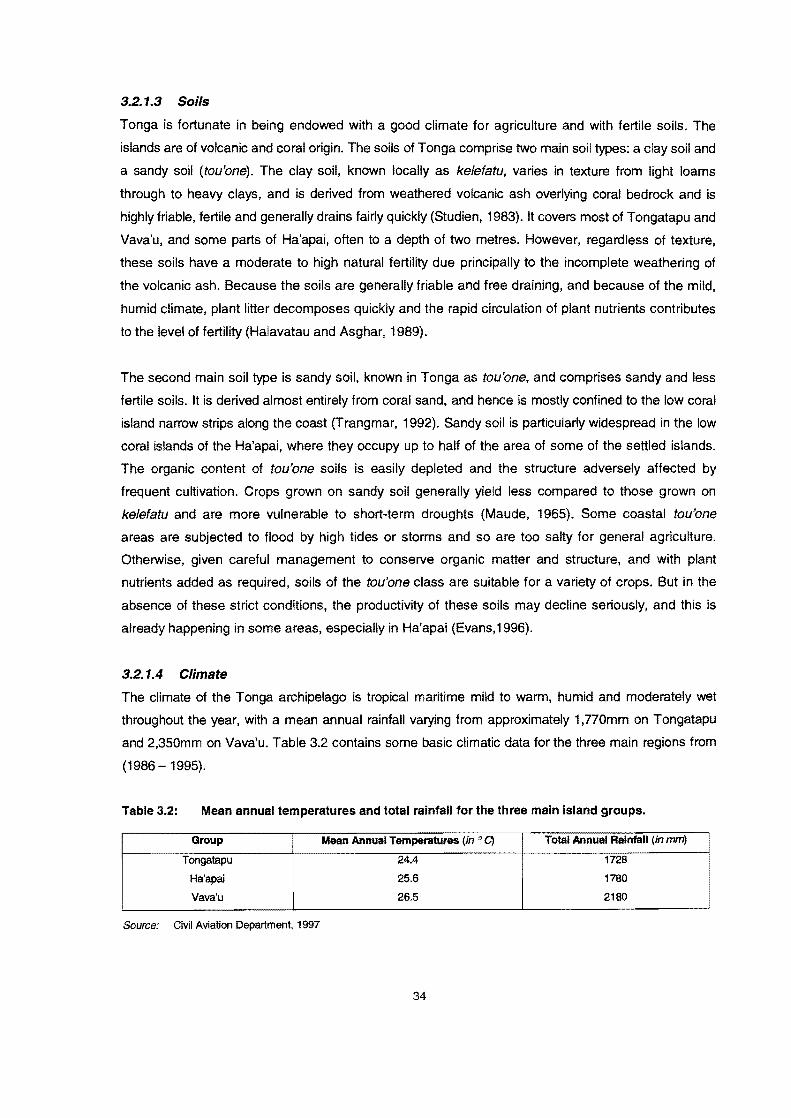
3.2.1.3 Soils
Tonga is fortunate in being endowed with a good climate for agriculture and with fertile soils. The
islands are of volcanic and coral origin. The soils of Tonga comprise two main soil types: a clay soil and
a sandy soil (tou'one). The clay soil, known locally as kelefatu, varies in texture from light loams
through to heavy clays, and is derived from weathered volcanic ash overlying coral bedrock and is
highly friable, fertile and generally drains fairly quickly (Studien, 1983). It covers most of Tongatapu and
Vava'u, and some parts of Ha'apai, often to a depth of two metres. However, regardless of texture.
these soils have a moderate to high natural fertility due principally to the incomplete weathering of
the volcanic ash. Because the soils are generally friable and free draining, and because of the mild,
humid climate, plant litter decomposes quickly and the rapid circulation of plant nutrients contributes
to the level of fertility (Halavatau and Asghar, 1989).
The second main soil type is sandy soil, known in Tonga as tou'one, and comprises sandy and less
fertile soils. It is derived almost entirely from coral sand, and hence is mostly confined to the low coral
island narrow strips along the coast (Trangmar, 1992). Sandy soil is particularly widespread in the low
coral islands of the Ha'apai, where they occupy up to half of the area of some of the settled islands.
The organic content of tou'one soils is easily depleted and the structure adversely affected by
frequent cultivation. Crops grown on sandy soil generally yield less compared to those grown on
kelefatu and are more vulnerable to short-term droughts (Maude. 1965). Some coastal tou'one
areas are subjected to flood by high tides or storms and so are too salty for general agriculture.
Otherwise, given careful management to conserve organic matter and structure, and with plant
nutrients added as required, soils of the tou'one class are suitable for a variety of crops. But in the
absence of these strict conditions, the productivity of these soils may decline seriously, and this is
already happening in some areas, especially in Ha'apai (Evans,1996).
3.2.1.4 Climate
The climate of the Tonga archipelago is tropical maritime mild to warm, humid and moderately wet
throughout the year, with a mean annual rainfall varying from approximately 1.770mm on Tongatapu
and 2,350mm on Vava'u. Table 3.2 contains some basic climatic data for the three main regions from
(1986 -1995).
Table 3.2: Mean annual temperatures and total rainfall for the three main Island groups.
Group Mean Annual Temperatures (in 0 Cj Total Annual Rainfall (in mni) I
~ ~ Tongatapu 24.4 1726 Ha'apai 25.6 1780
I Vava'u 26.5 2180
Source: Civil Aviation Department, 1997
34

There is a marked seasonality in the Tongan rainfall with two main seasons. The rainy season is
characterised by a mean monthly annual rainfall of up to 250mm and an average monthly temperature
of more than 26 DC. The "hot wet season" lasts from November to April, and about 65 percent of the
total annual rainfall occurs during the wet season. The "cool and dry season" is from May to October,
and has a mean monthly rainfall of less than 130 mm and lower temperatures of around 22°C
(Thompson, 1985). A four to eight week drought often occurs during this season, which tends to
influence crop growth and production, due to the rapid drying out of the soil. Rainfall seasonality is most
marked on the Vava'u and the Ha'apai island groups.
High humidity occurs throughout the year. The annual mean humidity ranges from 77 percent in
Tongatapu to 79 percent in Vava'u. The prevailing winds are Southeast Trades winds, which dominate
during the months of May to October, a period when rainfall is lowest and when periodic water
shortages occur, especially in the warmer season. Tropical cyclones also occur frequently. The
cyclone season for Tonga runs from December through to April although deviations outside this
period occur. Tonga experiences an average of two tropical cyclones per year. In the last nine years,
five notable cyclones occurred (in 1990, 1992. 1993, 1995, and 1997) which were the most
destructive in terms of the severity of damage and the vast area affected. Tonga is susceptible to
occasional long periods of drought. 'Utoikamanu (1993) notes that of the three main island groups,
Ha'apai is the most vulnerable to drought because of problems with the provision of an adequate
water supply. During the last ten years, two notable periods of drought have occurred in Tonga
(1992 and 1996) and caused a severe impact on agricultural production.
3.2.2 Social background
3.2.2.1 The Household The basic social and economic unit in Tonga is not, and was not, the individual but the household,
generally referred to as an 'api. Normally the farm household is defined as a group of individuals,
eating and sleeping together (Thaman, 1976). In the past, most of the households were composed of
extended2 families (two or more nuclear families living in one household). All basic economic activities -
production, consumption and the accumulation of goods are organised within the extended family
(Studien, 1983). According to Seve Ie (1973). the economic activities connected with earning a
livelihood are predominantly the business of the household members.
The decisions on cultivation of all land belonging to this extended family was the responsibility of the
head of household (the 'ulumotu'a). Now, however, with changes in household structure. the decisions
are being made differently. At present the trend is more toward nuclear families, comprised of a man
and wife and their real and/or adopted children, which may also include unmarried brothers or sisters, a
2 An extended family is a household consisting of two or more nuclear families.
35
parent, or even a friend or relative. According to the last population census, the mean household size
for Tongatapu was 6.7 persons in 1996 (Statistics Department, 1997).
One of the significant features of the Tongan society is its relatively homogenous nature, with an
elaborate and well-established social system. Thus, although the household consisting of individuals
bound by kinship ties is the basic unit of everyday living, the extended family which consists of varying
numbers of kinship households, known locally as kainga or famili, also constitutes a socio-economic
unit of considerable importance (Sevele, 1973; Thaman, 1976). Among themselves the members of
the extended family form a unit of co-operation in activities requiring a lot of labour such as certain
farming activities and house construction, but especially on occasions such as marriages, funerals,
birthdays celebrations and festive occasions (Evans, 1996). Each of the various members has his
position in relation to others and his obligations to, and expectations from, others are governed to an
important degree by the kinship. Sevele (1973) considered these personal interrelationships,
obligations and expectations as important components of the social fabric within which the Tongan
household operates. The impact of these factors on household's production decisions is examined in
Chapter 8.
3.2.2.2 The Village
In Tonga, as in most Pacific countries, the principal form of settlement is the village. There are
altogether 145 villages in Tonga, and they vary greatly in size (Appendix 3). Apart from being a
residential unit, the village is also a social, administrative and, to an important degree, an economic
unit. Corresponding to the types of authority over land in Tonga are two types of villages, noble and
government estates. In the noble estate village, the traditional status and authority of the noble, the
chief of the village, constitutes a strong force, binding the members of the village together in common
allegiance to him. Evans (1996) notes that the noble is recognised as having the authority to call upon
every household in the village to supply gifts of food crops, livestock, mats, tapa cloth and other goods,
whenever the need arises, for example, on the marriage or death of a member of Royalty or of the
nobility. Although not bound by the law, the villagers display great respect to the noble and listen to, and
carry out, his demands, partly in recognition of his traditional position as the village leader. The nobles'
control of land distribution enables them to have a powerful influence on the villagers, especially those
who are seeking land allotments.
3.2.2.3 The Church
Sisifa et al., (1993) note the church is of considerably more social importance than the government and
is the primary focus of the Tongan society. The Christian religion in its various forms has made a deep
and permanent impact upon Tongans, and is an extremely important institution in Tongan society
(Evans, 1996). Church activities and ceremonies playa prominent role in the lives of the Tongans.
Much of the church financial support, as well as support in kind for ministers, teachers, and church
officials, comes directly or indirectly from the agricultural system (Sisifa et al., 1993). Sevele (1973)
36
claimed it is not uncommon for a family to give more than fifty percent of its annual income to support
the church in the form of cash or church feasts. The strong co-operative and competitive spirit and
energetic drive shown by the Tongans in church activities do not always extend to other activities,
especially those connected with attempts to improve their material living conditions.
The importance of church has both positive and negative effects. Church group activities, particularly in
subsistence cropping (toutu'u 'uff), are strong. Some district extension officers have used this to
advantage in their work. In the field of education, the various churches playa very important role such
as providing 90 percent of the secondary education with no financial assistance from the Government.
On the other hand, church and community activities often take up much of their time and efforts at the
expense of improvement to agricultural productivity (Sisifa et a/., 1993). The influences of church on
household production decisions are discussed in-depth in Chapter 8.
3.2.3 Land tenure system
A country's land tenure system is a critical factor in its economic. cultural and environmental make-up,
and to its agriculture and forestry. The livelihood of most Tongans is intimately tied to the land. It is the
basis of not merely their immediate subsistence but their cash transactions (Hardaker et al., 1988).
Consequently land distribution is fundamental to the organisation of social relations in Tonga. Access
to land is crucial to the economic situation, power, prestige and security of any individual or family
(ADS, 1995). Tonga has a unique land tenure system, based on the traditional hierarchical structure of
society but securing the rights of individual landholders to a degree unparalleled in neighbouring Pacific
Islands states. The Land Act elaborates that all land became the property of the Crown and was
divided into royal, government and noble estates (James, 1995). From these estates all adult males
were entitled to a tax allotment for his garden ('api tukuhau) of 3.34 hectares, and a smaller dwelling
known as a town allotment ('api kolo) of 0.16 hectares. Allotments are made upon application from
either the hereditary estates, or from Government land, depending on where the applicant is lawfully
resident, and once registered the title is inheritable, according to strict rules of successions set out in
the Constitution. There are four land tenure categories - the King's estates, the Royal Family's
estates, the estates of the nobles and chiefs, and Government land. Only the last two categories of
land are available for allotment as 'api land.
The 1992 Annual Report of the Minister of Lands, Survey and Natural Resources showed the total
registered holdings at the end of 1992 comprised 15,196 tax allotments ('api 'uta), 12,557 town
allotments ('api kolo) and 3,441 leaseholds ('api lisi). The land distribution was as follows:
3 Toutu'u 'uti means a group-plot, mads up of individually owned plots, of yams and associated crops,
37
Allotment 62.8% Unallocated Govemment land 11.4% Unallocated noble's land 6.9%
Leases 8.4%
Small islands, lakes, lagoons 10.5%
100.00 Source: Statistics Department, 1986
Progressive allocation of allotments has meant that many hereditary estates are now fully allocated,
although apparently land is still available for leasing - either formally or informally (and probably
illegally). Land scarcity is now a major constraint to agricultural development in Tonga. While it is
officially estimated that, today, about 60 percent of eligible people do not have a tax allotment, most
people do have access to garden land, either the land of kin, in-laws or friends, or land leased from the
Government, nobles or other allottees. These measures enable the necessary adaptation of what
would otherwise be a rigidly equal distribution of land. Fukofuka (1994) argued that the present system
constrains development and the whole land tenure system should be reviewed to counter the following
problems;
the increasing number of absentee landowners; about 10 per cent of those with tax allotments
are now residing in a foreign country.
the difficulty of obtaining long-term leases of tax allotments from the tax allotment holders.
the high cultural value attached to land has meant that allotment holders, even those overseas,
hold on to their land which they do not use, but which they regard is important to their security,
status and identity (Fukofuka, 1994, p 147).
3.2.4 Economic background
3.2.4.1 The Tongan Economy The economy of Tonga has three dominant features: a large semi-subsistence agricultural sector, a
high degree of dependence on imported capital and consumption goods, and comparatively high
inflows of finance in the form of remittances from Tongans living abroad. Foreign exchange is
centered on the exports of two main commodities: people and agricultural produce. Whilst
agriculture is vitally important to Tonga, both in an economic and social context, the economy is also
under-pinned by remittances from the large expatriate population and by foreign aid assistance.
Emigration has played an important role in the economy. As noted earlier, about 45,000 ethnic
Tongans are estimated to be residing abroad mainly in New Zealand, Australia and the USA. The
World Bank (1996) estimated cash remittances from overseas residents to be about T$40 million
per annum or equivalent to 20 percent of nominal GOP. Despite a reduction in the cash remittances
over the years, there has been significant upsurge in the provision of remittances in kind, mostly
consumer durables and light consumer goods.
38
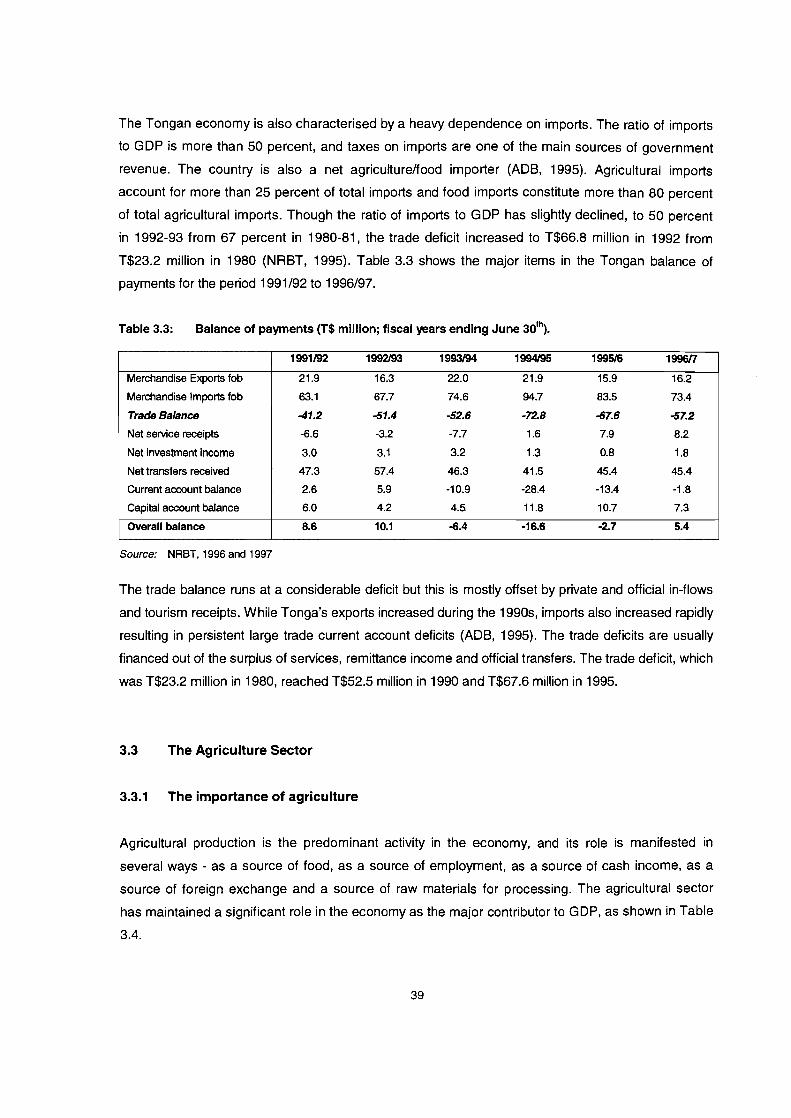
The Tongan economy is also characterised by a heavy dependence on imports. The ratio of imports
to GOP is more than 50 percent, and taxes on imports are one of the main sources of government
revenue. The country is also a net agriculture/food importer (ADS, 1995). Agricultural imports
account for more than 25 percent of total imports and food imports constitute more than 80 percent
of total agricultural imports. Though the ratio of imports to GOP has slightly declined, to 50 percent
in 1992-93 from 67 percent in 1980-81, the trade deficit increased to T$66.8 million in 1992 from
T$23.2 million in 1980 (NRST, 1995). Table 3.3 shows the major items in the Tongan balance of
payments for the period 1991/92 to 1996/97.
Table 3.3: Balance of payments (T$ million; fiscal years ending June 30'\
1991192 1992193 1993194 1994195 1995/6 1996f7
Merchandise Exports fob 21.9 16.3 22.0 21.9 15.9 16.2 Merchandise Imports fob 63.1 67.7 74.6 94.7 83.5 73.4
Trade Balance -41.2 -51.4 -52.6 -72.S -67.6 -57.2 Net service receipts -6.6 -3.2 -7.7 1.6 7.9 8.2
Net investment income 3.0 3.1 3.2 1.3 0.8 1.8
Net transfers received 47.3 57.4 46.3 41.5 45.4 45.4 Current account balance 2.6 5.9 -10.9 -28.4 -13.4 -1.8
Capital account balance 6.0 4.2 4.5 11.8 10.7 7.3
Overall balance 8.6 10.1 -6.4 -16.6 -2.7 5.4
Source: NRBT, 1996 and 1997
The trade balance runs at a considerable deficit but this is mostly offset by private and official in-flows
and tourism receipts. While Tonga's exports increased during the 1990s, imports also increased rapidly
resulting in persistent large trade current account deficits (ADS, 1995). The trade deficits are usually
financed out of the surplus of services, remittance income and official transfers. The trade deficit, which
was T$23.2 million in 1980, reached T$52.5 million in 1990 and T$67.6 million in 1995.
3.3 The Agriculture Sector
3.3.1 The importance of agriculture
Agricultural production is the predominant activity in the economy, and its role is manifested in
several ways - as a source of food, as a source of employment, as a source of cash income, as a
source of foreign exchange and a source of raw materials for processing. The agricultural sector
has maintained a significant role in the economy as the major contributor to GOP, as shown in Table
3.4.
39

Table 3.4: Contribution of agriculture to gross domestic product (GOP).
YEARS 1987 1988 1989 1990 1991 1992 1993 1994 1995 1996
I Agriculture as % of GOP 38.9 38.0 36.7 35.1 36.9 38.1 38.6 35.8 35.2 35.1
Source: ADB, 1996; NRBT, 1997
Almost 80 percent of the agriculture production is for the domestic market with the remaining 20
percent produced for export. Domestic production concentrates largely on traditional root crops,
namely yam, taro, cassava and sweet potatoes. For the export market, squash and vanilla are the two
leading crops, while kava and watermelon are gaining importance. The volume of food-crop production
in Tonga has remained high over the years. Table 3.5 shows the total area and quantity of crops
recorded in the Land Use and Crops Survey (MAF, 1994b).
Table 3.5: Production estimates of major crops grown in Tonga in 1993.
Individual Crop Area (ha) Production (tonnes) Percentage of Total Area
Cassava 2647.0 45,786.3 39.1
Squash 2113.0 20,890.0 17.8 Taro 1532.1 16123.8 11
Bananas 743.8 9655.4 8.3 Gjanttaro 7082 8,751.0 7.5 Yam 617.4 7345.7 6.3 Sweet Potato 564 5,575.6 4.8 Pineapple 140.9 2,263.3 1.9 Potatoes 80.5 995.0 0.8 Kava 250.5 928.5 0.8 Vegetables 46.7 513.6 0.4 Watermelon 67.5 834.0 0.3 Vanilla 803.6 397.1 0.3
Source: MAF,1994b
However, according to the World Bank (1990) the true value added and contributions of agriculture
to the economy are grossly understated by at least 25 percent. The understatement is related to
underestimation in agricultural production for home consumption as well as marketed production for
local and export markets.
3.3.2 Performance of the agriculture sector
Agriculture has undergone major changes in the past decade, as has the Tongan economy. Table 3.6
shows the significant contributions of agriculture to Tonga's export earnings. Figure 3.2 show the
structure of the exports and the contributions of the various components.
40
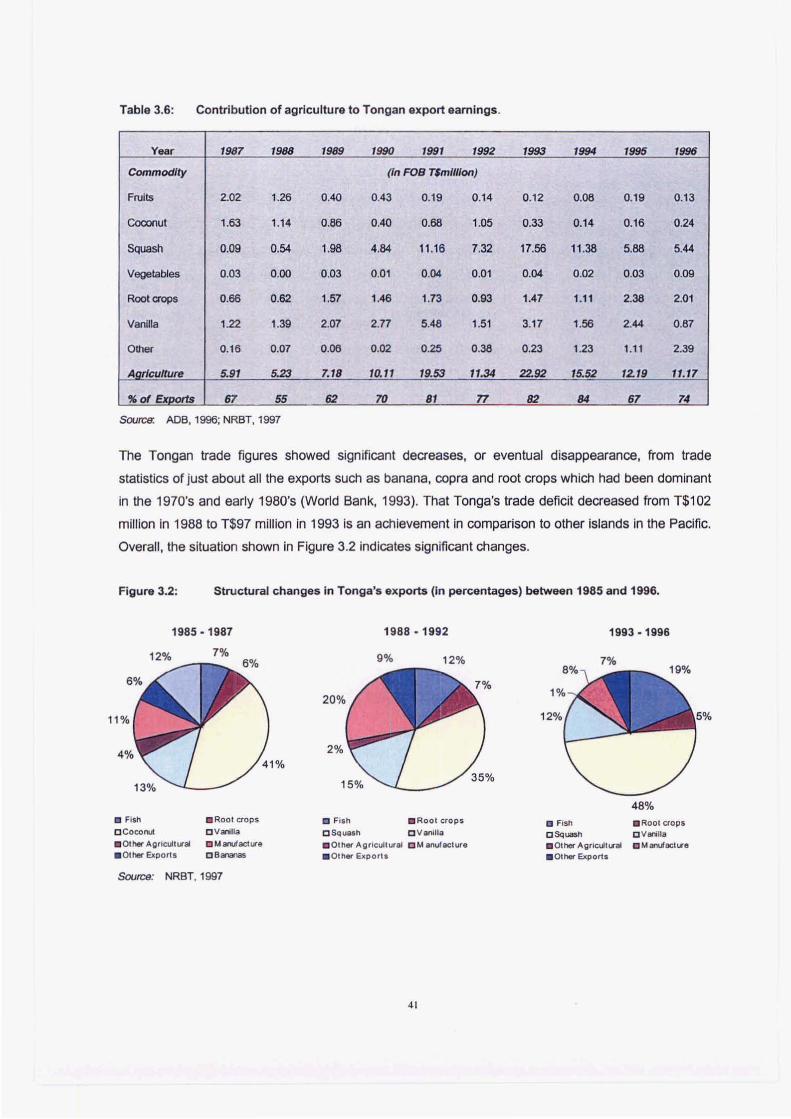
Table 3.6: Contribution of agriculture to Tongan export earnings.
Year 1987 1988 1989 1990 1991 1992 1993 1994 I_
1996
Commodity (In FOB TSmllllon)
Fruits 2.02 1.26 0.40 0.43 0.19 0.14 0.12 0.08 0.19 0.13
Coconut 1.63 1.14 0.66 0.40 0.68 1.05 0.33 0.14 0.16 0.24
Squash 0.09 0.54 1.98 4.84 11 .16 7.32 17.56 11 .38 5.88 5.44
Vegetables 0.03 0.00 0.Q3 0.01 0.04 0 .01 0.04 0.02 0.03 0.09
Rootaops 0 .66 0.62 1.57 1.46 1.73 0.93 1.47 1.11 2.38 2.01
Vanilla 1.22 1.39 2.07 2.77 5.48 1.51 3.17 1.56 2.44 0.87
Other 0.16 0.07 0.06 0.02 0.25 0.38 0.23 1.23 1.11 2.39
Agriculture 5.91 5.23 7.18 10.11 19.53 11.34 22.92 15.52 12.19 11.17
"ofExDOrls 67 55 62 70 81 77 82 84 67 74
Source: ADB. 1996; NRBT. 1997
The Tongan trade figures showed significant decreases, or eventual disappearance, from trade
statistics of just about all the exports such as banana, copra and root crops which had been dominant
in the 1970's and early 1980's (World Bank, 1993). That Tonga's trade deficit decreased from T$102
million in 1988 to T$97 million in 1993 is an achievement in comparison to other islands in the Pacific.
Overall, the situation shown in Figure 3.2 indicates significant changes.
Figure 3.2: Structural changes in Tonga's exports (In percentages) between 1985 and 1996.
• Fish c eocorU
1985 - 1987
7%
• Root crops CVanill~
• Other Agricuiltn! aM antlachn • Ott_ Exports OBiW1afI3S
Source: NRBT.1997
• Fish C Squash
1988 - 1992
9% 12%
.Root crops C Vanilia
. Other Agricultural eM anufaclure
. Other Expo rt s
41
II Fish 0 50 ......
1993 -1996
48% . RoOl crops o Vanilia
. Ott..."Agrlcul" .... DM ant.lach.r •
. Ott,.Expol1,
According to Sturton (1992), the performance of the agriculture sector in the 1980s was dismal.
Production of all traditional commodities (for example, coconut and bananas) stagnated significantly.
During the 1970s, coconut products represented over 70 percent of the exports. The drop in the world
market prices of coconut products from an average of T$500 per ton to a low of T$200 per ton had a
major impact on the coconut industry. Production of coconut products has declined from about 70
percent of the exports in the 1970s to about 41 percent in the 1985 -1988 and to a low of 1.8% in 1990
to 1993. This substantial decline not only induced a loss in the foreign exchange but also affected the
employment opportunities created through copra and oil processing, and desiccated coconut
manufacturing.
By the end of the 1980s there was a general disillusionment in the ability of the sector to contribute
in a substantial way to development. Banana production, which was the second most important
export earner, also followed similar trends falling from 12 percent in 1985-1988 to a low of 0.5% in
1990-1993. The production of bananas virtually vanished due to natural disasters, quarantine
restrictions, and the termination of the subsidy scheme. By the late 1980s manufacturing and
tourism offered greater long-run potential, yet during this period some important diversification
reSUlted. Nonetheless, Tongan agriculture continued to move through the resulting transition phase
with some considerable success. There has been some strong growth in exports of other crops;
exports of vanilla and root crops and other vegetables have risen to counterbalance the decline in the
traditional exports. In addition, Government policies for the encouragement of a manufacturing sector
gave rise to the Small Industries Centre (SIC). However, these developments, taken collectively,
were not sufficient to counterbalance the deterioration in the production of the traditional export
commodities and the economy entered a period of prolonged recession.
The most notable development in the 1990s was the rapid growth of squash exports to Japan. This
remarkable growth in the early 1990s led to the economy emerging from the recession. Production
of squash for export commenced in 1987 and from 1991 to 1996, the total export earnings from
squash amounted to a total of about T$60 million which is equivalent to about 63 percent of the
agricultural exports and at least 45 percent of the overall export value. Details of present agricultural
export commodities are reviewed in Chapter 5.
3.3.3 The Tongan farming systems
Tongan agricultural systems are fundamentally agro-forestry systems utilising bush, or grass, fallow
followed for several years by a series of crops intercropped with coconuts and other trees to create a
rotational, multi-storeyed fallow system. These farming systems have shown adaptability by readily
incorporating new crops and technologies. Most importantly, they have proven robust, productive and
sustainable. The productivity of the total system is higher than if any of these crops were monocropped
(World Bank, 1990). The importance of the system lies not in some view of the past, but in fact that the
42
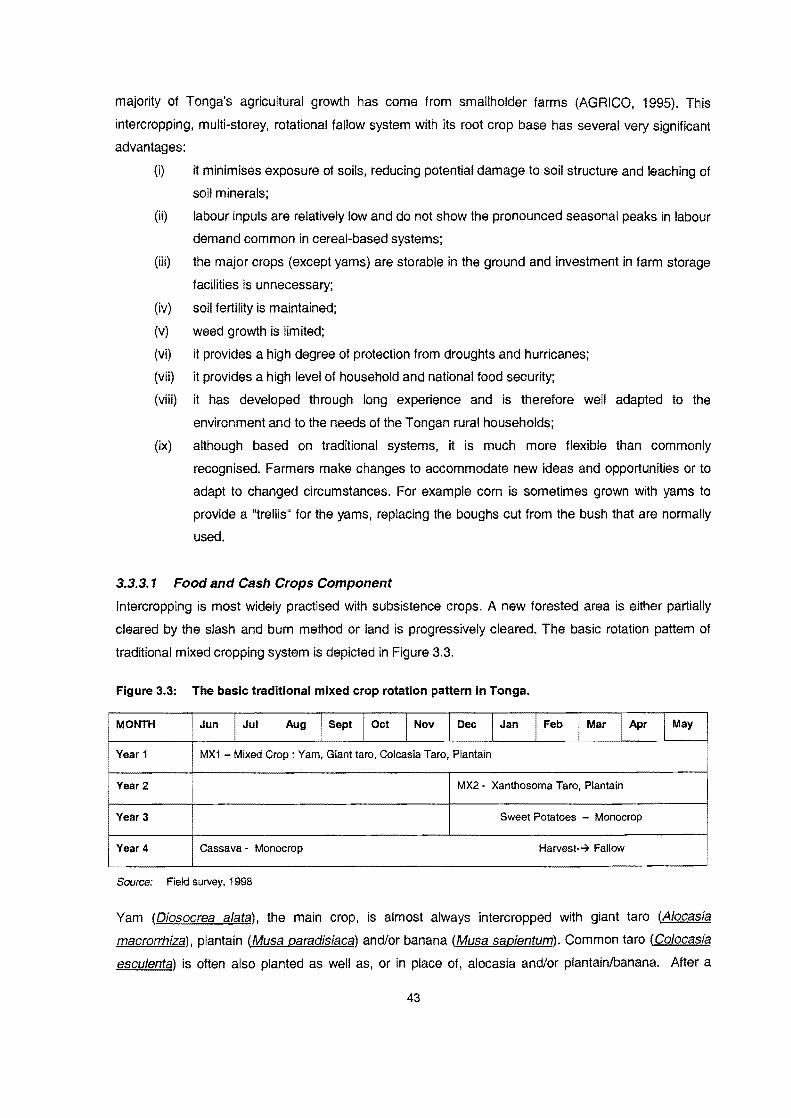
majority of Tonga's agricultural growth has come from smallholder farms (AGRICO, 1995). This
intercropping, multi-storey, rotational fallow system with its root crop base has several very significant
advantages:
(i) it minimises exposure of soils, reducing potential damage to soil structure and leaching of
soil minerals;
(ii) labour inputs are relatively low and do not show the pronounced seasonal peaks in labour
demand common in cereal-based systems;
(iii) the major crops (except yams) are storable in the ground and investment in farm storage
facilities is unnecessary;
(iv) soil fertility is maintained;
(v) weed growth is limited;
(vi) it provides a high degree of protection from droughts and hurricanes;
(vii) it provides a high level of household and national food security;
(viii) it has developed through long experience and is therefore well adapted to the
environment and to the needs of the Tongan rural households;
(ix) although based on traditional systems, it is much more flexible than commonly
recognised. Farmers make changes to accommodate new ideas and opportunities or to
adapt to changed circumstances. For example corn is sometimes grown with yams to
provide a "trellis" for the yams, replacing the boughs cut from the bush that are normally
used.
3.3.3.1 Food and Cash Crops Component
Intercropping is most widely practised with subsistence crops. A new forested area is either partially
cleared by the slash and burn method or land is progressively cleared. The basic rotation pattern of
traditional mixed cropping system is depicted in Figure 3.3.
Figure 3.3: The basic traditional mixed crop rotation pattern in Tonga.
MONTH ! Jun I Jul • Aug I I Sept I Oct I Nov Dec I Jan I Feb I Mar I Apr I May
I Year 1 MX1 - Mixed Crop: Yam, Giant taro, Colcasia Taro, Plantain
Year 2 i
MX2· Xanthosoma Taro, Plantain
Year 3 Sweet Potatoes - Monocrop
Year 4 Cassava· Monocrop Harvest'-7 Fallow
Source: Field survey, 1998
Yam (Diosocrea alata) , the main crop, is almost always intercropped with giant taro (Alocasia
macrorrhiza). plantain (Musa paradisiacal and/or banana (Musa sapientum). Common taro (Colocasia
esculenta) is often also planted as well as, or in place of, alocasia and/or plantainlbanana. After a
43

period of 8-10 months, yam is harvested. American taro (Xanthosoma sPP.) is then planted in the place
of yams and is followed by sweet potatoes (Ipomoea batatas) and by cassava (Manihot esculenta)
before the land is allowed to revert to fallow. Cropping sequences last from two to five years, after
which the land is left fallow from two to six years. The average length of fallow has plummeted from 10-
15 years to only about 3 years today, and in certain cases, to about 6 months. This creates a concern
over the sustainability of the soil fertility due to a shortened fallow.
3.3.3.2 Livestock Component
In addition to traditional cropping, livestock also plays a significant role in the agricultural system of
Tonga. The most frequently observed stock, owned by Tongans, include pigs, horses, chickens,
cattle and goats. Pigs are the most important animals kept by Tongan smallholders in terms of
nutritional significance and importance as gifts in the social system, and for feasts. These will be
discussed in greater depth in Chapter 7.
3.3.3.3 Handicraft Component
Handicraft production plays an important role in village life for home use, as gifts on special occasions
and for sale (AGRICO, 1995), Although principally the work of women, other household members
commonly participate. Handicraft production includes tapa (or bark cloth) making and mat weaving, as
well as production of baskets or other items for domestic use and some for exports.
3.4 Conclusions
In Tonga, smallholder agriculture is the main mode of agricultural production. The general picture,
which emerges, is the important role these units have in Tonga's economy. Despite the mixed
performance of the agriculture sector over the recent years, there is a potential for the country to
expand its export market. 'Akolo (1997) pointed out that increased export growth can be achieved if
advantage is taken of the possibilities to continue improving productivity of high value crops that
have promising market prospects (such as squash, vanilla and kava). Farmers need to respond by
expanding the use of improved farm techniques, and increased production through bringing unused
land under cultivation. As such it has attracted the particular attention from the government and
farming interests and more recently donor agencies and development planners.
Smallholder agriculture involves complex characteristics that appear to require further analysis. A
number of features of Tongan smallholder farming systems are revealed which have implications for
the modelling process. Firstly, the majority of agricultural smallholder producers in Tonga are semi-
subsistence farm households. There is a predominance of diversified farming system production
activities with a wide range of food, cash crops, and livestock. A significant proportion of part of the
total product is retained within the household for home consumption and for social and religious 44

obligations. The remainder is sold. Secondly, the limited resource capacity (land, labour, capital) of
smallholder farm households imposes severe constraints on both the range of production activities
possible and the nature of commercial capabilities and so influences their decisions on utilising their
land.
Following a general overview of the villages and associated farming system, a number of aspects
were selected as being of key importance in modelling the decision framework of the system.
Farmers' decisions relating to utilising limited land resources are influenced by the goals and
preferences farmers have. Decisions also relate to the allocation of farm output and income for
several objectives such as household consumption, church and social obligations and determine the
level of production and investment in the agriculture sector. Similarly, farmers' response to proposed
government agricultural policy and project innovations is likely to involve changes in behaviour, yet
very little is known about the nature of their behaviour.
The next chapter provides a detailed description of the survey method used for data gathering and
collecting key information for the study area.
45
CHAPTER 4
FIELD RESEARCH METHODOLOGY
4.1 Introduction
This study attempts to develop planning models that contain an understanding of Tongan
smallholder farm household production and land use decisions. The fieldwork focussed on
developing knowledge and information to provide both statistical and descriptive guidelines for
understanding the dynamics of the decision making process in the village farm household regarding
the utilisation of its limited land resources. The key issues to be addressed include:
(a) How land use dec;sions are made in a smallholder farm household; who makes the
decisions and what factors influence the decisions?
(b) What are smallholder farmers' objectives and motives? The goals need to be ranked
and weighted.
(c) What do smallholder farmers see as key constraints to achieving those objectives?
(d) Obtaining information on the production system, household income, expenditure and
consumption.
The methodological approach used to collect data and identify and describe smallholder farming in
Tonga is outlined in this chapter. In order to describe the farmer's behaviour, data from individual
farm households and other sources was required. This chapter outlines the general procedures for
sample selection and data collection, and describes the sources of data, sample size determination,
criteria for sample selection, questionnaire administration and data collection procedures.
4.2 Research Approach
Any behavioural model should be specified to capture the principal interactions and behaviour of the
Tongan smallholder farming system and should be capable of experimental manipulation in order to
predict the consequences of changes in the determinants of the system's behaviour. Modelling is
thus one of the techniques or tools that systems approaches employ.
46
Within the systems research framework, the present study is primarily concerned with the analysis of
the Tongan smallholder farming system. It views the farm household system as a whole, and
understands the connections and interactions between individual components. The Tongan
smallholder farm household consists of three basic sub-systems, which are closely interlinked, and
interactive (Hardaker, 1975; Brook, 1980):
• the household - the decision making unit which controls and establishes objectives for the
system; provides labour, demanding food, other products and cash in fulfilment of set
objectives.
• the farm and its crop and livestock activities, providing employment, food and cash for the
farm family.
• the off-farm component which competes with farm activities for labour; providill9
employment and income generating activities that are becoming increasingly more
important to supplement the well-being of farm families.
Systems analysis as defined by Anderson and Dent (1972) is the study of a system, its component
parts, their interactive behaviour and their interrelationships between the major components. The
systems approach is based on a thorough analysis of all elements and an understanding of the
dynamics of the system. Smallholder farming systems analysis involves understanding the natural,
socio-cultural and policylinstitutional environment that influences decision processes at the farm-
household level. This enables policy makers to diagnose constraints, and to identify and assess
potential improvements, which should be addressed in development programs and policy design.
The study focussed on the farm household system as it ultimately controls the transformation of
inputs into basic agricultural outputs (production). At the farm-household level the objectives are set
by, and for, the farm household itself. It is therefore important that the farm household objectives,
and the way they try to achieve them, are well understood. In most cases the proposed intervention
packages at the farm household level will increase the linkage with systems. With development, the
level of interdependence decreases and the linkages with other systems becomes more important.
The farm-household becomes important in fulfilling the needs of systems higher up in the hierarchy
at village and national levels.
Varying approaches and methods have been used during this study in an attempt to combine a depth
of understanding with a breadth of coverage. To provide the information necessary a qualitative
approach was adopted along with village and household case studies. An approach, characterised by
information such as descriptions of situations, events, people's perceptions, interactions and observed
behaviour, was considered to be most appropriate for an in-depth study of smallholder farm
47

household's decision making (Casleyand Kumar, 1988). The analysis examined complex sociological,
cultural and biological relationships within the villages and farm households by means of informal
interviews with individuals or groups, and direct observations of local conditions, and a study of pre-
eXisting or secondary information. These general methods were used together and interactively.
4.3 Field Visits
4.3.1 Initial visit
An initial four week research visit was conducted in September 1997. The main purpose was to
continue to build an external framework for the study and to gather the secondary information required.
This included an initial survey of the islands to build up an overview of ecological patterns, popUlation,
settlement and land use patterns, operation of present subsistence and cash cropping systems and
administrative and economic structures. Information of a general nature relating to each region, such
as population, land resources, agricultural production, transport and infrastructure facilities and various
other aspects of the socio-cultural and political environment was also collected. A great deal of
ethnographic, economic and technical, statistical and other material, both on macro and micro scale, is
available. A considerable amount of information was also obtained from reports and surveys of
Government Ministries. Furthermore, the author already had considerable familiarity with Tongan
agricultural systems and administrations.
Information and data sources included land use and crop surveys, agriculture studies, statistical
reports, annual reports, climatological data, maps, population census data, and previous island
development studies and other research. Basic demographic data were available from the Statistics
Department, which conducted population censuses in 1986 and 1996. Compared with most
developing countries, Tonga is very well provided with information on the quality of its land
resources, the tenure under which land is held, and the use to which it is put. The last agricultural
census of the entire kingdom was conducted in 1986 and provided statistics on the areas under each
of a range of crops or types of land use. The Policy and Planning Division of the Ministry of Agriculture
and Forestry has also produced numerous surveys, reviews and statistical summaries from each sub
region that provided valuable secondary information. These included the 1993 Land Use and Crop
Survey, which is the second periodic survey on the structure of cropping, that gives the manner in
which the agricultural land is being utilised, the ownership of cropped land, and the means by which
farmers obtained the use of land.
The secondary information was crucial in the early stages of the research not only as it provided a
broad perception of the project area but also helped identify data gaps that needed to be addressed
during the main fieldwork. Because there is a reasonable base of social data and agricultural land use
48

data available, information gathering was focussed on data that was most relevant to the research
objectives.
Specific tasks also undertaken included co-ordinating with various relevant Tongan Government
ministries in the update and collection of basic and ongoing secondary data and information, and
familiarisation with existing and planned agricultural aid projects which have implications for rural
development. A large body of statistics and information on the smallholder economy has been
collected from farm management surveys, household surveys and income and expenditure surveys.
Such data are appropriate for the piecemeal application of the theory of the firm and consumer
behaviour, but they are inadequate for analysing the complex interactions among economic activities
within a household and a village.
The need for such data collection is not limited to academic interests. It should also be the basis for
effective design of rural development programs and national development policies. For example, a
program for the development and extension of a new crop should be evaluated by farm production
surveys to indicate how the technology will affect farm outputs, costs, and returns. However, the
program's impact on rural welfare through income re-distribution and consumption, and on local and
national development through capital formation, cannot be evaluated without access to information on
consumption and investment both at the household and the village levels.
4.3.2 Main research visit
An independent village survey was used as the main source of primary data for this study. The survey
was conducted during the main field research visit from December 1997 to March 1998. The main
fieldwork gathered primary data in order to develop a conceptual framework of smallholder decision
making and to assist in model design. The premise for this framework was that land is the most
critical resource in Tongan agriculture and therefore attention is focussed on land use decisions.
This meant, amongst other things, being able to identify farmer'S goals and priorities, and to quantify
accurately for each village and region such economic parameters as;
the resource endowment in terms of land, labour and capital,
the level and composition of subsistence production, consumption, and investment,
the level and sources of cash income and use,
the level and means of cash consumption expenditure, investment and savings,
some of the important linkage factors such as cash returns to labour in the production of
farm outputs.
49
4.4 Data Collection
The methodology used in acquiring the necessary data during the main research visit included a
household survey, key informant interviews and discussions, and personal observation.
4.4.1 Farming system household survey
The household head is traditionally the father or the most senior male member, and normally is the
inheritor of the land. He directs most of the affairs of the household both internally and externally. The
household head was therefore selected as the person for interviewing on behalf of the household. The
farm household survey was undertaken to generate primary data of the farming systems, both
quantitative and qualitative information, to allow a quantitative representation of the farm-household
system such as required in mathematical programming models
The interviews used Semi-Structured Interviewing (SSI) and followed a guided questionnaire (Appendix
1). The survey questionnaire acquired information on the household size and structure, household
income and expenditure, and supply of family agricultural labour. It also covered information on land
access and utilisation, crop size, livestock raised, consumed and sold, marketing, credit, cropping
calendar, output, and inputs used. Information on religion, customs, tradition, and beliefs was also
included. Questions were asked in Tongan by the author and translated for recording. No time limit
was placed on the interview to allow as much time as possible for the farmer to understand and
answer the questions. Generally the interviews took about two hours for each household. It was
possible to critically explore and study various issues with regards to land use decision making at
length, which would otherwise not materialise with a standard quantitative survey.
4.4.2 Interviews of key informants
In addition to the farm households, interviews were conducted with key people and groups in the village
including,
Village chief or noble
Vii/age officer
Vii/age Church leaders
Village committees or District agricultural committees
Grower's group
Women's group
Agricultural Extension Officer
NGO's and other development groups
Village elders
50
Progressive farmers
Agricultural exporters
Tonga Development Bank Officers
Qualitative interviews with these people were essential for obtaining additional information, ideas and
insights about farmers in the villages and the village itself. Small group meetings with women, usually
with work collective work groups (tou lalanga) in their work places, and also with other groups, such as
farmer's (kautaha toungaue) groups were conducted. The separate interviews with these groups
proved to be useful, as group activities are significant at a village level. It provided a better
understanding of group networks, poliCies, and activities, which have an impact on individual household
prod uctivity.
Informal kava meetings with some village members were also conducted in the evenings. These
meetings included some village elders, farmers and youth, and the discussion was unstructured.
Some of the major key issues of the study were raised for discussion, and the meetings were
instrumental in getting the villager's views on these issues. The use of village kava meetings as a
means of acquiring information blended well with the normal tradition of meetings, which gave village
people the freedom to express their views and ideas.
4.4.3 Direct observation
Through careful observation, precise and detailed knowledge of the technological, economic and social
relationships, which are at work in agriculture and village life, was also accumulated. Direct observation
involved watching what people do, their behaviour, relationships, networks, and the farming process
(Casley and Kumar, 1988). This was required by the need to go beyond outward appearances and
probe the perceptions, motives, beliefs, values and attitudes of the smallholder farm household. Cas ley
and Kumar (1988) note the central concept in participant observation is that researchers participate in
the social reality experienced by the community under observation. In studying the economic behaviour
of smallholder farmers, the researcher becomes a part of the rural community to the degree required in
order to understand the smallholder farmers' perceptions of the constraints and opportunities open to
them. It also involves the assessment of development packages, and farmer attitudes towards
institutions and poliCies.
Direct observation was conducted because of the need to observe agriculture decisions and
practices in their most natural setting. This included the way that decisions are made in village or
district committees, growers' groups and associations, the technical advice actually communicated
to farmers by the extension worker, and the daily operations of supporting institutions in rural
settings. The resulting depth of insight is not easily obtained in any other way. Direct observation
reveals behavioural patterns, social and economic processes, and environmental factors, which the
51

farmers themselves may not be aware of, or are unable to adequately describe. Participant
observation thus is particularly useful in gaining insights about the conditions, needs and
behavioural patterns of the rural poor and other vulnerable groups who are usually not able to
articulate their problems and predicaments. An illiterate, old, poor farmer does not find it easy to
explain his problems and needs, but a perceptive observer may see them clearly after spending a
few days in the field.
4.4.4 Village studies
The bulk of material from the detailed farming system surveys and fieldwork was carried out within
the framework of the village community. Thus most of the strongest claims put forth here are based
on a village centred view. The village perspective is important, as it is the major geographical form in
which individuals and other culturally significant social units interact and overlap in Tonga. As Evans
(1996) pOinted out, it is a particularly intense locus of interaction for all persons if for no other reason
than the reciprocity, co-operation, and competition present within the village in the course of daily
life. Within the village, people are interrelated through kinship and church membership.
No attempt was made to draw a random sample of households over the whole of Tonga; instead a
small number of villages was selected and a sample of households in each was studied. Due to the
limited time and resources available for fieldwork, it was decided to concentrate on the island groups of
Tongatapu, Ha'apai and Vava'u. Geographically, these islands also make up the three main regions of
Tonga. These three regions account for approximately 80 percent of the total land area and contained,
in 1996, over 90 percent of the total population. The study compares the three major regions, which
were selected because of the markedly different levels of market incentives. Each provides an
independent case study of economic behaviour concerning land use decisions in semi-subsistence
village communities.
The main problem in adopting a village level approach is the choice of villages for study. In general,
the villages chosen were selected for their potential to illustrate the complex relationships that
determine household land use decision making within a village situation. The aim was not to choose
villages simply to represent typical conditions, but rather the range of conditions, therefore the data
obtained would not be expected to be used to calculate conclusive values for Tonga as a whole,
though they would provide reasonable guidance.
Furthermore, the villages used were selected to constitute a set of benchmark villages reflecting
major characteristics of interest in terms of agro-climatic (soil type, climate, etc.) and socio-
economic (farm size, infrastructure, etc.) attributes. In undertaking the research, two main criteria
were employed in the selection of surveyed villages. Firstly, the two villages from each sub-region
should be representative of other villages in the same general location. The second criteria was that
52
the two villages from each region should be a 'noble estate' and a "government estate" village. The
six villages selected from the list of villages (given in Appendix 2) were:
Village 1: Navutoka, T ongatapu
Navutoka village is situated on the north coast of the main island T ongatapu and in the Lapaha
district. Navutoka is one of the King's Estate villages, and faces an extensive fishing ground. It is
about 27km from the capital, Nuku'alofa. The 1996 population census showed that it had a total
population of 812, almost equally male and female, in 134 households. The 1993 Land Use and
Crop survey recorded a total number of 62 farmers and a cropped area of about 77 ha out of a total
land area of 206 hectares.
Village 2: Masilamea, T ongatapu
Masilamea village is a Government Estate, situated on the western district of Tongatapu. It is
connected to Nuku'alofa by 15km of sealed road. Masilamea is a relatively small village in
Tongatapu with only 36 households and a total population of 276 people in 1996. The 1993 Land
Use and Crop survey recorded a total number of 20 farmers and a cropped area of about 50 hectares.
This represents 68 percent of the total arable land area available to this village.
Village 3: Ha'ano, Ha'apai
Ha'ano village is one of four villages on Ha'ano Island in Ha'apai. It is located on a noble's estate. The
1996 population census recorded a total village population of 126 in 34 households. In the 1993 Land
Use and Crop survey, there was a total of 42 farmers with 30 hectares under crop, which was 47
percent of total land area that the villagers have.
Village 4: Koulo, Ha'apai
Koulo village is a government estate and one of the four villages on the main island Pangai. The 1996
population census recorded a total village population of 275 in 45 households. The 1993 Land Use and
Crop survey recorded a total number of 29 farmers, cropping about 25 hectares, which is about 37
percent of arable land available to this village.
Village 5: Tefisi, Vava'u
Tefisi village, a noble estate, is situated on the Westem district of Vava'u island. It is about 10 km from
the capital Neiafu. In 1996 there were 100 households and a total population of 628 people. In 1993, 83
households grew a total cropped area of 185 hectares. This corresponds to 72 percent of the total
arable land area available to this village.
Village 6: Feletoa, Vava'u.
Feletoa village is one of the four villages in the Leimatu'a district of Vava'u and is located on a
Government Estate. It is about 8 km from the capital Neiafu. In 1996 there were 58 households and a
53
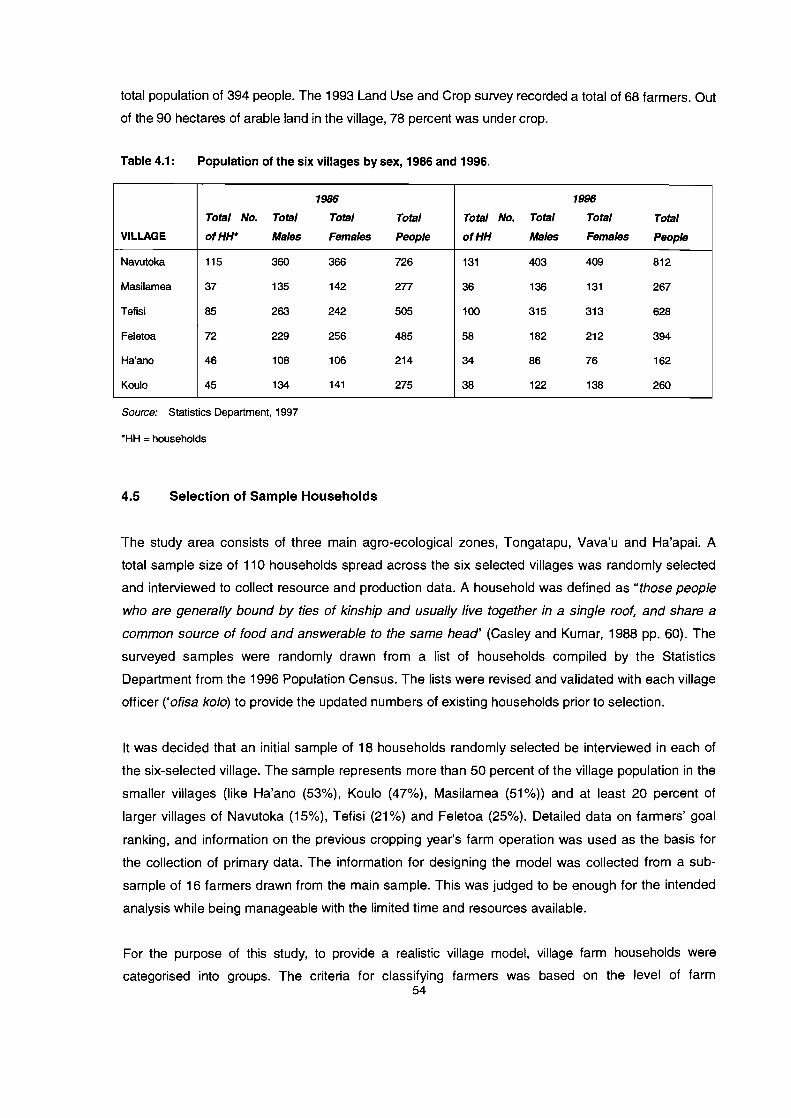
total population of 394 people. The 1993 Land Use and Crop survey recorded a total of 68 farmers. Out
of the 90 hectares of arable land in the village, 78 percent was under crop.
Table 4.1: Population of the six villages by sex, 1986 and 1996.
1986 1996
Total No. Total Total Total Total No. Total Total Total VILLAGE ofHW Males Females People ofHH Males Females People
Navutoka 115 360 366 726 131 403 409 812
Masilamea 37 135 142 277 36 136 131 267
Tefisi 85 263 242 505 100 315 313 628
Feletoa 72 229 256 485 58 182 212 394
Ha'ano 46 108 106 214 34 86 76 162
Koulo 45 134 141 275 38 122 138 260
Source: Statistics Department, 1997
*HH = households
4.5 Selection of Sample Households
The study area consists of three main agro-ecological zones, Tongatapu, Vava'u and Ha'apai. A
total sample size of 110 households spread across the six selected villages was randomly selected
and interviewed to collect resource and production data. A household was defined as "those people
who are generally bound by ties of kinship and usually live together in a single roof, and share a common source of food and answerable to the same head' (Casley and Kumar, 1988 pp. 60). The
surveyed samples were randomly drawn from a list of households compiled by the Statistics
Department from the 1996 Population Census. The lists were revised and validated with each village
officer ('ofisa kola) to provide the updated numbers of existing households prior to selection.
It was decided that an initial sample of 18 households randomly selected be interviewed in each of
the six-selected village. The sample represents more than 50 percent of the village population in the
smaller villages (like Ha'ano (53%), Koulo (47%), Masilamea (51%)) and at least 20 percent of
larger villages of Navutoka (15%), Tefisi (21 %) and Feletoa (25%). Detailed data on farmers' goal
ranking, and information on the previous cropping year's farm operation was used as the basis for
the collection of primary data. The information for designing the model was collected from a sub-
sample of 16 farmers drawn from the main sample. This was judged to be enough for the intended
analysis while being manageable with the limited time and resources available.
For the purpose of this study, to provide a realistic village model, village farm households were
categorised into groups. The criteria for classifying farmers was based on the level of farm 54
management practices; hectarege and variety of crops grown; farm income level; and. the degree of
farm commercialisation. These are all related factors. The degree of commercialisation is reflected in
the significance of monetary circulation in the household operation. Using the household data collected
from the survey and the criteria described, the median farm of each group was chosen as being
representative resulting in representative farms of the following smallholder farmer groups. These
are:
(i) Marginal or subsistence- oriented farmer Marginal farmers comprised about 38 percent of
sampled households with a total cropped area of less than one hectare per year. Marginal
farmer households are poor. with an average agricultural earning of less than T$2000 per
year. They commonly supplement their income through remittances from family members
residing overseas and non-agricultural employment of household members.
Oi) Emergent or semi-subsistence farmer - Emergent farmers constitute a majority (53 percent)
of the surveyed households. Emergent farmers are referred as those generating an average
farm income ranging from T$2,500 to around T$6,000 a year. They tend to farm 1 to 2
hectares.
(iii) Progressive or commercialised farmer: Progressive farmers depend largely on farming
activities for their livelihood. Compared to emergent and marginal farmers, progressive
farmers operate on larger scale and generally farm more land. Constituting about 9 percent of
the surveyed sample. their agriculturally derived income averages more than T$10,000 per
annum.
The degree of representativeness of these median farms was tested by comparing the farm plans data
of each selected farm to the average of the corresponding farm groups. Village agricultural production
patterns are an aggregation of these three main groups. The detailed data collected from these
representative farms allowed models to be developed for each particular farmer group to reflect the
behaviour of each reference farm type.
4.6 Conclusions
This chapter provides an outline of the field research design and the analytical techniques used to
assess the data. Part 2 of the study contains the information collected and its analysis. Thus, the
next four chapters contain details of the organisation of agriculture in Tonga, farm household goals
and objectives, current resource capacity and production. and the socio-cultural environment where
smallholder farmers operate.
55

PART 2: SYSTEM ANALYSIS
This is the initial analytical stage of the modelling process. The system is studied to determine the
nature and behaviour of its components and sUb-systems including the interaction between the
components. A literature review, data analysis and subjective observation and assessment are all
presented and included in this analysis of the farm household, of the institutional and economic
environment, and of the socio-cultural environment facing smallholder farmers in Tonga.
CHAPTER 5
ORGANISATION OF TONGAN AGRICULTURE
5.1 Introduction
Agricultural development, in the context of this study, is the improvement in the way farmers and
people utilise their land for crops and livestock production so as to improve their living standards.
Developing countries seek to improve the performance of the agricultural sector as a means of
promoting their overall economic and social development. The causes of poor performance of the
agricultural sector are complex. In general, five conditions are essential for satisfactory
development progress in the agriculture sector: (a) adequate resources, both physical (land, labour,
good weather) and financial; (b) new technology to improve productivity; (c) suitable institutional
supports (for research, extension, marketing, credit etc.); (d) appropriate policies, both in the
economy as a whole and in the agriculture sector. including marketing systems. in particular; and
(d) suitably trained and skilled farm managers. A government can not control all aspects of the
agricultural environment that are ideal for development. However, it can have a significant influence
on agricultural development through development policies and programs, and the provision of
financial and other supporting services.
In this chapter, a review and analysis of the organisation of agriculture in Tonga is presented. The
development of the agricultural sector is examined with an emphasis on the economic and
institutional environment in which smallholder farmers operate. A detailed discussion on how
policies and development plans are formulated in Tonga is presented, and on how supporting
services, research and extension, marketing and credits impact. Major problems are also
presented. The key policies described were incorporated into the model application.
56
5.2 Agricultural Policy and Development Planning
Policies to promote development are partly guided by policymakers' conceptions of the behaviour of
people. In agricultural development, a better understanding about farm-level behaviour, therefore, is
a crucial factor in formulating decisions that could affect the welfare of farmers. Agricultural policy is
the specification by government of those laws, regulations and rules under which agriculture and
agribusinesses have to operate (Dillon and Hardaker, 1993). Agricultural policy analysts face a
challenging task of formulating policy measures, within the framework of national economic policy,
which witl elicit desired responses from key components of the agricultural sector, the producers,
consumers and traders. The range of agricultural policies available include those affecting prices,
marketing, input supply, credit, mechanisation, land reform, infrastructure facities, research,
extension, and food security. Instruments are, or should be, chosen on the basis of their expected
contributions to overcoming critical constraints and to attaining stated objectives. Agricultural policy
instruments are often based on adjustments to the production and consumption incentives for rural
households, so the responses of these households to changing external conditions are of
considerable significance.
The basic ingredient of good policymaking in agricultural development planning is being able to
define and classify the development problems that are to be dealt with. Upton and Dixon (1994)
noted the need for sectoral policies to be developed with information on, and an understanding of,
the way in which rural incomes are generated and, even more critically. of the nature of the rural
producers' and consumers' attitudes and responses to constraints, incentives and changes in the
policy environment. The responses do vary between different household categories and can be
strongly influenced by existing local formal and informal institutions. Dillon and Hardaker (1993)
point out an important aspect in policy analysis is the recognition of the differences between farm-
level decision-making and aggregate sector-level decision-making. Often their interests do not
coincide, leading to difficulty in the achievement of desirable results in the economy. At the farm
level, the responsibility for decision making rests on individual farm households, groups or
communities who formulate the goals to be achieved and decide on the technology and input levels
to be used within the limits of their resources and the prevailing policy environment. They are
responsible for making production, consumption, and marketing decisions. Therefore, the
aggregate effects of farmers' responses to agricultural policies can lead to significant changes in the
economic structure of the agricultural sector.
Government agricultural policies have targeted increases in productivity as well as a diversification
of production to improve incomes of rural people. An effort is also being made to promote the use of
more productive farm inputs and techniques. In many countries the infrastructure and institutional
framework is also being improved and planning for the agricultural sector is aimed at identifying the
major constraints on agricultural development. If these government policies are to be effective,
57

target farm groups must be identified and policy tools developed which are specific to the
production possibilities and farm resource bases of the targeted groups.
With reference to Tonga, agricultural development must be viewed in terms of the large proportion
of the population who are smallholder farm families. These people have a close affinity to the land
and agriculture, and their social, cultural and economic attitudes must be taken into account. The
agriculture sector forms a substantial part of the national economy. Development efforts in the
agricultural sector have faced several constraints, such as the small land area, varying degrees of
internal fragmentation, remoteness, small market size, high per capita costs in the provision of basic
physical and socio-economic infrastructures, socio-cultural factors such as land tenure, poverty of
resources, and internal and external communication problems. These problems are widely known
and well documented (Hardaker, 1975; Sevele, 1973; ADB, 1995). The Tongan economy is
inevitably open and vulnerable to both natural disasters and external market shocks. Cyclones and
droughts have more impact in smaller developing countries like Tonga, and the ability of the
agriculture and other production activities to recover are much lower compared to larger and
developed nations. Smallholder producers are price takers and are subject to fluctuations in world
market prices because fewer products dominate the composition of their exports. The
responsiveness of long run growth to export instability is a matter of debate but the limited
production possibilities in small economies reduces their capacity to adjust to external shocks and
thus lowers the profitability of this leading sector.
5.3 The Formulation of Government Policy in Tonga
Tongan society is relatively homogenous, with an elaborate and well-established social system. In
the latter part of the 19th century a Constitutional Monarchy was established, which still dominates
the structure of the socio-political system. The government consists of the Privy Council, the
Legislative Assembly, and the Judiciary. The King has constitutional authority to appoint the Privy
Council, including all cabinet ministers. The Cabinet consists of a speaker and ministers appointed
by the King and the governors of Ha'apai and Vava'u. There are 33 nobles who elect nine
representatives on the Legislative Assembly. The remaining nine members are elected from
members of the general public in a nation-wide poll every three years. Cabinet-level island
development committees have been formed for each island group and, under the direction of these
committees, aid packages providing funding for institutional buildings and infrastructures are
currently being planned for each respective island group. At the district and village levels, there are
elected officers. They serve as a link between the government and the people, passing on
government directives, making representations to government on behalf of their communities, and
handling official duties. Regular village meetings (fono) are held to discuss community and village
issues.
58
The Central Planning Department (CPD) has overall responsibility for co-ordinating the preparation
of development plans, in consultation with relevant ministries. CPD also undertakes negotiations
with funding sources, prepares project dossiers and monitors their implementation. The Ministry of
Agriculture and Forestry (MAF) is responsible for the implementation of Government policy through
most aspects of agriculture and forestry, with three exceptions. Land tenure matters are the
responsibility of the Ministry of Lands, Survey, Environment and Natural Resources; market
development of most export crops is the responsibility of Tonga Trade at the Ministry of Labour,
Commerce and Industries; and agricultural credit is largely the responsibility of the Tonga
Development Bank. The detailed descriptions of MAF organisation structure and major responsibilities
are given in Appendix 1.
The complicated nature of agricultural development in Tonga stems from the fact that government, in
an effort to meet the aspirations of its citizens, is compelled to accelerate the pace of agricultural
development. If left to natural evolutionary processes they would take far too long. The Government
policy formulation process is closely tied to the preparation of formal five-year development
planning documents. The recent development objectives and strategies for the economy are outlined
in the sixth development plan known as DPVI, which covers the period 1991-95 (Kingdom of Tonga,
1991). The predominant objective of DPVI is the achievement of sustainable growth conducive to a
higher and more equitable distribution of income.
Project or program proposals from MAF are submitted to the Development Coordination Committee
(DCC) for review prior to being put to Cabinet for approval. Delforce (1990) claimed that given this
apparently rigorous selection procedure, projects that are accepted should have a high chance of
success. Nevertheless, the results of projects implemented are often disappointing. In some cases,
the difficulties stem from a lack of understanding of the objectives of intended beneficiaries, or an
overestimation of their ability to commit resources, such as family labour, to the project.
Previous studies (Hardaker, 1975; Delforce, 1990; AGRICO, 1995) noted that despite sporadic
attempts to involve target beneficiaries through regional development workshops, policy formulation
and implementation is still very much a top-down process. In the agricultural sector in particular,
government policies frequently take the form of directives which are relayed, via the ministries
concerned, down to the District and Town Officers, who are expected to see they are acted upon by
their constituents.
In the area of agricultural development planning, there is evidence of a lack of consistency at a
number of levels (Dixon et a/., 1994). At the macro level, the emphasis placed on agriculture, and
the resources allocated to it, tend not to match the stated objective of promoting the development of
the sector. At the level of choice of development programs and projects, there has been confusion
about the merits of promoting the smallholder sector and the priorities that need to be followed in
59

such a promotion. This confusion is reflected in the often diverse opinions encountered among
those supposedly involved with agricultural policy formulation. In many cases, it is not clear where
policy initiatives originate and how they are linked to each other and to the development objectives
set down in planning documents.
Agriculture policy analysis and planning activities in Tonga have been dominated by ad-hoc
activities, such as, for example, sectoral reviews by donors, and routine planning and reporting.
Although the underlying strategies for the agricultural sector are usually prepared within the context
of a five-year plan, they are often strongly modified by changes in bUdget allocations. Ministerial
targets set by the Ministry of Finance fluctuate from year to year, so the budget process is often
confrontational, with each sector striving to maximise its share of the available budget allocations.
The agriculture sector gets limited government support. In 1996, agriculture received only 6 percent of
the total recurrent budget allocation despite the fact that it provided 78 percent of all exports and 53
percent of employment. Unfortunately, the narrow tax base in the rural sector does not assist the
limited government revenue base overall, adding to the problems of the limited capacity and recurrent
expenditure to support agriculture.
5.4 Government Support Programs and Development Initiatives
The agricultural sector in Tonga is facing considerable challenge which may require Government
policies to increase agricultural and forestry production, improve market accessibility and profitability
while maintaining sustainability. self sufficiency and agricultural security (MAF, 1995). This direction is
expressed in the 1997/1998 Budget Statement wh ich contains the recent government policies and
national strategy on agriculture. "MAF's objective is to facilitate the private sector to:
(i) improve agricultural and forestry production by (a) actively promoting research into export potential
crops such as vanilla, squash, spices, papaya, yam beans and coffee; (b) deregulating the quota
system thereby improving the efficiency of resource use through greater competition; and (c)
revitalising copra exports, which will greatly benefit outer island farmers.
(ii) diversify the agricultural sector through (a) introduction of new crop varieties such as coffee, aloe
vera, rock melons, chilli, peppers and papaya, and (b) development of the organic market.
(iii) improve market opportunities by (a) developing quarantine protocols; (b) exploiting traditional
systems of organic horticulture; (c) seeking innovative ploys and niches for products; and (d) using the
high temperature forced air treatment facility which provides the opportunity to open overseas markets
for Tongan fruits and vegetables previously not considered because of fruit fly and restrictions on
ethylene dibromide residues' (Ministry of Finance, 1998).
60
Over the last 20 years the Government has encouraged entrepreneurial development either directly
or indirectly through a number of initiatives. These have included (1) improved credit facilities
through the establishment of the Tonga Development Bank (2) establishment of the small industries
centre for agro-processing activities, (3) the provision of business incentives under the Industrial
Development Incentives Act (1978) which gives tax exemptions on exports, imports and income (4)
regulation of export licenses (exporters must be licensed by the Ministry of Labour, Commerce and
Industries) (5) and improvements to the infrastructure such as roads, wharves, water supply and
improved access to market information and research. The perceptions of the people on these
initiatives revealed in the survey varied among the different region and the different farm types.
These are discussed at more depth later in this chapter and chapter 6.
Recently, the Government has followed a policy of promoting the expansion of the agriculture
sector both for domestic and export production through an export diversification program. The aim
was to encourage farmers to increase production and productivity in order to improve the nationai
trade balance. Development efforts have been aided by a variety of different schemes in the form of
development projects from various donors. Assistance has been provided in a wide range of areas
such as crop development, extension support, finance quality control and marketing (Unisearch Ltd,
1991). All these programs involve some financial assistance and have an influence upon the
financial situation of farms. Contemporary developmental agricultural policies through the Ministry of
Agriculture and Forestry tend to incorporate research and extension education as priority areas, and major strategies for the generation and transfer of improved technologies to smallholder
farmers to enhance productivity. A major change in the form of support was given mostly in the form
of outright grants or subsidies; later on an increased emphasis was put on credit schemes and
institutional support through research and technology development. It is considered that credit
programs lead to a better use of money spent as they usually imply a greater selectivity and require
more economic considerations on behalf of the user. In recent years, the credit schemes have
become more co-ordinated and integrated in view of the long-term adjustment of Tongan agriculture
and strict criteria are applied by TDB in the selection of farms benefiting from the various schemes.
An issue for the sustainability of financing agricultural development is the low level of tax taken in
the agriculture sector. Agriculture producers pay no income tax, there is no sales tax levied on
domestic produce market sales, and agricultural produce exporters can be granted development
status. Government policy instruments of price policy have been used in recent times in Tonga. For
example, input subsidies on banana rehabilitation and coconut replanting schemes. Another
common government action has been to provide subsidies for tractors and agricultural machinery,
which encourages farmers to convert from traditional manual to machine cultivation. MAF operated
a tractor hire service for farmers, which was subsidised to some extent. Some of the respondents
favoured the subsidy and demand continuation. However, the government claimed the lack of fund
61
to support the scheme is the major constraint. Recently, the machinery pool has been reorganised
into full commercialisation and the subsidy abandoned. Other subsidies to the agricultural sector
exist in the form of exemptions from customs and import duties as well as port and service tax.
Some farm machinery, chemicals and seeds are exempt, but other inputs, such as livestock feed
and fishing equipment (boats, engines, freezers), had only partial exemption until recently (Sevele,
1983). The main source of tax revenue from the agricultural sector is the 20 percent Port Services
Tax levied on all imported goods. Import tariffs and licensing gives some protection to local
agriculture. Import duties ranging from 15 to 25 percent are incurred on items, which can be
produced locally, including poultry, pork products, fish, fruit, vegetables and root crops. Importation
of eggs is permitted only by license and only when local supplies fall short of demand.
5.5 Past Development Schemes
On a national basis, agriculture is still perceived as being the major source of future foreign
exchange, with the greatest scope for improvement. Yet experience to date has been very mixed
with regard to agricultural development projects that have targeted export market opportunities. In
order to highlight the behaviour of smallholder farmers, it is useful to review the past performance of
agricultural development projects. While some development programs were successful, including
the squash, kava, and vanilla development programs, a significant proportion of agricultural
development projects have been uniformly unsuccessful in achieving their manifested objectives of
sustained increases in production and productivity. Examples of these commodity based
development schemes are reviewed here.
5.5.1 Banana rehabilitation scheme
The banana industry was a significant export earner in the late 1960s, but has failed to develop in
the long term. New Zealand was closely associated with the development of the banana industry
through an aid scheme designed to re-establish a New Zealand market for Tongan bananas by
improving quality, productivity and consistency of supply. New Zealand funding for the Tonga
Banana Rehabilitation Export scheme, which catered for technical assistance, capital eqUipment,
funds for disease control and a price support system, amounted to over NZ$6 million over the
period from 1983-1988. The objective was to have 810 hectares under production by 1987 with an
average yield of 4 tonnes per ha and a minimum farm size of 0.8 ha. If this target had been
achieved it would have amounted to about 40 percent of the New Zealand market.
Input subsidies were a feature of the New Zealand-financed Export Banana Scheme from its
inception in 1983. Chemical inputs (fertilisers, insecticides and fungicides) and packaging materials
62
(cartons) were provided to participant farmers free of charge or at low prices. These subsidies were
gradually phased out over the life of the project, which concluded in 1988 (Needs, 1988).
A review by Cessford (1989) showed that, while the scheme made a number of achievements in
quality control, post-harvest handling, production, safety, research, commercial attitudes and
financial returns, the project fell well short of its major goals. Cessford attributed the failure of the
scheme to poor productivity (low yields and poor quality), not only from climate effects but also from
poor management. The exceptionally dry (less than two thirds of the long-term average) weather in
1981 to 1987 produced an average yield of 1.5 tonnes per hectare, but when rainfall returned to
normal in 1988 the yield doubled. Several tropical cyclones during the project period also
devastated most plantations and had a major impact. For instance, in 1989 banana exports
dropped significantly from 1316 in 1988 to 445 tonnes in 1989. Exports of banana to New Zealand
peaked in 1986 with T$1.5 million and drastically dropped to T$0.2 million dollars in 1989. By 1991,
exports of banana to New Zealand ceased. The New Zealand market had opted for different
suppliers, as Tonga could not achieved the quantity and the quality required. In addition, the
outbreak of black leaf disease intensified the problem.
Needs (1988) has claimed that the project had the effect of increasing economic inequality among
farmers in Tonga, and the poorest farmers had the least benefits. T~e scheme involved about 250
growers and about 462 hectares of land. Twenty growers owned about 32 percent of the land in the
scheme, while 70 percent of the growers had an average of one hectare accounting to 35.6 percent
of the land. The large growers were almost all involved in other ventures besides banana growing
and had the money to increase their landholdings. Many of those in the upper socio-economic level
had acquired the land specifically to participate in the banana scheme. The lower socio-economic
group, who depended on banana production for most or all of their cash income, were relatively
disadvantaged in their access to the scheme.
5.5.2 Coconut replanting scheme
The Coconut Replanting Scheme was financed with British aid and commenced operations in 1967
with the objective of rejuvenating the coconut industry. The scheme involved direct input subsidies
to encourage the replanting of coconuts. In this case, growers received a cash grant (T$4 per ha)
towards clearing and establishment costs, and seedlings were distributed free of charge. The
operation of the scheme was structured around the selection of seed nuts from selected mother
palms and propagated in nurseries. The resulting seedlings, after further selection for vigour, were
supplied to growers for replanting. Employees of the scheme did part of the land preparation and
planting or else subsidies were paid to growers who did the work themselves. A further subsidy was
introduced in 1975 to encourage farmers to maintain their trees.
63
During the 1970s coconut products represented over 70 percent of the exports. The drop in the world
market prices of coconut products from an average of T$$500/MT to a low of T$200/MT had a major
impact on the coconut industry. The decline in the relative importance of coconut product exports
was particularly severe in 1988-1989. The production of coconut products has declined from about
70 percent of the exports in the 1970s to about 41 percent in the 1985 -1988 and to a low of 1.8% in
1990 to 1993. This substantial decline has not only induced a loss in foreign exchange but also
affected the employment opportunities created through copra processing, oil mill and desiccated
coconut manufacturing. The decline was particularly severe on the outer island economies.
5.5.3 Coffee development project
The Coffee Development Project is an ongoing project supported by French and Australian Aid
Programs. Part of the project proposed to fund the planting and development of 8 hectares of coffee
in Ha'apai in 1993/1995. The coffee seedlings were raised by MAF and made available to growers
at no cost. Farmers' training on the establishment for coffee, management strategies, harvesting and
post-harvest operations were conducted by extension officers and research specialists from
Tongatapu.
A survey indicated that the project was not successful due to a low adoption rate with only 25 farmers
growing coffee. This corresponds to a total area of 2.4 hectares, which represents 30 percent of the
target area to be planted (MAF, 1997). The MAF officer in charge in Ha'apai reported that more than
20,000 coffee seedlings were left in the MAF nursery and thus were a waste of project resources.
According to the officer, "the main problems for developing coffee in Ha'apai, according to some
respondents, was the unreliability of the market and the technology - referring to the discrepancy of
yields of coffee in Ha'apai compared to that of Vaini experimental fami' (,Anitoni, pers comm. 1998).
5.5.4 Livestock development programs
The livestock industry has developed around the household production of mostly pigs and poultry
for social obligations and household consumption. The Tongan government has attempted to
initiate and accelerate the process of commercialisation of the livestock industry, mainly for cattle,
dairy, pigs and poultry farming to reduce the high importation of mutton, poultry and livestock
products. The livestock development schemes involved subsidised capital inputs for construction of
pigpens, fenced grazing, troughs for food and water, and the acquisition of stock. Nevertheless,
unforeseen problems occurred. The large scale of government plans and policies, which had been
drawn up with the assistance of Western experts, failed to correspond to the small scale of
traditional Tongan smallholder livestock husbandry.
64

Reviews of livestock development projects, according to the Head of the MAF Livestock Division,
showed the failure to achieve their respective projected outputs. For example, of the 83 farm
households involved in a pig development project in 1972, less than 5 percent were successful.
Project reviews noted a majority of smallholders did not see much point in fencing pigs if this meant
that they were obliged to feed them and clean their accommodation every day. The pink pigs
(improved breed) imported from New Zealand, which were larger than the beige, brown and black
Tongan pigs, were so seriously affected by sunburn (due to their lack of pigment) that they had to
be slaughtered prematurely. Similar results were found in a beef cattle development project in 1982
with a 10 percent success rate. Improved breed stocks were imported from New Zealand for
multiplication and distribution to smallholder farmers. The project struggled to achieve its objectives
due to the high cost of purchasing animals.
An official, when asked about the reasons for high failure rate, commented: "There are a number of
reasons for these failures. Tongans keep cattle and pigs for social motives, to meet social
obligations to church and family, and for home consumption. As far as the pig project is concerned,
a household would begin with two sows, say, but that was far too few; it was only enough to meet
their obligations. Perhaps they would manage to sell them if they had ten sows' (Fifita, pers comm.
1998).
The development of the poultry industry has seen the collapse of broiler production due to the local
industry's inability to compete with cheaper overseas imports. Thirty households were involved in
the poultry development project in 1974; only 10 percent were successful. The high cost of imported
feed was the major constraint, and made it impossible for them to sell at the price of imported
poultry meat and eggs.
5.5.5 Vanilla development project
Overall, it is hard to point to many concrete examples of success among the agricultural development
schemes introduced so far. This is not to disparage the efforts that have been made, but rather to
emphaSise the difficulties inevitably encountered in the attempts to transform agriculture from a
traditional, mainly subsistence oriented system, into a more market-oriented industry (Hardaker,
1975). However, some projects have been successful such as the vanilla, squash and kava
development programs. These commodities continue to be the most important cash crops and major
contributors to export earnings.
Vanilla has been successfully introduced and commercially established in Vava'u under past FAa,
ADB and French assistance starting in 1955. Project support was in the form of technical assistance,
research and extension activities, setting up of processing and curing units, and the provision of
planting materials. According to Hardaker (1975) the development of the vanilla industry was slow; it
65

was not until 1966 that any significant quantity of cured vanilla beans was successfully produced. In
1970, there were 723 growers in Vava'u with a total of over 80 hectares of vanilla producing about 2
tons of cured beans. Vanilla production has increased consistently since, 9 tonnes were produced in
1977, and in 1991 the export level reached a high of about 70 tonnes and with a total earning of
T$5.5million.
In 1993, the total area under vanilla was 804 hectares of which about 78 percent was in Vava'u and
18 percent in Tongatapu (MAF, 1994a). The average production has been about 110 tons of green
vanilla, or 22 tons of cured vanilla, in the last five years. Due to poor management, actual yields
averaged around 178 kilograms of green vanilla per hectare per year vis-a-vis yields of about 615 kg
per hectare under good management. Fa'anunu (1985) indicated that an average yield of 1400
kilograms of green beans per hectare is potentially attainable under progressive management.
However due to the lack of research and poor extension support, MAF input has slowed and
contributed to lower yields and post-harvest problems (immature harvesting and poor curing). The
relative profitability of vanilla seemed to decline in recent years. Vanilla exports continued to be
Tonga's second major export commodity, contributing about 16 percent of the total agricultural export
earnings over 1991-1996. The relative stability in the world prices of vanilla has maintained real
producer prices sufficiently to stimulate the expansion of farmers' plantations. The performance of
the vanilla industry is discussed in depth later in this chapter.
5.5.6 Squash development project
As noted in Chapter 3, the most Significant structural change during the last ten years has been the
development of the Squash Export Industry in place of banana and copra, which had been
dominant in the 70's and early 80's as the country's main export commodities. The squash industry
was initiated by private sector interests and has developed with little government intervention
compared to other development schemes. The squash export industry was established in 1987
under shipping and marketing arrangements with Group Trade Ltd of New Zealand. Local growers
were then organised into the Tongan G rowers Association and in 1989 took over the marketing role
of squash from the New Zealand company.
The squash development programme, in support of the private sector initiative and aided by the
New Zealand Assistance programme, focussed on technical assistance, infrastructure facilities,
training programmes on production and post-harvest handling. The Tongan Government also
assisted in setting up credit facilities through the TDB to assist the development of the Industry. The
major contributions by MAF have been through research and extension for improved technologies
and the dissemination of information to growers. The Quarantine division of MAF also handles
quality control and the management of export produce.
66
The development of the industry has been dramatic (discussed in depth later in this Chapter) and
farmers have responded in large numbers. This is reflected in significant increases in the area
cultivated under squash and the number of farmers involved. For instance, a fourfold increase
occurred in the area cultivated (from 80 to 320 ha) and farmers involved (40 to 164) in 1987 to 1989
respectively. The Land Use crop survey in 1993 showed the total area cultivated under squash was
about 2115 hectares and the number of growers was estimated to be about 1050 (MAF, 1994b).
5.5.7 Kava development project
The kava development program was initiated under Australian aid (ACIAR). Project support in the
form of technical assistance, and research and extension activities with an emphasis on the kava die
back disease control, which had hampered the industry in the late 1980s. The project involved setting
up a tissue culture laboratory unit at the MAF Research Station for the propagation and provision of
disease free planting material. In 1993, the total area under kava was only 250 hectares of which
about 70 percent is grown in Vava'u and 18 percent in Tongatapu. The performance of kava in the
Tongan economy is outlined later in this chapter.
5.6 Agricultural Marketing
One of the most important supporting services that has a direct impact on land use decisions relates
to the marketing of agricultural produce. This section provides an overview of the existing market
environment, specifically the domestic market and the access to export markets, marketing
organisations and farmers' access to market information.
5.6.1 Domestic marketing
Marketing of agricultural products in rural villages normally begins at the level of the individual
smallholder. The marketing of local produce, food and materials, remains largely in private hands
under the supervision of the Ministry of Agriculture and Forestry as specified in the Market's Act,
1975. The Government established produce markets in the main islands, and these are managed
and controlled by a separate Market Authority for each island group. Each market (except Ha'apai)
is administered by a market manager and supporting staff. They are responsible for collecting rent
from the stalls and butcheries, collecting marketing data (eg. volume of produce sold through the
market, prices received) and overall maintenance of the market place. Private individuals hire stalls
and floor space in these markets with the cost ranging from T$1.00/day for open stalls and
T$2.00/day for lockup stalls.
67

The primary local outlet for root crops and fresh produce in Vava'u is the Sailoame Market. Situated in
the capital town of Neiafu, the market serves as the centre for market exchange among the growers,
retailers, traders and consumers. According to some respondents, the Sailoame Market is presumed
to have reached its saturation point, given the low rate of population increase in Vava'u and Neiafu,
and the slow build-up of tourist arrivals. The existing market site is too small in physical area
(approximately 800 square meters). Over the last ten years, there have not been dramatic changes in
the volume and type of commodities traded. However, some congestion was noted on Saturday
mornings when market transactions between the sellers and buyers are at its peak. A new market site
has been identified, and currently under construction. In contrast, the Ha'apai market is held on an
area of open ground in front of the MAF head office in Pangai. The poor market infrastructure was one
of the major constraints according to the majority of village respondents in the two Ha'apai villages.
The lack of a permanent structure restricted sellers in the quantity they sell and some of the sellers
interviewed stated that a permanent structure would allow them to increase their sales by giving them
more flexibility over what they could sell and time to sell them.
Talamahu market in Tongatapu is the largest domestic market in the Kingdom. Construction of the
new market was completed in 1995. The market is a valuable source of cash for rural people as
well as being an important food source for the increasing urban population of Nuku'alofa. Talamahu
also provides an outlet for perishable and other commodities that are not allowed to be exported
(such as tropical fruits mangoes, etc). Table 5.1 summarises the average quantity and prices for the
major agricultural commodities supplied in 1990 to 1996. Trading is heaviest on Saturdays with
most of the vendors or buyers only attending once a week. The sale of Tongan handicrafts is also a
significant source of domestic cash income. Handicraft items are sold at Talamahu Market, and also
through co-operatives like FIMCO, Langafonua, and in special stalls on Government grounds when
cruise ships are in port, and at specific tourist resort locations.
The study found that a majority of the households surveyed in Vava'u and Ha'apai sell their produce
at their local market. However, despite the small-size and congested nature of the local market only
a few farmers, 7 and 12 percent in Vava'u and Ha'apai respectively, shipped some of their market-
directed surpluses to the national market in Tongatapu. This is confirmed by information from the
Market officials in Tongatapu which revealed that almost 80 per cent of national market (Talamahu)
sellers are from Tongatapu, 16 percent from 'Eua and less than 5 percent of the market sellers are
from Vava'u and Ha'apai Islands. The study showed that produce shipped from Vava'u and Ha'apai
were mainly high valued products such as yams, giant taro, kava, handicrafts, mats, processed
pandanus, and paper mulberry. Respondents expressed concern about the risks associated with
high freight and handling costs, and the strong competition with farmers in Tongatapu and 'Eua
giving them lower profit margins.
68
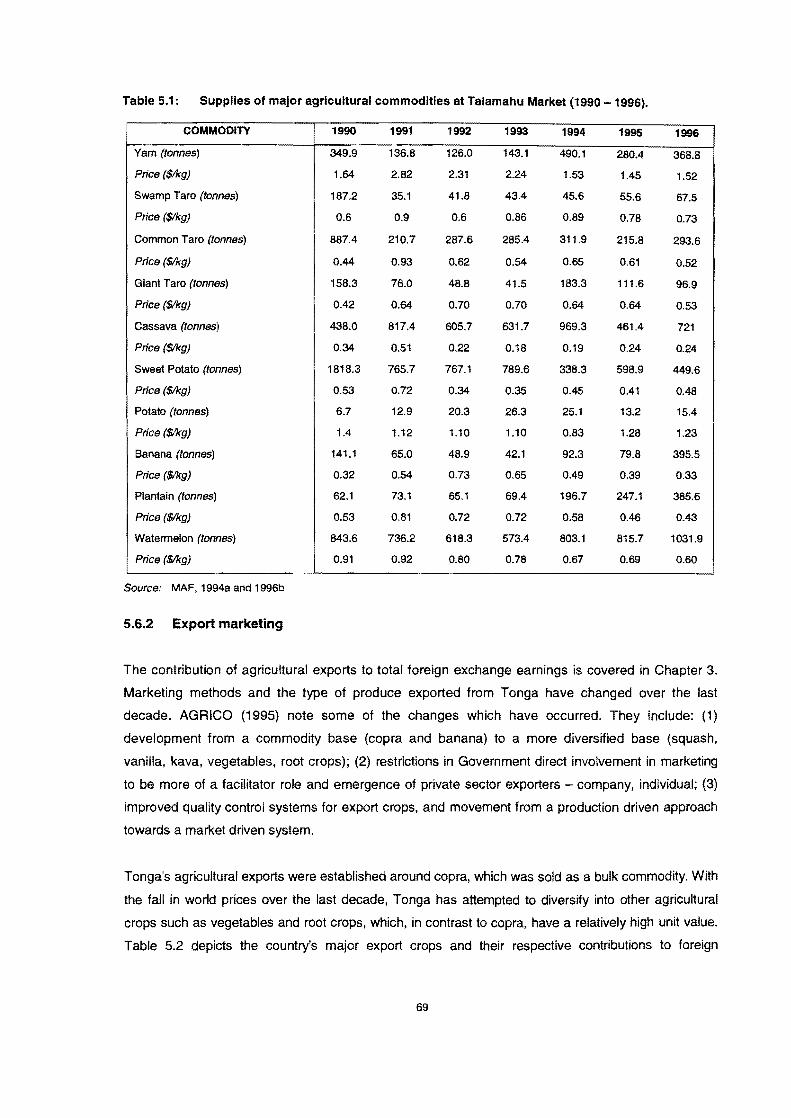
Table 5.1: Supplies of major agricultural commodities at Talamahu Market (1990 -1996).
COMMODITY 1990 1991 1992 1993 1994 1995 1996
Yam (tonnes) 349.9 136.8 126.0 143.1 490.1 280.4 368.8
Price ($/kg) 1.64 2.82 2.31 2.24 1.53 1.45 1.52
Swamp Taro (tonnes) 187.2 35.1 41.8 43.4 45.6 55.6 67.5
Price ($Ikg) 0.6 0.9 0.6 0.86 0.89 0.78 0.73
Common Taro (tonnes) 887.4 210.7 287.6 285.4 311.9 215.8 293.6
Price ($/kg) 0.44 0.93 0.62 0.54 0.65 0.61 0.52
Giant Taro (tonnes) 158.3 76.0 48.8 41.5 183.3 111.6 96.9
Price ($/kg) 0.42 0.64 0.70 0.70 0.64 0.64 0.53
Cassava (tonnes) 438.0 817.4 605.7 631.7 969.3 461.4 721
Price ($/kg) 0.34 0.51 0.22 0.18 0.19 0.24 0.24
Sweet Potato (tonnes) 1818.3 765.7 767.1 789.6 338.3 598.9 449.6
Price ($Ikg) 0.53 0.72 0.34 0.35 0.45 0.41 0.48
Potato (tonnes) 6.7 12.9 20.3 26.3 25.1 13.2 15.4
Price ($/kg) 1.4 1.12 1.10 1.10 0.83 1.28 1.23
Banana (tonnes) 141.1 65.0 48.9 42.1 92.3 79.8 395.5
Price ($/kg) 0.32 0.54 0.73 0.65 0.49 0.39 0.33
Plantain (tonnes) 62.1 73.1 65.1 69.4 196.7 247.1 385.6
Price ($Ikg) 0.53 0.81 0.72 0.72 0.58 0.46 0.43
Watennelon (tonnes) 843.6 736.2 618.3 573.4 803.1 815.7 1031.9
Price ($Ikg) 0.91 0.92 0.80 0.78 0.67 0.69 0.60
Source: MAF. 1994a and 1996b
5.6.2 Export marketing
The contribution of agricultural exports to total foreign exchange earnings is covered in Chapter 3.
Marketing methods and the type of produce exported from Tonga have changed over the last
decade. AGRICO (1995) note some of the changes which have occurred. They include: (1)
development from a commodity base (copra and banana) to a more diversified base (squash.
vanilla. kava. vegetables, root crops); (2) restrictions in Government direct involvement in marketing
to be more of a facilitator role and emergence of private sector exporters - company, individual; (3)
improved quality control systems for export crops, and movement from a production driven approach
towards a market driven system.
Tonga's agricultural exports were established around copra, which was sold as a bulk commodity. With
the fall in world prices over the last decade, Tonga has attempted to diversify into other agricultural
crops such as vegetables and root crops, which, in contrast to copra, have a relatively high unit value.
Table 5.2 depicts the country's major export crops and their respective contributions to foreign
69

exchange over the period 1991 to 1996. The major agricultural export commodities ir
vanilla, kava, root crops and watermelon.
5.6.2.1 Squash
The most significant structural change during the last ten years has been the development of the
Squash Export Industry, which has contributed significantly to economic growth. Trade figures show
significant decreases, or eventual disappearance, in just about all the traditional exports, such as
banana and copra, which had been dominant in the 70's and early 80's, (World Bank, 1993). These
have been replaced by squash as the main export commodity. The industry was established as a
result of the efforts of New Zealand entrepreneurs who identified a seasonal gap in the Japanese
market. At that time Tongan farmers were also under great pressure following the collapse of copra
prices and disease problems with bananas.
Table 5.2 shows the performance of the squash industry and its significant impact on foreign
exchange. The squash export industry was established in 1987 and during the last 6 years the total
export earnings from squash has amounted to a total of about T$60 million, which is equivalent to
about 63 percent of the agricultural exports and at least 45 percent of the overall export value.
Table 5.2: Major agricultural export crop earnings (1991 -1996). (in T$million)
1991 1992 1993 1994 1995 1996 Total % of Total
Squash 11.16 7.32 17.56 11.38 5.88 5.44 58.74 63.4%
Vanilla 5.48 1.51 3.17 1.55 2.44 0.87 15.02 16.2%
Yams 0.29 0.05 0.07 0.21 0.74 0.5 1.86 2.0%
Giant Taro 0.06 0.02 0.04 0.03 0.07 0.07 0.29 0.3%
Cassava 0.4 0.64 1.06 0.52 0.2 0.37 3.19 3.4%
Swamp taro 0.25 0.03 0.05 0.12 0.05 0.05 0.55 0.6%
Common taro 0.3 0.05 0.08 0.Q7 0.79 0.15 1.44 1.6%
Watennelon 0.18 0.13 0.12 0.08 0.19 0.13 0.83 0.9%
Kava 0.02 0.04 0.01 0.08 0.41 2.15 2.71 2.9%
. Coconut 0.68 1.05 0.33 0.14 0.16 0.24 2.6 2.8%
Total Agr. EXp. 19.53 11.35 22.93 15.53 12.19 11.16 92.69
Source: MAF,1996a
Despite being a successful industry, performance over the years has been characterised by
inconsistencies in production and market returns as depicted in Figure 5.2. In 1991 production of
more than 18,500 tons was exported to Japan. This exceeded market quotas and a large proportion
of the shipment had to be dumped, but despite a drop in market price it still managed to yield an
export FOB value of T$12.4 million which represented 50 percent of the country's total export
earnings for the year. After an oversupply in 1991, the Tongan Government immediately took
70
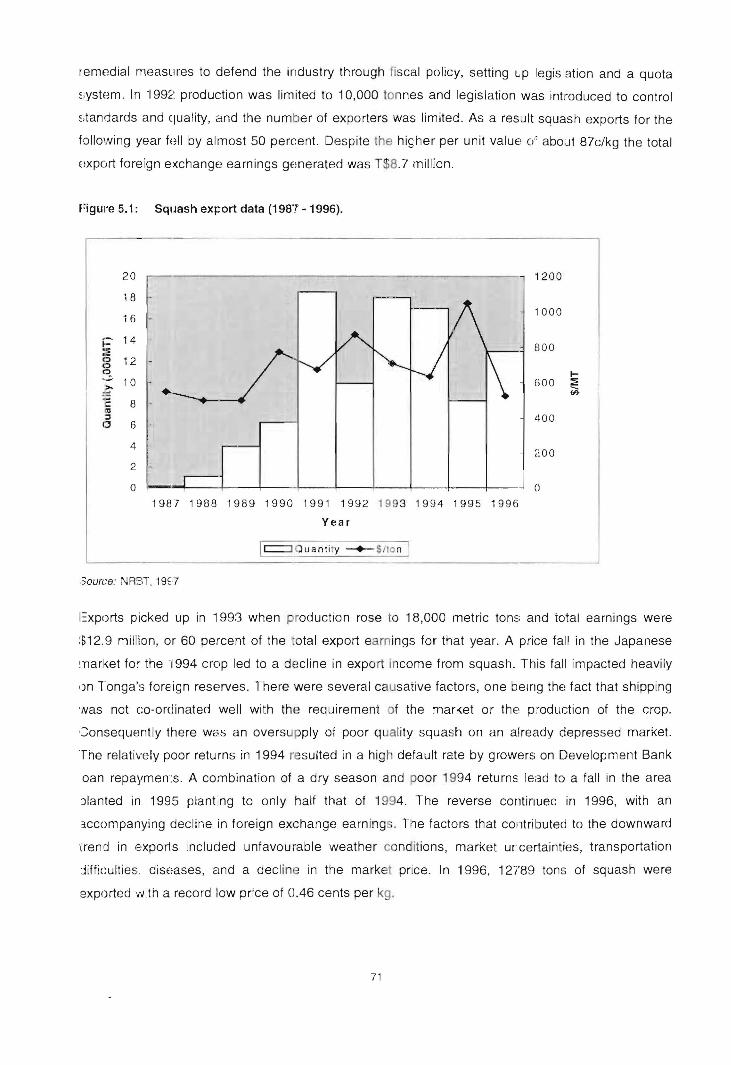
remedial measures to defend the industry through fiscal policy, setting Lp legislation and a quota
~ ; ystem. In '199£: production was limited to 10,000 tonnes and legislation was introduced to control
~ ;tandards and quality, and the number of exporters was limited. As a result squash exports for the
following year f(~11 by almost 50 percent. Despite the higher per unit valuE' 0'" about 87c/kg the total
EJXport foreign el(change earnings generated was T$8.7 million.
Figure 5.1: Squash export data (198" - 1996).
,---------------------------------------------------------------,
20 1200
18
i 6 -1000
.=-14
:lE
.-.-J (j 12 (j (j-
>- 10 -:,:; 8 t:
800
I-- 600 ::i:
~
til :J
cJ 6 - 400
;~oo
0
1987 1988 1989 1990 1991 1992 199 3 1994 1995 1996
Year
I~ uanti ty -+- $lto n I
.::;ource: NRBT, 1%7
I=xports picked up in 199:3 when production rose to 18,000 metric tom; and total earnings were
:&12.9 million, or 60 percent of the otal export earn ings for that year. A price fall in the Japanese
market for the -1994 crop led to a decline in export income from squash. This fall impacted heavily
I)n Tonga's foreign reserves. There were several causative factors, one being the fact that shipping
'Nas not co-ordinated well with the requirement of the 11arket or thE: pmduction of the crop.
'~onsequently there was an overs pply of poor quality squash on an already depressed market.
The relatively poor returns in 1994 resulted in a high default rate by growers on Development Bank
oan repaymen:s. A combination of a dry season and poor 1994 returnf: lead to a fall in the area
Jlanted in 1995 plant jng to only half that of 1994. The reverse continued in 1996, with an
'lccompanying decline in foreign exchange earning . The factors that contributed to the downward
trend in exports included unfavourable weather condit ions, market ur:certainties, transportation
::lifficulties. disE!ases, and a decl ine in the market price. In 1996, 121'89 tons of squash were
exportedvlJ_th a record ~ow price of 0.46 cents per kg.
71
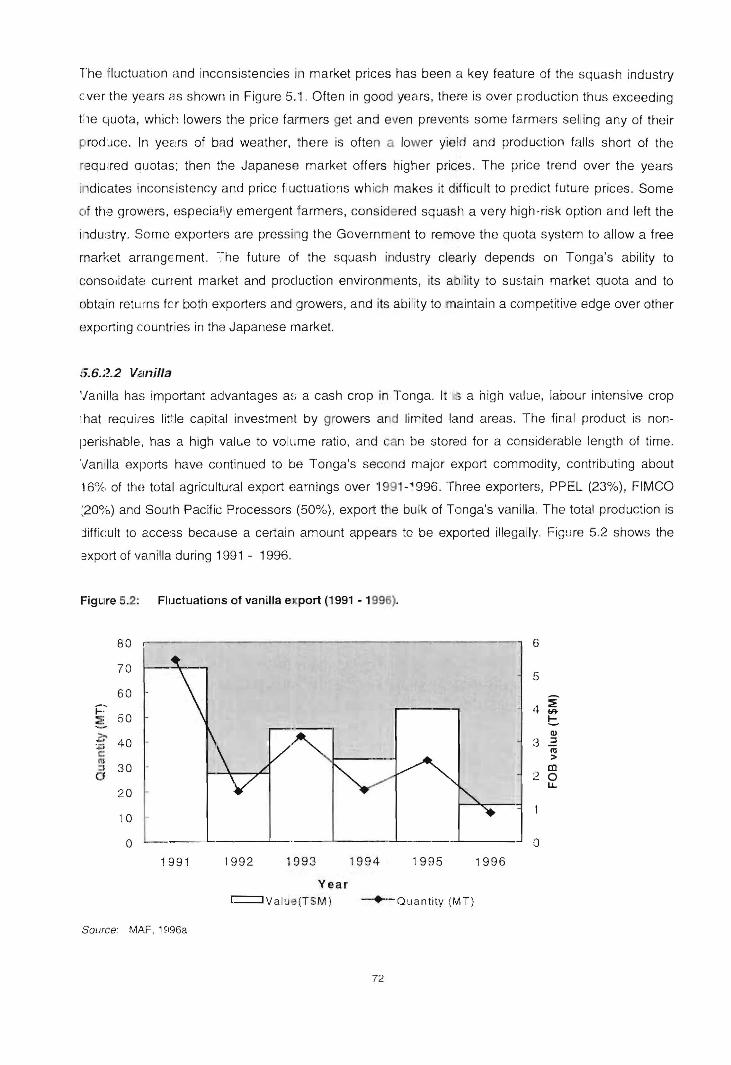
The fluctuation and inconsistencies in market prices has been a key feature of the squash industry
ever the years as shown in Figure 5 .-1. Often in good years, there is over r:;roduction thus exceeding
t:le quota, which lowers the price farmers get and even prevents some farmers selling any of their
prodJce. In yeE!rs of bad weather, 'here is often a lower yield and production falls short of the
requ ired auotas; then the Japanese market offers higher prices . The price trend over the years
indicates incon~ istency and price fluctuatio~s which makes it difficult to predict future prices . Some
(If the growers, especia~ ly emergent farmers, considered squash a very high-risk option and left the
i ldustry. Some exporters are pressing the Government to remove the quota system to allow a free
rnarket arrangEment. The future of the squash industry clearly depends on Tonga's ability to
consolidate current market and production environments, its ability to su~; tain market quota and to
obtain returns fer both exporters and growers, and its ability to maintain a competitive edge over other
exporting countries in the Japanese market.
5.6.2.2 Vanilla
'janilla has important advantages a~; a cash crop in Tonga. It .s a high value, iaoour iniensive crop
lhat requ ires lit'le capital investment by growers a d limited land areas. The final product is non
perishable. has a high value to volume ratio, ancl can be stored for a considerable length of time .
'vanilia exports have continued to be Tonga's second major export commodity, contributing about
16% of thn total agricu ltural export earnings over 1991-~ 996. Three exporters, PPEL (23%) , FIMCO
:20%) and South Pacific Processors (50%), export the bulk of Tonga's vanilla. The total production is
jiffic:ult to acce3S because a certain amount appears to be exported illegally. Figure 5.2 shows the
2xPOrt of vanilla during 1991 - 1996.
Figl.:lre 5.2: Fluctuations of vanilla export (1991 - 1996).
80 G
70 C' , )
60 j:'-
50 ~~ -
4 i' tll-
t:. z;.
40 -·z c cu
III
:3 :J nl :>
:J 30 -
C1 m
2 0 u...
20 - 1
10
0 0
1991 1992 1993 1994 1995 1996
Year c=::::JV alue(T$M ) -+-Quantity (MT)
Source: MAF, HI96a
72

Prices for high quality commodity are generally favourable, and vanilla production has provided an
attractive return to growers. The main producer in Madagascar dominates world prices, and political
uncertainties over the distribution of the present high level of stocks presents the possibility of price
destabilisation. Vanilla production increased from a depressed export level of 11 tonnes in 1990 to
about 70 tonnes in 1991 with a highest total earning of T$5.5million. The price per kilogram of cured
vanilla was T$79. Figure 5.2 shows the cyclic nature of vanilla export production in the last 6 years.
The 1996 production showed a significant reduction (72%) with only 15.7 tonnes of vanilla exported
compared to 53.1 in 1995. This was attributed to a drop in the world market price and lower yields.
Despite the drop in price for cured vanilla from USD $60-70 per kg in the 1970's - 1980s to the more
recent experience of $20-40 per kg, vanilla still fetches a higher return than most other crops. It
should be noted that average returns for organic vanilla is USD$60 per kg.
5.6.2.3 Kava Kava is currently Tonga's third major export commodity. Table 5.4 shows the performance of the kava
industry during 1991 to 1996. Kava exports were low in the early to mid 1990s with the major
attributing factors being a high local demand and the dominance of the squash industry. The FOB
price of $17 per kilogram of powdered kava was consistently high. However in 1994, production
increased to about 5.5 tonnes from 0.5 tonnes in 1993. This continued in 1995 to 24 tonnes and in
1996 kava exports surged to a record high of 126 tonnes with a total value of more than T$2 million
and was ranked second to squash on returns. The potential of kava for export is now much greater.
The local demand is consistently high with a reasonable price, and exports to Fiji, New Zealand and
the USA are growing. There was also an additional demand from pharmaceutical manufactures in
Europe in 1996 and this boosted the production and export of kava as well as the price which doubled
to about T$40 per kilogram of powdered kava. The future for kava looks promising and the challenge
now is for Tonga to meet the market demand. However, the main constraint lies in the difficulty of
obtaining access to areas with suitable soils of deep and moderate fertility, and access to a sufficient
quantity of planting materials.
5.6.2.4 Root Crops
Root crops are the major staple crop, and minor cash crops both for domestic and export markets.
The export of root crops to migrant communities overseas is a lesser known commodity but one that
has performed favourably in recent years. Overseas Tongans and other Pacific islanders provide a
continuing stable market for taro, yam, giant taro and cassava especially with the downturn of copra
production. Large volumes of frozen cassava, peeled and bagged, are exported in container lots all
year round to New Zealand and Australia. Yams, giant taros and taro are also exported in large
volumes on a very seasonal basis. The main supply goes to New Zealand and Australia on a private
basis through relatives and friends, and target markets are mainly Polynesian communities. T abl.e 5.3
shows the export of root crops in recent years. Significant increases reflect the fact that people lost
faith in the squash industry and opted to grow yams, taro, cassava and kava.
73

Table 5.3: Major root crop exports for 1991-1996.
Crop Type YEAR 1991 1992 1993 1994 1995 1996 Yams Quantity (MT) 245.3 31.5 67.8 193 745.3 551.4
Value (T$M) 0.29 0.05 0.07 0.21 0.74 0.5 Price ($/kg) 1.2 1.5 1.1 1.1 1 0.9
Giant Taro Quantity (MT) 125.8 39 61.3 59.5 116 147 Value (T$M) 0.06 0.02 0.04 0.03 0.07 0.07 Price ($/kg) 1 1.2 1 1 0.95 0.9
Cassava (frozen) Quantity (MT) 813.4 1065.7 1768.1 866.7 372.2 815.4 Value (T$M) 0.4 0.64 1.06 0.52 0.2 0.37 P rice ($/kg) 0.5 0.6 0.6 0.6 0.55 0.45
Common taro Quantity (MT) 428.1 56.5 90.2 77.2 92.7 219 Value (T$M) 0.3 0.05 0.08 0.07 0.79 0.15 Price ($/kg) 0.7 0.9 0.9 0.9 0.85 0.7
Swamp taro Quantity (MT) 178 15.7 45.8 111 49.8 52.3 Value (T$M) 0.06 0.02 0.04 0.03 0.07 0.07 Price ($Ikg) 1 1.2 1 1 0.95 0.9
: Kava Quantity (MT) 0.86 2.36 0.64 5.56 24 126.7 Value (T$M) 0.02 0.04 0.01 0.08 0.41 2.15 Price ($/kg) 18 17 15 17 17 40
Source: MAF. 1996a
5.6.2.5 Watermelon
There is an established market for watermelons in New Zealand through New Zealand traders,
(FIMCO or PPEL). Improved quarantine facilities in Nuku'alofa and Vava'u have resulted in the
recommencement of watermelon exports to New Zealand in the mid 1990s. In 1991,211 tonnes were
exported; then production dropped to 127 tonnes in 1992 and to 90 tonnes in 1995. This fall was
linked to farmers being attracted to squash production, which proved to be more productive at the
time. The problems intensified with a fruitfly infestation on one container load, which led to a
temporary ban on exports of watermelon from Tonga imposed by New Zealand Quarantine in 1994.
However, the export production picked up in 1995 and 1996 as more squash growers reverted back to
watermelon. This indicates that there is still potential to increase exports of watermelon.
5.6.3 Marketing organisations
As noted earlier, one of the major changes that has occurred was the Government phasing out its
involvement in the direct export marketing of agricultural produce. The Government is restricting it's
role to facilitating market research, quality control, credit and loan facility provision, and marketing
policies to assist private sector development. The actual marketing of agricultural produce for export
is entirely in the hands of the private sector through exporting companies, groups and individuals.
Individual farmers or groups negotiate contracts with exporting companies or organisations and
each grower is given a quota to produce. For example in the squash export market, the farmers
74

have to be registered with one or more of the exporting companies and a quota will be allocated.
There are about 14 squash exporting companies operating; however only two of them are involved
in exporting other crops and commodities (PPEL (Primary Produce Export Ltd) and FIMCO
(Friendly Islands Marketing Co-operatives». In addition there are a number of private
entrepreneurial exporters who export a variety of crops through an informal system that involves
either selling through relatives living in other countries or flying to the country to do their own selling.
5.6.4 National market information system
Market information systems for agricultural products exist in a number of agencies. The Marketing
Research and Development section of MAF is responsible to the Policy and Planning Division.
Activities performed by the marketing unit include industry workshops and liaison, maintenance of
databases, technical advice on food processing, collection and collation of market information from
Talamahu market, and the preparation of radio broadcasts. The Ministry of Labour Commerce, Trade
and Industry has established the Tonga Trade organisation and is responsible for approving export
licenses for squash, market research and the promotion of export products in overseas markets. The
Tonga Development Bank, exporters, and some NGOs such as the Foundation of the South Pacific
(FSP) are also involved in market development, and many individuals and groups act on their advice
for export market development (particularly with handicrafts). However, the activities are uncoordinated
and tend to be ad hoc.
5.7 Agricultural Credit
A survey of the household's credit source for financing farm activities was included in the household
questionnaire. The study found that a majority of surveyed households (about 90%) with agricultural
loans identified Tonga Development Bank (TDB) as their main source of credit. The other 10 per
cent borrowed from other credit resources such as relatives overseas or in Tonga. The use of credit
by households by region was fairly widespread with 43, 52 and 14 per cent of households in
Vava'u, Ha'apai, and Tongatapu respectively having an agricultural loan with TDB. The higher
percentage of households in the outer islands (Ha'apai and Vava'u) was largely due to a TDB credit
line from IFAD (International Fund for Agricultural Development) earmarked for the outer island's
development.
In the two villages from Vava'u more than 70 percent of surveyed households with agriculture loans
used them for vanilla and root crop development projects and the remaining 30 percent for womens'
projects. Crop development loans are often organised through village farmers' groups as working
capital for crop establishment labour, vanilla pollination, and crop management. The average loan
size was T$1300, and the interest rate on agricultural loans under T$2000 is 10% on a flat rate
75
basis. In the two villages in Ha'apai, about 70 percent of those with agricultural loans were through
womens' groups, or for womens' activities and the remaining 30 percent were for root crop
production purposes. In Tongatapu, the few people with agricultural loans had them mainly for
squash and watermelon cash crop development purposes.
5.7.1 Tonga Development Bank
The Tonga Development Bank (TDB) finances development investments within the agricultural,
industrial and commercial sectors with the majority of lending going to the agriculture sector. For the
past eighteen years of the TDB operation, a total of 74,422 loans have been approved by the Bank
for a total value of T$135.85 million. Agriculture sector loans dominated the loan portfolio with 83.0
percent in number and 62.7 percent in value (TDB, 1998). In 1998 agricultural loans still dominated
representing 59 percent of the total value of the TDB's loan portfolio. However the value of
agricultural loans decreased in 1997 to onlyT$12.6 million compared to T$13.6 million in 1995 and
T$18.5 million in 1994. Squash loans still dominated the agricultural loans in 1997 with a total value
of T$4.9 million, root crops (T$2.6 million), vanilla (T$2.5 million) and 'Women in development'
T$1.1 million. The decline was linked to the performance of the squash and vanilla industry
described earlier in this section.
The major proportion of all agricultural loans, 55 percent, was disbursed in Tongatapu, and the rest
was spent on the outer island groups with a major share going to Vava'u. In 1997, the total lending
to the outer islands amounted to a total value of $5.27 million. The Ha'apai group dominated the
number of loan approvals for the outer islands whilst Vava'u still dominates the amount approved. A
majority of agricultural loans were provided as working capital.
The majority of TDB clients are small-scale farmers, fishermen and handcraft producers
(approximately 70 percent) with the average loan size to this group being $420 with debt servicing
being approximately $25 per month. Typically, a small borrower will begin with a loan of less than
$200 and over time, if successful, their use of credit could increase to a loan of approximately
$2000. One key issue in this process is the difficulty faced by potential rural clients to attain the
threshold (and thus the equity) to access the first loan. While the IFAD credit package to outer
island borrowers has made considerable improvements in this respect, feedback from farmers,
especially young farmers and women (including women's handicraft groups), clearly highlighted this
need for training to support these new borrowers. Bank policy is that most potential borrowers must
undergo a pre-lending training, but there are not necessarily the resources for this work, especially
for follow-up training and the integration of credit training into a small business package.
A UNDP/FAO funded project supplied a base fund (T$23000) to be administered by TDB for
women's groups with income-generating projects. A group desirous of obtaining a loan presents a
76

project proposal to TDB for appraisal. These are normally supported by MAF. Money is released in
cash to the group, with interest imposed to cover costs, and repayments are constituted into a
revolving fund. The maximum size of a loan is T$1,500 with a maximum repayment period of two
years. The fund is fully committed for loans, which have been given for such purposes as vegetable
cultivation, for purchasing planting materials, or raw materials for handicrafts and tapa making,
sewing material, piggery, poultry requirements and other projects.
Farmers were asked their view of the performance of TDB and credit facilities. Many farmers
referred to TDB's loan procedures as cumbersome. In addition, many would like to see the
repayment schedules follow more closely the revenue earning peculiarities of each crop.
Progressive farmers, being risk-takers, are generally good clients. In contrast, subsistence and
emergent farmers are risk-averse and create most of TDB's problem loans. Although problems exist
in the dealings of the Tonga Development Bank (TDB) with farmers, it is believed these are not
serious. There are no shortages of TDB loan funds for the outer islands. The IFAD credit line is
especially suitable for farm loans to smallholder farmers and for income generating activities of
women's groups for Ha'apai and Vava'u groups. The credit conditions are not stringent. The interest
rate for short-term loans, especially for small scale subsistence agriculture (farming, fishing) loans
less than $1000, is 8.5 percent, while for commercial purposes it is 10 per cent. Repayment of loans
for short-term crops is due directly after harvest, while repayment for other types of credit varies
depending upon the type of project. The poor repayment of credit has been claimed by TDB to be
due to the following reasons; (a) failure of farmers to use funds for production; (b) low returns from
the technology package for which credit was obtained; (c) losses due to seasonal or unforeseen
calamities; (d) unscrupulous borrowers and wilful defaulters; and (e) inadequate efforts at collection
by the credit supplying institution. From the TDB's viewpoint, the existing repayment problems could
be reduced through a combination of intensive client training, closer monitoring, and loan
rescheduling.
The analysis of credit use showed that TDB used different criteria for different farmer types and
amongst the different island groups. The credit lines available for more subsistence and semi-
subsistence farmers are different to those that progressive farmers would have access to, not only
in terms of the total amount but also the interest rates. The available maximum credit is included in
the model for each farmer's type. The impact that changes in interest rates has on semi-
subsistence farmers and progressive farmers' operating plan was examined in the model analysis
and validation.
77

5.8 Agricultural Input Supply
Agriculture inputs and equipment are available from a number of sources. A commercial company
provides a wide range of herbicides, pesticides and fertilisers, farm tools and prerequisites in the
three main island groups. In Tongatapu, the major retail stores and some smaller, more specialised
retail outlets also supply farmers' need. Farmers are generally well served by these sources that in
addition to MAF and other exporters, also provide some advisory services. As an encouragement to
the primary sector, agricultural inputs are imported free of duty.
5.9 Conclusion
While the causes for the stagnation of the agriculture sector are varied, it is generally agreed that
inadequate sectoral planning capacity is one important reason. For future development, a
comprehensive agricultural policy statement is required to guide the activities of the Ministry of
Agriculture and Forestry (MAF) and the direction of agricultural development in Tonga. Within the
context of such a policy, a sound strategy must be formulated to ensure that the goals and objectives
are met. Based on these strategies, agricultural projects and activities undertaken by MAF must be well
planned and financially viable for successful implementation. Funded projects and activities must be
regularly monitored and evaluated to assure that targets and key indicators of performance are met.
Agricultural data for all types of planning and project preparation must be gathered and properly
managed.
The capacity to develop and monitor development policies is currently weak, but is a necessary
prerequisite for improved performance of the agricultural sector. This project addresses these issues
and should make a significant contribution in improving the overall performance of the sector through
improved planning techniques. Accelerated agricultural development and growth will have important
and significant implications on the quality of life for a large portion of the Tongan population, and on the
economy as a whole.
The major focus for the Government effort to develop the agriculture sector should be largely export-
based. This is aimed at increasing the incomes of local producers. The Government is turning
traditional constraints into development opportunities. Examples include the small size of the domestic
market, limited resources and relative isolation all being used to advantage by diversifying production
towards new crops for specialised niche markets overseas. It is placing a high priority on quality
management and the production of commodities which meet the high standards required by
specialised markets. The Government is also trying to increase domestic production of certain
commodities, such as livestock products, to replace relatively high levels of imports.
78
While past development efforts have been largely fragmented and donor driven, the Government is
attempting to consolidate and coordinate efforts by developing a program approach to sectoral
development. Experience from past performances discussed above have resulted in a noticeable
shift in the main thrust of agricultural policy and development innovations from direct interventions
to less direct measures affecting the incentives of the smallholder farm-households in Tonga. This
change in emphasis includes moving from such instruments as input subsidies and price controls to
measures such as support for improved technologies, and better infrastructure and supporting
institutions. Currently the majority of the developments involve training, research, extension, market,
credits, markets, roads, and wharves. Grants have given way to low-interest or interest-free loans,
and donors frequently make their contribution in the form of goods and technical assistance, rather
than monetary grants, which had, in the past so strained Tonga's administration.
The need to diversify agricultural production is a major concern to the agricultural sector. Judging
from recent development plans, the main motives for the diversification are: (a) to lessen
dependence on a single crop; (b) to switch from a crop with weak market prospects to one for which
the demand is likely to increase; (c) to encourage the production of crops that have an assured
local market; (d) to favour labour intensive crops; and (e) to encourage crops that can be processed
by local industries. The current reliance on a homogenous export crop like squash is a high risk to
the economy.
The economy urgently needs enlarged foreign exchange earnings from the export of agricultural
products. This study revealed that the smallholder agricultural sector in Tonga has unrealised
potential to contribute to economic growth. However, efforts to enhance the commercialisation of
the smallholder farmers requires effective poliCies and institutional support in terms of better market
access and more efficient marketing services; adequate credit facilities (criteria, and loan
repayment), and agricultural extension services. The cash income of farm households needs to be
increased to stimulate commercial production, but the restriction of factors such as limited market
opportunities, inadequate market access, fluctuating farm output and input prices, and even market
failures all need to be counted. As it will be difficult to enlarge the domestic market rapidly,
increasing the export of agricultural products will be an important strategy.
The increased commercialisation and introduction of new crops such as squash, requires modern
agricultural inputs (fertiliser and chemicals) and thus a considerable increase in expenditure per unit
of land. As a result, access to credit plays a major role in the diversification and commercialisation
process, allowing smallholder farmers to assume the greater risks associated with commercial crop
production. The Tonga Development Bank has an important role in the provision of agricultural
credit at reasonable cost for farmers' recurrent seasonal inputs such as fertilisers, pesticides and
labour requirements. Suggestions from farmers for improvements include credit must be available
79

at the time when the inputs are purchased and must be extended until the crop is marketed. Some
respondents raised the Bank using land as collateral for credit as unfair especially to landless
people who rely on borrowed land for their livelihood.
Tongan farmers have shown a remarkable capacity to adopt and expand the production of new crops.
and the private sector marketing system has shown a remarkable ability to move the new products into
export. This has been reflected in the success of squash. vanilla, and kava. Many farmers were able to
increase their cash income quite significantly by growing vanilla, kava, squash and other export
crops, thus overcoming the constraints due to the relatively small size of the domestic market for
food crops. Squash, an annual crop, is highly labour intensive. but it is short term, quick to mature
and with an assured market and financial support from the government (credit facilities through
TDB), and technical support from MAF, it generated a significant source of cash income. Squash
has been quickly adopted with minimal government extension effort. Kava and vanilla are perennial
long-term cash crops, which blend well with the existing mixed cropping system. and, like squash.
have an assured market. The rapid acceptance of these crops in Tongatapu and Vava'u is a clear
indication of smallholder's response to economic incentives. 'Akolo (1997) noted that Tongan
farmers are hard working, productive and ready to embark on new agricultural ventures, but there is
a need to find the right crops to grow, with the best yield, and a ready market. The Government
(Tongatrade and MAF) should therefore spend more time finding new crops. their markets and
possible distribution channels for the growers.
The second part of the analysis will examine the household's goals and objectives, and how they
are related to the national objectives and policies discussed above.
80
CHAPTER 6
ANALYSIS OF SMALLHOLDERS' GOALS AND OBJECTIVES
6.1 Introduction
This chapter contains a review of the goals and production motives of smallholder farmers,
particularly those in Tonga. The main aim of this analysis is to identify and evaluate the goals and
objectives of village smallholder farm households, and to derive an objective function suitable for
incorporation in the Tongan smallholder goal-programming model.
As identified in Chapter 2, for agricultural development planning to be successful, policy support and
development innovations must be based on a detailed understanding of the social and economic
realities of farm households. It is important to understand the goals, preferences and values, and the
many demands farmers have on their available time and resources. Capillon (1986) argued that
farmers practices reflect their particular goals and constraints and thus the poor application of advice
is not due simply to the technical failings of the farmers but as a result of failing to incorporate their
goals and intentions. Papy (1994) pointed out one must look at the underlying decision-making
processes which act as a driving force for practices. Understanding the whys and wherefores of these
practices is a necessary step towards designing new innovations (Gibbon. 1994).
The process of decision-making for land use is exceedingly complex. The decisions depend partly
on the farmers' objectives or goals as well as their decision making process. Gasson (1973) defined
goals as ends or states that an individual desires. These include economic. lifestyle status, social and
other components. Most researchers who study farm management in peasant agriculture recognise
the limited resources and smallholder farmers' multiplicity of goals, and appreciate they should be
considered when evaluating the relevance of agricultural innovations (Flinn et al., 1980; Patrick and
Blake, 1980; Lee et al., 1994). McGregor et al., (1996) highlighted the importance of studying farmer
behaviour in order to obtain credible information about the decision making process. These authors
studied the performance of Scottish farmers and concluded that they do have multiple objectives,
ranking environmental and social concerns ahead of the traditionally accepted objectives of profit
maximisation and risk minimisation.
81

It is important to understand the framework within which farm-household goals are set and the
methods by which they are achieved. The overall objective of a Tongan smallholder farmer, as far
as the operation of the family farm is concerned, should be to make what he or she regards as
efficient sustainable use of the resources available (land, labour, and capital) to achieve their goals.
The principles of enterprise choice deal largely with the internal problem of allocation of these
resources to those enterprises and activities that will satisfy their goals. The present study focuses
on the farm-level production objectives, which in turn influence higher level goals such as
improving living standards and the wellbeing of the family.
6.2 Goal Specification of Tongan Smallholder Farmers
One of the main concerns in the analysis of multiple goal decision making problems is the presence
of incompatible or conflicting multiple goals in which the farmer needs to exercise his judgement
about the importance of individual goals. In goal programming decision making, the ranking of the
various goals is necessary and the criterion for goal ranking is based on the deemed "importance"
of the objectives. Data collected in the present study allowed the opjectives and priorities of the
sample of village households to be described and ranked. Using pilot surveys with smallholder farm
households, discussions with key informants, secondary information, and the author's experience, six
potential production objectives were identified for use in the study.
Objective 1: Household sustenance - provide household with secured supply of staple food.
Objective 2: Use food, other products and cash for fulfilment of religious obligations.
Objective 3: Use or exchange food and other products for social obligations to family, relatives
and community.
Objective 4: Cash - to accumUlate cash for priority household demands.
Objective 5: Risk - minimise economic risk.
Objective 6: Leisure - organise work to have more leisure.
The smallholder farm household objectives and priorities were first specified using a series of open-
ended questions in the farm household interview questionnaire. As discussed in Chapter 4, farms
were ranked into three homogenous groups based on a number of factors. These included the
cropped area or farm size; and the degree of commercialisation (subsistence, emergent and
progressive). Detailed data on the different farm type's goal ranking, and information on the
previous cropping year's farm operation were collected from a sub-sample of 16 farmers drawn
from the main sample.
The general approach was to first rank all the objectives in order of preference and assign
weighting factors to the objectives. Explicit weights are used to indicate the importance of one goal
82

relative to all others. No single standard procedure exists for describing weights explicitly. A number
of techniques have been used for the empirical measurement of farmers' goals (Patrick and
Kliebenstein, 1980). No single method is correct, thus precluding all others from use. However,
decisions on the method to use depend on the situation or whichever method is most appropriate for
the decision-maker. Costa and Rehman (1999) noted some of the techniques involved presenting
respondents with a predetermined statements on objectives such as paired comparisons, rating
scales and magnitude estimations. Magnitude estimation is more difficult to implement with the
respondents and is, therefore, not used much. Paired comparisons and rating scales have provided
similar rank for objectives in both studies with the former being the easiest to administer, as
respondents are only asked which of the two alternatives they prefer. The general approach was to
first rank all the goals in order of preference and assign weighting factors to the goals. The weights
enable goals to be included in the multi-objective programming objective function.
Objective weighting was accomplished using the magnitude estimation method which is a more direct
approach for obtaining ratio scaled preferences (Stevens, 1966). The six goals were presented to the
respondents with the request to rate the importance of each goal. The rating values ranged from 0
to 10. More than one goal can have the same rating. The lower limit of 0 indicates no importance of
the objective while the higher limit refers to the value of maximum possible importance. Responses
from the three main farm types are summarised in Table 6.1.
Table 6.1: Importance weighting of objectives by each farm category.
FARM TYPES Subsistence
Goals Weight
1. Home sustenance 10.00
2. Risk minimisation 8.30
3. Religious obligation 6.60
4. Social obligations 4.40
5. Leisure time #. 4.00
6. Profit maximisation 1.20
LSD (5%) 0.47
Importance Scale: 0 '" Not important at all; 10", Extremely important.
Sample data (n 108); LSD values p < 0.005)
Source: Field survey. 1998
Emergent Weight
10.00
7.20
7.80 4.90
2.60
3.40
0.62
Progressive Weight LSD (5%)
10.00 a 3.80 0.64 6.70 0.57 5.10 0.51 1.50 0.67 8.30 0.54 0.48
The weight reflects the importance associated with the minimisation of a deviation variable assigned
to a given objective. The statistical assumptions are relatively simple and the technique can be used
to find target levels of specific goals. Unlike paired comparison, magnitude estimation yields scores
which represent the individual farmer's goal hierarchy. Because of the assumed scale properties, goal
scores are comparable across individuals and scalar transformation of these scores is permitted. The
goal information derived from magnitude estimation is suitable for developing a multiple goal
programming model.
83
The data in Table 6.1 shows that all farm types surveyed ranked the family subsistence food security
as the most important objective and their mean weightings were not significantly different. "The major
objective of my farming is firstly to feed my family. I have no income generating opportunity but from
my land" was a common statement. The basic objective, which almost universally applies, is the
desire to fulfil biological needs. In more traditional settings this is achieved through producing enough
food to feed the family (food self-sufficiency). This is also confirmed by the household expenditure, as
the majority (90 percent) of households do not purchase staple food. However, 9 percent of the
households have profit maximisation as their main objective. As the farm-hoUseholds become more
commercialised the food subsistence objective is likely to be replaced by one relating to producing
sufficient products that can either be consumed by the family and/or can be sold and the revenue
used for purchasing food for the family (food security).
Social objectives include fulfilment of church obligations and social contributions, which imply the
need to belong and be accepted. A majority of smallholders (91 percent) identified the fulfilment of
obligations to church as their second priority. These obligations take the form of annual commitments
both in cash and in food for feasts. However, progressive farmers give profit maximisation a higher
priority than either church or social obligations. One progressive farmer put it: "Cash is top priority
because with more cash then I will be able to put more into church donations and obligations to my
family and community". It is inevitable, therefore, that for most households a significant proportion of
the cash generated goes back into catering for these obligations.
The means show that food for home consumption is very important in all three farm types and
seems to follow the same ranking as in Table 6.1. The main difference relates to the profit
maximisation objective, which progressive farmers regard as more important than other objectives.
Subsistence oriented farmers rarely aim to maximise production, rather the goal is to maximise the
chance of survival. Social contributions to the church rank highly in subsistence and emergent
households, which indicates social objectives are apparently more important than economic
objectives of maximising profits. For progressive farmers, who represent about 9 percent of
households surveyed, social objectives are not as important as economic objectives.
This result confirms that the majority of village smallholders in Tonga are semi-subsistence farmers,
and their objectives and priorities are different from farmers in more developed countries. The latter
produce for sale and profit, and if there is no profit they go out of business. In Tonga. there are no
social welfare or unemployment benefits available. Therefore farm households have to rely on
agriculture and off-farm employment for living. It is evident from this study that, for village
smallholders in Tonga, continuous production of food for daily livelihood is essential, even when it is
commercially unprofitable and uneconomic. As some smallholder farmers put it: "If we stop
producing, our family will starve; therefore we have to plant food crops every year".
84
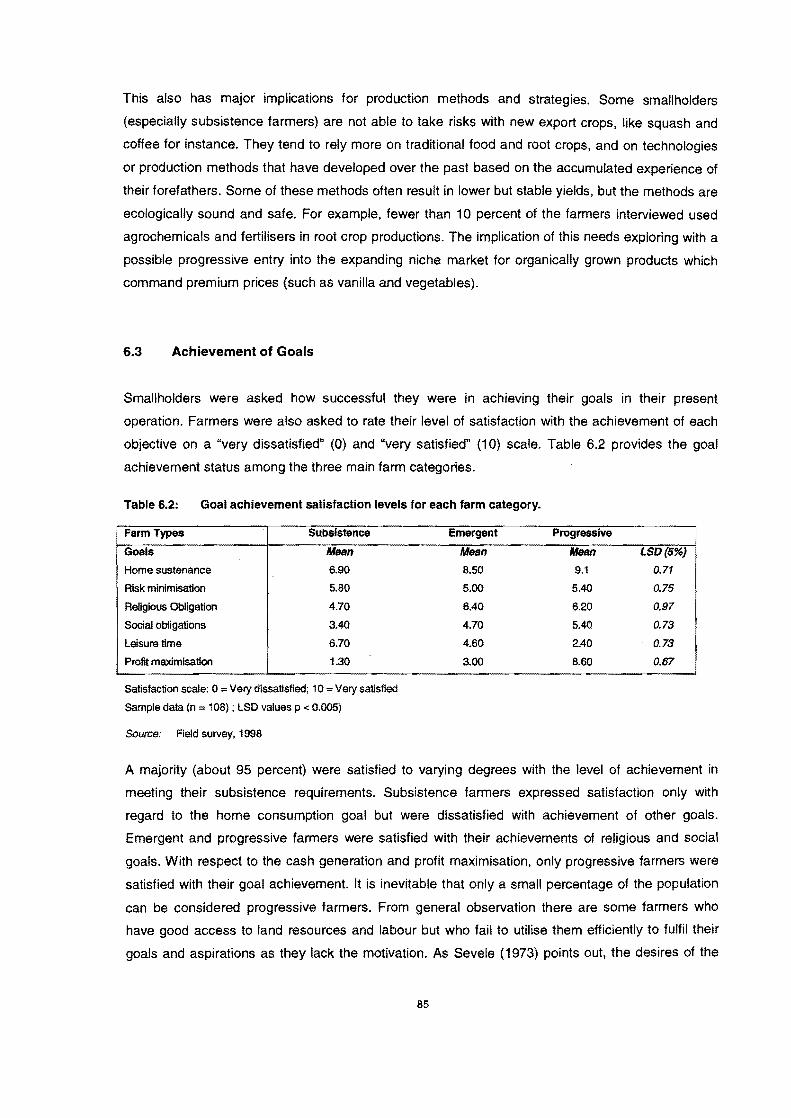
This also has major implications for production methods and strategies. Some smallholders
(especially subsistence farmers) are not able to take risks with new export crops, like squash and
coffee for instance. They tend to rely more on traditional food and root crops, and on technologies
or production methods that have developed over the past based on the accumulated experience of
their forefathers. Some of these methods often result in lower but stable yields, but the methods are
ecologically sound and safe. For example. fewer than 10 percent of the farmers interviewed used
agrochemicals and fertilisers in root crop productions. The implication of this needs exploring with a
possible progressive entry into the expanding niche market for organically grown products which
command premium prices (such as vanilla and vegetables).
6.3 Achievement of Goals
Smallholders were asked how successful they were in achieving their goals in their present
operation. Farmers were also asked to rate their level of satisfaction with the achievement of each
objective on a "very dissatisfied" (0) and "very satisfied" (10) scale. Table 6.2 provides the goal
achievement status among the three main farm categories.
Table 6.2: Goal achievement satisfaction levels for each farm category.
Farm Types Subsistence
Goals MeaD Home sustenance 6.90
Risk minimisation 5.80
Religious Obligation 4.70
Social obligations 3.40
Leisure time 6.70
Profit maximisation 1.30
Satisfaction scale: 0 == Very dissatisfied; 10 = Very satisfied
Sample data (n = 108) ; LSD values p <: 0.005)
Source: Field survey, 1998
Emergent
Mean 8.50
5.00
6.40
4.70
4.60
3.00
Progressive
Mean 1$0(5%) 9.1 0.71
5.40 0.75
6.20 0.97
5.40 0.73
2.40 0.73
8.60 0.61
A majority (about 95 percent) were satisfied to varying degrees with the level of achievement in
meeting their subsistence requirements. Subsistence farmers expressed satisfaction only with
regard to the home consumption goal but were dissatisfied with achievement of other goals.
Emergent and progressive farmers were satisfied with their achievements of religious and social
goals. With respect to the cash generation and profit maximisation, only progressive farmers were
satisfied with their goal achievement. It is inevitable that only a small percentage of the population
can be considered progressive farmers. From general observation there are some farmers who
have good access to land resources and labour but who fail to utilise them efficiently to fulfil their
goals and aspirations as they lack the motivation. As Seve Ie (1973) points out, the desires of the
85

Tongan for an improved level of living are not sufficiently strong to elicit the required effort given the
existing incentive structure.
The failure to achieve higher goals and aspirations should also be considered in relation to the
values and the way of life of smallholder farmer which, it is often argued, hamper development
efforts. It was evident that there is little spending on purchasing agricultural equipment and home
repairs and maintenance compared to the large spending on church and social occasions such as
funerals and weddings. With regard to the latter, Tongans are still prone to expenditure on a scale
that is lavish in relation to income. This tends to be more common with older farmers.
There is also the question of prestige and status. As one key informant stated, in the Tongan context
"Wealth of a man is identified not by what he owns but by his contributions for the church, and
social obligations'. Thus, large donations to the church and/or contribution to some public or
community fundraising are often made at the expense of greater material well being, due largely to
the prestige and status contributions bring to the donor. This is discussed at greater depth in
Chapter 9.
6.4 Major Constraints to Achieving Objectives
Farmers were asked to indicate the major constraints and agricultural problems they faced. These
are considered to influence their attitude, behaviour and overall production decisions. The nature of
their problems varies with location, physical environment, farm size and structure. Nevertheless, the
basic concern of the farmers was that their land was not realising its full potential. One of the most
interesting issues that emerged from the discussions was that all the farmers associated increased
productivity with cash cropping. The majority stated that achieving sustained food production for
family consumption was not a constraint, and catering for social and religious obligations is to some
extent satisfied (Table 6.2). But the main constraint lay in achieving a surplus for cash generation.
Therefore, the problems discussed mainly referred to cash production. The major problems and
constraints to improve smallholder agricultural production revealed in the survey are discussed below.
6.4.1 Inadequate marketing opportunities
Farmer respondents and key informants (exporters, traders, shippers, bankers, etc.) identified
inadequate marketing and marketing opportunities as the most serious and critical constraint. Poor
market access was seen as the most serious impediment. A majority of the household surveyed
expressed that they have enough land and sufficient labour to produce a surplus, "There is no
incentive for us to produce, prices are too low. What's the use of having high yields of yams and
taro, but all left unsold and rotting at the markef'. Some of the farmers from the six surveyed
86
villages succinctly summarised the issues by saying that "No matter what improvements in farming
we make, they are always nullified by marketing problems", They indicated that they could easily
double their output with the existing resources if there was a market for it. Most respondents
stressed the need for a market information system that allowed them to make informed choices
about the allocation of land, and the production of family food, crafts, medicines, firewood, etc, as
well as the use of capital and labour.
Among the factors that hinder accelerated agricultural production in the Vava'u and Ha'apai regions
are the small-size and over-supplied nature of their local market. Some Vava'u and Ha'apai farmers
and traders shipped their market-directed surpluses to and/or through Tongatapu Island particularly to
the Talamahu Market and overseas markets, Marketing costs are high (transport, handling,
transaction costs, etc) and there is strong competition offered by Tongatapu farmers and traders
giving them lower profit margins. They need, however, to continue with such outshipment
arrangements because better local marketing options are not available. There is a consensus that
Talamahu Market, however, like the local market, has reached its peak except during lean production
periods resulting from seasonal shortages.
Some farmers suggested that the Government needs to improve the economic environment in
which they operate through better incentives to produce more. In general, this could occur by
reducing the risk to farmers through better price policies and higher efficiency, particularly in
marketing. This would require not only a higher price per se paid to farmers but also a higher farm
price as a percentage of the market price. In other words, the farmers should receive a larger
proportion of the price paid by final consumers. This was the main problem for people who were
once engaged in squash production and have switched back to root crop production. One squash
grower noted "Squash exporting companies are getting the lion's share of what we get for our
produce and that is not fair'. The inconsistency in farm-gate prices and the lower percentage paid
out to farmers by exporters was discouraging. Many of the farmers from the two villages in Ha'apai,
for example, referred to the coffee development project that was initiated by the Ministry of
Agriculture in it's recent development programs for Ha'apai. Many farmers registered and
committed to the project but later withdraw due to low prices and a limited market opportunity for
their crops. Squash growers in Tongatapu and Vava'u raised similar concerns regarding the
instability of market export prices for their squash.
If new policies and strategies are to be successful, their introduction will have to be accompanied by
conducive pricing policies. Policies within the agricultural sector, such as trade duties and subsidies,
can mitigate the implicit taxation caused by general economic policies. Sectorial trade taxes and
subsidies in various developing countries are measured as the difference between farm-gate prices
and border prices at official exchange rates, after adjustments for internal transport and marketing
87
margins (Ellis, 1988). In Tonga, squash and vanilla exporters received more than half of the border
prices.
There were, however, many cases in which the obstacles were, in fact, more apparent than real. A
considerable number of farmers, for instance, could, with a little more effort, have easily improved
their current output of cash crops. In the two villages in Vava'u, for example, marketing of kava for
both domestic and export use is not a constraint. The study revealed that some households with
similar existing resources in terms of land and labour had different outputs; some are stiff marginal
farmers, while others are average or even progressive farmers. Strong evidence suggests that,
although inadequate marketing opportunities constituted a very important constraint to increased
productivity, factors such as lack of motivation and inability or reluctance to do sustained work were
also determining the level of household production.
6.4.2 Limited access to credit/capital
Some of the respondents regarded the inadequate access to credit as a major constraint. They found
difficulties in complying with alleged stringent Tonga Development Bank (TDB) loan terms and
conditions. One grower described the situation as "I have borrowed T$1000 from TDB for land
preparation and purchase of planting materials for yam plot. Yam take a year to mature and harvest,
but the bank wants repayments straight away. I would appreciate it if they would let me defer the
repayments until my yams are ready to harvest and self. The TDB. on the other hand, raised the
problems of people misusing loan proceeds for unproductive or consumption purpose; "They come
and make a loan for crop development but end up paying for their church donatiori'.
6.4.3 Ineffective MAF research and extension services
The Research and Extension Division of MAF is responsible for providing technology development
and technical advice to farmers. Advisory activities are carried out on a district basis by district
extension officers. To make the best use of resources, the extension service also provides back-up
support and assistance to the extension component of livestock and forestry development. Reports
from district extension officers indicate that progressive farmers increasingly play an important role in
disseminating improved agricultural technology to the community. Their farms are commonly used as
venues for field days for average and marginal farmers. Progressive farmers increasingly share their
knowledge and experience with other farmers in all categories in discussion groups. They also
commonly provide improved planting material to other growers at little or no cost. Common issues and
constraints to extension work reported by the district extension officers include lack of confidence, lack
of qualification or experience to advise farmers; limited resources such as vehicles, fuel for transport;
and poor extension information materials and services.
88

Some of the respondents were concerned about the inappropriate technology package for cash crops
(eg. squash, pineapple, vanilla, kava, etc.). There is a lack of confidence in some of the technologies
that MAF recommend. The discrepancy in yields from experimental farm trials by MAF and what the
farmers obtained is quite significant. For example, there was a 30 percent difference in yield for coffee
in Ha'apai compared to that in the Research Station. This may account for the low response rate to
coffee planting in Ha'apai (,Anitoni, pers comm. 1998).
In response to the question on what is their most important source of technical information, Table
6.4 illustrates the variation amongst the three categories. A most important source of production
information is experience, both that of the grower himself and that of the peers with whom he is in
most frequent and trusted communication (father, progressive farmers, friends). Subsistence
farmers often rely on their own experience and of other growers and do not seek advice from MAF
extension workers and other sources. District agricultural extension officers constitute a major
source of agricultural advice and information to emergent farmers and progressive farmers who
have commercial interests. Marketing companies, especially squash exporters, also offer advice
and technical information to growers. Thirty percent of smallholder farmers in this study seem to
mistrust technical information given by extension officers, especially on traditional root crops. In explanation they frequently cite the lessons of their years of farming experience: "Those extension
officers are teaching book stuff or from what they learn from school. I've been spending my entire
life growing yam, kava and taro and I have learnt a lot. What else do I need to learn? I don't need
advice from anybody".
Table 6.3: Main source of technical information for each farm category (column percentages).
Source Subsistence Emergent Progressive
Own experience 45 40 60
Experience of other growers 40 30 5
MAF extension 15 20 25 Marketing companies 0 10 10
Source: Field survey, 1998
6.4.4 Socio-cultural values and beliefs as constraints
The significance of social cultural and religious values on Tongan smallholders' household
production decisions is discussed at greater depth in Chapter 8. The evidence gathered in the
course of the fieldwork indicates that fulfilling traditional obligations is among the higher ranked
goals of smallholder farmers, although they do have conflicting effects on other goals. A majority of
respondents regard the demands for social and religious obligations as priority objectives rather
than constraints. Less than 10 percent of the respondents perceived them as a constraint and
impediment to increased productivity. This seems surprisingly low in view of the often-expressed
89

opinion that excessive contributions of labour, cash, and goods to religious and socio-cultural
organisations divert resources away from farming and thus are a deterrent to increased output.
Maude (1965), for example, has noted that the majority of those interviewed considered the burden
of obligations to be the major factor retarding their progress.
However, many observations made, and discussions held, in the course of the fieldwork suggested
that traditional obligations to church and society can, and do serve, as they did in the past, as
incentives to produce more than day to day household requirements. One household head put it:
"We have to produce more food and livestock than we actually need to cater for the many
obligations we have. It would be shameful if we cannot meet our obligation to church, family and
community. This is something that my forefathers believed in and passed on to me, and now I keep
telling my children".
Religious beliefs and values do affect decisions on production enterprises. For example, respondents
who belong to the Seventh Day Adventist church said, "Our church does not allow us to grow kava
and raise pigs, which are the most cash generating enterprises in the Tongan farming system. We
accept that and focus on other crops and livestocK'.
6.4.5 Absence, or inadequacy of infrastructures
The poor state of agricultural roads was identified as a major constraint to further development of
agriculture, especially in the Vava'u region. Most of the village agricultural activities in Tefisi take place
on steep sloping areas and access to agricultural land is mainly on clay surface roads or poorly sealed
roads, which are impassible in wet weather. Some squash growers reported that they were unable to
transport their produce to market in one season as no vehicle was able to get through.
Some respondents raised the issue of inadequate mechanical services, or insufficient machinery and
appropriate implements, which leads to inadequate land preparation. This problem was highly
significant in the Ha'apai region with only two working tractors, operated by the MAF machinery pool.
The effects of the unavailability of such services in Ha'ano village was described by some villagers;
"We have no choice but rely on manual labour for cultivation of our land. That's why we have smaller
crop size, that is what we could afford".
The absence of boundary fences in villages to avoid damage to crops by livestock was also a concern
to some households, especially to those with tax allotments close to the village boundary. The
problems with free ranging pigs posed a threat to farming activities: "If you want to grow any crops you
need to fence the plot to keep the pigs out, and we could not afford to purchase fencing materials'.
The only option lett for them is to grow the crops not affected by pigs like fruit trees such as breadfruit,
coconut, mangoes, mulberry and pandanus.
90
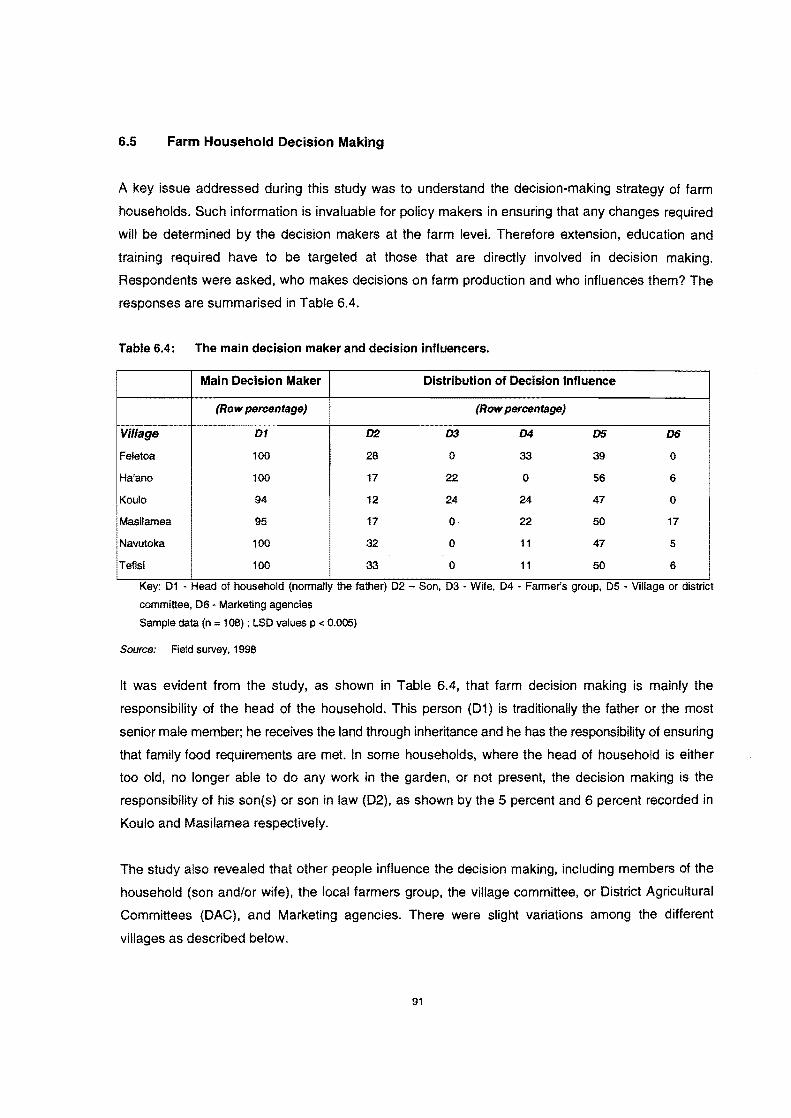
6.5 Farm Household Decision Making
A key issue addressed during this study was to understand the decision-making strategy of farm
households. Such information is invaluable for policy makers in ensuring that any changes required
will be determined by the decision makers at the farm level. Therefore extension, education and
training required have to be targeted at those that are directly involved in decision making.
Respondents were asked, who makes decisions on farm production and who influences them? The
responses are summarised in Table 6.4.
Table 6.4: The main decision maker and decision influencers.
Main Decision Maker Distribution of Decision Influence
(Row percentage) (Row percentage)
Village DI D2 D3 D4 D5 D6
Feletoa 100 28 0 33 39 0
Ha'ano 100 17 22 0 56 6
Koulo 94 12 24 24 47 0
Masilamea 95 17 0 22 50 17
Navutoka 100 32 0 11 47 5
Tefisi 100 33 0 11 50 6
Key: 01 - Head of household (normally the father) 02 - Son, 03 - Wife, 04 - Farmer's group, 05 - Village or district
committee, 06 - Marketing agencies
Sample data (n = 108) ; LSO values p < 0.005)
Source: Field survey, 1998
It was evident from the study, as shown in Table 6.4, that farm decision making is mainly the
responsibility of the head of the household. This person (01) is traditionally the father or the most
senior male member; he receives the land through inheritance and he has the responsibility of ensuring
that family food requirements are met. In some households, where the head of household is either
too old, no ronger able to do any work in the garden, or not present, the decision making is the
responsibility of his son(s) or son in law (02), as shown by the 5 percent and 6 percent recorded in
Koulo and Masilamea respectively.
The study also revealed that other people influence the decision making, including members of the
household (son and/or wife), the local farmers group, the village committee, or District Agricultural
Committees (DAC), and Marketing agencies. There were slight variations among the different
villages as described below.
91

6.5.1 Farmers' group
The evidence gathered in the course of this fieldwork indicates that about 40 percent of the
surveyed sample were involved in informal farmers' groups or kautaha. Respondents involved in such
groups claimed the main motivation from working as a group is the encouragement from other group
members, and they are able to share labour activities within the group and help each other to ensure
that their plots are weed free and well managed. In such situations, land use decisions of members
are influenced by the group (04) decisions. The group sets targets of what crops to grow and how
much for each associated member to produce. The group then conducts monthly inspections to
monitor the progress. For example, in the village of Tefisi, one group of 27 members was focussed on
the intensification of vanilla and kava plantings. The group agreed that every member must plant no
less than 200 kava and 200 vanilla plants for every month during the growing season, or a total of
1000 plants a year. After the growing season, the group followed up with a weed management
inspections plus monitoring of other crops that the group agreed to grow.
6.5.2 Village committees
Decisions on the use of land are to some extent affected by village or district agricultural committee
policies (discussed in greater depth in Chapter 8). In all villages, there is a food security enhancement
program, which includes ensuring root crop production by every household. The district officers and
village officers are responsible for conducting quarterly inspections and monitoring of the farm
allotments of every household to ensure that every household has crops growing in their allotment for
home consumption. The village and district agricultural committees are also responsible for organising
village involvement in the national agricultural shows that are conducted every three years.
6.5.3 Other factors
Social factors, like anticipated religious and ceremonial needs, also play an important role. These are
described in greater detail in Chapter 8. As noted by Delforce (1990), cropping decisions are directly
linked to forthcoming religious, social and cultural events and obligations. The importance of religion
and obligations to the church are significant. Most of the households make fixed contributions for their
church throughout the year, and annually in the form of annual fund raising activities (misinale) and
feastings (fakaafe). As one respondent described, "We have got one church feast on Christmas day
and our misinale in November. I am planning to plant yam, sweet potatoes and watermelon to harvest
around December'. Most households consider these obligations in deciding what crops to grow and
they time the harvest to coincide with these obligations and events. Preparations include food crops
(especially yam) and livestock raising that are earmarked for these obligations or kavenga. Farmers
generally plant crops in excess of their subsistence needs in order to contribute to wider social projects
through ceremonial activities; bare subsistence is considered deplorable. Marketable surpluses of
92

traditional crops are sometimes a result of conscious over-production, but are more often the result of a
particularly good growing season that leaves a surplus over and above subsistence and social
requirements.
Some respondents stated that decisions on the use of their land are also influenced by the tenure
status of land. Generally speaking, the amount of land and the form of their tenure are important
determinants of the level of living that the household can attain. Equally important, of course, is the
way the land is used. Among the many factors influencing the type and amount of crops planted are
material concerns like access to planting materials, access to land with the appropriate soil types
and available household labour. These factors are discussed in more detail in the next two
Chapters.
6.6 Risk Assessment
Risks are more easily defined than measured. While the ability to define and measure risk is of
assistance to policy makers, the most important aspect is being able to predict the response to
different policy measures. This response is closely related to the farmer's perception of, and attitude
to, the risk in question. An individual farmer's response will change over time, with experience, and
with changes in the goals set. Attitudes to risk appear to vary between smallholder farmers'
categories and geographical locations.
Risk arises when a farmer, embarking on any productive activity, is uncertain about what the actual
outcome will be. Yield risk is particularly significant in Tonga with the unreliable climatic conditions,
natural disasters, droughts, possible major pests and disease outbreaks. Also of crucial importance
are the fluctuating crop prices. Risk assessments in smallholder farming is a complex undertaking
as Ruthenberg (1985) described.
In this study the two major sources of risks identified by farmers to be most significant were market
or price risk, and production or technical risks. Market risk included the variability of commodity
prices featured in most cash crops like squash, vanilla and coffee. The price fluctuation of export
squash during the last 10 years was discussed in Chapter 5.
In the course of this study, farmers were asked for their response to the risks identified and to
describe the means used for avoiding or reducing their impact. The responses seem to vary with
risk type.
93
6.6.1 Crops and enterprise diversification
The ability to diversify and intensify production was rated as an important strategy to reduce the risk
by a majority of the farmers that increased the enterprise mix. "Because the market prices is
inconsistent and unpredictable, rather than putting all my eggs in one basket - I have to grow a wide
range of crops instead. When one crop fails others could stand in". The survey results indicated that
every household grew a diverse range of crops (4 to 10) thus reducing risks of disease incidence
and total crop failure. About 75 percent of the total adjusted cultivated area was devoted to food
crops, including yam, plantain, taro, and cassava. Almost all farmers grew these crops, which
reflects the high value placed on assuring the family food supply is maintained.
6.6.2 Modify planting times
Some farmers counter weather variability and price fluctuation effects on production by phased
planting techniques, which involve broadening the planting times for their crops to enable them to
lengthen the harvest periods. For example, one farmer in Navutoka who specialises in sweet
potatoes as a major cash crop described how he is now using block plantings of sweet potatoes
every two months to reduce market price risks. Rather than having a 0.8 hectares plot of sweet
potatoes planted and harvested at once, he now has four (0.2 hectares) plots each planted in June,
August, October and December. This would allow him to harvest from September to March. He is
doing the same with cassava and that has proved to be successful. He asserted "Even though I
have lower yield per unit area, I am able to supply my family throughout the year and get better
prices from the market at off-season times".
6.6.3 Diversify production practices or technology
Some farmers avoid risk or reduce the consequences through diversification andfor modification of
production practices to mitigate weather variability and drought effects. Some growers use live
mulching or ground cover for kava and vanilla, rather than a weed free bare soil, to reduce moisture
loss from the soil. This seems to work well with kava and vanilla, and also with squash where
weeds help to provide shade to the fruit reducing sunburn effects. Some of the respondents also
referred to their limited use of machine cultivation on their land in favour of direct drilling techniques.
In response to this, "There is less disturbance to soil, reducing moisture loss'.
94
6.6.4 Market information
Some of the respondents, especially larger or progressive farmers, indicated the importance of
regularly seeking appropriate information. They are aware of price and market risks and value flows
of updated market and financial information that improve their expectations of future events.
6.7 Summary
One of the most distinctive features of Tongan smallholders is the strong influence, if not
dominance, of socio-cultural considerations in the process of land use or production, labour use and
in the exchange of agricultural output. Economic factors are important but only partially determine
farmers' choices. In contemporary farming systems it was found that economic and socio-cultural
factors are mutual determinants of farming decisions in the Tongan smallholder household. The
study confirmed that the majority of village smallholder farmers have multiple goals that make them
more of semi-subsistence or semi-commercial producers. That is, the majority of smallholder
farmers produce primarily for their home consumption and social exchange, and commercial
production is very much an adjunct to subsistence production. Self-sufficiency at farm level implies
a high level of diversification, since smallholders have to produce a greater proportion of their direct
needs in terms of staple - root crops. The concept of food security is defined as the desire to
provide enough food for home consumption. The system also provides for fulfilment of social and
religious obligations. Food crops are normally grown for home consumption and social purposes with
the surplus being sold. Cash crops are grown to purchase goods that cannot be produced. Thus,
resources (land, labour, capital assets and savings) are combined in such a way to produce outputs,
which satisfy first the farm household basic needs - home food consumption then education, church
and social obligations.
Further, farming activities are stili submerged in social and cultural relationships and demands,
which invariably take precedence over profit maximisation. For example, the particular crops
chosen may need to meet certain anticipated kinship or religious obligations, and the subsequent
distribution of the product is made along societally or culturally determined lines rather than on
purely economic ones. The whole economic decision making and action complex is thus affected
significantly by non-economic forces - social, cultural, and religious. As our understanding of this
interrelationship deepens, we will increasingly be able to avoid attributing observed differences in
farming practices to individual or group irrationality. We will also be better equipped to distinguish
between courses of action that reflect farmers' values and those that are situational adaptations to
particular contexts of resource mobilisation.
95
This implies that development of agriculture in Tonga is not purely a technological or economic
problem. Its success is frequently dependent on an understanding of the socio-cultural
environment, knowledge of the social and cultural factors that condition farmers' responsiveness to
development change and innovation, and the ability to obtain willing co-operation of the people
involved. Gillmor (1986) noted the existence of two opposing schools of thought regarding the
motivation, attitudes and values of traditional subsistence or peasant farmers. One, described by
Schultz (1964), assumes a miniature economic man acting within the bounds of economic
rationalityl and striving to improve his economic position. According to this view, socio-cultural
factors only have a marginal role; subsistence farmers live and work in a physical, economic and
cultural environment that is relatively static. He asserted that traditional farmers would respond
quickly, normally and efficiently to economic incentives in adopting new innovation. The second
school considers that in subsistence agriculture, non-economic forces generally outweigh purely
economic forces, leading to behaviour that is not within the bounds of monetary economic
rationality. However, it appears reasonable to assume that both extreme points of view do not
reflect the real situation in Tonga, and the individual farmers and groups fall on different points of a
continuous scale.
The identification and ranking of the goals and priorities of Tongan smallholder farm households
allows them to be incorporated into a mathematical model. Given the inherent difficulties of
formulating farm household models, in which all the farmer's goals can be summarised as a single
utility maximisation problem, a more practical approach is to treat the farmer's goal as a series of
separate objectives or constraints. This approach opens up the possibility of including a variety of
other goals preferred by the farm household in addition to income and social obligations. Such
goals include family preferences to ensure survival in risk situations, leisure, social standing
(obligations to church and society). The simplest way to handle multiple goals is to select one goal
that will be maximised or minimised in the model, and to specify the remaining goals as inequality
constraints. Hardaker (1975) and Delforce (1990) used an example of this in setting up a model to
maximise cash income subject to minimum constraints on food production. A limitation of this
approach is that the goals included in the constraint set must be rigidly enforced and where they
cannot be met the problem will be infeasible. One form of alternative approach, known as goal
programming, establishes a target for each goal but rather than forcing compliance seeks instead to
minimise the deviations between the achievement of the goals and their target levels.
Increasing attention is being given to the fact that subsistence and emergent smallholder farmers
view risk differently than progressive farmers. For example, the adoption of a new farm technology
(eg. growing squash) often means a greater risk in an objective sense to small farmers than larger
farmers because small farmers cannot count on obtaining the necessary inputs when needed. In
1 Economic rationality: behaviour that seeks to maximise economic retums or income
96

addition, marketing services (eg. transport) are frequently not as certain for small farmers. Even if
the risk to large and small farmers is the same in terms of the expected probability of a crop loss,
there are often other reasons why smaller farmers would be less likely to adopt a new production
approach. Further, the small farmers may be more subject to group and community norms.
This study has confirmed that a majority of vii/age smallholders do respond to new economic
opportunities but within their realistic economic capacities and with their own understanding of the likely
risks and outcomes. Marginal farmers tend to be more risk averse than average and progressive
farmers. Long experienced with crop failures and with price fluctuations, and not yet directly affected by
expanding economies, these village farmers do not think like development planners in terms of
expanding horizons. Some indication of risk avoidance is indicated by the following survey findings:
(a) All the households grew a diverse mixture of root crops, fruit trees and vegetables, thus reducing
risks of disease incidence and total crop failure, (b) A large proportion of the cultivated land is
devoted to food crops, including yam, taro, cassava and sweet potatoes (almost all farmers grew
this crop indicating the high value placed on assuring the family food supply), and (c) 20 percent of
farmers indicated they had tried growing squash and coffee for a few years but decided against it
due to inconsistent market returns. Because even traditional activities carry some risks, the
subsistence farmers tend not to put their savings into long term fixed capital investments such as
machinery and land improvements. They cannot turn these investments into cash in the event of
bad seasons or prices and so prefer to keep savings in liquid assets such as cattle, pigs, mats and
handicrafts. These can be readily converted into cash.
The next two chapters analyse not only the resource endowment of farm households but describe
how the land, labour and capital resources are being utilised to achieve household's goals and
objectives described.
97
CHAPTER 7
ANALYSIS OF HOUSEHOLD LAND RESOURCES AND PRODUCTION
7.1 Introduction
Land is the most important productive asset in Tonga and reflects the economic conditions of
smallholder farmers. The livelihood of most Tongans is intimately tied to the land as it is the basis of
not merely their immediate subsistence but their cash transactions (Hardaker et al., 1988). With
about 80 percent of the population relying on land for an existence, consequently land distribution is
fundamental to the organisation of social relations in Tonga (ADS, 1995). Tonga's tenure system
has undoubtedly provided many benefits to its people, but pressures are now increasing for some
adjustment to meet the needs of changing social and economic circumstances (ADS, 1995). The
land tenure system increasingly impacts on the extent of farming as well as on how farming is carried
out. Access to land is crucial to the economic situation, power, prestige and security of any
individual or family. The amount of land to which a household has access and the terms on which it
utilises that land are factors that influence, if not determine, its decisions about the strategies adopted
in utilising land resources to earn a living.
In this chapter the way in which a household acquires rights to land, the nature of those rights and the
obligations they imply are discussed, as well as the distribution of land ownership and the pattern of
holdings in Tonga. This analysis provides an understanding of the land resource endowments of
different smallholder household types in terms of access to land, and how land resources are being
utilised. Particular attention is given to the farming system enterprises in terms of their cropping
patterns and livestock components. This analysis will allow decision variables and resource
constraints to be derived.
7.2 Access to Land
Smallholder farmers may have their own allotment as well as access to land registered to a relative
or friend, or to land under a formal lease agreement. In the course of this study, farmers were
requested to indicate whether they were farming exclusively their own tax allotment or whether they
were farming land belonging to others. The Land Use Crop Survey (MAF, 1993) showed that in
1992 a total of 14,846 tax allotments existed, of which 5422 were farmed at the time of the survey.
98
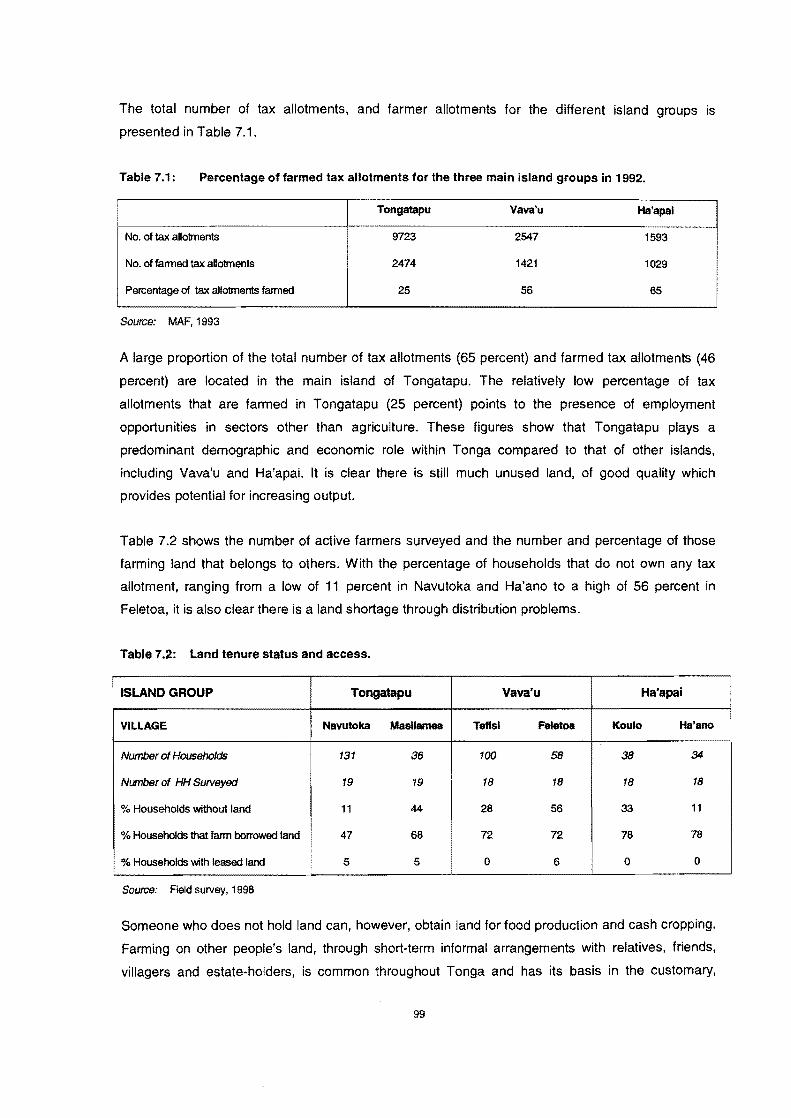
The total number of tax allotments, and farmer allotments for the different island groups is
presented in Table 7.1.
Table 7.1: Percentage of farmed tax allotments for the three main island groups in 1992.
Tongatapu Vava'u Ha'apal
No. of tax allotments 9723 2547 1593
No. of farmed tax allotments 2474 1421 1029
Percentage of tax allotments farmed 25 56 65
Source: MAF, 1993
A large proportion of the total number of tax allotments (65 percent) and farmed tax allotments (46
percent) are located in the main island of Tongatapu. The relatively low percentage of tax
allotments that are farmed in Tongatapu (25 percent) points to the presence of employment
opportunities in sectors other than agriculture. These figures show that Tongatapu plays a
predominant demographic and economic role within Tonga compared to that of other islands,
including Vava'u and Ha'apai. It is clear there is still much unused land, of good quality which
provides potential for increasing output.
Table 7.2 shows the number of active farmers surveyed and the number and percentage of those
farming land that belongs to others. With the percentage of households that do not own any tax
allotment, ranging from a low of 11 percent in Navutoka and Ha'ano to a high of 56 percent in
Feletoa, it is also clear there is a land shortage through distribution problems.
Table 7.2: Land tenure status and access.
ISLAND GROUP Tongatapu Vava'u Ha'apai
VILLAGE Navutoka Masllamea Telisl Feletoa Koulo Ha'ano
Number of Households 131 36 100 58 38 34
Number of HH Surveyed 19 19 18 18 18 18
% Households without land 11 44 28 56 33 11
% Households that farm borrowed land 47 68 72 72 78 78
% Households with leased land 5 5 0 6 0 0
Source: Field survey, 1998
Someone who does not hold land can, however, obtain land for food production and cash cropping.
Farming on other people's land, through short-term informal arrangements with relatives, friends,
villagers and estate-hOlders, is common throughout Tonga and has its basis in the customary.
99

although now weakened, obligations that exist between kin, friends and a chief and his people.
Individuals may be given rights by landowners to use the land for a specific time and are normally
known as a caretaker of tax allotments. It is clear from Table 7.2 that a majority (about 70 percent) of
the villages households, with the exception of Navutoka, farm on borrowed land. It is fairly easy to
borrow land for growing short-term subsistence crops, even in Tongatapu, although many villagers
claimed that it has become more difficult in recent years. This is also reflected in the fact that very
few people formally lease land. For example, in Ha'ano village there was no leased land but a
majority of the households within the village had access, at no cost, to other people's land,
especially from those who are residing overseas, or in Tongatapu or other areas. The figures also
point to absentee land ownership. This is partly due to overseas migration (which is higher in the
outer islands than in Tongatapu) and the dangers of losing the land title if the tax allotment is not
properly maintained and/or cropped. It should be noted that the degree of absentee land ownership
is lower in Tongatapu, where the economic opportunities in both the agriculture and non-agricultural
sectors is higher than in the outer islands. In the outer lying islands, including Vava'u and Ha'apai,
access to land is less of a problem.
A recent development in the transfer of land is the use of cash payments. The land legislation prohibits
the sale of land in Tonga. However, the survey showed it is increasingly common for people who want
land to make a gift (of cash) to an aristocratic landholder. He returns the favour by making a gift of land
and by giving his permission for the plot of land concerned to be officially registered in the name of the
direct user. This is the only guarantee of legal security. The parties involved do not view the
transactions as a sale, and there is no contract. Prices vary with land quality and demand levels. In the
village of Tefisi respondents reported that a 3.34 hectare allotment costs from T$5000 to T$10000. For
a town allotment, or 'api kolo, the prices vary more widely depending on place and region. The
standard size of a town allotment plot is 0.16 hectare. The information from the Ministry of Land and
Survey revealed that for a town allotment on Ha'apai and Vava'u the 'price' ranged from T$500 -
T$2000, while in Tongatapu the range is from T$1000 in rural area to as high as T$4000 in the
Nuku'alofa area.
The survey revealed that when land is borrowed for short-term use from a relative no direct
payment is usually made, but in borrowing land from others it is customary to give a small part of
the crop to the landholder. In Tongatapu, where the land constraint is more significant, such
transactions involve paying the landowner, in cash or in kind, for a few years' use of his land. In
these situations the contracts are not binding and the landowner could (and sometimes does)
renege on the agreement. Some respondents indicated that obtaining land for cash cropping is
more difficult. The demand for such land has increased with the growth of population and the
increasing commercialisation of Tongan agriculture. especially with the growing squash industry.
More people are borrowing land with higher cash rentals imposed. As one squash grower described
it "people are raising the rent for their land, from hundreds to thousands per seasori'. In Vava'u and
100

Ha'apai access to agricultural land is less of a problem and most farmers access other relatives' or
friends' land without charge. There is also a significant use of land under short term gardening
rights by co-operative gardening groups, known as toutu'u. These informal groups are often church,
or farmers' group, based.
Higher prices are charged for land used for export crops that fetch consistently high returns, such
as squash, kava and vanilla. In Vava'u, one informant paid T$3000 as a donation to the estate
holder for the registration of a 2 hectare tax allotment to grow kava for a period of 5 years. In 1996,
a squash grower paid T$2000 to register 1.5 hectares of land for one season. In Tongatapu, where
most of the squash is grown, and land is most limited, squash growers are paying between T$2500
to T$4000 per hectare to lease fertile land for one season.
The insecurity of land farmed under these circumstances, or under short-term formal leases, often
results in farming practices that degrade the land. This is highly significant in Tongatapu, where
squash cultivation is predominant, with an increased clearance of coconut trees, and fallow periods
reduced to six months. In addition, farmers with insecure land tenure normally do not invest in long-
term improvements to their farms. In the two villages in Vava'u this problem was often raised,
especially with respect to farming long term perennial crops like vanilla and kava. Some landowners
are reluctant to offer their land for kava and vanilla plantings as they have to wait for another 5 to 10
years respectively before their land is free. Some respondents also reported that the security of land
acquired from the Government, particularly those that are choice sites for public infrastructures, has
proven to be dubious. The Government sometimes requires immediate removal of all crops and
structures to allow public infrastructure development to go ahead.
The data in Table 7.2 also shows that land distributions in noble estate villages (Navutoka, Ha'ano
and Tefisi) are more evenly distributed than in Government estate villages (Masilamea, Koulo and
Feletoa). This is indicated in the lower percentages of households without tax allotments. Some key
informants in these villages noted that the Government is still holding on to land which should be
distributed to those with no land. In noble estate villages the noble has authority over the land
distribution and in most cases can subdivide to smaller plots of 1.5 hectares instead of the 3.4
hectares plot in normal legislation. Some of the Village respondents suggested that the Government
should review the existing land policies and reduce the quota to allow a better distribution of land.
7.2.1 Cropping pattern
The way in which farmers use their land can be described as a sophisticated and balanced mixed
cropping pattern, a type of organic farming which includes a diversity of crop species and tree crops
which supply food regularly throughout the year. The 1993 land use and crop survey (MAF, 1994b)
showed the major food and cash crops include the following species.
101

(i) Yam (Dioscorea spp.). Known in Tonga as 'uti, is the most valued and prestigious of the
root crops. Yam is considered to be best tasting and normally reserved for presentations to the
royalty, nobility, ministers and other high-ranking people in the community, and for ceremonial and
religious functions and feasts. Yam is also as a valuable cash crop for the domestic and export
markets. The 1993 Land Use Crop Survey showed that yam was grown by 83 per cent of
households surveyed, with a total of 3454 hectares being planted.
Yam is generally given pride of place as the first crop to be planted on new cultivated areas after a
fallow period. It is commonly grown as an intercrop with giant taro, plantain or American taro, kava
and vanilla. Yam comes in two varieties, early and late yam. Early yam is planted from May and
July and harvested in March and April. Late yam is planted from August to October and harvested
around May to July. Early yams usually grow for 9 to 12 months and late yams 8 to 12 months. Yam
has the important advantage among other tropical root and tuber crops of storing well after harvest for
up to 3 to 6 months if kept in a well-ventilated cool store. Yam production is highly specialised and
requires high capital investment. This is in terms of land preparation through tractor hire, labour and
the purchase of planting materials. Input costs are high, but so are the returns, both for local and
export sale to overseas Tongans and other Polynesians. Details of yam production and a gross
margin analysis is presented in Appendix 4.
(ii) Giant taro (Alocasia macrorrhiza). Known locally as kape, it is another prestigious traditional
crop found on a majority of bush allotments. Giant taro is an important subsistence crop and is also
produced for the domestic and export markets. The two common varieties are kape hina (white) and
kape fohenga (dark). Giant taro is commonly interplanted in yams and other crops. Kape takes
approximately 12 to 14 months to mature and is harvested from August through November.
(iii) American taro (Xanthosoma spp). Known as Talo Futuna, it is one of Tonga's most
important staple crops and the most frequently grown crop, and is of primary importance in the
household food consumption basket. This aroid of tropical American origin was probably introduced
into Tonga during the nineteenth century (Thaman, 1976). Farmers like American taro because it can
be planted all the year round provided the rainfall does not drop below 1000 mm, although most
planting occurs between June and September. The tubers take apout one year to mature, and
because they store well in the ground they can be left unharvested for up to two years without the
cormels rotting. The young green leaves, ru, of the American and common taro plants can be eaten as
a green vegetable after cooking.
(iv) Colocasia taro, or Talo Tonga, is an ancient introduction to Tonga and is cultivated as one
of the staple foods throughout the country and has good export potential. The popularity of the crop
has increased in the last 10 years due to the increasing demand for fresh corms from migrant
communities overseas. A cyclone in Western Samoa in 1991, followed by the Taro blight disease in
102
1993, virtually destroyed Samoan production, the major supplier of colocasia taro, and provided the
opportunity for Tonga to pick up the temporary reduction in supply, Colocasia taro is best planted
from March to April to synchronise harvest periods with the export demand to New Zealand, which
is greatest in December to January. The other planting period is between August and October,
during the wet season, which provides optimum yields. Colocasia can be grown both as a
monocrop and as an intercrop. Colocasia taro does not store well after harvest (2 weeks).
(v) Cassava (Manihot esculenta). Known as manioke, constitutes an important staple crop, as
well as a minor export crop. In the 1993 Land Use and Crop Survey, it was found that cassava was
the most widely planted staple crop with ninety percent of households growing, on average, 0.5
hectares per household. Cassava ranks low in consumer preferences, reflected in low prices for
cassava in the domestic market relative to other staples. Cassava has the advantage of being able
to be planted all year round and generally requires much less care and grows well on less fertile
soils. Cassava is commonly grown as a monocrop, is generally the last crop in the cropping cycle
following yam and subsequent taro and sweet potato. It is frequently planted twice in succession in
the same plot, after which the land is left fallow. Cassava can be harvested after 8-15 months, or
left unharvested for up to 2 years.
(vi) Sweet Potato is the third most important staple food crop. As a cash crop sweet potato is
attractive since it has a much shorter production period than other root crops, with some varieties being
ready to harvest four months after planting. In the traditional cropping cycle, sweet potato is planted
second to either yam or taro. Sweet potato is used as a feast food. The leaves are frequently used as
pig feed.
(vii) Buttercup squash (Cucurbita maxima D.) is the Tonga's most important export commercial
crop grown chiefly for the Japanese market. Squash, cultivated commercially, does not fit into the
mixed cropping system like kava and vanilla so it is commonly grown as a monocrop. The main export
variety grown is DeNca and the planting season is around July to August during the drier part of the
year. Squash takes about three months to mature with harvest occurring in November.
(viii) Kava (Piper methysticum) is commonly cultivated, especially in Vava'u, mainly for local sale
but also for the export market. Kava is the source of an important ceremonial and social beverage.
Kava grows best after a long period of fallow and is commonly planted in January to April. Intercrops
can be planted once the kava is 3 months old; common intercrops are yam, taro and bananas.
Intercrops will provide food and/or cash in the period while the kava is not productive. Kava used to be
harvested after 5 to 10 or more years of growth. It is now harvested as early as 3 to 4 years after
planting. In recent years, the increasing high demand of kava, plus the ideal growing conditions in
Vava'u, has made it become a high cash earning crop similar to vanilla. The trend for kava production
is increasing, mainly due to better market returns.
(ix) Vanilla (Vanilla planifolia) is the second most important cash crop in Tonga. Vanilla
production is concentrated in Vava'u, where soil and climate are particularly suited to the crop.
103
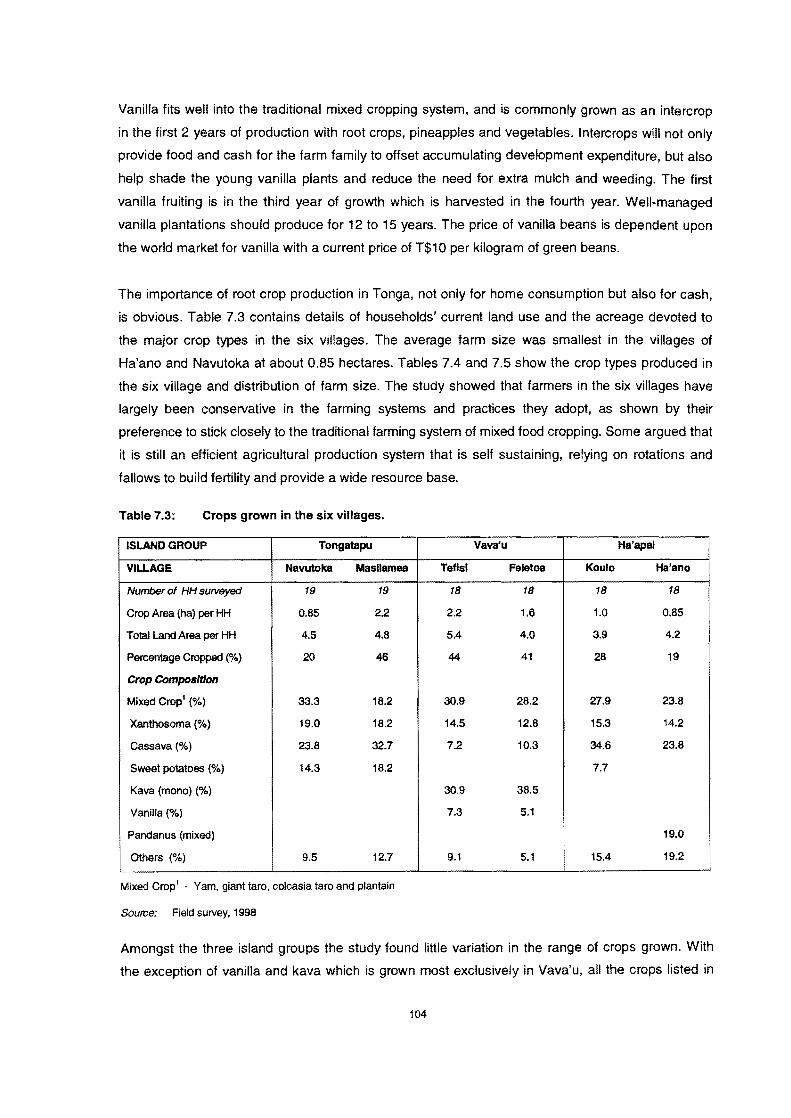
Vanilla fits well into the traditional mixed cropping system, and is commonly grown as an intercrop
in the first 2 years of production with root crops, pineapples and vegetables. Intercrops will not only
provide food and cash for the farm family to offset accumulating development expenditure, but also
help shade the young vanilla plants and reduce the need for extra mulch and weeding. The first
vanilla fruiting is in the third year of growth which is harvested in the fourth year. Well-managed
vanilla plantations should produce for 12 to 15 years. The price of vanilla beans is dependent upon
the world market for vanilla with a current price of T$10 per kilogram of green beans.
The importance of root crop production in Tonga, not only for home consumption but also for cash,
is obvious. Table 7.3 contains details of households' current land use and the acreage devoted to
the major crop types in the six villages. The average farm size was smallest in the villages of
Ha'ano and Navutoka at about 0.85 hectares. Tables 7.4 and 7.5 show the crop types produced in
the six village and distribution of farm size. The study showed that farmers in the six villages have
largely been conservative in the farming systems and practices they adopt, as shown by their
preference to stick closely to the traditional farming system of mixed food cropping. Some argued that
it is still an efficient agricultural production system that is self sustaining, relying on rotations and
fallows to build fertility and provide a wide resource base.
Table 7.3: Crops grown in the six villages.
ISLAND GROUP Tongatapu Vava'u Ha'apal !
VILLAGE Navutoka Masllamea Teflsl Feletoa Koulo Ha'ano
Number of HH surveyed 19 19 18 18 18 18
Crop Area (ha) per HH 0.85 2.2 2.2 1.6 1.0 0.85
Total Land Area per HH 4.5 4.8 5.4 4.0 3.9 4.2
Percentage Cropped (%) 20 46 44 41 28 19
Crop Composition
Mixed Crop! (%) 33.3 18.2 30.9 28.2 27.9 23.8
Xanthosoma (%) 19.0 18.2 14.5 12.8 15.3 14.2
Cassava (%) 23.8 32.7 7.2 10.3 34.6 23.8
Sweet potatoes (%) 14.3 18.2 7.7
Kava (mono) (%) 30.9 38.5
Vanilla (%) 7.3 5.1
Pandanus (mixed) 19.0
Others (%) 9.5 12.7 9.1 5.1 15.4 19.2
Mixed Crop! Yam, giant taro, colcasia taro and plantain
Source: Field survey, 1998
Amongst the three island groups the study found little variation in the range of crops grown. With
the exception of vanilla and kava which is grown most exclusively in Vava'u, all the crops listed in
104
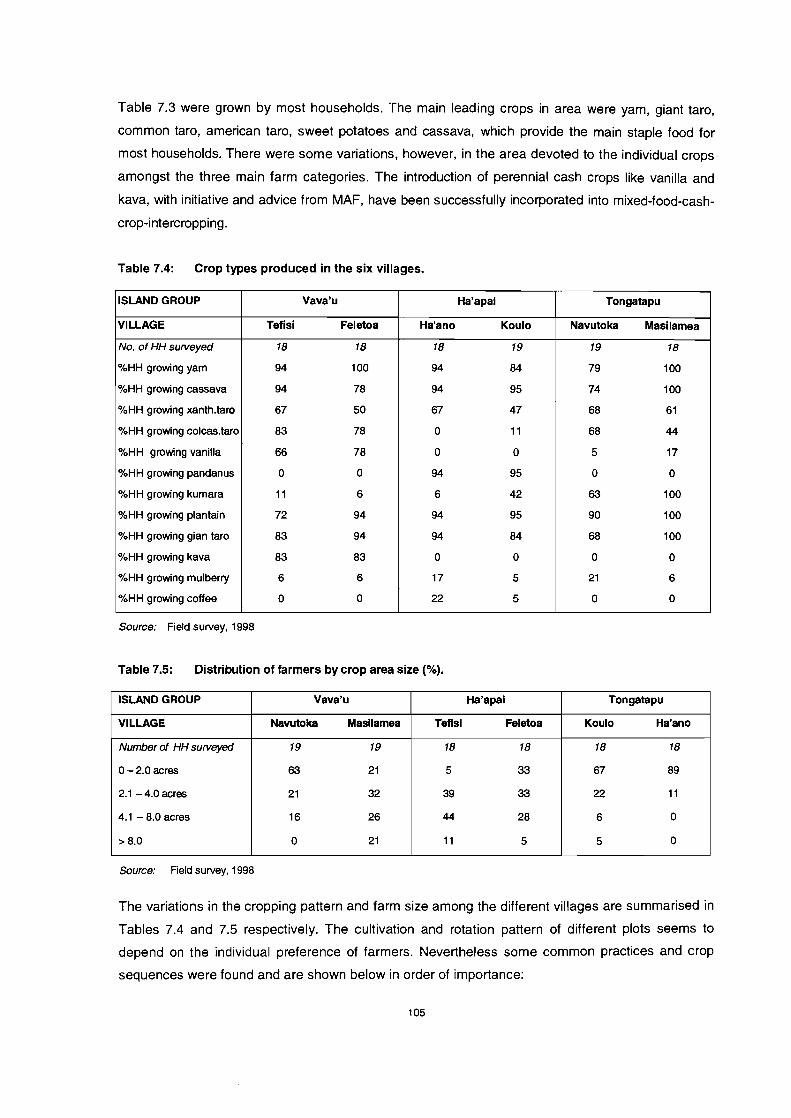
Table 7.3 were grown by most households. The main leading crops in area were yam, giant taro,
common taro, american taro, sweet potatoes and cassava, which provide the main staple food for
most households. There were some variations, however, in the area devoted to the individual crops·
amongst the three main farm categories. The introduction of perennial cash crops like vanilla and
kava, with initiative and advice from MAF, have been successfully incorporated into mixed-food-cash-
crop-intercropping.
Table 7.4: Crop types produced in the six villages.
ISLAND GROUP Vava'u Ha'apal Tongatapu
VILLAGE Tefisi Feletoa Ha'ano Koulo Navutoka Masilamea
No. of HH surveyed 18 18 18 19 19 18
%HH growing yam 94 100 94 84 79 100
%HH growing cassava 94 78 94 95 74 100
%HH growing xanth.taro 67 50 67 47 68 61
%HH growing colcas.taro 83 78 0 11 68 44
%HH growing vanilla 66 78 0 0 5 17
%HH growing pandanus 0 0 94 95 0 0
%HH growing kumara 11 6 6 42 63 100
%HH growing plantain 72 94 94 95 90 100
%HH growing gian taro 83 94 94 84 68 100
%HH growing kava 83 83 0 0 0 0
%HH growing mulberry 6 6 17 5 21 6
%HH growing coffee 0 0 22 5 0 0
Source: Field survey, 1998
Table 7.5: Distribution of farmers by crop area size (%).
ISLAND GROUP Vava'u Ha'apal Tongatapu
VILLAGE Navutoka Masilamea Teflsl Feletoa Koulo Ha'ano
Number of HH surveyed 19 19 18 18 18 18
0-2.0 acres 63 21 5 33 67 89
2.1 - 4.0 acres 21 32 39 33 22 11
4.1 - 8.0 acres 16 26 44 28 6 0
>8.0 0 21 11 5 5 0
Source: Field survey, 1998
The variations in the cropping pattern and farm size among the different villages are summarised in
Tables 7.4 and 7.5 respectively. The cultivation and rotation pattern of different plots seems to
depend on the individual preference of farmers. Nevertheless some common practices and crop
sequences were found and are shown below in order of importance:
105
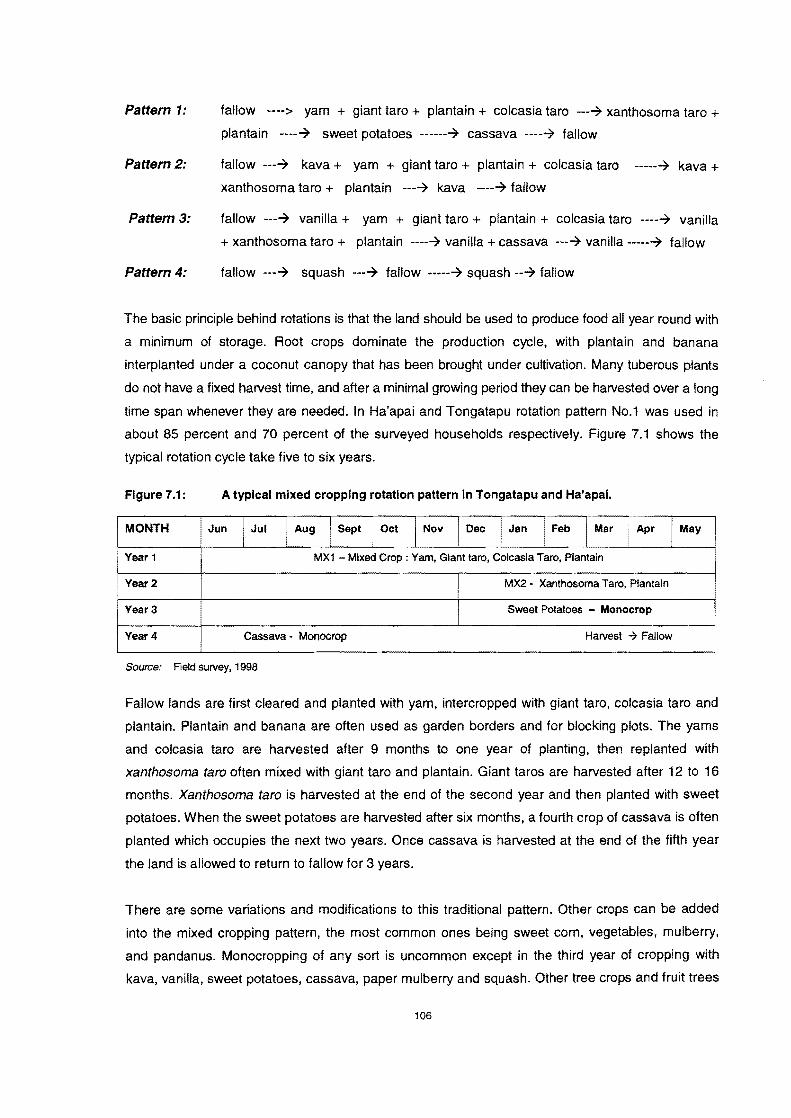
Pattern 1:
Pattern 2:
Pattern 3:
Pattern 4:
fallow ____ > yam + giant taro + plantain + colcasia taro ----7 xanthosoma taro +
plantain -----7 sweet potatoes -------7 cassava -----7 fallow
fallow ----7 kava + yam + giant taro + plantain + colcasia taro ------7 kava + xanthosoma taro + plantain ----7 kava -----7 fallow
fallow ----7 vanilla + yam + giant taro + plantain + colcasia taro -----7 vanilla
+ xanthosoma taro + plantain -----7 vanilla + cassava ----7 vanilla ------7 fallow
fallow ----7 squash ----7 fallow ------7 squash ---7 fallow
The basic principle behind rotations is that the land should be used to produce food all year round with
a minimum of storage. Root crops dominate the production cycle, with plantain and banana
interplanted under a coconut canopy that has been brought under cultivation. Many tuberous plants
do not have a fixed harvest time, and after a minimal growing period they can be harvested over a long
time span whenever they are needed. In Ha'apai and Tongatapu rotation pattern 1\10.1 was used in
about 85 percent and 70 percent of the surveyed households respectively. Figure 7.1 shows the
typical rotation cycle take five to six years.
Figure 7.1: A typical mixed cropping rotation pattern in Tongatapu and Ha'apai.
MONTH Jun I Jul I Aug I Sept i Oct l Nov Dec I Jan I Feb I Mar l Apr l May
I Year 1 MX1 - Mixed Crop: Yam, Giant taro, Colcasia Taro, Plantain
i Year2 MX2· Xanthosoma Taro, Plantain
Year 3 Sweet Potatoes - Monocrop
Year 4 Cassava - Monocrop Harvest ..,. Fallow
Source: Field survey. 1998
Fallow lands are first cleared and planted with yam, intercropped with giant taro, colcasia taro and
plantain. Plantain and banana are often used as garden borders and for blocking plots. The yams
and colcasia taro are harvested after 9 months to one year of planting, then replanted with
xanthosoma taro often mixed with giant taro and plantain. Giant taros are harvested after 12 to 16
months. Xanthosoma taro is harvested at the end of the second year and then planted with sweet
potatoes. When the sweet potatoes are harvested after six months, a fourth crop of cassava is often
planted which occupies the next two years. Once cassava is harvested at the end of the fifth year
the land is allowed to return to fallow for 3 years.
There are some variations and modifications to this traditional pattern. Other crops can be added
into the mixed cropping pattern, the most common ones being sweet corn, vegetables, mulberry,
and pandanus. Monocropping of any sort is uncommon except in the third year 01 cropping with
kava, vanilla, sweet potatoes, cassava, paper mulberry and squash. Other tree crops and fruit trees
106
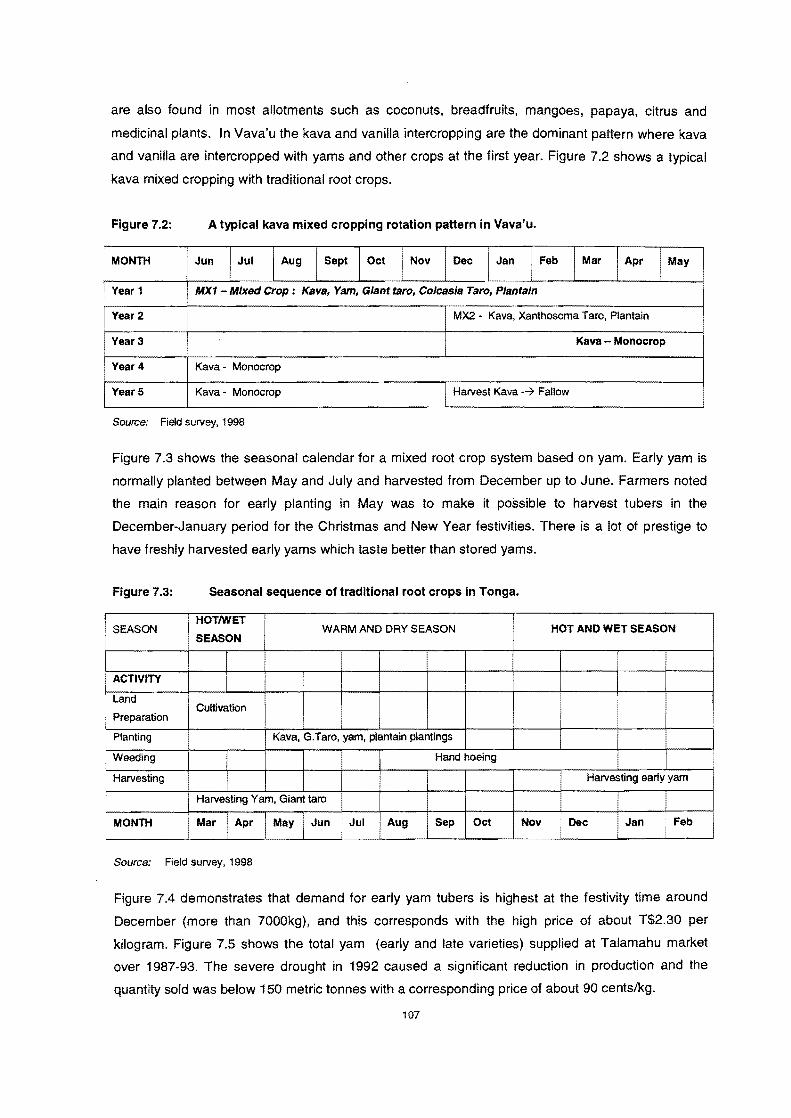
are also found in most allotments such as coconuts, breadfruits, mangoes, papaya, citrus and
medicinal plants. In Vava'u the kava and vanilla intercropping are the dominant pattern where kava
and vanilla are intercropped with yams and other crops at the first year. Figure 7.2 shows a typical
kava mixed cropping with traditional root crops.
Figure 7.2: A typical kava mixed cropping rotation pattern in Vava'u.
MONTH Jun I Jul I Aug I Sept I Oct Nov Dec I Jan I Feb I Mar I Apr I May
I Year 1 MX1 - Mixed Crop: Kava, Yam, Giant taro, Colcasla Taro, Plantain
Year 2 MX2 - Kava, Xanthosoma Taro, Plantain
Year 3 I Kava - Monocrop
! Year4 Kava - Monocrop
Year 5 Kava - Monocrop Harvest Kava --7 Fallow
Source: Field survey, 1998
Figure 7.3 shows the seasonal calendar for a mixed root crop system based on yam. Early yam is
normally planted between May and July and harvested from December up to June. Farmers noted
the main reason for early planting in May was to make it possible to harvest tubers in the
December-January period for the Christmas and New Year festivities. There is a lot of prestige to
have freshly harvested early yams which taste better than stored yams.
Figure 7.3: Seasonal sequence of traditional root crops in Tonga.
I SEASON HOTIWET
WARM AND DRY SEASON HOT AND WET SEASON SEASON
ACTIVITY
I Land Cultivation
I Preparation
Planting i Kava, G.Taro, yam. plantain plantings
: Weeding Hand hoeing
i Harvesting Harvesting early yam
Harvesting Yam, Giant taro
I MONTH Mar Apr May Jun Jul Aug Sep Oct Nov Dec Jan Feb
Source: Field survey. 1998
Figure 7.4 demonstrates that demand for early yam tubers is highest at the festivity time around
December (more than 7000kg), and this corresponds with the high price of about T$2.30 per
kilogram. Figure 7.5 shows the total yam (early and late varieties) supplied at Talamahu market
over 1987-93. The severe drought in 1992 caused a significant reduction in production and the
quantity sold was below 150 metric tonnes with a corresponding price of about 90 cents/kg.
107
I
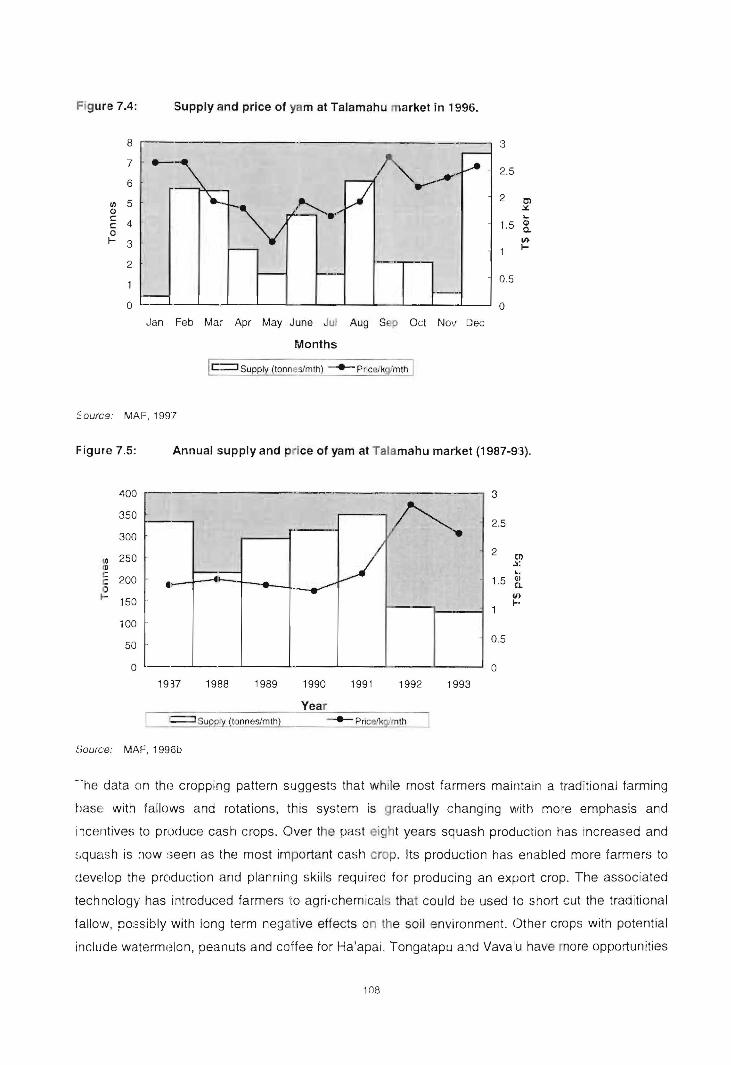
Figure 7.4:
8
7
6
!IJ 5 ClJ C c 4 0 I- 3
2
o
Supply and price of yam at Talamahu market in 1996.
------...-
~~
,Ian Feb Mar Apr May June Jul Aug Sep Oct Nov Dec
Months
!c=::JSUPPly (ton nes/mth) -+-Price/kglmth I
Eo ouree: MAI=, 1991
3
2.5
2 Cl .lC ...
1.5 &.
0.5
o
~ I-
Figure 7.5: Annual supply and price of yam at Talamahu market (1987-9:3).
400
350
300
In 250 IU I:
200 o ~- 150
100
50
o
•
1937
-
;
..... ! - -
1988 1989
==:ISupply (tonnes/mlh)
~;ource: MAF, 1996b
.-.------- .
1990
Year
1991 1992
-+- Pnce/kalmth
...
1993
3
2_5
2 en .. : .. 1_5 Q)
'l. II. fo·
0.5
0
--he data on thn cropping pattern suggests that while most farmers maintain a traditional farming
base with fallows and rotations, this system is gradually changing with more emphasis and
i lcentives to produce cash crops. Over the past eight years squash production has increased and
~;quash is now ::;een as the most important cash crop. Its production has enabled more farmers to
develop the production and planning skills required for producing an export crop. The associated
techl0logy has introduced farmers "to agri-chemicals that could be used to short cut the traditional
fallow, pO:3sibly with long term negative effects on the soil environment. Other crops with potential
include watermelon, peanuts and coffee for Ha'apai. Tongatapu and Vava'u have more opportunities
108
for improved agricultural productivity than Ha'apai. These opportunities mainly arise out of a rainfall
pattern that is more favourable for growth, less exploited and thus less abused soils, more available
and accessible arable land, and a conservation-conscious farming community.
7.2.2 Agricultural technology
One of the most important aspects of land use decisions is the technology used. The type of village
agriculture commonly practised in Tonga requires no special skills that could not be easily acquired
by a village smallholder. The bulk of the agricultural work is performed using simple hand tools such
as a spade, digging fork, axe, machete and hoe. However, the use of machine cultivation and
ploughing is now common in all villages except Ha'ano, which does not have access to a plough.
Among small land holders only some progressive farmers can afford to individually own a tractor
with a majority of farmers relying on the service of the machinery pool operated by the Ministry of
Agriculture and Forestry. This is available in the three main regions and costs T$30 per hour. The
main use of the service is for ploughing and disc harrowing during the initial land preparation stage
following the fallow period.
To explore the interaction of factors in the adoption of new innovations and improved technology it
is important to consider farmers' perceptions of the important technological changes they have
incorporated. The farmers were asked what major changes in farm practices or techniques had
been made over the years. About 70 percent noted mechanisation using a tractor and machine
cultivation for land preparation in place of manual land clearance and cultivation was the most
important change. Although the government encourages the use of commercial fertilisers, out of the
110 sample households, only 15 percent had used commercial fertiliser on their bush allotment. In a
vast majority of cases these were used in commercial cropping, especially squash, watermelon and
vegetables rather than in the traditional subsistence crops. In terms of crop composition, only 15
percent reported using fertiliser. Of particular interest were farmers' reasons for not using more high
cost technology, such as fertiliser. Four areas of concern emerged: the high cost of fertiliser, low
potential increase in yield, lack of knowledge on use, and lack of faith or confidence in the
technology.
In maintaining soil fertility, farmers have considerable empirical knowledge and understanding of the
necessity for crop rotations and a sufficient fallow period. In the past they have normally fallowed land
for more than 3 years. However, with an increasing demand on the limited land resource, the fallow
period has reduced from between five and three years to two or even just one year in some cases.
7.2.3 Indigenous knowledge
Despite the success of modern techniques, it is important to consider the indigenous knowledge of
smallholder farmers which affects some of the decisions. Thrupp (1989) noted the increasing
109

attention given to the indigenous knowledge and capabilities of smallholder farrrers in developing
countries as a potential basis for sustainable agricultural development. Rural people have a good
L nderstanding of their resources and often are adept t experimenting and adapting to changes over
·:' me. NumE:rous analysts have discLissed the knowl dge, practices, indigenous skills and beliefs of
rural farming people in developing countries. These insights and adaptive skills of farmers are often
derived fro :-n many years of experience and may be called cultural traditions . They often have been
communicated and learned through family members over generations. Olwiously, decisions to use
these ideas are not based on empirical measurement or cost benefit analyses as in conventional,
rnod9m science. Farmers in many parts of the world use their knowledge of the moon cycles as a basis
for farming, fishing and cultural practices. The specific activities vary in different regions, but some
aspects and principles are similar cross culturally (Th pp, 1989).
In ancient time~; Tongan smallholders had their own calendar mound which farm activities revolved .
,\s clays lookeci the same, the nights wera used to mark time through the phase of the moon, its
i.ime of rising, and the change of phases. The year comprised 13 months or phases and each phase
'Nas reckoned to consist of 28 days. The moon cycle within the month was divided into 3 main
)hases as shown in Figure 7.6. The month began when the th in crescent of the new moon was first
visible at sunset. It took 12 days from moonrise to fu ll moon and another 12 days to moon set. The
moon disappea red for a period of 4 5 days before rising again.
FigLlre 7.6: The three main pha!;es of tile moon.
PHASE 1 PHASE 2 PHASE 3 PHASE 1
Moon rise •............... ~ Full moon ................ ~ Moon Sf;t •............... •• Moon rise •............... ~
(Tu'u 'ae mahina:, (Katoa 'ae mahinaj
1;';;'I::'"Y' .. !-. Weeding
12 days
Source: Hav8a, pers comm. 1998; Field survey, 1998
(Mate 'ae mahina)
····· .. I .. ······ ·~··~~~~· Preparation.
(Tu'u 'ae mahina)
12 days
';/~',Jng
The Tongan ccllendar is significant in agricultural activities and decisions lhat the smallholder makes
in terms of tir.ling and productivity'. Figure 7.7 shows the passage of the year being generally
marked by reference to the month:3; two main seasons and t,:e names were based on the relative
growth and de.Jelopment of yam CUltivation.
Broadly it states that there are nat ra lly advantageous times to plant certain crops, and to weed and
prepare land. A key informant pointed out that "the principle of achieving maximum results with
minimum effol1 is still reflected in our lunar calenda r", which stressed that the importance of doing
the right ':hing at the right time saved effort and time (Havea. (1998) per:,. comm). The best time of
the month to plant crops is deterr1 ined by the phase of the moon. CroDs are said to grow best if
planted tetween moonrise (tu'u) and fu ll moon (katoa) and weeding is bE)st when the moon starts to
110

phase out (mate). The period of 4 to 5 days between set and moon rise, normally known as the
"disappearing moon", is considered the best time for land or seedbed preparation, and preparation
of planting materials. Smallholder farmers normally set out their farm work program accordingly. As
some asserted: "we never plant our root crops beyond full moon or when the moon is weak, we will
be getting low yields, and we never weed before full moon when the moon is strong, as it is hard to
kill weeds during this time'.
Figure 7.7: Tongan lunar months and key activities.
Season Months Tongan calendar Features and activities
January Lihamui Rainy season start s(First Rain) Weeding for most root crops
::r: Vaimu'a Mulching and looping for vanilla s:. February Planting of banana, plantain Sl> Latter rains ::J a. Weeding for root crops :E Vaimui Land preparation for next season plantings ~ March Planting peanuts en tD Early Spring Sl> m Weed management 0 Faka'afumo'ui ::J Thinning vanilla beans
April Planting vegetables End of Spring
Faka'afumate Planting sweet potatoes May Weeding
Harvesting of yam
Hilinga keJekeJe Land preparation (plough and disc) Planting sweet potatoes
June Weeding
:E Drying of yam planting material
II) Hilingame'aa Early yam planting 3 July Weeding
~ Yam planting a. ~o'ao Vanilla harvesting 0 August Squash planting -< (I> Squash fertiliser and insecticide application II) Fufunekinanga Staking of yam II) (I> Planting sweet potatoes 0 :::I
September Vanilla drying, pollination, looping 'O'oamofangongo Planting watermelon
Late yam plantings 'UJuenga Vanilla pollination
October Vegetable planting Taro plantino Yam start growing
Tanumanga Harvesting sweet potatoes November banana and plantain
Lihamu'a Yam tubers start to develop
December Harvesting watermelon Lihamui Harvesting vegetables
Source: Havea, pers comm. 1998; Field survey, 1998
It was evident from this study that some rural farmers know the basic calendar and still operate
accordingly, although some young farmers are discarding it with the increasing modernisation of
agriculture with new crops, varieties, fertilisers, chemicals, and technologies available. There is a
111
I
lack of information from MAF research to back up the indigenous ideas. Some of the traditional
farmers suggested that MAF should conduct more adaptive research on some of the traditional
methods and compare them to the modern methods they wish to promote.
7.3 Significance of Domesticated Livestock
As noted in Chapter 3, livestock plays a significant role in the Tongan agriculture system. Livestock
development in Tonga has been aimed at back-yard semi-commercialised operations performed by
smallholders to meet family goals of self-sufficiency in food and protein production and, to a greater
extent, to cater for religious and social obligations. As a cash product, livestock is sold almost
exclusively for the domestic markets with an active local demand for live animals, and very little of
this produce is exported to neighbouring nations. In addition, the domestic role of livestock is
complex and complicated by tradition. On ceremonial occasions, such as a funeral. wedding,
birthdays and church feasts, herds are often slaughtered. Very few people sell them for cash.
Survey results summarised in Table 7.6 indicate that every household surveyed owned pigs, poultry
and a minority of farmers own a few cattle, horses and goats.
7.3.1 Pigs
Pigs are the most prestigious livestock raised in Tonga, and are owned by more than 90 percent of
the survey sample (Table 7.6). As noted, domestic pigs play an important role in social obligations,
mainly for gifts and exchange at feasts, weddings and funerals. Most of the respondents described
the pig raising purposes as social and religious obligations. home consumption and cash, in that
order of importance. Pork is not included in the average Tongan weekly diet, being consumed
primarily during special occasions.
The study found the pig population per household to be much higher in the two villages at Ha'apai
than in Vava'u and Tongatapu. Table 7.7 shows the total number of pigs raised per household which
comprised boars, sows, porkers and weaners. While there are 15 pigs per household in Ha'apai.
there are only about 9 in Vava'u and Tongatapu. This may be a reflection of the lower amount of
cropping in this region compared to the other two SUb-regions. As vanilla, kava, squash and root crops
provide high receipts in Vava'u and Tongatapu, raising pigs is a comparatively low priority activity. In
T ongatapu, some respondents also claimed that the high cost and limited availability of pig feed is the
major constraint. In contrast, the high production of cassava and the excess of coconuts in the
Ha'apai region provides adequate feed to support the higher pig population.
112
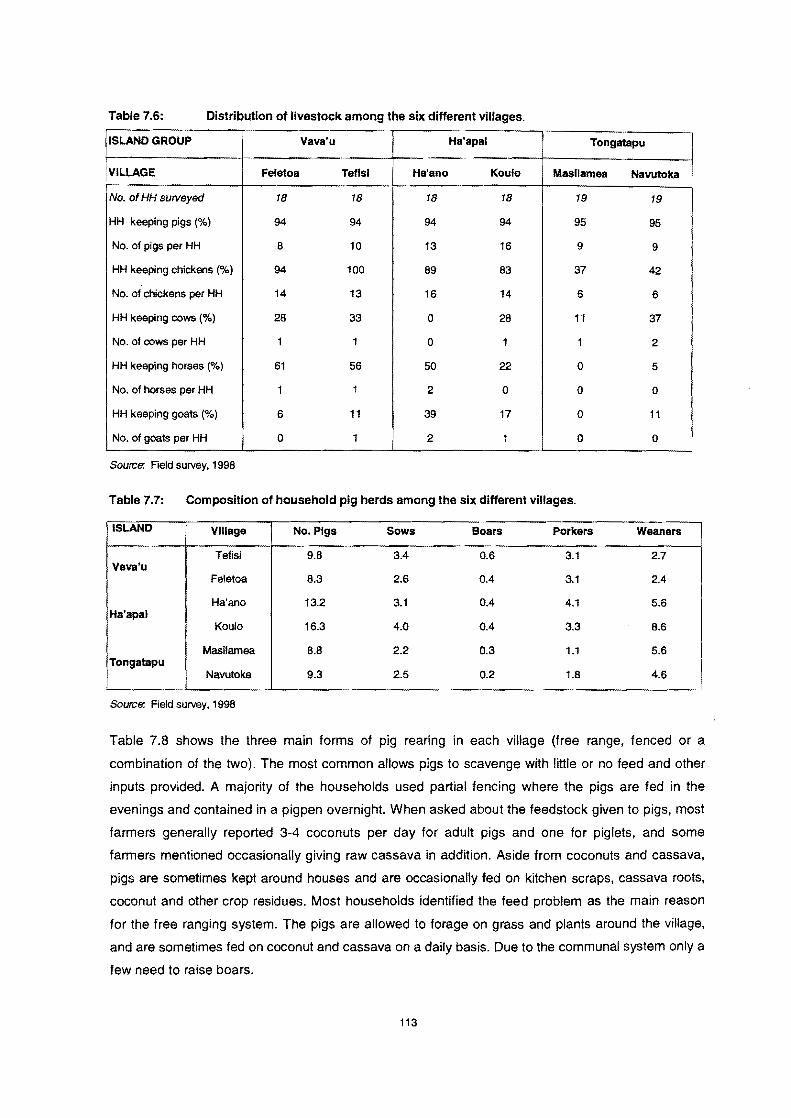
Table 7.6: Distribution of livestock among the six different villages.
ISLAND GROUP Vava'u Ha'apai Tongatapu 1
!VILLAGE Feletoa Tetlsl Ha'ano Koulo Masllamea Navutoka
No. of HH surveyed 18 18 18 18 19 19
HH keeping pigs (%) 94 94 94 94 95 95
No. of pigs per HH 8 10 13 16 9 9
HH keeping chickens (%) 94 100 89 83 37 42
No. of chickens per HH 14 13 16 14 6 6
HH keeping cows (%) 28 33 0 28 11 37
No. of cows per HH 1 1 0 1 1 2
HH keeping horses (%) 61 56 50 22 0 5
No. of horses per HH 1 1 2 0 0 0
HH keeping goats (%) 6 11 39 17 0 11
No. of goats per HH 0 1 2 1 0 0 I
Soun:::e: Field survey, 1998
Table 7.7: Composition of household pig herds among the six different villages.
ISLAND Village No. Pigs Sows Boars Porkers Weaners , Tefisi 9.8 3.4 0.6 3.1 2.7
Vava'u Feletoa 8.3 2.6 0.4 3.1 2.4
Ha'ano 13.2 3.1 0.4 4.1 5.6 Ha'apal
Koulo 16.3 4.0 0.4 3.3 8.6
Masilamea 8.8 2.2 0.3 1.1 5.6 Tongatapu
I Navutoka 9.3 2.5 0.2 1.8 4.6
Soun:::e: Field survey, 1998
Table 7.8 shows the three main forms of pig rearing in each village (free range, fenced or a
combination of the two). The most common allows pigs to scavenge with little or no feed and other
inputs provided. A majority of the households used partial fencing where the pigs are fed in the
evenings and contained in a pigpen overnight When asked about the feedstock given to pigs, most
farmers generally reported 3-4 coconuts per day for adult pigs and one for piglets, and some
farmers mentioned occasionally giving raw cassava in addition. Aside from coconuts and cassava,
pigs are sometimes kept around houses and are occasionally fed on kitchen scraps, cassava roots,
coconut and other crop residues. Most households identified the feed problem as the main reason
for the free ranging system. The pigs are allowed to forage on grass and plants around the village,
and are sometimes fed on coconut and cassava on a daily basis. Due to the communal system only a
few need to raise boars.
113
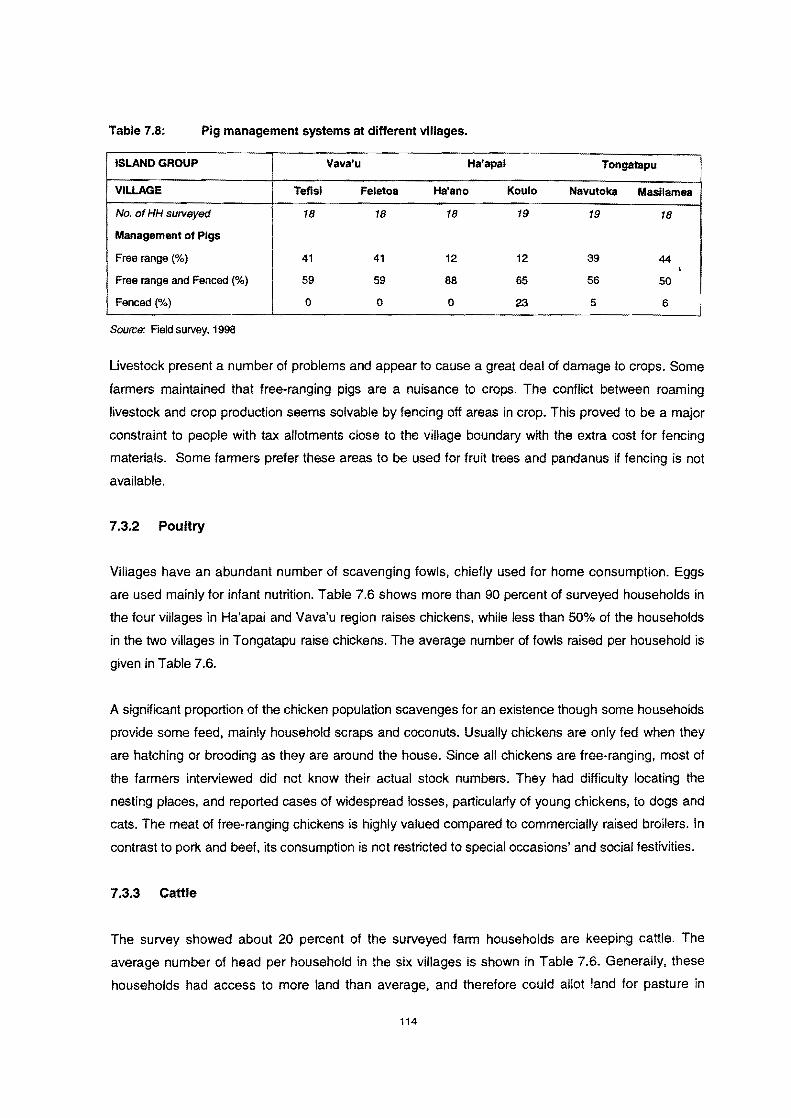
Table 7.8: Pig management systems at different villages.
ISLAND GROUP Vava'u Ha'apal Tongatapu
VILLAGE Tefisi Feletoa Ha'ano Koulo Navutoka Masiiamea
No. of HH surveyed 18 18 18 19 19 18
Management of Pigs
Free range (%) 41 41 12 12 39 44 \
Free range and Fenced (%) 59 59 88 65 56 50
Fenced ("/0) 0 0 0 23 5 6 I Source: Field survey, 1998
Livestock present a number of problems and appear to cause a great deal of damage to crops. Some
farmers maintained that free-ranging pigs are a nuisance to crops. The conflict between roaming
livestock and crop production seems solvable by fencing off areas in crop. This proved to be a major
constraint to people with tax allotments close to the village boundary with the extra cost for fenCing
materials. Some farmers prefer these areas to be used for fruit trees and pandanus if fencing is not
available.
7.3.2 Poultry
Villages have an abundant number of scavenging fowls, chiefly used for home consumption. Eggs
are used mainly for infant nutrition. Table 7.6 shows more than 90 percent of surveyed households in
the four villages in Ha'apai and Vava'u region raises chickens, while less than 50% of the households
in the two villages in Tongatapu raise chickens. The average number of fowls raised per household is
given in Table 7.6.
A significant proportion of the chicken population scavenges for an existence though some households
provide some feed. mainly household scraps and coconuts. Usually chickens are only fed when they
are hatching or brooding as they are around the house. Since all chickens are free-ranging. most of
the farmers interviewed did not know their actual stock numbers. They had difficulty locating the
nesting places, and reported cases of widespread losses, particularly of young chickens, to dogs and
cats. The meat of free-ranging chickens is highly valued compared to commercially raised broilers. In
contrast to pork and beef, its consumption is not restricted to special occasions' and social festivities.
7.3.3 Cattle
The survey showed about 20 percent of the surveyed farm households are keeping cattle. The
average number of head per household in the six villages is shown in Table 7.6. Generally, these
households had access to more land than average, and therefore could allot land for pasture in
114

addition to agricultural cultivation. Occasionally. cattle are tethered on garden fallow lands in tax
allotments where they live on the natural vegetation grazing grass and weeds under coconuts. No
fenced or improved pasture was found. The water supply of the animals is also far from secure.
Several farmers expound the belief that cattle have no need for supplementary water since the
animals have adequate access to rain water and to water-rich vegetation like banana stems. The
problem is mainly the lack of transport facilities to carry water from the village to the bush.
Cattle have entered the social system as most are traded, or exchanged, and butchered for feasts.
The study found that a majority kept cattle as a source of meat for very special occasions, mainly
religious obligations and social feasting such as funerals, weddings and birthdays. Similarly, some
households purchased cows for these obligations, and most sales are for urgent matters such as
school fees and church donations (misina/e).
7.3.4 Goats
Goats were owned by 15 percent of the total survey sample, with the average number per
household being 2 to 3. The local goat breed is a mixture based on the Saanen, a breed that has a
large mature size. However, due to the incidence of inbreeding, the adult is now medium to small.
Goat raising was found to be more dominant in Ha'apai. Goats are shepherded in village herds or
tethered in small lots on the fallow land, or sometimes free ranging or tethered within the village or
its nearby surroundings. Their feed consists of natural vegetation.
Goats are not milked. As a general rule goats are not rated very highly and only members of the
Seventh Day Adventist Church, who abstain from eating pig meat for religious reasons, rate goats
more highly and keep small herds numbering up to seven head. Goat meat is not usually reserved
for special occasions and goats are slaughtered for the less important festivals, or when there is
insufficient pig meat. In addition, because of the low status ascribed to goats, use of goat's milk is
avoided. Thus, the role of the goat in the Tongan agriculture is expected to remain one of little
significance.
Informants complained of extensive damage to crops caused by roaming goats. This problem is
complicated by the fact that tethering can lead to increased attacks by dogs and to foot rot. The
inhabitants of the outer-islands suggested increasing the number of goats in uninhabited islands
since goats tolerate drinking-water shortages, a situation that would also contribute to a reduction of
foot rot.
115
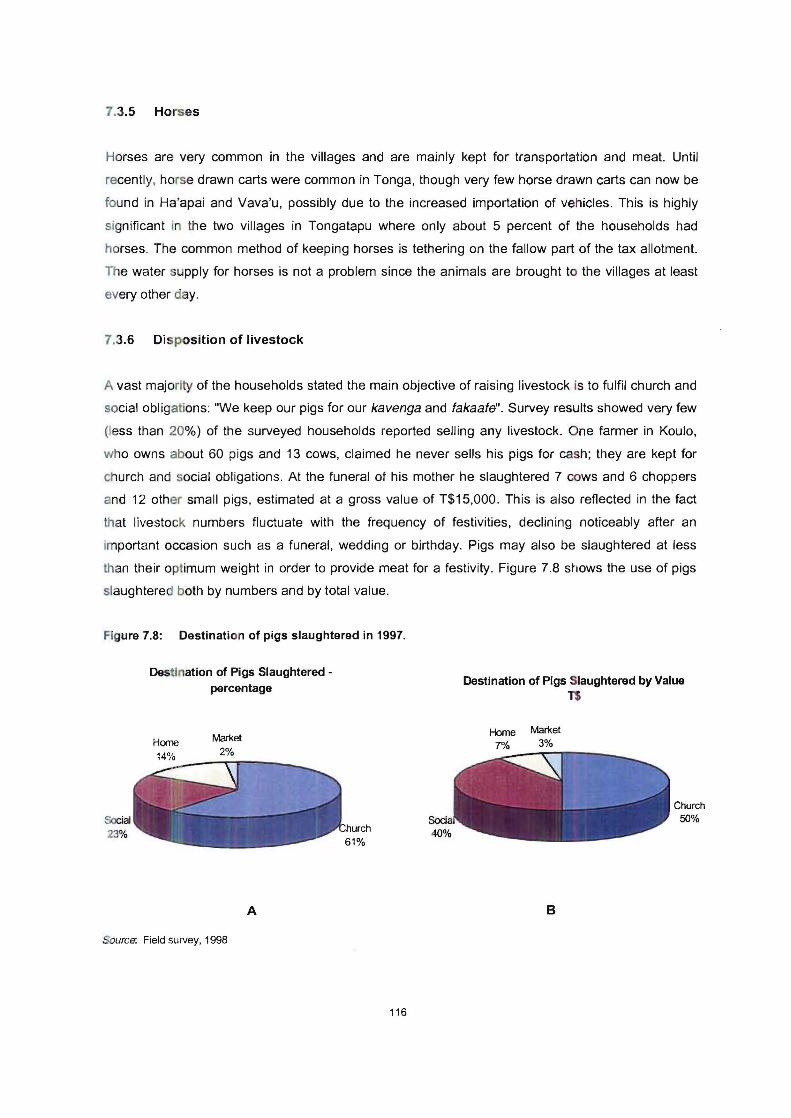
7.3.5 Horses
Horses are very common in the villages and are mainly kept for transportation and meat. Until
recently, horse drawn carts were common in Tonga, though very few horse drawn carts can now be
found in Ha'apai and Vava'u, possibly due to the increased importation of vehicles. This is highly
significant i the two villages in Tongatapu where only about 5 percent of the households had
horses. The common method of keeping horses is tethering on the fallow part of the tax allotment.
The water upply for horses is not a problem since the animals are brought to the villages at least
every other day.
7.3.6 Disposition of livestock
A vast majori ty of the households stated the main objective of raising livestock is to fulfil church and
social obligations: "We keep our pigs for our kavenga and fakaafe". Survey results showed very few
(less than 20%) of the surveyed households reported selling any livestock. One farmer in Koulo,
who owns about 60 pigs and 13 cows, claimed he never sells his pigs for cash; they are kept for
church and social obligations. At the funeral of his mother he slaughtered 7 cows and 6 choppers
and 12 other small pigs, estimated at a gross value of T$15.000 . This is also reflected in the fact
that livestock numbers fluctuate with the frequency of festivities, declining noticeably after an
important occasion such as a funeral, wedding or birthday. Pigs may also be slaughtered at less
than their optimum weight in order to provide meat for a festivity. Figure 7.8 shows the use of pigs
slaughtered both by numbers and by total value.
Figure 7.8: Destination of pigs slaughtered in 1997.
Social 23%
Destination of Pigs Slaughtered -percentage
Home Market 2%
A
Source: Field survey, 1998
116
Destination of Pigs Slaughtered by Value 1$
Home Mar1<et 7% 3%
B
Church 50%
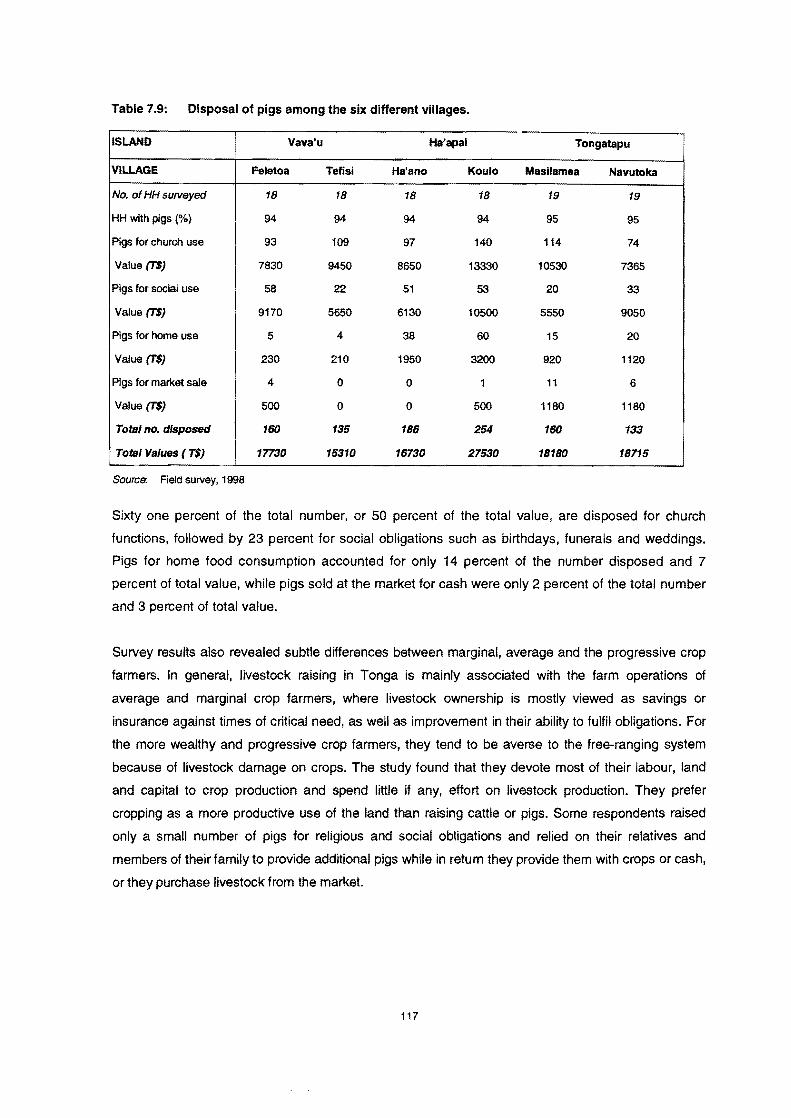
Table 7.9: Disposal of pigs among the six different villages.
ISLAND Vava'u Ha'apal Tongatapu
VILLAGE Feletoa Tefisl Ha'ano Koulo Masilamea Navutoka
No. of HH surveyed 18 18 18 18 19 19
HH with pigs ('Yo) 94 94 94 94 95 95
Pigs for church use 93 109 97 140 114 74
Value (T$) 7830 9450 8650 13330 10530 7365
Pigs for social use 58 22 51 53 20 33
Value (T$) 9170 5650 6130 10500 5550 9050
Pigs for home use 5 4 38 60 15 20
Value (T$) 230 210 1950 3200 920 1120
Pigs for market sale 4 0 0 1 11 6
Value (T$) 500 0 0 500 1180 1180
Total no. disposed 160 135 186 254 160 133
Total Values ( T$) 17730 15310 16730 27530 18180 18715
Source:. Field survey, 1998
Sixty one percent of the total number, or 50 percent of the total value, are disposed for church
functions, followed by 23 percent for social obligations such as birthdays, funerals and weddings.
Pigs for home food consumption accounted for only 14 percent of the number disposed and 7
percent of total value, while pigs sold at the market for cash were only 2 percent of the total number
and 3 percent of total value.
Survey results also revealed subtle differences between marginal, average and the progressive crop
farmers. In general, livestock raising in Tonga is mainly associated with the farm operations of
average and marginal crop farmers, where livestock ownership is mostly viewed as savings or
insurance against times of critical need, as well as improvement in their ability to fulfil obligations. For
the more wealthy and progressive crop farmers, they tend to be averse to the free-ranging system
because of livestock damage on crops. The study found that they devote most of their labour, land
and capital to crop production and spend little if any, effort on livestock production. They prefer
cropping as a more productive use of the land than raising cattle or pigs. Some respondents raised
only a small number of pigs for religious and social obligations and relied on their relatives and
members of their family to provide additional pigs while in return they provide them with crops or cash,
or they purchase livestock from the market.
117

7.3.7 Marketing livestock
Live sale is the normal method of marketing pigs and cattle, which are then used for slaughter in
social and church obligations. Prices are based on the characteristics demanded by the occasion. For
pigs intended for presentation in traditional ceremonies, the size of the animal may not be as
important as the size of the tusks. A live back fatter, or "puaka toho" could sell for T$600-T$800 while
a sow would sell for T$150-$250, weaners sell at an average price of T$30-T$60. For cattle, size and
condition are the main determinants. A three-year-old steer in good condition could fetch T$600-
T$1000 on the hoof. Market prices for a horse range from: T$350-T$600 per head and goats (T$30-
45 per head).
The domestic market for livestock products is not a problem for producers. Demand for pigs and cattle
is still high and good prices are obtained. Village pigs supply most of the pork consumed locally. A
few commercial producers - individuals and college institutions, supply the bulk of the local beef that
enters the market. The same applies to the milk supply. The local broiler and layer chicken industry
is reasonably well established and supplies most of the chicken meat and eggs consumed in
Tonga. High imported feed costs are the major difficulty facing commercial producers. Attempts at
intensive pig raising have not been successful, with only five such units now in operation. The main
constraints have been the high costs of establishment and imported feeds, lack of appropriate
technical and management skills, and an inadequate market infrastructure.
Tonga relies more on imported meat product for daily home consumption needs. It is estimated that
local production only accounts for about 26 percent of meat consumed in the country ('Akolo, 1997).
The balance is made up of imported mutton flaps, corned beef, poultry and other types of meat. As
indicated in Table 7.10, Tonga imported over T$6 million per annum of meat of various types during
the 1990s.
Table 7.10: Value of meat imported to Tonga in 1990 -1996.
YEAR Commodity 1990 1991 1992 1993 1994 1995 1996
Value In T$'ooo Poultry products 1325.4 1199.1 1261.4 1389.7 1587.3 1678.3 1950.4
Mutton flaps 2611 2547.6 2936.5 2785.4 2569.2 2736.2 2601.5
Beef 140 189.3 113.8 198.3 219.3 246.7 312.4
Corned Beef 2313.9 1995.7 2113.6 2058.3 2105.4 2068.9 2207.8
Other 427.9 157.3 94.5 287.6 402.6 389.3 464.8
Total meat L 6818.2 6089 6519.8 6719.3 6883.8 7119.4 7536.9
% of Total food 20.2 20.6 21.9 25.5 26.8 27.3 29.1
Source: MAF,1996a
118
Altogether livestock products account for approximately 28 percent of the total food imports
between 1991-1997. Such very large amounts of meat imports provide considerable scope for
import substitution through expanding all existing forms of livestock production. The development of
livestock should move towards self-sufficiency in fresh and frozen livestock products.
7.4 Conclusions
In addition to the farmers' goals and priorities, household decisions concerning land use are likely to
be influenced by several factors including land tenure, climate, soil types and fertility. The increase
in population has made it impossible for every Tongan male to acquire his constitutional right to
land from the limited land resource base. It was evident from this study that land use competition is
much more intense than a decade ago as the amount of people with no land is increasing. Until the
present, land development and an increase in the number of farmers has been seen as a process
of bringing virgin land into production. The availability of such land is now limited. If policies aimed
at increasing smallholder development are to succeed, they need to be based on intensification of
land use rather than development of new areas. The emerging forms of land use competition all
indicate that future land use planning and strategies for increasing smallholder production will have
to be directed towards achieving higher productivity from the land already in use. The study also
confirmed previous studies by Thaman (1976); Sevele (1973); Hardaker (1975); Menz (1988) and
Delforce (1990) that households with only temporary access to land were often precluded from
planting relatively long-term crops due to the terms under which land was borrowed.
The study showed that all villages normally adopt a farming system characterised by a broad mix of
traditional food crops, cash crops, tree crops and livestock, to provide for household food
requirement and to fulfil social and religious obligations and market surpluses. The outstanding
socio-economic characteristic of the intercropping mixed system is its space-saving attribute. Land
is a vital resource and is especially important to a smallholder farm that occupies a few hectares of
land. To achieve optimum use of the resources available, intensive use of all forms of space is
essential, as shown by the cropping pattern adopted. In these villages the small area of land
available necessitated their planting a mix of crops (annual, perennial and trees) thereby getting as
much as possible out of the land. Some farmers, however, indicated that the system strikes a
balance between the shortage of land and the labour requirements. They argued that the
intercropping system allows the efficient use of the farm family labour available by spreading the
labour resources among a wide range of crops. Mixed cropping also allows crops to suppress
weeds and also results in the reduction of risk: a most important economic objective for any
smallholder farmer. The chances of all-staple subsistence food crops and major cash crops being
destroyed or seriously damaged by hurricane, drought, disease and pest infestation are greatly
119

reduced by intensive mixing. The diversity has the potential to provide a more balanced diet, as well
as a regular and adequate food supply.
Crop and livestock interactions are important in analysing any mixed farming systems. With
subsistence and commercial livestock raised by almost 80 percent of the village households,
livestock are an integral part of the traditional farming system. Livestock provide rural households
with many important benefits such as a supply of animal protein, income flows and capital reserves,
social status, weed control in fallow land, and transport. Pigs, which are fenced or free ranged in
villages and fed on crop byproducts, do not compete with crops for the use of land so these are
supplementary activities in the use of land. However, the interaction may be complementary or
mutually beneficial. Producing livestock in small to medium scale enterprises with the aim of obtaining
regular cash income has yet to be successfully adopted in Tonga. Overall, the contribution of
livestock to agricultural output is small, in comparison to crop production, being mainly a way of
meeting obligatory social contributions on important occasions. Livestock is expected to retain its
traditional role in the agricultural system of Tonga. The potential upgrading of stock, as well as the full
utilization of this agricultural component, is directly determined by Tongan farming traditions.
One of the outstanding characteristics of smallholding agriculture is the remarkable uniformity and
similarity of farm units which produce the same crop in the same way year after year. Mixed farming
predominates. with root crops, yam, taro, cassava, plantain and pigs being the most important
enterprises. There is empirical evidence that the variation in climate and soil conditions between the
three regions has influenced the cropping pattern. Some farmers said that their decision on which
crops to grow is based on the soil fertility status. For instance, the farmers in Ha'apai could not grow
kava and vanilla well because of their low fertility sandy loam soil. Variations are also attributed to
government policies. for example, the decision to allocate quota for squash export to only two regions
in 1997, with 80 percent for Tongatapu and 20 percent for Vava'u and none to Ha'apai. This also
affects farm size as well as the enterprise combination.
Three major features characterise Tongan agriculture: that is, a subsistence base, social orientation
and smallness in scale. Over the past century, with the addition of commercial elements, these
have become mixed subsistence cash-cropping systems, but the three major features persist
indicating the compatibility of these features with the situation within which they operate and their
resistance to change. Thus, while cash cropping has been practised for decades by smallholder
farmers, it represents largely an extension of the traditional subsistence system in which crops were
produced for subsistence, social exchange and ceremonial purposes. Some external changes have
been imposed upon, or incorporated into, the traditional system over the years. These have not yet
succeeded in markedly altering the agricultural systems from this essentially subsistence and social
reprocity system, nor have they substantially altered attitudes to and lor habits of work.
120

The next chapter contains an analysis of the farm household utilisation of labour and capital
resources, relative to smallholder farmers' land use practices.
121
CHAPTER 8
ANALYSIS OF HOUSEHOLD INCOME AND LABOUR USE
8.1 Introduction
The purpose of this chapter is to provide background information on the pattern of income
distribution and labour utilisation in rural households of the different villages. This analysis
provides an understanding of the resource endowments of different smallholder household
types in terms of the capital and labour resources available, their use and disposal. In farming
systems analysis it is important to gather information on a farm household basis for cash
income, its sources and disposal. Data on household consumption patterns, including food
consumption and whether home grown or purchased, and other household cash expenditure,
was collected. The analysis also includes the supply of agricultural labour, both family and hired.
This allows further decision variables and resource constraints to be derived and incorporated in
the model.
8.2 Household Cash Income
Table 8.1 contains information on household income sources, including farm (crops, livestock,
trees, handicrafts sales) and off-farm income. Off-farm income is the sum of earnings from full
time or casual employment, remittances from overseas, gifts (cash and in kind received within
Tonga) and other income. Information on household income is important not only in assessing
the significance of agriculture as a source of income but it also provides an indication of the
return to agriculture relative to other sources of income. While it is hazardous to estimate
household cash income based on an interview at one point in time, the data provides an indication
of villagers' income received during the last 12 months.
8.2.1 Source of income
An important feature of the households studied was that almost all obtained income from more
than one source during the period under consideration. Table 8.1 shows the five major sources
of income, that is agriculture, wage employment, fishing and other business, gifts and
remittances (from relatives and friends), and exchange of mats and tapa. Although this range of
cash earnings featured in all the six selected villages, there was significant variability amongst
them.
122
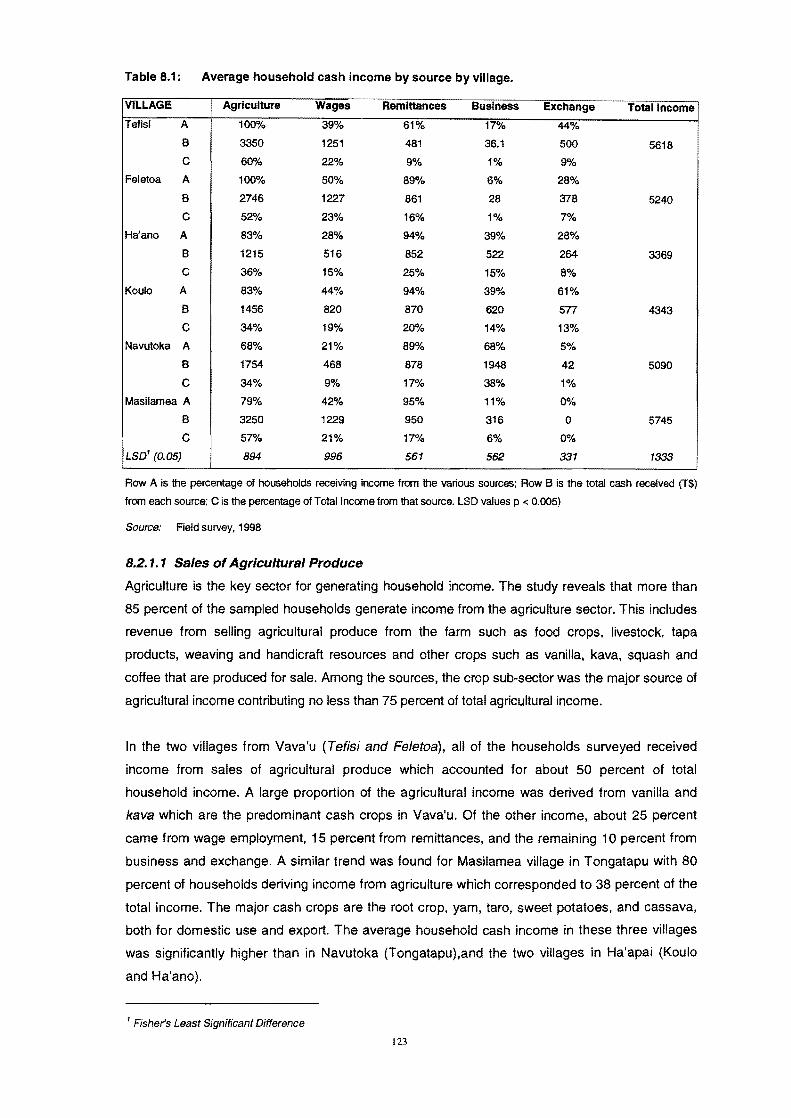
Table 8.1: Average household cash income by source by village.
VILLAGE Agriculture Wages Remittances Business Exchange Total Income Tefisi A 100% 39% 61% 17% 44%
B 3350 1251 481 36.1 500 5618 C 60% 22% 9% 1% 9%
Feletoa A 100% 50% 89% 6% 28%
B 2746 1227 861 28 378 5240 C 52% 23% 16% 1% 7%
Ha'ano A 83% 28% 94% 39% 28%
B 1215 516 852 522 264 3369 C 36% 15% 25% 15% 8%
Koulo A 83% 44% 94% 39% 61%
B 1456 820 870 620 577 4343 C 34% 19% 20% 14% 13%
Navutoka A 68% 21% 89% 68% 5%
B 1754 468 878 1948 42 5090
C 34% 9% 17% 38% 1%
Masilarnea A 79% 42% 95% 11% 0%
B 3250 1229 950 316 0 5745 C 57"10 21% 17% 6% 0%
LSD1 (0.05) 894 996 561 562 331 1333
Row A is the percentage of households receiving income from the various sources; Row B is the total cash received (T$)
from each source; C is the percentage of Total Income from that source. LSD values p < 0.005)
Source: Field survey, 1998
8.2.1.1 Sales of Agricultural Produce
Agriculture is the key sector for generating household income. The study reveals that more than
85 percent of the sampled households generate income from the agriculture sector. This includes
revenue from selling agricultural produce from the farm such as food crops, livestock, tapa
products, weaving and handicraft resources and other crops such as vanilla, kava, squash and
coffee that are produced for sale. Among the sources, the crop sub-sector was the major source of
agricultural income contributing no less than 75 percent of total agricultural income.
In the two villages from Vava'u (Tefisi and Fe/etoa). all of the households surveyed received
income from sales of agricultural produce which accounted for about 50 percent of total
household income. A large proportion of the agricultural income was derived from vanilla and
kava which are the predominant cash crops in Vava'u. Of the other income, about 25 percent
came from wage employment, 15 percent from remittances, and the remaining 10 percent from
business and exchange. A similar trend was found for Masilamea village in Tongatapu with 80
percent of households deriving income from agriculture which corresponded to 38 percent of the
total income. The major cash crops are the root crop, yam, taro, sweet potatoes, and cassava,
both for domestic use and export. The average household cash income in these three villages
was significantly higher than in Navutoka (Tongatapu),and the two vii/ages in Ha'apai (Koulo
and Ha'ano).
t Fisher's Least Significant Difference
123

In Ha'ano village (Ha'apai), cash income is largely derived from the sale of pandanus (kie) , root
crops, plantain, mangoes, tava and copra. There is some planting of coffee but, due to
production and marketing problems, many plantings are now neglected. Kie is perceived by
many of the farmers in Ha'ano as an important cash crop with future potential and some farmers
are increasing planting of pandanus. They regarded its advantages as being easy to plant and
manage, easy to market in terms of transportation, non-perishable and high value returns. Most
of it is being marketed in Tongatapu while processed pandanus in the form of mats and
handicrafts is exported. The development of fruit and vegetable crops has been retarded by a
general lack of expertise, the lack of a support infrastructure including available inputs and local
market facilities, and the ravages of pigs (which necessitates fences and covering).
8.2.1.2 Wages and Salary Earnings
Income derived from off-farm employment made up a considerable amount of the total
household average income in all the six villages. A majority of the households had educated
their children most of who are now working as civil servants or in other employment
opportunities that provide cash for the household. Between 20 and 50 percent of the village
households received a permanent wage or salary either from the head of the household or from
other members within the household. Paid employment, as a contributor to total average
income, provided 15 to 22 percent, except in Navutoka village, which was significantly less with
10 percent. This implies households diversify human labour use into paid employment
opportunities. In Feletoa and Koulo, group agricultural labourers are prominent, earning an
hourly rate of T$2.50 to T$3 per hour. All other wage earning positions are connected to the
Government. In each village, the village or town officer (,of is a kolo) and District Officer (Pule
fakavahe) received about T$30 and T$40 per fortnight respectively. Four of the villages have
agricultural extension officers earning a salary rate of T$2000 to T$6000 per year. A number of
primary school teachers have salary rates ranging from T$3000 to T$7000 per annum. Several
church positions were paid in each village. Ministers and stewards received about T$1000 and
T$250 per annum respectively. The significance of the off-farm income on potential agricultural
development earnings of different farm types will be explored in the model experiments.
Table 8.2: Wage employment incomes.
I Occupation Annual Salary Range (T$)
Civil servants 2000 - 7000
Church Ministers 800-2000
! Agricultural Labour 1000-2000
Source: Field survey, 1998
8.2.1.3 Gifts and Remittances Cash remittances from overseas migrants are an important part of the Tongan economy. It has
been estimated that private remittances, including those that are from both family and church
sources, contribute approximately 40 percent of Tonga's foreign exchange (National Reserve
124

Bank, 1997). In the present study, unearned income accruing from remittances from outside the
island was difficult to estimate as some are not in cash but in goods. However, at the level of
village economy, the data collected indicates that remittances (from overseas and in country
migrants) are the second most important source of household cash income.
More than 85 percent of the households in all the villages, except Tefisi, received cash
remittances. A majority of the households have adult members of their families living and
working overseas who frequently send help in the form of cash and goods. The most common
sources of remittances were from the United States, New Zealand and Australia, while
Tongatapu was also a source for villages in the Ha'apai and Vava'u groups. The amount of
money remitted varied both within and between villages. One informant stated that he had to
provide only food for the builders of his T$24,000 new house; his sons had sent all the material
and the money to pay for the builders. A majority of the households (95 percent) indicated most
of the household remittances were from children to parents or vice versa. The importance of
private remittances reflects the strong ties within the nuclear family and, to some extent, within
extended families.
It has been argued that remittances take away the motivation of locals to increase commercial
production. However, the results of this study showed that in fact locals market large
consignments of root crops and local produce overseas through their relatives and friends. For
example in Vava'u, an increasing number of people send kava, yams and root crops directly to
their relatives in New Zealand to sell. In Feletoa village, about 45 percent of households
reported regularly sending kava, food crops (yam, taro) and mats direct to their relatives
overseas. These findings support 'Akolo (1997) who noted the large unrecorded exports of root
crops to relatives in Australia, New Zealand and the United States in return for remittances of
proceeds and other cash resources as well as goods for sale at the local fairs and flea markets.
B.2. t.4 Business The cash income from business derives primarily from small retail stores, fishing, and
transportation services such as taxis, boats, and buses. As a source of household cash income,
the sale of fish was most significant in Navutoka; 68 percent of the household surveyed reported
receiving income from this source and the income accounted for 30 percent of the total average
household income. This was followed by Koulo with 12 percent while the other villages were about
5 percent. The data indicated that the comparatively higher earnings and greater significance of
this source resulted largely from the better access to market opportunities and facilities in
Tongatapu than in outer islands. A majority of the households in the other five villages fish for
home consumption and very little for cash. The major problem with fishing includes the lack of
refrigeration facilities and inadequate markets.
B.2. t.5 Exchange of Handicrafts Another source of household income is derived from the exchange of products (mats, tapa,
ta'ova/a) for cash, furniture, and other goods, particularly between women's groups. In absolute
125

values, household cash income from the exchange of mats and handicrafts was highest in
Ha'apai and Vava'u and accounted for an average of 10 to 15 percent of the total income and
30 to 60 percent of the households' derived income from this source. This reflects the fact that
women's groups are significantly more active in these two regions compared to Tongatapu.
Exchange is mainly organised by women's groups. Some argued that Ha'apai and Vava'u have
better access to raw materials, especially pandanus and mulberry. The declining performance of
the Tourism industry has a major impact on the marketing of handicrafts.
8.2.2 Variation in income among villages
In Ha'ano village (Ha'apai), remittances are the major source of income, averaging 35 percent,
followed by agriculture (29 percent) and wages (21 percent). In Koulo village (Ha'apai), income
derived from wage employment was, surprisingly, the main source of income. The location of
the airport in the village and the closeness to Pangai, the capital, provides more opportunities
for paid employment which accounts for a majority of households earning. The farm labourer
groups kautaha are also dominant, so agricultural labourer earnings also contribute. Some
households are also involved in commercial fishing, and womens' groups exchange mats and
handicrafts.
In Navutoka (Tongatapu), on the other hand, gifts and remittances, and fishing, business were
the major sources of household cash income, comprising about 37 percent and 30 percent
respectively. Agriculture accounted for 20 percent and wage employment for 12 percent. Data in
Table 8.3 shows the breakdown of household income level per village. In Ha'ano, 44 percent of
households received a total annual income of less than $2000, and 66 percent received
between T$2000 to $5000. In contrast, in Masilamea village none of the household had a total
annual income of less than T$2000, while more than 50 percent received income of more than
T$5000. This has resulted from a majority of households engaging in commercial agriculture. as
indicated by the highest average income from agriculture.
Table 8.3: Percentage households by income category.
Village O-T$2000 T$2001-SOOO 1$5001 plus
Tefisi 28 39 33 Feletoa 6 61 33 Ha'ano 44 66 0
Koulo 17 72 11 Navutoka 16 58 26 Masilamea 0 47 53
Source: Field survey, 1998
126
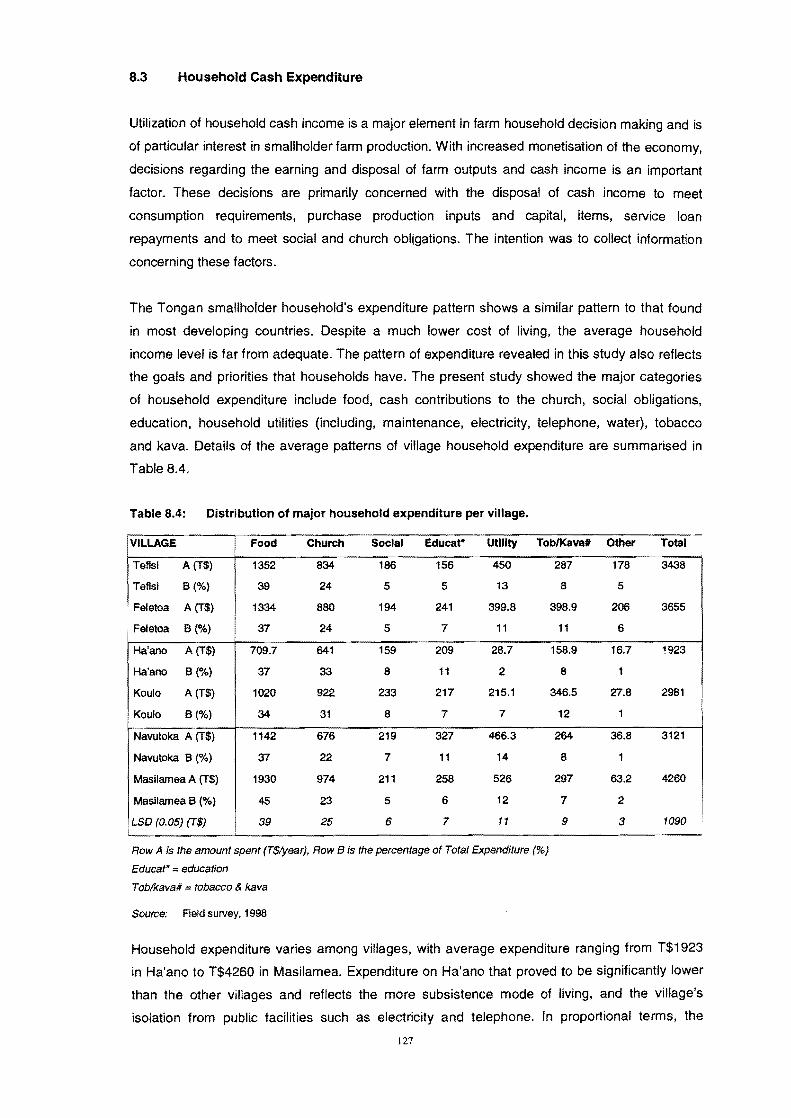
i
8.3 Household Cash Expenditure
Utilization of household cash income is a major element in farm household decision making and is
of particular interest in smallholder farm production. With increased monetisation of the economy,
decisions regarding the earning and disposal of farm outputs and cash income is an important
factor. These decisions are primarily concerned with the disposal of cash income to meet
consumption requirements, purchase production inputs and capital, items, service loan
repayments and to meet social and church obligations. The intention was to collect information
concerning these factors.
The Tongan smallholder household's expenditure pattern shows a similar pattern to that found
in most developing countries. Despite a much lower cost of living, the average household
income level is far from adequate. The pattern of expenditure revealed in this study also reflects
the goals and priorities that households have. The present study showed the major categories
of household expenditure include food, cash contributions to the church, social obligations,
education, household utilities (including, maintenance, electricity, telephone, water), tobacco
and kava. Details of the average patterns of village household expenditure are summarised in
Table 8.4.
Table 8.4: Distribution of major household expenditure per village.
VILLAGE Food Church Social Educat* Utility ToblKava# Other Total
Tefisi A (T$) 1352 834 186 156 450 287 178 3438
Tefisi B (%) 39 24 5 5 13 8 5
Feletoa A (T$) 1334 880 194 241 399.8 398.9 206 3655
!
• Feletoa B (%) 37 24 5 7 11 11 6
i
Ha'ano A (T$) 709.7 641 159 209 28.7
Ha'ano B (%) 37 33 8 11 2
Koulo A (T$) 1020 922 233 217 215.1
Koulo B(%) 34 31 8 7 7
Navutoka A (T$) 1142 676 219 327 466.3
Navutoka B (%) 37 22 7 11 14
Masilamea A (T$) 1930 974 211 258 526
Masilamea B (%) 45 23 5 6 12
LSD (0.05) (T$) 39 25 6 7 11
Row A is the amount spent (T$/year), Row B is the percentage of Totai Expenditure (%)
Educat* :; education
Toblkava# :; tobacco & kava
Source: Field survey. 1998
158.9 16.7 1923
8 1
346.5 27.8 2981
12 1
264 36.8 3121
8 1
297 63.2 4260
7 2
9 3 1090
Household expenditure varies among villages, with average expenditure ranging from T$1923
in Ha'ano to T$4260 in Masilamea. Expenditure on Ha'ano that proved to be significantly lower
than the other villages and reflects the more subsistence mode of living, and the village's
isolation from public facilities such as electricity and telephone. In proportional terms, the
127
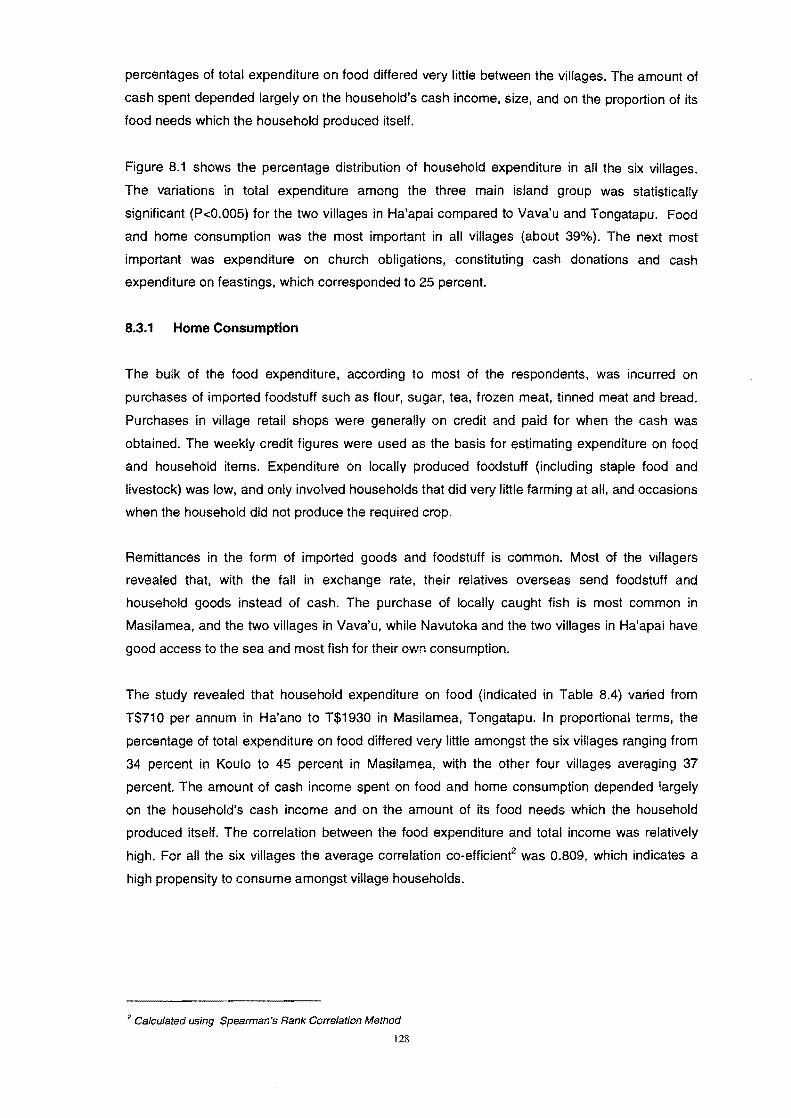
percentages of total expenditure on food differed very little between the villages. The amount of
cash spent depended largely on the household's cash income, size, and on the proportion of its
food needs which the household produced itself.
Figure 8.1 shows the percentage distribution of household expenditure in all the six villages.
The variations in total expenditure among the three main island group was statistically
significant (P<0.005) for the two villages in Ha'apai compared to Vava'u and Tongatapu. Food
and home consumption was the most important in all villages (about 39%). The next most
important was expenditure on church obligations, constituting cash donations and cash
expenditure on feastings, which corresponded to 25 percent.
8.3.1 Home Consumption
The bulk of the food expenditure, according to most of the respondents, was incurred on
purchases of imported foodstuff such as flour, sugar, tea, frozen meat, tinned meat and bread.
Purchases in village retail shops were generally on credit and paid for when the cash was
obtained. The weekly credit figures were used as the basis for estimating expenditure on food
and household items. Expenditure on locally produced foodstuff (including staple food and
livestock) was low, and only involved households that did very little farming at all, and occasions
when the household did not produce the required crop.
Remittances in the form of imported goods and foodstuff is common. Most of the villagers
revealed that, with the fall in exchange rate, their relatives overseas send foodstuff and
household goods instead of cash. The purchase of locally caught fish is most common in
Masilamea, and the two villages in Vava'u, while Navutoka and the two villages in Ha'apai have
good access to the sea and most fish for their own consumption.
The study revealed that household expenditure on food (indicated in Table 8.4) varied from
T$710 per annum in Ha'ano to T$1930 in Masilamea, Tongatapu. In proportional terms, the
percentage of total expenditure on food differed very little amongst the six villages ranging from
34 percent in Koulo to 45 percent in Masilamea, with the other four villages averaging 37
percent. The amount of cash income spent on food and home consumption depended largely
on the household's cash income and on the amount of its food needs which the household
produced itself. The correlation between the food expenditure and total income was relatively
high. For all the six villages the average correlation co-efficient2 was 0.809, which indicates a
high propensity to consume amongst village households.
2 Calculated using Spearman's Rank Correlation Method
128
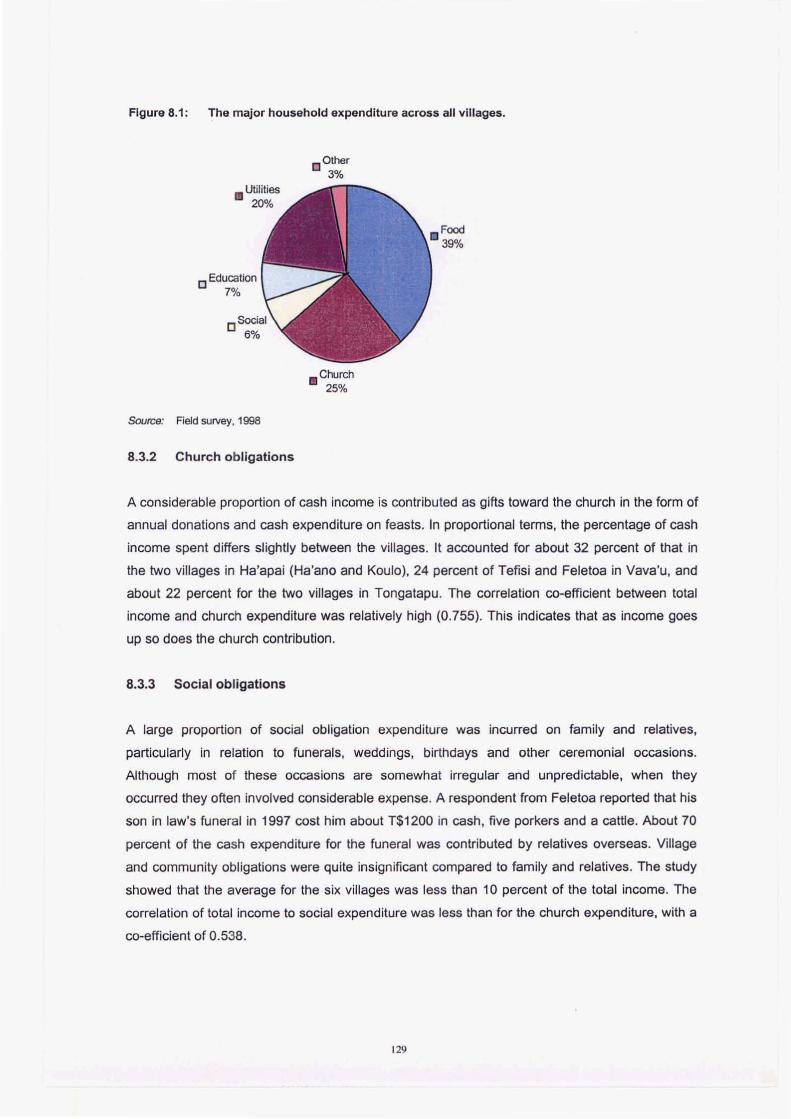
Figure 8.1 : The major household expenditure across all villages.
• Utilities 20%
CEducation 7%
Source: Field survey. 1998
8.3.2 Church obligations
C Other 3%
• Church 25%
A considerable proportion of cash income is contributed as gifts toward the church in the form of
annual donations and cash expenditure on feasts. In proportional terms, the percentage of cash
income spent differs slightly between the villages. It accounted for about 32 percent of that in
the two villages in Ha'apai (Ha'ano and Koulo), 24 percent of Tefisi and Feletoa in Vava'u, and
about 22 percent for the two villages in Tongatapu. The correlation co-efficient between total
income and church expenditure was relatively high (0.755). This indicates that as income goes
up so does the church contribution.
8.3.3 Social obligations
A large proportion of social obligation expenditure was incurred on family and relatives,
particularly in re lation to funerals, weddings, birthdays and other ceremonial occasions.
Although most of these occasions are somewhat irregular and unpredictable, when they
occurred they often involved considerable expense. A respondent from Feletoa reported that his
son in law's funeral in 1997 cost him about T$1200 in cash, five porkers and a cattle. About 70
percent of the cash expenditure for the funeral was contributed by relatives overseas. Village
and community obligations were quite insignificant compared to family and relatives. The study
showed that the average for the six villages was less than 10 percent of the total income. The
correlation of total income to social expenditure was less than for the church expenditure, with a
co-efficient of 0.538.
t29
8.3.4 Education
Proportional expenditure on education ranged from 5 percent in Tefisi to as high as 11 percent
in Ha'ano village (Table 8.4). The perception that a good education provides an assurance of a
good job drives many parents to spend a significant proportion of their cash income to support
their children's education. Table 8.4 shows that the expenditure on education ranged from $156
in T efisi to $327 in Navutoka.
8.3.5 Utilities
This category includes expenditure on electricity, telephone, water, kava and tobacco. The
village in Tongatapu and Vava'u spent more than the two villages in Ha'apai. due to the
differences in availability of these services between the three different regions. In Ha'ano, for
instance, they do not have access to electricity, public water, nor telephones. Tobacco is a
major item and absorbs a significant proportion of household expenditure. Kava expenses are
mainly incurred when adult male members of the household attend a kava party as weekend
entertainment. Each person pays a concession fee of about $2 - $3 per night to attend.
8.3.6 Other
'Other' covers a number of different items including capital items, the purchase of inputs and
expenditure on home maintenance. Some respondents asserted that home improvements
require a larger lump of income, such as a big remittance, or sale of a large mat or large
quantity of root crops, or a loan.
8.3.7 Cash savings
It was difficult to estimate accurately the extent of cash savings of the village households. Cash
savings of the surveyed households for the period under study ranged from $16.70 in Ha'ano to
$205 in Feletoa. The regional averages were $21 for Ha'apai, $45 for Tongatapu, and $180 for
Vava'u. As might be expected, not all of the households had savings, in fact, the majority (70
percent) had no savings at all.
8.3.8 Cashflow
The information obtained allows a simple diagrammatic view of a village farm household cashflow.
Figure 8.2 depicts the major sources of household income and expenditure in a typical Tongan
village.
130
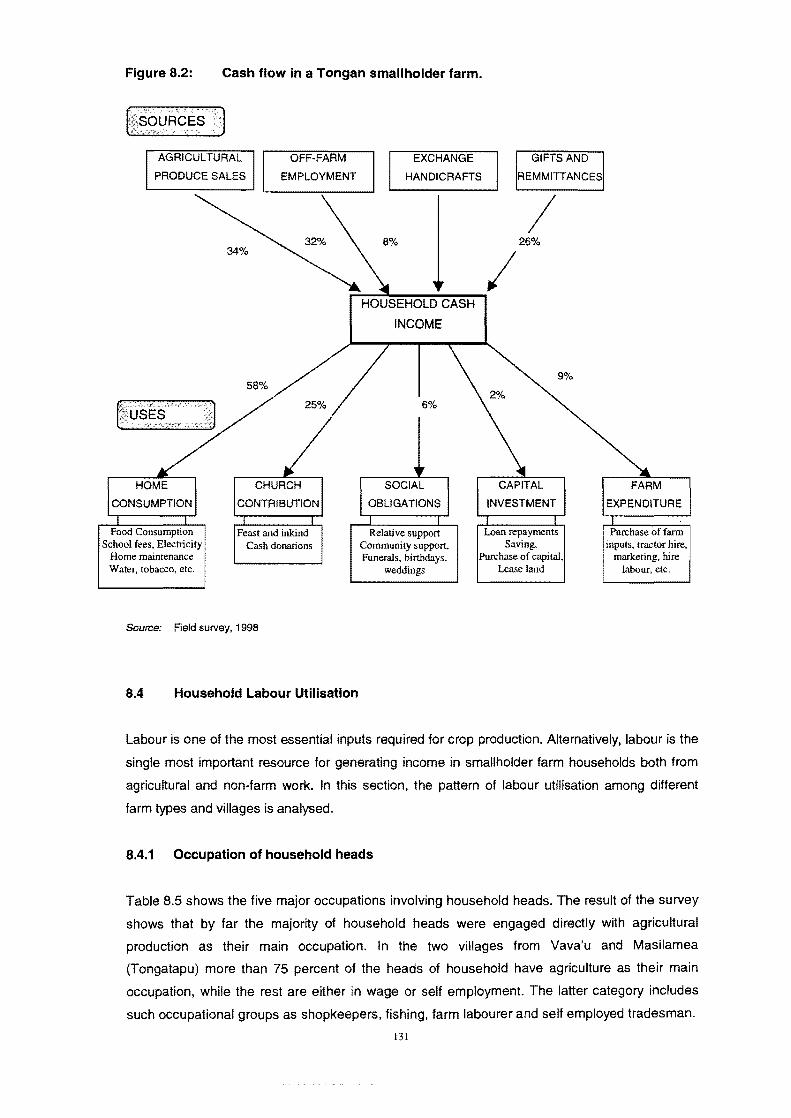
Figure 8.2: Cash flow in a Tongan smallholder farm.
AGRICULTURAL RM
PRODUCE SALES I I EMPILO\"MENT
8%
EXCHANGE
HANDICRAFTS
GIFTS AND
REMMITT ANCES
/ 26%
34%
~_I HOUSEHOLD CASH
Food Consumption School fees, Electricity
Home maintenance Water, tobacco, etc.
Source: Field survey, 1998
8.4 Household Labour Utilisation
INCOME
I SOCIAL
OBLIGATIONS
Relative support Community support, Funerals, birthdays,
weddings
9%
INVESTMENT
Loan repayments Saving,
Purchase of capital, Lease land
ITURE
Purchase of farm inputs, tractor hire,
marketing, hire labour, etc.
Labour is one of the most essential inputs required for crop production. Alternatively, labour is the
single most important resource for generating income in smallholder farm households both from
agricultural and non-farm work. In this section, the pattern of labour utilisation among different
farm types and villages is analysed.
8.4.1 Occupation of household heads
Table 8.5 shows the five major occupations involving household heads. The result of the survey
shows that by far the majority of household heads were engaged directly with agricultural
production as their main occupation. In the two villages from Vava'u and Masilamea
(Tongatapu) more than 75 percent of the heads of household have agriculture as their main
occupation, while the rest are either in wage or self employment. The latter category includes
such occupational groups as shopkeepers, fishing, farm labourer and self employed tradesman. 131
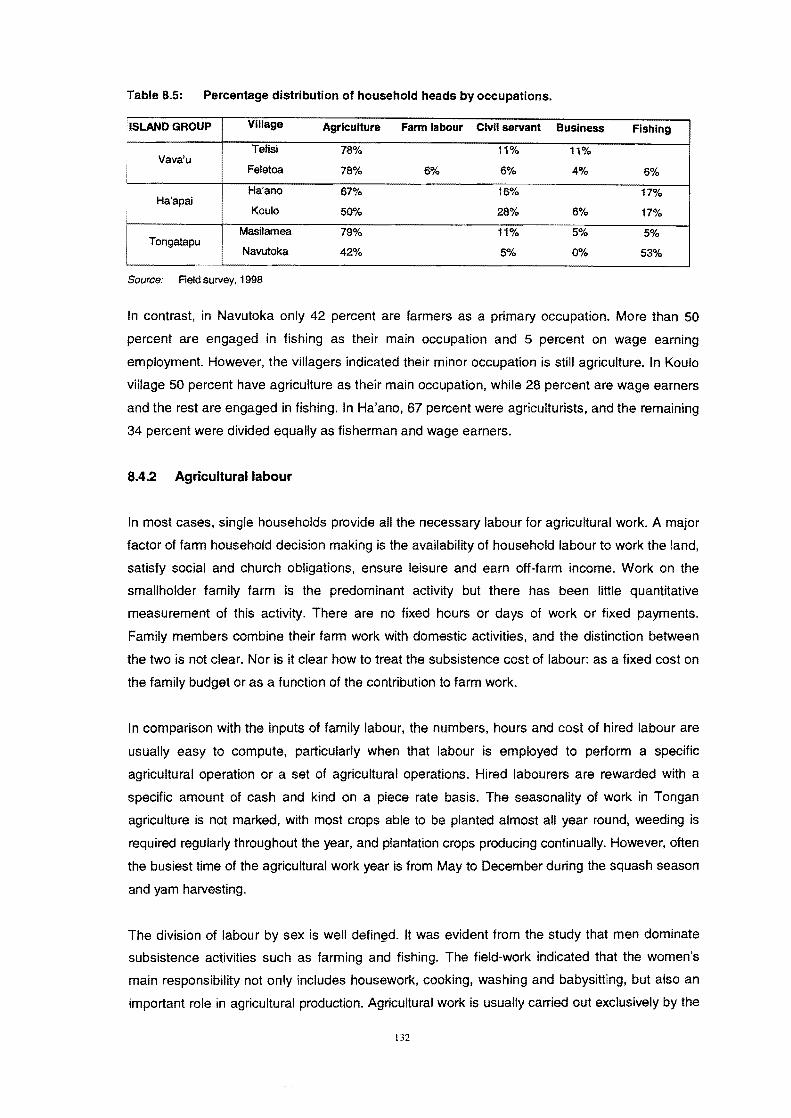
Table 8.5: Percentage distribution of household heads by occupations.
ISLAND GROUP Village Agriculture Farm labour Civil servant Business Fishing
! Tafisl 78% 11% 11%
I Vava'u
Felatoa 78% 6% 6% 4% 6%
! Ha'ano 67%. 16% 17% Ha'apal
Koulo 50% 28% 6% 17%
Masilamea 79% 11% 5% 5% Tongatapu
Navutoka 42% 5% 0% 53%
Source: Field survey, 1998
In contrast, in Navutoka only 42 percent are farmers as a primary occupation. More than 50
percent are engaged in fishing as their main occupation and 5 percent on wage earning
employment. However, the villagers indicated their minor occupation is still agriculture. In Koulo
village 50 percent have agriculture as their main occupation, while 28 percent are wage earners
and the rest are engaged in fishing. In Ha'ano, 67 percent were agriculturists, and the remaining
34 percent were divided equally as fisherman and wage earners.
8.4.2 Agricultural labour
In most cases, single households provide all the necessary labour for agricultural work. A major
factor of farm household decision making is the availability of household labour to work the land,
satisfy social and church obligations, ensure leisure and earn off-farm income. Work on the
smallholder family farm is the predominant activity but there has been little quantitative
measurement of this activity. There are no fixed hours or days of work or fixed payments.
Family members combine their farm work with domestic activities, and the distinction between
the two is not clear. Nor is it clear how to treat the subsistence cost of labour: as a fixed cost on
the family budget or as a function of the contribution to farm work.
In comparison with the inputs of family labour, the numbers, hours and cost of hired labour are
usually easy to compute, particularly when that labour is employed to perform a specific
agricultural operation or a set of agricultural operations. Hired labourers are rewarded with a
specific amount of cash and kind on a piece rate basis. The seasonality of work in Tongan
agriculture is not marked, with most crops able to be planted almost all year round, weeding is
required regularly throughout the year, and plantation crops producing continually. However, often
the busiest time of the agricultural work year is from May to December during the squash season
and yam harvesting.
The division of labour by sex is well defin§d. It was evident from the study that men dominate
subsistence activities such as farming and fishing. The field-work indicated that the women's
main responsibility not only includes housework, cooking, washing and babysitting, but also an
important role in agricultural production. Agricultural work is usually carried out exclusively by the
132
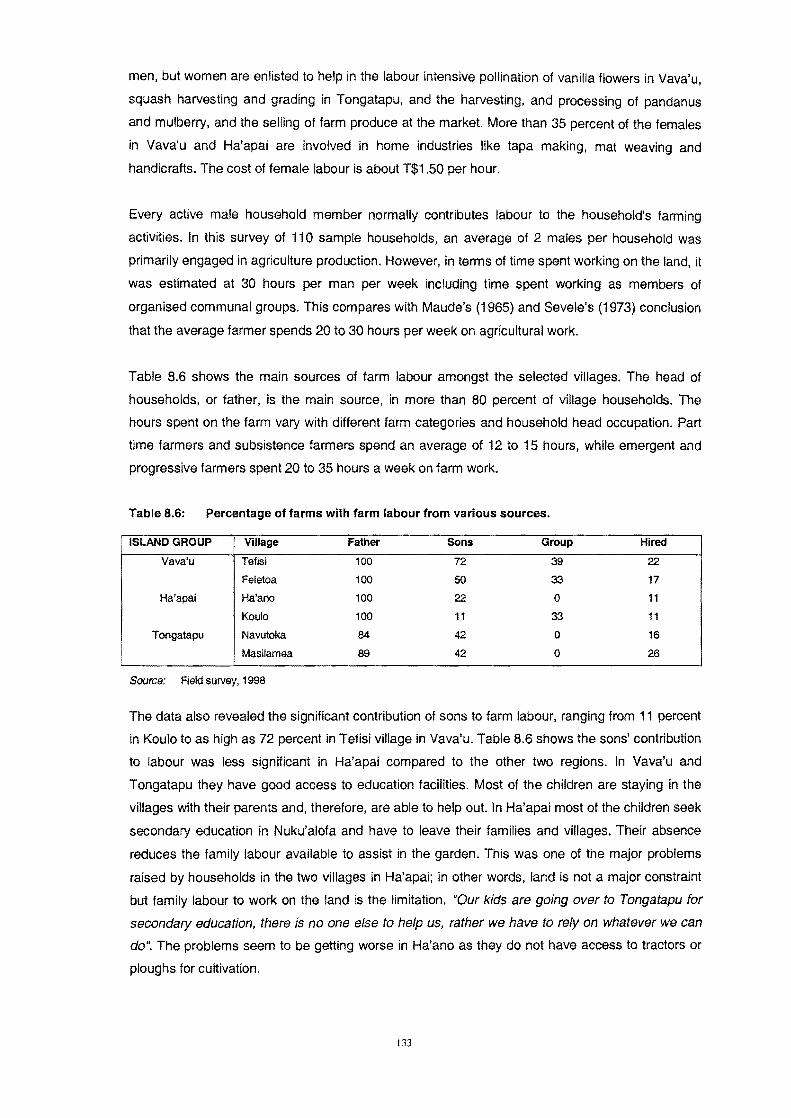
men, but women are enlisted to help in the labour intensive pollination of vanilla flowers in Vava'u,
squash harvesting and grading in Tongatapu, and the harvesting, and processing of pandanus
and mulberry, and the selling of farm produce at the market. More than 35 percent of the females
in Vava'u and Ha'apai are involved in home indUstries like tapa making, mat weaving and
handicrafts. The cost of female labour is about T$1.50 per hour.
Every active male household member normally contributes labour to the household's farming
activities. In this survey of 110 sample households, an average of 2 males per household was
primarily engaged in agriculture production. However, in terms of time spent working on the land, it
was estimated at 30 hours per man per week including time spent working as members of
organised communal groups. This compares with Maude's (1965) and Seve Ie's (1973) conclusion
that the average farmer spends 20 to 30 hours per week on agricultural work.
Table 8.6 shows the main sources of farm labour amongst the selected villages. The head of
households, or father, is the main source, in more than 80 percent of village households. The
hours spent on the farm vary with different farm categories and household head occupation. Part
time farmers and subsistence farmers spend an average of 12 to 15 hours, while emergent and
progressive farmers spent 20 to 35 hours a week on farm work.
Table 8.6: Percentage of farms with farm labour from various sources.
ISLAND GROUP Village Father Sons Group Hired
Vava'u Tefisi 100 72 39 22 Feletoa 100 50 33 17
Ha'apai Ha'ano 100 22 0 11
Koulo 100 11 33 11
Tongatapu Navutoka 84 42 0 16
Masilamea 89 42 0 26
Source: Field survey, 1998
The data also revealed the significant contribution of sons to farm labour, ranging from 11 percent
in Koulo to as high as 72 percent in Tefisi village in Vava'u. Table 8.6 shows the sons' contribution
to labour was less significant in Ha'apai compared to the other two regions. In Vava'u and
T ongatapu they have good access to education facilities. Most of the children are staying in the
villages with their parents and, therefore, are able to help out. In Ha'apai most of the children seek
secondary education in Nuku'alofa and have to leave their families and villages. Their absence
reduces the family labour available to assist in the garden. This was one of the major problems
raised by households in the two villages in Ha'apai; in other words, land is not a major constraint
but family labour to work on the land is the limitation. "Our kids are going over to Tongatapu for
secondary education, there is no one else to help us, rather we have to rely on whatever we can
do", The problems seem to be getting worse in Ha'ano as they do not have access to tractors or
ploughs for cultivation.
133
The study also revealed the significance of working as a group within villages. Some respondents
claimed the benefits of group working gives them more motivation in comparison to working alone.
The most common shared labour working group, the kautaha, usually consists of 4 to 20
members, often based on a village. They normally work on the allotments of members in rotation.
Group labour is predominant in Tefisi, Feletoa and Koulo as more than 30 percent of the
household in each village indicated they use group labour. In Masilamea, farmer's groups do exist
but they do not share labour; while in Navutoka and Ha'ano there were no farmer's groups
operating during the time of the survey.
Another temporary working group, similar to a kautaha but mainly on a "shared land" basis, is
toutu'u ma'a/a which is usually formed for planting yams and other subsistence crops on rented
land. This form is an advantage to landless people. A majority of these groups were church based
members and the objectives of setting up the group related to church obligations. One group in
Masilamea, for instance, set up a toutu'u in preparation for a church conference in May. Similarly,
in a village in Ha'apai the church planned to send a container load of yams and root crops to
Australia to sell for a new church hall construction. The study found that 20 percent of surveyed
households participated in toutu'u ma'a/a.
Hired labour in Tonga is mainly casual labour which can be divided into two main types -
individual casual labour and group labour (kautaha). The most common form is through working
groups or toungaue. However, in Ha'ano, it is mainly individuals. Progressive farmers hire labour
mainly on a seasonal basis, although a few employ permanent labour all the year round.
Squash growers heavily depend on farm tractors for land preparation and they hire labour mainly
for planting, fertiliser application, harvesting and packing. Hired farm-labour for specific activities is
normally available from kautaha3 groups. The wage rate of farm-labour is T$12.00 per man-day or
T$2.00 per man-hour in Ha'apai, but $2.50 - $3.00 in Vava'u and Tongatapu. Alternativ""ly, at the
discretion of the labourers, farmers may pay at the rate of T$10.00 per man-day plus meals,
cigarettes and transportation. The majority of the respondents reported that access to hired labour
is not a constraint.
The survey results indicated that subsistence farmers do not use hired labour. Emergent and
progressive farmers occasionally use hired labour, but only for specific activities such as during
land preparation and planting of yam and squash, and for vanilla pollination between May to
October. Subsistence, and some emergent, farmers often use the services of a few individuals
or friends for land preparation especially yam cultivation. Instead of paying cash, they prepare
food, drinks and cigarettes for the labourers.
Kautaha means a group of men who employ themselves to work collectively on each-other's farm for no payor for
cash on non-members' farms.
134
8.5 Conclusions
The analysis of household components provide an understanding of important resource
endowments of the different smallholder household types in Tonga in terms of access to capital
and labour. The information gathered on farm households consists of data related to the source
and uses of household cash income and labour resources, both of which are important
components of the model. This data allows decision variables and resource constraints which
directly influence farm operating plans to be derived and incorporated in the goal programming
model.
An important feature of the households studied was the diversity of income sources, as almost
all obtained income from more than one source during the period under consideration. The
significance of agriculture, off-farm employment (ranging from earnings from full time or casual
employment), remittances from overseas, gifts (cash and in kind received within Tonga),
handicraft making, fishing, and other business venture has been made clear. However, the
limited opportunities for wage employment in rural villages has resulted in families relying on
agricultural production for food and generating income.
Household's utilisation of cash income is a major element in farm household decision making
and has a major impact on smallholder production decisions. The Tongan smallholder
household's expenditure pattern shows similar patterns to those found in most developing
countries. Despite a low cost of living, the average household income level is far from adequate.
With the increasing monetisation of the Tongan economy, decisions regarding the earning and
disposal of farm outputs and cash income are very important as the quantity of surplus
produced for sale determines the level of cash income generated. The amount of cash
g')nerated will also influence further agricultural investments. The family cash expenditure
reflects the goals and priorities of Tongan smallholders and comprise family cash expenditure
on home consumption requirements, other household demands (education, utilities, etc), social
and church obligations, purchase of production inputs, and capital and land loan repayments.
The analysis of labour showed that the main source for agricultural work consists of family and
community labour, and to a lesser extent, hired labour. Farm work is normally done by more
than one person, such as the head of the household helped by one of his sons or a relative. An
average of 2 labour units on each farm provides the family labour supply in the model. Labour
requirements can be supplemented by hiring casual labour at a rate of T$3.00 per hour. Selling
of surplus family labour at a rate of $2.50 is included but constrained by the limited opportunities
for off-farm employment.
135

CHAPTER 9
ANALYSIS OF THE SOCIO-CUL TURAL ENVIRONMENT
9.1 Introduction
Tradition and cultural norms influence economic behaviour in any society. In societies where the
social and production units largely coincide, and production is largely for direct consumption, this
becomes particularly apparent. Successful development of agriculture in Tonga requires not only
technological and economic strategies but also a better understanding of the society in which it
is to take place. A knowledge of the social and cultural factors that condition farmers'
responsiveness to change and the ability to obtain willing co-operation of the people involved
are all pre-requisite to development.
This chapter analyses the influence of village or community groups, and other organisations, on
individual household decision making. The study identified several socio-cultural factors that
have a significant impact on household farming decisions. These include the church, District
Agricultural Committees, social organisation and leadership, social and cultural values, and
systems of reciprocity and redistribution which provide basic economic security to the great
majority of Tongans as well as a sense of identity and self-worth. Others include access to
support services; an increasing mode of dependency among communities; high propensity to
spend; a tendency of farmers to change the emphasis on commodities farmed; out-migration; the
increaSing role of women in agriculture, and macroeconomic issues.
9.2 Christian Church Activities
The people of Tonga have generally accepted Christianity with enthusiasm, and the Christian
religion in its various forms has made a deep and permanent impact upon village smallholders.
The church is an extremely important and powerful institution in Tongan society (Thaman, 1976;
Hardaker, 1975; Sevele, 1973). Evans (1996) pointed out that the integration of Christianity into
Tongan values and social practices is profound; "No ceremony or public event, even jf it is not
directly undertaken by a church, is without some overtly religious elements and the involvement
of a cleric of some types; all marriages, funerals, birthdays and civil ceremonies, involve God
and church through some earthly representative". Most village and household ceremonial
activities are organised through churches and it is common in all village and government
136

meetings to start with a prayer. Therefore, no treatment of Tongan society can ignore the
significance of the various churches at all levels of Tongan culture.
While there are more than ten different denominations in Tonga, the five main denominations
are the Free Wesleyan Church of Tonga, Roman Catholic, Mormon, Free Church of Tonga, and
the Church of Tonga. Each denomination has its own separate organisation, administration and
leaders, and has different approaches to donations, fund raising and obligations. Table 9.1
shows the distribution of village population to the different denominations amongst the selected
villages in the 1996 population census.
Table 9.1: Distribution of religious affiliation among the population.
ISLAND Tongatapu Vava'u Ha'apal
VILLAGE Navutoka Masllamea Teflsl Feletoa Koulo Ha'ano
Total No. 0' People 798 267 624 383 258 162
Free Wesleyan 34% 55% 27% 27% 52% 39%
Catholic 2% 0% 11% 14% 2% 0%
Mormon 18% 17% 17% 17% 16% 18%
Free Church Tonga 14% 5% 19% 39% 9% 17%
Church of Tonga 13% 16% 9% 1% 18% 23%
New Light 9% 3% 10% 0% 0% O"k
Bahai 1% 0% 2% O"k 0% 0"/0
Constitution 0% O"k 3% 0% 0% 0%
Seventh Day Adv. 9% 4% 1% O"k 4% 4%
Source: Statistics Department, 1997
The main influence of churches has been in taxing their adherents in order to finance the church
operation and activities. Fleming and Hardaker (1995) notes the willingness and eagerness of
Polynesians to support church activities and the construction of religious infrastructures such as
large and imposing places of worship, and it may be argued that the rent seeking behaviour of
the churches has been counter-developmental. Evidence from this survey showed that church
activities are still a dominant feature of everyday life in Tongan villages and this reflects in the
significant demands on household's cash, farm produce and time.
9.2.1 Cash donations
The annual public gifting (misinafe) or cash donation for the different churches creates a
substantial demand for cash. The significance of obligations to church in the average household
cash expenditure is discussed in Chapter 7. Cash donations to the churches accounted for 22
percent of the total household cash expenditure in Tongatapu, 30 percent of that in Ha'apai and
25 percent of that in Vava'u. Other occasions over the year, such as quarterly collections and
annual church conferences add to this demand. An indication of the high value people give to
church contribution can be derived from the misinafe, or the annual donation of Free Wesleyan
Church (FWC) in the six villages for 1997 as shown in Table 9.2. 137

The annual donations are organised by each village congregation. The Free Wesleyan Church's
headquarter sets a budget forecast, or target levels, and specific dates for each. The targets are
normally calculated to correspond to the number of people registered in the congregation, with an
average of T$45 to T$50 per head. These donations help finance church administration and
activities. A minister reported that in 1997, the 9 families of the Free Wesleyan Church in Ha'ano
raised T$7,124 for their misinale. One third of the money went to the central administration in
Nuku'alofa, one third to church education and the remaining one third returned to the local
congregation for its disposal.
Certainly, peoples' willingness to contribute varied a great deal. Table 9.2 shows the targets and
the actual donations for 1997. Every church donation exceeded the targets by a significant margin
as showed by donations per head. Donations are commonly organised by individual households
and usually in the name of the most senior person in the family. All donations are publicly made
and the amounts contributed by each household within the congregation are announced (Evans,
1996). The donation by each household reflects on the individual household within the church.
Greater prestige is associated with large donations.
Table 9.2: Annual donation to the Free Wesleyan Churches in the studied villages.
ISLAND Tongatapu Vava'u Ha'apal
Village Navutoka Masllamea Teflsl Feletoa Koulo Ha'ano
FWC adherents 271 147 168 103 134 63
Budget Forecast (T$) 13,550 7,350 8,064 4,944 6,030 2,835
Actual Donation (T$) 29,872 10,021 12,139 8,721 20,355 7,124
$ per adherent 110 68 72 85 151 113
Source: Field survey, 1998
9.2.2 Feasting
Feasts follow most important religious occasions. During the year a number of church ceremonies
and events are marked with feasts, such as special Sundays for education, Easter, children's,
mothers and father's Sundays. Each household also prepares feasts, or fakaafe, every year with an
average of two per household per year. Most of the farm households supplied pigs and other
animals and the food crops required, supplemented by purchased non-farm produce. These can
be lavish feasts of a full range of meats and special foods, or simply teas consisting of hot and
cold drinks, cookies, and sweet flour dumplings (Evans, 1996).
Most village respondents indicated that church based events are most intense during December
and January. On New Years Eve each church holds a long, multi-sermon service that ends at
midnight. In Feletoa village, for example, the FWC has nine members conducting the service;
another nine households in the congregation each prepare a feast for each of the preachers during
the day. This is followed by a prayer week, or uikelotu, in which services are conducted every
138

morning and afternoon for the whole week, followed by either a feast or a tea. During these weeks,
there is little work done but worship, food preparation and feasts.
9.2.3 Contributed labour and time
Besides donations of cash and kind, the church and its members also receive gifts of unpaid
labour. Members of the congregation carry out repairs and maintenance of the church in turn.
They also assist in carrying out unpaid work in the minister's garden when required. The church
not only benefits from labour in the strict sense of the word, but considerable time and effort are
devoted to church functions. For example, one respondent, who is a steward in one of
churches, asserted "I have to attend evelY service, program, and meeting. It is my duty to lead
and set a good example". This includes 3 services on Sundays, three services during the week,
and choir practices (twice a week).
9.2.4 Leadership role
Results of the study strongly indicated that church leaders have a major significant leadership role
compared to other traditional leaders (nobles, district officers and town officers and matapules4) in
the village community life. Obligations of traditional, national and religious nature are more likely to
be fulfilled by the community if directives come from church ministers rather than from other
leaders in other forums (Sisifa et al., 1993). Some villagers described this as one of the major
cultural changes that has occurred in Tonga over the years. Major reasons include the local and
constant presence of church ministers. A village district officer noted that "most of the nobles are
no longer staying with their people in the vii/ages or islands but have moved to Nuku'alofa and
overseas and only visit them occasionally, while church leaders are the ones who live with the
people and so take the honour and respect of villagers". Some reported that the recent change in
the land tenure system with regards to the noble's authority over land is no longer valid once a
villager registers the land. So most households are free to do whatever they want with their land.
9.2.5 Motives
One of the key question puts to a number of village respondents was "What motives drive you to
devote so much of your time, material produce and cash to the church?". Their responses can
be summarised as follows. Ultimately, village people see that their offering and gifts are not to
the church or the ministers but to God and are part of keeping their relationship with God intact.
Ministers are perceived as messengers from God, and people have the idea that God witnesses
acts of giving and notes this in their favour in the form of blessings. Many of them said "We are
fortunate that God blesses our family in many ways, we get good yields for our crops, our
children are doing well at school, our family is well and healthy, etc". The belief is thus a
4 A matapule means a spokesman of the King or a noble.
139

discourse of reciprocity; it is a question of giving and receiving, and gifts are given precisely in
order to receive. The size of a particular household's contribution is perceived to reflect the
vitality and viability of their relationship to God. A larger contribution implies more blessings, and
more blessings imply a larger contribution. A majority of the respondents in this study said that
they were happy and felt great satisfaction to be able to give. They also indicated that they would
donate more when they have more money and produce from their farm.
9.3 Cultural Values - wealth, prestige and respect
9.3.1 Social and kinship ties
In addition to their striving to acquire adequate land in order to achieve economic security, village
farmers also attach great importance to achieving social security within family units, groups and
within the whole village. Thaman (1976) noted the Tongan agricultural system provides a direct
and indirect means of fulfilling social obligations, both to relatives and to the society as a whole.
These obligations are important in understanding the influence of social and cultural obligations on
smallholder farmer's decisions on utilising land resources (Sisifa et aI., 1993). Generally these
obligations fall into two main classes: kinship ties and social ties. These ties are significant in
Tonga and farmers place a strong value on recognising their obligations and debts to their parents
and to their relatives.
Kinship ties are commonly known as the kainga system which mainly refers to kinship
relationships, including families and relatives. The larger unit, the kainga, not only includes the
individual household but also those bilateral kindred who reside in other households, villages, or
island groups. The size of this broader kin group, and the closeness of ties within the group,
depend primarily on the individual's knowledge of his consanguine relatives and their whereabouts
(Thaman, 1976). Kinship ties provide a major impetus for the redistribution of product from the
agricultural system within the kin group. The most salient exchanges are those which take place
during ceremonial occasions, such as births, baptisms, marriages, and funerals, where different
kinsmen contribute labour, food, or make presentations of fine mats, tapa, kava, and other
traditional goods of high social value. Apart from ceremonial exchanges, there is a constant flow of
labour, food and commodities throughout the kin group. This mutual assistance is not only in farm
produce but also reciprocal help in assisting cultivation, planting and management. Although the
direction is often from lower ranking members to higher-ranking members, there is also a
considerable flow in the opposite direction.
Villagers also value harmony and unity assuring security within the village and this is indicated by
the significant support given to village and district agricultural committee activities. This tends to
reflect on the utilisation of household farm produce, so that only a small proportion of produce is
usually for sale while the largest proportion of the surpluses from home consumption is to cater for
relatives and other households. It was evident from the study, especially in Ha'apai and Vava'u
140

and to a little extent in Tongatapu, that regardless of who plants a garden, the rights to harvest
from it can extend quite widely. Sisters and their families still maintain the right to harvest from the
lands of their brothers. One respondent asserted" The land is not mine but our father's land, so my
sisters and her children can help themselves. It is my duty though". Although it was not possible to
quantify the frequency with which this right is exercised, it was common for a man's sister's
children to go to their uncle's garden and help themselves to what they wanted. Brothers are also
generally held to have the right to harvest from each other's gardens. So people sharing food
crops are still common in village communities.
Field observations revealed that the importance placed by communities on religious and
traditional/cultural obligations appears to have led to an increasing mode of dependence in
society. The negative effects of "social taxation" on productivity have become apparent not only
among progressive farmers from whom the bulk of contributions are expected, but also among
those who choose to become dependent (largely the subsistence farmers) through the
reduction of an already meagre effort. Farmers who manage to significantly increase their
production of crops or agricultural profits are under social pressure to supply loans and
miscellaneous obligations to close relatives and friends. "Relatives always visit me at harvest
time expecting a share of yams and taro, even cash". Several informants asserted that this
practice severely reduces not only farmers' independence but also the incentive for increased
production: "They would not increase crop production because neighbours and relatives
subsequently borrow a/l extra produce". Although lending is a tradition, which increases the
social status of the lender, resentment toward this social obligation is increasingly expressed
among younger landholders, who place a higher value on cash than tradition.
9.3.2 Perception of wealth
The village people in Tonga have gradually formed their values of what is significant and desirable
to them in life. Their own experience and understanding of the environment they are in has
influenced their conclusion. Their values also reflect their understanding of the opportunities to
develop, given their resources and technology, social institutions and beliefs. The current values
held by most of the rural smallholders are influential in determining the outcomes and social
rewards they can expect from their choices and achievements. Those values are thus an important
element in their capacity to take on risky choices and to make the commitments required in
agricultural development programs.
A smallholder's production is consistent with the demands and social reward system, and this
relationship is necessary for a meaningful life. With regards to their relationship to agricultural
development, it is important to examine the value positions of smallholder farmers regarding
security, wealth, and prestige, at the same time as keeping in mind the differences between the
three main farmer categories which relate to the specific goals and means of attaining them.
Respondents in the six villages regarded wealth as desirable and one of the higher goals they hope
to achieve. They have been influenced by the increasing influx of consumer and luxury goods, for
141

example vehicles, TVs and videos. Some villagers have made great efforts in agriculture and other
off-farm employment opportunities to acquire wealth. However, although the material needs and
desires of farmers are increasing, marginal farmers are still realistically modest in their expectations
of their future economic opportunities.
The desire of Tongan smallholders for wealth is principally a search for security and prestige; that
is, enough land to produce adequate crops for subsistence, meet church and social obligations and
a surplus for cash sale. For smallholders, who have recently engaged in commercial agriculture,
wealth in the form of land is the most important key to security. The family household is the unit that
controls land, and the household head normally makes decisions regarding use of land. Land
tenure patterns are thus a major element of security.
9.3.3 Prestige and respect
One of the major social features of Tongan society is the high value given to prestige and respect.
Individual achievement is a lesser consideration. Elaborate contributions to church and social
obligations through family celebrations and the associated publicity are part of a prestige-conferring
pattern of conspicuous goods distribution within village society. As people in villages acquire
prestige from to each other, they tend to make judgements of people's worth based on status-
centred considerations more than on individual achievements. A member of a prominent family can
be highly regarded whether or not he contributes greatly to the family's position (Havea, 1998
pers.comm). People gain respect and prestige largely on the basis of their relationships with the
village as a whole and to family and relatives. For instance, a district officer in Ha'ano described
that for every funeral occasion in the village and district he had to make a contribution either in the
form of food, pigs, kava, and or cash. "Thafs what the village people expect someone in this
position to do. To have the respect of the community and the village you have to involve and
commit in many ways. However, it will in return give you more power and people will listen and
respond to any request you to make in future".
9.4 Village Organisations
9.4.1 District agricultural committee (DAC)
At the village and district levels respectively there are district committees and officers who link
the traditional structure to the system of public administration and have significant impact on
farm households' agricultural decisions. Village communities within each district are linked to the
Government through the District Officer (DO). The DO is a salaried post, elected every three
years by the community, and responsible directly to the Prime Minister through quarterly reports
concerning the welfare, activities and general order in the district. Traditionally. District and
Town Officers carried out their functions through informal meetings. Now the formal occasion,
the "fono" is normally held once a month and it involves the District and Town Officers of that
142

village, sometimes in conjunction with the Noble if one is present, giving directives from
Government, or from the District Officer/ Noble, to the people.
The District and Town Officers, farmers' representatives and a MAF extension officer make up
the District Agricultural Committee which has the aim of ensuring food crop security of district
households (Delforce, 1990). Each village has a Village Development Committee (VDC) which
comprises the Town Officer and community representatives. It plays a key role in the
implementation of DAC directives and policies (in the case of food security enhancement) in
each village. An important element is carrying out physical inspections to determine if goals
(minimum subsistence) set by DACs have been achieved. DAC inspections occur every six
months and village committees and groups inspect more frequently.
The DAC have developed into a natural focus for decision making and a forum for technology
transfer at the district level. Locally expressed needs, agricultural priorities and government
authority are all represented within their membership. In addition, at least for subsistence
production, the goals of DACs are supported by legislation and farmers have been brought before
District Court Magistrates when, without reasonable cause, they have not met DAC targets.
Magistrates have supported the District Officer, and people concerned have been required to plant
food gardens as specified by the DAC.
Village and district officers revealed that the DAC's operate with different degrees of effectiveness
in the three regions. In contrast to their counterparts in Tongatapu, and Ha'apai island groups,
Vava'u DAC's have contributed significantly not only to food-security but also to commercial
agricultural activities. Through their directives on what crops to grow, and how much, through their
follow-up field inspections, DAC's also encourage and foster new commercial crops such as
vanilla and kava. The effectiveness of a DAC largely depends on how active district extension and
district officers are and how well they are working together with the rest of village communities.
DAC's have proven to be one of the most effective means for agricultural extension in Tonga used
by MAF. However, much more remains to be done in the dissemination and adoption of highly
productive and environment-friendly technologies at the farmer level.
9.4.2 Women's role in Agriculture
The traditional Tongan view that agriculture is not part of the role of women is still strongly held.
However, there is no doubt that over time a unique role has evolved for women, who now play an
important supporting role to men in agricultural development. Interviews with womens' groups
revealed that they are directly involved in the planting and maintenance of pandanus and paper
mulberry. As well, they increasingly involve themselves in agro-forestry development, particularly
in the cultivation of "cultural ll and medicinal plants and trees. Women playa significant part in the
pollination, trading and curing of vanilla in Vava'u. In Tongatapu women are also highly involved in
squash cultivation, harvesting and processing. Overall, women on Tongatapu and Vava'u do not
play the pivotal role in household cash income that they do in Ha'apai. Nonetheless, their craftwork
143

is an important economic and social activity. The main handicraft production is tapa, which is made
from paper mulberry.
Women have traditionally worked in-groups to produce mats and tapa, and each village has one
or more such groups. Handicrafts have traditionally been produced for home use, ceremonial
purposes and traditional exchange, but these products have increasingly taken on a monetary
value, and become an important source of income (in both cash and kind) for some families.
Handicrafts are most important to the two villages from Ha'apai. Womens' groups also organise
sales, or exchange of their products, with overseas groups, or within Tonga. These are
commonly known as "katoanga". The usual approach is to negotiate sales with other groups for
cash or kind (such as furniture, linen, and kitchen equipment). For example, a womens' group in
Feletoa village exchanged mats for T$1200 with a womens' group in the USA. There is generally
plenty of paper mulberry and pandanus being available but there are some seasonal shortages,
and shortages for some individuals. Planting material can be scarce at times and some husbands
are reluctant to have tutu planted on their 'Bpi because of the conflict with other crops. The village
groups encourage planting tutu in particular. However, most women interviewed identified a
disease problem on paper mulberry, and there can also be wind damage during storms.
9.5 Major Support Services
9.5.1 Isolation from Support Services
Some farmers and key-informants reported that the Health and Education services in Ha'apai
and Vava'u, although having well developed infrastructures, fall short in their maintenance and
staffing (both in number and in qualifications). Most problems described by respondent farmers
concerning the MAF Extension Service related mainly to inadequate contact between the
extension officers and farmers, and inadequate supporting services such as tractors in Ha'ano.
Interviews with District Extension Officers revealed that their activities are shackled by an acute
lack of transport and operating funds. In numbers, there are adequate extension officers, but
many do not possess sufficient qualifications and technical knowledge. There are also very
limited activities and inadequately focused farmers' training, programmes, on-farm trials and
little extension information material (posters, leaflets, video, radio broadcasts, etc.).
Major infrastructure development in sea and air transport in the Kingdom has provided the main
island groups of Vava'u and Ha'apai with easy access to services available in Tongatapu. Yet
the isolation of the outer-islands from support services that are available in the mainland is a
major obstacle to development. They expressed their priority needs as health support, water
supply, electric power, road building/maintenance, wharves, shipping, farm inputs and improved
marketing. Their needs are simple because island life is, of necessity, simple. It is in the more
remote outer-islands of the group like Ha'ano that problems of isolation from support services
are acute. 144

9.5.2 Urban migration
Migration is a widespread and important phenomenon in the Tongan economy and society, both in
terms of internal migration between the island groups and in migration overseas (Kingdom of
Tonga, 1991). There is an increasing movement of people from the rural to the urban areas, or
overseas, or from the outer islands to the main island of Vava'u, Tongatapu. This is reflected by
the decreasing number of households residing in the rural villages and the increasing numbers
of outer homes left unoccupied. It was found that a major reason for the increasing migration
from the Vava'u, and to a greater extent from the Ha'apai subregions, was the severe
inadequacy of support services in terms of education,. health and income generating
opportunities. The migration from both the distant villages and the outer islands to the main island
is made in search of employment opportunities, better education, and a range of public services
such as electricity, water supplies, and transport, none of which are generally available in outlying
vii/ages and islands. Sisifa et al., (1993) note that in Vava'u the younger population, many at
secondary school age, and others at middle age, are the age-groups most affected.
Migrations also have an important influence on the agricultural sector. In Ha'apai and Vava'u it
was evident that about half of the village population is now living abroard. The number of people
who have opted to migrate is definitely more important in the outer islands and particularly in the
more remote islands like Ha'ano. This is due to the fact that there are very few employment
opportunities and, in general, the limited economic opportunities in these secluded islands. At
the moment land is not a scarce factor in any of these island groups but shortage of family
labour is a constraint. This may explain why in the remote villages of Ha'ano, without access to
tractor hire services, farm sizes are much smaller and those is little cash cropping occurs
compared to other villages.
On the other hand, migration normally brings economic advantages to families through the
remittances sent by relatives. The impact of migrant remittances on the economy is significant in
that over 1995 private remittances, contributed approximately 40 per cent of Tonga's foreign
exchange (Ministry of Finance, 1996). The value of remittances is practically double the value of
the gross agricultural product and 79 percent of the value of the gross domestic production. This
flow of remittances meets most of the liquidity requirements of an average farm family and
creates another disincentive for switching the farm system from self-sufficiency to commercial
forms of agriculture.
9.5.3 Input supplies
Continuous access to reasonably cheap farm inputs such as planting material, fertilisers,
pesticides, herbicides and farm equipment is essential to agricultural development. The survey
showed that the supply of planting material, especially vegetable seeds, is a constraint although
this is not a problem for most root and cash crops. In Vava'u, for example, village farmers noted
145
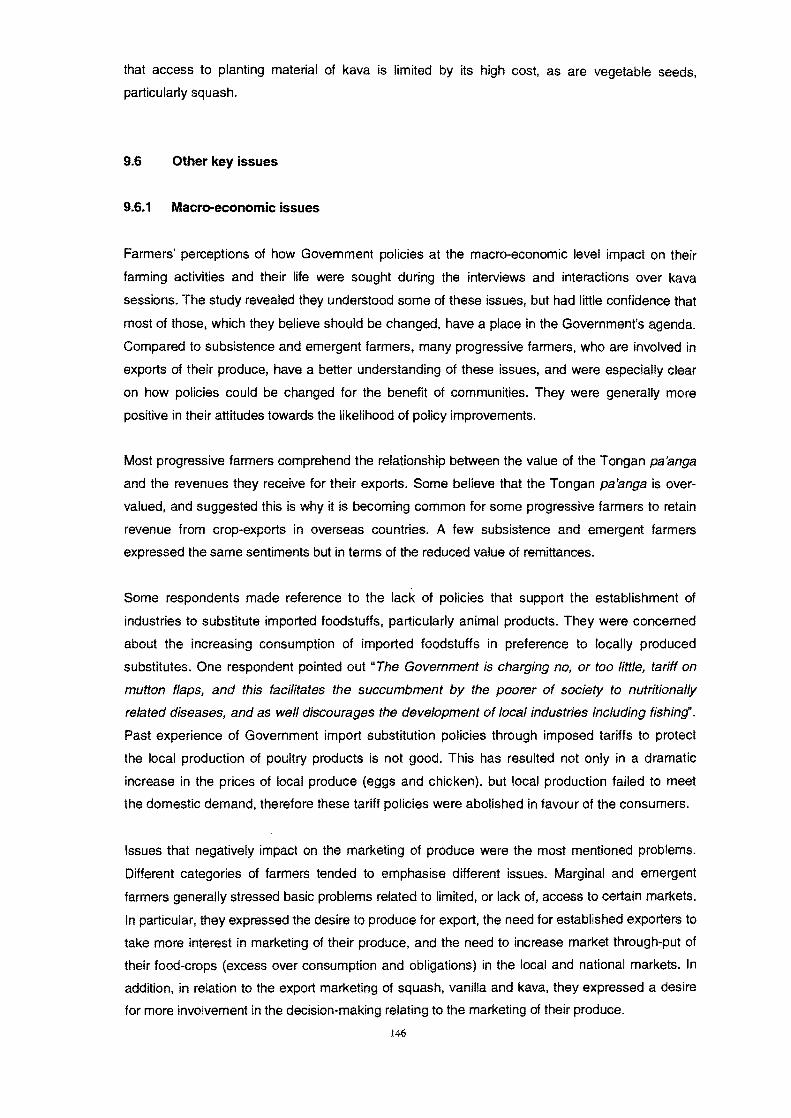
that access to planting material of kava is limited by its high cost, as are vegetable seeds,
particularly squash.
9.6 Other key issues
9.6.1 Macro-economic issues
Farmers' perceptions of how Government policies at the macro-economic level impact on their
farming activities and their life were sought during the interviews and interactions over kava
sessions. The study revealed they understood some of these issues, but had little confidence that
most of those, which they believe should be changed, have a place in the Government's agenda.
Compared to subsistence and emergent farmers, many progressive farmers, who are involved in
exports of their produce, have a better understanding of these issues, and were especially clear
on how policies could be changed for the benefit of communities. They were generally more
positive in their attitudes towards the likelihood of policy improvements.
Most progressive farmers comprehend the relationship between the value of the Tongan pa'anga
and the revenues they receive for their exports. Some believe that the Tongan pa'anga is over-
valued, and suggested this is why it is becoming common for some progressive farmers to retain
revenue from crop-exports in overseas countries. A few subsistence and emergent farmers
expressed the same sentiments but in terms of the reduced value of remittances.
Some respondents made reference to the lack of policies that support the establishment of
industries to substitute imported foodstuffs, particularly animal products. They were concerned
about the increasing consumption of imported foodstuffs in preference to locally produced
substitutes. One respondent pointed out "The Government is charging no, or too little, tariff on
mutton flaps, and this facilitates the succumbment by the poorer of society to nutritionally
related diseases, and as well discourages the development of local industries including fishing'.
Past experience of Government import substitution policies through imposed tariffs to protect
the local production of poultry products is not good. This has resulted not only in a dramatic
increase in the prices of local produce (eggs and chicken), but local production failed to meet
the domestic demand, therefore these tariff policies were abolished in favour of the consumers.
Issues that negatively impact on the marketing of produce were the most mentioned problems.
Different categories of farmers tended to emphasise different issues. Marginal and emergent
farmers generally stressed basic problems related to limited, or lack of, access to certain markets.
In particular, they expressed the desire to produce for export, the need for established exporters to
take more interest in marketing of their produce, and the need to increase market through-put of
their food-crops (excess over consumption and obligations) in the local and national markets. In
addition, in relation to the export marketing of squash, vanilla and kava, they expressed a desire
for more involvement in the decision-making relating to the marketing of their produce.
146

Compared to marginal and emergent farmers, progressive farmers were more critical of the
Government's intervention, or lack of intervention, in marketing. Most progressive farmers are
involved in the marketing of their own produce, locally and overseas. Some members of the
Vava'u Vanilla and Spices Association (VVSA), for instance, welcomed the involvement of the
MAF in the management and in the activities of the association. Others, particularly VVSA-non-
members, believed that by being involved directly in the marketing activities of VVSA, MAF
intrudes into the role of private enterprise, faces conflicts of interest, and can mis-use Government
resources in favour of the association. A progressive vanilla farmer in Tefisi clearly expressed this
sentiment, "At present, Government tries to do too much, but in reality, does little to enhance the
marketing of our produce (vanilla). What you people should do is work together with us to
establish policies like quality standards, make those standards binding, and ensure everyone
adheres to them. Then you should research markets continuously and keep us informed. Let us
and private exporters look after the rest without further interference". It raises important issues not
only the need to restrict the role of Government to more facilitating role, but to allow private sector
to have the direct marketing responsibilities.
9.6.2 Willingness to try new crops and new technology
Information from the field discussions suggested that some smallholder farmers have proven they
are willing to try and adopt new ideas. When vanilla production soared in the 1970's, Vava'u took
the lead and today remains the vanguard of the Kingdom's vanilla-based foreign exchange
earnings. In this instance, Vava'u farmers were able, within a very short time, to adopt MAF
recommended technologies and its calendar of activities for looping, pollination and curing of
vanilla. Also kava has in the last 8 years taken over quite significantly and with an assured market
and good profits. A similar trend was experienced in the recent development of the squaoh
industry. The assured market and a good profit meant large numbers of farmers became involved
within a short period despite it being a new crop.
New, successful crops, however, have a downside where farmers are irrational. The extraordinary
interest aroused by introduction of export squash is an example. In Tefisi, for instance, some
successful vanilla growers discarded their vanilla plots and took on squash. They have now given
up squash growing and returned to vanilla. "We had been attracted by the quick cash potential of
squash cultivation, but we could not cope with the inconsistency and low prices we gor. In
another case, one of the largest growers of kava in Vava'u recently started off-season production
of pineapples. He showed his intention to give up kava in favour of pineapples. Diversification of
the agricultural base is desirable, but not at the expense of already proven stable industries and/or
the environment and the ecological balance.
147

9.7 Conclusions
The field study sought to provide an understanding of how smallholder farmers' behaviour and
production decisions are related to the socio-cultural environment. One of the most distinctive
features of the Tongan smallholder farm household revealed in this study is the strong
influence, if not dominance, of socio-cultural considerations on household farming decisions and
activities. There is a strict observance of social norms and customs, including religious beliefs
and practices. These established customs, laws and relationships make up the traditional
institutions which govern the allocation and use of resources and the distribution of agricultural
products. Delforce (1990) noted that family, church, national government and the community in
general have considerable influence on the production and consumption among Tongan village
smallholder farmers. The crops chosen may need to meet certain anticipated kinship
obligations, and the subsequent distribution of the product is made along SOCietally or culturally
determined lines rather than on purely economic ones. An example is in the planting of feast
foods such as yam and raising pigs for church obligations, or social purposes such as funerals,
weddings and birthdays.
Socio-cultural factors are a source of both strength and contemporary weakness of Tonga's
development. The elements of the social structure most likely to complicate and affect economic
choices are neighbourhood ties, family and household ties, ties of kinship, status and class
difference, local political roles, and patterns of religious offering. Thaman (1976) claimed that
the Tongan social structure is permeated by countless social and kinship relationships and
institutionalised procedures which, if not fulfilled or adhered to in the strictest Tongan sense, can
result in a loss of prestige, favour, or effectiveness within one's social or economic sphere.
Sevele (1973) also stated that by fulfilling one's social obligations (considered to be the Tongan
way - Fakatonga), an individual keeps on good terms with his or her family, village, religious
leader, the traditional ruling class, and the rest of the community group. Consequently when a
Tongan needs assistance in the form of labour, money, food for ceremonial occasions, or even
land, other parties will be willing to fulfil their obligation to that person. Evans (1996) also
claimed that everyday interaction as well as ceremonial exchange rests on the conviction that
social life would go awry if people neglect sharing, kindness, obligation and religion. These social
relationships are particularly important in Tonga, where European institutions such as life
insurance, worker's compensation, social security, and freehold land are not available.
The social context within which the greater proportion of Tongan smallholder farmers still
operate was largely developed to meet the need of an integral subsistence system. In such
systems, people's behaviour is controlled by food security and by social and religious
obligations. This is significant to agriculture in attitudes to commercialisation, labour allocation
and distribution of farm produce and cash. It is often argued that smallholder farmers are
frequently unable to meet the requirements of successful commercial agriculture because of the
obligations and values whose origins lie in the older system. Conflicts arise in the allocation of
148
time, capital, labour, and in the disposal of produce or the distribution of financial return. Yet
they contain aspects perceived as constraints, given the high and rising economic expectations
of Tongans. All these factors tend to weaken the incentives for smallholder farmers to save and
invest. The lack of savings and leakage of funds and stock to kin has doomed many small family
business ventures to failure. People desire the fruits of modernisation while wishing to retain the
time-honoured traditions, which may impede these aspirations. However, it reflects the
importance and value that Tongan smallholder farm households place on these factors. As
shown by the significance of non-economic objectives (Chapter 5), the whole economic decision
making and action complex is significantly affected by non-economic forces such as social,
cultural, and religious factors. Therefore, no treatment of smallholder farmers' development can
ignore the significance of these in planning and implementing development programs.
The system analysis conducted in Part II of this study provides the basis for modelling the
Tongan smallholder farming system. The Part III of this study provides a conceptual framework
of farmer's decisions and a complete description of the model and the analysis. This is followed
by validation of the model and application for policy analysis in Chapter 10 and 11, respectively.
149

PART 3: SYSTEM SYNTHESIS AND MODEL EVALUATION
System synthesis involves integrating the results of the systems analysis into a coherent and
logical conceptual framework and the implementation of the framework into a working computer
model. In this case it involves explicit consideration of the smallholders' multiple objectives and the
characteristics of the farming and household systems to allow development of appropriate
procedures for representing these aspects.
CHAPTER 10
CONCEPTUAL FRAMEWORK AND MODEL DESCRIPTION
10.1 Introduction
In the first section of this chapter, a conceptual framework of Tongan smallholder farmers'
production decision making process is presented. Section 2 presents a discussion of the model
development phase including a detailed description of the multiple goal programming model
structure, the main components of the production model together with a description of data
requirements. The model, as constructed, is described and the model's operation outlined.
10.2 Decision-Making Conceptual Framework
The framework at the farm household level was based on the premise that land is the most critical
resource in Tongan agriculture, and therefore attention was focussed on land use decision
making.
Based on the literature and the analysis of the Tongan farming system (Chapters 4 to 8), a
representation of a smallholder farm household's decision matrix was developed (see Figure
10.1). It indicates the interdependent household decisions as constraints which, together with a
range of exogenous factors, will impact on both the resources available for production and the
farm objectives. The factors that are considered important include the availability and access to
land, the physical factors (soil, climate, etc); the social and cultural factors; and the institutional
factors. They will all influence the choice of crop and the production technology, these being the
central areas of decision making.
150

Figure 10.1: A conceptual framework of decision making in a Tongan smallholder farm (Fakava, 1998).
[CONSTRAiNTS
ENVIRONMENT
Physical: Soil and Climate
church, village conunittees
Economic: Policies, risk, market, credit, and other support services
PRODUCTION
Household: - Production and management - Food, cash, and leisure needs. - Off-farm employment - Remittances and gifts
INITIAL
Farm Pattern: Stocks, Rotational restnctlOns, Indigenous knowledge and skills capacity
I PRODUCTION OBJECTIVES
FARM PRODUCTION
DECISIONS
LAND Own, and hire
LABOUR Family and hire
RESOURCE STOCK
Cash and credit
I PRODUCTION STRATEGY
fARM ENTERPRISE Crop types and acreages . crop pattern (mixed or Inonocrop) ;Livestock type and
~h
anagement techniques choice of cultivars or
ivestock breeds.
~IME uration of major activities crop planting schedules
u::;

From the preceding chapters it is clear that the fundamental nature of decision making in the
Tongan smallholder farm household is analytically similar to decision making anywhere. The
smallholder farmer has control over a number of factors or resources, which he or she can define
quantitatively and qualitatively and the use of which is subject to a series of constraints and
influences. Thus, Tongan smallholder decision-makers have choices in the use of these factors to
achieve identifiable objectives.
10.2.1 Production objectives
The production objective is to make efficient sustainable use of land, labour, and capital. The
problem is to allocate resources to those enterprises and activities that will satisfy the objectives. It
is recognised that smallholder farmers in Tonga have multiple goals that often compete with one
another. The more frequently identified goals include having a secured supply of staple food; an
ability to meet social and religious obligations; to ensure that adequate cash is generated for
household demands and capital investment, and to have adequate leisure time. In managing the
farm, the smallholder farmer wishes to obtain the best level of overall satisfaction (or utility) across
(his or her) (household) multiple goals. Inevitably, some of the different goals will be in conflict (for
example, cash income versus leisure) so the farmer will have to achieve a satisfactory balance
between trading one goal off against another and to ensure the gain in satisfaction from the goal
receiving increased emphasis is greater than the decrease in satisfaction incurred by decreasing
the emphasis on the other goal or goals.
10.2.2 Resources availability
The relative factor proportions at the farmers' disposal in terms of land, labour, capital ratios are
major determinants in the choice of crops, livestock and production techniques. Conditions in
Tonga do vary from island to island and from decision unit to decision unit, but if there is a valid
generalisation, it is that in Tongan smallholder agriculture land availability and length of tenure is a
significant constraint to anyone household so that decisions on the use of the household land
resources are critical.
10.2.3 The Constraints
A key issue is the impact of constraints. Through their influence on resource availability,
constraints have significant effect on farmers land use decisions, and thus on the level and nature
of production, and the acceptance of improved innovations. For convenience, constraints may be
classified into (a) the physical and economic environment within which the farm operates, (b) the
starting conditions facing the farmer in formulating his production strategy, (c) the nature of the
farm household production unit, and in particular its competing demand for family labour both for
domestic and other economic activity, and (d) the perceived attitudes to climatic and market risks.
152
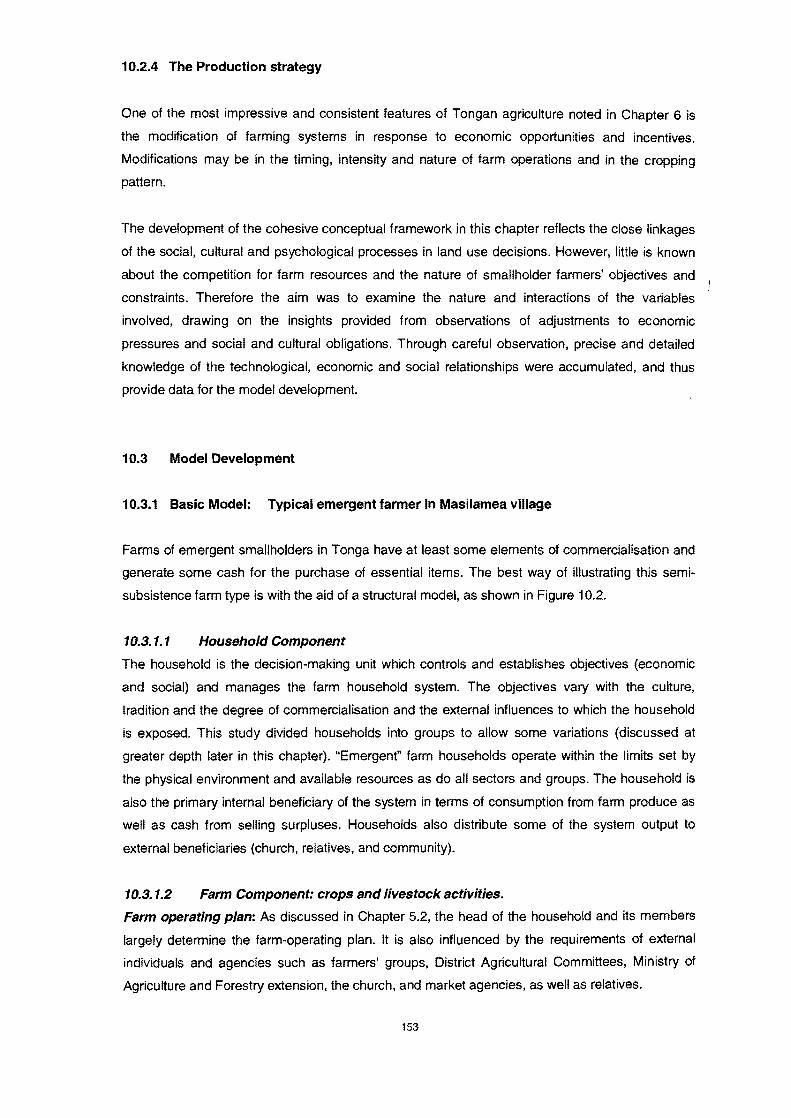
10.2.4 The Production strategy
One of the most impressive and consistent features of Tongan agriculture noted in Chapter 6 is
the modification of farming systems in response to economic opportunities and incentives.
Modifications may be in the timing, intensity and nature of farm operations and in the cropping
pattern.
The development of the cohesive conceptual framework in this chapter reflects the close linkages
of the social, cultural and psychological processes in land use decisions. However, little is known
about the competition for farm resources and the nature of smallholder farmers' objectives and
constraints. Therefore the aim was to examine the nature and interactions of the variables
involved, drawing on the insights provided from observations of adjustments to economic
pressures and social and cultural obligations. Through careful observation, precise and detailed
knowledge of the technological, economic and social relationships were accumulated, and thus
provide data for the model development.
10.3 Model Development
10.3.1 Basic Model: Typical emergent farmer in Masilamea village
Farms of emergent smallholders in Tonga have at least some elements of commercialisation and
generate some cash for the purchase of essential items. The best way of illustrating this semi-
subsistence farm type is with the aid of a structural model, as shown in Figure 10.2.
10.3.1.1 Household Component The household is the decision-making unit which controls and establishes objectives (economic
and social) and manages the farm household system. The objectives vary with the culture,
tradition and the degree of commercialisation and the external influences to which the household
is exposed. This study divided households into groups to allow some variations (discussed at
greater depth later in this chapter). "Emergent" farm households operate within the limits set by
the physical environment and available resources as do all sectors and groups. The household is
also the primary internal beneficiary of the system in terms of consumption from farm produce as
well as cash from selling surpluses. Households also distribute some of the system output to
external beneficiaries (church, relatives, and community).
10.3.1.2 Farm Component: crops and livestock activities. Farm operating plan: As discussed in Chapter 5.2, the head of the household and its members
largely determine the farm-operating plan. It is also influenced by the requirements of external
individuals and agencies such as farmers' groups, District Agricultural Committees, Ministry of
Agriculture and Forestry extension, the church, and market agencies, as well as relatives.
153
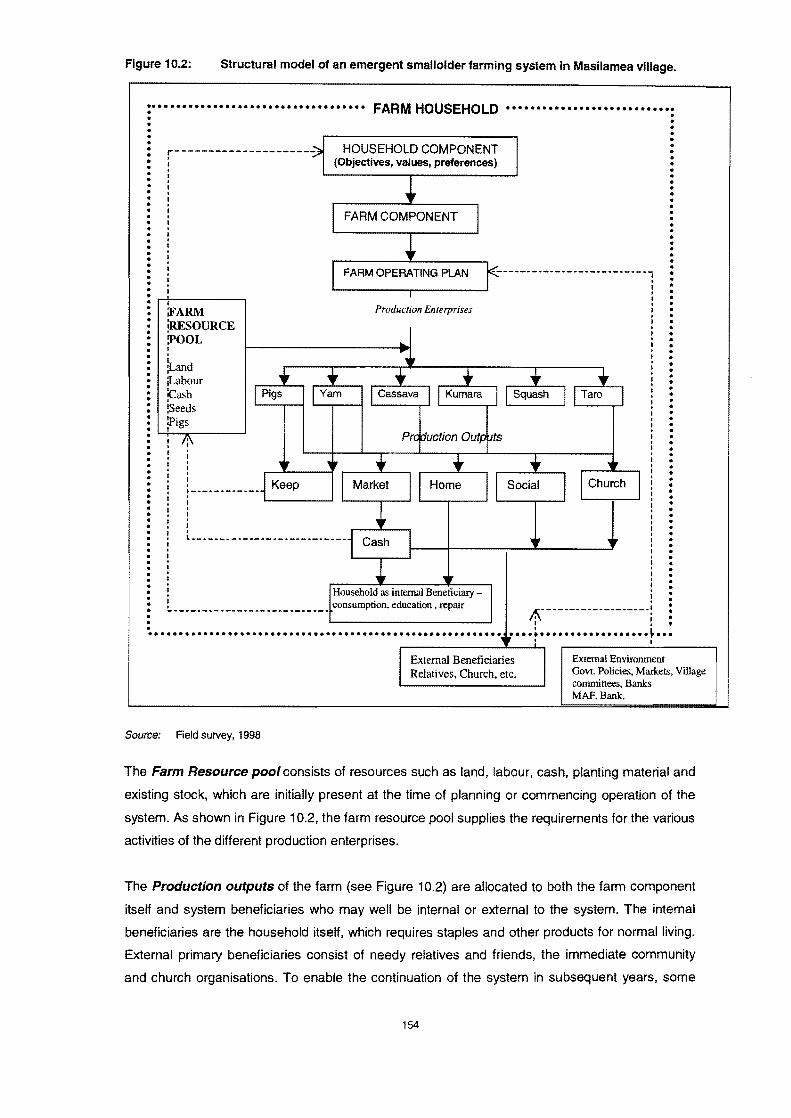
Figure 10.2: Structural model of an emergent small older farming system in Masilamea village.
..•.................•............... · FARM HOUSEHOLD
· · · · · · · r---------------------. I
HOUSEHOLD COMPONENT (Objectives, values, preferences)
. ...............•........... · ·
· · · · · · · · · · · · · · · · · · · · · · · ·
FARM OPERATING PLAN ---------------------------1 · · · · · · · · ·
· · · · · · · · · · · · · · · · · · · · · · · ·
I ;FARM REsOURCE !POOL I . lLand jLabour !Cash ~Seeds !Pigs I · I · I · I · I · ~------------
· I · I · L __________________________ _
Production Enterprises
· · · · · · ·
· · · · · · · · · · · · · · . I • · . , . ; : i • · A----.. - .. - .. - .. --------;
I • • ~ ..............•....•...................•............. .... ....•.................. ~ ...
Source: Field survey, 1998
r-------------~--~.~ I
External Environment Govt. Policies, Markets, Village committees, Banks MAF.Bank,
The Farm Resource pool consists of resources such as land, labour, cash, planting material and
existing stock, which are initially present at the time of planning or commencing operation of the
system. As shown in Figure 10.2, the farm resource pool supplies the requirements for the various
activities of the different production enterprises.
The Production outputs of the farm (see Figure 10.2) are allocated to both the farm component
itself and system beneficiaries who may well be internal or external to the system. The internal
beneficiaries are the household itself. which requires staples and other products for normal living.
External primary beneficiaries consist of needy relatives and friends, the immediate community
and church organisations. To enable the continuation of the system in subsequent years, some
154
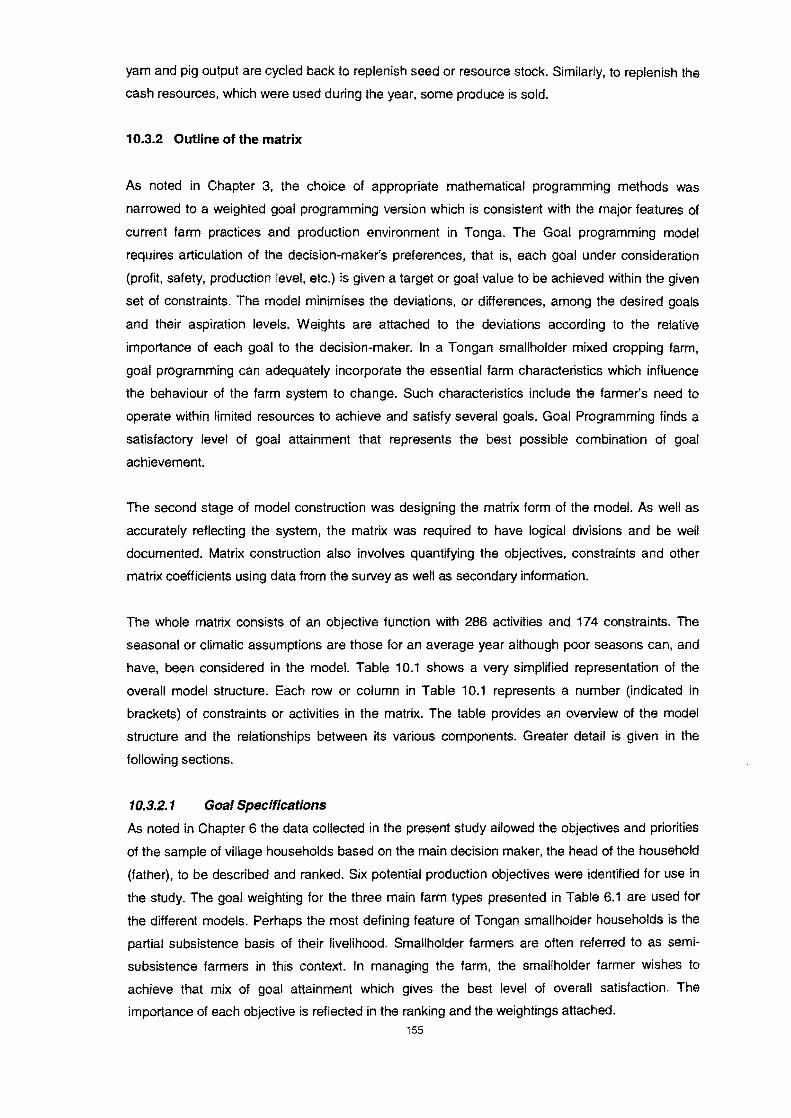
yam and pig output are cycled back to replenish seed or resource stock. Similarly. to replenish the
cash resources. which were used during the year. some produce is sold.
10.3.2 Outline of the matrix
As noted in Chapter 3. the choice of appropriate mathematical programming methods was
narrowed to a weighted goal programming version which is consistent with the major features of
current farm practices and production environment in Tonga. The Goal programming model
requires articulation of the decision-maker's preferences. that is. each goal under conSideration
(profit, safety. production level, etc.) is given a target or goal value to be achieved within the given
set of constraints. The model minimises the deviations. or differences, among the desired goals
and their aspiration levels. Weights are attached to the deviations according to the relative
importance of each goal to the decision-maker. In a Tongan sma"holder mixed cropping farm,
goal programming can adequately incorporate the essential farm characteristics which influence
the behaviour of the farm system to change. Such characteristics include the farmer's need to
operate within limited resources to achieve and satisfy several goals. Goal Programming finds a
satisfactory level of goal attainment that represents the best possible combination of goal
achievement.
The second stage of model construction was designing the matrix form of the model. As well as
accurately reflecting the system, the matrix was required to have logical divisions and be well
documented. Matrix construction also involves quantifying the objectives, constraints and other
matrix coefficients using data from the survey as well as secondary information.
The whole matrix consists of an objective function with 286 activities and 174 constraints. The
seasonal or climatic assumptions are those for an average year although poor seasons can, and
have, been considered in the model. Table 10.1 shows a very simplified representation of the
overall model structure. Each row or column in Table 10.1 represents a number (indicated in
brackets) of constraints or activities in the matrix. The table provides an overview of the model
structure and the relationships between its various components. Greater detail is given in the
following sections.
10.3.2.1 Goal Specifications
As noted in Chapter 6 the data collected in the present study allowed the objectives and priorities
of the sample of village households based on the main decision maker, the head of the household
(father). to be described and ranked. Six potential production objectives were identified for use in
the study. The goal weighting for the three main farm types presented in Table 6.1 are used for
the different models. Perhaps the most defining feature of Tongan smallholder households is the
partial subsistence basis of their livelihood. Smallholder farmers are often referred to as semi-
subsistence farmers in this context. In managing the farm, the smallholder farmer wishes to
achieve that mix of goal attainment which gives the best level of overall satisfaction. The
importance of each objective is reflected in the ranking and the weightings attached. 155
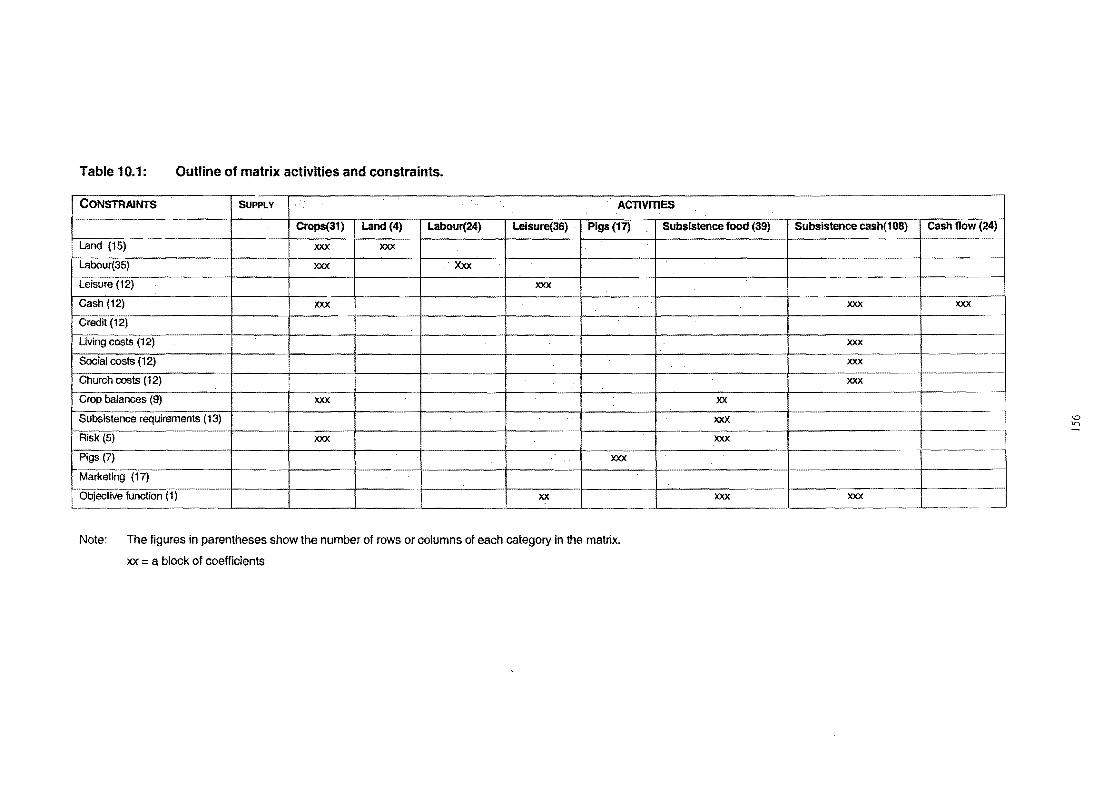
Table 10.1: Outline of matrix activities and constraints.
CONSTRAINTS SUPPLY ACTIVmES
Crops(31) Land (4) Labour(24) Leisure(36) . Pigs (17).
Land (15) xxx xxx Labour(35) xxx . Xxx
Leisure (12) xxx Cash (12) xxx Credit (12)
Living costs (12)
Social costs (12)
Church costs (12)
Crop balances (9) xxx Subsistence requirements (13)
Risk (5) xxx Pigs (7) . , xxx Marketing (17)
Objective function (1) xx
Note: The fjgures in parentheses show the number of rows or columns of each category in the matrix.
xx = a block of coefficients
Subsistence food (39)
xx XXX
xxx
xxx
-
Subsistence cash(108)
-
xxx
xxx xxx xxx
-
-
xxx
cash flow (24) -
-~
xxx --
-
--
\0 Ir)
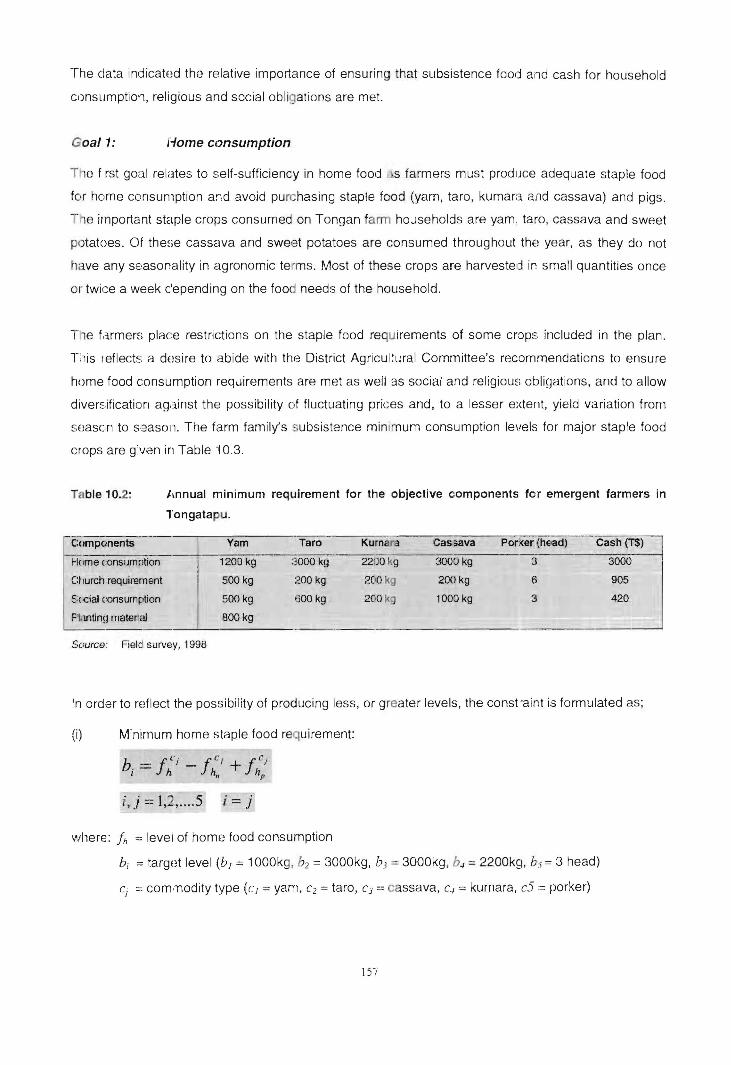
The ciata indicatod the relative importance of ensuring that subsistence food and cash for household
c,)nsLimption, religious and social obligations are met.
Goal 1: Home consumption
The f rst goal relates to self-sufficiency in home food . s farmers must produce adequate staple food
fc·r home consumption and avoid purchasing staple food (yam, taro, kumara and cassava) and pigs.
T le important staple crops consumed on Tongan farm hO:Jseholds are yam taro, cassava and sweet
potatoes. Of the~;e cassava and sweet potatoes are consumed throughout the year, as they do not
have any seasonality in agronomic te ms. Most of these crops are harvested in small quantities once
01 twice a week c'epending on the food needs of the household.
T 1e farmers place restrictions on the staple food requirements of some crop:::, included in the plan.
Tilis reflects a desire to abide with the District Agricultural Committee's recommendations to ensure
home food consumption requirements are met as well as social and religiou~ ; obligations, and to allow
diver!:,ification against the possibility of fluctuating prices and. to a lesser e:<tent, yield variation from
season to s·easoll. The farm family's subsistence minimum consumption levels for major staple food
crops are g'ven in Table i 0.3.
Table 10.2: tlnnual minimum requirement for the objective components fOir emergent farmers in
Tongatapu.
C:Clmpc~--
I-kome consumption
Church requirement
Sccial consumption
F'liIDtin!l material
Source: Field survey, 1998
Yam 1200 kg
500 kg
500 kg
800 kg
Taro Kurnara ._----:;000 kg 22:JO kg
;~OO kg 2CO kg
600 kg 200 kg
Cassava
300~ kg
200 kg
1000 kg
------Porker (hE.ad)
~I
6
::I
Cash (T$)
3000
905
420
In ord2r to reflect the possibi lity of producing less, or greater levels, the canst -aint is formulated as;
(i) Minimum home staple food requirement:
i,j =: 1,2, .... 5 i = j
INhere: fh ::: level of home food consumption
bi ::: targnt level (b / = 1 OOOkg. b2 ::: 3000kg, h - 3000kg. b .J = 2200kg, b5 ::: 3 head)
Cj ::: com'Tlodity type (c/ = yarn, C2 = taro. C3 ::: cassava, C.J ::: kumara, c5 ,= porker)
157

a 1d the variable~; with the subscripts lin (negative deviation) and hp (positive deviatic n) are referred to
as deviational variables and represent the kilograms of crop, or number of pigs, of over, or under
production relative to the minimum target level of production hi. The objective is to minimise ihc, .
r
(ii) Minimum living cost-monthly requirement:
2_<::0 Em Em E m J := II - II. + h,
wher3: E" = Living expenses in each month, m == month 1,2,3 ..... 12. and the variables with the
subscript h" = nE·gative deviation, and hp = positive deviation
Homa consumption also involves cash requirements for household demand~;. These include purchase
c·f ncn-farm produced food essential~; (flour, sugar, meat, etc) , and other essentials such as clothing,
education, and household utilities. Unlike the staple food requirement, the livinq costs are set up on a
r onthly basis 01 T$250 per month and derived from survey results in Chapter 8. This can be met not
only from the cash generated from selling surplus produce but from off-farm income earnings and
cash borrowed. Deviational variable:, with subscripts hp and hn represent the a.mount by which the
rninimum level is not met, or is exceeded respectively. The objective in the goal constraint is to
rninimise the unjer supply E; . p
l'3oaI2: Church obligation
The seco:1d gcal is the desire to produce adequate staple food, livestock, and cash for church
I)bli~lations .
': i) Minimum church staple food requirement:
i , j=I,2 ..... 5 i=j
where: fc == level of church food consumption
bi = target level (b I = 500kg, b2 = 200kg, b] == 200kg, b4 = 200kg, b i = 6 head)
c) = commodity type (c I == yam, C2 ::: taro, C3 == cassava, C4 = kumara, Cj = porker)
and the variablns with, the subscripts C" (negative deviation) and cp (positive deviation) are referred to
as deviatlonal variables , which represent the kilograms of crop, or number 01 pigs, of over, or under
production relai ive to the minimum target level of pw duction bi. The objective is to minimise f cC j
• • p
(ii) Church monthly cash requirements:
b =: E m _ E m + E m '" m C e lf C
whore: Ec = Church expenses in each month, m == month 1,2,3 ... .. 12.
b,n == monthly cash require ent target level. l Ii
Goal 3:
The var:abies with the subscripts CII and cp are the negative and positive deviations
respectively.
The objective in the goal constraint is to minimise the under supply E m . CI,
Minimise risks
The 1 hird goal i~; reflected in the emergent smallholders adopting production systems that put an
emphasis on faa] security and risk avoidance. The production and on-farm ~;torage of minimum staple
food requil'ements, intercropping, crop diversification, planting of drought resistant crops and the
fragmentation 01 individual holdings are a:1 symptomatic of a desire to ensure that subsistence
mqui rements in Goal 1, 2 and 4 are s:ltisfied .
Farm decision-makers frequently associate risk with the failure to attain some given target return
(Patnck et al., 1985). Low (1974) developed one of the safety-first models that represent risk as the
abso lute va :: ue of negative deviations from some target levei of achievement. These safety-first
concepts are related to short-run survival, which appeared to be an important consideration among
the Tongan farm house ~'lolds studied. The model used is designed to help farmers ensure that the
solutions produce minimum food and income necessary to meet the minimum family food requirement
end living costs each year. These are most appropriate requirements where the risk of calamity is
large, either beGause of an inherently risky environment, or because thE! farmer is poor and has
r linimal reserve:; to fall back on in a bad year.
The security requirements operate as a constraint on the satisficing objective so there is a cost
providing again ~;t ruin. This cost is the difference between the maximum expected income in the
absence of the risk requirement. Tile sr1::l.lIholder is assumed, therefore, to minimise the cost of
providing against the ruin by maximising expect goal attai'lment subject to ensuring t'"lat his
~ ; ubsistence requirement is met under the most adverse conditions he considers likely to arise. Crop
outputs are spedfied in terms of their physical yields so that they can relate directly to the staple food
requirements. The security constrwnt set ensures that ~aro, yam, sweet potato and cassava
production in a poor year is at least eyual to each basic subsistence requirement.
Thw;, the third ~Ioal of minimising risk was incorporated as the following system constraints:
j == 1,~ " ... .4
Nhere: Cp = rTinimum annual food conSUMption in a poor year
PI = total production in a poor year.
c) = commodity type ( c, = yam, C2 = taro, C '" cassava, C4 = kumara)
and Mp = quantity of product sold in a poor year at the associated price.
159
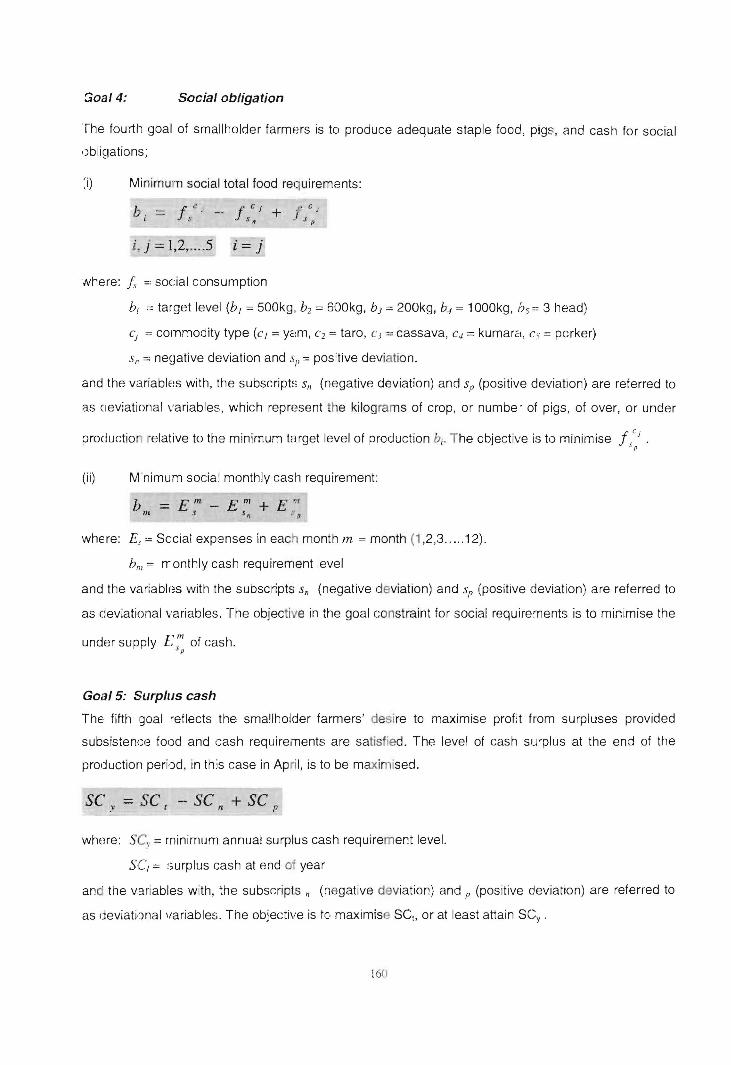
;;oaI4: Social obligation
The fourth goal of smallholder fa rmers is to produce adequate staple food, pigs, and cash for social
l )bli~lations;
:i) Minimum social total food requirements:
b = f L. _. r C J + . ~ c ) l S .JX" J sp
i, J = 1,2, .... 5 i = j
Nhere: Is ::: social consumption
bi :-:: target level (b J = 500kg, b2 = 600kg, b J :=: 200kg, b4 = 1000kg, h5 == 3 head)
CJ == commodity type (c J = yam, C2 = taro, Cj == cassava, C4 = kumara, c-' = porker)
s" =: negative deviation and si' = positive deviation.
and the variablE!s with, the subscripts Sn (negative deviation) and sp (positive deviation) are referred to
as cleviational variables, which represent the kilog rams of crop, or numbe ' of pigs, of over, or under
production relative to the minimum target level of production bi. The objective is to minimise J,c j • p
(ii) M'nimum socia ~ monthly cash requirement:
b = E /II - E '" + E <1 nl s s ~ :. ~
where: E~ '" Scciai expenses in each month m = month (1,2,3 ..... 12).
bm = rTonthly cash requirement level
and the variables with the subscripts s" (negative deviation) and sp (positive deviation) are referred to
as cleviational variables. The objective in the goal constraint for social requirements is to minimise the
under supply r ;' of cash. p
Goal5: Surplus cash
The fifth goal reflects the smallholder farmers' desire to maximise profit from surpluses provided
subsistence food and cash requirements are satisfied. The level of cash surplus at the end of the
production peri'Jd, in th is case in April, is to be maxi ised.
sc = 'lC - SC + SC v ... r n p
whore: Sc, = rninimum annual surplus cash requirement level.
SCI = !;urplus cash at end of year
and the va.riables with, the subscripls n (negative deviation) and p (positive deviation) are referred to
as deviati'Jnalllariables. The objective is to maximise SCt. or at least attain SCy .
160

~ i oal 6: Leisure requirernents
T he final goal is '~o allow adequate tims for leisure.
L = Lm - 1m + 1m
m I /I P
LtrI where: I = Leisure hours in each month
m = month ( 1,2,3 .... . 12)
Lm =: monthly leisure requirement level
and l;' = negative deviation and I;' = positive deviation in m1h month,
The demand for leisure was treated in much the same as the demand for staple food and cash
consumption, incorporating it in the goal constraints. The amount of leisure (for 2 labour units) taken is
constrained by the amount of productive work to be done and the total time available for allocation
between farm work and leisure. Fro survey results a minimum leisure mquirement of 192 hrs per
month for erner£lent farm household was included except in December and January which were given
:~80 and 230 hours respectively. The ob,ective in the goal constraint is to minimise the under
l m achievemEnt of leisure monthly requirements Jl
minimum can bn more than satisfied.
1O.3!.2.2 The Combined Objective Function
or to maximise overachievement if in fact the
The motivation contained in the objective function reflects the demand of a semi-subsistence farmer to
3nsure that there will be sufficient production to m ,et family consumption needs (home, religious ,
social); ensure -;hat adequate cash if3 generated for cash consumption require-nents (living cost, social
3.nd church donations) ; ensure sakty requirements are met or risk minimised, and ensure leisure
requirements al'e met. This is achieved by minimising:
5 5 5 12 12 12
MirzZ -- wlL fh:' + w2L fc:i + wJL IJ:' + w 4L E:: + w:; L E;': + w6L E~ -j=1 j=1 j= 1 tII=l m =,.1 m=l
12
+ W 7 L, [17 + W 8 SC p
m= 1
whme: Wj = goal weights for under achieveme t of goals respectively; (W1 = home food, W2 =
church food, \1\13 = social food, W4 = home cash, Ws = church cash, W6 = social cash, W7 = leisure, W8
= profit), f = slaple food requirement level ; E = minimum cash requirement; Cj =-= crop type (c) = yam,
C2 =: taro, C3 =: cassava, C4 = kumara, C5 = porker) , It = home requirement, s == soc~al requirement, c =
church requirement, m = month(1,2 .. . 12), I = leisure requirement, SC = wrplus cash at end of April,
anel the variables with the subscrip): p (positive deviation) is referred to as deviational variables which
16 1

represent the kilograms of crop, number of pigs, or cash under production relative to the minimum target level required.
10.4 Modelling Production Activities
The analysis of village smallholder farming systems (Chapter 6) revealed a mixed combination of food
and cash crops and domestic livestock such as pigs and poultry was produced. The combination of
livestock with crops results in a large number of activities, and an even larger number of different farm
products. The production activities in the matrix include the major staple food crops (yam, taro,
cassava, taro and sweet potatoes) and a specific cash crop squash. Not all the crops and livestock
that can be grown and raised are represented in the model, only the major food and cash crops
identified in the survey were included. Some of the minor crops and livestock, including fruit trees,
cattle and poultry, are in small quantities and the area planted and number kept does not justify
explicit consideration. In addition, they do not have the financial or subsistence reasons for production
expansion. Table 10.3 contains the input and output coefficients used in the crop components of the
model. The expected yield values are fixed for all runs of the model undertaken for this study.
Empirical values were obtained from an average of past gross margins analyses presented in
Appendix 3. In the case of perennial crops like kava and vanilla with a growing period of 5 and 12
years respectively, all coefficients were divided by the number of years of growth.
Table 10.3: Summary of input and output requirements for each enterprise.
CROP Labour Capital Yield Price GMiha Return to labour Hrs/ha T$lha kg/hs (T$Ikg) T$lha T$lhr
Yam (mixed) 1230 3089 12350 1.65 17,288 14.06
Giant taro 900 385 17000 0.4 6415 7.13
CoIocasia taro 985 no 9880 0.60 5457 5.54
Xanthosoma taro 955 587 11100 0.50 6763 6.03
Sweet Potatoes 830 440 12000 0.25 2560 3.08
Cassava 840 620 18525 0.15 2159 2.57
Squash 600 1673 8000 0.50 2327 3.88
Watermelon 680 1040 18000 0.35 5260 7.74
Vanilla 720 175 698 10 6809 10.27
Kava 430 170 1000 12.00 11884 27.52
Source: Field survey. 1998; Gyles et al., 1989
Tending pigs was the only livestock enterprise included in the model. Pig activities (Activities 74-93)
incorporated include pig rearing, buying and selling. Farmer's obtain breeding sows and fatten their
offspring for pork using some of the cassava production as feed to supplement coconuts. Breeding
sows are incorporated in the model through a single activity. Each sow is expected to produce 10
healthy offspring per year and to require 0.20 replacements each year. That is, a breeding life of five
162
years is assumed, implying that on average 20 percent of the sows must be replaced each year. The
replacement control equation implies that the number of young sows will be provided by rearing
replacements on the farm or, alternatively, purchased.
Weaner activities include selling, purchasing, and keeping for porker production. Porkers can be sold,
purchased or consumed (home, social, church). The minimum requirements for porkers are
expressed in constraints 155-157. The litter balance row requires that the number of weaners, and
replacements reared cannot exceed the number of piglets produced. Since the number of
replacements required would be small relative to the total number of piglets produced, it is not
necessary to include separate balance constraints for female and male piglets. As cassava can be fed
to pigs, it is necessary to include options for feeding that links to the cassava balance row. This
requires that the total amount of cassava used for subsistence consumption, pig feed, and sold,
cannot exceed the amount produced.
10.5 Modelling Production Constraints
While an emergent smallholder farmer seeks to achieve the many objectives through production
activities, the level of these activities is restricted by various technical and behavioural constraints.
The constraints included in the model are; (1) monthly land constraints; (2) monthly labour constraints
consisting of family labour supply and the availability of hired labour; (3) financial constraints which
consist of money constraints, borrowing constraints and loan repayment constraints; (4) household
subsistence consumption constraints; (5) flexibility constraints to account for risk and uncertainty
related to farm prices, yield expectations, government programs, and restrictions on the aggregate
supply of farm inputs. The details of resource constraints and restrictions are discussed below.
10.5.1 Modelling decision problems involving land
The supply of land resources in each period throughout the year must be known. The simplest form of
land constraint arises where individual crops occupy land for a full year, in which case only one
constraint may be required in intensive crop production, however, more than one crop can be
produced from the same block of land within a single year. Thus, the year was divided into monthly
periods and land constraints specified for each month within the year. This ensures that in no months
of the year will the total land requirement for cropping exceed the supply of land.
The model includes a land area of 3.34 hectares, which is the average area of land held under secure
tenure by each household. Provision is made for the short-term borrowing of land, which is common in
Tonga (discussed in Chapter 6). as well as hiring land activities with restrictions on each:
(i) maximum of 2 hectares of borrowed land,
(ii) provision for the hire of up to 8 hectares at a cost of T$2000/ha per season.
163

Figure 10.3:
I I May
Yam 1 I I···· Yam 2 I I,··· Taro 1 : 1-···
Taro 2 I I····
Cassava 1 1 I····
Cassava 2 11--.. Kumara 1 I
Kumara2 I
Squash i
Crop activities and land requirements.
MONTH
Jun \ Jul I
Aug Sep Oct 1 Nov
, .. - I I I ••• --
: .... - I I I --,-
:'----1--:-I
···_·-1- -:-.... -. 1-
, ..... , 1- I .----
1---·- ---.. ! ------ i ------ I ----.- I -_.-. 1-··- : .----
1-··- I __ ow I ---I : I
Source: Field survey, 1998
• '--_.' represents land occupation.
! I I Dec Jan Feb I Mar ! Apr 1 May Jun
-··-1 -.. ···r ---.. ----I
--·-1 ...... I ...... --.-. I .-.. -. • •• _1
····1
-··-1
-.--.. I -··-1 ____ ow l -"'-' ····1 I
I i
Each crop activity uses the land resource according to the period it occupies the ground (Figure 10.2).
This bar chart depicts the land requirements of each potential activity. The majority of the root crops
such as yam. taro and cassava occupy land for 9-12 months. sweet potatoes take six to seven
months while squash only occupy land for 4 months (July-Oct).
As described in Chapter 6, Tongan farmers still operate to a broad framework of crop sequences.
Such frameworks are often particular to individual' farmers and relate to their production objectives
and to the soil types and conditions found on the farm. Dent et al., (1986) note that suitable rotations
are the basis of farming systems. Rotational constraints include ensuring that the optimal cropping
pattern does not violate the rotational sequences that are technically feasible. In particular, fallow land
is constrained to allow planting next season's yam. The rotational requirements and preferences are
incorporated into the model in the system constraints.
Different crops have different fertility requirements and ability to produce. Provided in the model are
options for maintaining soil fertility either through fallowing or the use of fertilisers (organic and
inorganic). The fallowing period varies from one year to as long as six years. The average time
schedule consists of one to three years in fallow and 3 to 7 years in cropping. However, no farmer
reported following a predetermined schedule, basing decisions upon crop yields.
The fertility constraint (Row 13) assigns coefficients to each crop activity to reflect the relative changes
in soil nutrients and structure, which can be attributed to growing specific crops. Yam has the highest
coefficient (0.5), which reflects the high fertility and good structure requirement. It can only be grown
on the same land for two successive years before yield typically declines as a result of
impoverishment of soil fertility. On other hand, taro, with a coefficient of 0.2, indicates that it can be
164
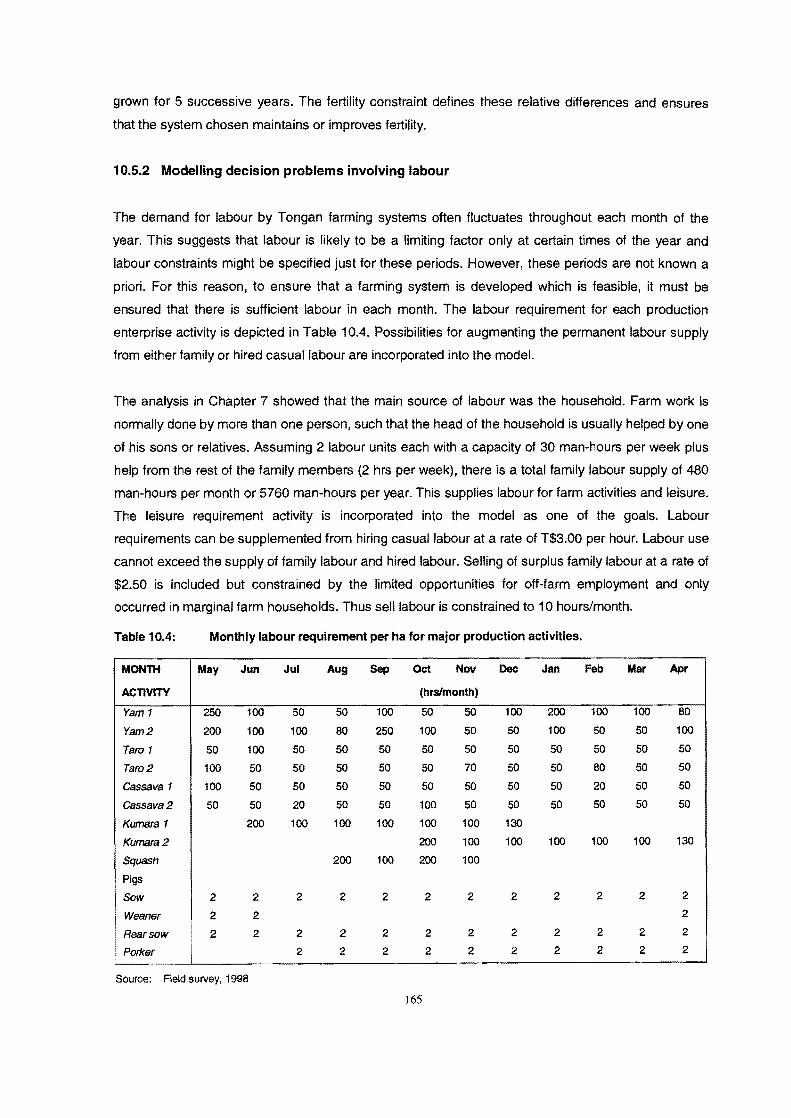
grown for 5 successive years. The fertility constraint defines these relative differences and ensures
that the system chosen maintains or improves fertility.
10.5.2 Modelling decision problems involving labour
The demand for labour by Tongan farming systems often fluctuates throughout each month of the
year. This suggests that labour is likely to be a limiting factor only at certain times of the year and
labour constraints might be specified just for these periods. However, these periods are not known a
priori. For this reason, to ensure that a farming system is developed which is feasible, it must be
ensured that there is sufficient labour in each month. The labour requirement for each production
enterprise activity is depicted in Table 10.4. Possibilities for augmenting the permanent labour supply
from either family or hired casual labour are incorporated into the model.
The analysis in Chapter 7 showed that the main source of labour was the household. Farm work is
normally done by more than one person, such that the head of the household is usually helped by one
of his sons or relatives. Assuming 2 labour units each with a capacity of 30 man-hours per week plus
help from the rest of the family members (2 hrs per week), there is a total family labour supply of 480
man-hours per month or 5760 man-hours per year. This supplies labour for farm activities and leisure.
The leisure requirement activity is incorporated into the model as one of the goals. Labour
requirements can be supplemented from hiring casual labour at a rate of T$3.00 per hour. Labour use
cannot exceed the supply of family labour and hired labour. Selling of surplus family labour at a rate of
$2.50 is included but constrained by the limited opportunities for off-farm employment and only
occurred in marginal farm households. Thus sell labour is constrained to 10 hours/month.
Table 10.4: Monthly labour requirement per ha for major production activities.
MONTH May Jun Jul Aug Sep Oct Nov Dec Jan Feb Mar Apr
ACTIVITY (hrslmonth)
Yam 1 250 100 50 50 100 50 50 100 200 100 100 80 Yam 2 200 100 100 80 250 100 50 50 100 50 50 100 Taro 1 50 100 50 50 50 50 50 50 50 50 50 50 Taro 2 100 50 50 50 50 50 70 50 50 80 50 50 Cassava 1 100 50 50 50 50 50 50 50 50 20 50 50 Cassava 2 50 50 20 50 50 100 50 50 50 50 50 50 Kumara 1 200 100 100 100 100 100 130 Kumara2 200 100 100 100 100 100 130 Squash 200 100 200 100 Pigs Sow 2 2 2 2 2 2 2 2 2 2 2 2 Wesner 2 2 2 l Rearsow 2 2 2 2 2 2 2 2 2 2 2 2
Porker I 2 2 2 2 2 2 2 2 2 2
Source: Field survey, 1998
165
10.5.3 Modelling decision problems involving working capital
Access to working capital is important. If shortages of working capital arise and impose limitations on
the farmer's production plans, then such limitations should be imposed on the goal-programming
model. The farming system must be organised so that demand for working capital for specific periods,
say monthly, can be satisfied from off-farm income, working capital on hand, or from borrowing.
The basic-on-farm supplies of short-term capital were obtained from the survey of household income
and expenditure. The initial off-farm capital supply was calculated by determining borrowing for
agricultural production and loans from various sources of credit. To construct the working capital
constraints, the net requirements of activities for working capital each month were incorporated.
The financial segment of the matrix incorporates a monthly cash flow, for the payment of fixed cash
costs and household living expenses and personal expenditure, social and church requirements,
maximum borrowing constraint and repayment. A minimum cash requirement for home, church, and
social consumption per month was incorporated in the model. These figures were determined from
the analysis of the household expenditure pattern in Chapter 7 (Field Survey, 1998). The total demand
for working capital and cash by each activity does not have to be met by funds on hand at the
beginning of the year because funds will also be earnt throughout the year by various activities.
Activities use or contribute to the cash stock in each month according to their cash flow
characteristics. Any cash surplus generated in any month may either be saved to meet future deficits
or transferred through the cash surplus activities to the objective functions. The monthly interest rate
on savings is about 0.7 percent, which is the current market interest rate on savings in the Bank of
Tonga and other commercial banks. Provision for credit comes from the Tonga Development Bank,
which is the main source of credit for agricultural activities. The interest rate on agricultural loans
under T$2oo0 is about 0.08 percent per month.
10.5.4 Selling and buying activities
Some of the resources available to farmers are not strictly fixed because they can be supplemented
through hiring or renting additional units. If the fixed supply of labour is critical, for example, the farmer
might hire additional workers. Similarly, the land area owned can be supplemented by renting
additional land. These options were incorporated in the goal-programming model through buying
activities. Such activities typically have a positive coefficient in the model's matrix representing the
wage or rent paid. Selling activities for excess resources and farm outputs are also incorporated to
reflect these options. Excess family labour can be hired out.
Buying and selling activities are also used in farm models to provide for the purchase of direct inputs
and the revenue from sales. Provision is made for trading farm produce and livestock although limits
166
are placed on the extent of such transactions, partly as a behavioural constraint reflecting the
subsistence nature of most Tongan smallholder households and the limited market opportunities.
Provision is also made for households to purchase foodstuffs that are not produced.
10.6 Summary
The main focus of this chapter has been on the development of a model to represent smallholder
farmers' production decision making in Tonga. The structure of the farm problem described was found
to suit a programming approach. Previous studies (Hardaker, 1975; Delforce, 1990) have shown that
comparable analytical requirements have been met with a mathematical programming approach.
Choice within the mathematical programming models was narrowed to a weighted goal programming
version which is consistent with the major features of current farm practices and the production
environment in Tonga as reflected in the structural model in Figure 10.1. In a study specific to a
Tongan smallholder mixed cropping farm, goal programming can adequately incorporate the essential
farm characteristics, which influence the behaviour of the farm system. Such characteristics include
the need for farmer's to operate within limited resources and a highly constrained environment to
achieve and satisfy an economic and non-economic goal set.
The main farm activities in the model included the (1) production activities which consist of growing
yam, taro, cassava, sweet potato, and squash. and tending pigs; (2) consumption activities which
utilise production for home, social and church requirements; (3) selling activities which market the
surplus of various farm commodities determined as a residual of production and consumption
decisions; (4) labour use activities which consist of family labour supply and monthly labour hiring; (5)
purchase activities which consist of agricultural inputs and non-farm durable and non-durable
consumer goods and services; and (6) financial activities which consist of cash flow, short-term
borrowing and loan repayment. The goal-programming model represents one annual production cycle
starting from May. The matrix embodies activities and constraints reflecting the division of the year
into two main cropping seasons (wet and dry) and into six-month periods within each season. The GP
model assumes no technological change within the year of analysis. Each production activity in a
representative farm can use one technology, expressed as a unique combination of input-output and
yield coefficients. The results obtained from implementing this approach are presented and discussed
in the next chapter.
167
CHAPTER 11
MODEL VALIDATION AND VERIFICATION
11.1 Introduction
The success and failure of a programming model must be measured by how well it predicts the
particular phenomena in question (Anderson, 1974). Hence, having completed the design of a model,
the modeller is faced with the task of determining if the model, when given proper inputs. produces
results that are meaningful and are of use in relation to the analytical purpose for which the model was
created. The first section of this chapter involves the testing and observation of the model output to
assess the usefulness of the model for its intended purpose. An important part is model validation,
which involves the testing of the verified model's ability to mimic the operation of the real world
situation. The second part discusses the model solutions. The GP model provides three types of
solutions: (1) the degree of goal attainment with the given resources; 2) identification of resource
requirements to attain all the desired goals; and (3) the degree of goal attainment under various
combinations of resources and goal priorities and weightings. This chapter presents the three
separate solutions in order to demonstrate the capability of the models to analyse Tongan smallholder
farm production.
11.2 Model Verification
Dent and Blackie (1979) considered a two step procedure for checking whether a model justifies
persistent analytical attention; a) verification is the process of ensuring that the model behaves as
the analyst intends it to it and hence involves the checking of the model for logical consistency; and b}
validation, or deciding the adequacy of the model to mime the behaviour of the real system. In the
model verification stage, some considerable care was devoted to the model construction to ensure
there were no discrepancies between the matrix and its representation in the computer. The Lindo
1997 computer package includes a number of check procedures for data handling and processing
which were used in conjunction with manual checking during the first stage of model verification. In
the second stage of verification, preliminary results were obtained for the models and compared with
existing situations. A few more errors were detected at this stage which led to some fundamental
revisions and modifications.
168

Some of the errors included the implausible levels of sales both for livestock and crops thus
generating an implausible level of surplus cash. In real situations, market opportunities are the major
constraint in Tonga. Therefore restrictions were imposed on trading in crops and pigs. The market
constraint varies between the three sub-regions as discussed in Chapter 5, with better market
opportunities in Tongatapu not only for domestic consumption, but for export compared to Vava'u and
Ha'apai. The levels of restrictions were estimated from the average sales per seller for each
commodity in a season for each of the respective island groups.
The sale of agricultural labour was also reconsidered. The results from the fieldwork indicated that this
activity only occurred with marginal farmers. Limited market opportunities exist for agricultural labour;
therefore it was unrealistic to incorporate selling labour activities in the model as an income generating
opportunity for emergent and progressive farm households. There was also variation among the
island groups with more agricultural labour demand existing in Tongatapu and Vava'u where cash
cropping is more intense compared to Ha'apai.
The initial formulation proved to be infeasible because pig production cost data was over specified
and unrealistic. Once these errors had been remedied solutions were obtained and carefully reviewed
to see that all the constraints and the activities were operating as intended. In this manner verification
of the model proceeded to a stage where it was possible to be confident that all errors of importance
had been corrected and the model was yielding solutions that closely resembled the existing situation
in Tongan agriculture.
11.3 Model Validation
The second stage of checking the model involves deciding if the model is a sufficiently valid
representation of the real world situation (Anderson, 1974). An analysis framework was constructed to
represent decision-making processes on smallholder farm management and this was subjected to
validation. In the use of models, the confidence that can be placed on generated output will depend
upon the accuracy with which the model reflects the essential behaviour of the real system. Validation
procedures are generally based on comparing the model predictions with what farmers are actually
doing and so determine the degree to which the model can mimic a situation that occurred in the past.
If the predictions differ from reality, we conclude the initial model assumptions were wrong and need
modifying. On the other hand, if the predictions closely resemble reality then we conclude that
assumptions were right and model is a true representation of existing situation. The model then needs
to be tested over a range of circumstances.
169

The validation :est used helps to t:!nsure that the input-output coefficients in tile model closely
resembled the real coefficients. Th is i achieved by c nstraining ~he model to the land use pattern of a
Irevious season to determine aggregate requ irement for each input and the output predicted by the
rnodl~1. The prEdicted values are then compared with the actual outpuls. The data used in the
validation procedures was derived from the field survey.
--he~;e results lEd to a r9adjustment of the objective function. The solution from the first run , despite
~; howing little difference to the existing operation with all the goals being achieved, gave higher priority
to meeting subsistence requirement with lower s rplus produce and cash output than might be
E,xpected. In other words, farmers prefer more surplus produce to sell for cash once the subsistence
requirement levels are attained. This resulted in a modification of the objective function by including
both the under-achievement and over-achievement deviation variables in the objective function.
Weinhts were then attached also to the overachievement of goals, with more weight given to surplus
Gash and leisure compared to subsistence food and minimum cash requirements. Thus, the objective
was modified to:
55555 5
MaxZ ::: -wi L f,,:i + w 2 L fh: J - w 3 L lc:i + w4 L f2 - w5 I fs~j + w 6 L f s:i
);1 ) = 1 ) ; 1 );1 ) = 1 )~1
12 12 I! 12 12 12
- W 7 L E:; + W8~ E;~ - W 9 L, E~ + WIGLE:: - W ll L E;: + W i2 LE;: 111=1 111=1 " =1 111 = m=1 m=1
where: Wi = noal weights for under and over achievement of goals respectively; (Wl.2 = home food,
W 3,4 = church food, WS,6 = social food, W7,B = home cash, W9,10 = church cash, WI1 ,12 = social
cash, W1 3, 14 = leisure, W1S,16 = profit), f = stap le food requirement level; E" = minimum cash
requirement; Cj = food type (c1 = yam, C2 ~ taro, C3 = cassava, C4 = kumara, Cs = porker), h = home
requirement, S = social requ irement, C = church requirement, m = month(1 ,2 ... 12}, I = leisure
requirement, SC= surplus cash in April , and the variables with the subscripts n (negative deviation)
and p (positive deviation) are referred to as deViational variables which represe~t the kilograms of
crop, number Jf pigs , or cash of :JVer, or under, production relative to the minimum target level
req lJired.
The new objective function is to maximise the net value of weighted under and over achievements.
The weight on the positive deviation reflects the importance attached for Cl goal to be achieved while
weig hts on the negative deviation reflects the value of overachievement of the same goal.
170
In order to assess the degree to which the model reflect farmer's choice, the optimal plan provided by
each model solutions were validated against the survey data with the actual operating conditions of
the representative farms in each zone. These actual conditions compared to model results are
presented and discussed below.
11.4 Model Results and Analysis
As outlined in Section 10.3 above, farms were categorised in order to develop a model for each
particular class. The prime objective of categorising farm types by geographical region and farmer
types is to provide homogenous groups each one of which has a specific model. Farm size, marketing
opportunity, degree of commercialisation, and differences in the geographical location for each island
group classify the reference farm types. The survey work suggested there were three main farmers'
group (marginal, emergent, and progressive). An important aspect of the modelling experiment is
recognising the different characteristics featured in the three main farm types in terms of their
preferences and goals, skill level, motivation and ability to utilise available resources. Further
consideration is also given in this section to develop models that are representative not only for each
particular farmer group but to reflect the behaviour of each reference farm type within the different
geographical regions. The three main island groups are characterised with different market access
and ability of different crops to perform. As a result, a total of eight reference farm types were chosen
to represents the situation of the three major farm types (marginal, emergent, progressive) in the three
sub-regions.
Farm 1 :
Farm 2:
Farm 3:
Farm 4:
Farm 5:
Farm 6:
Farm 7:
Farm 8:
Progressive farm in T ongatapu
Emergent farm in Tongatapu
Marginal farm in Tongatapu
Progressive farm in Vava'u
Emergent farm in Vava'u
Marginal farm in Vava'u
Emergent farm in Ha'apai
Marginal farm in Ha'apai
In the island of Ha'apai, the results from the survey indicated only two of main farm types exist
(emergent and marginal). Data were collated for each representative farm in the 3 sub-regions, for the
relative production activities, stocks of physical and of financial resources, constraints, and the
different goals and their relative weightings and these were incorporated into each matrix. Results for
the eight validated models are presented below to show the theoretical behaviour of each reference
farm type.
171

The representative farm models were first run to determine the input requirements necessary to
achieve all the goals, ranked on their relative importance, by each farm type. Information on
achievement status for each goal, and changes in farmers' operating plans, can be analysed for the
absolute changes in activity levels, or it can be used to study the distribution of the change itself.
11.4.1 Achievement of goals
The objectives of each farmer type are to ensure target levels for household food, cash and leisure
requirements, social and church obligations are satisfied. Table 11.1 summarises the achievement
status of the goals.
Goal 1: Home sustenance: According to the solution the most important goals, the household staple
food requirements for yam, taro, cassava and kumara are met exactly. All variables with the subscript
n (negative deviation) and p (positive deviation) are equal to zero. The living costs or monthly cash
requirements were also fully met with the exception of porker consumption which was not met where
hp= 3.
Goal 2 refers to church obligations: The staple food and cash requirements for church obligations are
fully met (cp = 0).
Goal 3: Minimise risks: The achievement of the goal of minimising risk was reflected by the respective
quantities of yam, taro, cassava and sweet potatoes sold in a poor year.
Goal 4: Social obligations: According to the goal programming basic solutions, staple food and cash
requirements for social obligations are fully met (sp = O).
Goal 5: Profit maximisation: The solution showed the surplus cash that the farmer achieved at the end
of the production year was adequate.
Goal 6: Leisure requirements: The goal programming basic solutions indicated that monthly leisure
requirements are satisfied.
11.4.2 Farm Operating Plans
The GP model solutions identify and quantify the input (resource) requirements to attain all the
desired goals. This is expressed in the farm plan specified by the optimum combination of activities in
the solutions. Another useful byproduct is the quantification of surplus or unused resources available
in each month (land, family labour and caSh). In this section, the farm-operating plans are presented
and the resource uses are analysed for each of the representative farm models. In

11.4.2.1 Analysis of land use
As shown in Table 11.2, farm operating plans from the model solutions are comparable to the actual
farm practices of the representative farms in the survey results. The vaJidation results for the
representative farms are close to those from the survey in terms of crop choice and the proportion
allocated for each crop. The slight variations in total cropped area and percentage distribution may be
attributed to some errors in the data used for actual production. As noted earlier, field results
estimation were based solely on what the farmers could recall and the area was estimated to the
nearest quarter acre or 0.1 hectare, and considering the low average cultivated area per farmer, such
errors will be more significant in the results. However, the results indicate that the models are accurate
and do reflect the decision-making process of the different farm types.
It is also important to note that these figures tend to be different to those reported in the 1993 Land
Use crop survey and elsewhere. The main reason for variation is due to the effect of the time of the
year the survey was carried out as most of the reported land use records referred to the land use at
the time of the survey. During the year a farmer may have some garden under cultivation, may have
abandoned others and clear some new ones and especially for root crops that are mostly planted all
year round. In some cases he may harvest more than one crop from the same area. The
measurement of the amount of land under cultivation at one time, therefore, will not necessarily
provide information on the total amount used during the year. The figures used for the model design
are production figures estimated from previous year total production.
In view of the different duration of various crops, land use is summarised in total hectares per year
and showed the proportion of cropped area allocated to different crops by each farm type. One can
notice that land use and cropping pattern during the first year varies within farm types and among the
different geographical regions. All the four root crops were included in the plan for each farm type
despite variations in their respective area CUltivated. The significant feature of emergent and marginal
households is almost all the cultivated land is under root crops. It shows the marginal farm households
in the three regions rely mostly on the root crops for food and cash with the total area cultivated less
than one hectare. Emergent farm households grew less than 1.5 hectares.
Squash as a cash crop was included in the farm plan of emergent and progressive farm households in
Tongatapu while kava and vanilla featured in Vava'u's emergent and progressive farm households'
operating plans. A major significant difference in the total area under crops in which progressive farm
households in Tongatapu (Farm 1) farmed 2.5 hectares, or 74 percent of the standard tax allotment
compare to 1.5 hectares for progressive farm in Vava'u (Farm 4). The discrepancy is attributed to
squash requiring more land compared to kava and vanilla. As showed in Table 11.2, 1.1 ha (42%) of
total cropped area is occupied by squash while 17 percent by yam. However in Vava'u, 37 percent of
total cropped land is under kava and vanilla and 73 percent is under root crops.
173
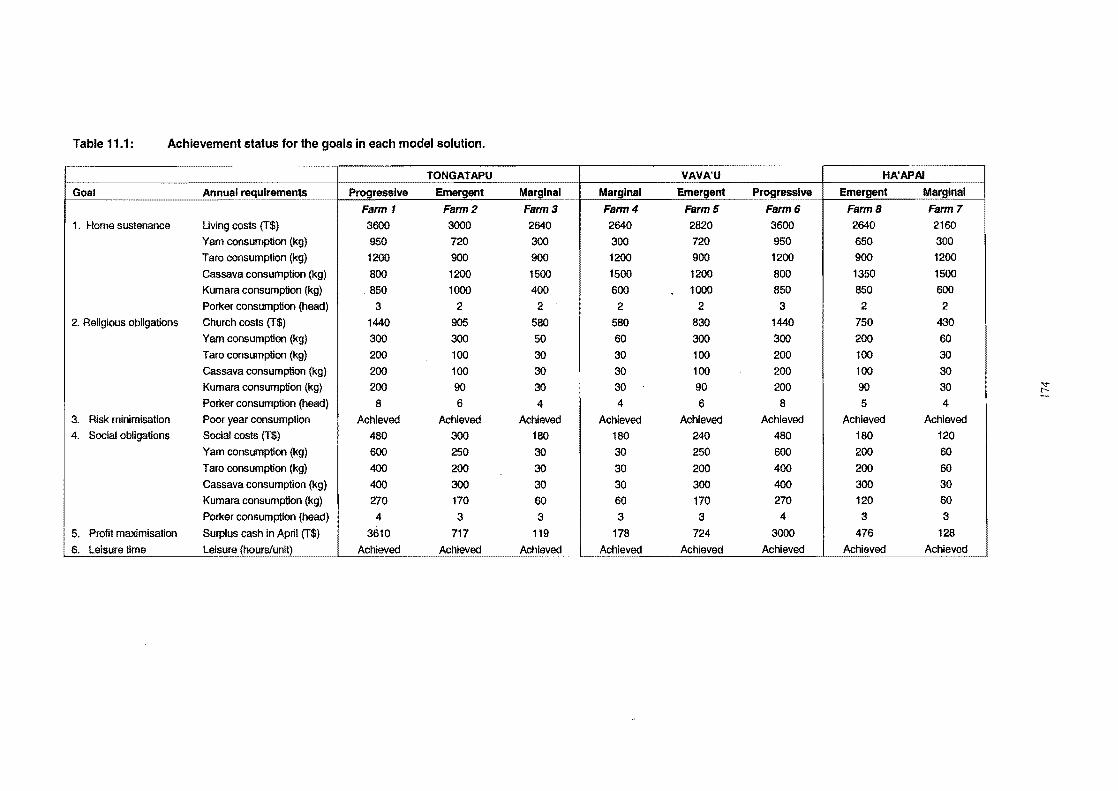
Table 11.1: Achievement status for the goals In each model solution.
TONGATAPU VAVA'U HA'APAI
Goal Annual requi~emel1ts Progressive Emergent Marginal Marginal Emergent Progressive Emergent Marginal
Farm 1 Farm 2 Farm 3 Fann4 Farm 5 Farm 6 Farm 8 Farm 7 1. Home sustenance Uving costs (T$) 3600 3000 2640 2640 2820 3600 2640 2160
Yam consumption (kg) 950 720 300 300 720 950 650 300 Taro consumption (kg) 1200 900 900 1200 900 1200 900 1200 Cassava consumption (kg) 800 1200 1500 1500 1200 800 1350 1500 Kumara consumption (kg) 850 1000 400 600 1000 850 850 600 Porker consumption (head) 3 2 2 2 2 3 2 2
2. Religious obligations Church costs (T$) 1440 905 580 580 830 1440 750 430 Yam consumption (kg) 300 300 50 60 300 300 200 60 Taro consumption (kg) 200 100 30 30 100 200 100 30 Cassava consumption (kg) 200 100 30 30 100 200 100 30 Kumara consumption (kg) 200 90 30 30 90 200 90 30 t! Porker consumption (head) 8 6 4 4 6 8 5 4
3. Risk minimisation Poor year consumption Achieved Achieved Achieved Achieved Achieved Achieved Achieved Achieved 4. Social obligations Social costs (T$) 480 300 180 180 240 480 180 120
Yam consumption (kg) 600 250 30 30 250 600 200 60 Taro consumption (kg) 400 200 30 30 200 400 200 60 Cassava consumption (kg) 400 300 30 30 300 400 300 30 Kumara consumption (kg) 270 170 80 60 170 270 120 60 Porker consumption (head) 4 3 3 3 3 4 3 3
5. Profit maximisation Surplus cash in April (T$) 3610 717 119 178 724 3000 476 128
6. Leisure time Leisure (hours/unit) Achieved Achieved Achieved Achieved Achieved Achieved Achieved Achieved

Table 11.2: Summary of optimal farm plans compared for different farm types in model solutions and actual survey results.
TONGATAPU
Production Progressive Emergent Activity Model Actual % diff. Model Actual % diff.
Yam 1 (ha) 0.27 0.30 13% 0.17 0.20 21%
Yam 2 (ha) 0.14 0.12 -14% 0.15 0.17 16%
Taro 1 (ha) 0.35 0.30 -13% 0.14 0.12 -17%
Taro 2 (ha) 0.08 0.06 -25% 0.14 0.12 -16%
Cassava 1 (ha) 0.29 0.30 5% 0.27 0.30 12%
Cassava 2 (ha) 0.11 0.12 12% 0.21 0.20 -5%
Kumara 1 (ha) 0.10 0.12 25% 0.09 0.08 -8%
Kumara 2 (ha) 0.10 0.12 25% 0.09 0.08 -8%
Squash (ha) 1.05 1.21 16% 0.19 0.40 107%
Kava (ha) NA NA NA NA NA NA
Vanilla (ha) NA NA NA NA NA NA
Total crop (ha) 2.48 2.67 8% 1.46 1.68 16%
Fallow (ha) 0.48 0.40 -15% 0.32 0.23 -28%
Fertilise area (ha) - - - - - -Surplus T$-Apr 3611 2500 -31% 717 400 -44%
~~. ------- ------- -------
"NA" indicates the model cannot choose the activity
Ow"~ indicates the activity is not chosen by the model
Marginal Progressive Model Actual % diff. Model Actual % ditto
0.05 0.06 32% 0.27 0.30 13%
0.05 0.06 24% 0.11 0.12 14%
0.09 0.09 -6% 0.26 0.30 16%
0.09 0.09 -6% 0.08 0.09 9%
0.26 0.27 4% 0.23 027 19%
0.26 0.27 4% 0.11 0.12 11%
0.05 0.06 35% 0.08 0.09 18%
0.05 0.06 35% 0.08 0.09 18%
. . . - . -NA NA NA 0.25 0.30 22%
NA NA NA 0.15 0.12 -20%
0.90 0.96 16% 1.61 1.82 13%
0.16 0.24 3% 0.39 - -88%
- - - - - -119 89 -25% 3000 1700 -43%
Minus (-) figures indicate negative percentage deviation from the model solution
Cropped area values are rounded off to 2 decimal places.
VAVA'U
Emergent Marginal
Model Actual % ditto Model Actual % diff.
0.13 0.12 -5% 0.05 0.06 32%
0.06 0.06 -4% 0.04 0.06 48%
0.13 0.12 -4% 0.08 0.06 -25%
0.05 0.06 12% 0.08 0.06 -25%
0.28 0.30 8% 0.25 0.30 21%
0.23 0.27 16% 0.25 0.27 8%
0.07 0.09 .32% 0.04 0.06 60%
0.07 0.09 32% 0.04 0.06 64%
. - - NA NA NA
0.17 0.20 23% NA NA NA
. - . NA NA NA
1.19 1.33 11% 0.83 0.94 14%
0.25 0.18 -28% 0.14 0.09 -33%
- - . . - -724 300 -59% 178 60 -66%
. ... ~
HA'APAI ----------
Emergent Marginal
Model Actual % ditto Model Actual % ditto
0.11 0.12 6% 0.04 0.06 48%
0.10 0.09 -9% 0.04 0.06 63%
0.11 0.12 12% 0.08 0.09 17%
0.11 0.12 12% 0.08 0.09 17%
0.29 0.30 3% 0.26 0.30 19%
0.28 0.30 8% 0.26 0.30 19%
0.07 0.09 36% 0.04 0.06 60%
0.07 0.09 36% 0.04 0.06 64%
NA NA NA NA NA NA
NA NA NA NA NA NA
NA NA NA NA NA NA
1.15 1.25 9% 0.83 1.04 26%
0.24 0.18 -24% 0.14 0.12 -12%
- - - - - -476 175 -63% 128 40 -69%
.,., t'-
Table 11.3 summarises the total land used (in hectares and percentage) during each month and their
respective percentage. It is most notable that in progressive and emergent farm households in
Tongatapu, who are involved in squash, that only during the squash season is more than 44 percent
and 71 percent of the available land farmed respectively. It is only with progressive farms in Tongatapu
that more than 50 percent of standard tax allotment is used while for farmers in Vava'u more than 40
percent of the available land is occupied. Emergent and marginal farm households use about 32 and
24 percent respectively.
The implication of this finding is that the existing standard allotment of 3.34 hectares is not fully utilised
which indicates there is potential and room for crop intensification. The result is consistent with earlier
findings (Delforce, 1990; MAF, 1994b) that despite an apparent shortage of land, existing production
for those who own land and have access to other's land used less than 50 percent of the total arable
land available.
11.4.2.2 Analysis of labour use
Table 11.4 represents the monthly distribution of labour expressed in man-hour units for model
solutions compared to the actual results in each of the representative farms in a production year. In
progressive farm households in Tongatapu, August to November represents the labour peak period
with more than 50 percent of family labour being used during the squash season. The minimum leisure
requirement per month for each farm type was easily met and over achieved. The last row in Table
11.4 shows the average number of hours of family labour each unit contributes to agricultural activities.
In progressive and emergent farm households the two labour units each contribute 25 hours and 18
hours respectively. In marginal farm households characterised with an average of one labour unit
providing the agricultural labour, an average of 12 hours a week of productive agricultural work is
carried out. The discrepancy in model figures compared to the actual hours is attributed to the
interpretation of productive hours and estimation errors by farmers. Model solutions represent
productive farm work and do not include travelling time and resting hours during the day. The data also
implies that surplus labour is available, which provides an opportunity for intensification jf more markets
were available, and other crop activities possible.
11.4.2.3 Analysis of cash flow
In reviewing farm performances it is important to distinguish between cash and non-cash items. For
some purposes it may be important to know how much cash is generated by the farm and, relatedly,
how much cash is available to the farm household to meet such needs as home food consumption,
church and social expenditure. The amount of cash generated by the farm that can be devoted to
household purposes can be calculated by making appropriate adjustments to the farm net cash flow.
Cash surpluses at the end of each production year (April) include farm cash revenue, cash borrowed
plus other household receipts such as wages for any off-farm employment and remittances.
The annual cash flow in each of the representative farm models is summarised in Table 11.5. The data
shows the average total income each farm household type receives and from each source. It shows
significant variation among the different farmers' groups but little variation between regions.
176

Progressive farmers in both island groups earned more than T$10,000 a year compared to about
T$5500 to T$7500 for emergent households while marginal farmers earn less than T$5500. There is
little significant difference between the different regions. As expected Table 11.5 shows that
agricultural income contributes more than 75 percent of total income in progressive farm households,
65 percent in emergent and about 45 percent in marginal farm households. All farmer types in each
region borrowed cash, which comprised less than 10 percent of total income. Off-farm income is a
more prominent source in marginal farm households (45%).
The production expenditure for associated crops and household requirements is also depicted in Table
11.5. After variable production costs, living, social and church expenditure is deducted to give the
surplus cash at end of the financial year (April). The farmers indicated that this money was used for
other consumption requirements, home improvement and reinvested into the farm or placed into
interest bearing investments.
Table 11.6 showed the composition of agricultural income among the eight representative farms from
model solutions is comparable to actual results. In terms of the total value, the solutions showed that
yam, squash, kava and vanilla are the major sources of agricultural income. Progressive farm
households in Tongatapu derived the bulk of agricultural income from the sale of squash (41%) and
yam (39%). Emergent farm household earned 21 percent from squash and the remaining from sales of
root crops. Likewise for progressive and emergent farmers in Vava'u with yam, kava and vanilla
contributing 85 percent of total agricultural income. Marginal farm households, as expected, showed
total reliance on selling surplus root crops for cash. They do not grow specific cash crops as emergent
and progressive farms do. However, selling of pigs is also a significant source of income.
11.5 Conclusion
Most models developed for farm management have focused on the analysis of input (resource)
requirements and they have generally neglected, or often ignored, the unique values and goals of
smallholder farmers and their decisions structures. However, these are important factors, which greatly
influence the production decision process. After the examination of Tongan smallholder farming
systems from a methodological point of view, it was apparent that Tongan smallholder farmers operate
in a complex environment characterised with severe resource and other constraints with conflicting
multiple goals.
In this study Goal Programming is utilised because it allows the optimisation of goal attainments while
permitting an explicit consideration of the existing decision environment. Perhaps its greater value is
that its application highlights the dynamic relationships that exist between productive activities,
technologies, constraints and farmers' objectives. With the assumption that the socio-economic
rationale of the Tongan farmer is well expressed in the set of the objectives incorporated, goal
programming can be very useful, particularly in the design of development policies and programs. Goal
programming models may be used to explore the probable consequences of a given action or
177

Table 11.3: Average monthly area of cultivated land per month by farm types in model solutions and actual survey results.
TONGATAPU ----
MONTH Progressive Emergent Marginal Progressive Model Actual % dirt. Model Actual % dirt. Model Actual % dirt. Model Actual % diff.
May 1.24 1.20 -3% 1.09 1.11 2% 0.81 0.84 4% 1.37 1.49 8%
June 1.34 1.32 -1% 1.17 1.19 1% 0.85 0.90 6% 1.45 1.58 9%
July 1.34 1.32 -1% 1.17 1.19 1% 0.85 0.90 6% 1.45 1.58 9%
August 2.38 2.53 6% 1.37 1.59 16% 0.85 0.90 6% 1.45 1.58 9%
September 2.38 2.53 6% 1.37 1.59 16% 0.85 0.90 6% 1.54 1.71 11%
October 2.48 2.65 7% 1.46 1.67 15% 0.90 0.96 7% 1.62 1.80 11%
November 2.48 2.65 7% 1.46 1.67 15% 0.90 0.96 7% 1.62 1.80 11%
December 1.43 1.44 1% 1.26 1.27 1% 0.90 0.96 7% 1.53 1.67 9%
January 1.53 1.32 -14% 1.17 1.19 1% 0.85 0.90 0% 1.45 1.58 0%
February 1.53 1.32 -14% 1.17 1.19 1% 0.85 0.9 0% 1.45 1.58 9%
March 1.53 1.32 -14% 1.17 1.19 1% 0.85 0.9 0% 1.45 1.58 9%
April 1.53 1.32 -14% 1.17 1.19 1% 0.85 0.90 -17% 1.45 1.58 9%
Total crop area 2.48 2.65 7% 1.46 1.67 15% 0.90 0.96 7% 1.62 1.80 11%
% Area farmed 74 79 44 50 27 29 49 54
"% diff" indicates the percent discrepancy between model solutions and the actual survey results.
Minus (-) figures indicate negative percentage deviation from the model solution.
Cropped area values are rounded off to 2 decimal places.
VAVA'U .
Emergent Marginal ModBi Actual % dirt. Model Actual % dirt.
1.05 1.10 4% 0.75 0.81 8%
1.12 1.19 6% 0.79 0.90 14%
1.12 1.19 6% 0.79 0.90 14%
1.12 1.19 6% 0.79 0.90 14%
1.12 1.22 9% 0.79 0.90 14%
1.2 1.31 9% 0.83 0.99 19%
1.2 1.31 9% 0.83 0.99 19%
1.2 1.28 6% 0.83 0.99 19%
1.12 1.19 6% 0.79 0.90 14%
1.12 1.19 6% 0.79 0.9 14%
1.12 1.19 0"/0 0.79 0.9 14%
1.12 1.19 6% 0.79 0.90 14%
1.2 1.31 9% 0.83 0.99 19%
36 39 25 30
HA'APAI
Emergent Marginal ModBi Actual % dirt. Model Actual % dirt.
1.01 1.05 4% 0.75 0.90 20%
1.08 1.14 6% 0.79 0.96 22%
1.08 1.14 6% 0.79 0.96 22%
1.08 1.14 6% 0.79 0.96 22"10
1.08 1.14 6% 0.79 0.96 22%
1.15 1.23 7% 0.83 1.02 23%
1.15 1.23 7% 0.83 1.02 23%
1.15 1.23 7% 0.83 1.02 23%
1.08 1.14 0% 0.79 0.96 22%
1.08 1.14 0"10 0.79 0.96 22%
1.08 1.14 0% 0.79 0.96 22%
1.08 1.14 6% 0.79 0.96 22%
1.15 1.23 7% 0.83 1.02 23%
34 36 25 31
co r-
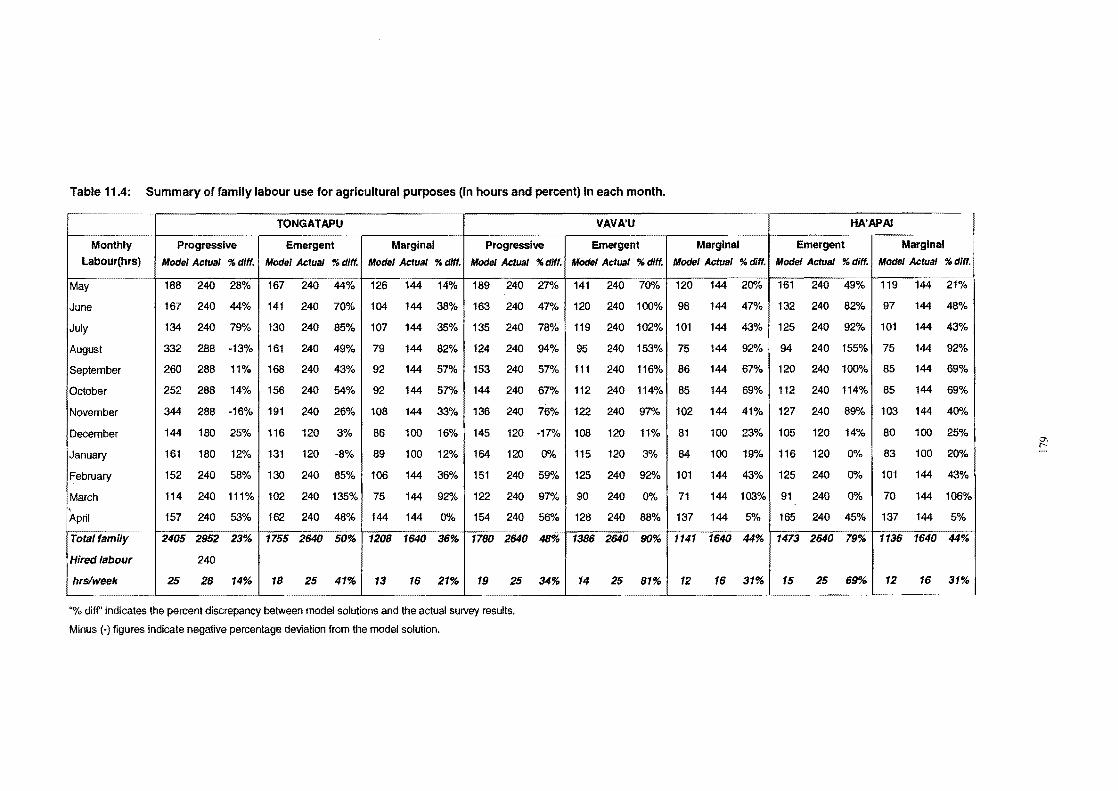
Table 11.4: Summary of family labour use for agricultural purposes (in hours and percent) In each month.
Month Labour
May
June
July
August
Septembe
October
November
December
January
February
March . April
Iy hrs) ----
Totaltami
Hiredlabo ur
hrs/week
-----
Progressive Model Actual % diff.
188 240 28%
167 240 44%
134 240 79%
332 288 -13% 260 288 11%
252 288 14%
344 288 -16%
144 180 25%
161 180 12%
152 240 58%
114 240 111%
157 240 53%
2405 2952 23%
240 25 28 14%
TONGATAPU
Emergent ModeJ Actual % dlff.
167 240 44% 141 240 70%
130 240 85%
161 240 49% 168 240 43%
156 240 54%
191 240 26%
116 120 3%
131 120 -8%
130 240 85%
102 240 135%
162 240 48%
1755 2640 50%
18 25 41%
Marginal Progressive Model Actual % diff. Model Actual % dlff.
126 144 14% 189 240 27<'10
104 144 38% 163 240 47%
107 144 35% 135 240 78%
79 144 82% 124 240 94%
92 144 57<'10 153 240 57%
92 144 57<'/0 144 240 67%
108 144 33% 136 240 76%
86 100 16% 145 120 -17%
89 100 12% 164 120 0%
106 144 36% 151 240 59%
75 144 92% 122 240 97%
144 144 0% 154 240 56%
1208 1640 36% 1780 2640 48%
13 16 21% 19 25 34%
"% diff' indicates the percent discrepancy between model solutions and the actual survey results.
Minus (-) figures indicate negative percentage deviation from the model solution.
VAVA'U
Emergent Model Actual % diff.
141 240 70%
120 240 100%
119 240 102%
95 240 153%
111 240 116%
112 240 114%
122 240 97%
108 120 11%
115 120 3%
125 240 92%
90 240 0% 128 240 88%
1386 2640 90%
14 25 81%
Marginal Model Actual % diff.
120 144 20%
98 144 47%
101 144 43%
75 144 92%
86 144 67%
85 144 69%
102 144 41%
81 100 23%
84 100 19%
101 144 43%
71 144 103%
137 144 5%
1141 1640 44%
12 16 31%
HA'APAI -------
Emergent Marginal Model Actual % diff. Model Actual % diff.
161 240 49% 119 144-21°;~-
132 240 82% 97 144 48%
125 240 92% 101 144 43%
94 240 155% 75 144 92%
120 240 100% 85 144 69%
112 240 114% 85 144 69%
127 240 89% 103 144 40%
105 120 14% 80 100 25%
116 120 0% 83 100 20%
125 240 0% 101 144 43%
91 240 0% 70 144 106%
165 240 45% 137 144 5%
1473 2640 79% 1136 1640 44% I
15 25 69% 12 16 31%
Q\ f'.
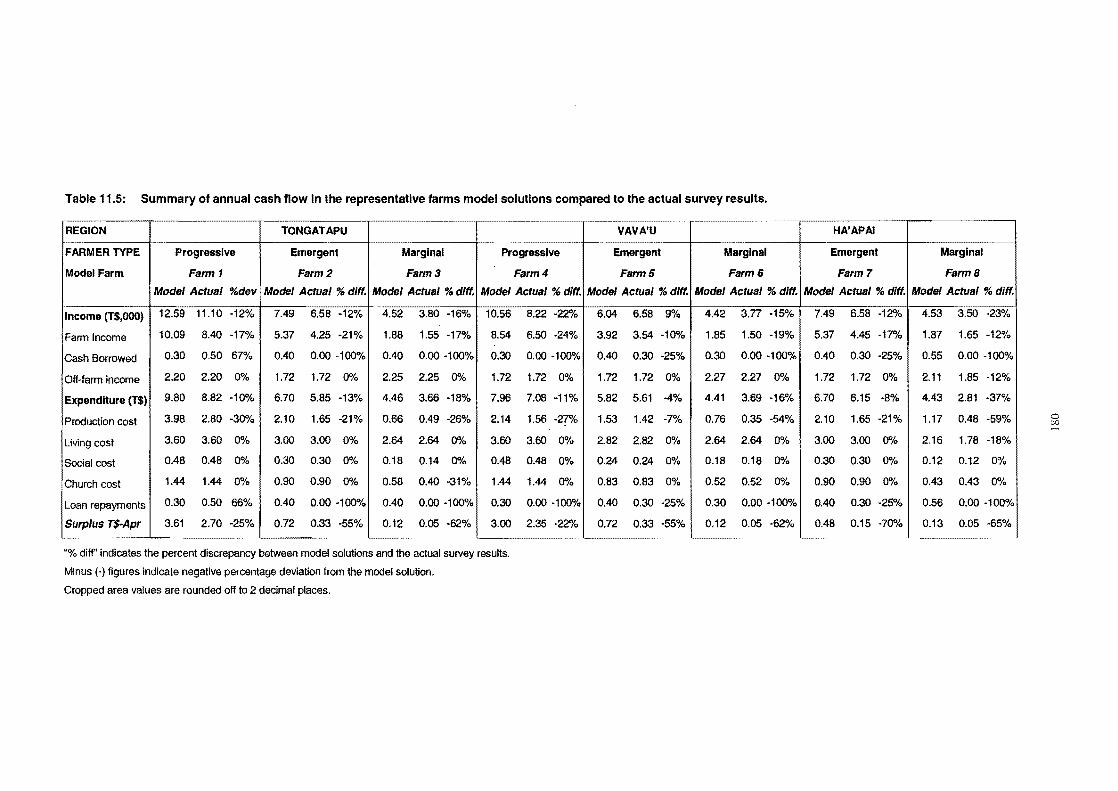
Table 11.5: Summary of annual cash flow in the representative farms model solutions compared to the actual survey results • --------- .... ~ .. -------- ..... _ ..... _ ...
REGION TONGATAPU
FARMER TYPE Progressive Emergent Marginal Progressive
Model Farm Fsrm 1 Fsrm2 Farm 3 Farm 4 Model Actual o/odev Model Actusl % diff. Model Actual % diff. Model Actual % diff.
Income (1$,000) 12.59 11.10 -12% 7.49 6.58 -12% 4.52 3.80 -16% 10.56 8.22 -220/0
Farm Income 10.09 8.40 -17% 5.37 4.25 -21% 1.88 1.55 -17% 8.54 6.50 -24%
Cash Borrowed 0.30 0.50 67% 0.40 0.00 -100% 0.40 0.00 -100% 0.30 0.00 -100%
Off-tarm income 2.20 2.20 0% 1.72 1.72 0% 2.25 2.25 0% 1.72 1.72 0%
Expenditure (T$) 9.80 8.82 -10% 6.70 5.85 -13% 4.46 3.66 -18% 7.96 7.08 -11%
Production cost 3.98 2.80 -30% 2.10 1.65 -21% 0.66 0.49 -26% 2.14 1.56 -2?"k
Living cost 3.60 3.60 0% 3.00 3.00 0% 2.64 2.64 0% 3.60 3.60 0%
Social cost 0.48 0.48 00/0 0.30 0.30 0% 0.18 0.14 0% 0.48 0.48 0%
Church cost 1.44 1.44 0% 0.90 0.90 0% 0.58 0.40 -31% 1.44 1.44 0%
Loan repayments 0.30 0.50 66% 0.40 0.00 -100% 0040 0.00 -100% 0.30 0.00 -100%
Surplus T$-Apr 3.61 2.70 -25% 0.72 0.33 -55% 0.12 0.05 -62% 3.00 2.35 -22% ~ ..
"% diff" indicates the percent discrepancy between model solutions and the actual survey results.
Minus (-) figures indicate negative percentage deviation from the model solution.
Cropped area values are rounded off to 2 decimal places.
VAVA'U
Emergent
FarmS Model Actual % dlff.
6.04 6.58 9%
3.92 3.54 -100/0
0.40 0.30 -25%
1.72 1.72 0%
5.82 5.61 -4%
1.53 1.42 -7%
2.82 2.82 0%
0.24 0.24 0%
0.83 0.83 0%
0.40 0.30 -25%
0.72 0.33 -55%
Marginal
Farm 6 Model Actual % diff.
4.42 3.n -15%
1.85 1.50 -19%
0.30 0.00 -100%
2.27 2.27 0%
4.41 3.69 -16%
0.76 0.35 -54%
2.64 2.64 0%
0.18 0.18 0%
0.52 0.52 0%
0.30 0.00 -1000/0
0.12 0.05 -62%
HA'APAI
Emergent
Farm 7 Model Actual % diff.
7.49 6.58 -12%
5.37 4.45 -17%
0.40 0.30 -25%
1.72 1.72 0%
6.70 6.15 -8%
2.10 1.65 -21%
3.00 3.00 0%
0.30 0.30 0%
0.90 0.90 0%
0.40 0.30 -25%
0.48 0.15 -70%
Marginal
FsrmS Model Actual % diff.
4.53 3.50~
1.87 1.65 -12%
0.55 0.00 -100%
2.11 1.85 -12%
4.43 2.81 -37%
1.17 0.48 -59%
2.16 1.78 -18%
0.12 0.12 0%
0.43 0.43 0%
0.56 0.00 -100%
0.13 0.05 -65%
o 00

Table 11.6: Percentage composition of agricultural income composition for each representative farm in the model solutions compared to actual results.
Tongatapu
Production Progressive Emergent Marginal Progressive Enterprise Model Actual Model Actual Model Actual Model Actual
Farm Income (T$) 10093 8400 5370 4250 1875 1550 8536 6500 Yam sales ("!o) 39 36 46 36 52 55 38 31 Taro sales ("!o) 12 8 14 18 18 16 9 8 Cassava sales ("!o) 4 4 3 7 15 7 3 5 Kumara sales ("!o) 3 6 5 11 5 6 2 5 Squash sales ("!o) 41 46 21 28 0 0 -Kava sales ("!oj - - 35 37 Vanilla sales ("!oj - - - 12 15 Porker sales (°/0) 0 10 0 27 16 0
"% diff" indicates the percent discrepancy between model solutions and the actual survey results.
Minus (-) figures indicate negative percentage deviation from the model solution.
Cropped area values are rounded off to 2 decimal places.
Vava'u Ha'apar
Emergent Marginal Emergent Marginal Model Actual Model Actual Model Actual Model Actual
3920 3540 1850 1500 5370 4450 1874 1650 34 29 54 47 63 56 48 42 8 9 10 7 14 11 11 6 3 3 4 7 4 7 4 0 5 9 3 7 5 9 3 3 - - 0 0 0
51 37 0 0 -0 0 0 0 - -10 14 29 33 14 17 34 49
00
innovation for the farm as a whole. In turn, this exploration can lead to a new conclusion concerning
the functioning of the farming systems and its dynamics.
The results of the model verification and validation exercise would suggest that the models generally
perform satisfactorily and they have sufficient validity to warrant their use as a policy analysis tool. It is
appropriate, however, to consider those aspects of the models where the model solutions deviated
from the actual practices. The causes and implications of such deviations should be noted in the
interests of ensuring careful use of the models. Deviant projections can probably be attributed to one
of two possible causes; either the model structure is different from the real world system, or the data
available to estimate model relationships, and to run the models, are imperfect. Since the essence of
modelling is to provide a simplified representation of a real world system, some structural imperfection
is inevitable and acceptable if the model as a whole performs satisfactorily.
With respect to imperfect data for estimating structural relationships and running the model, these
may be lead to deviant projections but not necessarily invalidate the underlying structural
assumptions. As mentioned earlier in this study, in relation to various aspects of system analysis,
some deficiencies seem likely to be present in the data used in model construction and operation. In
particular, expenditure, consumption, and production relationships are likely to be affected to some
extent. The apparent validity of the model in the light of the structural Simplifications and data
deficiencies mentioned above, would suggest that the model structure is basically sound and that the
modelled system is relatively insensitive to the various effects of imperfect data.
The GP approach is appropriate for budgeting and planning in smallholder farming situations.
However, the GP model requires the farmers to be capable of defining, quantifying and ordering
objectives and provides the best solution under the given constraints and priority structure. The
purpose of this study is to use GP to model the complex decision problems in Tongan smallholder
farmers' land use decisions. The eight representative farm models presented are a good illustration.
However, each goal may benefit from further in-depth analysis as would the interactions between the
major components of farming systems, social cultural, economic and institutional environments,
farmers goals and priorities. The results of this research will provide a more realistic picture which can
be built on in the future.
In the next chapter, the model for each representative farm type is put to its intended purpose with a
series of experiments to examine and to explore the effects of various policy instruments. The results
should assist the Government in designing policies that are effective in the achievement of farmers'
goals and objectives, and on the output changes relative to Tonga's balance of payments objectives.
182

CHAPTER 12
MODEL IMPLEMENTATION AND APPLICATION
12.1 Introduction
Improving the material well-being of Tongans requires practical and achievable economic
development. The model was developed and designed to allow the assessment of possible policy
changes designed to achieve this objective. In this section representative farm models were used to
analyse some of the different policy issues (economic and institutional) facing the different smallholder
farm types discussed in earlier chapters. The models were used to predict the likely consequences of
changes in cropping systems in terms of production, input demand, credit needs and employment.
The impact of different policy instruments on farm household production is evaluated against the
results of a base-run of each farm type model, in which the current production activities and
consumption behaviour of the corresponding household types are reflected.
12.2 Modelling Different Policies
The system analysis in Part 2 revealed the need for the Government to give more priority to
agriculture and better agricultural development planning by setting appropriate policies for improved
agricultural resource use. There is a need to identify effective policy instruments that have significant
influence on smallholder farmers' land use decisions.
The smallholder agricultural performance is influenced by four main variables which are subject to
policy intervention. Firstly, there is the limited availability and access to agricultural land, therefore it is
a priority for the government to explore the scope for land reform. Evidence of increasing
landlessness and under-utilisation of existing land indicates that there is scope for some land reform
measures to achieve agricultural growth objectives.
Secondly, there is a key role for agricultural research and technology development. The availability of
appropriate improved technology, which is the prime responsibility of the Ministry of Agriculture and
Forestry research and extension division, could be improved. Many currently used technologies have
varied success due to different agro-ecological conditions; hence there is a need for more on-farm trial
183
adaptive research to provide alternative technically feasible technologies. Thirdly, there is a need for a
policy environment which is conducive to the adoption of improved technologies. Since both market
and institutional support service failures are important causes of poor performance, the impact of
market and credit policies need further exploration. Finally, analysis would focus on farmer's goals
and priorities. Understandably, the Government cannot directly change people's motivation and
priorities but can set policies to encourage change in these personal characteristics through activities
of education and supporting services. As discussed in Chapters 6 there is a need for farmers'
motivation to be in line with national objectives. Key issues for this analysis include the non-economic
objectives for church and social obligations that influence land use decisions.
Policy experiments and analysis were focussed on major areas which the government policies may
have a major influence. In particular, major policy instruments include land; market, technology, labour
and credit systems and these are explored in this study. The major policy options were explored using
the basic model. The results and policy implications are presented and discussed in this section.
12.2.1 Modelling land reform policies
In agriculture the control of land resources is the most important determinant of employment,
investment and the distribution of income within the traditional agriculture. Obviously the control of
land is important because it determines how much of the land is brought into production. The
problems with the existing land tenure system and the increasing number of people without land in
Tonga and the case for a broader reform of institutional structures of land distribution has been
discussed in Chapter 7. It is widely acknowledged that the indigenous Tongan land tenure system is a
constraint on land productivity. The findings from this study indicate not only an increasing number of
people without land, but also that many smallholder farmers have the resource capacity, time and
commercial initiative to utilise more land than they command. Understandably most farmers are
reluctant to develop their lands to any substantial extent unless they are certain that the improved
lands will remain theirs. So, this insecurity of tenure is one of the most serious factors retarding
agricultural development in Tonga. This is consistent with the findings of others such as Hardaker,
(1975), Crocombe (1975), Delforce, (1990) and Fukofuka (1994), who found the indigenous land
tenure system is a static constraint, providing insufficient security to induce farmers to make land
improvements or intensify production. Crocombe (1975) claimed that the system worked in 1985
when it was first formalised when the population was less than 20,000 people and enough land to
allow the 3.34 hectares for every man. However, with the current five-fold increase in population, the
land tenure system is no longer sensible thus needing a review of land tenure system. Relatively few
agricultural holdings remain to be distributed so that unless the government changes the policy, future
population growth wi!1 produce a marked increase in the number of landless families. Consequently,
an important topic is the examination of policy impacts to reduce landlessness and improve access to
land.
184
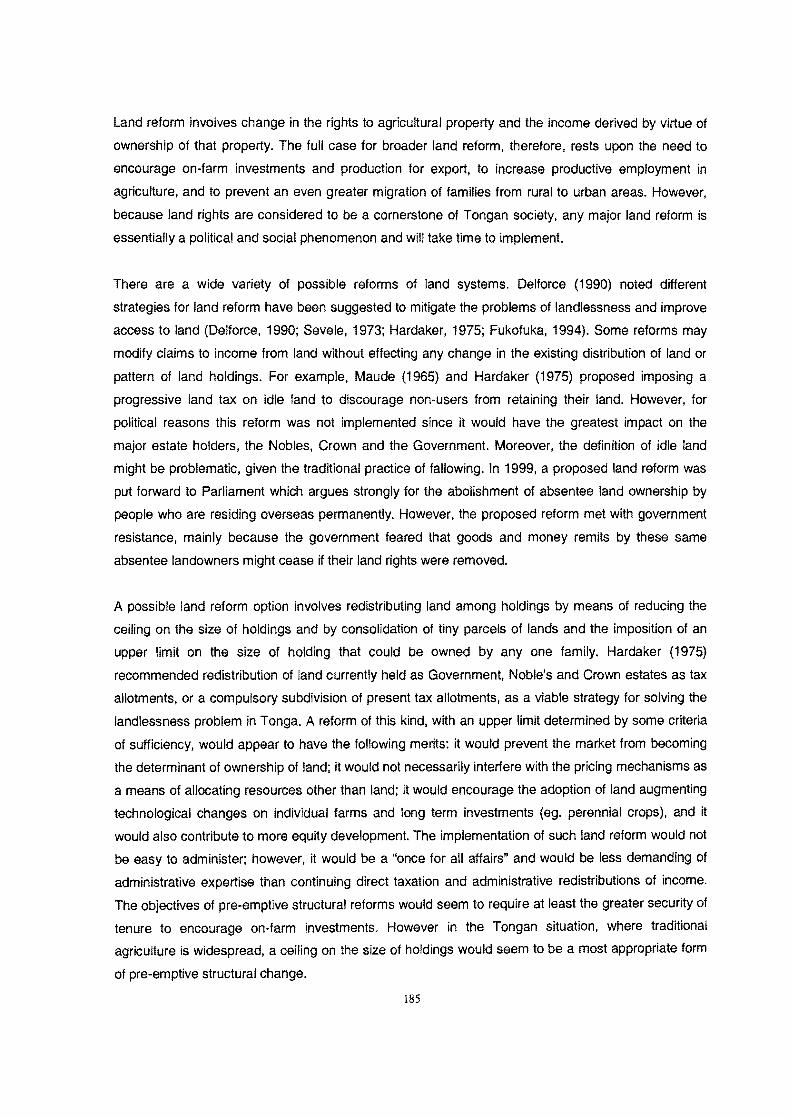
Land reform involves change in the rights to agricultural property and the income derived by virtue of
ownership of that property. The full case for broader land reform, therefore, rests upon the need to
encourage on-farm investments and production for export, to increase productive employment in
agriculture, and to prevent an even greater migration of families from rural to urban areas. However,
because land rights are considered to be a cornerstone of Tongan SOCiety, any major land reform is
essentially a political and social phenomenon and will take time to implement.
There are a wide variety of possible reforms of land systems. Delforce (1990) noted different
strategies for land reform have been suggested to mitigate the problems of landlessness and improve
access to land (Delforce, 1990; Seve Ie, 1973; Hardaker, 1975; Fukofuka, 1994). Some reforms may
modify claims to income from land without effecting any change in the existing distribution of land or
pattern of land holdings. For example, Maude (1965) and Hardaker (1975) proposed imposing a
progressive land tax on idle land to discourage non-users from retaining their land. However, for
political reasons this reform was not implemented since it would have the greatest impact on the
major estate holders, the Nobles, Crown and the Government. Moreover, the definition of idle land
might be problematic, given the traditional practice of fallowing. In 1999, a proposed land reform was
put forward to Parliament which argues strongly for the abolishment of absentee land ownership by
people who are residing overseas permanently. However, the proposed reform met with government
resistance, mainly because the government feared that goods and money remits by these same
absentee landowners might cease if their land rights were removed.
A possible land reform option involves redistributing land among holdings by means of reducing the
ceiling on the size of holdings and by consolidation of tiny parcels of lands and the imposition of an
upper limit on the size of holding that could be owned by anyone family. Hardaker (1975)
recommended redistribution of land currently held as Government, Noble's and Crown estates as tax
allotments, or a compulsory subdivision of present tax allotments, as a viable strategy for solving the
landlessness problem in Tonga. A reform of this kind, with an upper limit determined by some criteria
of sufficiency, would appear to have the following merits: it would prevent the market from becoming
the determinant of ownership of land; it would not necessarily interfere with the pricing mechanisms as
a means of allocating resources other than land; it would encourage the adoption of land augmenting
technological changes on individual farms and long term investments (eg. perennial crops), and it
would also contribute to more equity development. The implementation of such land reform would not
be easy to administer; however, it would be a "once for all affairs" and would be less demanding of
administrative expertise than continuing direct taxation and administrative redistributions of income.
The objectives of pre-emptive structural reforms would seem to require at least the greater security of
tenure to encourage on-farm investments. However in the Tongan situation, where traditional
agriculture is widespread, a ceiling on the size of holdings would seem to be a most appropriate form
of pre-emptive structural change.
185
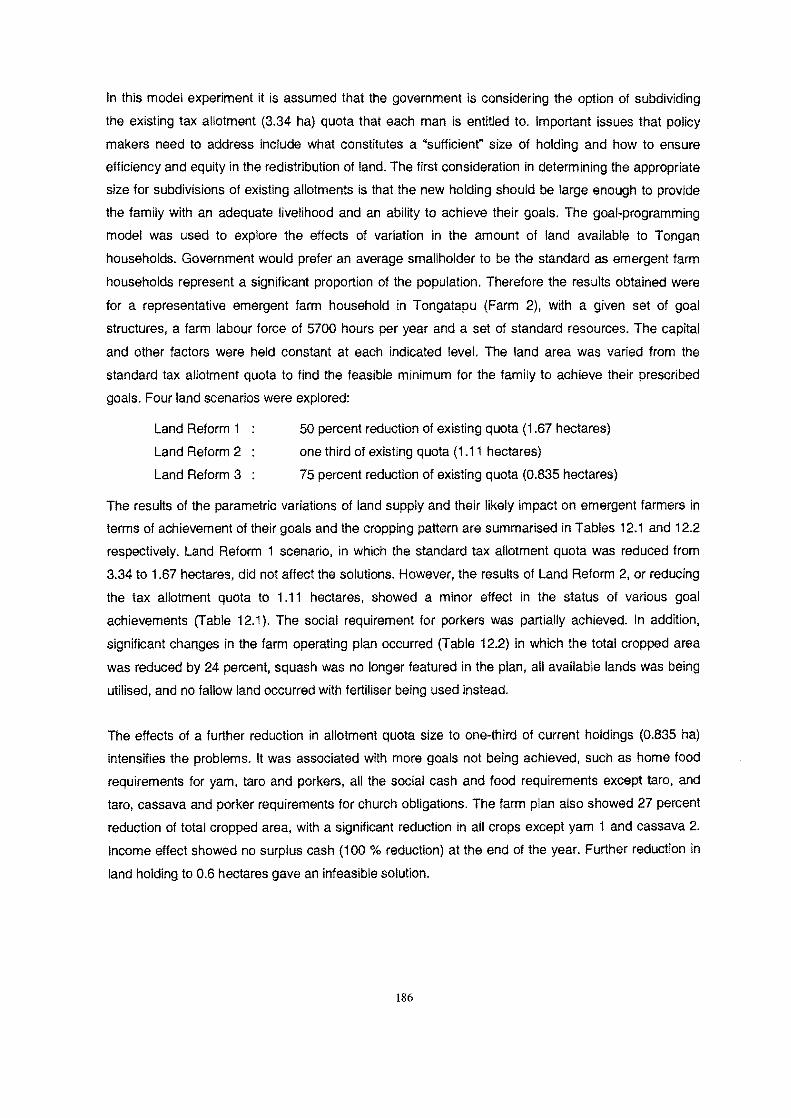
In this model experiment it is assumed that the government is considering the option of subdividing
the existing tax allotment (3.34 ha) quota that each man is entitled to. Important issues that policy
makers need to address include what constitutes a "sufficient" size of holding and how to ensure
efficiency and equity in the redistribution of land. The first consideration in determining the appropriate
size for subdivisions of existing allotments is that the new holding should be large enough to provide
the family with an adequate livelihood and an ability to achieve their goals. The goal-programming
model was used to explore the effects of variation in the amount of land available to Tongan
households. Government would prefer an average smallholder to be the standard as emergent farm
households represent a significant proportion of the population. Therefore the results obtained were
for a representative emergent farm household in Tongatapu (Farm 2), with a given set of goal
structures, a farm labour force of 5700 hours per year and a set of standard resources. The capital
and other factors were held constant at each indicated level. The land area was varied from the
standard tax allotment quota to find the feasible minimum for the family to achieve their prescribed
goals. Four land scenarios were explored:
Land Reform 1
Land Reform 2
Land Reform 3
50 percent reduction of existing quota (1.67 hectares)
one third of eXisting quota (1.11 hectares)
75 percent reduction of existing quota (0.835 hectares)
The results of the parametric variations of land supply and their likely impact on emergent farmers in
terms of achievement of their goals and the cropping pattern are summarised in Tables 12.1 and 12.2
respectively. Land Reform 1 scenario. in which the standard tax allotment quota was reduced from
3.34 to 1.67 hectares, did not affect the solutions. However, the results of Land Reform 2, or reducing
the tax allotment quota to 1 .11 hectares, showed a minor effect in the status of various goal
achievements (Table 12.1). The social requirement for porkers was partially achieved. In addition,
significant changes in the farm operating plan occurred (Table 12.2) in which the total cropped area
was reduced by 24 percent, squash was no longer featured in the plan, all available lands was being
utilised, and no fallow land occurred with fertiliser being used instead.
The effects of a further reduction in allotment quota size to one-third of current holdings (0.835 ha)
intensifies the problems. It was associated with more goals not being achieved, such as home food
requirements for yam, taro and porkers, all the social cash and food requirements except taro, and
taro, cassava and porker requirements for church obligations. The farm plan also showed 27 percent
reduction of total cropped area, with a significant reduction in all crops except yam 1 and cassava 2.
Income effect showed no surplus cash (100 % reduction) at the end of the year. Further reduction in
land holding to 0.6 hectares gave an infeasible solution.
186
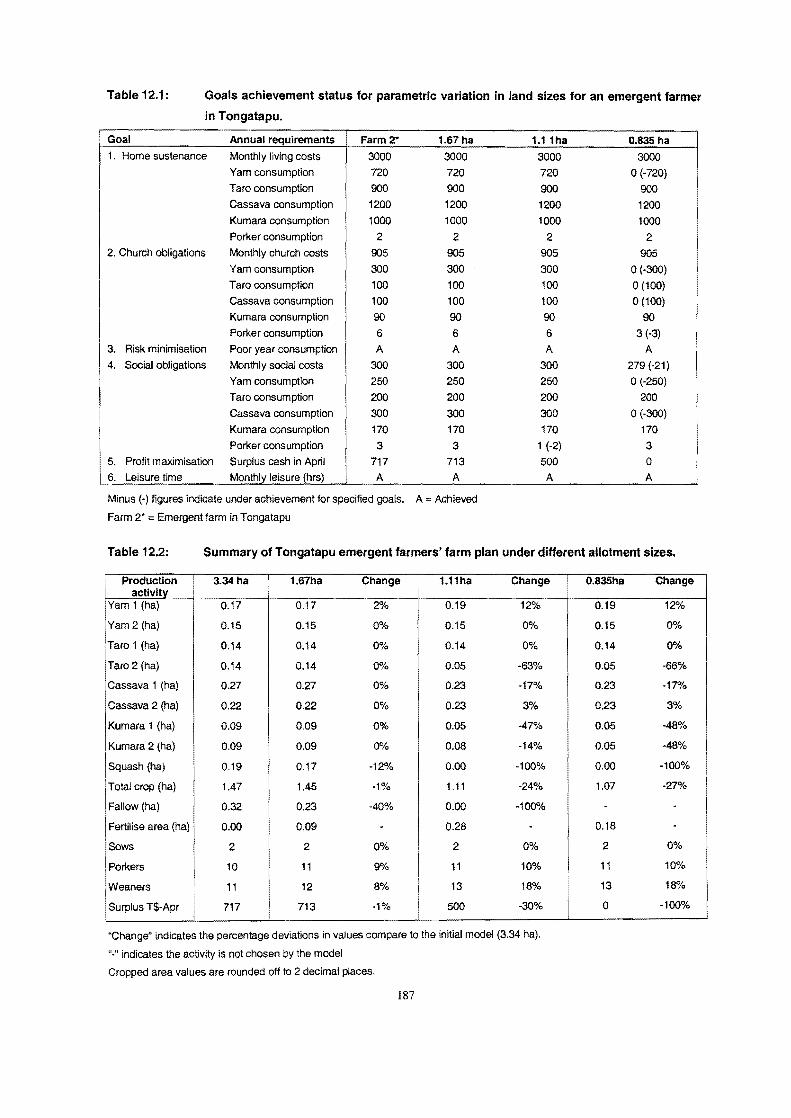
Table 12.1: Goals achievement status for parametric variation in land sizes for an emergent farmer
in Tongatapu.
I Goal Annual requirements Farm 2- 1.67 ha 1.11ha 0.835 ha 1. Home sustenance Monthly living costs 3000 3000 3000 3000
Yam consumption 720 720 720 0(-720) Taro consumption 900 900 900 900 Cassava consumption 1200 1200 1200 1200 Kumara consumption 1000 1000 1000 1000 Porker consumption 2 2 2 2
2. Church obligations Monthly church costs 905 905 905 905 Yam consumption 300 300 300 0(-300) Taro consumption 100 100 100 0(100) Cassava consumption 100 100 100 0(100) Kumara consumption 90 90 90 90 Porker consumption 6 6 6 3 (-3)
3. Risk minimisation Poor year consumption A A A A 4. Social obligations Monthly social costs 300 300 300 279 (-21)
Yam consumption 250 250 250 0(-250) Taro consumption 200 200 200 200 Cassava consumption 300 300 300 0(-300) Kumara consumption 170 170 170 170 Porker consumption 3 3 1 (-2) 3
5. Profit maximisation Surplus cash in April 717 713 500 0 6. Leisure time Monthly leisure (hrs) A A A A
Minus (-) figures indicate under achievement for specified goals. A= Achieved
Farm 2* = Emergent farm in Tongatapu
Table 12.2: Summary of Tongatapu emergent farmers' farm plan under different allotment sizes.
Production 3.34ha I 1.67ha Change I 1.11ha Change activi!y .. I
Yam 1 (ha) 0.17 0.17 2% 0.19 12%
Yam 2 (ha) 0.15 0.15 0% 0.15 0%
Taro 1 (ha) 0.14 0.14 0% 0.14 0%
Taro 2 (ha) 0.14 0.14 0% 0.05 -63%
Cassava 1 (ha) 0.27 0.27 0% 0.23 -17%
Cassava 2 (ha) 0.22 0.22 0% 0.23 3%
Kumara 1 (ha) 0.09 0.09 0% 0.05 -47%
Kumara 2 (ha) 0.09 0.09 0% 0.08 -14%
Squash (ha) 0.19 0.17 -12% 0.00 -100%
Total crop (ha) 1.47 1.45 -1% 1.11 -24%
Fallow (ha) 0.32 0.23 -40% 0.00 -100%
Fertilise area (ha) 0.00 0.09 - 0.28 -Sows 2 2 0% 2 0%
Porkers 10 11 9% 11 10%
Weaners I
11 12 8% 13 18%
I Surplus T$-Apr 717 713 -1% 500 -30% I
"Change" indicates the percentage deviations in values compare to the initial model (3.34 hal·
"-" indicates the activity is not chosen by the model
Cropped area values are rounded off to 2 decimal places.
187
O.835ha Change
0.19 12"k
0.15 0%
0.14 0%
0.05 -66%
0.23 -17%
0.23 3%
0.05 -48%
0.05 -48%
0.00 ·100%
1.07 -27%
. -0.18 -
2 0%
11 10%
I 13 18%
I 0 -100%
I
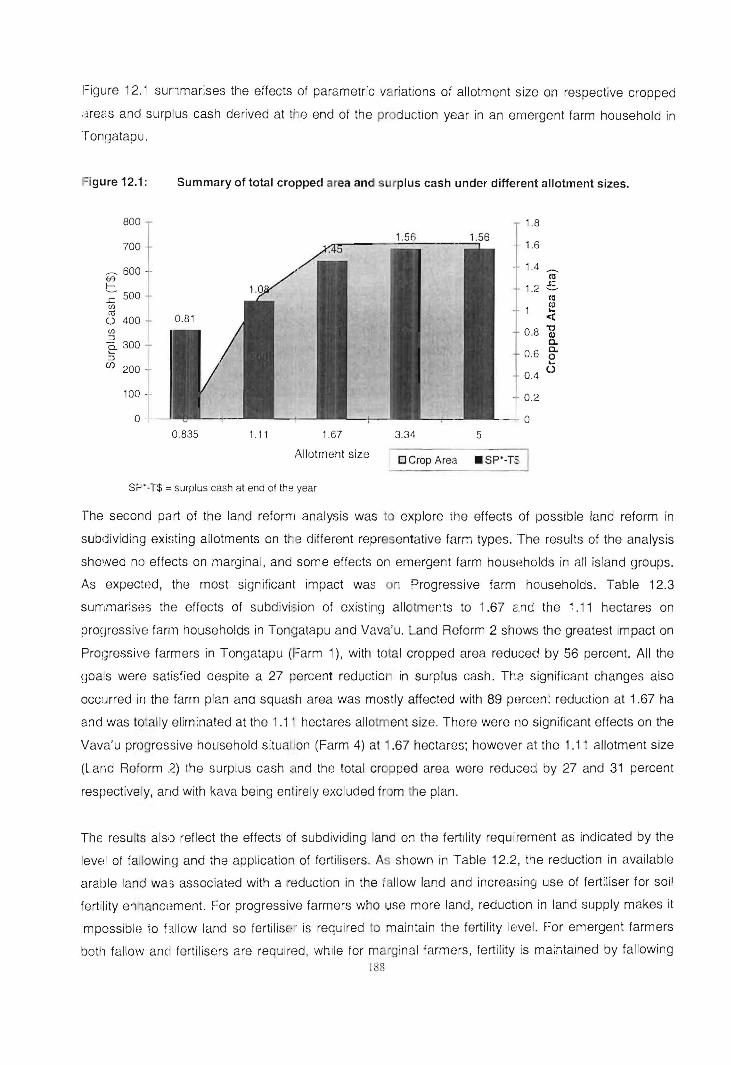
I=igure 12.1 sur,lmarises the effects of parametric variations of allotment size on respective cropped
;lreas and surplus cash derived at the end of the production year in an emergent farm household in
Tonqatapu.
igure12.1: Summary of total cropped area and s rplus cash under different allotment sizes.
800
700
~ 600 Eft f--;- 500 (fJ
cu U 400 (fJ
::J e. 300 -::J
en 200 -
o 0,835 1 .11 1,67
Allotment size
SP'oT$ = surplus cash at end of the year
3.34 5
1,8
1.6
1.4
1.2
~
co :S la Cll
~ 0 .8 "2
Co
0.6 g-.-0.4 (.)
0.2
o
DCrop Area .spoon]
The second part of the land reform analysis was to explore ihe effects of possible land reform in
subdividin!J exi~;ting allotments on t e different representative farm types. The results of the analysis
showed no effects on marginal, and some effects on emergent farm housl3holds in aI/ island groups.
As expected, the most significant impact was on Progressive farm households. Table 12.3
summaris()s the effects of subdivi:.ion of existing allotments to 1.67 c.nd the ~ .11 hectares on
pro~lressive farm households in Tongatapu and Vava'u. Land Reform 2 shows the greatest impact on
Proqressive farmers in Tongatapu (Farm 1), with total cropped area reduced by 56 percent. All the
goals were satisfied despite a 27 r~ercent reduction in surplus cash. The significant changes also
occurred in the farm plan and squash area was mostly affected with 89 pmcent reduction at 1.67 ha
and was to' ally eliminated at the 1.11 hectares allotment size. There were no significant effects on the
Vava'u progressive household situalion (Farm 4) at 1.67 hectares; however at the 1.11 allotment size
(Land Reform ,2) the surplus cash and the total cropped area were reduGed by 27 and 31 percent
respectively, and with kava being entirely excluded from the plan.
ThE results also reflect the effects of subdividing land o~ the fertility requi rement as indicated by the
level of fallowing and tile application of fertilisers. As shown in Table 12.2, the reduction in available
aral)le land wa3 associated with a mduction in the fa llow land and increasing use of fertiliser for soil
fertility enllanwment. For progressive farmers who use more land, reduction in land supply makes it
impossibln io f3.llow land so fertilisE' ! is required to maintain the fertility level. For emergent farmers
bolll fallow ancl fertilisers are required, while for marginal farmers, fertility is maintained by fal/owing 188

land. This implies that when land is adequate, farmers prefer to fallow due to the lower cost. The issue
of maintaining soil fertility is of critical concern to the Ministry. However, owing to the prohibitive cost
and lack of knowledge, it is expected that most of the Tongan farmers will continue to rely upon the
fallow system for replenishing soil nutrients provided they have sufficient land.
Table 12.3: Effects of reducing allotment size on progressive farm households' land use plans.
Production FARM 1: Tongatapu
activity 3.34 1.67 Change 1.11 Change 3.34 1.67
Yam 1 (ha) 0.27 0.27 0% 0.27 0% 0.27 0.27
Yam 2 (ha) 0.14 0.26 82% 0.17 21% 0.11 0.11
Taro 1 (ha) 0.35 0.35 0% 0.23 -34% 0.26 0.26
Taro 2 (ha) 0.08 0.08 0% 0.08 0% 0.08 0.08
Cassava 1 (ha) 0.29 0.29 0% 0.11 -63% 0.23 0.23
Cassava 2 (ha) 0.11 0.11 0% 0.11 0% 0.11 0.11
Kumara 1 (ha) 0.10 0.10 0% 0.06 -43% 0.08 0.08
Kumara 2 (ha) 0.10 0.10 0% 0.06 -43% 0.08 0.08
Squash (ha) 1.05 0.12 -89% 0.00 -100% NA NA
Kava (ha) NA NA NA NA NA 0.25 0.25
Vanilla (ha) NA NA NA NA NA 0.15 0.15
Total crop (ha) 2.48 1.67 -33% 1.08 -56% 1.70 1.70
Fallow (ha) 0.48 - ·100% - -100% 0.39 0.12
Fertilise area (ha) 0.00 0.44 100% 0.33 100% - 0.27
i Surplus T$-Apr 3611 3547 -2% 2640 -27% 3000 3000
"Change" indicates the percentage deviation in values compare to the initial model (3.34 hal.
"-" indicates the activity is not chosen by the model
"NA" indicates the model cannot choose the activity
Cropped area values are rounded off to 2 decimal places.
Farm 1 = Tongatapu progressive farm, Farm 4= Vava'u progressive farm
FARM 4: Vava'u
Change 1.11
0% 0.28
0% 0.11
0% 0.13
0% 0.08
0% 0.11
0% 0.11
0% 0.06
0% 0.08
NA NA
0% 0.00
0% 0.15
0% 1.11
-69% -100% 0.30
0% 2187
Change 4%
5%
-50%
-1%
-53%
0%
-25%
0%
NA
-100%
0%
-31%
-100%
100%
-27%
Recommendations following this research might take several forms. The most important and
immediate need involves the complete redistribution of land now being held by the nobility and royal
family and/or subdividing existing allotments into smaller holdings. This would not only reduce land
lessness but allow more productive use of land of which a large proportion is idle. However, it is
recognised that with the existing political and social structure of the Kingdom the implementation of
the former recommendation will be difficult leaving the latter to be the only option. The goal
programming analysis above showed that any government policy decisions regarding further
subdivisions of existing tax allotments, into two (1.67 ha) allotment sizes appear to adequately provide
the food and cash needs for the average family. Therefore, division of existing 3.34 hectares holdings
into 1.67 hectares units seems advisable and thus supports recommendations by Maude (1965) and
Hardaker (1975). This reform would enable more people to have access to land and improve tenure
security. With that, people would not only improve the productivity of land but also be able to
investment in longer term for crops like kava and vanilla. They will be more able to respond to new
189
market opportunities using land as collateral for credit. This is consistent with the national
development objectives of reducing poverty, unemployment and inequality in Tonga.
Clearly, the non-use of agricultural land is at variance with the current development needs of Tonga
and some means must be developed to bring as much of this land as possible into production. It is
suggested that regulations should be promulgated to restrict the maximum area of land held by any
individual, including nobles, and to ensure that as much of the remaining undistributed land is
reallocated as tax allotments to landless households. The analysis also indicated a way of
encouraging better land use would be to legalise the sub-leasing of tax allotments under appropriate
circumstances. It is suggested that creating a legal market for tax allotments would allow tax allotment
holders, such as marginal farm households who are unwilling or unable to use all their land, to lease
some of them on a short term basis to those people who need it.
12.2.2 Impact of market policies
One way in which the behaviour of Tongan farmers can be modified to achieve national development
objectives is by providing them with appropriate economic incentives. Many of the innovations that
could be included in an agricultural development strategy have their impact on farmers only indirectly
through input delivery or output markets. Farmers might be encouraged to intensify production or
diversify production by making available cheap inputs, by offering high returns on their outputs, or by
reducing the market risks they face. In addition a new technology might be profitably adopted by some
farmers only if there are so~e complementary changes made in the markets. In this SUb-section the
opportunities for encouraging agricultural development in these ways are explored. Activities in a
programming model will not only be confined to production; marketing activities carried out by the farm
households will also often be present, and market reforms may have their impact directly on these
activities.
12.2.2.1 Output prices
Market innovations may be embodied in institutional or infrastructural developments, such as the
establishment of a new local market place for Ha'apai island or improvement of a farm to market road
in Vava'u. Such developments may save some of the time that farm-household members must devote
to selling farm produce and to buying farm and household requisites. Because improvements in input
and output marketing most directly affect prices and net revenue, it is appropriate to evaluate them in
the model. To examine the operation of the different models under different price conditions, output
prices prevailing from 1990/1991 to 1991/97 for the two main cash crops, yam and squash were
introduced into the models. Four market scenarios were explored:
Market 1
Market 2
Market 3
Increase in price of squash from 50 to 90c/kg
50 percent reduction in price of squash to 25c/kg
Increase price of yam to T$1.90/kg 190
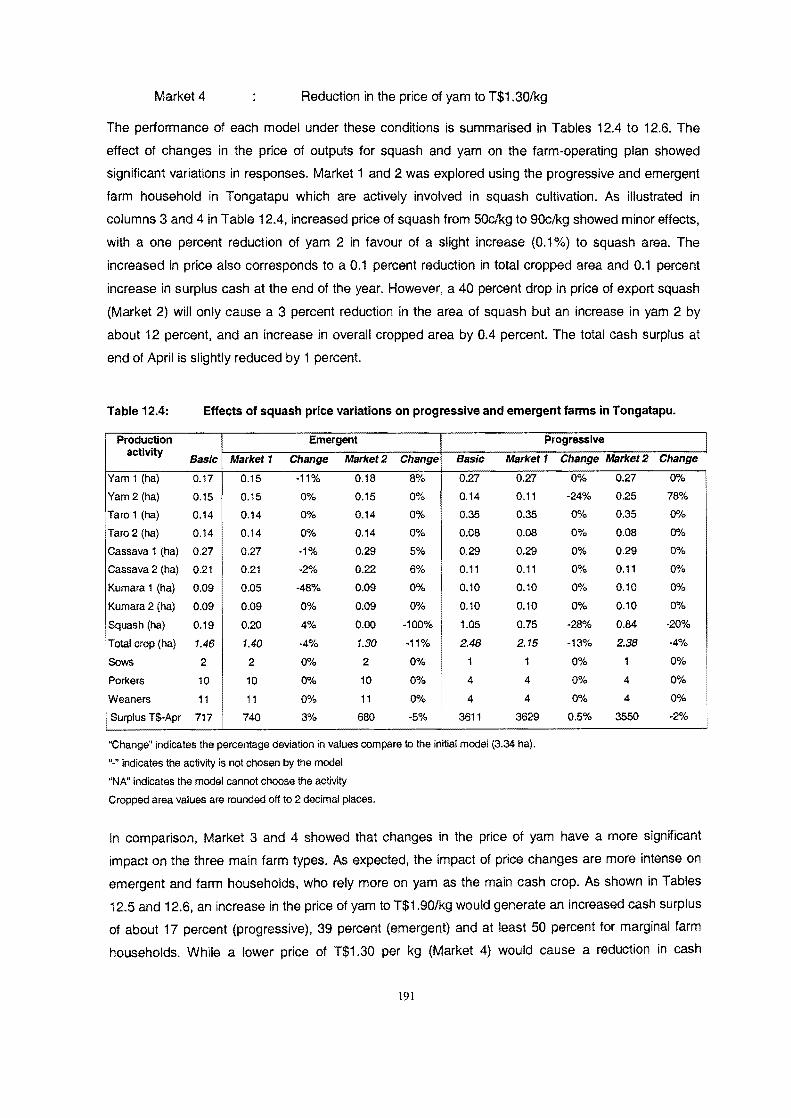
Market 4 Reduction in the price of yam to T$1.30/kg
The performance of each model under these conditions is summarised in Tables 12.4 to 12.6. The
effect of changes in the price of outputs for squash and yam on the farm-operating plan showed
significant variations in responses. Market 1 and 2 was explored using the progressive and emergent
farm household in Tongatapu which are actively involved in squash cUltivation. As illustrated in
columns 3 and 4 in Table 12.4, increased price of squash from 50c/kg to 90clkg showed minor effects,
with a one percent reduction of yam 2 in favour of a slight increase (0.1 %) to squash area. The
increased in price also corresponds to a 0.1 percent reduction in total cropped area and 0.1 percent
increase in surplus cash at the end of the year. However, a 40 percent drop in price of export squash
(Market 2) will only cause a 3 percent reduction in the area of squash but an increase in yam 2 by
about 12 percent, and an increase in overall cropped area by 0.4 percent. The total cash surplus at
end of April is slightly reduced by 1 percent.
Table 12.4: Effects of squash price variations on progressive and emergent farms in Tongatapu.
Production Emergent Progressive activity
Basic Market 1 Change Market 2 Change Basic Market 1 Change Market 2
Yam 1 (ha) 0.17 0.15 ·11% 0.18 8% 0.27 0.27
Yam 2 (ha) 0.15 0.15 0% 0.15 0% 0.14 0.11
Taro 1 (ha) 0.14 0.14 0% 0.14 0% 0.35 0.35
Taro 2 (ha) 0.14 0.14 0% 0.14 0% 0.08 0.08
Cassava 1 (ha) 0.27 0.27 ·1% 0.29 5% 0.29 0.29
Cassava 2 (hal 0.21 0.21 -2% 0.22 6% 0.11 0.11
Kumara 1 (ha) 0.09 0.05 -48% 0.09 0% 0.10 0.10
Kumara 2 (ha) 0.09 0.09 0% 0.09 0"/., 0.10 0.10
Squash (hal 0.19 0.20 4% 0.00 ·100% 1.05 0.75
Total crop (ha) 1.46 1.40 ·4% 1.30 -11% 2.48 2.15
Sows 2 2 0% 2 0% 1 1
'Porkers 10 10 0"/., 10 0% 4 4
Weaners 11 11 0% 11 0% 4 4
Surplus T$-Apr 717 740 3% 680 ·5% 3611 3629
"Change" indicates the percentage deviation in values compare to the initial model (3.34 hal.
".n indicates the activity is not chosen by the model
"NAn indicates the model cannot choose the activity
Cropped area values are rounded off to 2 decimal places.
0% 0.27
·24% 0.25
0% 0.35
0% 0.08
0% 0.29
0% 0.11
0% 0.10
0% 0.10
-28% 0.84
-13% 2.38
0% 1
0% 4
0% 4
0.5% 3550
Change I
0%
78%
0"/.,
0%
0%
0%
0%
0%
·20%
·4%
0%
0%
0%
.~A:.
In comparison, Market 3 and 4 showed that changes in the price of yam have a more significant
impact on the three main farm types. As expected, the impact of price changes are more intense on
emergent and farm households, who rely more on yam as the main cash crop. As shown in Tables
12.5 and 12.6, an increase in the price of yam to T$1.90/kg would generate an increased cash surplus
of about 17 percent (progressive), 39 percent (emergent) and at least 50 percent for marginal farm
households. While a lower price of T$1.30 per kg (Market 4) would cause a reduction in cash
191
surpluses of 58 percent (marginal), 30 percent (emergent), and about 20 percent for progressive
households.
12.2.2.2 Market Avenues
As discussed in Chapter 5, marketing has always dominated the list of constraints facing agricultural
development in Tonga. The key issue always raised by farmers is "Are there markets for the
increased agricultural output?" The emphasis on agricultural marketing is now firmly with the private
sector. Government continues to intervene in some marketing areas chiefly by licensing exporters,
market research and development, as well as quality control. Recently, the government has been
seeking agreements on market access for farm produce in other countries, such as Fiji and the
Samoas. Negotiations have entailed the establishment of quarantine protocols. Market innovation also
includes market research and development. It is important for policy makers to predict the likely
farmer responses to new market opportunities for existing and new crops. New marketing avenues,
which mean that more constraints on what that can be sold may be relaxed, or including new cash
commodities, can be incorporated into the model as new activities.
The models were used to explore the impact of relaxing market constraints for root crops to represent
situations where opportunities for yam export to Fiji and Samoa arise, and where more opportunities
for export of root crops and frozen cassava are attained. This was incorporated into the matrix by
adding extra selling activities at a lower price ego cassava (T$0.08/kg) , and yam (T$1.30/kg), and
increasing the market quota in the system constraints. Market 6 explores the opportunity for
incorporating a new cash crop into the system to reflect the likely response of farmers to new potential
crops such as watermelon, papaya, chilli, etc. In this case, watermelon for export and domestic food
requirements is incorporated.
Market 5:
Market 6:
increased market opportunities for yam and cassava
export market opportunities for watermelon
Table 12.7 summarises the likely responses of emergent farmers in the three main sub-regions to
improvement in market avenues for existing and new crops. The result shows that improved market
export opportunities for yam and cassava (Market 5) would increase the cash surplus at the end of
April dramatically by more than 140 percent for emergent farmers in the three main groups, with the
highest increase of more than 200 percent in the in the Ha'apai group.
The variation among the island groups is attributed to the variation in the initial market constraints in
each basic model. However, the general implication is that relaxing market constraints would allow
some emergent farmers to operate in a similar environment to that of progressive farmers and so
allow dramatic increases in cash surplus. The land utilisation also increased by 3 to 8 percent. Market
6 showed that incorporating watermelon into the system, which has both subsistence and cash
192
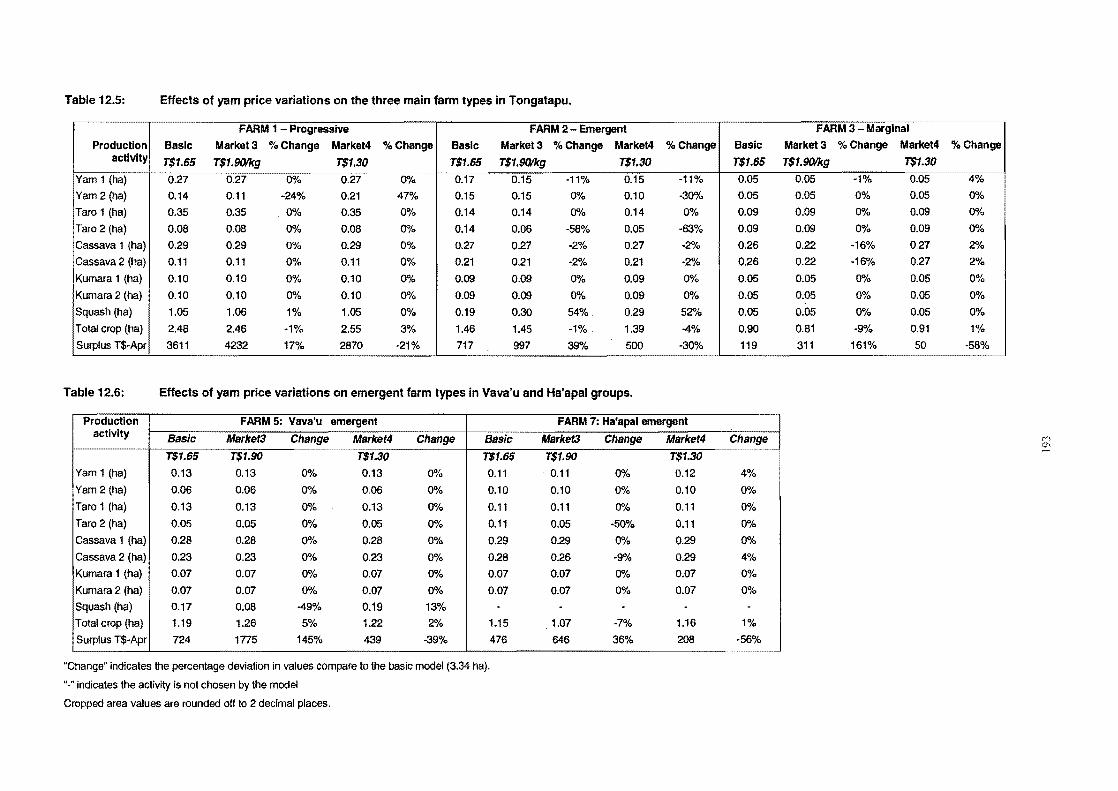
Table 12.5: Effects of yam price variations on the three main farm types in Tongatapu.
FARM 1 - Progressive FARM 2 - Emergent Production Basic Market 3 % Change Market4 % Change Basic Market 3 % Change Market4 % Change
activity T$1.65 T$1.901kg T$1.30 T$1.65 T$1.9OIkg T$1.30 Yam 1 (ha) 0.27 0.27 0% 0.27 0% 0.17 0.15 -11% 0.15 -11% Yam 2 (ha) 0.14 0.11 -24% 0.21 47% 0.15 0.15 0% 0.10 -300/0 Taro 1 (ha) 0.35 0.35 0% 0.35 0% 0.14 0.14 0% 0.14 0% Taro 2 (ha) 0.08 0.08 00/0 0.08 00/0 0.14 0.06 -58% 0.05 -63% Cassava 1 (ha) 0.29 0.29 OOk 0.29 0% 0.27 0.27 -2% 0.27 -2% Cassava 2 (ha) 0.11 0.11 0% 0.11 0% 0.21 0.21 -2% 0.21 -2% Kumara 1 (ha) 0.10 0.10 0% 0.10 0% 0.09 0.09 OOk 0.09 00/" Kumara 2 (ha) 0.10 0.10 0% 0.10 00/0 0.09 0.09 00/0 0.09 00/" Squash (ha) 1.05 1.06 1% 1.05 00/0 0.19 0.30 54% 0.29 52% Total crop (ha) 2.48 2.46 -1% 2.55 3% 1.46 1.45 -1% 1.39 -4% Surplus T$-Apr 3611 4232 17% 2870 -21% 717 997 39% 500 -30%
Table 12.6: Effects of yam price variations on emergent farm types in Vava'u and Ha'apai groups.
Production FARM 5: Vava'u emergent FARM 7: Ha'apal emergent activity Basic Market3 Change Market4 Change
T$1.65 T$1.90 T$1.30 Yam 1 (ha) 0.13 0.13 0% 0.13 0% Yam 2 (ha) 0.06 0.06 00/0 0.06 0% Taro 1 (ha) 0.13 0.13 00/0 0.13 0% Taro 2 (ha) 0.05 0.05 00/0 0.05 00/0 Cassava 1 (ha) 0.28 0.28 00/0 0.28 OOk Cassava 2 (ha) 0.23 0.23 OOk 0.23 0% Kumara 1 (ha) 0.07 0.Q7 0% 0.07 00/0 Kumara 2 (ha) 0.07 0.07 0% 0.07 0% Squash (ha) 0.17 0.08 -49% 0.19 13% Total crop (ha) 1.19 1.26 5% 1.22 2% Surplus T$-Apr 724 1775 145% 439 -39%
"Change" indicates the percentage deviation in values compare to the basic model (3.34
"." indicates the activity is not chosen by the model
Cropped area values are rounded off to 2 decimal places.
Basic Market3 Change Market4 T$1.65 T$1.90 T$1.30 0.11 0.11 0% 0.12 0.10 0.10 00/0 0.10 0.11 0.11 0% 0.11 0.11 0.05 -50% 0.11 0.29 0.29 0% 0.29 0.28 026 -9% 0.29 0.07 0.07 00/0 0.07 0.Q7 0.07 0% 0.07
- - - -1.15 1.07 -7% 1.16 476 646 36% 208
Basic T$1.65 0.05 0.05 0.09 0.09 0.26 0.26 0.05 0.05 0.05 0.90 119
Change ...... ~
4% 0% 0% 0% 0% 4% 00/0 0% -
1% -56%
•
FARM 3 - Marginal Market 3 % Change Market4 T$1.9OIkg T$1.30
0.05 -1% 0.05 0.05 0% 0.05 0.09 0% 0.09 0.09 0% 0.09 0.22 -16% 0.27 0.22 -16% 0.27 0.05 00/" 0.05 0.05 00/0 0.05 0.05 00/0 0.05 0.81 -9% 0.91 311 161% 50
%Ch,n ..
4% 0% 0% 0% 2% 2% 0% 0% 0% 1%
-58%
"" 0'\
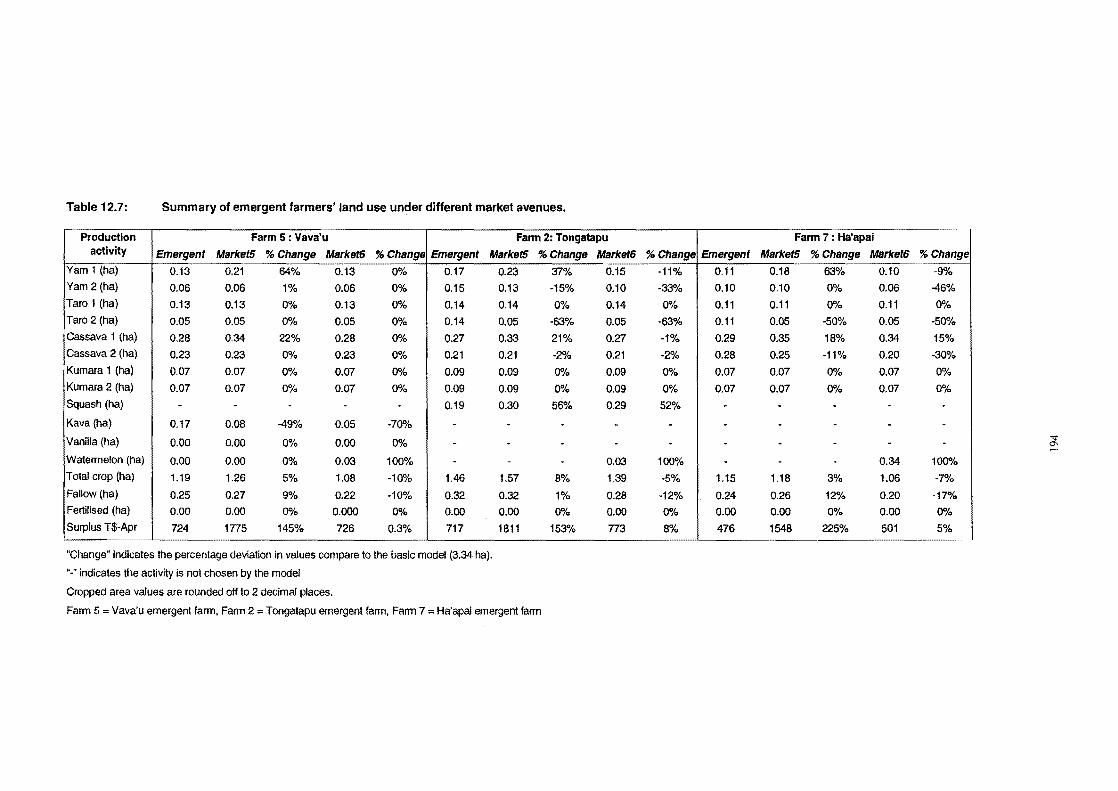
Table 12.7: Summary of emergent farmers' land use under different market avenues.
Production Farm 5 : Vava'u Farm 2: Tongatapu activity Emergent MarketS % Change Market6 % Change Emergent MarketS % Change Market6 % Change
Yam 1 (ha) 0.13 0.21 64% 0.13 O"k 0.17 Yam 2 (ha) 0.06 0.06 1% 0.06 0% 0.15 Taro 1 (ha) 0.13 0.13 0% 0.13 0"/0 0.14 Taro 2 (ha) 0.05 0.05 0% 0.05 O"k 0.14 Cassava 1 (hal 0.28 0.34 22% 0.28 0% 0.27 Cassava 2 (ha) 0.23 0.23 0% 0.23 0% 0.21 Kumara 1 (ha) 0.07 0.07 0% 0.07 O"k 0.09 Kumara 2 (hal 0.07 0.07 0% 0.07 0% 0.09 Squash (ha) - - . - . 0.19
Kava (ha) 0.17 0.08 -49% 0.05 -70% -Vanilla (hal 0.00 0.00 0% 0.00 0% . Watermelon (hal 0.00 0.00 0% 0.03 100% . Total crop (hal 1.19 1.26 5% 1.08 -10% 1.46 Fa\low(ha) 0.25 0.27 9% 0.22 ·10% 0.32 Fertilised (ha) 0.00 0.00 0"/0 0.000 0% 0.00 Surplus T$-Apr 724 1775 145% 726 0.3% 717
"Change" indicates the percentage deviation in values compare to the basic model (3.34 hal. "-» indicates the activity is not chosen by the model
Cropped area values are rounded off to 2 decimal places.
0.23 0.13 0.14
0.05 0.33 0.21
0.09 0.09 0.30
-. -
1.57
0.32 0.00 1811
Farm 5 = Vava'u emergent farm, Farm 2 = Tongatapu emergent farm, Farm 7 = Ha'apai emergent farm
37% 0.15 ·11% -15% 0.10 -33%
0% 0.14 O"k -63% 0.05 -63% 21% 0.27 -1% -2% 0.21 -2%
0"/0 0.09 0% 0% 0.09 0%
56% 0.29 52%
- - -. . . - 0.03 100"/0
8% 1.39 ·5%
1% 0.28 -12% 0% 0.00 0"/0
153% 773 8%
Farm 7 : Ha'apai
Emergent Market5 % Change Market6 % Change 0.11 0.18 63% 0.10 -9%
0.10 0.10 0% 0.06 -46% 0.11 0.11 0% 0.11 0"/0
0.11 0.05 -50% 0.05 -50%
0.29 0.35 18% 0.34 15% 0.28 0.25 -11% 0.20 -30%
0.07 0.07 0% 0.07 0% 0.07 0.07 0% 0.07 O"k - - - - · · · . . · · · . . · · · - 0.34 100"/0
1.15 1.18 3% 1.06 ·7%
0.24 0.26 12% 0.20 -17% 0.00 0.00 0% 0.00 0% 476 1548 225% 501 5%
-.:t ~
potential caused little or no significant effect on Vava'u farmers, while it increased the cash surplus by
5 and 8 percent for farmers in Ha'apai and Tongatapu respectively.
The modelling experiment results were consistent with the fieldwork results that indicated that limited
market avenues for root crops is the major constraining factor to increased production in Tonga. The
general attitude amongst Tongan farmers revealed in the fieldwork was that many had made the
attempt to expand commercial production but had become disillusioned when they found their efforts
were poorly rewarded. As showed in Table 12.7, relaxing market constraints for existing root crops
resulted in a significant increase in surplus cash with given resources and the cropped area. The
incorporation of watermelon into the production system showed a moderate increase in cash surplus
for Tongatapu and Ha'apai and can be recommended as a potential enterprise for export crop
diversification. It implies that new crops with assured markets could be well incorporated into the
system. The result also shows that the different market access associated with each farmer group is a
major contributing factor to the variation among progressive, emergent and marginal farmers. The
variation in responses to price changes by farm groups also reflects the status of Tongan farmers as
price takers.
The result implies the need for the Government and private sector to strengthen market research and
development. As the findings of the fieldwork confirmed, it is this aspect of the institutional framework
of Tongan agriculture where action and change is required. Priority should be given to exploring the
scope for opening up new markets for Tongan produce overseas as a means towards longer-term
development of agricultural production. Improvement is required in market arrangements to give
producers better and more secure rewards for their efforts in producing crop and animal products for
sale. The most promising developments in this area have been through the expansion of vanilla,
squash and kava sales in recent years. Improvement is also required in exports of traditional root
crops. As noted in Chapter 5, export of root crops is mainly targeted at the Pacific Island communities
overseas. Fleming and Hardaker (1995) claimed that Tonga's performance in exporting root crops to
New Zealand and Australia has been poor compared to Western Samoa. Apparently the Samoans
have established a formal wholesale and retail network, whereas much of the Tongan produce is
distributed through informal family and church networks. As a result both stock management and
payments are unreliable as some seliers prefer to travel to the destination market to do their own
marketing and to collect the money. In 1994, MAF proposed the Government should purchase land
for setting up a marketing centre and facility in Auckland. However, decisions on the proposed export
market reform would require an appropriate feasibility assessment; in addition, such a venture would
be costly.
In the area of local market reform, probably the least activity has taken place. The fieldwork revealed
that poor market infrastructures in the outer islands is a constraining factor for domestic sales of
agricultural produce. There is a need for improvements in market facilities, such as the establishment
195
of an appropriate market centre in Ha'apai Islands, and in main roads and transportation for Vava'u.
These infrastructure facilities are important to boost agricultural production, however, the government
does need to carry out a feasibility study to assess the benefits and cost.
12.2.3 Effects of Improved Technology
Agricultural research and extension have become a significant component of agricultural
development. Technological change can be an appropriate part of agricultural development.
Appropriate crop production technologies not only increase the efficient use of land, labour, and
capital, but also hasten the farmer's adoption of viable and economic production technologies.
Improved technology can reduce the marginal cost of production by offsetting the scarcity of one or
another conventional agricultural resource; for example, the introduction of new varieties of seeds and
inorganic fertilisers is substantially offsetting the scarcity of land in several countries. For successful
crop husbandry, the main activities of agricultural research include: soil fertility evaluation trials, crop
management trials, screening of cultivars under different environments, development of new cropping
patterns, improved tillage practices, crop protection methods, water management, and post-harvest
studies. These activities must, however, be carried out both in the ideal conditions of research
stations, and on practising farm situations.
The quality of research in terms of achievements depends upon two things: the capability of the
researcher and the availability of adequate research facilities. The single most crucial factor in
agricultural research is the availability of well-qualified and adequately trained technical manpower
capable of solving complex farm problems. Therefore, a good research system derives from
multidisciplinary research establishments, highly qualified manpower, adequate fund allocations, and
proper research management and co-ordination. As discussed in Chapter 5, the present main
research establishment in the country is centralised in Tongatapu. The lack of proper research
facilities, infrastructure and manpower resources are the main constraints to broadening the scope of
research activities and undertaking worthwhile research to other sub-regions of different agro-
~cological zones (Vava'u and Ha'apai).
It has been noted earlier in this chapter that one of the crucial components of smallholder agriculture
development strategy is through technological advance. There are innumerable ways in which the
methods of farm production in Tongan could be improved. No attempt can be made here to provide
detailed technological improvement packages. Instead, on the basis of information gathered during
the fieldwork, analyses offer the possibility of estimating the effects of change in technology either
through improved varieties, or management practices, the use of machine cultivation in place of the
traditional manual cultivation method or the use of inorganic fertilisers. The improved yields data were
derived from MAF research results. MAF agronomists confirmed that improved farm practices could
potentially increase crop yields for root crops by 40 percent, and in some cases even more (MAF,
196

I
1994C). The basic models assume that technologies are constant in the three regions and farm types.
The three representative models for Tongatapu were used to explore farmers' responses to the
introduction of new improved technologies that improve yield and productivity. In this model
experiment, productivity improvement measures are assumed to increase root crop yields by at least
20 percent of current base yields.
The effect of introducing improved production technologies under prevailing conditions is reflected in
the technological change simulation. Table 12.8 summarises the effects of improved management
technologies that increase the yield for root crops. It shows that with improved technologies the total
cropped area is reduced by at least 18 percent and cash surplus is increased by about 60 percent
(marginal), 15 percent (emergent) and less than 5 percent for progressive farms.
Table 12.8: Summary of farmers' lands use under improved technologies.
Production Progressive Emergent
activity Basic TeeM Change Basic TeeM Change Yam 1 (hal 0.27 0.22 -17% 0.17 0.12 -27%
Yam 2 (hal 0.14 0.09 -37% 0.15 0.12 ·17%
Taro 1 (hal 0.35 0.29 -17% 0.14 0.12 ·14%
Taro 2 (hal 0.08 0.07 -17% 0.14 0.05 -68%
Cassava 1 (ha) 0.29 0.24 -17% 0.27 0.22 -17%
cassava 2 (hal 0.11 0.09 -17% 0.21 0.17 -18%
Kumara 1 (hal 0.10 0.08 ·17% 0.09 0.07 ·19%
Kumara 2 (ha) 0.10 0.08 ·17'% 0.09 0.07 -19%
Squash (ha) 1.05 0.91 -13% 0.19 0.24 27%
Total crop (ha) I 2.48 2.08 -16% . 1.46 1.20 -18%
Surplus T$-Apr 3611 3720 3% 717 823 15%
"Change" indicates the percentage deviation in values compare to the basic modal (3.34 hal.
"_. indicates the activity is not chosen by the model
Cropped area values are rounded off to 2 decimal places.
Marginal
Basic TeeM Change 0.05 0.04 -17%
0.05 0.04 ·16%
0.09 0.08 -17%
0.09 0.08 -17%
0.26 0.21 -19%
0.26 0.21 -19%
0.05 0.04 ·16%
0.05 0.04 -16%
0.00 0.00 0%
0.90 0.74 -18%
119 191 61%
As would be expected making available improved technologies allows subsistence requirements to be
satisfied from a smaller land area, with resultant increases in market surplus both of the staple crops
and of cash crops. Continuing effort is therefore needed to strengthen the basic support services for
Tonga's agriculture; particularly crucial is technical and advisory assistance, through an effective
extension service, agricultural research, and improved marketing facilities. The problem of limited land
resources can be reduced by focusing on crop productivity improvement techniques either through the
use of field tested improved cultivars, improved management, or improved plant nutrition through
judicious use of organic and inorganic fertilisers.
The survey results also revealed a discrepancy in yields from on-station research trials compared to
the average yield farmers get for some of the major crops (Fakava and Pole, 1994). In addition,
productivity varies between households and different farmer categories indicating there is already 197

scope for more widespread dissemination of improved technologies. There are opportunities to
strengthen indigenous organic farming methods and techniques, and to explore progressive entry into
the expanding niche market for organically grown products which command premium prices (eg.
vanilla, banana, squash and vegetables). It has been suggested that there is a lack of interaction
between farm, extension and research systems in Tonga. Fieldwork revealed that farmers are not
adopting the best available technologies. This may be because the technologies being extended are
not well matched to the needs and circumstances, or it may be that improvements are needed in the
way extension is conducted.
The farming systems research and extension approach may offer a means of improving the
collaboration between users, producers and disseminators of improved technologies. This problem
has been a key consideration in the recent restructuring of the MAF Research and Extension division
to allow more qualified staff to be in the field and in regular contact with farmers. However agricultural
research and extension is hampered by financial and manpower resources which tend to restrict
research activities to on-station based research, with little on-farm trials to develop better
understanding of farm-level realities of smallholders. This makes it particularly important to give
priority to a more effective programs of agricultural research to develop improved production and
marketing technologies which are suitable for eXisting conditions and can be widely adopted by
smallholders. As noted in Chapter 7 the practice of indigenous technology by farmers is still common
thus indicates the need for MAF researchers to consider for further validation.
One of the technical problems facing Tongan agriculture, especially with the decreasing land
resources as discussed in Chapter 7, concerns crop rotations and soil fertility. The general findings
from the survey is that a shift from subsistence to semi-subsistence farming, and a move toward
commercial farming, has been the major development in agriculture during the last 20 years. Farmers
still practice a system of mixed cropping, but due to the shortage of land the length of fallow has been
reduced, and the system of farming is exposed to higher inputs such as machine cultivation, use of
chemicals and fertilisers and more intensive farming. With limited land resources and declining soil
fertility problems, perhaps the most useful type of technological innovation should involve
improvement in fallowing practices or application of fertiliser and other soil fertility management
techniques which allow greater cropping intensity to be sustained. It raises the issue of the urgent
need for research and development work to develop crop rotations and farm production methods
which are not only attractive and viable to farmers, but also sustainable in maintaining the soil's
productive capacity. Recommendations for further research should include:
(i) Use of legumes (eg. Dolichos lablab- Tongan bean) as a short-term fallow.
(ii) Use of a more balanced crop rotation pattern with a legume crop as part of the
rotation eg peanuts.
(iii) Use of intercropping, especially using long-term crops such as kava and vanilla to
help retain the soil structure.
198
(iv) Improved cultural practices (ego Mulches, organic fertilisers).
(v) More livestock-crop interaction, especially proper use of manure for soil fertility
management.
(v) Improving the level of education of the rural work force through agricultural education
in schools, farmer training, and the distribution of essential information to farmers.
The fieldwork also revealed that one impediment to the expansion of production was the shortage of
planting material, especially kava, vanilla, colocasia taro and vegetables. Establishment of a tissue
culture laboratory and nursery plots in main regional centres would provide the Ministry of Agriculture
and Forestry with a ready means of disseminating improved crop varieties as well as overcoming the
problem of planting material shortages.
Another area where the farmers need help is the maintenance of crop quality. As discussed in
Chapter 5 and revealed during the fieldwork, the current capacity to produce quality crops is less than
desirable and lower quality is a major factor contributing to the loss of markets, such as the demise of
the banana industry. MAF (1994c) noted the high rejection rate for current export crops such as
squash and vanilla had been a major problem in 1993 and 1994. In response, the Ministry set up a
Quality Management and Control system in the Quarantine division. Farmers need regular access to
advice on improved cultural practices and control of pests and diseases. The MAF Research and
Extension service of the ministry, therefore, has a major role to play in the dissemination of relevant
knowledge to improve management skills on pest and disease control as well as quality improvement.
12.2.4 Effects of Labour Policies
A fourth analysis was conducted to explore the effects of a variation in the family labour supply in
emergent farm households. The parametric variation in the labour supply may provide an indication of
the scope for expansion of productive employment in the agricultural sector. This is particularly
important given the increasing number of people without land, and unemployment level. The
downward variation in the labour supply will also reflect some of the outmigration effect that is
significant in outer remote islands as discussed in Chapter 9. It may also be used to reflect the
farmer's pursuit of the leisure goal. Two main family labour scenarios were explored:
Labour 1:
Labour 2:
Labour 3:
50% reduction in monthly family labour supply to 240 hours (1 adult).
Family monthly labour supply of 180 hours (1 part-time).
Family monthly labour supply of 480 hours (basic- 2 adult).
The achievement status of goals and the corresponding farm plans generated for the basic model with
parametric variation in family labour availability are summarised in Tables 12.9 and 12.10
respectively. The labour was varied from 120 hrs/month (one part-time) to 480 hours/month (2 full
time people). In terms of goal achievement, the minimum cash and food requirement for home
199

consumption is satisfied in all labour levels with the exception that porker requirements for home and
social consumption at 180 hours. This is not fully met.
The pattern of land use resulting from a 50 percent reduction in family labour units reduced total
cropped area by 12 percent and surplus cash in April by 30 percent. As would be expected, reducing
the family labour supply not only affects the achievement of the leisure goal but forces the hiring of
more casual labour. The results also showed that labour requirements in some months are
supplemented by hired labour (a total of 50 hours of hired laboured is used). With a further reduction
in family labour supply to 180 hours per month (in Labour 2 column) there were reductions of the total
cropped area by 27 percent and no surplus cash was generated at the end of April. The increased
reliance on hired labour, along with a significant reduction in leisure hours, is one of the main features
of the plan. In Labour 2, a total hired labour of 255 hours is required and none of the monthly leisure
requirements are fully met. Most notably, the high labour intensive crops are most affected, with
squash area reduced by about 90 percent.
Table 12.9: Achievement status for goals for variation in family labour supply.
Goal Annual requirements Farm 2 Labour1 Labour 2 480hrs 240hrs 1BOhrs
1. Home sustenance Monthly living costs 3000 3000 3000 Yam consumption 720 720 720 Taro consumption 900 900 900 Cassava consumption 1200 1200 1200 Kumara consumption 1000 1000 1000 Porker consumption 2 2 0(2)
2. Church Obligations Monthly church costs 905 905 905 Yam consumption 300 300 300 Taro consumption 100 100 100 Cassava consumption 100 100 100 Kumara consumption 90 90 90 Porker consumption 6 6 6
3. Risk minimisation Poor year consumption A A A
4. Social obligations Monthly social costs 300 300 300 Yam consumption 250 250 250 Taro consumption 200 200 200 Cassava consumption 300 300 300 Kumara consumption 170 170 170
Porker consumption 3 3 1 (-2)
5. Profit maximisation Surplus cash in April 717 500 0
6. Leisure time Minimum leisure A PA PA
Hired Labour (hrs) 0 50 255
A = Achieved, PA = Partially achieved
Minus (-) figures indicate under achievement for specified goals.
Farm 2 = Tongatapu emergent farm
200
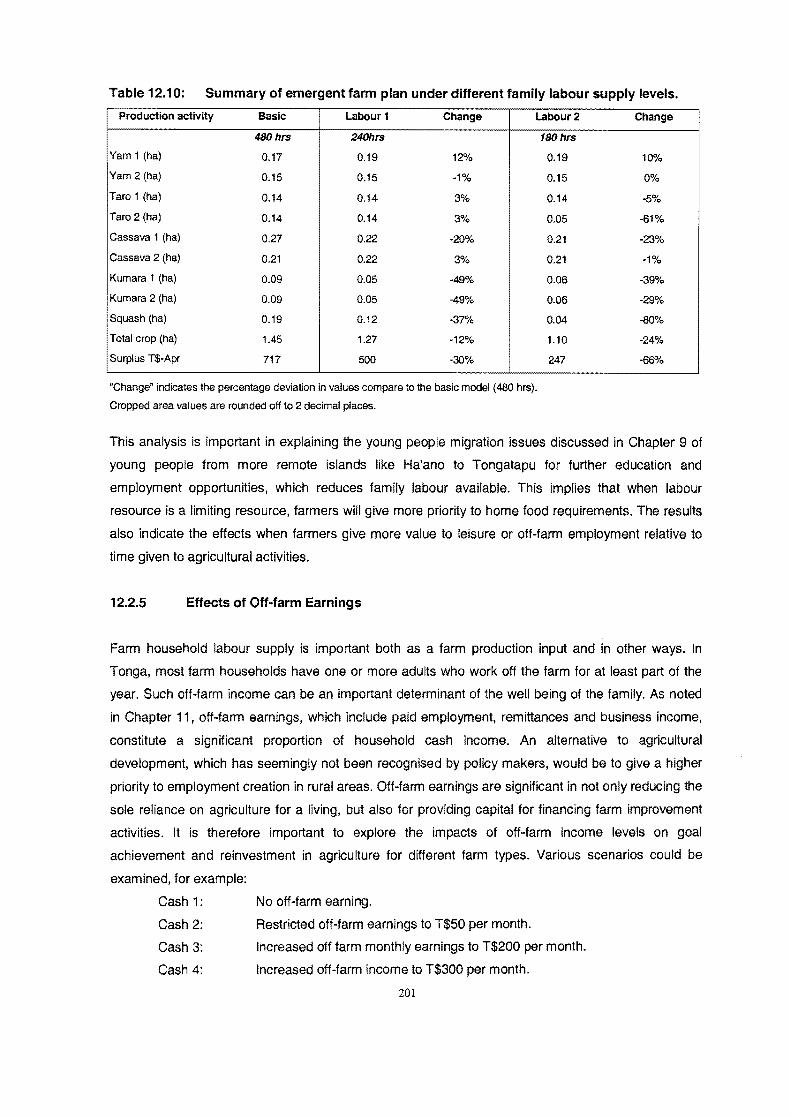
Table 12.10: Summary of emergent farm plan under different family labour supply levels. Production activity Basic Labour 1 Change Labour 2
480hrs 240hrs
Yam 1 (hal 0.17 0.19 12%
Yam 2 (hal 0.15 0.15 ·1%
Taro 1 (hal 0.14 0.14 3%
Taro 2 (hal 0.14 0.14 3%
Cassava 1 {hal 0.27 0.22 -20%
Cassava 2 {hal 0.21 0.22 3%
Kumara 1 (hal 0.09 0.05 -49%
Kumara 2 (hal 0.09 0.05 -49%
Squash (hal 0.19 0.12 -37%
Total crop {hal 1.45 1.27 -12%
Surplus T$-Apr 717 500 -30%
"Change" indicates the percentage deviation in values compare to the basic model (480 hrs).
Cropped area values are rounded off to 2 decimal places.
180hrs
0.19
0.15
0.14
0.05
0.21
0.21
0.06
0.06
0.04
1.10
247
Change
10%
0%
-5%
-61%
-23%
-1%
-39%
-29%
-80%
-24%
-66%
This analysis is important in explaining the young people migration issues discussed in Chapter 9 of
young people from more remote islands like Ha'ano to Tongatapu for further education and
employment opportunities, which reduces family labour available. This implies that when labour
resource is a limiting resource, farmers will give more priority to home food requirements. The results
also indicate the effects when farmers give more value to leisure or off-farm employment relative to
time given to agricultural activities.
12.2.5 Effects of Off-farm Earnings
Farm household labour supply is important both as a farm production input and in other ways. In
Tonga, most farm households have one or more adults who work off the farm for at least part of the
year. Such off-farm income can be an important determinant of the well being of the family. As noted
in Chapter 11, off-farm earnings, which include paid employment, remittances and business income,
constitute a significant proportion of household cash income. An alternative to agricultural
development, which has seemingly not been recognised by policy makers, would be to give a higher
priority to employment creation in rural areas. Off-farm earnings are significant in not only reducing the
sole reliance on agriculture for a living, but also for providing capital for financing farm improvement
activities. It is therefore important to explore the impacts of off-farm income levels on goal
achievement and reinvestment in agriculture for different farm types. Various scenarios could be
examined, for example:
Cash 1: No off-farm earning.
Cash 2: Restricted off·farm earnings to T$50 per month.
Cash 3: Increased off farm monthly earnings to T$200 per month.
Cash 4: Increased off-farm income to T$300 per month.
201

The impacts on farm plans for the three main farm types in Tongatapu for different levels of off-farm
income were examined and are summarised in Table 12.11. Goal achievement was significantly
different between the three main farm types. Progressive (Farm 1) showed every goal was achieved,
irrespective of the off-farm income level reflecting the large proportion (78%) of household income
derived from agriculture (as shown in Table 11.5). Farms 2 and 3 showed that the goals were not
achieved at both zero and T$50 off-farm income levels. As Table 12.11 shows the effects on
emergent farms were minor compared to marginal farms with the cash and porker requirements for
social obligations and church obligation not being fully met. In contrast to the marginal farm (Farm3),
some of the cash requirements for living needs, church and social obligations were not met. The
porker requirements and leisure were also affected both at zero and T$50 income levels.
Changes also occurred in the associated farm plans and the amount of surplus cash generated. The
effects of off-farm income levels on production farm plans are summarised in Table 12.2 and Figure
12.2. Progressive and emergent farm households, despite variation in their respective cash surplus
and total areas cropped, showed similar responses to changes in off-farm income level. In both cases,
with off-farm income below T$120, more crops were grown but there was a lower cash surplus.
However, with off-farm income of more than T$120, both the total cropped area and the cash surplus
increased. A different outcome was observed in marginal farms (Farm 3), where there was a
significant decrease in the total cropped area as off-farm income decreased.
Table 12.11: Summary of production and economic effects under different off-farm earnings for the three
representative farms in Tongatapu.
Off-farm (T$) level OImth 501mth 120/mth 2001mth 300Imth
Farm 1 SP·cash Apri (T$)I 3079 3297 3611 3951 4354
Cropped Area (ha) 2.73 2.67 2.48 3.08 3.27
Farm2 SP-cash Apri (T$)I 326 492 717 1088 1516
Cropped Area (ha) 1.46 1.46 1.43 1.51 1.56
Farm3 SP-cash Apri (T$)I 0 0 119 475 899
Cropped Area (ha) 1.11 1.11 0.9 0.72 0.69
Farm 1- progressive, Farm 2 - emergent. Farm 3 - marginal
SP = Surplus
The responses of these marginal farmers to off-farm income implies what other writers (Hau'ofa and
Ward, 1980; Sisifa et al., 1993) have noted in that they have "target household incomes'. This refers
to the threshold amount of cash that they must strive to obtain to meet their basic and immediate
needs (basic living costs), such as for the purchase of non-staple food, household consumption
needs, church obligatio~s and some social needs. It is argued that once these modest needs have
been met, further efforts at production cease. The modelled reactions of progressive and emergent
farm households are consistent with the findings in this survey in that civil servants are highly involved
202

Table 12.12: Effect of varying off-farm income levels on the achievement of goals for the three main farm types in Tongtapu.
Marginal Emergent Progressive Goal Annual requirements FAAM1 FAAM2 FAAM3
Off-farm Income (T$) 0 50 200 300 0 50 200 300 0 50 200 300 1. Home sustenance Living costs (T$) 3600 3600 3600 3600 3000 3000 3000 3000 2346 (-294) 2346 (-294) 2640 2640
Yam consumption (kg) 950 950 950 950 720 720 720 720 300 300 300 300 Taro consumption (kg) 1200 1200 1200 1200 900 900 900 900 900 900 900 900 Cassava consumption (kg) 800 800 800 800 1200 1200 1200 1200 1500 1500 1500 1500 Kumara consumption (kg) 850 850 850 850 1000 1000 1000 1000 400 400 400 400 Porker consumption (head) 3 3 3 3 2 2 2 2 2 2 2 2
2. Church obligations Church costs (T$) 1440 1440 1440 1440 905 905 905 905 80 (-500) 80 (-500) 580 580 Yam consumption (kg) 300 300 300 300 300 300 300 300 50 50 50 50 Taro consumption (kg) 200 200 200 200 100 100 100 100 30 30 30 30 Cassava consumption (kg) 200 200 200 200 100 100 100 100 30 30 30 30 Kumara consumption (kg) 200 200 200 200 90 90 90 90 30 30 30 30 Porker consumption (head) 8 8 8 8 0(-6) 0(-6) 6 6 2 (-4) 2 (-4) 4 4
3. Risk minimisation Poor year consumption A A A A A A A A A A A A 4. Social obligations Social costs (T$) 480 480 480 480 253 (-47) 300 300 300 30 (-180) 30(-180) 180 180 8
N
Yam consumption (kg) 600 600 600 600 250 250 250 250 30 30 30 30 Taro consumption (kg) 400 400 400 400 200 200 200 200 30 30 30 30 Cassava consumption (kg) 400 400 400 400 300 300 300 300 30 30 30 30 Kumara consumption (kg) 270 270 270 270 170 170 170 170 60 60 60 60 Porker consumption (head) 4 4 4 4 2(-1) 2(-1 ) 3 3 3 3 3 3
5. Profit maximisation Surplus cash in April (1$) 3079 3297 3611 3951 4354 492 1088 1517 0 0 475 899
6. Leisure time Leisure (hours/unit) A A A A A A A A PA PA A A
A = Achieved. PA = Partially achieved
Minus (-) figures indicate under achievement for specified goals.

i 1 cash croppin;J. Such farmers halfe a secured income source that alle·ws them to finance farm
i Tlprovements , but those who rely directly on agriculture are not in such a strong position. This implies
that becaus8 th l3 family labour supply is in excess of current farm requirements, there is opportunity
for cff-fawl employment. Off-farm earnings ensure farmers have a more secured income and thus
allows then to invest more on profitable agricultural ventures.
Figu;'e 12.2:
3.5 -
3 -
2.5
(0' 2 -J: ,-
to :~ 1.5 -
c:(
1
0.5
0
12.2.6
Summary of total cropped area under scenarios of different levels of off-farm income for
representative farm types in Tongatapu.
a 50 120 200 300
Off-farm income (T$)
o Marginal [] Errergent E1 Progressive
Effects of Credit policies
Another p'oduction incentive often used in agricultural policy is the provision of credit. The credit
facil ities available to farmers have ~een discussed in greater depth in Chapter 5. With respect to
:: reclit, the level of short or long-term borrowing is determined by the farmer's -c:apacity to repay a loan
and his willingness to borrow. The current interest r te and term for possible loans was specified in
the credit comr:onent of the model. As shown earlier in Chapter 11, credit accounts for less than 10
percent of total income and varies among the three main farm types .
An analysis of credit policy was conducted for two potential situations where the government provides
more incentivef; through TOB credit lines with lower agricultural credit interest rates, and also where
such assistancl3 is not provided and therefore using a higher interest rates. Concessional credit for
farm development purposes could be represented by adjusting interest rates and the proportion of
borrowed fund~ used for on-farm investment. The three farm types from the outer islands were used
to examinH the impact of changes in interest rate charges on the level of borrowing and on farm plans.
The main scenarios examined were parametric variations of monthly interest rate, from 3 percent to
15 percent. 104
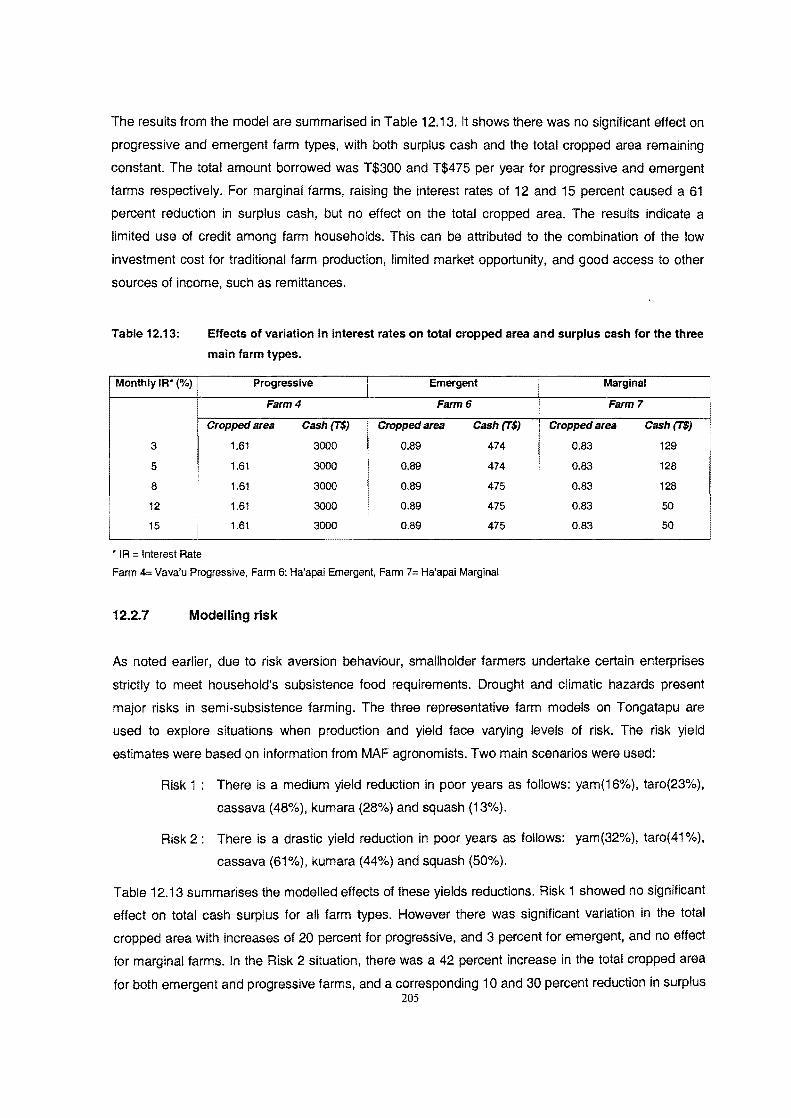
I
The results from the model are summarised in Table 12.13. It shows there was no significant effect on
progressive and emergent farm types, with both surplus cash and the total cropped area remaining
constant. The total amount borrowed was T$300 and T$475 per year for progressive and emergent
farms respectively. For marginal farms, raising the interest rates of 12 and 15 percent caused a 61
percent reduction in surplus cash, but no effect on the total cropped area. The results indicate a
limited use of credit among farm households. This can be attributed to the combination of the low
investment cost for traditional farm production, limited market opportunity, and good access to other
sources of income, such as remittances.
Table 12.13: Effects of variation in interest rates on total cropped area and surplus cash for the three
main farm types.
Monthly IR* (%) Progressive Emergent Marginal
Farm 4 Farm 6 Farm 7
Cropped area Cash(T$) Cropped area Cash(T$) Cropped area Cash(T$)
3 1.61 3000 0.89 474 0.83 129
5 1.61 3000 0.89 474 0.83 128
8 1.61 3000 0.89 475 0.83 128
12 1.61 3000 0.89 475 0.83 50
15 I
1.61 3000 0.89 475 0.83 50
• I R = Interest Rate
Farm 4= Vava'u Progressive, Farm 6: Ha'apai Emergent, Farm 7= Ha'apai Marginal
12.2.7 Modelling risk
As noted earlier, due to risk aversion behaviour, smallholder farmers undertake certain enterprises
strictly to meet household's subsistence food requirements. Drought and climatic hazards present
major risks in semi-subsistence farming. The three representative farm models on Tongatapu are
used to explore situations when production and yield face varying levels of risk. The risk yield
estimates were based on information from MAF agronomists. Two main scenarios were used:
Risk 1: There is a medium yield reduction in poor years as follows: yam(16%), taro(23%),
cassava (48%), kumara (28%) and squash (13%).
Risk 2: There is a drastic yield reduction in poor years as follows: yam(32%), taro(41%),
cassava (61%), kumara (44%) and squash (50%).
Table 12.13 summarises the modelled effects of these yields reductions. Risk 1 showed no Significant
effect on total cash surplus for all farm types. However there was significant variation in the total
cropped area with increases of 20 percent for progressive, and 3 percent for emergent, and no effect
for marginal farms. In the Risk 2 situation, there was a 42 percent increase in the total cropped area
for both emergent and progressive farms, and a corresponding 10 and 30 percent reduction in surplus 205
I
cash, respectively. For marginal farm households, the total crop area increased by 33 percent and
surplus cash reduced by at least 33 percent.
The results indicate the significance of production risk management behaviour among Tongan
smallholders. Fieldwork results showed that with farmers' experience of traditional root crops, they
have a fair idea of yield discrepancy between poor and good years for specific crops. Consequently
they always produce in excess for food security reasons. This raises an important issue for MAF
Research and Extension in terms of the development of improved technologies and information for
assisting farmers to reduce yield risk ego drought and disease resistant cultivars, and better
management techniques and practices such as irrigation, and the use of fertilisers. Market price risk
was not explored using the model but it was raised in the fieldwork. This included a suggestion for a
price support scheme whereby farmers would receive a guaranteed price for their output, regardless
of the prevailing market price. This could apply to squash and vanilla where the fluctuation in price is
seen as a risk, and discourages some farmers. Some respondents also raised the lack of a crop
insurance facility and support to help farmers in sharing the burden of losses occurring in agriculture
as a result of disasters, whether natural (drought, hurricane, hail, etc.) or man made fires beyond
farmers' control. Thus the suggestion for government to establish a reserve fund to serve as a cushion
for such crop losses.
206

Table 12.14: Effects of yield risk on different farm types in Tongatapu.
Production Progressive activity Basic RIsk1 "Change Rlsk2 "Change Basic
Yam 1 (ha) 0.27 0.27 0% 0.27 0% 0.17
Yam 2 (ha) 0.14 0.21 46"/0 0.68 384% 0.15
Taro 1 (ha) 0.35 0.35 0% 0.35 0% 0.14
Taro 2 (ha) 0.08 0.08 0% 0.37 355% 0.14
Cassava 1 (ha) 0.29 0.29 0"/0 0.29 0"/0 0.27
Cassava 2 (ha) 0.11 0.11 0"/0 0.11 0% 0.21
Kumara 1 (ha) 0.10 0.10 0% 0.29 200% 0.09
Kumara 2 (ha) 0.10 0.10 0% 0.29 200% 0.09
Squash (ha) 1.05 1.48 41% 0.88 -16% 0.19
Total crop (ha) 2.48 2.98 20% 3.53 42% 1.45 Surplus T$-Apr 3611 3576 -1% 3264 -10% 717
"Change" Indicates the percentage deviation in values compare to the basic model (3.34 hal. "-» indicates the activity is not chosen by the model
Cropped area values are rounded off to 2 decimal places.
Minus (-) figures indicate under achievement for specified goals.
Risk1 0.17
0.15
0.14
0.14
0.27
0.21
0.12
0.09
0.19
1.49
715
Emergent Marginal
"Change Risk2 "Change Basic Rlsk5 "Change Risk "Change -1% 0.18 8% 0.05 0.05 0% 0.06 26%
-1% 0.45 201% 0.05 0.05 0% 0.13 169%
3% 0.14 3% 0.09 0.10 6% 0.18 91%
3% 0.34 140% 0.09 0.09 0"10 0.09 0%
1% 0.27 1% 0.26 0.26 0% 0.26 -2%
1% 0.21 1% 0.26 0.26 0% 0.26 -2%
35% 0.25· 176% 0.05 0.09 93% 0.15 224%
-2% 0.09 -2% 0.05 0.05 0% 0.07 47%
-1% 0.13 -33% 0.00 0.00 0% 0.00 0"10 S 3% 2.06 42% 0.90 0.94 5% 1.19 33% N
0"/0 500 -30% 119 119 0"/0 80 -33%

12.3 Modelling farmer's goals and priorities
Given that the representative models developed in this study are useful for analysis of individual policy
instruments, further consideration is given in this section to using the models for assessing the value
and importance of the goals and priorities of different farm types. A series of experiments using the
eight representative farm models was conducted. These explored the significance of non-economic
and social goals that characterise Tongan smallholder farmers most importantly, church and social
obligation and leisure goals.
12.3.1 Modelling the significance of church and social obligations
Chapter 9 identified the strong influence, if not dominance, of religious and socio-cultural
considerations on Tongan household farming decisions and activities. This takes the form of strict
observance of social norms and customs, including religious beliefs and practices. The models were
used to explore the significance of church and social obligations on farm household production by
varying the weights attached to the over achievement of objectives. The weights were derived from
the basic models indicating the preferences of the farmer to maximise surplus cash (0.1) once the
minimum requirements for food and cash requirements ( 0.0001) are met. Models of the 3 main farm
types in T ongatapu were examined using the following scenarios:
Church 1: More weight on church obligation (0.1) and less on surplus cash April (0.0001)
Church 2: Less weight on church obligation (0.0001) in favour of surplus cash April (0.1)
Social 1 : More weight on social obligation (0.1) and less on surplus cash April (0.0001)
Social 2: Less weight on social obligation (0.0001) in favour of surplus cash April (0.1)
Leisure 1 : More weight on leisure (0.1) and less on surplus cash April (0.0001)
Leisure 2: Less weight on leisure (0.0001) in favour of surplus cash April (0.1)
Profit Maximisation: Assume that farmer's prime objective is to maximise cash surplus.
The results of the modelling experiments are presented in Tables 12.15 and 12.16. Under scenarios
Church 1 and 2, varying the weights on church goals has a significant impact on the farm plan and
total cash surplus. For instance, in Church 1, if farmers prefer to overachieve on church goals
(increase weight from 0.0001 to 0.1), and give lower importance to cash surplus generation (reduce
weight from 0.1 to 0.0001), the system would fail to meet some of the current monthly cash and
porker requirement fully. For progressive farms, the total cropped area increased by 35 percent, while
surplus cash at end of April decreased by 18 percent. In contrast, in Church 2 where more emphasis
is put on surplus cash (0.1) and less emphasis on church obligations (0.0001), was a minor effect on
the total cropped area, but an increased surplus cash of 8 percent. There was also a significant
variation among farm types: in which Church 1 the emergent farmer had a 48 percent reduction in
surplus cash, and a 31 percent increase in cropped area.
208

Table 12.15: Effects of altering the weight on church obligations on farmer's production plans.
Production Progressive Emergent Activity Basic Church 1 % Change Church2 % Change Basic Churchf % Change Church2 % Change
Yam 1 (ha) 0.27 0.27 0% 0.27 0% 0.17 0.08 13% 0.15 -11% Yam 2 (ha) 0.14 0.15 7% 0.12 -12% 0.15 0.14 -44% 0.08 -44% Taro 1 (ha) 0.35 0.35 0% 0.35 0% 0.14 0.14 0% 0.14 0% Taro 2 (ha) 0.08 0.11 36% 0.08 0% 0.14 0.27 0% 0.05 -63% Cassava 1 (ha) 0.29 0.29 0% 0.29 0% 0.27 0.27 65% 0.27 -2% Cassava 2 (ha) 0.11 0.11 0% 0.11 0% 0.22 0.09 104% 0.21 -6% Kumara 1 (ha) 0.10 0.10 0% 0.10 0% 0.09 0.09 0% 0.09 0%
Kumara 2 (ha) 0.10 0.10 0% 0.10 0% 0.09 0.21 0% 0.09 0%
Squash (ha) 1.05 0.85 -19% 1.05 0% 0.19 1.49 52% 0.29 52% Total crop (ha) 2.48 2.32 -6% 2.46 -1% 1.47 1.92 31% 1.37 -6%
Surplus T$-Apr 3611 2963 -18% 3902 8% 717 371 -48% 1029 44%
Table 12.16: Effects of altering the weight on social obligations on different farm type production plans.
Production Progressive Emergent Activity Basic Soc/a/1 % Change Socia/2 % Change Basic Socia/1 % Change Soc/a/2 % Change
Yam 1 (ha) 0.27 0.27 0% 0.25 -8% 0.17 0.15 -11% 0.14 -19% Yam 2 (ha) 0.14 0.11 -24% 0.09 -39% 0.15 0.08 -44% 0.07 -52% Taro 1 (ha) 0.35 0.35 0% 0.33 -5% 0.14 0.14 0% 0.14 -3% Taro 2 (ha) 0.08 0.08 0% 0.06 -22% 0.14 0.05 -63% 0.05 -66%
Cassava 1 (ha) 0.29 0.29 0% 0.28 -4% 0.27 0.27 -2% 0.26 -3%
Cassava 2 (ha) 0.11 0.11 0% 0.10 -11% 0.22 0.21 -6% 0.20 -7%
Kumara 1 (ha) 0.10 0.10 0% 0.09 -12% 0.09 0.09 0% 0.04 -52%
Kumara 2 (ha) 0.10 0.10 0% 0.09 -12% 0.09 0.09 0% 0.04 -52%
Squash (ha) 1.05 0.84 -20% 1.06 1% 0.19 0.29 52% 0.26 33%
Total crop (ha) 2.48 2.24 -10% 2.33 -6% 1.47 1.37 -6% 1.21 -18%
Surplus T$-Apr 3611 3345 -7% 3752 4% 717 423 -41% 1052 47%
"Change" indicates the percentage deviation in values compare to the basic model (3.34 ha).
Emergent MarketS 0.05 0.06
0.05 0.05
0.09 0.09
0.09 0.09
0.26 0.26
0.26 0.26
0.05 0.05
0.05 0.05
0.00 0.00
0.90 0.91
119 50
Bas/c Soc/a/1 0.05 0.05 0.05 0.05 0.09 0.09
0.09 0.09
0.26 0.26
0.26 0.26
0.05 0.05
0.05 0.05
0.00 0.00
0.90 0.90
67 -44%
Marginal % Change Market6
24% 0.05
0% 0.05
0% 0.09
0% 0.09
0% 0.21
0% 0.21
0% 0.05
0% 0.05
0% 0.00
1% 0.80
-58% 326
Marginal % Change Soc/al2
0% 0.05
0% 0.05 0% 0.09
0% 0.09
0% 0.25
0% 0.25
0% 0.05
0% 0.05
0% 0.00
0% 0.87
95% 290
% Change 0%
0%
0%
0% -18%
-18%
0%
0%
0% -11%
174%
% Change 0% 0% 0%
0% -5%
-5%
0%
0%
0%
-3%
144%
a c ('

Table 12.17: Effects of altering the leisure weights on production plans of the different farm types in Tongatapu.
Production Progressive Emergent Activity Basic Lelsure1 % Change Leisure2 % Change Basic Lelsure1 % Change Lelsure2 % Change
Yam 1 (ha) 0.27 0.31 14% 0.27 0"10 0.17
Yam 2 (ha) 0.14 0.20 44% 0.13 -11% 0.15
Taro 1 (ha) 0.35 0.35 0% 0.35 0% 0.14
Taro 2 (ha) 0.08 0.08 -1% 0.08 0"/0 0.14
Cassava 1 (ha) 0.29 0.11 -63% 0.29 0% 0.27
Cassava 2 (ha) 0.11 0.11 00/0 0.11 0% 021
Kumara 1 (ha) 0.10 0.06 -43% 0.10 -1% 0.09
Kumara 2 (ha) 0.10 0.09 -5% 0.10 -1% 0.09
Squash (ha) 1.05 0.00 -100% 0.93 -11% 0.19
Total crop (ha) 2.48 1.30 -47% 2.34 -6% 1.45
Surplus T$-Apr 3611 2500 -31% 3619 0.2% 717
"Change" indicates the percentage deviation in values compare to the basic model (3.34 hal.
Cropped area values are rounded off to 2 decimal places.
Minus (-) figures indicate under achievement for specified goals.
0.19 11% 0.15 -13%
0.15 -1% 0.15 -1%
0.14 3% 0.14 3%
0.05 -61% 0.05 -61'}'0
0.21 -23% 0.27 -1%
0.21 -1% 0.21 -1%
0.05 -50% 0.09 -2%
0.09 -2% 0.09 -2%
0,00 -100% 0.30 55%
1.08 -25% 1.44 -1%
500 -30% 757 6%
BlISle 0.05
0.05
0.09
0.09
0.26
0.26
0.05
0.05
0.00
0.90
119
Marginal I
. Lelsure1 % Change Lelsure2 % Change 0.04 -22% 0.05 0%
! 0.05 -8% 0.05 0%
0.09 -4% 0.09 00/0 0.09 -4% 0.09 0%
0.26 -1% 0.26 -1%
0.11 -60% 0.26 -1%
0.04 -13% 0.16 247%
0.04 -9010 0.05 0%
0.00 0% 0.00 0%
0.71 -21% 1.00 12%
89 -25% 154 29% --
C r·

Reversin;J the weight in favour of s rplus cash (0 1) would increase surplus cash by 44 percent. For
a rnarginal farm household the cash surplus is reduced by 58 percent in Church 1, but increased by
1703 percent when the weightings are reversed (Church 2). These differEinces are attributed to the
variation in income levels among the three groups and the variation in the weights for each farm type
in the initial models. A similar trend was observed with the social obligation goal. More weight on the
acllievernent of social goals showed differences among production plans of the three farm types,
with decrease.:> in surplus cash by 44 percent (marginal), 41 percent (emI3rgent) and only 7 percent
in progressivE-. Reversing the weights in favour of achieving cash surJlus showed a 4 percent
increase for p'ogressive farmers, 41 percent for emergent, and, most siqnif icantly, 144 percent for
the mar~linal farm hOLseholds.
The effect of varying the weights for social and ch rch goals relative to cash surplus were further
':3xplored using an emergent farm type in Tongatapu (Farm 4; . Figure 12.3 shows the percentage
edLction in surplus cash at the end of the year when the respective goal weights for church and
30cial obl i(p.tiorl change. These figur'es are compared with the initial modGI in which the weights on
:3actl were sel at 0.0001 indicating the preferences of the farmer for meeting the minimum
'eql!iremellts.
Figure 12.3 :
80% -
70 %
60 c)io
= .2 U :l
50% "0 OJ r... OJ 40 % cJ)
'" C 30 '11> OJ
<.J r... OJ
c.. 20%
10 ']
0%
Percen1age reduc1ion in surplus cash when varying goal weigh'ls for social and church
obliga1ions in an emergent farm household in Tongatapu.
76% 73%
450/c
40%
0% 0%
0.0001 0.00 1 O. ~ll 0.1 ,---------------,
Weights • Social 0 Church
From the data it can be seen that increasing the weights for social and church obligations from 0.0001
to 0.001 would reduce surplus cash by 15 percent and 45 percent respectively. Further increases of
soc al and church weights to 0.1 would subsequently reduce the cash surplus by 40 percent and 76
percent. Figure 12.4 depicts the changes in the level of surplus cash for ar er,ergent farm household
in Tongatapu \I/hen the weights on profit maximisation are varied while oller goals remain constant.
211
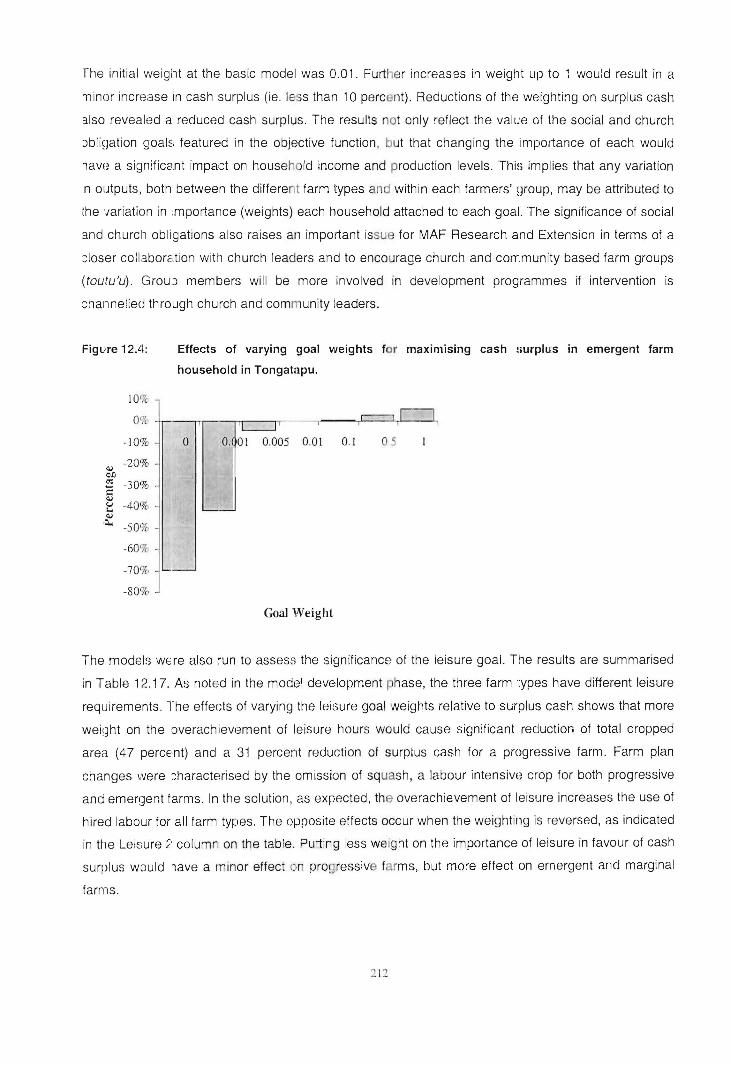
fhe initial weigllt at the basic model was 0.01. Further increases in weight up to 1 would result in a
llinor increase in cash surplus (ie. Ie s than 10 percent). Reductions of the weighting on surplus cash
3.lso revealed a reduced cash surplus. The results not only reflect the value of the social and church
Jblination goal~; featured in the objective function , but that changing the importance of each would
lave a significant impact on household income and production levels. This implies that any variation
n outputs, both between the different farm types and within each farmers' nroup, may be attributed to
the 'Jariation in ;mportance (weights) each ~lousehold attached to each goal. The significance of social
and churcll obligations also raises an important issue for MAF Research and Extension in terms of a
::Ioser collaborc:,tion with church leaders and to encourage church and corrmunity based farm groups
(toutu 'u) . GrouJ members will be more involved in development programmes if intervention is
:;hannelled through church and com unity leaders.
FigLre 12A:
10o/c
OUk
- 10'3'0
<iJ -20%
<;.() <II -30'10 i: <iJ <.J -40 t~ .... <iJ ,~
·509(
·609(
-70%
-80'l<'
Effects of varying goal weights for maximising cash Burplus in emergent farm
household in Tongatapu.
0 O. 01 0.005 0.01 0. 1 0
Goal Weight
The models WEre also run to assess the significance of the leisure goal. The results are summarised
in Table 12.17. As noted in the model development phase, the three farm ':ypes have different leisure
requirements . The effects of varying the leisure goal weights relative to surplus cash shows that more
weiqht on the overachievement of leisure hours would cause significant reduction of total cropped
area (47 percE,nt) and a 31 percent reduction of surp(us cash for a progressive farm. Farm plan
changes were :;haracterised by the omission of squash, a labour intensive crop for both progressive
and emeq:jent farms. In the solution, as expected, th overachievement of leisure increases the use of
hired labour for all farm types. The opposite effects occur when the weighting is reversed, as indicated
in the Leisure ~ ' colum on the table. Putting less weight on the importance of leisure in favour of cash
surplus WJuid lave a minor effect c,n progressive farms, but more effect on emergent and marginal
farms.
:! 12
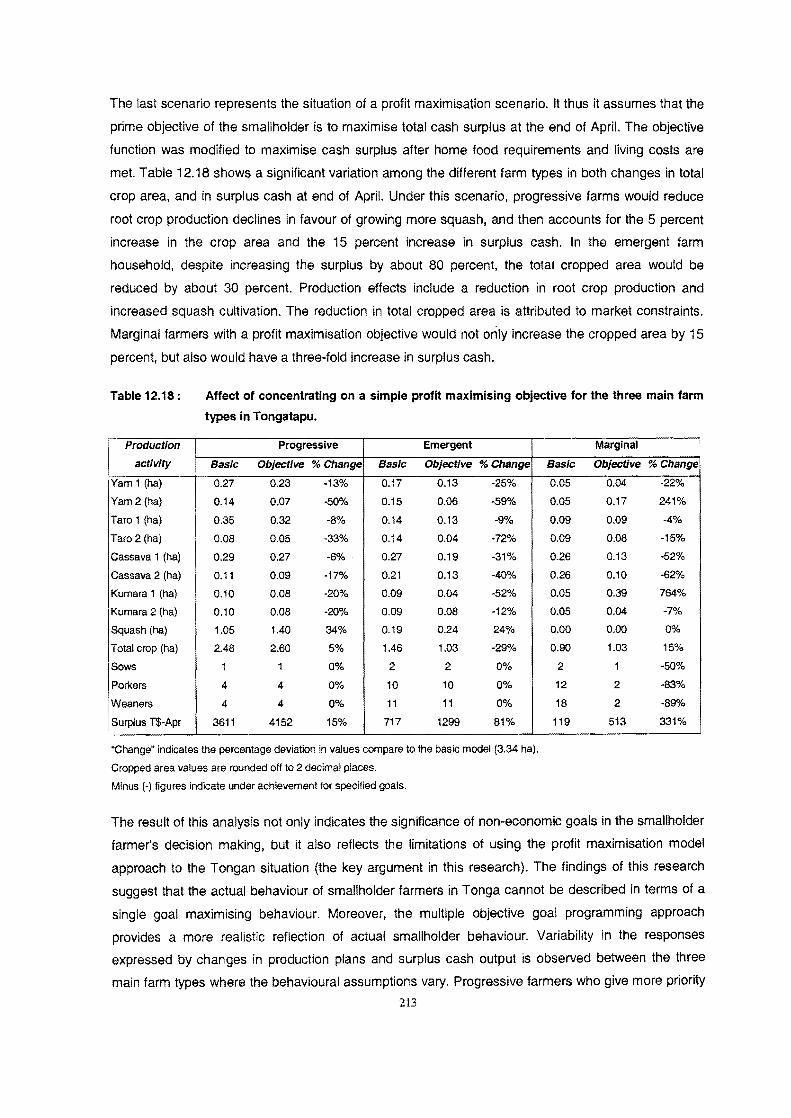
I
The last scenario represents the situation of a profit maximisation scenario. It thus it assumes that the
prime objective of the smallholder is to maximise total cash surplus at the end of April. The objective
function was modified to maximise cash surplus after home food requirements and living costs are
met. Table 12.18 shows a significant variation among the different farm types in both changes in total
crop area, and in surplus cash at end of April. Under this scenario, progressive farms would reduce
root crop production declines in favour of growing more squash, and then accounts for the 5 percent
increase in the crop area and the 15 percent increase in surplus cash. In the emergent farm
household, despite increasing the surplus by about 80 percent, the total cropped area would be
reduced by about 30 percent. Production effects include a reduction in root crop production and
increased squash cultivation. The reduction in total cropped area is attributed to market constraints.
Marginal farmers with a profit maximisation objective would not only increase the cropped area by 15
percent, but also would have a three-fold increase in surplus cash.
Table 12.18:
Production activity
Yam 1 (hal
Yam 2 (hal
Taro 1 (ha)
Taro 2 (ha)
Cassava 1 (ha)
Cassava 2 (ha)
Kumara 1 (hal
Kumara 2 (ha)
Squash (ha)
Total crop (ha)
Sows
Por1<ers
Affect of concentrating on a simple profit maximising objective for the three main farm types in Tongatapu.
Progressive Emergent Marginal
Basic Objective % Change Basic Objective % Change Basic Objective % Change
0.27 0.23 ·13% 0.17 0.13 -25% 0.05 0.04 -22%
0.14 0.Q7 -50% 0.15 0.06 -59% 0.05 0.17 241%
0.35 0.32 -8% 0.14 0.13 -9% 0.09 0.09 -4%
0.08 0.05 -33% 0.14 0.04 -72% 0.09 0.08 -15%
0.29 0.27 -6% . 0.27 0.19 -31% 0.26 0.13 -52%
0.11 0.09 -17% 0.21 0.13 -40% 0.26 0.10 -62%
0.10 0.08 -20% 0.09 0.04 -52% 0.05 0.39 764%
0.10 0.08 -20% 0.09 0.08 -12% 0.05 0.04 -7%
1.05 1.40 34% 0.19 0.24 24% 0.00 0.00 0%
2.48 2.60 5% 1.46 1.03 -29% 0.90 1.03 15%
1 1 0% 2 2 0% 2 1 -50%
4 4 0% 10 10 0% 12 2 -83%
,Weaners 4 4 0% 11 11 0% 18 2 -89%
I Surplus T$-Apr 3611 4152 15% 717 1299 81%
"Change" indicates the percentage deviation in values compare to the basic model (3.34 hal.
Cropped area values are rounded off to 2 decimal places.
Minus (-) figures indicate under achievement for specified goals.
119 513 331%
The result of this analysis not only indicates the significance of non-economic goals in the smallholder
farmer's decision making, but it also reflects the limitations of using the profit maximisation model
approach to the Tongan situation (the key argument in this research). The findings of this research
suggest that the actual behaviour of smallholder farmers in Tonga cannot be described in terms of a
single goal maximising behaviour. Moreover, the multiple objective goal programming approach
provides a more realistic reflection of actual smallholder behaviour. Variability in the responses
expressed by changes in production plans and surplus cash output is observed between the three
main farm types where the behavioural assumptions vary. Progressive farmers who give more priority 213
to maximising surplus cash in favour of church, social, and leisure were the least affected compared
to the other two farm types.
These results show that any changes to the goals and priorities or preferences of smallholder farmers,
as specified in the objective function, would have a significant impact on productivity and overall farm
production. The reality is that farming communities are comprised of different farm groups with
different goals, preferences, attitudes, aspirations and financial conditions that restrict them in drawing
benefits from farm resources. Of the three main farm types, progressive farms were found to have the
best access to resources and market, but most importantly, they have the attitude and motivation to
excel in the efficient mobilisation of their resources. This highlights the importance for Government
officials to understand the farmers' priorities and relative goals in the design and prescription of
effective development policies and programmes.
At the farm level, successful crop husbandry needs good skills, expertise and management to utilise
available resources. The successful development of a public and private infrastructure, and
institutional services for agriculture, first depend on the managerial skills and capabilities of farmers to
boost farm productivity. Farmer characteristics such as educational attainment, farming experience,
financial condition, all directly influence their perceptions of, and attitudes toward, technological
innovations. It may be possible for government, through educational and training programs and the
rural development schemes, to improve farmers' perceptions and to help develop positive attitudes
towards commercialisation and the adoption of innovations. Government can indirectly influence
farmers' goals through education and training programmes, and the provision of incentives for farmers
to put a higher priority obtaining a cash surplus rather than non-economic social goals. This would
enhance commercial production and there would be more outputs to be sold, and there would be
more cash available for on farm investment. Some of the livestock development projects (discussed
earlier in Chapter 5) failed to improve breeds or stocks of pigs and cattle because they are mostly
raised for social and cultural obligations rather than for cash.
Some marginal households work just hard enough to maintain themselves and no more, even when
there is considerable potential for further production. This is due to their goals and preferences which
are expressed in a lack of the commercialisation mentality and motivation that is the driving force of
progressive farmers. Without doubt, most villagers desire money and material possessions and they
are definitely interested in obtaining them. However, if their achievement involves sustained and
strenuous effort, the cost is commonly considered too high. The things that money buys are attractive,
but rarely attractive enough to compensate for a loss of leisure time. As Hau'ofa and Ward (1980)
argued, if smallholder farmers are content in their low input type of agriculture. why change it? This
debate must be considered by the people of Tonga and decision made on whether greater
commercialisation is appropriate. For the development of educational and health facilities
development will be essential.
214
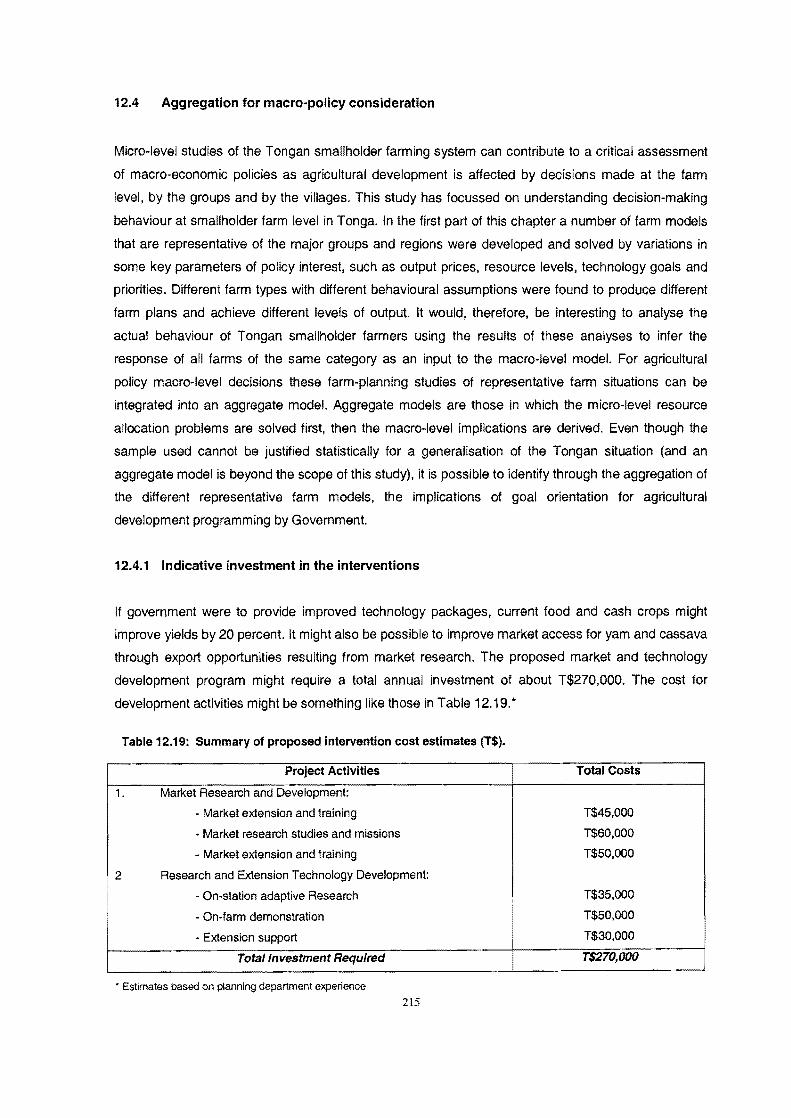
12.4 Aggregation for macro-policy consideration
Micro-level studies of the Tongan smallholder farming system can contribute to a critical assessment
of macro-economic policies as agricultural development is affected by decisions made at the farm
level, by the groups and by the villages. This study has focussed on understanding decision-making
behaviour at smallholder farm level in Tonga. In the first part of this chapter a number of farm models
that are representative of the major groups and regions were developed and solved by variations in
some key parameters of policy interest, such as output prices, resource levels, technology goals and
priorities. Different farm types with different behavioural assumptions were found to produce different
farm plans and achieve different levels of output. It would, therefore, be interesting to analyse the
actual behaviour of Tongan smallholder farmers using the results of these analyses to infer the
response of all farms of the same category as an input to the macro-level model. For agricultural
policy macro-level decisions these farm-planning studies of representative farm situations can be
integrated into an aggregate model. Aggregate models are those in which the micro-level resource
allocation problems are solved first, then the macro-level implications are derived. Even though the
sample used cannot be justified statistically for a generalisation of the Tongan situation (and an
aggregate model is beyond the scope of this study), it is possible to identify through the aggregation of
the different representative farm models, the implications of goal orientation for agricultural
development programming by Government.
12.4.1 Indicative investment in the interventions
If government were to provide improved technology packages, current food and cash crops might
improve yields by 20 percent. It might also be possible to improve market access for yam and cassava
through export opportunities resulting from market research. The proposed market and technology
development program might require a total annual investment of about T$270,OOO. The cost for
development activities might be something like those in Table 12.19.*
Table 12.19: Summary of proposed intervention cost estimates (T$).
Project Activities Total Costs
1. Market Research and Development:
- Market extension and training T$45.000
• Market research studies and missions T$60,OOO
- Market extension and training T$50,OOO
2 Research and Extension Technology Development:
- On-station adaptive Research T$35 ,000
- On-farm demonstration T$50,OOO
• Extension support i
T$30,000
Total Investment Required T$270,OOO
• Estimates based on planning department experience 215

12.4.2 Indicative project benefits
Working under the assumption that the representative farm "adequately" represents other holdings,
the eight representative models developed in this study was used to evaluate the results of a
proposed development program. This was done by multiplying each representative farm plan and its
associated financial results by the number of holdings it represents to obtain a regional aggregate of
production, activity levels and financial data (eg. surplus cash at the end of the year). The project
benefits have been estimated for each island group on the basis of information from the 1993 Land
Use Crop Survey and the categorisation into the 3 main farm types. According to the Land Use and
Crop survey (MAF, 1994b), the total number of farmers in each region was estimated to be:
Tongatapu (3193), Vava'u (1601) and Ha'apai (968). The relative distribution of farm types was
estimated from the survey results. Table 12.21 details the project induced changes in land use pattern
and likely increases in surplus cash for the eight representative models. These results were then used
to determine overall project benefits. This is summarised in Table 12.20 below.
Table 12.20 shows that if the project is properly implemented it has the potential to generate
incremental surplus cash of more than $3 million. More realistically there are additional factors such
as risk, imports and a time lag involved in strengthening adaptive research and extension capacities.
With a modest target and a more conservative estimate of 40 percent adoption for year 1, an
incremental cash surplus or revenue of T$1.3 million could be attained.
Table 12.20: Summary of proposed project benefits (T$).
Farm Type Region % Farm type No. of growers Incremental T$ Incremental at 100 % Incremental at 40 %
T$M T$M
Tongatapu 6 192 537 0.10 0.04
2 Tongatapu 50 1597 594 0.95 0.38
3 Tongatapu 44 1405 470 0.66 0.26
4 Vava'u 6 96 566 0.05 0.02
5 Vava'u 50 801 535 0.43 0.17
6 Vava'u 44 704 627 0.44 0.18
7 Ha'apai 33 319 885 0.28 0.11
8 Ha'apai 67 649 583 0.38 0.15
Total Incremental Benefit 3.30 1.32
216

Table 12.21 : Summary ofthe projected changes in representative farm land use patterns.
TONGATAPU
Production Progressive Emergent Marginal Progressive activity Farm 1 Farm 2 Farm 3
Yam 1 (ha) 0.27 0.26 -4% 0.17 0.12 -3% 0.05 0.07 57% 0.27
Yam 2 (ha) 0.14 0.09 -37% 0.15 0.09 41% 0.05 0.04 -14% 0.11
Taro 1 (ha) 0.35 0.29 -17% 0.14 0.12 -5% 0.09 0.08 ·17% 0.26
Taro 2 (ha) 0.08 0.Q7 -16% 0.14 0.05 ·17% 0.09 0.08 -17% 0.08
Cassava 1 (ha) 0.29 0.27 -8% 0.27 0.22 ·21% 0.26 0.20 -25% 0.23
Cassava 2 (ha) 0.11 0.09 -17% 0.21 0.17 -26% 0.26 0.15 -43% 0.11
Kumara 1 (ha) 0.10 0.08 -18% 0.09 0.07 2% 0.05 0.04 -16% 0.08
Kumara 2 (ha) 0.10 0.08 -18% 0.09 0.07 2% 0.05 0.04 -16% 0.08
Squash (ha) 1.05 0.09 -91% 0.19 0.24 0.00 0.00 0% -Kava (ha) - . - - « « - . - 0.25
Vanilla (ha) - « . « . . « - . 0.15
Total crop (ha) 2.48 1.32 -47% 1.46 1.16 -3% 0.90 0.69 -400/0 1.61
Fallow (ha) 0.48 0.40 -15% 0.32 0.23 -5% 0.16 0.24 3% 0.39
Fertilise area (ha) - - - - - - - - - -Sows 1 1 0% 2 2 0% 2 2 00/0 1
Porkers 4 4 0% 10 10 -17% 12 12 0% 4
Weaners 4 4 0% 11 11 -15% 18 18 38% 4
Surplus T$-Apr 3611 4148 15% 717 1311 81 % 119 589 395% 3000
"Change" indicates the percentage deviation in values compare to the basic model (3.34 hal.
"_n indicates the activity is not chosen by the model
Cropped area values are rounded off to 2 decimal places.
Minus (-) figures indicate under achievement for specified goals.
Farm 4 0.22 -17%
0.09 -17%
0.22 -16%
0.07 -17%
0.19 -17%
0.19 76%
0.Q7 -9%
0.Q7 -18%
. «
0.13 0%
0.15 0%
1.40 -13%
0.31 -20%
- -1 OOA. 4 OOA. 4 OOA.
3566 19%
VAVA'U
Emergent
Farm 5
0.13 0.11 -16%
0.06 0.05 ·16%
0.13 0.11 ,17%
0.05 0.05 -17%
0.28 0.24 -17%
0.23 0.20 -17%
0.07 0.06 -16%
0.07 0.06 -16%
« « -0.17 0.06 -65%
0.00 0.00 0%
1.19 0.92 -23%
0.25 0.18 -28%
- - -2 2 OOA. 12 12 00/0
13 13 00/0
724 1259 74%
Marginal
Farm 6
0.05 0.03 -26% 0.11
0.04 0.01 -66% 0.10
0.08 0.07 -17% 0.11
0.08 0.05 -40% 0.11
0.25 0.16 -36% 0.29
0.25 0.15 ·40% 0.28
0.04 0.04 16% 0.Q7
0.04 0.03 -16% 0.Q7
- - - -« « - -« - - -
0.83 0.55 -33% 1.15
0.14 0.09 -33% 0.24
« - - -2 1 -500/0 2
5 10 1000/0 12
6 9 500/0 13
178 805 352% 476
HA'APAJ
Emergent
Farm 7
0.12 6% 0.04
0.04 -62% 0.04
0.09 ·17% 0.08
0.05 -53% 0.08
0.26 -10% 0.26
0.21 -26% 0.26
0.06 -13% 0.04
0.06 -16% 0.04
- - -- - -- - «
0.89 -22% 0.83
0.18 -24% 0.14
- - -2 OOA. 2
12 0% 20
13 0% 12
1013 113% 128
Marginal
FarmS 0.07
0.03
0.Q7
0.05
0.19
0.15
0.04
0.03
---
0.63
0.12
-1
10
9
711
66%
-17%
-17%
-38%
-26%
-41%
16%
-16%
---
-24%
-12%
-
-50%
-50%
-25%
455%
r-<'1

12.5 Summary
Using the GP approach, the representative farm models were used to identify microeconomic supply
reactions to various policy measures. Production and consumption decisions were simultaneously
analysed, permitting an appraisal of adjustments in land use in accordance with farm household
goals. The results of this study show that the objectives of the individual smallholder farmer are
unlikely to be those of maximum output and productivity. They are more likely to want to satisfy
multiple objectives, such as producing enough for subsistence; catering for religious and social
obligations, having adequate time for leisure; earning some cash through sales; and being able to play
their appropriate roles in their society and culture. These objectives were quantified and introduced
into the models which offered more realistic solutions to the smallholder farmers in their practical
settings. Dynamic properties were included in the models through the requirements and preferences
for non-economic motives (church and social obligations), savings, and investment by different types
of households.
In the modelling experiments, three farm household types were distinguished, according to the
resource endowment and objective functions, to account for different supply responses. Comparing
the three different farm types, it was striking that progressive farmers with a higher resource capacity,
better access to markets (both domestic and export), and with a higher priority on maximising surplus
cash, would develop operating plans superior to marginal farmers. In contrast, marginal farmers were
more concerned with their survival rather than maximising cash surplus. But, given their limited
resource base, different personal goals and preferences, and the level of risk they found acceptable,
they generally would behave in a rational way.
The results of this research show that the economic behaviour and production plans of the different
categories of farmers are determined not only by the resources available, technology and the
institutional constraints, but the also by preferences and importance attached to each objective or
goal. Although the preferred plan still does not guarantee the best results, the resource-use
inefficiency could be considerably lowered while still meeting the farmers other production goals.
The solving of the GP models indicates that some goals cannot be achieved under the desired policy.
Tradeoffs therefore occur due to limited resources. The different models also allow planners to review
critically the priority structure of each farm type in view of the solutions derived by the respective
models. Indeed, the most important feature of the GP model is its flexibility, which allows simulation
under numerous variations of constraints and goal priorities.
The discussion in earlier chapters has shown that the potential of the agriculture sector to contribute to
economic development of Tonga is substantial. It is, therefore, very important that efforts are made to
make agriculture competitive, profitable and attractive for income generation. This will require
218
appropriate development strategies, and pOlicies to implement the strategies. Eight representative
models which were developed to represent the different farm categories in three main regions were
used for critical assessments of macro-economic policies. Policy experiments and analysis focussed
on major areas in which the government policies may have a major influence, including the land,
market, technology, labour and credit systems. It also included areas where Government has an
indirect influence, in particular the preferences, priorities and goals associated with different types of
farms.
Recent analysis of agricultural performance and critiques of Tongan government pOlicies toward
agriculture not only identified the constraints on agricultural production but also indicated farmers'
likely responses to policy changes. The modelled effects of different policy measures confirms that
market development instruments, improved technologies and increasing farmer motivation can have a
substantial and positive impact on farm revenue and commercial development. A change in
technology, either through improved cultivars or improved management, could have a strong impact
on the production structure, as shown by farmers being able to meet their food and cash requirements
with less land.
This result emphasises that access to markets, and having a "commercial mentality", are the prime
influencer's in farmers determining their production options. The result showed that social and church
obligations, and leisure requirements, also have significant effects on land use decisions of emergent
and marginal farm households even though these may have a negative impact on farm revenues.
Varying the weighting on these goals in favour of a cash surplus, or profit maximisation, clearly
increases the cash surplus. It was also evident in these findings that Tongan smallholder farmers are
not producing as much as they are able with their existing resources. This suggests that policies
should concentrate on improving market access and getting the prices right.
Increasing landlessness has resulted in more people being available for agricultural labour and
employment by those households with land to develop. There is evidence of a lively labour market
existing in the villages; some respondents asserted "hiring casual labour is not a constraint but having
the cash to pay them is the main problem". Nevertheless, it is important to emphasise the substantial
potential to generate employment in the smallholder agriculture sector. Given the proper incentives,
including the development of improved production systems allowing for sustained intensified
production, the agricultural sector appears to offer the best prospects of any sector in Tonga of
providing employment to match the potential growth of the workforce. For example, the successful
development of the squash industry has significantly increased demand for hired labour and increased
wage rates during the squash season.
As noted in Chapter 9, the increasing migration to urban areas in response to economic and social
pressure for education, employment and the prestige of urban living, plus a lessening attachment to
219

the traditional village lifestyle, are indicative of cultural and economic trends in Tonga. These are
expected to continue. Increasing out-migration puts more localised pressure on the land available for
cultivation, which results in more intensive use of land, reduced fallow and increasing reliance on
fertiliser to offset the nutrient depletion of soils. The problems also further impact on cropping patterns.
As some respondents in Tongatapu pointed out, "we have to change our cropping pattern, because
we no longer fallow land for yam, therefore we just rely more on taro, cassava and sweet potatoes for
our staple food'. This research recommends social policies for Government to address, including
institutional development of the outer islands, improved support services, education and off-
employment opportunities to retain locals and reduce migration. An internal immigration policy is also
an option to reduce competition for land especially in Tongatapu, which already has a high population
density (259 people per km2).
While the emphasis of this research has been on the creation and development of individual holdings,
it may be advantageous to encourage farmers' groups and co-operatives. Promotion of small farmer
organisations that vertically integrate production and marketing may strengthen income gains and
reduce income disparities among smallholder farmers. As noted in Chapter 8, farmers' groups are
currently operating, especially in Vava'u and Ha'apai, but on a basis of labour sharing ventures.
However, promotion of export growth, and collective production should be encouraged to enable
small-scale farmers to capture the benefits of large-scale marketing and persistent economies of
large-scale production. Co-operative and farmer group arrangements may also enable better access
to credit and other complementary inputs that are essential if farmers are to adopt new innovations
that will raise their productivity, output and incomes. These self-managed farmer organisations might
ultimately take the form of co-operatives, depending on the key limiting factors in the provision of
these different inputs and services in the local village community. One reason why farm organisations
are necessary is that the costs of dealing with a large number of small farmers is very high
(particularly for increased number of staff, vehicles, and other facilities and equipment). By developing
self-managed farmer organisations, farmers can buy inputs in much larger quantities at a cheaper
price, and acquire larger group loans, with lower bank service costs per farmer. Farmer organisations
are also necessary to increase the partiCipation of rural people in efforts to influence agricultural policy
and to articulate the needs and problems of the farm community to the agricultural service agencies.
Increasing export production from the agricultural sector is regarded as the key factor for the growth of
the Tongan economy. The economy urgently needs enlarged foreign exchange earnings from the
export of agricultural products. The cash income of farm households needs to be increased to
stimulate industrialisation. The increasing commercialisation of the semi-subsistence farms is an
important requirement for increasing production with a limited land area. In Tonga where markets for
land and capital are not well developed, pricing instruments appear to have limited influence on
resource allocation. Market and institutional development are therefore the required instruments. The
market for the farmer must be enlarged. At the same time, the efficiency of the marketing
220
organisations needs to be improved. Since a large proportion of the consumers of agricultural produce
is within the agricultural sector, it will be difficult to enlarge the domestic market rapidly. Increasing the
export of agricultural products will therefore be an important strategy for enlarging the market for the
subsistence farmer.
Based on the findings from this study, given appropriate types of improved technology, supportive
agricultural policies (research and extension, market, land tenure, education, etc), and appropriate
incentives, smallholder farmers can simultaneously pursue the goals of increasing national agricultural
production and securing increased rural welfare. Fleming and Hardaker (1995 pp 47) noted that the
Tongan experience with vanilla, squash and kava indicates that finding the right products to supply to
the right markets is not easy. But, if it can be done, the rewards can be great. However, the
sustainability performance of the agricultural sector depends on both how long the niche markets for
these crops remain open and profitable for Tongan farmers and the success of efforts to diversify
agricultural products and exports to other markets. If the momentum continues long enough, and if
sufficient new export crop opportunities are available, the loss of a single market commodity will not
be serious enough to stop the momentum for development that will have been built up. IncreaSing
commercialisation requires modification of farmers' objectives towards greater priority on profit
maximisation. It also requires improvement in the ability of semi-subsistence farmers to be able to
manage the uncertainties and risks that come with increasing commerCialisation. For new products
and new inputs to be introduced, the dissemination of new knowledge through extension needs to be
improved.
221
CHAPTER 13
CONCLUSIONS AND SCOPE FOR FURTHER RESEARCH
The final chapter is comprised of three sections. The first section treats the overall approach and
empirical results of the study. In the second section, study conclusions are made as to the overall
value of the study. Consideration is also given to the implementation of the goal programming
approach to develop models representillg the different farm types within village situations for the
assessment of different policies under a range of farming conditions. The final section is devoted to
providing suggestions for further research along the lines followed in this study.
13.1 Summary
At the very beginning (Chapter 1), this study set out a theme of trying to gain some insight into the
farm-level production decision making of Tongan smallholder farmers. While the prime objective of
this study was to develop a farm-level production model to assist policy analysis, a secondary, but
parallel objective, was to analyse and describe aspects of smallholder farmer decision making
behaviour in Tonga. In particular, the goals and priorities they have, the production and consumption
behaviour, and the significance of social and cultural values on smallholder farm production decisions.
The major problem facing policy analysts and development planners is a lack of a reliable model and
framework that adequately portrays the productive behaviour of the Tongan farmers which can be
used for effects and impact assessment interventions. This has been identified by previous
researchers (Hardaker, 1975; Brook, 1980; Delforce, 1990) due to a variety of factors influencing the
economic decisions of smallholder farmers. The approach adopted was to understand the broad,
strategiC aspects of decision-making and the behaviour of farmers rather than to focus on specific
farming decision scenarios. Accordingly, the present study was designed to provide an integrated
approach to studying smallholder farmer behaviour. The smallholder farmers' behaviour must be
examined in relation to the set of circumstances within which they operate. In this respect the
analyses described in Part 2 provide some useful insights into aspects of farmer behaviour and the
Tongan agricultural system. Such inSights include the identification of goals and priorities, resources
available and use, institutional and economic factors, and social cultural factors that impinge on
production decisions and operating plans of different smallholder farm types.
222
The system analysis revealed that Tongan smallholder farmers operate in a complex environment
characterised with severe resource and other constraints to achieve conflicting multiple goals.
Agricultural production does not follow a regular pattern in Tonga; most farmers do not specialise, in
the sense of devoting all their time to either cash cropping or subsistence farming; most do a little of
both. Subsistence crops are intercropped with cash crops, and both can enter the market according to
the seasonality of the money needs of the households. The motivation to plant is determined by the
need to provide the family with adequate food, but is also strongly influenced by the necessity to meet
church, social and communal responsibilities and obligations. In other words, the motivation behind
economic decisions is not purely economic; many short and long-term, everyday decisions are made
by reference to their effects on the network of social relationships regulating village life.
With respect to the modelling objective, it would appear that much of the potential value attributed to
farm-level production models as described in Chapter 2 has been realised. The mathematical
representation of the decision-making processes was based on the conceptual framework of the
factors and the complex relationships thought to influence a Tongan smallholder's allocation of
resources in agricultural production. Goal Programming (GP) offered a number of appealing features
to handle complexities of the system and appears to be well suited to the problem. The model is
consistent not only with the physical view of the farm but also with the way it behaves, or reacts to
stimuli and changes over time with respect to agricultural development policies. The model has
incorporated some of the complex features of smallholder farming system such as the existing mix of
enterprises (and alternatives to them) and the way these enterprises compete for the use of the
limited resources available. Goal programming was chosen as the analytical tool since there is no
attempt to optimise the system's behaviour to schedule events in the most economically efficient way;
contrast the assumption is that the farmers attempt to satisfy a multiplicity of goals and other
requirements, a more realistic assumption of the circumstances.
What the model is designed to do is, in effect, to ask the same questions of a farm plan as the farmer
is considering. From the answers, the model deduces whether the farm plan would be workable to the
farmer, that is, whether he would be able to generate sufficient resources to satisfy the goals given the
constraints under which he farms and the level of technology available to him. The farm plan is taken
to cover a year - from May to April - to coincide with the major planting season beginning in April.
Conceptually the model has three main parts (i) Production objectives which reflect the relationships
that determine the farmer's requirements from his farming operation; (ii) those relationships that define
his assessment of the constraints which he needs to consider in deciding upon a farm plan; (iii) those
relationships which make up his and the household personality. The personal characteristics
influencing a farmer's choice of plan are difficult to include in a mathematical model. Household
preferences of different staple foods are reflected in the amount of each required. Emergent rural
223
farmers' willingness to be self sufficient in staple food requirement and livestock needs was reflected
in the omission of purchasing staple food and the limit on buying porkers and weaners.
The models developed are detailed and flexible enough to simulate a wide range of policy scenarios
within a framework which adequately represents complex aspects of the farming systems. Also, the
flexibility and detail of the models provide the basis for representing a range of farm conditions and for
describing policy responses in terms of a number of farm performance parameters. As such the
models should provide policy makers and analysts with a useful analytical tool.
13.2 Conclusions
The results of the estimations in this research may not be of direct use by farmers, but they certainly
should provide the basis not only for guidance in general policy formulation, but more specifically for
indicating the direction and magnitude by which relevant instrumental variables need to be
manipulated or introduced to achieve some desired objectives. In addition, the model should also
furnish reasonable information on how smallholder farmers might respond to agricultural development
programs such as improved technologies and new crops. Without a better understanding of farmer
structures, goals and objectives that determine economic behaviour and motivation, the planners and
policymakers cannot fully appraise the potential of agricultural development programs on production,
farm income, and farmer welfare.
The semi-subsistence, or semi-commercialised, nature of Tongan smallholders is characterised by
being motivated primarily by many objectives that contribute to maximising family satisfaction.
Satisfaction is not only increased by the benefits of farm output, but also decreased by the cost of
sacrificing food, leisure, and money, or taking risks. Realising a profit on the sale portion of the crop is
important, but maximising profit is not always the over riding consideration in allocating land and other
resources. Increased profits increase family satisfaction to a certain extent. At some levels, profit
maximisation might be secondary to family satisfaction and enterprises and productive processes that
allow the family greater security and satisfaction might take precedence over those that are more
profitable.
A major feature of all the smallholder farmers studied, regardless of farm size, and location, was their
practice of using crop mixtures in which a number of crops were intermingled in the same field. This
practice was, therefore, examined in some detail for consistency with the major goals identified.
Exclusive subsistence production is rarely found; generally the survey results show that a certain
amount of produce (crops, livestock, handicrafts) is sold, either those surplus to family needs, or
specialised cash crops such as vanilla, squash and coffee.
224
The strong farm-household relation may not indicate that farmers lack economic motivation. In fact the
results of this study shows that some farmers are responsive to prices. Similarly, the farmer's choice
to produce traditional or subsistence crops that are less profitable than cash crops does not
necessarily reflect indifference to economic returns. Farming is inherently risky because the individual
farmer has no control over his physical and economic environment. The farmer tries to reduce his
risks by judicious selection of enterprises, by crop diversification, and by spreading production over
the growing season.
A majority of farmers in Tonga are risk avoiders, which means that they will choose less risky activities
even though they may not be the most profitable on average over a period of years. Growing
traditional crops for home consumption as well as cash crops may provide protection against various
risks. Many farmers could maximise their average profits by growing only cash crops, but they
maximise their satisfaction by avoiding risks.
The question arises as to the potential for adapting the GP model to the three different farm types and
different geographical regions. The study revealed little variation amongst the 3 main categories in
terms of farm structure, crop composition, which was dominated by root crops, in all regions. The
main variation was in the cash crops types. For example, vanilla and kava are dominant cash crops in
the Vava'u models but not in Ha'apai and Tongatapu models. Therefore, the model was designed as
a blueprint model so that considerable flexibility is possible through variation in input data of crop
composition and respective areas without a need for structural changes.
This study assessed some agricultural policy options as Tonga requires estimates of the likely
responses by different types of smallholder farmers, and an appraisal of the impact on the farm
household of the proposed measures. These judgements require a goal understanding of the nature
of agricultural farming systems, including the characteristics and behaviour of different types of
agricultural production units. These are typically smallholdings supporting complex systems of mixed
crop and livestock production. These farming systems are managed by farm households who must
cope with a range of uncertain factors, including market prices, weather, pest and diseases, and
government poliCies. This improved understanding can improve the diagnosis of agricultural
development programs and, ex ante, assessments of the likely responses to, and impacts of,
alternative agricultural policies and programs. Through experimentation with the Tongan household
agricultural system, it should be possible to design packages of policies and practices tailored to the
economic behaviour of Tongan smallholder farmers.
225
13.3 Implications for Further Research
The final section is devoted to the discussion of the limitations of this research and suggestions for
number of lines which the present modelling approach in this study could be refined, and extended
further in future research.
In the process of the study major areas of data deficiency became apparent. The empirical results of
this study should be interpreted with some caution considering the following limitations. One is the
meagreness and the quality of the production data. A major problem identified during the survey is
that every farmer surveyed did not keep farm records, therefore data for expenditure, income and
output were based on what they could recall and estimate during the time of survey. An important
implication for MAF extension and research activities is to encourage farmers to keep farm records so
that accurate and reliable data will become available for further research.
The second is the simplification and implicit restrictions entailed in the models. For example, in activity
budget estimations, we have to assume that the prices are exogenous and somehow can be
observed from input markets with everybody paying the same price. But in the real world, at least in
the study area, the markets are not well established and the costs are not easy to evaluate. For
example, for labour, some farmers might obtain labour from specific customary arrangements so that
it is not clear what the real cost is. Another example is the marketing cost of produce has been set at
an estimated figure as much of the packaging is currently made in the household - what is its true
opportunity cost? This needs researching.
It is important, also, not to overlook the limitations associated with this type of model. In addition, there
is the aggregation problem which must be considered when using the representative models for a
general specification of Tongan smallholder farming systems. Another restrictive assumption made
was to assume that the level of technology for each enterprise was constant among the three main
island groups and in the three main farm types. In reality, there are variations in terms of soil types
and the technology used. If the model is to draw conclusions about the behaviour of a group of farms,
then analysts should be aware of the potential for aggregation bias. Further research is required to
elucidate these factors and so obtain better forecasts for the whole of Tonga.
As discussed in Chapter 7, livestock is a major component of the farming system and has a significant
impact on the economy. The unique examination of village cattle, chicken, and pig production in
Tonga should seek to determine the potential for increased livestock production in view of the
increasing demand for meat in Tonga. However, reliable farm data and gross margin analysis
information was not available, therefore other livestock were not fully explored. The scope could be
broadened to focus on crop-livestock interrelationships in the smallholder production system. This
226
would be rewarding in view of the high importation of meat products, and the apparent potential to
substitute imports.
Cattle provide draft power and manure as well as meat while controlling weeds on fallow land by
feeding on grass and other edible plants. Pigs and chickens in contrast are found to be competitive in
resource use with human food crops. Further study to analyse these relationships should provide
unique insights into specific constraints controlling livestock reproduction and growth under traditional
farming systems.
The model should explore more with livestock SUbsystems, based on a small scale tethered cattle
module, which may make better use of surplus family labour and the fallow land. The outputs will not
only be milk, sold for cash, but also include manure to improve soil fertility. Similarly, the model can
also be extended further to include more interaction from the pigs in which the system allows a
manure contribution to soil fertility for crop production. However, this can only be achieved through
providing sufficient economic and technical information on small scale livestock production from
further MAF research. Effective policy simulations at the farm level do need appropriate and reliable
farming systems database.
Another limitation of this study was the time horizon of the models, which was reflected in a one-year
time span and encompassed a balanced production plan, whereas the comparison data was for a
specific year which may not have reflected a balanced average year system. The model should be
extended to a multi-period model, which looks at the generation of a long run production, and the
yearly trend could there be more useful. A recursive programming model (Hazel and Norton, 1986)
where several decision-making periods are executed one after another with the results of the previous
decisions affecting the current resource endowments is a conceptually appealing approach. With the
time and data constraints the approach of conceptually incorporating the recursive aspects and what
data to use to develop empirical model was beyond the scope of this research. However, it is an
important area for future research provide appropriate time series of data could be established.
227
REFERENCES
'Akolo, L. (1997). Improving the Environment for Private Sector Development in Tonga. Vol. 2: Main Report. Central Planning Department, Nuku'alofa, Tonga.
Amir, L.; Puesch, J. and Granier, J. (1991). ISFARM: An integrated system for farm management: Part 1 Methodology. Agricultural Systems, 35: 455-469.
Anderson, J.R. (1974). Simulation: methodology and application in agricultural economics. Review of Marketing and Agricultural Economics, 42 (1): 3-55.
Anderson, J.R. and Dent, J.B. (1972). Systems simulation and agricultural research. Journal of the Australian Institute of Agricultural Science, 36 (4): 264-269.
Anderson, J.R.; Dillon, J.L. and Hardaker, B.J. (1977). Agricultural Decision Analysis. Iowa State University Press. Ames.
Anderson, D.R.; Sweeney, D.J. and Williams, T.A. (Ed). (1991). An Introduction to Management Science: quantitative approach to decision making (6th ed.), 15: 651-652. West Publishing Company, Los Angeles.
Ashby, A.W. (1926). Human motives in farming. Welsh Journal of Agriculture, 2 (1): 5.
AGRICO, (1995). Tonga Agriculture Development Project - Feasibility Study, Vol. 2: Asian Development Bank TA TON 1970-TON. Working Papers.
Asian Development Bank, (1995). Tonga Agriculture Development Project - Main Report, Asian Development Bank TA TON 1970-TON. AGRICO I\lew Zealand.
Asian Development Bank, (1996). Sociocultural Issues and Economic Development in the Pacific Islands. Pacific Studies Series. Asian Development Bank, Manilla, Phillipines.
Astroth, J.H. (1990). Understanding Peasant Agriculture: An integrated land-use model for the Punjab. University of Chicago, Geography Research paper No. 223 Chicago, Illinois.
Austin, E.J.; Willock, J.; Dreary, I.J.; Gibson, G.J.; Dent, J.B.; Edward-Jones, G.; Morgan, 0.; Grieve, R. and Sutherland, A. (1998). Economic models of farmer behaviour using psychological, social and economic variables. Part 1: Linear Modelling. Agricultural Systems, 58 (2): 203-234.
Barnard, C.S. and Nix, J.S. (1973). Farm Planning and Control. Cambridge University Press.
Barnett, D.; Brian, B. and McCarl, BA (1982). Goal programming via mUlti-dimensional scaling applied to Senegalese subsistence farms. American Journal of Agricultural Economics, 64 (4): 720-727.
Barry, P.J. (Ed). (1984). Risk Management in Agriculture. The Iowa State University Press, Iowa.
Beets, W.C. (1990). Raising and Sustaining Productivity of Smallholder Farming System in the Tropics. Handbook of Sustainable Agricultural Development. AgBe Publishing, Alkemaar Holland.
228
Beneke, R.R. and Winterboer, R. (1973). Linear Programming Applications to Agriculture, Iowa State, University Press, AMES.
Bollard, AE. (1977). Design and Evaluation of Projects with variable Labour Response: Case Study of Agricultural Aid on Atiu, PhD Thesis, Department of Economics, Auckland University, New Zealand.
Brook, BA (1980). An Information System for Planning Agricultural Development in the Kingdom of Tonga. MAgr Com Thesis, University of Canterbury, New Zealand.
Buchanan, J.T. (1985). Solution Methods for Multiple Objective Decision Models. PhD Thesis, University of Canterbury, New Zealand.
Capillon, A. (1986). A Classification of Farming Systems, Preliminary to an Extension Program. ill: International Symposium on farming Systems Research and Extension, Kansas State University.
Cas ley, D.J. and Kumar, K. (1988). The Collection, Analysis, and Use of Monitoring and Evaluation Data. Johns Hopkins University Press, Baltimore, Md., U.S.A.
Central Planning Department, (1991). Kingdom of Tonga Sixth Development Plan, Nuku'alofa, Tonga.
Cessford, M. (1989). Final Report of the Tonga Banana Export Scheme. Report prepared for the Development Assistance Division, Ministry of External Relations and Trade, Wellington.
Chambers, R. (1983). Rural Development: Putting the Last First. Harlow, Longman.
Chambers, R.; Pacey, A and Thrupp, L.A. (1989). Farmer First: Farmer Innovation and Agricultural Research. Intermediate Technology Publications, London.
Champ, 8.; Highley, E. and Remenyl, J. (1987). Technological Change in PosthaNest Handling of Grains in the Humid Tropics. ACIAR, Canberra. Australia.
Chandra, S. and Hewson, R. (1991). Agriculture Projects Review. AIDAB Evaluation Series No. 11. Australian International Development Assistance Bureau. Canberra.
Charnes, A and Cooper, W.W. (1961). Management Model and Industrial Application of Linear Programming. Vol. 1 : New York. John Wiley & Sons, 1961.
Charnes, A and Cooper, W.w. (1977). Goal programming and multiple objective optimisation Part 1. European Journal of Operational Research, 1: 39-54.
Civil Aviation Department, (1997). Annual Report. Nuku'alofa, Tonga.
Cochrane, J.L. and Zeleny, M. (1973). Multiple Criteria Decision Making. University of South Carolina Press, Columbia.
Cohan, J.L. (1978). Mulfiobjective Programming and Planning. London: Academic Press.
229

Cole, R.V. (1993). Donor Financing of Development: General Trends and Issues. In: "Development Planning in Small Island Nations of the Pacific", United Nation Centre for Regional Development, Nagoya, Japan.
Collinson, M.P.; Finney, C. E.; Low, A.R.C.; Zuckerman, P.S.; Casey, H. and Upton, M. (1974). Planning of agriculture in low-income countries. University of Reading, Department of Agricultural Economics. Development Study 14.
Conell, J. (1980). Remittances and Rural Development: Migration, Dependency and Inequality in the South Pacific. Occasional Paper No. 22, Development Studies Centre, Australian National University.
Costa, F.P. and Rehman, T. (1999). Exploring the link between farmers' objectives and the phenomenon of pasture degradation in the beef production systems of Central Brazil. Agricultural Systems,61 (1999): 135-146.
Crocombe, R. (1975). Land Tenure in Tonga, In: Tonga Council of Churches, Land and Migration. Tonga. pp 3 - 59.
Crocombe, R. and Meleisea, M. (1994). Land Issues in the Pacific. Macmillan Brown Centre for Pacific Studies, Canterbury University and Institute of Pacific Studies, University of the South Pacific.
Crosson, P. (1985). Agricultural land: a question of Values. Agriculture and Human Values. Fall 1985.
Dams, T. and Hunt, K.E. (1977). Decision-Making and Agriculture. Papers and Reports on 16th
International Conference of Agricultural Economists, 1976 in Nairobi, Kenya. Oxford Agricultural Economic Institute.
Dashfield, P.B. (1980). The Role of Foreign Aid in Third World Development. Lincoln College, Canterbury, New Zealand.
Dasgupta, S. (1989). Diffusion of Agricultural innovations in Village India. New Delhi, Wiley Eastern Limited.
Delforce, J. (1990). Smallholder Agriculture in the Kingdom of Tonga: A farm household analysis. Thesis, PhD, University of New England, Armidale, N.S.W.
Delforce, J. and Hardaker, J.B. (1985). An experiment in multiattribute utility theory. Australian Joumal of Agricultural Economics. 29: 179-198.
Dent, J.B. (1991). The potential for systems simulation in farming systems research? in: Penning de Vries, F., Teng, P. and Metselaar, K. (Ed). Systems Approaches for Agricultural Development, Proceedings of an international Symposium held at the Asian Institute of Technology, Thailand,2 - 6 December. Kluwer Academic, Dordrecht, pp. 325-340.
Dent, J.B. and Blackie, M.J. (1979). Systems Simulation in Agriculture. London, Applied Science Publishers.
Dent, J.B. and Jones, J.w. (1993). Multiple Criteria Analysis in Agricultural Systems. Agricultural Systems, 41: 3.
230
Dent. J.B. and McGregor, M.J. (1994). Rural and Farming Systems Analysis. Cab International. Edinburgh.
Dent. J.B.; Harrison, S.R. and Woodford. K.B. (1986). Farm Planning with Linear Programming: Concept and Practice, Butterworths, Sydney.
De Wilde, J. (1967). Agricultural Development in Tropical Africa. Vol. 1: John Hopkins University Press, Baltimore.
Dia, M. (1991). Development and Cultural Values in Sub-Saharan Africa. Finance and Development, December 1991: 10-13.
Dillon, J.l. and Anderson, J.R. (1971). Allocative efficiency, traditional agriculture, and risk. American Journal of Agricultural Economics, 53: 26-32.
Dillon, J.L. and Hardaker. J.B. (1993). Farm Management Research for Small Farmer Development. Farm Systems Management Series 6. FAO, Rome, Italy.
Dixon, J.M.; Hall, M.; Hardaker, J.B. and Vyas, V.S. (1994). Farm and Community Information Use for Agricultural Programmes and Policies. FAO Farm Systems Management Series 8. Rome, Italy.
Dobbins. C. (1978). The Inter generational Transfer of the Farm Firm: A recursive Goal Programming Analysis. PhD Thesis, Olkahoma State University, 1978.
Doorman. F. (1991). A framework for the rapid appraisal of factors that influence adoption and impact of new agricultural technology. Human Organisation, 50 (3): 1991.
Doyle, C.J.; Baars, J.A. and Bywater, A.C. (1989). A simulation model of bull beef production under rotational grazing in the Waikato region of New Zealand. Agricultural System, 31: 247-278.
Ducker, R. (1994). Decides on Customary Use. An Analysis of Conflicting Values in Customary Use Decision-Making. MSc Thesis, Centre for Resource Management, Lincoln University.
Duff, S.N.; Stonehouse, D.P.; Hilts, S.G. and Blackburn, D.J. (1991). Soil conservation behaviour and attitudes among Ontario farmers towards alternative government policy responses. Journal of Soil and Water Conservation, 46 (3): 215.
Easton, A. (1973). Complex Managerial Decisions Involving Multiple Objectives, Wiley, New York.
Ellis, F. (1988). Peasant Economics: Farm households and Agrarian Development. Cambridge University Press. New York.
Evans, M. (1996). Gifts and Commodities on a Tongan Atoll: Understanding Intention and Action in a MIRAB Economy. PhD Thesis, McMaster University, Hamilton, Ontario.
Fa'anunu, H.O. (1985). The economics of export vanilla production in Tonga. Unpublished paper, Ministry of Agriculture, Fisheries and Forestry, Tonga.
231
Fairweather, J.R. and Campbell, H. (1996). The Decision Making of Organic and Conventional Agricultural Producers. Research Report No. 233, June 1996. Agribusiness and Economics Research Unit, Lincoln University, Canterbury, New Zealand.
Fairweather, J.R. and Keating, N.C. (1994). Goals and Management Styles of New Zealand farmers. Agricultural Systems, 44: 181-200.
Fakava, V.T. and Pole, F.S. (1994). Food and Cash Crop Development Programme for Vava'u Integrated Development Programme, Policy and Planning Division, Ministry of Agriculture and Forestry, TONGA.
FAa, (1989). Farming Systems Development: concept, methods, and application. Rome, Italy.
Felemi. I.M. (1991). Abstract only. Estimation of National parameters for project appraisal and evaluation in Tonga. Occasional paper No. 15, South Pacific Smallholder Project, Australia. University of New England Press.
Featherstone, A. M. and Goodwin, B. K. (1993). Factors Influencing a Farmer's Decision to Invest in Long Term Conservation Improvements. Land Economics, 69 (1): 67-81.
Feder, G.; Just, R.E. and Zilberman, D. (1985). Adoption of Agricultural Innovations in Developing Countries: A survey. Economic Development and Cultural Change, 33: 225-298.
Ferrero diRoccaferrera, G.M. (1973). Behavioural Aspects of Decision-Making Under Multiple Goals. In: Cochrane and Zeleny (1973). Multiple Criteria Decision Making. University of South Carolina Press, Columbia. pp. 635-646.
Fleming, E.M. and Hardaker, J.B. (1995). Pacific 2010: Strategies for Polynesian Agricultural Development. Pacific Policy Papers, 15. National Centre for Development Studying. Australian National University, Canberra.
Flinn, J.C.; Jayasuriya, S. and Knight, C.G. (1980). Incorporating Multi-objectives in Planning Models of Low Resources Farmers. Australian Journal of Agricultural Economics, 24 (4): 34-45.
Foltz, J.C.; Lee, J.G.; Martin, M.A. and Preckel, P.V. (1995). Multiattribute assessment of alternative cropping systems. American Journal of Agricultural Economics, 77: 408-420.
Fukofuka, V. (1994). New Directions in Land Development Policies in Tonga. In: Land Issues in the Pacific, Crocombe and Meleisea, (1994) Chapter 14.
Gasson, R. (1973). Goals and Values of Farmers. Journal of Agricultural Economics, 24: 521-537.
Gasson, R. and Errington, A. (1993). The Farm Family Business. Wallingford, CAB.
Gaul, P. (1993). Difficulties in applying cost benefit analysis to social factors in development projects. A project submitted for MGMT611. Farm Management Department, Lincoln University.
Ghadim, A.A.; Kingwell, R.S. and Pannell, D.J. (1991). An economic evaluation of deep tillage to reduce soil compaction on crop-livestock farms in Western Australia. Agricultural Systems, 37: 291-307.
Gibbon, D. (1994). Farming Systems Research/extension: Background Concepts, Experience and Networking. 1.0: Rural and Farming Systems Analysis, ed. J. B.Dent and M.J. McGregor, pp. 3-18. Cab International, Edinburgh.
Gillmor, DA (1986). Behavioural Studies in Agricultural; Goals, Values and Enterprise Choice. Irish Journal of Agricultural Economics and Rural Sociology, 11: 19-33.
Gladwin, C.H. (1977). A Model of Farmers' Decision to Adopt the Recommendations of Plan Puebla. PhD Thesis. Stanford University.
Greer, J.P. (1982). Motivation and Other Factors Influence the Adoption of Practices by Sheep Farmers in Oxford County, New Zealand. Thesis, MAgrSc, Lincoln University.
Gyles. A.; Hardaker, J.B. and Verspay, H.M.H. (Ed). (1989). Farm Management Handbook for Tonga. (2nd ed.) Technical Bulletin No. 8. Ministry of Agriculture and Forestry. Smallholder Project. University of New England, Armidale.
Halavatau. S.M. and Asghar. M. (1989). Land Use and Conservation Farming in Tonga. Alafua Agricultural Bulletin, 14 (3): 41-47. University of the South Pacific, Western Samoa.
Halter, A.N. and Dean, GW. (1971). Decisions Under Uncertainty. Cincinnati: South-Western Publishing Co.
Hardaker, J.B. (1975). Agriculture and development in the Kingdom of Tonga. Thesis, PhD, University of New England, Armidale, N.S.W.
Hardaker, J.B.; Delforce, J.C.; Fleming, E.M. and Sefanaia, S. (1988). Smallholder Agriculture in Tonga: Report of the South Pacific Smallholder Project in Tonga 1984-85, South Pacific Smallholder Project, University of New England.
Harman, W. L.; Hatch, R. E.; Eidman, V. R. and Claypool, P.L. (1972). An Evaluation of Factors affecting the Hierarchy of Multiple Goals, Technical Bulletin T-134, Olkahoma Agricultural Experimentation Station.
Harrison, E.F. (Ed). (1987). The Managerial Decision-Making Process. (3rd ed.), San Francisco State University.
Hau'ofa, E. and Ward, R.G. (1980). The Social Context. In South Pacific Agriculture Choices and Constraints by Ward, A.G. and Proctor, A. (1980). pp. 49-71.
Hazell, P.B. (1982). Application of Risk Preference Estimates in Firm-Household and Agricultural Sector Models. American Journal of Agricultural Economics, 64: 384-390.
Hazell, P.B. and Norton, R.D. (1986). Mathematical Programming for Economic Analysis in Agriculture. New York: McMillan.
Hearth, H.M.G. (1981). An Empirical Evaluation of Multiattribute Utility Theory in Peasant Agriculture. Oxford Agrarian Studies, 10: 240-254.
Hollander, A.D. (1986). Values and Making Decisions about Agricultural Research. Agriculture and Human Values, Summer 1986.
233

Hopper, W.O. (1965). Allocative Efficiency in a Traditional Indian Agriculture. Journal of Farm Economics, 47: 611- 624.
Hwang, C.L.; Paidy, S.R.; Yonn, K. and Maud, AS.M. (1980). Mathematical Programming with Multiple Objectives: A Tutorial, Computer and Operation Research, 7: 5-31.
James, K. (1995). Right and Privileges in Tongan Land Tenure In: Ward, G.R and Kingdon, E. (1995) Land, Custom and Practices in the South Pacific, 5: 157-198.
Igni.<;io, J.P. (1976). Goal programming and Extensions. Lexington Books, Massachusetts.
Ignizio, J.E. (1983). Generalized Goal Programming: An Overview. Computers and Operation Research. 10 (4): 277-289.
Ijeri, Y. (1965). Management Goals and Accounting for Control, Rand McNally, Chicago.
Jolly, J.J. (1988). Technology Transfer Institutions, Models, and Impacts on Agriculture and Rural Life in the Developing World. Agriculture and Human Values. Winter-Spring 1988.
Keeney, R.L. and Raiffa, H. (1976). Decisions with Multiple Objectives: Preferences and Value Trade-offs. John Wiley & Sons, New York.
Kingdom of Tonga, (1991). National Report to the United Nations Conference on Environment and Development. May, Nuku'alofa.
Lacy, W.B. (1996). Research, Extension, and User Partnerships: Models for Collaboration and Strategies for Change. Agriculture and Human Values, Spring 13 (2).
Lavulo, P. (1988). Development Objectives and Strategies in Tonga. In: Smallholder Agriculture Development in Tonga: ACIAR Proceedings No. 24. ed, Menz, K.M., p16-19.
Lee, S.M. (1972). Goal Programming for Decision Analysis. Auerback Publishers, Philadelphia.
Lee, D.J.; Tipton, T. and Leung, P. (1994). Modelling Cropping Decisions in a Rural Developing Country; a Multiple -Objective Programming Approach. Agricultural Systems, 49 (1995): 101-111.
Leys, WAR. (1962). The Value Framework of Decision-Making. In: Concepts and Issues in Administrative Behaviour, ed. Sidney Mailick and Edward H. Van Ness. Englewood Cliffs, N. J. Prentice Hall. pp. 81-83.
Lincoln International Ltd, (1993). Tonga: Review of Operations of Ministry of Agriculture and Forestry. Nuku'alofa, Tonga.
Linder, R.K. (1987). Adoption and Diffusion of Technology: An Overview. In: Champ, B., Highley, E. and Remenyl, J. (eds) Technological Change in Postharvest Handling of Grains in the Humid Tropics. ACIAR, Canberra, pp. 144-151.
Lindo, (1997). Lindo User Manual: the optimisation standard. Lindo Systems Inc, Chicago, Illinois.
234

Lopez-Tirado, Q. and Jones, J.G.W. (1991). A Simulation Model to Assess Primary Production and Use of Bouteloa gracillis grasslands. Part 1. Model Structure and Validation. Agricultural Systems. 35: 189-208.
Low, A.R.C. (1974). Decision Making under Uncertainty: A Linear Programming Model ot Peasant Farmer Behaviour. Journal of Agricultural Economics, 20: 269-278.
Lynne, G.D.; Shonkwiler, J.S. and Rola, L.R. (1988). Attitudes and farmer conservation behaviour. American Journal of Agricultural Economics, 70 (1): 12-19.
MacCrimmon, K.R. (1973). An Overview ot Multiple Objective Decision Making, In: Cochrane and Zeleny (1973). Multiple Criteria Decision Making. University of South Carolina Press, Columbia. pp.18-47.
MAF, (1993). Annual Report, 1992, Quarantine and Quality Management Division (QQMD). Ministry of Agriculture and Forestry, Nuku'alofa, Tonga.
MAF, (1994a). The 1985-1993 Compendium of Agricultural and Forestry Statistics, Ministry of Agriculture and Forestry, Nuku'alofa, Tonga.
MAF, (1994b). Land Use and Crops Survey 1993, Vo1.1: Main Report. Ministry of Agriculture and Forestry, Nuku'alofa, Tonga.
MAF, (1994c). Vava'u Integrated Agriculture and Forestry Development Programme: 1994-2000. Vol. 1: Main Programme Document. Ministry of Agriculture and Forestry, Nuku'alofa, Tonga.
MAF, (1995). Strategic Plan for the Ministry of Agriculture and Forestry, Planning Division of MAF, Ministry of Agriculture and Forestry, Nuku'alofa, Tonga.
MAF, (1996a). Annual Report 1996. Ministry of Agriculture and Forestry, Nuku'alofa, Tonga.
MAF, (1996b). Talamahu Market Report for 1996. Ministry of Agriculture and Forestry, Nuku'alofa, Tonga.
MAF, (1997). Annual Report 1997. Ministry of Agriculture and Forestry, Nuku'alofa, Tonga.
MAF, (1998). Annual Report 1998. Ministry of Agriculture and Forestry, Nuku'alofa, Tonga.
Mailick, S. and Ness, E.H.Van (1962). Concepts and Issues in Administrative Behaviour,. Englewood Cliffs, N. J. Prentice Hall.
Maino, M.; Berdegue, J. and Rivas, T. (1993). Multiple Objective Programming - An Application for Analysis and Evaluation of Peasant Economy of the viiith Region of Chile. Agricultural Systems, 41: 387-397.
Mapp, H.P.Jr.; Hardin, ML; Walker, OL and Persuad, T. (1979). Analysis of Risk Management Strategies for Agricultural Producers. American Journal of Agricultural Economics. 61: 1071-1077.
235

Marglin, JA (1967). Public Investment Criteria. The Massachusetts Institute of Technology, Cambridge.
Maude, A (1965). Population, Land and Livelihood in Tonga, PhD Thesis, Australian National University.
McGregor, M.; Willock, J.; Dent, B.; Deary, I.; Sutherland, A; Gibson, G.; Morgan, O. and Grieve, B. (1996). Links between Physiological Factors and Farmer Decision Making. Farm Management, 9 (5) Spring 1996.
McRae, AF. (1993). As Applied Agricultural Scientists We Serve? The Proceedings of the New Zealand Society of Animal Production, 53: 107-110.
Menz, K. M. (1988). Smallholder agriculture development in Tonga: proceedings of a workshop held at the Institute of Rural Development, University of the South Pacific, Nuku'alofa, Tonga. 12-13 May 1988, ACIAR Proceedings No. 24.
Ministry of Finance, (1996). Budget Statement for the year ending 30 June 1996. Government of Tonga, Nuku'alofa.
Ministry of Finance, (1998). Budget Statement for the year ending 30 June 1998. Government of Tonga, Nuku'alofa.
Mitchell, M. (1985). Agriculture and Policy: Methodology for the Analysis of Developing Country Agricultural Sectors. Ithaca Press, London.
Nair, SK (1995). Modelling Strategic Investment Decisions Under Sequential Technological Change. Management Science, 41 (2), February 1995.
National Reserve Bank of Tonga, (1995). Economic and Financial Outlook, Occasional Paper NO.2.
National Reserve Bank of Tonga, (1996). Quarterly Bulletin. March, Vol. 7: No.1.
National Reserve Bank of Tonga, (1997). Economic and Financial Outlook, Quarterly Bulletin. Occasional Paper No.4.
Needs, AP. (1988). New Zealand Aid and the Development of Class in Tonga: An Analysis of the Banana Rehabilitation Scheme. MA Thesis, Department of Sociology, Massey University, New Zealand.
Norman, D.W. (1974). Rationalising Mixed Cropping under Indigenous Conditions: the example of Northern Nigeria. Journal of Development Studies, 11 :3-21.
Norman, D.W. (1982). The Farming Systems Approach to Research, Farming System Research Paper No.3, Manhattan, Kansas State University.
Nowak, P.J. (1987). The Adoption of Agricultural Conservation Technologies: Economic and Diffusion Explanations. Rural Sociology, 52 (2): 208-220.
NuthaJl, P.l. (1996). An Introduction to the Economic Analysis of Farming Systems. Lecture Notes for MGMT 604, Lincoln University.
236
Odulaja, A. and Kiros, F.G. (1996). Modelling agricultural production of small-scale farmers in sub-Saharan Africa: A case study in Western Kenya. Agricultural Economics, 14 (1996): 85-91.
Ofstad, H. (1961). An Inquiry into the Freedom of Decision. Oslo, Norwegian University Press.
Papy, F. (1994). Working knowledge concerning technical systems and decision support. In: Rural and Farming Systems Analysis, ed. J.B.Dent and M.J. McGregor, pp. 222-235. Cab International, Edinburgh.
Parker, W.J. and Townsley, R.J. (1995). The Disciplines of Farm Management in New Zealand: Future Directions? Paper presented to the New Zealand Agricultural Economics Society Conference, Blenheim, 30 June - 1 July. AERU Discussion Paper No. 142, Lincoln University.
Patrick, G.F. and Blake, B.F. (1980). Measurement and Modelling of Farmers' Goals: An Evaluation and Suggestions. Southern Journal of Agricultural Economics, July 1980 (1): 199-204.
Patrick, G.F. and Eisgruber, LM. (1968). The Impact Measurement and Modelling of Farmers' goals: An Evaluation and Suggestions. Southem Joumal of Agricultural Economics, July 1980 12: (1) 119- 204.
Patrick, G.F. and Kliebenstein, .. I.B. (1980). Multiple Goals in Farm Firm Decision-Making: A Social Science Perspective. Station Bulletin No. 306, Department of Agricultural Economics, Purdue University, West Lafayette, Indiana.
Patrick. G.R.; Wilson, P.N.; Barry, P.J.; Boggess, W.G. and Young, DL (1985). Risk Perceptions and Management Responses: Producer-Generated Hypotheses for Risk Modeling. S. J. Agr. Econ, 17: 231-238.
Penning de Vries, F.; Teng, P. and Metselaar, K. (1991). Systems Approaches for Agricultural Development, Proceedings of an International Symposium held at the Asian Institute of Technology, Thailand, 2 - 6 December. Kluwer Academic, Dordrecht.
Peters, G.H.; Stanton, B.F. and Tyler, G.S. (1992). Sustainable Agricultural Development: The Role of International Cooperation. Proceedings of the Twenty-First International Conference of Agricultural Economists, Tokyo, Japan 22 - 29 August 1991. University of Oxford, Dartmouth.
Phelan, J. (1994). Objectives and Attitudes of Farm Households in the Republic of Ireland. In: Dent, J. B. and McGregor M. J. (1994). Rural and Farming Systems Analysis - European Perspective. CAB International. pp 106-116.
Piech, B. and Rehman, T. (1993). Application of Multiple Criteria Decision-Making Methods to Farm Planning: A Case Study. (1993) Agricultural Systems, 41: 305-319.
Reid, J.I.; McRae, A.F. and Brazendale, B. (1993). Farmer First Research: A review of Phase One Results in Relation to Farmers' Willingness and Ability to Change. Proceedings of the New Zealand Grassland Association, 55: 17-21.
Rehman, T. and Romero, C. (1993). The Application of the MCDM Paradigm to the Management of Agricultural Systems: Some Basic Considerations. (1993) Agricultural Systems, 41: 239-255.
Rogers, E.M. (1983). Diffusion of Innovations, New York: The Free Press
237

Rogers, E.M. and Shoemaker, F.F. (1971). Communications of Innovations: A Cross-cultural Approach. New York: The Free Press.
Romero, C. (1991). Handbook of Critical Issues in Goal Programming, University of Cordoba, Spain. Pergamon Press.
Romero, C. and Rehman, T. (1983). Goal Programming via Multidimensional Scaling applied to Senegalese Subsistence Farming: Comment. American Joumal of Agricultural Economics, 65: 829-831.
Romero, C. and Rehman, T. (1985). Goal Programming and Multiple Criteria Decision Making in Farm Planning: Some Extensions. Journal of Agricultural Economics, 36: 171-185.
Romero, C. and Rehman, T. (1989). Multiple Criteria Analysis for Agricultural Decisions. Elsevier, Amsterdam.
Romero, C.; Amador, F. and Barco, A. (1987). Multiple Objectives in Agricultural Planning: A Compromise Programming Application. American Journal of Agricultural Economics. 69 (1): 78· 86.
Roumasset, JA (1976). Rice and Risk: Decision Making Among Low-Income Farmers, Amsterdam: North-Holland Publishing Co.
Roumasset, J.A.; Boussard, J.M. and Singh, I. (Ed). (1979). Risk, Uncertainty and Agricultural Development. Laguna, Phillipines: SEARCA and ADC.
Ruben, R.; Moll, H. and Kuyvenhoven, A. (1998). Integrating Agricultural Research and Policy Analysis: Analytical Framework and Policy Applications for Bio-economic Modelling. Agricultural Systems, 1998.58 (3): 331-349.
Ruhen, D. (1998). Ministry of Agriculture and Forestry Organisation Restructure 1998, Reform Proposal ADB TA 2467-TON. AGRICO Limited of New Zealand.
Ruthenberg, H. (1980). Farming Systems in theTropics. Oxford University Press, Oxford, UK.
Ruthenberg, H. (1985). Innovation Policy for Small Farmers in the Tropics. The Economics of Technical Innovations for Agricultural Development. Clarendon Press. Oxford.
Schelas, J. (1996). Land Use Choice and Change: Intensification and Diversification in the Lowland Tropics of Costa Rica. Human Organisation, 1996. 55 (3): 298-306.
Schnierderjans, M.J. (1995). Goal Programming: Methodology and Applications. Kluwer, Boston.
Schoeffel, P. (1991). Social Factors in Technology Transfer through Development Aid, New Zealand Institute for Social Research and Development.
Schuler, A.T.; Webster, H.H. and Meadows, J.C. (1977). Goal Programming in Forest Management, Journal of Forestry, 75: 320-324.
Schultz, T.W. (1964). Transforming Traditional Agriculture. Yale University Press, New Haven, USA.
238
Sevele, F.V. (1973). Regional inequalities in Socia-economic Development in Tonga. Unpublished PhD Thesis, University of Canterbury, ChristChurch.
Sevele, F.V. (1983). Constraints and possible solutions to agricultural development in the South Pacific. New Zealand Agricultural Science, 1983. 17 (2): 245-251.
Sevele, F.V. (1986). Kingdom of Tonga: Agricultural Incentives. A Report on UNDP Regional Project RAS/83/015 "Advisory Services for Development in the Pacific". Pacific Operations' Centre. Port Vila, Vanuatu.
Shucksmith, M. (1993). Farm Household Behaviour and the transition to Post-Productivism. Joumal of Agricultural Economics, 1993. 44 (3): 466-478.
Simon, H.A. (1955). A Behavioural Model of Rational Choice. Quarterly Journal of Economics, 69: 99-118.
Sisifa, 'AF. (1986b). The District Agricultural Committee in Tonga: An Effective Extension - Farmer Linkage. Alafua Agricultural Bulletin, 11 (2): 38-41, May - August 1986. University of the South Pacific, Western Samoa.
Sisifa, 'AF.; Fakava, V.T. and Villegas, P. (Ed). (1993). Rapid Agricultural and Forestry Appraisal of Vava'u Island. Policy and Planning Division, Ministry of Agriculture and Forestry, TONGA
Smith, D.A. and Capstick, D.F. (1976). Establishing Priorities among Multiple Management Goals. Southern Journal of Agricultural Economics, 2: 37-43.
Singh, I.; Squire, L. and Strauss, J. (Ed). (1986). Agricultural Household Models: Extensions, Applications and Policy. John Hopkins University Press, Baltimore, Md, U.S.A.
Sorensen, J.T. (1989). A Model Simulating the Production of dual-purpose Replacement Heifers. Agricultural Systems, 30: 15-34.
Spedding, C. (1994). Farming Systems Research/Extension in the European Context. In: Dent, J. B. and McGregor M. J. (1994). Rural and Farming Systems Analysis - European Perspectives. CAB International. pp 46-53.
Statistics Department, (1985). Agricultural Census 1985, Statistic Department, Nuku'alofa, Tonga.
Statistics Department, (1986). Tonga Population Census 1986, Statistic Department, Nuku'alofa, Tonga.
Statistics Department, (1993). Statistical Abstract 1993, Statistic Department, Nuku'alofa, Tonga.
Statistics Department, (1996). Foreign Trade Reports, Statistic Department, Nuku'alofa, Tonga.
Statistics Department, (1997). Tonga Population Census 1996: Preliminary Results, Bulletin NO.1. Nuku'alofa, Tonga.
Steur, R.E. (1976). Multiple Objective Linear Programming with Interval Criterion Weights. Management Science, 23: 305-316.
239
Steur, R.E. (1994). Random Problem Generation and the Computation of Efficient Extreme Points in Multiple Objective Linear Programming. Computational Optimisation and Applications, 3: 333-347.
Steur, R.E. and Harris, F.w. (1980). Intra Set Point Generation and Filtering in Decision and Criterion Space. Computers and Operations Research, 7: 41-53.
Stevens, S. (1966). A Metric for Social Consensus. Science, 151: 530-541.
Strauss, J.; Barbosa, M.; Thomas, D.; Teixeira, M. and Gomes, R. (1991). Role of Education and Extension in the Adoption of Technology: A Study of Upland Ice and Soybean Farmers in Central-West Brazil. Agricultural Economics 5: 341-359.
Studien, A. (1983). Current Yield Potentials on Tax Allotments on the Island of Ha'apai and Vava'u, Kingdom of Tonga.
Sturton, M. (1992). Tonga: Development through Agricultural Exports. Economic Report No.4. Honolulu: Pacific Islands Development Program, East-West Center.
Tamiz, M. (1996). Multi-Objective Programming and Goal Programming: Theories and Applications, Lecture Notes in Economics and Mathematical Systems.
Tamiz, M. and Jones, D.F. (1996). An Overview of Current Solution Methods and Modelling Practices in Goal Programming. 10: Multi-Objective Programming and Goal Programming: Theories and Applications, by Tamiz, M. (1996). Lecture Notes in Economics and Mathematical Systems. pp 198-211.
Taylor, C.N. (1980). Social Changes in the Cook Island Agriculture: Final Report Department of Sociology, Canterbury University, Christchurch.
Thaman, R.A. (1976). The Tongan Agricuffural System: with Special Emphasis on Plant Assemblages. PhD Thesis. University of California, Los Angeles, USA.
Thampapilli, D.J. (1978). Methods of Multiple Objective Planning: A Review, World Agric. Econ. And Rural Sociology Abstracts, 20 (12): 803-813.
Thompson, C.S. (1985). Climate and weather of Tonga. New Zealand Meteorological Service, Wellington, New Zealand.
Thrupp, L.A. (1989). Legitimizing Local Knowledge: From Displacement to Empowerment for Third World People. Agriculture and Human Values. Fall 1985.
Tonga Development Bank, (1998). Annual Report 1997. Nuku'alofa, Tonga.
Tonga On Line, (1999). Map of Tonga, Tonga Online. http:/tongaonline.com.
Trangmar, B.B. (1992). Proceedings of the Soil Fertility and Land Evaluation Workshop, Nuku'alofa, Tonga.
240

Unisearch Ltd, (1991). The Tongan Economy: Setting the stage for accelerated growth. International Development Issues No. 22. Australian International Development Assistance Bureau.
Upton, M. (1973). Farm Management in Africa. London: Oxford Press.
Upton, M. and Dixon, J.M. (1994). Methods of Micro-Level Analysis for Agricultural Programmes And Policies. A guideline for policy analysts. FAO Farm Systems Management Series 9. Food and Agriculture Organisation of the United Nations, Rome, Italy.
'Utoikamanu, F. (1993). Disaster Preparedness Planning and Management in the Kingdom of Tonga . .In: "Development Planning in Small Island Nations of the Pacific", by Cole, R.V. (1993). United Nation Centre for Regional Development, Nagoya, Japan. pp 47-66.
von Neumann, J. and Morgenstern, O. (1944). Theory of Games and Behaviour. Princeton University Press, New Jersey.
Ward, R.G. and Kingdon, E. (1995). Land, Custom and Practices in the South Pacific. Australian National University Press.
Ward, R.G. and Proctor, A. (1980). South Pacific Agriculture: Choices and Constraints. Asian Development bank and Australian National University Press.
Wheeler, B.M. and Russel, J.R.M. (1977). "Goal Programming and Agricultural Planning". Operation Research Quarterly, 28(1977): 21-32.
Wolgin, J.M. (1975). Resource Allocation and Risk: A case study of smallholder agriculture in Kenya. 1975 American Journal of Agricultural Economics, 57: 622-630.
World Bank, (1990). Kingdom of Tonga: Agriculture Sector Strategy Review, Report No. 8544-TON.
World Bank, (1991). Tonga Economics Development. In: Pacific Island Economies - Towards Higher Growth in the 1990's. A World Bank Country Study. pp 243-274.
World Bank, (1993). Pacific Island Economies: Towards Efficient and Sustainable Growth. Vol. 1. Report no. 11351·EAP. Washington, D.C.: Country Operations Division. Country Department III. East Asia and Pacific Region.
World Bank, (1996). Pacific Island Economies: Building a resilient Economic Basis for the Twenty Arst Century. pp 122·124.
Wossink, G.A.A.; Koejier, T.J.de and Renkema, J.A. (1992). Environmental-economic policy assessment: a farm economic approach. Agricultural Systems, 39: 421-438.
Young, D.l. (1979). Risk preferences of Agricultural Producers: Their Use in Extension and Research. American Journal of Agricultural Economics, 61 (5): 1063-1070.
Zadeh, l.A. (1963). Optimality and Non-scalar Valued Performance Criteria. IEEE Transaction on Automatic Control, AC-8, 59-60.
241

Zeleny, M. (1973). Compromise Programming. In: Multiple Criteria Decision Making. Eds. J. L. Cochrane & M. Zeleny. University of South Carolina Press, Columbia, 262-301.
Zeleny, M. (1981). The Pros and Cons of Goal Programming. Computers and Operations Research, 8: 357-359.
Zeleny, M. (1982). Multiple Criteria Decision Making. McGraw-Hili, New York.
Zeleny, M. and Cochrane, J.L. (1973). A priori and posteriori goals in macroeconomic policy making. 1.0: Multiple criteria decision making, Cochrane, J.L. and Zeleny, M. (Ed). University of South Carolina Press, South Carolina, 373-391.
242

LIST OF APPENDICES
Appendix 1: Ministry of Agriculture and Forestry
Appendix 2: Farm Survey Questionnaire
Appendix 3: Villages Information
Appendix 4: Major Food and Cash Crop Description
240
Appendix 1: The Ministry of Agriculture and Forestry
The Ministry of Agriculture and Forestry (MAF) is a long establishe.d agency. MAF plays a key role
in relation to the formulation and implementation of agriculture policy (Lincoln International, 1993).
In 1998, major changes were made in the MAF organisational structure in response to the need to
improve the performance of the Ministry. A number of studies, including a sectoral study (World
Bank, 1990), an operation review (ADB, 1995) and a strategic plan (MAF, 1995), have pointed to
the need to improve the quality of MAF services and to be more efficient in assisting farmers to
improve productivity. These studies emphasise the need for an organisational reform to be able to
achieve those goals. In 1997 the Government of Tonga requested the Asian Development Bank
(ADB) to provide technical assistance to establish MAF as an efficient and effective organisation
responsive to the technical and market information needs of farmers.
The ADB report recommended an organisational restructure of MAF. According to Ruhen (1998),
the main features of the restructuring included; (a) a farmer centred approach; (b) improved skills
and service delivery from extension officers; (c) more highly qualified extension officers, and (d)
reorganisation of MAF with a reduction in the number of divisions from 8 to 5 (see Figure 1 a). The
new organisational structure consisted initially of five main divisions; Corporate, Research-
Extension, Regulatory, Forestry, and Services. Briefly, the functions of the various divisions are
described in the following sections.
A 1. 1 Research- Extension division
The Research-Extension division is responsible for agricultural research and technology
development. It consists of 4 integrated units. The Administration unit provides internal
administration services, manages Vaini farm services and coordinates special projects. The
Research unit conducts applied on-station research into most aspects of agricultural production
including the agronomy of present and potential cash crops, pastures, soil science, entomology,
and plant pathology and animal nutrition (Ruhen, 1998). The Research unit activities are principally
carried out at the Government Experimental Farm at Vaini on Tongatapu. The Extension unit is
responsible for extension and adviSOry services in all aspects of agriculture. It generates sound
farm management practices in Tongan farming systems through applied research and the
demonstration of proven technologies; it provides farmers with technical and market advice through
a participatory approach from the subject matter specialists and district extension teams. The
Information Unit is designed to produce and disseminate technical, farm management, and market
information to farmers using radio and other media. This includes regular radio broadcasts and the
publication of agricultural information. It also has the responsibility for the coordination and
publication of the MAF Annual Report.
241
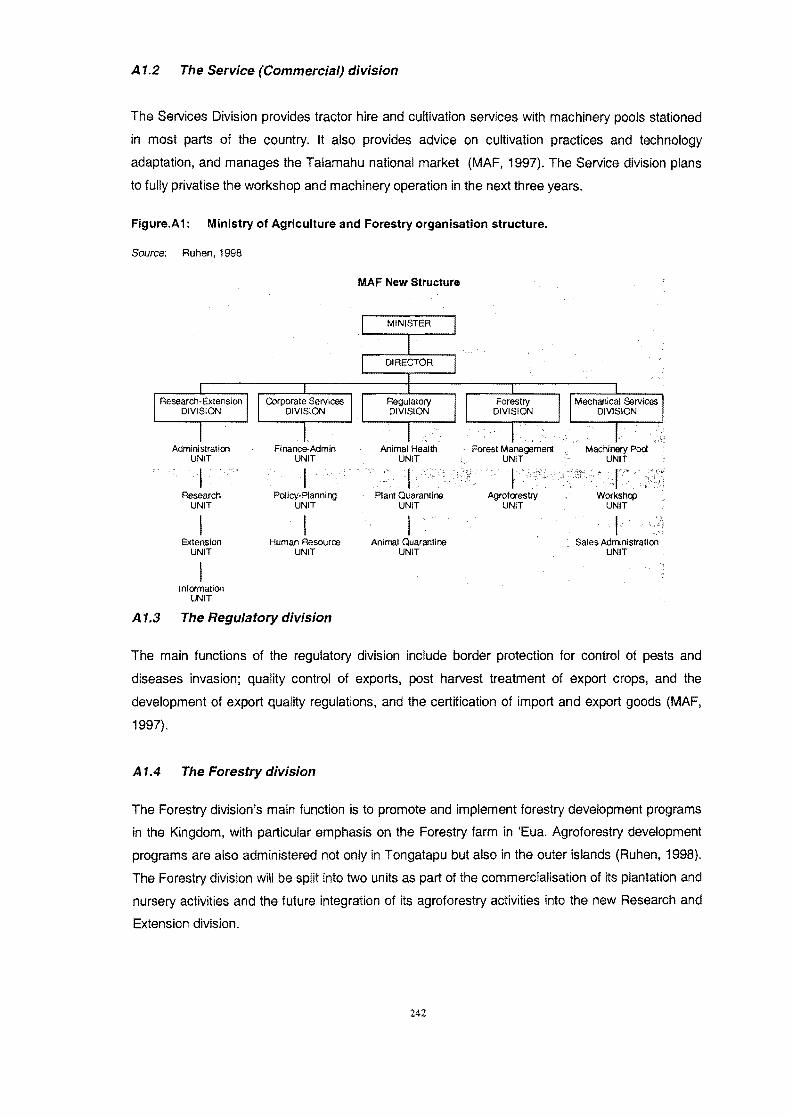
A 1.2 The Service (Commercial) division
The Services Division provides tractor hire and cultivation services with machinery pools stationed
in most parts of the country. It also provides advice on cultivation practices and technology
adaptation, and manages the Talamahu national market (MAF, 1997). The Service division plans
to fully privatise the workshop and machinery operation in the next three years.
Figure.A1: Ministry of Agriculture and Forestry organisation structure.
Source: Ruhan, 1998
·1·· . Research
UNIT
Extension UNIT
Information UNIT
I Policy· Planning
UNIT
Human Resource UNIT
A 1.3 The Regulatory division
MAF New Structure
Plant Quarantine Agroforestsy UNIT UNIT
Animal Quarantine UNIT
Workshq:> UNIT
·1· . Sales Administration
UNIT
The main functions of the regulatory division include border protection for control of pests and
diseases invasion; quality control of exports, post harvest treatment of export crops, and the
development of export quality regulations, and the certification of import and export goods (MAF,
1997).
A 1.4 The Forestry division
The Forestry division's main function is to promote and implement forestry development programs
in the Kingdom, with particular emphasis on the Forestry farm in 'Eua. Agroforestry development
programs are also administered not only in Tongatapu but also in the outer islands (Ruhen, 1998).
The Forestry division will be split into two units as part of the commercialisation of its plantation and
nursery activities and the future integration of its agroforestry activities into the new Research and
Extension division.
242

A 1.5 The Corporate division
The Corporate Services division consists of three functional units. The Policy and Planning unit's
key roles are to develop and recommend policies that are consistent with national strategic
objectives and provide MAF program and divisional managers with effective planning and updated
project monitoring and evaluation services. This unit is also responsible for the compilation of
agricultural statistics and market information and co-ordination of donor assistance programs
(Ruhen, 1998). The Human Resource unit helps managers establish a productive and efficient
working environment through effective performance assessment practices, focused training
programs that are consistent with the priority development needs, and public service reform
strategies recommended by the Government. The Administration unit is also directly responsible to
the staff administration and financial management control (MAF, 1998).
243

Appendix 2: Farming System Household Questionnaire
VilJage: _________ _ Head of Household: Date of Visit, ________ _ Respondent(s):
i. Generallnformation
1. Describe household composition.
2. State the level of Household Income derived from the following in the last 12 months. a) Employment b) Remittances from Overseas c) Business d) Sales of Agricultural Produces! $ ____ _ e) Exchange of products (approx. value)
3. What were the major expenditures by the household during the last 12 months on the following. a) Food Consumption $ ___ b) Repair and Maintenance of Home .... ____ _ c) Education d) Church Donations $ e)Family and Social Obligation$, __ _
f) Others (list) ego Tobacco $ __ Kava $ ___ Electricity $ ___ Water $. ____ _
4. What are food consumption habits? Bought: Own grown: _______ _
ii. Farm Household Decision-making
5. Describe how farm decisions are made within the household. Who makes decision on farm production? and why?
iii. Farm Household Goals, Priorities and Preferences
6. What are the most important objectives of your farming? [Rank from most to leas~
4 How successful are you in achieving your objectives? [Explain your answe~
8. What is the major benefits from your farming activities?
What are the major problems and constraints to achieving your objectives? [Rank from most to leas~
10. What would you suggest to solve or reduce the problems & constraints?
iv. Land access and utilization
11. Describe the main cropping pattern, crops grown, purpose and their respective area.
Crop Type Purpose MixediMonocrop Area
12. Provide details of the number of Tax Allotments under your management, how much of each are under cropping and fanowed and land holding status.
13. How do you plan your crop rotations?
14. How often do you fallow your land?
15. Which crop would you like to produce more of? And why?
16. What were the major changes implemented in your farm operations up to now? Why changes?
17. What kind of changes to your farm structure to improve your production - in terms of enterprises, technology, capital, will you undertake in the near future?
I IncIudes crops, livestock. frrewocxl
244
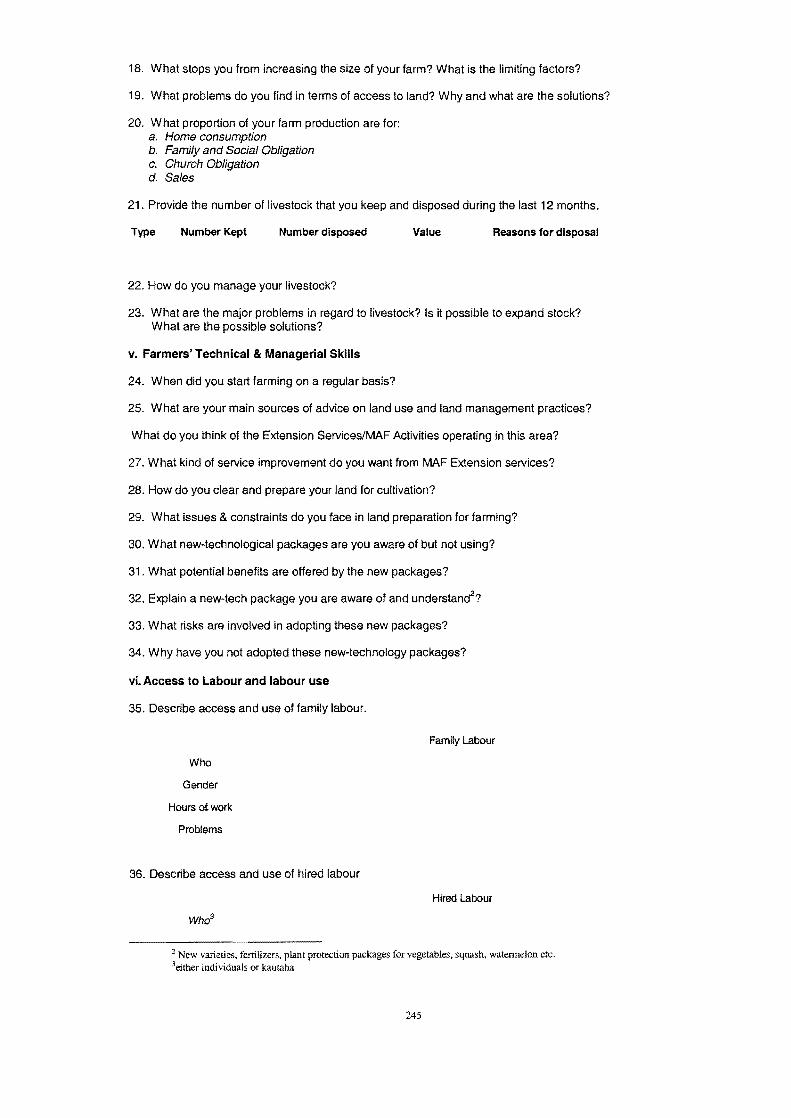
18. What stops you from increasing the size of your farm? What is the limiting factors?
19. What problems do you find in terms of access to land? Why and what are the solutions?
20. What proportion of your farm production are for: a. Home consumption b. Family and Social Obligation c. Church Obligation d. Sales
21. Provide the number of livestock that you keep and disposed during the last 12 months.
Type Number Kept Number disposed Value Reasons for disposal
22. How do you manage your livestock?
23. What are the major problems in regard to livestock? Is it possible to expand stock? What are the possible solutions?
v. Farmers' Technical & Managerial Skills
24. When did you start farming on a regular basis?
25. What are your main sources of advice on land use and land management practices?
What do you think of the Extension Services/MAF Activities operating in this area?
27. What kind of service improvement do you want from MAF Extension services?
28. How do you clear and prepare your land for cultivation?
29. What issues & constraints do you face in land preparation for farming?
30. What new-technological packages are you aware of but not using?
31. What potential benefits are offered by the new packages?
32. Explain a new-tech package you are aware of and understand2?
33. What risks are involved in adopting these new packages?
34. Why have you not adopted these new-technology packages?
vi. Access to Labour and labour use
35. Describe access and use of family labour.
Family Labour
Who
Gender
Hours ot work
Problems
36. Describe access and use of hired labour
Hired Labour
2 New varieties. fertilizers. plant protection packages for vegetables. squash. watermelon etc. 3either individuals or kautaha
245

Gender
Hours of work
Type of Work
Rates of Pay
Problems
vii. Market Access
37. How much of each commodity that you produce are marketed locally and overseas? Name of commodity Where Selling Price/unit
For each commodity marketed. who set the price and what are the lowest prices acceptable to you?
39. For which commodities do you anticipate expansion in market opportunities? Give reasons for your answer.
40. What are likely constraints to development of those market opportunities and how can the opportunities is enhanced?
viii. Infrastructure
41. What are your views on the conditions of the following infrastructure facilities and how it affects your farming decisions?
i) Roads? ii) Wharves? iii) Packing & Storage Sheds? iv) Markets?
42. If you are empowered to decide on infrastructure development, what are three priority infrastructures improvements would you authorize now? [Give reasons]
ix.lnstitutional and Support Services
43. How effective are the govemment policies and incentive schemes that Government provides? Please explain.
44. In your opinion, what sort of policies and incentives should be provided to motivate you and fellow workers to increase agricultural productivity?
45. Where do you seek credit for finance farm activities?
46. How effective are bank credit policies to your endeavour. Suggest improvements.
ix. Group Farming and Growers Association
47. With what types of village and farm group do you involve in.? Why or why not?
48. What are the objective(s) of the group?
49. What activities do these groups carry out?
50. How do you benefit from working as a group?
51. What problems do these farm groups face? What opportunities do you see for addressing these problems?
246

Appendix 3: Villages Information
Total population by sex and number of households, actual farmers and land utilisation for sub-regions, districts and villages.
Population' Farmers and Farming areas
Village Total Males Females No.ofHH No. of Actual Crop Area Land Area Av. Farm Size to Farmers (Acres) (Acres) No. of Farmers
TONGATAPU SUB-REGION
Koloto'ou District 15,903 7,894 8,009 2,339 224 1314.0 2266.9 5.7 Kolofo'ou 10,044 4,988 5,056 1,494 166 993.0 1711.6 5.8 Ma'ufanga 4,924 2,404 2,520 699 58 321.0 555.3 5.5
Kolomotu'a District 13,115 6,469 6,646 2,037 302 1542.0 2668.7 5.1 Kolomotu'a 6,415 3,143 3,272 1,040 207 1227.4 1863.1 6.6 Haveluloto 3,070 1,528 1,542 469 18 65.1 144.3 3.8 TofoalKoloua 2,298 1,093 1,205 289 22 113.2 206.3 5.1 Hofoa 609 317 292 94 18 82.9 168 4.6 Puke 403 204 199 63 18 53 132 3.0 Sia'atoutai 320 184 136 82 1 97.7 182.3 5.1
Vaini District 11,104 5,618 5,486 1,676 667 3465.7 6277.2 5.3 Vaini 2,697 1,387 1,310 421 162 862.4 1494.3 5.5 Malapo 582 284 298 82 33 184.7 359.5 5.7 Longoteme 730 388 342 108 56 273.5 855.0 4.9 Folaha 706 336 370 115 59 281.2 486.8 4.9 Nukuhetulu 329 157 172 55 26 105.7 208 4.1 Veitongo 1,080 541 539 146 64 347.6 552.0 5.5 Ha'ateiho 1,825 918 907 267 120 703.3 1046.8 6.0 Pea 2,152 1,091 1,061 327 99 455.6 802.8 4.6 Tokomololo 1,003 516 487 155 46 244.9 464.0 5.3
41986 Population Census
51993 Land Use and Crop Survey
247
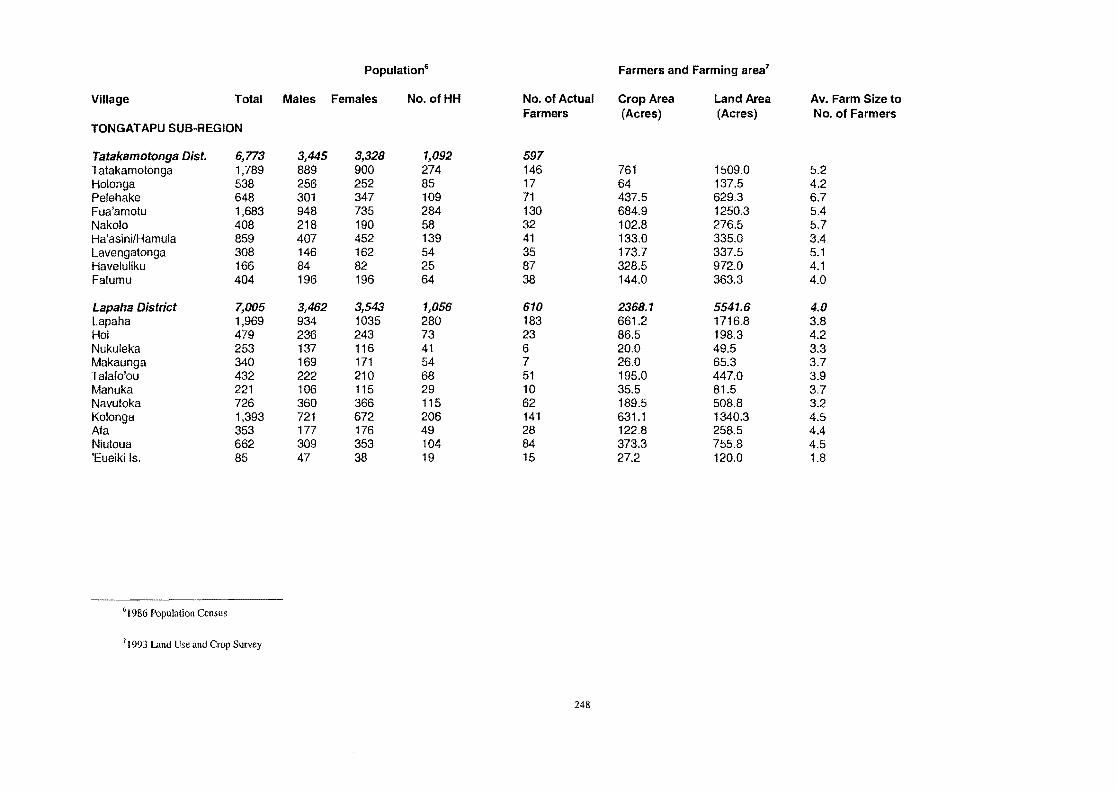
PopulationS Farmers and Farming area7
Village Total Males Females No.ofHH No. of Actual Crop Area Land Area Av. Farm Size to Farmers (Acres) (Acres) No. of Farmers
TONGATAPU SUB-REGION
Tatakamotonga Dist. 6,773 3,445 3,328 1,092 597 T atakamotonga 1,789 889 900 274 146 761 1509.0 5.2 Holonga 538 256 252 85 17 64 137.5 4.2 Pelehake 648 301 347 109 71 437.5 629.3 6.7 Fua'amotu 1,683 948 735 284 130 684.9 1250.3 5.4 Nakolo 408 218 190 58 32 102.8 276.5 5.7 Ha'asini/Hamula 859 407 452 139 41 133.0 335.0 3.4 Lavengatonga 308 146 162 54 35 173.7 337.5 5.1 Haveluliku 166 84 82 25 87 328.5 972.0 4.1 Fatumu 404 196 196 64 38 144.0 363.3 4.0
Lapaha District 7,005 3,462 3,543 1,056 610 2368.1 5541.6 4.0 Lapaha 1,969 934 1035 280 183 661.2 1716.8 3.8 Hoi 479 236 243 73 23 86.5 198.3 4.2 Nukuleka 253 137 116 41 6 20.0 49.5 3.3 Makaunga 340 169 171 54 7 26.0 65.3 3.7 Talafo'ou 432 222 210 68 51 195.0 447.0 3.9 Manuka 221 106 115 29 10 35.5 81.5 3.7 Navutoka 726 360 366 115 62 189.5 508.8 3.2 Kolonga 1,393 721 672 206 141 631.1 1340.3 4.5 Afa 353 177 176 49 28 122.8 258.5 4.4 Niutoua 662 309 353 104 84 373.3 755.8 4.5 'Eueiki Is. 85 47 38 19 15 27.2 120.0 1.8
61986 Population Census
71993 Land Use and Crop Survey
248
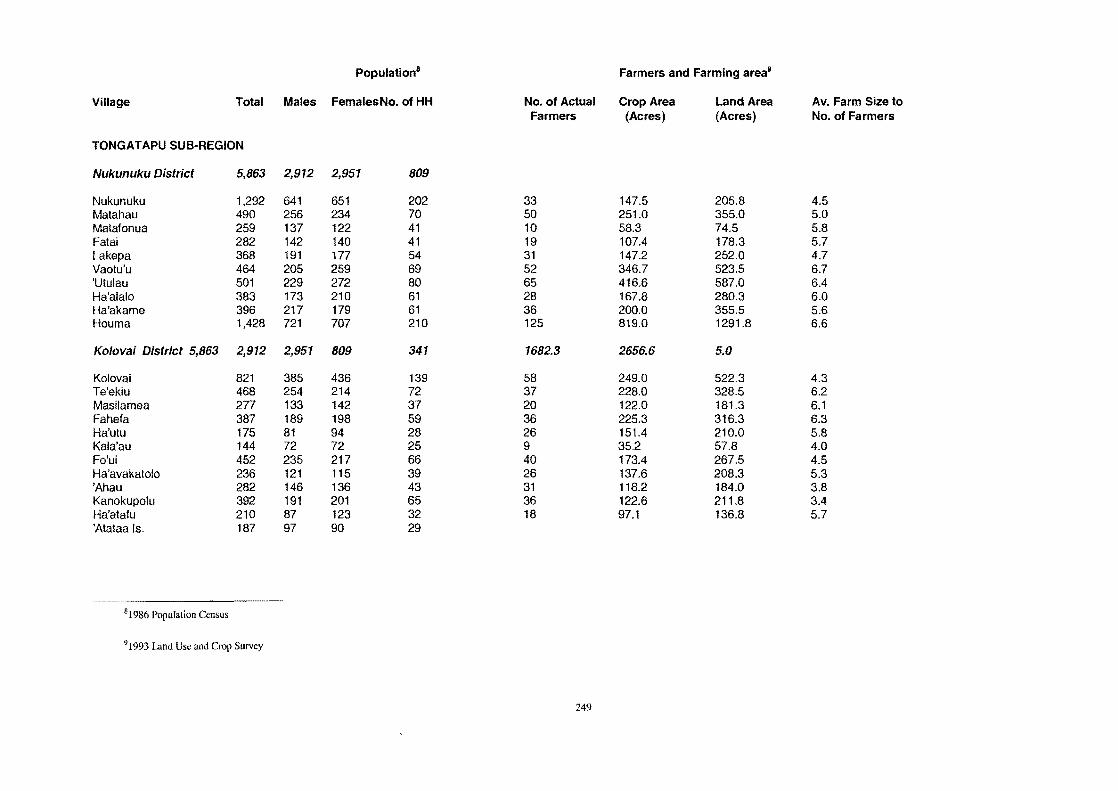
Population8 Farmers and Farming area9
Village Total Males FemalesNo. of HH No. of Actual Crop Area Land Area Av. Farm Size to Farmers (Acres) (Acres) No. of Farmers
TONGATAPU SUB-REGION
Nukunuku District 5,863 2,912 2,951 809
Nukunuku 1,292 641 651 202 33 147.5 205.8 4.5 Matahau 490 256 234 70 50 251.0 355.0 5.0 Matafonua 259 137 122 41 10 58.3 74.5 5.8 Fatai 282 142 140 41 19 107.4 178.3 5.7 lakepa 368 191 177 54 31 147.2 252.0 4.7 Vaotu'u 464 205 259 69 52 346.7 523.5 6.7 'Utulau 501 229 272 80 65 416.6 587.0 6.4 Ha'alalo 383 173 210 61 28 167.8 280.3 6.0 Ha'akame 396 217 179 61 36 200.0 355.5 5.6 Houma 1,428 721 707 210 125 819.0 1291.8 6.6
Kolovai District 5,863 2,912 2,951 809 341 1682.3 2656.6 5.0
Kolovai 821 385 436 139 58 249.0 522.3 4.3 Te'ekiu 468 254 214 72 37 228.0 328.5 6.2 Masilamea 277 133 142 37 20 122.0 181.3 6.1 Fahefa 387 189 198 59 36 225.3 316.3 6.3 Ha'utu 175 81 94 28 26 151.4 210.0 5.8 Kala'au 144 72 72 25 9 35.2 57.8 4.0 Fo'ui 452 235 217 66 40 173.4 267.5 4.5 Ha'avakatolo 236 121 115 39 26 137.6 208.3 5.3 'Ahau 282 146 136 43 31 118.2 184.0 3.8 Kanokupolu 392 191 201 65 36 122.6 211.8 3.4 Ha'atafu 210 87 123 32 18 97.1 136.8 5.7 'Atataa Is. 187 97 90 29
81986 Population Census
91993 Land Usc and Crop Survey
249

Population' 0 Farmers and Farming area"
Village Total Males FemalesNo. of HH No. of Actual Crop Area Land Area Av. Farm Size to Farmers (Acres) (Acres) No. of Farmers
VAVA'U SUB-REGION
Neiafu District 5,268 2,689 2,579 882 Neiafu 3,879 1,991 1,888 657 247 839.2 1729.0 3.4 Makave 371 196 175 59 31 82.4 178.3 2.7 Toula 243 114 129 38 51 56.4 132.0 1.1 'Utui 231 118 113 41 23 44.8 117.3 1.9 Ofu Is. 218 98 120 36 19 27.7 99.8 1.5 Okoa Is. 232 122 110 34 19 38.6 64.3 2.0 'Olo'ua Is. 94 50 44 17 13 18.4 54.8 1.4
Pangaimotu District 1,247 650 597 205 Pangaimotu 659 343 316 101 45 138.2 335.0 3.1 'Utulei 159 88 71 29 10 45.7 88.0 4.6 Nga'unoho 176 81 95 28 11 26.8 73.3 2.4 'Utungake 253 138 115 47 22 69.2 159.5 3.1
Hahake District 2,299 1,145 1,154 353 Ha'alaufuli 467 219 248 78 57 114.5 393.0 2.0 Ha'akio 227 108 119 33 20 45.5 106.3 2.3 Houma 169 83 86 28 15 31.0 89.3 2.1 Mangia 110 52 58 20 6 16.0 49.0 2.7 Ta'anea 648 330 318 90 40 108.0 260.3 2.7 Tu'anekivale 358 179 179 60 20 66.3 147.0 3.3 Koloa 193 114 79 28 29 64.9 118.5 2.2 Holeva 127 60 67 16 18 24.2 46.3 1.3
101986 Population Census
111993 Land Use and Crop Survey
250
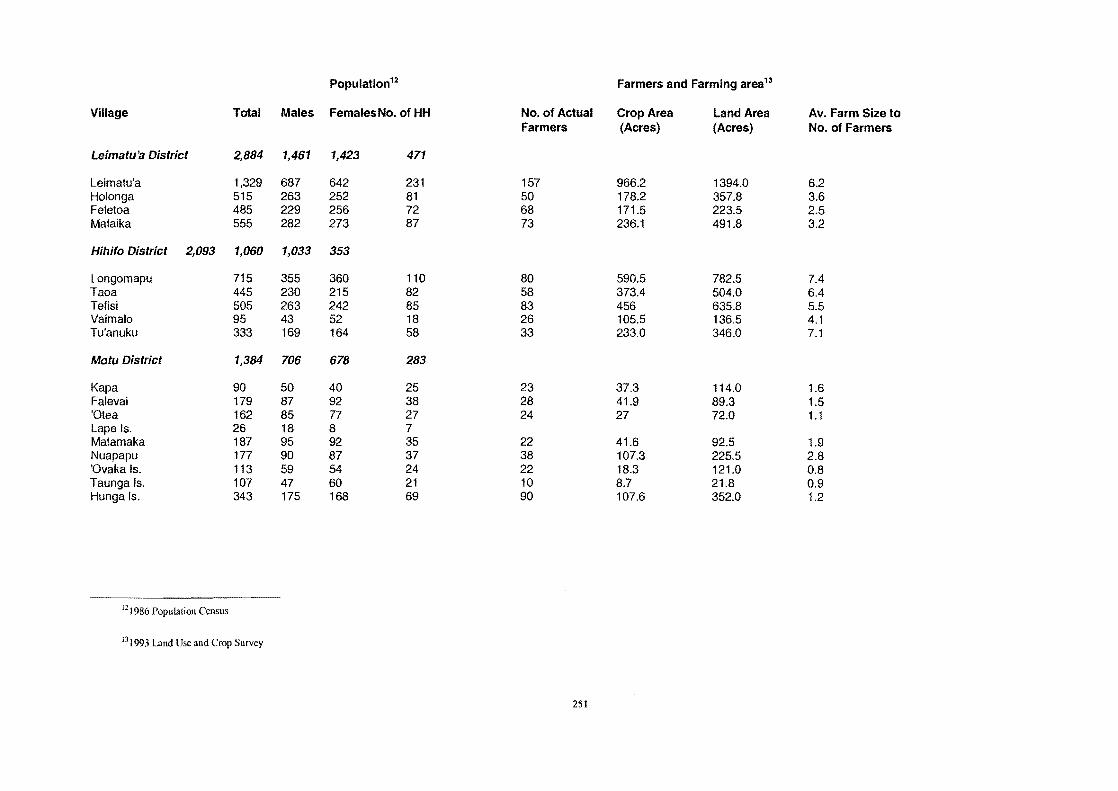
Population 12 Farmers and Farming area1J
Village Total Males FemalesNo. of HH No. of Actual Crop Area Land Area Av. Farm Size to Farmers (Acres) (Acres) No. of Farmers
Leimatu'a District 2,884 1,461 1,423 471
Leimatu'a 1,329 687 642 231 157 966.2 1394.0 6.2 Holonga 515 263 252 81 50 178.2 357.8 3.6 Feletoa 485 229 256 72 68 171.5 223.5 2.5 Mataika 555 282 273 87 73 236.1 491.8 3.2
Hihifo District 2,093 1,060 1,033 353
Longomapu 715 355 360 110 80 590.5 782.5 7.4 Taoa 445 230 215 82 58 373.4 504.0 6.4 Tefisi 505 263 242 85 83 456 635.8 5.5 Vaimalo 95 43 52 18 26 105.5 136.5 4.1 Tu'anuku 333 169 164 58 33 233.0 346.0 7.1
Motu District 1,384 706 678 283
Kapa 90 50 40 25 23 37.3 114.0 1.6 Falevai 179 87 92 38 28 41.9 89.3 1.5 'Otea 162 85 77 27 24 27 72.0 1.1 Lape Is. 26 18 8 7 Matamaka 187 95 92 35 22 41.6 92.5 1.9 Nuapapu 177 90 87 37 38 107.3 225.5 2.8 'Ovaka Is. 113 59 54 24 22 18.3 121.0 0.8 Taunga Is. 107 47 60 21 10 8.7 21.8 0.9 Hunga Is. 343 175 168 69 90 107.6 352.0 1.2
121986 Population Census
I J 1993 Land Use and Crop Survey
251

Population 14 Farmers and Farming area's
Village Total Males Females No.ofHH No. of Actual Crop Area Land Area Av. Farm Size to Farmers (Acres) (Acres) No. of Farmers
HA'APAI SUB·REGION
Pangai District 2,850 1,447 1,403 504
Pangai 1,487 772 715 262 71 153.4 398.7 2.3 Hihifo 901 448 453 164 88 201.5 448.8 2.4 Holopeka 187 93 94 33 26 55.1 162.3 2.2 Koulo 275 134 141 45 29 61.0 166.2 2.1
Foa District 1,410 699 711 247
F angale'ounga 287 138 149 38 25 41.3 105.2 1.7 Fotua 243 123 120 41 35 61.2 166.2 1.0 Lotofoa 399 200 199 73 50 120.4 265.3 2.8 Faleloa 413 204 209 81 62 116.5 355.8 2.0 Ha'afakahenga 68 34 34 14
LuJunga District 1,584 790 794 275
Ha'afeva Is. 450 237 213 72 58 76.8 214.8 1.3 Tungua Is. 301 154 147 52 71 99.0 201.8 1.4 Fotuha'a Is. 190 97 95 33 'O'ua Is. 266 118 148 47 37 46.8 153.0 1.3 Matuku Is. 142 77 65 22 19 16.3 49.8 0.9 Kotu Is. 233 107 126 49 26 10.2 21.0 0.4
14 1986 Population Census
101993 Land Use and Crop Survey
252

Population16 Farmers and Farming areau
Village Total Males Females No.ofHH No. of Actual Crop Area Land Area Av. Farm Size to Farmers (Acres) (Acres) No. of Farmers
Mu'omu'a District 885 452 433 173
Nomuka Is. 686 338 348 132 50 162.3 315.0 3.2 Mango Is. 83 49 34 18 10 9.0 67.8 0.9 Fonoifua Is. 111 60 51 22 16 17.4 48.0 1.1 Nomukeiki Is. 5 5 1
Ha 'ano District 891 457 434 173
Fakakai 237 125 112 40 56 76.9 233.5 1.4 Pukotala 173 84 89 30 25 41.2 97.0 1.7 Ha'ano 214 108 106 46 42 74.1 157.5 1.8 Muitoa 103 58 45 19 19 55.0 107.6 2.9 Mo'unga'one 164 82 82 38
'Uiha District 1,299 650 678 243
'Uiha 632 312 320 113 64 93.7 252.7 1.5 Felemea 248 115 133 58 50 64.0 168.7 1.3 Lofanga Is. 330 156 174 50 Tofua Is. 89 67 22 22
161986 Population Census
17 1993 Land Use and Crop Survey 253
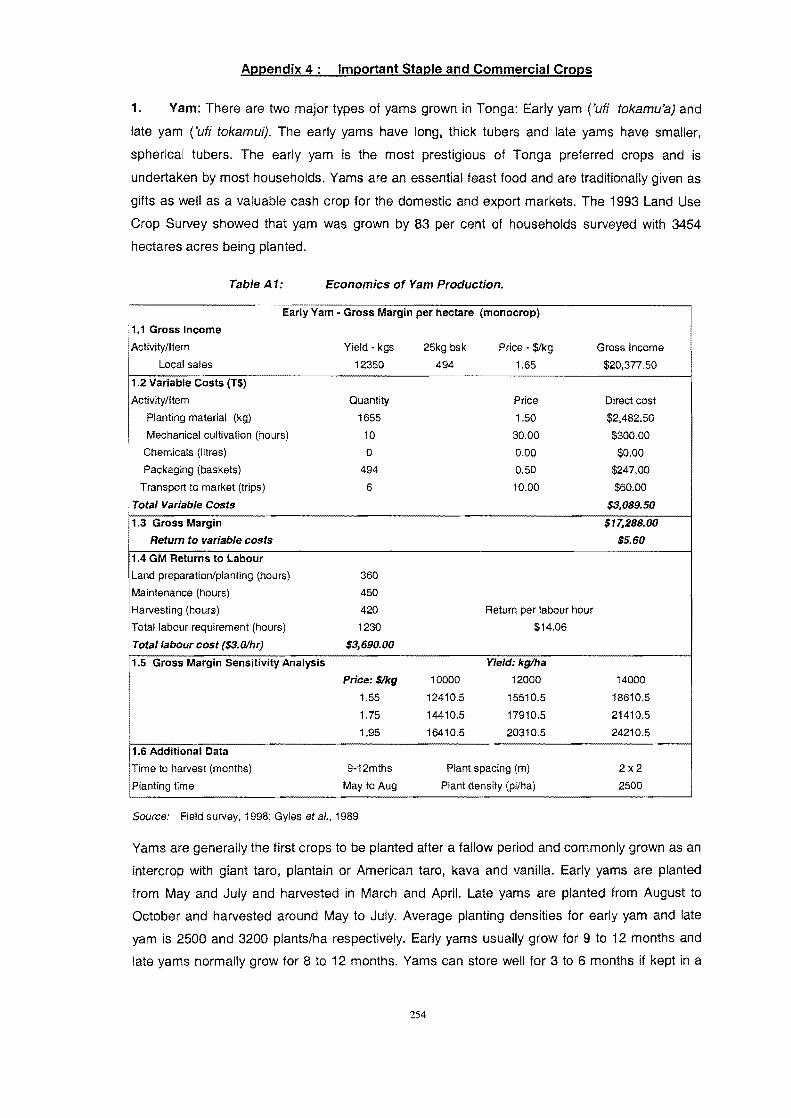
Appendix 4 : Important Staple and Commercial Crops
1. Yam: There are two major types of yams grown in Tonga: Early yam ('uti tokamu'a) and
late yam ('uti tokamui). The early yams have long, thick tubers and late yams have smaller,
spherical tubers. The early yam is the most prestigious of Tonga preferred crops and is
undertaken by most households. Yams are an essential feast food and are traditionally given as
gifts as well as a valuable cash crop for the domestic and export markets. The 1993 Land Use
Crop Survey showed that yam was grown by 83 per cent of households surveyed with 3454
hectares acres being planted.
Table A1: Economics of Yam Production.
Early Yam - Gross Margin per hectare (monocrop) 1.1 Gross Income Activity/Item Yield· kgs 25kg bsk Price - $/kg Gross Income
Local sales 12350 494 1.65 $20,377.50 1.2 Variable Costs (T$)
Activity/Item Quantity Price Direct cost Planting material (kg) 1655 1.50 $2,482.50 Mechanical cultivation (hours) 10 30.00 $300.00
Chemicals (litres) 0 0.00 $0.00 Packaging (baskets) 494 0.50 $247.00
Transport to market (trips) 6 10.00 $60.00 Total Variable Costs $3,089.50
1.3 Gross Margin $17,288.00 Return to variable costs $5.60
1.4 GM Returns to Labour Land preparation/planting (hours) 360 Maintenance (hours) 450 Harvesting (hours) 420 Return per labour hour
!Totallabour requirement (hours) 1230 $14.06
• Total labour cost ($3.0Ihr) $3,690.00
\1.5 Gross Margin Sensitivity Analysis Yield: kg/ha
Price: $/I<g 10000 12000 14000
1.55 12410.5 15510.5 18610.5 1.75 14410.5 17910.5 21410.5 1.95 16410.5 20310.5 24210.5
1.6 Additional Data Time 10 harvest (months) 9-12mlhs Plant spacing (m) 2x2 Planting time May to Aug Plant density (pl/ha) 2500
Source: Field survey, 1998; Gyles et a/., 1989
Yams are generally the first crops to be planted after a fallow period and commonly grown as an
intercrop with giant taro, plantain or American taro, kava and vanilla. Early yams are planted
from May and July and harvested in March and April. Late yams are planted from August to
October and harvested around May to July. Average planting densities for early yam and late
yam is 2500 and 3200 plants/ha respectively. Early yams usually grow for 9 to 12 months and
late yams normally grow for 8 to 12 months. Yams can store well for 3 to 6 months if kept in a
254
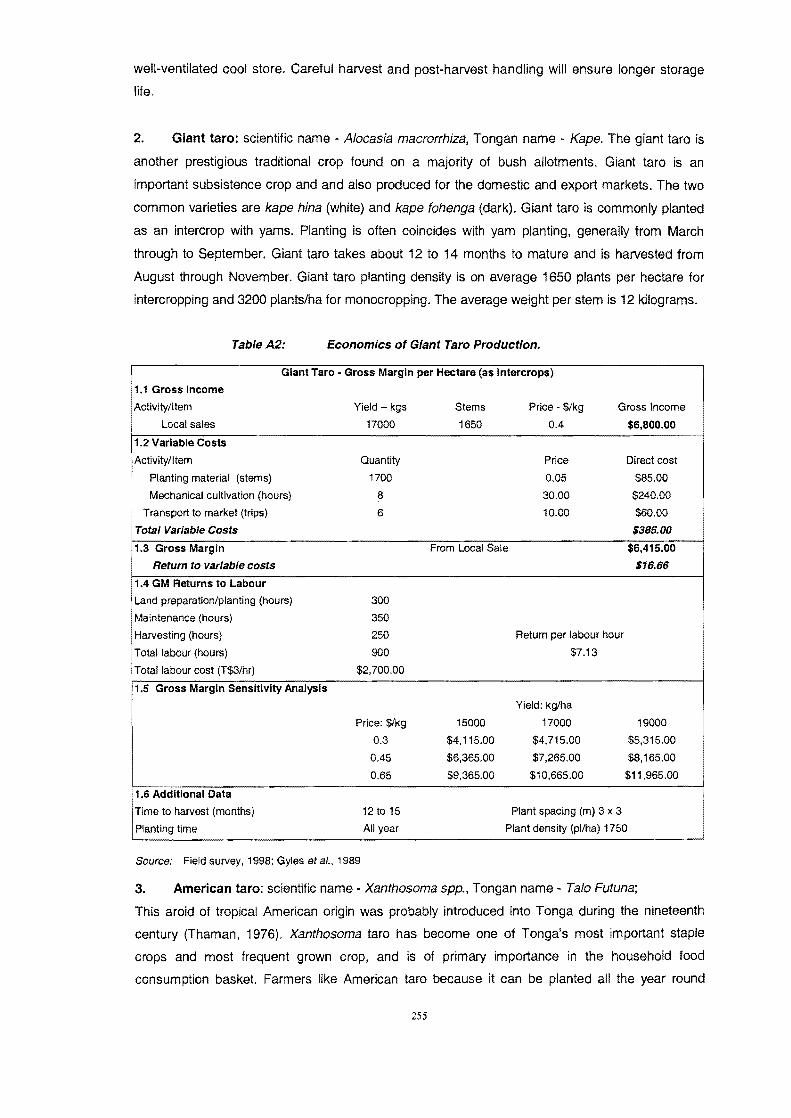
well-ventilated cool store. Careful harvest and post-harvest handling will ensure longer storage
life.
2. Giant taro: scientific name - Alocasia macrorrhiza, Tongan name - Kape. The giant taro is
another prestigious traditional crop found on a majority of bush allotments. Giant taro is an
important subsistence crop and and also produced for the domestic and export markets. The two
common varieties are kape hina (white) and kape fohenga (dark). Giant taro is commonly planted
as an intercrop with yams. Planting is often coincides with yam planting, generally from March
through to September. Giant taro takes about 12 to 14 months to mature and is harvested from
August through November. Giant taro planting density is on average 1650 plants per hectare for
intercropping and 3200 plantsiha for monocropping. The average weight per stem is 12 kilograms.
TableA2: Economics of Giant Taro Production.
Giant Taro - Gross Margin per Hectare (as Intercrops) 1.1 Gross Income
! Activity/ltem Local sales
1.2 Variable Costs Activity/ltem
Planting material (stems) Mechanical CUltivation (hours)
Transport to market (trips) Total Variable Costs
1.3 Gross Margin Return to variable costs
1.4 GM Returns to Labour Land preparation/planting (hours) Maintenance (hours) Harvesting (hours) Total labour (hours) Total labour cost (T$3/hr)
1.5 Gross Margin Sensitivity Analysis
.1.6 Additional Data Time to harvest (months) Planting time
Yield - kgs 17000
Quantity 1700
8 6
300 350 250 900
$2,700.00
Price: $Ikg 0.3
0.45 0.65
12 to 15 All year
Source: Field survey, 1998; Gyles et al., 1989
Stems 1650
From Local Sale
15000 $4,115.00 $6,365.00 $9,365.00
Price· $/kg 0.4
Price
0.05 30.00 10.00
Gross Income $6,800.00
Direct cost $85.00
$240.00 $60.00 $385.00
$6,415.00 $16.66
Return per labour hour $7.13
Yield: kg/ha 17000 19000
$4,715.00 $5,315.00 $7,265.00 $8,165.00
$10,665.00 $11,965.00
Plant spacing (m) 3 x 3 Plant density (pl/ha) 1750
3. American taro: scientific name - Xanthosoma spp., Tongan name - Talo Futuna;
I
This aroid of tropical American origin was probably introduced into Tonga during the nineteenth
century (Thaman, 1976). Xanthosoma taro has become one of Tonga's most important staple
crops and most frequent grown crop, and is of primary importance in the household food
consumption basket. Farmers like American taro because it can be planted all the year round
255

provided the rainfall does not drop below 1000 mm, although most planting occurs between June
and September. The tubers take about one year to mature, and because they store well in the
ground they can be left unharvested for up to two years without the cormels rotting. Consequently,
it is occasionally an important species in fallow vegetation associations. Planting materials consists
of tubers. After harvest, all taros can be stored up to three months. The corms of common and
giant taro are eaten while normally only the cormels of American taro are used as food since the
main corms are often very acrid. The young green leaves, ill, of the American and common taro
plants can be eaten as a green vegetable after cooking.
1.1 Gross Income Activity/Item
Taro corm Taro leaves Total sales
1.2 Variable Costs Activity/I tem
TableA3:
Planting material (stems) Mechanical cultivation (hours) Packaging (baskets)
Transport to market (trips) i Total Variable Costs
1.3 Gross Margin Return to Variable Costs
1.4 GM Returns to Labour
Economics of Xanthosoma Taro Production.
Xanthosoma Taro· Gross Margin per Hectare
Yield· kgs 11100
800
Quantity 1250
6 444
6
25kg bsk 444
bundles
From Local Sale
Price· $/kg $0.50 $1.00
Price 0.10 30.00 0.50 10.00
Land preparation/planting (hours) 275 Maintenance (hours) 350
Gross Income $5,550.00 $800.00
$6,350.00
Direct cost $125.00 $180.00 $222.00 $60.00 $587.00
$5,763.00 $9.82
. Harvesting (hours) 280 50 955
Return per labour hour
• Marketing (hours) Total labour (hours) Total labour cost (T$3/hr)
1.5 Gross Margin Sensitivity Analysis
1.6 Additional Data Time to harvest (months) Planting time
$2,865.00
Price: $/kg 0.45 0.6 0.75
8to 24 All year
Source: Field survey, 1998; Gyles et al., 1989
$6.03
Yield: kglha 8500 10000 12000
$3,238.00 $3,913.00 $4,813.00 $4,513.00 $5,413.00 $6,613.00 $5,788.00 $6,913.00 $8,413.00
Plant spacing (m) 1.3 x 1.3 Plant density (pl/ha) 10000
4. Colocasia taro: scientific name· Colocasia esculenta, Tongan name· Tala Tonga;
Colocasia taro is an ancient introduction to Tonga and is cultivated as one of the staple foods
throughout the country. The popularity of the crop has increased in the last 10 years due to the
increasing demand for fresh corms migrant communities overseas. A cyclone in Western Samoa
in 1991 followed by the Taro blight disease in 1993 virtually destroyed Samoan production, the
256
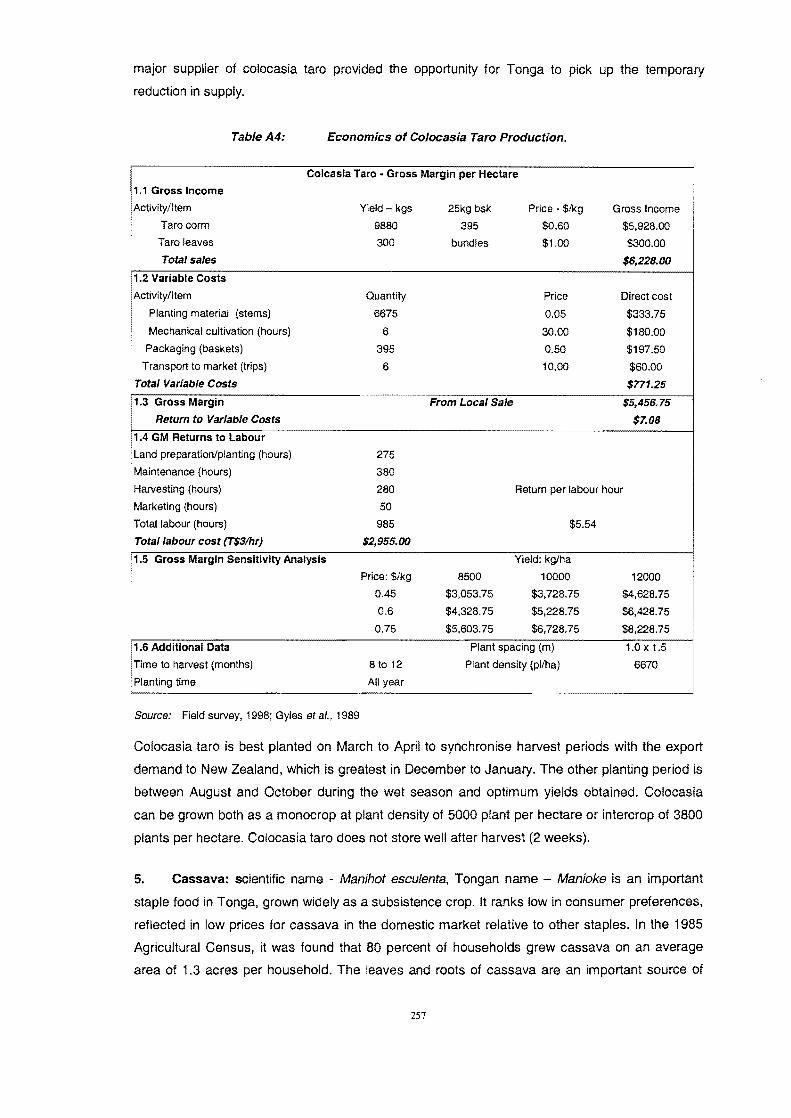
major supplier of colocasia taro provided the opportunity for Tonga to pick up the temporary
reduction in supply.
TableA4: Economics of Colocasia Taro Production.
Colcasia Taro· Gross Margin per Hectare 1.1 Gross Income Activity/Item Yield kgs 25kg bsk Price - $/kg Gross Income
Taro corm 9880 395 $0.60 $5,928.00 Taro leaves 300 bundles $1.00 $300.00 Total sales $6,228.00
1.2 Variable Costs Activity/Item Quantity Price Direct cost
Planting material (stems) 6675 0.05 $333.75 Mechanical cultivation (hours) 6 30.00 $180.00
Packaging (baskets) 395 0.50 $197.50 Transport to market (trips) 6 10.00 $60.00
Total Variable Costs $771.25 11.3 Gross Margin From Local Sale $5,456.75
Return to Variable Costs $7.08 1.4 GM Returns to Labour Land preparation/planting (hours) 275 Maintenance (hours) 380 Harvesting (hours) 280 Return per labour hour Marketing (hours) 50 Total labour (hours) 985 $5.54
1 Total labour cost (T$3Ihr) $2,955.00 1.5 Gross Margin Sensitivity AnalysiS Yield: kglha
Price: $/kg 8500 10000 12000 0.45 $3,053.75 $3,728.75 $4,628.75 0.6 $4,328.75 $5,228.75 $6,428.75
0.75 $5,603.75 $6,728.75 $8,228.75
1.6 Additional Data Plant spacing (m) 1.0 x 1.5
Time to harvest (months) 8 to 12 Plant density (pl/ha) 6670 Planting time All year
Source: Field survey, 1998; Gyles et al .• 1989
Colocasia taro is best planted on March to April to synchronise harvest periods with the export
demand to New Zealand, which is greatest in December to January. The other planting period is
between August and October during the wet season and optimum yields obtained. Colocasia
can be grown both as a monocrop at plant density of 5000 plant per hectare or intercrop of 3800
plants per hectare. Colocasia taro does not store well after harvest (2 weeks).
5. Cassava: scientific name - Manihot eSGulenta, Tongan name - Manioke is an important
staple food in Tonga, grown widely as a subsistence crop. It ranks low in consumer preferences,
reflected in low prices for cassava in the domestic market relative to other staples. In the 1985
Agricultural Census, it was found that 80 percent of households grew cassava on an average
area of 1.3 acres per household. The leaves and roots of cassava are an important source of
257

animal feed. Cassava is generally the last crop in the cropping cycle, following the yam crop and
subsequent taro and sweet potato crops. It is frequently planted twice in succession in the same
plot, after which the land is left fallow.
TableA5: Economics of Cassava Production.
Cassava - Gross Margin per Hectare 1.1 Gross Income Activity/Item Yield - kgs 25kg bsk Price - $/kg Gross Income
Local sales
1.2 Variable Costs Activity/Item
Planting material (stems) Mechanical cultivation (hours) Packaging (baskets)
Transport to market (trips)
Total Variable Costs
1.3 Gross Margin
Return to variable costs
1.4 GM Returns to Labour Land preparation/planting (hours) Maintenance (hours)
Harvesting (hours) Marketing (hours)
Total labour (hours) Total labour cost (T$3Ihr)
1.5 Gross Margin Sensitivity Analysis
1
1.6 Additional Data Crop Form . Planting time I
18525
Quantity 6000
6 740
7
300 350 150 40 840
2520
Price: $/kg
0.1 0.25 0.35
Monocrop All year
Source: Field survey, 1998; Gyles et al., 1989
741 0.15
Price $0.00 $30.00
$0.50 $10.00
From Local Sale
10000 -$1,159
$341 $1,341
Return per labour hour
$2.57
Yield: kglha 12000
-$959 $841
$2,041
Plant density (pl/ha)
Time to harvest (mths) Plant spacing (m)
$2,778.75
Direct cost $0.00
$180.00 $370.00
$70.00
$620.00 $2,158.75
$3.48
14000 -$759 $1,341 $2,741
10000 Sep-24 1.0 x 1.0
Cassava can be planted all year round. Cassava is commonly grown as a monocrop, planted
immediately after the previous crop has been harvested, although it may be planted while the
previous crops remain in the ground. It is sometimes grown as an intercrop with crops such as
pineapples, vanilla, kava and corn. Cassava can be harvested after 8-15 months, or left
unharvested for up to 2 years. Once harvested, the cassava roots begin to deteriorate in only a few
hours. They can be stored in the ground for two years or more.
6. Sweet Potato: scientific name - Ipomea batatas, Tongan name - Kuma/a.
Sweet potato is the third most important staple food crop. As a cash crop sweet potatoes is
attractive since it has a much shorter production period than other root crops, with some varieties
being ready to harvest four months after planting. In the 1985 Agricultural Census, it was found that
258

662 households on an average area of 0.9 of an acre grew sweet potato. In the traditional cropping
cycle, sweet potato is planted second to either yam or taro. Sweet potato is used as a feast food.
The leaves are frequently used as pig feed.
TableA6: Economics of Sweet Potato Production.
Sweet Potatoes - Gross Margin per Hectare 1.1 Gross Income Activitylltem Yield· kgs 25kg bsk Price - $lkg Gross Incoma
Local sales
1.2 Variable Costs Activity/ltem
Planting material (stems) Mechanical cultivation (hours)
Chemicals (Iitres) Packaging (baskets)
Transport to market (trips) :Total Direct Costs
1.3 Gross Margin Return to variable costs
1.4 GM Returns to Labour 'Land preparation/planting (hours) Maintenance, mounding (hours) Harvesting (hours) Total labour (hours)
: Total labour cost (T$3/hr)
1.5 Gross Margin Sensitivity Analysis
1.6 Additional Data Time to harvest (months) Planting time
Source: Field survey, 1998; Gyles et al., 1989
12000
Quantity 25000
5
0 480
5
300 350 180 830
$2,490.00
Price: $/kg 0.10 0.20 0.30 0.40
480
8500 $410.00
$1,260.00 $2,110.00 $2,960.00
0.25
Price $0.00 $30.00
$0.00 $0.50 $10.00
Return per labour hour $3.08
Yield: kg/ha 11000
$660.00 $1,760.00 $2,860.00 $3,960.00
4 to 5 Plant spacing (m) March - July Plant density (pl/ha)
$3,000.00
Direct cost $0.00
$150.00 $0.00
$240.00 $50.00 $440.00
$2,560.00 $5.82
13000 $860.00
$2,160.00 $3,460.00 $4,760.00
1.2 x 0.9 9140
The best yields are obtained when sweet potato is planted between March and July. Spacing
ranges from 1.0 m x 1.0 m to 1.0 m x 1.5 m; an average of 1.2 m x 0.9 m is equivalent to 3700
plants/ac. Sweet potato is harvested mostly after 4-5 months, but can be harvested from 3-8
months.
7. Squash: scientific name - Cueurbita maxima (var. Oeliea), Tonga name - Hina.
Buttercup squash (Cueurbita maxima D.) is a hybrid member of the pumpkin family. It has
become an attractive vegetable in Japan and a standard staple. Squash is the most important
export commercial crop from Tonga. Production of squash for export to Japanese market
259

started in 1987 and during the last ten years squash export industry has developed to become
the mainstay of the Tongan economy.
TableA7: Economics of Squash Production.
Squash - Gross Margin per Hectare 1.1 Gross Income Activity/Item
Local sales 1.2 Variable Costs (T$) Activity/Item
Planting material (kg seed) Fertilizer • NPK (40kg bags)
- Urea (40kg bag) Mechanical cultivation (hours)
Chemicals -Packaging (bins)
Transport to market (trips) . Total Variable Costs 1.3 Gross Margin
Return to variable costs
1.4 GM Returns to Labour Land preparation/planting (hours) Maintenance (hours) Harvesting (hours) Grading (hours)
I Total labour (hours) • Total labour cost (3.0lhr)
Yield - kgs 8000
Quantity 2.5 10 5 5
18 3
Hours 50
300 150 100 600
$1,800.00 1.5 Gross Margin Sensitivity Analysis
1.6 Additional Data Time to harvest • Planting time
Price: $/kg 0.35 0.55 0.75 0.95
3 months July to August
Source: Field survey, 1998; Gyles et al., 1989
25kg bsk Price· $/kg Gross Income $0.50 $4,000.00
Price Variable Cost $300.00 $750.00 $27.00 $270.00 $22.00 $110.00 $35.00 $175.00 $0.00 $200.00 $6.00 $108.00 $20.00 $60.00
$1,673.00 $2,327.00
$1.39
Return per labour hour $3.88
7000 $777.00
$2,177.00 $3.577.00 $4,977.00
Yield: kg/ha 8500
$1,302.00 $3,002.00 $4,702.00 $6,402.00
Plant spaCing (m) Plant density (pl/ha)
10000 $1,827.00 $3,827.00 $5,827.00 $7.827.00
1.5 x 1.5 4500
The main export variety grown is Oelica. The best planting time is around July to August
during the drier part of the year. Planting materials consists of imported seeds purchased
through squash exporting companies or seed stores. Favourable results have been found
using chicken manure (0.60 kg per planting point at planting), and NPK. Sowing rate of about
1800 planting points per acre (spacing of 1.5m x 1.5m). Seeds are planted 3 to each planting
point at a depth of 3 cm. Squash takes about three months to mature with harvests occurring
in November.
8. Kava: scientific name· (Piper methysticum) , Tongan name - Kava Tonga.
Kava is the source of an important ceremonial and social drink in Tonga. The roots and
rhizomes of the kava plant are cut, sun-dried and crushed into a powder. The powder is mixed
260
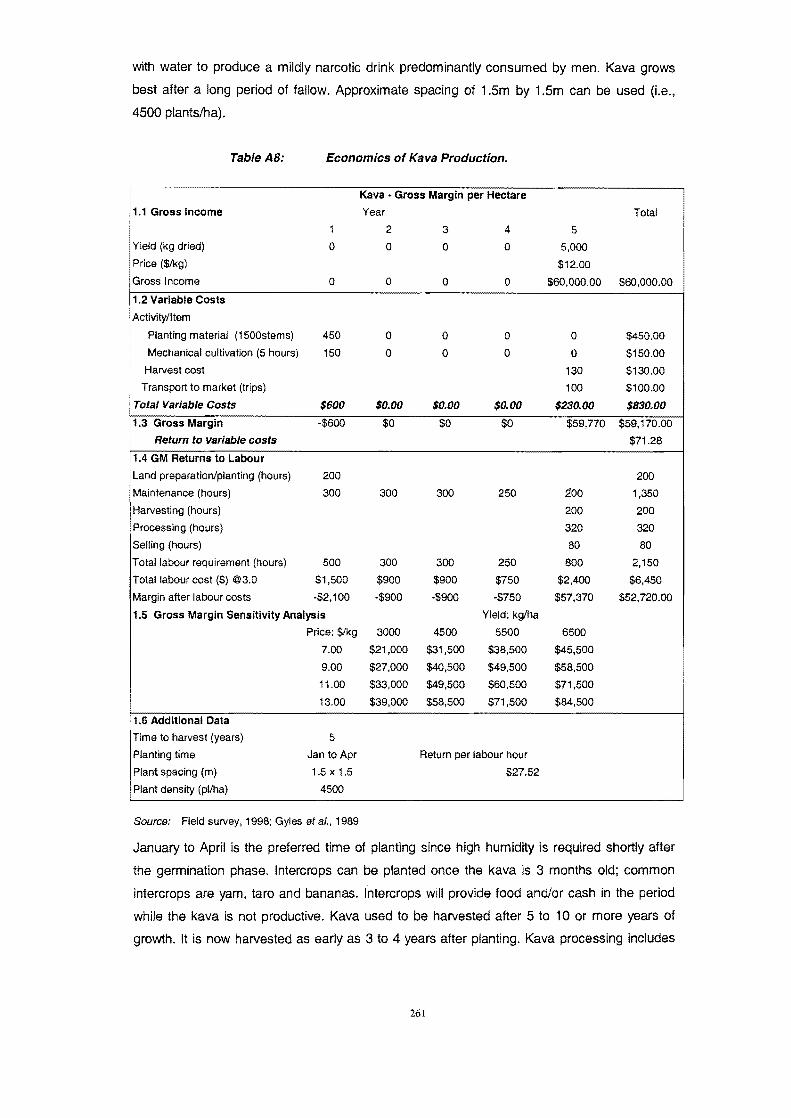
with water to produce a mildly narcotic drink predominantly consumed by men. Kava grows
best after a long period of fallow. Approximate spacing of 1.5m by 1.5m can be used (Le.,
4500 plants/ha).
Table A8: Economics of Kava Production.
Kava· Gross Margin per Hectare 1.1 Gross Income Year Total
1 2 3 4 5 Yield (kg dried) 0 0 0 0 5,000 Price ($/kg) $12.00 Gross Income 0 0 0 0 $60,000.00 $60,000.00 1.2 Variable Costs Activity/Item
Planting material (1500stems) 450 0 0 0 0 $450.00 Mechanical cultivation (5 hours) 150 0 0 0 0 $150.00
Harvest cost 130 $130.00 Transport to market (trips) 100 $100.00
Total Variable Costs $600 $0.00 $0.00 $0.00 $230.00 $830.00
i 1.3 Gross Margin -$600 $0 $0 $0 $59,770 $59,170.00 Return to variable costs $71.28
1.4 GM Returns to Labour Land preparation/planting (hours) 200 200 Maintenance (hours) 300 300 300 250 200 1,350 Harvesting (hours) 200 200 Processing (hours) 320 320 Selling (hours) 80 80 Total labour requirement (hours) 500 300 300 250 800 2,150 Total labour cost ($) @3.0 $1,500 $900 $900 $750 $2,400 $6,450 Margin after labour costs -$2,100 -$900 -$900 -$750 $57,370 $52,720.00 1.5 Gross Margin Sensitivity Analysis Yield: kglha
Price: $Ikg 3000 4500 5500 6500 7.00 $21,000 $31,500 $38,500 $45,500 9.00 $27,000 $40,500 $49,500 $58,500 11.00 $33,000 $49,500 $60,500 $71,500 13.00 $39,000 $58,500 $71,500 $84,500
1.6 Additional Data Time to harvest (years) 5 Planting time Jan to Apr Return per labour hour Plant spacing (m) 1.5 x 1.5 $27.52 Plant density (pi/hal 4500
Source: Field survey, 1998; Gyles etal., 1989
January to April is the preferred time of planting since high humidity is required shortly after
the germination phase. Intercrops can be planted once the kava is 3 months old; common
intercrops are yam, taro and bananas. Intercrops will provide food and/or cash in the period
while the kava is not productive. Kava used to be harvested after 5 to 10 or more years of
growth. It is now harvested as early as 3 to 4 years after planting. Kava processing includes
261

cleaning of stems and roots with water, cutting up the product for quicker drying, and drying in
the sun. On average 1 kg of green kava yields 0.6kg of dry (powdered) kava.
9. Vanilla: scientific name - Vanilla planifolia, Tongan name - Vanilla.
Vanilla is an important cash crop in Tonga. In Tonga, vanilla production is concentrated in
Vava'u, where soil and climate are particularly suited to the crop. Vanilla is normally planted at
a spacing of about 2.5m between rows and 1.5m along rows can be used or 1000 plants/ac.
Well-managed vanilla plantations should produce for 12 to 15 years. The first vanilla fruiting is
in the third year of growth, to be harvested in the fourth year. For this reason it is common to
grow intercrops in the first 2 years of production to supply food and cash to offset
accumulating development expenditures. Crops such as pineapples, vegetables, yams and
taro can be grown. Intercrops will not only provide food and cash for the farm family, but also
will shade the young vanilla plants and reduce the need for extra mulch and weeding.
The price of vanilla beans is dependent upon the world market for vanilla. The study showed
that current farmgate price of $10 kg green beans.
262
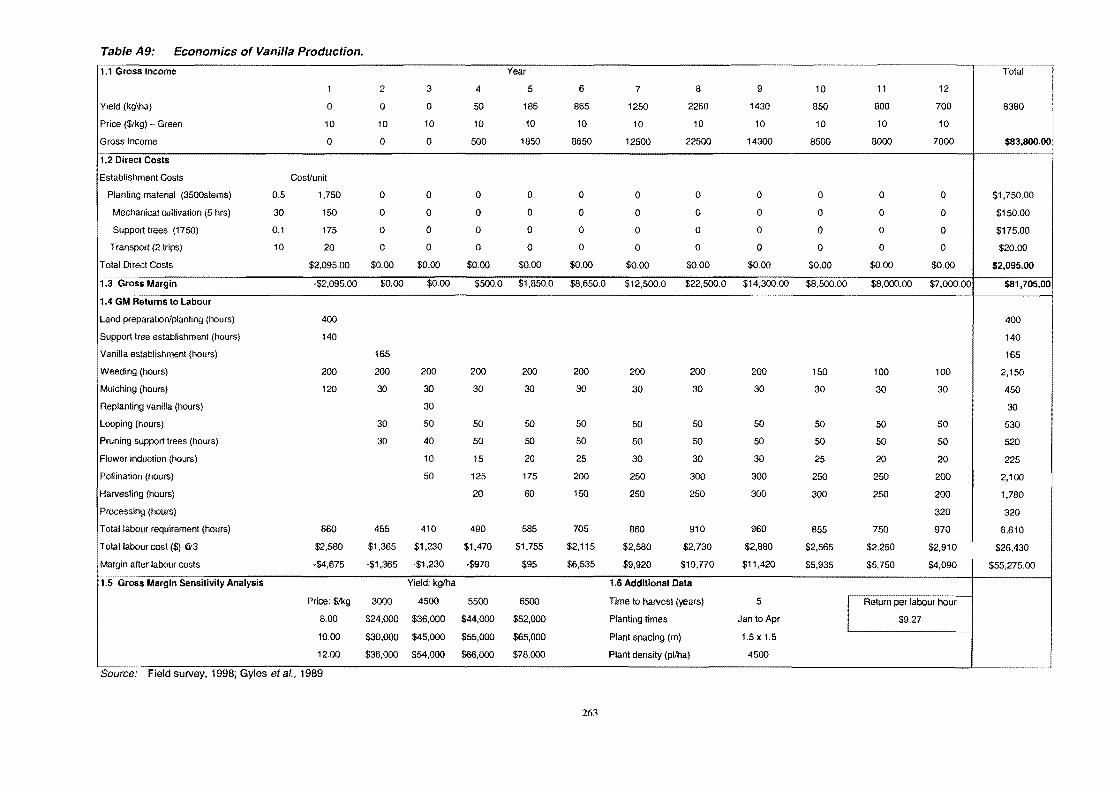
Table A9: Economics of Vanilla Production. 1.1 Gross Income Year Total
1 2 3 4 5 6 7 8 9 10 11 12
Yield (kg\ha) 0 0 0 SO 185 865 1250 2250 1430 850 800 700 8380
Price ($/kg) - Green 10 10 10 10 10 10 10 10 10 10 10 10
Gross Income 0 0 0 SOO 1850 86SO 12500 22500 14300 8500 8000 7000 $83,800.00
1.2 Direct Costs
Establishment Costs CosVunit
Planting material (3500slems) 0.5 1,750 0 0 0 0 0 0 0 0 0 0 0 $1,750.00
Mechanical cultivation (5 hrs) 30 150 0 0 0 0 0 0 0 0 0 0 0 $150.00
Support trees (17SO) 0.1 175 0 0 0 0 0 0 0 0 0 0 0 $175.00
Transport (2 trips) 10 20 0 0 0 0 0 0 0 0 0 0 0 $20.00
Total Direct Costs $2,095.00 $0.00 $0.00 $0.00 $0.00 $0.00 $0.00 $0.00 $0.00 $0.00 $0.00 $0.00 $2,095.00
1.3 Gross Margin -$2,095.00 $0.00 $0.00 $500.0 $1,8SO.0 $8,650.0 $12,500.0 $22,500.0 $14,300.00 $8,500.00 $8,000.00 $7,000.00 $81,705.00
DiGM Returns to Labour
Land preparation/planting (hours) 400 400
Support tree establishment (hours) 140 140
Vanilla establishment (hours) 165 165
Weeding (hours) 200 200 200 200 200 200 200 200 200 150 100 100 2,150
Mulching (hours) 120 30 30 30 30 30 30 30 30 30 30 30 450
Replanting vanilla (hours) 30 30
Looping (hours) 30 50 50 SO 50 50 SO 50 50 50 50 530
Pruning support trees (hours) 30 40 SO SO 50 50 SO 50 50 50 50 520
Flower induction (hours) 10 15 20 25 30 30 30 25 20 20 225
Pollination (hours) 50 125 175 200 250 300 300 2SO 2SO 200 2,100
Harvesting (hours) 20 60 150 250 250 300 300 250 200 1,780
Processing (hours) 320 320
T otallabour requirement (hours) 860 455 410 490 585 705 860 910 960 855 750 970 8,810
Totallabouroosl($) @3 $2,580 $1,365 $1,230 $1,470 $1,755 $2,115 $2,580 $2,730 $2,880 $2,565 $2,250 $2,910 $26,430
Margin after labour costs -$4,675 ·$1,365 -$1,230 -$970 $95 $6,535 $9,920 $19,770 $11,420 $5,935 $5,750 $4,090 $55,275.00
1.5 Gross Margin sensitivity Analysis Yield: kglha 1.6 Additional Data
Price: $!kg 3000 4500 5500 6500 Time to harvest (years) 5
I Return per labour hour
8.00 $24,000 $36,000 $44,000 $52,000 Planting times Jan to Apr $9.27
10.00 $30,000 $45,000 $55,000 $65,000 Plant spacing (m) 1.5 x 1.5
12.00 $36,000 $54,000 $66,000 $78,000 Plant density (pl/ha) 4500 I c-.........
Source: Field survey, 1998; Gyles et a/., 1989
263
Copyright © 2022 FDOKUMEN