High global food prices – crisis or opportunity for smallholder farmers in Tanzania?
186
High Global Food Prices - Crisis or Opportunity for Smallholder Farmers in Ethiopia, Malawi and Tanzania By Ruth Haug, Worku Tessema, Thomas Lemma, Trygve Berg, Alexander R. Phiri, James W. Banda, Emmanuel E. Kaunda, Joseph Hella, Illuminatus Kamile and Carl Erik Schulz Noragric Report No. 48 Department of International Environment and Development Studies Noragric
-
Upload
independent -
Category
Documents
-
view
1 -
download
0
Transcript of High global food prices – crisis or opportunity for smallholder farmers in Tanzania?

High Global Food Prices - Crisis or Opportunity for Smallholder Farmers in Ethiopia, Malawi and Tanzania
By Ruth Haug, Worku Tessema, Thomas Lemma, Trygve Berg,Alexander R. Phiri, James W. Banda, Emmanuel E. Kaunda,Joseph Hella, Illuminatus Kamile and Carl Erik Schulz
No
ragric Report N
o. 48
Departm
ent o
f Intern
ation
al Enviro
nm
ent an
d D
evelopm
ent S
tud
iesN
ora g
ric

HIGH GLOBAL FOOD PRICES - CRISIS OR
OPPORTUNITY FOR SMALLHOLDER FARMERS IN ETHIOPIA, MALAWI AND TANZANIA
By
Ruth Haug, Worku Tessema, Thomas Lemma, Trygve Berg, Alexander R. Phiri, James W. Banda, Emmanuel E. Kaunda,
Joseph Hella, Illuminatus Kamile and Carl Erik Schulz
Noragric Report No. 48 September 2009
Department of International Environment and Development Studies, Noragric
Norwegian University of Life Sciences

Noragric is the Department of International Environment and Development Studies at the Norwegian University of Life Sciences (UMB). Noragric’s activities include research, education and assignments, focusing particularly, but not exclusively, on developing countries and countries with economies in transition. Noragric Reports present findings from various studies and assignments, including programme appraisals and evaluations. This Noragric Report was commissioned by the Norwegian Agency for Development Cooperation (NORAD) under the framework agreement with Noragric. Extracts from this publication may only be reproduced after prior consultation with the employer of the assignment (NORAD) and with the consultant team leader (Noragric). The findings, interpretations and conclusions expressed in this publication are entirely those of the authors and cannot be attributed directly to the Department of International Environment and Development Studies (UMB/Noragric).
Haug, Ruth1, Worku Tessema2, Thomas Lemma3, Trygve Berg4, Alexander R. Phiri5, James W. Banda6, Emmanuel E. Kaunda7, Joseph Hella8, Illuminatus Kamile9 and Carl Erik Schulz10. High global food priceor opportunity for smallholder farmers in Ethiopia, Malawi and Tanzania. Noragric Report No. 48 (September
s - crisis
evelopment Studies, Noragric ersity of Life Sciences (UMB)
3 as
ternet: http://www.umb.no/noragric
organ/UMB Printed at: Rotator, Ås
2009). Department of International Environment and DNorwegian UnivP.O. Box 500N-1432 ANorway Tel.: +47 64 96 52 00 Fax: +47 64 96 52 01 In ISSN: 1502-8127 Photo credits: Digital Vision (cover) Cover design: Åslaug B
1 Norwegian University of Life Sciences 2 Hawassa University, Ethiopia 3 Hawassa University, Ethiopia 4 Norwegian University of Life Sciences 5 Bunda College, Malawi 6 Bunda College, Malawi 7 Bunda College, Malawi 8 Sokoine University of Agriculture, Tanzania 9 Sokoine University of Agriculture, Tanzania 10 Norwegian University of Life Sciences
ii

TABLE OF CONTENTS Acknowledgements v List of Abbreviations vi Summary 1 1. INTRODUCTION 2 2. OBJECTIVES AND APPROACH 3
2.1. Objectives 3 2.2. Approach 3
3. CONTEXTUAL BACKGROUND 4 3.1. The recent food crisis 4 3.2. Food production, the environment and climate change 7 3.3. High food prices: Winners and losers 9 3.4. Food crisis: Recommended action 12
4. HIGH GLOBAL FOOD PRICES – IMPACT AT COUNTRY LEVEL 14 4.1. Agricultural production and food security in Ethiopia, Malawi & Tanzania 14 4.1.1. Ethiopia 15 4.1.2. Malawi 17 4.1.3. Tanzania 20 4.2. Impact of high food prices on smallholder farmers 22 4.2.1. Ethiopia 22 4.2.2. Malawi 24 4.2.3. Tanzania 26 4.3. Lessons learned from the global food crisis in Ethiopia, Malawi & Tanzania 29
5. CONCLUSION 31 6. RECOMMENDATIONS 32 REFERENCES 33 List of Figures Figure 1a World cereal prices 2007-09 (FAO, 2009b) 6 Figure 1b Food price indices May 2008 – May 2009 (FAO, 2009b) 7 Figure 2 Cereal production in developed and developing countries (FAO, 2009d) 8 Figure 3 Food price increase in Ethiopia- January 2009 (FAO/WFP, 2009) 16 Figure 4 Maize price increase in Malawi, real and nominal terms (Banda et al., 2008) 17 Figure 5 Agricultural price seasonality in Malawi - Spatial Maize Market Integration (Sopo et al., 2009) 18
iii

Figure 6 Relative Monthly Maize Prices for 2007 and 2008 (Food and Nutrition Security Technical Secretariat, Ministry of Agriculture in Phiri, 2008) 19 Figure 7 Maize prices in Tanzania in 2007-08 (FAO, 2008b) 21 Figure 8 Price trends for five major crops in Songea district (Ruvuma) (Source DALDO Songea) 21 List of Tables Table 1 Overview of food and agriculture in Ethiopia, Malawi and Tanzania (World Bank, 2009) 15 Table 2 Ethiopia: Lessons learned from Arsinegelle (West Arsi Zone of Oromia region) and Damot Sore of Wolaita Zone in the South 22 Table 3 Malawi: Lessons learned from Chileka EPA (Lilongwe) and Matenje EPA (Salima) 24 Table 4 Tanzania: Lessons learned from Chigongwe village in Nala ward in Dodoma region and Mgazini village in Songea rural district Ruvuma regions 26 APPENDICES 38 Appendix 1. Rising Food prices: Crisis or Opportunity? Lessons from Arsi Negelle and Wolaita Areas of Ethiopia Appendix 2. Rising Food prices: Crisis or Opportunity? A case study of Chileka and Matenje Extension Planning Areas in Lilongwe and Salima Districts, Malawi Appendix 3. Food prices and world poor: Winners and losers. A case study of two villages in Tanzania
iv

ACKNOWLEDGEMENTS To all smallholder farmers and consumers in the study areas in Ethiopia, Malawi and Tanzania, who willingly provided information and shared their experience and insight with us. To the late team member, Professor Carl Erik Schulz, who passed away in South Africa in November 2008 and who believed strongly in a more equitable and just world also for Africa and who was instrumental in developing the outline for this study. To the universities of Hawassa, Bunda and Sokoine who do a wonderful job in educating the change agents of tomorrow and in producing knowledge for the future. Thank you on behalf of the Norwegian University of Life Sciences for many years of excellent partnership and collaboration. Ruth Haug
v
vi
LIST OF ABBREVIATIONS ADP Agricultural Development Program ADMARC Agricultural Development and Marketing Corporation ARDEP Agricultural Research and Development Program ASWAp Agriculture Sector Wide Approach CFA Comprehensive Framework for Action DALDO District Agricultural and Livestock Development Officer GDP Gross Domestic Product FAO Food and Agriculture Organization of the United Nations GRAIN Small international non-profit organization: http://www.grain.org HLTF High Level Task Force IFAD International Fund for Agricultural Development IFPRI International Food Policy Research Institute MKUKUTA Swahili acronym standing for National Strategy for Growth and Poverty
Alleviation (NASGPA) MK Malawi Kwacha MT Metric Ton NBS National Bureau of Statistics, Tanzania NFRA National Food Reserve Agency OECD Organization for Economic Co-operation and Development OXFAM Oxford Committee for Famine Relief PPP Purchasing Power Parity UMB Norwegian University of Life Sciences (In Norwegian: Universitetet for miljø og
biovitenskap) UN United Nations UNCTAD United Nations Conference on Trade and Development WB World Bank WFP World Food Program

High Global Food Prices – Crisis or opportunity for smallholder farmers in Ethiopia, Malawi and Tanzania
SUMMARY The main purpose of this study is to assess how the recent food crisis with its high food prices has impacted on smallholder farmers in Ethiopia, Malawi and Tanzania when it comes to production, food and livelihood security. The three countries Ethiopia, Malawi and Tanzania were selected as cases for the study based on importance of agriculture in these countries, the high proportion of rural poor and institutional collaboration with the Norwegian University of Life Sciences. Sample surveys were carried out by three different country teams during the first months of 2009. In Africa, the food crisis is a matter of low production and income, high prices, poverty and food insecurity while in developed countries the food crisis is associated with excessive speculation, agro-business profits, “land grabbing” and subsidized agriculture. The high international food prices have to a varying degree and in combination with other factors been transmitted to Africa. The observed price surge and food insecurity situation in Ethiopia, Malawi and Tanzania are caused by many aspects different from high food prices at the world market. The high food prices in the three countries provide opportunities for net-selling farmers and for traders/middlemen to improve their income and livelihoods. However, for the majority of people comprising rural net-buying farmers, rural wage workers and poor urban consumers, the food price increase appears to have been a disaster. The findings from the three country studies indicate that net-selling smallholder farmers in the better-off areas of Ethiopia benefit more from food price increase than in the other two countries, reasons being that the market has become more conducive for the producers and the use of inputs can be profitable. In Tanzania, net-selling smallholders in the better-off areas also benefit from price increase, but the agricultural policy is not as conducive to boost production as in Ethiopia. In Malawi, basically, neither smallholders in food surplus nor food deficit areas benefit from the high food prices since only a small proportion of smallholder farmers in both categories are net-sellers. The main lessons learned are that more smallholders than expected have benefitted from high food prices in the better-off areas in Ethiopia and Tanzania, but not in Malawi.
1

High Global Food Prices – Crisis or opportunity for smallholder farmers in Ethiopia, Malawi and Tanzania
1. INTRODUCTION In June 2009, FAO released new estimates indicating that world hunger is projected to reach a record high of 1,020 million people going hungry in 2009 (FAO, 2009a). This discouraging news makes the first Millennium Development Goal of halving world poverty and hunger by the year 2015 further away than ever. The Director General of FAO explains the main reason for the increase in world hunger as a dangerous mix of the global economic slowdown combined with stubbornly high food prices and adds that poor global harvests are not a reason for the recent increase in hunger (FAO, 2009a). Figures from FAO’s Food Outlook indicate record high world cereal production in 2008 and 2009. The OECD-FAO Agricultural Outlook 2009-2018 also underlines that the longer term problem is access to food rather than food availability (OECD-FAO, 2009). The world food and fuel crisis of 2006-08 and the current financial crisis have added new dimensions to the development challenges. We still know little about how poor people in poor countries will be impacted by what is predicted to be the consequences of the financial crisis such as decreases in foreign investments going to developing countries, decline in remittances and drops in official development assistance. We also do not know much about how local people in different African countries have been affected by the high food prices. However, the recent world hunger estimates indicate that the situation is worsening. According to FAO, hunger is rising in all world regions and Sub-Sahara Africa has the largest prevalence of undernourishment relative to its population size: 32% (FAO, 2009a). Globally, in 2009, 36 countries are facing a food security crisis and 21of these countries are in Africa, including Ethiopia (UNCTAD, 2009). The high food prices are driving vulnerable people further into poverty and of particular concern is the deterioration of the nutritional status of pregnant and lactating women and of pre-school children, the withdrawal of children, especially girls, from school, and distress sales of productive assets (Braun, 2008a,b). World food prices have decreased since the high record in mid 2008, but are still much higher than before the global food crisis evolved. According to UNCTAD (2009), the 2008 food crisis should be taken as a wake-up call that action is needed. Social unrest and protests in relation to the high food prices took place in more than 30 countries during early 2007 and May 2008 (Braun, 2008b). If not already recognized, these food riots made the world realize the political sensitivity of high food prices. UNCTAD underlines the need to understand lessons from the food crisis to be able to take the right action to assist African countries in improving their food security situation. The main purpose of this study is to assess how high food prices have impacted on smallholder farmers in Ethiopia, Malawi and Tanzania when it comes to production, food and livelihood security. Many countries in Africa are trying to keep the food prices down which benefits poor consumers, but which might reduce overall production. Different schemes for subsidizing food may also be straining already limited national budgets in Africa. However, if the conditions for
2

High Global Food Prices – Crisis or opportunity for smallholder farmers in Ethiopia, Malawi and Tanzania
agricultural innovation and livelihood improvements do not change, few farmers are expected to benefit from the higher prices. The World Food Program (WFP) has estimated that only one out of ten farmers in Africa will benefit from the food price increase. There is a saying that you should never lose the opportunities that lie in a crisis. High food prices have a large negative effect on urban consumers, net-buying rural farmers and rural wage laborers (Benson et al., 2008). The question is to what degree some smallholder farmers might have or will be able to benefit from the food price increase or if more or less everybody is losing out. If some smallholders are able to benefit from the price increase who are they? What made them able to take advantage of the situation and what could be the lessons learned that could benefit others? Another question is what about poor urban consumers and poor rural producers who consume more food than they are able to produce - how to find the right balance between farmers getting a fair price for their production and at the same time supplying poor consumers with affordable food?
2. OBJECTIVES AND APPROACH 2.1. OBJECTIVES The study addressed the following two main objectives:
• To assess how high food prices have impacted on both men and women smallholder farmers in Ethiopia, Malawi and Tanzania when it comes to production, food and livelihood security.
• To assess how different national and international actors could contribute towards
reducing negative impacts of high food prices on poor rural and urban consumers and at the same time utilizing the opportunities that high food prices might provide for men and women smallholder farmers in Ethiopia, Malawi and Tanzania.
2.2. APPROACH The three countries Ethiopia, Malawi and Tanzania were selected as cases for the study based on the following criteria:
• Importance of agriculture in the country (GDP, income, employment) • Limited degree of urbanization • High proportion of poor people in the rural areas in the country • Institutional collaboration between the Norwegian University of Life Sciences and
partner universities in the countries.
3

High Global Food Prices – Crisis or opportunity for smallholder farmers in Ethiopia, Malawi and Tanzania
Field work was carried out during the first months of 2009, and country reports written by researchers at Bunda College of Agriculture in Malawi, Sokoine University of Agriculture in Tanzania and Hawassa University in Ethiopia in collaboration with the team at the Norwegian University of Life Sciences (UMB). Within the three countries two different villages were selected as study areas based upon food deficit and food surplus11 variables with the intention of capturing some of the huge diversity within the countries. Sample surveys were undertaken in these six villages based on pre-developed and pre-tested questionnaires. The samples were drawn randomly from the village population; however, the villages where purposely selected, hence, we cannot generalize to the whole country. Although the sample size is small, the findings still offer some indications on what might be the situation in the countries. The data were analyzed using descriptive statistics and some narratives to present the qualitative data. The qualitative data were collected by interviewing key informants such as traders and urban consumers. The methods are described in more detail in each of the country cases (reports are enclosed in the Appendices). Limitations in relation to the study are related to the possibility of respondents for different reasons not providing accurate answers (figures) to many of the quantitative questions (production, income, prices, and consumption) and the limited time available for the study. 3. CONTEXTUAL BACKGROUND 3.1. THE RECENT FOOD CRISIS The current food system being global12 or local13 in nature appears to be unable to address many of the difficult challenges related to food, hunger and livelihood security. Most people would agree that the food system should aim for (see UN Millennium Development Goals):
11 FAO uses the term ‘food deficit’ to classify countries. The classification of a country as low‐income food‐deficit is traditionally determined by three criteria: per capita income, the net food trade position of a country average over the preceding 3 years and the self‐exclusion criterion (FAO‐InfoSys, 2009). In this study, food deficit and food surplus areas within the three countries are defined in the country studies (see appendices).
12Pinstrup‐Andersen (2002:2) defines a ’global food system’ as a system that links national and local food systems from around the world in a clearly defined manner, for example, through trade, information sharing, technology, or some other observable way.
13 Sonnino & Marsden (2006) define local food systems as an alternative to the global corporate models where producers and consumers are separated through a chain of processors/manufacturers, shippers and retailers. As the food industry grows, the ‘middle man’ is increasingly able to control the quality of food. Conversely, the local food system redevelops these relationships and encourages a return of quality control to the consumer and the producer respectively. These quality characteristics are not only in the produce but in the method of producing.
4

High Global Food Prices – Crisis or opportunity for smallholder farmers in Ethiopia, Malawi and Tanzania
• Availability of food • Nobody going hungry • Nutritious and high quality food • Environmentally friendly production of food Affordibility of food yet at the same time
producers geting a fair price • Cultural aspects that should be taken care of
How to prioritize between these goals is a different question and what kind of development path will enable us to reach the goals is also highly debatable. At the global level, the food system is much more interlinked than before although both the food crisis and the financial crisis have contributed towards more protection in relation to agricultural policy and trade. In addition, the “new” phenomenon of land grabbing not only within but also between countries is creating unusual arenas of agro-investment and possible marginalization of local people (Cotula et al., 2009; Braun & Meinzen-Dick, 2009; GRAIN, 2008a). What we see is that different kinds of agricultural policies in northern countries are increasingly impacting the food security situation in developing countries. In this report, we use the concept food crisis without really providing a definition of what a food crisis is. In many ways we already had a food crisis before the 2008 food crisis hit in the sense that more than 850 million people around the world were hungry. According to Patel (2008) what made the 2008 situation different was the rapidity of the change, with food prices doubling and tripling, but incomes remaining static. That means that many more people are now unable to afford to feed their families. And throughout this process, it has been women rather than men who have been hit hardest, being the ones who skip meals so the rest of their family can eat. That's an everyday crisis that has been ignored for decades (Patel, 2008). The recent food crisis has contributed towards the number of hungry people in the world jumping from about 850 million to 1,020 million (FAO, 2009a). There are many explanations to why the food crisis developed and to what degree it is now over. Between 2005 and the summer of 2008, the international prices of wheat and maize tripled and rice prices increased by a factor of five (Mitchell, 2008). For poor people who spend about 50-70% of their income on food (Braun 2008b), the price increases have been devastating. Norwegians spend on average only 11% of their household incomes on food and do not experience much impact of the huge hike in world cereal prices due to a policy regime of substantial producer support and consumer subsidies. But the price increase appears to have contributed towards fear that food scarcity might happen also in Norway and the rest of the rich part of the world. FAO estimates that world food production has to double by the year 2050 to meet the demands of a population which will reach around nine billion and require a better diet than today (FAO, 2008).
5

High Global Food Prices – Crisis or opportunity for smallholder farmers in Ethiopia, Malawi and Tanzania
The recent food crisis has been explained by drought, biofuels, high oil price, and poor people becoming less poor and, accordingly, improving their diets – all contributing towards a deficit as related to production or availability of food. Another way of explaining the food crisis did not put so much emphasis on lack of production, but on economic policy failure, speculations, global trade and deregulations, dominance of big companies and structural injustice. UNCTAD (2009) divides the food crisis into a production crisis and a price crisis. The production crisis is explained by low productivity and production in African agriculture while the price crisis arose from a malfunctioning and manipulation of the market. Figure 1 illustrates the hike in world food prices in mid 2008. According to FAO, the falling prices might not be due to high yield records, but prices might be driven down by slowing demand as poverty is increasing. Figure 1a. World cereal prices 2007-09 (FAO, 2009b)
6
High Global Food Prices – Crisis or opportunity for smallholder farmers in Ethiopia, Malawi and Tanzania
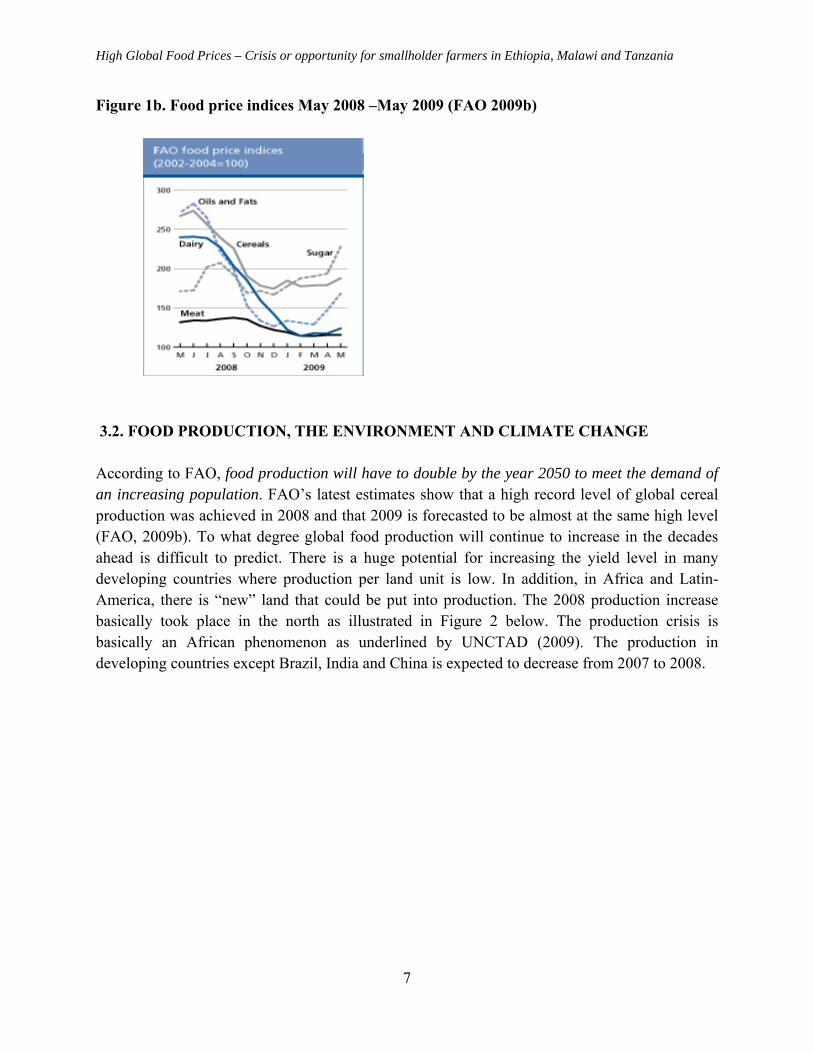
Figure 1b. Food price indices May 2008 –May 2009 (FAO 2009b)
3.2. FOOD PRODUCTION, THE ENVIRONMENT AND CLIMATE CHANGE According to FAO, food production will have to double by the year 2050 to meet the demand of an increasing population. FAO’s latest estimates show that a high record level of global cereal production was achieved in 2008 and that 2009 is forecasted to be almost at the same high level (FAO, 2009b). To what degree global food production will continue to increase in the decades ahead is difficult to predict. There is a huge potential for increasing the yield level in many developing countries where production per land unit is low. In addition, in Africa and Latin-America, there is “new” land that could be put into production. The 2008 production increase basically took place in the north as illustrated in Figure 2 below. The production crisis is basically an African phenomenon as underlined by UNCTAD (2009). The production in developing countries except Brazil, India and China is expected to decrease from 2007 to 2008.
7

High Global Food Prices – Crisis or opportunity for smallholder farmers in Ethiopia, Malawi and Tanzania
Figure 2. Cereal production in developed and developing countries (FAO, 2009d)
According to FAO, the forecast for production increase where it is most needed does not look all that good: In Low-Income Food-Deficit countries, prospects for the early 2009 cereal crops point to a lower output. The challenge is how to increase production also in developing countries where smallholder farmers are in dire need of livelihood improvements and governments indeed need the economic contribution to GDP that agriculture can provide. Production in African agriculture is low compared with other regions and has not had any real yield improvements over past decades (UNCTAD, 2009). In the 1970s, African countries were exporting food while in 2008 they imported about 25% of food. According to UNCTAD (2009), 45% of wheat and 84% of rice consumed in Africa is imported. Another challenge is how to increase production in an environmentally friendly way as related to water use, avoiding land degradation, pollution, loss of biodiversity, deforestation and health risks from the use of agro-chemicals. Fertilizer use in Africa is only 8 kg/ha compared to more than 100 kg/ha globally (UNCTAD, 2009). For smallholder African farmers other soil fertility improvement measures can be employed as alternatives or supplements to fertilizer, e.g., conservation farming that is gaining popularity in African countries (Norad, 2007). Climate change is expected to have huge negative impacts on agricultural production in Africa. According to IPCC (2007) reduced yields from rain fed crops in Africa and other parts of the world are likely to place an additional 170 million more people at risk of hunger. Adapting agriculture to the impact of climate change might play an important role in relation to future production increase and food security especially in Africa. Also policy measures in relation to addressing climate change challenges e.g., in relation to biofuel production might impact
8

High Global Food Prices – Crisis or opportunity for smallholder farmers in Ethiopia, Malawi and Tanzania
negatively on food supply and poor people’s livelihoods. FAO's forecast for 2008/09 estimates that about 4.6 percent of world cereal production will be used for biofuels in 2009 (FAO, 2009b).
3.3. HIGH FOOD PRICES: WINNERS AND LOSERS
There are many ways of explaining the recent food crisis, food insecurity and world hunger and how the world is being impacted by the food crisis. One way of explaining the crisis is that something is wrong with the global food system and that structural change is needed. In the quote below from a report by GRAIN the emphasis is put on the profits of investors.
Since 1961 the world’s cereal output has tripled, while the population has doubled. Stocks are at their lowest level in 30 years, it’s true, but the bottom line is that there is enough food produced in the world to feed the population. The problem is that it doesn’t get to all of those who need it. Less than half of the world’s grain production is directly eaten by people. Most goes into animal feed and, increasingly, biofuels – massive inflexible industrial chains. In fact, once you look behind the cold curtain of statistics, you realize that something is fundamentally wrong with our food system. We have allowed food to be transformed from something that nourishes people and provides them with secure livelihoods into a commodity for speculation and bargaining. Today it is staring us in the face that this system puts the profits of investors before the food needs of people (GRAIN, 2008b).
The FAO website provides fact sheets with answers to topical questions in relation to the food crisis. Below is a quote on how FAO perceives the impact of high food prices regarding who benefits and who loses.
It is evident that, when food prices rise, consumers are the first to suffer. Especially in low-income and food-deficit countries, rising food prices translate into hefty increases of food import bills with negative impacts on the balance of payments. For several years, consumers around the world have benefited from low food prices. In many countries, farmers could only grow agricultural crops thanks to strong government support. Most developing countries could not afford to provide such support measures. As a result, investment in agriculture has declined and many poorer countries became increasingly dependent on imports to meet their domestic food requirements. If today’s high prices really trickle down to the farm level in developing countries, they could have a very positive impact on food production and convert agriculture into an engine of growth and employment, especially in rural areas (FAO, 2009c).
It is interesting to note that FAO explains the situation that has occurred in many developing countries in relation to high food prices’ contribution to increased hunger and riots with import
9

High Global Food Prices – Crisis or opportunity for smallholder farmers in Ethiopia, Malawi and Tanzania
of cheap subsidized food from the North followed by lack of investment in own agricultural development. UNCTAD (2009) also states that the neglect of the agricultural sector in Africa for decades has been leading to the food crisis (UNCTAD, 2009). Development assistance to food and agriculture has been declining since 1980 by 85% in multilateral assistance and 39% in bilateral assistance (UNCTAD, 2009). Who are losing out due to the high food prices? According to Braun (2008b) most countries in Africa are net importers of cereals and they are hit hard by rising prices. Within the countries, the poor and the vulnerable are the ones hardest hit, spending a considerable proportion of their income on food, 50-70% (Braun, 2008c). Among the poor, poor urban consumers, poor rural producers who buy more food than they produce, landless wage workers and women-headed households are hardest hit;-women are more negatively affected than men since they often eat last and least (Braun, 2008b). Women are less able to cope with and overcome crises than men because they have less access to and control over resources than men and they experience gender-based vulnerabilities, including extensive time burdens, threats or acts of violence, and limited legal benefits and protection, decision making authority, and control of financial resources (Quisumbing, Meinzen-Dick & Bassett, 2008). At the same time as food prices increased, oil prices also hiked and contributed towards inputs becoming much more expensive than anticipated. Since very many of the smallholders do not use commercial fertilizer they are not directly affected by the price increase of fertilizer in their production, but fertilizer prices impact food prices which will hurt if they are net buyers of food. Smallholder farmers who use fertilizer and do not benefit from any support were hit hard by the price increase of fertilizer. In general it appears that agricultural inputs remain expensive relative to farm-gate prices (Braun, 2008a). Also, commercial farmers were affected negatively in many countries because of policy measures to keep food prices from getting out of control. An FAO survey found that more than 20 countries imposed export controls of some kind – either in the form of taxes or quantitative controls such as outright bans and quotas (FAO, 2009b). This kind of food policy price controls might work as a disincentive for commercial farmers to produce. In general, the losers of the high food prices appear to be:
• Poor urban consumers in developing countries • Poor rural producers in developing countries who buy more food than they sell • Poor rural landless in developing countries • Poor urban and rural women-headed households, and in general women more than men • Smallholder farmers in developing countries adversely affected by the price increase of
inputs • Commercial farmers in developing countries where price measures e.g. export control
were introduced • Poor consumers in some developed countries
10

High Global Food Prices – Crisis or opportunity for smallholder farmers in Ethiopia, Malawi and Tanzania
To what degree do we find winners in relation to high food prices? According to Oxfam (2008) there are few winners and many losers. The FAO figures indicate that the increase in cereal production recorded in 2008 basically took place in the developed countries (Figure 2). Farmers in the North were able to use the opportunity that came with the high food prices and increased their production and income. Benson et al (2008) have developed a conceptual framework for understanding the welfare impact of the food crisis in developing countries. In this framework for analyzing the situation, only rural net-selling farmers are listed as positively affected households. Short-term impact on welfare and real income of different types of households (Benson et al., 2008:5): • Urban rich: negative but small proportional effect • Urban poor: negative and large proportional effect • Rural wage laborers: negative and large effect • Rural farmers, net sellers: positive effect • Rural farmers, net buyers: negative effect But as Patel (2007) phrases it in his book Stuffed and Starved – the hidden battle for the world food system the analysis has to go beyond the household level and also look at the global level where agro-business, supermarkets and investors play important roles. GRAIN (2008b) has assessed the profit level among several agro-business companies, the top three global fertilizer companies, Potash Corp, Mosaic and Yara, which increased their profits by 139% in 2007. The three global grain trade companies, Cargill, ADM, and Bunge, increase their profits by 103% in 2007. Monsanto, Syngenta and DuPont increased their profit by 91% in 2007 (GRAIN, 2008b). According to GRAIN (2008b),
speculators and traders, who are having a field day, hedge funds and other sources of hot money are pouring billions of dollars into commodities to escape sliding stock markets and the credit crunch, putting food stocks further out of poor people’s reach. Investment funds now control 50–60% of the wheat traded on the world’s biggest commodity markets. One firm calculates that the amount of speculative money in commodities futures – markets where investors do not buy or sell a physical commodity, like rice or wheat, but merely bet on price movements – has ballooned from US$5 billion in 2000 to US$175 billion in 2007.
Also UNCTAD (2009) underlines the shortcomings of the international food market which makes it possible for a handful of investors in pursuit of profit to disrupt millions of people’s access to food - and Braun (2008a) states that speculative capital has played a role in the rise of food prices. In general, the winners of the high food prices appear to be:
• Investors and speculators • Agro-business and supermarkets
11

High Global Food Prices – Crisis or opportunity for smallholder farmers in Ethiopia, Malawi and Tanzania
• Farmers in developed countries • Some few net-selling farmers in developing countries
When the global food prices started to increase, one view was that the price increase might create new opportunities for smallholder farmers in poor countries to increase their income and improve their livelihoods. Unfortunately, farmers in developing countries do not seem to have benefitted much from the price increase. In the following chapters, we will assess how high food prices have impacted on smallholder farmers in Ethiopia, Malawi and Tanzania by analyzing empirical data collected at the village level in these three countries.
3.4. FOOD CRISIS: RECOMMENDED ACTION In the literature (e.g. from institutions such as UN, FAO, IFPRI, WB, WFP, IFAD, OECD, UNCTAD, GRAIN, OXFAM) there are different sets of recommendations for what developing countries’ governments, international and bilateral donors should do to address current and future food crises in the best possible way. The food crisis led to the establishment by the United Nations of the High Level Task Force on the global food security crisis (HLTF) which developed a Comprehensive Framework for Action (CFA) which was presented by the chair UN Secretary General Ban Ki-moon in July 2008. The CFA presents two sets of actions to promote a comprehensive response to the global food crisis (HLTF, 2008):
a. Immediate needs of vulnerable populations • emergency food assistance, nutrition interventions and safety nets to be enhanced and
made more accessible • smallholder farmer food production to be boosted • trade and tax policies to be adjusted • macroeconomic implications to be managed b. Build resilience and contribute to global food and nutrition security in the longer-
term • social protection systems to be expanded • smallholder farmer-led food availability growth to be sustained • international food markets to be improved • international biofuel consensus to be developed
There was consensus within the HLTF that the above recommendations were the most important action to be taken. It was also agreed that actions needed to be harmonized and coordinated and that the framework provided an excellent vehicle for such coordination. In addition to the CFA being developed by UN institutions and other international institutions such as the World Bank,
12

High Global Food Prices – Crisis or opportunity for smallholder farmers in Ethiopia, Malawi and Tanzania
we also include recommendations from the OXFAM report Doubled-Edged Prices that is very supportive of the CFA and of UN leadership. Oxfam (2008: 33-34) recommends that developing country governments, with the support of donors, should:
• Increase public spending on agriculture to generate supply in the short term, and provide support to smallholder farmers in the longer term
• Properly target farming sector expenditure, both in order to provide the public services required and to reach small-scale producers
• Invest in social protection programmes to enable citizens to meet their basic needs, protect their livelihoods from potential threats, and improve their social status and rights
• Consider contributing to national or regional strategic food reserves to counteract food shortages and market volatility
• Adopt trade measures that protect small-scale producers, strategic agricultural sectors, and emerging companies
• Avoid resorting to trade measures that could exacerbate the crisis or undermine long-term development prospects. Export bans should be avoided if possible as such bans may harm countries and population groups that are net food importers or purchasers
• Support the creation and strengthening of trade unions, producer organizations, and women’s groups in particular, in order that they can take part in the design, implementation, and monitoring of food and agricultural policies and demand favorable national policies, and also so that they can negotiate collectively to bring down the prices of inputs purchased and obtain better wages and prices for their products
• Promote access to assets and services, particularly for women farmers. Access to land, water, seeds, fertilizer, technology, loans, infrastructure and energy is often insufficient, insecure or too expensive
• Address the problems of waged agricultural workers, developing and enforcing labor legislation for rural workers establishing guaranteed employment programmes for people who remain unemployed out of season
• Build community-level resilience to climate change to ensure that poor producers can benefit from higher food prices and both adapt to and mitigate the impacts of climate change
In addition, rich countries, the World Bank, and other donors should (Oxfam, 2008 cont.):
• Coordinate their action and funding through a UN-led mechanism, building on the work done by the High Level Task Force on food crisis
13

High Global Food Prices – Crisis or opportunity for smallholder farmers in Ethiopia, Malawi and Tanzania
• Increase investment in development assistance to agriculture in developing countries, particularly for smallholders. Funding should be new, predictable, in grant form, and additional to health and education funding
• Stop pressing for rapid liberalization and opposing adequate safeguards for developing countries in multilateral, regional, and bilateral trade negotiations and agreements
• Reform their agriculture and trade policies that permit dumping, restrict policy space, and hinder growth in developing countries, so that countries can support their own agricultural development and in turn ensure food security, which is central to poverty reduction
• Contribute to a coordinated international response, led by the UN, which channels funds urgently to those in need, and leads on implementation of the longer-term reforms.
4. HIGH GLOBAL FOOD PRICES – IMPACT AT COUNTRY LEVEL
4.1. AGRICULTURAL PRODUCTION AND FOOD SECURITY IN ETHIOPIA, MALAWI AND TANZANIA
The food price situation is just one of many factors framing the conditions for smallholder farmers in Ethiopia, Malawi and Tanzania to produce and to obtain food and livelihood security. This section provides contextual information on the situation in the three countries of relevance for food and agriculture. According to the World Bank (2009), Ethiopia, Malawi and Tanzania are three low income countries where most of the population (83%, 82% and 75% respectively) live in rural areas and are dependent upon agriculture for their survival. Agriculture constitutes a substantial part of GDP: 46%, 34% and 45%, respectively. The three countries are ranked as number 197, 198 and 184 respectively out of 210 regarding Gross National Income per capita (purchasing power parity). The poverty and undernourishment levels are 39% and 46% for Ethiopia, 83% and 29% for Malawi and 88.5% and 35% for Tanzania (Table 1). Among the three countries, Ethiopia has both the highest growth in agriculture and the highest prevalence of undernourishment. Tanzania has the lowest growth in agriculture and the highest prevalence of poverty. All three countries are totally dependent upon agriculture for providing employment and income for the majority of their population.
14

High Global Food Prices – Crisis or opportunity for smallholder farmers in Ethiopia, Malawi and Tanzania
Table 1 Contextual background: Ethiopia, Malawi and Tanzania (World Bank, 2009) Ethiopia Malawi Tanzania Gross national income per capita 2008 (PPP)
$870 (ranked 197)
$830 (ranked 198)
$1230 (ranked 184)
Poverty headcount ratio $1.25 a day (PPP in %)
55.6 (2000) 39.0 (2007)
83.1 (2000) 88.5 (2000)
Undernourishment (% of population)
46.0 (2007) 29.0 (2007) 35.0 (2007)
Population in millions 79 (2007) 13.9 (2008) 40.4 (2007) Agriculture value added (% of GDP)
46.3 (2007) 34.3 (2007) 45.3 (2006)
GDP growth annual 11.1 (2007) 7.9 (2006) 7.1 (2007) Rural population % 83 82 75 Av. Annual growth agriculture
9.4 (2007) 5.9 (2007) 3.8 (2006)
Food imports: 1997 (in US$ millions) 2007
17 259
168 231
97 217
PPP = Purchasing Power Parity Below, a brief overview of the food and agriculture situation in the three countries is provided as given in the country cases reports (see Appendices).
4.1.1. Ethiopia Agriculture in Ethiopia does not only cater for subsistence needs of people. It also provides 90% of the country’s export incomes and 85% of total employment. Both food availability and general economic development depend on the performance of agriculture. Public efforts to stimulate agricultural growth have, together with favorable rainfall, contributed to a steady growth of agricultural production during the last five years. The growth by itself is not adequate to secure access to food, and painfully reconfirms the dependence on rainfall. Ethiopia collects most of its grain harvest during November – December and normally adds around 5% of additional production during the short rains ending in May. When yield estimates for 2007 and 2008 were released, the figures gave reason to believe that sufficient nationally produced food to feed the population would be available during the coming years (2008 and 2009). It therefore came as a surprise when local failure of the short rains in 2008 resulted in new calls for disaster relief and the same seems to be repeated in 2009 because of irregularities in the small rains. Apparently a great number of people live from harvest to harvest unable to afford the slightest yield failure, even in the short rains. The most recent FAO/WFP Crop and Food Security Assessment concludes from various sources that some reduction in national poverty is taking place. The World Development Report 2008 estimates that 44.2% of the population is below the poverty line and an appalling 77.7% below
15

High Global Food Prices – Crisis or opportunity for smallholder farmers in Ethiopia, Malawi and Tanzania
$2 a day (World Bank, 2007a). However, the report uses data from 1999-2000 which was the last year of the Ethiopian-Eritrean war. That war was also an economic disaster and the country’s economy has later recovered and improved considerably. The government is stimulating agricultural growth by improving infrastructure (roads), increasing the number of bank branches, importing fertilizers (Ethiopia used 487,057 tons of fertilizers in 2008 and plans to use 680,886 tons in 2009). The increase in fertilizer use is expected to considerably increase production at the farms where fertilizers are used given sufficient rainfall. Agronomists looking at production figures for Ethiopia would immediately see an enormous potential for increased production and productivity. Constraints for increased production are many, including population growth and the low level of urbanization that makes it impossible for the majority of those who live on small farms to move out of the subsistence trap. Figure 3. Food price increase in Ethiopia, July 2008 – November 2009 (FAO/WFP, 2009)
As seen in Figure 3, Ethiopia experienced a sharp increase in food prices in general, and prices of cereals in particular, during a few months in 2008. There is no consensus on why Ethiopia is experiencing such rapid price rises. Unlike in the past, inflation growth has recently coincided with high economic growth rates. World food price increases may not have big effects in Ethiopia because of the limited size of food imports and also of food export, although Ulimwengu, et al. (2009) find significant short-term price effects between the world maize market and Ethiopian regional markets bordering Sudan. Prices for major staple crops have been
16

High Global Food Prices – Crisis or opportunity for smallholder farmers in Ethiopia, Malawi and Tanzania
above import parity since early 2008. The major explanations are, however, high domestic demand, expansionary monetary policy, a shift from food aid to cash transfers, and structural factors due to reforms and investments in infrastructure (Dorosh and Subran, 2007; World Bank, 2007b; Braun, 2007; Emiru and Ageba, 2009 ). Some studies also indicated that food price variability has been consistently higher in Ethiopia compared with the world market, and the variability was heterogeneous within the country. The food inflation rate was different between regions except a common feature of the drastic rise in food inflation rates during the first half of 2008 (Ulimwengu et al., 2009).
4.1.2. Malawi Malawi is perceived as a success case regarding agricultural development and improved food security particularly during the last four years. The country has gone from severe hunger several times during the last 15 years to export of maize to neighboring Zimbabwe. The agricultural policy in the country can be categorized into four different phases (Sjaastad et al., 2007):
• Capital investment and public monopoly (1980s) • Parastatals and private competition (1987-97) • Hunger and starter packs (1997-2005) • Public vouchers and private marketing (2005-today)
The poor 2004/05 season, made the government restart its support to agricultural inputs (fertilizer and seed for maize and tobacco, which continues, as well as a once-off support for coffee and tea in the 2008/09 season). Vouchers are currently distributed to poor smallholders. The vouchers allow for seed free of charge and heavily subsidized fertilizers. The voucher system has contributed towards increased production and improved food security (Sjaastad et al., 2007). Other factors, such as favorable rainfall, a predictable market, political stability, and donor support to fertilizer subsidies have also contributed to the improvements in food production and food security. Food prices in Malawi, especially maize, have been rising both in real and nominal terms (Figure 4). Figure 4. Maize price increase in Malawi, real and nominal terms (Banda et al., 2008)
Nominal Annual Average Maize Grain Prices (1988-2007)
0.00
5.00
10.00
15.00
20.00
25.00
30.00
35.00
1988
1989
1990
1991
1992
1993
1994
1995
1996
1997
1998
1999
2000
2001
2002
2003
2004
2005
2006
2007
Year
Pric
e (M
K)
Maize Prices in Real Values (US)-in malawi (1998-2008)
0.00
0.05
0.10
0.15
0.20
0.25
0.30
0.35
1998
1999
2000
2001
2002
2003
2004
2005
2006
2007
2008
Year
Pric
e in
MK
/US$
17

High Global Food Prices – Crisis or opportunity for smallholder farmers in Ethiopia, Malawi and Tanzania
The other important consideration in prices is the seasonal nature of price variation (Figure 5), which affects food security in different months. Figure 5 Agricultural price seasonality in Malawi - Spatial Maize Market Integration (Sopo et al., 2009)
60.00
70.00
80.00
90.00
100.00
110.00
120.00
Jan Feb Mar Apr May Jun Jul Aug Sep Oct Nov Dec
Months
Index
North Centre SouthMalawi
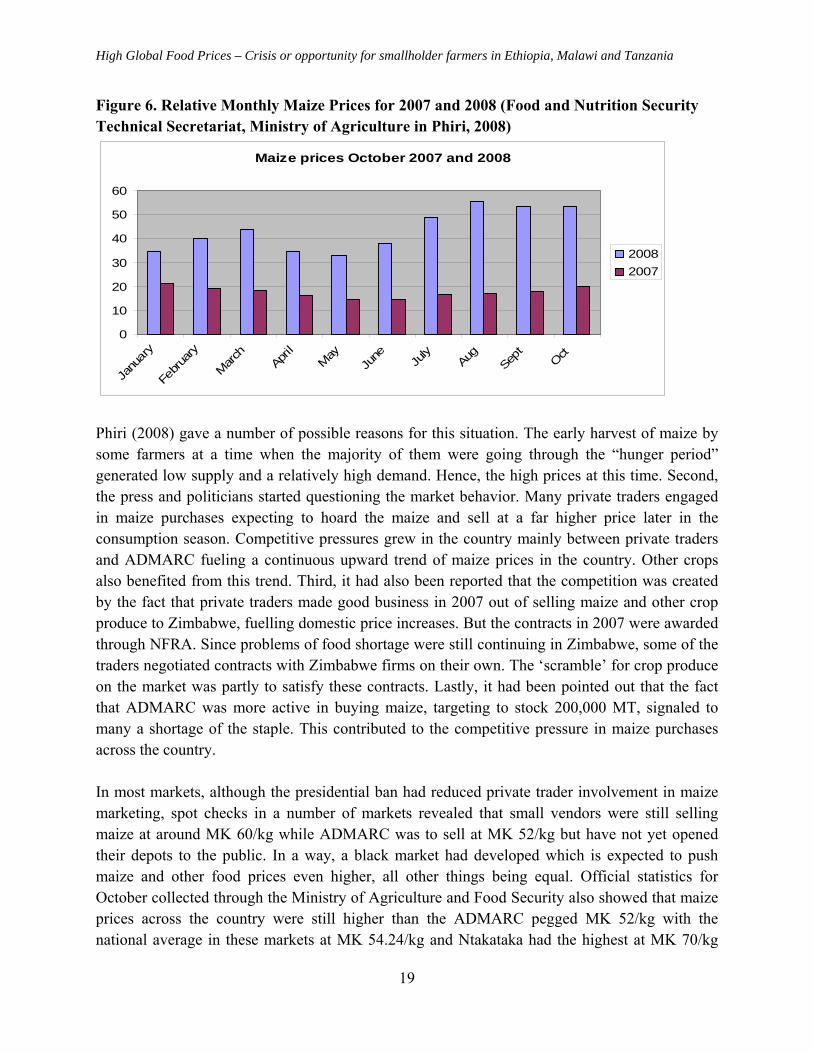
A study by Phiri (2008) indicated that the maize price trends for 2008 in all markets in the country had deviated from the normal trend in Figure 5 above. It was observed in his study that in the majority of markets across the country, maize prices had continued to increase since November 2007 with a short drop around April - May. Comparing maize prices for 2008 with those that prevailed during the same months in 2007, it was noted that for all the months under consideration, prices in 2008 were more than double of what they were in 2007.
18
High Global Food Prices – Crisis or opportunity for smallholder farmers in Ethiopia, Malawi and Tanzania
Figure 6. Relative Monthly Maize Prices for 2007 and 2008 (Food and Nutrition Security Technical Secretariat, Ministry of Agriculture in Phiri, 2008)
Maize prices October 2007 and 2008
0
10
20
30
40
50
60
Janu
ary
Februa
ry
March
April
MayJu
ne July
AugSep
tOct
20082007
Phiri (2008) gave a number of possible reasons for this situation. The early harvest of maize by some farmers at a time when the majority of them were going through the “hunger period” generated low supply and a relatively high demand. Hence, the high prices at this time. Second, the press and politicians started questioning the market behavior. Many private traders engaged in maize purchases expecting to hoard the maize and sell at a far higher price later in the consumption season. Competitive pressures grew in the country mainly between private traders and ADMARC fueling a continuous upward trend of maize prices in the country. Other crops also benefited from this trend. Third, it had also been reported that the competition was created by the fact that private traders made good business in 2007 out of selling maize and other crop produce to Zimbabwe, fuelling domestic price increases. But the contracts in 2007 were awarded through NFRA. Since problems of food shortage were still continuing in Zimbabwe, some of the traders negotiated contracts with Zimbabwe firms on their own. The ‘scramble’ for crop produce on the market was partly to satisfy these contracts. Lastly, it had been pointed out that the fact that ADMARC was more active in buying maize, targeting to stock 200,000 MT, signaled to many a shortage of the staple. This contributed to the competitive pressure in maize purchases across the country. In most markets, although the presidential ban had reduced private trader involvement in maize marketing, spot checks in a number of markets revealed that small vendors were still selling maize at around MK 60/kg while ADMARC was to sell at MK 52/kg but have not yet opened their depots to the public. In a way, a black market had developed which is expected to push maize and other food prices even higher, all other things being equal. Official statistics for October collected through the Ministry of Agriculture and Food Security also showed that maize prices across the country were still higher than the ADMARC pegged MK 52/kg with the national average in these markets at MK 54.24/kg and Ntakataka had the highest at MK 70/kg
19

High Global Food Prices – Crisis or opportunity for smallholder farmers in Ethiopia, Malawi and Tanzania
and the lowest in Misuku Hills in Chitipa where maize was at MK36/kg followed by Mitundu (Lilongwe south) and Thete (Dedza west) where maize was selling at MK46/kg in October. The general trend however was that for all markets across the country, maize grain prices had doubled from what they were at the same time in 2007. 4.1.3. Tanzania Increased agricultural income is central to reducing poverty in Tanzania, and is a key component in the National Strategy for Growth and Poverty Reduction (MKUKUTA in Swahili acronym). Agriculture is the largest sector of the economy contributing about 45 percent of GDP and employs 80 percent of the labor force. Agriculture accounts for most of the economic activity in rural areas. The sale of agricultural commodities accounts for 70 percent of rural incomes. Most Tanzanian farms are small – over 50 percent are less than one hectare. Poverty in Tanzania has increased in actual numbers but decreased as a proportion of the population (National Bureau of Statistics (NBS), Household Budget Survey). Almost all of Tanzanian agriculture depends on rainfall, area productivity is very low and yields fluctuate widely from season to season. Despite its importance in the economy, the agricultural sector has not optimized its potential in contributing to the poverty reduction goal. Previous policies resulted in poorly functioning agricultural cooperatives, leading to mismanagement and inefficiency in agricultural marketing systems. Despite the privatization of state companies, the private sector has not expanded fast enough to fill the vacuum left by collapsed cooperatives and state companies in supplying farm inputs, processing, marketing and export of crops. Currently, there are few functioning cooperatives and producer organizations. Many farmers face serious problems in identifying markets for their crops, understanding how to meet market standards, and difficulty in accessing inputs, extension advice, and credit. While the nation’s research and extension systems are in place, the delivery of services is weak. Other constraints to the agricultural sector are costs associated with poor infrastructure, especially rural roads and electricity. Multiple local taxes, unstable policies, bureaucracy, monopolistic markets and other market failures as well as corruption increase the costs and risks of accessing national, regional, and international markets. In November 2008, the wholesale price of maize in Dar-es-Salaam was up 24 percent compared to November 2007 (FAO, 2008b). As illustrated in Figure 7 below, the price increase in Dar-es-Salaam, Tanzania is much less than in Ethiopia and Kenya.
20

High Global Food Prices – Crisis or opportunity for smallholder farmers in Ethiopia, Malawi and Tanzania
Figure 7. Maize prices in Tanzania, Kenya and Ethiopia in 2007-08 (FAO, 2008b)
It is interesting to note the rather low maize price increase reported in Dar-es-Salaam compared to the higher price increases reported in the empirical findings from fieldwork in Dodoma and Ruvuma regions (Figure 8 and 9 below). This illustrates the importance of understanding the price diversity within a country. Figure 8. Price trends for five major crops in Songea district (Ruvuma) (Source DALDO Songea)
0
100
200
300
400
500
600
2005 2006 2007 2008 2009
Years
Tshs
/kg
MaizePaddyCassavaC/ beanR/ potato
Figure 8 shows prices of major food crops collected in Songea Rural district’s DALDOs office. Trends for the past four years show the general increase in prices of all food crops from 2006 onwards.
21

High Global Food Prices – Crisis or opportunity for smallholder farmers in Ethiopia, Malawi and Tanzania
4.2. IMPACT OF HIGH FOOD PRICES ON SMALLHOLDER FARMERS
This chapter provides a summary of the findings in the three country cases as well as a comparison between the three countries. The findings are based on empirical data from two different villages in each country. It is not possible to generalize to the country level from the sample surveys conducted in each of the two times three villages. However, the findings give an indication of what might be the situation also in other villages in the countries. The three Tables below present the main findings from field work undertaken in Ethiopia, Malawi and Tanzania in the beginning of 2009. Much more data, analysis and findings are available in each of the three country studies (Appendices). The purpose of this chapter is to compare the main findings among the three countries and between the food deficit and food surplus areas within each country and to present the results regarding impact on high food prices on smallholder farmers. As will be shown in this chapter, all three countries have faced considerable food price increase, particularly Ethiopia. The price increases are caused by a diversity of factors where the rise in international food prices is just one among many contributing factors.
4.2.1. Ethiopia Table 2. Ethiopia: Lessons learned from Arsinegelle (West Arsi Zone of Oromia region) and Damot Sore of Wolaita Zone in the South. Arsinegelle (Surplus) Damot Sore (Deficit) People interviewed (random sample)
77 households, 90% male headed
73 households, 85% male-headed
Context Farm land relatively larger, produce cereals (maize and wheat), close to roads and markets
Farm land relatively smaller, produce teff, roots and tubers, distant to roads and markets
Income improvements from price increase
96% reported improved income (particularly wheat)
68% reported improved income (particularly teff)
Investment in farm inputs 30% invested in farm inputs 3% invested in farm inputs Consumption expenditures (mean)
Spend less on buying food most on school fees
Spend most of income on buying food
Sellers of crop Majority sell maize (45%) and wheat (65%)
Few sell maize (12%) and wheat (14%). 23% sell teff
Changing production due to price increase/inflation
64% 81%
Fertilizer cost Fertilizer price not a problem Farmers benefit from price
High fertilizer cost make it difficult to benefit from price
22

High Global Food Prices – Crisis or opportunity for smallholder farmers in Ethiopia, Malawi and Tanzania
increase increase Production 1.3 t/ha of maize 0.8 t/ha of maize
(low yield due to rain failure) Table 2, above, gives an overview of how farmers in a food surplus and food deficit village in Ethiopia respond to cereal price increase. The income level has improved for those selling maize, wheat and teff. The majority of farmers are selling cereals in the food surplus village while a minority is selling in the food deficit village. In the food surplus village the price of fertilizer is not regarded as a constraint when it comes to making profit. The increased income makes it possible for farmers in the food surplus village to invest in the farm. They spend proportionally less on food purchase than in the food deficit village. The result from these two villages indicates that in Ethiopia, there is more than a 50% chance to benefit from the high food prices given that you are in a better-off area (sufficient land of good fertility and sufficient rainfall). This finding corresponds with what Hussein Jemma (personal communication, July 2009) found in Arsi and West Arsi Zones of Oromia that farmers in better-off areas are able to improve their income from farming given that they have access to modern technology and have the capability to work hard. Unfortunately, the majority of farmers in Ethiopia do not find themselves in this favorable situation. One important reason why Ethiopian farmers who have a sellable surplus can now benefit from high food prices is that the market has become more conducive for the producers. An unexpected and most remarkable experience during the period of 2004-2009 was that the market no longer depresses the food prices after harvest. Food inflation continued to accelerate despite good weather and an agricultural production boom. Since 2007, the farmers have supplied increased surpluses to the market and still got stable or even increased prices for what they can deliver. Farmers experience that use of inputs can be profitable but wage earners and urban dwellers that spend a substantial proportion of their income on food saw their household economy dramatically worsened. Even the majority of the rural poor who are not net sellers of cereals are equally hit by the inflation. The government of Ethiopia has undertaken different measures to reduce the negative effect of food inflation on the poor. Buying food for distribution from food surplus to food deficit areas would increase the demand and the prices. The government therefore decided to cover such needs by importing wheat and distributing it for a subsidized price as a welfare contribution. Such import started in late 2007, continued during 2008 and 2009. So far the government has purchased 750,000 t of wheat. The efforts of the Ethiopian government were not only to provide subsidized wheat and cooking oil to the urban poor, but included an export ban on certain food items, removing/lifting value added and turnover taxes on imported foodstuffs, huge and continued subsidy on oil, introduction of commodity exchange market and other similar measures (Emiru & Ageba, 2009). While this may have prevented a further increase of food
23

High Global Food Prices – Crisis or opportunity for smallholder farmers in Ethiopia, Malawi and Tanzania
prices, it contributed little to the reduction of prices. The annual food inflation rose from 18.2% in June 2007 to a peak of 91.7% in July 2008. At the same time overall inflation rose from 15.1% in June 2007, to 55.3% in June 2008 (Loening et al., 2009). Wage earners continued to complain bitterly of economic hardships because of expensive food.
4.2.2. Malawi Table 3. Malawi: Lessons learned from Chileka EPA (Lilongwe) and Matenje EPA (Salima). Chileka EPA (Lilongwe)
(Surplus) Matenje EPA (Salima) (Deficit)
People interviewed (random sample)
57 households 61% male respondents
54 households 72% male respondents
Context Maize surplus area Small land holdings
Maize deficit area Not as small as land holdings in Lilongwe
Income improvements from price increase
Maize prices doubled from 2007 to 2008 but 79% did not benefit (sold no maize)
Maize prices doubled from 2007 to 2008 but 87% did not benefit (sold no maize)
Use of farm inputs More than half use fertilizer. More than half use fertilizer Consumption expenditures
Seed and fertilizer main expenditure
Seed and fertilizer main expenditure
Sellers of crop 21% sold maize 25% sold groundnuts
13% sold maize 20% sold groundnuts
Changing production due to price increase/inflation
Almost half reported to have changed their cropping patterns due to higher food prices
Almost half reported to have changed their cropping patterns due to higher food prices
Fertilizer cost Market price MK 8000 Subsidized price MK 800 (2007/08)
Doubled from 2007/08 to 2008/09. Input to output ratio worsened. Targeted fertilizer subsidy needed
Doubled from 2007/08 to 2008/09. Input to output ratio worsened. Targeted fertilizer subsidy needed
Production (average both places) Production pr hh pr year (To be food secure require)
0.530 t/ha of maize 16 bags (27 bags to be food secure)
0.530 t/ha of maize 16.7 bags (26.4 bags to be food secure)
Hire out labor 24 (42%) 28 (52%)
24

High Global Food Prices – Crisis or opportunity for smallholder farmers in Ethiopia, Malawi and Tanzania
In Malawi, the main finding is different from Ethiopia. Although two villages are selected, one in a food surplus area and one in a food deficit area, a very small proportion of farmers are benefitting from the food price increase in both villages, including in the food surplus area. The reason for this is that on average less than 20% of the farmers are selling any maize at all. The huge majority does not have any surplus to sell and, hence, does not benefit from the price increase when it comes to improving their income. The situation is more or less the same in both villages with only a slightly better situation in the food surplus area. In both villages, the productivity is very low and the production per household is far below the level required for providing the household with sufficient food throughout the year. The farmers in both villages are totally dependent upon subsidized fertilizer to be able to acquire inputs. The cost of fertilizer has doubled from 2007/8 to 2008/9 and the input to output ratio has worsened. The increasing food prices have created lucrative business opportunities mainly for vendors (middlemen). But in some cases, these middlemen also take advantage of the situation to exploit producers through dubious means that ‘intend’ to reduce food insecurity during the lean months among these producer-consumer households (see example in the narrative below). Case Study 1: In Salima, the food crisis is really a hot issue. During the lean periods (December – March) when food prices are high and unaffordable for the majority of the poor households, vendors take advantage of the situation. It was reported through key informant interviews that some vendors visit those households that are most affected by food shortage and give them some money - about Mk 200 per household. Such households that receive this assistance when they have run out of their own production are asked to repay a 50kg bag of maize once they have harvested. And yet, even at the time of harvest, a 50 kg maize bag would not be sold for MK 200! In 2008, the lowest maize price at harvest was MK25.00 per kg which means the bag would go for MK 1,250. In this case the vendor is openly making a profit of MK1, 050.00 from the poor farmer. The more money the farmers borrow from these vendors, the more maize they have to give away and hence the more they accept to be exploited.
Rising food prices are indeed a crisis in Malawi. From the consumer perspective increasing food prices erode the purchasing power of households. What this means is that a continued increase of prices leads to household food insecurity. Additionally, producer households at some point in the consumption year become dependent on the market for food. Hence, the increase in food prices is of major concern to them as well. Most particularly, rural producer households that have run out of their own maize due to poverty are most vulnerable to food insecurity arising from increasing food prices. The study has shown that the impacts of increasing prices mainly affect the vulnerable groups in Malawi (which represents the majority) and include reduced accessibility to inputs among poor famers which, in turn, has a negative impact on food availability and the nutrition status of these vulnerable people. The food basket is reduced
25

High Global Food Prices – Crisis or opportunity for smallholder farmers in Ethiopia, Malawi and Tanzania
among those people living on less than 1.25 US$/day by cutting down on social activities like health and education and further by reducing meals and nutritious foods in their diets. On the other hand, from the producer-trader perspective, rising food prices is a business opportunity. But the study has revealed that less than 20% of the producers sell any maize. Therefore, the impacts of price increases will be negative on the majority of producers as the income will not change, but the expenditures will. It has been revealed through the study that some traders are exploiting producers by lending cash when they have run out of food from their own production with the aim of collecting a stated amount of maize at harvest. This is testimony that increasing food prices are creating business opportunities not only to the producers, but also to the traders. However, due to the urban biased food policy, the government intervened to control the increasing food prices. The question is if the government is denying the producers who produce a surplus the opportunity to make money out of maize production? Usually, no easy answer is given to this question. The reality on the ground however is that denying farmers remunerative produce prices is a disincentive to the increased use of improved technologies such as improved seeds and inorganic fertilizers. The government’s policy is to control the sharp increase in food prices to protect the urban consumers on the one hand and to support the producers on the other with various interventions that are aimed at abating the cost of production so as to render food crops (maize in particular) profitable. The study has clearly demonstrated that food price increases are a major challenge to policy makers. Producers as well as consumers need to be supported in the face of continued increase of food prices. It is unlikely that farmers will achieve higher levels of crop productivity without any support. Taking Malawi’s hunger history into consideration, food security is prioritized by the government in its country policy.
4.2.3. Tanzania Table 4. Tanzania: Lessons learned from Chigongwe village in Nala ward in Dodoma region and Mgazini village in Songea rural district Ruvuma regions. Mgazini village,
Ruvuma (Surplus) Chigongwe village, Dodoma (Deficit)
People interviewed (random sample)
47 households 81% male respondents
51 households 86% male respondents
Context Better-off , surplus area 16 food crops grown 100% grow maize
Food deficit 7 food crops grown Semi-arid 86 % grow maize
Income improvements from price increase
Income increase from sale of maize and beans -
Almost nobody benefitted from high maize price since
26

High Global Food Prices – Crisis or opportunity for smallholder farmers in Ethiopia, Malawi and Tanzania
maize prices more than doubled since 2007
almost nobody sells maize.
Investment in farm inputs Majority invest in buying seed, fertilizer, equipment, hiring labor,
Some investment in farm tools and equipment
Consumption expenditures
Two thirds of income consumed: 6% spent on buying food 31% on school fees
Almost all income consumed: 35% spent on buying food 21% on school fees
Sellers of crop 98% sold maize 53% sold beans
4.5% sold maize 72.5% sold groundnuts
Changing production due to price increase/inflation
Area cultivated and total production have not changed
Area cultivated and total production have not changed
Fertilizer cost
Majority buy fertilizer Nobody buys fertilizer
Production (Country avr.: 0.8-1.2 t/ha)
2.4 t/ha maize
1.2 t/ha maize
Household income Animal husbandry also an important source of income
Sale of charcoal and hire out labor important
In Tanzania, we find the same trend as in Ethiopia regarding a huge difference between the two villages in food surplus and food deficit areas. In the village in the food surplus area almost everybody is selling maize and buying inputs such as fertilizer and hired labor. Income from crop sale is high at food surplus Mgazini village mainly from the sale of main staple maize. The farmers in this village spend a small proportion of their income on buying food (6%) and a large proportion on school fees (31%). In Chigongwe village agricultural income is negligible mainly from the sale of ground nuts and of livestock; off-farm employment and petty trading are other sources of income. Nobody buys fertilizers and the investment in the farm is limited. A much higher proportion of income is spent on food. In the food deficit semi-arid area Chigongwe village, 98% of the income is consumed, compared to 67% in food surplus Mgazini village. Hence the results show declining investment in welfare expenditure such as housing, education and health as well as on productive ventures such as fertilizer, seed and farm equipments. Agriculture development and food security in Tanzania are constrained by many factors such as:
• Low production and productivity: In a close-to-subsistence economy, farmers are supposed to produce enough for household consumption and sell the surplus. However, due to many factors within and outside the control of the farmers such as poor weather,
27

High Global Food Prices – Crisis or opportunity for smallholder farmers in Ethiopia, Malawi and Tanzania
availability and use of inputs, poor husbandry practices and high input prices, production and productivity decline. With an expanding demand due to the increase in population, the decline in production creates scarcity on the market. Under a free market economy, this situation leads to price increase. A typical case is what was observed in the Dodoma region where crops such as pearl millets and sorghum are agronomically suitable for local production, but prices are generally high due to low production.
• Seasonal nature of agricultural production: In Tanzania like anywhere in the tropics where production is dependent on seasonal weather systems, the production is quite variable. Soon after harvest (during the dry season) prices of major staples fall drastically and then rise sharply during rainy season. With diverse climatic conditions typical for Tanzania, one would imagine the availability of food products at all locations throughout the year. However, due to a poor road network, transportation of bulky food products to food deficit areas is always a serious problem. During the rainy season it is cheaper and faster to import maize from Durban in South Africa than transporting from Rukwa region in southern Tanzania.
• Limited distribution due to high transportation costs: It is well known that there are several regions, or districts within the regions or villages within the districts, which have food surplus. However, due to poor roads to reach these areas, accessibility is generally a problem. A study conducted in 2004 on maize pricing at marginal and poor access areas in Tanzania (see Hella et al., 2007) posits that traders and transporters find it too costly to reach these areas, hence food cannot be available in areas with a deficit except at very high costs.
• Unreliable middlemen who have low operating capital: Removal of cooperative societies and allowing private traders to operate as middlemen in food crops marketing resulted in an emergence of unreliable middlemen with low capital. In order for these middlemen to operate, they work with a chain of other middlemen or agents at villages, district towns and the regional town.
• High marketing costs: The small and subsistence nature of producers have the tendency to increase marketing costs. The most significant cost is that of collecting and bulking small quantities to get a sizeable load for transportation. Also, since the products come from different sources there must be extra costs of cleaning, standardizing and grading. These costs are usually transmitted to the final consumers, with consequently high prices.
• Limited availability of support services: In Tanzania, like elsewhere in developing countries, institutions like banks insurance agents, and extension services that provide support to producers, are non- existent or discriminate against small scale farmers or agricultural enterprises due to the associated risk and high transaction costs associated with small scale clients.
• Price distortions through short-term deregulations: Marketing or pricing policies, rules, regulations, acts and by-laws are common in developing countries. In Tanzania, for
28

High Global Food Prices – Crisis or opportunity for smallholder farmers in Ethiopia, Malawi and Tanzania
example, taxes and levies have to be paid at different check points when moving products from the villages to urban areas. . These costs are finally transmitted to the consumer.
In Tanzania, the recent increases in prices of staple foods were envisaged to raise the real incomes of those selling food (producers in rural areas), many of whom are relatively poor, while hurting net food consumers (consumers in rural and urban areas), many of whom are also relatively poor. Due to the subsistence nature of the Tanzanian economy, traditional consumption and production behaviors and to some extent the pricing policy, institutional support and market failure, the impacts in terms of gaining or losing are certainly very diverse. Results using household and secondary data for the two study regions show that the short-run impacts of higher staple food prices on the poor differ considerably by commodity, by region and by income status of the consumer. The recent large increases in food prices appear likely to raise overall poverty although substantially more in food deficit households. The winners are those who produce the most important and most preferred staples (mainly maize and rice) in large quantities; who live and farm close to good and all-weather roads that link to the main market; who can postpone selling when prices are low (soon after harvest) and sell when prices are good; who have access to inputs and technology; who also may produce less perishable produce, thus not affected by seasonal price variations, and who keep livestock which can be sold to buy staple food when the need arises. The losers are the poor consumers and low producers who cannot produce enough for their households and thus have to buy extra food at the local market; who cannot produce crops which are favored by the consumers; who reside in remote and poor accessed villages; and who produce crops which are of national interest in terms of food security (maize & rice) thus are bonded by the laws and regulations on what, when and where to sell.
4.3. LESSONS LEARNED FROM THE GLOBAL FOOD CRISIS IN ETHIOPIA, MALAWI AND TANZANIA What lessons can be learned from the empirical studies in Ethiopia, Malawi and Tanzania? Although it is impossible to generalize from sample surveys in three times two purposely selected villages, the findings still offer some indications on what might be the situation at the country level. The main question posed in this study is to what degree high food prices cause a crisis or provide an opportunity for smallholder farmers in the three countries. The broad answer to this question is that the majority of smallholder farmers are not able to benefit from high food prices because they basically sell very little both in total and especially in relation to what they buy. The reasons why they sell little are many, including low productivity, small landholdings, low soil fertility, long distances to good roads and markets, insufficient infrastructure, lack of knowledge in appropriate technology and innovation, lack of access to inputs and credit, low prices at farm gate, exploitation by traders/middlemen, debt traps, lack of a conducive national
29

High Global Food Prices – Crisis or opportunity for smallholder farmers in Ethiopia, Malawi and Tanzania
agricultural price and marketing policy. However, some farmers are able to benefit. They have their land in better-off areas, their yields are higher, their landholdings are bigger and they have access to inputs and improved technology with the capability to innovate. The findings from the three country studies indicate that smallholder farmers in the better-off areas of Ethiopia benefit more from food price increase than in the other two countries. Of the smallholder farmers in the better-off areas, 96% reported improved income from sale of cereals. Since the market has become more conducive for the producers and the use of inputs can be profitable, production incentives have boosted production in these better-off areas in Ethiopia. In Tanzania, smallholders in the better-off areas also benefit from price increase, but the agricultural policy is not conducive enough to boost production as in Ethiopia. In Malawi, neither smallholders in food surplus or food deficit areas benefit from the high food prices as only a small proportion, less than 20%, of the farmers are net-sellers. FAO, WFP and IFPRI have reported that very few farmers in Africa have been able to benefit from the high food prices. This study shows that more smallholders than expected have benefitted in the better off-areas in Ethiopia and Tanzania, but not in Malawi. It should also be noted that there is a possible time lag related to measuring the impact of high food prices. Farmers might gradually invest in the farm which might add value to the production and income over a longer time period. Increased income from the farm might also result in more hiring of rural wage workers which will improve employment opportunities in rural areas. If the wage level is fair, a broader group of rural people could be able to improve their livelihoods than only the net selling farmers. However, it might be that inequalities are increasing and wages are far too low for any livelihood improvements among those who depend upon selling their labor. Farmers residing in the food deficit areas are the main losers in addition to especially poor urban consumers in all three countries. In Tanzania 40% live in food deficit areas which mostly are the semi-arid areas (WFP, 2009). In Ethiopia, most of the farmers in southern Ethiopia, and also in the north and north east, are living in possible food deficit areas. The highest potential for food crops surplus is found in parts of Oromia and Amhara regions. In Malawi the most seriously affected food deficit areas are Mulanje, Mangochi, Zomba, Phalombe, Mzimba and Chiladzulu. It is difficult for this group of farmers to benefit because their production is small, it is expensive to market the small volumes being produced, they have nothing left to invest when the most basic consumption needs are covered and thereby it is difficult to move out of the poverty trap. In addition, traders might take advantage of the desperate situation this group of smallholders is in, as illustrated by the case study from Malawi where vendors visit food insecure households and offer maize which has to be repaid six fold next time the farmers harvest. The production alternative for this group might not be fertilizer unless it can be heavily subsidized as in Malawi, but other means of improving soil fertility and water efficiency without increasing the labor demands such as conservation farming, agro-forestry, compost/organic manure, animal manure, green manure and intercropping. There is a need to invest in national level research and
30

High Global Food Prices – Crisis or opportunity for smallholder farmers in Ethiopia, Malawi and Tanzania
extension to better tailor appropriate technological solutions and innovations to the conditions of this group of smallholder farmers. As net-buyers of food, they will only be negatively impacted by high food prices. Unfortunately, a large proportion of smallholder farmers in the three countries belong to this group. The solution for this group might lie partly outside the agricultural sector if employment opportunities could be created elsewhere or in connection with rural investment. In relation to the impact of high food prices on women smallholder farmers, limited information was reported from the three country studies. From Tanzania it was reported that women-headed households have less access to land and natural resources than men-headed households and this restricts women more than men from producing food and benefiting from the rising prices. From Ethiopia it was reported that women-headed households included in the study were mostly net food buyers and, therefore, the victims of high food price inflation. Intra-household analysis is not undertaken in any of the three country cases. But a lot of diversity is reported in relation to crop, size of landholding, soil fertility, animal husbandry, consumption level, farm investment, price of fertilizer, subsidies, access to good roads, closeness to markets, ability to take risk, region, policy, trade restrictions – diversity that impacts to what degree farmers benefit from high food prices. Marketing and price information appear to be much less of a problem than previously. The availability of cell phones, price information, marketing institutions and cooperatives, has contributed towards improving the situation for the producers. People now have more trust in the market than before, particularly in Ethiopia and Malawi. In Tanzania, there appears to be somewhat less trust in the agricultural policy and market predictability.
5. CONCLUSION
The construction of a better world calls for a value-based approach. Economic analysis of the realities of poverty and food insecurity must be coupled with ethical reflections on current social and economic structures (Braun & Diaz-Bonilla, 2008:6)
The recent food crisis has again made the world focus on hunger and the weaknesses embedded in the current global food system regarding combating hunger and food insecurity. The main challenge appears to be how to address the structural injustice that is hindering access to food by the world poor. In Africa, the food crisis is a question of low production and productivity, high prices, poverty and food insecurity while in developed countries the food crisis is associated with excessive speculation, agro-business profits, land grabbing and subsidized agriculture. The high international food prices have to a varying degree and in combination with other factors been transmitted to local markets in Africa. In general, there is low price transmission between world and local market prices, the observed price surge in Ethiopia, Malawi and Tanzania is caused by many other dimensions in addition to high food prices on the world market. The high food prices
31

High Global Food Prices – Crisis or opportunity for smallholder farmers in Ethiopia, Malawi and Tanzania
provide opportunities for net-selling rural farmers and for traders/middlemen in developing countries to improve their income and livelihoods. However, for the majority, rural net-buying farmers, rural wage workers and poor urban consumers, the food price increase has been a disaster. The challenge is how to respond both to the risk and the opportunities that higher food prices provide. Improving African agricultural production and productivity and improving rural livelihoods are desperately needed. This study shows that in food deficit areas with small landholdings, different strategies are needed than in better-off areas. Possible strategies for the food deficit areas include improved farm technologies as well as job creation aiming at absorbing rural labor and social protection schemes. At the same time, it is important to recognize the huge potential that exists in African countries to increase production from today’s very low yield levels. High food prices and market opportunities alone are not enough to make this happen. An active state and investment policy are needed to enable agriculture to play the important role it could play in relation to employment, food and livelihood security, and economic development. Developing countries cannot do this alone; the global food and agriculture governance structures and institutions, as well as the global community in general, must take on this responsibility and act. Both, the High Level Task Force on the Global Food Security Crises in its Comprehensive Framework for Action of 2008 and the powerful Group of 8 (G8) in the declaration from its July 2009 meeting in Italy, have promised increased aid to agriculture and food security, whether or not these promises will be implemented and contribute to results are still to be seen.
6. RECOMMENDATIONS At the international level, Norway should continue to support the work of the High Level Task Force on the Global Food Security Crises and its Comprehensive Framework for Action. The framework should be improved to better address the interests of poor people in low income countries. Issues of concern that need further strengthening in the CFA are related to trade measures that better protect small-scale producers in the South, land policies that prevent land grabbing and reduce possible negative impact of land acquisition on poor people, an efficient international architecture for food & agriculture institutions that better serve the poor as well as strengthen the dialogue and collaboration with civil society and other relevant actors. At the country level, Norway should support increases in public spending on agricultural sector programmes targeted towards facilitating more conducive production conditions for smallholder men and women farmers. More conducive production conditions will better enable certain groups of smallholder farmers to benefit from high food prices. Situation specificity will determine what kind of support to choose. Different strategies will be needed in food surplus and food deficit areas. In food deficit areas, off-farm employment opportunities will be of crucial importance to improve food and livelihood security. Each of the three country studies, Ethiopia, Malawi and Tanzania (Appendices), include recommendations tailored for the specific country.
32

High Global Food Prices – Crisis or opportunity for smallholder farmers in Ethiopia, Malawi and Tanzania
REFERENCES
Banda, J.W., Chitika, R. and Kaunda, E.K.W. 2008. Response to High Food Prices in Developing Countries: Needs Assessments and Response Proposal for Malawi. FAO Consultancy Report, October 2008. FAO, Lilongwe, Malawi. Benson, T., Minot, N., Pender, J. Robles, M. and von Braun, J. 2008. Global Food Crisis. Monitoring and assessing Impact to Inform Policy responses. IFPRI Food Policy Report. Washington DC. Braun von, J. 2007. The World Food Situation: New Driving Forces and Required Actions. Food Policy Report 18. Washington DC: International Food Policy Research Institute. Braun von, J. 2008a. Rising Food prices – What should be done? IFPRI Policy Brief. April 2008. Washington DC. Braun von, J. 2008b. High Food prices: The What, Who, and How of Proposed Policy Actions. IFPRI. Washington DC. Braun von, J. 2008c. Food and Financial crises. Implications for Agriculture and the poor. IFPRI Food Policy Report. Washington DC. Braun von, J. and Diaz-Bonilla, E. 2008. Globalization of food and agriculture and the poor. IFPRI Issue brief, September 2008. Washington DC. Braun von J and Meinzen-Dick, R. 2009, “Land Grabbing” by Foreign Investors in Developing Countries: Risks and Opportunities. IFPRI Policy Brief 13 Cotula, L., Vermeulen, S., Leonard, R. and Keeley, J., 2009, Land Grab or Development Opportunity? Agricultural Investment and International Land Deals in Africa, IIED/FAO/IFAD, London/Rome. Dorosh, P.A. and Subran L. 2007. Food Markets and Food Price Inflation in Ethiopia. Background paper for the Food Price Inflation Policy Note. Washington DC: World Bank. Emiru, T. and Ageba, G. 2009. The Dynamics of Food Price Inflation in Ethiopia. Paper presented in the 7th International Conference on the Ethiopian Economy, June 25-27, 2009, Addis Ababa.
33

High Global Food Prices – Crisis or opportunity for smallholder farmers in Ethiopia, Malawi and Tanzania
FAO, 2009a. 1.02 billion people hungry. www.fao.org/news/story/en/item/20568/icode/ Accessed 22.06.2009. FAO, 2009b. Food Outlook. Global Market Analysis. www.fao.org/docrep/011/ai482e/ai482e00. Accessed 22.06.09. FAO, 2009c. FAQs on Food Situation. www.fao.org/worldfoodsituation/wfs-faq/en/ Accessed 22.06.09. FAO, 2009d. Soaring food prices. www.fao.org/isfp/isfp-home/en. Accessed 22.06.09. FAO, 2008. The State of Food and Agriculture 2008. FAO, Rome. FAO-InfoSys, 2009. Low-Income Food-Deficit Countries. www.fao.org/countryprofiles/lifdc.asp Accessed 15.07.09 FAO/WFP, 2009. Crop and Food Security Assessment Mission to Ethiopia. Special report, 21 January 2009. FAO, Rome. GRAIN, 2008a. The 2008 land grab for food and financial security. http://www.grain.org/nfg/?id=610 Accessed 14.07.09 GRAIN, 2008b. Making a killing from hunger. www.grain.org/articles/?id=39. Accessed 8.12.08.
Hella, A.K. Kashuliza and C. Polton (2007). Dynamics of Liberalized Maize Marketing in Remote Areas of Tanzania: Evidences from Ludewa and Sumbawanga districts. Proceedings of AGREST annual workshop, Dodoma Tanzania
HLTF, 2008. Comprehensive Framework for Action. High Level Task Force on the Global Food Security Crises IPCC, 2007. Fourth assessment report: Climate Change. Intergovernmental Panel on Climate Change. Cambridge University Press, Cambridge. MoAFS (2008). Malawi food crisis response programme. Ministry of Agriculture and Food Security (MoAFS), Lilongwe, Malawi. Food Crisis Meeting, Pretoria, South Africa, September 2008.
34

High Global Food Prices – Crisis or opportunity for smallholder farmers in Ethiopia, Malawi and Tanzania
Mitchell, D. 2008. A note on rising food prices. Policy Research Working paper 4682. The World Bank, Development Prospects group. Washington DC. Norad, 2007. Resultatrapport 2007. Norad, Oslo, Norge. OECD-FAO, 2009. Agricultural Outlook 2009-2018. Rome: FAO. Oxfam, 2008. Doubled-Edged Prices. Lessons from the food prices crisis: 10 actions developing countries should take. Oxfam International. Oxfam briefing paper no 121. Patel, R. 2008. Patel talk about the food crisis. www.berkeley.edu/news/media/releases/2008/05/21_qafoodcrisis.shtml. Accessed on 8.07.2009. Patel, R. 2007. Stuffed and Starved. The hidden battle for the world food system. Portobello Books Ltd., UK. Phiri M. A. R. 2008. Impact Assessment of the Increase in Food Prices on Food and Livelihood Security in Malawi. Prepared for the Catholic Relief Services- Malawi. Pinstrup-Andersen, P. (2002) Towards a Sustainable Global Food System: What Will It Take? John Pesek Colloquium, Iowa State University. Quisumbing, A., Meinzen-Dick, R. and Bassett, L. 2008. Helping Women Respond to the Global Food Price Crisis. Policy Brief No. 007. www.ifpri.org/pubs/bp/bp007.asp. web summary. IFPRI. Washington DC. Accessed on 6.07.2009. Sjaastad, E., R. Kaarhus, P. Vedeld & B.K.Wold. 2007. Privatization and liberalization in the agricultural sector. An examination of processes and outcomes in three African cases. Noragric Report No 39. Norwegian University of Life Sciences, Ås. Sonnino, R. & Marsden, T. (2006). Beyond the Divide: rethinking relationship between alternative and conventional food networks in Europe. Economic Journal of Geography. pp 181-199 Sopo, O., Phiri, M.A.R., Nakhumwa, T.O. and Tchale, H. (2007). Economic analysis of the role of market information on marketing of agricultural produce in Malawi: The case of maize market. In: Proceedings of the Biennial Conference of the Regional Universities Forum for Capacity Building in Agriculture (RUFORUM), Working Document No. 2, 23-27 April 2007, Mangochi, Malawi.
35

High Global Food Prices – Crisis or opportunity for smallholder farmers in Ethiopia, Malawi and Tanzania
Sopo, O., Phiri, M.A.R., Nakhumwa, T.O. and Tchale, H. (2009). Spatial maize market integration in Malawi. Unpublished. MSc Thesis, University of Malawi, Bunda College, Lilongwe, Malawi. Ulimwengu, J.M., Workneh S. and Paulos, Z. 2009. Impact of Soaring Food Price in Ethiopia: Does Location Matter? IFPRI, Discussion Paper 846. UNCTAD, 2009. Food security in Africa: learning lessons from the food crisis. United Nations Conference on Trade and Development, Trade and Development Board. Geneva, 30 June, 2009 WFP, 2009. Threats to Food Security. http://www.wfp.org/countries/tanzania-united-republic. Accessed 15.07.09 World Bank, 2009. World Development Indicators, World Bank statistical database. www.worldbank.org. Accessed at 2.07.09. World Bank, 2007a. World Development report 2008. Agriculture for development. The World Bank. Washington DC. World Bank, 2007b. Ethiopia: Explaining Food Price Inflation: Policy Note. Washington DC.
36

High Global Food Prices – Crisis or opportunity for smallholder farmers in Ethiopia, Malawi and Tanzania
37
APPENDICES: CASE STUDIES The complete country studies are presented in the following three Appendices A1. RISING FOOD PRICES: CRISIS OR OPPORTUNITY? LESSONS FROM ARSI NEGELLE AND WOLAITA AREAS OF ETHIOPIA. A2. RISING FOOD PRICES: CRISIS OR OPPORTUNITY? A CASE STUDY OF CHILEKA AND MATENJE EXTENSION PLANNING AREAS IN LILONGWE AND SALIMA DISTRICTS, MALAWI A3. FOOD PRICES AND WORLD POOR: WINNERS AND LOSERS. A CASE STUDY OF TWO VILLAGES IN TANZANIA

High Global Food Prices – Crisis or opportunity for smallholder farmers in Ethiopia, Malawi and Tanzania
APPENDIX I

High Global Food Prices – Crisis or opportunity for smallholder farmers in Ethiopia, Malawi and Tanzania
APPENDIX 1
Rising food prices: Crisis or Opportunity?
Lessons from Arsi Negelle and Wolaita Areas of Ethiopia
Final Report
Prepared By:
Worku Tessema Thomas Lemma
and Trygve Berg
Department of Agricultural Resource Economics and Management College of Agriculture, Hawassa University
June, 2009 Hawassa
1

High Global Food Prices – Crisis or opportunity for smallholder farmers in Ethiopia, Malawi and Tanzania
TABLE OF CONTENTS List of Acronyms 4 Acknowledgement 5 1. INTRODUCTION 6
1.1. Inflation under Ethiopian context 6 1.1.1. The oil price and Ethiopia 7
1.1.2. The fertilizer price and Ethiopia 8 1.1.3. Food prices and inflation in Ethiopia 8
1.2. Statement of the problem 9 1.3. Objectives of the study 10
2. METHODOLOGY 10 2.1. Research site 10 2.2. Samples and Research design 12
3. RESULTS AND DISCUSSION 12 3.1. Household Characteristics and asset ownership 12
3.1.1. Education and Employment 13 3.1.2. Asset Ownership 14
3.2. Production, Consumption and Markets 18 3.2.1. Crop production and selling activities 18 3.2.2. Livestock production and selling activities 22 3.2.3 Other income sources 23 3.2.4. Overall income of the farm households in the two sites 24
3.3. Production and consumption expenditures 25 3. 4. Food price increase and the use of gained income 26 3.5. Perceptions about the effects of price increase 28
4. CONCLUSION AND RECOMMENDATIONS 28 4.1. Recommendations for Ethiopia 29 REFERENCES 31 A1.1 Changes in stock of livestock between 2008 and 2009 at Arsi Negele site A1.2: Changes in stock of livestock between 2008 and 2009 at Damot Sore site List of Tables Table 1 Level of education by sex of the household head 14 Table 2 Housing structure in the locations by year 15 Table 3 Mean areas in timad in the two locations 16 Table 4 Major livestock assets in the two locations 16 Table 5 Ownership of pack animals in the two locations 17 Table 6 Area and average yield per hectare for major cereal crops and pulses 18 Table 7 Sellers and not sellers of cereal crops in the study locations 19
2

High Global Food Prices – Crisis or opportunity for smallholder farmers in Ethiopia, Malawi and Tanzania
Table 8 Summary of root and tuber crop production and sales 20 Table 9 Income from sales of crop in two study sites 21 Table 10 Income received from sales of livestock and their products in Birr 22 Table 11 Participation in different sources of income other than crop and livestock sales 23 Table 12 Income from major sources 24 Table 13 Expenditure on basic agricultural inputs 25 Table 14 Consumption expenditures of farm households in the two sites 26 Table 15 Use of the income gained from increased crop prices 27 List of Figures Figure 1 Map of Ethiopia showing the study sites 11
3

High Global Food Prices – Crisis or opportunity for smallholder farmers in Ethiopia, Malawi and Tanzania
List of Acronyms Hhs Households OECD Organization for Economic Cooperation and Development PAs Peasant Associations
4

High Global Food Prices – Crisis or opportunity for smallholder farmers in Ethiopia, Malawi and Tanzania
Acknowledgement We highly acknowledge Norad for the financial support for this study. We also thank Professor
Ruth Haug and Associate Professor Trygve Berg at Noragric for initiating this collaborative
research idea and for leading its realization.
We also thank the farmers, consumers and traders for their time and genuine information. We
also appreciate the help and cooperation we received from woreda agriculture and rural
development offices, town administration offices, and enumerators in both research sites. Finally,
we acknowledge the collaboration of the Research and Extension Coordination Office of
Hawassa University in providing vehicle for the field survey.
5

High Global Food Prices – Crisis or opportunity for smallholder farmers in Ethiopia, Malawi and Tanzania
1. INTRODUCTION
Food is one of the basic necessities for human life. Ensuring the availability of food, food
security and food self sufficiency has been and will continue to be the prior target of
governments. To this end governments engage in production and/or purchase of food. Purchase
of food as net importer of food is regarded as a strategy by almost all African Countries.
Starting from the 1950’s, high levels of production in OECD countries and the Green revolution
in Asia, has led to increase world food production and hence decrease price of food (Wiggins and
Levy, 2008). However, the price of staple food has been rising since 2000 and the rise is stronger
starting from 2006. Forecasts show that the rising food price is going to increase in the next 10
years and the situation has raised serious concerns by the public about the food and nutrition
situations of the poor in developing countries (Ulimwengu et al., 2007).
In Ethiopia, during the years 2004 to 2008, the food inflation rates indicate a general trend of
increasing food prices, 3.4%, 13.6% and 34.9% in 2004, 2006 and 2008 respectively. The rise
was believed to be due to the rise in the food items and food taken away from home (Ibid).
Different reasons have been forwarded in tracing the root causes of this global price rise. The
major causes are identified as: rapidly rising demand in emerging economies, poor harvests in
some major commodity producing countries, increases in the costs of production due to higher
fuel and fertilizer prices, higher transportation costs, diversion of food crops to production of bio-
fuels, and the introduction of policies to restrict food exports by some countries (Loening et al.,
2009). The relative importance of each cause could differ between countries and should be
identified through research.
1.1. INFLATION UNDER ETHIOPIAN CONTEXT Ethiopia, one of Africa’s largest countries with an estimated 77 million people in 2008, is also
one of the countries in Africa who recently have experienced high and ever increasing inflation.
Historically, the country has not suffered from high inflation. According to Loening, et al., 2009,
annual average inflation was only 5.2 percent between 1980 and 2004, and major inflationary
6

High Global Food Prices – Crisis or opportunity for smallholder farmers in Ethiopia, Malawi and Tanzania
episodes have occurred only during conflict and drought. Annual average inflation reached a
record of 18.2 percent during the 1984/85 drought, 21.1 percent in 1991/92 at the peak of war
with Eritrea, and again 15.5 percent during the 2003 drought.
An unexpected and most remarkable experience during the period of 2004-2009 progress was
that the market no longer depresses the food prices after harvest. The food inflation continued to
accelerate despite good weather and an agricultural production boom. Since 2007 the farmers
have supplied increased surpluses to the market and still got stable or even increased prices for
what they can deliver. Farmers experience that use of inputs can be profitable but wage earners
and urban dwellers who spend a substantial proportion of their income on food saw their
household economy dramatically worsened. Even the majority of the rural poor who are not net
sellers of cereals are equally hit by the inflation.
1.1.1 The oil price and Ethiopia
As an oil-importing country with limited access to foreign currencies Ethiopia is vulnerable to
fluctuations in oil prices. The dramatic change of oil prices during 2008 came as a threat to an
otherwise positive trend of economic development. Driven by favorable climate and increasing
agricultural productivity the economy grew steadily and reached a cumulative GDP growth of 67
% for the five year period of 2003 – 2008. The oil-import bill of 2008, however, drained the
foreign exchange reserves and threatened to halt this positive economic development. The higher
transport cost affected price of imported commodities and contributed to the inflation.
Ethiopia developed and approved a biofuel-policy during 2008 hoping to reduce dependence on
imported oil. The policy included plans for a huge expansion of sugar cane plantation for bio-
ethanol production and incentives for investment in bio-diesel production with such crops as
jatropha, castor and even oil palm. Many biofuel-projects are in the pipeline, but implications for
the national economy and for food security remains to be seen.
7

High Global Food Prices – Crisis or opportunity for smallholder farmers in Ethiopia, Malawi and Tanzania
1.1.2 The fertilizer price and Ethiopia
Ethiopia imports all its fertilizers, and most farmers use fertilizer or would use it if they could
afford it. In the small-holder dominated Ethiopian agricultural sector, however, the producers do
not have the money to buy at planting time and depend to a large extent on seasonal credit.
World market fertilizer prices started to increase in late 2007. Ethiopian farmers use urea
(nitrogen-fertilizer) and DAP (diammonium phosphate; composite nitrogen + phosphate). The
world market price for urea had been fairly stable during the whole of the century until it
suddenly jumped from 228 $ to 405 $ in 2007. But in 2008 the price went up to 815 $ per ton in
August but then plunged to 247 $ by end of the year. The price shock of DAP was even worse.
From 262$ in early 2007 it soared to 1218 $ by April 2008. Later in 2008 it dropped to 469 $
(IFDC, 2008). For Ethiopia, this is meant a heavy toll on the reserves of foreign exchange.
Farmers had to consider not only whether it would be profitable to use so expensive inputs, but
also whether they at all could raise the money for such fertilizer bills.
1.1.3 Food prices and inflation in Ethiopia
Food prices account for 57 % of the consumer price index in Ethiopia. Inflation therefore reflects
the domestic food market to a large extent. Traditionally prices have gone up after poor harvests,
but in 2007 prices increased in spite of a bumper harvest, and in 2008 it went up dramatically
after another good year. Apparently effective food demand is growing more than the supply.
Monthly inflation (12-month moving average) topped over 60% in August 2008, but has since
been slowly decreasing. Since food inflation is the main contributor to the overall inflation, this
means that consumers faced close to a doubling of cereal prices in 2008. This price shock spread
to other food commodity thus threatening many people’s food security. It also made it very
expensive for the government as well as for WFP and other agencies to provide food for the poor.
As mentioned the total food production was, according to the FAO/WFP crop and food security
assessments, sufficient for national level food security. However, buying food for distribution to
food deficit areas and for help to the poor on the domestic market would increase the demand and
the prices and thereby worsen the situation. The government therefore decided to cover such
needs by importing wheat and distributing it for a subsidized price as a welfare contribution.
Such import started in late 2007, continued during 2008 and in 2009. So far the government has
8

High Global Food Prices – Crisis or opportunity for smallholder farmers in Ethiopia, Malawi and Tanzania
purchased 750 000 t of wheat. The efforts of the Ethiopian government were not only provision
of subsidized wheat & edible oil to the urban poor, but include export ban on certain food items,
removing/lifting value added & turnover taxes on imported foodstuffs, huge & continued subsidy
on oil, introduction of commodity exchange market and other similar measures (Emiru and
Ageba, 2009). While this may have prevented a further increase of food prices, it contributed
little to reduction of prices. The annual food inflation rose from 18.2 percent in June 2007 to a
peak of 91.7 percent in July 2008. At the same time overall inflation rose from 15.1 percent in
June 2007, to 55.3 in June 2008 (Loening et al., 2009). Wage earners continued to complain
bitterly of economic hardships because of the expensive food.
There is no consensus on why Ethiopia is experiencing such rapid prices rises. Unlike in the past,
inflation growth has recently coincided with high economic growth rates. World food price
increases may not have big effects in Ethiopia because of the limited size of food imports.
Although Ulimwengu, et al, (2009) find significant short-term price effects between the world
maize market and Ethiopian regional markets bordering Sudan, Prices for major staple crops have
been above import parity since early 2008. The major explanations are, however, high domestic
demand, expansionary monetary policy, a shift from food aid to cash transfers, and structural
factors due to reforms and investments in infrastructure (Dorosh and Subran, 2007; World Bank,
2007; von Braun, 2007; Emiru and Ageba, 2009 ).
Some studies also indicated that food price variability has been consistently higher in Ethiopia
compared with the world market, and the variability was heterogeneous within the country. The
food inflation rate was different between regions except a common feature of the drastic rise in
food inflation rates during the first half of 2008 (Ulimwengu et al., 2009).
1.2. STATEMENT OF THE PROBLEM
High food prices will have adverse effects on poverty, especially in countries with large fractions
of net food-buyers and urban population groups. However, what the current state of food price
will bring to the rural poor (opportunity or threat) is a subject of argument by most scholars. The
impact is obviously different for different countries depending on whether a country is net food
9

High Global Food Prices – Crisis or opportunity for smallholder farmers in Ethiopia, Malawi and Tanzania
importer or exporter. At the household level, the few households who are net sellers of food may
benefit from higher prices. But majority of poor and food insecure households are to be highly
affected, to the extent that their nutritional status could be put at risk (von Braun, 2008). Efforts
to understand the situation in Africa and particularly in the Ethiopian context are limited. This
research was therefore initiated by the Norwegian Government (NORAD) to explore the
consequences of rising food prices in Ethiopia, as part of the three pilot projects to be conducted
in Africa (the others in Malawi and Tanzania). The research was carried out in collaboration
between the Department of International Environment and Development Studies (NORAGRIC)
of the Norwegian University of Life Sciences (UMB) and the Department of Agricultural
Resource Economics and Management (AREM) of the Hawassa University.
1.3. OBJECTIVES OF THE STUDY
The main objectives of the study are:
i) To assess how high food prices impact on both poor men and women producers and poor
consumers in Ethiopia in relation to production, income, food security and poverty.
ii) To assess how Norway could contribute towards reducing the negative impacts of high
food prices on poor rural and urban consumers and at the same time utilizing the
opportunities that high food prices provide for men and women farmers in Ethiopia.
2. METHODOLOGY
2.1. RESEARCH SITE
Two areas, each comprising three ‘Kebeles’ (Peasant Associations) were selected for this study.
The two sites are Arsi Negele woreda14 in West Arsi Zone of Oromia region and Damot Sore
woreda (Gununo area) of Wolaita Zone in the Southern Nations, Nationalities and Peoples
Region (SNNPR). Figure 1 shows the location of the two research sites on the map of Ethiopia.
14 Woreda is equivalent to district.
10

High Global Food Prices – Crisis or opportunity for smallholder farmers in Ethiopia, Malawi and Tanzania
The sites were chosen for the following reasons:
i) In terms of the population size and land availability, the two sites represent two different
situations. In the former, population size and density are relatively smaller and average
farm lands are relatively larger while the latter is densely populated with less than a
hectare of land to till.
ii) Arsi Negele and areas around it are known to produce staple foods namely, wheat and
maize, representing cereal based diet. Damot Sore and other areas in the SNNPR are well
known for producing and consuming root and tuber crops.
iii) Regarding access to roads and markets, Arsi Negele is found by the side of the
international road connecting Addis Ababa with Nairobi and in the middle of the network
of roads which dispatch different commodities to different parts of the Southern and
Oromia regions. Damot Sore is found at a relatively distant place to major markets and
road networks are poor when compared with Arsi Negele.
The researchers believe that the outcome of this research will assess the relationships between the
aforementioned points and food price inflation.
Figure 1. Map of Ethiopia showing the study sites Legend: Damot Sore Arsi Negele
11

High Global Food Prices – Crisis or opportunity for smallholder farmers in Ethiopia, Malawi and Tanzania
2.2. SAMPLES AND RESEARCH DESIGN
This study employed both qualitative and quantitative methods of data analysis by using both
primary and secondary data. A total of 150 farm households (hhs) from the two locations, 77
from Arsi Negelle and 73 from Damot Sore, were selected for interviews using a systematic
random sampling method. Of the interviewed farm hhs, 13% were female headed. The focus
being on farm hhs in the two locations, consumers and traders were included with the view to
grasp their understanding about the food price inflation and its effect on their life. For this, 50
consumers and 10 traders from the nearest towns of each location were also selected using the
same sampling method. The consumer study also included consumers and traders from Hawassa
(regional city) for comparison.
Data analysis employed some simple descriptive statistics such as mean, standard deviation and
percentage using Excel and STATA software.
3. RESULTS AND DISCUSSION
3.1. HOUSEHOLD CHARACTERISTICS AND ASSET OWNERSHIP
Out of 150 farm hhs included in this study, 77 (51%) and 73 (49%) were taken from Arsi Negelle
and Damot Sore, respectively. Most of the farm hhs were male headed, 90% in Arsi Negelle and
85% in Damot Sore. Moreover the average age of the hhs was relatively older (49years) at Arsi
Negele and younger (44years) for Damot Sore. The average age of the household head for the
total population was calculated to be 46 years.
The mean household size over the two locations was found to be 7.9 with slightly higher (8.5)
mean hhs size for Arsi Negelle to the mean hhs size of 7 for Damot Sore. This figure is much
higher than the national average. Regarding the member’s presence in the house, members of the
hhs in Damot Sore had stayed through all the 12 months while 88% of the hh members in Arsi
Negele stayed for the whole year with the mean stay being 10 months.
12

High Global Food Prices – Crisis or opportunity for smallholder farmers in Ethiopia, Malawi and Tanzania
3.1.1. Education and Employment
The analysis for educational levels by the head of the household reveal that hh heads in Arsi
Negelle is better educated than those Damot Sore in both sexes of the household head (Table 1).
From the total sample, 57 household heads (38%) have not attended any formal education, and
none of the female headed households taken from Damot Sore have attended education. In both
locations, male heads are better educated than female heads.
Regarding employment, 97.3 percent of the respondents were employed as farmers on their own
land and only 2 (1.36%) were government employees who happened to be farmers at the same
time. Only one respondent considered himself self employed but did not have employment at the
time of our survey. When we look at the two sites separately, household heads in Arsi Negelle
had better employment than Damot Sore. It was also observed that none of the heads in Damot
Sore went to the level of tertiary education which would provide alternative employments while a
case of 3 observations was observed for Arsi Negelle.
13

High Global Food Prices – Crisis or opportunity for smallholder farmers in Ethiopia, Malawi and Tanzania
Table 1. Level of education by sex of the household head
Level of
Education
Arsi Negelle Damot Sore
Male
headed Hhs
Female
headed Hhs
Total Male
headed Hhs
Female
headed Hhs
Total
No % No % No % No % No % No %
0 16 23.2 3 37.5 19 24.7 27 43.5 11 100 38 52.1
1-5 19 27.5 4 50 23 29.9 18 29.0 0 0 2 2.7
6-8 21 30.4 1 12.5 22 28.6 12 19.4 0 0 4 5.5
8-10 10 14.5 1 12.5 11 14.3 5 8.1 0 0 3 4.1
10+15 3 4.3 0 0 3 3.9 0 0.0 0 0 9 12.3
Total 69 100 8 100 77 100 62 100 11 100 73 100
3.1.2. Asset Ownership
a) Shelter Ownership
Investigation was made on the availability of shelter made from both iron roofed and grass roofed
houses. In Arsi Negelle, half of the hhs had no iron roofed houses while 42% of hhs had one and
nearly 5.2% of the hhs had more than 1 iron roofed houses in 2007 (Table 2). The figures for the
iron roofed houses remained the same in 2008 with some changes for grass roofed houses.
In Damot Sore, the maximum iron roofed house during 2007 was 2 and the rest had either
1(53%) or no (44%) iron roofed houses. The figures clearly depict that Arsi Negelle area is
better in terms of shelter than Damot Sore.
15 10+ refers to those household heads who have attended Technical and Vocational Training and/or went to their tertiary education.
14

High Global Food Prices – Crisis or opportunity for smallholder farmers in Ethiopia, Malawi and Tanzania
Table 2. Housing structure in the locations by year
No of
Shelter
Asset
Arsi Negelle Damot Sore
Iron Roofed Grass Roofed Iron Roofed Grass Roofed
2007 2008 2007 2008 2007 2008 2007 2008
0 39 39 20 18 32 31 37 38
1 34 34 42 44 39 40 35 34
2 2 2 10 10 2 2 1 1
3 1 1 4 4 0 0 0 0
4 1 1 1 1 0 0 0 0
Grass roofed houses were the major types of shelter for hhs in Damot Sore in both the years. b) Land availability The average landholding for the respondents in the two locations was calculated to be 4.91
timad16. Comparing the two locations, higher land holding of 5.3 timad was observed for Arsi
Negelle to that of 1.5 timad for Damot Sore (Table 3).
Looking in to the practices of land contracts, the practices of renting land, borrowing and sharing,
nearly all of the hhs in the two locations were participating in these transactions. The number of
participants was higher for arsinegele than for Damot Sore, except that land borrowing was
totally absent in Arsi Neglle. The mean cultivated land was also higher for Arsi Negelle (5.8
timad) than Damot Sore (4.9 timad), the average cultivated land for the whole population being
3.91 timad.
The practices of land fallowing and allocating pasture land were also studied. The analysis
showed that farm hhs in Arsi Negelle on average allocated 0.15 timad of land for pasture while
this is slightly higher for land scarce Damot Sore (0.32 timad). Land fallowing was totally absent
in Damot Sore while farmers around Arsi Neglle use 0.03 timad of their land as fallow.
16 Timad is local yardstick for measuring land in Ethiopia and 1 timad=0.25ha
15

High Global Food Prices – Crisis or opportunity for smallholder farmers in Ethiopia, Malawi and Tanzania
Table 3. Mean areas in timad in the two locations
No Type of cultivation Arsi Negelle
(Timad)
Wolait Soddo
( Timad)
1 Land Owned 5.279 1.485
2 Land Rented in 0.542 0.021
3 Land Rented Out 0.299 0.007
4 Land Borrowed 0.000 0.041
5 Land Share Cropped 0.344 0.348
6 Land Cultivated 5.867 1.847
7 Fallow Land 0.030 0.000
8 Pasture Land 0.156 0.324
9 Land Under Tree 0.266 0.303
c) Livestock asset
c.i. Productive Animals
In terms of the productive livestock assets, comparing the two places reveals that hhs in Arsi
Negelle have higher mean number of every live stock asset is than their counter parts in Damot
Sore (Table 4). All the livestock assets have declined in mean number of the stock between 2007
and 2008, except for goats that have increased in Arsi Negelle and remained constant in Damot
Sore and Sheep which have increased in Arsi Negelle only.
Table 4. Major livestock assets in the two locations
No Type of animal Arsi Negele Damot Sore
Mean stock
2007
Mean stock
2008
Mean stock
2007
Mean stock
2008
1 Cattle 5.45 4.84 2.46 2.16
2 Milking cows 1.29 1.22 0.81 0.69
3 Sheep 1.94 1.98 0.5 0.38
4 Goats 0.59 0.7 0.04 0.04
16

High Global Food Prices – Crisis or opportunity for smallholder farmers in Ethiopia, Malawi and Tanzania
In addition, it is observed that the unit holdings of livestock assets went on decreasing over the
two locations during the two periods included in the study and even for some observations the net
asset holdings on count basis was negative indicating that farm households were forced to sell
their assets than they have acquired through buying or new births (See Tables 16 and 17 in the
appendix).
c.ii. Pack Animals
Pack animals are an integral part of the farm households as they are local means to transport
agricultural products to the nearby market and get reasonable price. The result revealed a higher
proportion of pack animals in Arsi Negelle giving them the option to deliver their products in the
market in time and gain a reasonable price. No household had Mule in both study sites. It is also
to be noted that the most important pack animal is Donkey (Table 5).
Table 5. Ownership of pack animals in the two locations
Number
of pack
animals
Arsi Negelle Damot Sore
Number of hhs
owning (2007)
Number of hhs
owning (2008)
Number of hhs
owning (2007)
Number of hhs
owning (2008)
Horse Donkey Horse Donkey17 Horse Donkey Horse Donkey
0 75 43 75 43 73 71 72 69
1 1 26 1 25 0 2 1 4
2 0 4 0 6 0 0 0 0
3 1 3 1 1 0 0 0 0
4 0 1 0 1 0 0 0 0
Total 77 77 77 76 73 73 73 73
17 Negative holding of donkey was recorded for both locations in 2008 by one hhs
17

High Global Food Prices – Crisis or opportunity for smallholder farmers in Ethiopia, Malawi and Tanzania
3.2. PRODUCTION, CONSUMPTION AND MARKETS
3.2.1. Crop production and selling activities
As we are dealing with two places that widely differ in cropping patterns, we will divide our
discussion on crop production and sales into two parts. One deals with cereals and pulses and the
other with vegetables, root and fruit crops.
a) Cereal and pulse crops
According to the result of the analysis, maize, wheat, teff, barley and haricot bean take the larger
area of crop production. The crops received an average area of 0.88, 0.65, 0.19, 0.08 and 0.01
hectare of land in Arsi Negelle and 0.21, 0.09, 0.04 and 0.01 hectare of land in Damot Sore for
maize, wheat, teff, haricot bean and barley respectively (Table 6). The average yield of these
crops was also calculated and the results indicate that maize is highly productive in both areas
registering 13.4 and 8.2qt/ha in Arsi Negelle and Damot Sore, respectively followed by wheat.
Table 6 summarizes land allocation and productivity of the major18 cereal and pulse crops
produced in the areas.
Table 6. Area and average yield per hectare for major cereal crops and pulses
Crop
Type
Arsi negelle Damot Sore Amount
sold(Qt/Ha) Average
area(ha)
Average
yield
(Qt/ha)
Amount sold
(Qt/Ha)
Average
area(ha)
Average
yield
( Qt/ha)
Maize 0.88 13.4 2.5 0.21 8.21 0.06
Wheat 0.65 10.8 3.6 0.09 0.3 0.08
Teff 0.19 1.5 0.26 0.09 0.44 0.20
Barley 0.081 3.02 0.03 0.01 3.1 0.01
Haricot
bean
0.015 0.43 0.03 0.04 1.1
18 The majority classification is based on size of land and productivity of the crops.
18

High Global Food Prices – Crisis or opportunity for smallholder farmers in Ethiopia, Malawi and Tanzania
An investigation was made to see the contribution of crop production and selling as to how much
it represents the income of a household in a given year. As a result hhs around Arsi Negelle sold
at average 2.5, 3.6, 0.26 and 0.03 quintals of maize, wheat, teff and barley, generating an average
income of Birr 915.6, 1751.9, 284.4 and 14.28 respectively. This is quite consistent with the
production pattern of the area in which wheat dominates followed by maize and other cereal
crops. It is also found that no farm household has brought crops like finger millet, faba bean and
haricot bean to the market, most probably using all for home consumption.
This is quite the opposite in the Damot Sore where only 0.06, 0.08, 0.20 and 0.01 quintals of
maize, wheat, teff and barley were brought to market making a meager income of Birr
27.05,37.4,99.15,4.79 respectively. In addition, the farmers have brought 0.06 quintals of haricot
bean, and made Birr 15.3 income on average.
We also assessed participation the households marketing of cereal crops in the two sites. Table 7
summarizes the number of hhs who were involved in selling activities of the crops indicated
above. The number of maize and wheat sellers, the crops which account for the large amount of
hhs income in both locations, is higher in Arsi Negelle than in Damot Sore. This is compatible
with one of the arguments kept in the rationale to select sites as Arsi
Table 7. Sellers and not sellers of cereal crops in the study locations
Crop Type Arsi Negelle Damot Sore
Sellers19 Not sellers Sellers Not sellers
Maize 35 42 9 64
Wheat 50 27 10 63
Teff 10 67 18 55
Barely 3 74 2 71
Sorghum 0 77 0 77
Haricot bean 0 77 6 67
19 Sellers represent hhs which sold any amount of the crops.( at least more than zero)
19

High Global Food Prices – Crisis or opportunity for smallholder farmers in Ethiopia, Malawi and Tanzania
Negelle is located adjacent to main roads with access to markets giving them the incentive to do
some marketing. It should also be noted that insignificant amounts of crops like Chick pea were
made available to the market. Due to the fact that the farm households in Damote Sore mostly
depend on root crops, some are producing teff as a cash crop.
b) Vegetable and fruit production and selling
A comparative difference between the locations was observed in their production for vegetables,
fruits and root and tuber crops. Hhs around Damot Sore allocated more areas of land for these
crops and were higher producers except for irish potato in which case the Arsi Negelle area takes
the upper hand. More over hhs Damot Sore have even allocated more area of land to sweet potato
and Yam than the areas they have allocated for cereal crops (Table 8). Significantly the
summation of the areas for cereals is less than the land allocated for sweet potato.
Production of these crops is also higher in Damot Sore area than Arsi Negelle with Sweet Potato
and Yam yielding the highest 3 and 1.4qt/ha. Irish potato was largely produced in Arsi Negelle
recording an average yield of 4.9qt/ha. Yam and Taro were not produced in Arsi Negelle. Onion
and pepper as expected were largely produced around Arsi Negelle.
Table 8. Summary of root and tuber crop production and sales
Crop Type
Arsi Negelle Damot Sore Amount
sold(Qt/Ha) Average
area(ha)
Average
yield
(Qt/ha)
Amount
sold
(Qt/Ha)
Average
area(ha)
Average
yield
( Qt/ha)
Sweet Potato 0.003 0.06 0.16 0.11 3.1 0.15
Irish Potato 0.17 4.9 0.25 0.02 0.25 0.05
Yam 0 0 0 2.8 1.4 0.19
Taro 0 0 0 0.03 0.7 0.08
onion 0.05 2.4 2.39 0.0006 0.1 0.005
Pepper 0.06 0.4 0.27 0.0004 0.003 0.002
20

High Global Food Prices – Crisis or opportunity for smallholder farmers in Ethiopia, Malawi and Tanzania
In Arsi Negelle, Irish potato and Sweet potato earned the highest income with 27.9 and 26.5 Birr
on average per quintal sold. While in Damot Sore, yam, sweet potato, irish potato and taro earned
incomes of 16.02, 11.6, 11.2 and 6.7 Birr income on average respectively.
Pepper and onion were the highest income sources for Arsi Negelle earning about Birr 525 and
518 per quintal per annum. These figures are very small for Damot Sore, making on average Birr
1.5 and 0.78 for Onion and pepper20.
c) Overall income from crop sales
When we compare the overall income of the two sites, the average income in Arsi Negele which
is surplus producing area for cereal crops is much larger than that of Damot Sore, an area with
dominantly root crop based farming system (Table 9).
Table 9. Income from sales of crop in two study sites Crops Arsai Negele Damot Sore Total
Maize 67260 2130 69390
Wheat 106138 2277.5 108415.5
Teff 12200 7030.5 19230.5
Barley 950 350 1300
Haricot bean 0 1115 1115
Chick pea 0 79 79
Enset (Kocho) 0 50 50
Enset (Bulla) 0 70 70
Sweet potato 2040 810 2850
Irish potato 2150 850 3000
Yam 0 1170 1170
Taro 0 53.1 53.1
Coffee 0 6270 6270
Onions 35787 111 35898
Pepper 40492 57 40549
Other vegt 550 450 1000
20 Caution must be taken that these average figures represent small proportion of growers and sellers from a large population who didn’t grow and sell.
21

High Global Food Prices – Crisis or opportunity for smallholder farmers in Ethiopia, Malawi and Tanzania
Avocado 0 415 415
Banana 0 126 126
Mango 0 20 20
Other crops 0 60 60
Total 267567 23494.1 291061.1
Average 3474.896 321.837 1940.407
In Arsi Negele, the sale of cereal crops counts for the largest sale followed by pepper and onions
where as the sale in Damot Sore is diversified into all crops including pulses, root and fruit crops.
The major sale items in this area are coffee and Teff. Coffee and root crops such as enset, yam
and taro are not grown in Arsi Negele. Generally, average crop sale income (Birr 3475) of
producers in Arsi Negele is much higher than that (Birr 322) of producers in Damot Sore.
3.2.2. Livestock production and selling activities We have already discussed the livestock inventory of the households in section 2. Here, we
simply provide a note of incomes that the hhs receive from selling livestock and their products.
Table 10 shows that farmers in Damot Sore earn more income from selling butter than their
counterparts in Arsi Negelle. However, the average income from sales of all livestock and
products in Arsi Negelle area is much higher (Birr 456.68) than the sale in Damot Sore (Birr
329.72). The overall average income from the two sites combined is about 399.51 Birr.
Table 10. Income received from sales of livestock and their products in Birr
Livestock and
products sold
Arsi Negele Damot Sore Total (research area)
Butter 5300 7080 12380
Milk 0 843.5 843.5
Eggs 352 363.2 715.2
Honey 0 320 320
Heifer 1600 1791 3391
Bull 4460 2353 6813
Milking cows 450 2000 2450
Other cows 2500 650 3150
22
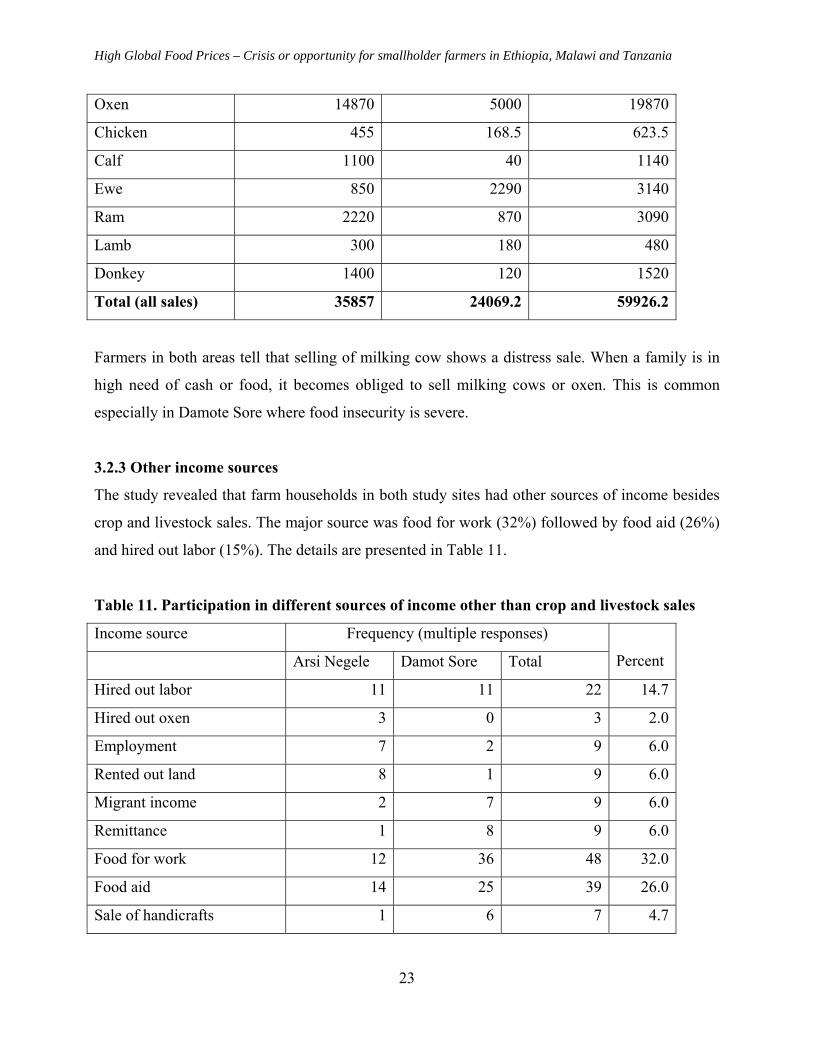
High Global Food Prices – Crisis or opportunity for smallholder farmers in Ethiopia, Malawi and Tanzania
Oxen 14870 5000 19870
Chicken 455 168.5 623.5
Calf 1100 40 1140
Ewe 850 2290 3140
Ram 2220 870 3090
Lamb 300 180 480
Donkey 1400 120 1520
Total (all sales) 35857 24069.2 59926.2
Farmers in both areas tell that selling of milking cow shows a distress sale. When a family is in
high need of cash or food, it becomes obliged to sell milking cows or oxen. This is common
especially in Damote Sore where food insecurity is severe.
3.2.3 Other income sources
The study revealed that farm households in both study sites had other sources of income besides
crop and livestock sales. The major source was food for work (32%) followed by food aid (26%)
and hired out labor (15%). The details are presented in Table 11.
Table 11. Participation in different sources of income other than crop and livestock sales
Income source Frequency (multiple responses)
Percent Arsi Negele Damot Sore Total
Hired out labor 11 11 22 14.7
Hired out oxen 3 0 3 2.0
Employment 7 2 9 6.0
Rented out land 8 1 9 6.0
Migrant income 2 7 9 6.0
Remittance 1 8 9 6.0
Food for work 12 36 48 32.0
Food aid 14 25 39 26.0
Sale of handicrafts 1 6 7 4.7
23

High Global Food Prices – Crisis or opportunity for smallholder farmers in Ethiopia, Malawi and Tanzania
Sale of beverages 0 2 2 1.3
Sales of firewood 5 9 14 9.3
Sale of grass 0 7 7 4.7
Petty trade 3 6 9 6.0
Gifts/assistance 0 1 1 0.7
Non-participant households 35 3 38 25.3
Comparing the two study sites shows that many farm households in Damot Sore depend on food
for work and food aid. Almost all the households in this site participate in these different income
sources while about 45.5% percent of the respondents in Arsi Negele do not have income from
these sources. Most probably, they are better off by concentrating in crop and livestock
production as they also have relatively productive and large land sizes. However, the average
income of these producers from this income source (Birr 1247.92) is still higher than the average
income (743.93) of Damot Sore producers.
3.2.4. Overall income of the farm households in the two sites As it is clear from the previous sections, the overall average income of the producers in Arsi
Negele is higher than that of producers in Damot Sore (Table 12). Producers in Arsi Negele
generate largest income from crop sales followed by income from other sources while those in
Damot Sore earn more from selling livestock and their products.
Table 12. Income from major sources
Major income source Arsi Negele Damot Sore Total
Crop sales 267567 23494.1 291061.1
Livestock & products sales 35857 24069.2 59926.2
Other sources 96089.5 54307 150396.5
Total 399510.5 101870.3 366026.8
Average 5188.45 1395.48 2440.17
As producers in Arsi Negele are generally in a better position in terms of market access, land size
and productivity, most of them have benefited from price increase for major cereals. The majority
of Damot Sore producers on the other hand were not in a position to use the opportunity of
24

High Global Food Prices – Crisis or opportunity for smallholder farmers in Ethiopia, Malawi and Tanzania
earning more income from especially crop sales due to limited land size and inaccessibility to
major markets.
3.3. PRODUCTION AND CONSUMPTION EXPENDITURES
Farmers’ expenditure on basic agricultural inputs, seed, fertilizer and chemicals was also
analyzed and the results are presented below (Table 13).
Table 13. Expenditure on basic agricultural inputs
Type of
Input
Arsi Negelle Damot Sore
Mean Quantity
used(Kg/Lit)
Mean
Expense
Mean Quantity
used(Kg/Lit)
Mean
Expense
Seed 15.31299 542.5357 .1108072 103.0445
DAP 1.016234 764.9481 .1779534 123.237
UREA .3357143 102.0779 .0293151 14.67055
Chemicals 1.889803 34.86364 0 0
Farm hhs in Damot Sore have a small tendency to adopt or use modern yield/Productivity
increasing inputs. This is reflected in their reduced productivities of most of the cereal and
vegetable crops which were important sources of income for the farm hhs. Most of the farmers
interviewed condemned escalating fertilizer prices for not using sufficient amount of fertilizer
although they at the same time understand that their soil needs fertilizer for better productivity.
The use of fertilizer was better in Arsi Neglle most probably because they have a comparative
advantage of producing high earning cereal crops and on a relatively larger area of land.
Our analysis of expenses on food items, cloths and other house hold goods revealed that farm hhs
in Damot Sore spend much on food items but little on other items (Table 14), given the little
income they derived from different activities.
25

High Global Food Prices – Crisis or opportunity for smallholder farmers in Ethiopia, Malawi and Tanzania
Table 14. Consumption expenditures of farm households in the two sites
Type of Input Arsi Negelle Damot Sore
Mean Expense Mean Expense
Food items 417.2727 836.274
Clothing 1171.169 212.9452
Household goods 350.2078 26.90411
health 356.863 86.0137
Schools fee 598.039 138.1849
Travel 299.1429 45.43836
Tax 70.24675 35.84932
Ceremony 219.8701 194.863
The result can also be used as a proxy variable to show the wealth status of the two locations;
farm hhs in Arsi Negelle are relatively wealthier than farm hhs in Damot Sore. The figures also
demonstrate that farm hhs in Damot Sore have reduced access to education and health, and hold
little house hold assets. These could be hit most by the price inflation compared with those in
Arsi Negele. Most of them are not net sellers of cereals, and thus missing the opportunity of the
price increase on food crops. In the next section, we assess the effects of the price increase and
perceptions of different stakeholders concerning this.
3. 4. FOOD PRICE INCREASE AND THE USE OF GAINED INCOME
About 96 % of the interviewed farmers in Arsi Negele reported that food prices have increased
especially for wheat, making them earn better. In Damot Sore, only 68% percent of the
interviewed farmers reported the food price increase, for them especially for teff. Table 15 shows
number of households who reported their spending from the gains due to the price increase.
Farmers in Arsi Negele invested more in farm inputs and housing while the majority in Damot
Sore has spent on food items (the percentage does not add to 100 as one interviewee could report
spending on more than one thing). This is consistent with what we have discussed earlier because
farmers in Damot Sore are more of net buyers of cereals.
26

High Global Food Prices – Crisis or opportunity for smallholder farmers in Ethiopia, Malawi and Tanzania
Table 15. Use of the income gained from increased crop prices
Income
spending
Farmers who reported spending from the gain
Arsi Negele Damot Sore Total
number % of 77 number % of 73 number % of 150
Food 13 16.88 11 15.07 24 16.00
Housing 13 16.88 7 9.59 20 13.33
School fee 10 12.99 6 8.22 16 10.67
Clothes 10 12.99 4 5.48 14 9.33
Farm input 23 29.87 2 2.74 25 16.67
Animal purchase 4 5.19 3 4.11 7 4.67
hh furniture 2 2.60 0 0.00 2 1.33
Tax/ceremonies 3 3.90 5 6.85 8 5.33
Medication 1 1.30 0 0.00 1 0.67
Saving/ donkey cart 3 3.90 0 0.00 3 2.00
Credit repayment 0 0.00 1 1.37 1 0.67
Have not sold 11 14.29 36 49.32 47 31.33
Total 93 120.78 75 102.74 168 112.00
In relation to the gains from the price increase, farmers in Arsi Negele reported providing
support to their relatives or friends either in kind (19 respondents) or in cash (14 respondents). In
Damot Sore, Nine respondents supported their relatives in urban areas and even friends in the
village in kind (giving sucks of food crop) and 13 in cash. Some 5 farmers reported buying
clothes for children of their nearest relatives. Strong social networks in Damot Sore seem to have
pushed even those who are not much better off to share what they have.
Moreover, 64% of the respondents in Arsi Negele reported changing their production patterns
following the price increase. Although the change in production pattern does not necessarily
indicate for better in Damot Sore, quite a big number of respondents (81%) reported changing
their production pattern due to the price inflation.
27

High Global Food Prices – Crisis or opportunity for smallholder farmers in Ethiopia, Malawi and Tanzania
3.5. PERCEPTIONS ABOUT THE EFFECTS OF PRICE INCREASE
In addition to asking farmers, we have also interviewed consumers and traders in the nearest
towns of the study areas. Although farmers, especially in Damot Sore, revealed that they were not
able to take advantage of the cereal crop price increase due to high fertilizer costs, they still agree
that the most negatively affected are the urban poor. Traders also fully agree with this, and think
that farmers (especially in Arsi Negele) are the most benefiting ones.
Consumers without exception claimed being victims of the price increase not only on food but
also other commodities and services (transport). According to them, farmers are now dealing with
traders selling in bulk instead of retailing to them. Farmers have also started to check prices
before selling and wait if they anticipate future prices to increase. Consumers also think traders
sometimes play a role in artificial price increase, for example, by storing and waiting for high
prices.
4. CONCLUSION AND RECOMMENDATIONS
This study has tried to assess the effect of food prices inflation on producers and consumers. Two
different localities with different farming systems and differences in market access were
considered for comparing the effects in these varying situations.
The study concludes that the effects on producers vary within the study site as well as between
the study sites. In both study sites there were households who benefited (net sellers) and those
who were hit by the price increase (net buyers) within each study site. However, the extent of the
benefit and the negative effects widely vary between the two sites. The price increase has
severely affected the majority of the producers in Damot Sore, as net buyers of cereal crops.
Although a few have reported being hit by the price increase, most of farm households in Arsi
Negele have benefited from it. On the other hand, the price increase has also affected the
livelihoods of the net buyers by increasing their inability to use agricultural inputs.
28

High Global Food Prices – Crisis or opportunity for smallholder farmers in Ethiopia, Malawi and Tanzania
The study also concludes that consumers are the most affected parts of the community by the
price increases. Consumers with lower income are struggling for survival being hit by the
increase in food prices and other commodities, also as traders or merchants shift the burden to
consumers. The effort of the government to sell imported wheat at subsidized price did not reach
many consumers at many towns.
There is a need for the policy makers and development workers to understand these varying
effects of the price increase on consumers and even producers. The effect is never the same in
different areas and for different households in the same area. The Norwegian Government can
help in assessing such varied situations and in providing material and technical support for
addressing the most vulnerable group of the community.
4.1 RECOMMENDATIONS FOR ETHIOPIA
• Poverty and population growth: The findings reconfirm the importance of reduction in population growth. In overpopulated areas like Wolaita most people are unable to take advantage of improved market conditions and remain food insecure and vulnerable to food price instability. The recent census (2007) shows that the reduction in population growth is slow, particularly in the densely populated areas in the South and West. Poverty reduction and population policies need to be reviewed and strengthened.
• Off farm employment opportunities: Growth in off-farm employment to facilitate
reduction in number of farmers is essential for a much needed transition towards farming that can provide households with sufficient income for decent livelihoods.
• Production increase: Potential for growth in agricultural production is considerable and
exceeds that of current population growth for a good number of years to come. Realizing such a potential depends on the market that must remain attractive and profitable, and climate that must deliver enough and favorably distributed rains every cropping season. While the market is now better for the producers and is reaching out to increasing number of farmers with the impressively growing road network, the weather is beyond human control and keeps individual farms and the entire nation in a state of extreme vulnerability. In addition to seasonal inputs for short-term profitability, Ethiopian agriculture needs investments for the long-term improvement of basic resources (soil, water, forest) to make the farm productivity more resilient relative to yearly fluctuations as well as to the projected longer term climate change.
29

High Global Food Prices – Crisis or opportunity for smallholder farmers in Ethiopia, Malawi and Tanzania
• Specially designed intervention programmers for development of farm and non-farm activities are needed in the densely populated areas such as that of Wolaita. When, as this study shows, people in those areas spend almost all their income on basic necessities and little or nothing on investments, resources for development must come from outside.
• With the current economic development the difference between those who can take
advantage of the economic opportunities and those who cannot (both rural and urban) are likely to increase. The social safety net remains important and will require considerable resources in foreseeable future.
30

High Global Food Prices – Crisis or opportunity for smallholder farmers in Ethiopia, Malawi and Tanzania
REFERENCES
Dorosh, P.A. and L. Subran. 2007. Food Markets and Food Price Inflation in Ethiopia.
Background paper for the Food Price Inflation Policy Note. Washington DC: World Bank.
Emiru, T. and G. Ageba, 2009. The Dynamics of Food Price Inflation in Ethiopia. Paper
presented in the 7th International Conference on the Ethiopian Economy, June 25-27, 2009,
Addis Ababa.
IFDC Report, 33 (4) December 2008.
Loening, J. L. Durevall, D. and Y.A. Birru, 2009. Inflation Dynamics and Food Prices in an
Agricultural Economy: The Case of Ethiopia. Paper presented in the 7th International Conference
on the Ethiopian Economy, June 25-27, 2009, Addis Ababa.
Ulimwengu, J.M., Workneh S. and Z. Paulos 2009. Impact of Soaring Food Price in Ethiopia:
Does Location Matter? IFPRI, Discussion Paper 846.
von Braun, J. 2007. The World Food Situation: New Driving Forces and Required Actions. Food
Policy Report 18. Washington DC: International Food Policy Research Institute.
__________ 2008. Rising Food Prices: What should be done? IFPRI Policy Brief, Washington
DC: International Food Policy Research Institute.
Wiggins, S. and S. Levy, 2008. Rising Food Prices: Cause for Concern. Overseas Development
Institute, Natural Resource Perspectives 115.
World Bank. 2007. Ethiopia: Explaining Food Price Inflation: Policy Note. Washington DC.
31

High Global Food Prices – Crisis or opportunity for smallholder farmers in Ethiopia, Malawi and Tanzania
32
A1.1 Changes in stock of livestock between 2008 and 2009 at Arsi Negele site Arsi Negelle Stock in 2007 (counts) Stock 2009 (counts) Type of Animal 0 1 2 3 4 5 6 7 8 9 0 1 2 3 4 5 6 7 8 9 Miliking Cows 34 15 16 3 3 5 1 34 15 14 2 4 5 1 Other Cows 54 13 7 2 1 55 10 8 2 1 Oxen 16 23 25 3 5 3 1 19 25 17 7 6 2 1 Hefier 49 6 13 6 2 1 49 5 10 8 3 1 1 Bull 64 11 1 1 64 11 1 1 Calf 46 12 13 3 2 1 51 7 9 2 1 Ewe 52 8 6 3 3 1 2 2 54 6 8 2 1 2 1 1 Ram 62 5 6 3 1 64 4 5 2 Lamb 63 5 3 2 1 1 1 1 61 6 3 1 3 1 1 Does 68 3 1 2 2 1 69 3 1 2 1 1 Buck 72 4 1 72 4 1 Kid 73 1 1 2 72 1 1 3
A1.2: Changes in stock of livestock between 2008 and 2009 at Damot Sore site Damot Sore Stock in 2000 Stock 2001 Type of Animal 0 1 2 3 4 5 6 7 8 9 0 1 2 3 4 5 6 7 8 9 Miliking Cows 26 37 9 1 28 38 5 4 Other Cows 47 21 3 1 1 49 19 1 1 1 Oxen 40 24 7 1 45 20 6 Hefier 57 13 3 57 8 5 1 1 Bull 69 4 67 3 1 Calf 62 10 1 51 12 4 Ewe 62 6 5 61 7 3 1 Ram 66 4 3 67 5 1 Lamb 72 1 68 4 1 Does 71 1 1 71 1 1 Buck 73 73 Kid 73 73

High Global Food Prices – Crisis or opportunity for smallholder farmers in Ethiopia, Malawi and Tanzania
APPENDIX 2

High Global Food Prices – Crisis or opportunity for smallholder farmers in Ethiopia, Malawi and Tanzania
APPENDIX 2
RISING FOOD PRICES: CRISIS OR OPPORTUNITY?
A Case Study of Chileka and Matenje Extension Planning Areas in Lilongwe and Salima Districts- Malawi
Prepared by
M. Alexander R. Phiri
James W. Banda
and
Emmanuel E. Kaunda
May, 2009
1

High Global Food Prices – Crisis or opportunity for smallholder farmers in Ethiopia, Malawi and Tanzania
TABLE OF CONTENTS List of Acronyms 4 Acknowledgements 5 Executive Summary 6 1. INTRODUCTION 9
1.1 Background 9 1.2 Research Questions 10
2. OBJECTIVES 11 3. STUDY APPROACH 11
3.1 Study area 11 3.2 Design of Study tools 13 3.3 Training and Recruitment of Data Collectors 13 3.4. Sample Size and Data Collection 13
4. RESULTS AND DISCUSSIONS 14 4.1 Household Demographic Characteristics 14 4.1.1 Education Level 15 4.2 Asset Ownership 16 4.3 Crops Grown and Food Security 17 4.3.1 Markets and Income from Crop Sales 19 4.3.2 Volatile Prices and Profitability of Maize 21 Source: Food and Nutrition Security Technical Secretariat. Ministry of Agriculture 4.4 Livestock Ownership and Sales 25 4.5 Source of household income 27 4.6 Household income expenditures 29 4.6.1 Use of Gained Income from Higher Crop Prices 31 4.7 General Impressions on Food Price Increase 32 4.8 Key Informant and Consumer Impressions 33 4.9 Impressions of Traders 35 4.10 The increase in fertilizer prices threatens production 36
5. CONCLUDING REMARKS AND RECOMMENDATIONS 37 5.1 Recommendations 38
REFERENCES 40 APPENDICES 41 A2. 1 Land Allocation by Crop A2. 2 Average Quantity of Maize Produced per Household A2. 3 Average Quantity of Maize Produced per Household by District A2. 4 Amount of Crop Produce Sold per Crop by District A2. 5 Income from Crop Sales by District
2

High Global Food Prices – Crisis or opportunity for smallholder farmers in Ethiopia, Malawi and Tanzania
A2. 6 Average Income Level by Study Site A2. 7 Price per Unit (MK) List of Figures Figure 1 Map of Malawi showing study sites A (Msundwe, Lilongwe District) and B (Khombedza, Salima District) 12 Figure 2 Nominal and Real Annual Average Maize Price in Malawi (see Banda et al 2008) 20 Figure 3 Agricultural Price Seasonality in Malawi 20 Figure 4 Relative Monthly Maize Prices for 2007 and 2008 22 Figure 5 Fertilizer and Food Price Indices (2000 = 100) 36 List of Tables Table 1 Education Level of Household Head by District 15 Table 2 Asset Ownership 16 Table 3 Fertilizer Price Changes (2005/06 – 2008/09) (US$/MT) 24 Table 4 Input-Output Price Ratios 25 Table 5 Livestock Ownership and Variation 25 Table 6 Unit Prices by Livestock Type Sold (Malawi Kwacha) 27 Table 7 Sources of Income 28 Table 8 Quantity Purchased in kilograms 30 Table 9 Cash Expenditure by Item or Commodity 31 Table 10 General Impressions 32
3

High Global Food Prices – Crisis or opportunity for smallholder farmers in Ethiopia, Malawi and Tanzania
LIST OF ACRONYMS
ADD Agricultural Development Division
ADMARC Agricultural Development and Marketing Corporation
ADP Agricultural Development Programme
AEDOs Agricultural Extension and Development Officers
ARDEP Agricultural Research and Development Programme
ASWAp Agriculture Sector Wide Approach
CAN Calcium Ammonium Nitrate fertilizers
EPA Extension Planning Area
EU European Union
FAO Food and Agriculture Organisation
HH Household
ISP Input Subsidy Programme
LADD Lilongwe Agricultural Development Division
MDGs Millennium Development Goals
MGDS Malawi Growth and Development Strategy
MK Malawi Kwacha
MT Metric tonne
NFRA National Food Reserve Agency
NORAGRIC Department of International Environmental and Development Studies
NSO National Statistics Office
SLADD Salima Agricultural Development Division
USA United States of America
US$ United States Dollar
4

High Global Food Prices – Crisis or opportunity for smallholder farmers in Ethiopia, Malawi and Tanzania
ACKNOWLEDGEMENTS
The team acknowledges the cooperation of the following: The Ministry of Agriculture and Food
Security through their AEDOs in Lilongwe and Salima; Malawi Lake Basin Programme (Salima
Field Offices); Research Assistants and the Driver.
The team wishes to also acknowledge the financial assistance by NORAGRIC through Professor
Ruth Haug. ARDEP provided supplementary funding to complete the study.
5

High Global Food Prices – Crisis or opportunity for smallholder farmers in Ethiopia, Malawi and Tanzania
EXECUTIVE SUMMARY
The study to assess the impacts of high food prices on poor producers, consumers and traders in
Malawi was conducted between December 2008 and April 2009 in Lilongwe West near
Msundwe market under Lilongwe Agricultural Development Division (LADD) as the surplus
production area and Salima North under Salima Agricultural Development Division (SLADD) as
food deficient area. A total of 111 individual farm households (40 or 36% were female-headed),
20 traders, 64 consumers and 12 key informants were interviewed.
The study revealed that prices of major food security commodities such as maize had doubled
between 2007 and 2008. However, this increase was also concomitant with increase in input
prices. Incidentally, the results also show that productivity of all the crops is very low. For
example, the average maize production in Salima and Lilongwe was 530 kg/ha, which is
equivalent to 11 - 50kg bags. This is equivalent to 16-50 kg bags per household which is far
much less than the required 27- 50kg bags of maize to last up to the next harvest, While there is
this food shortage, it was interesting to note that 17% of the respondents that grew maize reported
to have sold some of the maize grown. The amount sold in Lilongwe was a lot higher (520 kg)
than that of Salima (157 kg). This sale of maize may be attributed to the increase in price of the
commodity which seems to have doubled between 2007 and 2008.
The result of this is that annual incomes are insufficient to enable producers buy enough maize
after they have run out of their own production. Those close to the city are better since as a
coping strategy, they are able to get off-farm employment. ,
From the producer-trader perspective, rising food prices is a business opportunity. But as stated
above, the study has revealed that less than 20% of the producers sell any maize. Therefore, the
impacts of price increases will be negative on the majority of producers as the income will not
change, but the expenditures will. Therefore some policy changes or interventions should be
implemented that will assist this huge group of poor, small-scale farmers either through the
government itself or in partnership with donors.
6

High Global Food Prices – Crisis or opportunity for smallholder farmers in Ethiopia, Malawi and Tanzania
The Malawi Government has controlled price of maize to protect urban consumers. However,
denying farmers of remunerative produce prices is a disincentive to increased investment in
improved technologies such as improved seeds and inorganic fertilizers. What this entails then is
that government should continue adopting doubled pronged food policy: control the sharp
increase in food prices to protect the urban consumers on the one hand and supporting the
producers with various interventions that are aimed abating the cost of production so as to render
food crops (maize in particular) profitable. This is an area where the Norwegian government
could support the Malawi government in supporting the fiscal burden of implementing such
programs.
Other recommendations from the study include the following:
1. In view of the continued tremendous imbalance between input and output prices, coupled
with high levels of poverty in Malawi, it is unlikely that farmers will achieve higher levels
of crop productivity without any support. It is therefore recommended that the
government should continue supporting farmers not necessarily through the Input Subsidy
Program alone but also through other supplementary means such as investment in water
management infrastructure and Integrated Soil Fertility Management technologies which
would improve crop productivity. It is in this area that we believe the Norwegian
Development Agency (Norad) could identify a niche of support.
2. Agricultural Research and Development Programme (ARDEP) funded by the Norwegian
Government has successfully increased the participation in research and outreach, of the
majority poor farmers who now appreciate the value of such programmes, which has
resulted in increased uptake of research knowledge and technologies by 33-66%. The
programme has triggered increased food production in participating farmers by 30-50%
and income levels by more than 20%. There is therefore need for donors such as the
Norwegian Government to expand support to programmes like ARDEP as workable
models that are capable of translating best bet technologies (coupled with concurrent
research) into viable agricultural production. This could be coupled with support to
innovative risk management strategies to sustain the adoption of such best bet
technologies.
7

High Global Food Prices – Crisis or opportunity for smallholder farmers in Ethiopia, Malawi and Tanzania
3. Since ARDEP is an innovative food security programme, there is need for the Norwegian
Government to facilitate the mainstreaming of ARDEP within the Agriculture Sector
Wide Framework (ASWAp) (then ADP) and ensure that issues of high food prices are
fully tackled through increased productivity.
4. Concurrent and timely packaged investment in input distribution systems and water
management infrastructure: ARDEP has shown that timely delivery of inputs such as
fertilizers and seeds/ livestock together with other well packaged best bet technologies
increases productivity by 30-50%, hence Government should endeavour to follow these
guidelines in their input subsidy programmes. This should be combined with investments
in irrigation, water storage and use as well as delivery infrastructure, but not forgetting
improvements in rain fed systems.
5. There is also need to support and protect the most vulnerable groups of people who are
unable to meet high food prices, e.g., malnourished children, HIV and AIDS and
chronically ill affected people and school going children, through increased life-saving
nutritional support and cash transfers by donor commitments since most programmes run
by Government or other partners are currently running at much lower than originally
planned levels in a high food price (HFP) context. It should be noted that 80% of all the
food commodities distributed by some of the programmes are from local purchases from
Malawian farmers/ traders, although the current policy of ADMARC being the sole buyer/
seller is an impediment to local purchases.
6. Government and donors should support conducting high food price (HFP) Urban and
Rural Assessments to identify the vulnerable and needs which will help to map out those
deserving support together with quantitative estimates for maximum intervention impact.
8

High Global Food Prices – Crisis or opportunity for smallholder farmers in Ethiopia, Malawi and Tanzania
1. INTRODUCTION
1.1 BACKGROUND
Globally, food prices have greatly increased particularly since 2007 in response to many factors
including: higher energy and fertilizer prices; increased demand for bio-fuels, especially in the
United States of America (USA) and the European Union (EU); droughts in Australia and other
countries (Phiri, 2008). Reports indicate that wheat prices (US$) have increased by 200 percent,
and overall food prices (US$) have risen by 75 percent since the turn of the century. Adjusting
for exchange rates and domestic inflation reduces the price increases faced by developing
countries – but it is indicated that these increases are still severe for millions of poor consumers.
The purpose of this study was to assess how food prices impact on poor producers and consumers
in Malawi and what role Norway could play in this regard. Similar studies have also been
conducted in Ethiopia and Tanzania in collaboration with the Norwegian Agricultural College in
Norway. Experience has shown that many countries in Africa are trying to keep the food prices
down which benefit poor consumers, but which might not send the right signals to the food
producers of responding to the crisis by producing more food. Different schemes for subsidizing
food will also be straining already limited national budgets of African countries – countries that
have an enormous potential of increasing agricultural production. However, if the production
systems do not change, very few farmers might benefit from the rising food prices. What is not
really known is the possible impact rising food prices might have on African producers. It is
important therefore, to increase our knowledge and understanding of what is happening at
country level in order to be able to design appropriate policies and measures that will contribute
towards improving the situation for both poor producers and consumers in countries where
Norway collaborates in Africa. Malawi is one of the countries which has benefitted from Norway
since 1998.
Based on comments from Noragric, certain observations were made, and, some assumptions were
formulated as follows:
9

High Global Food Prices – Crisis or opportunity for smallholder farmers in Ethiopia, Malawi and Tanzania
• In surplus-producing areas, farming is profitable. Farmers make good income, in some
cases to the extent that they become rich. Some farmers send food to their relatives who
try to subsist as civil servants in the towns (such flow of resources went the opposite
direction only few years ago). This year’s main harvest (November – December) looks
very promising and is likely to exceed last year’s record harvest. What are the production
outlooks this year?
• Farmers use their profit to improve their houses, to build houses in the town and rent them
out, they invest in education of their children, and they invest in productive means and
inputs on the farm. It is common to pay cash for fertilizers.
• This turn of economy towards better times for the farmers is in line with the wishes of the
current government. Food self-sufficiency is one of its main goals as outlined in the
Malawi Growth and Development Strategy (MGDS) and consistent with the Millennium
Development Goals (MDGs)
• The business community also belongs to the “winners”. We see an emerging class of
“nouveau-riche” people.
• The main group of people in the economy that the government is trying to protect with
regards to increasing food prices is that of urban consumers who are largely wage/salary
earners. Increasing food prices erode their purchasing power as the wages and salaries are
rarely revised to enable such households to cope with these economic shocks.
• Farmers who because of marginal ecologies or small size of holdings produce at or below
their subsistence needs are at a clear disadvantage. Poverty in those sections of the
communities is getting worse and we see an increasing out migration of poor people from
those areas. Most of the migrants go to the towns and seek employment as daily labourers.
1.2 RESEARCH QUESTIONS
In confirming or refuting the claims made above, and providing data for more firm conclusions,
the following research questions provided the framework for the study: How do the increased
food (largely maize) prices affect the household economy of the various groups in the study? If
farmers benefit and make more profit, what do they do with the increased income? If traders
benefit, how do they use the increased income? If some groups are unable to take advantage of
10

High Global Food Prices – Crisis or opportunity for smallholder farmers in Ethiopia, Malawi and Tanzania
the situation and only face the problem of higher food prices, how do they cope or how does this
affect them? Are the current farm gate prices profitable relative to the increased prices of inputs
and other costs of production? How does this affect production?
2. OBJECTIVES
The study addressed the following two main objectives:
i) To assess how high food prices impact on both poor men and women producers and poor
consumers in Malawi regarding production, income, food security and poverty.
ii) To assess how Norway could contribute towards reducing the negative impacts of high
food prices on poor rural and urban consumers and at the same time utilizing the
opportunities that high food prices provide for men and women farmers in Malawi.
3. STUDY APPROACH
The study was carried out as part of the 3 case studies conducted in Ethiopia, Tanzania and
Malawi. Therefore, the categories of respondents, the sample size and general approach were the
same for all the three countries to allow for meaningful comparisons.
3.1 STUDY AREA
The study was carried of in two separate sites. These were a maize surplus area during 2007/2008
cropping season and a maize deficit area during the same season. This was aimed at assessing
whether there were any major differences in the impact of increasing food prices between
households in food surplus areas and those from food deficit areas. Lilongwe West near
Msundwe market under Lilongwe Agricultural Development Division (LADD) was the surplus
production area while Salima North under Salima Agriculture Development Division (SLADD)
was selected as the food deficient area. Agriculture Development Divisions (ADDs) (8 of them)
represent agro-geographical zones which form the national agricultural administrative
headquarters. Specifically, in LADD, the study was carried out in Chimambi and Mtete sections
under Chileka Extension Planning Area (EPA). In SLADD the study was carried out in two
11

High Global Food Prices – Crisis or opportunity for smallholder farmers in Ethiopia, Malawi and Tanzania
sections, Matenje Central and Matenje North in Matenje EPA near Khombedza Trading Centre.
Figure 1 is a map showing the study sites.
A
B
Figure 1. Map of Malawi showing study sites A (Msundwe, Lilongwe District) and B (Khombedza, Salima District)
12

High Global Food Prices – Crisis or opportunity for smallholder farmers in Ethiopia, Malawi and Tanzania
3.2 DESIGN OF STUDY TOOLS
The study used quantitative and qualitative tools to collect data. Primary as well as secondary
data sources were used in this study. Hence, a desk study was conducted to gather relevant
information and insights on the food price situation in Malawi. Where necessary secondary data
sources have been referenced and acknowledged throughout the report. For primary data, the
study tools were consistent with those used for other similar studies conducted in Ethiopia and
Tanzania. For Farm Households (HHs) the questionnaire that was developed for Ethiopia was
modified/ reviewed by the research team in Malawi based on local conditions (see attached). In
addition, check lists were developed for traders, consumers and key informants (see attached).
3.3 TRAINING AND RECRUITMENT OF DATA COLLECTORS
A team of five experienced data collectors including one supervisor were recruited and trained at
Bunda College. The team collected data from both LADD and SLADD so that biasness due to
interviewer was minimized.
3.4. SAMPLE SIZE AND DATA COLLECTION
In consistence with other studies, the aim was to interview 50 farm HH per case (including the
poor and better-off, men and women), 10 traders in each case, and 30 consumers and 6 key
informants in each of the two case areas. The total number of households interviewed in the two
study sites was: 57 from Lilongwe and 54 farm HHs from Salima, respectively. Out of a total of
these 111 farm HHs, 40 were female headed representing 36 % of the total sample. Farm HHs
were obtained from randomly selected 2 villages under each section making a total of 4 villages
in each case area. Ten (10) traders were interviewed in each case making a total of 20, while 32
(total of 64) consumers and 6 key informants (total of 12) were interviewed in each of the case
areas.
13

High Global Food Prices – Crisis or opportunity for smallholder farmers in Ethiopia, Malawi and Tanzania
4. RESULTS AND DISCUSSIONS 4.1 HOUSEHOLD DEMOGRAPHIC CHARACTERISTICS
As noted above, 111 individual households were interviewed comprising 57 (51%) from
Lilongwe (Chileka EPA) and 54 (49%) from Salima (Matenje EPA), 59 (53%) of the respondents
were male while 52 (47%) were female. However, the majority of the households among the
respondents were male headed representing 74 (67%) compared to 37 (33%) who were female
headed. It was further noted that a higher percentage of male headed households was reported in
Salima 39 (72%) compared to 35 (61%) for Lilongwe.
The majority 586 (98%) of the household members were present in the household all year. The
results were very similar from the two study sites with an average period of stay of 11.95 months
and 11.92 months for Lilongwe and Salima, respectively. This means that food problems in the
households did not vary across the year because of household size fluctuations as most members
remained in the household all year round.
The average household size was slightly bigger (5.6) for Salima while in Lilongwe the average
household size was reported to be 5.2. The mean household size for the whole sample was 5.4. It
is worth noting that these averages are slightly higher than those reported from the NSO (2008)
Population and Housing Census where they were 4.5 and 4.4 for Lilongwe and Salima,
respectively. Similarly, the mean age for the household head was slightly higher for Salima (44
years) compared to Lilongwe with an average of 42 years and the mean age of household heads
for the whole sample was 43 years. However, the average age for all the household members for
both districts was 21. Since the average household size is quite similar, the total number of
household members was also quite close21. This comprised 302 for Salima and 296 for Lilongwe
making a total of 598 members for the whole sample. Of these 51% were female and 49% male,
interestingly reflecting exactly the national population census for 2008 as reported by the
National Statistics Office (NSO).
21 The slight difference arising mainly from the sample differences
14

High Global Food Prices – Crisis or opportunity for smallholder farmers in Ethiopia, Malawi and Tanzania
The majority of the family members 323 (53%) represented sons/daughters in the household
followed by household heads 111 (19%) and 79 (13%) were spouses or partners. Other members
represented grand children, father/mother (grandparents), other relatives, brother/sister, other
non-relative and son/daughter In-law, in descending order of frequencies.
4.1.1 Education Level
The results from the study for the education attainment of household heads revealed that the
highest percentage of the respondents 33 (30%) had never been to any formal school. However,
32 (29%) had reached Standard 1-5, 30 (27%) had reached Standard 6-8. Only 11 (10%) had
reached as high as Secondary school while only 5 (5%) had attained tertiary education. When
results were analyzed by district (EPA), it was found that the situation in Lilongwe was far much
better than in Salima (see Table 1 below).
Table 1. Education Level of Household Head by District Education level Lilongwe Salima Total
Count Percent Count Percent Count Percent
None 14 26.4 19 35.2 33 29.7
Std 1 - 5 19 33.3 13 24.1 32 28.8
Std 6 - 8 15 26.3 15 27.8 30 27.0
Secondary Forms 7 12.3 4 7.4 11 9.9
Tertiary 2 3.5 3 5.6 5 4.5
Total 57 100.0 54 100.0 111 100.0
The results for the whole population showed that more members 266 (46%) were either in lower
primary or had at least reached that level of education22 and 180 (31%) were either still too
young to be in school or some of them had not been to school among the adults as reported
bove.
were reported to be farmers while only 189
2%) reported that they were working on a farm.
a
The majority of the household heads 106 (96%)
(3
22 Recall the average age for all the household members was 21 years.
15

High Global Food Prices – Crisis or opportunity for smallholder farmers in Ethiopia, Malawi and Tanzania
4.2 ASSET OWNERSHIP
lined from 12.71 to only 6.11. See detailed summary of most important assets
Table 2 below:
Ownership Asset Owned 008
Results on asset ownership and other amenities around the households revealed that the
respondents were relatively poor. For example in 2007, only 11 respondents reported that they
had an Iron roofed house, 4 households reported owning an axe, 1 household reported owning an
animal drawn cart, 1 household had a television set, only 1 respondent with cattle. However, the
most commonly owned asset among the respondents is the hoe where up to 80 respondents
reported owning at least 2.94 hoes. The second in line was the bush knife23 with 50 households
who owned at least 1.22 of them. It was further noted that although there was a slight variation in
the ownership of some assets between 2007 and 2008, the numbers of these assets varied
insignificantly. With regards to chicken ownership, although the number of people who owned
some chickens increased from 38 in 2007 to 66 in 2008, the average number owned per
household had dec
in
Table 2. Asset2007 2
Number of
Households Owned* Households Owned
(n)
Number Number of
(n)
Number
Hoe 80 3 106 3.25
Grass Thatched House 51 1 59 1.24
with mud walls
Phanga (Bush knife) 50 1 78 1.24
Radio 43 1 60 1.22
Sickle 41 1 63 1.16
Chickens 38 13 66 6.11
Bicycle 34 1 45 1.16
23 Phanga
16

High Global Food Prices – Crisis or opportunity for smallholder farmers in Ethiopia, Malawi and Tanzania
Grass Thatched and
all
23 1 36 1.22
Brick w
Goats 22 4 39 4.21
Bed 12 1 16 1.62
Mobile Phone 11 1 14 1.21
* All figures have been rounded off
ng out an average of 2.33 goats and an average of 4.20 hoes given out
r sold by 5 households.
f the
spondents used all the land that they owned and not put to fallow or used as pasture land.
.3 CROPS GROWN AND FOOD SECURITY
It could be deduced from the results above that the average ownership of chickens declined
mainly because of selling or giving out during 2008. It was reported by 13 households that they
had given out an average of 3.38 chickens during 2008 followed by goats reported by 9
households selling or givi
o
The average land holding size among the respondents was 2.1 acres (≈1.0 ha). However, the
figure was slightly higher for Salima (2.27 acres) compared to 2.06 acres for Lilongwe. The
results from the study also revealed that some households rented in some land for cultivation but
with a very small number of households reported having rented out some land. For example, 14
(25%) of the respondents in Lilongwe and 8 (15%) from Salima reported to have rented in some
land in 2006/07. The average of rented in land for Lilongwe was 1.3 acres and 1.06 acres for
Salima. However, only two households and one household in Lilongwe and Salima, respectively
reported to have rented out some land in 2006/07. Similarly, borrowing and use of land under
share cropping were rare practices in the two districts. Furthermore, the majority o
re
4
The study revealed that the majority 109 (98%) of the respondents grew maize followed by
groundnuts 74 (67%), green maize 40 (36%), and 10 (9%) growing vegetables among the main
crops. Field crops were the most commonly grown by the respondents in both districts. It was
noted also that much of the land (71%) of the average land owned by the respondents was put to
maize. These statistics correspond to the national average where about 70 percent (Sopo et al,
17

High Global Food Prices – Crisis or opportunity for smallholder farmers in Ethiopia, Malawi and Tanzania
2009) of the total arable land in Malawi is put to maize each year. For the other crops such as
common beans, cassava, sweet potato etc., although the hectarage allocated to them was
relatively high, but these crops were grown by very few farmers among the respondents. See
ppendixes Table A1.
maize
roduced from the secondary crop was 2 – 50kg bags and 1.4 – 50kg bags of green maize.
to last up to the
ext harvest. The results suggest a serious maize shortage among the households.
A
The results also show that productivity of all the crops is very low. For example, dividing the
average hectarage put to maize into the average maize production gives a per hectare
(productivity) production of 529.88 kg. This is equivalent to 10.6 - 50kg bags. However, the
average production per household is equivalent to 16.3 – 50kg bags of maize. It is noted that the
production levels were slightly better for Salima (16.7 bags) than Lilongwe (16.0 bags). See
Appendixes Tables A2 and A3. The main secondary crops reported were maize and green maize.
And this was reported by only 11(10%) of the respondents. The average quantity of
p
If we divide the 16.7 and 16.0 - 50 kg bags of maize for Salima and Lilongwe, respectively by
their respective average household size, it is found that respondents in both study sites did not
produce enough maize to last them from one harvest to the next. The average household sizes for
Salima and Lilongwe are 4.4 and 4.5, respectively. And according to the Ministry of Agriculture,
an individual requires about 6 – 50kg bags of maize per year (279 kg each). What this means then
is that for a household to be food secure in Salima, it has to produce at least 26.4 bags. And on
the other hand, an average household in Lilongwe needs at least 27 bags of maize
n
Surprisingly, only 19 (17.0%)24 of the respondents that grew maize reported to have sold some of
the maize grown. The amount sold on average per respondent was 386 kg. However, the amount
sold from Lilongwe was a lot higher (520kg) than that from Salima (157kg). See details in the
Appendices A4. Similarly a relatively small proportion, 14 (5%) of the responses indicated that
respondents intercropped some of their crops while the rest said no – maize being the main crop.
Of these cases, 86% were reported in Lilongwe and 14% reported in Salima. It could be pointed
24 Maize sales are of main concern because it is a staple
18

High Global Food Prices – Crisis or opportunity for smallholder farmers in Ethiopia, Malawi and Tanzania
out that this corresponds to the relative scarcity of land in the two districts. It has been reported
earlier that renting in of land was more common in Lilongwe. This is a reflection of relatively
tobacco
(14%); soybeans 2 (14%); pumpkins 2 (14%); ground nuts 1 (7%) and Bambara nuts 1 (7%).
as not common among the respondents.
eed from the producer perspective, rising food (maize) prices were an opportunity to
arn higher income which unfortunately negatively affects food security of market dependent
households.
smaller land holdings in this district compared to Salima. The main crops intercropped were the
following reported in descending order of the frequency of the responses:
Beans 3 (21%) of the responses indicating some intercropping; Sweet potatoes 3 (21%);
2
These results show that indeed, intercropping w
4.3.1 Markets and Income from Crop Sales
As it has already been pointed out above, only a small percentage of the respondents reported
selling some crops. Results from the study revealed that vendors were the main market for all the
crops sold among the respondents. Surprisingly, only two responses indicated the Agricultural
Development and Marketing Corporation (ADMARC) as one of their market outlets for crop
produce. Although farmers sold crop produce at different times during the year, much of the sales
took place between the months of May and August. This largely explains why the lowest prices
for most agricultural prices are lowest during these months as shown in Figure 1 below. It was
noted that the highest average income (MK17, 640) was obtained from the sales of maize
followed by rice with MK8,933.00. A recent Finscope study (2009) reported that maize was the
main source of income for the majority of the people in Malawi. When results were analyzed by
district, it was noted that a significantly higher level of income from maize was reported in
Lilongwe (MK24,833) compared to only MK6850 from Salima. This is not surprising because
respondents in Lilongwe also sold significantly a higher amount of the maize produced. Higher
incomes for all the crops with the exception of sweet potato and rice were reported in Lilongwe
compared to Salima. See Appendices Table A5 for the details. The highest price obtained was
reported for maize by 41 percent of the respondents and 15 percent for groundnuts. With regards
to the crop earning the highest price in the area, maize was given by 67 percent of the
respondents and 74 of the respondents reported that these were higher than in 2007. These results
show that ind
e
19

High Global Food Prices – Crisis or opportunity for smallholder farmers in Ethiopia, Malawi and Tanzania
In fact, the results on rising maize price are corroborated by those that have been recently
reported elsewhere, that food prices, especially maize have been rising both in real and nominal
terms (Figure 2).
Nominal Annual Average Maize Price in Malawi (1988-2008) Maize Real Values in
Malawi (1988-2007)
Nominal Annual Average Maize Grain Prices (1988-2007)
0.00
5.00
10.00
15.00
20.00
25.00
30.00
35.00
The other important consideration in prices is the seasonal nature at which they change (Figure 3)
and which affect food security in different months.
60.00
70.00
80.00
90.00
100.00
110.00
120.00
Jan Feb Mar Apr May Jun Jul Aug Sep Oct Nov Dec
Months
Inde
x
North Centre SouthMalawi
Figure 3. Agricultural Price Seasonality in Malawi (Source: Sopo et al (2009): Spatial Maize Market Integration in Malawi- Unpublished paper)
The main secondary crops sold were: ground nuts, soy beans and vegetables. In all the cases
again, the highest incomes were reported in Lilongwe compared to Salima.
The increasing food prices have also created lucrative business opportunities mainly for vendors
(middlemen). But in some cases, these middlemen also take advantage of the situation to exploit
19 19 19 19 19 19 19 19 19 19 19 19 20 2 20 20 20 20 20 2088 89 90 91 92 93 94 95 96 97 98 99 00 00
1 02 03 04 05 06 07
Year
Pric
e (M
K)
Maize Prices in Real Values (US)-in malawi (1998-2008)
0.00
0.05
0.10
0.15
0.20
0.25
0.30
0.35
1998
1999
2000
2001
2002
2003
2004
2005
2006
2007
2008
Yea
Pric
e in
MK
/US$
r
Figure 2. Nominal and Real Annual Average Maize Price in Malawi (see Banda et al 2008)
20

High Global Food Prices – Crisis or opportunity for smallholder farmers in Ethiopia, Malawi and Tanzania
producers through dubious means that ‘meant’ to reduce food insecurity during the lean months
among these producer-consumer households. See the full details in the case study below.
Case Study 1:
In Salima, food crisis is really a hot issue. During the lean periods (December – March) when
food prices are high, hence unaffordable for the majority of the poor households, vendors take
advantage of the situation. It was reported through key informant interviews that some vendors
visit those households that are most affected by food shortage and give them some money - about
Mk200 per household. Such households that receive this assistance when they have run out of
their own production are asked to repay a 50kg bag of maize once they have harvested. And yet,
even at the time of harvest a 50 kg maize bag would not be sold for MK200! In 2008, the lowest
maize price at harvest was MK25.00 per kg which means the bag would go for MK1,250. In this
case the vendor is openly stealing MK1,050.00 from the poor farmer. The more the money the
farmers collect from these vendors, the more the maize they have to give away, and hence the
more they accept to be exploited.
4.3.2 Volatile Prices and Profitability of Maize
A study by Phiri (2008) indicated that the maize price trends for 2008 in all markets in the
country had deviated from the normal trend of Figure 2 above. It was observed in his study that in
the majority of markets across the country, maize prices had continued to increase since
November 2007 with a short drop around April- May. Comparing maize prices for 2008 with
those that prevailed during the same months in 2007, it was noted that for all the months under
consideration, prices 2008 were more than double what they were in 2007.
21

High Global Food Prices – Crisis or opportunity for smallholder farmers in Ethiopia, Malawi and Tanzania
Maize prices October 2007 and 2008
0
10
20
30
40
50
60
Janu
ary
Februa
ry
March
April
MayJu
ne July
AugSep
tOct
20082007
Figure 4. Relative Monthly Maize Prices for 2007 and 2008 Source: Food and Nutrition Security Technical Secretariat. Ministry of Agriculture
This author gave a number of reasons for this situation. The early harvest of maize by some
farmers at a time when the majority of them were going through the hungry period created supply
with a relatively high demand. Hence the very lucrative prices at this time. Secondly, the press
and politicians immediately started questioning the market behaviour – mainly as indicating a
maize shortage. This induced private traders to engage in speculative maize purchases expecting
to hoard the maize and sell at a far much higher price later in the consumption season. As a result,
competitive pressure grew in the country mainly between private traders and ADMARC fueling a
continuous upward trend of maize prices in the country. Other crop produce also benefited from
this trend. Fourthly, it had also been reported that the competition was created by the fact that
private traders made good business in 2007 out selling maize and other crop produce to
Zimbabwe. But the contracts in 2007 were awarded through NFRA. Since problems of food
shortage were still continuing in Zimbabwe, some of the traders negotiated contracts with
Zimbabwe firms on their own. The ‘scramble’ for crop produce on the market was partly to
satisfy these contracts. Lastly, it had been pointed out that the fact that ADMARC was more
active in buying maize targeting to stock 200,000 MT signaled to many a shortage of the staple
although official crop estimates were not yet released. This contributed to the competitive
pressure in maize purchases across the country. In most markets, although the Presidential ban
has reduced private trader involvement in maize marketing, spot checks in a number of markets
revealed that small vendors were still selling maize at around MK60/kg while ADMARC was to
22

High Global Food Prices – Crisis or opportunity for smallholder farmers in Ethiopia, Malawi and Tanzania
sell at MK52/kg but have not yet opened their depots to the public. In a way, a black market had
developed which expected to push maize and other food prices even further, all other things
being equal. Official statistics for October collected through the Ministry of Agriculture and Food
Security also showed that maize prices across the country were still higher than the ADMARC
pegged MK52/kg with the national average in these markets at MK54.24/kg and Ntakataka had
the highest at MK70/kg and the lowest in Misuku Hills in Chitipa where maize was at MK36/kg
followed by Mitundu (Lilongwe south) and Thete (Dedza west) where maize was selling at
MK46/kg in October, respectively. The general trend however was that for all the markets across
the country, maize grain prices had doubled from what they were at the same time in 2007. The
key question here is do increasing food prices lead to an improved profitability of the crop mainly
cognizant of the fact that input prices are also increasing?
The price changes for four major fertilizers between 2007/08 and January 2008/09 cropping
seasons are as shown in Table 3 below25. Converting26 the prices into Malawi Kwacha per 50kg
bag it is found that all prices had more than doubled between the two seasons. It is noted that the
annual incomes of most households including farmers are not enough to assist them to buy
enough maize after they have run out of their own production. This means that the majority of
them would not even afford to buy a bag of fertilizer at full cost on their own. The input –to-
output price ratios which have been calculated using the MK54 per kg national average price for
2008, shown in Table 4 below reveal that farmers had better returns out of selling their maize in
2008 using the fertilizer at 2007/08 fertilizer cost prices. This is due to the fact that for all the
fertilizer types, a farmer required to sell less than two kilograms of maize in order to buy a
kilogram of inorganic fertilizer or to repay for the costs of a kilogram of fertilizer that was used
in growing the maize. However, the prices of fertilizer for 2008/09, keeping the maize prices at
MK54 per kg show that farmers would face more hardships in procuring fertilizers from maize
grain sales produced in 2007/2008. The input-to-output ratios worsened as shown in the Table.
This means that unless farmers have access to the targeted fertilizer subsidy, the majority of them
would be unable to purchase any fertilizers at these prices as reflected by the ratios. What this
25 These are prices delivered Lilongwe without factoring in transport costs to various destinations
26 Exchange rate at MK140 per US$ for both seasons since there has not been major change
23

High Global Food Prices – Crisis or opportunity for smallholder farmers in Ethiopia, Malawi and Tanzania
indirectly means is that if the government wants to continue controlling maize prices as a way of
protecting urban consumers, farmers/producers should also be supported through effective input
subsidies failing which makes fertilizer use in maize not only unprofitable, but also out of reach
of the majority of the poor farmers. All other things being equal, controlling maize prices would
discourage farmers from using inorganic fertilizers leading to lower yield and subsequently food
insecurity. Hence such a policy is self-defeating!
Table 3 Fertilizer Price Changes (2005/06 – 2008/09) (US$/MT) Fertilizer Type 2005/06 2006/07 2007/08 2008/09 Price Change
(2007/08-
2008/09
NPK 23-21-0 + 4s 430
460 650
(MK4550)
1420
(MK9940)
118%
Urea 380
430 550
(MK3850)
1130
(MK7910)
105%
D Compound 440
440 670
(MK4690)
1450
(MK10150)
116%
CAN 370
370 450
(MK3150)
900
(MK6300)
100%
Source: Fertilizer Association of Malawi. Paper Presented at the Capital Hotel (August 2008).
Note: Figures in brackets are in Malawi Kwacha per 50kg bag
According to the Fertilizer Association of Malawi (2008), the tremendous increase in fertilizer
prices this year is part of a global trend due to three main factors. These are as follows:
• Increased global fertilizer usage thereby increasing demand – USA, China, India
• Increased demand for maize as a raw material for biofuels
• Increase in price of crude oil – from US$90 to US$130 a barrel, thereby increasing cost
of transportation
24

High Global Food Prices – Crisis or opportunity for smallholder farmers in Ethiopia, Malawi and Tanzania
Table 4 Input-Output Price Ratios Fertilizer Unit Prices
(MK/kg)
Prices Ratios
Type of Fertilizer 2007/08 2008/09 2007/08 2008/2009
NPK 23-21-0 + 4s 91 199 1.7 3.7
Urea 77 158 1.4 2.9
D Compound 94 203 1.7 3.8
CAN 63 126 1.2 2.3
4.4 LIVESTOCK OWNERSHIP AND SALES Livestock ownership among households is very low. Chickens are the most commonly found
livestock type among households in both study sites. However, the average number reared per
household is also very low. For example, as it can be noted in Table 3 below, the average number
of chickens kept per household in 2007 was 13 and only 10 were born per household in 2008.
Very few purchases or deaths occurred between 2007 and 2008.
The second most commonly found type of livestock as manifested through the frequencies was
Does. 21 households, representing about 19 percent of the respondents kept Does. However, the
average number of animals per household was only 3. The rest of the other types of livestock
kept and the variation can be noted in the Table 5 below. Table 5 Livestock Ownership and Variation Type of
Livestock
Ownership in
2007
Born in 2008 Bought in
2008
Died in 2008 Sold in 2008
N Mean n Mean n Mean n Mean n Mean
Milking
cow
1 15 1 5 1 2
Other cow 1 1 1 1
Oxen 1 2
Heifer 1 2
25

High Global Food Prices – Crisis or opportunity for smallholder farmers in Ethiopia, Malawi and Tanzania
Does 21 3 14 2 5 1 8 2 5 1
Buck 11 2 11 2 2 1 7 2
Kid 5 3 7 3 1 1
Chicken 31 13 32 10 13 3 41 1 12 3
Pig 1 1 1 5
Duck 4 11 4 7 1 2 3 3 4 6
Guinea
Fowl
2 34 2 15 2 34 2 4
It should be noted that little variation in the numbers of livestock arising from sales. However, as
could be deduced from the relatively higher numbers, chickens were reported to be the mostly
sold livestock type among the respondents. Other types of livestock that were sold in 2008 were
cows, Does, and Ducks. The sales largely took place at the homestead followed by the local
market. The highest mean average sale price was reported for cows at MK38,750 per cow and the
lowest was that of chickens at MK468 per chicken. The highest total income realized was from
cows although only two animals were reported to have been sold (MK60,000). As can be noted
from the average price and number of animals sold, the lowest Gross Income from livestock sales
was obtained from chickens (MK1,381). Sixty four (64) percent of those who had sold some
livestock reported that the income was meant to assist in purchasing food and 20 percent
indicated the purchase of fertilizer and the remaining percentages reported other household needs.
What these data are showing is that due to the small numbers of livestock sold in both study sites,
there was very little reliance on livestock sales to cope with food shortages arising from high
prices on the market. However, the results for chicken sales show that 10 (91%) of the sales took
place between October and March and 5 (50%) sold in March and February the most lean months
with regards to food security in Malawi. In relative terms however, except for the chickens, more
livestock were sold in Lilongwe than in Salima.
26

High Global Food Prices – Crisis or opportunity for smallholder farmers in Ethiopia, Malawi and Tanzania
Table 6 Unit Prices by Livestock Type Sold (Malawi Kwacha)27 Livestock
Type
Mean n Std
Deviation
Minimum Maximum
Cow 38,750.00 2 5303.3008 35,000 42,500.00
Does 3,150.00 6 1383.8352 1,900.00 5,000.00
Ducks 3,375.00 8 744.0238 2,000.00 4,500.00
Chicken 468.18 11 127.0289 250.00 700.00
Total 4,761.11 27 9972.8316 250.00 42,500.00
4.5 SOURCE OF HOUSEHOLD INCOME
The results from the study showed that respondents had several other sources of income besides
crop and livestock sales. The highest among these was hiring out (ganyu) of labour which
comprised 33 percent of the total responses. Food for work came second with 13 percent of the
responses. In a way, it could be concluded that 46 percent of the households were involved in
some for of hiring out of labour since Food for Work is also ganyu were workers are paid in kind
in form of an agreed amount of food. Selling of crops was reported by only 11 percent of the
respondents.
It was noted that despite the fact that the majority of the respondents were engaged in hiring out
their labour, the highest amount of average income was obtained from employment
(MK68,975.00 while that of hiring out labour is MK5,371.73 only). Employment was followed
by other business types in terms of income levels where the average was MK50,140.00. The
lowest among all sources of income was migrant income (MK200). When the data were analyzed
by study site, it was found that most employment was reported in Lilongwe which is not
surprising because of the closeness of the study site to the City. On the other hand, sales of crops
were a lot higher in Salima while the relative importance of ganyu in the two sites was quite
similar. See Appendix A6. It can be concluded therefore that despite the relatively low income
27 Exchange rate: MK141 = US$1.00
27

High Global Food Prices – Crisis or opportunity for smallholder farmers in Ethiopia, Malawi and Tanzania
from ganyu, a large number of households rely on it as a coping strategy in times of food
shortages.
The head of the household contributed or earned 78 percent of all incomes earned in the
household, followed by spouse with 12 percent, son 5 percent, whole family 3 percent and both
household head and spouse in the last position with only 2 percent. While all the income from
migration, crafts, hiring out oxen and other sources was contributed to the family by the
household head, the spouse contributed to most of the other sources of income.
Table 7 Sources of Income Income Source Frequency Percent Average Income
n Mean (MK)
Hire out labour 57 33.3 52 5,371.73
Food for work 22 12.9 7 5.085.00
Crop sales 19 11.0 18 24,081.11
Other business 15 8.8 15 50,140.00
Sale of grass 13 7.6 12 1,653.33
Gift/Assistance 11 6.4 7 3,107.14
Firewood 11 6.4 11 8,372.72
Employment 8 4.7 8 68,975.00
Handcrafts 6 3.5 6 4,833.33
Remittances 4 2.3 3 1,666.67
Migrant Income 1 0.6 1 200.00
Hire out Oxen 1 0.8 1 5,000.00
Others 3 1.8 3 2,251.67
Multiple responses
28

High Global Food Prices – Crisis or opportunity for smallholder farmers in Ethiopia, Malawi and Tanzania
4.6 HOUSEHOLD INCOME EXPENDITURES
The results from the analysis revealed that seed and inorganic fertilizer were the main items on
which household incomes were used. In aggregate terms, both of these items comprised 14
percent of the responses. Clothes and shoes came second with 10 percent of the responses while
relish only gave 9 percent of the responses and maize grain comprised only 7 percent of the
responses. A recent similar study by Phiri (2008) showed that households tended to purchase
luxury products when they still had food (maize) stocks from own production but the proportion
of food purchases tended to increase as they run out of the food stocks. Hence, the fact that maize
grain was only reported by 7 percent of the cases does not mean that this is not an important
expenditure item in the household, but overall, within any consumption year, households spend
much of their incomes on other items other than food. This also demonstrates that own
production is the main source of food for the majority of the households, only turning to the
market when they have run out of their own production.
It is noted that households purchase on average between 1 and 2 – 50kg bags of fertilizer, about
10 kg (1 pack) of maize seed, and about 2 bags of maize grain. It can also be deduced from the
results in Table 8 below that more households purchase fertilizer and not maize seed. This means
that if not given improved seed through other programmes, most households plant local or
recycled maize seed. This would obviously lead to relatively lower yields that would be obtained
if fertilizers were applied to improved maize seed.
29

High Global Food Prices – Crisis or opportunity for smallholder farmers in Ethiopia, Malawi and Tanzania
Table 8 Quantity Purchased in kilograms y p g
9.1053 38 5.99454 2.00 20.0012.1429 7 8.02971 3.00 24.001.0000 1 . 1.00 1.00
26.0000 2 33.94113 2.00 50.00104.5455 11 90.70431 50.00 350.0070.3276 58 71.24516 4.00 400.0050.6250 8 25.41618 5.00 100.0056.1818 33 24.75184 4.00 150.00
112.5000 26 64.67225 10.00 250.0010.0000 1 . 10.00 10.009.5000 4 10.37625 3.00 25.00
15.0000 1 . 15.00 15.0057.6842 190 62.50084 1.00 400.00
Item/Commondity Mean N Std. Deviation Minimum MaximumMaize seedG/nuts seedCommon bean seedSoyabeans seedDAP fertilizerUrea fertilizerCAN fertilizer23:21:0 fertilizerMaize food itemCassava food itemRice food itemRelish food itemTotal
An examination of the prices per unit of item purchased show that the fertilizer prices reported
were not those at commercial level. The subsidy program and the fact agro-dealers also sell
fertilizers in smaller quantities may have affected the reporting of these prices. The subsidized
fertilizer price for 2007/08 was MK800 but the commercial prices were above MK8,000. On the
other hand, the other prices reported are closer to those reported through the weekly surveys that
are done in about 70 markets across the country. See Appendix Table A7 for the details.
The results (Table 9 below) on the amount of cash spent by item are slightly different from those
reported above. Nevertheless, it is still noted that clothing and shoes, food and relish, fertilizers,
maize grain are all among the most important expenditure items in the households.
30

High Global Food Prices – Crisis or opportunity for smallholder farmers in Ethiopia, Malawi and Tanzania
Table 9 Cash Expenditure by Item or Commodity Cash expenditure
1680.4186 43 1497.14774 120.00 7000.001826.4706 17 3070.98913 100.00 13500.00
150.0000 2 70.71068 100.00 200.00900.0000 1 . 900.00 900.00
6189.2857 14 10834.88274 400.00 42000.004616.4063 64 8506.25379 250.00 48000.001628.5714 7 2148.42135 800.00 6500.002933.3333 36 4458.93966 400.00 19000.001827.5000 4 2788.25364 250.00 6000.00
497.1429 7 230.70286 250.00 900.00880.0000 5 540.37024 500.00 1800.00
9613.3333 15 6802.19152 1200.00 25000.005693.3333 6 9202.65541 250.00 24000.004918.0000 50 4744.17753 200.00 29600.00
923.5294 17 856.97828 100.00 3000.001688.6667 15 1428.07996 130.00 5000.00
10191.04 67 24851.84422 200.00 182000.006700.4937 79 8836.56486 50.00 50000.003230.8333 48 4695.44996 100.00 24000.002329.5870 46 2921.14457 100.00 12000.005820.8696 23 11547.75614 80.00 45000.004930.3226 31 5449.50180 200.00 20000.004000.0000 2 1414.21356 3000.00 5000.006681.0345 29 10054.23164 200.00 35000.003392.8571 14 3226.44465 300.00 10000.004819.9969 642 10374.66768 50.00 182000.00
Item/CommondityMaize seedG/nuts seedCommon bean seedSoyabeans seedDAP fertilizerUrea fertilizerCAN fertilizer23:21:0 fertilizerChemicalsTools/EquipmentHired in oxenHired in labourAnimal boughtMaize food itemCassava food itemRice food itemRelish food itemClothing & shoesHousehold goodsHealth/medicineSchool feesTravel expenseland/income taxCeremoniesOther Inc' beerTotal
Mean N Std. Deviation Minimum Maximum
4.6.1 Use of Gained Income from Higher Crop Prices
Much of the gains from higher crop (food) prices were used to purchase household needs as
reported by 39 percent of the respondents and purchasing of fertilizer (22%). And 44 percent of
the respondents reported that they assisted a friend or relative residing in town. However, the
main means of support was giving food (80%) and giving out cash was only reported by 36
percent28 of them. The average amount of maize (food) given out was about 65 kg which is just
above 1 – 50 kg bag and maize was the main food item given out. The average amount of money
given out was MK9,012 for Lilongwe and MK3,171 for Salima.
28 Multiple responses
31

High Global Food Prices – Crisis or opportunity for smallholder farmers in Ethiopia, Malawi and Tanzania
It should be noted that up to 41 percent of the respondents reported that they had changed their
cropping pattern in terms of crop area, fertilizer and seed use resulting from higher crop prices.
Shortage of land was one of the main constraints limiting expanded crop area. Maize and ground
nuts were the main crops that were reported to have benefited from increased land allocation and
more fertilizer application (maize only).
Seventy one (71 percent) of the respondents reported that they believed that crop price rise was
going to continue while 29 percent said no. And it was noted that this influenced the general
plans to increase land allocation to maize.
Only 48 percent of the respondents reported that prices for livestock and products also increased
while the rest said no. The common trend in Malawi is that livestock prices fluctuate in the
opposite direction of food prices. This is so because livestock, particularly small stocks such as
goats or poultry are sold during food shortages to earn some income which is then used to
purchase maize. However, 95 percent of the respondents reported that prices for other consumer
goods and farm implements had also increased at the same time.
4.7 GENERAL IMPRESSIONS ON FOOD PRICE INCREASE
From the results in Table 10 below, it can be noted that high food prices have had serious
negative impact on the households. This mainly emanates for high poverty levels among the
majority of them. Although some of them gained by selling their produce at high prices, but as it
has already been reported, not all of them were engaged in selling their maize due to high prices.
Table 10 General Impressions Impression Rank Count Percent
Not manage necessities 1 49 40.5
Poverty, can’t cope 2 26 21.5
Got little income29 3 21 17.4
29 Part of poverty
32

High Global Food Prices – Crisis or opportunity for smallholder farmers in Ethiopia, Malawi and Tanzania
Inadequate food in year 4 7 5.8
Good poor harvest 5 4 3.3
Reduce fertilizer price 6 3 2.5
4.8 KEY INFORMANT AND CONSUMER IMPRESSIONS
The qualitative assessment in the field through key informant interviews and consultations with
consumers revealed that indeed, increasing food prices were having serious negative effects on
the poor. Besides the usually negative impact such as reduced number of meals per day, increased
malnutrition among the vulnerable people in the households (children, the elderly and the
chronically ill), it was reported marriage stability was usually a problem particularly among those
under the matrilineal (chikamwini) marriage system. See case study below
Case Study 2:
In Salima, where the commonest marriage system is Chikamwini it was reported that a wife in
one of the villages in the study site was sent packing because he was failing to find adequate food
for the family. Under this system, the husband goes to settle in the wife’s village and thus called
Mkamwini. One gentleman struggled to find money to buy food for the family. Despite the fact
that he managed to raise some money on orders from the wife, he was told to pack because the
money was too little to take the family through the hungry months.
As noted earlier, a commonest means of getting extra income for most households beside crop
sales was hiring out their labour which it has been noted is not necessarily the most lucrative
means of generating extra income.
In both Lilongwe and Salima, it was noted that both food and input prices had escalated during
the past 2-3 years. For Lilongwe for example, from 2005/06 growing season to 2007/08, prices
for commodities like maize, livestock and livestock products had all registered tremendous price
increases. For example, on average, in 2005/06 maize per 20kg was going at around Mk450 and
by end of 2008 that same quantity of maize had more than doubled to Mk1000. This represents
more than 100% increase in price. Beef was at Mk250/kg in 2005 and by end of 2007/08 that
same 1kg of beef was at Mk500/kg representing a 100% price increase within a three year period.
33

High Global Food Prices – Crisis or opportunity for smallholder farmers in Ethiopia, Malawi and Tanzania
On the other hand, in Salima, maize prices were already relatively higher than those in Lilongwe.
This was mainly due to the fact that the study area usually runs food shortages. For example,
while in 2005 in Lilongwe the 20kg pail was selling at MK450, in Salima, this was already at
MK1000. The same pail was selling at MK2000 in December 2008.
While this is a tremendous business opportunity for the maize producers as well as the vendors,
the rapid expansion of maize petty trading was hampered by the low purchasing power of most
consumers. Instead of buying large quantities, they resorted to only buying small quantities,
usually only for the day which affected the turn over making most vendors holding large volumes
of stocks for a long time.
A number of reasons were given at various levels for the price trends.
Firstly the high input costs have negatively affected the majority of farmers’ access to improved
inputs such as seed and inorganic fertilizer. This has resulted in low productivity explaining the
price increase since household food requirements are not met in most households.
Secondly, as a result of the general low production and increasing prices, many vendors take
maize selling as a lucrative business resulting in competitive buying at the farm-level but also
seeking higher margins as they resell to the next level.
Thirdly, the increase in the cost of transportation arising from fuel prices has had a direct effect
on the cost of trading. High fuel prices make the price of different commodities to go up. For
example, a 100% hike in the price of livestock products like beef is attributable to high cost of
transportation from Mchinji (the source of animals) to Msundwe and Namitete markets (where
the butchers are) which are around 120km and 100km respectively to reach Mchinji.
The impact of all these factors is high food prices leading to reduced purchasing power and hence
consumption levels. It was also reported that during such lean months when most households
cannot afford adequate consumption, quality is no longer of priority as feeling the stomach with
34

High Global Food Prices – Crisis or opportunity for smallholder farmers in Ethiopia, Malawi and Tanzania
whatever food stuff is the choice for many. This automatically results in stomach related diseases
and malnutrition.
4.9 IMPRESSIONS OF TRADERS
The types of food commodities sold in Salima by the traders are almost the same with those sold
in Lilongwe. Commonly sold food commodities at these two areas comprise maize, maize flour,
beans, tomatoes, cabbage heads, meat and eggs and other food items are mostly bought from
farm households that are within the community. The only difference is the unit price of these
food prices. For example, the unit price of maize in the base year i.e. in 2005 was registered to be
higher in Salima than in Lilongwe. Maize per 20kgs was recorded to be at Mk1000 while in
Lilongwe that same 20kg was sold at Mk450. However, the unit price of livestock product like
meat in Salima was recorded slightly lower than those in Lilongwe in 2005. In 2005, Msundwe
market in Lilongwe was offering meat at Mk250 while Khombedza market in Salima was
offering at Mk200 on average. Thus livestock product price in Salima currently at Mk350/kg is
lower than what a unit price is bearing in Lilongwe which is going at Mk500/kg. Nevertheless,
the percentage increase in livestock products in both case areas have had a more than 100%
increase from 2005 to 2008.
Another observation is on the price of maize. The price of maize in Salima from the base year is
higher which escalated up to Mk2000 during the lean periods. This proves the inadequate
production of maize in Salima North. This, however, indicates that in both case areas the prices
for food items have increased.
Just like in Lilongwe, during lean periods when prices are high household is negatively affected
and other aspects of basic needs are compromised as well.
The benefits and profits realized by traders in Salima are used just in same way as in Lilongwe
thus some reinvest in the business, building houses, payment of school fees and meeting other
basic needs that are compromised during times when prices of food items have gone up.
35

High Global Food Prices – Crisis or opportunity for smallholder farmers in Ethiopia, Malawi and Tanzania
The general comment given by most traders regarding the food prices was that the living
standards of many in the case areas goes down and the inflow of cash into the business is
disturbed as most of customers buy in small quantities due to low purchasing power.
4.10 THE INCREASE IN FERTILIZER PRICES THREATENS PRODUCTION
Through the Input Subsidy Programme (ISP), Malawi has supported its production, and somehow
maintained maize surpluses consecutively for the last three years. However, the high increase in
fertilizer prices greatly threatens the size of subsidy programme, and therefore there is likelihood
that under such circumstances, surpluses or profits by producers may not be realized. As can be
seen in Figure 4 and Tables 3 and 4, there have been sharp increases in fertilizer prices on the
international commodity market. Because Malawi imports all of its fertilizers, these price
increases have already been transmitted on the domestic market, with prices of some types of
fertilizers nearly doubling in recent months. If such prices continue while produce prices
particularly those of maize, farmers will find no economic incentive in investing in fertilizers.
This is likely to result in reduced production of maize, unless Government decides to maintain
the same level of subsidy, but this will obviously entail a higher fiscal cost. However, with the
reduction in prices of fertilizers this year by 35-45%, the production may not be reduced to the
same extent if the prices were maintained.
0
200
400
600
800
Jan-Dec,2006
Jan-Dec,2007
Jan-Apr,2008
Jan-Mar,2007
Apr-Jun,2007
Jul-Sep,2007
Oct-Dec,2007
Jan-Mar,2008
Feb,2008
Mar,2008
Apr,2008
pric
e in
dex
(200
0=10
0)
food fertilizer
Figure 5 Fertilizer and Food Price Indices (2000 = 100)
36

High Global Food Prices – Crisis or opportunity for smallholder farmers in Ethiopia, Malawi and Tanzania
Source: MOAFS (2008) adopted from World Bank Development Prospects: Commodity Price Data
5. CONCLUDING REMARKS AND RECOMMENDATIONS
This study was carried out with the main objective of assessing the impact that rising food prices
are having on producer and consumer households in Malawi. The study was carried out in
Chileka EPA in Lilongwe district and Matenje EPA in Salima. Results from both study sites have
clearly revealed that food prices have tremendously increased during the recent past.
The key question that was asked for the study was whether the food price increase was a crisis or
an opportunity. This question is answered with mixed feelings. Firstly, rising food prices are
indeed a crisis. From the consumer perspective increasing food prices erode the purchasing
power of households. What this means is that continued increase of prices leads to household
food insecurity. Additionally, producer households also at some point in the consumption year
become dependent on the market for food. Hence, the increase in food prices is also of major
concern to them as well. Most particularly, due to poverty rural producer households who have
run out of their own maize are most vulnerable to food insecurity arising from increasing food
prices. The study has shown that the impacts of the increasing price situation are mainly on the
vulnerable groups in Malawi and these impacts include: reduced accessibility to inputs among
poor famers which also have a negative impact on food availability; and nutrition status of such
vulnerable people. The food basket is reduced among those people living on less than 1US$/day
by cutting down on social activities like health and education and further by reducing meals and
nutritious foods in their diets.
Secondly, from the producer-trader perspective, rising food prices is a business opportunity. But
the study has revealed that less than 20% of the producers sell any maize. Therefore, the impacts
of price increases will be negative on the majority of producers as the income will not change,
but the expenditures will. Therefore some policy changes or interventions should be implemented
that will assist this huge group of poor, small-scale farmers either through the government itself
or in partnership with donors.
37

High Global Food Prices – Crisis or opportunity for smallholder farmers in Ethiopia, Malawi and Tanzania
It has been revealed through the study that some traders are exploiting producers by giving them
cash when they have run out of food from their own production with the aim of collecting a
stated amount of maize at harvest. This is testimony that increasing food prices are creating
business opportunities not only to the producers, but also to the traders. However, due to the
urban bias food policy, the government intervened to control the increasing food prices. The
question is, is the government denying the producers to make money out of maize production?
Usually, no easy answer is given to this question. The reality on the ground however is that
denying farmers of remunerative produce prices is a disincentive to increased investment in
improved technologies such as improved seeds and inorganic fertilizers. What this entails then is
that government should continue adopting double pronged food policy: control the sharp increase
in food prices to protect the urban consumers on the one hand and supporting the producers with
various interventions that are aimed abating the cost of production so as to render food crops
(maize in particular) profitable. This is an area where the Norwegian government could support
the Malawi government in supporting the fiscal burden of implementing such programs.
5.1 RECOMMENDATIONS
The study has clearly demonstrated that food price increases are a major challenge to policy
makers. Producers as well as consumers need to be supported in the face of continued increase of
food prices. However, the main problem has usually been that of balancing the policy support. A
few recommendations could therefore assist in alleviating some of these key challenges.
1. In view of the continued tremendous imbalance between input and output prices, coupled
with high levels of poverty in Malawi, it is unlikely that farmers will achieve higher levels of
crop productivity without any support. It is therefore recommended that the government should
continue supporting farmers not necessarily through the Input Subsidy Program alone but also
through other supplementary means such as investment in water management infrastructure and
Integrated Soil Fertility Management technologies which would improve crop productivity. It is
in this area that we believe the Norwegian Development Agency () could identify a niche of
support.
2. There is need for donors such as the Norwegian Government to expand support to
national program initiatives that enhance food supply such as building best bet technologies
38

High Global Food Prices – Crisis or opportunity for smallholder farmers in Ethiopia, Malawi and Tanzania
(coupled with concurrent research) which enhance viable agricultural production. This could be
coupled with support to innovative risk management strategies to sustain the adoption of such
best bet technologies.
3. There is need for the Norwegian Government to continue supporting the Agriculture
Sector Wide Framework (ASWAp) (then ADP) and ensure that issues of high food prices are
fully tackled through increased productivity.
4. There is need for increased investment in concurrent, timely and affordable packaged
input distribution systems (“smart” subsidies) and water management infrastructure. Government
should also endeavor to follow these guidelines in their input subsidy programs to enhance input
distribution systems. This should be combined with investments in irrigation, water storage and
use/ management as well as delivery infrastructure, but not forgetting improvements in rain fed
systems.
5. There is also need to support and protect the most vulnerable groups of people who are
unable to meet high food prices, e.g., malnourished children, HIV and AIDS and chronically ill
affected people and school going children, through increased life-saving nutritional support and
cash transfers by donor commitments since most programs run by Government or other partners
are currently running at much lower than originally planned levels in a high food price (HFP)
context. It should be noted that 80% of all the food commodities distributed by some of the
programes are from local purchases from Malawian farmers/ traders, although the current policy
of ADMARC being the sole buyer/ seller is an impediment to local purchases.
6. Government and donors should support conducting high food price (HFP) Urban and
Rural Assessments to identify the vulnerable and needs which will help to map out those
deserving support together with quantitative estimates for maximum intervention impact.
39

High Global Food Prices – Crisis or opportunity for smallholder farmers in Ethiopia, Malawi and Tanzania
REFERENCES
Banda, J.W., Chitika, R. and Kaunda, E.K.W. (2008). Response to High Food Prices in Developing Countries: Needs Assessments and Response Proposal for Malawi. FAO Consultancy Report, October 2008. FAO, Lilongwe, Malawi. Kadale Consultants (2009): Finscope Study– Access to Banking Services in Malawi MoAFS (2008). Malawi food crisis response programme. Ministry of Agriculture and Food Security (MoAFS), Lilongwe, Malawi. Food Crisis Meeting, Pretoria, South Africa, September 2008. Phiri M. A. R. (2008): Impact Assessment of the Increase in Food Prices on Food and Livelihood Security in Malawi. Prepared for the Catholic Relief Services- Malawi Sopo, O., Phiri, M.A.R., Nakhumwa, T.O. and Tchale, H. (2007). Economic analysis of the role of market information on marketing of agricultural produce in Malawi: The case of maize market. In: Proceedings of the Biennial Conference of the Regional Universities Forum for Capacity Building in Agriculture (RUFORUM), Working Document No. 2, 23-27 April 2007, Mangochi, Malawi. Sopo, O., Phiri, M.A.R., Nakhumwa, T.O. and Tchale, H. (2009). Spatial maize market integration in Malawi. Unpublished. MSc Thesis, University of Malawi, Bunda College, Lilongwe, Malawi.
40

High Global Food Prices – Crisis or opportunity for smallholder farmers in Ethiopia, Malawi and Tanzania
APPENDICES
A2. 1 Land Allocation by Crop
area
1.5415 109 .86749 .50 6.001.5415 109 .86749 .50 6.00
.7538 74 .51105 .25 2.00
.7538 74 .51105 .25 2.00
.5000 6 .15811 .25 .75
.5000 6 .15811 .25 .751.7500 2 1.76777 .50 3.001.7500 2 1.76777 .50 3.001.0000 1 . 1.00 1.001.0000 1 . 1.00 1.00
.4167 3 .14434 .25 .50
.4167 3 .14434 .25 .504.0000 1 . 4.00 4.004.0000 1 . 4.00 4.00
.2500 4 .00000 .25 .2510.3333 6 6.40833 4.00 20.00
6.3000 10 7.06596 .25 20.00.8750 2 .17678 .75 1.00
9.6667 3 5.50757 4.00 15.006.1500 5 6.19375 .75 15.00
.6324 34 .37048 .25 2.0020.5000 6 14.19507 10.00 48.00
3.6125 40 8.80722 .25 48.00.5000 1 . .50 .50.5000 1 . .50 .50.6563 8 .22903 .50 1.00.6563 8 .22903 .50 1.00
1.0000 2 .00000 1.00 1.001.0000 2 .00000 1.00 1.001.0754 246 .79622 .25 6.00
13.6250 16 10.83744 4.00 48.001.8418 262 4.05095 .25 48.00
unit of areaAcreTotalAcreTotalAcreTotalAcreTotalAcreTotalAcreTotalm sqTotalAcrem sqTotalAcrem sqTotalAcrem sqTotalAcreTotalAcreTotalAcreTotalAcrem sqTotal
CropsMaize
Groundnuts
Soybeans
Common beans
Cassava
Sweet potato
Pepper
Vegetables
Tomatoes
Green maize
Sugarcane
Rice
Cotton
Total
Mean N Std. Deviation Minimum Maximum
41

High Global Food Prices – Crisis or opportunity for smallholder farmers in Ethiopia, Malawi and Tanzania
A2. 2 Average Quantity of Maize Produced per Household Quantity in kgs for major crop
816.0280 107 904.78204 50.00 6000.00343.8873 71 373.77730 20.00 1800.00172.0000 5 123.16655 60.00 350.00150.0000 2 .00000 150.00 150.00
1200.0000 1 . 1200.00 1200.00150.0000 2 .00000 150.00 150.00
12.0000 1 . 12.00 12.00185.0000 38 101.02181 25.00 350.00150.0000 1 . 150.00 150.00130.0000 7 107.54844 20.00 300.00
28.3333 3 10.40833 20.00 40.00340.6250 8 261.15728 125.00 900.00200.0000 2 .00000 200.00 200.00506.8669 248 690.01845 12.00 6000.00
CropsMaizeGroundnutsSoybeansCommon beansCassavaSweet potatoPepperGreen maizeAvocadoGuavaMangoRiceCottonTotal
Mean N Std. Deviation Minimum Maximum
42

High Global Food Prices – Crisis or opportunity for smallholder farmers in Ethiopia, Malawi and Tanzania
A2. 3 Average Quantity of Maize Produced per Household by District Quantity in kgs for major crop
801.1607 56 927.49859 100.00 6000.00832.3529 51 888.08691 50.00 4500.00816.0280 107 904.78204 50.00 6000.00331.3143 35 347.79539 20.00 1320.00356.1111 36 401.99700 50.00 1800.00343.8873 71 373.77730 20.00 1800.00170.0000 3 157.16234 60.00 350.00175.0000 2 106.06602 100.00 250.00172.0000 5 123.16655 60.00 350.00150.0000 2 .00000 150.00 150.00150.0000 2 .00000 150.00 150.00
1200.0000 1 . 1200.00 1200.001200.0000 1 . 1200.00 1200.00
150.0000 1 . 150.00 150.00150.0000 1 . 150.00 150.00150.0000 2 .00000 150.00 150.00
12.0000 1 . 12.00 12.0012.0000 1 . 12.00 12.00
185.5556 36 103.66690 25.00 350.00175.0000 2 35.35534 150.00 200.00185.0000 38 101.02181 25.00 350.00150.0000 1 . 150.00 150.00150.0000 1 . 150.00 150.00130.0000 7 107.54844 20.00 300.00130.0000 7 107.54844 20.00 300.00
28.3333 3 10.40833 20.00 40.0028.3333 3 10.40833 20.00 40.00
250.0000 1 . 250.00 250.00353.5714 7 279.29546 125.00 900.00340.6250 8 261.15728 125.00 900.00200.0000 2 .00000 200.00 200.00200.0000 2 .00000 200.00 200.00448.6849 146 663.92203 12.00 6000.00590.1471 102 720.87971 50.00 4500.00506.8669 248 690.01845 12.00 6000.00
DistrictLilongweSalimaTotalLilongweSalimaTotalLilongweSalimaTotalLilongweTotalSalimaTotalLilongweSalimaTotalLilongweTotalLilongweSalimaTotalLilongweTotalLilongweTotalLilongweTotalLilongweSalimaTotalSalimaTotalLilongweSalimaTotal
CropsMaize
Groundnuts
Soybeans
Common beans
Cassava
Sweet potato
Pepper
Green maize
Avocado
Guava
Mango
Rice
Cotton
Total
Mean N Std. Deviation Minimum Maximum
43

High Global Food Prices – Crisis or opportunity for smallholder farmers in Ethiopia, Malawi and Tanzania
A2. 4 Amount of Crop Produce Sold per Crop by District p
Quantity of major crop sold in kg
519.5833 12 824.20887 20.00 3000.00157.1429 7 134.74844 20.00 400.00386.0526 19 673.39228 20.00 3000.00170.7143 14 194.45542 45.00 787.50169.8182 11 189.94898 45.00 720.00170.3200 25 188.45633 45.00 787.50
61.0000 3 33.80828 40.00 100.0061.0000 3 33.80828 40.00 100.00
166.6667 3 125.83057 50.00 300.00166.6667 3 125.83057 50.00 300.00100.0000 1 . 100.00 100.00144.0000 5 132.73093 20.00 350.00136.6667 6 120.06942 20.00 350.00285.0909 33 532.33019 20.00 3000.00160.3478 23 157.04859 20.00 720.00233.8571 56 422.57936 20.00 3000.00
DistrictLilongweSalimaTotalLilongweSalimaTotalLilongweTotalLilongweTotalLilongweSalimaTotalLilongweSalimaTotal
CropsMaize
Groundnuts
Soybeans
Green maize
Rice
Total
Mean N Std. Deviation Minimum Maximum
44

High Global Food Prices – Crisis or opportunity for smallholder farmers in Ethiopia, Malawi and Tanzania
A2. 5 Income from Crop Sales by District p
Income (MK) of major crop sols
24833.33 12 49543.63244 1500.00 180000.006850.0000 8 6148.63516 900.00 18000.00
17640.00 20 38944.79764 900.00 180000.009353.3333 15 10385.62651 1200.00 42000.006363.6364 11 6525.18547 1800.00 24000.008088.4615 26 8927.62351 1200.00 42000.004500.0000 3 2598.07621 1500.00 6000.004500.0000 3 2598.07621 1500.00 6000.004000.0000 1 . 4000.00 4000.004000.0000 1 . 4000.00 4000.002066.6667 3 1331.66562 1200.00 3600.007950.0000 2 9970.20561 900.00 15000.004420.0000 5 6010.15807 900.00 15000.001200.0000 1 . 1200.00 1200.001200.0000 1 . 1200.00 1200.002260.0000 8 1432.36069 600.00 4800.002260.0000 8 1432.36069 600.00 4800.00
11700.00 6 13427.58355 600.00 35000.0011700.00 6 13427.58355 600.00 35000.00
6750.0000 4 7675.71929 1000.00 18000.006750.0000 4 7675.71929 1000.00 18000.001650.0000 1 . 1650.00 1650.00
210.0000 1 . 210.00 210.00930.0000 2 1018.23376 210.00 1650.0010525.00 4 7846.60224 3500.00 21600.0010525.00 4 7846.60224 3500.00 21600.00
1800.0000 1 . 1800.00 1800.0010360.00 5 9059.41499 2000.00 24000.00
8933.3333 6 8824.43577 1800.00 24000.0010702.41 54 25055.70495 600.00 180000.00
7462.8125 32 6871.31684 210.00 24000.009496.9767 86 20276.71026 210.00 180000.00
DistrictLilongweSalimaTotalLilongweSalimaTotalLilongweTotalSalimaTotalLilongweSalimaTotalLilongweTotalLilongweTotalLilongweTotalLilongweTotalLilongweSalimaTotalSalimaTotalLilongweSalimaTotalLilongweSalimaTotal
CropsMaize
Groundnuts
Soybeans
Cassava
Sweet potato
Pepper
Vegetables
Tomatoes
Green maize
Sugarcane
Mango
Rice
Total
Mean N Std. Deviation Minimum Maximum
45

High Global Food Prices – Crisis or opportunity for smallholder farmers in Ethiopia, Malawi and Tanzania
A2. 6 Average Income Level by Study Site Total income (MK)
3678.3333 24 3839.94527 1000.00 18000.006823.2143 28 9291.36878 300.00 40000.005371.7308 52 7406.73957 300.00 40000.005000.0000 1 . 5000.00 5000.005000.0000 1 . 5000.00 5000.00
85733.33 6 101713.84698 6000.00 276000.0018700.00 2 15980.61325 7400.00 30000.0068975.00 8 91592.35386 6000.00 276000.00200.0000 1 . 200.00 200.00200.0000 1 . 200.00 200.00
2000.0000 2 1414.21356 1000.00 3000.001000.0000 1 . 1000.00 1000.001666.6667 3 1154.70054 1000.00 3000.00
12700.00 2 10323.75901 5400.00 20000.002040.0000 5 1404.63518 800.00 4000.005085.7143 7 6792.25750 800.00 20000.004700.0000 1 . 4700.00 4700.004860.0000 5 2519.52376 1800.00 8000.004833.3333 6 2254.47703 1800.00 8000.00
15825.00 4 29456.90355 600.00 60000.004114.2857 7 6724.68799 400.00 18000.008372.7273 11 17954.22462 400.00 60000.001845.0000 8 2841.89072 210.00 8800.001270.0000 4 1555.50635 400.00 3600.001653.3333 12 2424.77490 210.00 8800.00
67455.56 9 62063.82020 600.00 192000.0024166.67 6 18137.43826 3000.00 40000.0050140.00 15 52919.28895 600.00 192000.00
5000.0000 1 . 5000.00 5000.002791.6667 6 3799.79166 100.00 10000.003107.1429 7 3567.72904 100.00 10000.00
31900.00 2 41436.45738 2600.00 61200.0023103.75 16 27621.27607 2000.00 89000.0024081.11 18 27969.05557 2000.00 89000.00
2251.6667 3 1884.80989 255.00 4000.002251.6667 3 1884.80989 255.00 4000.00
22261.83 63 48362.46132 210.00 276000.0010240.00 81 16554.84650 100.00 89000.0015499.55 144 34687.42845 100.00 276000.00
DistrictLilongweSalimaTotalLilongweTotalLilongweSalimaTotalSalimaTotalLilongweSalimaTotalLilongweSalimaTotalLilongweSalimaTotalLilongweSalimaTotalLilongweSalimaTotalLilongweSalimaTotalLilongweSalimaTotalLilongweSalimaTotalLilongweTotalLilongweSalimaTotal
Source of income in 2008Hired out labour
Hired out oxen
Employment
Migrant income
Remittance
Food for work
Sale of handcrafts
Sale of firewood
Sale of grass
Other business
Gift/Assistance
Sale of crops
Other specify
Total
Mean N Std. Deviation Minimum Maximum
46

High Global Food Prices – Crisis or opportunity for smallholder farmers in Ethiopia, Malawi and Tanzania
47
A2. 7 Price per Unit (MK) Price/Unit (MK)
384.1538 52 519.59835 30.00 2300.00284.7500 28 271.15987 35.00 1000.00200.0000 1 . 200.00 200.00458.0000 2 625.08239 16.00 900.00
1891.5000 12 2338.02514 88.00 6500.001990.3846 52 2547.85566 70.00 10000.001635.7143 7 2145.28830 800.00 6500.002089.0625 32 2725.85395 200.00 9500.00
321.6667 6 123.35585 150.00 450.001123.3333 3 865.23600 270.00 2000.001474.3442 31 767.47625 52.00 3000.00
20.0000 1 . 20.00 20.00282.5000 4 312.76988 90.00 750.00125.0000 2 106.06602 50.00 200.00250.0000 1 . 250.00 250.00100.0000 1 . 100.00 100.00
2750.0000 2 353.55339 2500.00 3000.001231.2982 237 1876.16649 16.00 10000.00
Item/CommondityMaize seedG/nuts seedCommon bean seedSoyabeans seedDAP fertilizerUrea fertilizerCAN fertilizer23:21:0 fertilizerTools/EquipmentAnimal boughtMaize food itemCassava food itemRice food itemRelish food itemClothing & shoesHousehold goodsland/income taxTotal
Mean N Std. Deviation Minimum Maximum

High Global Food Prices – Crisis or opportunity for smallholder farmers in Ethiopia, Malawi and Tanzania
APPENDIX 3

High Global Food Prices – Crisis or opportunity for smallholder farmers in Ethiopia, Malawi and Tanzania
APPENDIX 3
FOOD PRICES AND WORLD POOR - WINNERS & LOSERS:
A case study of two villages in Tanzania
By Joseph Hella
Illuminatus Kamile Carl Erik Schulz
1

High Global Food Prices – Crisis or opportunity for smallholder farmers in Ethiopia, Malawi and Tanzania
TABLE OF CONTENTS Acknowledgment 4 Executive Summary 5 List of Abbreviations 8 1. INTRODUCTION 9 2. PROBLEM DEFINITION 9
2.1 Problem statement and justification 9 2.2 Objective 10
3. THEORETICAL AND CONCEPTUAL FRAMEWORK 11 4. METHODOLOGY 14
4.1Location of the study 14 4.1.1 Dodoma region 14 4.1.2 Ruvuma region 15 4.2 Types and Methods of Data Collection 15 4.3 Sampling and Sample Size 16 4.4 Data collection and analysis 17 4.5 Limitation of the methodology 17
5. RESULTS AND DISCUSSION 17 5.1 Sample characteristics 17 5.1.1 Producers socio-characteristics 17 5.1.2 Ownership of assets 18 5.1.3 Consumers characteristics 20 5.2 Food crops production 21 5.2.1 Main crops produced by proportion of farmers 21 5.2.2 Farm level production and trend 21 5.2.3 Production trends regional wise 23 5.3 Main food consumed 24 5.4 Pricing and prices at different market levels 25 5.4.1 Review of pricing policy 25 5.4.2 Market price for major food crops and consumers indication for willingness to pay 27 5.4.3 Price trends at main consumer markets 29 5.4.4 Income generation pattern by producer 30 5.4.5 Expenditure pattern at producer market 31 5.5 Factors leading high prices 33 5.6 Global Food Prices - winners and losers 34 5.6.1 Winners 35 5.6.2 Losers 35
6. CONCLUSION AND RECOMMENDATION 35
2

High Global Food Prices – Crisis or opportunity for smallholder farmers in Ethiopia, Malawi and Tanzania
LIST OF REFERENCES 38 Household questionnaire Consumers’ questionnaires Key informants checklist LIST OF TABLES Table 1 The composition of respondents by location and total sample sizes 16 Table 2 Household socio-economic characteristics for the Chigongwe and Mgazini villages 18 Table 3a Proportion of the respondents by type of assets owned 18 Table 3b Land ownership variables by Gender of the household 19 Table 4 Cereal consumption characteristics 20 Table 5 Reasons for eating maize and rice as main staple 20 Table 6 Proportion of the respondent by type of crops produced 21 Table 7a Farm level production, productivity and income for Chigongwe village 22 Table 7b Area cultivated, quantity of crop sold and income obtained by gender for selected crops 22 Table 8 Farm level production, productivity and income for Mgazini village 22 Table 9 Proportion of respondent by type of food consumption and degree of preference 24 Table 10 Consumers’ response and historical prices and their willingness to pay 27 Table 11 crops sources of income at Chigongwe and Mgazini village 30 Table 12 Expenditure on welfare (consumption) 31 Table 13 Expenditure on investment 32 LIST OF FIGURES Figure 1 Conceptual framework on influencing staple food consumption 13 Figure 2 Location of Dodoma and Ruvuma 14 Figure 3 Maize - Area cultivate, total production and prices Songea rural district Songea region 23 Figure 4 Maize – Quantity and price of maize brought at Kibaigwa market Dodoma 24 Figure 5 Indicate price consumer willing to pay in 2009 and price trend between 2006 and 2008 28 Figure 6 Price trends for five major crops in Songea district 29 Figure 7 Bean priced trends 30 Figure 8 Proportion of expenditure on consumption and investment 33
3

High Global Food Prices – Crisis or opportunity for smallholder farmers in Ethiopia, Malawi and Tanzania
ACKNOWLEDGEMENT
To all smallholder farmers and consumers
in Dodoma and Ruvuma region in Tanzania who, in their different ways, provided information which resulted to producing this
report and whatever the insight I possess
To
Norad through the Norwegian University of Life Sciences, Department of International Environment and Development Studies (Noragric)
for funding this study
and to
Sokoine University of Agriculture for logistical support
and to Bai Omary, Mwantumu Omary, Meda Theodore and Wiiliam Juma for enumeration, data entry and data analysis
4

High Global Food Prices – Crisis or opportunity for smallholder farmers in Ethiopia, Malawi and Tanzania
EXECUTIVE SUMMARY 1. Increased agricultural income is central to reducing poverty in Tanzania, and is a key
component in the National Strategy for Growth and Poverty Reduction (MKUKUTA in Swahili acronyms). Agriculture is the largest sector of the economy contributing about 45 percent of GDP and employing 80 percent of the labor force.
2. Despite its importance in the economy, the agricultural sector has not maximized its potential in contributing to the poverty reduction goal. Previous socialist regimes resulted in the poor functioning of agricultural cooperatives, leading to mismanagement and inefficiency in agricultural marketing systems.
3. While these problems are still affecting the national economy, since 2005, the country experienced a dramatic surge in the price of many staple food commodities in the world. In some countries the price of maize increased by 80% between 2005 and 2007, and has since risen further. Other commodities whose prices also rose sharply over this period include milk powder by 90%, wheat by 70% and rice by about 25% with tremendous impacts on the real incomes of poor households in developing countries who spend roughly three quarters of the incomes on staple foods.
4. However, despite widespread concern about the impacts of high food prices on poor people and on social stability (e.g. FAO, 2007; World Bank 2008) little concrete information appears to be available on actual impacts on poor people. The overall impact on poverty rates in poor countries depends on whether the gains to poor net producers outweigh the adverse impacts on poor consumers.
5. This study attempted to address the main implications (gain or crisis) of higher food prices on producers and consumers in Tanzania. The study is significant and timely undertaken since a recent upward trend in global food prices have led to widespread concern that hunger and poverty will increase sharply in the country as poor and food insecure households may be forced to reduce their consumption and investment levels devastating effect to their livelihood.
6. The purpose of this study was to assess how food prices impact poor producers and consumers in Tanzania and what role Norway could play in this regard. Specifically the objectives are to (a) asses food prices trends both from producers and consumers perspectives, (b) assess the impact of current and foreseen implications of high market prices on food security and welfare at the household level; (c) conduct a comparative analysis between farm gate prices profitability in relation to the increased prices of inputs and other costs of production ; (d) Establish factors that limits participants to take full advantages of increased food prices so that they can benefit from more, and (e) Propose immediate, mid-term, and long-term response options to any negative impacts of rising global food prices on household welfare and food security.
7. The study is based on data that is collected from two locations in Tanzania mainland i.e Chigongwe village and Dodoma town in Dodoma region (depicting food deficit area) and Mgazini village and Songea in Ruvuma region (depicting food surplus area).
8. Both primary and secondary data were used. Primary data were collected by using structured and semi-structured questionnaire, checklists, and observations. The questionnaires were directed to producers and consumers in sample villages and urban centers respectively. Checklist was directed to key informants such as agricultural extension officers, village leaders, traders and transporters, market mangers and other key informants where
5

High Global Food Prices – Crisis or opportunity for smallholder farmers in Ethiopia, Malawi and Tanzania
appropriate. Secondary data were collected from various sources including internet. A sample of 98 and 62 farmers and consumers were interviewed.
9. The respondents were very diverse as expected. Majority of the respondents were male as in all regions accounted for more than 80%, although slightly higher in Chigongwe than Mgazini village. Household size varies slightly between two study regions. Chigongwe had high household size (5.25 members compared to Mgazini (4.47 members) and the mean age of the farmers was about 42 years although minimum and maximum age for Mgazini village was relatively higher than Chigongwe village. Almost all respondents (95%) in al villages work full time in the farm.
10. A house is the most important asset owned by the respondents. All respondents stay in their own house. The status of the houses varied significantly across the study villages. Iron roofed houses are common at Mgazini than Chigongwe. The latter village is dominated by grass thatched houses. Hand hoes are most common assets for the farmers. Each household own about 3-5 hand hoes. Ownership of motorized farm implements was not reported. Only 2 farmers at Chigongwe village reported to own ox-plough.
11. Cereal mainly maize and to some extent rice are most consumed staple in all study villages. Majority (66%) eat three times per day. Maize is more preferred staple because of taste, availability and tradition.
12. Due to favorable climate in Ruvuma region, 16 foods crops were reported to be cultivated compared to only 7 crops in semi-arid Dodoma region. Overall analysis suggest that almost 93% percent of the respondents reported to cultivate maize, followed by ground nuts (45%), common beans (28%), pear millets (21%), simsim (19%) and sorghum (13%). Other crops also cultivated are sorghum, pearl millet, finger millets, sunflower, simsim, soya beans, tomato, leafy vegetable and bambara nuts. Not all crops are produced in the same region thus substantial inter-regional trade is common.
13. The current consumer prices in Tanzania are function of many attributes including transport cost and pricing policy. Crops pricing policy is linked to changes in agricultural pricing policy in Tanzania since independence can be subdivided into three periods, namely post independence (1961-1966), socialism (1967-1984) and reform to market economy periods (1985-to date).
14. Analysis of responses from consumers at two markets for four major food crops i.e. maize, rice, sorghum and round potato, indicate that except round potato all other crops are sold at higher prices at Dodoma than Songea market. Also except for sorghum and rice which showed price to increase at an increasing rate, prices of maize and round potato are increasing at a decreasing rate. In all markets consumers indicated that they were willing to pay lower prices compared to the 2008 prices or to put it correctly prices are identical to 2006 prices. Net food buyers are affected much with such situation.
15. Analysis of income generation capacity which could be used to buy staple food in deficit households or not produced by household. Income from crop sale is high at food surplus Mgazini village mainly from sale of main staple maize. In Chigongwe village revenue is negligible mainly from sale of ground nuts. Sale of livestock, off farm and on-farm employment, and petty trading are other sources of income.
16. Expenditure pattern of income generated on consumption and investment was analyzed. Overall 76% of income generated is consumed while 24% is saved or invested in agriculture and non-agriculture ventures. In food deficit areas 98% of their merger income is consumed compared to 67% in food surplus Mgazini village. Hence the results show declining
6

High Global Food Prices – Crisis or opportunity for smallholder farmers in Ethiopia, Malawi and Tanzania
investment in welfare expenditure such as housing, education and health as well as on productive ventures such as fertilizer, seed and farm equipments.
17. Despite of the fact that there is low price transmission between world and local market prices, the observed price surge in developing countries like Tanzania is cause by factors. This study recorded factors such as low production and productivity, seasonality nature of agricultural production, limited distribution due to high transport costs, unreliable and low operating capital, high marketing costs, limited availability of support services, and price distortions through short term deregulations using local, regional and national By-laws and taxes/levies.
18. Finally this study concluded that although the recent increases in prices of staple foods which was envisaged to raise the real incomes of those selling food (producers in rural areas), many of whom are relatively poor, while hurting net food consumers (both in rural and urban areas), the evidence suggests that due to the subsistence nature of Tanzania economy, tradition, consumption and production behaviors and to some extent pricing policy, institutional support and market failure, the large increases in food prices appear likely to raise overall poverty although substantially more in deficit households. This observation suggests that smallholder net buyers and consumers are the overall losers.
19. Government and donor support to stimulate production through research and extension, marketing function through credit and subsidies and nutritional support to those mostly affected are important.
7

High Global Food Prices – Crisis or opportunity for smallholder farmers in Ethiopia, Malawi and Tanzania
LIST OF ABBREVIATIONS DALDO District Agricultural and Livestock Development Officers DR Congo Democratic Republic of Congo FAO Food and Agricultural Organization GDP Gross Domestic Product MKUKUTA: Swahili acronym standing for National Strategy for Growth and Poverty
Alleviation (NASGPA) NBS National Bureau of Statistics NDL National Distribution Limited NMC National Milling Company SODECO Songea Development Company SUA Sokoine University of Agriculture Tshs Tanzania Shillings (1300 Tshs – 1US Dollar) URT United Republic of Tanzania USDollar United States Dollar
8

High Global Food Prices – Crisis or opportunity for smallholder farmers in Ethiopia, Malawi and Tanzania
1. INTRODUCTION Increased agricultural income is central to reducing poverty in Tanzania, and is a key component in the National Strategy for Growth and Poverty Reduction (MKUKUTA in Swahili acronyms). Agriculture is the largest sector of the economy contributing about 45 percent of GDP and employing 80 percent of the labor force. Agriculture accounts for most of the economic activity in rural areas. The sale of agricultural commodities accounts for 70 percent of rural incomes. Most Tanzanian farms are small – over 50 percent are less than one hectare. Almost all of Tanzanian agriculture depends on rainfall, productivity is very low and yields fluctuate widely from season to season. Despite its importance in the economy, the agricultural sector has not maximized its potential in contributing to the poverty reduction goal. Previous socialist regimes resulted in the poor function of agricultural cooperatives, leading to mismanagement and inefficiency in agricultural marketing systems. Despite the privatization of state companies, the private sector has not expanded fast enough to fill the vacuum left by collapsed cooperatives and state companies in supplying farm inputs, processing, marketing and export of crops. Currently, there are few functioning cooperatives and producer organizations. Many farmers face serious problems in identifying markets for their crops; understanding how to meet market standards; and difficulty in accessing inputs, extension advice, and credit. While the nation’s research and extension systems are in place, the delivery of services is weak. Other constraints to the agricultural sector are costs associated with poor infrastructure, especially rural roads and electricity. Multiple local taxes, unstable policies, bureaucracy and corruption increase the costs and risks of accessing national, regional, and international markets. While these problems are still affecting the national economy, International agricultural commodity prices (in US dollar terms) have been increasing since 2003 for cereals, other foods and non-foods. There are many factors behind these increases: increased biofuels demand; higher oil prices that have raised prices for agricultural inputs such as fuel and fertilizer; continued growth in demand for resources from China and India that have led to reductions in net cereal and oilseed exports from these two giants in recent years; short-term supply shocks due to adverse weather conditions; low world prices in the early years of this decade, which may have reduced production incentives; and short-term trade policy changes such as reduced barriers to imports and increased restrictions on exports, growing foreign exchange holdings by major food-importing countries, and recent policies by some exporting countries to mitigate their own food-price inflation. Macroeconomic factors such as a weak US dollar and low real interest rates that affect both supply and demand have also played a role. 2. PROBLEM DEFINITION 2.1. PROBLEM STATEMENT AND JUSTIFICATION Since 2005, the world has experienced a dramatic surge in the price of many staple food commodities. In some countries the price of maize increased by 80% between 2005 and 2007, and has since risen further. Many other commodity prices also rose sharply over this period: milk
9

High Global Food Prices – Crisis or opportunity for smallholder farmers in Ethiopia, Malawi and Tanzania
powder by 90 percent, wheat by 70 percent and rice by about 25 percent. Clearly, such large increases in prices may have tremendous impacts on the real incomes of poor households in developing countries who spend roughly three quarters of the incomes on staple foods. However, despite widespread concern about the impacts of high food prices on poor people and on social stability (e.g. FAO, 2007; World Bank 2008a), little concrete information appears to be available on actual impacts on poor people. The overall impact on poverty rates in poor countries depends on whether the gains to poor net producers outweigh the adverse impacts on poor consumers. Little is known if higher food prices improve or worsen the situation. Studies elsewhere (e.g. see Hertel and Winters 2006; Ravallion and Lokhsin 2005; Hella et al., 2004) tell us that the impacts of higher food prices on poverty are likely to be very diverse, depending upon the reasons for the price change, the structure and degree of transmission of world prices to that rural economy. In addition, it also depends on the distribution of net buyers and net sellers of food among low-income households (Aksoy and Isik-Dikmelik 2007). In this study, we attempt to address the main implications (gain or crisis) of higher food prices on producers and consumers in Tanzania. The study is significant and timely undertaken since a recent upward trend in global food prices have led to widespread concern that hunger and poverty will increase sharply in the country as poor and food insecure households may be forced to reduce their consumption levels. In addition to reduced food consumption, increased household expenditure to meet immediate food needs may be at the expense of sufficiently addressing other longer-term household needs, such as education and health. The quality of diets may suffer as families shift the income that they have been spending on nutrient-dense fruits, vegetables, pulses, and animal-source foods to purchases of energy-dense cereals or tubers. The most affected households are likely to be those most dependent on the market for their food.
2.2. OBJECTIVE The primary objective The purpose of this study was to assess how food prices impact poor producers and consumers in Tanzania and what role Norway could play in this regard. Similar studies have also been conducted in Ethiopia and Tanzania in collaboration with the Norwegian University of Life Sciences in Norway. Specific objectives Specifically the study sought to:
a) Asses food prices trends both from producers and consumers perspectives; b) Assess the impact of current and foreseen implications of high market prices on food
security and welfare at the household level; and c) Conduct a comparative analysis between farm gate prices profitability in relation to the
increased prices of inputs and other costs of production d) Establish factors that limit participants to take full advantages of increased food prices so
that they can benefit from more. e) Propose immediate, mid-term, and long-term response options to any negative impacts of
rising global food prices on household welfare and food security.
10

High Global Food Prices – Crisis or opportunity for smallholder farmers in Ethiopia, Malawi and Tanzania
Research questions The study was directed by the following research questions:-
a) Are the current farm gate prices profitable in relation to the increased prices of inputs and other costs of production?
b) How do the increased prices affect the household economy of the various groups in the study?
c) How does increase in prices affect production? d) If farmers benefit and make profit, what do they do with the increased income? e) If traders benefit, how do they use the increased income? f) If some groups are unable to take advantage of the situation and only face the problem of
higher food prices, how do they cope or how does it affect them? 3. THEORETICAL AND CONCEPTUAL FRAMEWORK The starting point in analyzing the impact of rise in global food prices on smallholder producers is to acknowledge that household do dispose their income as taxes to government, and the rest is divided between personal savings (S) and personal consumption (C). Increase in food prices lead to increased consumption expenditure at the expenses of saving (i.e. investment). Looking from micro level, the immediate impact of high food prices on household welfare, which effectively depends on whether the household is net buyer or seller of the food item(s) is analyzed based on initial ideas by Zezza et al. (2008) and to some extent Ivanic & Martin (2008). Their argument was based on the welfare effect due to food price rise and resulting impact before any adjustment can take place in household production and consumption patterns. In this framework, given a change in producer and consumer staple prices, the net effect on household welfare depends on the household’s condition as net seller or net buyer. If staple prices increase, the household will experience a welfare gain in the short run if it is a net seller or a welfare loss if it is a net buyer. To quantify this change in welfare in an intuitive manner a useful notion is that of compensating variation, which equals the gain/loss to the income/monetary transfer needed to restore the household to the position it was before the (price) shock occurred. According to Zezza et al. (2008) the compensating variation is expressed as a percentage of the initial welfare level. The immediate welfare effect of changes in the price of a staple food is given by:
ic
c
tp
p
t
i CRppPR
pp
xw
000
Δ−
Δ=
Δ
………………………………………………………………………(1) Where:- ~ Δw
i is the first-order approximation of the change in welfare for household i of a change in
the staple food price, ~ x
0i is the original income (here proxied by total consumption expenditure) of household i,
11

High Global Food Prices – Crisis or opportunity for smallholder farmers in Ethiopia, Malawi and Tanzania
~ pp
0 is the original price of the staple at which production is valued,
~ pc
0 is the original price of the staple at which consumption is valued,
~ PRi is the value of the production of this staple for household i as a proportion of x
0i, and
~ CRi is the value of the consumption of this same staple for household i as a proportion of x
0i.
The above equation can be readily adapted to account for different degrees of transmission of changes in producer and consumer prices, to account for regional variations in price changes within each country, and to account for different prices changes for different commodities to the three main tradable food staples in each country. Imputing differing price changes across countries (for instance to reflect actual price increases recorded on local markets) would have rendered the international comparison less straightforward. Thus, equation (1) reduces to
( ttt
i CRPRxw
−=Δ
1.00
) ………………………………………………………….. (2)
The analysis focused on tradable staples (and staple products) only, as these are at the centre of the current international debate, but the same analysis can be easily extended to cover non-tradable staples as these, over time, may also increase due to growth in demand. This study was guided by the conceptual framework presented below. The starting point for our framework is cultivated staples which are either consumed and/or sold to generate income. Basic food commodities that are traded globally and are important for small farmers and consumers in Tanzania include wheat, rice, dairy products, maize, sugar, beef and poultry are suggested. World food demand influence production decisions at farm level and adds to income to the farmer. Income generated is used to buy food which is not cultivated by the household, used to meet welfare needs or invested back to agriculture and non agricultural activities (See figure 1).
12

High Global Food Prices – Crisis or opportunity for smallholder farmers in Ethiopia, Malawi and Tanzania
Marketed food
Staple Food Consumption
Government policy/institutions /road networks
Cultivated food/livestock
Income from crop sale
Save/invest
Welfare expenditure
World food demand
Figure 1 Conceptual framework on influencing staple food consumption
13

High Global Food Prices – Crisis or opportunity for smallholder farmers in Ethiopia, Malawi and Tanzania
Government policies, regulations and by-laws, available institutions in production and marketing and road network have influence on households’ welfare expenditure, income from crop sale, food crop production and world food demand. Based on this framework the analysis the impacts of changes in the prices of these commodities using household-level data from the two regions – Dodoma and Ruvuma will be sought. 4. METHODOLOGY
4.1. LOCATION OF THE STUDY This report is based on the study conducted in two locations in Tanzania. Tanzania is a significant producer of food within East Africa and Great lakes region including Zambia and Malawi. Traditionally and in normal circumstances, Tanzania is the most important food exporter in the region. The principal food export is maize and rice, with most going to Kenya, Malawi, Zambia, Democratic Republic of Congo, Comoro, Mauritius to mention but few. These staples are the main sources of calories for the population. Other crops produced in the country and consumed extensively include cooking banana, cassava and sweet potato, round potato, beans and most fruits and vegetables. Almost three-quarters of consumption of these foods is from the own production of consuming households. Due to diversity in agro-climate across the country, degree of self sufficiency differs across the study regions. For example the semi-arid central regions are mostly food deficit which better-off regions are mostly food surplus. For this study data were collected from Dodoma region (depicting food deficit area) and Ruvuma region (depicting food surplus area) (Figure 2). 4.1.1. Dodoma region Dodoma region is among the semi-arid regions in Tanzania in Dodoma urban district. The region which lies between latitude 4°49' and 7°00' South and36°56' and 35°55' longitude East has a total area of 41,311 km2. The predominant climatic feature of the district is the short rain season from
December-April and the prolonged dry season of 7-8 months (Hella et al; 1999). The economy of the district almost entirely depends on agriculture and animal husbandry. Agriculture is characterized by low productivity due to low and highly unreliable rainfall. Livestock play a central role in social and economic well being of the district. In Tanzania about 40% of the farmers live in chronic food deficit regions such as semi-arid areas. This study was conducted in Chigongwe village in Nala ward. The village is located about 25 km from Dodoma town along Dodoma – Singida road. Due its position, farmers at the village have a reliable and easily accessed market at Dodoma town which is linked by a good tarmac road. Dodoma town is also linked with good
Dodoma
Ruvuma
14 Figure 2. Location of Dodoma and Ruvuma
High Global Food Prices – Crisis or opportunity for smallholder farmers in Ethiopia, Malawi and Tanzania
tarmac road to Kibaigwa (largest maize market in Tanzania and Dar es Salaam located about 470 km away. For this study data were from Chigongwe village and Dodoma municipality (Figure 2). According to data collected at the village, about 1445 households reside in the village with a population of about 5389 people (2300 male and 3089 female). 4.1.2. Ruvuma region Along with Mtwara region Ruvuma is the Southern most part of Tanzania Mainland. The region lies between latitudes 9 0 35' and 11 0 45' South of the equator and between longitudes 34 0 35' and 38 0 10' East of Greenwich. It borders the Republic of Mozambique to the South and shares Lake Nyasa with the Malawi Republic to the West. Mtwara Region is to the East. To the North East is Lindi region and in the north the region borders with Morogoro and Iringa regions. Ruvuma region has a total surface area of 67,372 sq. km. Of this area the water area comprises 3,582 sq. km. The water area is dominated by some 2,979 sq. km of Lake Nyasa. Hence, the 603 sq km of water are scattered throughout the rest of the region. This leaves a land area of some 63,790 sq. km. This study was conducted in Songea rural district.
About 90% of land in Songea rural district is suitable for farming although on 9% is under cultivation. Due to good and reliable rainfall a number of crops are cultivated. Major crops include maize, rice, beans, sweet potato, and cassava. Other crops include tobacco, coffee, cashew nuts, sesame, groundnuts and paprika. Due to high food crop production, Ruvuma region is one of the four regions considered as nation’s food granary. Other regions are Mbeya, Iringa and Rukwa.
Mgazini village is located about 37 km from Songea town, the capital of Ruvuma region. Songea is located about 1033 km south of Dar es Salaam city. Mgazini village is linked with 18 km of tarmac road to Peramiho and the rest is gravel road which is impassable during rain season. According to a recent village statistics, there are 705 households with about 3904 total population (1902 male & 2002 female).
4.2. TYPES AND METHODS OF DATA COLLECTION Both primary and secondary data were used. Types of data collected include:
a) Households’ production, purchases, own-consumption and sales of selected agricultural products;
b) Information on supply, demand and net sales of food products; c) Historical data on domestic prices at different levels of the marketing system (farm,
wholesale, retail), as well as data on exchange rates and the consumer price index; d) Historical data on policies, laws, by-laws and regulations regarding food production,
imports, exports, trade, and compatibility to other policies within and other countries which have contradictory effect on food production, exportation or importation.
Primary data were collected by using structured and semi-structured questionnaire, checklists, and observations. The questionnaires were directed to producers (Appendix 3.1) and consumers (Appendix 3.2) in village and urban respectively. Checklist (Appendix 3.3) was directed to key
15

High Global Food Prices – Crisis or opportunity for smallholder farmers in Ethiopia, Malawi and Tanzania
informants such as agricultural extension officers, village leaders, traders and transporters, market mangers and other key informants where appropriate.
4.3. SAMPLING AND SAMPLE SIZE As mentioned earlier two locations one with better-off and surplus food crop production (Ruvuma region) and another with low potential and food deficit (Dodoma region) were purposely chosen. Upon consultation with respective regional authorities’, two districts Songea rural and Dodoma urban districts were proposed. Furthermore, in each district, one village was purposely identified based on suggested criteria (e.g. production potential, proximity to consumer markets30, and major crops produced). Finally 98 respondents (producers) – 51 from Dodoma region and 47 from Ruvuma region were randomly selected from high and low income strata in each sample village. Data from consumers were collected from Dodoma and Songea31 Municipalities respectively. Snowball approach was used to select 31 respondents from each municipality who provided data on prices from the consumption side of food pricing. Table 1 shows the composition of respondents by location and total sample sizes. Table 1. The composition of respondents by location and total sample sizes Region Location Sex &
market Count Total
Producers Consumers Dodoma Producers (Chigongwe
village by sex)
Male 44 51
Female 7
Consumers (Dodoma municipal by market location)
Majengo 11
31 Chang’om
be10
Miembeni 10 Ruvuma Producers (Mgazini
village by sex) Male 38
47
Female 9 Consumers (Songea
municipal by market location)
SODECO 18 31 Soko kuu 13
Grand total 98 62
30 Chigongwe village in Dodoma region is located 25 km from Dodoma town along good tarmac road while Mgazini village is located 37 km from Songea town of which 20 is on gravel road impassable during rainy season
31 Songea is a capital of Ruvuma region
16

High Global Food Prices – Crisis or opportunity for smallholder farmers in Ethiopia, Malawi and Tanzania
4.4. DATA COLLECTION AND ANALYSIS Data collection was conducted during the month of April 2009. After establishing the sample and pre-testing the questionnaire, the trained enumerators administered the questionnaire at the respondents’ homes - for producers’ and at the market places - for consumers’ respectively. On the other hand, secondary data were collected by reviewing records, reports, and other literatures from respective District Agriculture and Livestock Development offices (DALDO), local market offices, Sokoine University of Agriculture (SUA), National Bureau of Statistics (NBS) and various web pages. Questionnaire were later coded and entered into Statistical Programme for Social Scientists (SPSS) and analyzed according to requirements addressed by research objectives. Excel computer program was used to analyze time series data of inputs and outputs prices.
4.5. LIMITATION OF THE METHODOLOGY Cross sectional data collection method was the main method for collecting primary data. In some occasions, data which required the respondent to recall important figures of the past two or three years was needed. Possibility of forgetting hence giving false information is high. In this context secondary data collected at the same or nearby market was used to countercheck. Information thus presented by this paper is valid and reliable. 5. RESULTS AND DISCUSSION
5.1. SAMPLE CHARACTERISTICS 5.1.1. Producers socio-characteristics Producer data were collected from Chigongwe village (Dodoma) located 25 kilometers from Dodoma town and Mgazini village (Ruvuma) located about 37 km from Songea town. The respondents were very diverse as expected. Majority of the respondents were male as in all regions accounted for more than 80%, slightly higher in Chigongwe than Mgazini village. This was not surprising as males are heads of the house in all patriarchal systems. Household size varies slightly between two study regions. Chigongwe had high household size (5.25 members compared to Mgazini (4.47 members). Household size recorded at Chigongwe village is higher than the national average on 4.8 members (URT, 2002). As indicated in Table 2, the average age of the farmers was 42 years although minimum and maximum age for Mgazini village was relatively higher than Chigongwe village. Analysis of education level of the head of the household was very variable. Generally, the study revealed that respondents at Mgazini village are more elite than their counterparts at Chigongwe village since about 47% of the respondents have not attained universal primary education compared to 13% in Mgazini village.
17

High Global Food Prices – Crisis or opportunity for smallholder farmers in Ethiopia, Malawi and Tanzania
Table 2. Household socio-economic characteristics for the Chigongwe and Mgazini villages Variable Characteristic of the variable Chigongwe Mgazini Distance From regional headquarters (km) 25 37 Sex of household head
o Male 44 (86.3) 38 (80.9) o Female 7 (13.7) 9 (19.1)
No. of members in one household
o Mean 5.25 4.74 o Minimum 12 13 o Maximum 2 1 o Std deviation 2.19 2.09
Age (years) of Household head
o Mean 42.3 42.2 o Minimum 20 26 o Maximum 75 79 o Std deviation 14.63 13.37
Education level o No formal education 5 (13.2) 1 (2.1) o Lower primary education 13 (34.2) 5 (10.6) o Primary education 18 (47.4) 36 (76.6) o Secondary education plus
course 2 (5.3) 5 (10.6)
Employment status o Family farm full time 48 (94.1) 45 (95.7) o Self non-farm 2 (3.9) 2 (4.3) o Not working at all 1 (2.0) 0 (0.0)
NOTE: Numbers in the brackets are percentages The study also analyzed employment status of the respondents. In all villages, about 95% of all respondents are full time farmers while the remaining 5% are employed in non-farm activities or not working at all. 5.1.2. Ownership of assets Households in study villages own number of assets such as house, household items, livestock, farm equipments, Table 3a presents number of respondents by an average number of assets owned and Table 3b present land ownership by sex of the household head. Type of house owned has status connotation. Ownership of iron roofed house is associated with high income and status. From the study 84% of the respondents at Mgazini village have iron roofed houses compared to only 27% in at Chigongwe suggesting that the latter have low economic power. Ownership of radio, hand hoes, mobile phones, goats, and beds was high in all villages with high proportion at Mgazini than Chigongwe. Table 3a. Proportion of the respondents by type of assets owned Asset Dodoma
(Chigongwe) Ruvuma (Mgazini) Statistics
Frequency Average Frequency Average F-statistic
Sig-level
Iron roofed house 14 1.05 37 1.02 0.0272 .604 Grass/tembe roofed house
37 1.0 7 1.0 0.000 1.000
18

High Global Food Prices – Crisis or opportunity for smallholder farmers in Ethiopia, Malawi and Tanzania
Cows 8 18.7 5 2.6 19.500 .001*** Goats 14 10.4 28 5.7 4.939 .032* Sheep 3 4.0 - - 0.000 1.000 Pigs 1 20 28 2.9 625.000 .000*** Ox-plough 2 1.0 - - 0.000 1.000 Hoe 51 3.3 47 5.4 15.840 .000*** Spade 17 1.2 15 1.5 1.660 .207 Bicycle 12 1.3 32 1.4 0.404 .528 Motorcycle - - 1 1.0 0.000 1.000 Power tiller - - 1 1.0 0.000 1.000 Milling machine 2 1.0 3 1.0 0.600 .495 Radio 31 1.1 41 1.5 10.980 .001** Mobile phones 7 1.0 15 1.5 5.568 .029* Whist watch 1 1.0 12 12 0.282 .606 Beds 30 2.0 28 2.9 7.663 .008*** Bed-rooms 29 3.0 22 4.3 1.354 .250 NOTE: *, **, *** = Significant at α=0.1, 0.05, 0.01 levels Due to the role of cattle as banks in the hoofs in most semi-arid areas, the proportion of respondents owning cattle is higher at Chigongwe than Mgazini village. Since ownership of assets reflects the wellbeing of the society, the main reflection which can be made from this finding is that income realized by producers at Mgazini village higher that proportion invested is also higher than their counterparts in Chigongwe village in Dodoma region. The higher the priced of food crops the higher the income so as investment in physical and social assets. Most significant difference (ά=0.1) is reflected in ownership of cows, goats, pigs, hand hoes, radio, mobile phones and beds. Analysis of ownership of land by gender of the household is highly skewed. Male dominancy on total land owned, rented out, available, cultivated and land under planted tree is apparent. Land is an important resource in farming communities. Limited access to land suggests that, female headed households face limited investment option thus are less likely to benefit from increased food prices than male counter parts especially when area expansion is required. Table 3b: Land ownership variables by Gender of the household Male Female
Mean Acreage
Freq MeanAcreage
Freq
Total land owned 12.45 79 5.92 16 Total land rented out 2.75 4 0.00 0 Total land rented in 10.60 2 0.00 0 Total land borrowed 0.75 3 0.00 0 Total land available 12.59 81 5.92 16 Total area cultivated 6.70 79 3.07 14 Total fallow land 4.60 15 7.00 3 Total land under trees 0.95 5 0.00 0
19

High Global Food Prices – Crisis or opportunity for smallholder farmers in Ethiopia, Malawi and Tanzania
5.1.3. Consumer characteristics In order to gather information about food prices, this study interviewed 62 consumers, 31 from Songea and Dodoma towns respectively. Respondents were from Majengo, Miembeni and Chamwino markets in Dodoma town and SODECO and Soko Kuu markets in Songea town. The objective was to establish the main food crops consumed, frequency of eating, current and historical prices at local markets (2006-2008), and their willingness to pay at the current period (2009). Cereal mainly from maize, rice and to some extent wheat is reported to be consumed by all consumers interviewed. About 67% of all consumers’ interviews indicated to consume cereals twice per day. Difference frequency of consumption between dry season (soon after harvest) and wet season was negligible (Table 4). Other sources of carbohydrates include; cassava, sweet potato, round potato, sorghum, pearl millets, and yams Table 4. Cereal consumption characteristics Variable Characteristics PercentCereal as main dish Yes 100.0
No 0.0Eating frequency during dry season Every day once per days 1.6
Every day twice per days 68.3Every day thrice per days 30.2
Eating frequency during wet season Every day once per days 4.8Every day twice per days 66.7Every day thrice per days 28.6
Analysis to reflect the reasons for eating cereals (Maize and rice) varied across the study regions. Taste and tradition was important reasons for eating rice among respondents at Songea town as reported by 53% and 27% of the respondents respectively. Consuming because it is the traditional food was recorded almost equally by the respondents in all towns whereas high price and limited availability were relatively the important reasons that limit consumption of both maize and rice among consumers in Dodoma region (Table 5). Based on the marketing systems for these two staples, it’s due to low purchasing power which limits their consumption in Dodoma municipality than otherwise. Table 5. Reasons for eating maize and rice as main staple Reasons Maize Rice
Dodoma Ruvuma Dodoma Ruvuma Taste 2.1 65.2 0 53.3 High price 17.9 4.3 12.9 0.7 Limited availability
20.0 8.7 45.2 13.3
Health 20.0 4.3 9.5 0.0 Traditional food 36.7 13.0 32.3 26.7 Others 3.3 4.3 0.0 0.0
20

High Global Food Prices – Crisis or opportunity for smallholder farmers in Ethiopia, Malawi and Tanzania
5.2. FOOD CROPS PRODUCTION 5.2.1. Main crops produced by proportion of farmers In order to reflect consumption and production, data on main crops produced in the study villages were collected and analyzed. Due to favorable climate in Ruvuma region, 16 foods crops were reported to be cultivated compared to only 7 crops in semi-arid Dodoma region. Overall analysis suggest that almost 93% percent of the respondents reported to cultivate maize, followed by ground nuts (45%), common beans (28%), pear millets (21%), simsim (19%) and sorghum (13%) (Table 6). Due to climate variability the importance differ across the study villages. Maize, common bean, simsim, finger millets, sunflower, and to some extent soya bean are important food crops in Mgazini village (Ruvuma) where as maize, groundnuts, pear millets, sorghum, bambara nuts and to some extent simisim in Chigongwe village. Table 6. Proportion of the respondent by type of crops produced Crop Dodoma
(Chigongwe) Ruvuma (Mgazini)
Overall
Count % Count % Count %Maize 44 86.3 47 100.0 91 92.9Ground nuts 39 76.5 5 10.6 44 44.9Common bean 0 0.0 27 57.4 27 27.6Pearl millets 21 41.2 0 0.0 21 21.4Simsim 4 7.8 15 31.9 19 19.4Sorghum 13 25.5 0 0.0 13 13.3Finger millets 0 0.0 6 12.8 6 6.1Sunflowers 0 0.0 5 10.6 5 5.1Bambara nuts 4 7.8 0 0.0 4 4.1Soya bean 0 0.0 3 6.4 3 3.1Cassava 0 0.0 3 6.4 3 3.1Sweet potato 0 0.0 2 4.2 2 2.0Rice 0 0.0 1 2.1 1 1.0Onion 0 0.0 1 2.1 1 1.0Tomato 0 0.0 1 2.1 1 1.0Sugarcane 0 0.0 1 2.1 1 1.0
It should be noted that although rice and sweet potato are important crops consumed in the study areas (see Table 2), but are not produced within the areas thus must be purchased from other regions in the country or imported from abroad. 5.2.2. Farm level production and trend Table 7a, 7b and 8 present production area cultivated, yield, price and income generated from crop sales at farm Chigongwe and Mgazini villages respectively. Results show that for main staple (maize) the difference in terms of area cultivated, total yield, productivity, quantity sold and income from sale is relatively high. Mgazini village in Ruvuma region records higher figures than Chigogwe village. Low production in Chigongwe villages also reflected on the number of respondents who sold their crops. For instance while 2 (4.5%) out of 44 farmers who grew maize in Chigogwe villages reported to sale their crop, 46 (98%) out of 47 farmers who were
21

High Global Food Prices – Crisis or opportunity for smallholder farmers in Ethiopia, Malawi and Tanzania
interviewed reported to sale part of their produce Table 7a & 8). Female headed households cultivate smaller areas than male headed households and accordingly obtain lower yield and lower total revenue from crop sale compared to male headed households. Table 7a. Farm level production, productivity and income for Chigongwe village Crop Area
cultivate Average
yield (kg)
Yield per acre
Average sold (kg)
Price/kg Total income
Maize (n=44) 1.28 611.1 477.4 960 (2) 280 259,500.0Simsim (n=4) 1.25 162.5 130.0 200 (1) 800 160,000.0Pearl millets (n=20) 1.80 493.0 273.8 120 (3) 400 43,660.0Sorghum (n=13) 1.00 325.0 325.0 300 (1) 280 74,000.0Bambara nuts (n=4) 1.30 560.0 430.8 0.0 (0) 0 0.0Ground nuts (n=44) 1.90 700.0 368.4 608 (37) 558 230,935.0 Table 7b: Area cultivated, quantity of crop sold and income obtained by gender for selected crops Crop Area cultivated Quantity sold (kg) and income (Tshs)
Male Female
Average Male Female Quantit
y soldIncome (Tshs)
Quantity sold
Income (Tshs)
Maize 4.50 2.80 4.20 14,054.3
1,020,964.0
2,728.8 482,577.0
Simsim 1.10 0.65 1.00 783.6 488,150.0 180.0 157,333.3Pearl millets 1.86 1.75 1.85 120.0 4366.0 0.0 0.0Common Bean 1.97 2.00 1.83 500.0 295,592.8 414.0 233,500.0Ground nuts 1.61 0.50 1.48 626.8 230,648.0 214.0 153,000.0 Table 8. Farm level production, productivity and income for Mgazini village Crop Area
cultivated Average
yield (kg)
Yield per acre
Average qty sold
(kg)
Price/kg Total income
Maize (n=47) 7.10 37,880.0 2.4 t/ha 38,233 (46)
266.2 873,930.4
Soya beans (n=3) 1.00 666.6 666.6 700 (2) 400.0 180,000.0Rice (n=1) 0.25 200.0 800.0 92 (1) 500.0 46,000.0Simsim (n=15) 0.90 1475.0 1638.8 60(9) 830.0 432,971.0Onion (n=1) 0.50 600.0 1200.0 - - -Sweet potato (n=2) 0.37 300.0 810.8 100 (1) 200.0 20,000.0Tomato (n=1) 0.50 700.0 1400.0 - - -Finger millets (n=6) 1.30 850.0 653.0 - - -Common bean (n=27) 1.80 7998.0 4443.3 485 (25) 655.7 283,174.2Cassava (n=3) 1.60 300.0 187.5 300 (1) 100 30,000.0Groundnuts (n=5) 0.70 810.0 1157.1 128 (2) 490 70,640.0Sunflower (n=5) 2.00 1280.0 640.0 493 (3) 450 586.666.6Sugarcane (n=1) 0.50 7000.0 14,000.0 - - -
22

High Global Food Prices – Crisis or opportunity for smallholder farmers in Ethiopia, Malawi and Tanzania
Important crops for income generation in terms of proportion of producers who reported to sale their produce are maize, common beans and simsim for Mgazini village in Ruvuma region while in Dodoma region only groundnuts and to some extent pearl millets are important crops for cash generation. Poor smallholder farmers are not able to benefit from rising food prices. Under normal circumstances the subsistence farmers will normally decide to sale their produce only after meeting their household food requirements albeit at minimum level. 5.2.3. Production trends regional wise In addition to farm level productivity, this study sought to establish production trends for important staples based on time cereals data collected from reliable sources at the study regions. Analysis of the results as presented in Figure 3 and 4 shows that despite the fact that price of maize has been increasing tremendously over the past three years, area cultivated and total production have not been increasing accordingly. The hypothesis that price is a determinant factor in directing decision to invest in production does not hold. In situation like this, other reasons such as institutional, policy and infrastructural failures could be the main courses.
0
20,000
40,000
60,000
80,000
100,000
120,000
2005 2006 2007 2008 2009
Years
Tons
/hac
tare
0
200
400
600
800
1,000
1,200
1,400
1,600
T_S
hilli
ngs
Hectare cultivated Tons hatvested
Price/kg maize Price Fuel/litre
Figure 3. Maize - Area cultivate, total production and prices Songea rural district Songea region (Source Songea DALDO office reports, 2009)
23

High Global Food Prices – Crisis or opportunity for smallholder farmers in Ethiopia, Malawi and Tanzania
0.0
2000.0
4000.0
6000.0
8000.0
10000.0
12000.0
14000.0
16000.0
2004 2005 2006 2007 2008
Years
Tonn
es
0.00
50.00
100.00
150.00
200.00
250.00
300.00
Tshs
/kg
Price (Tshs) tonnes
Figure 4. Maize – Quantity and price of maize brought at Kibaigwa market Dodoma (Kibaigwa market reports, 2008) Evidences established by two figures above suggest that in smallholder production systems, farmers have been slow to benefit from increase in food prices in terms of expanding production and productivity through expanding production areas or improving productivity through intensive use of farm inputs. Harsh production climate, high and unavailability of production inputs, high transportation cost due to high prices of fuel and barrier to trade through burning exportation of staple crops to markets which offer high prices outside the country may have caused this behavior.
5.3. MAIN FOOD CONSUMED Table 9 presents main food crops consumed by respondents interviewed at Dodoma and Songea markets. Analysis show that more than 50% of the respondents reported to eat maize (95%), followed by rice (79%) common beans (54%) and sweet potato (52%). Other crops of significant importance include round potato (31%), cassava (29%), leafy vegetable and banana (22%). Table 9. Proportion of respondent by type of food consumption and degree of preference Crop Count
(n=62) Percent (%) Rank in order of importance
1st 2nd 3rd 4th 5th Maize 60 95.2 84.2 9.5 1.4 - - Rice 50 79.4 17.5 39.7 14.3 7.9 - Common bean 34 54.0 3.2 6.3 15.9 14.3 14.3 Sweet potato 33 52.4 - 9.5 17.5 15.9 9.5 Round potato 20 31.4 3.2 4.2 11.1 11.1 1.6 Cassava 15 28.8 - 6.3 11.1 4.8 1.6 Leafy 14 22.2 11.1 1.6 3.2 3.2 3.2
24

High Global Food Prices – Crisis or opportunity for smallholder farmers in Ethiopia, Malawi and Tanzania
vegetables Banana 14 22.2 1.6 3.2 6.3 4.8 6.3 Soya bean 12 19.0 3.2 - 9.5 3.2 3.2 Tomato 12 16.4 9.6 2.7 1.4 1.4 1.4 Onion 9 14.3 12.7 - 1.6 - - Yams 5 7.9 - - 3.2 - 4.8 Sorghum 4 6.3 - 3.2 1.6 1.6 - Bambara nuts 4 6.3 - - - 1.6 4.8 Cowpea 3 4.8 - - 1.6 - 3.2 Coffee 3 4.8 1.6 - - - 3.2 Papaya 3 4.8 - - 1.6 1.6 1.6 Mango 3 4.8 - - 1.6 - 3.2 Finger millets 3 4.8 1.6 1.6 - 1.6 - Pigeon pea 2 3.2 - 1.6 1.6 - - Avocado 2 3.2 - - 1.6 - 1.6 Egg plants 2 3.2 1.6 - 1.6 - -
Due to the presence of different agro-ecological zones which is a unique characteristic for Tanzania, all these crops (especially major staples except wheat) are produced in Tanzania in various intensities. In a year with good rainfall, yields are usually high that the country is self sufficient and able to export to neighboring countries such as Zambia, Malawi, DR Congo Kenya, Uganda and Comoro. However, due to government directives that hinder exportation of crops for food security reasons, internal distribution mainly through trade is common in areas where one or two crops are not produced through free marketing systems that enable traders to transport to deficit areas as regulated by market forces. In this context, although crops such as rice and round potato are not produced in all study districts, their consumption continues albeit at higher price due to high by transportation cost.
5.4. PRICING AND PRICES AT DIFFERENT MARKET LEVELS 5.4.1. Review of pricing policy Changes in agricultural pricing policy in Tanzania since independence can be subdivided into three periods, namely post independence (1961-1966), socialism (1967-1984) and reform to market economy periods (1985-to date). Pricing policy targeted agricultural inputs, food crops (especially staples) and export crops. While inputs and food crops were directly targeted by pricing policy, export crops were mainly intervened through marketing institutions. Phase I was characterized by market economy where input and product market demand and supply determined prices. However, farmer’s cooperatives were influential in export crop prices. Government provided support to farmers’ cooperatives without intervening directly in their decisions. Phase II pricing policy was characterized by regulated markets in line with African socialist policies, Ujamaa, also popularly known as Arusha Declaration. Under socialism most private enterprise including financial institutions were nationalized and put under the management of state companies. State companies had a monopoly in all sectors despite continued operation of private enterprises. The government fixed prices of staples, export crops and essential goods and took control of farmers’ co-operatives.
25

High Global Food Prices – Crisis or opportunity for smallholder farmers in Ethiopia, Malawi and Tanzania
During socialism the government directly intervened in the market through price fixing, imposing restrictions on trade, monopolizing the commodity market using state owned companies and subsidizing the agricultural inputs and food commodities. Purchasing food crops from surplus areas, processing and then distributing to demand areas were mainly undertaken by the state owned National Milling Corporation (NMC). Agricultural co-operatives operated in the rural areas as an agent for NMC. In addition to the NMC and co-operatives, the private sector also operated, mainly as a parallel market. Even though NMC was supposed to cater for the whole country, its activities were concentrated in the urban areas. Besides NMC, there was a state owned company, National Distributors Limited (NDL), created specifically for staple food distribution in cities like Dar es Salaam. NDL is a reflection of government priority to urban population. One of the pricing policy instruments adopted by the government was the system of pan-territorial prices introduced in 1974/75, whereupon the state company NMC purchased grains including maize at fixed prices across the country regardless of transport and marketing costs. The objective was to increase food output by promoting production in remote areas and to reduce regional income disparity among farmers (Mlay, 1988). Such policy resulted into increased maize production in the Southern Highlands and the marketable surplus provided for the market in major urban centres such as Dar es Salaam, Mwanza and Tanga (MOA 1997). However, the policy was not sustainable as NMC incurred large financial losses and had to depend on the government subsidies (Ashimogo, 1994). Further, the policy resulted in nominal increases of producer prices but later real producer prices fell as the private buyers withdrew from the market due to lack of incentive (Geir, 1995). De-regulation of the economy started gradually in 1984. However, serious reforms were instituted in 1986. Agricultural sector reforms included the withdrawal of the government from fixing producer and consumer prices, reduction of export taxes and removal of agricultural subsidies, particularly in farm inputs and crop marketing. Other reforms included lifting of government monopoly in marketing of staples and export crops, privatization of state-owned companies, and promotion of the private sector. The new agricultural pricing policy seeks to promote food and cash crops production for the domestic and export markets where it is expected that food production for the market will increase farmers’ cash income while ensuring adequate supply in the urban sector. The new policy places clear restrictions on government interventions in markets. Except in cases such as restocking of the emergency grain reserve, the government is not supposed to intervene in the food markets; rather its role has been limited to facilitate and promote the participation of the private sector (MOA 1997). After the liberalization of markets began, the districts, which are food deficit and characterized by low purchasing power, in the remote areas that have not been well served by the developing market due to prohibitive high transfer costs for imported grain. Bryceson observed that, after liberalization of the market, traders in the private sector have concentrated their efforts on supplying the more profitable urban markets. Also, Geir shows concern that some rural markets may be segmented or weakly integrated making the market-oriented food policy less effective.
26

High Global Food Prices – Crisis or opportunity for smallholder farmers in Ethiopia, Malawi and Tanzania
Applying a Ravallion-Timmer model of market integration, Nyange (1999) observed that degree of market integration for maize (Tanzania’s staple) varied with distance between markets and quality of transportation infrastructure. The study further revealed that markets in western Tanzania were more segmented than those on the East due to poor infrastructure in the former. In recent years, new de-regularization of producer prices by both local and district and national by laws has surfaced. Through these arrangements acts, by-laws and policy statements that burn exportation of main staples to safeguard the national food security can be instituted at any administration framework. The historical perspectives on pricing policies and the existence of by-laws that de-regulate marketing of preferred staple have to greater extent shaped the existing market price of various food crops in Tanzania. 5.4.2. Market price for major food crops and consumers indication for willingness to pay Since main market of staple produced in the country is within the country, our study intended to establish historical market prices of selected food crops produced and consumed in Tanzania at Dodoma and Songea towns. In Table 10 we have presented consumers reflection on prices of important foods crop from 2006 and 2008. In addition, consumers were asked to tell the prices which they are currently willing to pay. Table 10. Consumers’ response and historical prices and their willingness to pay
Crop Description prices
Dodoma (Dodoma1 town) Ruvuma (Songea town) mean minimum maximum mean minimum maximum
Maize Willing to pay now
287.3 150 600 234.0 100 700
Price in2008 382.6 235 700 344.0 200 500Price in2007 408.7 200 500 285.0 150 500Price in2006 270.1 175 470 241.0 75 450
Rice Willing to pay now
920.6 100 1400 840.0 400 1600
Price in2008 1737.9 700 1400 1496.8 100 1300Price in2007 1036.5 100 1300 955.1 100 1300Price in2006 896.0 600 1500 794.6 400 1200
Round Potato
Willing to pay now
268.3 150 600 463.3 100 1400
Price in2008 542.8 300 1200 791.6 300 1500Price in2007 450.0 200 800 725.8 250 3500Price in2006 342.6 200 600 481.0 200 800
Sorghum Willing to pay now
244.0 150 400 312.5 200 500
Price in2008 516.6 200 800 462.5 400 500Price in2007 397.7 100 600 295.0 200 430Price in2006 386.2 100 800 287.5 200 500
NOTE: 1 Three markets sampled are: Majengo, Miembeni and Chamwino. 2 Two markets sampled are: SODECO and Soko kuu.
27

High Global Food Prices – Crisis or opportunity for smallholder farmers in Ethiopia, Malawi and Tanzania
Analysis of responses from consumers at two markets on four major food crops indicate that except round potato (Figure 5d) all other crops are sold at higher prices at Dodoma than Songea market. Also except for sorghum (Figure 5a) and rice (Figure 5b) which showed price to increase at an increasing rate, prices of maize and round potato are increasing at a decreasing rates. The situation is more pronounced at maize at Songea market and round potato at Dodoma markets. In all markets consumers indicated that they were willing to pay lower prices than the 2008 prices or to put it correctly prices are identical to 2006 prices. Figure 5. Indicate price consumer willing to pay in 2009 and price trend between 2006 and 2008
0.0
100.0
200.0
300.0
400.0
500.0
600.0
Willing to pay2009
Price in 2006 Price in 2007 Price in 2008
Prices
Tshs
/kg
Dodoma Ruvuma
(a) Sorghum
920.6 896.01036.5
1737.9
840.0 794.6955.1
1496.8
0.0200.0400.0600.0800.0
1000.01200.01400.01600.01800.02000.0
Willing to pay 2009 Price in 2006 Price in 2007 Price in 2008
Years
Tsh/
kg
Dodoma Ruvuma
(b) Rice
28

High Global Food Prices – Crisis or opportunity for smallholder farmers in Ethiopia, Malawi and Tanzania
287.3 270.1
408.7382.6
234.0 241.0285.0
344.0
0.050.0
100.0150.0200.0
250.0300.0350.0
400.0450.0
Willing to pay 2009 Price in 2006 Price in 2007 Price in 2008
Years
Tshs
/kg
Dodma Ruvuma
(c) Maize
268.3342.6
450.0542.8
463.3 481.0
725.8791.6
0.0100.0200.0300.0400.0500.0600.0700.0800.0900.0
Willing to pay2009
Price in 2006 Price in 2007 Price in 2008
Years
Tshs
/kg
Dodoma Ruv uma
(d) Round potato 5.4.3. Price trends at main consumer markets
0
100
200
300
400
500
600
2005 2006 2007 2008 2009
Years
Tshs
/k
MaizePaddyg
CassavaC/ beanR/ potato
To ascertain the research results obtained from consumers at the two study towns, secondary data from these study towns were collected. Figure 6 show prices of major food crops collected Songea Rural district’s DALDOs office. Trends for the past 4 years show the general increase in prices all food crops from 2006 onwards. Increase is more pronounced for maize, paddy and common beans than cassava and round potato. Overall, round potato and beans recorded higher prices compared to cassava and maize which recorded low prices all time. Figure 6. Price trends for five major crops in Songea district (Source DALDO Songea)
29

High Global Food Prices – Crisis or opportunity for smallholder farmers in Ethiopia, Malawi and Tanzania
Figure 7 shows price trend for the bean at Songea (Ruvuma) and Dodoma markets. Until 2004 prices of bean per kilogram has been relatively constant at Tsh 400/kg. Price of beans in all markets started to increase from 2005 onwards with hyper increase at Dodoma than Songea market. The increase can be linked with declining production and productivity, poor weather and husbandry practices and favorable local marketing environment. Increase in export prices cannot be ruled out since bean is not among staple crop (maize & rice) which have been subjected to severe de-regulation for national food security
reasons.
0
200
400
600
800
1000
1200
19881999
20002001
20022003
20052007
2008
Ruvuma Dodoma
Figure 7. Bean priced trends
5.4.4. Income generation pattern by producer Table 3 presented income generated from sale of major crops produced in sample villages. From the table it was apparent that income from sale of staple crops is very minimal especially in traditional-food-deficit regions like the Dodoma region where major proportion of the produce is consumed by household members. On the other hand income from sale of maize is very high at Mgazini village apparently a food surplus village. Table 11 presents a list of other sources of income from the two study regions. Income from petty business and sale of chicken although not very important monetary value but was reported by many respondent. For example, almost 30% and 22% of the producers obtain income from petty trading and sale of chicken respectively. Other most important sources in Chigongwe village in terms of number of people engaged include sale of charcoal (20%), hiring out labor (18%), sale of cow/goats and its by-products (10%) and local brewing (10%). In Ruvuma region other sources of income comes from sale of pigs (23%), goats (17%) and sale of bucks (11%). Table 11. Crop sources of income at Chigongwe and Mgazini village Source Dodoma Ruvuma Total
Freq. Amount (Tshs)
Freq. Amount (Tshs)
Freq. Amount (Tshs)
Local brews 5 1,301,600.0 2 4,000,000.0 7 1,044,000.0 Petty business 7 115,714.8 22 933,545.0 29 987,517.2 Cows 4 472,500.0 - - 4 472,500.0 Bulls 1 400,000.0 - - 1 400,000.0 Heifer - , 1 360,000.0 1 360,000.0 Pigs 1 120,000.0 11 244,090.0 12 233,749.0 Hand craft 4 255,000,0 2 77,500.0 6 175,833.0 Hire out labour 9 27,222.2 1 120,000.0 10 147,222.2
30

High Global Food Prices – Crisis or opportunity for smallholder farmers in Ethiopia, Malawi and Tanzania
Sale charcoal 10 127,500.0 1 115,000.0 11 126,363.6 Bucks 3 100,000.0 5 62,000.0 8 76,250.0 Doe 5 67,400.0 8 49,125.0 13 56,153.8 Chickens 6 42,166.0 16 38,562.5 22 39,545.0 Rent out land - - 1 10,000.0 1 10,000.0
Discussing Table 11 together with Table 3, it is apparent that non-crop income sources are relatively lower and/or are effective to relatively small segment of the population. From this realization, it is now agreeable that income shortage can be reduced through sale of both staple and non-staple crops. The observed increase in prices may decline if it is coupled with increase in production and productivity and higher income for the farmers. 5.4.5. Expenditure pattern at producer market Table 12 and 13 present results of the analysis of expenditure of their income generated from sale of their produce on consumption and investment respectively. You will recall that farmers in food deficit Chigongwe village in Dodoma generate income from sale of groundnuts, charcoal, hiring out labor and sale of livestock and related products. On the other hand respondents in Mgazini village depend on sale of maize and to some extent livestock mainly pigs, goats and chicken. Expenditure on welfare (consumption) was compared between the two study villages on food, clothes, household items, health, school fees, transport, traditional rituals and ceremonies and support to relatives (Table 12). Expenditure on food accounted for 35% of the total income apportioned for welfare in Chigongwe village. Other major expenditure includes school fees (21%), and clothes (11%). At Mgazini village expenditure pattern on welfare is slightly different from that at Mgazini village. Expenditure on food accounts for only 6% of the total income on welfare. This is mainly due to the fact that the village is surplus producer of maize which is the main staple. Main expenditure is on school fees (31%), clothes (11%), traveling (14%) and rituals and ceremonies (14%). Table 12. Expenditure on welfare (consumption) Chigongwe
(Dodoma)Mgazini (Ruvuma) Total
(%)Tshs (freq) % Tshs (freq) %
Food 229,294.8 (39)
35 59,150.0 (8) 6 17
Clothes 73,259.0 (28)
11 123,055.0 (36)
12 12
Household items 24,800.0 (5)
4 86,265.6 (32) 8 7
Health 53,794.8 (39)
8 56,437.0 (40) 5 6
School fees 139,940 (15)
21 328,617.6 (34)
31 28
Traditional rituals & ceremonies 16,714.0 (14)
3 144,444.0 (18)
14 9
Support relatives away from 36,833.0 6 31,666.6 (9) 3 4
31

High Global Food Prices – Crisis or opportunity for smallholder farmers in Ethiopia, Malawi and Tanzania
home (12)Support children away from home
46,857.1 (7)
7 64,615.0 (13) 6 7
Travel expenses 32,710.0 (20)
5 151,629.0 (27)
14 11
100 100
100
As narrated in section 3 of this report where economic theory is presented, the income received by any household is either consumed and/or saved. From macroeconomics point of view, saving is equal to investment. Analysis of investment decisions of the farmers in the two study villages is presented in Table 12. Comparatively farmers in Mgazini villages portion much of their income on investment spending than those at Chigongwe village. Majority invest in agriculture such as buying seed, fertilizer, hiring farm labor, and on farm equipments. At Chigongwe villages, very few farmers reported to make investments agriculture except on purchase of farm tools and equipment (Table 13). Table 13. Expenditure on investment Chigongwe
(Dodoma)Mgazini (Ruvuma) Overall
(%)Tshs (Freq) % Tshs (Freq) %
Expenditure on improved seed (Tshs)
12,871.0 (7)
4.83 69,204.5 (22)
7.22 6.70
Quantity of DAP fertilizer used (kg)
0.0 (-) 0.00 207.9 (24) 0.02 0.02
Expenditure on DAP fertilizer (Tshs)
0.0 (-) 0.00 382,446.2 (26)
39.92 31.22
Quantity of UREA fertilizer used (kg)
0.0 (-) 0.00 214.1 (12) 0.02 0.02
Expenditure on UREA fertilizer (Tshs)
0.0 (-) 0.00 184,323.0 (17)
19.24 15.05
Expenditure on veterinary drugs
5,370.0 (5) 2.01 6,622.2 (9) 0.69 0.98
Expenditure on livestock minerals
0.0 (-) 0.00 59,000.0 (2)
6.16 4.82
Expenditure on farm tools & equipments
84,033.0 (15)
31.50 24,446.6 (15)
2.55 8.86
Expenditure for hiring farm labour
142,000.0 (5)
53.23 216,666.6 (21)
22.61 29.28
Expenditure for purchasing livestock
22,500.0 (2)
8.44 15,000.0 (11)
1.57 3.06
Total 100.00 100.00 100.00
32

High Global Food Prices – Crisis or opportunity for smallholder farmers in Ethiopia, Malawi and Tanzania
Figure 8 present a proposition income used for consumption and investment in the study area. Overall, the 76% total income generated is used for consumption and only 24% is invested in development ventures. Analysis across the study villages indicated a very skewed proportion. While almost all income (98%) generated by farmers at Chigongwe village is consumed, only 67% of the total income at Mgazini village is consumed (Figure 8). Based on economic principle which believes that income is equal to consumption and saving. And since saving is equal to investment, then farmers in Chigonwe village have negligible power to save hence they have a negligible capacity of investment. The situation is aggrieved more by an increase in food prices thus they have to use more of their little income to buy food within the declining income from sale of crops due low production hence are not benefiting from increasing food prices. This is a double barreled tragedy. In this context farmers’ residing in low potential food deficit areas are main losers in a situation of increasing food prices.
0.98
0.67
0.76
0.02
0.33
0.24
0.00 0.20 0.40 0.60 0.80 1.00 1.20
Chigongwe
Mgazini
Average
Percentage
Consumption Investiment
Figure 8. Proportion of expenditure on consumption and investment
5.5. FACTORS LEADING HIGH PRICES It is now apparent food prices are higher than what consumers are willing to pay as reported in all markets in the study regions (Figure 4). Analysis of data collected from Songea and Dodoma market revealed four factors that lead to increase in food prices. These include: a) Low production and productivity: In subsistence economy farmers are supposed to produce
enough for household requirement and sale surplus. However due to many factors within and outside the control of the farmers such as poor weather, inputs availability and use, poor husbandry practices and high input prices, production and productivity decline. With expanding demand due increase in population, the decline in production create scarcity at the market. Under free market economy, this situation leads to price increase. A typical case is what was observed in Dodoma region where even for crops such as pearl millets and sorghum which it has high comparative advantage in production, but due to low production, prices are generally high.
33

High Global Food Prices – Crisis or opportunity for smallholder farmers in Ethiopia, Malawi and Tanzania
b) Seasonality nature of agricultural production: Tanzania like anywhere in the tropics where production is dependence of seasonal weather system, the production is very variable. Soon after harvest (during dry season) prices of major staple falls drastically and rise sharply during the rainy season. With diverse climatic condition typical for Tanzania, one would imagine availability of food products at all locations throughout the year. However due poor road network, transportation of bulky food products to food deficit areas is always a serious problem. During the rainy season it is cheaper and faster to import maize from Durban South Africa than transporting from Rukwa region is southern Tanzania.
c) Limited distribution due to high transport costs: It is well known that there are several regions, or districts within the regions or villages within the districts which are food surplus at any one season. However due to poor roads to reach these areas, accessibility is usually a problem. A study conducted in 2004 on maize pricing at marginal and poor access areas in Tanzania (see Hella et al., 2007) posit that traders and transporters find it too costly to reach these areas hence food cannot be available in areas which deficit except at very high costs.
d) Unreliable middle that have low operating capital: Removal of Cooperative societies and allowing private traders to operate as middlemen in food crops marketing resulted to an emergence of unreliable middlemen who have low capital. In order for these middlemen to operate they ought to work with a chain of other middlemen or agents at villages, district towns and regional town. In so doing tendency is to ensure lowest price is paid at the farm gate and highest at the final consumers.
e) High marketing costs: Small and subsistence nature of producers have tendencies to increase marketing cost. The most significant cost is that of collection in small quantities and bulking to get sizeable load for transportation. Also since the produces comes from different sources there must be extra cost of cleaning, standardizing and grading. These costs are usually transmitted to final consumer with high consequence on prices
f) Limited availability of support services: In Tanzania like elsewhere in the developing countries institutional like banks, insurance, extension services that would provided support to produces are not existing or discriminate small scale farmers or agricultural enterprises due associated risk.
g) Price distortions through short term deregulations: Marketing or pricing policies, rules, regulations, Acts and by-laws are common in developing countries. In Tanzania for example in moving produce from the villages to urban areas one has to pay taxes and levies at different check points. These costs are finally transmitted to the final consumer to pay.
5.6. GLOBAL FOOD PRICES - WINNERS AND LOSERS In Tanzania, the recent increases in prices of staple foods was envisaged to raise the real incomes of those selling food (producers in rural areas), many of whom are relatively poor, while hurting the net food consumers (consumers in rural and urban areas), many of whom are also relatively poor. Due to the subsistence nature of Tanzanian economy, traditional food consumption and production behaviors and to some extent due to pricing policy, institutional support and market failure, the impacts in term of gaining or losing is certainly very diverse. Results using household
34

High Global Food Prices – Crisis or opportunity for smallholder farmers in Ethiopia, Malawi and Tanzania
and secondary data for two study regions show that the short-run impacts of higher staple food prices on poverty differ considerably by commodity, by region and by income status of the consumer. The recent large increases in food prices appear likely to raise overall poverty in food deficit households substantially although the degree differs as outlined in sections 5.6.1 (winners) and 5.6.2 (losers) below. 5.6.1. Winners
~ Who produce the most important and most preferred staples mainly maize and rice ~ Who produce in large quantities for own consumption and sell the surplus to buy food
items not produced locally ~ Who live and farm close to good and all weather roads that link to the main market ~ Who can generate enough income from non agricultural activities so that they can
afford to buy food at the local markets ~ Those who can postpone sale when prices are low (soon after harvest) and sale when
prices are good ~ Who produce less perishable products thus not affected by seasonal price variations ~ Who keep livestock which can be sold to buy staple food when need arise
5.6.2. Losers ~ Poor and low producers who cannot produce enough for their households thus have to
buy extra food at the local market ~ Who cannot produce crops which are favored by the consumers ~ Female headed households who have limited access to resources ~ Who resides in remote and poor accessed villages ~ Produce crops which are of national interest in terms of food security (e.g. maize &
rice) thus are bonded by the laws and regulations on what, when and where to sale 6. CONCLUSION AND RECOMMENDATIONS This report analyzed the household level impact of an increase in price of major tradable staple foods in two regions in Tanzania one representing food deficit and another food surplus area, using randomly sampled producers and consumer household surveys. The purpose of the study was to assess how food prices impact poor producers and consumers and what should be done in this regard. Specifically the study sought to; (a) assess food prices trends both from producers and consumers perspectives, (b) assess the impact of current and foreseen implications of high market prices on food security and welfare at the household level; (c) conduct a comparative analysis between farm gate prices profitability in relations to the increased prices of inputs and other costs of production; (d) establish factors that limit participants from taking full advantages of increased food prices so that they can benefit from more, and (e) propose immediate, mid-term, and long-term response options to any negative impacts of rising global food prices on household welfare and food security. From the results presented in this report it is obvious that high food prices are associated with both threats and opportunities. The analysis in previous sections has shown that for the poorest net buyer households, high food prices of principal staple foods are associated with potentially serious welfare losses, at least in the short run. At the same time, high food prices increase the
35

High Global Food Prices – Crisis or opportunity for smallholder farmers in Ethiopia, Malawi and Tanzania
value of agricultural assets and have the potential of stimulating private sector investment in agriculture if the necessary public goods are present. Although in totality Tanzania is not food deficit but in order to prevent the potential negative effects of high food prices on the extremely poor and a further increase in undernourishment, and to simultaneously take advantage of the potentially positive effects on agricultural investment, productivity and food production, a double barreled approach will be essential. In this context, those most vulnerable to food price shocks need to be protected from nutritional deprivation, asset shedding and reductions in their real purchasing power. Such protection not only saves lives, it can also strengthen livelihoods and promote longer-term development. Safety nets and social protection can reduce malnutrition that has lifelong consequences, prevent distress sales of assets, and allow investments in education and health that high food prices make more difficult, all of which help keep households from falling into poverty traps due low saving hence investment. In the very short run, protecting the most vulnerable may require direct food distribution, targeted food subsidies and cash transfers, and nutritional programmes including school feeding. The precise choice will depend on the extent to which some form of safety net or social protection mechanisms are already in place and can be mobilized. As was elaborated above, Tanzania has restricted exports in attempts to ensure domestic food security. While such barriers sometimes help to contain pressures on domestic prices, they can also signal problems and lead to panic buying on domestic markets. On the other hand, in some countries where the barriers are effective, farmers have reduced planting of cereals in the face of low domestic prices for their products coupled with high prices for inputs such as fuel, seeds and fertilizers. In the medium-term, there is a need for renewed attention to the agricultural sector. High food prices constitute an important element in the effort to re-launch agriculture since they provide incentives to the private sector to invest and produce. There is ample scope for substantial increases in agricultural production and productivity. Productivity increases will require significant and sustained improvements in long neglected areas such as research, extension, agricultural and general infrastructure along with credit and risk management instruments, all of which will complement increased price incentives. This study therefore recommends the following; a) Special support focus particularly on enabling poor rural producers – i.e. those in food deficit
areas who are least able to respond to changing market signals – to expand their production and marketed supply. The main areas of support include fostering agricultural research focused on the needs of marginal areas through enhancing access to agriculture services, including research, extension and financial services, and strengthening their capacity to take advantage of these;
b) There is a need for the government to implement specialized programme that will secure small farmers’ access to natural resources such as land and water; and fostering their participation in non-agricultural income generation activities and on more climate robust crops/livestock production as means to increase their income within non preferred staple crops.
36

High Global Food Prices – Crisis or opportunity for smallholder farmers in Ethiopia, Malawi and Tanzania
c) It is also important to assist these households in food deficit areas to strengthen their livelihoods in conditions of ever greater climatic uncertainty and their awareness of ways to benefit from new approaches to managing weather and other risks, including new forms of insurance.
d) We recommend that the government combines investment in agriculture and rural development with measures to enhance direct and immediate access to food for the most seriously undernourished. This should be achieved through expansion of rural infrastructure. High priority should be given to upgrading basic infrastructure, such as rural roads, to stimulate private sector investment. Investment is also needed to assure food quality and safety, and to develop food handling, processing, distribution and marketing enterprises by promoting small farmers' cooperatives and associations. These initiatives create more income generation opportunities for people in food deficit areas.
e) Government should foster policies that would ensure increased transmission of world prices to local market so that small-scale poor producers benefit from high world food prices.
f) Developing countries such as Norway should support programmes that enhance access to food for the most needy through school meals, feeding of pregnant and nursing mothers and children under five, and food-for-work programmes in food deficit area. Other area where support is needed most is on infrastructure development (roads, market institutions) that will link rural producers in remote areas with urban consumers and reduce food prices caused high transport cost.
37

High Global Food Prices – Crisis or opportunity for smallholder farmers in Ethiopia, Malawi and Tanzania
38
LIST OF REFERENCES
Ashimogo, G., (1994). Peasant grain storage and marketing in Tanzania: A case study of maize in Sumbawanga district. Koster, Berlin.at Peasant Household Level in Tanzania. Norwegian Journal of Agricultural Science supplement 21, 13-30
FAO, (2008) “Declaration of the high-level conference on world food security: The challenges of climate change and bioenergy”, June 5, Rome
Geir, G., (1995). Food security policy in Africa: Between disaster relief and structural adjustment; reflection on conception and effectiveness of policies: the case of Tanzania. German Development Institute, 5.
Hella, J.P.; E. Mbiha, D. Nyange, J. Makindara, and N. Mtenga (2004) Globalisation, Structural Adjustment and Smallholders Tanzania, Sokoine University of Agriculture, Morogoro, Tanzania
Hella, A.K. Kashuliza and C. Polton (2007). Dynamics of Liberalized Maize Marketing in Remote Areas of Tanzania: Evidences from Ludewa and Sumbawanga districts. Proceedings of AGREST annual workshop, Dodoma Tanzania
Hertel, T. and Winters, L. A. eds. 2006. Poverty and the WTO: Impacts of the Doha Development Agenda. Basingstoke and Washington DC: Palgrave-Macmillan and the World Bank
Ivanic, M. and Martin, W. (2008). Implications of Higher Global Food Prices for Poverty in Low income Countries. World Bank research group, Policy Research Working paper # 4594,
Mlay, G.I. (1988) “Analysis of factors affecting maize production and consumption in Tanzania.” FAO, Rome.
Nyange, D.A. (1999), “The estimation of inter-regional maize market integration and its Determinants in Tanzania”; Journal of Rural Problem, Japan. Vol. 35 No. 2 pp 59-71
Ravaliion and Lokhasin (2005). Ravallion, M. and Lokshin, M. 2005. “Winners and Losers from Trade Reform in Morocco” Mimeo, World Bank.
URT (2002). National Census: A preliminary report, DSM, Tanzania
World Bank (2008a). High food prices: a harsh new reality. http://econ.worldbank. org/WBSITE/EXTERNAL/EXTDEC/0,,contentMDK:2166588 3~pagePK:64165401~piPK:64165026~theSitePK:469372,00.html
Zezza, A.; B. Davis, C. Azzarri, K. Covarrubias, L. Tasciotti and G. Anriquez (2008) The Impact of Rising Food Prices on the Poor ESA Working Paper No. 08-07 , FAO Rome

Household questionnaire
Rising Food Prices: Crisis or opportunity?
Questionnaire for farm household interviews
The information collected will be used for research purposes. It will be treated as confidential and will not be used by tax authorities or others to assess the need for food aid or other assistance.
Questionnaire number: __________ Date of Interview: dd/mm/yy___/____/_______ Region: ________________ District:___________ Division:________________ Village:____________ Distance regional Hq :__________ (km) Full name of Household head:_________________________________ Household number:______ Enumerator’s full name:___________________________ Date checked: dd/mm/yy____/____/______ Checked by:______________________

1. Household characteristics No Full name of the
member Sex 1=male 2=female
Age (years)
Relation with the hh heada
formal education(years)
Employment statusb
presence (months in a year)
1 2 3 4 5 6 7 8 9 10 11 12 13 14 15 16 17 18 19 20 21 22 23 24 a Relation with the hh head: 1=head 2=spouse/partner 3=son/daughter 4=son/daughter in-law 5=grand child 6=brother/sister 7=father/mother 8=other relative 9=other non-relative (specify) b employment status: 1=work on the family farm 2=government employee 3=non-government employee 4=self-employed in other than farm(specify)__________ 5=casual labour 6=not employed

7=other (specify)______________
2. Asset endowments of the household Type Asset Number last
year (in 2007) Bought/owned in 2008
Sold/given out in 2007
House
1. Iron sheet roof 2. Grass thatched roof
Livestock
1. Cow (cross-breed)
2. Cow (other) 3. Oxen 4. Other cattle (calves)
5. Goat 6. Sheep 7. Chicken 8. Guinea Fowls 9. Pigeon 10. Pigs 10. Donkey 11. Mule/horse 10. Others
Machinery, equipment & transport
1. Oxen-plough 2. Wheel barrow 3. Hoe 4. Pitch fork 5. Donkey/horse/ox cart
6. Spade 7. Sickle 8. Hammer

9. plough parts 10. Bicycles 11. Tractors 12. Motor cycles 13. Power tiller 14. Milling machine
15. car or truck 17. Oil extraction mill
Others Household goods
1. Radio 2. Television 3. Telephone 4.Bed 5. Wrist watch 6. Separable bedroom
3. Crop production 3.1. Farm size in 2007
a) Land owned: _________ hectare b) Land rented out: _______ hectare c) Land rented in: _______ hectare d) Land borrowed: ________ hectare e) Land share cropped: _______ hectare f) Total available land: ______ hectare
3.2. Area of: a) cultivated land in 2007 ______hectare b) fallow land _______ hectare c) pasture land ______ hectare d) land under trees _______ hectare

3.3. Crop production activities in 2007 No
Crop
Area Intercropped Production (major crop)
Production (secondary crop)
Amount
Unit 1=yes 2=no
If yes, with: (crop)
Quantity Unit Quantity Unit
1 ze Mai 2 Soya beans 3 R ice 4 Pigeon peas 5 Cowpea 6 Sweet potato 7 Irish potato 8 Ya m 9 m Simsi 10 Coffee 11 Onions 12 Pepper 13 Wheat 14 Leafy
Vegetable
15 Pearl millets 16 Papaya 17 Avocado 18 Guava 19 Banana 20 Mango 21 Tomato 22 Barley 23 Sorghum 24 Finger millet 25 Common

bean 26 Haricot bean 27 Chick pea 28 Bambara nuts 29 Cassava 30 Cotton 31 Groundnuts 32 Sunflower 33 Okra 34 Egg plants 35 Chick peas 36 Others
(specify) ……………. ……………. …………….
3.4. Crop selling activities in 2007 No
Crops sold
Quantity sold (major crop) Production (secondary crop) Qty Unit Price
/ unitIncome (shilling)
Month sold
Where/to whom sold
Qty Unit Price/unit
Income (shilling)
Month sold
Where/to whom sold
1 ze Mai 2 Soya beans 3 R ice 4 Pigeon peas 5 Cowp ea 6 Sweet potato 7 o Irish pot at 8 Ya m 9 m Simsi 1 e0 Coff e

11 Onions 12 Pepper 1 at3 Wh e 14 Leafy
Vegetable
15 Pearl millets 16 Papaya 17 Avocado 18 Gua va 19 Banana 20 Mango 2 to1 Toma 2 y2 Barl e 23 Sorghum 24 Finger millet 25 Common
bean
2 an6 Haricot be 27 Chick pea 28 Bambara nuts 29 Cassa va 30 Cotton 31 Groundnuts 32 Sunflower 33 O kra 34 Egg plants 35 Chick peas 36 Others
(specify) …………….
Household ID No. Ruvuma Dodoma

4. Livestock production 4.1. Livestock production and inventory Type of animal
Stock in 2007
Current stock
Born in 2007
Bought in 2007
Died in 2007
Sold in 2007
Remarks
Cattle Milking cow Other cow oxen He ifer bull calf Sheep Ewe R am La mb Goats D oes B uck Kid Equines H orse Mule Donkey chicken Local chicken
Broiler chicken
Layers chicken
D ucks Guinea fo lw

Pigeon Beehives 4.2. Livestock selling activities Animal/ product
Sold in 2000 E.C
Price/unit
Income (shilling)
Month sold
Where/to whom sold
Remarks
Qty/amnt unit
Milking cow
Other cow Oxen Heifer Bull Calf Ewe Ram Lamb Does Buck Kid/goats Horse Mule Donkey Chicken (all)
Ducks Pigs/Piglets Butter Milk Meat (all types)

Eggs Hides & Skins
Honey Wax Animal dung
5. Other sources of income in 2007? Source Who
earned Which month
Quantity/amount
unit Price/unit
Income (shilling)
Hired out labour Hired out oxen Employment Rented out land Migrant income Remittance Food for work Food aid Sale of handicrafts
Sale of beverages
Sale of firewood Sale of grass Other petty trade Other business Gifts/assistance Transportation Provision services
Other (specify) ………………..

………………. 6. Household consumption expenditures in 2007? Item/commodity Qty own
production Unit Qty
purchasedUnit Price/unitc Cash
expenditureValue of own production
Seed Fertilizer-DAP Fertilizer-urea Chemicals Animal feed Animal medicine Animal salt Tools/equipment Hired in oxen Hired in labour Animals bought Food items Clothing & shoes Household goods Health/medicine School fees Travel expense Land/income tax Ceremonies Other (specify) c For single items only 7. Increased prices and farmer perceptions
7.1. For which crop did you receive highest per unit price last year (2007)?
_______________________

7.2. What did you do with the money gained from the price increase?
_______________________________________________________
_______________________________________________________
_______________________________________________________
7.3. Did you support any relative/family member or a friend residing in towns?
7.3.1. If yes, how?
a) Gave food crops: ______ bags of _____ (crop type)
b) Gave some money from my income: ______Shilling
c) Bought clothes for children: spent _______Shilling
d) Other (mention) ____________________________________
7.4. Did you make any changes in your cropping pattern and input use for 2008 due to last year’s
Higher prices? Yes ______ No ________
7.4.1. If no, why not? __________________________________________________
7.4.2. If yes, what changes did you make?
a) Allocated more land for ________________ crop
b) Used more fertilizer and improved seed: __________
c) Bought improved breed of dairy cow: __________
d) Rented in more land: ________ hectare
e) Other (mention): ________________________________________________
7.5. Do you think the price increase will continue in the future? Yes_____ No ______
7.5.1. If yes, what is your future plan related to this? _______________________________
7.5.2. If no, why do you think so? ____________________________________________
7.6. Did prices for livestock and livestock products also increase last year? Yes __ No __

7.7. Do you think prices for consumer goods and farm tools have also increased or are the same as before?
____________________________________
7.7.1. If you think prices for items you buy have also increased, how do you compare this with the in price increase of your produce?
_________________________________________________
7.8. Did you harvest any crop this year (2008) ? Yes_____ Not yet ______
7.8.1. If yes, a) crop type: ________ ____________ ______________
b) Did you sell some of the harvest?
c) if yes to b, crop type ______________ unit price_______
crop type ____________ unit price_______
7.9. Do you have any thing else to tell us about the price increase and its effect on you life?
_________________________________________________________________
__________________________________________________________________
Thank you for your cooperation!
Consumers’ questionnaires

Food Prices Study Dodoma and Ruvuma
(Consumers Questionnaire) 1.0 Basic data 1.1 Date form filled (mm/dd/yyyy)
1.2 Name/ No. of RA1
Dodoma Ruvuma 1.3 Form filled at:
Area in Dodoma 1 __________________________ 2 __________________________ 3 __________________________
Area in Ruvuma 1
_______________________ 2
_______________________ 3
_______________________ 1.4 Name of the village/town________________________________
1.5 Name of the ward / Location ________________________
1.6 Name of interviewee 1.7 Household ID number

2.0 Cereal food consumption Do you consume cereal foods? 1=no 2=yes How often do you consume cereal in the rainy season?
1 never 2 One per week 3 Every day one per day 4 Every day twice per day 5 Every day three times per day 6 Every day More than for times per day
How often do you consume cereals in the dry season?
1 never 2 One per week 3 Every day one per day 4 Every day twice per day 5 Every day three times per day 6 Every day More than for times per day
3.0 Which crops do you consume most? WET SEASON
CROP
Consume regularly?
1=no 2=yes
If YES, Why? 1=taste 2=price 3=availability
4=improves health 5=tradition 6=other
If NO, Why? 1=taste 2=price 3=availability
4=pesticides5=don’t know it
6=other
Buy?
1=no 2=yes
Produce
1=no 2=yes
Rank
HH 1-5 (1=most)
Maize Soya beans Rice Pigeon peas Cowpea Sweet potato Irish potato Yam Simsim Coffee

Onions Pepper Wheat Leafy Vegetable Pearl millets Papaya Avocado Guava Banana Mango Tomato Barley Sorghum Finger millet Common bean Chick pea Bambara nuts Cassava Groundnuts Sunflower Okra Egg plants Chick peas Other …………………..

4.0 During the dry season, which vegetables do you consume? DRY SEASON
Crop Consume regularly?
1=no 2=yes
If YES, Why? 1=taste 2=price 3=availability
4=improves health 5=tradition 6=other
If NO, Why? 1=taste 2=price 3=availability
4=pesticides5=don’t know it
6=other
Buy?
1=no 2=yes
Produce
1=no 2=yes
Rank
HH 1-5 (1=most)
Maize Soya beans Rice Pigeon peas Cowpea Sweet potato Irish potato Yam Simsim Coffee Onions Pepper Wheat Leafy Vegetable Pearl millets Papaya Avocado Guava Banana Mango Tomato Sorghum Finger millet Common bean Chick pea Bambara nuts

Cassava Cotton Groundnuts Sunflower Okra Egg plants Chick peas Other …………………

6.0 Factors Influen
cing Maize Buying Decision
5.0 Which traditional/non cultivated crops do you still consume in this area CROP? Comments: Intensity of consumption now and
before 1. 2. 3. 4. 5. 6. 7. 8.
6.1 Which of the following criteria influence your decision t o buy maize. Please rate on extremely important (5) and don’t know (6)
Not
A li
ttle
Impo
rtant
Ver
y
Extre
mel
y Im
porta
nt
Don
’t K
now
Please describe the preferred attribute of each trait 1 2 3 4 5 6
Form 1- grain, 2 – Dehulled, 3- unga, 4- Roasted maize,
Origin of products 1. Local 2- From another region within country 3- Imported
Presentation 1. Sisal/viroba bags 2- Cooked 3- Loose
Point of sale 1- Supermarket 2- Grocery 3- Local market 4-streets
Others ( Specify) 6.2 Considering all the traits that are important for you, what is the maximum price that you are
willing to pay for a Kg./ of Maize today, if it had all the qualities that you are looking for? Tanzania = ____Tshs.
6.3 What was the highest price in 2008 …………..; 2007 ………….; 2006 …………. (Tshs)

7.0 Factors Influencing Rice Buying Decision
7.1 Which of the following criteria influence your decision t o buy Rice. Please rate on extremely important (5) and don’t know (6)
Not
A li
ttle
Impo
rtant
Ver
y
Extre
mel
y Im
porta
nt
Don
’t K
now
Please describe the preferred attribute of each trait 1 2 3 4 5 6
Color 1- Light Grey, 2 – white, 3- Darkish , 4- Brownish, 5.- Others
Size 1- Narrow, 2- Broken & whole mixed 3- thick (kitumbo)
Thickness of stem 1- Thin 2- Average 3- Thick Origin of products 1. Local 2- From another region
within country 3- Imported Presentation 1. Rice already packed 2- Rice
loose 3- Cooked 4- Paddy Point of sale 1- Supermarket 2- Grocery 3-
Local market 4-streets Others ( Specify)
7.2 Considering all the traits that are important for you, what is the maximum price that you are
willing to pay for a Kg./ of Rice today, if it had all the qualities that you are looking for? Tanzania = ____Tshs.
7.3 What was the highest price in 2008 …………..; 2007 ………….; 2006 …………. (Tshs) Factors Influencing Buying Decision
8.0 Which of the following criteria influence your decision t o buy Sorghum. Please rate on extremely important (5) and don’t know (6)
Not
A li
ttle
Impo
rtant
Ver
y
Extre
mel
y Im
porta
nt
Don
’t K
now
Please describe the preferred attribute of each trait 1 2 3 4 5 6
Color 1- while 2 – brownish, 3- Darkish, 4- Red, 6- Variegated

leaf color Freshness 1- Recently harvested 2- Three
months after harvested 3- More than three after harvest
Origin of products 1. Local 2- From another region within country 3- Imported
Presentation 1. Sorghum already packed 2- Sorghum loose 3- Cooked 4- Sorghum dehulled, 5:- Flour
Point of sale 1- Supermarket 2- Grocery 3- Local market 4-streets
Others ( Specify)
8.1 Considering all the traits that are important for you, what is the maximum price that you are
willing to pay for a Kg./ of Sorghum today, if it had all the qualities that you are looking for? Tanzania = ____Tshs.
8.2 What was the highest price in 2008 …………..; 2007 ………….; 2006 …………. (Tshs) Factors Influencing Buying Decision
9.0 Factors Influencing Buying Decision of round potato
9.1 Which of the following criteria influence your decision t o buy round potato. Please rate on extremely important (5) and don’t know (6)
Not
A li
ttle
Impo
rtant
Ver
y
Extre
mel
y Im
porta
nt
Don
’t K
now
Please describe the preferred attribute of each trait 1 2 3 4 5 6
Color 1- white, 2 – Greenish, 3- Reddish 3- Purple
Freshness 1- Recently harvested 2- Tthree months after harvested 3- More than three after harvest
Form of tuber 1- Round 2- Oval 3- Long Size of tuber 1- Small 2- Average 3- Big Origin of products 1- From another region within
country 2- Imported Presentation 1. Sisal thread 2- Banana fibre
thread 3- Loose Point of sale 1- Supermarket 2- Grocery 3- Local

market 4-streets Presence of seeds 1- No 2- Yes Others ( Specify)
9.2 Considering all the traits that are important for you, what is the maximum price that you are
willing to pay for a Kg./ of Potato today, if it had all the qualities that you are looking for? Tanzania = ____Tshs.
9.3 What was the highest price in 2008 …………..; 2007 ………….; 2006 …………. (Tshs) 10.0 What is the general comment main food prices in your local markets
………………………………………………………………………………………………………………………………………………………………………………………………………….………………………………
Thank You Very Much for your Cooperation
A.3 Key informants checklist