Role of University Education in Poverty Alleviation in Pakistan
Upload
khangminh22Category
view
0download
0
The Role of Small Businesses
in Poverty Alleviation:
The Case of Dar es Salaam, Tanzania
Raymond Mnenwa &
Emmanuel Maliti
Research on Poverty Alleviation, REPOA, is an independent, non-profit organisation concerned with poverty and related policy issues in Tanzania. REPOA undertakes and facilitates research, enables monitoring, and promotes capacity building, dialogue and knowledge sharing.
REPOA’s research agenda is concerned with poverty and its alleviation. Our objectives are to: - develop the research capacity in Tanzania; - enhance stakeholders’ knowledge of poverty issues
and empower them to act; - contribute to policy dialogue; - support the monitoring of the implementation of
poverty related policy;- strengthen national and international poverty
research networks, and- forge linkages between research(ers) and users.
It is our conviction that research provides the means for the acquisition of knowledge necessary for improving the quality of welfare in Tanzanian society.
REPOA’s Research Reports contain the results of research financed by REPOA. Our Special Papers contain the findings of commissioned studies conducted under our programmes of research, training and capacity building. The authors of these research reports and special papers are entitled to use their material in other publications; with acknowledgement to REPOA.
REPOA has published the results from this research as part of our mandate to disseminate information. Any views expressed are those of the authors alone and should not be attributed to REPOA.
Research on Poverty Alleviation (REPOA)P.O. Box 33223, Dar es Salaam, Tanzania 157 Mgombani Street, Regent EstateTel: +255(0)(22) 270 00 83 / 277 2556Fax: +255(0)(22) 277 57 38Email: [email protected]: www.repoa.or.tz
ISBN: 978 - 9987 - 615 - 25 - 4 REPOA
978 - 9987 - 08 - 005 - 2 Mkuki na Nyota
RESEARCH ON POVERTY ALLEVIATION
Research Report No. 08.2
R
E S E A R C H O N P O V E R T Y
A L L E V I A T I O N
R
E S E A R C H O N P O V E R T Y
A L L E V I A T I O N

�
Literature Review
The Role of Small Businesses in Poverty Alleviation:
The Case of Dar es Salaam, Tanzania
Raymond Mnenwa&
Emmanuel Maliti
Research Report 08.2
Mkuk� na Nyota Publ�shersP. O. Box 4246,
Dar es Salaam, Tanzan�a

��
Publ�shed for: Research on Poverty Allev�at�on (REPOA)
P. O. Box 33223, Dar es Salaam, Tanzan�a
157 Mgomban� Street, Regent Estate
Tel: + 255(0)(22) 270 00 83 /277 2556
Fax: + 255(0)(22)277 57 38
Ema�l: [email protected]
Webs�te: www.repoa.or.tz
by: Mkuk� na Nyota Publ�shers
6 Muhonda St., M�ss�on Quarter, Kar�akoo
P. O. Box 4246, Dar es Salaam, Tanzan�a
Ema�l: ed�tor�al.uhar�r�@mkuk�nanyota.com
Webs�te: www.mkuk�nanyota.com
Suggested C�tat�on:
Mal�t�, Emmanuel and Raymond Mnenwa (2008). ’The Role of Small Bus�nesses �n Poverty Allev�at�on: The Case of Dar es Salaam, Tanzan�a’. Research Report 08.2, Dar es Salaam, REPOA.
Suggested Keywords:
Tanzan�a, small bus�ness, emerg�ng bus�ness, SME, SSE
© REPOA, 2008
ISBN: 978-9987-615-25-4 REPOA
978-9987-08-005-2 Mkuk� na Nyota
All r�ghts reserved. No part of th�s publ�cat�on may be reproduced or transm�tted �n any form or by any means w�thout the wr�tten perm�ss�on of the copyr�ght holder or publ�sher.

���
Literature Review
TABlE of ConTEnTS
L�st of Tables ............................................................................................................................................................................................... v
Abbrev�at�ons ...........................................................................................................................................................................................v�
Acknowledgements ...........................................................................................................................................................................v��
Abstract .....................................................................................................................................................................................................v���
Execut�ve Summary ............................................................................................................................................................................. �x
1. Introduction.....................................................................................................................................................1
1.1 The study .........................................................................................................................................................................11.2 L�m�tat�ons of the study ..........................................................................................................................................11.3 Organ�sat�on of the report ....................................................................................................................................1
2. LiteratureReview...........................................................................................................................................2
3. HypothesisandSignificanceoftheStudy............................................................................................4
3.1 Hypothes�s ......................................................................................................................................................................43.2 S�gn�ficance of the study .......................................................................................................................................4
4. ResearchMethodology................................................................................................................................5
4.1 Sampl�ng frame ...........................................................................................................................................................54.2 Data analys�s ..................................................................................................................................................................5
5. ContributionofSmallBusinessestoPovertyAlleviation.................................................................7
5.1 Source of d�sposable �ncome .............................................................................................................................75.2 Employment creat�on ..............................................................................................................................................85.3 Income generat�on for employees ............................................................................................................... 105.4 Profit marg�ns and profitab�l�ty trend .......................................................................................................... 105.5 Conclus�ons ................................................................................................................................................................. 12
6. Socio-economicFactorsInfluencingtheContributionofSmallBusinessestoPovertyAlleviation...................................................................................................................................... 14
6.1 Gender of small bus�ness owners ................................................................................................................. 146.2 Educat�on and tra�n�ng of bus�ness owners ........................................................................................... 156.3 Mot�vat�ons for start�ng small bus�nesses ................................................................................................ 166.4 Major sources of �n�t�al cap�tal ......................................................................................................................... 17
7. Socio-economicFactorsInfluencingEmploymentCreation....................................................... 19
7.1 Gender of bus�ness owners ............................................................................................................................... 197.2 Level of educat�on and tra�n�ng ..................................................................................................................... 207.3 Act�v�t�es of owners before start�ng the�r bus�ness ............................................................................ 227.4 Owners’ mot�vat�on for start�ng bus�ness ................................................................................................. 237.5 Technology .................................................................................................................................................................. 247.6 Conclus�on ................................................................................................................................................................... 25

�v
8. LevelofFormality,ProfitMarginsandEmploymentLevels......................................................... 26
8.1 Attr�butes of bus�ness formal�ty...................................................................................................................... 268.2 Bus�ness reg�strat�on, profit marg�ns and employment creat�on .............................................. 278.3 Bus�ness l�cens�ng, profit marg�ns and employment creat�on .................................................... 288.4 Tax payments, profit marg�ns and employment creat�on .............................................................. 308.5 Conclus�on ................................................................................................................................................................... 31
9. EmergingPolicyConclusions.................................................................................................................. 32
10. SuggestedFurtherResearch................................................................................................................... 33
References................................................................................................................................................................ 34
PublicationsbyREPOA........................................................................................................................................ 36

v
Literature Review
list of Tables
Table 1: Rank�ng of sources of �ncome ................................................................................................................................7
Table 2: Number and percentage of respondents w�th other occupat�ons ................................................8
Table 3: Respondents’ percept�ons of l�v�ng standard relat�ve to �ncome source ....................................8
Table 4: Average number of employees per enterpr�se and employment growth ................................9
Table 5: Monthly salar�es for small bus�nesses employees .................................................................................10
Table 6: Monthly profit marg�ns ..........................................................................................................................................11
Table 7: Percept�ons of bus�ness profitab�l�ty trend..................................................................................................12
Table 8: Profitab�l�ty trends relat�ve to employment growth ..............................................................................12
Table 9: Percept�ons of bus�ness performance by gender ...................................................................................14
Table 10: Educat�on levels of small bus�ness owners .................................................................................................15
Table 11: Durat�on of tra�n�ng completed by owners w�th educat�on above secondary level and average monthly profits of the�r bus�nesses ........................................................................16
Table 12: Mot�vat�ons of owners for establ�sh�ng the�r bus�nesses compared w�th monthly average profits ........................................................................................................................................16
Table 13: Sources of �n�t�al cap�tal ...........................................................................................................................................17
Table 14: Sources of �n�t�al cap�tal and profitab�l�ty trend .......................................................................................18
Table 15: Employment levels for bus�nesses by gender of owners ...................................................................19
Table 16: Employment growth by gender of owners ................................................................................................20
Table 17: Compar�son of owners’ level of educat�on and bus�ness employment levels ......................21
Table 18: Compar�son of owners’ level of educat�on and bus�ness employment growth ..................21
Table 19: Compar�son of durat�on of owners’ tra�n�ng and bus�ness employment growth ..............22
Table 20: Compar�son of pr�or act�v�t�es of bus�ness owners and employment levels .........................22
Table 21: Compar�son of pr�or exper�ence of owners and employment growth .....................................23
Table 22: Compar�son of owners’ mot�vat�ons for establ�sh�ng bus�ness and employment levels ....................................................................................................................................................................................23
Table 23: Compar�son of owners’ mot�vat�ons for establ�sh�ng bus�ness and employment growth ..............................................................................................................................................................................24
Table 24: Compar�son of bus�ness technology and employment levels .......................................................24
Table 25: Attr�butes of formal�ty - bus�ness reg�strat�on, l�cence and tax payment ................................26
Table 26: Unreg�stered and reg�stered bus�nesses and the�r average monthly profits .........................27
Table 27: Reg�stered bus�ness owners’ op�n�on on reg�strat�on process & cost .........................................27
Table 28: Compar�son of bus�ness reg�strat�on and employment growth ...................................................28
Table 29: Unl�censed and l�censed bus�nesses and the�r average profits......................................................29
Table 30: Owners’ att�tudes towards l�cens�ng costs ..................................................................................................29
Table 31: L�censed and unl�censed bus�nesses and employment growth ...................................................29
Table 32: Bus�nesses that pa�d and d�d not pay tax and the�r profits ...............................................................30
Table 33: Compar�son of bus�ness’s tax pay�ng status and employment growth ...................................30
Table 34: Percept�ons of respondents on tax rates and tax concept ...............................................................31

v�
Abbreviations
CTI Confederat�on of Tanzan�a Industr�es
GDP Gross Domest�c Product
ILO Internat�onal Labour Organ�sat�on
ILFS Integrated Labour Force Survey
MEs M�cro-Enterpr�ses
OLS Ord�nary Least Squares Method
2SLS Two-Stage Least Squares Method
SSEs Small-Scale Enterpr�ses
SMEs Small and Med�um Enterpr�ses
TShs Tanzan�an Sh�ll�ngs
UNDP Un�ted Nat�ons Development Programme

v��
Literature Review
ACknowlEDgEMEnTS
Th�s study represents the jo�nt efforts of the authors �nvolved. We are �ndebted to REPOA, not only for the financ�al support to undertake the study but also for the useful comments wh�ch pol�shed up the study. We also apprec�ate for the cooperat�on granted to us by the small bus�ness owners �nvolved �n th�s study.

v���
ABSTRACT
By us�ng a sample of 225 manufactur�ng small bus�nesses employ�ng between one and ten employees, th�s study �nvest�gates whether the profits, salar�es and jobs created by small bus�nesses contr�bute to poverty allev�at�on.
The data gathered supports the hypothes�s that small bus�nesses do contr�bute to allev�at�ng poverty. Results show that average �ncomes generated by surveyed bus�nesses (both profit marg�ns and salar�es) were above the bas�c and food poverty l�nes, much more for small-scale enterpr�ses than m�cro-enterpr�ses.
Bus�ness performance �n terms of profit generat�on and employment creat�on was also pos�t�vely related to the s�ze of the firm, suggest�ng that strateg�es wh�ch promote vert�cal growth are more favourable than those wh�ch promote hor�zontal growth.
Moreover, soc�o-econom�c factors were found to pos�t�vely �nfluence profit marg�ns and employment creat�on. These factors �ncluded the bus�ness owners’ gender, level of educat�on, mot�vat�ons for establ�sh�ng the�r bus�nesses, sources of �n�t�al cap�tal, and the technology used. F�nally, find�ngs �nd�cated that the potent�al to generate profit l�es mostly w�th formal firms compared w�th �nformalthe potent�al to generate profit l�es mostly w�th formal firms compared w�th �nformal enterpr�ses.
Suggested keywords: Tanzan�a, small bus�ness, emerg�ng bus�ness, SME, SSE

�x
Literature Review
ExECuTivE SuMMARy
introduction
The role of small bus�ness �n poverty allev�at�on and econom�c growth has emerged as an �mportant top�c not only for pol�cy makers but also for academ�c research. The �mportance of small bus�ness ar�ses �n v�ew of the d�smal performance of prev�ous pol�c�es that emphas�zed large-scale �ndustr�al�zat�on. Desp�te confl�ct�ng ev�dence obta�ned �n several stud�es, �t �s generally agreed that encourag�ng the development of small bus�nesses �s one way of foster�ng growth and allev�at�ng poverty. Th�s debate has prompted the authors to �nvest�gate the role of small bus�nesses �n poverty allev�at�on focus�ng on the Dar es Salaam reg�on.
literature Review
The exam�nat�on of the relat�onsh�p between small bus�ness, econom�c growth and poverty allev�at�on �s an expand�ng field of research. Several stud�es have supported the role of small bus�nesses �n econom�c growth, job creat�on and poverty allev�at�on. Such stud�es �nclude one by Gebremar�am et al (2004) wh�ch demonstrated a pos�t�ve relat�onsh�p between small bus�ness and econom�c growth; and B�rch (1979) who found that 80% of the jobs created between 1969 and 1976 �n the US resulted from the act�v�t�es of small bus�nesses. In Tanzan�a, Small and Med�um Enterpr�ses (SMEs) were est�mated to account for a s�gn�ficant share of GDP – up to 35% and employ about 20% of the labour force1.
Stud�es such as B�ggsB�ggs et al (1998), Lugalla (1995), and Musonda and Kweka (1998) have �nd�cated that have �nd�cated that factors such as educat�on, cap�tal etc have an �nfluent�al role on firm performance. Unfortunately,Unfortunately, some of these analyses d�d not assess how these determ�nants of firm growth affect the contr�but�on of small bus�nesses to poverty allev�at�on. Some researchers have generated results that small bus�nesses do not have a pos�t�ve role �n growth and poverty allev�at�on, and so further �nvest�gat�on �s necessary2.
The Survey
The survey was conducted �n Dar es Salaam �n October 2004 to establ�sh the l�nk between small bus�nesses and poverty allev�at�on. Three areas were covered:
�) The role of small bus�nesses �n poverty allev�at�on us�ng four core var�ables: namely, sources of d�sposable �ncome, profit marg�ns, salar�es and employment creat�on;
��) The soc�o-factors �nfluenc�ng profit and employment creat�on, and
���) The �mpact of bus�ness formal�ty on profit marg�ns and employment growth.
Dur�ng the survey 225 respondents were �nterv�ewed us�ng a sem� structured quest�onna�re.
1 Wangwe, 19992 Beck et al., 2003 and Dav�s et al., 1993

x
RESulTS AnD AnAlySiS
Contribution of Small Businesses to Poverty Alleviation
Source of Disposable Income: A major�ty of the small bus�ness (87%) ranked small bus�nesses as the�r top source of �ncome out of wh�ch 84% were owners of M�cro-Enterpr�ses (MEs) and 94% were �n Small-Scale Enterpr�ses (SSEs). Furthermore, a major�ty of the respondents (60%), ranked �ncome from small bus�ness as the�r number one source, �nd�cated at the same t�me, an �mprovement �n the�r standard of l�v�ng wh�le only 29% of them exper�enced a decl�n�ng l�v�ng standard.
Employment Creation: Employment growth occurred w�th�n SSEs �.e. three employees per SSE over an average per�od of 6 years, wh�le MEs d�d not �ncrease the�r employment levels; g�v�ng an overall annual employment growth of 4.2%. Although th�s proves that the b�gger the firm, the h�gher the potent�al for expand�ng employment; the percentage of firms w�th decl�n�ng or stat�c employment was h�gher than the percentage of firms that �ncreased the�r employment levels. W�th�n the per�od of s�x years, only 14.8% of the firms wh�ch started as MEs managed to graduate to SSE, further �nd�cat�ng the l�m�ted potent�al of small bus�ness to �ncrease employment.
Salaries, Profit Margins and Profitability Trend: Analys�s shows that salary levels and profits var�ed w�th the s�ze of enterpr�ses. SSEs offered h�gher monthly salary levels compared to MEs. For both MEs and SSEs, salar�es earned were well above both the bas�c need and food poverty l�nes. Moreover, SSEs generated more profits compared to MEs. Regard�ng profitab�l�ty trends, the major�ty of smallRegard�ng profitab�l�ty trends, the major�ty of smallmajor�ty of small bus�nesses were less l�kely to atta�n grow�ng profitab�l�ty as 56% �nd�cated e�ther decl�n�ng profitab�l�ty or stat�c profits. In th�s case, the potent�al for small bus�nesses to allev�ate poverty appear to be further l�m�ted by the lack of overall �mprovement �n profitab�l�ty.
Socio-economic factors influencing the Contribution of Small Businesses to Poverty Alleviation
Gender: The results show that male-owned enterpr�ses possess h�gher potent�al for profit generat�on compared to female-owned bus�nesses. S�m�larly a large proport�on of the male-owned firms had �ncreased employment levels compared to the proport�on of female-owned firms. Although a major�ty of both men and women had not completed educat�on above secondary level, the results show that more male entrepreneurs (13%) had acqu�red cert�ficates, d�plomas or un�vers�ty degrees, compared to female entrepreneurs (6%).
Education: Entrepreneurs educated above secondary school generated more profit than those w�th lesser educat�on. Th�s �s the same w�th those entrepreneurs tra�ned for more than one year when compared to those w�th less than a year of tra�n�ng. Regard�ng growth �n employment, the major�ty of entrepreneurs w�th h�gher than secondary educat�on �ncreased the�r employment. Thus, although part�c�pat�on �n tra�n�ng programmes was not a necessary cond�t�on to employment growth; a longer durat�on of tra�n�ng appeared to have contr�buted to employment growth.
Motivations: The study shows that wh�le most of the small bus�nesses were mot�vated by push factors, firms mot�vated by pull factors demonstrated more potent�al to generate h�gher profits. For the case of employment levels and growth, push factors were dom�nant among owners of MEs, wh�le two-fifths of the SSEs owners were �nfluenced by pull factors. At the same t�me major�ty of firms establ�shed out of pull factors exper�ence employment growth contrary to the major�ty of push factor firms wh�ch e�ther d�d not reg�ster employment growth or decl�ned over t�me.

x�
Literature Review
Sources of Initial Capital: Bus�nesses wh�ch sourced cap�tal from personal sav�ngs as well as profits from other bus�nesses generated h�gher profits than bus�nesses wh�ch accessed cap�tal from other sources. Almost all of the bus�nesses surveyed (96.6%) sourced cap�tal from personal or fam�ly sav�ngs, loans from fr�ends, or profits from other bus�nesses. Only 2% of the firms had access to formal financ�al �nst�tut�ons show�ng the need to address those factors wh�ch l�m�t access to formal financ�al sources.
Activities of Owners Before Starting Their Businesses: The study shows the ex�stence of a strong level of entrepreneursh�p among SSE owners. Owners of MEs were relat�vely more l�kely to have been unemployed pr�or to the�r current bus�nesses compared to SSE owners. The major�ty of the firms w�th owners possess�ng pr�or bus�ness exper�ence managed to �ncrease the�r employment levels. However, be�ng employed, unemployed or attend�ng school�ng pr�or to the current bus�ness d�d not contr�bute to the �ncrease �n employment levels.
formality, Profit Margins and Employment levels
The study ut�l�zed three attr�butes of formal�ty – bus�ness reg�strat�on, l�cens�ng and tax payments to establ�sh the �mpact of formal�ty on profit marg�ns and employment creat�on. Most of small bus�nesses were w�th�n the marg�n between formal and �nformal sectors. Wh�le 31% of the respondent MEs had v�rtually none of the formal�ty attr�butes, only 13% of the SSEs d�d not possess any of the attr�butes of formal�ty.
Business Registration, Profit Margins and Employment Creation: A major�ty of firms generated profits whether reg�stered or not. However, the percentage of reg�stered enterpr�ses wh�ch generated profit and exper�enced employment growth was h�gher than the percentage of unreg�stered enterpr�ses. Furthermore, a large percentage of unreg�stered firms had not grown or have decl�ned over t�me compared to reg�stered firms.
Business Licensing, Profit Margins and Employment Creation: Most enterpr�ses generated profit whether l�censed or not. However, the percentage of l�censed firms that generated profit was h�gher than the percentage of unl�censed firms. In terms of employment growth, a major�ty of the l�censed firms reg�stered growth wh�le a large percentage of unl�censed firms had not grown or had decl�ned over t�me compared to l�censed firms.
Tax Payments, Profit Margins and Employment Creation: S�m�lar to the cases above, most of the enterpr�ses generated profit whether they pa�d tax or not. However, the percentage of tax-pay�ng enterpr�ses generat�ng profit was marg�nally h�gher than the percentage of those wh�ch d�d not pay taxes. As for the reg�strat�on and l�cens�ng categor�es, s�m�lar results were found when taxat�on was l�nked to employment growth.
Overall, the study shows that the potent�al to generate h�gher profit l�es mostly w�th formal firms compared to �nformal enterpr�ses. However, further find�ngs �nd�cated that although formal�ty m�ght have an �nfluence on profit generat�on and employment growth, �t was not capable by �tself to enable small bus�nesses to �ncrease the�r performance.
Emerging Policy Conclusions
Although many SMEs have been establ�shed over the last two decades, poverty has cont�nued to be a major character�st�c of many people �n the country. Th�s ra�ses the quest�on of whether SMEs play any role �n poverty allev�at�on. Is the creat�on of surv�val�st enterpr�ses an effect�ve poverty

x��
allev�at�on strategy? Th�s study shows that major�ty of small bus�nesses earned l�ttle and the�r �mpact on employment growth �s l�m�ted.
As Broembsen, 2003 �nd�cated g�ven the character�st�cs of the market �n wh�ch MEs operate, �.e., low �ncome, low value-added act�v�t�es, fierce compet�t�on and over-trad�ng, a del�berate strategy to repl�cate these k�nds of bus�nesses s�mply threatens ex�st�ng bus�nesses and results �n �nsecur�ty for ex�st�ng entrepreneurs. Th�s study shows that bus�ness performance �n terms of profit generat�on and employment creat�on �s pos�t�vely related to the s�ze of the firm, suggest�ng that strateg�es that promote vert�cal growth are more favourable than those promot�ng hor�zontal growth.

1
Literature Review
1. inTRoDuCTion
1.1 The Study
The role of small bus�ness �n poverty allev�at�on, econom�c growth and job creat�on has emerged as an �mportant top�c not only for pol�cy makers but also for academ�c research. The �mportance of small bus�ness ar�ses �n v�ew of the d�smal performance of prev�ous pol�c�es that emphas�zed large-scale �ndustr�al�zat�on. Recent econom�c reforms have also created opportun�t�es for the fledgl�ng small bus�nesses, and thus generated �nterest �n small bus�ness research �n�t�at�ves. It �s generally agreed that encourag�ng the development of small bus�nesses �s an effect�ve way of foster�ng growth and allev�at�ng poverty, desp�te confl�ct�ng ev�dence obta�ned �n several stud�es. Th�s debate has prompted the authors to �nvest�gate the role of small bus�nesses �n poverty allev�at�on �n Dar es Salaam, Tanzan�a.
The study adopted three major approaches:
1. F�rstly, to gauge the d�rect role of small bus�nesses �n poverty allev�at�on, the follow�ng major var�ables were analyzed: 1) sources of d�sposable �ncome (rank�ng); 2) profit marg�ns, remunerat�on to employees, and profitab�l�ty trends; and, 3) employment creat�on.
2. Secondly, cr�t�cal soc�o-econom�c factors �nfluenc�ng the contr�but�on of small bus�nesses (�n terms of profits and employment levels) to poverty allev�at�on were assessed.
3. Th�rdly, small bus�ness formal�ty was �nvest�gated by exam�n�ng bus�ness reg�strat�on, l�cens�ng and taxat�on, and how these factors �nfluenced employment levels and profit marg�ns. The prem�se was that h�gher levels of profitab�l�ty and growth were poss�ble for formal firms, wh�ch operated at h�gher levels of r�sk than �nformal firms.
1.2 limitations of the Study
Though the find�ngs and conclus�ons are not affected, �t �s �mportant to h�ghl�ght some l�m�tat�ons of th�s study. F�rst, the survey was only conducted �n the Dar es Salaam reg�on hence, �t does not exam�ne reg�onal var�at�ons �n Tanzan�a. Secondly, as w�th most surveys, the study only captured the c�rcumstances preva�l�ng at the t�me of the �nterv�ews. Th�rdly, �t �s also poss�ble that some entrepreneurs d�d not prov�de the�r true op�n�ons dur�ng the �nterv�ews because they regarded some of the quest�ons as sens�t�ve. However, th�s group was small and we assume d�d not affect the overall results and conclus�ons.
1.3 organisation of the Report
The report �s organ�sed as follows. Chapter 2 rev�ews the relevant l�terature. Chapter 3 descr�bes the hypothes�s to be tested and the s�gn�ficance of the study, and chapter 4 presents the research methodology used. Chapters 5 to 7 present and d�scuss the results of the emp�r�cal analys�s, and chapter 8 explores the relat�onsh�p between bus�ness formal�ty, profit marg�ns and employment levels. Chapter 9 d�scusses whether small bus�ness pol�cy �n Tanzan�a �s based on ev�dence obta�ned from research. F�nally, chapter 10 makes suggest�ons for further research.

2
2. liTERATuRE REviEwliTERATuRE REviEw
The exam�nat�on of the relat�onsh�p between small bus�ness, econom�c growth and poverty allev�at�on �s an expand�ng field of research, frequently featur�ng �n development pol�cy stud�es. It �s generally agreed and well documented that small bus�nesses have a pos�t�ve role �n poverty allev�at�on. Small bus�nesses have long been regarded as cruc�al for the ach�evement of broader development object�ves, �nclud�ng poverty allev�at�on, econom�c development and the promot�on of more democrat�c and plural�st soc�et�es3. People on low �ncomes can augment the�r �ncomes by engag�ng �n small bus�ness act�v�t�es4. Small bus�ness ownersh�p can also fac�l�tate greater self-determ�nat�on and empowerment of poor people as a consequence of own�ng and controll�ng resources.
Several stud�es have supported the role of small bus�nesses �n econom�c growth, job creat�on and poverty allev�at�on. Us�ng both OLS and 2 SLS regress�on analys�s, Gebremar�am et al (2004) demonstrated a pos�t�ve relat�onsh�p between small bus�ness and econom�c growth. Furthermore, they found that a strong relat�onsh�p also ex�sted between the �nc�dence of poverty, small bus�ness and econom�c growth. Relat�ve to job creat�on, B�rch (1979) found that 80% of the jobs created between 1969 and 1976 �n the US resulted from the act�v�t�es of small bus�nesses, and �t was est�mated that Small and Med�um Enterpr�ses (SMEs) employed 22% of the adult populat�on �n develop�ng countr�es5. In Tanzan�a, SMEs were est�mated to account for a s�gn�ficant share of Gross Domest�c Product (GDP) – up to 35% – and to employ about 20% of the labour force6. These results mostly lead to the conclus�on that, by creat�ng jobs, small bus�nesses play a cr�t�cal role �n poverty allev�at�on.
B�ggs et al (1998) evaluated how determ�nants, such as educat�on and cap�tal, contr�buted to firm performance. They found that firm growth was greater when the manager or owner of the firm had completed secondary educat�on or un�vers�ty, and �t was even h�gher when the owner had some techn�cal educat�on. In Tanzan�a, several stud�es focus�ng on SMEs, such as Lugalla (1995), and Musonda and Kweka (1998), have assessed the effects of several determ�nants on firm growth such as the level of educat�on of entrepreneurs, cap�tal factors etc. However, the analys�s d�d not assess how these determ�nants of firm growth affect the contr�but�on of small bus�nesses to poverty allev�at�on.
In relat�on to the pol�cy env�ronment �n Tanzan�a, several stud�es7 have exam�ned taxes and bus�nesshave exam�ned taxes and bus�ness l�cens�ng �ssues and how they act as constra�nts to successful bus�ness growth and operat�ons. However, these stud�es were l�m�ted �n terms of �nvest�gat�ng how these pol�cy factors �nfluence the contr�but�on of small bus�nesses to poverty allev�at�on.
Some researchers have also generated results that small bus�nesses do not have a pos�t�ve role �n growth and poverty allev�at�on, and so further �nvest�gat�on �s necessary. Us�ng the newly-bu�lt cross-country database on SMEs, Beck et al (2003) found that, wh�le SMEs were a character�st�c of fast-grow�ng econom�es, cross-country analyses d�d not support the v�ew that SMEs exerted a causal �mpact on long-run growth. A s�gn�ficant relat�onsh�p between SMEs and poverty allev�at�on d�d not ex�st. Spec�fically, they found that the s�ze of the SME sector was not assoc�ated w�th the �ncome levels and growth of the poorest qu�nt�le of soc�ety, the percentage of the populat�on l�v�ng below the poverty l�ne, or the poverty gap.
The relat�onsh�p between small bus�nesses and poverty allev�at�on and job creat�on has also been
3 UNDP, 19984 Sull�van, P., 19975 F�sseha & McPherson, 1991; F�sseha, 1992; Dan�els & Ngw�ra, 19936 Wangwe, 19997 Bhalla, 1991; CTI, 2000; Sw�ssContact, 2003; World Bank, 2004

3
Literature Review
quest�oned. Dav�s et al (1993) demonstrated that wh�le the gross rate of job creat�on and loss of jobs was h�gher �n small firms, there was no systemat�c relat�onsh�p between net job creat�on and firm s�ze. Hallberg, K (2001) also d�sputes the argument that SMEs are �mportant for employment growth, �nd�cat�ng that apart from the fact that small bus�nesses exh�b�t h�gh b�rthrates and h�gh death rates, �n some countr�es (both developed and develop�ng), net job creat�on rates (gross job creat�on less gross job destruct�on) do not exh�b�t a systemat�c relat�onsh�p to firm s�ze. In sub-Saharan Afr�ca, B�ggs and Shah (1998) found that large firms were the dom�nant source of net job creat�on �n the manufactur�ng sector.

4
3. �yPoT�ESiS AnD SignifiCAnCE of T�E STuDy�yPoT�ESiS AnD SignifiCAnCE of T�E STuDy
3.1 �ypothesis
The follow�ng are the major hypotheses to be tested:
Small bus�nesses play a s�gn�ficant role �n poverty allev�at�on;
Soc�o-econom�c factors �nfluence the contr�but�on of small bus�nesses to poverty allev�at�on; and
Bus�ness formal�ty �nfluences the contr�but�on of small bus�nesses on poverty allev�at�on.
3.2 Significance of the Study
Although relevant l�terature �s full of references to small bus�ness, the problem of the poor performance of small bus�nesses ra�ses the quest�on whether the role and dynam�cs of small bus�nesses �n poverty allev�at�on are fully understood by entrepreneurs and pol�cy makers. Most stud�es, such as Musonda and Lwoga, (1997) and Wangwe, (1999), have tended to focus on general �ssues, such as constra�nts and the �nst�tut�onal and pol�cy frameworks, w�thout exam�n�ng the l�nk between small bus�ness and poverty allev�at�on. A s�gn�ficant part of th�s l�terature only analysed constra�nts (both at the enterpr�se level and macro-level) that face small and med�um enterpr�ses �n Tanzan�a, and assumed that any small bus�ness act�v�ty contr�buted to poverty allev�at�on. Thus, the current study undertakes to establ�sh the l�nk between small bus�nesses and poverty allev�at�on. Furthermore, prev�ous researches on small bus�nesses stud�ed SMEs together, and, therefore, the d�rect contr�but�on of SMEs employ�ng less than 10 persons on poverty allev�at�on was not separately �dent�fied.
•
•
•

5
Literature Review
4. RESEARC� MET�oDology
Th�s research cons�ders the contr�but�on of small bus�nesses to poverty allev�at�on as a mult�-faceted phenomenon. Consequently, the survey gathers data on a range of var�ables related to:
1) the role of small bus�nesses �n poverty allev�at�on;
2) soc�o-econom�c factors; and,
3) bus�ness formal�ty.
4.1 Sampling frame
Pr�mary data were generated from a cross-sect�onal survey of small bus�ness firms. One round of �nterv�ews was conducted. The sampl�ng frame for the survey cons�sted of firms employ�ng less than ten people. Extens�ve �nterv�ews w�th the small bus�nesses were conducted us�ng a survey quest�onna�re cover�ng both soc�o-econom�c and bus�ness �nformat�on data. Only the bus�ness owners were �nterv�ewed.
Ident�ficat�on of the firms �ncluded �n the sampl�ng frame was done us�ng del�berate systemat�c select�on based on two cr�ter�a. F�rst, the firm had to be �n the manufactur�ng sector, and secondly �t had to employ between one and ten employees, �nclud�ng the owner �f he/she was act�vely �nvolved �n the bus�ness. Follow�ng Parker R. L (1995), the bus�ness firms were strat�fied accord�ng to type �.e. m�cro-enterpr�ses8 (MEs) and small scale enterpr�ses9 (SSEs). From each stratum, firms were randomly sampled �.e. 162 MEs and 63 SSEs.
Thus the total sample covered 225 small bus�nesses �n the three d�str�cts of Dar es Salaam: Temeke (34 bus�nesses), K�nondon� (129 bus�nesses) and Ilala (62 bus�nesses). The analyt�cal methods used �n the study w�ll now be br�efly descr�bed.
4.2 Data Analysis
Analysis of the Role of Small Businesses in Poverty Alleviation
The role of small bus�nesses �n poverty allev�at�on was the pr�mary theme of the research, and was analyzed us�ng descr�pt�ve stat�st�cs (means and percentages). Results generated were used to reject or accept the first hypothes�s. Four core var�ables were covered �n th�s analys�s:
�) Entrepreneurs’ sources of d�sposable �ncome (ranked accord�ng to �mportance).
��) Income generat�on �n terms of profit marg�ns. Respondents were asked to est�mate the�r monthly revenues and costs, from wh�ch the�r profit marg�ns were calculated. The gu�d�ng pr�nc�ple for th�s part of the analys�s was the level of �ncome that was perce�ved by respondents to be poverty reduc�ng.
���) Income generat�on �n terms of salar�es and wages for employees. The same pr�nc�ple regard�ng the level of �ncome was appl�ed here.
�v) Employment creat�on. The data were tabulated and analyzed us�ng means and percentages.
8 ‘MEs’ refers to small bus�nesses employ�ng 1 to 5 employees.9 ‘SSEs’ refers to small bus�nesses employ�ng 6 to 10 employees.

6
Analysis of the Factors Influencing Profit and Employment Creation10
In add�t�on to the analys�s of sources of d�sposable �ncome, profit marg�ns, employment creat�on and salar�es, the soc�o-econom�c factors w�th the potent�al to �nfluence on profit and employment creat�on were exam�ned. Descr�pt�ve stat�st�cs were calculated to assess these factors.
Analysis of the Formality of the Business
Three major attr�butes of bus�ness formal�ty – reg�strat�on, l�cens�ng and tax payments – were stud�ed to establ�sh the �mpact of bus�ness formal�ty on profit marg�ns and employment growth. Descr�pt�ve analys�s was performed by cross-tabulat�ng the attr�butes of formal�ty, w�th profits and employment growth.
10 For employment creat�on, analys�s focused on two var�ables �) employment levels, and; ��) employment growth

7
Literature Review
5. ConTRiBuTion of SMAll BuSinESSES To PovERTy AllEviATion
To assess the role of small bus�nesses �n poverty allev�at�on, four core var�ables were exam�ned: entrepreneurs’ sources of d�sposable �ncome, �ncome generat�on �n terms of profit marg�ns, �ncome generat�on �n terms of salar�es and wages for employees, and employment creat�on.
5.1 Source of Disposable income
Major findings
Smallbusinesseswererankedasnumberonesourceofincome60%ofrespondentsindicatedanimprovementintheirstandardofliving29% of the respondents experienced a declining standard of living, while 11%saw nochange
•••
The assessment of the role of small bus�nesses �n poverty allev�at�on commenced by look�ng at the pos�t�on small bus�nesses occup�ed as a source of d�sposable �ncome. Table 1 show that 87% of the respondents ranked small bus�nesses as the�r top �ncome source. For those who ranked small bus�nesses as number one source of �ncome, 84% were m�cro-enterpr�ses (MEs) and 94% were small-scale enterpr�ses (SSEs).
Table 1: Ranking of Sources of income
Primary Source of incomeMicro Enterprise Small Scale Enterprise All
number % number % number %
Small bus�nesses 136 84 59 94 195 87
Employment elsewhere 19 12 4 6 23 10
Fam�ly rem�ttances 7 4 0 0 7 3
Total 162 100 63 100 225 100
The �mportance of �ncome from the small bus�nesses �s further emphas�sed by the fact that a major�ty of respondents, as shown �n Table 2, were not engaged �n other occupat�ons, �mply�ng that these small bus�nesses were the�r sole source of �ncome. Th�s find�ng also correlates w�th the find�ngs on the owners’ mot�vat�ons for start�ng small bus�nesses (see Table 12) where ‘push’ factors dom�nated over ‘pull’ factors s�gnal�ng a h�gher probab�l�ty that �ncome from these establ�shments would bes�gnal�ng a h�gher probab�l�ty that �ncome from these establ�shments would be h�ghly ranked.
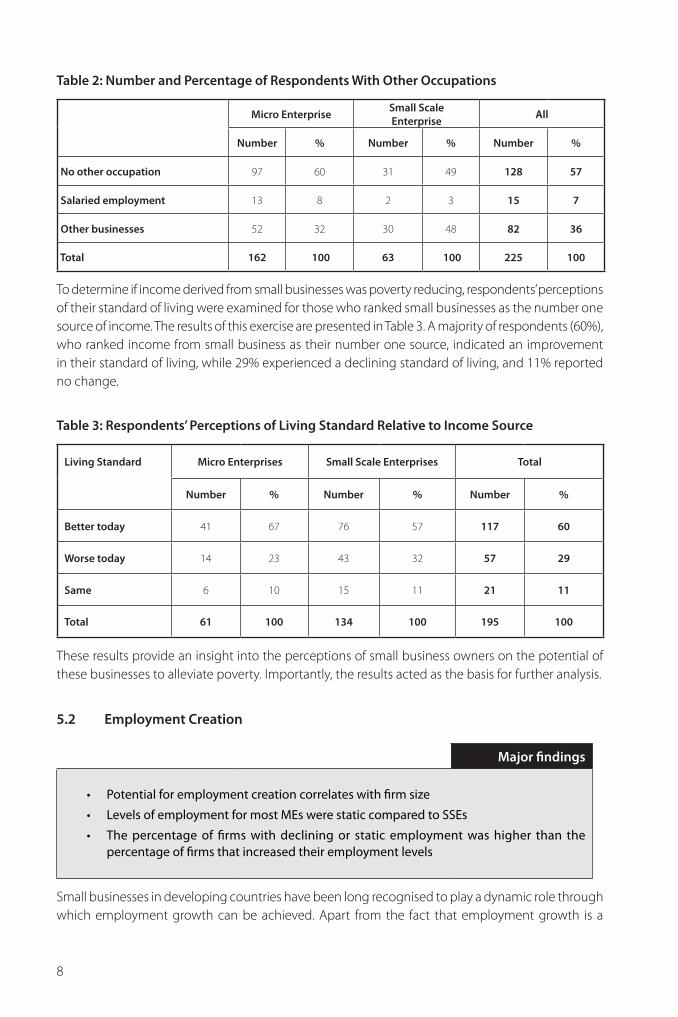
8
Table 2: number and Percentage of Respondents with other occupations
Micro Enterprise Small ScaleEnterprise All
number % number % number %
no other occupation 97 60 31 49 128 57
Salaried employment 13 8 2 3 15 7
other businesses 52 32 30 48 82 36
Total 162 100 63 100 225 100
To determ�ne �f �ncome der�ved from small bus�nesses was poverty reduc�ng, respondents’ percept�ons of the�r standard of l�v�ng were exam�ned for those who ranked small bus�nesses as the number one source of �ncome. The results of th�s exerc�se are presented �n Table 3. A major�ty of respondents (60%), who ranked �ncome from small bus�ness as the�r number one source, �nd�cated an �mprovement �n the�r standard of l�v�ng, wh�le 29% exper�enced a decl�n�ng standard of l�v�ng, and 11% reported no change.
Table 3: Respondents’ Perceptions of living Standard Relative to income Source
living Standard Micro Enterprises Small Scale Enterprises Total
number % number % number %
Better today 41 67 76 57 117 60
worse today 14 23 43 32 57 29
Same 6 10 15 11 21 11
Total 61 100 134 100 195 100
These results prov�de an �ns�ght �nto the percept�ons of small bus�ness owners on the potent�al of these bus�nesses to allev�ate poverty. Importantly, the results acted as the bas�s for further analys�s.
5.2 Employment Creation
Major findings
Potentialforemploymentcreationcorrelateswithfirmsize
LevelsofemploymentformostMEswerestaticcomparedtoSSEs
The percentage of firms with declining or static employment was higher than thepercentageoffirmsthatincreasedtheiremploymentlevels
•
•
•
Small bus�nesses �n develop�ng countr�es have been long recogn�sed to play a dynam�c role through wh�ch employment growth can be ach�eved. Apart from the fact that employment growth �s a

9
Literature Review
measure of econom�c growth11, for the entrepreneur, �t can also serve as an �nd�cator of h�s/her success and, for the company as a whole, �t �s a measure of the econom�c contr�but�on of the firm to the common good12. Moreover, accord�ng to Ch�ld (1973), employment �s an adequate cr�ter�on for the measurement of the s�ze of an organ�sat�on, because �t �s above all human be�ngs who are ‘organ�sed’.
Th�s study assessed the ab�l�ty of small bus�nesses to generate employment opportun�t�es. Table 4h�s study assessed the ab�l�ty of small bus�nesses to generate employment opportun�t�es. Table 4 shows that MEs employed on average three employees wh�le SSE employs tw�ce as many. F�nd�ngs further show that employment growth occurred w�th�n the SSEs �.e. three employees per SSE over an average per�od of 6 years13 �n operat�on, wh�le MEs d�d not �ncrease the�r employment levels, wh�le MEs d�d not �ncrease the�r employment levels14; g�v�ng an overall annual employment growth of 4.2% as �nd�cated �n Table 4.
Table 4: Average number of Employees per Enterprise and Employment growth
Business Type observations number Employees at Commencement
number Employees at Time of interview
AverageChange
%growth
Micro Enterprises 162 3 3 0 0
Small Scale Enterprises 63 6 9 3 8.3
overall 225 4 5 1 4.2
Three conclus�ons can be made from these results:
�) the b�gger the small bus�ness firm, the h�gher the potent�al for expand�ng employment;
��) overall, the small bus�ness sector possesses l�m�ted capac�ty to expand to absorb surplus labour; and,
���) the pr�nc�ple focus of MEs �s often on ‘surv�val’, wh�le ‘growth’ m�ght be the major focus of SSE �rrespect�ve of the hurdles �n the bus�ness env�ronment.
We also observed that 41%, 31% and 28% of the �nterv�ewed firms recorded �ncreas�ng, decreas�ng and no change �n employment, respect�vely. Comb�n�ng the percentages of firms w�th stat�c employment (28%) and those w�th decreas�ng employment (31%) shows the �nab�l�ty of the small bus�ness landscape to expand employment. Furthermore, only 14.8% of the firms wh�ch started the per�od as MEs managed to graduate to the SSE category, further �nd�cat�ng the l�m�ted potent�al of small bus�ness to reduce poverty.
11 K�rchoff, 199112 Dunkelberg and Cooper, 198213 Small bus�nesses were �n bus�ness for d�ffer�ng durat�ons w�th an average of s�x years.14 On the bas�s of K�rchoff (1991) argument, th�s w�ll mean that MEs d�d not contr�bute to econom�c growth
compared to SSE.
Contribution of Small Businesses to Poverty Alleviation

10
5.3 income generation for Employees
Major findings
SalariespaidtoemployeeswereaboveboththefoodandbasicneedpovertylinesLowsalariessignalledlowjobqualityinthesmallbusinesslandscapeHighersalariescorrelatedpositivelywiththesizeoftheenterprise
•••
To analyse �ncome generat�on for employees, th�s study focused on salar�es earned by people employed �n small bus�nesses. The respondents were requested to �nd�cate salar�es and wages. 151 respondents answered th�s quest�on. Table 5 shows that salary levels var�ed w�th the s�ze of enterpr�ses. SSEs offered h�gher salar�es of about TShs 50,000 per month, compared to TShs 32,000 offered by MEs.
Th�s result was cons�stent w�th results from Beck, T et al (2003) wh�ch �nd�cated that large firms offered h�gher wages and more non-wage benefits than small firms �n developed and develop�ng countr�es, even after controll�ng for d�fferences �n educat�on, exper�ence and �ndustry. As remunerat�on �s one of the �nd�cators for job qual�ty, T�bandebage, P. et al (2001) demonstrated the ex�stence of low levels of job qual�ty �n the small bus�ness sector through an analys�s of the remunerat�on, soc�al protect�on, work�ng cond�t�ons, human resource development and organ�sat�on �n th�s sector. In �ncome terms for both MEs and SSEs, salar�es earned were well above the est�mated bas�c need poverty l�ne of TShs 9,203 per month, as well as above the food poverty l�ne est�mated for Dar es Salaam reg�on15.
Table 5: Monthly Salaries for Small Businesses Employees (Tshs)
wages and Salary Micro Enterprise(number = 101)
Small ScaleEnterprise
(number = 50)
All(number = 151)
Mean wages and salaries 31,648 49,989 40,818
Standard deviation 14,820 28,245 21,533
Maximum 90,000 100,000 100,000
Minimum 9,000 15,000 9000
5.4 Profit Margins and Profitability Trend
Major findings
Firmsizecorrelatedwithprofitgenerationi.e.SSEsgeneratedmoreprofitscomparedtoMEsOverall,smallbusinessesgeneratedprofitsabovetheaveragesalaries
•
•
15 The bas�c food poverty l�nes for the Dar es Salaam reg�on as est�mated by Household Budget Survey 2000/01 �s Tshs 6,719 per month (adult equ�valent for 28 days) HBS Table 7.1, page 78.

11
Literature Review
As the major�ty of small bus�ness owners were not �nvolved �n other �ncome-generat�ng act�v�t�es16, the est�mated profit marg�ns represent a better proxy for the d�sposable �ncome of surveyed entrepreneurs. The respondents were also requested to comment on the�r profitab�l�ty trend s�nce the start of the�r bus�nesses up unt�l the t�me of �nterv�ew. Profit marg�ns for both MEs and SSEs are presented �n Table 6, where 214 respondents answered th�s quest�on. Profits for MEs ranged between TShs 5,000 and TShs 900,000 per month, and averaged TShs 137,600, wh�le SSEs’ profits ranged from TShs 6,000 to 2,500,000 per month w�th an average of TShs 465,887.
Table 6: Monthly Profit Margins (TShs)
Profit Margin Micro Enterprise(number = 152)
Small ScaleEnterprise
(number = 62)
All(number = 214)
Average profit 137,473 465,887 301,680
Std. deviation 152,432 604,657 378,544
Maximum 900,000 2,500,000 2,500,000
Minimum 5,000 6,000 5,500
The lower profits for MEs were attr�buted to the lower scale of the�r bus�ness operat�ons as ev�denced by low �nvestment cap�tal (the major�ty of respondents, as d�scussed later, establ�shed small bus�nesses due to a lack of other employment opportun�t�es). The overall average profit marg�n for both the MEs and SSEs was est�mated at TShs 378,544 per month, wh�ch was h�gher than the average salary �n the manufactur�ng �ndustry wh�ch stood at TShs 103,40717. The results conform to the occupat�onal cho�ces models18, wh�ch descr�be how �nd�v�duals dec�de to become entrepreneurs by compar�ng the wage they can earn from other employment w�th the entrepreneur�al rent19 they can obta�n by manag�ng the�r own bus�ness20. Opt�ng for alternat�ve employment w�ll lead to a h�gh probab�l�ty ofof earn�ng a m�n�mum salary �n the labor market g�ven that the major�ty of entrepreneurs had a pr�mary school level of educat�on21.
Two observat�ons can be made here on the role of small bus�ness on poverty allev�at�on:
�) the major�ty of the surveyed bus�nesses generated �ncome above poverty l�nes; and,
��) most of the owners were not engaged �n other �ncome generat�ng act�v�t�es (57%)22.
In v�ew of these find�ngs, remov�ng obstacles that l�m�t vert�cal growth23 may be more poverty allev�at�ng than pol�cy �n�t�at�ves that emphas�se hor�zontal growth24.
Entrepreneurs were then asked to comment on the�r bus�nesses’ profit trends from when the bus�ness started to the t�me of the �nterv�ew. Table 7 records the�r responses. The results �nd�cate that 44% of respondents generated more profit over t�me, w�th no major d�fferences �n find�ngs based on the firm’s s�ze.
16 Table 217 ILFS 200118 Lucas, 1978; O�, 1983; Blanchflower and Oswald, 1990; Jovanov�c, 199419 Entrepreneur�al rent refers to benefits �n terms of profit, soc�al status, power and author�ty over employees.20 In the�r most bas�c form these models pred�ct that an �nd�v�duals’ propens�ty to become self-employed �s
pos�t�vely �nfluenced by h�s/her manager�al ab�l�t�es, and negat�vely by the expected wage that could be earned as a worker.
21 Table 1022 Table 223 Vert�cal growth refers to bus�ness expans�on w�th�n the same enterpr�se �.e. growth �n s�ze of firms. 24 Hor�zontal growth refers to bus�ness expans�on by establ�sh�ng new more s�m�lar enterpr�ses �.e. growth �n number of
firms.
Contribution of Small Businesses to Poverty Alleviation

12
Table 7: Perceptions of Business Profitability Trend
ProfitabilityMicro Enterprise Small Scale Enterprise All
number % number % number %
More profitable 71 44 29 46 100 44
less profitable 60 37 25 40 85 38
no changes 31 19 9 14 40 18
Total 162 100 63 100 225 100
However, more MEs (19%) �nd�cated no changes �n profitab�l�ty compared to 14% of SSEs. Comb�n�ng ‘less profitab�l�ty’ and ‘no changes �n profitab�l�ty’ shows that the major�ty of small bus�nesses were less l�kely to atta�n grow�ng profitab�l�ty as 56% of the respondents �nd�cated e�ther decl�n�ng profitab�l�ty or stat�c profits. Therefore, �n th�s case, the potent�al for small bus�nesses to allev�ate poverty appears to be further l�m�ted by the lack of �mprovement �n profitab�l�ty.
To determ�ne the relat�onsh�p between profit trends and employment growth, profitab�l�ty trends were cross-tabulated w�th data on employment growth (see Table 8). The results show that that only 49% of the firms wh�ch perce�ved grow�ng profitab�l�ty, reg�stered employment growth, wh�le 42% of these firms d�d not grow �n terms of employment levels.
Table 8: Profitability Trends Relative to Employment growth
no growth growth Declining
number % number % number %
More profitable 51 42 45 49 4 36
less profitable 44 36 35 38 6 55
no change 27 22 12 13 1 9
Total 122 100 92 100 11 100
5.5 Conclusions
The results on the contr�but�on of small bus�nesses to poverty allev�at�on show that, �ncome from small bus�nesses contr�butes to poverty allev�at�on. In th�s case, the hypothes�s that small bus�nesses have a role to play �n poverty allev�at�on �s accepted. However, the capab�l�ty of small bus�ness to generate employment opportun�t�es �s low g�ven that the percentage of firms w�th decl�n�ng or stat�c employment was h�gher than the percentage of firms that had �ncreased the number of employees. Furthermore, only a small proport�on of firms wh�ch started as MEs had managed to graduate to SSEs.
Profitab�l�ty as a proxy for d�sposable �ncome for entrepreneurs correlated w�th the firm s�ze. The find�ngs �nd�cated that b�gger firms have greater potent�al for poverty allev�at�on than small firms, �.e., the potent�al for poverty allev�at�on correlates w�th firm s�ze. In th�s case, the pr�nc�pal focus of government pol�cy relat�ve to SMEs should be to �mprove the bus�ness env�ronment, so as to fac�l�tate vert�cal growth rather than hor�zontal growth as an �nd�rect way to reduce poverty. The necess�ty for

13
Literature Review
th�s pol�cy opt�on �s further ev�denced by the fact that a substant�al number of firms exper�enc�ng both pos�t�ve profitab�l�ty and h�gh turnover25 trends d�d not grow over t�me �mply�ng the ex�stence of both firm-level and pol�cy �mped�ments that l�m�t vert�cal growth.
25 Turn over refers to volume of sales over a per�od of t�me (month �n th�s case).
Contribution of Small Businesses to Poverty Alleviation

14
6. SoCio-EConoMiC fACToRS influEnCing T�E ConTRiBuTion of SMAll BuSinESSES To PovERTy AllEviATion
The contr�but�on of small bus�nesses �n terms of profit marg�ns can be �nfluenced by a number of cr�t�cal factors. Cr�t�cal factors �nfluenc�ng profit marg�ns were �dent�fied. The factors �dent�fied and exam�ned �n the current study �nclude the bus�ness owners’ sex, educat�on, mot�vat�ons for start�ng the�r bus�nesses, sources of �n�t�al cap�tal, and technology used.
6.1 gender of Small Business owners
Major findings
Ab�l�ty to generate profit was �nfluenced by gender of owners
A major�ty of male entrepreneurs perce�ved better profit trends compared to female entrepreneurs
Male-owned bus�nesses generated more profit than female-owned bus�nesses
Educat�on level and exper�ence were the major factors expla�n�ng the gender d�fferences �n profit generat�ng performance
•
•
•
•
Recent emp�r�cal stud�es on small bus�nesses have �ncorporated a gender perspect�ve through �dent�ficat�on of certa�n gender spec�fic tra�ts of entrepreneurs. Gender factors not only affect the performance of small bus�nesses, but also �nfluence the cho�ce of bus�ness opportun�t�es26. In th�s study, the effects of gender were assessed by compar�ng profits generated by var�ous small bus�nesses and the bas�c poverty l�ne. Table 9 presents the analys�s of profits generated by gender of the bus�ness owner.
When asked the�r percept�ons on the performance of the�r bus�ness ventures, 47% of male entrepreneurs �nd�cated that the�r bus�nesses had been more profitable, compared to only 30% of the female entrepreneurs. These results �mply that male-owned enterpr�ses possess h�gher potent�al for profit generat�on compared to female-owned bus�nesses.
Table 9: Perceptions of Business Performance by gender 27
Male female group27 All
number % number % number % number %
More profitable 85 47 11 30 4 57 100 44
less profitable 67 37 16 43 2 29 85 38
no changes 29 16 10 27 1 14 40 18
Total 181 100 37 100 7 100 225 100
26 OECD, 200427 Group refers to bus�ness enterpr�ses that were owned by more than one person w�th d�fferent sex.

15
Literature Review
Educat�on was found to be the ma�n factor expla�n�ng profit generat�on. Generally, as shown �n Table 10, a major�ty of both men and women had not completed educat�on above secondary level.
Table 10: Education levels of Small Business owners
Male female group All
number % number % number % number %
no formal education 4 2 1 3 0 0 5 2
Primary education 105 58 18 49 5 71 128 57
Secondary education 49 27 16 43 1 14 66 29
Certificate 8 4 0 0 1 14 9 4
Diploma 5 3 1 3 0 0 6 3
Degree 10 6 1 3 0 0 11 5
Total 181 100 37 100 7 100 225 100
However, the table shows that a greater number of male entrepreneurs (13%) had acqu�red cert�ficates, d�plomas and un�vers�ty degrees, compared to only 6% of female entrepreneurs.
6.2 Education and Training28 of Business owners
Major findings
FirmswithownerseducatedabovesecondaryschoolgeneratedmoreprofitthanthosewithlessereducationFirmswithownerstrainedformorethanoneyeargeneratemoreprofitthanthosewhoattendedtraininglastingforlessthanayear
•
•
Educat�on �s w�dely acknowledged as an �mportant factor for entrepreneursh�p and bus�ness sk�lls development. Table 11 shows that a major�ty of bus�ness owners that were educated above secondary level had completed further tra�n�ng last�ng more than a year. Results also show that firms owned by entrepreneurs who had attended tra�n�ng courses last�ng more than one year were generat�ng h�gher profits than those firms w�th owners who had attended tra�n�ng of one year’s durat�on or less.
28 Tra�n�ng refers to ta�lor made and out of school courses prov�ded to entrepreneurs. Such courses are prov�ded by NGOs, Banks and other development �nst�tut�ons to prov�de entrepreneurs w�th spec�al sk�lls needed to run the�r bus�nesses.
Socio-economic Factors Influencing the Contribution of Small Businesses to Poverty Alleviation

16
Table 11: Duration of Training Completed by owners with Education above Secondary level and Average Monthly Profits of Their Businesses
Average Profits(TShs, monthly) number of firms %
of firms
less than 1 year 235,000.0 20 31.7
1 year 122,812.5 17 27.0
More than 1 year 291,541.7 26 41.3
Total 63 100.0
6.3 Motivations for Starting Small Businesses
Major findings
MostofthesmallbusinessesweremotivatedbypushfactorsFirmsmotivatedbypullfactorshadmorepotentialtogeneratehigherprofitsSSEshavegreaterpotentialtogeneratehigherprofitscomparedtoMEs
•••
Human be�ngs have var�ous demands on them and these shape the�r pr�or�t�es and mot�vat�ons for start�ng bus�nesses. Reasons for start�ng a bus�ness can be class�fied �nto two types: push factors and pull factors. Push factors ex�st when a bus�ness entrepreneur �s desperate or stranded to meet h�s/her bas�c needs. Such factors �nclude loss of job, lack of employment, lack of adequate �ncome sources, etc. On the other hand, pull factors are �ncent�ves that mot�vate bus�ness entrepreneurs to start bus�nesses. Incent�ves �nclude profits or add�t�onal �ncome, d�vers�ficat�on, growth, etc. It was hypothes�sed that the object�ves for establ�sh�ng a bus�ness have an �nfluence on the operat�ons of the bus�ness, and �n turn, an �nfluence on the profitab�l�ty of the bus�ness.
Respondents were requested to �nd�cate the�r mot�ves �n start�ng the�r current bus�nesses. Table 12 shows that major�ty of the small bus�ness owners had been mot�vated by push factors (124 or 54.9%) compared to those mot�vated by pull factors (101 or 45.1%).
Table 12: Motivations of owners for Establishing Their Businesses Compared with Monthly Average Profits (TShs)
Average Profits number of firms %
Push factors1 194,727.1 124 54.9
Pull factors2 391,064.2 101 45.1
Total 225 100
1 Push factors �nclude need of bas�c �ncome and lack of alternat�ve opportun�t�es.
2 Pull factors �nclude d�vers�ficat�on and profit generat�on.
Th�s find�ng has s�gn�ficant ram�ficat�ons on the potent�al for the small bus�nesses to flour�sh. At the same t�me, strateg�c pol�cy �ntervent�on to support firm-level expans�on �s further compl�cated as small bus�nesses pulled by profit factors are much more respons�ve to the�r env�ronment and to market

17
Literature Review
opportun�t�es, compared to those who enter saturated markets due to the lack of better alternat�ves29. As Parker et al (1995) �nd�cated, support�ng SMEs �nd�scr�m�nately would not y�eld substant�al growth of bus�nesses, but �gnor�ng them altogether may neglect potent�al h�gh performers w�th�n the�r ranks. Table 12 shows firms that have been mot�vated by pull factors are generat�ng more profit than those mot�vated by push factors.
6.4 Major Sources of initial Capital
Major finding
Businesseswhichsourcedcapitalfrompersonalsavingsaswellasprofitsfromotherbusinessesgeneratedhigherprofitsthanbusinesseswhichaccessedcapitalfromothersources
A pre-requ�s�te for start�ng a firm �s to have financ�al cap�tal as well as relevant bus�ness knowledge. The ava�lab�l�ty of financ�al cap�tal �s cruc�al for establ�sh�ng and support�ng any bus�ness. Usually, entrepreneurs w�ll first draw on the funds that are cheapest to acqu�re, and w�ll then proceed to more expens�ve funds �f needed30. Obv�ously, the perce�ved ava�lab�l�ty of cap�tal to �nvest �n a firm also determ�nes what k�nd of opportun�t�es entrepreneurs w�ll cons�der.
Table 13 shows that most of the respondents sourced the�r �n�t�al cap�tal from the�r own sources followed by those who obta�ned cap�tal from the�r fam�ly members and relat�ves.
Table 13: Sources of initial Capital
number of firms %
Personal savings 148 66
family/friend loans 50 22
Profit from other businesses 23 10
Banks 2 1
Microfinance institutions 2 1
Total 225 100.0
The mode of �n�t�al cap�tal acqu�s�t�on has a bear�ng on the profitab�l�ty of a small bus�ness. The mode of �n�t�al cap�tal acqu�s�t�on �nfluences the degree of aggress�veness of entrepreneurs and m�ght also �nd�cate a certa�n degree of bus�ness sk�ll. Almost all of the bus�nesses surveyed (96.6%) sourced cap�tal from personal or fam�ly sav�ngs, loans from fr�ends, or profits from other bus�nesses. Only 2% of firms accessed other sources of cap�tal, �.e., banks and m�crofinance �nst�tut�ons.
Table 14 shows the find�ngs on the d�fferent sources of �n�t�al cap�tal compared aga�nst bus�ness profitab�l�ty. The results show that a h�gher proport�on of firms wh�ch sourced �n�t�al cap�tal from �nformal sources such as fam�ly/fr�end loans exper�enced grow�ng profitab�l�ty, followed by those firms wh�ch used profit from other bus�nesses as �n�t�al cap�tal.
29 One of the factors that st�mulate the d�vers�ficat�on of the small bus�ness landscape �s the chang�ng pattern of consumer spend�ng/demand result�ng from r�s�ng standards of l�v�ng.
30 OECD, 2004
Socio-economic Factors Influencing the Contribution of Small Businesses to Poverty Alleviation

18
Table 14: Sources of initial Capital and Profitability Trend
Source of initial Capital
MoreProfitability
(number = 101)
lessProfitability
(number = 80)
no Change(number = 44)
Total(number = 225)
no. % no. % no. % no %
Personal savings 62 41 63 42 24 16 149 100
family/friend loans 27 54 10 20 13 27 50 100
Banks 0 0 2 100 0 0 2 100
Profit from other businesses 10 47 6 26 6 26 22 100
Microfinance institutions 2 100 0 0 0 0 2 100

19
Literature Review
7. SoCio-EConoMiC fACToRS influEnCing EMPloyMEnT CREATion
In th�s sect�on, the capac�ty of small bus�ness to create employment �s assessed by exam�n�ng two factors:
1) employment levels, focus�ng on soc�o-econom�c factors �nfluenc�ng firms to employ fewer people (1-5 employees) or more staff (6-10 employees); and
2) employment growth, focus�ng on whether firms had managed to �ncrease the number of employees over t�me.
Earl�er �n th�s study the potent�al for employment growth w�th�n small bus�nesses was found to correlate w�th firm s�ze. Th�s chapter looks at a number of �ssues that have been �dent�fied as growth determ�nants of firms (and thus determ�nants of employment growth). These �nclude the character�st�cs of bus�ness owners such as the�r sex, level of educat�on, act�v�t�es undertaken before establ�sh�ng the�r current bus�ness, mot�vat�ons for start�ng bus�nesses, sources of �n�t�al cap�tal, and the types of technology used.
7.1 gender of Business owners
Major findings
Theabilitytoincreaseemploymentlevelswasinfluencedbygender
A large proportion of the male-owned firms had increased employment levelscomparedtotheproportionoffemale-ownedfirms
•
•
The results �n sect�on 6.1 �nd�cated that the gender of bus�ness owners had an �nfluence on the performance of small bus�nesses �n terms of profit generat�on. The rema�n�ng task was to establ�sh �f there was any l�nk between employment creat�on and the sex of bus�ness owners. To do that, sex factors were cross-tabulated w�th employment levels and growth. Table 15 shows that 29% of female-owned firms had 6-10 employees wh�ch �s sl�ghtly h�gher than male-owned firms (25%) w�th the same number of employees, �mply�ng that the potent�al for h�gher employment levels l�es w�th�n female owned firms compared to male owned bus�nesses.
Table 15: Employment levels for Businesses by gender of owners
(number and percentage of bus�nesses)
Type of ownership1-5 Employees 6-10 Employees Total
no. % no. % no %
Male owned 136 75 45 25 181 100
female owned 26 71 11 29 37 100
group owned 0 0 7 100 7 100
overall 162 72 63 28 225 100

20
A major�ty of both male owned and female owned firms reported no employment growth (Table 16), but the proport�on of the male owned firms that d�d not grow was sl�ghtly less (60%) than those owned by women (64%). In the growth category, the proport�on of male owned firms (40%) was marg�nally h�gher than female owned firms (36%).
Table 16: Employment growth by gender of owners
(number and percentage of bus�nesses)
Type of owners
no growthor Declining growth Total
no. % no. % no. %
Male owned 109 60 72 40 181 100
female owned 24 64 13 36 37 100
group owned 0 0 7 100 7 100
overall 133 59 92 41 225 100
7.2 level of Education and Training
Major findings
ThemajorityoffirmsownedbyentrepreneurswithhigherthansecondaryeducationhadincreasedtheiremploymentIngeneral,participationintrainingprogrammesdidnotleadtofirmgrowth;however,alongerdurationoftrainingcontributedtoemploymentgrowthOwnerswithbettereducationranbusinesseswithhigheremploymentlevels
•
•
•
Depend�ng on the�r level of educat�on, �nd�v�duals may d�ffer �n the�r ab�l�ty to d�scover and explo�t opportun�t�es. People have access to d�fferent �nformat�on, and process �t d�fferently depend�ng on personal knowledge and preferences31. The ab�l�ty to d�scover product�ve opportun�t�es depends largely on prev�ous educat�on and work exper�ences. In v�ew of th�s, the owners’ level of educat�on was cross-tabulated w�th the employment levels of bus�nesses, and also w�th employment growth, to see �f any relat�onsh�ps ex�sted between these var�ables.
Table 17 presents the results of an analys�s regard�ng employment levels and educat�on. The major�ty of the entrepreneurs were educated to pr�mary school level, a character�st�c also observed �n the stud�es by Sw�ssContact (2004) and ESRF (1996). Table 17 further �nd�cates that a major�ty of the respondents w�th bus�nesses employ�ng 1-5 staff possessed pr�mary educat�on (62%), wh�le 53% of the respondents employ�ng 6-10 employees had educat�on of secondary level and above. These results h�ghl�ght the fact that owners w�th better educat�on tend to run bus�nesses w�th h�gher employment levels.
31 Shane, 2000

21
Literature Review
Table 17: Comparison of owners’ level of Education and Business Employment levels
Education level 1-5 Employees 6-10 Employees All
number % number % number %
Pr�mary educat�on 101 62 27 43 128 57
Secondary educat�on 41 25 25 40 66 29
Cert�ficate 4 2 5 8 9 4
D�ploma 5 3 1 2 6 3
Degree 9 6 2 3 11 5
None 2 1 3 5 5 2
Total 162 100 63 100 225 100
The �nfluence of educat�on on employment growth was also assessed. Table 18 demonstrates that a h�gher percentage of small bus�nesses owners w�th educat�on above secondary level (cert�ficate, d�ploma and degree) had managed to �ncrease the�r employment levels compared to firms owned by those w�th secondary school educat�on and below.
Table 18: Comparison of owners’ level of Education and Business Employment growth
Education levelno growth growth Decline Total
no. % no. % no % no. %
Primary education 74 57 48 38 6 5 128 100
Secondary education 36 55 26 39 4 6 66 100
Certificate 4 44 5 56 0 0 9 100
Diploma 2 33 4 67 0 0 6 100
Degree 4 36 7 64 0 0 11 100
none 2 40 2 40 1 20 5 100
overall 122 54 92 40 11 6 225 100
These results are further supported by find�ngs reported �n Table 19. Almost two-th�rds (65%) of owners of the ‘growth’ firms had attended tra�n�ng last�ng more than one year, compared to 34% and 20% of owners of ‘No Growth’ and ‘Decl�n�ng’ firms respect�vely. A surpr�s�ng find�ng was that a substant�al number of firm owners had rece�ved tra�n�ng, but st�ll a large port�on of these respondents reported no employment growth. Th�s m�ght be expla�ned by the fact that most of the tra�n�ng prov�ded for entrepreneurs �s general �n nature and not focused on the spec�fic challenges exper�enced by small bus�nesses.
Socio-economic Factors Influencing Employment Creation

22
Table 19: Comparison of Duration of owners’ Training and Business Employment growth
Training Durationno growth growth Decline All
no. % no. % no. % no. %
less than 1 year 15 37 2 12 3 60 20 32
1 year or less 12 29 4 23 1 20 17 27
More than 1 year 14 34 11 65 1 20 26 41
Total 41 100 17 100 5 100 63 100
7.3 Activities of owners Before Starting Their Busines
Major findings
MajorityoffirmswithownerspossessingpriorbusinessexperiencemanagedtoincreasetheiremploymentlevelscomparedtoothercategoriesBeingemployed,unemployedorattendingschoolingpriortothecurrentbusinessdidnotcontributetotheincreaseinemploymentlevels
•
•
The �nvolvement of owners �n other enterpr�ses pr�or to the�r current bus�ness prov�des a good proxy for the level of entrepreneursh�p among small bus�ness owners and can be used to further analyse employment trends of the surveyed f�rms. Two approaches were adopted. F�rst, the proport�on of entrepreneurs w�th pr�or bus�ness exper�ence was determ�ned. Table 20 shows that 41% of entrepreneurs were engaged �n pr�or bus�ness act�v�t�es represent�ng a major�ty of SSE owners (55%), compared to a l�ttle over one-th�rd of ME owners (36%). Th�s �nd�cates a strong level of entrepreneursh�p among SSE owners, wh�ch could have enhanced the�r r�sk tak�ng, rent seek�ng behav�our, and search for new opportun�t�es; factors that are �mportant for bus�ness performance. Owners of MEs were marg�nally more l�kely to have been unemployed pr�or to the�r current bus�nesses compared to SSE owners.
Table 20: Comparison of Prior Activities of Business owners and Employment levels
Prior Activities1-5 Employees 6-10 Employees All
no % no. % no. %
other business activities 58 36 35 55 92 41
Employed 50 31 17 27 68 30
unemployed 15 10 4 7 20 9
Schooling 37 23 7 11 45 20
Total 162 100 63 100 225 100
Second, the �nfluence of pr�or bus�ness act�v�t�es on employment growth was �nvest�gated. It �s �nterest�ng to note from Table 21 that �n the category of those owners who had pr�or bus�ness exper�ence, nearly one-half (47%) had managed to �ncrease the�r employment levels compared

23
Literature Review
to other categor�es. Overall, the table �nd�cates that most of the firms (54%) d�d not �ncrease the�r employment levels, but th�s was more cr�t�cal for entrepreneurs who were prev�ously unemployed or school�ng.
Table 21: Comparison of Prior Experience of owners and Employment growth
Prior Activitiesno growth growth Decline Total
no. % no. % no. % no. %
Other bus�ness act�v�t�es 43 46 44 47 6 6 93 100
Employed 33 49 30 45 4 6 67 100
Unemployed 14 69 5 26 1 5 20 100
School�ng 32 71 13 29 0 0 45 100
overall 122 54 92 41 11 5 225 100
7.4 owners’ Motivations for Starting Business
Major findings
Push factors were dominant among owners of firms employing 1-5 employees, whiletwo-fifthsofthefirmswith6–10employeeswereownedbythoseinfluencedbypullfactorsMajorityoffirmsestablishedoutofpullfactorsmanagedtocontributetoemploymentgrowthMajorityofpush factorsfirmseitherdidnot registeremploymentgrowthordeclinedovertime
•
•
•
The study �nvest�gated the �nfluence of owners’ mot�vat�ons for establ�sh�ng the�r bus�nesses on firm employment levels. The results are recorded �n Table 22. Push factors were the dom�nant mot�vat�ons among owners of firms employ�ng 1 – 5 employees (86%), wh�le two-fifths (40%) of the owners of firms w�th 6 – 10 employees were �nfluenced by pull factors.
Table 22: Comparison of owners’ Motivations for Establishing Business and Employment levels
Motivations1 to 5 Employees 6 to 10 Employees All
number % number % number %
Pull factors 23 14 25 40 101 45
Push factors 139 86 38 60 124 55
Total 162 100 63 100 225 100
It was also of �nterest to know how mot�vat�ons �nfluenced employment growth w�th�n firms. Table 23 shows that a major�ty of the respondent enterpr�ses (57%) mot�vated by pull factors had managed
Socio-economic Factors Influencing Employment Creation

24
to reg�ster employment growth over t�me. At the same t�me, 70% of the firms that �nd�cated push factors had e�ther reg�stered stagnant or decl�n�ng employment.
Table 23: Comparison of owners’ Motivations for Establishing Business and Employment growth (number and percentage of bus�nesses)
Motivationno growth growth Decline Total
no. % no. % no. % no. %
Pull factors 41 41 58 57 2 2 101 100
Push factors 81 65 34 27 9 5 124 100
overall 122 54 92 41 11 5 225 100
S�nce add�t�onal �ncome was one of the �mportant pull factors, �t may be argued that entrepreneurs seek�ng add�t�onal �ncome were more aggress�ve �n manag�ng the�r bus�ness act�v�t�es than those who a�med at gett�ng employment only. Income mot�ves requ�re that the bus�ness makes a profit. For a person who engages �n bus�ness as a way of secur�ng employment, profit �s not as a h�gh pr�or�ty as those w�th purely �ncome mot�ves.
7.5 Technology
Major finding
A higher percentage of firms using electricity-based technology managed to registeremploymentgrowthcomparedtotheproportionoffirmswhichregisteredgrowthusingmanualtechnology.
•
The �nfluence of technology on employment growth was determ�ned by compar�ng the types of technology used by bus�nesses w�th the�r employment growth. The respondents were asked to �nd�cate the type of technology they were us�ng �n the�r act�v�t�es. Only 166 bus�ness owners responded to th�s quest�on. Table 24 shows that a h�gher percentage of the small bus�nesses (60%) us�ng electr�c�ty-based technology had managed to reg�ster employment growth compared to the proport�on of firms wh�ch reg�stered growth us�ng only manual technology (23%).
Table 24: Comparison of Business Technology and Employment levels
Type of Technology usedno growth growth Decline Total
no. % no. % no. % no. %
Manual 62 72 20 23 4 5 86 100
Electric 29 36 48 60 3 4 80 100
overall 91 55 68 41 7 4 166 100
The �nfluence of electr�c�ty-based technology �s also noted �n the table whereby almost three-quarters (72%) of firms wh�ch used manual technology d�d not grow.

25
Literature Review
7.6 Conclusion
Soc�o-econom�c factors found to have a pos�t�ve �nfluence on profit marg�ns and employment creat�on �ncluded the owners’ sex, level of educat�on, and mot�vat�ons for establ�sh�ng the�r bus�nesses, the sources of �n�t�al cap�tal, and the technology used �n the bus�nesses. Therefore, we accept the hypothes�s that soc�o-econom�c factors �nfluence the contr�but�on of small bus�nesses to poverty allev�at�on. Results �nd�cate that the profit levels generated by enterpr�ses are �nfluenced by these factors.
Furthermore, the results have shown that profits are l�kely to be h�gher �f the entrepreneur �s a male, �s mot�vated by pull factors, �s h�ghly educated, uses modern technology, and has sourced �n�t�al cap�tal from e�ther personal sav�ngs or re�nvested profits from other bus�nesses.
Socio-economic Factors Influencing Employment Creation

26
8. lEvEl of foRMAliTy, PRofiT MARginS AnD EMPloyMEnT lEvElS
Bus�ness formal�ty �s an �mportant aspect of entrepreneursh�p. St�gl�tz & We�ss, (1981) and Harhoff et al (1998), �nd�cate that theoret�cally, formal enterpr�ses enjoy a greater �ncent�ve to take r�sk �n bus�ness act�v�t�es, thereby �ncreas�ng the chances of h�gher profitab�l�ty, as well as bus�ness growth compared w�th �nformal enterpr�ses. Th�s argument forms the bas�s for th�s sect�on, wh�ch was �ntended to test the hypothes�s that bus�ness formal�ty �nfluences the contr�but�on of small bus�nesses to poverty allev�at�on.
8.1 Attributes of Business formality
Major findings
MajorityoftherespondentfirmshadoneoranotherattributeofformalityTheproportionoffirmswithnoneoftheformalityattributeswashigherforMEscomparedtoSSEsMEswerelesslikelytoberegistered(12%)comparedtoSSEs(41%)
••
•
The study ut�l�zed three attr�butes of formal�ty – bus�ness reg�strat�on, l�cens�ng and tax payments32 33, – to establ�sh the �mpact of formal�ty on profit marg�ns and employment creat�on. Table 25 presentsestabl�sh the �mpact of formal�ty on profit marg�ns and employment creat�on. Table 25 presentsTable 25 presents the number of bus�ness firms, wh�ch were reg�stered, l�censed and pa�d taxes. The results �nd�cate that small bus�nesses were at the marg�n between formal and �nformal sectors. Wh�le 31% of the respondent MEs had v�rtually none of the formal�ty attr�butes, only 13% of the SSEs d�d not possess any of the attr�butes of formal�ty. Furthermore, MEs were less l�kely to be reg�stered (12%) compared to SSEs (41%).
Table 25: Attributes of formality - Business Registration, licence and Tax Payment
Attributes of formality
Micro Enterprises(number = 162)
SS Enterprises(number = 63)
Total(number =225)
no. % no. % no. %
Business registration 20 12 26 41 46 20
Business licence 83 51 49 78 132 59
Tax payments 66 41 49 78 115 51
none 51 31 8 13 59 26
32 Parker,Parker,arker, et al, 199533 Formal�ty �s defined �n Parker, R.L et al (1995) as a concept �nd�cat�ng how well a firm �s �ntegrated �nto the
modern economy. However, the concept of formal�ty �s not very clear as defin�t�ons vary s�gn�ficantly between stud�es. World Bank (2004) �nd�cates that �dent�fy�ng firms under formal/�nformal class�ficat�on �s d�fficult as firms can be formal or �nformal to greater or lesser extent depend�ng on the�r spec�fic character�st�cs. Some of the reg�stered firms are �nformal to some degree (e.g., some reg�stered firms m�ght evade taxat�on) and some of the unreg�stered firms are formal to some degree (e.g., have a bank account).

27
Literature Review
8.2 Business Registration, Profit Margins and Employment Creation
Major findings
AmajorityoffirmsgeneratedprofitswhetherregisteredornotHowever,thepercentageofregisteredenterprisesgeneratingprofitwashigherthanthepercentageofunregisteredenterprisesAmajorityofregisteredfirmsexperiencedemploymentgrowthAlargepercentageofunregisteredfirmshadnotgrownordeclinedovertimecomparedtoregisteredfirms
••
••
Table 26 shows the relat�onsh�p between bus�ness reg�strat�on and profit marg�ns, demonstrat�ng that most of the enterpr�ses whether reg�stered or not generated profit.
Table 26: unregistered and Registered Businesses and Their Average Monthly Profits
Average Profit (TShs) number of firms %
unregistered businesses 257,766.7 179 70
Registered businesses 460,900.0 46 30
Total 255 100
F�nd�ngs from Table 26 show that the average profit for reg�stered enterpr�ses was h�gher than the average profit for unreg�stered enterpr�ses. Th�s �mpl�es that the potent�al for enterpr�ses to make h�gher profits l�es w�th reg�stered firms. It also �mpl�es that expand�ng the formal�sat�on of the pr�vate sector has the potent�al to �nd�rectly contr�bute to poverty allev�at�on – a dr�ve wh�ch should go hand �n hand w�th other pol�c�es that �ncrease the �ncent�ves for small bus�nesses to become more formal.
Furthermore, the owners of the bus�nesses that were reg�stered were requested to respond to quest�ons related to reg�strat�on process and cost of reg�strat�on. Table 27 shows that major�ty of the reg�stered enterpr�ses were sat�sfied w�th the reg�strat�on process (61%) and the cost �ncurred (61%).
Table 27: Registered Business owners’ opinion on Registration Process & Cost
Registration Process
MicroEnterprises
Small ScaleEnterprises All
no. % no. % no. %
Satisfied with the process 13 64 15 58 28 61
Bureaucratic 7 36 10 37 17 37
Corrupt 0 0 1 5 1 2
Total 20 100 26 100 46 100
Registration cost
�igh costs 8 38 10 39 18 39
Affordable 12 62 16 61 28 61
Total 20 100 26 100 46 100
Level of Formality, Profit Margins and Employment Levels

28
However the fact that major�ty of the firms were not reg�stered, �t �mpl�es some constra�nts �n the reg�strat�on process. World Bank (2004) po�nts out that one l�m�t�ng aspect, wh�ch �s a d�s�ncent�ve for small bus�nesses to reg�ster, �s the absence of government programmes target�ng small bus�nesses, such as fac�l�tat�ng the�r market access through government procurements.
In terms of employment growth, Table 28 reveals that 52% of reg�stered firms compared to 38% of unreg�stered firms had managed to expand employment. The other 62% of unreg�stered firms had not grown or had decl�ned over t�me compared w�th 48% of reg�stered firms. In other words, the contr�but�on of �nformal firms to job creat�on was l�m�ted as compared to the contr�but�on by formal firms. Reg�stered bus�nesses were able to secure advantages ava�lable to formal firms.
Table 28: Comparison of Business Registration and Employment growth
no growth growth Decline Total
no. % no. % no. % no. %
unregistered businesses 100 56 68 38 11 6 179 100
Registered businesses 22 48 24 52 0 0 46 100
overall 122 54 92 41 11 5 225 100
8.3 Business licensing, Profit Margins and Employment Creation
Major findings
Overall,smallbusinessesgeneratedprofitwhetherlicensedornotHowever, the percentage of licensed firms generating profit was higher than thepercentageofunlicensedfirmsIn terms of employment growth, a majority of licensed firms registered employmentgrowthwhilealargepercentageofunlicensedfirmshadnotgrownorhaddeclinedovertimecomparedtolicensedfirms
••
•
Table 29 demonstrates that bus�ness l�cens�ng was not an advantage for bus�ness performance as most of the enterpr�ses generated profit whether they were l�censed or not. It also shows that l�censed firms generated a sl�ghtly h�gher average profits compared to unl�censed firms. Th�s �mpl�es that the potent�al for enterpr�ses to make h�gher profits l�es more w�th l�censed firms compared to unl�censed firms. By compar�ng results on reg�strat�on and l�cens�ng, the aggregate level of profits (Tshs. 278,252) for l�censed enterpr�ses �s less than for those �n the reg�strat�on category (Tshs. 460,900). Th�s �mpl�es that the strength of the reg�strat�on to �nfluence profitab�l�ty �s lower than that of l�cens�ng.

29
Literature Review
Table 29: unlicensed and licensed Businesses and Their Average Profits
Average Profit (TShs) number of firms %
Unl�censed bus�nesses 272,715.1 93 41
L�censed bus�nesses 278,252.0 132 59
Total 225 100
Further �nvest�gat�on as recorded �n table 30 shows that 50% of the respondents had a pos�t�ve op�n�on on l�cens�ng costs34, wh�le 27% of the respondents were neutral regard�ng l�cens�ng costs. Only 24% of the respondents had negat�ve att�tudes towards l�cens�ng costs.
Table 30: owners’ Attitudes Towards licensing Costs
AttitudeMicro Enterprises Small Scale Enterprises All
no. % no. % no. %
Pos�t�ve 83 51 29 46 112 50
Negat�ve 32 20 21 33 53 24
Neutral 47 29 13 21 60 27
Total 162 100 63 100 225 100
Table 31 presents the results on the relat�onsh�p between bus�ness l�cens�ng and employment growth. The table �nd�cates that 55% of l�censed enterpr�ses managed to reg�ster employment growth at the same t�me the percentage of unl�censed firms w�th ‘no growth’ employment �s h�gher than the percentage of l�censed firms under the same category.
Table 31: licensed and unlicensed Businesses and Employment growth
no growth growth Decline Total
no. % no. % no. % no %
Unl�censed bus�nesses 67 72 20 22 6 6 93 100
L�censed bus�nesses 55 42 72 55 5 4 132 100
overall 122 54 92 41 11 5 225 100
34 Th�s m�ght be attr�buted to the �n�t�at�ve by the M�n�ster of F�nance to abol�sh bus�ness l�cense fee for SMEs w�th turnovers below TShs 20 m�ll�on per annum. However these results should be read w�th care. On average most of these enterpr�ses have been �n operat�on for about 5 years, �n the sense that the�r pos�t�ve op�n�on on l�cens�ng costs m�ght s�mply be an express�on of opt�m�sm on the part of the respondent.
Level of Formality, Profit Margins and Employment Levels

30
8.4 Tax Payments, Profit Margins and Employment Creation
Major findings
MostoftheenterprisesgeneratedprofitwhethertheypaidtaxornotThepercentageoftax-payingenterprisesgeneratingprofitwasmarginallyhigherthanthepercentageofthosewhichdidnotpaytaxes
••
Table 32 shows the relat�onsh�p between enterpr�ses pay�ng taxes and profit marg�ns. The table demonstrates that tax payment was not an �mportant factor on profit levels.
Table 32: Businesses that Paid and Did not Pay Tax and Their Profits
Average Profit(TShs) number of firms %
Businesses not paying taxes 279,761.9 110 49
Businesses paying taxes 284,038.1 115 51
Total 225 100
As for the reg�strat�on and l�cens�ng categor�es, s�m�lar results were found when taxat�on was l�nked to employment growth (Table 33). For example, 59% of the tax pay�ng enterpr�ses v�s�ted managed to grow compared to 22% of the not pay�ng taxes firms. The percentage of tax pay�ng firms w�th grow�ng employment was h�gher than the percentage for ‘not pay�ng firms’ suggest�ng that tax pay�ng as an attr�bute of formal�ty had a remarkable �nfluence on employment growth. Table 33 also shows that the percentage of tax pay�ng firms w�th decl�n�ng employment was sl�ghtly h�gher than the percentage of not pay�ng firms, though th�s �s cons�dered negl�g�ble on the bas�s of the number of cases.
Table 33: Comparison of Business’s Tax Paying Status and Employment growth
no growth growth Decline Total
no. % no. % no. % no. %
Businesses not paying taxes 81 74 24 22 5 5 110 100
Businesses paying taxes 41 36 68 59 6 5 115 100
overall 122 54 92 41 11 5 225 100
Several stud�es such as CTI (2000) and World Bank (2004) found that the bus�ness env�ronment �n Tanzan�a �s character�sed by h�gh tax rates and cumbersome adm�n�strat�on procedures. To further look at how effect�ve tax reduct�on as a pol�cy opt�on was, the find�ngs demonstrated �n Table 34 �nd�cate that although 70% of the respondents were negat�ve on tax rates only 30% of those were also negat�ve on the concept of taxat�on. Th�s suggests that major�ty (70%) of the respondents were �n favour of the taxat�on concept �mply�ng tat a pol�cy to reduce tax rates m�ght be product�ve �n reduc�ng tax evas�on, thereby further strengthen�ng the formal�sat�on of small bus�ness ent�t�es.

31
Literature Review
Table 34: Perceptions of Respondents on Tax Rates and Tax Concept
Attributes
Those Positive or neutral on Tax Rates
Those negative on Tax Rates All
no. % no. % no. %
Those positive or neutral on tax concept 103 84 71 70 174 77
Those negative on tax concept 20 16 31 30 51 23
Total 123 100 102 100 225 100
8.5 Conclusion
The major �ntent�on of the analys�s conducted �n chapter 8 was to test the hypothes�s that bus�ness formal�ty �nfluences the contr�but�on of small bus�nesses on poverty allev�at�on. It �s clear from the find�ngs that major�ty of the �nterv�ewed firms generated profit, whether they possessed formal�ty attr�butes or not.
However, further analys�s shows that the potent�al to generate h�gher profit l�es mostly w�th formal firms compared to �nformal enterpr�ses. The results on the comparat�ve analys�s and cross tabulat�ons of formal�ty var�ables w�th profit and employment confirmed that formal bus�ness have more prospects than �nformal ones. However, the find�ngs �nd�cate that although formal�ty m�ght have an �nfluence on profit generat�on and employment growth, �t was not capable by �tself to enable small bus�nesses to �ncrease the�r performance.
Level of Formality, Profit Margins and Employment Levels

32
9. EMERging PoliCy ConCluSionS
Are the find�ngs of the current study cons�stent w�th the analyt�cal underp�nn�ngs of the ex�st�ng SME pol�cy? In the course of �mplement�ng econom�c reforms as well as structural adjustment to make the pr�vate sector the eng�ne of growth, the Tanzan�an government �ntroduced a SMEs development pol�cy �n 2003 a�med at address�ng constra�nts fac�ng SMEs. The SME pol�cy also conta�ned d�fferent strateg�es that the government �ntended to pursue to benefit the SMEs sector. However, does the pol�cy and �dent�fied strateg�es take �nto account analyt�cal work both on poverty and the small bus�ness landscape? In th�s sect�on, some of the find�ngs of th�s research study are compared w�th the conceptual underp�nn�ngs of the SME pol�cy. In add�t�on, the usefulness of the pol�cy w�ll be assessed, both �n terms of �ts �ntended object�ve as well as �ts �mplementat�on framework.
Job creat�on and �ncome generat�on are the spec�fic object�ves of the SME pol�cy. However, the rat�onale for the SME pol�cy also embod�ed the concept of poverty allev�at�on:
“…… in Tanzania, the SME sector has been recognised as a significant sector in employment creation, income generation and poverty alleviation …”35
Th�s statement �llustrates that poverty allev�at�on was clearly an object�ve of the SME pol�cy. It ra�ses the quest�on of the role of SME �n poverty allev�at�on. Is the creat�on of surv�val�st enterpr�ses an effect�ve poverty allev�at�on strategy? Th�s study shows that major�ty of small bus�nesses earned l�ttle. One of the ma�n character�st�cs of these bus�nesses was the�r pr�or�ty to surv�ve. Hallberg, KHallberg, K (2001) �nd�cates that the reason that develop�ng countr�es should be �nterested �n small bus�nesses �s because they account for a large share of firms and employment, �n other words, because “they are there.” Search�ng for further just�ficat�on to promote small bus�ness as an �nstrument of poverty allev�at�on �s necessary and product�ve.
Wh�ch modes of �ntervent�ons are appropr�ate and are relevant at the pol�cy level? Another defic�ency of the SME pol�cy �s �ts preference for ‘supply s�de �ntervent�ons’, such as prov�d�ng access to tra�n�ng and cred�t to ex�st�ng and new bus�nesses.
Another of the expl�c�t object�ves of the SME pol�cy �s to encourage the establ�shment of new SMEs and to �mprove the performance and compet�t�veness of ex�st�ng ones. However, we should note that, the creat�on of the MEs �s h�ghly content�ous espec�ally �f susta�nab�l�ty �s a paramount object�ve. G�ven the character�st�cs of the market �n wh�ch MEs operate, �.e., low �ncome, low value-added act�v�t�es, fierce compet�t�on and over-trad�ng, a del�berate strategy to repl�cate these k�nds of bus�nesses s�mply threatens ex�st�ng bus�nesses and results �n �nsecur�ty for ex�st�ng entrepreneurs36. Th�s study shows that bus�ness performance �n terms of profit generat�on and employment creat�on �s pos�t�vely related to the s�ze of the firm, suggest�ng that strateg�es that promote vert�cal growth are more favourable than those promot�ng hor�zontal growth.
It �s also apparent that the SMEs pol�cy has, at the same t�me, dev�sed a pol�cy framework and strateg�es that outl�ne the �ntent�on of the government for the SMEs’ sector. However, the strateg�es to address constra�nts fac�ng the SMEs’ sector fa�l to d�fferent�ate between the d�fferent sectors w�th�n small bus�ness. Small bus�nesses are heterogeneous �n nature, and they have spec�fic strengths andhey have spec�fic strengths and weaknesses that may requ�re spec�al pol�cy responses, e.g. �mprov�ng access to markets for MEsmprov�ng access to markets for MEs demands very d�fferent strateg�es to that of �mprov�ng access to markets for small enterpr�ses. ThereThere �s a need to strengthen the format�ve research for pol�cy mak�ng so that pol�cy makers can make dec�s�ons �n an �nformed manner based on emp�r�cal ev�dence. 35 URT (2002)36 Broembsen, 2003

33
Literature Review
10. SuggESTED fuRT�ER RESEARC�
Th�s research exam�ned the extent to wh�ch small bus�nesses have a role �n poverty allev�at�on, and concludes that small bus�ness pol�cy needs careful cons�derat�on. However, th�s study �s not exhaust�ve on the role that small bus�nesses play �n job creat�on and econom�c growth.
It �s bel�eved that both the rates of gross job creat�ons and gross job losses are s�gn�ficantly h�gher for small firms than the�r larger counterparts, reflect�ng greater turbulence/turnover of staff among small firms. Therefore, future research work could �nvest�gate net job creat�on to better determ�ne the employment capac�ty of small bus�nesses. Currently,Currently, there �s also no rel�able and current data on the small bus�ness sector. Most of the recent surveys37 were l�m�ted �n coverage and comp�lat�on of cr�t�cal data that would fac�l�tate further analys�s on the role of small bus�nesses from both soc�o-econom�c and macro-econom�c perspect�ves. In th�s case, there �s a need for a basel�ne survey that w�ll prov�de accurate, format�ve data on the character�st�cs and performance of the small bus�ness sector.
37 Sw�ssContact 2003
34
REfEREnCES
A�d�s, R. (2002). ‘‘Why Less? The Gendered Aspects of Small and Med�um S�zed Enterpr�se (SME) Ownersh�p under Econom�c Trans�t�on”. Faculty of Econom�cs and Econometr�cs, Un�vers�ty of Amsterdam, Amsterdam Work�ng paper.
Beck, T. et al, (2003). “SME, Growth and Poverty: Cross Country Ev�dence”. World Bank, Wash�ngton.
Bhalla, A.S., (1991). “Small and Med�um Enterpr�ses; Technology Pol�c�es and Opt�ons” Un�ted Nat�ons Center for Sc�ence and Technology Development: Greenwood Press, Connect�cut, USA.
B�ggs, T., V�jaya Ramachandran and Manju Shah (1998). “The Determ�nants of Enterpr�se Growth �n Sub-Saharan Afr�ca”, RPED Paper 103.
B�rch, D. (1979). “The Job Generat�on Process”. Massachusetts Inst�tute of Technology: Cambr�dge, USA.
Blanchflower, D., Oswald, A, (1990). “What Makes a Young Entrepreneur”. NBER Work�ng Paper 3252.
Broembsen, M (2003). “Poverty Allev�at�on: Beyond the Nat�onal Small Bus�ness Strategy”. IDASA Budget Informat�on Serv�ces: Budget Informat�on Serv�ce, Occas�onal papers.
Ch�ld, J. (1973). “Pred�ct�ng and understand�ng organ�zat�onal structure”. Administrative Science Quarterly, 18, 168-185.
CTI (2000). “The Manufactur�ng Sector �n Tanzan�a”, A study by the Confederat�on of Tanzan�a Industr�es (CTI) and the Confederat�on of Dan�sh Industr�es (DI). CTI, Dar es Salaam.
Dan�els, L and Ngw�ra A. (1993). “Results of Nat�onw�de Survey on M�cro, Small and Med�um Enterpr�ses �n Malaw�”, GEMINI Techn�cal Report 53.
Dav�s, Steven, J., John Halt�wanger, and Scott Schuh, (1993). “Small Bus�ness and Job Creat�on: D�ssect�ng the Myth and Reassess�ng the Facts”. Business Economics 29: 13-21.
Dunkelberg, W.G. and Cooper, A.C. (1982). “Patterns of small bus�ness growth”. Academy of Management Proceed�ngs, page 409-413.
ESRF (1996). “Study on the proposed projects �n the �nfrastructure and Informal/M�croenterpr�se” sectors. Nat�onal Income Generat�on Programme (NIGP), Dar es Salaam.
F�sseha, Y. (1992). “Small Scale Enterpr�ses �n Lesotho: Summary of a Countryw�de Survey”. Gem�n� Techn�cal Report 14.
F�sseha & McPherson (1991). “A Countryw�de Study of Small Scale Enterpr�ses �n Swaz�land”. Gem�n� Techn�cal Report 24.
Gebremar�am, H.G., Tesfa G. Gebremedh�n and Randall W. Jackson, (2004). “The Role of Small Bus�ness �n Econom�c Growth and Poverty Allev�at�on �n West V�rg�n�a: An Emp�r�cal Analys�s”. Research Paper No. 10.
Hallberg, Kr�st�n, (2001). “A Market-Or�ented Strategy for Small and Med�um-Scale Enterpr�ses”. IFC D�scuss�on Paper 48.
Harhoff, D., et al., (1998). “Legal Form, Growth and Ex�t of West German F�rms— Emp�r�cal Results for Manufactur�ng Sector, Construct�on, Trade and Serv�ce Industr�es”. Journal of Industrial Economics 46: 453-488.

35
Literature Review
Jovanov�c, B., (1982). “Select�on and Evolut�on of Industry”. Econometrica 50: 649-670.
K�rchhoff, B.A., (1991), “Entrepreneurs’ Contr�but�on to Econom�cs”. Entrepreneurship Theory and Practice 16: 93-112.
Lucas, R.E., (1978). “On the S�ze D�str�but�on of Bus�ness F�rms”. The Bell Journal of Economics 9: 508-523.
Lugalla, J., (1995). “New Opportun�t�es for �ncome and employment generat�on �n ME sector”. Unpubl�shed.
Musonda, F.M., & C. Lwoga, (1997). “Potent�al Costs and Benefits of Reg�onal Integrat�on/Open Trade to the MSEs Sectors �n Tanzan�a: Some Cons�derat�on”. ESRF, Dar es Salaam. ESRF, Dar es Salaam.
Musonda, F.M., & Josephat Kweka, (1998). “The Dynam�cs and potent�al of cluster firms �n the growth and development of MSE �n Tanzan�a: The Case of three selected clusters �n Tanzan�a”. ESRF, Dar es Salaam.
O�, W. Y. (1983). “Heterogeneous F�rms and the Organ�sat�on of Product�on”. Economic Enquiry 21: 147-171.
OECD (2004). “Promot�ng Entrepreneursh�p and Innovat�ve SMEs �n a Global Economy: Towards a more Respons�ble and Inclus�ve Global�sat�on”. Second
OECD Conference of M�n�sters
respons�ble for Small and Med�um-s�zed Enterpr�ses (SMEs), Istanbul, Turkey, 3-5 June 2004.
Parker, R.L., R. R�opelle and W.F. Steel (1995). “Small Enterpr�ses Adjust�ng to L�beral�sat�on �n F�ve Afr�can Countr�es”, World Bank D�scuss�on Papers.
Shane, S. (2000). “Pr�or knowledge and the d�scovery of entrepreneur�al opportun�t�es”. Organization Science. Volume 11 , Issue 4 : 448 - 469.
St�gl�tz, J.E. and A. We�ss (1981). “Cred�t Rat�on�ng �n Markets w�th Imperfect Informat�on”. The American Economic Review 71: 393-410.
Sull�van P (1997). “Small Entrepreneur�al Bus�ness: A Potent�al Solut�on to Female Poverty �n Rural Amer�ca”. The Un�vers�ty of Vermont, Vermont.The Un�vers�ty of Vermont, Vermont.
Sw�ssContact (2003). “Basel�ne Survey of MSE & MSFs �n the Uhuru Corr�dor, Tanzan�a”. Sw�ss Contact, Dar es Salaam, Tanzan�a.
T�bandebage, P., Samuel Wangwe, and Darlene Mutalemwa, (2001). “Do Decent Jobs Requ�re Good Pol�c�es? A Case Study of MSEs �n Tanzan�a”. ESRF, Dar es Salaam. ESRF, Dar es Salaam.
UNDP (1998). “Bus�ness Development Serv�ces for Small and Med�um-S�zed Enterpr�ses: Prel�m�nary Gu�del�nes for Intervent�on”. UNDP.
URT (2000). “Household Budget Survey 2000/01”. Nat�onal Bureau of Stat�st�cs: Dar es Salaam.
URT (2002). “Integrated Labour Force Survey”. Nat�onal Bureau of Stat�st�cs: Dar es Salaam.
URT (2002). “Small and Med�um Enterpr�ses Development Pol�cy”. M�n�stry of Industr�es and Trade: Dar es Salaam.
Wangwe, S., (1999). “M�cro and Small Enterpr�ses Development and Employment �mpl�cat�ons: Rev�ew of Current Status and Prospects”. Paper prepared for a nat�onal workshop on Rev�ew of the Current Employment S�tuat�on �n Tanzan�a, ESRF, Dar es Salaam.
World Bank (2004). “Investment Cl�mate Assessment: Improv�ng Enterpr�se Performance and

36
PuBliCATionS By REPoA
Books
Research Reports08.2 “The Role of Small Businesses in Poverty
Alleviation: The Case of Dar es Salaam, Tanzania”Raymond Mnenwa and Emmanuel Mal�t�
08.1 “Improving the Quality of Human Resources for Growth and Poverty Reduction: The Case of Primary Education in Tanzania”Amon V.Y. Mbelle
07.2 “Financing Public Heath Care: Insurance, User Fees or Taxes? Welfare Comparisons in Tanzania” Deogras�as P. Mush�
07.1 “Rice Production in the Maswa District, Tanzania and its Contribution to Poverty Alleviation”Jerry A. Nga�lo, Ab�ud L. Kaswam�la and Cather�ne J. Senkoro
06.3 “The Contribution of Microfinance Institutions to Poverty Reduction in Tanzania” Sever�ne S.A. Kessy and Fratern M Ur�o
06.2 “The Role of Indigenous Knowledge in Combating Soil Infertility and Poverty in the Usambara Mountains, Tanzania”Juma M. W�ckama and Stephen T. Mw�homeke
06.1 “Assessing Market Distortions Affecting Poverty Reduction Efforts on Smallholder Tobacco Production in Tanzania”Denn�s Rweyemamu and Mon�ca K�maro
05.1 “Changes in the Upland Irrigation System and Implications for Rural Poverty Alleviation. A Case of the Ndiwa Irrigation System, West Usambara Mountains, Tanzania”Cosmas H. Sokon� and Tam�lwa� C. Shechambo
04.3 “The Role of Traditional Irrigation Systems in Poverty Alleviation in Semi-Arid Areas: The Case of Chamazi in Lushoto District, Tanzania” Ab�ud L. Kaswam�la and Baker M. Masurul�
04.2 “Assessing the Relative Poverty of Clients and Non-clients of Non-bank Micro-finance Institutions. The case of the Dar es Salaam and Coast Regions”Hugh K. Fraser and V�v�an Kaz�
04.1 “The Use of Sustainable Irrigation for Poverty Alleviation in Tanzania. The Case of Smallholder Irrigation Schemes in Igurusi, Mbarali District”Shadrack Mwakal�la and Chr�st�ne Noe
03.7 “Poverty and Environment: Impact analysis of Sustainable Dar es Salaam Project on “Sustainable Livelihoods” of Urban Poor”M.A.M. V�ctor and A.M.P. Makalle
03.6 “Access to Formal and Quasi-Formal Credit by Smallholder Farmers and Artisanal Fishermen: A Case of Zanzibar” Khal�d Mohamed
“Researching Poverty in Tanzania: problems, policies and perspectives”
Ed�ted by Idr�s K�kula, Jonas K�pokola, Issa Sh�vj�, Joseph Semboja and Ben Tar�mo
“Local Perspectives on Globalisation: The African Case”
Ed�ted by Joseph Semboja, Juma Mwapachu and Eduard Jansen
“Poverty Alleviation in Tanzania: Recent Research Issues”
Ed�ted by M.S.D. Bagachwa

37
Literature Review
03.5 “Poverty and Changing Livelihoods of Migrant Maasai Pastoralists in Morogoro and Kilosa Districts”C. Mung’ong’o and D. Mwamfupe
03.4 “The Role of Tourism in Poverty Alleviation in Tanzania”Nathanael Luvanga and Joseph Sh�tundu
03.3 “Natural Resources Use Patterns and Poverty Alleviation Strategies in the Highlands and Lowlands of Karatu and Monduli Districts – A Study on Linkages and Environmental Implications” P�us Zebbe Yanda and Ndalahwa Faust�n Madulu
03.2 “Shortcomings of Linkages Between Environmental Conservation and Poverty Alleviation in Tanzania” Idr�s S. K�kula, E.Z. Mnzava and Claude Mung’ong’o
03.1 “School Enrolment, Performance, Gender and Poverty (Access to Education) in Mainland Tanzania” A.V.Y. Mbelle and J. Katabaro
02.3 “Poverty and Deforestation around the Gazetted Forests of the Coastal Belt of Tanzania”God�us Kahyarara, W�lfred Mbowe and Omar� K�mwer�
02.2 “The Role of Privatisation in Providing the Urban Poor Access to Social Services: the Case of Solid Waste Collection Services in Dar es Salaam” Suma Kaare
02.1 “Economic Policy and Rural Poverty in Tanzania: A Survey of Three Regions”Long�nus Rutas�tara
01.5 “Demographic Factors, Household Composition, Employment and Household Welfare”S.T. Mw�somba and B.H.R. K��lu
01.4 “Assessment of Village Level Sugar Processing Technology in Tanzania” A.S. Chungu, C.Z.M. K�mambo and T.A.L. Bal�
01.3 “Poverty and Family Size Patterns: Comparison Across African Countries”C. Lwechungura Kamuzora
01.2 “The Role of Traditional Irrigation Systems (Vinyungu) in Alleviating Poverty in Iringa Rural District”Tenge Mkav�danda and Ab�ud Kaswam�la
01.1 “Improving Farm Management Skills for Poverty Alleviation: The Case of Njombe District” A�da Is�n�ka and Ntengua Mdoe
00.5 “Conservation and Poverty: The Case of Amani Nature Reserve”George Jamb�ya and Husse�n Sosovele
00.4 “Poverty and Family Size in Tanzania: Multiple Responses to Population Pressure?”C.L. Kamuzora and W. Mkanta
00.3 “Survival and Accumulation Strategies at the Rural-Urban Interface: A Study of Ifakara Town, Tanzania” Anthony Chamwal�
00.2 “Poverty, Environment and Livelihood along the Gradients of the Usambaras on Tanzania” Adolfo Mascarenhas
00.1 “Foreign Aid, Grassroots Participation and Poverty Alleviation in Tanzania: The HESAWA Fiasco” S. Rugumamu
99.1 “Credit Schemes and Women’s Empowerment for Poverty Alleviation: The Case of Tanga Region, Tanzania” I.A.M. Makombe, E.I. Temba and A.R.M. K�hombo
98.5 “Youth Migration and Poverty Alleviation: A Case Study of Petty Traders (Wamachinga) in Dar es Salaam” A.J. L�v�ga and R.D.K Mekacha
98.4 “Labour Constraints, Population Dynamics and the AIDS Epidemic: The Case of Rural Bukoba District, Tanzania” C.L. Kamuzora and S. Gwalema

38
98.3 “The Use of Labour-Intensive Irrigation Technologies in Alleviating Poverty in Majengo, Mbeya Rural District”J. Sh�tundu and N. Luvanga
98.2 “Poverty and Diffusion of Technological Innovations to Rural Women: The Role of Entrepreneurship”B.D. D�yamett, R.S. Mabala and R. Mandara
98.1 “The Role of Informal and Semi-Formal Finance in Poverty Alleviation in Tanzania: Results of a Field Study in Two Regions”A.K. Kashul�za, J.P. Hella, F.T. Magayane and Z.S.K. Mvena
97.3 “Educational Background, Training and Their Influence on Female-Operated Informal Sector Enterprises”J. O’R�ordan. F. Swa� and A. Rugumyamheto
97.2 “The Impact of Technology on Poverty Alleviation: The Case of Artisanal Mining in Tanzania” B W. Mutagwaba, R. Mwa�popo Ako and A. Mlak�
97.1 “Poverty and the Environment: The Case of Informal Sandmining, Quarrying and Lime-Making Activities in Dar es Salaam, Tanzania”George Jamb�ya, Kass�m Kul�ndwa and Husse�n Sosovele
Special Papers08.27 “The Growth – Poverty Nexus in Tanzania:
From a Developmental Perspective”Marc Wuyts
08.26 “Local Autonomy and Citizen Participation In Tanzania - From a Local Government Reform Perspective.”Amon Chal�gha
07.25 “Children and Vulnerability In Tanzania: A Brief Synthesis”Valer�e Leach
07.24 “Common Mistakes and Problems in Research Proposal Writing: An Assessment of Proposals for Research Grants Submitted to Research on Poverty Alleviation REPOA (Tanzania).”Idr�s S. K�kula and Martha A. S. Qorro
07.23 “Guidelines on Preparing Concept Notes and Proposals for Research on Pro-Poor Growth and Poverty in Tanzania”
07.22 “Local Governance in Tanzania: Observations From Six Councils 2002-2003”Amon Chal�gha, Flor�da Henjewele, Ambrose Kessy and Geoffrey Mwambe
07.21 “Tanzanian Non-Governmental Organisations – Their Perceptions of Their Relationship with the Government of Tanzania and Donors, and Their Role and Impact on Poverty Reduction and Development”
06.20 “Service Delivery in Tanzania: Findings from Six Councils 2002-2003”E�nar Braathen and Geoffrey Mwambe
06.19 “Developing Social Protection in Tanzania Within a Context of Generalised Insecurity”Marc Wuyts
06.18 “To Pay or Not to Pay? Citizens’ Views on Taxation by Local Authorities in Tanzania”Odd-Helge Fjeldstad
17 “When Bottom-Up Meets Top-Down: The Limits of Local Participation in Local Government Planning in Tanzania”Br�an Cooksey and Idr�s K�kula
16 “Local Government Finances and Financial Management in Tanzania: Observations from Six Councils 2002 – 2003”Odd-Helge Fjeldstad, Flor�da Henjewele, Geoffrey Mwambe, Erasto Ngalewa and Knut Nygaard
15 “Poverty Research in Tanzania: Guidelines for Preparing Research Proposals”Br�an Cooksey and Servac�us L�kwel�le
14 “Guidelines for Monitoring and Evaluation of REPOA Activities”A. Chungu and S. Muller-Ma�ge

39
Literature Review
13 “Capacity Building for Research”M.S.D. Bagachwa
12 “Some Practical Research Guidelines” Br�an Cooksey and Alfred Lokuj�
11 “A Bibliography on Poverty in Tanzania” B. Mutagwaba
10 “An Inventory of Potential Researchers and Institutions of Relevance to Research on Poverty in Tanzania”A.F. Lwa�tama
9 “Guidelines for Preparing and Assessing REPOA Research Proposals” REPOA Secretar�at and Br�an Cooksey
8 “Social and Cultural Factors Influencing Poverty in Tanzania” C.K. Omar�
7 “Gender and Poverty Alleviation in Tanzania: Issues from and for Research” Patr�c�a Mbughun�
6 “The Use of Technology in Alleviating Poverty in Tanzania” A.S. Chungu and G.R.R. Mandara
5 “Environmental Issues and Poverty Alleviation in Tanzania” Adolfo Mascarenhas
4 “Implications of Public Policies on Poverty and Poverty Alleviation: The Case of Tanzania”F�del�s Mtat�fikolo
3 “Who’s Poor in Tanzania? A Review of Recent Poverty Research”Br�an Cooksey
2 “Poverty Assessment in Tanzania: Theoretical, Conceptual and Methodological Issues”J. Semboja
1 “Changing Perceptions of Poverty and the Emerging Research Issues”M.S.D. Bagachwa
Project Briefs
Br�ef 11 C�t�zens Demand Tougher Act�on on Corrupt�on �n Tanzan�a
Br�ef 10 Outsourc�ng Revenue Collect�on: Exper�ences from Local Government Author�t�es �n Tanzan�a
Br�ef 9 Ch�ldren and Vulnerab�l�ty �n Tanzan�a: A Br�ef Overv�ew
Br�ef 8 Mawazo ya AZISE za Tanzan�a Kuhusu Uhus�ano Wao na Wafadh�l�
Br�ef 7 Mawazo ya AZISE za Tanzan�a Kuhusu Uhus�ano Wao na Ser�kal�
Br�ef 6 Local Government Reform �n Tanzan�a 2002 - 2005: Summary of Research F�nd�ngs on Governance, F�nance and Serv�ce Del�very
Br�ef 5 Ch�ldren Part�c�pat�ng �n Research
Br�ef 4 Changes �n Household Non-Income Welfare Ind�cators - Can poverty mapp�ng be used to pred�ct a change �n per cap�ta consumpt�on over t�me?
Br�ef 3 Part�c�patory Approaches to Local Government Plann�ng �n Tanzan�a, the L�m�ts to Local Part�c�pat�on
Br�ef 2 Improv�ng Transparency of F�nanc�al Affa�rs at the Local Government Level �n Tanzan�a
Br�ef 1 Governance Ind�cators on the Tanzan�a Governance Not�ceboard Webs�te
TGN1 What �s the Tanzan�a Governance Not�ceboard?
LGR 12 Trust �n Publ�c F�nance: C�t�zens’ V�ews on Taxat�on by Local Author�t�es �n Tanzan�a
LGR 11 Domest�c Water Supply: The Need for a B�g Push
LGR10 Is the commun�ty health fund better than user fees for financ�ng publ�c health care?

40
LGR 9 Are fees the major barr�er to access�ng publ�c health care?
LGR 8 Pr�mary educat�on s�nce the �ntroduct�on of the Pr�mary Educat�on Development Plan
LGR 7 C�t�zens’ access to �nformat�on on local government finances
LGR 6 Low awareness amongst c�t�zens of local government reforms
LGR 5 Fees at the d�spensary level: Is un�versal access be�ng comprom�sed?
LGR 4 TASAF – a support or an obstacle to local government reform
LGR 3 Counc�llors and commun�ty leaders – partnersh�p or confl�ct of �nterest? Lessons from the Susta�nable Mwanza Project
LGR 2 New challenges for local government revenue enhancement
LGR 1 About the Local Government Reform project
Copyright © 2022 FDOKUMEN