
urban poverty alleviation strategies a study of six cities (in india)
174
D.K.Srivastava, C.Bhujanga Rao, Swarna S. Vepa and Brinda Viswanathan MADRAS SCHOOL OF ECONOMICS Gandhi Mandapam Road Chennai 600 025 India December 2010 URBAN POVERTY ALLEVIATION STRATEGIES A STUDY OF SIX CITIES (IN INDIA) MONOGRAPH 7/2010
-
Upload
khangminh22 -
Category
Documents
-
view
1 -
download
0
Transcript of urban poverty alleviation strategies a study of six cities (in india)

D.K.Srivastava, C.Bhujanga Rao, Swarna S. Vepaand Brinda Viswanathan
MADRAS SCHOOL OF ECONOMICSGandhi Mandapam Road
Chennai 600 025 India
December 2010
URBAN POVERTY ALLEVIATION STRATEGIESA STUDY OF SIX CITIES (IN INDIA)
MONOGRAPH 7/2010


Urban Poverty Alleviation Strategies A Study of Six Cities (In India)
D K Srivastava
C Bhujanga Rao Swarna S. Vepa
Brinda Viswanathan
MADRAS SCHOOL OF ECONOMICS Gandhi Mandapam Road
Chennai 600 025 India
December 2010

MONOGRAPH 7/2010
November 2010
Price: Rs.200
MADRAS SCHOOL OF ECONOMICS Gandhi Mandapam Road
Chennai 600 025 India
Phone: 2230 0304/ 2230 0307/2235 2157
Fax : 2235 4847 /2235 2155
Email : [email protected]
Website: www.mse.ac.in

Acknowledgements
We are thankful to the Ministry of Housing and Urban Poverty Alleviation for entrusting this study to the Madras School of Economics, Chennai. We have considerably benefited from discussions with Professor O.P. Mathur at the National Institute of Public Finance and Policy, New Delhi and various officials of the Ministry of Housing and Urban Poverty Alleviation, GOI and officials of the municipal corporation of these cities. We also had occasion to consult the NIPFP library. In the preparation of the manuscript we have been helped considerably by Ms Sudha and Ms Jothi at the Madras School of Economics. Mr. Raju and Ms. S. Chandrakala, Project Associates rendered valuable services in compiling extensive data from National Sample Survey and various other reports. We are thankful to all of them for their help at various stages in the completion of this study.
D K Srivastava
C Bhujanga Rao Swarna S Vepa
Brinda Viswanathan


i
CONTENTS
Acknowledgements
List of Tables
List of Charts
Executive Summary
Chapter 1 Introduction and Overview 1
Chapter 2 Profile of Urban Poverty and Demographic Dynamics 13
Chapter 3 Perspectives on Growth and Employment 39
Chapter 4 Resources and Financing of Poverty Alleviation 63
Chapter 5 Poverty Alleviation Programmes - Progress and Prospects 89
Chapter 6 City-based Poverty Reduction Strategy: 2010-20 111
References 144
Annexures 148

ii
LIST OF TABLES
Table 1.1 Percentage of Poor Population, 2004-05
Table 2.1 Core City population, Area, Density and Growth rates
Table 2.2 Percentage of Slum Population to Total Population and Literacy
Table 2.3 Houseless Population in Million (Census 2001)
Table 3.1
Number of Persons Employed Per 1000 Person-days of Age 15 Years and Above
According to Current Daily Status for Each City during 1993-94, 1999-2000 and 2004-05
Table 3.2
Unemployment Rates of Men and Women Aged 15 Years and Above According to Usual and Current Daily Statuses for Each City during 1999-2000 and 2004-05
Table 3.3
Per Thousand Distribution of Men and Women across Broad Industry Divisions, 2004-05
Table 3.4
Per 1000 Distribution of Usually Employed (ps+ss) Men and Women Aged 15
Years and Above by Status of Employment for Each City during 1993-94, 1999-2000 and 2004-05
Table 3.5
Per 1000 Distribution of Usually 'Working' (ps+ss) Persons of Age 15 Years and
Above by Broad Industry Division - Chennai City
Table 3.6 Income Estimates – Gross District Domestic Product at 1999-00 Prices
Table 3.7 Employment Projection for CMA-2026, Chennai City
Table 3.8 State Domestic Product in West Bengal and KMA by Major Sectors in Kolkata City
Table 3.9
Annual Average Growth Rate of SDP for KMA and West Bengal by Major Sectors in Kolkata City
Table 3.10 Number of Registered Factories and Employment in West Bengal and KMA
Table 3.11 Labour Output Ratios
Table 3.12 Occupational Pattern of Ahmedabad
Table 3.13 Working Factories and Workers Employed Daily in Ahmedabad City
Table 3.14
Per 1000 Distribution of Usually 'Working' (ps+ss) Persons of Age 15 Years and
Above By Broad Industry Division in Ahmedabad City
Table 3.15
Per 1000 Distribution of Usually 'Working' (ps+ss) Persons of Age 15 Years and Above in Jaipur City
Table 3.16
Per 1000 Distribution of Usually 'Working' (ps+ss) Persons of Age 15 Years and Above by Broad Industry Division in Indore City
Table 3.17 Gender Composition of Employment: Industrial Category in Indore City
Table 3.18 Workforce Breakup in Guwahati City: 1998
Table 4.1 Inter-city Comparison of Finances of Municipal Corporations: 2004-05
Table 4.2 Overview of Municipal Finances of the Corporation of Chennai

iii
Table 4.3 Composition of Revenue Receipts of the Chennai Municipal Corporation
Table 4.4 Capital Receipts of the Corporation of Chennai
Table 4.5 Capital Expenditure of the Corporation of Chennai
Table 4.6 Aggregate Fiscal Position of ULB’s (including KMC)
Table 4.7 Aggregate Fiscal Position of ULBs - Per Capita (including KMC)
Table 4.8 Growth Rate (including KMC)
Table 4.9 Summary of Ahmedabad Municipal Corporation
Table 4.10 Composition of Revenue Receipts
Table 4.11 Share of Income from Tax Source of AMC
Table 4.12 Composition of Revenue Expenditure of AMC
Table 4.13 Composition of Capital Receipts of AMC
Table 4.14 Composition of Capital Expenditure of AMC
Table 4.15 Financial Profile of Jaipur Municipal Corporation
Table 4.16 Financial Details of JMC Compiled for the Year 2004-05
Table 4.17 Financial Profile Guwahati Municipal Corporation
Table 4.18 Sources of Finance
Table 4.19 Utilization
Table 6.1 Chennai: Key Urban Poverty Issues
Table 6.2 Implementing Poverty Reduction Strategy: Key Interventions
Table 6.3 Kolkata: Key Interventions for Poverty Reduction
Table 6.4 Employment Potential for Urban Poor across Industries in Ahmedabad City
Table 6.5 Poverty Reduction in Ahmedabad: Key Interventions
Table 6.6 Poverty Reduction in Jaipur: Key Interventions
Table 6.7 Poverty Reduction in Indore: Key Interventions

iv
LIST OF ANNEXURE TABLES
Table A1 Poverty Status across Social Groups: 2004-05
Table A2 Poverty Status across Education Groups: 2004-05 Table A3 Poverty Status across Education Groups: 2004-05 (contd.)
Table A4 Distribution of Population in Expenditure Deciles, 2004-05 Table A5 Percentage of Slums According to the Hours of Water Supply
Table A6 Availability of Sewer Connection
Table A7 Type of Toilets
Table A8 Table A9
Availability of Electricity Frequency of Street Lighting
LIST OF CHARTS
Chart 1.1 City-specific Urban Poverty Head Count Ratio: 2004-05
Chart 2.1 Percentage Change in Population Density from 1991 to 2001 Chart 2.2 Percentage of Population Below Poverty Line
Chart 3.1
Number of Usually Employed Persons Per 1000 Persons Aged 15 Years
and above According to Usual Principal and Subsidiary Status Taken Together for Each Class 1 City during 1993-94, 1999-2000 and 2004-05
Chart 4.1 Non-tax Revenues of AMC

v
EXECUTIVE SUMMARY Introduction and Overview
1. Cities in general and many of the Indian cities in particular are dynamic, pulsating
entities that have evolved over a long period of time having attracted a fair share of
the country’s population for religious, educational, and economic reasons. The six cities under study here are good examples: Chennai, Kolkata, Ahmedabad, Jaipur,
Indore, and Guwahati. In many respects, the evolution of these cities has depended on their geographic features, religious background, nature of economic activities, and
features of the surrounding hinterland. Along with their overall growth and the growth of population, growth of slums and urban poverty has also plagued these
cities. This study aims at analyzing the profile and features of urban poverty in these
cities with a view to taking these to a slum-free zero-poverty status by 2020.
2. Urban poverty differs significantly from rural poverty being more heterogeneous in income generation and location patterns. Rural poverty is marked by connections to
agriculture and land. The urban poor exhibit a highly diverse pattern of activities and
problems. However, in India, apart from the contemporaneous migration of the rural poor to urban areas, urban poverty has expanded in urban areas itself with the
original migrant family remaining poor but becoming larger and one or two generations old.
3. Poverty reduction should be considered as an important national task. Musgrave, one of the most well known fiscal economists in the world, has listed in a seminal work
(1999) that ‘Relief of Poverty’ as an important ‘Fiscal Task’ in a listing of fiscal tasks for a modern economy. Poverty reduction needs to be distinguished from the
provision of ‘urban public goods’ for which local resources should be raised. Augmentation of public expenditure on and for urban areas can lead to both direct
and indirect effects on poverty reduction. The direct effects emanate from
programmes focused on poverty reduction. Many of the expenditures closely related to poverty, in particular, public welfare and health are financed largely by the federal
and state governments. Nonetheless, the burden borne by local governments are still substantial.
4. Financing to reduce urban poverty has to come from the central as well as state governments and the citizens of the concerned city. A key issue is that the city
governments have to compete for resources that can come from the higher tiers of governments’ both the concerned state and the central government. The state
government has to play a key role for ensuring that all the conditionalities associated with the central and centrally sponsored schemes are met and complementary funds
that are to come from the state governments are allocated.

vi
Poverty Profile and Demographic Dynamics
5. The six cities under study here are: Chennai, Kolkata, Ahmedabad, Jaipur, Indore,
and Guwahati. These have been chosen to represent a key city in the southern, eastern, western, northern, central and north-eastern parts of the country. These
cities have similarities as well clear differences in their poverty profile and demographic dynamics and together present a varied mix of contexts in which to
examine the issues of urban poverty reduction in India. Though poverty is normally
measured by the ratio of population below the stipulated poverty line the dimensions of urban poverty vary across cities. Several factors impact urban poverty and quality
of life of the poor. Based upon the demographic characters such as rate of urbanization, population density, migration, location of job opportunities, pattern of
city growth, quality of the slum amenities, overall efficiency of the city in delivering of
the basic services, the attitude of the authorities towards the slums and land rights, the profile of urban poverty differs from city to city.
6. Average annual compound rates of growth of population of Chennai, Kolkata, and
Ahmedabad, within the limitations, we find that poverty in the studied five cities has declined substantially in four cities and increased only in one city, the city of Jaipur.
It is not a reflection of urban poverty. It is because National Sample survey sample
mostly pertains to the municipal corporation areas and do not reflect the poverty in the entire agglomeration. Northeast in general has lower levels of poverty and hence,
Guwahati represented by Kamrup district which is 35 percent urban also has low levels of poverty. When we supplement the information with the study of City
Development Reports prepared by the city authorities, we find that the satellite,
towns, and municipalities in the urban agglomeration experience higher levels of poverty compared to the core city. Jaipur is an exception. Out of the three cities for
which urbanization (represented by the annual rate of growth of population) is very high, two of them experienced reduction in poverty, while Jaipur experienced
substantial increase in poverty.
7. Municipal Corporation areas or core city areas, the growth rates of urban population,
between 1991 and 2001 are rather low, the lowest being that of Kolkata at 0.40 percent followed by Chennai at 0.94 and by Ahmedabad at 1.75. All of them are
much lower than the growth rates for urban population at 2.73 percent for urban India as a whole. Further, in all the three cities there has been a higher rate of
growth of population in the urban agglomeration compared to the core city. In
contrast, the core cities of Jaipur, Indore and Guwahati have grown very fast showing an average annual population growth rates exceeding 3 percent, between
1991 and 2001. These three cities are relatively smaller, Guwahati being the smallest with less than a million people. Jaipur has been the fastest growing city at a growth
rate of 4.77 percent followed by Indore at 3.88 percent and Guwahati at 3.26
percent.

vii
8. The two sets of cities have reasons to display the differential in the rate of
urbanization in the last decade. Jaipur, Indore and Guwahati are the only relatively big urban centres in the states which are less urbanized and mostly surrounded by
rural areas with fewer employment opportunities. The core cities of Jaipur, Indore and Guwahati are relatively less dense than those of Chennai, Kolkata and
Ahmedabad, also lack the basic amenities and infrastructure. The very fact that they are attracting a large number of people indicates that migrants were in search of
work.
9. Incidence of poverty is high among the illiterate and those who have attained the
education level only up to primary. Literacy no doubt reduced poverty, but functional literacy level is probably achieved only beyond higher secondary level. Several
National Sample Surveys have shown that incidence of poverty is low or none for the
group that completes the higher secondary level and has a functional diploma relevant to the work. Incidence of poverty is also found at higher levels of education, probably due to two reasons. Those (especially women), who go out of labour force for other reasons and want to re-enter the labour
force find it difficult to re-enter even if they hold higher educational qualification. Further, those whose skills and knowledge has no application
also do not get job even if they achieve higher educational qualification.
10. As per the 2001 census, slum population was between 15 to 33 percent of the total
population of the cities studied. Kolkata appears to have the largest slum population of 32.6 percent. It appears that the slum population is higher than the below poverty
line population in Kolkata and Chennai, implying that a number of slum dwellers are
not poor but experience the problems of housing and basic amenities. In contrast in the city of Jaipur, poverty is very high at 42 percent while the slum population was
only 15.9 percent. Most of the houses in Jaipur are of permanent nature. In Indore and Ahmedabad, the slum population as well as poverty population is close to each
other and below 20 percent which implies that many slum dwellers are likely to be poor, though it is possible that there are poor outside the slum areas.
Poverty Reduction: Role of Growth and Employment
11. The key to poverty reduction lies in generating productive employment and improving the skill levels of the poor though the poorest may still need additional
welfare measures to be able to participate effectively in the labour market.
12. Overall, in 2004-05 one finds that among both men and women the participation
rates are lower in the metros, Chennai and Kolkata while the smaller cities like Jaipur and Ahmedabad shows a higher participation rates. In the previous two years, the
cities seemed more homogenous in participation rates for men while female
participation rates show larger disparities across cities and over time. Among these cities, Guwahati has the lowest labour force participation rates. Among men,

viii
employment rate has increased marginally in Ahmedabad and Jaipur and very rapidly
in Indore while it has declined in Chennai and Kolkata. In comparison to this, female labour force participation has increased in all cities except Chennai.
13. Unlike men, female labour market does not show a secular trend for all the cities. For
instance, Chennai shows a marginal increase in 1999-00 followed by a large decline in 2004-05 while for Jaipur it is the reverse with a large increase by 2004-05 having
dipped in between since 1993-94. Similarly, Indore also shows dip in 1999-00 but
only a marginal increase recently while Ahmedabad and Kolkata show small but gradual increase.
14. Apart from unemployment rates, the nature of job contract in the case of wage
labour (regular versus casual) and also type of occupation pursued has an impact on
economic status. In urban areas, regular employed dominate among the richer sections of the population, followed by the self-employed and then by the casual
labour. In 2004-05, the share of casual labour population is highest in Kolkata, while Chennai and Guwahati have the largest share of regular salaried for both men and
women (about three-fourths). Indore has a substantially high share among self-employed men while Jaipur has a very high rate of self-employed among women.
15. The economy of the city is gradually shifting from secondary to tertiary sector absorbing 56 percent of the total main workers of the city. Employment potential has
to be identified not only from the perspective of employment guarantee as there may be several better skilled who may not want to be part of welfare schemes and remain
unemployed seeking better quality jobs. All the cities have the potential in terms of
tourism and as heritage cities. Improving the quality of skills for better employability is one aspect and now with opening up of tourism sector for 100 percent foreign
investment, the investors could themselves be linked to providing finance for education and vocational training. Public private partnerships, corporate social
responsibility and other forms of interactions among various stakeholders will be essential to take this forward. The cities would also serve as central hubs for tourism
in and around the fringes and resulting in a larger sphere of employment
opportunities outside the city limits thereby reducing congestion within the cities.
16. Hotel, retail trade and transportation would be the three main sectors to provide employment in the near future. Ensuring that gender discrimination both in terms of
hiring and wages does not take place, better working conditions linked with social
security measures have to be put in place. With focus on creating a slum-free city, the quality of housing and transportation for urban poor is a challenge as well
opportunity. The challenge would be in finding cheaper ways of financing such projects and minimising corruption while opportunities would be in terms of providing
employment in the construction activities and public transportation.

ix
17. Thus, there are two aspects to poverty reduction within the gamut of livelihood and
employment provision. From the demand side, there is lot to be done to improve the conditions of work and from the supply side the quality of the labour force has to be
improved. This would entail good governance systems in collaboration with entrepreneurs, technocrats, social scientists and civil society to enhance the
technological potential and productivity on the one hand and social capital and interactive governance leading to sustainable solutions. A key input no doubt is
adequate financial resources that lead to improvement of the well-being of the poor
in the cities.
Poverty Reduction Programmes
18. The urban poverty alleviation programmes are designed not only to generate self
employment and wage employment, but also to improve the quality of life of the slum dwellers and provide housing. The main aim is to provide minimum basic
amenities such as electricity, water supply, toilet facilities, sewage connection, and proper disposal of solid and liquid waste in the slum areas. Hence, the progress of
urban poverty alleviation needs to be judged interms of BPL population, slum population, progress in housing, conditions of the slums and so on. Most of these
aspects are already covered in the report and the situation is rather bleak on several
fronts.
19. Urban poverty alleviation schemes are of three types from the perspective of who sponsored the programme: centrally sponsored schemes of the central government,
state government sponsored or local government sponsored schemes and those
aided and promoted by international development agencies. From the perspective of financing also they are of three types; those completely financed by the central or
state government or both, those subsidised by the central or state government or the aid agency, which involve payment by the individuals to avail of the benefits and
other schemes which involves cost sharing by the entire community as a groups.
20. From the point of view of the problem addressed, the poverty alleviation programs
target
a. Subsidised food distribution to the BPL families and destitute families b. Assist in employment generation, through skill generation and loans and
provision of work
c. Slum improvements or upgrading by providing basic amenities such as provision of water, electricity, individual and community toilets, sewage connections,
garbage disposal etc. d. Provision of subsidised housing, community shelters, resettling those displaced
from unauthorised and objectionable slums, allotment of land and so on.

x
21. While urban poverty reduction languished for many years, in recent times a new
thrust and priority has been given to this growing problem. Important among the new initiatives are the Jawarharlal Nehru Urban Renewal Mission, a modified Swarna
Jayanti Shahari Rojgar Yojana, and the Rajiv Awas Yojana (RAS).
22. JNNURM which is for a seven-year period from 2005-06, has two main components - Basic Services to the Urban Poor (BSUP) Programme and Integrated Housing and
Slum Development Programme (IHSDP). BSUP was launched to assist cities and
towns in taking up housing and infrastructural facilities for the urban poor in 63 selected cities in the country. IHSDP, which was launched simultaneously with BSUP
in December 2005, is taking up housing and slum upgrade programmes in non-BSUP cities.
23. Rajiv Awas Yojana envisages tackling the issues of inclusive growth and slum-free-cities, including basic amenities and affordable housing to the existing slum-dwellers
as well as new additions to the number of poor due to urban growth. It emphasizes that States/UTs develop a slum-free State/UT/Cities vision and develop a legal
framework for regularizing space and accord property rights to the slum-dwellers as well as create space for the poor and new entrants to cities as they grow.
24. The poverty-reduction strategy for the six cities under study is in the framework of a new deal for the urban poor to be implemented through 2010-2020. This strategy
has five key components in line with the overall all-India strategy for reducing urban poverty. These interlinked strategies, supported by a suitable financing strategy, are
to be aimed at
a. taking key Indian cities towards a slum-free zero-poverty status;
b. developing, employment-oriented and inclusive growth of economic activities in the cities;
c. providing low-cost housing in designated areas, well connected with the city-core as well as the city periphery through ring roads and extensive intra-city
road and, wherever feasible, metro networks;
d. developing a safety-net for the urban poor, including an urban counterpart of the Rural Employment Guarantee (National Urban Employment Guarantee
Scheme), complemented by a Food Security Act, and e. providing a well-developed social infrastructure with free access to education at
least upto secondary education and low-cost health services.
25. Taken together all the six cities discussed in this report account for a large share of
slums in India. Converting these cities into slum free cities requires (a) developing existing slums to an extent that they qualify to be defined as non-slum areas, and (b)
not allowing any new slums to develop. If the slums are located in city centres, they
would have the highest land values. A low cost housing scheme that accommodates the eligible/registered slum dwellers in proper housing units in suitable multi-storied

xi
buildings can in most cases reduce the horizontal spread of the hutments into
permanent dwellings houses and accommodate nearly the same number of families. Some portion of the released land can be used for developing roads, schools and
other commonly usable physical infrastructure. A suitable combination of involvement of private property developers along with an adequate subsidy can successfully
achieve this target. During the period 2010-20, this strategy requires to be implemented in stages starting from slums located within a given radius around the
city centre and widening the radius in stages.
26. Avoiding formation of new slums requires development of low cost houses to
accommodate new entrants into the city-life. This needs development of outer ring roads/urban corridors providing road-networks in the urban periphery and
designating suitable areas for low-cost housing in the newly available areas on the
urban peripheries. Low cost ownership and low cost rentals can both be offered as options. These schemes can also accommodate slum dwellers or other non-slum poor
who may wish to migrate out of the city centre to the outskirts. These designated areas would require to be served by suitable social infrastructure with educational
and health facilities within manageable distances. The newly proposed Rajiv Awas Yojana, discussed in the section on low cost housing, has the potential to make a
serious impact towards reducing and eventually eliminating the slums in Indian cities.
27. A basic feature of the cities surveyed in this study highlights that the incidence of
urban poverty goes down with the attainment of education levels higher than secondary education and technical training. As city’s economic activities are
expanded in industry as well as services sectors, younger members of the poor
households can be productively absorbed if they have adequate education and training. In addition, building of low cost housing and road networks including ring
roads will themselves create employment opportunities in the construction sector both for skilled and unskilled labour. Additional employment needs to be
complemented by strategies for financial inclusion. Micro-finance facilities in urban areas can be effective in generating self-employment and employment of labour by
considerably expanding the base of the economic activities of the city.

1
Chapter 1
INTRODUCTION AND OVERVIEW
Cities in general and many of the Indian cities in particular are dynamic, pulsating entities
that have evolved over a long period of time having attracted a fair share of the country‟s
population for religious, educational, and economic reasons. The six cities under study
here are good examples: Chennai, Kolkata, Ahmedabad, Jaipur, Indore, and Guwahati. In
many respects, the evolution of these cities has depended on their geographic features,
religious backgrounds, nature of economic activities, and features of the surrounding
hinterland. Along with their overall growth and the growth of population, growth of slums
and urban poverty has also plagued these cities. This study aims at analyzing the profile
and features of urban poverty in these cities with a view to taking these to a slum-free
zero-poverty status by 2020.
1.1 Some Lessons from the Literature
Urban poverty differs significantly from rural poverty being more heterogeneous in
income generation and location patterns. Rural poverty is marked by connections to
agriculture and land. Studies of Asian developing countries in the late 1980s and also
West Africa [Hill (1972), Reardon, et. al. (1992)] have shown that the rural poor depend
more on agriculture than the rural non-poor [Quibria and Srinivasan (1991)]. However,
about one-third of rural income, and one-quarter of employment, typically derive from
non-farm activities [Chuta and Liedholm (1981)], but their prosperity depends
substantially on forward and backward production and consumption linkages [Hazell and
Haggblade (1993), Hazell and Ramasamy (1991)]. In contrast, the urban poor exhibit a
highly diverse pattern of activities and problems. Lipton and Ravallion (1995) observe: “It
is possible to focus rural anti-poverty policy on improving the amount, productivity,
stability, and distribution of farm inputs, employment, and output, and their social and
physical infrastructures. This is why – despite the urban bias of public spending and
personnel allocation in most LDCs – there is a much clearer and more production-
oriented menu of anti-poverty policies for rural areas than for towns”.
The migration of rural poor to urban area has been extensively discussed in the
literature. The Harris-Todaro (1970) framework attempts to explain the rural-to-urban
migration mainly in terms of rural-urban expected earning differentials. It implies that
assetless and jobless persons in the rural areas will be attracted more to the urban areas.
However, their failure to be absorbed in the high productivity sector implies that they

2
effectively transfer their poverty from the rural to the urban areas (Todaro 1969, 1980).
Rural poverty has a tendency to increase the urban immigration for employment which,
in turn, expands the relative size of urban informal sector employment. The residual
absorption of labour in the low productivity informal sector reduces the consumption
expenditure per capita and thus inflates the ratio of urban poverty. Since industrial
employment affects the share of informal sector employment negatively and the latter
responds positively to migration from the rural to urban areas, it is quite likely that
among the migrant workers large majorities are engaged in the informal sector.
However, in India, apart from the contemporaneous migration of the rural poor to urban
areas, urban poverty has expanded within urban areas with the original migrant family
remaining poor but becoming larger and one or two generations old. For example, Mitra
(1992) has estimated that the elasticity of urban poverty with respect to rural poverty (at
mean values) are in the range of 0.02 to 0.07 in some variants of the model. Using a
recursive model framework, Mitra has tested the rural to urban migration hypothesis in
the Indian context, and found that while there is a clear link between rural and urban
poverty, the elasticity of urban poverty with respect to rural poverty is extremely low. In
view of this low elasticity, the primary cause of urban poverty in India may not be the
rural poverty. In fact, many of the urban poor have been residing in the cities for several
decades-the inflow of rural population into the urban areas just adds at the margin to the
existing magnitude of poverty. Thus for the reduction of urban poverty one has to look
for separate and focussed urban poverty alleviation measures instead of seeking its
solution only in terms of rural employment programmes.
The urban informal sector has traditionally been linked to both the rural sector
and the urban formal sector through migration and remittances. It is characterised by
features like easy entry, non-implementability of minimum wages, weak safety standards,
low capital requirements, small enterprise units producing goods that are mainly
consumed by the low-income households. The urban informal sector is now perceived as
a source of strength with its diversity, low unit costs, heterogeneity of products, and wide
range of skills. Lipton and Ravallion (1995) observe that in explaining poverty in the
urban informal sector, “current thinking puts greater emphasis on individual
characteristics such as human capital endowments than on the „structural‟ features of the
economy arising out of a Todaro (1969) migration equilibrium with a fixed urban sector
wage. Poverty in the rural sector tends to be explained more by low access to physical
assets (particularly land), farm technology, non-farm employment opportunities, and
health care and schooling, than by labour-market distortions as in the urban sector”.

3
Urbanisation can reduce overall poverty if the rural poor are attracted to the
cities and find productive employment. It offers better education facilities, as also better
health facilities, more opportunities to interact, better information base, larger market,
and access to public services like bus transport. However, unless conditions are not
adequately conducive, urbanization may only mean shifting rural poor to urban slums
with far worse living conditions than in the rural areas. The DFID report on „Meeting the
Challenge of Urban Poverty‟ (2000) observes:
“Urban poverty is therefore invariably associated with overcrowded, unsanitary
living conditions within large slum settlements, with limited or no access to basic
utilities, or services such as health, education, energy and law and order. Indeed,
in many instances, the lack of access to basic utilities forces the poor to pay
many more times the unit cost of water and energy than the rich do.”
The higher density of urban population also means lower unit delivery costs in
respect of certain services due to economies of scale. On the other hand, the pressure of
people on limited areas, increases the price of land, and leads to further environmental
degradation.
1.2 City Governments and the Seventy-Fourth Amendment
The Seventy-Fourth Amendment of the Constitution received the assent of the President
on April 20, 1993 and came into force with effect from 1st April, 1993. The introduction of
Part IXA signifies that municipalities (institutions of self-governance) now constitutionally
have a specific and permanent place among the hierarchy of institutions constituted for
governance of the nation.
The Constitution (Seventy-Fourth Amendment) Act, 1992 defines a metropolitan
area as an area having a population of ten lakhs or more, comprised in one or more
districts and consisting of two or more municipalities or panchayats or other contiguous
areas, specified by the Governor by public notification to be a metropolitan area. Every
state has to constitute a Nagar Panchayat, a Municipal Council for a smaller urban area,
and a Municipal Corporation for a larger urban area. The Act has laid down rules for
composition of Municipalities and Wards committees, reservation of seats, duration of
municipalities, disqualification for members, powers, authority and responsibility of
municipalities and a host of other activities of municipalities. There are provisions for
audit of accounts of municipalities and regular elections to the municipalities which is
vested with the State Election Commission.

4
The Act (i) authorises a municipality to levy, collect appropriate taxes, duties,
tolls and fees as per procedures (ii) authorises the state governments to assign to
municipality such taxes, duties, toll and fees levied as collected by them according to
purpose and conditions, (iii) makes provision for grants-in-aid to the municipalities from
the Consolidated Fund of the State, and (iv) provides creation of such a fund for crediting
and withdrawal of money.
The Act provides a mandate to the Finance Commission to make
recommendations regarding the principles which should govern the overall and respective
shares of the various categories of panchayats and the municipalities in the revenues of
the state government, as well as regarding the making of grants-in-aid to them from the
Consolidated Fund of the state.
Every state has to constitute a committee for district planning to consolidate the
plans prepared by the panchayats and municipalities in the district and to prepare a draft
development plan for the district as a whole. The chairperson of every district planning
committee will forward the development plan to the state government. These provisions
including the Twelfth Schedule (Article 243-W) enables self-governance of the urban
areas.
1.3 Reducing Urban Poverty
1.3.1 Role of Public Expenditure
Augmentation of public expenditure on and for urban areas can lead to both direct and
indirect effects on poverty reduction. The direct effects emanate from programmes
focused on poverty reduction. Pack (1998) in a study of a number of U.S. cities contends
that a large share of local public expenditures in cities is poverty related, especially those
that have an indirect effect. He finds that the largest poverty-related expenditures come
from indirect poverty-related expenditures like those on police, fire, courts, and general
administrative functions rather than from primary poverty related functions like public
welfare, health and hospitals. Often the primary poverty functions of local governments
are financed largely by intergovernmental revenues but other types of expenditures
associated with poverty receive little or no intergovernmental assistance. Many of the
expenditures are closely related to poverty, in particular, public welfare and health are
financed largely by the federal and state governments. Nonetheless, the financial burden
borne by local governments are still substantial.

5
The main determinants of poverty-related public expenditures identified in this
study are listed below:
i. The larger the per capita income of the community, the greater is public
expenditures on the poor. And, the greater the other resources available to
the community, i.e., the lower the tax price to the local residents of a
particular bundle of goods, the larger is the public expenditures on the poor.
ii. Public expenditures also are made to counteract and prevent the negative
externalities generally associated with high poverty rates (Cullen and Levitt,
1999; Case and Katz, 1991) particularly, crime. There is a statistically
significant positive relationship between poverty rates and crime rates in
these large cities.
iii. Poverty rates may influence expenditures as communities respond to poverty
by providing for poor persons the types of goods believed to influence both
the quality of life of the poor and increase the likelihood of moving out of
poverty.
iv. The cost of delivering services in cities with higher poverty rates has also
been found to be high. This is the case for education, where the costs of
educating the poor have been found to be higher than for the non-poor.
Ladd and Yinger (1989) also find that increases in the costs of such public
functions are not reflected in decreases in the quality of services demanded,
but rather in increasing expenditures.
In the context of urban poverty in India, the Report of the Sub-Group under the
Working Group on Urban Poverty Alleviation for the Tenth Five Year Plan (Ministry of
Urban Development and Poverty Alleviation, 2001) notes that “Urban poverty in case of
many states is due to lack of development; but in some other states it is because of its
nature of development – and the sectoral composition”. The Sub-Group Report also notes
that the incidence of urban poverty is negatively related to the size of the town. It
observes “the probability of being poor, given that a person is in a particular town, is the
highest in towns having a population of less than 50,000”.
1.3.2 Financing Strategies
Poverty reduction should be considered as an important national task. Musgrave, one of

6
the most well known fiscal economists in the world, has listed in a seminal work (1999)
“Relief of Poverty” as an important “Fiscal Task” in a listing of fiscal tasks for a modern
economy. Poverty reduction needs to be distinguished from the provision of „urban public
goods‟ for which local resources should be raised. Secondly, the city attracts in-migrating
population who would normally contribute to output of the city. However, the poor
among the in-migrating population, whether currently migrating population or of a
previous generation, do not contribute to the fiscal capacity of the city unless they are
productively employed. This externality is another reason for attracting national funds for
the urban poverty alleviation programmes. So far, in India, allocation of central resources
for the rural poverty alleviation programmes has been far larger than those for the urban
poverty alleviation. Given the trend towards urbanization of population and particularly
urbanization of poverty in India, much larger resources need to be allocated for reduction
of urban poverty.
Finances to reduce urban poverty have to come from the central as well as state
governments and the citizens of the concerned city. A key issue is that the city
governments have to compete for resources that can come from the higher tiers of
governments both the concerned state government and the central government. The
state government has to play a key role for ensuring that all the conditionalities
associated with the central and centrally sponsored schemes are met and complementary
funds that are to come from the state governments are allocated.
Some of the new initiatives of the central government including the Jawaharlal
Nehru Urban Renewal Mission (JNUURM) with its substantially increased allocation in the
2009-10 budget and the Rajiv Awas Yojana focusing on low-cost urban housing that is
being introduced in the current financial year are taken advantage of to the fullest extent
by the local / State Governments by the local / state governments..
1.4 Urban Poverty and Slums
There are significant negative externalities associated with the urban poor. The urban
poor are more easily drawn into the illegal disruptive activities, particularly, when there is
a higher concentration of the poor in geographical clusters. Therefore, higher
concentration ratios and higher urbanisation of poverty provides fertile ground of
recruitment of people into activities that have a bearing on the negative externalities
related to poverty. Further, urban concentration of poverty leads to development of
slums and squalor, which generates health-related negative externalities.

7
The report of the Committee on Problems of Slums in Delhi (2002) observes:
“Almost all slum dwellers belong to the very poor strata of society in the country” and
further that “The characteristics of a slum is the excessive congestion and unhygienic
nature of the housing, lacking in basic amenities”.
Slum areas create health hazards for the non-poor population within the slum or
nearby areas. Many of these hazards emanate from poor availability of drinking water. A
Nationwide survey on „Particulars of Slums‟, conducted by the NSSO in its 19th round had
found that nearly 81 percent rural slums did not have access to a tap for drinking water.
In the case of urban slums about 35 percent did not have a „tap‟ as source of drinking
water, and in many states about 50 percent of urban slums did not have access to a tap
for drinking water. About 60 percent of the urban slums remain waterlogged during
monsoon. Around 83 percent of urban slums did not have an underground sewerage
system. An open pucca system of drainage did not exist in 65 percent of the urban
slums. About 35 percent of urban slums did not have any arrangement for garbage
disposal, the figure being far larger in many of the bigger states. These conditions of
urban slums make them a clear source of health hazards not only for the inhabitants
themselves, but to the nearby non-slum residents as well.
The 49th round (January-June, 1993) of NSSO carried out a nationwide survey on
„condition of slum areas in cities‟, covering class 1 cities in India with population of 1 lakh
or more in 1971 census. A slum was defined as follows:
“as a real unit having twenty five or more kutcha structures mostly of temporary
nature, or fifty or more households residing mostly in kutcha structures, huddled
together, or inhabited persons”.
The Government of India, in the context of the Environmental Improvement of
Urban Slums (EIUS) defined “slums” as:
“A slum area means any area where such dwellings predominate which by reason
of dilapidation, over crowding, faulty arrangement of design of building,
narrowness or faulty arrangement of streets, lack of ventilation, light or
sanitation facilities, inadequacy of open spaces and community facilities or any
combination of these factors, are detrimental to safety, health or morale”.
The NSSO survey showed that there were 117227 declared and undeclared slums
in the country of which 60916 were in the rural sector and 5631 in the urban sector.
Around 5 percent of rural slums and 36 percent of urban slums were “declared slums” by

8
the civic authorities. More than 89 percent of the urban slums were located in residential
areas, with 5 and 3 percent of the slums being formed in industrial and commercial areas
respectively.
At the all India level, around one-third each of the urban slums had pucca, semi-
pucca, and kutcha structures. Around 65 percent of urban slums had tap as the source of
drinking water, while more than a quarter of the slums get drinking water through a tube
well/hand pump. About 75 percent of urban slums reported electrification while around
60 percent of urban slums remained water logged during monsoon.
Around 47 percent of urban slums had pucca (all weather) roads. More than 84
percent of the slums had pucca cartable approach roads. Underground sewerage system
existed in 17 percent of these slums. Drainage system existed in 70 percent of the slums
with 35 percent having an open pucca system and 20 percent having an open kutcha
system, 8 percent of them having underground and rest having covered pucca system.
About 35 percent of urban slums did not have any arrangement for garbage disposal. In
a majority of urban slums, the municipality or corporation disposes off garbage. In 98
percent of urban slums, a motorable road, and in 90 percent, primary schools, and in 63
percent, hospital health centres were available within a distance of 1 km.
1.5 Cities Studied
The six cities under study here are: Chennai, Kolkata, Ahmedabad, Jaipur, Indore, and
Guwahati. These have been chosen to represent a key city in the Southern, Eastern
Western, Northern, Central and North-eastern parts of the country. These cities have
similarities as well prominent differences in their poverty profile and demographic
dynamics and together present a varied mix of contexts in which to examine the issues of
urban poverty reduction in India.
Table 1.1 indicates the total population of the cities under study in 2004-05 along
with the number of poor. The head count ratio (the number of poor as a percentage of
population) also shown in Figure 1.1 indicates that in three cities viz., Chennai, Guwahati
and Kolkata the poverty head count ratio is less than 10 percent. In Ahmedabad also it is
only marginally above 10 percent at 13 percent. In the case of Jaipur the much higher
ratio is mainly due to the expansion of the area under the municipal limits. This issue is
discussed further in Chapter 2.

9
Table 1.1: Percentage of Poor Population, 2004-05
City Population
No. of Poor No. of Poor as a
(in lakhs) (in lakhs)
Percentage of
Population
Chennai 39.11 3.42 8.74
Kolkata 41.44 0.95 2.29 Ahmedabad 28.08 3.72 13.25
Jaipur 25.17 10.64 42.27
Indore 14.83 2.51 16.93 Guwahati (Kamrup) 5.67 0.17 3.00
Total 154.30 21.41 13.88
All India Urban Population * 3143.81 807.96 25.70 Percentage of Total to All 4.91 2.65 53.99
India Urban Population Source: Estimates Based on National Sample Survey Unit Level Data Analysis, 2004-05.
* Planning Commission, Government of India – 2007.
13.25
8.74
3.00
16.93
42.27
2.29
0
5
10
15
20
25
30
35
40
45
Ahmedabad Chennai Guwahati
(Kamrup)
Indore Jaipur Kolkata
Urban Poverty Head-Count Ratio
Figure 1.1: City-specific Urban Poverty Head-Count Ratio: 2004-05
1.6 Government Programmes: Some New Initiatives
While the focus on urban poverty reduction languished for many years, in recent times a
new thrust and priority has been given to this growing problem. Important among the

10
new initiatives are the Jawaharlal Nehru Urban Renewal Mission (JNNURM), a modified
Swarna Jayanti Shahari Rojgar Yojana (SJSRY), and the Rajiv Awas Yojana (RAY).
Rajiv Awas Yojana envisages tackling the issues of inclusive growth and slum-
free-cities, including basic amenities and affordable housing to the existing slum-dwellers
as well as new additions to the number of poor due to urban growth. It emphasizes that
States/UTs develop a slum-free State/UT/Cities vision and develop a legal framework for
regularizing space and accord property rights to the slum-dwellers as well as create
space for the poor and new entrants to cities as they grow. It proposes a four-pronged
approach:
(i) „in situ‟ development programmes with basic amenities and an enabling strategy
for affordable housing in the case of „tenable‟ slums, with reconfiguration to the
extent possible based on town planning norms of the State/UT concerned;
(ii) Development in „relocation‟ sites with affordable housing and access to all basic
amenities, including easy access of public transportation to commute to jobs for
rehabilitating the „untenable‟ slums; efforts will first be made to re-examine the
issue of so-called „untenability‟ and whether the untenable slums could be settled
in tenable slums with densification based on city-wise slum upgrading approach;
(iii) Housing and civic development programmes in peripheries of existing cities and
towns to accommodate the urban poor including migrants, with a focus on
public-private partnerships and requiring/incentivising developers to adopt
inclusive zoning and reserve land/houses for the poor; and
(iv) Integrated-and-inclusive new townships around emerging hubs of industry, trade
and commerce, including Special Economic Zones (SEZs) with adequate space for
housing the poor and informal sector workers as part of the location policy for
those entities.
To develop a suitable city level strategy RAY will take up an „equitable cities
campaign‟ in select cities /municipalities. These cities will enable to draw up
development and action plans within the state specific plan/policy, and to operationalise
them to upgrade or rehabilitate existing slums and make new land and housing available
for the urban poor within the formal planning system at least at the rate of their growth
in population. The RAY emphasizes taking a whole city (preferably city agglomeration)

11
approach, mapping all existing slums and deficiencies therein, and undertaking a
complete household biometric survey with identification numbers.
The objectives of the revised (with modified guidelines) Swarna Jayanti Shahari
Rojgar Yojana (SJSRY) are:
Addressing urban poverty alleviation through gainful employment to the
urban unemployed or underemployed poor by encouraging them to set up self-
employment ventures (individual or group), with support for their sustainability;
Supporting skill development and training programmes to enable the urban poor
have access to employment opportunities opened up by the market or to
undertake self-employment; and
Empowering the community to tackle the issues of urban poverty through
suitable self-managed community structures like Neighbourhood Groups (NHGs),
Neighbourhood Committees (NHC), and Community Development Society (CDS).
The delivery of inputs under the scheme shall be through the medium of urban
local bodies and community structures. Thus, SJSRY seeks to strengthen these local
bodies and community organizations to enable them address the issues of employment
and income generation facing the urban poor.
It may however be remembered that slum clearance schemes in India are quite
old. The success so far has been limited because of legal, administrative, and financial
hurdles. Also, the approach so far has not been holistic. Slums require to be viewed as
part of the larger problem of housing and mass deprivation that confronts a city. There
has to be realistic recognition of the constraints so that measures are devised to
overcome these. Accessing urban land for housing the poor in a high-value real estate
market will continue to be a serious challenge. There will be an urgent need to create
land banks through appropriate land-use zoning. Substantial financial allocations from the
central, state, and local governments will also be required.
Given this context, the new initiative in terms of these two programmes are
welcome and would provide a significant breakthrough if these are followed up by a city-
based strategy for reducing urban poverty supplemented by effective support by the
state governments.

12
1.7 Chapter Outline
This study is mainly based on secondary data and draws its insights based on (a) the
evolution of city-specific poverty, (b) inter-city comparisons, and (c) differential success
of a common set of urban poverty reduction programmes of the central government.
The presentation is divided into six Chapters. While Chapter 1 provided
introduction and overview of the study, Chapter 2 examines the poverty profile and
changes in the demographic conditions of the cities. The poverty estimates are based on
National Sample Survey data as well as available city/local government estimates.
Problems of slum population as well as their poverty levels are discussed in detail.
Chapter 3 examines employment and unemployment scenario in the selected five cities
and also profiles the economic activities of these cities. Chapter 4 provides a review of
local government finances and the role that service provision by the local governments
play in the context of urban poverty reduction. Chapter 5 reviews the various
programmes and initiatives of the central and the concerned state governments aimed at
urban poverty reduction. Chapter 6 outlines the common and city-specific poverty
reduction strategies.
1.8 Future Research
There is considerable paucity of data and documentation regarding how many and who
the urban poor are, where they live, what funds are needed to achieve a given reduction
in the poverty head count ratio. There is hardly any information the relative efficiency
and impact of the large number of urban poverty alleviation programmes. There is a
need to build up capacity at the local level for better and more authentic data and
documentation about city-based poverty.

13
Chapter 2
PROFILE OF URBAN POVERTY AND DEMOGRAPHIC DYNAMICS
Though poverty is normally measured by the ratio of population below the stipulated
poverty line, the dimensions of urban poverty vary across cities. Several factors impact
urban poverty and quality of life of the poor. Based on the demographic characteristics
such as the rate of urbanization, population density, migration, location of job
opportunities, pattern of city growth, quality of the slum amenities, overall efficiency of
the city in delivering the basic services, the attitude of the authorities towards the slums
and land rights.
In this Chapter, we have made an attempt to study the poverty profile of the
cities in terms of it demographic background, estimated number of people below poverty
line the characteristics of the poverty groups, slum population and the problems of slums.
It enables us to assess the situation well and provide insights into the variations in
pattern of city growth, poverty and employment. This chapter is structured in four parts.
Section 2.1 discusses the demographic profile by examining the statistics and
characteristics of the city population. Poverty profile is analysed in Section 2.2 through
estimates of the number of poor and their characteristics. Slum population and amenities
in the slums are discussed for the five cities in Section 2.3, and Section 2.4 looks at the
demographic dynamics and urban poverty.
2.1 Demographic Profile: Population Growth of the Cities
Average annual compound rates of growth of population of Chennai, Kolkata, and
Ahmedabad Municipal Corporation areas or core city areas between 1991 and 2001 are
rather low. The lowest being that of Kolkata at 0.40 percent, followed by Chennai at 0.94
and Ahmedabad at 1.75. All of them are much lower than the growth rates for urban
population at 2.73 percent for urban India. Further, in all the three cities there has been
a higher rate of growth of population in the urban agglomeration compared to the core
city. The core cities are losing population as in Chennai or losing population in some
wards as in Kolkata or in the middle of the city as in Ahmedabad. No doubt urbanization
is decelerating in the core cities or parts of the core cities, much faster than the rest of
the urban agglomeration. In the case of these three cities, the urbanization was much
faster in the urban agglomeration compared to the core city for several reasons. The
densities of the core city have been very high and much higher than that of the suburbs.

14
It possibly indicates a saturation point to absorb additional population. The increase in
the real estate prices also make the core city suitable for office complexes, businesses
and less suitable for residential purposes, the rich preferring to move to the well planned
suburbs and the poor to the cheaper suburbs.
In contrast the core cities of Jaipur, Indore and Guwahati have grown very fast
showing an average annual population growth rates exceeding 3 percent, between 1991
and 2001. These three cities are relatively smaller, Guwahati being the smallest with less
than a million people. Jaipur has been the fastest growing city at a growth rate of 4.77
percent followed by Indore at 3.88 percent and Guwahati at 3.26 percent. The core city
areas have changed between the census years of 1991 and 2001 and hence the growth
of the population is due to three reasons; addition to the population already living in the
new areas, migration from outside and natural increase. However, it is not possible to
exactly explain the contribution due to each of these causes as the details are not
available. The changes in the density of the city area clearly show that a substantial
portion of the growth could be due to changes in the migration of population into the
urban areas of these cities. The area of all the cities except Kolkata appears to be rather
stable. Other information on the wards of the city also helps to assess the situation. The
core city areas of Jaipur city limits said to have expanded substantially including a
number of rural areas only in 2004.
The two sets of cities have specific reasons accounting for the differential in the
rate of urbanization in the last decade. Jaipur, Indore and Guwahati are relatively big
urban centres in the states which are less urbanized and mostly surrounded by rural
areas with fewer employment opportunities. In Madhya Pradesh, Indore is bigger than
Bhopal and more commercialized than Bhopal. The urbanization of core city is important
because the suburbs of city and especially the outskirts are more rural and lack the basic
infrastructure and employment opportunities in formal as well as informal sectors, unlike
the bigger cities which are expanding with satellite towns and urban out-growths. The
core cities of Jaipur, Indore and Guwahati are relatively less dense than those of
Chennai, Kolkata and Ahmedabad. They lack the basic amenities and infrastructure. The
very fact that they are attracting a large number of people indicates that migrants were
in search of work. The next important question is whether urban migration has a positive
impact on their incomes showing a reduction in poverty. It is distress migration if there is
an increase in poverty. The issue of demographic dynamics is discussed on the basis of
information given in Table 2.1 and Figure 2.1.

15
Table 2.1: Core City Population, Area, Density and Growth Rates
City
Population (Persons)
Density (per. Sq.
km.)
Area in Sq.km.
Growth Rate 1991-01
(in percent)
1991 2001 1991 2001 1991 2001 City Distric
t
Chennai
379502
8 4216268
2232
4
2423
1
170.0
0
174.0
0 0.94 1.22
Kolkata
439981
9 4580544
3248
7
3203
7
185.3
9
271.3
1 0.40 0.04
Ahmedabad
2876710 3520085
15039
18445
191.28
190.84 1.75 1.91
Jaipur 130063
1 2322745 5958 8054 218.3
0 288.4
1 4.77 1.06
Indore 110400
0 1639000 8482 1259
1 130.1
6 130.1
7 3.88 2.90
Guwahati 584342 809895 2705 3741
216.7
9
216.7
9 3.26 2.32 Source: City Development Reports.
8.54
22.65
35.18 38.30
48.44
-1.39
-10.00
0.00
10.00
20.00
30.00
40.00
50.00
60.00
Kolkata Chennai Ahmedabad Jaipur Guwahati Indore
(Per
cen
tag
e)
Figure 2.1: Percentage Change in Population Density from 1991 to 2001
Chennai

16
Chennai city is said to be losing population but the municipalities and towns in the
agglomeration are gaining population. Chennai Urban Agglomeration (CUA) is spread
over an area of 571.93 sq. km and the Chennai Metropolitan Area (CMA) is spread over
an area of about 1177 sq. km. Chennai city covers an area of about 174 sq. km. The
population density of the Chennai city was 24,231 persons per sq. km as per the 2001
census. The gross density of the CMA has been increasing from a mere 1813 persons per
sq. km in 1961 to 5982 persons per sq. km in 2001 as per the respective census figures.
The decadal change in percentage growth has been decelerating. Rather the urban
population growth has been decelerating and yet the density of population is very high.
As per census reports, in Chennai city an out-migration of 10.41 lakhs (27
percent of the total population) was noted during 1981-91. Also, during 1991-01, an out-
migration of 10.34 lakhs (24 percent of the 2001 population) was noted. Though there
were large scale building construction activities noted during the above periods, the out-
migration of resident population from Chennai city proves that considerable conversion of
residential premises into non-residential mostly for office, shopping, hotels and other
commercial purposes took place.
Kolkata
The Kolkata core city has lost population in several city blocks. However the population of
other municipal corporations and municipalities and census towns etc., in the Kolkata
agglomeration has been growing much faster. Kolkata Municipal Corporation‟s share in
Kolkata Metropolitan Area‟s (KMA) population fell continuously from 46.8 percent in 1961
to 31.1 percent in 2001. As opposed to this, the shares of all other districts except
Howrah have risen over time. The 2001 census reports a total population of 45.81 lakhs
in Kolkata Municipal Corporation. The present population growth rate is 0.4 percent,
imply that the growth due to natural causes or immigration is matched by the decrease in
the population due to death or other factors. One notable feature is that the population
density increase is due to the enlargement of the Kolkata Municipal Corporation (KMC)
area (from 100 wards to 141 wards) and the subsequent urban development in the
added area. This however may not reflect the trend. The decennial growth of urban
population in the KMC area was 22 percent in 1981 and 33.7 percent in 1991.
The contribution of different constituent units to KMA population over time shows
that in the decades of 1961 and 1971, the three municipal corporations (Kolkata, Howrah
and Chandannagar) accounted for more than half of KMA‟s population, which thereafter
gradually fell to 39.0 percent in 2001. On the other hand, the percentage of KMA

17
population living in smaller municipalities has been consistently rising, registering an
increase from 31.3 percent in 1961 to 45.1 percent in 2001. The percentage of
population living in other units like census towns‟, urban outgrowths and rural units has
also shown increasing trend over this period, though understandably their contribution
remained very small.
More recent details about migration between 1991 and 2001 are not known
except the conjuncture that the population in the Kolkata Municipal Corporation area has
been declining would mean out-migration from some of the core city areas. A study by
Centre for Studies in Social Sciences (CSSS), Kolkata examined this aspect in 2002. The
starting premise of the study is the fall in the population density of Kolkata, which
showed up in the 1991 and 2001 censuses. The census figures reveal that there has
been a population decline in as many as 60 wards, with 12 wards showing a continuous
decline for three successive censuses. This includes a staggering decline of 56 percent in
Ward 23 (Bartala) and 55 percent in Ward 87 (Lake Market). On the other hand, there
has been a growth of population in the “added areas” - Behala, Jadavpur and Garia and
in Salt Lake. According to Partha Chatterjee, the migration out of Kolkata is in significant
contrast to other Indian metros as well as other third world cities where the “standard
pattern is a growing population” (Times of India, July 2002).
Ahmedabad
The greater Ahmedabad urban agglomeration is an amalgam covering an area of about
4200 sq. km. Out of this (a) an area of 190 square kilometers is under the jurisdiction of
Ahmedabad Municipal Corporation (AMC), (b) 150 villages in the periphery of the city are
under the jurisdiction of Ahmedabad Urban Development Authority (AUDA), (c) 9
Municipalities in the periphery of the city are under the jurisdiction of Ahmedabad Urban
Development Authority (AUDA) consisting of 1330.8 kilometers, (d) Gandhinagar and the
surrounding villages, and (e) Chatral, Bhopal and other surrounding villages adjoining
AUDA limits. As per the census, the Ahmedabad urban agglomeration area (AUA) has
about 350 sq. km.
The area within the AMC limits consists of: (1) the traditional city centre within
the fort walls with relatively high-density of population, large concentration of commercial
activities and narrow streets, (2) eastern sector accommodating large and small
industries and low income residential areas, and (3) a well planned western sector with
wide roads accommodating major institutions and high-income residential areas. The
population growth in the peripheral areas is more rapid than the areas within the city
limits. The inner city has negative population growth. This is partly due to the saturation

18
of population within the city area and the consequent large-scale housing development in
the peripheral areas.
The population in the AMC limits increased to 35.15 lakhs in 2001 from 28.77
lakhs in 1991. The population in AUDA area in 1991 was 38.75 lakhs. The AUA housed
23.25 percent of the state‟s urban population in 1991, which has gone up to about 25
percent in 2001. Urban population of Gujarat is not concentrated in the Ahmedabad city.
Urban population of Gujarat is spread evenly across other class one cities of million plus
population in the state. In the recent years, the economic development shifted away
from Ahmedabad city to the cities such as Surat and other cities where the petro-
chemical industries are being set up. The contrasting spatial patterns observed in the
eastern and western areas of AMC have extended into the peripheral areas in the same
manner. The western part is experiencing more rapid growth than the eastern part.
Rapid growth in the form of ribbon corridor development along the Sarkhej -
Gandhinagar highway is being witnessed during the 1990‟s. These trends are likely to
intensify further in the coming decades.
Jaipur
The Jaipur region which is included in the Jaipur Development Plan by the Jaipur
Development Authority (JDA) has an extent of 1464 sq. km. The area of Jaipur Municipal
Corporation has grown from 200 sq. km in 1981 to 218 sq. km in 1991 to 288 sq. km in
2001. Jaipur has a population of 23.2 lakhs and experienced an annual compound growth
rate of about 4.6 percent for the period 1991-01. The very fact that the Jaipur Municipal
Corporation (JMC) area has increased only by 70 sq. km but the population density has
gone up from 5958 persons per sq. km to 8054 per sq. km, in itself shows that there has
been a huge influx of population into the city of Jaipur, leaving alone the slight expansion
of area. Probably this is one of the reasons for expanding the municipal corporation area
of Jaipur to a much larger area in 2004. The details are unfortunately not available to
assess whether it helped to reduce the density of the older municipal corporation area.
The population of Jaipur area that comes under Jaipur development authority
has increased from 18.7 lakhs in 1991 to 26.8 lakhs in 2001. In terms of share, 87
percent of the total population lives in the JMC area. In 2001 the walled city within Jaipur
city had the highest density of 58,207 persons per sq. km., though the density in 2001
was lower than that of 1991 (74,000 persons per sq. km). Thus, it appears that the
walled city has lost population. However, it is very much a part of the Jaipur Municipal
Corporation.

19
Indore
The population of Indore city increased from 57,235 persons in the year 1911 to 15.42
lakhs in 2001. The annual compound rate of growth of population has historically varied
over decades. It was about 3.88 percent between 1991 and 2001. This was higher than
the compound rate of growth of population between 1991 and 1981, which was only
2.80 percent. What is also important to note was that the area of the municipal district
has remained unchanged between 1991 and 2001. The total population growth was due
to migration and natural increase during this period. A rough estimation of the rate of
migration for Indore city between 2001 and 1991 after adjusting for natural increase
based on sample registration surveys for urban Madhya Pradesh was 2.23 percent for the
core city.1 Thus most of the population increase could be attributed to migration. The
urban population growth rate of Indore has been higher than the national urban
population growth rate of about 2.78 percent and the state (Madhya Pradesh) urban
population growth rate of about 2.83 percent, indicating rapid urbanization of Indore.
Indore city with an annual compound rate of growth of population of 3.36 percent has
also been named as one of the world‟s fastest growing cities by the study conducted by
Price Water House Cooper (2005). The high rate of growth of population observed could
be due to rapid industrial and commercial development in Indore city planning area. Not
only the population of municipal corporation but also the population of Indore planning
area (urban agglomeration consisting of nearby villages and satellite small towns) seems
to have increased.
Guwahati
Guwahati is the fastest growing city in Assam. Among the northeastern states, Assam has
the lowest urbanization and Mizoram is the most urbanized state. While the share of
urban population to total population of Assam in 1951 was only 4.29 percent, it has
increased to 12.1 percent in 2001, which is still lower than the national average of 27.78
percent. Guwahati is the largest urban centre in Assam with 23.89 percent of the total
urban population of the state. Among all the districts of Assam, Kamrup is the most
urbanized with 35.81 percent urbanization. The annual compound rate of growth of
population was 2.32 percent for the Kamrup district between 1991 and 2000, indicating a
growing urban agglomeration.
1 MSSRF and WFP (2002).

20
Guwahati is a fast growing metropolis and the most important city of the region.
The city with a population of 8.09 lakhs (Census 2001) is by far the largest settlement,
while Shillong and Imphal, with population size of only 2.7 and 2.5 lakhs respectively are
second and third largest cities in the north eastern region. The population of Guwahati
Metropolitan Area has grown almost 6.5 times between 1971 and 2001. The municipal
limit of the city during the period increased from 43.82 sq. km in 1971 to 216.79 sq. km
in 1991 and remained at the same level in 2001. The average annual compound rate of
growth of population over the decade between the census years has been 3.26 percent,
much higher than that of urban India. The density of 3741 is moderate for a city. Yet
over a decade the density increased by more than 1000 persons per sq. km. However,
the growth in density has been largely skewed resulting in congestion in certain pockets.
Density was higher in the middle of the city which is highly commercialized.
2.2 Poverty Profile
Based on the NSS data it is possible to get an estimate of the magnitude of poverty, the
socio-economic characteristics of the poverty groups, and their occupational structure
and literacy levels. The estimates of the below poverty line population differs from one
source to the other. Normally at the city level we get information on the percent of poor
below the specified state specific poverty line defined by the Planning Commission.
Municipal Corporations give their own estimates based on the Planning Commission‟s
definition of state specific urban poverty line or they go by their own process of
recognising the poor. Another source is the number of persons holding the BPL ration
cards and other cards for people who are recognized as the most needy among the poor
(Annapurna Anna Yojana card) issued by the city. Some times city level information may
not be available on BPL cards as it is consolidated for the urban and rural areas of the
state. NSS data provide an independent source for estimating the percentage of
population below the given urban poverty line of the state, presuming that it applies to
the city.
2.2.1 Magnitude of Poverty
All the estimates have their own unknown margins of error. Municipal Corporation is
expected to have more accurate information, judging from the knowledge they have
about the city and its population and data collection for various purposes. However,
many corporations do not undertake a comprehensive survey. The BPL cards are issued
based either on self selection, i.e. applications received from the general public. Some
times erroneous targeting may include non poor among the BPL card holders and also
exclude a number of those below the poverty line. People also may not apply for cards if

21
the public distribution system does not work well. However in the cities studied, it was
not possible to get the data on the BPL cards issued in the city. Normally data are
consolidated for the state. From the city development reports, we could not get
information on the percent of BPL card holders, Antyodaya Anna Yojana card holders or
the number of those getting some kind of food assistance for any other city except for
Indore. The main problem with the National Sample Survey data is that the sample
becomes too small for some cities such as Indore and Jaipur and may not represent the
reality as it may miss out certain sections of population, who live on the pavements and
may under-represent certain other sections or over represent areas in which poverty is
concentrated.
Within the limitations of the data, we find that poverty in the five cities studied
has declined substantially in four cities and increased only in one city, the city of Jaipur.
It is not a reflection of urban poverty. This may be because the National Sample Survey
samples mostly pertain to the municipal corporation areas and do not reflect the poverty
in the entire agglomeration. Northeast in general has lower levels of poverty and hence,
Guwahati (represented by Kamrup district which is 35 percent urban) also has low levels
of poverty. When we supplement the information with the study of City Development
Reports prepared by the city authorities, it is shown that the satellite towns and
municipalities in the urban agglomeration experience higher levels of poverty than the
core city. Jaipur is an exception. Out of the three cities for which urbanization
(represented by the annual rate of growth of population) is very high, two of them
experienced reduction in poverty, while Jaipur experienced substantial increase in
poverty.

22
2.94
32.6
20.00 18.9
2.28
42.28
16.94
8.74 13.23
15.9 17.7 13.5
0.00
5.00
10.00
15.00
20.00
25.00
30.00
35.00
40.00
45.00
Kolkata Guwahati Chennai Ahmedabad Indore Jaipur
Percentage
Percentage of Population in Below Poverty Line, 2004-05 Percentage of Slum Population to Total Population, 2001
Figure 2.2: Percentage of Population Below Poverty Line
Source: Based on the Unit Level Data of NSS for 2004-05 and Dubey and Mahadevia
(2001) for 1993-94.
Chennai
As per National Sample Survey, the percentage of population below the state specific
urban poverty line of Rs. 547.42 per capita per month for the year 2004-05, is given by
the Planning Commission is quite low at 8.74 percent2 (Chart 2.2). Over the period form
1993-94 to 2004-05, Chennai city district consisting of Chennai Municipal Corporation
area has experienced substantial reduction in poverty. As per the government of Tamil
Nadu, the percentage of population below the poverty line has come down from 31.58
percent in 1993-94 to 9.58 percent during 1999-00, in the municipal corporation city
area. However, the incidence of poverty was not low in the Chennai urban
agglomeration.
In the other municipalities of the urban agglomeration outside Chennai district,
the poverty ratios are quite high at about 28 percent in 2004, though there has been a
decline over the period from 37.73 percent in 1998. In 2004, high levels of poverty were
reported in Kathivakkam, Pallavaram, Alandur and Avadi exceeding 40 percent of the
population. Such a concentration of poverty in the suburbs of the city and an expanding
2 Based on the analysis of unit level NSS data of 2004-05 by the authors.

23
urban agglomeration is common due to the changes in the economic activity that lead to
location of industries at the outskirts of the city. Increase in the cost of housing within
the city as well as the re-settlements offered to the poor in the suburbs may also lead to
higher levels of poverty outside the corporation limits.
Kolkata
As per the unit level NSS data for Calcutta city in 1993-94, the percentage of population
below poverty line was 9 percent (see Dubey and Mahadevia, 2001). It seems to have
fallen further to 6.44 percent in 1999-00 and to a mere 2.28 percent in the year 2004-05.
However earlier, Kolkata Metropolitan Development Authority, in the report on Socio-
Economic Profile of Households in Kolkata Metropolitan Area brought out in 1996-97
defined poverty line of Rs. 308.20 or less per-capita in that year and estimated that 19
percent of households in Kolkata Metropolitan area as poor. At the same time, on the
basis of calorie intake criteria, the estimated poverty level was found to be 34 percent for
KMA. The Kolkata urban agglomeration, thus appear to have higher poverty than the
Kolkata city in 1993-94. Similar to the case of Chennai city poverty in Kolkata city has
fallen but the areas out side the municipal corporation obviously experience much larger
level of poverty.
In 2004-05 the urban poverty in West Bengal was 14.8 percent. Historically
urban poverty is less than rural poverty in West Bengal, unlike some states such as
Maharashtra and Andhra Pradesh, where urban poverty was higher than rural poverty in
2004-05. Urban poverty in West Bengal was also lower than the all India level of 28.3
percent in 2004-05. The overall urban poverty in urban West Bengal has fallen to about
15 percent in 2004-05 as per NSSO survey, from 23 percent in 1993-94. The rate of
decline in urban poverty has been found to be fastest in West Bengal among the major
states of India. Since the urban population of Kolkata Metropolitan Area constitutes 89
percent of the total urban population of West Bengal, it appears that the Kolkata
Municipal Corporation area had very little poverty of 2.28 percent in 2004-05, while the
rest of poverty is dispersed in the urban agglomeration surrounding the core city of
Kolkata.
Ahmedabad
According to the National Sample Survey unit level analysis in 1993-94 about 32.81
percent of the population was below poverty line in the city of Ahmedabad (see Dubey
and Mahadevia, 2001). A unit level analysis of the NSS data in 2004-05 shows that only
13.23 percent of the total population is below poverty line. There was substantial

24
reduction over time in poverty in the Ahmedabad city which consists of only the Municipal
corporation areas.3 However the 1999-00 unit level data shows that the percentage of
people below poverty line in Ahmedabad city was 11.98, lower than the 2004-05 level.
The 55th round data for 1999-00 and that of 2004-05 are not strictly comparable.
Jaipur
As per the Jaipur municipal corporation sources, 16 percent of the population is below
the poverty line in Jaipur. In absolute terms, the total population below poverty line is
only 1.5 lakhs. As per the Municipal Corporation data, Jaipur city has six zones. The
largest proportion of poor is in Hawa Mahal which is the east zone of Jaipur and includes
the walled city. 20 percent of the population in the walled city was estimated to be poor.
The walled city can be characterized as one of the poorest areas of the city, though it is
the commercial nucleus of the city. The poverty line and the method of assessment are
not clear from the report of the city development plan. In stark contrast, the estimated
percentage of population in the city of Jaipur was higher both in 1993-94 as well as in
2004-05 as per National Sample Survey. Based on the NSS unit level data the percentage
of population below poverty line of urban Rajasthan was assessed at 19.28 percent in
1993-94. As per Planning Commission estimates, the urban poverty line for Rajasthan
was Rs. 559.63 in 2004-05. The percentage of population below the poverty line
estimated in this study based on the unit level data of the NSS appears to be very high at
42.48 in Jaipur city, compared to 32.2 for urban Rajasthan as a whole in the same year.
It appears that the urban poverty is higher in Rajasthan and even higher in Jaipur city.
This is probably due to the fast growing population of Jaipur city over a period of time,
which appears to be faster than that of urban India. The problem also could be migration
of large number of illiterate persons from other parts of the state who earn very little.4
Indore
If we go by the National Sample Surveys, city level data, the percentage of population
below the urban poverty line in Indore was 37.98 percent in 1993-94 (see Dubey and
Mahadevia, 2001). It declined to 24.69 percent in 1999-00 and fell further to 16.94
3 The estimated population of Ahmedabad city as per National Sample survey in 2004-05 was 30.7
lakhs. This appears to be close to the 2001 population estimation of the Ahmedabad Municipal
corporation area alone at 35.20 lakhs. Hence, the NSS data is presumed to pertain to the
Ahmedabad municipal corporation area alone. 4 As against this the poverty in Jaipur city was very low in 1999-00 at about 4.61 percent. It had
shot up to 42.28 percent in 2004-05. This could also be due to problem with 1999-00 data. The
data for 1993-94 and 2004-05 appear compatible.

25
percent in 2004-05. Strictly speaking, while 1999-00 NSS data are not comparable with
the other years, 1993-94 data are comparable with 2004-05 data. As per the city
development report, about 17.7 percent of the households are below poverty line, while
the economically weaker sections are 29.5 percent. Economically weaker sections are
defined as those getting an income of less than Rs. 2500 per month. As per the survey
sponsored by the UNDP recently, about 69,044 people applied for the BPL cards and the
government approved 54,392 BPL cards. Another 10,000 ration cards are issued under
Antyodaya Anna Yojana Programme. Thus a total of the number of people holding BPL or
AAY cards constitutes only 4.3 percent of the total population of Indore city.
Guwahati
As per the City Development Report of 2006, for the municipal area of the city of
Guwahati, percentage of population below the poverty line was 31.1 percent. Compared
to the high estimate of 31.1 percent for Guwahati, the national sample survey estimate of
poverty for the Kamrup district is very low level of 2.94 percent. Probably it is due to the
concentration of slums only in the city area while the urban agglomeration and the
district itself is quite prosperous. The core city municipal corporation area population has
grown faster than the metropolitan development area that includes more areas and
population. The district of Kamrup has much more population and much less growth rate
in population. Probably the prosperity of the oil refining and related impact on incomes in
the surrounding areas is more apparent on the population of Kamrup district compared to
the municipal corporation area of Guwahati into which people migrate for work related to
commercial activities.
On some occasions the core city has less poverty compared to the urban
settlements and satellite towns out side the city as in the case of Chennai and Calcutta.
In Guwahati the core city seems to have more poverty than the entire district. In Assam
urban poverty is also very low at 3.3 percent in 2004-05, while the rural poverty is high
at 22.3 percent. The migration data also shows that a quarter of the total population is
that of migrants at some time or other. A sizable percent of them also come from the
rural areas of the state, though the share of the total decadal migration from rural areas
is not known.
2.2.2 Socio-economic and Other Characteristics of the Poor
The analysis in this section is based on the unit level NSS data on BPL population and
total population with respect to social groups, literacy levels, household types and decile-
distribution. The industrial classification is based on the occupation of the head of the

26
household. Though data for 1999-00 and 2004-05 are not strictly comparable, they have
been used only when the differences are strikingly large (for details relating to the year
2004-05 see Annexure Tables A1-A4).
Chennai
Poverty rates have declined substantially in all the social groups compared to the
situation in 1999-00 as per the unit level data of NSS. However what is interesting is that
there are probably more migrants who belonged to SC and ST categories, swelling the
percentage of SC and ST population from about 10 percent in 1999-00 to about 19.37
percent in 2004-05. Though the incidence of poverty has declined in this category from
38.77 to 23.32 percent over time, there are more SC and ST category among the poverty
group in 2004-05. Only about 30 percent of the poor belonged to SC and ST in 1999-00.
About 52 percent of the poor belong to SC and ST category in 2004-05.
If we look at the occupation of the head of the household, we find poverty is
concentrated in agricultural related occupations followed by construction and
manufacturing. However, numberwise 33.62 lakh poor households depended on
manufacturing sector and 20.97 lakh households depended on construction. Poverty is
also estimated at 16.52 percent in households depending upon services such as
education, health, administration etc
The incidence of poverty is high among the illiterates and those who have
attained the education level only up to primary. It substantially declines only after the
educational attainment of higher secondary level. Poverty is higher at 27.68 percent
among the illiterate population of Chennai followed by 23.14 percent among those who
have achieved literacy level lower than primary education. A large number of poor are
illiterate and the incidence of poverty is also high among them. Literacy no doubt
reduced poverty, but functional literacy level is probably achieved only beyond higher
secondary level. The incidence of poverty is seen to decline rapidly with higher levels of
educational attainment to as low as 0.20 percent, beyond higher secondary level.
In 2004-05, an average monthly per capita monthly expenditure of the top ten
percent was 9.61 times higher than the average per capita monthly expenditure of the
lowest ten percent.
Kolkata

27
As per the national sample survey unit level data (city sample), population below poverty
line in 2004-05 in the Kolkata Municipal Corporation area was less than one lakh people.
The scheduled castes and scheduled tribes population was only 14 percent of the total
population. Poverty in Kolkata is concentrated more among the castes other than SC and
ST and OBCs. Most of the poor (81 percent) belong to the category of others in 2004-05.
It is interesting to note that about 41.10 percent of the poor in 1999-00 belonged to SC
and ST while only 4.43 percent of the poor were SC and ST in 2004-05. This is to be
taken as a massive reduction in poverty among the SC and ST population from 1999-00
to 2004-05. If the NSS sample is to be taken as representative, the total population of
the city corporation area increased over this period and most of the people who moved in
were above the poverty line. Thus it appears that the dynamics of the population
movement attracted fewer poor and more non-poor. The poor however increased in
absolute number from a mere 28000 in 1999-00 to 95000 in 2004-05.
The NSS results show that the incidence of poverty was highest among the
construction worker households. About 30 percent of the poor belonged to the
construction worker households. A number of poor also belong to manufacturing
households, though the incidence of poverty in this group is very small. Since there are
more persons who belong to the manufacturing households the share of the
manufacturing households in the overall poverty increased. A similar pattern was
observed for retail and wholesale trade, motor repair services etc. Roughly about 15
percent of the poor belonged to manufacturing and trade plus repair services.
Of the total population in the Kolkata Municipal corporation area, 13.63 percent
are illiterate. The rest are literate. About 11.25 percent had achieved educational
qualifications below the primary level. Low levels of poverty are normally associated with
higher levels of literacy. About 56 percent of the poor are illiterate. Poverty is higher
among the illiterates than literates. Poverty persists in all educational categories though it
falls rapidly with higher educational qualifications.
Distribution of the population among various per capita monthly expenditure
classes show that population has been shifting to higher expenditure classes and the
mean incomes are increasing. The inequality in the distribution of income is apparent
from the distribution as per deciles. The average monthly per capita expenditure of the
top ten percent was 8.48 times higher than that of the lowest ten percent in 1999-00. In
2004-05 we find that the gap between the top and the bottom deciles widened. The

28
monthly average per capita expenditure of the top ten percent was 10.87 times higher
than that of that of the lower ten percent.
Ahmedabad
The data shows that about 60 percent of the population is non OBC and non SC and ST
in character. Though the incidence of poverty is lower in this category at 8.61 percent
compared to SC and ST population that has an incidence of about 22 percent and OBC
population that has an incidence of about 19 percent, the number of poor as well as the
share of the total poverty is high among the upper castes. Thus, about 38 percent of the
poor belong to the other category of non OBC and non SC and ST. Ahmedabad city had
3.7 lakh poor in 2004-05.
Going by the occupational status of the head of the household as per the usual
status the incidence of poverty is high for households with the head of household
working in construction industry, followed by the household dependent upon services,
such as sewage health and public administration and other services. About 48 percent of
the poor come from household types dependent upon trade and maintenance of
transport vehicles.
Only 12 percent of the population is illiterate in the Ahmedabad city. Among the
poor who are below the poverty line, 35 percent are illiterate. The incidence of poverty is
quite high at about 33 percent for those who have studied up to the primary level but
below the primary level. Literacy and educational qualification alone do not reduce
poverty substantially.
Poverty incidence was high at 28 percent even among those who have achieved
the educational qualifications of the middle school level. Obviously education becomes
useful only if a person achieves functional education. Only after the achievement of the
educational level of higher secondary level, we find some evidence of a positive impact of
education. Poverty levels are as low as 1.51 percent for this group. Several NSS surveys
have shown that the incidence of poverty is low for the group that completes the higher
secondary level and has a functional diploma relevant to the work. Incidence of poverty
is higher at higher levels of education, probably due to two reasons. Those (especially
women), who go out of labour force for other reasons and want to re-enter the labour
force find it difficult to re-enter even if they hold higher educational qualifications.
Further, those whose skills and knowledge has no application also do not get a job even
if they achieve higher educational qualification. Age, sex, community, caste and
physically challenged status, some times act as barriers, keeping the educated people in

29
poverty. In 2004-05, an average monthly per capita expenditure of the top ten percent
was 7.49 times higher than the average per capita monthly expenditure of the lowest ten
percent. In 1999-00 the difference was higher at 11.33 times. Thus there was reduction
in the inequality, quite unlike many metropolitan cities where the inequality increased
over the same period.
Jaipur
The distribution of the total population of the Jaipur city among various social classes
indicates that the non OBC and non SC and ST who belong to the other categories
constitutes about 51 percent of the city‟s population. Those belonging to SC and ST and
OBCs were 30.79 and 18.22, respectively.
Among various social classes poverty rate has been close to 67 percent among
the SC and ST households. Poverty was high even among the backward classes (OBCs),
at about 55 percent. Even among others (other than SC, ST, OBCs) about 22.83 percent
are poor. On the whole, 42.28 percent are poor in Jaipur in 2004-05. Most of the poor
are concentrated in the households whose head is engaged in transport storage and
communications (59 percent) followed by hotel and restaurant services (57 percent).
Many of those engaged in construction (48 percent) and manufacturing (39 percent)
were also poor. The poorest of them all are in urban agriculture (66 percent). The
absolute number of poor is the highest in manufacturing.
About 50 percent of the population below poverty line are either illiterate or had
education below the primary level. About 76 percent of those who have completed higher
secondary education were also poor, indicating that unless literacy is functional,
educational achievement does not translate into acquiring the skills needed to get rid of
poverty. The irrelevance of education level even at higher secondary levels could be due
to lack of opportunities for certain types of jobs that require literacy or the non functional
nature of literacy or both.
In 2004-05, the average monthly per capita expenditure of the top ten percent is
15 times higher at Rs. 5245 compared to the average monthly per capita expenditure of
the lowest ten percent at Rs. 348. The inequality in consumption distribution was much
lower in 1999-2000, where the top ten percent had an average monthly per capita
expenditure of only about 7 times more than the lowest ten percent of the population.
Indore

30
As per the NSS data, 65.92 percent urban population of Indore belongs to castes other
than SC and ST, and other backward castes. Poverty appears to be spread across the
social groups in 2004-05. Though, the incidence (poverty rate) seems to be higher
among the OBCs at 28.83 percent, more than half of the 2.51 lakh BPL population
belongs to the castes other than SC and ST, and OBCs. About 38.89% of the poor are
OBCs and 9.57 percent of the poor belong to the SC and ST groups and the remaining
51.54 percent belonged to higher castes. It also appears that while the overall poverty
declined the composition of the poor changed towards non OBC, and non SC and ST
groups. Distribution of the population by the Occupation of the Head of the Household
shows that the households headed by construction workers show a high incidence of
Poverty at 65.77%. Incidence of poverty was high at about 25% for workers in trade and
maintenance of motor vehicles. Since a quarter of the entire working population is
engaged in trade and maintenance of vehicles, about 36% of all poor are seen in the
household type of trade and motor vehicle maintenance. About 28% of the working
population belongs to household type-manufacturing. Incidence poverty was about
16.51% in this category in 2004-05.
Guwahati
As per the National Sample Survey data for Kamrup district, 59 percent of the population
below poverty line belongs to Scheduled Castes and Scheduled Tribes. About 64 percent
of the poor are also self-employed. There is less poverty among the casual labour
compared to self employed. About 34 percent of the poor are illiterate. Rest of the poor
are educated at higher secondary or below. 38 percent of the poor are in manufacturing
households. Consumption inequality in the Kamrup district is quite low. The top ten
percent population gets about 6.5 times more than the lowest ten percent of the
population. Poverty also appears to be concentrated in the informal sector of the city.
2.3 Slums of the Cities
2.3.1 Slum Population
As per the 2001 census, slum population was between 14 to 33 percent of the total
population of the cities studied. Kolkata appears to have the largest slum population of
32.6 percent. It appears that the slum population is higher than BPL population in
Kolkata and Chennai implying that a number of slum dwellers are not poor but
experience the problems of housing and basic amenities. In contrast, in the city of Jaipur,
poverty is very high at 42 percent while the slum population was only 15.9 percent. Most
of the houses in Jaipur are of permanent nature.

31
Table 2.2: Percentage of Slum Population to Total Population and Literacy
City
Total
Population
of the City in 2001
(million)
Slum
Population
in 2001 (million)
% of Slum
Population
to the Total
Population
Literacy Rate of
Slum Population
Poverty
Rate* of
the Total
Population (%)
Male
Female
Chennai 4.3 0.8 18.9 82.9 69.6 8.74
Kolkata 4.6 1.5 32.6 77.7 67.8 2.28 Ahmedabad 3.5 0.5 13.5 74.9 53.8 13.23
Jaipur 2.3 0.4 15.9 73.0 47.0 42.23
Indore 1.5 0.3 17.7 87.0 69.7 16.94 Source: National Institute of Urban Affairs (2008), supported by GoI-UNDP Project, July.
*Poverty rates are based on NSS 2004-05 surveys.
In Indore and Ahmedabad, the slum population as well as poverty population is
close to each other and below 20 percent which implies that many slum dwellers are
likely to be poor, though it is possible that there are poor outside the slum areas (Table
2.2). As per the city development report, there are number of slums in the Guwahati
city. It was found that there are 26 slum pockets in the Guwahati Municipal Corporation
(GMC) area covering 1.6 lakh people which constitutes about 20 percent of the
population.
Chennai
Official estimates of slum population are probably more realistic for recent years. The
estimates of slum population vary between census figures and the city authorities in
many cities. In Chennai about 819873 persons constituting 25.6 percent of the
population was reported to have inadequate access to shelter and basic services and they
are categorized as slum dwellers in Chennai as per the city development plan of Chennai
city.
Kolkata
In Kolkata, a sample survey conducted in about 500 households by Kar Kamal et. al
(1997), shows that about 19 percent of the slum population was below poverty line. The
study by Kundu (2003), with a sample of 20 slums shows 52.7 percent to be below the
poverty line. There are 2,011 registered, and 3,500 unregistered slums in Kolkata.
Poverty is as low as 2 percent and literacy rate among men is as high as 78 percent and
yet one-third of the people live in slums.

32
Ahmedabad
For Ahmedabad city, there are different estimates regarding the slum population.
According to city development plan of Ahmedabad, 2006-2012, as per the SJSRY survey
conducted in Ahmedabad in 1998, about 32.4 percent of city‟s population is living in the
slums. According to the same survey, around 60 percent of the slum households fell
below the poverty line in Ahmedabad. Presently there are around 710 slums in the city
housing around 9 lakh population. The slum population has almost doubled over the last
decade, though the number of slums has not increased significantly. Presently slum
population accounts for 25.77 percent of the city‟s population. With regard to the basic
infrastructure for the poor, we find that only 9 percent of the households in slums and 17
percent of the households in the chawls have pucca housing. A major reason for such
poor housing could also be due to the tenurial rights not being clearly defined. In such
circumstances households would be unwilling to invest in improving the conditions of
their house.
Jaipur
As per the Municipal Corporation of Jaipur city, there are 183 slums in Jaipur in 2004.
These increased from 109 in 1971 to 183 in 2004. Only 39.1 percent of the slum
population is below poverty line as per the municipal corporation. General poverty is a
bigger problem in the city of Jaipur compared to the slum population as per the census
and NSS. The perception of the local administration is that a majority of the slum
dwellers are not poor
Indore
Alternative estimates of slum population in Indore city were higher than the census
figures. A detailed study of the type of urban housing systems and the population by the
School of Planning and Architecture, New Delhi in recent years quoted in the 2007 UNDP
sponsored survey has put the population in the slums and squatters at 35 percent of the
total population in Indore in 2005 occupying 11 percent of the city area. The city plan
document prepared by the municipal corporation of Indore acknowledges that the
number of slums increased from 183 in 1991 to about 604 in 2007. Thus there has been
sufficient evidence that the growth of slums has been very rapid in the Indore city from
the recent survey of 604 slums.

33
Slum population varied in the literary achievements, across the cities. Indore slums
have more literate persons (87 percent for men and 70 percent for women), followed by
Chennai slums. Chennai slums had about 83 percent literate men and 70 percent literate
women. Literacy was the lowest at 73 percent for men and 47 percent for women in
Jaipur. Ahmedabad had the next lowest literacy rate of slum population at 75 percent for
men and 54 percent for women (Table 2.2).
2.3.2 Type of Housing and Congestion in the Slums Chennai
In Chennai, only 64 percent of the houses are of a permanent nature in slum areas. Semi
permanent and temporary houses form the rest in equal proportion. The picture in non-
slum areas is in sharp contrast- almost 91 percent of the houses are of a permanent
nature and semi-permanent houses form 5 percent and the rest are of a temporary kind.
The number of persons occupying each dwelling unit in the slum areas is also found to
be higher with about 7 persons per house compared to an average of 5 persons per
house.
Kolkata
In Kolkata most slum people live in rented houses. The average area of the slum huts is
450 sq. ft. (45 sq m) and on an average 13 people share this space. Population density in
the slums is extremely high averaging around 19 people per katha (2812 people per ha)
and usually these houses consist of about 8-10 rooms where one family lives in one
room.
Ahmedabad
In Ahmedabad city, only 9 percent of the households in slums and 17 percent of the
households in the chawls have pucca housing. A major reason for such poor housing
could be due to the tenure rights not being clearly defined. There is some variation by
zone. For instance, in the south zone, only 16 percent houses are pucca, but less than
one percent is kuccha. The majority are semi- pucca. In the central zone, on the other
hand, 37.2 percent of the houses are pucca, and a little over half are semi-pucca. The
houses in the slums had an average of 2 rooms, with little variation across zones. Almost
all the houses had only a ground floor. According to UN-HABITAT if there are more than
3 persons per room in a house, it is defined as overcrowded living condition. According to
this calculation, only three-fourths of the households had sufficient living area.

34
Jaipur
Most of the houses in the slums of Jaipur are permanent structures built with brick and
mortar. They have proper roofs of permanent and semi-permanent nature. Only 6
percent of the houses in the slums were of temporary structures. The density of the
slums has increased in recent years. The slums varied in size from 500 to 8000 houses
with inner city settlements being denser.
Indore
In Indore, nearly half of the slum dwellers live on less than 350 sq. ft. of land per person.
Another survey of 120 slums of Indore reported that the average gross land area per
family was 121 square meters, of which only 33 square meters was developed. A study
of houses in 108 slums revealed that about 49 percent of the houses are permanent
constructions and the rest are either semi permanent or temporary structures. In Indore,
unlike slums in other cities, each slum has pockets of open community space inside.
Guwahati
Housing shortage was assessed in Guwahati by a study conducted by the Comprehensive
Master Plan preparation team for GMA-2025. It has revealed that the shortage for
housing facilities within the Guwahati city in the year 2001 was to the tune of 3.1
percent, which has subsequently increased to 6.9 percent in the year 2005.
2.2.3 Ownership of the Land and Houses of Slum Dwellers
Chennai
In Chennai, a majority of the slums (36 percent) is located on government lands and
about 32 percent are located on private lands. The slums are found mainly on lands
categorized as government owned, corporation owned, private owned and other
categories. Slums, both in the objectionable and non objectionable areas, fall under these
categories of ownership. The majority of slums are found on land owned by the
government, while the slums on private and other lands are negligible in number. In
Chennai, contrary to expectations, 40 percent of the houses in slums are rented and the
others are owned, while 3 percent are neither rented nor owned. This clearly indicates
the presence of slumlords, who own more than one house and are in a position to rent
out houses to others.
Kolkata
In Kolkata, the government of West Bengal enabled conferred land rights to the refugees
from Bangladesh including several amenities. In many cases the rent is given to the

35
Rent Control Board and the rents have not changed for decades. The ward-wise
distribution of slum households by type of ownership shows that a majority of the houses
were rented. Slum dwellers in the non notified slums also face threats of eviction and
occasionally pay bribes. In Kolkata, there are two broad categories of slums. The
officially authorized ones called bustees and others. Bustees are the ones, which came
into being during the British period. In this category there are of four types – (a)
middlemen took land from the landowners usually for a long term and built hut type
settlements, which they let out to migrants; (b) „Thika Tenant Slums” where the slum
dwellers have taken possession at a fixed rent and have constructed their houses; (c)
constructed by zaminders (landowners) themselves and let out to the slum dwellers; (d)
refugee resettlement colonies (locally called udbastu colonies) where land has been
leased out for 99 years to the refugees from present-day Bangladesh by the government
at nominal rents. About 1.7 million people out of the total of 3.3 million in the KMC live in
13 million huts.
Ahmedabad
In Ahmedabad, chawls have a much higher percentage of pucca houses compared to
slums - 31.3 percent versus 14.6 percent. The type of households differed from one zone
to another. About 60 percent of the households paid property tax, indicating that they
are eligible for all the services provided by the municipal corporation. The highest
proportions of households that paid property tax were in the central and east zones (77
and 70 percent, respectively) and the lowest proportion were in the west zone (38
percent). Many more chawl dwellers (76.3 percent) paid property tax compared to slum
dwellers (42.1 percent). There was a negligible payment of any other types of taxes by
residents in these settlements.
Jaipur
In Jaipur Most of the poor do not have access to secure land tenure. About 71 percent of
the poor lived on leased land. 23 percent of the poor are squatters and are vulnerable to
frequent eviction. 6 percent of the poor lived on rented accommodation and have to pay
a substantial portion of their income for rent. Most importantly, such rental quarters do
not have even basic infrastructure facilities.
2.3.4 Amenities in the Slums
Ahmedabad slums were better off in terms of supply of water compared to the other
cities, as all the slums received water supply for some time every day. Compared to this
the situation in Kolkata was worse off, where 60 percent of the slums did not receive any

36
water supply. Chennai slums mostly depended on the tankers. Slums had better street
lighting made available daily in 80 percent of the slums in Indore and Jaipur compared to
53 percent in Chennai. However, electricity is available in all slums. Ahmedabad and
Kolkata appear to provide daily lighting to about 12 percent of the slums. In 70 percent
of the cases individual toilets are available in Ahmedabad and Indore. Chennai had fewer
individual toilets but more community toilets. Kolkata appeared to be quite backward in
this respect. Ahmedabad and Jaipur are better off as for sewage connections compared
to Kolkata and Chennai. Chennai slums appear to be in the worst condition, where 68
percent of the slums have no sewerage connection. Though Indore appears to be better
off as for sanitation is concerned, the facilities may not be functioning well, as stated in
the city reports (see Annexure Tables A5 to A9).
2.3.5 Houseless Population in the Cities
One of the major concerns for Kolkata city has been the homeless. In 2006, 1.47 percent
of Kolkata‟s population was homeless. Next to Kolkata, Chennai has the largest number
of homeless at 0.64 percent. On the one hand, they lack proper shelter and are also
forced to lead a nomadic life due to the eviction activities undertaken by municipal
authorities. On the other hand, lack of access to use of toilet carries a very high disease
burden, inability to access welfare benefits like a ration card (giving them access to
subsidized basic commodities) and lack of access to education and adequate health care.
Both the cities have similar problems. However, in Chennai city, the houselesses are
reported to have ration cards and voter identities. As per the census 2001, houseless
population of Indore is about 4885 and of Jaipur is 8529. However, as per the report by
the UNDP on Jaipur, around 17,000 people in the city of Jaipur are houseless. These
include primarily the pavement dwellers. Most of them usually resort to begging (Table
2.3).
Table 2.3: Houseless Population in Million (Census 2001)
S. No. City Number of Houseless % to the Population
1 Chennai* 27329 0.64
2 Kolkata* 67676 1.47 3 Ahmedabad* 7787 0.22
4 Jaipur* 8529 0.37 5 Indore* 4885 0.33
Source: www.indiastat.com Note: *Municipal Corporation Source: Lok Sabha Unstarred; Question No. 2564 dated 08.12.2006.

37
2.4 Demographic Dynamics and Urban Poverty
The big cities of Chennai and Kolkata had reduction both in poverty as well as low
population growth thereby leading to a reduction in density of population in the core city.
The city districts and the municipal corporation areas are more or less the same for these
two big cities. Hence, the poverty appears to be low both in the core city as well as in the
city district. However, if we look at the entire urban agglomeration, the poverty-incidence
is high and migration mainly appears to be higher out side the city centre. The municipal
corporations claim much higher poverty levels than what is seen in the NSS unit level
data. Though the magnitude is different, the trend may be the same as one of declining
poverty in the big city agglomerations over a ten year period. In the case of
Ahmedabad city also the poverty estimates of the city are lower than the agglomeration.
Ahmedabad also has low urbanization and thinning of the population in the walled city.
Unlike Kolkata and Chennai, the growth has been taking place in other parts of the state,
where the petrochemical industry has been expanding. There is shift in growth pattern
that shifted away form Ahmedabad.
The pattern in the other three cities of Jaipur, Indore and Guwahati is different
where the core of the city has more poverty than the periphery. The core cities also grew
much faster, giving opportunities for development of commerce and trade, and formation
of slums. These cities are small and have low density and hence there is scope for more
poor to migrate to areas, where it is not necessary to travel long distances to work. Poor
living in the core of the city is very common in the history of urbanization. All the old city
areas are inhabited by the poor at some point of time.
An interesting question is whether urbanisation has been having a positive or
negative impact on poverty. In the case of Indore there has been a reduction in poverty
probably due to the nature of migration from other states and not necessarily from the
rural areas of the state, due to the location advantage of the city in the centre of the
country. However in the case of Jaipur, there are many better cities such as, Delhi Capita
Territory at close proximity offering better opportunities than Jaipur. Migration in this
case is mainly from the rural Rajasthan were the poverty is high. This may have led to
distress migration and spurt in poverty. The educational levels of the Jaipur city are the
lowest among all the cities studied. The city of Jaipur despite its large population is
probably like a class II city where the poverty is much higher. However more research is
required to understand the process of demographic dynamics and poverty. Indore city
shows a perceptible fall in poverty despite high levels of migration. Obviously, it appears
to be a case of migration and urbanization for gainful employment. Guwahati is a case

38
where the poor from far off rural areas come in search of work and live in the core city
slums, and the better off migrants for defence and other purposes live in the outskirts.
Increase in poverty in the core areas is mainly due to an increase in slums. One has to
realize that poverty is widespread among the slum dwellers, though all the slum dwellers
are not poor.
Contrary to the popular belief that rapid urbanization in developing countries is
accompanied by massive migration from rural to urban areas, in West Bengal as well as
Tamil Nadu, migration was small owing to variety of factors. The various reform
measures in the rural sector leading to agrarian prosperity in rural Bengal and diffused
urbanization among small towns and non agricultural work opportunities even in small
towns of Tamil Nadu have played a key role during the recent decades. Similarly the
changing economic dynamics change the attraction of migration to areas of gainful
employment, whether it is a big town or small town. The cases of Kolkata, Chennai and
Ahmedabad appear to be of low migration and low urbanization in the past decade and
considerable improvement in economic status of the people. Thus, urban migration need
not prove to be a rural-urban migration and a distress one.
Given the possible increase in urban population the future emphasis should be to
reverse the traditional pattern of rural to urban migration. Now the emphasis should be
on reducing the density of population, higher incomes and social tranquility. This sharply
diverges from the major social surveys carried out in the 60s that produced a general
narrative of urban poverty, overcrowding and unrest. Hence poverty reduction amenities,
decongestion, and increased literacy would make the urban growth healthier.

39
Chapter 3
PERSPECTIVES ON GROWTH AND EMPLOYMENT
The key to poverty reduction lies in generating productive employment and improving the
skill levels of the poor though the poorest may still need additional welfare measures to
be able to participate effectively in the labour market. This chapter discusses the
possibilities of generating sustainable livelihoods to try and achieve „zero-poverty‟. One
must of course acknowledge that this poverty reduction is based on a definition of
absolute poverty while there may still be challenges posed by relative poverty and
inequality within the cities.
This Chapter is organized into three sections. Section 3.1 provides inter-city
comparison of employment patterns and trends over the years. Section 3.2 presents a
brief overview of the growth potential leading to employment generation for each of the
six cities. Section 3.3 gives some broad suggestions for improving livelihood options and
generating more employment for the urban poor, taking in some city specific
characteristics.
3.1 Inter-city Comparisons on Employment Patterns
3.1.1 Labour Force Participation Rates
Figure 3.1 shows the labour force participation rates for men and women aged 15 years
and above. Overall, in 2004-05 one finds that among both men and women, the
participation rates are lower in the metros, Chennai and Kolkata while the smaller cities
like Jaipur and Ahmedabad shows higher participation rates. In the previous two years,
the cities seemed more homogenous in participation rates for men while female
participation rates show larger disparities across cities and over time. Among these cities,
Guwahati has the lowest labour force participation rates.
Among men, the employment rate has increased marginally in Ahmedabad and
Jaipur and very rapidly in Indore while it has declined in Chennai and Kolkata. In
comparison to this, female labour force participation has increased in all cities except
Chennai. Unlike men, female labour market does not show a secular trend for all the
cities. For instance, Chennai shows a marginal increase in 1999-00 followed by a large
decline in 2004-05 while for Jaipur it is the reverse with a large increase by 2004-05
having dipped in between since 1993-94. Similarly, Indore also shows dip in 1999-00 but

40
only a marginal increase recently while Ahmedabad and Kolkata show small but gradual
increase.
Figure 3.1: Number of Usually Employed Persons Per 1000 Persons Aged 15 Years and Above According to Usual Principal and Subsidiary Status Taken
Together for Each Class 1 City during 1993-94, 1999-00 and 2004-05
3.1.2 Underemployment
Underemployment is a common feature of the labour market in developing countries,
wherein the population is not employed all through the year. To assess this aspect, NSSO
collects information based on current daily status of employment. Expectedly, in all the
cities current daily status of employment rate is lower than the usual principal status.
However, the gap between the usual principal and subsidiary status (UPSS) and current
daily status (CDS) varies across cities, and does not seem to be contingent upon the city
size but perhaps the informal nature of activities in the city. Consequently, among males,
the gap between UPSS and CDS is smaller in Ahmedabad, Chennai and Jaipur but higher
in Kolkata and substantially higher in Indore (Table 3.1). This pattern is similar among
women, with the exception of Jaipur where the gap is as large as in Indore.
Over the last decade, CDS employment declined for both men and women in
Chennai and Kolkata while it increased in all the other cities with women in Jaipur
showing a substantial increase; this pattern of change over time is similar to UPSS.
Table 3.1: Number of Persons Employed Per 1000 Person-days of Age 15 Years and Above According to Current Daily Status for Each City during 1993-94,
1999-00 and 2004-05
City Male Female
2004-2005 1999-2000 1993-1994 2004-2005 1999-2000 1993-1994
Chennai 712 710 720 162 231 204
Kolkata 703 742 762 150 154 155 Ahmedabad 766 736 740 191 175 162
Jaipur 720 698 703 258 83 113
Indore 773 725 748 196 165 207 Source: NSS 61st Round, Report No. 520.
Males
60
65
70
75
80
85
Ahmedabad Chennai Indore Jaipur Kolkata
Perc
en
tag
e
1993-94 1999-2000 2004-05
Females
0
10
20
30
40
Ahmedabad Chennai Indore Jaipur Kolkata
Perc
en
tag
e
1993-94 1999-2000 2004-05

41
3.1.3 Unemployment Rates
The employment rates based on different reference periods (that is UPSS and CDS)
would also be reflected in differential unemployment rates using similar definitions. Table
3.2 shows the unemployment rates using the UPSS and CDS definitions. Comparing the
two metros, Kolkata, which had lower male unemployment rates five years back, shows a
higher rate now as well as above Chennai‟s rate. For women Kolkata has had higher
unemployment rate across all the four cities. Further, in Kolkata the female
unemployment rates among women are much higher than that of men. Over time,
Chennai seems to be showing an „income/wealth effect‟ wherein the UPSS employment
rates have declined (Figure 3.1) and so have the UPSS unemployment rates. As for
Ahmedabad, Indore and Jaipur, the unemployment rates have gone up based on both
the statuses but the gap between UPSS and CDS is much larger in the latter two cities.
Once again this may be a reflection of variations in employment opportunities within
these growing cities, which would increase income fluctuations within a year and the
need for well targeted social protection to ameliorate this situation.
Table 3.2: Unemployment Rates of Men and Women Aged 15 Years and Above
According to Usual and Current Daily Statuses for Each City during 1999-00 and 2004-05
City
2004-05 1999-00
Usual
(Adj.)
Current Daily
Status
Usual
(Adj.)
Current Daily
Status
Male
Chennai 30 64 45 92
Kolkata 53 81 36 70 Ahmedaba
d 27 53 10 26
Jaipur 27 72 33 36
Indore 16 90 65 85
Female
Chennai 23 41 41 45
Kolkata 104 133 70 110 Ahmedaba
d 27 73 10 11
Jaipur 10 30 18 24 Indore 0 93 0 6 Source: NSS 61st Round, Report No. 520.
3.1.4 Broad Industrial Divisions

42
Table 3.3 below shows that in Indore, Jaipur and Kolkata some agricultural activity takes
place and largely pursued by women. Among these five cities, all of them have moved
towards the tertiary sector in about a decade‟s time. Employment in secondary sector
(mainly manufacturing) is high among men and women in Ahmedabad and women in
Jaipur. In all other cities tertiary sector (predominantly other services) dominates in
employment and more prominently in Chennai, Guwahati and Kolkata.
Table 3.3: Per Thousand Distribution of Men and Women Across Broad Industry Divisions, 2004-05
City Male Female
Primary Secondary Tertiary Primary Secondary Tertiary
Chennai 1 362 637 0 127 872 Ahmedabad 0 498 502 0 575 424
Jaipur 99 388 513 286 560 154 Indore 40 361 599 83 403 516
Guwahati 125 241 634 163 9 829
Chennai 1 362 637 0 127 872 Source: NSS 61st Round, Report No. 520. For Guwahati, the estimations are obtained by the authors using
unit record data and are based on Kamrup district. 90 percent of the urban population in this district is from Guwahati.
3.1.5 Employment Status
Apart from unemployment rates, the nature of job contract in the case of wage labour
(regular versus casual) and also the type of occupation pursued has an impact on
economic status. In urban areas, regular employed dominate among the richer sections
of the population, followed by the self-employed and then by the casual labour. In 2004-
05, the share of casual labour population is highest in Kolkata, while Chennai and
Guwahati have the largest share of regular salaried for both men and women (about
three-fourths) as shown in Table 3.4. Indore has a substantially high share among self-
employed men while Jaipur has a very high rate of self-employed among women.
Though overall these six cities show somewhat dissimilar patterns in employment
status, the pattern of change is somewhat similar over time with a decline in casual
labour for some cities, Chennai showing the largest decline. Exceptions to this change
within these six cities are in the case of women in Ahmedabad (wherein a substantial
increase in casual labour proportion is due to a decline in self-employment) and a
marginal increase among men in Kolkata. A city with the presence of large employment
provider like SEWA this change in status in female employment seems unusual as self-
employment has always dominated in the previous two NSS rounds as shown below.
Another city that has shown drastic changes in employment pattern is that of Jaipur

43
where employment has moved away from regular status towards self employment for
both men and women.
Table 3.4: Per 1000 Distribution of Usually Employed (ps+ss) Men and
Women Aged 15 Years and Above by Status of Employment for Each City during 1993-94, 1999-00 and 2004-05
City 2004-05 1999-00 1993-94
SE RE CL SE RE CL SE RE CL
Male
Chennai 351 545 104 293 491 215 290 464 246
Kolkata 368 435 197 444 406 150 339 544 117 Ahmedabad 369 525 107 369 340 291 356 513 131
Jaipur 450 466 84 385 556 58 364 607 29
Indore 519 390 91 428 414 158 421 396 183 Guwahati 368 504 128
Female
Chennai 226 762 12 273 619 112 133 637 230 Kolkata 516 442 42 299 545 150 284 623 93
Ahmedabad 388 299 313 627 225 147 439 270 291 Jaipur 799 167 34 380 546 74 469 531 NA
Indore 576 343 81 332 523 146 498 260 242
Guwahati 20 915 65 Source: As in Table 3.3. Note: ps: principal status, ss: subsidiary status, SE: Self-employed, RE: Regular Employed, CL: Casual Labour, and NA: Not Available.
3.2 Growth Potential and Economic Activities
In this section the city specific employment features and opportunities for future
employment are complied from City Development Plans of the respective cities and the
recently commissioned Urban Poverty Project Reports submitted to the Ministry of Urban
Poverty and Housing and UNDP, Delhi.
Chennai
Chennai has developed as the largest commercial and industrial centre in South India,
with an extensive network of transportation facilities including the largest seaport in
South India, an international airport, well-laid roads and rail facilities. The policy of the
Government of Tamil Nadu for the industrial development in the state lays special
emphasis on the development of the small-scale sector on the strength of the inherent
merits that it has low capital intensity, short generation period, high employment
generating potential, capability to induce dispersal of industrial activity, widening of the

44
entrepreneurial base etc. Efforts in recent times have been paying regular attention to
the upgradation of technology adoption in the small-scale sector.
As indicated in Section 3.1, defying the general trend in the country and urban
India, in Chennai, unemployment had substantially declined in terms of usual status,
weekly status and daily status, both for men and women. This probably partly explains
the sharp decline in poverty in Chennai over the decade from 1993-94 to 2004-05 noticed
in Chapter 2. The distribution of employed men and women among the industrial
categories in Chennai (Table 3.5) clearly shows that a variety of services such as financial
intermediation, real estate, personalised services, education, health and so on provided
work for a majority of women (71.2 percent) and for one third of men (30.0 percent). It
is common to see women in schools, hospitals, banks and insurance companies, retail
shops, hotels, and in cleaning services in various capacities in Tamil Nadu. Women are
also employed in un-conventional roles such as police women, or petrol pump operators.
Manufacturing engaged 27.7 percent of men, and 12. 4 percent of women while trade
and hotels have provided employment for about 22.4 percent of men and 15.9 percent of
women. Thus service sector was the main employer of both men and women followed by
manufacturing sector to a lesser extent. However compared to 1999-00, the share of
women in the manufacturing sector has declined drastically by 2004-05.
Table 3.5: Per 1000 Distribution of Usually 'Working' (ps+ss) Persons of Age 15 Years and Above by the Broad Industry Division - Chennai City
Broad Industry Division 2004-05 1999-00
(NIC-98 Code) Male Female Male Female
Agriculture (01-05) 1 0 10 7 Mining & Quarrying (10-14) 2 0 0 0
Manufacturing (15-37) 277 124 251 285 Electricity & Water (40,41) 10 0 4 2
Construction (45) 73 3 103 29
Trade, Hotel & Restaurant (50-55) 224 159 243 142 Transport (60-64) 113 1 145 33
Other Services 65-93 294 508 202 276
95 6 204 40 225 99 0 0 0 0
Total 1000 1000 1000 1000 Source: NSS Report Nos. 520 and 462. Note: ps: principal status, ss: subsidiary status.
Income Estimates for CMA and Gross Domestic Product of Chennai City

45
The following are the Income estimates for the districts falling under Chennai
Metropolitan Area (CMA). The income estimates for districts in CMA is presented in Table
3.6.
Table 3.6: Income Estimates – Gross District Domestic Product (Rs. lakhs) at 1999-00 Prices
2000-01 2005-06
Chennai 1126540 (8.95) 1376445 (8.72) Kancheepuram 634730 (5.04) 825380 (5.23)
Thiruvallur 633252 (5.03) 850043 (5.39)
Tami Nadu 12591664 (100) 15784231 (100) Source: Department of Economics and Statistics. Note: Values in brackets are shares.
The share of Chennai in the past five years has been about 9 percent and the
three district of Chennai, Kancheepuram, and Thiruvallur together account for about 19
percent. The gross domestic product of Chennai urban agglomeration was 38 billion US $
in 2005 as per this study (PWC, 2005). Chennai ranks 105 among the 150 richest cities in
the world. In the relative sense Chennai is not as rich as Bombay, or Calcutta or Delhi.
Bangalore has higher GDP at 45 Billion US $, compared to Chennai. Hyderabad had the
same GDP as that of Chennai, in 2005 as per this study. This study is based on
purchasing power parity calculations and hence among the Indian cities, higher prices
may also get higher valuation of the GDP.
Employment Potential in Chennai Metropolitan Area
The employment potential and projection for future is worked out based on the existing
and envisaged economic developments and past trends. Based on the workers
participation rate in 2001, it is estimated that by 2011, 87.5 percent of the male and 30
percent of the female eligible working population will be willing to work and by 2021
about 92.5 percent of males and 36 percent of females would be willing to work
necessitating creation of employment opportunities. The demand for employment for
Chennai Metropolitan Area (CMA) is presented in Table 3.7.
Table 3.7: Employment Projection for CMA-2026, Chennai City Description 2011 2016 2021 2026
(Lakhs)
Population 88.71 99.66 112.00 125.80 Eligible Workers 15-60 (69.15 percent) 61.34 68.92 77.43 87.01 Eligible Male Workers (52 percent) 31.90 35.84 40.26 45.24 Eligible Female Workers (48 percent) 29.44 33.08 37.17 41.76 Male Willing to Work 27.91 32.25 37.25 42.98 Female Willing to Work 8.37 10.64 13.41 17.19

46
Total 36.28 42.89 50.65 60.17 Additional Jobs to be Created 10.09 16.70 24.47 33.99 Male Willing to Work percent (assumed) 87.50 90.00 92.50 95.00 Female Willing to Work percent (assumed) 30.00 33.00 36.00 40.00 Source: National Institute of Urban Affairs, Urban Poverty Reduction Strategies (UPRS) for Chennai City.
Kolkata
The economic profile of Kolkata Metropolitan Area (KMA) is well-diversified with activities
stretching across manufacturing, construction, transport, communication, trades and
commerce, real estate, services etc. The basic information for this analysis is available in
Statistical Abstract - both of West Bengal and India, Economic Census, NSSO, CSO,
Economic Reviews etc. The Kolkata metropolitan area contributes substantially to the
state GDP, in manufacturing as well as service sector, though its share has fallen by
about 10 percent both in manufacturing as well as services in the last two decades (Table
3.8). The share of the KMA in the manufacturing sector of West Bengal has declined from
41 to 29 percent and the share of services increased from about 56 percent to about 70
percent over a period of two decades from 1985-86 to 2001-02.
Table 3.8: State Domestic Product in West Bengal and KMA by
Major Sectors in Kolkata City
Area/Item Year Primary Secondary Tertiary Total
West Bengal (Rs. lakh) 1985-86 3613.25 3037.77 3749.43 10400.45
1993-94 5597.79 4462.53 7160.36 17220.68 2001-02 7766.55 7310.76 14802.16 29879.47
KMA (Rs. lakh) 1985-86 65.46 1312.5 1790.07 3168.03
1993-94 74.23 1514.92 2413.08 4002.23 2001-02 50.14 2362.18 5586.96 7999.28
KMA's Share in 1985-86 1.81 43.21 47.74
West Bengal (%) 1993-94 1.33 33.95 33.70 2001-02 0.65 32.31 37.74
Distribution of SDP in 1985-86 2.07 41.43 56.5 100
KMA by Sector (%) 1993-94 1.85 37.85 60.29 100 2001-02 0.63 29.53 69.84 100 Source: GoWB, Statistical Abstract, 2001-02, BAE&S.
There have been signs of structural changes in the economy of KMA, the tertiary
sector witnessed a phenomenal increase of SDP growth of 11.1 percent per annum
between 1993-94 and 2001-02 (Table 3.9). This rate of growth was found to be even
higher than that (9.5 percent per annum) for West Bengal. The corresponding rate of
growth for KMA was 3.8 percent between 1985-86 and 1993-94. Further, both the
secondary and tertiary sectors of KMA had exhibited remarkable growth in SDPs in the

47
period between 1993-94 and 2001-02, as against the rates of growth during the period
1985-86 to 1993-94.

48
Table 3.9: Annual Average Growth Rate of SDP for KMA and
West Bengal by Major Sectors in Kolkata City
KMA West Bengal
Sector Avg. Annual Growth (%) Avg. Annual Growth (%)
85-86 to 93-94 93-94 to 01-02 85-86 to 93-94 93-94 to 01-02
Primary 1.58 -4.79 5.62 4.18
Secondary 1.81 5.71 4.92 6.36
Tertiary 3.8 11.06 8.42 9.50
Total 2.96 9.04 6.51 7.13 Source: Kolkata City Development Plan, Kolkata Metropolitan Development Authority.
The period between mid-1980s to early 2000 saw an increase in registered
manufacturing units though their growth rate slowed down (Table 3.10). The number of
registered working factories in the KMA-districts has fallen from 3.4 percent per annum
during the period 1985-86 to 1993-94 to 2.1 percent per annum in the years between
1993-94 and 2001-02, indicating a higher rate of growth of industries outside KMA. The
more disturbing fact has been that during this decline in growth phase within KMA,
employment has declined and that too at a faster phase in the latter decade.
Table 3.10: Number of Registered Factories and Employment in West Bengal
and KMA
Item 1986 1994 2002
Unit Emp Unit Emp Unit Emp
KMA-districts 6658 718878 8666 708436 10250 696039
West Bengal 8064 900790 10431 912569 12641 890689
KMA as % of West Bengal 82.56 79.81 83.08 77.63 81.09 78.15
Growth Rate (%) 1986-94 1994-02
KMA-districts 3.35 -0.18 2.12 -0.22
West Bengal 3.27 0.16 2.43 -0.30 Source: GoWB, Statistical Abstract, 2001-02, BAE&S.
This phase of industrialisation has been capital intensive and is corroborated by
the fact that productive capital and investment increased in KMA. The Annual Survey of
Industries data show that in the 1990s, there was a growth of about 35.5 percent per
annum in the KMA-districts, as against a much lower rate of growth of 19.7 percent per
annum for the state as a whole. Further, the net value added by factories in KMA-districts
showed a substantial increase at about 31.5 percent per annum between 1990-91 and
1997-98, shooting up from 10.5 percent per annum during 1985-86 and 1990-91 period.
The state, however, experienced a much lower rate of growth in net value added during
the corresponding periods at 18.5 percent per annum and 7.8 percent per annum,

49
respectively. This implies that the value addition in manufacturing industries in KMA-
districts in later years has been significantly higher than the preceding years.
The labour-output ratios have experienced a declining trend during the decade of
nineties in both the state as well as in KMA-districts. The labour-output ratio for KMA-
districts recorded a fall from as high as 0.79 in 1985-86 to 0.19 in 1996-97. This implies
that there was a lower labour input per unit of output. In other words, labour absorption
declined. Yet it would mean the labour productivity increased. Thus this reflects an
increasing adoption of capital-intensive or labour-saving technologies in manufacturing
processes (Table 3.11).
Table 3.11: Labour Output Ratios
Area Gross Output
(Rs. lakh) Workers/Labour
(No.) Labour-output Ratio
1985-86 1996-97 1985-86 1996-97 1985-86 1996-97
KMA-districts 574128 2278096 452600 426515 0.79 0.19 West Bengal 954393 3447749 634426 585642 0.66 0.17 Source: Kolkata Metropolitan Development Authority and CEPT University (2007).
Within manufacturing, jute textile and metal based engineering industries form
the major chunk. The higher capacity utilization and modernization of jute industry is
required to keep pace with ensuing rising internal and external demand resulting from
enforcement of the Jute Packaging Materials Act, 1987, mandating compulsory use of
jute in packing of commodities. In recent years diversification of jute industries is also
noticed. A number of recent studies have revealed that the jute-diversified industries hold
a great promise in the KMA districts. Chemicals and drugs and pharmaceuticals is another
industry which was in the forefront in KMA and that is being slowly revived after the
setting up of Haldia Petrochemicals Ltd. Other forms of modernization and appropriate
training of the youth so that they will be employable in these industries serves as a good
potential for employment.
Construction Sector
Construction Industry registered an annual average rate of growth of around 6.3 percent
in State Domestic Product (SDP) from KMA-districts between 1994-95 and 2000-01. A
major part of the construction activities in KMA is accounted for by real estate and
infrastructure development activities. The year 1998-99 and 1999-2000 deserve special
mention when this industry experienced a boom with the construction-SDP showing an

50
annual growth rate of 7.8 percent and 9.5 percent, respectively. Employment potential of
this sector has also been high particularly for the unskilled and semi-skilled workers.
Service Sector
Within KMA, Sector-V in Salt Lake forms a major hub for ITES activities which registered
a compound annual growth rate of 119 percent during 2002-03. Currently, there are 185
IT companies in Sector-V of Salt Lake employing more than 15,000 IT professionals. With
virtual saturation of Salt Lake Sector–V, a new IT Hub near Eastern Metropolitan Bye
Pass, called The Sunrise City, has been conceived by KMDA over an area of 40 acres.
Though these provide employment to better skilled but externalities exist in terms of
related services like housekeeping, retail trade and restaurants where the urban poor
could benefit.
Ahmedabad
The city of Ahmedabad has had great importance in the economy of Gujarat owing to the
large concentration of economic activities their high growth rates and productivity.
Ahmedabad city accounted for 21.5 percent of factories in the state employing 18
percent of workers in 2000. In 1981, before the textile crisis, though Ahmedabad city has
a smaller share of the factories (19.3 percent) but employed a larger proportion (27.7
percent) of workers in the state. The investment figures show a significant decline in the
share of industries in and around Ahmedabad. On the other hand, tertiary sector which
includes business and commerce, transportation and communication, construction
activities and other services appears to be growing. This sectoral shift has been observed
in several parts of Gujarat, after liberalization.
Economic Activity of the City
The economy of the city is gradually shifting from secondary to tertiary sector absorbing
56 percent of the total main workers of the city (Table 3.12). Table 3.13 gives the details
of the number of working factories and workers employed daily in Ahmedabad city for
the years 1965 to 2003. The number of workers employed in registered factories has
remained more or less stagnant in the city for over four decades. The numbers of jobs
vary between 1.4 lakh to 2.2 lakh jobs and in 2003 it is about 1.75 lakh. Workers per
factory have also declined from 93 workers in 1979 to 53 in 1990 and to 36 in 2003.
These two are in conjunction with the trends at the state level. There are around 4859
factories in Ahmedabad City, of which Chemical and Petrochemical industries have the
largest share (29 percent), followed by metallurgical and engineering industries.
Significant decline is observed in textile industry, which has a current share of 12

51
percent. The employment however is the highest in textile industries followed by
chemical and petrochemical. Though the number of chemical industries is more than
twice the textile industries, the employment is much lower.
Table 3.12: Occupational Pattern of Ahmedabad City
S. No.
Categories 1971 1991 2001
Nos. Percent Nos. Percent Nos. Percent
Primary Sector
I Cultivation 839 0.19 2659 0.32 1168 0.10
II Agricultural Labourers 613 0.14 1889 0.23 1133 0.10
III Live stock, Forestry, 2749 0.61 5444 0.65
A
Fishing etc and Allied
Activities
IV Mining and Quarrying 2557 0.57 1932 0.23
Total 6758 1.50 11924 1.43
Secondary Sector
V-A
Manufacturing and
processing 6857 1.52 6479 0.78 34624 3.09
in Household Industries V-B Manufacturing and
processing in
other than Household Industries 204255 45.39 308183 37.07
VI Construction 14203 3.16 38197 4.59
Total
225315 50.08
352859 42.44
Tertiary Sector
VII Trade and Commerce 88239 19.61 212051 25.50
B
A+B=
1085070
(96.71
percent)
VIII Transport, Storage and Communication 32779 7.28 75446 9.07
IX
Other Services
(Other than those mentioned
above e.g. Politics, Social Work, Govt.
Service, Teaching,
Entertainment etc.) 96864 21.53 179179 21.55 Total 217882 48.42 466676 56.13
Grand Total 449955 100.00 831459 100.00 831459 100.00 Source: City Development Plan of Ahmedabad 2006-2012.

52
Table 3.13: Working Factories and Workers Employed Daily in Ahmedabad City
Year
No of Working Factories
Average No of Workers Employed Daily in Working
Factories (Including Estimated
Average No. of Workers)
Workers Per Factory
1965 939 162104 173
1971 1129 152986 136
1975 1434 170522 119
1979 1981 184247 93
1983 2320 184246 79
1986 2169 139715 64
1988 3640 205498 56
1990 4114 220083 53
1993 3553 200652 56
1996 4481 193740 43
1999 4271 157568 37
2000 4243 152933 37
2001 4415 157486 36
2002 4689 168700 36
2003 4859 175728 36
Source: City Development Plan of Ahmedabad 2006-2012.
If we look at the industrial classification of the adults who are employed, we find
that as per the usual status, largest number of workers, both male and female, are
engaged in manufacturing. About 40.2 percent of the male workers and 39.6 percent of
the female workers were in manufacturing in 2004-05 (Table 3.14). Trade, hotel and
restaurant sector engaged 22.5 percent of the male workers and 11.3 percent of the
female workers. The share of this sector in the total workers had come down over the
past five years since 1999-2000. Third important sector is other services, which includes
domestic helpers. There are more women in this sector compared to men. A quarter of
the women workers are engaged in this sector in 2004-05. Transport services sector is
another important sector for men, employing about 11 percent in 2004-05. Construction
sector has engaged more women than men in 2004-05. About 18 percent of women and
8 percent of men are engaged in construction.

53
Table 3.14: Per 1000 Distribution of Usually 'Working' (ps+ss) Persons of
Age 15 Years and Above by the Broad Industry Division in Ahmedabad City
Broad Industry Division 2004-05 1999-00
(NIC-98 Code) Male Female Male Female
Agriculture (01-05) 0 0 13 34
Mining & Quarrying (10-14) 3 0 5 0
Manufacturing (15-37) 402 396 323 312
Electricity & Water (40,41) 13 0 1 0
Construction (45) 80 179 75 3
Trade, Hotel & Restaurant (50-55) 225 113 342 290
Transport (60-64) 112 0 104 61
Other Services
65-93 153 248 132 300
95 12 63 4 0
Total 1000 1000 1000 1000 Source: NSS Report No. 520 and 462. Note: ps: principal status, ss: subsidiary status.
Jaipur
As mentioned in Section 3.1 Jaipur shows a change in the sectoral employment shares. A
large shift away from manufacturing as well as services has taken place in favour of
construction and transport. The employment of males in construction works has gone up
from 6.2 percent in 1999-00 to 17.4 percent in 2004-05 while in transport from 5.8
percent to 11.9 percent in respective years. For women there has been a substantial
decline in services but their share in manufacturing registered a huge increase to about
52 percent in 2004-05 as compared to 6.7 percent in 1999-00 (Table 3.15). This shift is
attributed to the textile sector.
Industries in Jaipur
As per the draft investment plan of 1998, various industries, large medium household
and cottage industries provide employment in Jaipur. The Rajasthan State Industrial
Development and Investment Corporation Limited (RIICO) is the main agency
responsible for industrial development in the city. There are 21 industrial areas under it
out of which 14 have already been developed, three are partially developed, three are
undeveloped and one is under development. Slum colonies and illegal hutments near all
these industrial developments cater to their labour requirements. Both small-scale
industries and household industries form a substantial part of the industries.

54
Table 3.15: Per 1000 Distribution of Usually 'Working' (ps+ss) Persons of
Age 15 Years and Above in Jaipur City
Broad Industry Division 2004-05 1999-00
(NIC-98 Code) Male Female Male Female
Agriculture (01-05) 99 286 7 240
Mining & Quarrying (10-14) 0 0 0 0
Manufacturing (15-37) 162 517 206 67
Electricity & Water (40,41) 52 11 6 0
Construction (45) 174 32 62 22
Trade, Hotel & Restaurant (50-55) 138 0 208 47
Transport (60-64) 119 0 58 14
Other Services
65-93 251 154 432 610
95 5 0 20 0
Total 1000 1000 1000 1000 Source: NSS 61st & 55th Round, Report No. 520 and 462.
As per the 1991 Census there are 4953 small-scale industrial units with a total
work force of around 25,000. Household industries in Jaipur includes industries such as
stone cutting and polishing, blue pottery, lac work, gota, sculptures etc. These industries
have played an important role in providing employment as well as in conserving the
traditional arts and craft of the city. A majority of these household industries are located
in the walled city. The number of persons employed in this sector was 0.017 million in
1991, which almost doubled in 2001(0.033 million). Nearly 12 percent of total workers of
the secondary sector were involved in the household industry in 1991and it grew to 15
percent as per census 2001. As per the NSSO data there seems to be a large increase in
woman employment in this sector.
Traditional Art and Craft of Jaipur
Linked to the household industrial activity mentioned above, is the trade in these items
along with other craft items. The primary commodities that attract revenue to the city are
precious stones, marble, sandalwood and cement. The traditional bazaars located within
the walled city conduct retail and wholesale trading of these handicrafts.
Trade and Commerce
The proportion of workforce in this sector constituted 24 percent of the total main
workers in the city in 1991. The growth of this sector can be gauged by the employment
it generates. In 1991 the actual number of persons identified in the sector were

55
1,02,521. The number of retail shops has nearly doubled in the city from 45,000 in 1991
to 80,000 in 2000. These markets coupled with the informal sector and the wholesale
markets cater to the city population as well as the large tourist population of Jaipur.
These markets also provide employment opportunities (both temporary and permanent;
for skilled and non-skilled jobs) to the migrants to Jaipur city and also to the homeless
and slum dwellers of the city.
Tourism
Jaipur is situated on the Tourism Golden Triangle including Delhi, Agra and Jaipur,
attracting a large number of domestic and foreign tourists every year. On an average
Jaipur receives 3000 tourists daily, who stay in the city for 3-4 days. The tourism sector
employs a large number of people from all sections of the society. Since tourism is a
seasonal activity employment linked to it would also be seasonal. This needs to be kept
in mind while collecting data in terms of number of poor and their seasonal livelihood
patterns. Employment is provided in the upkeep of the hotel and also through the sale of
different handicraft items to the visitors.
As per the tourism policy of the state, subsidies are provided for conversion of
old palaces and havelis into heritage hotels. The conservation of these old buildings and
their adaptive reuse requires knowledge of indigenous materials and building techniques.
This is another area where a number of people can be employed as there are many
building techniques on the verge of extinction in Rajasthan.
Indore
Employment potential for Indore comes mainly from cotton textiles while iron and steel,
chemicals, and machinery are also manufactured there. Indore has many food processing
industries such as oil seed extraction industry and confectionery. Paper and straw board,
factories for asbestos products, RCC pipes and poles, machine tools and accessories,
electrical machinery and appliances, electronics goods, bicycles and ready made
garments are also made here.
If we go by the broad industrial classification of workers, we find that those
employed in manufacturing had increased from 23.7 percent to 27.7 percent for male
and from 31.0 percent to 37.3 percent for female during the years 1999-00 and 2004-05,
respectively. This shows that now more women found jobs in manufacturing than before.
However, from the gender composition for the year 2004-05 it is observed that the total
women employed in manufacturing are fewer than men. About 68.36 percent in

56
manufacturing are men and 31.64 percent are women. Thus manufacturing is still the
largest employer of women who go for work. Trade hotel and restaurants provide next
highest employment to men while other services provide more employment for women.
The share of hotel and restaurant sector had gone up 30.8 percent in 2004-05 from 25.1
percent in 1999-00. Though it has been reported that over years since 1991 the
importance of this sector has gone down in Indore, the share of this sector in the total
employment of men increased between 1999-00 and 2004-05. Services sector‟s share
has gone up in female employment to 36 percent in 2004-05 as compared to 28 percent
in 1999-00, the sector accounts for 33.7 of the employment in 2004-05. However, there
are more men in this sector as compared to women, about 64 percent are men in 2004-
05 though their share declined from 72 percent in 1999-00 (Tables 3.16 and 3.17).
Table 3.16: Per 1000 Distribution of Usually 'Working' (ps+ss) Persons of
Age 15 Years and Above by the Broad Industry Division in Indore City
Broad Industry Division 2004-05 1999-00
(NIC-98 Code) Male Female Male Female
Agriculture (01-05) 40 83 80 70
Mining & Quarrying (10-14) 0 0 3 0
Manufacturing (15-37) 277 373 237 310 Electricity & Water (40,41) 0 0 6 0
Construction (45) 84 30 68 47 Trade, Hotel & Restaurant (50-55) 308 173 251 161
Transport (60-64) 89 0 106 32 Other Services
65-93 202 337 250 375
95 0 6 0 4
Total 1000 1000 1000 1000 Sources: a. NSS 61st Round, Report No. 520, and b. NSS 55th Round, Report No. 462.
The most critical issue for the future economic development and growth potential
for Indore is the proposed establishment of a Special Economic Zone near Pittampur
Industrial area. There are also central government proposals for an Agriculture Export
Zone near Indore. This zone would offer incentives for processing and export of specific
crops. A feasibility study is being undertaken for a number of crops including vegetables,
wheat and seed spices. Old-time industries which flourished in Indore were handloom,
hand dyeing, manufacture of niwar, oil extraction by ghani, manufacture of bamboo
mats, baskets, metal utensils, embossing and engraving of gold and silver ornaments,
shellac industry etc. Ayurvedic and Unani medicines from roots and herbs were
manufactured with state patronage.

57
Table 3.17: Gender Composition of Employment: Industrial Category in
Indore City (in percentage)
Industrial Category 2004-05 1999-00
Chennai Male Female All Male Female All
Agriculture 58.37 41.63 100.00 81.68 18.32 100.00
Mining & Quarrying 0.00 0.00 0.00 100.00 0.00 100.00
Manufacturing 68.36 31.64 100.00 74.89 25.11 100.00 Electricity & Water 0.00 0.00 0.00 100.00 0.00 100.00
Construction 89.06 10.94 100.00 84.95 15.05 100.00 Restaurant 83.82 16.18 100.00 85.88 14.12 100.00
Transport 100.00 0.00 100.00 92.82 7.18 100.00 Other Services (65-93) 63.55 36.45 100.00 72.23 27.77 100.00
Other Services (95) 0.00 100.00 100.00 0.00 100.00 100.00 Sources: As in Table 3.16.
Given the present state of development, Indore would seem to benefit more
form a better linkage between agricultural and non-agricultural activities for instance, by
setting up of food processing industries within the agricultural export processing zones.
The city also seems to have a good knowledge base for traditional products which have
good aesthetic and esoteric value. These could serve as a good basis for providing
employment to the semi-skilled workers who may be among the poorer sections of the
population.
Guwahati
Guwahati is the major hub of economic activity in the entire northeastern region. The
establishment of Guwahati Refinery in 1962 marked the beginning of industrialization in
the city. The construction of bridge over River Brahmaputra at Saraighat and the shifting
of capital from Shillong to Guwahati in 1972 made tremendous economic impact on the
city and turned Guwahati into one of the most important cities in the northeast. The
economic activity of Assam is based on Agriculture and Oil. More than half of India's
petroleum is produced in Assam. It also produces significant part of total world's tea
production. Though it is an agriculturally based state, industrialization of Assam dates
back to the beginning of the nineteenth century, when the country's first petroleum
refinery was setup by the British at Digboi in Upper Assam. The central projects like Oil
India Ltd., ONGC Ltd., HFC Ltd., Petro-chemical project and more recently Numaligarh
Refinery have been established in the state.

58
Ever since the major industrial development through the establishment of the
Guwahati refinery in 1961 the city has seen a steady growth in the industrial sector.
During the 1990s, the major focus of industrial development in Guwahati has been light
and medium industries. The major types of industries in Guwahati include Chemicals and
Fertilizers, Engineering Industries, Petroleum and Refineries, and Agro Based Industries.
Table 3.18 shows the break-up in Assam and that of Guwahati Municipal Area
(GMA). Community, social and personnel services accounts for a substantial share
followed by retail trade. Manufacturing also has a significant presence.
Table 3.18: Workforce Breakup in Guwahati City: 1998
Activity Code
Major Industry Code Employment in Reference
Area
(Assam)
Employment in Local Area
(GMA)
1 Raising of Live Stock 37,785 2,059
2 Agricultural Services (Hunting, Forestry & Fishing)
16,756 232
3 All Agricultural Activities (Sr. 1 + Sr. 2) 54,541 2,291
4 Mining & Quarrying 24,309 1,021 5 Manufacturing 390,007 16,747
6 Electricity, Gas & Water 6,141 36 7 Construction 55,467 1,622
8 Wholesale Trade 30,711 7,034
9 Retail Trade 163,791 40,211 10 Restaurants & Hotels 68,112 11,097
11 Transport 15,487 5,099 12 Storage & Warehousing 5,658 1,128
13 Communications 13,088 2,005
14 Financial, Insurance, Business Services Real Estate and Business Services
50,738 14,648
15 Community, Social and Personal Services
735,232 95,145
Total 1,613,282 198,084 Source: City Development Plan, Guwahati.
As mentioned earlier, oil refinery and tea production form the major industrial
activity. The climatic conditions of Guwahati, also provide good forest resources including
wood and hence wood based industries like the paper and pulp industry. Good
management practices and use of appropriate technology to harness these resources and
increasing employment would be the key challenge in this state.

59
Guwahati‟s positioning in the tourism map of Assam and perhaps the
northeastern region is due to the fact that the city is well connected to places of tourist
interest by road, rail and air. Most of the tourist routes in the region touch upon
Guwahati and hence is considered to be a hub for tourist movement within the region.
Different action plans facilitating package touring of Guwahati and the neighboring capital
cities like Shillong, Imphal, Kohima and other places in Arunachal Pradesh etc would also
enhance the tourism culture. River cruises to Kaziranga sanctuary, Majuli Island and
other places of tourist interest can be developed to encourage tourism in this region.
From a long-term perspective, to encourage tourism, there is a need to prepare an
Integrated Tourism Plan and will include measures to develop tourist spots holistically
coupled with enhanced connectivity. Steps need to be taken to market tourist
destinations besides developing and publicizing tourism products.
Thus, in terms of the employment potential tourism has great opportunity and
the state is investing in it. With the focus on improving infrastructure, to improve tourism
there is also indirect effect of employment generation in construction activities. Along
with tourism state has traditional handloom and handicrafts sector which has a good
scope with the interest in not just global market but also domestic demand within India.
Better marketing, innovations that will suit the tastes and demand within and outside the
country and skill development to improve the quality of the products will go a long way in
enhancing the well-being of the poor women who may be largely involved in these
activities.
Apart from tourism and related activities the state government is also making
efforts to develop the information technology (IT) sector. With the global slump there
may be some danger in pursuing this vigorously but there is still a need for IT enabled
services within the country itself and also for aspects like e-governance within the state.
Assam‟s challenge to employment and poverty reduction comes from the large
migrant population coming in from other districts and states. The tensions that prevail
between the local population and migrants is an issue that the state has had to grapple
with and needs a more thought out political solution.
3.3 Urban Poor: Prospects for Improving Livelihood Opportunities and
Reducing Vulnerability The National Commission for Enterprises in the Unorganised Sector (NCEUS) was set up
recently with an intention to address livelihood related issues for improving well-being.

60
There have been several studies conducted by it to understand and assess the existing
old and new schemes in India. They have made comprehensive set of recommendations
for those in the informal and unorganised sector.5 Some of the recommendations also
relate to strengthening the laws and bringing in legislation for effective and widespread
implementation of various government schemes.
Since poverty and vulnerability are multi-dimensional, dealing with these aspects
need a multi-pronged approach. The commission identifies three ways through which
conditions of the poor could be improved: (i) social security measures, (ii) better working
conditions, and (iii) creating new livelihood opportunities in the unorganised sector. It is
recognised world over that the employment generation in recent times has been in the
informal sector and will take several years for the transition to occur towards organised
sector employment. In this sense these jobs would impact poverty and given the current
rate of urbanisation their linkage to urban systems is inevitable.
In this section, we discuss some of the possible ways to address urban poverty
by drawing upon some of the recommendations made by NCEUS relevant to the specific
characteristics of the six cities under focus in this study.
The first aspect relates to better working conditions in existing units in the
unorganised sector; not only where there are hazardous substances involved but simple
aspects related to providing cleaner working atmosphere (for instance, clean drinking
water and better sanitation). The duration of working hours are usually very long as has
been observed in the export processing zones which affect the health conditions
particularly of women (Swaminathan, 1997 and 2004).
The second aspect deals with providing the minimum wage and several
challenges exist here. One of the major challenges would be in household sector either
involving units which operate from home drawing upon labour from household members
or for domestic help. Commonly found in these circumstances are unpaid family worker
and child labour. Since these involve dealing with aspects within the privacy of individual
household, regulations to improve the well-being through the involvement of the state is
usually limited. To find ways and means to involve the civil society to assist in this
process is a big challenge.
5 http://nceus.gov.in/

61
The third aspect would be social security measures covering a wide range from
nutrition security to unemployment security involving both short term and long term
measures. For instance, the public distribution system in the cities may be transformed to
food coupons to be encashed against nutritious items like cereals, pulses and milk. In
cities like Chennai affording time to regularly access the fair price shops becomes difficult
as family size has shrunk and both men and women are employed. Further, the taste has
also transformed due to the bandwagon effect and households prefer to consume rice of
richer quality. Similarly, the process of weaning hand-pulled rickshaws in Kolkata poses a
challenge in terms of livelihood opportunities to those involved in it. As has been
suggested by some groups a possible way out would be to provide pensions for the
elderly among them and improve the skills of the younger among these to be absorbed
into any other livelihood options6. One could also find technical solutions for instance a
recently announced innovation of a solar rickshaw that could be economical and cleaner
mode of local transport.7
As discussed in the beginning under-employment is still a concern in the medium
and smaller towns (except Chennai and to some extent Kolkata the unemployment rates
based on CDS has gone up). Thus, household are unable to secure full time employment,
which is usually a feature of rural labour markets. This may be due to the fact that
employment in sectors like tourism may follow a seasonal pattern or that the nature of
contract being informal provides for limited duration employment as in masonry,
carpentry or painting works. Further, with globalisation there may be sudden spells of
unemployment linked to slump in demands for products related to export markets like
the leather and textiles. Unemployment doles from employers may be one way of dealing
with it but administering and ensuring that these are paid out poses difficulties and can
only be applicable where employment is within some organised set-up even though the
employment contract may still be insecure. For those in informal sector the employment
guarantee is being seen as a way forward similar to the rural employment guarantee
programmes now in place. This has to be transformed to suit the nature of economic
activity being pursued in the city. The state will have to actively involve itself in
identifying the sectors and use the local urban bodies for better delivery. Involvement of
civil society is inevitable to reduce corruption and effective monitoring, and would require
formation of self-help groups and neighbourhood groups for this purpose.
6 The Calcutta Samaritans (2008).
7 http://www.hindu.com/2009/07/13/stories/2009071353731800.htm

62
Employment potential has to be identified not only from the perspective of
employment guarantee as there may be several better skilled who may not want to be
part of welfare schemes and remain unemployed seeking better quality jobs. All the cities
have the potential in terms of tourism and as heritage cities. Improving the quality of
skills for better employability is an aspect and now with opening up of tourism sector for
100 percent foreign investment, the investments could be linked to providing finance for
education and vocational training. Public-private partnerships, corporate social
responsibility and other forms of interactions among various stakeholders will be essential
to take this forward. The cities would also serve as central hubs for tourism in and
around the fringes resulting in a larger sphere of employment opportunities outside the
city limits thereby reducing congestion within the cities.
Hotel, retail trade and transportation would be the three main sectors to provide
employment in the near future. Ensuring that gender discrimination both in terms of
hiring and wage payment does not take place, better working conditions linked with
social security measures have to be put in place. With focus on creating a slum-free city,
the quality of housing and transportation for urban poor is a challenge as well
opportunity. The challenge would be in finding cheaper ways of financing such projects
and minimising corruption while opportunities would be in terms of providing
employment in the construction activities and public transportation.
With the increase in economic activities as suggested above, the challenge of
local pollution and increasing contribution to global pollution is going to be immense.
Since the tsunami, cities like Chennai have to some extent started preparing themselves
for natural disasters (perhaps exacerbated by climate change). Greening the cities, using
building materials and production processes that would contribute to lesser pollution,
solid waste management and sanitation works are all likely to create job opportunities
across different skills levels including those without any skills. The immediate goal of
employment provision for adults in these sectors should be to remove children involved
with rag-picking and working in small restaurants, tea shops and grocery stores.
Employment potential improves through skill and educational enhancement. The
community colleges located within slums of Chennai involve the local residents who have
completed secondary schooling for training others. Similarly, human capital is required
for supervising and managing several government schemes at the delivery point.

63
One of the strong requirements for better management of welfare schemes is
whether the amount allocated for different schemes are being spent appropriately and
what impact it has on the beneficiaries. This would involve maintaining a good database
and in the process can also generate some skilled employment at the lowest level.
Involving NGOs for this and monitoring the database on a regular basis would also
provide a lot of transparency. More importantly, this will tap into the demographic
dividend of this country employing the younger population and at the same time provide
flexi-time job options allowing the poor and less skilled additional time for improving their
skills further.
Thus, there are two aspects to poverty reduction within the gamut of livelihood
and employment provision. From the demand side, there is lot to be done to improve the
conditions of work and from the supply side the quality of the labour force has to be
improved. This would entail good governance systems in collaboration with
entrepreneurs, technocrats, social scientists and civil society to enhance the technological
potential and productivity on the one hand and social capital and interactive governance
leading to sustainable solutions on the other hand. A key input no doubt is adequate
financial resources that would lead to improvement of the well-being of the poor in the
cities. The next chapter deals with this aspect in detail.

64
Chapter 4
RESOURCES AND FINANCING OF POVERTY ALLEVIATION
Adequate financial resources are key to any poverty alleviation programme. While
providing resources for poverty reduction is a responsibility of both the central and the
state governments, adequate resources for the local bodies are critically important since
they provide many services that affect the poor directly. The ability of the Municipal
Corporations to raise its own resources will go a long way in implementing meaningful
development programmes in the Urban Local Bodies. Most of the cities in India are faced
with problems related to drinking water supply, sewerage, roads, solid waste
management, and social facilities like education, medical, housing and so on. In this
Chapter we look at the financial resources of five selected cities - Chennai, Kolkata,
Ahmedabad, Jaipur and Guwahati. In the case of Indore data are not adequate for
comparison with the other cities. The analysis in this chapter is based on the information
from the City Development Plan Documents of the respective cities.
Section 4.1 provides a comparative view of inter-city finances of Municipal
Corporations in the five cities. The following Sections from 4.2 to 4.6 provide a brief
overview of growth in finances in the five cities. The last Section 4.7 gives suggestions
for improving resources of the cities and implementing poverty alleviation programmes.
4.1 Inter-city Comparison of Finances of Municipal Corporation
The finances of Municipal Corporation can be categorized into two accounts viz., Revenue
Account and Capital Account. Both of these accounts are further classified into two sub-
heads viz., revenue and expenditure. The revenue account comprises the operating
income and expenditure items of the corporation. These are generally recurring items viz.
income from taxes (octroi, property and other direct taxes), non-tax income (rents on
municipal properties, charges, fees), grants, etc. and expenditure on establishment,
repairs and maintenance, debt-servicing, etc. The corporation spends considerable
amounts on capital works – such as creation of infrastructure assets – water supply and
drainage works, roads, conservancy schemes, purchase of vehicles, plant and machinery.
The corporation‟s funds for capital expenditure are a mix of loans, grants, assistance
from financial institutions and from own sources.
Table 4.1 shows the inter-city comparison of five Municipal Corporations in per
capita terms for the year 2004-05. In the case of Guwahati and Kolkata the capital

65
account data is not available. Ahmedabad Municipal Corporation (AMC) has the highest
per capita receipts among the five cities and is having a surplus on revenue account
while it is spending more than its receipts on capital account.
Table 4.1: Inter-city Comparison of Per Capita Finances of Municipal Corporations: 2004-05
(Rupees)
Chennai Kolkata* Ahmedabad Jaipur Guwahati
Revenue Account Receipts 1647.46 753.44 2871.07 446.36 658.49
Expenditure 1299.51 613.3 2124.2 406.04 709.64 Capital Account
Receipts 415.21 484.21 70.12 Expenditure 346.2 673.37 174.02 Source: Based on City Development Plan Documents and for population it is based on Planning Commission
data released in 2007. Note: *Fiscal position of Urban Local Bodies (including Kolkata Municipal Corporation)
In the case of Chennai Municipal Corporation (CMC), on revenue account the per
capita receipt is Rs. 1648 while per capita expenditure is Rs.1300. Chennai like
Ahmedabad has a surplus account. But unlike Ahmedabad, in Chennai the capital account
expenditure is lower than the receipts. In the case of Kolkata the per capita revenue
account refers to urban local bodies as a whole and it includes Kolkata Municipal
Corporation (KMC). The per capita revenue receipt is Rs. 753.4 while the expenditure is
Rs. 613.3. Guwahati Municipal Corporation (GMC) has higher per capita revenue receipts
as compared to Jaipur Municipal Corporation (JMC) and spending more than its
resources, while Jaipur is having lower per capita expenditure as compared to receipts.
4.2 Chennai Municipal Corporation
The finances of the Corporation of Chennai (CoC) are reviewed for the years 2001-02 to
2004-05. The CoC is maintaining its accounts under accrual based accounting system.
Revenue income of the CoC, has grown to a level of Rs. 523.52 crore in 2004-05 from Rs.
382.15 crore in 2001-02. This accounts for a compounded growth at a rate of 12.33
percent per annum during the four-year period. As a whole, the revenue income of the
CoC has grown at an annual growth of 11.82 percent during the assessment period.
During the same period, revenue expenditure also increased at an average annual rate of
12.73 percent. The CoC maintained revenue surplus consistently over the assessment
period (Table 4.2).

66
Capital income comprises loans, grants and contribution in the form of sale
proceeds of assets and contribution. A major share of capital income is in the form of
transfer from revenue funds, which is s healthy sign. The capital account has witnessed a
deficit-during 2001-02 and 2002-03 implying utilization of revenue surpluses to fund
capital works. However, during 2003-04 and 2004-05, the capital account witnessed a
surplus resulting due to excess withdrawal from revenue fund but not utilized to the full
extent.
Table 4.2: Overview of Municipal Finances of the Corporation of Chennai
S.
No.
Particulars 2001-
02
2002-
03
2003-
04
2004-
05
2005-06
RE
A. Account Summary (Rs. crore)
1
Revenue
Account Receipts 382.15 497.61 527.15 523.52 644.32
Expenditure 360.10 405.77 513.36 508.24 640.74
Surplus / Deficit 22.05 91.84 13.79 15.28 3.58 2 Capital Account
Receipts / Income 87.13 68.50 181.66 162.39 215.40 Expenditure 102.91 71.93 169.11 135.40 215.09
Surplus / Deficit -15.78 -3.43 12.55 26.99 0.31
B. Growth Trends ( in percentage)
1
Revenue
Account Receipts - 30.21 5.94 -0.69 23.07
Expenditure - 12.68 26.52 -1.00 26.07
2 Capital Account Receipts - -21.38 165.20 -10.61 32.64
Expenditure - -30.10 135.10 -19.93 58.86 Source: Government of Tamil Nadu (2006), Development Plan for Chennai Metropolitan Area.
The source-wise income generated for the CoC during the period 2001-02 to
2005-06 is presented in the Table 4.3.
Table 4.3: Composition of Revenue Receipts of the Chennai Municipal Corporation
Particulars 2001-02 2002-03 2003-04 2004-05 2005-06 RE
Tax Revenues 51.86 39.10 44.94 51.08 49.11
Non-tax Revenues 11.11 9.85 10.14 10.95 11.08
Assigned Revenues 34.68 44.82 41.61 34.19 29.64
Revenue Grants and Contributions 2.35 6.24 3.32 3.77 10.17

67
Revenue Receipts (Rs. crore) 382.15 497.61 527.15 523.52 644.32 Source: Government of Tamil Nadu (2006), Development Plan for Chennai Metropolitan Area.
Receipts from taxes include all taxes levied and collected directly by the CoC.
These include property tax and professional tax, which are the more significant taxes and
other taxes like pilgrim tax, tax on carriages and animals, tax on carts, servant tax,
advertisement tax and others. Property tax was the single largest source of revenue of
the CoC and was levied as a percentage of the Annual Rateable Value (ARV) of all real
properties (including built-up and vacant land) within in the administrative jurisdiction of
the CoC. The other major tax item is the professional tax levied on all registered
employed professionals and establishments in the organized sector. Other taxes included
pilgrim tax, tax on carriages and animals, tax on carts, servant tax, advertisement tax
and others.
The total property tax assessment in the CoC was about 5.22 lakhs, resulting in a
property tax demand of about Rs. 216.95 crore for the year 2004-05. The total collection
of property tax (both current and arrears) have increased from Rs. 169.50 crore in 2001-
02 to Rs. 220.54 crore in 2004-05, indicating an average annual growth of about 9.84
percent with an average contribution of 39.65 percent to the total revenue receipts. It
may be noted that there was no tax revision during this period and the increase is only
due to the increase in number of assessments during this period. During this period, the
number of assessments has increased at about 8.78 percent on an average annually
(GoTN, 2006 and MSE, 2008).
During the same period, professional tax component has recorded an increase
from Rs. 28.20 crore in 2001-02 to Rs. 46.22 crore in 2004-05, indicating an average
annual increase of about 20.44 percent with average contribution of about 6.93 percent
to the total revenue receipts was negligible. As a whole, the receipts from taxes alone
has contributed an average of about 46.74 percent to the total revenue receipts of the
CoC, with an average annual growth of about 10.94 percent. The non-tax revenue has
minimum contribution to the total revenue receipts of the CoC. As a whole, about 10.51
percent of the total revenue receipts were realized annually through non-tax revenues.
The non-tax revenues of the CoC have grown at about 10.58 percent per annum on an
average during the period 2001-02 to 2004-05.
Assigned revenues include revenues transferred to the CoC by the Government
of Tamil Nadu (GoTN) under specific acts. These are transferred to the CoC as their
68
share of taxes levied and collected by the Government of Tamil Nadu. These include duty
on transfer of property, entertainment tax, surcharge on sales tax, and other assigned
revenues if any. Among all these, duty on transfer of property and entertainment tax is
the most significant ones. The Government of Tamil Nadu levies duty on transfer of
properties within the administrative limits of the CoC and transfers part of the same to
the CoC. Duty on transfer of properties has grown at an average rate of about 1.97
percent per annum during the assessment period with an average contribution of about
21.27 percent to the total revenue receipts of the CoC. Duty on transfer of property was
forming about half of the assigned revenues of the CoC on an average during the
assessment period.
Similarly, the Government of Tamil Nadu also collects entertainment tax from
cinemas and theatres within the limits of the CoC and transfers 90 percent of the total
tax collection to the CoC, after retaining 10 percent as collection charges. Entertainment
tax has also increased from Rs. 12.14 crore in 2001-02 to Rs. 18.19 crore in 2004-05,
with an average annual growth of 17.16 percent during this period. The entertainment
tax contributed about 2.90 percent of the total revenue while it was 7.38 percent of the
assigned revenue on an average during the four-year period. In addition, there may be
other assigned revenues by the Government of Tamil Nadu to the CoC. Assignment from
other tax revenues had a contribution of about 14.65 percent on an average while there
were no receipts from surcharge on sales tax during this period. The CoC received
revenue grants from the Government of Tamil Nadu to meet recurring expenses under
various schemes. However, the sectoral contribution of revenue grants to the total
revenue receipts was less than 4 percent per annum on average. Also, there was no
consistency in flow of grants during 2001-02 to 2004-05.
The core (revenue) expenditures of the CoC are broadly categorized under the
heads of expenses, personal cost, repairs and maintenance, financial expenses, other
expenses (operating expenses, program expenses, and administrative expenses),
payments and contributions (payment to elementary education fund, library cess,
contribution to capital fund and contribution to Mayor Special Development Fund).
The personnel cost includes salaries and other establishment expenses. The
salaries include pay including personnel pay, special pay, DA, interim relief, HRA, CCA,
allowances like cash, conveyance, medical and others and ex-gratia/bonus. Other
establishment related expenses include travel allowance, LTC, supply of uniform,
conveyance charges, hospital stoppages/reimbursement of medical expenses, training

69
programme expenses and staff welfare expenses. In addition, this also includes
retirement and terminal benefits. The personnel cost of the CoC stood at Rs. 194.39
crore in 2001-02 and was Rs. 207.05 crore in 2004-05. The average utilization was about
45.56 percent of the total revenue expenditure for the last four years, with little/no
change in the growth pattern. The salaries and wages component of the personnel cost
utilized about 32.99 percent of the total revenue expenditure while the terminal and
retirement benefits component utilized 12.57 percent of the total revenue expenditure. It
is observed that about 45.56 percent of revenue income is spent on salaries and wages
(excluding terminal and retirement benefits), which is above the average or threshold
generally considered at 35 to 40 percent of revenue income. This high proportion of
establishment expenditure is one of the factors, which would affect the credit rating of
the CoC.
Repairs and maintenance head include all repairs and maintenance related
expenses like buildings, subways, plants and machineries, roads, drainage, etc. The
repairs and maintenance cost of the CoC has increased from Rs. 16.60 crore in 2001-02
to Rs. 39.28 crore in 2004-05 with an average annual increase of about 37.33 percent.
Financial expenses primarily include interest paid on the loans and other
liabilities. Other components like interest charged by the bank, other bank charges,
lapsed deposit refund, audit expenses, etc. are taken under administrative expenses. The
interest paid towards debt servicing was about 3.74 percent on an average during the
assessment period. There has been a decline in interest paid towards debt servicing,
indicating efforts on part of the CoC towards sustained debt servicing and improving
capability towards leveraging additional debts for city services.
Other expenses include operating expenses, program expense and administrative
expenses. The CoC provides for payment and contributions to various funds within the
CoC, which include payment to elementary education fund, library cases, contribution to
capital fund and contribution to mayor special development fund. The other expenses
had a utilization of about 16.82 percent of the total revenue expenditure while that of
payments and contributions was about 27.05 percent on an average during the
assessment period. The growth trends in both the cases were inconsistent and thus no
specific trend pattern could be established.
The detailed components of the capital receipts are enumerated in the Table 4.4.
An analysis of this account shows that grants contributed 15 percent of the capital

70
income in 2004-05 as against 10 percent by loans grants. However, major proportion
(about three-fourth) of the capital receipts was in the form of transfer from the CoC
funds like revenue funds, elementary education fund, and improvement charges for
private streets and mayor special development fund. This pattern indicates right
utilization by the CoC, its credit worthiness (The Corporation of Chennai has been rated
AA(so)/stable recently in 2006 by CRISIL ratings) and taking up capital asset creation.
Table 4.4: Capital Receipts of the Corporation of Chennai
Particulars 2001-02 2002-03 2003-04 2004-05 Average (Rs. crore) (percent)
Loans 29.32 32.83 5.50 9.48 18.36
Grants 15.08 0.58 5.67 14.83 11.98 Transfer from CoC Funds 55.60 66.58 88.83 75.69 94.58
Capital Receipts (Rs. crore) 87.13 68.5 181.66 162.39 124.92 Source: Government of Tamil Nadu (2006), Development Plan for Chennai Metropolitan Area.
Majority of capital expenditure has been directed towards roads and buildings
with about 78 percent utilization. As such, the capital expenditure pattern is consistent
with equal proportion of spending in each sector. Analysis of capital income and capital
expenditures indicates that the capital account has been in surplus during last two years
(2003-04 and 2004-05) mainly due to excess transfer of funds from the funds of the CoC
(Table 4.5).
Table 4.5: Capital Expenditure of the Corporation of Chennai
Particulars 2001-02 2002-03 2003-04 2004-05 Average
(Rs. crore) (percent)
Roads & Buildings 78.82 81.08 79.03 73.38 93.11
Street Lighting 4.48 2.91 2.73 3.56 4.03 Storm Water Drains 5.48 2.57 9.47 11.56 9.79
Solid Waste Management 2.57 0.06 0.86 1.61 1.58 Basic Amenities 3.53 2.14 2.16 2.63 3.1
Other Capital Works 5.13 11.25 5.75 7.27 8.23
Capital Exp. (Rs. crore) 102.91 71.93 169.11 135.4 119.84 Source: Government of Tamil Nadu (2006), Development Plan for Chennai Metropolitan Area.
Debt Servicing Ratio (DSR) is ratio (expressed in percentage) of debt payment
(principal and interest paid out) to total revenue income. This indicator helps in assessing
the implication of debt on the local body finances vis-à-vis expenditure for operation and
maintenance. It has been observed that the CoC had an average DSR of about 17.40
percent, which is well below the desirable level of 30 percent.

71
Debt management is a significant issue that needs to be addressed, especially in
the wake of urban local bodies having to approach the hitherto non-traditional sources of
borrowings, viz. the financial institutions and the open market. The urban local bodies
ought to plan their borrowings on the basis of their capacity to leverage operating
revenues. Moreover, the local bodies will have to ensure prompt servicing of the debt in
order to retain fair levels of credit-worthiness. This is one aspect where many urban local
bodies have defaulted in the past, due to various reasons. As a result, they end up
accumulating significant sums of overdue principal and interest.
A review of the outstanding loan statement of the CoC, as on March 31st 2005,
reveals that the net outstanding debt liabilities of the CoC are estimated at Rs. 80.14
crore. In 2004-05, the ratio of outstanding loans to current demand of property tax is
about 0.37, thereby indicating that the CoC is capable of leveraging additional debt to
finance its projects as this is well below the threshold level of 3 (generally considered by
Financial Institutions). Debt servicing (including both principal repayment and interest
charges) accounted for about 18.55 percent of revenue expenditure during the review
period and the DSR (as percentage of revenue income) is around 17.40 percent, which is
still below the threshold level of 25 percent, considered by financial institutions. The debt
servicing in 2004-05 was 12.36 percent and was about 35 percent in 2003-04 (this
includes takeover loan of Rs. 56.20 crore), indicating the efforts on part of the CoC
towards sustained debt servicing and improving the capability towards leveraging
additional debts for city development. The outstanding loan per capita however is not a
performance or a status indicator, but it gives a measure to compare the extent of
borrowings/debt liability by the CoC. The analysis indicates that the outstanding debt per
capita was about Rs. 179.
4.3 Kolkata Metropolitan Area
The Kolkata Metropolitan Area (KMA) consists of Municipal Corporations (Kolkata
Municipal Corporation, Howrah Municipal Corporation and Chandannagar Municipal
Corporation) and 38 Municipalities. In view of this financial analysis of Urban Local Bodies
(ULB‟s) has been presented on two scenarios, Scenario 1 excludes Kolkata Municipal
Corporation (KMC) financials and Scenario 2 includes KMC financials. KMC has
weightages in the range of 80-85 percent and 75-80 percent in aggregate revenue from
own sources and total revenue expenditure respectively, of all the ULB‟s combined
together. Thus, any trends or change in trends of KMC financials will have a significant

72
impact on the overall outcomes and thus might not reflect the true picture of financials of
all other ULB‟s (Table 4.6).
Table 4.6: Aggregate Fiscal Position of ULB’s (including KMC)
(Rs. crore)
Year
Own Source Revenue Receipts
2001-02 2002-03 2003-04 2004-05
Total Revenue Receipts
Property Tax Revenue 226.24 258.69 285.56 431.58 Other Tax Revenue 8.49 14.38 22.25 25.05
Non-tax Revenue 322.95 478.36 655.73 515.79
Total Own Source Revenue 557.68 751.42 963.55 972.42
Total Revenue Expenditure
Salary & Wages 543.10 548.31 483.43 499.28
Other Revenue Expenditure 225.66 224.72 299.27 292.28 Total Revenue Expenditure 768.76 773.03 782.70 791.56
Government Transfers & Grants 406.69 407.56 415.41 457.65
Gap Analysis Own Source Revenue and Revenue
Expenditure Gap -211.09 -21.61 180.85 180.86 Revenue Surplus 195.60 385.95 596.26 638.52 Source: Kolkata City Development Plan, Kolkata Metropolitan Development Authority.
The aggregate picture, including KMC financials shows that „Own Source
Revenues‟ have increased significantly, with only a marginal increase in „Revenue
Expenditure‟, thus, converting a deficit into a surplus.
The analysis of fiscal performance of ULB‟s is more realistic if an analysis of
trends in key fiscal indicators on a per capita basis is attempted, so as to assess whether
improvement or increase in key financial figures is only due to population increase or is
due to greater and more effective efforts of the ULB. Per capita revenue was Rs. 753.4
per capita and the per capita expenditure was Rs.613.3 per capita in 2004-05 (Table
4.7).
Table 4.8 shows the key ratios and growth rates on parameters related to ULB
finances and growth rates over the period 2001-02 to 2004-05. Since 2001 to 2005, own
resources of the Kolkata Municipal area and other urban local bodies such as
municipalities in the Kolkata metropolitan area increased by about 20.36 percent, though
the growth has been decelerating year after year. The salary and wage expenditure has

73
fallen slightly. Revenue expenditure has been growing rather slowly, at the rate of less
than one percent per annum that has contributed to the surpluses.
Table 4.7: Aggregate Fiscal Position of ULBs - Per Capita (including KMC) (in Rupees)
Year Per Capita Own Source Revenue Receipts
2001-02 2002-03 2003-04 2004-05
Property Tax Revenue 182.83 206.16 224.41 334.39 Other Tax Revenue 6.86 11.46 17.49 19.41
Non-tax Revenue 260.97 381.23 515.31 399.64 Per Capita Total Own Source
Revenue 450.66 598.85 757.21 753.44
Total Revenue Expenditure Salary & Wages 438.88 436.98 379.91 386.85
Other Revenue Expenditure 182.36 179.09 235.18 226.46
Per Capita Total Revenue Expenditure 621.24 616.07 615.09 613.31
Government Transfers & Grants 328.64 324.80 326.45 354.60
Gap Analysis Per Capita Own Source Revenue &
Revenue Expenditure Gap -170.58 -17.22 142.12 140.13 Per Capita Revenue Surplus 158.06 307.58 468.57 494.73 Source: Kolkata City Development Plan, Kolkata Metropolitan Development Authority.
Table 4.8: Growth Rate (including KMC)
(percent)
Parameter 2002-03 2003-04 2004-05 CAGR
Own Source Revenue 34.74 28.23 0.92 20.36 Property Tax Current Demand 8.39 11.25 11.32 10.31
Non-Tax Revenue 48.12 37.08 -21.34 16.89 Revenue Expenditure 0.55 1.25 1.13 0.98
Salary and Wages Expenditure 0.96 -11.83 3.28 -2.77 Source: Kolkata City Development Plan, Kolkata Metropolitan Development Authority. Note: * CAGR – Compound Annual Growth Rate.
The capability of ULBs to rally resources efficiently indicates their self reliance
and less dependence on the State Government for support. Financially self-reliant ULBs
can only be achieved if they harness themselves adequately for generation of own
resources rather than looking up each year to the State Government for funds. The State
Government, through “The West Bengal Municipal Act” has given revenue-raising powers
to the Local Bodies. Most of the urban local bodies seem to have (i) own source revenue

74
as proportion of revenue expenditure of at least 45 percent in 2003-04 and 2004-05, (ii)
compound annual growth rate (CAGR) of own revenue generation of at least 10 percent;
(iii) CAGR of per capita on source revenue generation of at least 10 percent. An analysis
of individual ULBs on the above parameters exhibits that at least 16 ULBs fulfills all the
above mentioned conditions. The 16 ULBs together account for more than 60 percent of
the population of the KMA area and thus a majority of the population is being serviced by
ULBs that are functioning effectively in terms of improving their services and at the same
time are taking steps to increase generation of revenue from own sources and they were
able to generate surpluses as per capita expenditure was lower than the per capita
revenue raised.
From the above analysis, it can be concluded that more than 67 percent of the
population of KMA is being serviced by ULBs that either have sound financial health or
are making effective efforts towards attaining healthy financial health. About 60 percent
of the KMA population is being serviced by ULBs that are making effective efforts towards
better provision of services for citizens.
Non-tax revenues have been greater contributors to the overall own sources
revenues, which exhibits greater capacity of Kolkata Municipal Corporation to raise non
tax revenues. In 2004-05 non-tax revenues are lower than 2003-04, but it can be seen
that 2004-05 non-tax revenues are higher than 2002-03. The fall in 2004-05 appears to
be substantial more so because of a sudden spurt in 2003-04 and therefore is not a
cause of worry.
4.4 Ahmedabad Municipal Corporation
Until 1991 the Municipal Corporation of Ahmedabad had shortage of funds and thereafter
the financial situation improved. Initially octroi and property tax helped the revenues but
later the corporation went to the capital market to raise funds through public bonds
worth Rs. 100 crore at an interest rate of 14 percent per annum. AMC also went in for
commercial borrowing from HUDCO at 18 percent interest, and from US Housing
Guarantee Funds also at 18 percent interest. It also borrowed from the World Bank and
resorted to commercial borrowing. Hence, over time as borrowing for infrastructure
increased, the debt servicing and debt repayment accounted for more than a third of its
revenues. The loss of revenue from octroi also contributed the general problems.
However, due to floating of tax free bonds several times since nineties helped the
Municipal Corporation to raise funds.

75
Some experts like Darshini Mahadevia are of the opinion that the changing face
of globalization and raising finances for infrastructure projects and preoccupation with
mega projects diverted the government‟s attention away from increasing expenditure on
urban poverty alleviation programmes.
The city of Ahmedabad has shown operating surplus, in spite of its development
activities. The corporation has shown a mix of surplus and deficit in its revenue and
capital accounts over five years (2000-01 to 2004-05) for which data are available (Table
4.9). The revenue account shows a surplus, whereas the capital account has shown
deficit in three of the past five years. It shows the city‟s ability to generate surpluses
amidst a favourable and flexible environment as well as flexibility in the tax structure.
The corporation has a healthy opening balance of more than Rs. 246 crore and the
positive fiscal result demonstrates the officials‟ will to maintain fiscal control.
Table 4.9: Summary of Ahmedabad Municipal Corporation
(Rs. crore)
Items 2000- 01 2001- 02 2002- 03 2003- 04 2004- 05
Opening Balance 139.23 160.54 234.58 169.50 246.26
Revenue Account
Receipts 562.58 561.84 615.64 690.68 806.20
Expenditure 561.20 559.54 581.90 562.65 596.48
Surplus/Deficit 1.38 2.30 33.74 128.03 209.72
Capital Account
Receipts 156.08 241.70 38.80 192.12 135.97
Expenditure 136.15 169.96 137.62 243.39 189.08
Surplus/Deficit 19.94 71.74 -98.82 -51.28 -53.12 Source: City Development Plan of Ahmedabad 2006-2012, prepared by AMC and AUDA with Technical support
by CEPT University. Note: The figures have been computed based on the annual accounts‟ figures provided by the AMC.
The revenue account has shown significant surpluses over the years. It
represented an upward trend from Rs. 1.38 crore in 2000-01 to Rs. 209.72 crore in 2004-
05, while the capital account has recorded deficit during the past three yeas indicating
transfer of revenue surplus for assets‟ creation on a regular basis, which is a positive
feature. Inspite of deficit in capital account, the overall municipal account has been
continuously in surplus during the assessment period indicating the sound financial health
of the corporation. The revenue receipts of the corporation have grown at a rate of 9.70
percent, while the growth in revenue expenditure during the same period was only 1.28

76
percent. This explains for high operating surpluses during the last five years. The trends
in capital income and expenditure have been fluctuating.
In addition, the Municipal Corporation undertakes infrastructure projects, such as
improvement in water supply, conservancy related works, development of commercial
complexes, etc. The source-wise uses of the general fund of the corporation (revenue
and capital account) are discussed later in this Chapter.
Table 4.10 shows the revenue receipts of the municipal corporation categorized
as own sources (octroi, tax and non-tax sources) of the corporation, general grant and
contributions.
Table 4.10: Composition of Revenue Receipts
Item 2000- 01 2001- 02 2002- 03 2003- 04 2004- 05
Own Sources 81.86 84.10 85.51 88.08 88.68
Octroi 57.68 54.66 58.69 58.05 57.34 Taxes 17.39 21.64 19.69 19.81 21.55
Non-tax Sources 6.79 7.80 7.13 10.22 9.79 Grants & Subsidies 18.14 15.90 14.49 11.92 11.32
Total Revenue Receipts 100.00 100.00 100.00 100.00 100.00 Source: City Development Plan of Ahmedabad 2006-2012, prepared by AMC and AUDA with Technical support
by CEPT University.
In 2004-05, Ahmedabad Municipal Corporation (AMC) derived about 80 percent
of its revenues from octroi and taxes and a mere 9.8 percent from non-tax sources, with
state government grants providing a further 11 percent of the revenues. Octroi and
property tax (general tax, water charges and water mere inspection fee) dominated the
tax structure. The low non-tax receipts can be attributed to low rates of user charges for
services against considerably good service coverage. In effect the corporation‟s income
largely depends on a single source i.e. octroi, whose contribution has been constant
between 54 to 58 percent for the past five years. The total revenue income for the year
2004-2005 was Rs. 806.20 crore. In the absence of any assigned revenues, deposits and
advances, AMC has been able to generate 81 to 88 percent of the total revenue income
through its own sources during the last five years. It has shown a collection of Rs. 714.96
crore during 2004-05. Also, the number of property tax assessments increased by 24
percent from 2003-04 to 2004-05.

77
The AMC levies property tax and services-based taxes of different types against
the services provided by it to the citizens. The corporation also owns assets in the form
of land and buildings, which are leased / rented out to generate revenue. The income
from such sources contributes to the own source income of AMC.
The taxation powers for the corporation and relevant procedures are listed in
Section 127 of BPMC Act, 1949. The taxes levied by the corporation are (a) property tax
(property tax, and water and sewerage charges), (b) other direct taxes (vehicle tax and
theatre tax), and (c) other taxes/refund.
The tax sources accounts for about 21.55 percent of the total revenue income in
2004-05 (Table 4.10). The tax sources have increased from Rs. 97.84 crore in 2000-01 to
173.77 crore in 2004-05, thereby showing a growth rate of about 15.96 percent.
Table 4.11 show the composition of taxes of AMC during the period 2000-01 to
2004-05.
Table 4.11: Share of Income from Tax Source of AMC (percent)
Item 2000- 01 2001- 02 2002-03 2003- 04 2004- 05
1. Property Tax 95.89 98.91 98.35 95.67 96.24
a. General Tax 93.85 98.24 90.09 81.68 80.52
b. Water Sewage Charges 2.05 0.67 8.26 13.98 15.71
c. Water Inspection Fee 0.00 0.00 0.00 0.01 0.00
2. Other Taxes 4.11 1.09 1.65 4.33 3.76
Total Taxes (1+2) 100.00 100.00 100.00 100.00 100.00 Source: City Development Plan of Ahmedabad 2006-2012, prepared by AMC and AUDA with Technical support
by CEPT University.
The property related taxes are commonly known as house tax and include a tax
on buildings or lands situated with the municipal limits. In some local bodies, it is
observed that a consolidated tax is being levied in place of property tax. The AMC levies
property tax on residential, commercial and industrial buildings and lands that lie within
its jurisdiction. The rules and procedures pertaining to levy of property tax are governed
by the (Bombay Provincial Municipal Corporation) BPMC.
The income from general tax has increased from Rs. 91.81 crore in 2000-01 to
Rs. 139.93 crore in 2004-05. These collections are mainly due to the revamping of the

78
tariff rates apart from the increase in the number of property tax assessments during
1998. The number of property tax assessments in AMC has grown over the years from
9.5 lakh tenements in 2001 to about 10 lakh tenements in 2004-05.
As for water and sewerage charges, the AMC levied water tax to all assessments
having house service connection within the AMC limits. The water tax levied was done as
a part of the property tax. However with the change in the property tax formula, water
tax component has been removed. Prior to introduction of this system (2001-02) the
contribution of water tax to the total revenue income was marginal 0.43 percent at the
aggregate level. Realizations by way of water tax have been about Rs. 2.0 crore during
2000-01. The income from water tax has grown at a rate of 7.14 percent during the last
five years. The amount realized under water taxes has been around Rs. 2 crore to Rs. 2.3
crore during last five years.
The other major taxes levied by the AMC are vehicle tax and theatre tax. The
share of these two taxes in the total tax is negligible. During the last five years, these
two contributed 0.62 percent to the tax sources showing a declining trend. The income
from this source during the year 2004-05 was about Rs. 5.92 crore.
The non-tax own revenue sources of the AMC accounts for 9.79 percent of the
total revenue income. The revenue sources include fees and charges levied as per the
legislation. The income sources are classified under the following broad categories, such
as (i) municipal properties, (ii) collection from public places, (iii) realization under special
status, (iv) public service charges/fee, (v) sale proceeds and (vi) miscellaneous income
(Figure 4.1). These revenue sources include the income from leased/rented out municipal
property and form the fees and charges levied for the different services rendered by the
corporation. At an aggregate level, the contribution of non-tax income to the total
revenue income generated is about 8 percent.
The AMC grants and contribution comes from the state and central government
under various heads, for general as well as specific purpose. About 14.03 percent of the
total income is contributed from this source with a sum of Rs. 91.23 crore in 2004-05.
Some of the heads as per the AMC statement are (a) slum upgradation, (b) MLA and MP
grant, (c) GMFB grant for urban poor, and (d) Finance Commission grant.
The total revenue expenditure has increased from Rs. 561.20 crore in 2000-01 to
Rs. 596.48 crore in 2004-05 - a growth of 1.28 percent (Table 4.12).

79
0
5
10
15
20
25
30
35
40
45
(Rs. crore)
2000- 01 2001- 02 2002- 03 2003- 04 2004- 05
Figure 4.1: Non-tax Revenues of AMC
Table 4.12: Revenue Expenditure of AMC
Items 2000- 01 2001-02 2002-03 2003-04 2004-05
Establishment Expenditure 45.18 42.04 40.85 43.59 41.27 Administration & General Expenses 1.83 1.64 2.64 1.97 1.75
Repair and Maintenance 2.86 3.70 4.01 3.36 5.60
Power Charges 10.18 11.68 11.08 11.35 9.92 Fuels 0.57 0.58 0.56 0.54 0.56
Consumarable Stores 0.01 0.01 0.01 0.01 0.02 Service & Programme Expenses 2.46 2.69 2.95 2.54 3.32
Contribution to Allied Institutions & Others 24.60 24.28 22.27 22.47 22.91
Debt Charges 12.30 13.38 15.63 14.17 14.64
Grand Total (Rs. crore) 561.20 559.54 581.90 562.65 596.48 Source: City Development Plan of Ahmedabad 2006-2012, prepared by AMC and AUDA with Technical support
by CEPT University.
Capital receipts are also referred to as capital non-tax sources. AMC has the
following sources of income for own sources, grants and borrowings (Table 4.13).

80
Table 4.13: Composition of Capital Receipts of AMC
Financial Year 2000-01 2001-02 2002-03 2003-04 2004-05
Grant and Contribution 18.45 17.06 96.02 32.80 24.43 Borrowings 81.47 82.91 0.00 66.63 73.55
Other Capital Income 0.08 0.03 3.98 0.57 2.03
Capital Receipts (Rs. crore) 156.08 241.70 38.80 192.12 135.97 Source: City Development Plan of Ahmedabad 2006-2012, prepared by AMC and AUDA with
Technical support by CEPT University.
Table 4.14: Composition of Capital Expenditure of AMC
Financial Year 2000- 01 2001- 02 2002- 03 2003- 04
Land 0.45 0.44 0.04 0.36
Buildings 2.50 4.75 3.15 0.68 Public Places 2.50 0.58 0.65 0.71
Roads/ Bridges 14.64 4.44 2.26 6.86
Sewerage & Drainage Lines 6.30 2.55 1.52 5.36 Water Supply 39.36 6.35 9.66 16.92
Plants, Machinery & Equipment 0.79 0.52 0.14 0.26 Motor Vehicle and Transportation 0.27 0.02 0.31 0.54
Office Equipments 0.51 0.04 1.91 0.67
Street Lighting 0.40 0.90 0.00 0.66 Works for Weaker Section 1.19 0.46 0.46 0.20
Miscellaneous Fixed Assets 31.10 78.96 79.90 66.78
Capital Expenditure (Rs. crore) 136.15 169.96 137.62 243.39 Source: City Development Plan of Ahmedabad 2006-2012, prepared by AMC and AUDA with Technical support
by CEPT University.
The capital expenditure of AMC includes all expenditure incurred on creation /
acquisition of capital including construction of buildings and infrastructure systems and
purchase of furniture, plant / equipment, machinery and vehicles (Table 4.14).
The total outstanding loan including the overdue principal and interest as on
March 2001 is Rs. 329.24 crore. The loans from LIC and HUDCO alone account for about
46 percent of the total outstanding loans of the AMC. The ratio of outstanding liabilities
to total property tax demand is 40.48. The outstanding liabilities for the financial year
ending 2004-05 are Rs. 420.57 crore.
4.5 Jaipur Municipal Corporation

81
In this section the financial resources of Jaipur Municipal Corporation (JMC), Jaipur Nagar
Nigam (JNN) and Jaipur Development Authority (JDA) are examined.
4.5.1 Jaipur Municipal Corporation Finances
Jaipur Municipal Corporation (JMC) has been assigned a range of functions relating to the
provision of the public services. They strive to meet the costs of constructing and
maintaining urban facilities and services. The revenue receipts comprise own sources
(taxes and non-taxes) and grants from the central and state governments. Capital
receipts comprise revenues earned from sale of land, general grants from state and
central governments and various loans. The revenue expenditure comprises salaries and
wages, establishment, operations and maintenance and interest and debt servicing.
Capital expenditure includes grants, equipment / assets, loan repayments and refunds.
The accounts of the JMC are maintained on an accrual based double-entry system which
is under process. JMC is empowered to levy and collect taxes approved by the state
government.
The financial profile of JMC shows that the total receipts that were steady at Rs.
145 crore upto 2003-04 have declined to Rs. 130 crore by 2004-05. Own tax sources
account for 65 percent, own non-taxes account for 10 percent, grants about 11 percent
and the rest 14 percent are capital receipts from sale of land and loans. The available
information on Jaipur Municipal Corporation has been presented in Tables 4.15 and 4.16.
Table 4.15: Financial Profile of Jaipur Municipal Corporation
(Rs. crore)
Particulars 2001-02 2002-03 2003-04 2004-05
Total Receipts 145.00 130.00 Own Tax Revenue 93.53 84.26
Own Non-Tax Revenue 14.96 13.48
Grants 16.21 14.61 Capital Receipts 23.38 20.30 17.65
Total Expenditures 130.00 146.00 Salaries and Wages 71.50 80.30
Establishment 6.50 7.30
Operation and Maintenance 11.70 13.14 Interest and Debt Payment 1.30 1.46
Capital Expenditure 39.00 43.80 Source: Jaipur Municipal Corporation.

82
Table 4.16: Financial Details of JMC Compiled for the Year 2004-05
(Rs. crore)
Particulars Jaipur
Revenue Account
Receipts 112.35 Expenditure 102.20
Capital Account
Receipts 17.65 Expenditure 43.80 Source: Jaipur Municipal Corporation.
As in the case of other municipal bodies, JMC‟s own tax revenue comprises the
revenues from property / house tax, octroi, advertisement hoardings tax, road / market /
footpath tax and entertainment tax. Major non-tax revenues are from building permission
fees, licenses and other by-law revenues, and penalties. The most important tax source
was the octroi that accounted for over 70 percent of the own revenue, followed by the
house / property tax. Octroi is levied on the goods entering within the municipal limits for
use, consumption or sale. But octroi has been removed and now whatsoever is received
is in the form of arrears. In order to compensate for the loss of the removal of octroi, the
state government has instituted a grant with an annual growth of 10 percent.
House tax is the second most important tax levied by JMC. Till 2003, the house
tax was levied on the basis of the Annual Rental Value (ARV). After, 2003 onwards the
method was converted to a unit based system. The charges for the house tax are:
50 paise per sq. ft for covered area
50 paise per sq. yard for open area
Residential – 50 paise per sq. ft
Commercial – INR 2 per sq. ft
Industrial – 50 paise per sq. ft
Industrial other than RIICO area – INR 2 per sq. ft
Industrial under RIICO* area – Nil
Utilization of RIICO area other than industrial then the rates are same as for
mentioned above
There is no tax on Temples
*Rajasthan State Industrial Development & Investment Corporation
Source: Jaipur Municipal Corporation House Tax Department.

83
Capital receipts of JMC mainly comprise sale of land, general grants and loans.
They have declined from Rs. 23.38 crore in 2001-02 to Rs. 17.65 crore in 2004-05.
Capital grants have also declined in 2003-04. Performance of sale of land has been very
fluctuating over the last four financial years and in 2004-05 it has declined to almost 50
percent. Thus, overall there has been a consistent fall in the revenues of the JMC.
Total expenditure has been steadily rising. It rose from Rs. 130 crore in 2001-02
to Rs. 146 crore in 2004-05. Over 70 percent of the expenditure is of current nature
comprising of salaries and wages (55 percent), establishment (5 percent), operation and
maintenance (9 percent), and interest and debt-servicing obligations (1 percent). Capital
expenditure forms about 30 percent of total. Overall the revenue account balance which
has been a surplus has been declining as also the capital account deflect is rising,
resulting overall worsening of the total fiscal balance.
Some reforms are being underway in the accounting system, which are being
converted to accrual system. Also, there is a need to provide suitable training on double-
entry accounting/accrual system of accounting. The tax collection efficiency needs to be
improved. The arrears (accounts receivable) need to be reduced by streamlining the
collection machinery. The revenue collection system is inefficient and the asset
management and maintenance is inadequate. There is lack of financial and taxation
powers, the JMC cannot borrow from the market. No proper budgeting system in place.
There is considerable room for review and revision of the current tax rates. The data
base and information management is poor and there is a lack of use of technology in
infrastructure monitoring.
4.5.2 Slum Dwellers in JMC
About 60 percent households are ready to pay for better water supply services. The
amount paid by households for the use of water differed from slum to slum. On an
average they are ready to pay up to Rs. 60-70 per month except in the case of Fauji
Nagar, people are very poor and don‟t pay for water at present. Of the few who pay, it is
a nominal amount of Rs. 20 a month. Overall, more than one-third households are ready
to pay between 25-50 and18 percent households are ready to pay even more than Rs.
50. At the same time households are also ready to pay for new water connection as
shown in the table given below. More than 50 percent households are ready to pay for
new connection across all the surveyed slums.

84
More than 1/4th (27 percent) households are ready to pay up to Rs. 200 for a
new connection and more than half the people are interested to pay only up to Rs. 100.
Since people are more affluent in Gujarghati, a minority of 20 percent families is even
ready to spend Rs. 200 to Rs. 350 a month. The per capita water consumption too varied
across slums. In slums where water supply is available for longer periods, especially in
cases where people have individual bore wells, per capita daily consumption was quite
high. In contrast, per capita daily consumption was low which was in hilly areas. People
expressed an urgent need to improve the existing water facilities. According to them,
water should be supplied twice a day, in the morning and evening; pressure of water
should be improved so that people can fill containers up quickly; damaged pipes must be
promptly replaced, community taps should be located at central points to enable all
households to have equal access to water supply which will also help minimize collection
time.
4.5.3 Jaipur Nagar Nigam
On the whole, there appears to be considerable lack of accountability and transparency in
functioning of Jaipur Nagar Nigam (JNN) and lack of experience in handling big
infrastructure project. The financial organization seems quite uncoordinated. JNN
finances are in an unsatisfactory state, attributable to the abolition of octroi. The surplus
on revenue account which the JNN used to have in 2001-02 has been converted into a
deficit. Even though JNN received octroi compensation from the state government, this
has been shown as a part of `own resources‟ of the JNN. This manner of classification
changes the finance portfolio of the JNN. On the expenditure side, salaries and wages
account for 77 percent of the total revenue expenditure of the JNN, leaving little for the
maintenance of services.
4.5.4 Overview of Jaipur Development Authority Finances
The income sources of Jaipur Development Authority (JDA) may be categorized as
revenue receipts, capital, deposits and recovery of loans and advances. The expenditure
comprises revenue expenditure, capital expenditure and deposits, loans and advances.
Of the three basic components of the JDA receipts, revenue receipts comprising
urban assessment fee, interest receipts and other miscellaneous receipts, hardly form 10
percent of the total receipts. Capital receipts are the main stay which average at about
Rs. 125 crore. These receipts along with the deposits and loans form 90 percent of the
receipts. While capital receipts have been stable over the last four years, deposits and
loans have increased.

85
As regards the expenditure the total expenditure has been around Rs. 249 crore.
Over half of the expenditure is of capital nature comprising costs of land acquisition,
expenditure on development works and construction as also grants to Jaipur Nagar
Nigam and various Panchayats. More expenses on capital side imply that the stress is on
the development side, which is purpose of JDA‟s existence. Deposit refunds, loans and
advances and related repayments also form significant portion. The expenditure growth
and pattern more or less remained constant during the last few years.
Revenue expenditure on an average over last four financial years accounted for
11 percent of the total expenses incurred by JDA. Within revenue expenditure salaries
and wages accounts for around 43 percent. Under capital expenditure, maximum amount
is spent on development works, which indicates that the reason for the existence of a
development works only. This is followed by the expenses incurred on construction
works, which accounts to around 5 percent approximately.
The revenue and capital account balances indicate that the JDA is not quite able
to meet its recurrent expenditure out of its own resources. The establishment costs seem
on a higher side and exceed the revenue receipts because both the capital as well as
revenue account balances are negative. The operating ratio, which is defined as the ratio
of revenue expenditure to revenue income, is an indicator of profitability of the
operations of a local body. The operating ratio has been more than unity indicating a
trend of going beyond means. However, the operating ratio is showing a declining trend
thereby indicating that JDA is improving. Debt Servicing Ratio (DSR) is ratio (expressed in
percentage) of debt payment to total revenue income. This indicator helps in assessing
the implication of debt on the local body finances. But it has been observed that the local
body services their debt on regular basis.
The City Development Plan of Jaipur also shows a deficit for the Jaipur
Development Authority (JDA). Also, JDA has powers to levy assessment fee.
There are other bodies providing public services in Jaipur such as the Rajasthan
Housing Board (RHB), Public Health Engineering Department (PHED), Public Works
Department (PWD), Rajasthan Urban Infrastructure Development Project (RUIDP),
Irrigation Department (ID), and Finance Department. All these bodies do not have
decision making powers and their finances are part of the state finances. Therefore, it is
pertinent to look into the state level finances.
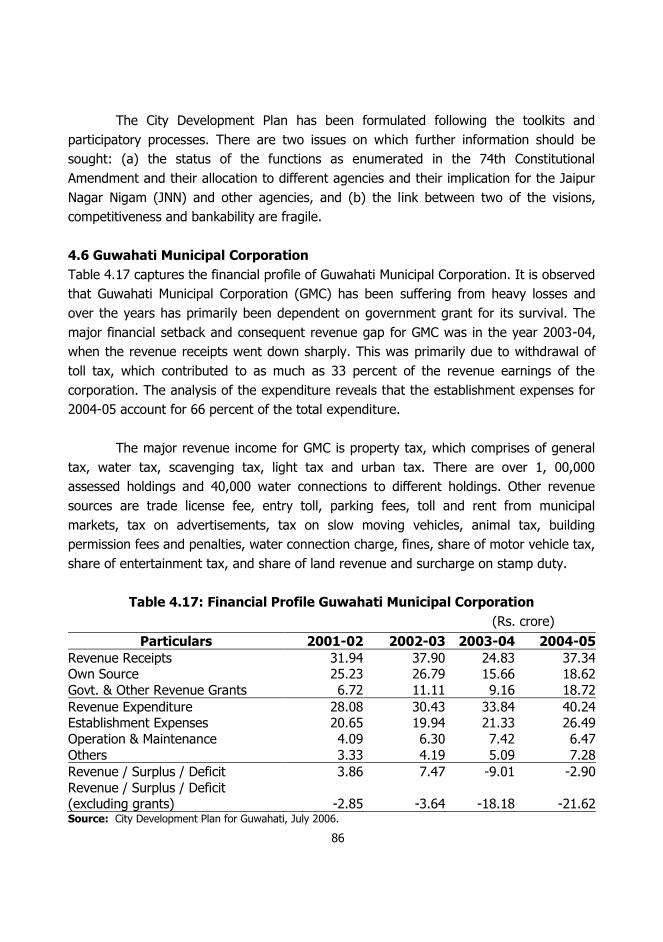
86
The City Development Plan has been formulated following the toolkits and
participatory processes. There are two issues on which further information should be
sought: (a) the status of the functions as enumerated in the 74th Constitutional
Amendment and their allocation to different agencies and their implication for the Jaipur
Nagar Nigam (JNN) and other agencies, and (b) the link between two of the visions,
competitiveness and bankability are fragile.
4.6 Guwahati Municipal Corporation
Table 4.17 captures the financial profile of Guwahati Municipal Corporation. It is observed
that Guwahati Municipal Corporation (GMC) has been suffering from heavy losses and
over the years has primarily been dependent on government grant for its survival. The
major financial setback and consequent revenue gap for GMC was in the year 2003-04,
when the revenue receipts went down sharply. This was primarily due to withdrawal of
toll tax, which contributed to as much as 33 percent of the revenue earnings of the
corporation. The analysis of the expenditure reveals that the establishment expenses for
2004-05 account for 66 percent of the total expenditure.
The major revenue income for GMC is property tax, which comprises of general
tax, water tax, scavenging tax, light tax and urban tax. There are over 1, 00,000
assessed holdings and 40,000 water connections to different holdings. Other revenue
sources are trade license fee, entry toll, parking fees, toll and rent from municipal
markets, tax on advertisements, tax on slow moving vehicles, animal tax, building
permission fees and penalties, water connection charge, fines, share of motor vehicle tax,
share of entertainment tax, and share of land revenue and surcharge on stamp duty.
Table 4.17: Financial Profile Guwahati Municipal Corporation
(Rs. crore)
Particulars 2001-02 2002-03 2003-04 2004-05
Revenue Receipts 31.94 37.90 24.83 37.34 Own Source 25.23 26.79 15.66 18.62
Govt. & Other Revenue Grants 6.72 11.11 9.16 18.72
Revenue Expenditure 28.08 30.43 33.84 40.24 Establishment Expenses 20.65 19.94 21.33 26.49
Operation & Maintenance 4.09 6.30 7.42 6.47
Others 3.33 4.19 5.09 7.28
Revenue / Surplus / Deficit 3.86 7.47 -9.01 -2.90
Revenue / Surplus / Deficit (excluding grants) -2.85 -3.64 -18.18 -21.62 Source: City Development Plan for Guwahati, July 2006.

87
The major revenue income for GMC is property tax, which comprises of general
tax, water tax, scavenging tax, light tax and urban tax. There are over 1, 00,000
assessed holdings and 40,000 water connections to different holdings. Other revenue
sources are trade license fee, entry toll, parking fees, toll and rent from municipal
markets, tax on advertisements, tax on slow moving vehicles, animal tax, building
permission fees and penalties, water connection charge, fines, share of motor vehicle tax,
share of entertainment tax, and share of land revenue and surcharge on stamp duty.
One of the key factors affecting the financial health of GMC is the extremely low
recovery of the cost of services being rendered by the corporation. For example, as per
Government of India (GoI) report in 2003, the average cost per connection on account of
water generation and distribution is Rs. 9 against a cost recovery of only Rs. 3 per
connection reflecting a collection level of only 33 percent.
The Financial Operating Plan is essentially a multi year forecast of the Urban
Local Body in the area. In order to assess the sustainability of the project and quantify
the impact of the reform process, an attempt has been made to develop a Financial Plan
based on the information available, analysis of the trend and the commitments received
from the State Government. The Financial Plan charts out the revenue income and
expenditure so as to ensure that the cash flows are sustainable. The overall fund
requirement is proposed to be spent over a period of three years and the region is taking
full efforts to expedite the project development. In line with JNNURM guidelines for the
northeastern region, the projects are proposed to be funded as per the Table 4.18.
Table 4.18: Sources of Finance
Mode of Financing
Source Amount (Rs. crore)
Percentage of Total Investment
Identified Investments 3200 100
Grants JNNURM 2880 90
Loan / ULB‟s
Open Market / FIs / State
Government 320 10 Source: City Development Plan for Guwahati, July 2006.
The key assumptions have been appropriately escalated keeping in view the
inflation and past trends as follows:
Property Tax: The projections are based on the present collection which is proposed
to be enhanced to 85 percent by the end of the Mission Period.

88
Urban Immovable Tax (UIT) and Taxes on Animals and Non-mechanized Vehicles:
These have been projected to increase by 6 and 2 percent, respectively. Similar
escalation rates have been applied to other income heads.
Urban Local Bodies (ULBs): ULBs have been accessing grants for funding plan and
non-plan expenditures. This is essentially need based and is for approved
expenditure heads.
O&M Expenditures: The average O&M Expenditures for new projects has been
assumed at 3 percent of the project cost.
O&M Expenditures of Corporation: The O&M Expenditures of Corporation are to
increase sharply from 2009-10 with the implementation of the JNNURM Projects. The
Corporation needs to take strong measures for collection of the user charges at 3
percent of the project cost and to be further spelt out in the Memorandum of
Agreement proposed to be entered with the Government of India in due course.
However, complete cost recovery considering the present abysmal rate of recovery
can be achieved only over a length of time and therefore there is a requirement of
availability of funds in the interim period.
Operation and Maintenance Fund (O&M Fund). It is proposed to create a O&M Fund
for funding the deficit of O&M Recoveries so as to ensure that the assets created
under the Mission is maintained and operated as per best practices. The Fund will be
operational by 2009-10 when the projects become operational.
Cost Recovery: The cost recovery of the water, sewage and drainage schemes have
been computed based on targets for cost recoveries which are accepted by the State
Government.
In order to leverage JNNURM funding to attract private sector resources and
efficiencies, projects for creation of logistic hubs, parking terminals, bus terminals etc are
to be operated under pubic-private partnership and with 100 percent cost recovery. The
utilisation figures are given in Table 4.19.

89
Table 4.19: Utilization
Sources Amount (Rs. crore)
Transportation* 811
Drainage 200
Service to Urban Poor 80 Water 1077
Solid Waste 66 Sewerage 306
Total 2540 Source: City Development Plan for Guwahati, July 2006. Note: * Cost of MRTS has not been included, however the total expenditure for the MRTS project has been calculated around Rs. 1500 crore.
4.7 Summary
The finances of the municipal corporation in the four states viz., Ahmedabad, Chennai,
Guwahati, Jaipur and Kolkata do not seem to be in great shape, though the degree of
comfort varies among the cities. There is a need to raise their own resources to meet the
various developmental needs of the growing urban population in the cities. There is a
need to boost the property tax collections by giving appropriate incentives to the city
dwellers. The non-tax income like rents on municipal properties should be in line with the
commercial market rates. There is a need to increase the charges and fees for services
provided by the municipal corporation keeping in view the changing situation of the
economy. Computerization of collection centres so that the transactions are immediately
recorded. The corporations spend considerable amount of funds on maintenance of
various services, there is a need to monitor the expenditures and maintain the standards
set for infrastructure assets. Also there should be efforts to improve the existing services
to the satisfaction of the public especially in areas like water supply and drainage works,
roads, and conservancy schemes. Since corporation funds for capital expenditure mainly
come from a mix of loans, grants, and assistance from financial institutions, there is a
need to maintain transparency in their dealings, especially in the purchases of capital
assets. The cities also get grants from the state and the centre to run various poverty
alleviation programmes in the urban areas, there is a need to make transactions on these
schemes transparent and the impact of the targeted users regularly assessed and
appropriate corrective measures taken. The accounts should be maintained and
accessible to the public on demand.

90
Chapter 5
POVERTY ALLEVIATION PROGRAMMES - PROGRESS AND PROSPECTS
In view of the Central Government‟s decision to raise the budget allocation for urban
poor schemes to 39.73 billion rupees in 2009-10,8 it is important to see what the
schemes are and how they impact urban poverty. Unfortunately a comprehensive
evaluation of the urban poverty alleviation programmes is not available to assess their
effectiveness. The urban poverty alleviation programmes are designed not only to
generate self employment and wage employment, but also to improve the quality of life
of the slum dwellers and provide housing. The main aim is to provide minimum basic
amenities such as electricity, water supply, toilet facilities, sewage connection, and
proper disposal of solid and liquid waste in the slum areas. Hence, the progress of urban
poverty alleviation needs to be judged in terms of BPL population, slum population,
progress in housing, conditions of the slums and so on. Most of these aspects are already
covered in the report and the situation was rather bleak on several fronts, except the
poverty ratio, which was lower in some cities in 2004-05 compared to 1993-94. The
impact of high inflation in 2008-09 relating to essential commodities on urban poverty in
2008-09 is not known. The average inflation as per the Consumer Price Index relevant to
urban poverty groups has been 9.1 percent for the period 2008-09.9 Unfortunately, we
do not have any evaluation of the city specific food-based programmes such as Public
Distribution System, Antyodaya Annapurna Yojana etc.
Unlike the rural poverty alleviation schemes, which have been conceived and put
in place since the mid seventies the urban poverty alleviation schemes have been
initiated only in early nineties. The problems of urban poverty are multi dimensional. Lack
of purchasing power or income poverty is one of them. Problems of urban poverty are
not restricted to intermittent unemployment and vulnerability to food inflation. In
addition, there are problems of slums along the sewage canals/drains, garbage dumps
and so on. Lack of adequate water-supply, toilet facilities, education and health facilities
add to their woes. All the cities also have houseless population, living on pavements and
side streets. There are street children, rag pickers and street vendors. Unlike the rural
poor, urban poor are not a homogenous group. Thus urban poverty is multi faceted.
8 Budget speech of the Finance Minister on 6
th July, 2009.
9 Economic Survey 2008-09 released on July 2
nd , 2009.
91
Thus the profile of poverty and the problems differ from one group to the other
from one location to the other (some slums are as good as housing colonies albeit
congested), one city to the other and one group to the other (for example rag picker‟s
problems are different from street vendor‟s). This is not to say that there are no common
problems to all cities. Such identified common problems are addressed by the centrally
sponsored schemes. Yet the character of the problem differs and defies easy solutions.
Urban poverty alleviation is quite a daunting task. Probably this is one of the reasons for
the inability to find one programme that is effective in all cities. Each city tells a story of
its own. It is doubtful if one successful program for one city can necessarily be replicated
elsewhere.
In this Chapter in section 5.1 an overview of the poverty alleviation schemes
implemented in the five cities is presented. In section 5.2, some of the city specific
experiences and experiments of centrally sponsored schemes, which are common to all
the five selected cities, are discussed. A few programmes specific to some cities are
highlighted as successful. However, full evaluations are not available.
5.1 Urban Poverty Alleviation Schemes: An Overview
Urban Poverty alleviation schemes are of three types from the perspective of who
sponsored the programme: (i) centrally sponsored schemes of the central government,
(ii) state government sponsored or local government sponsored schemes, and (iii) those
aided and promoted by international development agencies. From the perspective of
financing also they are of three types: (a) those completely financed by the central or
state government or both, (b) those subsidised by the central or state government or the
aid agency, which involve payment by the individuals to avail of the benefits, and (c)
other schemes which involves cost sharing by the entire community as groups. Private
sector partners are also involved in the poverty alleviation programmes but their
involvement is not direct. The payment for the services rendered by the private sector
partners is normally made by the government and they are not accountable to the
individual beneficiaries or poverty groups. The involvement of the non-governmental
agencies is very common and normally sought to mobilize the poverty groups to avail of
the benefits or to organize the poverty groups and communities to participate in the
activities that benefit them. However increasingly, the non-governmental agencies are
extensively used by the governments and international aid agencies as agents of service
delivery to the poor, or middlemen to reach the micro credit to the poor. The role of non-
governmental agencies in sensitising the poor, mobilizing the poor and making the poor

92
aware of their right and responsibilities is receding to the background, except in a few
cases especially in the urban poverty alleviation scenario.
Main Objectives of Poverty Alleviation Schemes
From the point of view of the problems addressed, the poverty alleviation programmes
target
1. subsidised food distribution to the BPL families and destitute families,
2. employment generation, through skill generation and loans and provision of work,
3. slum improvement or upgradation by providing basic amenities such as water,
electricity, individual and community toilets, sewage connections, garbage disposal
etc.,
4. provision of subsidised housing, community shelters, resettling those displaced
from unauthorised and objectionable slums, allotment of land and so on.
The central government sponsored programmes are prominent in all the above
areas, viz., food, shelter, sanitation, and employment. The central government
programmes of poverty alleviation in the area of foodgrains are the Public Distribution
System to the BPL population and Antyodaya Anna Yojana for the old and the infirm.
Among the employment generation programmes, the prominent one is the Swarna
Jayanti Shahari RojgarYojana and its predecessor, Nehru RojgarYojana. Some states
had merged this programme with the housing programme as in West Bengal. In the area
of urban housing, a variety of schemes were in place for a long time and more recent
ones are the Valmiki Ambedkar Awas Yojana (VAMBAY) for upgrading the existing houses
in the slums and Jawaharlal Nehru National Urban Renewal Mission (JNNURM) for
building new houses. In all these areas, the state governments have taken their own
initiatives and some states were more successful than others.
To sum up, we find that Chennai city has been the most successful in the area of
food based programmes. Housing for the urban poor is affordable in Chennai and
Kolkata. Kolkata Municipal Corporation has been in the forefront of providing affordable
slum amenities. Ahmedabad city has done a commendable job in the employment
generation initiatives, while for housing for the urban poor there has not been much
progress. Indore has provided security of land tenure to the urban poor since 1984. Land
allotment and rights of tenure to the urban poor under the Patta Act of Madhya Pradesh
are remarkably good. Though the amenities have not been provided in the slums in
Indore, land rights help people to invest. Jaipur housing for urban poor is still at a
planning stage but land is available on lease to slum dwellers. Kolkata Municipal

93
Corporation has been in the forefront of providing affordable slum amenities. Thus, the
emphasis on the schemes and achievements vary across the cities.
5.2 Centrally Sponsored Programmes of Poverty Alleviation
5.2.1 Food Based Programmes
Many food based programmes are common to urban and rural areas. Food based
programmes are important for the urban poor as they mostly depend upon purchased
food. The increase in the price of the daily food consumption items in 2008-09 would
have had a considerable impact on the lives of the poor but for the benefits of the food
based programmes. In this context, the urban poor are worse off than the rural poor
since the prices would be lower in the areas at least in the harvest season. Prominent
among these schemes are the Targeted Public Distribution System that sells food grain to
the “Below Poverty Line” (BPL) families at prices below the market rates by issuing the
BPL cards. There are other food based programmes with or without add-on benefits such
as cash component, medical help, free education etc. These are Annapurna Yojana,
Antyodaya Anna Yojana, Mid-day Meal scheme, and Integrated Child Development
Scheme (ICDS). Other common schemes such as Balika Samridhi Yojana, Maternity
Benefit Scheme, Pension Scheme and so on also offer useful benefits. 10
Annapurna Yojana benefits those destitutes who are above 65 years of age and
not covered in state or central social security pension scheme. They are issued special
green ration cards. Urban local bodies have to carry out the identification of these
destitutes. Ten kilograms of rice per month is given under the scheme. Antyodaya Anna
Yojana (AAY) gives 25 kg of rice/wheat per family to the poorest of the poor at Rs. 2 or
Rs. 3 per kilogram in rural and urban areas. The AAY families are issued special yellow
ration cards. Mid-day Meal Scheme entitles all the primary school children, in government
and government-aided schools, a fresh cooked meal on each working day, for at least
200 days in a year. Integrated Child Development Scheme gives supplementary food to
the lactating and expectant mothers and pre-school children in the ICDS centres.
Family welfare programmes are meant mainly for widows and children, Balika
Samridhi programme for adolescent girls, sometimes give food grains in addition to or in
lieu of the cash prescribed. They may also give free medical help. Pension programme is
meant for old people, aged destitutes, widows, and disabled. A minimum of Rs. 75 per
month is to be given. Many states give higher amounts. Levels of implementation as well
10
http://www.righttofoodindia.org/schemes/scheme.html

94
as coverage of food entitlement differ from state to state and city to city. BPL cards and
AAY cards are issued in all the six cities studied.
Chennai
Of the six cities studied Chennai is in the forefront of issuing BPL ration cards as well as
Antodya Anna Yojana cards to the identified families. BPL ration cards are issued to the
houseless population as well in Chennai. The price of rice was cut to Rs. 2 per kg by the
incoming DMK government in June 2006. When the open market price of rice rose from
Rs. 20 to Rs. 35 per kg, the Tamil Nadu government announced a subsidy scheme of rice
at Re. 1 per kg for all card holder families and free for BPL families. In addition, the poor
get dhal, oil, sugar and tea, all at subsidised rates. The prices are normally 50 percent
lower than the market prices in Chennai city. Women/men who have lost the sole
breadwinner of the family (age less than 65 years), gets a family pension of Rs. 400 per
month.
About 18 lakh families of the state were entitled to 35 kg of rice per month under
the scheme. The exact number of cards issued in Chennai city is not known. However,
the government admitted the presence of bogus ration cards in excess of the actual BPL
families. Chennai is also in the forefront of providing cooked meals to all the school
children in the government and government-aided primary schools. Even the Integrated
Child Development Schemes work well in Chennai city providing supplementary diets to
preschool children, lactating expectant mothers. They also get day care facilities for
working mothers.
Kolkata
Kolkata has been making an effort to issue BPL cards and AAY cards to the identified
poor in the state and Kolkata city. Following Andhra Pradesh and Tamil Nadu, West
Bengal government fixed the price of the common boiled rice at Rs. 2 a kg in January
2009. It has drawn a lot of people to ration outlets. Hitherto, BPL rice was Rs. 6.15 per
kg while AAY rice sold for Rs. 3 per kg. There were no problems over the quality of rice,
though the supply has been by and large erratic. There was lot of skepticism as to
whether West Bengal could sustain such a scheme for long, given the track record of
poor performance of the PDS in the past.11 The Mid-day Meal programme and the
Integrated Child Development programme are not as effective as in Tamil Nadu.
11
Times of India (2009).

95
Ahmedabad
The computerized ration cards for BPL families, APL families and the Antyodya Anna
Yojana cards have been issued to all the eligible persons in the state including the
Ahmedabad city, totaling 1.6 crore people. Gujarat also issues rolling ration cards for
migrant workers. The cards issued were found to be larger than the identified poor and
richer sections seem to have been benefited as per a CAG report. A survey of
Ahmedabad Metropolitan Area revealed that there were about 634 cards issued to richer
sections of the population.12
Jaipur
As per the City Development Report, there are about 26000 BPL families identified. In
addition, 364 AAY cards for subsidized foodgrains and 348 Annapurna cards for free
distribution of foodgrains have been issued in the city of Jaipur.
Indore
As per the 2007 City Development Report, according to survey sponsored by the
JNNURM, about 69044 people applied for the BPL cards and the city government
approved 54392 BPL cards. Another 10,000 ration cards were issued under Antyodaya
Anna Yojana programme. Thus a total of the number of people holding BPL or AAY cards
constitutes only 4.3 percent of the total population of Indore city.
Guwahati
In general, the northeast states being border state are provided ample foodgrains for
distribution under the Public Distribution System from the central government. It is
expected that the PDS would be reaching all the needy.
5.2.2 Employment Generation Programme
Swarna Jayanti Shahari RojgarYojana
Swarna Jayanti Shahari RojgarYojana (SJSRY) was launched in December 1997 by the
Government of India. SJSRY seeks to provide gainful employment to the urban poor
through wage employment or self-employment. The scheme funding is shared between
the Central and State Governments, with the former providing 75 percent of the funds
and the latter 25 percent. Self employment subsidy is to be provided at the rate of 15
percent of the project cost, subject to a ceiling of Rs. 7500 per beneficiary (for individual
urban self employed person). Contribution of 5 percent as margin money is to be borne
12
Financial Express (2007).

96
by the applicant. Under-employed and unemployed urban youth whose annual family
income is below the poverty line and who have got education up to ninth standard are
assisted with bank loan and government subsidy. Prior to the new guidelines, the
definition of „below poverty line‟ (BPL) was annual income of Rs. 24,180 or below, based
on a survey conducted in 1998. Urban Wage Employment Programme (UWEP) aims at
providing wages to the urban poor working on improving infrastructure facilities like
roads, drainages, community halls, etc. The SJSRY has three components:
Gainful Employment to Urban Poor through Self-employment or Wage-employment
Under the Urban Self Employment Programme (USEP), the scheme provides assistance to
individuals for setting up gainful self-employment ventures, including loans and training
of beneficiaries for acquisition or upgrading of vocational and entrepreneurial skills. The
Urban wage employment programme (UWEP) aims at providing wages to the urban poor
working on improving infrastructure facilities like roads, drainages, community halls, etc.
Promoting Community Empowerment through Creation of Suitable Community
Structures The SJSRY is based on the foundation of community empowerment. Instead of relying on
top down implementation, this programme aims to promote community organisations for
local development. Community organisations like Neighborhoods Groups (NHGs) and
Neighbourhood Committee (NHCs) are to be set up in the target areas and federated
under Community Development Societies (CDSs). They are the focal point for
identification of beneficiaries, preparation of applications, monitoring of recovery of loans
given under the scheme, and identification of viable livelihood projects suitable to their
area
Development of Women and Children Groups in Urban Areas Programme
The scheme also promotes the formation of women‟s groups under the Development of
Women and Children Groups in Urban Areas Programme (DWCUA). The DWCUA groups
undertake income generating activities with financial support from the programme.
Problems of Design
Some of the inherent problems of design of the schemes generally reported were that
they remained top down. If the officials take interest, some progress is made. If the
official interest is low, the schemes do not get any attention. There was no demand for
funds allocated or response from within the poverty groups as such. Community
participation on their own initiative is very rare, though the committed non-governmental

97
organizations make it happen. Urban poor are not a cohesive group like tribal poverty
groups, who tend to work together. Involvement of non-governmental organization is
important to create awareness and to make people come forward and benefit from the
schemes. Poor are normally not efficient in running businesses and taking the risks,
which are required in the business. Hence many self employment programmes remain
unprofitable and short lived.
Of the six cities, Chennai City Development Plan did not elaborate the SJSRY
implementation. There was a mention of the previous programme, viz., the Nehru
RojgarYojana, the funding for which was used for housing and employment generation of
the labour employed. The Kolkata report did not give any evaluation, but had given the
financial and physical targets achieved under the scheme. Only Ahmedabad and Jaipur
have given an evaluation of the scheme. In Ahmedabad city, the evaluation highlighted
the problems of establishing bank linkages to the enterprises and irregular repayments of
loans. Training was not adequate to acquire relevant skills to get employment.
Chennai
Under Nehru Rojgar Yojana loan assistance of Rs. 4150 per slum family was given for
upgradation of their shelters. It was implemented by Tamil Nadu Slum Clearance Board
(TNSCB) with grant assistance from GoI and GoTN and loan assistance from HUDCO.
About 14000 families benefited by this scheme.
Kolkata
The SJSRY programme was implemented on a city/town basis with special emphasis on
urban poor clusters. The programme targets the urbanites living below the poverty line.
The special schemes of the programme are: Urban wage employment programme and
urban self employment programme. In the self-employment programme, 41,079
applications have been sent till date to different banks for obtaining bank loans and out
of these, 12,647 applications have so far been granted loans by the banks. Under skill
development programme, 66,116 unemployed youth have been trained and 605 of them
have been employed / self employed.
The most important feature of the SJSRY is the active participation of the women
of the poor families in formulating, implementing, and supervising the schemes. For this,
a three-tier structure has been formed at the municipal level. About 35374
Neighbourhood Groups (NHGSs, 3295 Neighbourhood Committees (NHCs) and 302
Community Development Societies (CDSs) have been formed in Kolkata city. Another

98
prominent part of the scheme is the formation of about 10277 thrift and credit groups
(TCGs) and the formation of 267 DWCUA (Development of Women and Child in Urban
Areas) groups. 41079 cases of micro enterprises for self employment were provided with
loans. About 66116 persons received skill training.
Jaipur
A provision of Rs. 2500 lakh has been proposed as state share for the Eleventh Five Year
Plan under the SJSRY programme, out of which Rs. 250 lakh was for the Annual Plan
2007-08. The assessment study carried out by local bodies in 2006 found that in Jaipur, a
number of job opportunities have been created in colonies where BPL households reside.
Women have taken various trade trainings and they are eager to obtain grants and loans.
These grants and loans have been provided with 75 percent as central government
contribution and 25 percent as state contribution under SJSRY. Under the daily wage
programme, the selected bodies have been providing 27 days gainful employment each
month. Banks too have been prompt in granting loans within 15 days from the receipt of
applications. However, the financial assessment study of Jaipur city concluded that the
allocations under the programme by both the central as well as the state government are
fluctuating. No group based activities were formed in the city. Very few beneficiaries
have been imparted training in tailoring and stitching or other relevant skills.
Indore
The evaluation of the various schemes for Indore shows that in spite of all the welfare
schemes, the government‟s endeavour of “slum free Indore by 2015” seems a difficult
target to achieve. Most of the interventions have failed in achieving their objectives due
to lack of participation of NGOs, Community Base Organisations (CBOs) and beneficiaries.
Lack of coordination between agencies involved is a major problem. The issue of
operation and maintenance of the facilities has also not been addressed.
State Level Programmes of Employment Generation for Urban Poor
Ahmedabad Ek Mauka Udan – A Scheme for Livelihood Promotion
The Ahmedabad Municipal Corporation (AMC) launched a livelihood programme “Ek
Mauka Udan” in September 2005 in partnership with Saath and heritage livelihood. Saath
is an Ahmedabad based NGO working in the city‟s slums. The heritage livelihood is a
Hyderabad based organization working to promote livelihoods. This programme was first
piloted in Andhra Pradesh (AP) by Dr. Reddy‟s group. AMC was approached by Dr.
Reddy‟s group for this venture. Heritage livelihood of AP conducted the training and
Saath was the implementing agency. This programme has also been implemented in

99
countries like Sri Lanka and Vietnam. The aim of the programme is to provide or
upgrade (train) skills among the youth to make them competent for the present day
market and give them employment opportunities.
AMC and the beneficiary share the cost of the training. AMC has a budget of
Rs. 4100 per participant. The beneficiary pays Rs. 500 as fees while the other costs,
including infrastructure required for conducting the trainings are borne by AMC. The
beneficiary has to pay Rs. 250 before the training and the remaining half on completion
of the training. The beneficiary has to be between the age group of 18 - 30 years.
The role of the NGO is built into the scheme‟s design. This includes market
assessment, awareness creation, identification of beneficiaries and organizing the training
and market assessment. Prior to the implementation of this project, market assessment
was done in order to assess the market situation. Road shows were conducted in slums
to orient the youth about the programme. The main features of this initiative were to
create scheme awareness, promote the programme at the community level, identifying
beneficiaries between the age group of 18-30 years and enroll identified youths for the
programme based on their area of interest.
Different trades have been identified under this programme in order to train the
youths. The trades are broadly classified as (a) multi skill (e.g. AC repairing, refrigerator
repairing), (b) hospitality (e.g. hotel management), (c) logistics (e.g. office management,
couriers), (d) Earnings Per Share [EPS] (e.g. customer relation, call centers), and (e)
information technology (e.g. MS office, Desk Top Publishing. The course duration of each
batch is three months. Uptill April 2007, four batches have been trained with a total of
900 beneficiaries.
The NGO Saath associated with the programme found that the ratio of male to
female trainees per batch was 70:30. The overall dropout rate was 10 percent. 5-10
percent males get placed with some company, 5 percent join father‟s business. Of the
female trainees, 3 percent are not interested in taking up any kind of job after training.
One of the main reasons for dropping out is joining the course at the same time when
they are involved in their family business The trainees absorbed in the market draw a
monthly salary in the range of Rs. 1500 - 6000.
Programme success is clear from the high motivation levels due to enhanced
capacities. Trainees learn not only the specific skills that they are trained for, but also

100
several „life skills‟ through their peers and through the training experience. The trainees
have been placed in mainstream businesses such as the Subhiksha chain of retail stores.
The Gujarat state government is now trying to replicate this programme at the state
level.
After the success of this programme, the state government has now decided to
replicate it elsewhere in the state. Some of the changes that would be introduced in the
present programme are as follows:
1. This programme has been renamed “Ummeed”.
2. A budget of Rs. 35 crore has been allocated for training 1 lakh trainees over a
period of 3 years.
3. Cost sharing would be done by the state and the participant where the state will
contribute Rs. 3500 and participant will contribute Rs. 500.
4. Some SJSRY funds and the infrastructure of SJSRY will be used for this
programme on a larger scale. The existing infrastructure will be improved to
enhance the quality of the programme.
5. Saath will be the resource agency in this case. They will be responsible for
overseeing the implementation of this programme in Ahmedabad, Baroda,
Palanpur and other selected districts.
6. 3 more NGOs have been associated with this task. They are Dr. Reddy‟s, Capt
Foundation and AID-DE-ACTION.
In implementing this programme some of the main challenges are as follows.
First, the programme does not target people above 30 years of age. This programme is
designed only to train people between the age group of 18-30. Thus it does not target
people who are in the higher age group, when in fact they are the ones who need such
training the most, owing to their social position. Secondly, all trainees don‟t get job
placements. The effort is to place all the trainees, but they do not get placements.
Skill Training to the Poor an NGO Initiative in Ahmedabad
One of the popular initiatives is “providing skills to the poor”. It is done differently by
different organizations. The organization „Saath‟ has established one urban resource
centre for 1000 poor people in the slums of Ahmedabad. The main task of the resource
centre is to collect data and pass it on to the appropriate authorities. They also collect
information about the existing skills of the people. The training is given to the youth in
the slums in skills such as spoken english, basic computer skills, and other technical
programs. At present training is being imparted in courses like Customer Relation and

101
Sales (CRS), IT Enabled Services (ITES), Business Process Outsourcing (BPO),
Hospitality, Multi-skills, Bed Side Patient Assistant (BSPA), logistics, automobile repair,
electrician course etc. There is a placement cell that helps them to get jobs. About 80
percent get jobs in the salary range of Rs. 2000- 2500 per month. The training is
imparted for a period of 3 months and fee is charged.
The resource centres also help the agencies to train domestic helpers. The work
of police verification and certification of the domestic helpers is done by the agencies.
Basic training in house work, use of gadgets, and basic cleanliness is given and agencies
send domestic helpers to the required households. The agencies get jobs that fetch up
to Rs. 3500 per month for 8 hour work. The agencies earn money by charging the
employer as well as the employee.
SEWA (self employed women‟s association) also provides skill training to women.
They import the textile machinery (zuki machines) and provide training for 3 months by
charging Rs. 50 per person so that they get placement in the textile mills. They also
provide various other types of training that enables the members to get jobs. These
include use of embroidery machines, computer skill, sales girls training, petrol filling skills
to get jobs in petrol pumps etc. SEWA effectively organizes the street vendors, rag
pickers, construction workers and home based workers, and systematically provides them
the required enabling atmosphere. They go to the extent of fighting the court cases to
get space for street vendors and help for rag pickers. SEWA wants to buy land for the
street vendors, so that they cannot be evicted. They also want to make the street
vendors to maintain the places clean and not to obstruct the traffic by encroaching up on
the streets, and pay their taxes to the municipality. The rag pickers are organized and bid
for the municipality tenders for door to door collection of the garbage is in process.
SEWA also runs five peace centres in sensitive areas of communal violence to give one
hour life education, and organize all festivals. SEWA provides tuition to the children in
the municipal schools up to third standard.
5.2.3 Housing Programmes
Valmiki Ambedkar Awas Yojana (VAMBAY)
VAMBAY launched during 2001-02 by the central government. The scheme aims at
providing shelter or upgrading the existing shelter for people living in urban slums. The
target group consists of all slum dwellers in urban slums, who are below the poverty line.
In selecting beneficiaries the following reservation scheme is to be followed: not less
than 50 percent allocation to SC and ST, 30 percent allocation to backward classes, 15

102
percent to other weaker section, and 5 percent to physically disabled persons. Half of the
total project cost is borne by central government and the rest is shared between the
beneficiary and the urban local body or the state.
„Nirmal Bharat Abhiyan‟ is an integral sub component of VAMBAY. Twenty
percent of the total allocation under VAMBAY is dedicated to the construction of
community sanitation facilities. Slum clearance boards and urban local bodies such as
Municipal Corporations act as nodal agencies. Subsidy is provided at 50 percent of the
cost and 50 percent is given as a loan by HUDCO. Each toilet block is to be maintained by
a group from among the slum dwellers who will make a monthly contribution of about
Rs. 20 or so per family and obtain a monthly pass or family card.
Chennai
Under the VAMBAY scheme the urban slum families who are in possession of title for the
land were provided with R.C.C. roof houses having a plinth area of about 150 sq. ft. at a
cost of Rs. 40,000. So far, these houses have been provided for 17,250 families at a cost of
Rs. 69.00 crore. The works under this programme have been implemented adopting the
following funding pattern: Rs. 20,000 from the government of India grant; Rs.16,000 as
institutional finance and Rs. 4000 as the contribution from the beneficiary. In Chennai, 80
percent of total amount received from GOI was spent on housing of which: 50 percent
was given as subsidy and 30 percent as loan. The remaining 20 percent has been
invested in the provision of water supply and sanitation (toilets) within the assisted
slums.
Kolkata
Under VAMBAY scheme, construction of 6573 dwelling units and 20 community toilets
have been completed against a target of 9675 dwelling units and 30 community toilets.
Kolkata Metropolitan Development Authority has completed 876 units against the target
of 1076 in East Kolkata, B.P. township, Tolly's Nullah, Chetla Hut and Barasat.
Construction of 807 Units at Mahisbathan, Panihati (Phase II), Mahatsabtala, Nonadanga
(Phase-II) has also been initiated. At present, VAMBAY has been merged with SJSRY in
West Bengal. As per City Development Plan in Kolkata, about 2424 dwelling units were
sanctioned 1542 were constructed. 794 toilets have been constructed.
Ahmedabad
The city is required to construct 60,000 houses for the urban poor at a cost of Rs. 750
crore. Ten percent of the land was allotted to the economically weaker sections and

103
houses are built with the money received from JNNURM scheme. AMC has indicate that
by 2009 about 30,000 low income houses have been constructed. However, allotment is
done to the selected beneficiaries after recovering the construction cost borne by AMC.
The beneficiaries get subsidy to the extent of land cost and the JNNURM contribution.
There is no scheme of free housing to the slum dwellers, though land is allotted to those
who are displaced by the infrastructure projects.
Indore
Indore Municipal Corporation and Indore Development Authority (IDA) have rehabilitated
around 1000 slum dwellers under this scheme so far. Under this scheme Indore Municipal
Corporation has redeveloped Arjun Pura slum which proposed rehabilitation of 344 slum
households. The work is under progress and 50 percent of them are already
rehabilitated. Similarly, Indore Development Authority has rehabilitated Buddha Nagar
Slum comprising 600 dwelling units. Indore Development Authority had taken up
proposals for rehabilitation of about 6000 slum dwellers under their currently running
town development schemes. In future, IDA will be developing its town development
schemes with 20 percent of the developed land reserved for economically weaker
sections and low income group housing and will be rehabilitating slum dwellers.
The scheme has been much criticized in Indore, owing to some of its
shortcomings. Some of them, from the beneficiaries‟ perspective are that the area of
houses is very small and doesn‟t provide enough space for all essential household
activities. Planning of the houses is illogical since the toilet is oddly shaped, with doors
opening inwards and they are positioned very close to the cooking area, in several
houses. Beneficiaries pointed out that limited access to information on the scheme
available from the implementing agency and lack of mechanisms/platforms to ensure
community participation in design, monitoring of construction and project
implementation.
Jaipur
Under the Valmiki Ambedkar Awas Yojana scheme, 1940 houses have been constructed
for slum dwellers in the city of Jaipur. In 2002-03, according to official records, nearly
2000 families were covered in three slum colonies of Govindpura, Bakshawala and Paldi
Meena. Apna Ghar Apna Aangan Yojana is another programme of VAMBAY. As part of the
VAMBAY programme, this scheme has been designed to provide housing along with basic
facilities to the slum people. Located on Ajmer road near Bhangrota, 335 surveyed
families will be allotted dwelling units at Kharda site near Bhakrota on Ajmer road. The

104
total cost of the project is Rs. 167.5 lakh, which is being financed with HUDCO
assistance. The project is likely to be completed in the near future.
Another ambitious multipurpose scheme for resettlement of 16 unorganised slum
colonies at Sanjay Nagar Bhatta Basti area has been drawn for 10171 surveyed families.
The area consists of 500 bigha of barren land up to Nahargarh hills out of which 400
bigha land has already been developed. Under the scheme, two storey houses (ground
plus one) would be constructed with central assistance under VAMBAY. The estimated
cost of this scheme under VAMBAY is about Rs 14.00 crore. Expenditure on development
of infrastructure facilities like roads, drinking water, sewerage, drainage, schools, parks,
police station, post office and community centre etc. comes to an additional 34.60 crore.
Guwahati
To provide shelter or upgrade the existing shelter for people living below poverty line in
urban slums, which will help in making cities slum free. Land ownership and housing are
critical for poverty alleviation and slum development. One of the reasons identified for
the growth of slums is the non-availability of developed land for weaker sections.
For this purpose, Guwahati Municipal Development Authority (GMDA) will be
taking steps for development of housing facilities for the poor in the fringe areas and the
unused lands, with central agencies such as land with railways which are lying unused or
are being used for illegal encroachment, of the city or other vacant lands outside the
cities where land price is affordable for the poor section. Also, provide basic housing to
the identified areas with a scheme, where there is partial recovery from the users. Night
Shelters for pavement dwellers shall also be provided to improve the living the conditions
of the homeless.
Jawaharlal Nehru National Urban Renewal Mission (JNNURM) in the Slums
While VAMBAY is a scheme for upgrading the existing temporary houses in slums,
JNNURM aims at building new houses for the slum population. JNNURM which is for a
seven-year period from 2005-06 has two main components – basic services to the urban
poor (BSUP), programme and integrated housing and slum development programme
(IHSDP). BSUP was launched to assist cities and towns in taking up housing and
infrastructural facilities for the urban poor in 63 selected cities in the country. IHSDP,
which was launched simultaneously with BSUP in December 2005, is taking up housing
and slum upgrade programmes in non-BSUP cities.

105
Ahmedabad
Being a recent programme, the details of implementation are not available. In the
Ahmedabad about 30,000 houses are being planned for construction for economically
weaker sections. Allocation priority is given to the people displaced by the city
development. It may be observed that the cost of housing of 30,000 may be high for
some of the poor. The number of houses to be constructed is too small compared to the
demand. Further the programme is a time bound one with targets and the progress is
likely to be slow owing to the delayed allocation of land by the state governments with
possible miss-targeting and cost hikes.
Other housing Schemes in the Cities
Chennai Housing Schemes
Shelter for Shelterless Scheme
Affordable houses for slum dwellers were constructed on serviced plots, using locally
available materials and adopting low cost techniques. They were allotted to slum families
on hire purchase basis. It was tried as a pilot project in Chennai by TNSCB with GOI
grant 20 percent, GoTN grant 15 percent and HUDCO loan component 65 percent. The
total number of families who have benefited under the scheme was 2982.
Tamil Nadu Slum Clearing Board’s Sites and Services Scheme
Land acquired under the Tamil Nadu Urban Ceiling (TNULC) Act and allotted to Tamil
Nadu Slum Clearance Board (TNSCB) was used for this scheme. Open plots with basic
infrastructures were developed with loan assistance from HUDCO and the slum dwellers
in objectionable areas were resettled. Costs are to be recovered from the resettlements
over a period of 20 years. The number of families benefited under this scheme was 1473.
Pavement Dwellers Housing Scheme
Under this scheme, serviced plots with core housing were allotted to the identified
pavement dwellers. It was funded by the GoI (Rs. 4000 per household), GoTN (Rs.1000
per household) and HUDCO loan (Rs. 8000 per household). The number of families
benefited under this scheme was 7787.
Cash Loan Scheme
Cash loan assistance for construction of houses over plots allotted by TNSCB under lease-
cum-sale basis was given by TNSCB. It was financed by HUDCO as loan.15, 554 families
have benefited from this scheme.

106
Mass Housing Scheme
Apart from providing basic infrastructures in slum areas, grant to slum families for
conversion of thatched roof to tiled roof or mud walls to brick walls was given under the
scheme and, 97,650 families have benefited from this scheme.
EWS Plots in Layouts
Since 1989 CMDA has been ensuring that a certain percentage of plots excluding roads
are earmarked as Economically Weaker Section (EWS) plots while according approval in
cases of layouts exceeding one hectare. By this way at least 10 percent of the plotted out
area in the layout is generated as EWS plots which can accommodate about one third of
the population, which can be accommodated in the layout area. TNSCB has also
estimated that the tenement construction to house slums dwellers from early 70‟s are
reaching end of the life of the asset and in the next 10 years most of these tenements
have to be reconstructed. It is estimated that about 46,500 tenements units have to be
reconstructed.
Kolkata Housing Schemes
Housing finance for the slum dwellers is provided through the KMC but because of the
disputed nature of ownership in many cases as also because of the banks‟ disinterest,
this facility has remained unavailable in most cases. Recently the KMC has actively
considered a housing programme known as Valmiki Griha Yojona. This scheme also has
some technical requirement relating to ownership but these are likely be solved by joint
meetings with slum dwellers, locally elected representatives and funding agencies.
The scheme for housing and shelter upgrading (SHASU) is a programme under
NRY for providing technical training to construction workers in urban areas and financial
assistance to economically weaker sectors of the population for housing and shelter
upgrading with government subsidies and housing loans. The Prime Minister‟s Integrated
Urban Poverty Eradication Programme (PMIUPEP) was launched as a part of Nehru
Rojgar Yojana (NRY) in 1994 to improve the quality of life of the urban poor by creating
a facilitating environment through community-based planning and implementation.
Thus the scheme was thought of as an effective achievement of social sector
goals, community empowerment, convergence through sustainable support system
employment generation and environmental improvement.

107
Ahmedabad Housing Schemes
Slum Upgrade by giving Tenure Status
Under this project, slums selected for upgrade are given an assurance that they will not
be removed by the AMC for at least 10 years if they join this project of upgrade. The
AMC has passed a policy resolution to this effect. This gives added incentive to the slum
dwellers to participate in the project. The slum dwellers are given a facility of
microfinance by an NGO SEWA Bank at the doorstep. Those who cannot pay contribution
of Rs. 2000 up-front can avail of the credit facility from SEWA Bank upto Rs. 1500. This is
an initiative taken by SEWA bank at its own to support the project.
Looking to the procedural constraints in the implementation of the project, the
corporation now proposes to create a special purpose vehicle within the AMC to up-scale
the project to ensure that large number of slums are taken up for upgrade each year.
Full autonomy is proposed to be given to the special purpose vehicle (SPV) to scale-up
this project. The SPV will have a special board management to take all decisions in
regard to the upgrade of slums. The board will have, besides the corporation‟s office
bearers, the representatives of NGOs, community and stakeholders on the board of
management. It is envisaged to cover all the eligible slums within a period of 5 to 7
years.
Jaipur Housing Schemes
Housing and Resettlements Schemes
There are four main providers of housing in Jaipur - the Rajasthan Housing Board (RHB),
the Jaipur Development Authority, private developers and cooperative societies.
RHB prepares housing schemes based on housing demand. They acquire agricultural land
and construct for all income groups. The task of building houses in mainly carried out by
the Rajasthan Housing Board. Jaipur Development Authority develops the areas and sells
plots of land to builders. They cater mainly to high and middle-income groups.
The housing cooperatives purchase agricultural land from farmers and convert
them into residential colonies. Houses built by private developers do not follow the town
planning norms and regulations, and often result in haphazard development of a large
number of colonies. Besides these housing cooperatives, private builders are also
involved in plot developments, mostly around the municipal boundaries. They generally
cater to the higher income groups.

108
The Gharonda Scheme for Daily Wage Workers
This scheme was launched in August 2004 for the daily wages worker who can get a
house by saving just Rs. 18 per day for a period of 20 years for the repayment of the
cost. This is a state-wide scheme and till March, 2007 work has been taken up in 30
cities. In Jaipur city, the Gharonda project is under implementation in Sanganer area. Out
of the total of 1000 houses taken up in this area, 995 have been allotted and 948 houses
have been handed over.
Multistoried Residential Flats for Urban Poor
The other housing scheme for the urban poor, under implementation in Jaipur is the
Dwarkapuri scheme launched by Rajasthan Housing Board. Under this scheme,
multistoried residential flats are being built over a total area of 67581 sq. m for the urban
poor of Jaipur. Under this scheme, RHB proposes to construct a total of 4092 multistoried
flats of 33.44 sq. m each. Out of this 2976 flats are proposed to be taken up in the first
phase and 1116 in the second phase. In the first phase, for the 2976 flats, 12500
applications were received. As per this scheme, the estimated cost per flat was fixed at
Rs. 2.85 lakh. However, due to increase in built up area, better standard of living,
arrangement for additional lifts, extra expenditure on the foundation due to enhanced
load bearing capacity of buildings, escalation, VAT, increased charge of service tax, the
total cost will now be in the range of approximately Rs. 3.85 lakh to Rs. 4.30 lakh.
Rental Housing Scheme
The Rajasthan Government plans to have a programme for providing low cost rental
housing for the urban poor. An amount of Rs. 718.90 lakh provided during the Tenth
Plan on construction of rental housing. For the Eleventh Plan, a provision of Rs. 1500
lakh is proposed, out of which Rs. 347.92 lakh is for committed works and Rs. 1152.08
lakh is for new works. For Annual Plan 2007-08, a provision of Rs. 300 lakh was proposed
out of which Rs. 252.15 lakh was for committed works and Rs. 47.85 lakh was for new
works. Details of this programme are yet to be finalized by the state government.
Night Shelter Scheme in Jaipur
Temporary night shelters have been constructed at 11 places in the Jaipur city to
provide shelter to the homeless on winter nights. In these night shelters, free woolens,
blankets, beddings, drinking water and food are provided.

109
Indore Housing Schemes
Rajiv Gandhi Ashray Yojana
Rajiv Gandhi Ashray Yojana, a programme that attempts to systematically meet the
shelter needs of the urban poor over a 20-year perspective, was introduced in 1998 by
the state government. It was under this scheme that the „Patta Act‟ was amended in
1998 to enlarge its scope as well as form mohalla samitis. The objectives of the Ashray
Abhiyan are (a) security of tenure, (b) provision of basic facilities, (c) preparing a 20-year
plan, (d) raising of financial resources, and (e) land pooling.
Following the 74th Constitutional Amendment Act, “economic and social planning
as well as poverty alleviation” have been added as obligatory functions of the urban local
bodies. In Madhya Pradesh, the state government has devised some innovative
mechanisms such as the shelter fund, Ashray Nidhi, for directing funds available from
private real estate developers towards slum upgradation and poverty alleviation.
Experiments in slum upgrading and provision of basic services and facilities such as the
slum networking initiative at Indore has also been undertaken at different times.
Patta Act
The Madhya Pradesh Nagariya Kshetron Ke Bhoomihin Vyakti (Pattadhruti Adhikaron Ka
Pradan Kiya Jana) Adhiniyam, 1984, popularly known as the „Patta‟ Act was introduced to
grant leasehold rights to the landless persons occupying urban lands. The Act was
amended in 1998 under Rajiv Gandhi Ashray Abhiyan to extend the cut off date of
eligibility to 31 May 1998. In addition, the plot areas were revised for different categories
of cities (1000 to 600 square feet) and lease rent per square feet per year for 10 years
was introduced at the rate of Rs 1.00 for nagar panchayats, Rs 1.50 for other towns and
Rs 2.00 for Rajbhogi cities (Bhopal, Indore, Jabalpur, Gwalior and Raipur). The most
important amendment in the Act was to introduce the mohalla samitis with the intent to
empower the community in the planning and management of the development and social
welfare. Under the „Patta Act‟, three categories of pattas are given, category „ka‟ (A) for
the registration of disputed cases, category „kha‟ (B) for permanent lease of 30 years and
category „gha‟, and (C) for temporary lease of 1 year. The initial intent of the Patta Act
was to give absolute security of tenure to all landless persons occupying government
land. Over the years, the concept has been diluted and shifted towards facilitating
resettlement (although not much relocation has actually taken place). Out of the families
reviewed in Indore, only 40-50 percent have permanent pattas, 20-25 percent have
temporary pattas and the rest have not been given pattas.

110
Guwahati Housing Schemes
Guwahati Housing Schemes aim to provide shelter or for upgrading the existing shelter
for people living below the poverty line in urban slums, which will help in making cities
slum free. Land ownership and housing are considered to be critical for poverty
alleviation and slum development. For this purpose, GMDA is taking steps for
development of housing facilities for the poor in the fringe areas and unused land, with
central agencies such as railways. Other vacant lands outside the city where land price is
affordable for the poor section are also being taken up for development. Basic housing in
the identified areas with a scheme is being provided, where there is partial recovery from
the users. Night shelters for pavement dwellers are also being provided to improve the
living the conditions of the homeless.
5.2.4 National Slum Development Programme
National Slum Development Programme (NSDP) is a centrally sponsored ongoing
programme. Upgrading slums through the provision of physical amenities, community
infrastructure, health care and social amenities is main objective of the programme.
Funds are allocated annually in proportion to the national slum population in each States
and UT‟s. Ministry of Urban Development and Poverty Alleviation (MOUD&PA) monitors
the programme. Neighbourhood Communities and Community Development Societies
have to implement the schemes. Ten slum development committees, including elected
representatives from ULB‟s, NGO‟s and community based organizations are required to
oversee progress. 70 percent loan and 30 percent grant has been provided for. For
special category states, the amount is given as 90 percent grant and 10 percent loan.
Ten percent of NSDP funds can be used for housing construction and/or upgradation (the
rest should be used for physical and social infrastructure). Housing is provided on a loan
of Rs. 50,000 whereas amenities are provided free of cost.
Kolkata
NSDP was launched by GOI with the objective to improve the quality of life of urban slum
dwellers. The components of the scheme are (i) making provision of physical amenities
like water supply, drains, sewers, community latrines, community bath, street light, roads
etc., (ii) provision of community infrastructure for providing social amenities, (iii)
provision of community primary health care centre, and (iv) provision of shelter.
The programme is implemented by municipal bodies through community
development societies. Under this programme till date, in the state a total of 7569404
metres of roads, 451905 metres of drinking water pipelines, 837588 metres of drains,

111
63462 metres of underground sewerage drain, 29039 street light posts, 6504 water taps,
5403 shallow tube wells, 212 deep tube wells, 907 community bathing places, 9017
community toilets, 1222 dustbins, 197 community centres, 184 primary health centres,
5687 dwelling houses, and 101 primary school buildings have been constructed.
Due to notable achievement in this project the central allocation has been
progressively increased. Under the programme till date, a total of Rs. 217.49 lakh
mandays have been generated and a total sum of Rs. 419.58 crore has been released to
ULBs and out of that, Rs. 271.86 crore has been utilized. Apart from the above
programmes, there are other programmes being run in the state that are being
conducted / implemented effectively for the urban poor. Some of these other
programmes are: development of playgrounds, Sishu Siksha Kendra, Wage Employment
Programme and School Health Programme.
Jaipur
Up to March 2003, in Rajasthan maximum work was done under physical infrastructure
component under which roads of 530.95 km length, 144.58 km of drainage lines and
1227.27 km of sewerage lines were laid, and 2309 electric poles were constructed. Under
the basic amenities component, 1625 stand posts (drinking water outlets), 5241 street
lights, 298 community bathrooms, 2461 community toilets and 699 dustbins were
provided. Under social infrastructure, 103 community halls, 13 primary education centres
and health care centres were opened. Under the environment component, 11225 trees
were planted. Under the housing upgradation component, a total of 290 houses were
upgraded.
Though, there has been an improvement in economic and social condition of
slum dwellers, there has not been any significant improvement in shelter upgradation.
One of the main reasons for this is the lack of clarity in norms regarding utilization of
funds by the state government. As per JDA, 31 slum colonies have been relocated till
2005. Slums have been relocated at Nahargarh foothills. Few slums have also been
relocated in Vidyadharnagar zone.

112
Chapter 6
CITY-BASED POVERTY REDUCTION STRATEGY: 2010-2020
Strategies of poverty alleviation in India have focused largely on rural poverty reduction
because of its larger magnitude. Also, there was the consideration that if rural poverty
could be tackled, there will be a reduced outflow of the rural poor into urban areas.
Urban poverty is however different from rural poverty in many critical respects and
requires a poverty alleviation strategy that needs an entirely different focus.
This Chapter develops the poverty-reduction strategy for the six cities under
study in the framework for a new deal for the urban poor to be implemented through
2010-2020. This strategy has five key components in line with the overall all-India
strategy for reducing urban poverty. These interlinked strategies, supported by a suitable
financing strategy, are to be aimed at
(a) Taking key Indian cities towards a slum-free zero-poverty status;
(b) Developing, employment-oriented and inclusive growth of economic activities in
the cities;
(c) Providing low-cost housing in designated areas, well connected with the city-core
as well as the city periphery through ring roads and extensive intra-city road and,
wherever feasible, metro networks;
(d) Developing a safety-net for the urban poor, including an urban counterpart of the
Rural Employment Guarantee (National Urban Employment Guarantee Scheme -
NUEGS), complemented by a Food Security Act; and
(e) Providing a well-developed social infrastructure with free access to education at
least up to secondary education and low-cost health services.
The basic and common components for each component of the strategy are
discussed first followed by the city specific perspectives.
6.1 Towards Slum-free Zero-poverty Cities
All the six cities discussed in this report taken together account for a large share of slums
in India. Converting these cities into slum free cities requires (a) developing existing
slums to an extent that they qualify to be defined as non-slum areas, and (b) not
allowing any new slums to develop. If the slums are located in city centres, they would

113
have the highest land values. A low cost housing scheme that accommodates the
eligible/registered slum dwellers in proper housing units in suitable multi-storied buildings
can in most cases allow the horizontal spread of the hutments into proper houses and
accommodate nearly the same number of families. Some portion of the released land can
be used for developing roads, schools and other commonly usable physical infrastructure.
A suitable combination of involvement of private property developers along with an
adequate subsidy can successfully achieve this target. During the 2010-20 period, this
strategy requires to be implemented in stages starting from slums located within a given
radius around the city centre and widening the radius in stages.
Avoiding formation of new slums requires development of low cost houses to
accommodate new entrants into the city-life. This needs development of outer ring
roads/urban corridors providing road-networks in the urban periphery and designating
suitable areas for low-cost housing in the newly available areas on the urban peripheries.
Low cost ownership and low cost rentals can both be offered as options. These schemes
can also accommodate slum dwellers or other non-slum poor who may wish to migrate
out of the city centre to the outskirts. Theses designated areas would require to be
served by suitable social infrastructure with educational and health facilities within
manageable distances. The newly proposed Rajiv Awas Yojana (RAY), discussed further
in the section on low cost housing, has the potential to make a serious impact towards
reducing and eventually eliminating the slums in Indian cities.
The Eleventh Plan has set out the target of reducing overall urban poverty by ten
percentage points. In some of the cities studied in this report the incidence on poverty is
less than 10 percent. Achieving the Eleventh Plan target in the cities would imply that at
least in some of the cities, incidence of income-poverty should be zero or near-zero
earlier than 2020, which is the target date for the New Deal being considered for the
urban poor in this strategy paper. The target of zero-poverty requires to be achieved city
by city and should be made an explicit target for selected cities to be achieved by 2020
including at least four of the six cities under study here as part of the overall urban
poverty reduction strategy in India viz., Chennai, Kolkata, Ahmedabad and Guwahati.
6.1.1 Employment Oriented Growth
A basic feature of the cities surveyed in this study highlights that the incidence of urban
poverty goes down with the attainment of higher than secondary education and technical
training. As city‟s economic activities are expanded in industry as well as service sectors,
younger members of the poor households can be productively absorbed if they have

114
adequate education and training. In addition, building of low cost housing and road
networks including ring roads will themselves create employment opportunities in the
construction sector both for skilled and unskilled labour. Additional employment needs to
be complemented by strategies for financial inclusion. Micro-finance facilities in urban
areas can be effective in generating self-employment and employment of labour by
considerably expanding the base of the economic activities of the city.
6.1.2 Low Cost Housing
Low cost housing requires identification of suitable areas in the city and its periphery with
the outer ring roads/corridors, identification of private builders who may be subsidized
subject to their agreeing on price ceilings for different types of housing units,
development of physical and social infrastructure around these housing clusters, and a
plan for identifying eligible households who may be offered ownership or rental
arrangements for these subsidized housing units. The Rajiv Awas Yojana, which is being
introduced particularly for this purpose, offers a significant potential if supported by
adequate city-based initiatives and support by the state governments. Under the Rajiv
Awas Yojana property rights to slum dwellers and urban poor are being ensured by the
states and the construction of houses through access to subsidised credit also needs to
be ensured by the urban local bodies. The central government has indicated that it is
willing to extend support to those states who would agree to assign property rights to
slum dwellers. State governments need to take the initiative to take advantage of this
support from the central government.
Under the Rehabilitation Assistance Scheme (RAS), urban local bodies will be
required to
a) conduct slum and BPL household surveys, prioritize slums, identify beneficiaries,
explain schemes and issue biometric ID cards;
b) implement the RAS in convergence with Jawaharlal Nehru National Urban
Renewal Mission, including the scheme of Affordable Housing along with other
programmes, dovetailing Swarna Jayanti Shahari RojgarYojana to address the
concerns of employment and skill development of the urban poor in addition to
shelter; and
c) induce public private partnership in construction, especially new construction of
social housing by identifying land or deciding on models for public-private –
partnership with land of the private parties.

115
Wherever feasible, additional land for urban development will need to be
released by the construction of outer ring roads. The construction of the ring roads and
extension of inner city road networks themselves will create jobs for skilled as well as
unskilled labour, release land for other economic activities between the ring road and the
inner city or otherwise extended urban areas while preventing formation of additional
slums through the strategy of low-cost housing. However, separate financing will be
required for the development of physical and social infrastructure.
6.1.3 Safety Net for the Urban Poor
A no-slum zero-poverty strategy would require an effective social safety net consisting of
a safety net for the urban poor, designed to ensure a minimum income and food security
to all households as well as to cope with the adverse effects of economic slowdowns and
other unanticipated economic calamities. The safety net should provide for subsidized
food through the PDS or food coupons, subsidized education and health facilities to the
poor households and unemployment benefits where employment cannot be offered
under the Minimum Employment Guarantee Scheme. NUEGS can work on a self-selection
basis with a well-defined scope. While the NREGA cannot be duplicated in full in the
urban areas, a modified form of urban employment guarantee scheme can be developed.
An urban public employment guarantee scheme should improve upon the current
prototype. The NREGA emphasizes creating jobs largely on public works such as
construction and road maintenance. An employment scheme for urban India should go
beyond the present scope of public works projects, and address urban demands. The
emphasis could also be on those illiterates and semi-literates, who had lost jobs in the
informal sector due to the economic down turn. There are many workers and
considerable houseless urban population at the lowest rungs of the urban society that
require to be assisted.
In this context, city governments have to take full advantage of the new version
of the SJSRY. Under the new guidelines, SJSRY will have five major components, namely
(i) Urban Self Employment Programme (USEP)
(ii) Urban Women Self-help Programme (UWSP)
(iii) Skill Training for Employment Promotion amongst Urban Poor (STEPUP)
(iv) Urban Wage Employment Programme (UWEP)
(v) Urban Community Development Network (UCDN)
Under SJSRY allocation of funds is according to the share of the number of urban
116
poor in total urban poor in India but the more effective local governments can have
access to unutilised funds allocated to other local governments. Also, the release of funds
to the States/UTs will be made for SJSRY as a whole, without segregating into
components, thereby giving flexibility to the local bodies in utilizing funds. City
governments can therefore utilize this flexibility to suit their local conditions.
The currently proposed National Food Security Act (NFSA) envisages that every
BPL family in rural as well as urban areas will be entitled to 25 kg. of rice or wheat at Rs.
3 per kg. It is well known that there are some targeting errors in the BPL surveys. Of the
two types or errors, namely, counting poor as non-poor and identifying non-poor as poor,
the first one involves the more serious welfare costs from the viewpoint of constructing a
social safety net. Subject to some city-based supplementation of the BPL lists so that the
genuinely poor are not left out of the purview, the NFSA will be a key constituent of a
social safety net particularly in drought years or when food prices rise inordinately.
Another important consideration is that the benefits presently given to the Antyodaya
households like higher quantity of wheat/rice and or lower price should not be diluted
under the NFSA.
6.1.4 Social Infrastructure: Education and Health
The social safety net will need to be supported by developing a social infrastructure to
take care of the education and health needs of the urban poor living in slum as well as
non-slum areas.
Notwithstanding the 86th Constitutional Amendment Act, 2002, which led to
insertion of a new Article 21-A in Part III of the Constitution that made free and
compulsory education to all children of 6 to 14 years of age a Fundamental Right, there
are considerable deficiencies in the practical implementation of this guaranteed right. The
problem is particularly important in urban areas where children are often engaged in
work to supplement family incomes. By the time children reach secondary education age,
their earning capacity increases and the number of drop-outs from secondary education
also increases. UNDP‟s report (2009) on urban poverty observes that „urban casual
informal workers have been left behind in grabbing the growing urban employment
opportunities as they don‟t have adequate education and skills‟.
Slum dwellers in urban areas face health risks due both to household poverty
and spatial concentration of population in the slums. The poor quality and quantity of
water and sanitation in these communities, inadequate hygienic practices, poor

117
ventilation, and dependence on hazardous cooking fuels provide conditions conducive to
the transmission of disease among densely settled slum dwellers. Montogomery (2009) in
a recent study on urban poverty and health in developing countries observes only 69.7
percent of very poor urban women in India receive any prenatal care-similar to the
percentage for rural women in the top half of the rural living standards distribution‟.
Urban health systems are characterized by extensive presence of the private
sector which is highly monetized on the one hand and inadequate attention and priority
accorded by the state and local governments, on the other. Investments in urban public
health infrastructure require substantial financial allocations and calls for significant
changes in priorities of budget allocations.
6.1.5 Targeting Strategies
The population of the urban poor may be divided into two groups: poor living in slums
and poor living outside the slums. Both these groups require different strategies for
targeting. While the slum-based poor are geographically concentrated, the non-slum poor
are dispersed throughout the city and its suburbs. While there may be many in the slum
areas who may be non-poor, it has already been noted that in many cities (e.g. in
Chennai), a high percentage of the poor are concentrated in the so-called
„underdeveloped slums‟. The targeting of programmes has to focus on the slums in
general and „under-developed‟ slums in particular. For the non-slum urban poor, suitable
programmes will have to be those that are designed to be „self-selective‟.
The current initiative of providing every India citizen a Unique Identification
Number (UID) will particularly facilitate identification of the more dispersed non-slum
poor. It is understood that the UID initiative will focus on the BPL households and
Antyodaya families in the first instance. It can be developed as an effective targeting tool
for poverty reduction interventions.
6.2 Poverty Reduction Strategy: Chennai
6.2.1 Basic Features of Poverty in Chennai
The basic features of the poverty profile in Chennai city that have a bearing on designing
an effective poverty reduction strategy are highlighted below:
a) The poverty ratio in Chennai city is only 9.6 percent within the Municipal
Corporation city area.
b) There is a clearly notable trend of out-migration of population from Chennai city
to its suburbs. As noted in Chapter 2, an out-migration of 10.41 lakhs (27

118
percent of the total population) was noted during 1981-91 and that of 10.34
lakhs (24 percent of the 2001 population) was noted during 1991-01. This
happened in spite of considerable construction activities undertaken in the
municipal areas during these two decades.
c) The BPL population in other municipalities outside Chennai remains high at 28
percent of population.
d) The incidence of poverty is the highest for SC/ST population in Chennai.
e) The incidence of poverty is highest among the illiterates and it declines
dramatically for people who have attained higher secondary education.
f) Poverty is highly concentrated in slums identified as „under-developed slums‟.
6.2.2 Core Issues and Targets
Some of the important dimensions of alleviating urban poverty in Chennai identified in
this and other studies refer to five heads, viz., housing and security, basic amenities,
education, health, and livelihood. The key issues in each case are listed in Table 6.1.
Table 6.1: Chennai: Key Urban Poverty Issues
Housing and
Security
Basic Amenities
Education and
Health
Livelihood
Lack of affordable
housing
construction.
Lack of access to clean
and regular water.
Secondary school
dropouts.
Low employability
of youth by
vocational training.
Targets and Objectives Ensure low cost
housing for all the urban poor by
2020.
Reduce number of
population not having access to sanitation by
three-fourths by 2020.
Arrange for low-cost
access to technical and vocational
training for adolescents from
poor households.
Extensive facilities
of micro-finance in urban areas.
Safe and free access to night
shelter for homeless.
A solid waste management
comparable to international standards
to be in place in
Chennai by 2020
Improve quality and affordability of
service delivery in health.
Increase opportunities for
women to work or be self-employed in
micro-enterprises.
6.2.3 Making Chennai Slum-free: Low-cost Housing and Property Rights
Government of Tamil Nadu has already accepted the idea of making several of the Tamil
Nadu cities slum-free. The target for Chennai is to make it slum-free by 2011. Towards
this end, government has started constructing several residential complexes across the

119
metropolis to rehabilitate slum-dwellers. Efforts are being taken by the Chennai
Corporation in association with Tamil Nadu Slum Clearance Board (TNSCB), to make
Chennai slum-free by 2011. An attempt is being made to resettle people living along the
city's waterways and those living along the coast in suitable housing facilities. For this
purpose seven-storied buildings are being constructed to rehabilitate the slum dwellers.
In most cases, government land is being allotted for the purpose and the land-acquisition
has not posed any significant problem. Chennai‟s initiative can become an example for
other cities.
6.2.4 Chennai: Towards a Zero-poverty City by 2020
The poverty head count ratio in Chennai is less than 9 percent. More than half of these
are in slums. With a slum-free status, the residual poor would also need to be pushed
above the poverty line. With economic growth both in the industrial and services sectors
in and around Chennai, the critical step is to ensure that members of poor households
who are young and likely to be employable in the next few years complete secondary or
higher education and be given adequate job-oriented training. With NUEGS, the
remaining poor can also be kept above the poverty line until they are productively
employed in secure jobs.
The Government of Tamil Nadu has already agreed to a five percent interest
subsidy for housing loans up to Rs. one lakh and 50 percent extra floor space index
(FSI), which is the ratio of land area to the built-up area for residential projects aimed at
the economically weaker sections of the society. The scope of Transferable Development
Rights (TDR) has been expanded in the Second Master Plan of the Chennai Metropolitan
Area (CMA) has to be broadened so that land acquisition for road and infrastructure
projects may be facilitated. Government of Tamil Nadu has agreed to provide plots to
the slum dwellers who are dislodged due to these projects with TDRs subjects to a ceiling
of 20 sq meters (215 sq ft)13.
13
As per the government order, if properties eligible for 1.5 floor space index (FSI is the ratio of
land area to the built-up space permitted on that plot) is acquired for infrastructure projects, it
will be given a TDR with 50 percent additional FSI. It means that if 1000 sq ft of land is
acquired, which as per the development regulations (DR) of the CMDA is eligible for 1.5 FSI
(total 1,500 sq ft built-up space), its virtual FSI will be increased to 2.25 (or 2,250 sq ft built-up
space) for issuing TDR. In case a land with 1.75 FSI is acquired, an additional 0.5 FSI will be
added and a total of 2.25 FSI will be given as TDR. For plots with 2 and more FSI, an additional
0.25 FSI will be given while issuing development rights certificate (DRC). The TDRs can be
used on the balance portion of the land the owner retains (after the acquisition by the

120
The Government of Tamil Nadu has issued the necessary government order for
issuance of transferable development rights and has also instructed the Chennai
Metropolitan Development Authority to formulate the necessary guidelines for
implementing the TDR scheme.
For low cost housing, schemes like the Rajiv Awas Yojana to be adopted on a
large scale, a minimum of Rs. 1 lakh to Rs 1.5 lakh may be needed for an eligible
household and the number of such loans should be increased by 100 percent to make an
effective dent on the housing for the urban poor. The state government should take
steps to meet the conditionalities of the Rajiv Awas Yojana.
6.2.5 Urban Employment Guarantee Scheme in Chennai
Contrary to the assertion of many articles expressing the opinion that the urban poor
need literate jobs only, there seem to be a need for manual work as well. For example a
study of the Chennai homeless population in 2008 points out the plight of the families
that lived on the streets for generations and earn as little as Rs. 50 to 100 per day.
Chennai has 27,329 houseless as per 2001 census. Many people are engaged in rag
picking and other types of jobs and do not earn enough to make both ends meet, let
alone affording a roof over the heads. Even if they are allotted houses, they cannot keep
them as they do not earn enough to be able to keep the house and pay for small rental
on water electricity etc. Urban employment guarantee scheme would help in augmenting
their incomes and helps in keeping the cities clean and green. Innovative manual work
can be created in providing better urban services.
An important requirement for a successful scheme is the involvement of local
bodies, as they are closer to the problem. Empowering local bodies to create jobs in
education and healthcare, and other public services, will cater to the varied requirements
of urban job seekers and serve as an efficient starting point. However, wage employment
schemes supported by government can only offer transitional solutions. Yet they will be
effective to augment the incomes.
6.2.6 Outer Ring Road Plan of Chennai
Chennai Metropolitan Development Authority is planning the development of Outer Ring
Road (ORR) along the periphery of Chennai Metropolitan Area (CMA) with the objective
government) or it can be shifted to any other property of his choice. It can also be traded to other
parties against payment of money.

121
of relieving the congestion within the city and also for catalysing the even dispersal of
urban growth.
ORR connects NH45 at Vandalur, NH4 at Nazarathpet, NH 205 at Nemilichery.
NH5 at Nallur and TPP road at Minjur and is of 62.3 km in length. The configuration of
the alignment comprises of dual system of both road and rail corridor in a width of 72 m.
50 m. wide portion of land is reserved for future developments. The estimated project
cost is about Rs. 850 crore. Land acquisition has been taken up in two phases. The first
phase of land acquisition from NH 45 to NH 205 for a length of 29.5 km covering 29
villages has been completed and possession taken over by CMDA. The second phase of
acquisition from NH 205 to TPP road covering 28 villages is under progress.
A consultancy study for preparation of a detailed feasibility report (DFR) for
development of ORR in CMA has been completed. On approval of the DFR by
Government, the preparation of DPR will be taken up. It is to be executed in 4 segments.
It consists of a 122 m. (400‟) wide road, comprising about 50 m wide for forming 2 way
transportation corridor with 6 lanes and 2 service lanes and 50 m wide for provision of
required public facilities and commercial exploitation along the transportations corridor,
22 m wide strip in the center reserved for future Mass Rapid System/LRT. It covers
approximately 545.8 hectares of land.
• Segment one connects GST road (Vandalur) to GWT road (Nazarathpet) of 19.7
kilometres covering 265.34 hectares of Land.
• Segment two connects GWT (Nazarathpet) to CTH road (Nemilicherry) of 9.5
kilometres covering 140.9 hectares of land.
• Segment three connects CTH road (Nemilicherry) to GNT road (Nallur) of 19.1
kilometres covering 258.02 hectares.
• Segment four connects GNT road (Nallur) to TPP road (Minjur) of 14 kilometres
covering 198.8 hectares of land.
6.2.7 Implementing Poverty Reduction Strategy: Key Interventions
Accordingly, an action plan may be designed to address each of these issues, as given in
Table 6.2.

122
Table 6.2: Implementing Poverty Reduction Strategy: Key Interventions
Tackling Slums Health and Education
Implement law already enacted for transfer of property rights to identified slum
households
Issues bio-metric cards to slum household heads by the end of financial year 2010-11.
Identify land banks or cluster of areas for allocation for low-cost housing meant for
relocation of slums.
Develop roads, schools and health centres in
the vicinity of these areas.
Improve coordination and develop a common policy and regulatory framework among various
public and private sector providers (including NGOs) of education in slum areas.
Set up an education management information system that will improve educational data
collection, information systems and monitoring
and evaluation citywide. Management by the community with the
involvement of NGOs. Local industries and other corporations should
be involved in financing community colleges
(through scholarships) as part of corporate social responsibility.
Strengthen the effectiveness of the National Literacy Mission so that literacy rate is 100
percent for both men and women. Use the National Open School to improve the
level of educational attainment.
Services Employment and Livelihood
Prepare detailed water supply and sanitation projects for all areas where new housing has
been provided when slums are developed into in situ or relocated.
Introduce efficient collection and transportation of municipal waste in the slum
areas to the waste processing and disposal site.
Train slum dwellers to recycle, reduce and
reuse process of industrial and other solid
wastes.
New SJRSY Involve locally active NGOs to develop projects
under the new guidelines, particularly utilizing the cluster approach.
Microfinance Public private partnership in both delivery of
credit and setting up micro-enterprises.
Provide non-financial services such as technology, marketing and risk management.

123
6.3 Poverty Reduction Strategy: Kolkata
6.3.1 Main Issues Identified
In devising a Kolkata-specific poverty reduction strategy, the following are some of the
relevant features of the poverty profile of Kolkata.
1. The actual incidence of poverty as measured by the application of consumption
expenditure at the household level is quite different from the prevailing evidence
on BPL. In fact, several wards covered under the primary survey show evidence
of gaping differences in the number of poor residents as measured by per capita
expenditure vis-à-vis BPL list.
2. Residents in the slums of Kolkata suffer from various chronic problems, including
water logging, lack of health facilities, malfunctioning public distribution system
and so on. The dwelling houses can barely accommodate the members and most
activities are performed in a very unhygienic manner.
3. The livelihood opportunities facing the slum dwellers are limited to a few low-
paying choices and it is one of the prime factors why the low level equilibrium is
not easily broken by outside interventions that aim at redistribution alone.
4. There is strong insecurity among the slum dwellers interms of their residence
and especially so for inhabitants of the non-notified slums. Forceful occupancy of
land often leads to serious tension in the localities. The major problem appears
to be lack of housing and amenities exacerbated by private owners of slum lands
controlling the housing and amenities in the slums.
5. The major issue is the ownership of the housing or longterm (90 year lease that
prevents the sale) to enable the slum dwellers to improve their living. The
common problem of allotting free houses is that as their land value increases
slum dwellers sell these to make money. Economics does not enable the low
income owners to keep and maintain high value properties in the core of the city.
6. In Calcutta, health facilities are a big issue in addition to housing.
7. Urge for acquiring school education is high at the initial stage, but the children
tend to drop out of school by the time they reach age of 10 -12 on average.
8. Most residents thrive on very small-scale activities and are known to pay bribes
at every stage, even to the extent of obtaining a vending permit.
6.3.2 Towards a Slum-free Zero Poverty Kolkata
The incidence of poverty by itself is quite limited in the core city of Calcutta Municipal
Corporation. Poverty head count ratio is less than 3 percent in this area, as per the
National Sample Survey data. It is quite possible that NSS may have missed out on many

124
poor and may have under-estimated poverty. Even so there are reasons to believe that
core city poverty tends to be low. Literacy rates are also quite high in this area at about
86 percent. Out of the total population of Calcutta urban agglomeration only one-third of
the population is in the municipal corporation district of Calcutta. Calcutta core city seem
to be losing population in the recent years between 1991 and 2000, just as Chennai.
6.3.3 Relocating Homeless Residents
By the middle of the year 2009, all homeless residents of the city of Kolkata must be
relocated to publicly provided housing in the fringes of the city. They must also be
provided livelihood options such as manufacturing of handicrafts which the government
should procure and make arrangements for selling. Initially, therefore, these homeless
residents must be provided adequate training to acquire requisite skills.
By the end of the year 2020, all notified slums must be upgraded to multistoried
buildings with the rights of ownership transferred to the residents in the slums at a highly
subsidized price. Maintenance and operational aspects of the housing facilities should rest
with the occupants so as to share the burden of responsibility. In Kolkata according to
available information nearly 60 percent of slums may have to be reallocated and about
40 percent of the slums can be taken up for in situ development.
6.3.4 Health and Education
All residents of the slum households should be provided health insurance with immediate
effect and at no cost to the proposer. However, given the poor conditions of the publicly
provided health care facilities in Kolkata, it is also urgently required that several other
public hospitals are opened up in various parts of the city that can treat and offer stay
over services to say 300 poor patients (adults and children) at a time. The proposed
health care facilities must be in operation by the end of 2013 to offer any distributive
justice to a large number of residents in the city who cannot get the benefits of the
economic up-swing that India is experiencing at the time. Health insurance at cheaper
rates and implementation of micro insurance schemes could also be beneficial.
The relocation should also involve opening up of primary and secondary schools
in the vicinity of the dwelling place and vocational institutes must be established for
future training. Provision of properly functioning public schools or upgrading the
corporation schools which have virtually lost their importance and purpose is essential.
Provision of vocational training institutes and training workshops on manufacturing of
handicrafts etc. will be useful. There are sporadic initiatives from various NGOs in this
direction, but these are clearly insufficient.

125
6.3.5 Documenting Mobility of Migrants
Big cities like Kolkata with a significant pool of migrantsfactor must begin a procedure for
recording the mobility of internal and international migrants. It may be very useful to
track the pattern of mobility of various people in the city according to their occupational
patterns, residential choices, period of residence, educational qualifications etc., if the
plans proposed above are to be made functional in a dynamic manner.
6.3.6 Implementing Poverty Reduction Plan: Key Interventions
Some of the key interventions for the poverty reduction strategy are summarized in Table
6.3.
Table 6.3: Kolkata: Key Interventions for Poverty Reduction
Tackling Slums Health and Education
Regularization of slums with lease
purchase option.
Legal framework for implementation of Rajiv Awas Yojana.
Rental housing for the urban poor. Detailed household database and
mapping of all slums; identification of
land and transfer of land. Complete bio-metric survey of slum
households.
Health facilities and access to other
amenities
Improvement in infrastructure and capacity building of staff in existing health centre.
Awareness campaign on personal hygiene, immunization, registration of pregnant women in
PHCs
Education Compulsory primary education for all, improved
access to better quality education, and more equitable coverage of primary school in the city
with Sarva Siksha Abhiyan. Widespread campaign for vocational training –
night schools, placement cell for students, earn
and learn schemes. Adult literacy campaigns.
Eliminating dropouts at the secondary stage.
Services
Augmenting Water Supply Ensure recovery of O & M cost through cross subsidy.
Implementing water supply charges (e.g. volumetric water tariff).
Installation of meters for private taps.
Providing Sewage System and Toilets
Small Sewage Treatment Plants for clusters of slums.
Maintenance of community toilets to be managed by community based
organisations. Adoption of low cost sanitation where no underground sewerage network exists.

126
6.4 Poverty Reduction Strategy: Ahmedabad
6.4.1 Basic Features of Poverty in Ahmedabad
The poverty rate in Ahmedabad declined from about 32 percent in 1993-94 to 13 percent
in 2004-05; 20 percentage point decline in about a decade. This has been among the
fastest decline in comparison to other large cities of India. The poor in Ahmedabad
include about two-third from the socially disadvantaged sections of the population like
the SC/ST and OBCs while there are a large number from the other castes as well which
is different from other large metros like Chennai. Ahmedabad has also shown a growth in
employment over the past few years but most of it has been in the informal sector. A
majority of these people live in slums and have limited access to basic services.
Though the poverty rate may be small on the basis of an absolute poverty line
there may still be relative poverty.14 In effect sustained access to basic services may be
relatively more expensive thereby impacting overall welfare. There is also a large
variation in access to basic services across different zones of Ahmedabad. Some parts of
Ahmedabad have grown very rapidly with faster increase in slum population while older
parts of the city though may not have added to the numbers over time but continue to
have a high population density putting pressure on local resources. Education seems to
be one of the key factors in reducing poverty. Households with even one member having
education above secondary level clearly push them above the poverty line.
6.4.2 Issues Identified by Various Studies
The issues identified by different studies are: (a) low cost housing for slum upgradation
and preventing the rise of newer slums, (b) regularisation of land tenure among the older
slums and appropriate legal framework for safeguarding the newly allotted land/house in
the newer settlements, (c) clear guidelines for financing options and cost sharing by the
residents allowing for flexibilities and temporal changes in requirements and needs, (d)
improving the competence of the local bodies to allocate land effectively, assistance in
construction of houses and managing the basic services, (e) provision of adequate
transportation with reasonable fares, (f) the challenge of managing a communally
sensitive city, and (g) improving the quality of education in municipal schools.
6.4.3 Making Ahmedabad Slum-free
Upgrading the slums is a clear priority by providing adequate quality of housing and
14
It may be noted that the poverty lines used here pertain to the state level urban poverty line. If
this poverty line is redrawn to reflect cost of living at the city level, then the poverty estimates
may be different.

127
access to basic services along with social infrastructure relating to education and health.
Also there is a need to prevent surge of new slums by planning for better and new
infrastructure. As suggested in the UN Report15 this saves a large amount of financial
resources and is clearly welfare improving as the living conditions will be far better. This
is currently being looked into by AMC and one hopes that will be pursued effectively.
Clearly, both the features suggested above will need adequate planning with the
involvement of the civil society and AMC is preparing for a slum free population by 2020.
Among the several challenges to this planning process the first one relates to availability
of land. Second, the housing needs have to be socially, communally and culturally
sensitive to the needs of the local population and adequate flexibility has to be ensured.
Adequate and cheap modes of public transport are also an essential requirement as
newer settlements may be widespread and separated from central business districts.
6.4.4 Ahmedabad: A Zero-poverty City by 2010
From the current poverty rate of about 10 percent, reducing absolute poverty to zero by
2010 would be a challenge. However, with concerted effort this may be a possibility.
Cleary, the key is access to regular employment and reducing the vulnerability in incomes
associated with seasonal occupations. Ahmedabad is a city which has high secondary
sector as well as tertiary sector population among the poor. Regular monitoring of
schemes for the poor by involving them, access to better education and health care, and
social security schemes for the elderly and women headed households are ways to
protect a segment of the population.
6.4.5 Urban Employment Guarantee Scheme in Ahmedabad
The challenge of providing employment guarantee in urban areas would come from
identifying works suitable to the skills and forecasting labour demand. Unlike rural areas
the demand may be all through the year. Public works programmes have to be identified
well in advance so that work plan can be chalked out when the demand arises. The cost
of providing the employment will involve capital cost and recurring wage cost. The
demand for employment guarantee would arise both from unskilled and semi-skilled.
Table 6.4 provides a list of options for employment generation across different industry
segments within the Ahmedabad city.
15
Task Force 8 Report on Improving the Lives of Slum Dwellers - A Home in the City, 2005.

128
Table 6.4: Employment Potential for Urban Poor across Industries in
Ahmedabad City
Industry Potential for
Employment of Urban
Poor
Activities to be Carried Out
Construction Very high Training and upgrading skills of masons, plumbers,
carpenters , painters etc.
Retail High Training persons in this sector.
Linking with organized retailing outlets.
Garments High Training persons in this sector.
Lining with production units.
Hospitality Moderate High demand for food and processing industry. Need to professionalize activity.
Horticulture & Floriculture
Moderate Promote urban agriculture
Promote links with organized retail.
Handicrafts Moderate Upgrade skills of certain activities, e.g. idol
making, kite-making etc. Provide market linkages.
Develop special area for display and marketing.
Khadi and Village
Industries
Moderate Can be linked with handicraft promotion
Gems and Jewelry
Moderate Training persons in this sector. Linking with production units.
6.4.6 Low Cost Housing in Ahmedabad
The first component to reduce the cost of housing is land cost. Providing land away from
the main roads reduces the cost of land but keeping them far away from the main hub of
the city would also not find many takers. The land cost may have to be subsidized
through various schemes of the government. One potential option is incremental low-cost
housing model suggested in the Ahmedabad report. This allows for using the private land
allotted to each household efficiently so that house may be constructed in phases. The
cost sharing between the household and the government has to be worked out. By
restricting the houses to the inner core of a particular area and allowing commercial
development along the main road gives scope for cross-subsidy from the tax earnings of
the commercial establishments towards low cost housing. The families living in these
households would also benefit due to opening up of livelihood options in shops and other
commercial establishments. Involving research institutions for making use of cheaper yet
sturdy inputs for building construction is also a key to cost reduction.

129
6.4.7 Outer Ring Road Plan of Ahmedabad
The second ring road project was funded by AUDA and two lanes were completed. Then,
the work of making four lanes was contracted out on the Built, Operate and Transfer
(BOT) basis for twenty years. All vehicles except two wheelers and hand carts pay the
toll. The fares of commercial buses increased due to the imposition of toll tax. However
to begin with, to popularize the use of ring road, AUDA runs single free bus service.
30,000 houses of two rooms with kitchen were constructed by AMC and allotted
to the displaced persons of the rapid bus transport system and Sabarmati river front
project. Upto 70 percent the construction cost is given by JNNURM and per house
construction is about Rs. 66,000. There is also a tender premium of 10 percent in the
construction cost. This entire amount is recovered from the person to whom the house is
allotted. The future plan is to construct more than a lakh of houses by 2012. After the
allocation of houses to the people affected by the urban development work, the
remaining houses shall be allotted, without any specific reference to poverty status to
recover the cost through installments. The AMC has been raising finances through
floating of bonds for over 30 years. For the sixth time the bonds are being floated.
Probably more has to be done in this direction.
6.4.8. Implementing Poverty Reduction Strategy: Action Plan
i. Housing
As envisaged in the city development plan and the UPRS report for Ahmedabad (Mahila
Samaj Sewa, 2006) construction of the initial 18, 000 households as planned by AMC in
phase-I needs to be undertaken. The phase-II of the project would involve identification
of land for other 38,000 housing units proposed under JNNURM and its construction.
Alongside this formulation of residence association for maintenance and linking with
livelihoods is also essential for maintaining a certain quality of life. Finally, assessment of
shortfall in housing and a review of strategies for creation of new housing stock have to
be undertaken.
ii. Basic Services
Provision of basic services would require the endorsement of Slum Development Policy by
the Government of Gujarat. This would include undertaking necessary legal reforms as
well. Formulation of community based organizations and representation in ward
committees ensures smooth access to basic services with identification of major
impediments to access. One of the main components of basic services is access to clean
sanitation which includes construction of toilets under Urban Basic Service Programme.

130
The preference is to have 90:10 sharing scheme, and have pay and use toilets, where
individual toilets within the household cannot be provided. Ensuring implementation of
sewage/water connections under 1500 NOC scheme. With the transfer of titles to slum
dwellers, there will be a need to maintain the basic services by the poor as the ownership
status changes.
iii. Livelihood and Social Infrastructure
An inventory of all major economic activities in the city is essential for planning and
scaling up livelihood activities. This will become imperative if an employment guarantee
scheme has to be envisaged. Issuing identity cards to workers with different skills levels
and work preferences would be useful in understanding the supply of labour and the
various needs. Hawkers and vendors form a substantial part of the vulnerable sections in
a city and women form a large proportion of them. The retail trade segment by these
people on the one hand provides self-employment for a large segment of population and
on the other hand provides commodities that are accessible to economically weaker
sections and the middle class as well. To give them a better deal in terms of access to
space for undisrupted selling points, a mapping of existing vending location at
Ahmedabad would be needed. This has to be supported by formulation of a committee
including traffic department, Municipal Corporation, representative of vendors, NGOs for
on site reorganization of vendors/legal vending spaces in DP and CDP of Ahmedabad.
Increased access to information about different schemes of the government for urban
poor opening could be disseminated through the formation of Community Resource
Centers in all wards of Ahmedabad. These would also include organizing skill
competitions/fairs for the poor that would enable them to identify their basic skills and
improve upon them as and when there are opportunities. With globalization now having a
larger impact on local economies particularly in urban areas, demand for skills will keep
changing more rapidly and thereby gains and loses may be more quickly felt. A periodic
review of all the aforementioned activities involving the local community and
intermediaries like the NGOs is essential to reduce vulnerabilities and will also allow for
coping strategies to be formed effectively.
The key poverty reduction strategies for Ahmedabad are shown in Table 6.5.

131
Table 6.5: Poverty Reduction in Ahmedabad: Key Interventions
Services Employment and Livelihood
Basic Services
Endorsement of Slum Development Policy by the Government of Gujarat including legal
reforms as well as transfer of property rights
to slum dwellers with a suitable cut-off date. Issue of bio-metric cards to slum dwellers.
Formulation of community based organizations and representation in ward
committees ensures smooth access to basic
services with identification of major impediments to access.
Implementation of Slum Networking Project in identified 120 + pockets.
Ensuring implementation of sewage/water connections under 1500 NOC scheme.
Livelihood and Social Infrastructure
An inventory of all major economic activities in the city is essential for
planning and scaling up livelihood
activities. Issuing identity cards to workers with
different skills levels and work preferences would be useful in
understanding the supply of labour and
the various needs
Low Cost Housing
As envisaged in the city development plan and the UPRS report for Ahmedabad (Mahila
Samaj Sewa, 2006) construction of initial 18, 000 households as planned by AMC in Phase–I needs to be undertaken. Phase-II of the project would involve identification of
land for other 38, 000 housing units proposed under JNNURM and its construction. Alongside this formulation of residence association for maintenance and linking with
livelihoods is also essential for maintaining a certain quality of life. Finally, assessment of shortfall in housing and a review of strategies for creation of new housing stock have to
be undertaken.
6.5 Jaipur: Poverty Reduction Strategy
6.5.1 Key Features of City Poverty
In devising a city-based poverty reduction strategy, the following are some of the salient
features of poverty in Jaipur.
1. The urbanization pattern of Jaipur City is quite different from other cities such as
Kolkata and Chennai. The city has experienced an increase in poverty,
unemployment, and migration. In Rajasthan women are predominantly employed
in the manufacturing sector. Interestingly, Jaipur city has no employment in
mining and quarrying, though Rajasthan is known for the marble industry.
Literacy rates are rather low and women‟s work participation is high. However
the slum population of Jaipur as per census declined from 31 percent in 1991 to
16 percent in 2001. There are 17,000 houseless people in the Jaipur city as per

132
the UNDP Report. Jaipur also has higher level of urban growth much higher than
the average urban growth for All India.
2. In the case of city of Jaipur there is a need to have a proper city-wide network of
physical infrastructure among the various organizations. There is also a need to
identify the demand driven services and include the demand of all slums in
Jaipur. The financial sustainability of Jaipur Municipality Corporation, Jaipur
Nagar Nigam and Jaipur Development Authority should be strengthened and
there should be wider consultations with the various stakeholders in the city.
3. Partnerships between the organizations should be streamlined. There should be
proper coordination at the slum level, ward level and the municipal level. At the
slum level, there could be neighbourhood groups who could represent one large
slum or cluster of slums. At the ward level it could be a community based
organization which could represent large slums or cluster of slums and at the
municipal level there could be ward committees.
4. At the grass root level there is a need to identify all the slums in the city of Jaipur
and prepare strategies to relocate them or upgrade them as per the policy
guidelines. The relocation of slums could be done in a phased manner
categorizing it into high, moderate and low priority. Similarly, upgradation can
also be done in a phased manner.
6.5.2 Slum Development and Infrastructure Issues
The Cabinet Sub-committee on the Regulation of Slums in Jaipur has vide its report dated
September 30, 2005 had recommended that a new residential and development plan for
the slums will be developed keeping in mind the following:
a. each house in a slum will be given a serial number,
b. the plan should provide for road, sewerage and other basic amenities,
c. multistoried residential areas will be developed,
d. for making the scheme acceptable and popular among the slum dwellers
cooperation of NGOs, committees of slum dwellers etc. will be considered,
e. two strategies for development of housing will be followed providing in situ
development of slum areas or relocation of slum, and
f. these regulations will apply to those slums which have come under the survey at
the cut off date of 1.04.2004.
The basic problem at the slums could be whether the land on which slums have
come up should be given to slum dwellers on tenure or rental basis. Other options

133
include regularization with lease purchase of land, community acquisition of land and
public-private partnership in housing. There is wide prevalence of rental housing for the
urban poor in the organized slums. The government will have to decide whether they
want to upgrade the existing slums by enabling the slum dweller to go in for semi-pucca
houses, or link the housing and tenure options to state level policy on housing. There is
also a need to educate the slum dwellers. Also, government should have a plan for
systematically denotification of slums at regular intervals. The successful Gharonda
schemes should be up scaled.
Next in importance is the water supply at the various slums. There is a need to
match the supply and demand in terms of quantity and efficiency. To ensure that water
supply projects in the city are given individual connection or else group taps, recovery of
Operation and Maintenance (O & M) cost through cross subsidy, water supply charges
(e.g. volumetric water tariff) and installation of meters at the level of private taps should
be provided.
The sewage system and toilets are of great importance to maintain hygiene. The
slum settlement will have to be linked with the city network, wherever feasible and small
sewerage treatment plants for clusters of slums could be provided. The maintenance of
community toilets should be managed by community base organizations and adoption of
low cost sanitation where no underground sewage network exists. The charges should be
nominal and subsidized and cover only the O & M cost for maintenance. The installation
and connection charges should be phased and cross subsidization should be provided by
the government.
Storm water drainage should be made mandatory in the slum. Underground
sewerage and drainage connection should be provided free of cost to all residents
wherever trunk sewage network and drainage network facility is available. Irrespective of
whether people take connection or not, it should be made mandatory as per act to
charge maintenance cost. Drainage Master Plan for Jaipur should ensure linkage with
slums. Solid waste management and storm water drains are to be taken up together and
managed by the community based organizations. Public participation should be
encouraged and awareness campaigns at the slums should be conducted and the
dustbins should be located at specific locations.

134
6.5.3 Health and Education
There is a need to improve infrastructure and capacity building of staff in existing health
centre and to launch an awareness campaign on personal hygiene, immunization,
registration of pregnant women in Primary Health Centres (PHCs). To provide health and
other amenities to existing slums located close to the proposed Mass Rapid Transport
System (MRTS). While relocating slums, access to workplace through efficient and
affordable transport means needs to be taken care of.
There is a need for (i) compulsory primary education for all the slum children, (ii)
improved access to better quality education, and (iii) more equitable coverage of primary
school in the slums of the Jaipur city. Also, there should be widespread campaign for
vocational training – night schools, placement cell for students, earn and learn schemes
and adult literacy campaigns and better awareness of existing programmes.
6.5.4 Livelihood Issues
(i) Skill Development
Development of various skill related jobs for the slum dwellers in construction, hospitality,
travel and tourism, retail trade, handicrafts, hair dressing and beauty therapy, security
services, driving and automotive maintance, and business process outsourcing (BPO) and
call centers would considerably expand livelihood options for the poor households.
(ii) Self Employment Opportunities
The Government can provide entrepreneurship development and service centers, women
employment opportunities, workspace for entrepreneurs, micro-credit systems and other
informal sector opportunities to be recognized through licensing/registration system.
(iii) Single Window System
There is a strong need for a single window system in the projects undertaken in the
slums. A single department for undertaking all projects in slums be it civic services, on
site physical infrastructure, housing and shelter upgradation, education, health and family
welfare, employment and community based organizations. Also, there should be a
mechanism for identification of needs of the slums and its residents, assessment of
demand for housing and infrastructure facilities, an information base on slums, advocacy
and campaign on educating slum residents about sanitation and hygiene, provision for
skill development and training for accessing better employment opportunities, promotion
of community development initiative through formation of community based
organizations and organization of financial help and subsidies.
135
The experts for the department should be drawn from civil engineering and
equivalent technical fields, social development experts, institutional development experts
and communication experts specializing in advocacy and campaign.
6.5.5 Developing Jaipur Ring Road Development Corridor
The Ring Road Development Corridor project has already been under discussion and the
relevant feasibility issues have been examined. Implementation of the project would
become a major vehicle for urban poverty reduction by opening new employment
opportunities and by releasing land for low cost housing and relocation of slums
wherever in situ development of slums is not feasible. The development zone along the
road corridor is envisaged to comprise IT zones, knowledge zones,
commercial/educational establishments, sports zones, special economic zones, garment
processing areas, exhibition grounds, transport nodes, hospitals, satellite towns, etc.
The project report has assessed that proportionate to the investment in the
project, large employment opportunities will be generated as a result of the project
implementation. The employment opportunities will be created for skilled (engineers –
civil, transport, mechanical), semi-skilled (technician, road inspectors, plant operator,
office support etc.) and unskilled (general labour) labourers. While most of the skilled
labourers may come from other parts of the country, the opportunities for semi-skilled
and unskilled sections of the workforce will be mainly available to the local communities.
6.5.6 Policy Recommendations
The state government must come out with policy decisions on matters concerning the
slum development, on setting up guidelines for slum relocation, tenure security for
regularized and non-regularized slums, land and housing policy at local level, reforms in
water, sanitation and livelihood, and designing a proper monitoring and evaluation
system.
Prior to provision of basic services there is a need to have a detailed household
database and mapping of all slums, identification of land and transfer of land,
implementation of water and sanitation sector reforms (standards and options for
service delivery), implementation of integrated programme for upgradation and
relocation of vulnerable slums, implementation of water and sanitation sector reforms,
community mobilization and awareness and advocacy campaigns for sanitation, health,
education and livelihood.

136
A detailed survey of existing skill levels and employable adults in slum areas is
needed for upgradation and identification of new skills must be undertaken. Basic
education should be ensured to all slum children by linking existing mission of Sarva
Shiksha Abhiyan and related missions. This should be followed by an appropriate skill
development model suited to local conditions of the slums.
The state government could also come out with an employment / income
guarantee programme. The advantage of works involving manual work, minimum
hundred days guarantee and freedom to register for the scheme or not makes it more
self selective. Urban city services that involve in cleaning, greening of the city of Jaipur
could be included in it. Urban services in health care and nutrition programmes, such as
cooking of mid-day meal, collecting information on immunization, helpers in hospitals,
helpers in ICDS centres could also come under its ambit. All these can be brought under
the purview of the Urban Employment Guarantee Scheme for women. It is not necessary
that there would be any conflict of interest between the existing helpers and the new
ones to be hired under the scheme, as the Employment Guarantee Scheme provides
lowest income/day compared to all the other existing government schemes (yet above
the minimum wage and it is only for 100 days). The regular salaried hired workers do not
compete with this work. If necessary, the ad hoc workers, volunteers may become part
of the guarantee scheme.
The work of upgradation of the slums and shifting slums from non hygienic
locations to hygienic locations should be a priority of the Jaipur Urban Development
Authority to make the city free of slums. Proper housing, water sanitation and transport
arrangements will have to be a part of this development. The new settlements should be
on long lease, so that the low income population gets a stake in the land they live on and
contribute towards its development. Once developed, these settlements should not be
disturbed to benefit the other big players such as industries, educational institutions,
hospitals and so on.
Jaipur may also envisage a ring road programme to give impetus to employment
in transport and housing, taking the long-term needs of the people into consideration.
Finally, there is a need to enhance the capacity building of the urban poverty alleviation
departments; regular awareness and advocacy campaigns should be an integral part of
their agenda alongside proper implementation of monitoring and evaluation system.
There should be coordination between the various organization involved in the urban
poverty alleviation programme.

137
Some of the key poverty reduction strategies for Jaipur are shown in Table 6.6.
Table 6.6: Poverty Reduction in Jaipur: Key Interventions
Tackling Slums Health and Education
Identify all the slums in the city of Jaipur
and prepare strategies to relocate them
or upgrade them as per the policy guidelines.
Proper housing, water, sanitation and
transport arrangements. New settlements should be on long
lease, so that the low income population
gets a stake in the land they live on and contribute towards its development.
Improve infrastructure and capacity
building of staff in existing health
centres. Launch an awareness campaign on
personal hygiene, immunization,
registration of pregnant women in PHCs.
Compulsory primary education for all
the slum children. Improved access to better quality
education.
Widespread campaign for vocational
training – night schools, placement
cell for students, earn and learn schemes and adult literacy campaigns
and better awareness of existing programmes.
Services Employment and Livelihood
Maintenance of community toilets,
managed by community based
organizations wherever feasible setup
small STPs for clusters of slums. Adoption of low cost sanitation where no
underground sewerage network exists.
Changes should be nominal and
subsidized and cover only the O & M cost for maintenance by the government.
Storm water drainage should be made
mandatory in the slum.
Skill Development Develop skill-related jobs for the slum
dwellers like construction, hospitality,
travel and tourism, retail trade,
handicrafts, hair dressing and beauty therapy, security, driving and
transportation, and BPOs and call centers backed by appropriate
training.
Provide entrepreneurship
development and service centers, women employment opportunities,
workspace for entrepreneurs, micro-credit systems and other informal
sector opportunities to be recognized through licensing/registration system.
Undertake detailed survey for existing
skill levels and needs assessment for
upgradation and identification of new skills.

138
6.6 Indore: Urban Poverty Reduction Strategy
6.6.1 Features of Poverty Profile of Indore
a. The poverty head count ratio of the city municipal corporation Area of Indore for
which NSS data are available has declined from about 38 percent in 1993-94 to
about 17 percent in 2004-05. However, poverty is widespread among the slum
dwellers according to a recent UNDP supported survey in 2007 which reported
about 68 percent of the slum dwellers as living below the poverty line.
b. About one-fifth of the population of Indore is illiterate. Illiteracy seems to be the
main cause of poverty in urban Indore. 83 percent of all poor are illiterate. Those
who are educated above the level of „Higher Secondary‟ or above are not poor.
c. People holding Below Poverty Line cards or Antyodaya Anna Yojana cards
constitute only 4.3 percent of the total population of Indore city. It is said that
only few people applied for such cards.
d. The incidence of poverty is relative high among the OBCs at about 37 percent as
per the NSS survey.16 More than half of the 2.51 lakh BPL population belongs to
castes other than SC & ST and OBCs.
e. The SC and ST slum colonies are the poorest followed by the OBC slums.
f. About 63.7 percent of the Indore city population and about 80 percent of the
poor are engaged in the informal sector. Indore suffered a set back in
employment opportunities and experienced a decline in employment as the
traditional sectors such as food processing, trade and retail business had shrunk
over the years up to 2000. Self employment has increased and casual work
shrunk.
g. The city also has 4885 houseless people as per 2001 census. The number may
have gone up.
h. A quarter of the entire working population is engaged in trade and maintenance
of vehicles, and about 36 percent of all poor belong to household engaged in
trade and motor vehicle maintenance.
16
It may be noted that the Indore NSS sample is very small and may or may not have captured the
issues correctly.

139
Urbanization of Indore city has been driven by the increase in the informal sector
employment in the recent years and a fast changing structure of economic growth away
from traditional sectors. However, it is possible that the informal sector also may have
received a set back in the post 2007 recession that is gripping the country as well as the
world.
The slum population as per the census was about 16 percent of the population of
Indore city in 2001. However, a more recent survey reported in the City Development
Report puts it at about 35 percent. The recent UNDP sponsored survey as well as the City
Development Plan acknowledged the existence of 604 slums, though they are not
officially recognized. The slums are along the river banks of the seasonal rivers in the
middle of the city.
The sanitary situation of the slums appear to be rather bleak, especially with
respect to the quality of water supply to public toilets, garbage collection and sewage
water being let out on to the roads. Drinking water is available mostly through public
taps. The slums in Indore are characterized by dilapidated houses, lacking in hygiene,
services, utilities and infrastructure. However, the land area available in general is better
than the other big cities as there are open spaces in the middle of the slum colonies.
Slums are sometimes divided along the caste lines. Only 20 percent of the slums have
primary schools in their area while about 26 percent of slums have ICDS centres. Thus,
slums of Indore and the poor in the slums require substantial help to upgrade to the level
of having the basic minimum amenities.
6.6.2 Towards a Slum-free Indore
A suitable low-cost housing strategy under the Rajiv Awas Yojana would prove to be an
effective way of making Indore slum free. The key intervention strategies for Indore are
given in Table 6.7.

140
Table 6.7: Poverty Reduction in Indore: Key Interventions
Tackling Slums Health and Education
Undertake necessary legal reform for providing
ownerships rights to slum dwellers to take advantage of Rajiv Awas Yojana.
Implement Slum-networking Project in identified
slums. Issue of bio-metric cards.
Relocated slums and in situ provision of
multi-storied housing should ensure that health centres and schools are within easy
reach of the slum population.
Track transmission of slum children from elementary to secondary education aiming
at minimization of drop-out at secondary stage through NGOs.
Services Employment and Livelihood
Consolidation of SNP / UCDP Cells. Construction of toilets under Basic Service
Programme.
Ensuring implementation of sewage / water
connection under 1500 NOC scheme. Transfers of titles to slum dwellers.
Map and prepare inventory of all major skill related economic activities in the city
suitable for slum dwellers.
Issuing identity cards to workers. Mapping of existing vending locations at
Indore. Testing and certification of construction
worker.
Ensuring micro credit and micro insurance for urban poor such as health insurance
etc.
Low Cost Housing Construction of initial households as planned by IMC.
Construction of other households as planned by IMC. Identification of land for housing units proposed under JNNURM.
Policy decision regarding allocation to beneficiaries.
Formulation of Residence Association for maintenance and linking with livelihood options. Assessment of shortfall in housing, review strategy and creation of new housing stock.
6.7 Guwahati: Poverty Reduction Strategy
6.7.1 Key Features of Poverty Profile
On some occasions the core city has less poverty compared to the urban settlements and
satellite towns outside the city as in the case of Chennai and Kolkata. In Guwahati the
core city seems to have more poverty than the entire district. The Assam urban poverty
is also very low at 3.3 percent in 2004-05, while the rural poverty is high at 22.3 percent.
The migration data also shows that a quarter of the total population is migrants. A
sizable percent of them also come from rural areas of the state, though the share of the
total decadal migration from rural areas is not known.

141
As per NSS for Kamrup district, 59 percent of the population below poverty line
belongs to SC & ST. 64 percent of the poor are also self-employed. There is less poverty
among the casual labour compared to self employed. About 34 percent of the poor are
illiterate. Rest of the poor are educated at higher secondary or below. 38 percent of the
poor are in manufacturing households. Income inequality in the Kamrup district is quite
low with top ten percent of population getting about 6.5 times more than the lowest ten
percent of population. Poverty also appears to be concentrated in the informal sector of
the city.
Compared to the assessment of 31 percent as below poverty line by the city
planning authorities, the National Sample Survey of Kamrup district puts the poverty at a
very low level of 2.94 percent. Probably it is due to the concentration of slums only in the
city area while the urban agglomeration and the district itself are better off. This is an
insight from the city level study. The core city Municipal Corporation Area (MCA)
population has grown faster than the Metropolitan Development Area that includes more
areas and population. The district of Kamrup has much more population and much less
growth rate in population. Probably the prosperity of the oil refining and related impact
on incomes is more apparent in the population of Kamrup district than compared to the
MCA of Guwahati. The exact slum population of the city is not known.
6.7.2 Drinking Water Problems
It is striking that in spite of being water-rich, access to water is restricted to only 30
percent of population. The Brahmaputra river system provides ample water and the
water is relatively less polluted than many other rivers, and yet the distribution is not
effective and hence ground water is extensively used. Since the terrain of the city is
undulating, ground water exploitation is not easy. As flooding is the major problem of the
city coupled with improper solid-waste disposal, clogged open-drains, and lack of proper
sewage drains, safe drinking water becomes a big problem.
6.7.3 Housing Shortage
A study conducted by the Comprehensive Master Plan preparation team for GMA –2025,
has revealed that the shortage for housing facilities within the Guwahati city in the year
2001 was to the tune of 3.1 percent, which has subsequently increased to 6.9 percent in
the year 2005.

142
Thus, the analysis of the situation shows that the city urgently needs basic
amenities and civic services such as safe drinking water, sanitation and drainage, and
flood control. Very little attention is paid to poverty alleviation programmes and slum
clearance. As poverty is concentrated in the core city, attention has to be paid to the
improvement of basic services and hygienic living for the poverty groups. The problems
of drinking water flood control and waste management appears to be paramount just as
in any other class I or class II city of India. The pockets of defence activities and oil
related businesses and colonies appear be in glaring contrast to the facilities available to
the poor in the city.
6.7.4 Suggestions of the City Development Plan
(i) Investment
The city investment plan for Guwahati Metropolitan Area was formed, wherein the project
cost is proposed to be funded by the central government. Centre will provide 90 percent
of the project cost for projects relating to slum development and the balance of will be
funded by Urban Local Bodies (ULBs) on the basis of private – public partnership (PPP),
issue of bonds or other innovative financing. The Guwahati Development Department
has in principle agreed to support ULB through financial assistance for creation of
appropriate structure.
(ii) Sustainability and Financial Options
It is recognized that the JNNURM is an important stepping stone to make the ULBs self-
sufficient and financially independent. It is also important to ensure that the assets being
created are adequately maintained and adequate resources are allocated for the same. In
order to ensure the above, the following steps are being taken:
(iii) Strengthening of Financial Status of Urban Local Bodies
As mentioned earlier, comprehensive steps are being taken to identify opportunities to
strengthen the financial health of the ULBs. A range of short- and medium-term
interventions are being taken up with the objective of generating adequate resources
within the ULBs so as to suitably operate and maintain the projects. The measure
includes levy of surcharge on holding used for commercial purposes, conduct provisional
assessment, enforce collection drives and gradually increase tariffs so as to ensure user
charges are adequate to recover at the least operation and maintenance costs of
individual projects. This is particularly relevant for water projects where present collection
is far below the cost.

143
(iv) Public Private Partnership Projects
The region recognizes the importance of PPP not only as funding mechanism but also as
an important tool to improve efficiency and to ensure proper operation and maintenance
of the created assets. This was also agreed upon as a priority during the consultative
process as well as by the State Level Steering Committee during the finalization of the
City Development Plans.
A spectrum of PPP options ranging from agreeing on frameworks (such as
community contracts) to full privatization has been thought about. The following
partnership options are generally used as PPP options:
• Service Contracts
• Build Operate Transfer (BOT)
• Concessions
• Joint Venture
• Community Based Provisions
However, the choice of option will depend on factors such as degree of control
desired by the ULBs, legal framework for private investment, regulatory mechanism, and
the potential of attracting financial resources from both the public and private sectors.
For example, service contract option of PPP has been considered for improving solid
waste management practices. PPP options in sectors such as water supply, sewerage and
drainage has been generally found difficult because of large investment requirement,
long gestation period and poor cost recovery. However, with the JNURM funding and
proper structuring, PPP is possible. One of the major goals of JNURM is to encourage
PPP participation and also to make the ULBs self-sufficient. Also the ULBs may with the
help of JNURM fund look to restructure its balance sheet.
(v) ULBs Fund Raising
Presently it is difficult for the ULBs to raise resources independently. In view of this the
following steps are required to be taken in a phased manner which is expected to
strengthen the financial status of ULBs.
1. Balance Sheet Restructuring: Balance sheet restructuring will involve activities, which
will aim to enhance the financial strength of the ULBs in the Guwahati Metropolitan Area.
2. Revaluation of Assets: In municipalities what happens is that usually the assets are not
revalued for long time; they are recorded in the books of accounts at the price in which it

144
was purchased or brought. So if the assets can be revalued at a realistic price, this can
have a sound impact on the balance sheet of the ULBs.
3. Leveraging Idle Asset: The ULBs need to identify idle assets that they can leverage out
to private players and earn sufficient revenues. Even the unutilized assets of DSP and
railways can be used for commercial purposes and to earn sufficient revenues.
4. Escrowable Receivables: Structured financing against escrowing of receivables can also
be a good procedure to attract private players, since if the receivables are escrowed, the
private players can be convinced to invest.
Once the above activities are implemented, the financial strength of the ULBs in
the Guwahati Metropolitan Area is likely to be enhanced. The next step is to create an
infrastructure fund. As the above measures will take some time for implementation, in
the mean time to ensure that the assets are properly operated and maintained, a fund
needs to be created. The fund is to be taken as a part of project cost and will be taken
into account while preparing individual project proposals and will also be reflected in the
respective DPRs. The individual projects will be prioritized according the urgency of the
requirements. The city plans to give the highest priority to provision of water services to
its citizens, followed by provision of service to urban poor, provision of drainage and
sewage.

145
REFERENCES
Ahmedabad Municipal Corporation (AMC) and Ahmedabad Urban Development Authority
(AUDA) with Technical Support by Centre for Environmental Planning and Technology, University(2005), City Development Plan of Ahmedabad 2006-2016,
Ahmedabad.
Ahmedabad Municipal Corporation (AMC) and Ahmedabad Urban Development Authority (AUDA) with Technical Support by Centre for Environmental Planning and
Technology, University (2005) “City Development Plan of Ahmedabad 2006-2016” Ahmedabad.
Bandyopadhyay, Simanti and M. Govinda Rao (2009), “Fiscal Health of Selected Indian
Cities”, NIPFP, Working Paper No. 2009-58, March.
Case, A.C. and L.F. Katz (1991), The Company You Keep: The Effects of Family and Neighbourhood on Disadvantaged Youths” (NBER Working Papers 3705, National Bureau of Economic Research).
Census of India (2001), Population Totals, New Delhi.
Centre for Studies in Social Sciences (2007), Urban Poverty Reduction Strategy for the City of Kolkata, National Institute of Urban Affairs, New Delhi.
Chuta, E. and C. Liedholm (1981), Rural Non-Farm Employment: A Review of the State of the Art, East Lansing: Michigan State University.
City Development Plan of Ahmedabad 2006-2012.
City Development Plan of Guwahati, July 2006.
Cullen, Julie Berry and Steven D. Levitt, (1999) “Crime, Urban Flight, and the
Consequences for Cities,” The Review of Economics and Statistics, 81(2), pp.159-169.
DFID (2000), Meeting the Challenge of Urban Poverty, New Delhi.
Dey, Paramita Datta (2008), “Urban Poverty Reduction Strategy – Jaipur”, National
Institute of Urban Affairs, New Delhi, April 24.
Dubey Amaresh and D. Mahadevia, (2001), “Poverty and Inequality in Indian Metropolises”, Indian Journal of Labour Economics, Vol. 44(2).
Financial Express (2007), “BPL Cards in Excess of Identified Families in Gujarat”, May 21.
Government of Tamil Nadu (2006), Development Plan for Chennai Metropolitan Area, Chennai, April.
Government of India (2009), Economic Survey, Ministry of Finance, New Delhi.
Harris J. and M. Todaro (1970), “Migration, Unemployment and Development: A Two-
Sector Analysis”, American Economic Review, March 1970, 60(1), pp.126-142.

146
Hazell, Peter and C. Ramasamy (1991), The Green Revolution Reconsidered, Baltimore:
Johns Hopkins.
Hazell, P. and S. Haggblade (1993), “Farm/Non-Farm Growth Linkages and Welfare of
the Poor”, in M. Lipton and van der J. Gaag (eds.), Including the Poor, The World Bank, Washington, D.C.
Hill, P. (1972), Rural Hausa: A Village and a Setting, Cambridge University Press, Cambridge.
Jaipur Municipal Corporation (2006), City Development Plan for Jaipur, Jawaharlal Nehru
National Urban Renewal Mission.
Jaipur Municipal Corporation, “Draft Final Report Urban Poverty Reduction Strategy:
Jaipur”.
Kar Kamal et. al. (1997), Participatory Impact Assessment: Kolkata Slum Improvement Project CMDA, DFID, New Delhi.
Kolkata Metropolitan Development Authority (KMDA) and Bengal Integrated Infrastructure Development Ltd. (2007), City Development Plan for Kolkata, Kolkata.
Kolkata Metropolitan Development Authority and CEPT University (2007).
Kundu Nitai (2003), “Understanding Slums: Case Studies for The Global Report on Human Settlements”, The Case of Kolkata, India,
(http://www.ucl.ac.uk/dpu- projects/Global_Report/pdfs/Kolkata.pdf).
Ladd, H.F. and J. Yinger (1989), America‟s Ailing Cities: Fiscal Health and the Design of Urban Policy, Johns Hopkins University Press, Baltimore, M.D.
Lipton, Michael, and Martin Ravallion (1995), “Poverty and Policy”, in Jere R. Behrman and T.N. Srinivasan (eds.), Handbook of Development Economics, Vol. 3, North-
Holland, Amsterdam, edition 1, volume 3, chapter 41, pp. 2551-2657, Elsevier.
Madras School of Economics in Association with Community Consulting Private Limited (2008), Urban Poverty Reduction Strategies for Chennai, Government of India –
UNDP Project on National Strategy for Urban Poor (NSUP).
Mahila Housing Sewa Trust (2006), Urban Poverty Reduction Strategy Report – City of Ahmedabad, National Institute of Urban Affairs, New Delhi.
Michael P. Todaro (1969), “A Model of Labor Migration and Urban Unemployment in Less
Developed Countries”, American Economic Review, vol. 59, pp. 138-148.
Michael Todaro, (1980), "Internal Migration in Developing Countries: A Survey," NBER Chapters, in: Population and Economic Change in Developing Countries, pp. 361-
402 National Bureau of Economic Research, Inc.
Mitra, A., (1992), “Growth and Poverty: The Urban Legend”, Economic and Political Weekly. March 28, pp. 659-65.

147
Montgomery, Mark R. (2009), “Urban Poverty and Health in Developing Countries”,
Population Reference Bureau, Vol. 64(2).
MSSRF and WFP (2002), “Study Across Different Size Classes of Towns”, Food Security Atlas of Urban India, Dec, p. 154.
Musgrave, R.A. (1999), “Fiscal Tasks of the State”, in J.M. Buchanan and R.A.
Musgrave (eds.), Public Finance Public Choice: Two Contrasting Vision of the State, MIT Press, Cambridge, U.S.A.
National Institute of Urban Affairs (2008), Urban Poverty Reduction Strategy for Jaipur, Government of India UNDP Project on National Strategy for Urban Poor (NSUP). New Delhi.
National Institute of Urban Affairs (2008), Urban Poverty Reduction Strategy in Select Cities of India, supported by GoI-UNDP Project, July.
National Institute of Urban Affairs, Urban Poverty Reduction Strategies (UPRS) for Chennai City.
NCAER (2008), “The Next Urban Frontier- Twenty Cities to Watch”, New Delhi.
NIPFP (2006), Jaipur: City Development Plan - An Appraisal Report, March 24.
NSSO (1997), Employment and Unemployment Situation in Cities and Towns in India 1993-94, India.
NSSO (2001), Employment and Unemployment Situation in Cities and Towns in India 1999-00, India.
NSSO (2007), Employment and Unemployment Situation in Cities and Towns in India 2004-05, India.
NSSO (Jan 1993- June 1993), “Housing Conditions and Migration with Special Emphasis on Slum Dwellers”, Ministry of Statistics and Programme Implementation,
Government of India.
Pack, Janet Rothenberg (1998), “Poverty and Urban Public Expenditures Urban Studies, Vol. 35(11), pp. 1995-2019.
Price Water House Coopers (2005), “The 150 Richest Cities in the World by GDP in 2005”, City Mayor‟s Statistics http://www.citymayors.com/statistics/richest-
cities-2005.html
Quibria, M.G. and T.N. Srinivasan (1991) “Rural Poverty in Asia: Priority Issues and
Policy Options”, mimeo, Manila: Asian Development Bank.
Reardon, T., C. Delgado and P. Matlon (1992), “Determinants and Effects of Income Diversification among Farmer Households in Bukina Faso”, Journal of Development Studies, 28(2), pp. 264-296.
Report of the Committee on Problems of Slums in Delhi, 2002.

148
Rothenberg Pack, Janet (1998) “Poverty and Urban Public Expenditures” Urban Studies,
Vol. 35(11), pp. 1995-2019.
Government of West Bengal, Statistical Abstract, 2001-02, BAE&S.
Swaminathan, P (1997), Work and Reproductive Health: A Hobson's Choice for Indian Women?, Working Paper No.147, Madras Institute for Development Studies,
Chennai.
Swaminathan, P. (2004), The Trauma of 'Wage Employment' and the 'Burden of Work' for Women in India: Evidences and Experiences, Working Paper No 186, Madras
Institute for Development Studies, Chennai.
The Calcutta Samaritans (2008), “Living on the Edge: Women on the Streets of Kolkata”,
A Report prepared by the Calcutta Samaritans, Kolkata.
The Constitution (Seventy-Fourth Amendment) Act, 1992
Todaro, M.P. (1969), “A Model of Labour Migration and Urban Unemployment in Less
Developed Countries”, American Economic Review, Vol. LIX.
Todaro, M.P. (1980), “Internal Migration in Developing Countries: A Survey”, in R.A.
Easterlin (ed.), Population and Economic Change in Developing Countries, University of Chicago Press, Chicago.
Times of India (2002), “Body to Survey City‟s Problems”, July 2, Kolkata edition.
Times of India (2009),”Rice Politics in Election Season”, April,
UNDP (2009), India: Urban Poverty Report 2009, OUP, New Delhi.

149
Annexures
Table A1: Poverty Status across Social Groups: 2004-05
City
APL
(Lakh) BPL
(Lakh) Population Distribution
( Percent)
Poverty Rate$
( Percent)
Distribution of BPL
Population
( Percent)
SC and ST
Ahmedabad 3.67 1.03 16.74 21.88 27.68 Chennai 5.81 1.77 19.37 23.32 51.68
Guwahati 0.97 0.10 18.79 9.22 58.91 Indore 0.35 0.18 19.63 34.21 27.20
Jaipur 2.57 5.18 30.79 66.88 48.70
Kolkata 5.80 0.04 14.10 0.72 4.43
OBC Ahmedabad 5.48 1.25 23.98 18.63 33.76
Chennai 20.78 1.55 57.11 6.95 45.41 Guwahati 0.74 0.06 13.95 6.99 33.17
Indore 0.38 0.23 22.01 37.44 33.38 Jaipur 2.06 2.53 18.22 55.13 23.75
Kolkata 1.39 0.23 3.91 14.39 24.60
Others Ahmedabad 15.21 1.43 59.27 8.61 38.56 Chennai 9.10 0.10 23.53 1.08 2.91
Guwahati 3.80 0.01 67.26 0.35 7.92 Indore 1.34 0.27 58.36 16.68 39.42
Jaipur 9.90 2.93 51.00 22.83 27.54 Kolkata 33.26 0.67 81.88 1.98 70.97
All Ahmedabad 24.36 3.72 100.00 13.23 100.00
Chennai 35.69 3.42 100.00 8.74 100.00 Guwahati 5.50 0.17 100.00 2.94 100.00
Indore 2.07 0.68 100.00 24.69 100.00 Jaipur 14.53 10.64 100.00 42.28 100.00
Kolkata 40.49 0.95 100.00 2.28 100.00 Source: Based on unit level data of NSS 61st round 2004-05. APL: Above Poverty Line, BPL: Below Poverty Line $ Poverty rate is based on the urban poverty line for the state.

150
Table A2: Poverty Status across Education Groups - 2004-05
City
APL (Lakh)
BPL (Lakh)
Population Distribution
( Percent)
Poverty Rate$
( Percent)
Distribution of BPL
Population ( Percent)
Illiterate
Ahmedabad 2.23 1.21 12.23 35.09 32.44
Chennai 3.61 1.38 12.76 27.68 40.43 Guwahati 0.20 0.06 4.48 22.45 34.16
Indore 1.16 2.09 21.91 64.40 83.31 Jaipur 1.97 4.53 25.81 69.76 42.59
Kolkata 5.12 0.53 13.63 9.41 56.18
Literate: Below Primary Ahmedabad 1.48 0.74 7.89 33.29 19.85
Chennai 1.63 0.49 5.42 23.14 14.34
Guwahati 0.64 - 11.32 - - Indore 1.24 0.02 8.45 1.48 0.74
Jaipur 0.31 0.81 4.44 72.32 7.60 Kolkata 4.55 0.12 11.25 2.52 12.41
Primary Ahmedabad 3.84 0.40 15.09 9.38 10.70 Chennai 4.06 0.84 12.53 17.12 24.55
Guwahati 0.26 0.04 5.30 13.45 24.26
Indore 0.33 0.20 3.60 38.18 8.11 Jaipur 1.53 2.07 14.31 57.40 19.43
Kolkata 6.30 0.19 15.65 2.86 19.62
Middle Ahmedabad 4.57 1.05 20.02 18.65 28.23
Chennai 5.51 0.44 15.22 7.47 13.02 Guwahati 1.92 0.03 34.41 1.78 20.79
Indore 0.92 0.16 7.24 14.61 6.24
Jaipur 3.83 1.98 23.07 34.08 18.60 Kolkata 6.43 0.07 15.67 1.01 6.92
Secondary Ahmedabad 4.69 0.04 16.84 0.81 1.04 Chennai 8.29 0.21 21.74 2.52 6.28
Guwahati 0.53 - 9.38 - - Indore 1.62 0.04 11.17 2.43 1.60
Jaipur 3.43 0.21 14.47 5.85 2.00
Kolkata 5.69 0.04 13.82 0.67 4.05 Source: As in Table A1.

151
Table A3: Poverty Status across Education Groups - 2004-05 (contd.)
City
APL (Lakh)
BPL (Lakh)
Population Distribution
( Percent)
Poverty Rate$
( Percent)
Distribution of BPL
Population
( Percent)
Higher Secondary
Ahmedabad 2.22 0.03 8.05 1.51 0.92
Chennai 3.03 0.03 7.81 0.98 0.88 Guwahati 0.37 0.03 7.08 8.63 20.79
Indore 2.62 - 17.66 - - Jaipur 0.27 0.85 4.42 76.04 7.96
Kolkata 2.13 - 5.15 - -
Diploma Ahmedabad 0.14 - 0.49 - -
Chennai 0.93 0.00 2.39 0.00 0.00
Guwahati 0.01 - 0.11 - - Indore 0.11 - 0.76 - -
Jaipur 0.29 0.00 1.14 0.00 0.00 Kolkata 0.18 - 0.44 - -
Others Ahmedabad 5.19 0.25 19.39 4.66 6.83
Chennai 8.64 0.02 22.13 0.20 0.50 Guwahati 1.58 - 27.92 - -
Indore 4.33 - 29.22 - - Jaipur 2.91 0.19 12.33 6.26 1.83
Kolkata 10.10 0.01 24.39 0.08 0.83
All Ahmedabad 24.36 3.72 100.00 13.23 100.00
Chennai 35.69 3.42 100.00 8.74 100.00
Guwahati 5.50 0.17 100.00 2.94 100.00 Indore 12.32 2.51 100.00 16.94 100.00
Jaipur 14.53 10.64 100.00 42.28 100.00 Kolkata 40.49 0.95 100.00 2.28 100.00
Source: Based on unit level data of NSS 61st Round 2004-05. $ Poverty rate is based on the urban poverty line for the state.

152
Table A4: Distribution of Population in Expenditure Deciles, 2004-05
Deciles
Average MPCE (Rupees)
Ahmedabad Chennai Guwahati Indore Jaipur Kolkata
1 408.61 472.29 432.57 367.60 347.82 467.33
2 572.33 631.80 746.30 605.14 387.95 616.61 3 673.57 801.87 922.98 840.87 468.80 728.39
4 774.83 962.80 947.85 1064.14 540.33 853.72
5 908.43 1145.06 991.86 1187.92 605.88 991.79 6 1101.94 1321.40 1120.22 1321.36 762.30 1130.52
7 1303.68 1573.13 1368.46 1533.97 1020.73 1355.32 8 1531.40 1980.61 1609.09 1969.19 1131.45 1666.84
9 1814.71 2602.99 2097.45 2847.61 1543.04 2345.41 10 3059.95 4540.36 2844.94 6610.43 5245.30 5078.89
Source: Based on unit level data of NSS 61st Round.
Table A5: Percentage of Slums according to the Hours of Water Supply
City
Figures in Percentage
0-4 4-8 8-12 12-24 No Supply Total
(in hours)
Ahmedabad 100 0 0 0 0 100.0
Chennai*
Indore 48 10 0 14 28 100.0
Jaipur 84 5 0 3 8 100.0
Kolkata 4 24 8 5 60 100.0 Source: National Institute of Urban Affairs, Urban Poverty Reduction Strategy in Select Cities of India. * In Chennai more than 90 percent population of the slums depends on water tanker. So it is not possible to
provide the data for the availability of water in hours.

153
Table A6: Availability of Sewer Connection
(Figures in percentage)
City Available Not Available No Response Total
Ahmedabad 69 31 0 100.0
Chennai 32 68 0 100.0 Indore 55 40 5 100.0
Jaipur 72 28 0 100.0
Kolkata 41 6 54 100.0 Source: National Institute of Urban Affairs, Urban Poverty Reduction Strategy in Select Cities of India
Supported by GoI-UNDP Project, July 2008.
Table A7: Type of Toilets
(Figures in percentage)
City Individual
Toilet
Community
Toilet
Open
Defecation
Dry
Latrine
Septic
Tank
Others
Total
Ahmedabad 70 16 14 - - 0 100.0
Chennai 29 48 23 - - - 100.0
Indore - 20 - - -
Jaipur 70 10 20 - - - 100.0
Kolkata 9 - 4 13 41 33.21* 100.0 Source: National Institute of Urban Affairs, Urban Poverty Reduction Strategy in Select Cities of India
Supported by GoI-UNDP Project, July 2008. * one pit latrine
Table A8: Availability of Electricity
(Figures in percentage)
City Available Not Available Total
Ahmedabad 94.00 6.00 100.00 Chennai 87.00 13.00 100.00
Indore 91.00 9.00 100.00 Jaipur 90.00 10.00 100.00
Kolkata 98.00 2.00 100.00 Source: National Institute of Urban Affairs, Urban Poverty Reduction Strategy in Select Cities of India
Supported by GoI-UNDP Project, July 2008.

154
Table A9: Frequency of Street Lighting
(Figures in percentage)
City
Daily
No Street
Lights
Irregular
No
Response
Total
Ahmedabad 11.50 23.00 64.00 1.50 100.00 Chennai 53.40 23.20 17.10 6.40 100.00
Indore 80.00 20.00 0.00 0.00 100.00
Jaipur 80.00 20.00 0.00 0.00 100.00 Kolkata 12.56 1.95 85.36 0.13 100.00 Source: National Institute of Urban Affairs, Urban Poverty Reduction Strategy in Select Cities of India
Supported by GoI-UNDP Project, July 2008.

MSE Working Papers Recent Issues
* Working Paper 45/2009 Data Requirements and Statistical Challenges for Designing Climate Friendly Energy Policies in Multilateral Framework U.Sankar
* Working Paper 46/2009 Causality Between Foreign Direct Investment and Tourism: Empirical Evidence from India Saroja Selvanathan, E.A. Selvanathan and Brinda Viswanathan
* Working Paper 47/2009 Ecology, Environment and Sustainable Development in Indian Fiscal Federalism U.Sankar
* Working Paper 48/2009 Revenue-Expenditure Nexus for Southern States: Some Policy Oriented Econometric Observations Kausik Chaudhuri and Bodhisattva Sengupta
* Working Paper 49/2009 MNEs and Export Spillovers: An Analysis of Indian Manufacturing Industries Chiara Franco and Subash Sasidharan
* Working Paper 50/2010 Reforming Indirect Taxes in India: Role of Environmental Taxes D K Srivastava and C Bhujanga Rao
* Working Paper 51/2010 The Value of Improved Public Services: An Application of the Choice Experiment Method to Estimate the Value of Improved Wastewater Treatment Infrastructure in India Ekin Birol and Sukanya Das
* Working Paper 52/2010 Measuring Accuracy of Projections of Central Taxes by the Finance Commission D K Srivastava and C Bhujanga Rao
* Working Paper 53/2010 Heterogeneous MNC Subsidiaries and Technological Spillovers: Explaining Positive and Negative Effects in India Anabel Marin and Subash Sasidharan
* Working Paper 54/2010 Climate Variability and Agricultural Productivity: Case Study of Rice Yields in Northern India Ishwarya Balasubramanian and K.S. Kavi Kumar
* Working papers are downloadable from MSE website http://www.mse.ac.in $ Restricted circulation

MSE Monographs
* Monograph 1/2006 A Tract on Reform of Federal Fiscal Relations in India Raja J. Chelliah
* Monograph 2/2006 Employment and Growth C. Rangarajan
* Monograph 3/2006
The Importance of Being Earnest about Fiscal Responsibility C. Rangarajan and Duvvuri Subbarao
* Monograph 4/2007 The Reserve Bank and The State Governments: Partners in Progress Y.V.Reddy
* Monograph 5/2008
India’s Dilemmas: The Political Economy of Policy -Making in a Globalized World Kaushik Basu
* Monograph 6/2010 MDGS-Based Poverty Reduction Strategy for Tamil Nadu D.K.Srivastava, K.R. Shanmugam And C.Bhujanga Rao