Poverty Alleviation Programmes and Structural Changes in ...
133
Poverty Alleviation Programmes and Structural Changes in the Rural Economy M.K. Sukumaran Nair & P.M. Mathew Institute of Small Enterprises and Development ISED Road, Cochin 680 028 Sponsored by PLANNING COMMISSION Yojana Bhavan, New Delhi 110 001 March, 2000
-
Upload
khangminh22 -
Category
Documents
-
view
1 -
download
0
Transcript of Poverty Alleviation Programmes and Structural Changes in ...

Poverty Alleviation Programmes and Structural Changes in the Rural Economy
M.K. Sukumaran Nair & P.M. Mathew
Institute of Small Enterprises and Development
ISED Road, Cochin 680 028
Sponsored by
PLANNING COMMISSION Yojana Bhavan, New Delhi 110 001
March, 2000

Poverty Alleviation Programmes and Structural Changes in the Rural Economy
CONTENTS
(i) Introduction
(ii) Executive Summary
Chapter - 1 National Issues, the Kerala Model, and the Emerging Challenges
Chapter - 2 The Design of the Study
Chapter - 3 The Regional Setting
Chapter - 4 The Clusters
Chapter - 5 Government Programmes in Vypeen
Chapter - 6 Employment, Income and Asset Creation
Chapter - 7 The Sustainability Question
Chapter - 8 Issues of Governance
Chapter - 9 Some Key Areas of Concern
Chapter - 10 Policy Imperatives
Chapter - 11 Concluding Observations and Suggestions
(iii) Selected Bibliography
(iv) Selected Statistical Tables
(v) List of NGO Programmes

Introduction
The planning era in India has witnessed the design and implementation of several development programmes geared to poverty removal and employment generation in the rural areas. The impact of these programmes have been periodically evaluated by the respective Ministries/Departments as well as by the Planning Commission. Such evaluations have generally tried to look programme implementation from the administrative point of view than from that of the ultimate beneficiaries. Often leading to wrong conclusions and policy prescriptions they fail to capture adequately, the limits and constraints of the key participants.
It was against this background that the present study was entrusted to Institute of Small Enterprises and Development by the Planning Commission. It looks into the quality of programme design and implementation by different tiers of government, right from the Gram Panchayath. The agenda before the study is to see things from the point of view of the common man. It was carried out in Vypeen, Ernakulam district, Kerala. Besides a sample study of poor households, we have put in our best efforts to document the several governmental programmes being implemented in the village, their linkages, and the perceptions of different sections of society regarding these programmes. We have also physically verified a large number of public assets created in the area over the past several years, and have clear insights into their performance and usefulness.
We would like to place on record our sincere appreciation for the Planning Commission to take up such a vital investigation, and for trusting the capabilities of our Institute. We would also like to note that the present assignment is a continuation of the cooperation we have had with the Planning Commission for the last several years.
Our Institute is indebted to Mr. K.C. Pant, Deputy Chairman, Planning Commission, who has shown keen interest in this series, by personally attending the agenda-setting Conference at Yojana Bhavan on 19th July, 1999. Dr. N.C. Saxena, Secretary, Mr. S.S. Meenakshisundram, Adviser (Monitoring) and Mr. Shilendra Sharma, Adviser (SER), have shown keen interest and have extended active support for the successful implementation of this project. Sincere thanks are also due to Mr. S.M. Vijayanand, IAS, Secretary, Department of Local-Self Government-Rural, Government of Kerala, who assured that the project gets support and encouragement from various departments of the State. The district Administration of Eranakulam, the Gram Panchayaths of Vypeen, public men, scientists, and non-governmental organisations have helped the project in several ways. But above all, the rich insights and experience shared with us by our respondents of Vypeen have placed this study in its present form.
We would also like to thank all of them whom we may have inadvertently failed to mention.
M.K. Sukumaran Nair
P.M. Mathew Cochin
March 31, 2000

Executive Summary
The Environment
The Kerala model of development is by now well known in development literature. The stagnation of primary and secondary sectors, and the disproportionate growth of the services sector has brought the economy of the State into a ratchet effect. The services sector has crossed its absorbtive capacity, leading to the vital question of sustainability. The stagnancy of the primary and secondary sectors has resulted in a draining off of resources from these sectors. The State is, therefore, on the verge of a serious economic crisis with far-reaching adverse implications on maintaining even the existing welfare programmes meant for the poor people. Vypeen Island, which is supposed to be ranking the first in terms of the density of population in any rural area, has several peculiar features, which in turn, have far-reaching implications on programme design and implementation by several government departments.
Relevance of Government Programmes
The relevance of government programmes in Vypeen has to be understood in relation to the massive problems of high density of population, unemployment, environmental degradation and consequent poor health standards of the people. Against these massive problems, individual programme design and implementation at the Gram Panchayath level has been found to be very ineffective.
Commonality of Underdevelopment
A cluster-based investigation into the development processes as well as the living standards of the people indicate that Vypeen is a case where, the problems of the people are less sector-specific or activity specific. Therefore, any policy measure meant to attack poverty and unemployment is not likely to lead to significant positive results. The implementation of government programmes in the Island has to be understood against this background.
People's Perception and Participation
The field research indicates that, poor people's perception on most of the development programmes are as temporary relief measures, rather than as programmes capable of shaping the economic position of their households. Naturally, the death rate as well as sickness among assets created under government programmes (eg. IRDP) remain significantly high. The bureaucracy also do not consider these programmes as serious. The monitoring part is found to be weak.
Transparency
A major victim of such lack of interest among people is transparency. The panchayaths do not maintain the relevant muster rolls. Manipulative techniques in the Gram Sabha have been widely reported. A significant number of beneficiaries are not aware of the role and functions of the Gram Sabha. Similarly, many beneficiaries have availed of the benefits of anti-poverty programmes even without attending the Gram Sabha once.
Income and Employment Changes
Unlike in other parts of the State, the survival of the household is dependent not only on the income of the head, but also by the income subsidies provided by other members. There is only a very negligible labour mobility both temporally and spatially. Even under such a situation,

dependency ratio remains high, with significant adverse implications on the economic survival of the household. Employment has not recorded any significant changes over the last five years, despite the presence of several government programmes. Wage rates, however, have gone up to some extent.
Lack of Programmes
Many of the programmes being implemented by the Gram Panchayaths and the Block are repetitive, with very poor positive results. On the other hand, there are some sectors where relevant programmes are totally absent. For instance, where there is a trend of massive unemployment, programmes related to entrepreneurship development and industrial promotion are almost totally absent. Even available funds are not properly utilised. Irrelevant programmes like digging of wells for the poor, vegetable cultivation (due to salinity of soil) etc. are found to be common.
Need for Large Projects
The mounting problems of the Island suggest the need for projects of a critical minimum size, which at a time, can provide employment opportunities, can create new assets, and can reduce social costs like environmental degradation, mounting medical expenses etc. We have identified eleven crucial sectors where alternative programmes can lead to positive results.
Need for a Consortium Approach
The people's planning model in Kerala, to some extent has been successful to translate the aspirations of the people into concrete reality. However, the wisdom of the Gram Sabha has limitations. While the Gram Sabha has to be taken into confidence, imaginative projects are needed to improve the situation of the Island. It is vital for the Gram Panchayaths to think of some consortium approach, while designing and implementing development projects in the Island.
Capacity Building
As a bridge between the people and the political leadership, it is necessary to enhance the capacity of the personnel in the Gram Panchayaths. This is necessary to improve the quality of administration and to assure that the fruits of development reach the people in the appropriate manner and time. The Panchayaths do not have any relevant databases. The officials were also found to handle even minimum vital data.
Capacity building at the level of the Gram Panchayaths and monitoring their activities are important for meaningful implementation of Panchayati Raj. The task of monitoring should be taken up by the State government. The State Planning Board, the most appropriate agency for this, should be supported by the Planning Commission in this regard.
Primacy of a Clean Environment
Vypeen should learn from the environmental experience of places like Surat. Major projects meant for improving the environmental standards of the Island should be initiated urgently. The State Government, probably with the support of international funding agencies should think of such a major project. The interest and involvement of donor agencies like the World Bank, SDC and the Dutch government should help to explore further initiatives in this area.
Gap Between the People and the Panchayaths

We note with grave concern the fact that the will of the people, as reflected in the resolutions of the Gram Sabha, do not get materialised adequately. For instance, innovative projects identified by the Gram Sabha, in many cases, have not got implemented in right time and in the correct manner.
Inter-Plan Changes
We do not find any major changes in the culture of programme design and implementation over the Eighth and Ninth Plans. People's involvement in Plan design and implementation, even under the 'People's Planning' approach is far from satisfactory. The findings from Vypeen cannot, however, be generalised. Success stories of several Panchayaths in Ernakulam district and elsewhere in the State have been well documented. Such success stories suggest that, planning and programme implementation in the Island need a major restructuring.

National Issues, the Kerala Model, and the Emerging Challenges
1.0. Kerala as a Model?
The Kerala model of development is by now well known in international literature. The particular type of development pattern assumed by this part of the country has caught the attention of academicians and politicians alike due to its uniqueness. However, from the point of view of development, two crucial points standout: 1) should the Kerala model be understood in isolation from the wider experience of India as a whole; and 2) what does the experience of Kerala offer to the rest of the country?
Before going into the details of the Kerala model, it is instructive to make a word of caution on how the model has been projected. A model becomes what it is only when it is able to present a consistent picture in terms of its strengths which far outweigh its constraints, both being defined in terms of a consistent framework. Unfortunately discussions on the Kerala model are largely a subject matter of professional academicians, rather than a debate in which several sections of the community participate. This itself implies a biased perception on what Kerala has already achieved and what more is expected of it. For instance, a segment of Kerala economists, as well as a few Kerala observers outside the country, have been instrumental in presenting the experience of this State as a unique model. It is history that shapes the development experience of any region of a country. Naturally, Kerala was endowed with certain positive factors such as higher level of education, which in turn promoted social consciousness, class movements and enhanced politicisation. While other parts of the country were not favoured with many of these positive factors, the latter regions have their own strength in other areas like higher levels of industrialisation, emergence of a innovative business community and enhanced international relations through industry and trade. Kerala, however, has been deprived on many of these aspects. Therefore, as indicated earlier, the crucial question is as to what Kerala has gained from the rest of the country, and what the rest of the country have learned from Kerala's experience. Unfortunately, most academic discussions in this area have a "Kerala-mania" The Kerala's experience has been studied largely by Keralites than by outside observers within the country.
Majority of the Indians do have to necessarily wait for an indefinite future for the hump of economic growth to be crossed, for schooling, house-sites, primary heath-care, food at fair prices and so on. Kerala's development experience questions such a sequence of agriculture, industry and subsequently, improvement in the standard of living of the masses. The challenge posed by Kerala relates to this historical sequencing of economic growth and mass welfare sanctified by the developed countries. One of the relatively backward states of India, with per capita domestic production consistently below the national average, Kerala has been able to provide for the basic needs of the majority of its citizens. This is revealed by comparative indicators of health, education and demographic transition. (Issac and Tharakan, 1995). The comparative index of quality of life, taking into account various factors, place Kerala far above the general situation prevailing not only in other parts of the country, but also in most parts of the Third World.
Broadly speaking, there are two schools which try to explain the Kerala model and have arrived at their prognosis. The first school argues that Kerala has succeeded in achieving a quality of life nearly comparable to the developed countries at a much lower level of resource consumption. Arguing on these lines, they hail Kerala as the best sustainability model. Another variant of this approach hails Kerala as shortcut to development, where quality of life can be improved without economic growth or social change. They call it an ideal cheap model of development (Mencher, 1980).
There have also been serious criticisms. As a reaction to the above position, there has been a tendency to denigrate the achievements of Kerala in the social sectors. Alternatively, taking into

consideration per capita income, unemployment and other indicators of economic backwarness, it has been shown that Kerala has been slipping sharply down in the rank order of development, as a "growth-less model".
The paradox of Kerala's experience lies precisely in achieving a relatively high quality of life at a low level of economic development. Low economic development is normally associated with low quality of life. This raises the question, if the people of Kerala are worse off because they have better education and health.
There is also another extreme position. Kerala's educational and health development has been cited as another variant of the underdevelopment paradigm of colonial and neocolonial conditions.
Despite the discussions at the overall level, significant deviation also been suggested. The overall indicators cited above contradicts with the experience of some communities that have been left out of the development process. Such communities include the tribes, the fisher folk etc.
2.0. Structural Changes
The Kerala economy has been characterised by some structural changes, but these changes demonstrate one of lop-sided development. During the 1980s, the economy of the State demonstrated poor performance of agricultural and industrial sectors, severe power shortage, high incidence of educated unemployment and poverty. The development of the economy during the 1990s may be understood in two phases, i.e., the growth phase of the first half of the decade and the recession since the mid-90s. During the former period, the State's economy achieved higher growth, which can be attributed to the better performance of the secondary and territory sectors. But, the State could not sustain this tempo of development which was not rooted on sustainable factors. The decline in Gulf remittances, a severe jolt to the industrial sector due to acute power shortage, and a sharp fall in the prices of some commercial crops which form the mainstay of agricultural economy of the State, have led to a significant decline. This was compounded by factors such as enhanced unemployment, inadequate infrastructural facilities, especially against a mounting rate of urbanisation. The structural changes that took place in the regional economy were not capable of addressing themselves to these severe problems.
3.0. Gains and Losses
The era of economic reforms and the revival of migration to the Middle East and consistent increase in inflow of foreign remittances to Kerala, have been remarkable features of the economy of the State during the first half of the last decade. The devaluation of the rupee in 1990 and the changes that have taken place regarding convertibility of rupee have helped migrants to earn more. These factors helped to keep migration as a sustained process even when the wage rate in many of the Gulf countries came down significantly. The number of Kerala migrants to the Middle East increased from 8.25 lakhs in 1971 to 14 lakhs in 1996. The corresponding remittances increased from the 230 crores in 1991 to 550 crores in 1995.
The process of migration virtually promoted a structural changes in the economy through a very basic attitudinal change in the society as a whole. A spurt in price of land, and real estate, a boom in construction activity, enhanced speculative and rent seeking activities were the roles of these new environment. The speculative mind got reflected in the labour market as well. While economic activities got concentrated around the tertiary sector, it created a value system which is anti-entrepreneurial. Within this wider environment, the entrepreneurs themselves got subjected to a process of retarded entrepreneurship (Mathew, 1999).
The picture on the economy of the state, as available today, is one of chronic stagnation. The data on Net Domestic Product (NDP) indicates that Kerala economy achieved a marginal increase in growth rate during the first half of 1990s compared to 1980s. The tertiary sector registered a higher growth rate, within which, sub-sectors like transport, storage and communication, registered the highest growth rate during the first half 1990s.
Kerala's industrial sector has undergone stagnation since the mid-1960s. The share of manufacturing sector in the SDP is relatively small and the growth rate recorded has been marginal compared to the all-India figures. Industrial performance in India since the Second Five Year Plan has witnessed three phases: a) high growth rate since mid-1950s; b) a deceleration since mid 1960s; and c) a phase of recovery since mid-1970s. Studies like Goldar and Seth (1989) have analysed the spatial variations in the rate of industrial growth across the country. Such studies indicate that, Kerala, Andhra Pradesh and Karnataka, were three states which experienced continuous deceleration till the mid-1980s. The figures available thereafter indicates that both these states have improved their growth rates, i.e., Andhra Pradesh from 6.03 to 6.76% and Karnataka from 6.85% to 7.68%. Among the Indian states, Kerala showed continues deceleration in the rate of industrial growth since the second half of 1960s.
The lopsided development observed in Kerala has often been explained in terms of high cost of production, labour related problems and the psychological fear of entrepreneurs. Unfortunately, much of the academic discussion during the 1980s - 1990s, were either for or against the 'labour-unrest hypothesis'. These debates however, failed to go deeper into the processes that are operating at the grass-root level as well as the mental models developed by Keralites which get reflected in their investment decisions. As already noted, the whole situation has to be analysed from the history of development of this economy. Mathew (1991, 1999) has provided a wellknown experience in terms of a crisis-cushion hypothesis. This hypothesis emanates from an analysis of investment behaviour that is observed in Kerala economy. While there has been an overall commercial orientation in investment decisions, the industrial investment themselves are of a specific breed which nurtures absenteeism. Mathew's study, carried out on behalf of the Planning Commission, shows that the small scale sector of industry, which is the only hope of State, given several constraints, is subjected to a process of informalism. While the innovative entrepreneur progressively plunges into higher levels of involvement in industrial activities, the Kerala entrepreneur demonstrates a tendency of progressive withdrawal. This phenomenon has been explained in terms of the crisis-cushion hypothesis. The hypothesis says that the psychology of progressive withdrawal operates across all sectors of the economy. Not only the industrial entrepreneurs, the planners, the policy makers, bureaucrats, the academicians etc. demonstrate such rent-seeking behaviour. Unfortunately, this wider issue has been misconstrued in terms of 'lack of entrepreneurship' by some scholars. This wrong diagnosis has resulted in an unwarranted perception and treatment to the entrepreneurial community which provides atleast some relief to the development of Kerala economy.
4.0. Rural Development and Employment
The debate on integrated rural development during the mid-1980s has significantly enriched our understanding of the dimensions of the problems of poverty as well as the nexus between employment and poverty (Rath, 1986, Dandwall, 1987, Dandekar, 1986 etc). The need for generation of employment opportunities on a massive scale was emphasised by several debates. Hence, emerged the search for the most suitable strategy of employment generation. The discussions revolved around the two major categories: wage-employment and self-employment.
At the operational level, employment generation programmes received an added theoretical focus during 1980s. Subsequently, the concurrent evaluations undertaken by the Ministry of Rural Development and independent studies by several scholars gave a greater boost to debate. The concern of much of these evaluations and debates has been to pinpoint the sustainability of employment generation. While some success stories have been reported from different parts of

the country, the various rural development programmes implemented by Ministries and central agencies could not report a significantly high rate of success in achieving the economic objective of sustainability and the wider social objectives.
The achievement of such objectives, as outlined above, is essentially geared to structural changes in the rural economy, ipso facto, does not lead to higher levels of income and employment. It is necessary that these changes should be of the type which promotes positive and appropriate linkages in the economy.
The new millennium brings in more challenges than hopes to the rural poor in India. While, latest studies indicate mounting unemployment and poverty as two crucial problems which need to be addressed to on a war-footing, it has become practically impossible to chalk out massive programmes that are capable of responding to these problems. The latest strategy has been to target the poorest of the poor through anti-poverty programmes of a reoriented nature. In Kerala, these programmes have further been fine-tuned through the people's planning approach. Despite all these initiatives, there has been substantial leakges in programme implementation. Besides, even with the best efforts the impact they can make in the rural economy remain negligible, in relation to the needs.
5.0. Health
The development in the area of health-care in Kerala has been the kingpin of Kerala model. It has been noted that, "no other large population on earth adequately meets the requirements of small families, combined with modest consumption". (Mencher, 1980).
While the achievements in the health sector of Kerala has to be appreciated, it is important to examine the reasons for the same as well as the methods by which these achievements can be sustained. Enhanced literacy level, enhancement of status of women in society, land reforms, an effective public distribution system, enhanced political consciousness etc have often been suggested as the key factors. However, an area which has been overlooked by most scholars is health-care infrastructure. (Ramankutty, 1999).
The health-care legacy of Kerala dates back to the 19th Century. The princely states of Travancore and Cochin had initiated steps to set up vital health infrastructure, mainly for the objective of prevention of contagious diseases. Since Independence , this legacy continued. The number of beds in government hospitals increased from 13,000 in 1961 to 20,000 in 1971, and again to 29,000 in 1981; by 1996, it became 38,000. A look at the budgetary documents shows that, during 1985-86 to 1995-96, even under budgetary constraints, government expenditure in health-care has not come down. It is also important to note that, both in terms of the number of beds, and the number of employees, the private sector has outweighed the public sector. Simultaneously, the public sector is facing an unhealthy competition, mainly due to unfair practices by the private sector.
In any society, what is expected of the health-care sector is to contribute to improve the quality of life of the people. Infact, a sound health-care system is the very foundation of a healthy economy. Three of the crucial issues facing the health care system in Kerala are the following:
Mobilisation of adequate resources for maintenance of the existing infrastructure;
The deteriorating quality of health services;
The indiscriminate growth of private sector and its negative implications on meeting the health-care needs of the people.

An examination of the developments in this sector in the recent past indicates that, unlike in the past there has been excessive focus on the curative rather than preventive aspect of the health-care in the State. Even while the State bears an important part of budgetary resources for this sector, it has not been able to perform the community health role effectively. As a consequence, the outbreak of contagious diseases has been reported from various parts of the State during recent times. Such problems have often been viewed by planners and administrators simply as a health problem rather than as social costs which have a close bearing on the performance of the economy as a whole. The experience of Vypeen, to be discussed in the foregoing chapters, provides such a specific case.
6.0. People's Planning.
There has been common agreement that something need to be done urgently to salvage Kerala out of its present crisis. One attempt in this direction was the so-called People's Planning which was inaugurated in 1996.
People's planning experiment in Kerala is an extension of debates on multi-level planning as it emerged in 1960s and which appeared in several official documents of the Government of India during the late 1960s and 1970s. The thrust on democratic decentralisation contained in these policy documents were adapted to the situation of Kerala. Hence, a model of People's Planning has been articulated in terms of more efficient administration of physical and social capital for the purpose of development. Democratic decentralistion, has also the potential of nurturing a particular useful state-civil society synergies.
The 73rd and 74th amendments to the Constitution of India formed an opportunity for setting in motion the decentralisation process in Kerala in a new direction. The traditional step-by-step approach of devolution of financial resources and administrative powers from the State to the District, was reoriented by giving substantial powers to the village Panchayaths and the municipalities. The LDF Government, way back in 1996, earmarked 35 to 40% of the outlay to the Ninth Five Year Plan towards programmes and projects drawn up by the local-self governments. During 1997-98, the resources thus devolved worked out to be Rs. 1025 crores and Rs. 1178 crores 1998-99. This excludes the funds from centrally- sponsored schemes and institutional loans that could be availed by local bodies with government guarantee. While before 1996-97 the share of local-self governments in the Annual Plan was around Rs. 20 crores, this signifies a quantum jump in resource available with local- self government (Issac, 1999:5). A major feature of the devolution of financial powers in Kerala under the People's Plan has been that, devolution has taken place in terms of a significant size of the Plan funds into the hands of the local-self government, (in 1997-98, 75% of grant-in-aid, and the rest in terms of sponsored schemes). However in other states of the country, grant-in-aid forms a small component of the so-called untied funds whereas financial devolution takes largely the form of schemes.
Another major feature of the People's Planning model was a thrust given to social mobilisation as an instrument for Plan formulation and implementation. The involvement of ordinary people in the Plan process through the mechanism of Gram Sabha is innovative and probably the first experiment of its kind ever recorded under a democratic set up. This method of drawing up a Plan and its implementation has some positive contribution: Firstly, it helped significantly to raise the illusions of common people regarding decision making at the grassroots level. It is important to note that Kerala's grand tradition of "discussing politics over a cup of tea", which signifies a substantial degree of social consciousness and accountability, got eroded significantly since mid-1970s.
The subsequent experiment of Plan design and implementation proved that expectation of a major departure from the beaten track has been much constrained to begin with, the financial devolution did not lead to a diversification of programmes and projects. Since the Second Annual Plan onwards, a conscious effort was taken by the Government as well as the State Planning

Board to initiate greater innovative programmes and projects. However, considering the vast requirements of a thorough restructuring of Plan process, the efforts do not bear significant fruits. This owes to several constraints: 1) Kerala's thrust during the past several decades has been geared largely to the social sectors. The productive sectors like agriculture and industry got only step-motherly treatment under a welfare-oriented regime which Kerala witnessed since about 1970s. Planning these productive sectors were a bureaucratic exercise with very little people's involvement or expertise. This retarded hegemony continues under the people's planning regime also. Secondly, the planning process itself operates at two levels with their often less complementary regimes. For instance, macro level planning for industry does not match with counterpart initiatives taken by the Panchayathi Raj Institutions. Thirdly, the People's planning movement could not mobilise the expertise of a large number of people who could have contributed significantly to its success. Unfortunately, several experts who showed substantial enthusiasm during the initial stages of the movement got distanced themselves in the subsequent stages. Fourthly, Kerala failed to present a clear development agenda before the people of the State. The political parties, unlike in the past gain mandate largely on the basis of short-term programmes and issues, rather than on wider issues of development and long-run programmes. This gradually led to a blurring of the developmental scene where some sort of inertia is rampant. Fifthly, the intellectual leadership, of the State also got alienated from the mainstream of development. While the lower ranks of academic community, due to their political leanings showed some interest in activities which are largely politically driven, those who could have made use of their expertise, largely chose be silent. Sixthly, the emergence of non-resident Keralites (NRKs) as a significant group, had it negative implications on the development scene as a whole. While NRKs contributed significantly in terms of foreign exchanges, the NRK phenomenon itself lead to a polarisation in Kerala society. While NRKs received considerable social and political patronage, this was largely at the expense of the morale of sizeable sections of the community who wanted to earn a living on the local economy. This is very clear in the industrial sector where no major effort has been initiated over the last 20 years to raise the morale of the entrepreneurial community. This vicious effect has not received adequate attention in the media as well.
Naturally, while in other parts of the country, atleast selected sections of the society have been aware of the challenges of liberalisation and are taking steps to withstand the evil effects of these challenges, Kerala by and large, has been groping in the darkness. It is against this background that an innovative approach like People's Planning has been placed. Naturally, the enthusiasm it has created does not get translated into concrete action and ideas generated by the people.
In a people-centered initiative, it is the enthusiasm, imagination and drive of the people that lead the programmes into success.
7.0. Learning From the Grassroots Experience
An understanding of the complex Kerala reality as outlined above, is based on the substantial literature that has been generated on the State's economy and society. While many of these issues are common to several villages in Kerala, the case of Vypeen Island stands out, in terms of the specific history the Island has. While poverty and unemployment are of a common problems of the rural economy of Kerala, the regional diversities are a reflection largely of how the people, and poor people in specific, react to these problems. While comparable literature is scanty, we have attempted to provide a comparative static position in terms of a similar study we have undertaken in Idukki district (Mathew, 1999) of Kerala during 1999.
The changes that have taken place in the regional economy of Ernakulam district as well as of Vypeen Block has to be understood against the background of these State-level issues. Where Kerala is a rural-urban continuum, highly sensitive to information through a higher average level of education and transport and communication network, it is natural that the developmental issues of Vypeen resembles closely with the wider issues of development at the State-level.

The Design of the Study
1.0. Background
Poverty removal and employment generation have been two main pillars of planning in India. In correspondence to this thrust, anti-poverty and employment generation programmes have been implemented by the Centre and the State Governments.
The strategy for programme implementation and delivery system in the rural economy has to be built upon the lessons learned from the experience in the execution of anti-poverty programmes on a longitudinal basis. Such understanding of these programmes and the lessons learned from experience are important to arrive at steps for speedy and more effective implementation, as well as for structuring more relevant programmes, if needed.
2.0. Problem
The anti-poverty programmes being implemented at the Block-level have been periodically evaluated. Several evaluation studies in the past have indicated that, while these programmes have been successful to some extent, the anomalies are substantial. These problems, however, cannot be simply explained away in terms of common usages like corruption, nepotism etc. On the other hand, there have been substantial gaps in our understanding of the context in which they have been implemented. Moreover, the implementing agencies as well as the sponsoring Ministries monitor these programmes from the point of view of their current status of implementation. Besides, the linkages of these programmes as well as the wider overall linkages in the regional economy remain unexplored.
Considering these constraints we are not in a position to understand the reasons for programme failure, if any. It is also difficult to explain success stories adequately. Unless the beneficiary households is taken as the unit of analysis and structural changes in these households over a period of time are not analysed in detail, it will be rather difficult to rectify anomalies and to implement the programmes meaningfully.
Structural changes, by no means, are the result of any particular programmes or government programmes as a whole. On the other hand, such changes have been the ultimate result of a variety of factors, both exogenous and endogenous to the household. It is important that such relevant factors are identified and their causation explained in order to arrive at a meaningful assessment of the situation.
3.0. Objectives of the Study
The objective of this study is to examine the structural changes that have taken place in selected clusters of poor households and to situate them against the background of various anti-poverty programmes. The specific objectives are the following:
• to prepare an inventory of all anti-poverty and welfare programmes implemented in some identified clusters by the governmental agencies, NGOs, other funding agencies etc. over a period of five years;
• to examine the present status of assets created in terms of their quality and performance; • to examine the extent of participation of poor people in the implementation of these
programmes; • to analyse the perception of beneficiaries regarding the usefulness of these programmes;
and

• to analyse the transaction costs, cost effectiveness and sustainability of these programmes.
4.0. The Locale
The objective of this study is to situate the role and relevance of development programmes initiated by several government departments in relation to the changes that have taken place in a representative village over a period of time. Though it may not be easy to make a causal relationship between structural changes in a region and the programmes that have been implemented there, it is important to understand the processes in operation. Taking into consideration this vitality, we have selected Vypeen as the region of our study. This village is characterised by a number of conducive factors, like high unemployment, inadequacies relating to water supply and sanitation, inadequate transport and communication facilities etc which make enhanced developmental intervention crucial. The Government obviously is the crucial agent who can play an important role in this situation.
5.0. Methodology
A crucial feature of this study is its wide coverage, in terms of the scope of analysis as well as the longitude. Therefore, it demands a combination of methods, including detailed literature survey, collection of qualitative information and data through observation and informal discussions, and a sample study. Secondary data for this investigation was collected from the National Informatics Centre, dicennial census, DRDA etc. Qualitative information was collected from a large number of informed persons such as local social workers, people's representatives, political leaders etc. Besides, all relevant studies/literature in the area were meticulously reviewed.
The sample study was aimed at capturing the specificities of programme implementation specifically in the context of anti-poverty and employment programmes. Based on relevant secondary literature as well as information available through discussions, four clusters of households were selected for drawing a random sample of 25 households each for indepth study. The sample Panchayaths were initially selected. Three criteria were used for selection of Panchayaths: (a) total population; (b) density of population; and (c) number of BPL families; and (d) SC/ST population. The clusters were situated in particular Wards of the corresponding Panchayaths. With the help of a map of the Ward concerned, the centre of the cluster was identified. A household situated at this centre formed the first sample. The subsequent samples were drawn using the Random Numbers Table, until the required number of samples were obtained.
Table: 2.1 Sampling Indicators
Name of the P anchayath
Total Population
Density of Population
No. of BPL Families ('98 census)
SC/ST population
Name of the Cluster
Constituent Wards
Mulavukadu 22322 1158 1063 3002 Elankunnapuzha 47878 4106 4060 4570 Valappu 10,12 &14 Narakkal 22978 2672 1504 3538 Manjanakad 1,3,4,5 &8 Nayarambalam 23166 1783 1258 3818 Nedungad 4 & 5 Edavanakkad 19631 1747 1891 3703 Kuzhuppilli 11446 1481 743 1791 Pallippuram 41100 2467 3900 3506 Thrikkadak-
kappily 7

6.0. Technical Problems and Constraints
This study is not without technical problems and constraints. The major constraint relates to inadequate availability of data on a longitudinal basis. Most government departments do not maintain correct data on programmes implemented, number of beneficiaries etc. Besides, available data also has substantial inaccuracies and/or inconsistencies which needed to be corrected/cross-checked at various levels.
With the launching of the people's planning approach to local level planning, there remains substantial latent potential to utilise Block level and village level data for the purpose of planning, programme implementation and monitoring. Unfortunately, though the relevant softwares and infrastructure are available to DRDAs and Blocks, these have not been used appropriately for maintenance of a strong database. On the other hand, the Development Report/Plan Document of the Block Panchayath, which is supposed to be the only comprehensive document at the Block/Gram Panchayath level, was found to be with lot of inaccuracies and data gaps. While these reports provide a lot of general information, comments, and policy recommendations mostly of a sweeping nature, review of programmes, insights on the present stage of programme implementation, and suggestions on how they could be improved, are almost totally lacking. This infact is a reflection of the very low level of administrative and analytical expertise which has gone into the preparation of these reports.

The Regional Setting
1.0. Introduction
This chapter seeks to further elaborate the relevance of our study region. This has been done in terms of the locational advantages/ disadvantages of the village, the peculiarities of the regional economy, the linkages of the village with the District and State level administration, and finally, the role and relevance of different actors, the government, the private sector and the NGOs, in shaping the structure of the regional economy
2.0. Geography
Vypeen, is an island on the western side of the Ernakulam District. With the Kodungalore strait on the North, the Cochin port and Backwaters on the South, river Periyar and the Cochin city on the East and the Arabian Sea on the West, Vypeen has a size of 87.85 Sq. kms. The Island is demarcated by a sea coast of 26 Kilometers on the West and backwaters extending around 30 Kilometers on the East. A cluster of islands, this Block is constituted by seven Gram Panchayaths, Mulavukadu. Elamkunapuzha, Narakkal, Nayarambalam, Edavanakad, Kuzhupilly and Pallipuram. Of these, Mulavukadu is constituted by three islands, ie., Panambukadu, Valarpadam and Mulavukadu. Narakkal is constituted by two islands as well ie., Valliavattom and East Manjanakadu. Though it remains separated from the main land, Vypeen is narrowly linked with other parts of the District through an artery road, the Vypeen-Munambam road, which divides this Asia's most densely populated Island into two stretches, i.e., the Western stretch, which is coastal-belt, and the Eastern-belt, which is closer to the Backwaters. Three of the constituent Island, ie., Mulavukadu, Panambukadu and Valarpadam, remain completely isolated with water transport as only access. Similarly, the only direct access to the nearby Cochin city is the Backwaters.
Largely below the sea level, Vypeen is subject the threat of the vagaries of the Ocean, though the Kodungalore strait provides a bulwark.
The ecology of Vypeen is unique. The region is endowed with large canals extending over 50 Kilometers and a network of small canals emerging there from. With paddy fields, coconut gardens, marshy lands and waste lands, water in most parts of the Island is extremely saline. Naturally, availability of drinking water remains a major problem. With the mixed topography, improper drainage is a major problem which affects the environment adversely.
3.0. Population
The population of Vypeen according to the 1991 census was 1,88,521 which is 9.53 % of the district population of 19,77,142. The density of population is 2158 per square kilometers, which is highest in the State. The total number of households is 35,606 which is 9.10% of the total households in the district. The sex-ratio is 1042 females per 1000 males.
Table: 3.1 General Population Particulars
Population Literacy Rate
Male Female Total Male Female Total Male female
Vypeen 87.35 35610 35606 92306 96215 188521 85.5 81.6 Dist. Total 2133.10 390951 389868 987606 989536 1977142 84.0 78.5

Source: Census of India, 1991
Table: 3.2 -
SC/ST Population
Scheduled Caste Scheduled Tribes
Male Female Total Male Female
Total
Vypeen 4474 11620 12053 23673 82.9 51 125 133 258 83.7
Dist. Total
38067 100522 101674 202196 61.4 698 1786 1669 3455 47.9
Source: Census of India, 1991
3.1. Literacy Level
A distinguishing feature of Vypeen is its higher level of literacy and especially of female literacy. While the district level of literacy rate is 84% and in Vypeen it is 85.5%. Corresponding figures for female literacy is 78.5 and 81.6% respectively. A more distinguishing feature is the higher level of literacy among SC/ST population. It exceeds both the district level rates as well as rates within the Block. Literacy rate among Schedules Castes is 82.9% whereas for Scheduled Tribes is 83.7%. It is to be noted that, the district level rates for Scheduled Castes is only 61.4%, whereas for Scheduled Tribes, it is 47.9%.
3.2. Occupational Pattern
The occupational profile of the Block throw light upon the lope-sided development of the Block. Main workers constitute only 8.56% of the total population, whereas the size of non-workers category constitute as large as 10.09%. The share of marginal workers remain low indicating the small size of ancillary employment opportunities. Details on occupational pattern of households is given in the following tables.
Table: 3.3
Occupational Classification of Households (1996)
S.F. M.F. Agrl. Lbrs Non.Agrl. Lbrs Rural Artisans
Vypeen - 1273 8488 3288 880 Dist. Total 824 17463 54168 59922 1224
Dist. Avg. 54.93 1164.2 3611.2 3994.8 81.6
Table: 3.4
Occupational Classification of Households 1996 (New Survey)

S.F. M.F. Agrl. Lbrs Non.Agrl. Lbrs Rural Artisans
Vypeen - - - - - Dist. Total 53 839 3237 2703 447
Dist. Avg. 3.53 55.93 215.8 180.2 29.8
Table: 3.4
Classification of Main Workers (1991)
Cultivators Agri- Labours
H.Hs. Industry Workers
Other Workers
Total Workers
Vypeen 458 1823 288 50006 52575 Dist. Total 76511 129164 13602 376125 595402
Dist. Average
5100.73 8610.93 906.8 25075 39693.47
Source: Census of India, 1991
The decline in agricultural employment is an emerging phenomenon in the Island. Though, this to some extent, has been compensated by non-farm activities, there is a general preference among the younger generation not to go for the traditional non-farm activities like tree-climbing and coir work like, retting, dehusking, and spinning. There has also been an alienation of the younger generation from fishing, which is prominent tradition activity. Fish peeling absorbs a sizeable group of women workers. Carpentry and masonry would have been other prominent areas. However, due to inadequate mobility of labour, the opportunities remain limited. Other section like masons assistance and casual labourers, move out of the Island to some extent. Besides, there is also a process of entry into the ranks of masons and carpenters from other communities. The Island in general, demonstrates a tendency of a ratchet within which labour circulates without much opportunities for openings outside.
3.3. Employment and Unemployment
The Census figures indicate that unemployment is a major problem in the Island. While partial and full unemployment are rampant, the major reason remains the structural factors. Marginalisation of coconut gardens, and enhanced diseases have led to a declined interest in coconut cultivation. Similarly, the entry of massive tribe of Tamil fishermen and their settlement in the region have reduced employment opportunities of local fishermen. The problem has been compounded by limited mobility of labour.
Table: 3.5
Workers & Non Workers
Main Workers Marginal Workers Non Workers
Male Female Total Male Female Total Male Female Total
Vypeen 42861 9614 52475 3110 2433 5543 46335 84168 130503

Dist. Total
478268 134061 612329 27875 30842 58717 474896 817888 1292784
Dist. Average
31884.53 8937.4 40821.93 1858.33 2056.13 3914.46 31659.73 54525.87 86185.6
Source: Census of India, 1991
4.0. Infrastructure
The Vypeen is endowed with availability of basic social and economic infrastructure. However, many such infrastructure is not adequate in relation to higher density of population. Constraints are largely in the areas of water supply and sanitation.
4.1. Education and Culture
Vypeen has a rich cultural heritage. However, its attainments in the area of education are far from satisfactory. Both secondary data, as well as our own field research indicate that the levels of education are much lower in relation to the situation in other parts of the State.
Table: 3.6
Educational Institutions in Vypeen Block
Lower Primary Upper Primary High School
Sl No
Panchayaths Govt Pvt Un- aided
Total Govt Pvt Un- aided
Total Govt Pvt Un- aided
Total Grand Total
1 Mulavukad - 5 - 5 1 2 - 3 - 2 - 2 10 2 Elankunnapuzha 2 8 - 10 2 5 - 7 1 1 - 2 18
3 Narakkal 1 3 - 4 1 1 - 2 1 1 - 2 8 4 Nayarambalam - 3 - 3 - 2 - 2 - 1 1 2 7
5 Edavanakkad - 2 - 2 1 - - 1 - 2 - 2 5
6 Kuzhuppilly - 3 - 3 - 1 - 1 - 1 - 1 5 7 Pallippuram 3 6 - 9 - 2 - 2 - 3 - 3 14
Block 6 29 - 35 5 15 - 18 2 11 1 14 67
Table: 3.7
Social and Cultural Institutions
Libraries Reading Rooms
Cinema Theatres
Auditoriums Churches Temples Mosques Angana wadies
Bala wadies
Pre-Primary Schools
Vypeen 16 23 11 12 38 66 14 105 2 31 Dist. Total
303 313 84 104 530 758 261 403 278 225
Dist. 20.2 20.86 5.6 6.93 35.33 50.53 17.4 26.86 18.53 15
Average
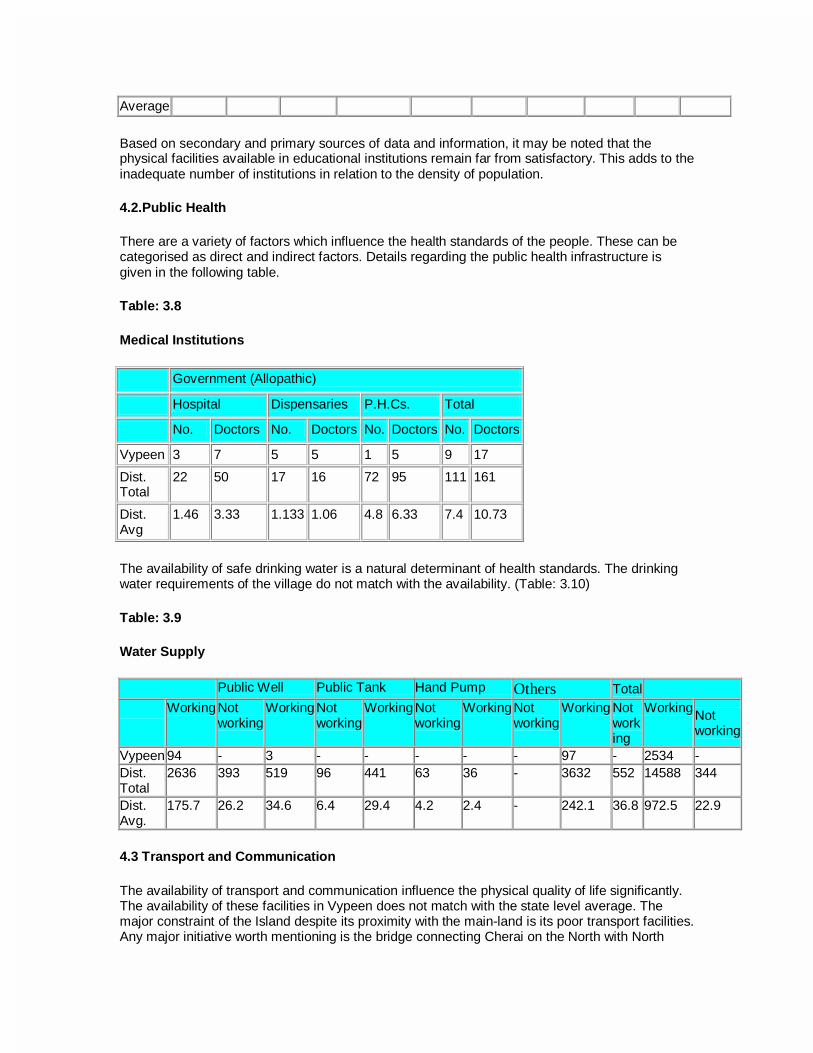
Based on secondary and primary sources of data and information, it may be noted that the physical facilities available in educational institutions remain far from satisfactory. This adds to the inadequate number of institutions in relation to the density of population.
4.2.Public Health
There are a variety of factors which influence the health standards of the people. These can be categorised as direct and indirect factors. Details regarding the public health infrastructure is given in the following table.
Table: 3.8
Medical Institutions
Government (Allopathic)
Hospital Dispensaries P.H.Cs. Total
No. Doctors No. Doctors No. Doctors No. Doctors
Vypeen 3 7 5 5 1 5 9 17
Dist. Total
22 50 17 16 72 95 111 161
Dist. Avg
1.46 3.33 1.133 1.06 4.8 6.33 7.4 10.73
The availability of safe drinking water is a natural determinant of health standards. The drinking water requirements of the village do not match with the availability. (Table: 3.10)
Table: 3.9
Water Supply
Public Well Public Tank Hand Pump Others Total Working Not
working Working Not
working Working Not
working Working Not
working Working Not
work ing
Working Not working
Vypeen 94 - 3 - - - - - 97 - 2534 - Dist. Total
2636 393 519 96 441 63 36 - 3632 552 14588 344
Dist. Avg.
175.7 26.2 34.6 6.4 29.4 4.2 2.4 - 242.1 36.8 972.5 22.9
4.3 Transport and Communication
The availability of transport and communication influence the physical quality of life significantly. The availability of these facilities in Vypeen does not match with the state level average. The major constraint of the Island despite its proximity with the main-land is its poor transport facilities. Any major initiative worth mentioning is the bridge connecting Cherai on the North with North

Paravoor. Even this connection does not improve the transport situation significantly as the bridge is far away from Cochin. A regular Jungar service linking Fort-Cochin and Vypeen was started in 1977 as an outcome of an agitation under the leadership of Mr. T.A. Paraman, who was then member of the Legislative Assembly. Subsequently, a similar service between Ernakulam and Vypeen started in 1993. Despite these interventions, the facilities available are not commensurate with the traffic density, especially between Vypeen and Cochin.
Table: 3.10
Communication Facilities
Post Offices Tele. Exchanges Tele. Connections Tele. Booths
Vypeen 13 2 3335 40
Dist. Total 278 57 41452 440 Dist. Avg 18.53 3.8 2763.46 29.33
Banking and other financial institutions play a crucial role in mobilising local resources. Details on banking infrastructure in the village is given in the following table.
Table: 3.11
Financial Institutions
Nationalised Banks
Schedules Banks
Co-op. Banks
Co-op Societies
Other Financial Institutions
Vypeen 9 6 8 8 1
Dist. Total
106 65 124 156 166
Dist. Avg
7.06 4.33 8.26 10.4 11.06
5.0. Regional Economy
The regional economy is characterised by pre-dominance of agriculture and fisheries. In tune with the emerging needs of a significantly sized population, there has been a significant growth of the service sector. Large industries are almost nil. Small enterprises are largely of a primitive mould, involved in service activities.
5.1 Agriculture
Vypeen is characterised by a peculiar eco-system suitable for paddy cultivation, cultivation of garden crops like coconut and fish farming. The canals connected with the Cochin backwaters on the eastern side facilitates paddy cultivation in most Panchayaths of Vypeen. However, there is a direct inlet, which connects Puthuvypu village with the sea. This prevents paddy cultivation in that village. The estimated productivity of paddy is 600 kgs. per acre.

Prawn culture is an off-season activity which provides substantial income and employment. Infrastucture for research and development activities in this area have been set up by the Kerala Agricultural University as well as by the Govt. of India through its Krishi Vigyan Kendra.
Coconut is another major crop, distributed throughout the area. It has been estimated that an area of 7136 acres are occupied by coconut gardens. Root-wilt disease is widespread and this has affected productivity of coconut gardens significantly.
Table: 3.12
Land Particulars (Hect.) (1996)
Dryland Wetland Total Net Area cultivation
Net Area non-Agri. use
Area not cultivated
Vypeen 6910.00 2028.00 8938.00 4740.00 2226.00 1972.00 Dist. Total
140635.62 61595.80 202231.42 152405.10 35230.89 14595.43
Dist. Average
9375.70 4106.38 13482.09 10160.34 2348.72 973.028
5.2. Livestock and Poultry
Livestock and poultry which were important subsidiary activities in the village have come down in the recent past. However, programmes like IRDP have attracted more households into these activities. Two Co-operative Dairies, one at Pallippuram and the other one at Narakkal, as well as a number of private initiatives, take care of the processing and distribution of dairy products. Rearing of ducks and poultry also provide subsidiary employment opportunities for many households.
Table: 3.13
Livestock Population
Total in Milk Total Females Buffaloes
Cross breed
Indige- nous
Cross breed
Indi- genous
Total Female Male
Vypeen 3159 2386 2947 2399 5346 325 5671 26 18 44 96502
Dist. Total
106924 62280 163691 104142 267833 34903 302736 11945 5951 17896 1568642
Dist. Avg.
7128.26 4152 10912.73 6942.8 17855.53 2326.86 20182.4 796.33 396.73 1193.0 104576.1
5.3. Fisheries
Endowed with rich water resources and with infrastructural support by several governmental agencies, fishing, fish processing and trade have offered an important source of income and employment in the region. Fishing forms the major occupation for nearly 21,000 persons. In addition, there are around 8,000 workers involved in fishery related ancillary activities.

Membership in Fishermen's Welfare Societies (which forms the backbone of fishermen's villages in Kerala) constitutes, as per latest data, around 12,500 persons.
Fishing equipments also support the village assets significantly. This includes, 1323 fishing boats registered in the area, in addition to about 400 boats which come from outside Vypeen. The fishing craft also includes trawlers and purse-seine boats, amounting 110 in numbers.
The infrastructure for this sector include, the state-owned Fishing Harbour at Munambam, in addition to the two private harbours, one at Munambam and the other one at Murikkumpadam. The processing network includes 70 ice plants and 400 peeling sheds located in various parts of the Block.
The public support system for fisheries is significant and widespread in Vypeen. The R&D and extension services are offered by the Fisheries Station of the Kerala Agricultural University located at Puthuvypu as well as by the Fisheries Research Station and the Krishi Vigyan Kendra located at Narakkal. In addition to this, there is a regular support network, largely by the Govt. of Kerala. The Matsya Bhawan of the Fisheries Department has 2 Inspectors posted in this area, in addition to 3 Project Officers of the Matsyafed and 2 Fisheries Officers of the Fishermen's Welfare Board. Most of the government programmes in the area have been implemented through a network of 22 primary Fishermen's Societies operating under Matsyafed, which is the apex Federation.
The public promotional cum incentive system includes, distribution of equipments to primary societies, production and distribution of prawn seeds through hatcheries, and technical training in prawn fishery and hatchery. The relevant institutions are, the Marine products Export Promotion Authority, and state level organisations, the ADAK and the BEFDA
5.4. Industries
As already noted, the region has been characterised by lope-sided industrial development. The industrial base is largely constituted by fisheries related industrial activities such as, fish processing units, tiny units which are involved in processing of fish products, peeling sheds, ice plants, boat yards, production, repairing and servicing of fishing equipments etc. Despite this significant resource base and natural advantages, no major structural or organisational changes have taken place in these industries. The government promotional activities in the past include setting up of an industrial estate, registration of 16 industrial co-operative societies and implementation of usual programmes of promotional agencies like the District Industries Centre and the Khadi and Village Industries Board etc. Depsite these initiatives, and the possible market opportunities offered by Cochin city, which is just a few kilometers away, the industrial base has not picked up, nor have any significant diversification taken place in the existing structure.
5.5. Services Sector
While there is a lope-sided industrial development as outlined above, the service sector has grown significantly, partly in response to the high density of population. The activity structure of this sub-sector include, a large number of hotels, distribution services, shops catering to household items, financial services etc.
6.0. Income Levels and Poverty
Despite significant interventions through official and non-official development programmes, Vypeen stands first in poverty and income inequalities. The latest survey conducted by the DRDA shows the following results:
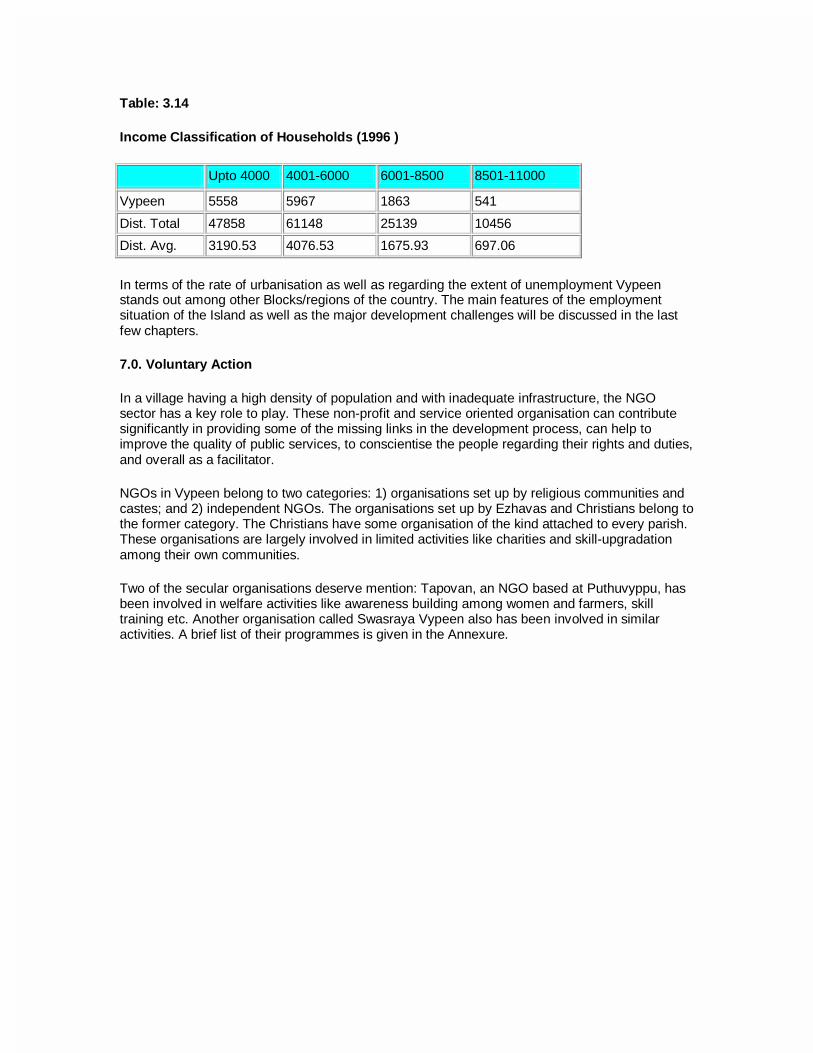
Table: 3.14
Income Classification of Households (1996 )
Upto 4000 4001-6000 6001-8500 8501-11000
Vypeen 5558 5967 1863 541
Dist. Total 47858 61148 25139 10456 Dist. Avg. 3190.53 4076.53 1675.93 697.06
In terms of the rate of urbanisation as well as regarding the extent of unemployment Vypeen stands out among other Blocks/regions of the country. The main features of the employment situation of the Island as well as the major development challenges will be discussed in the last few chapters.
7.0. Voluntary Action
In a village having a high density of population and with inadequate infrastructure, the NGO sector has a key role to play. These non-profit and service oriented organisation can contribute significantly in providing some of the missing links in the development process, can help to improve the quality of public services, to conscientise the people regarding their rights and duties, and overall as a facilitator.
NGOs in Vypeen belong to two categories: 1) organisations set up by religious communities and castes; and 2) independent NGOs. The organisations set up by Ezhavas and Christians belong to the former category. The Christians have some organisation of the kind attached to every parish. These organisations are largely involved in limited activities like charities and skill-upgradation among their own communities.
Two of the secular organisations deserve mention: Tapovan, an NGO based at Puthuvyppu, has been involved in welfare activities like awareness building among women and farmers, skill training etc. Another organisation called Swasraya Vypeen also has been involved in similar activities. A brief list of their programmes is given in the Annexure.

The Clusters
1.0. Introduction
The concept of cluster has been in vogue in development literature especially in the context of small and medium enterprises. A cluster may be defined as a local agglomeration of enterprises (mainly small enterprises, but often also including some larger enterprises), which are producing and selling a range of related and complementary products and services. An example can be a localised leather industry which includes leather tanning units, leather finishing units, leather goods producers, leather garment manufacturers, designers, sub-contractors, merchant buyers and exporters etc. It must however, be highlighted that a cluster is not merely a hardware, consisting of a group of industries located in a particular area. Its success and dynamism are highly dependent on the software i.e. the linkages and relationships that get established, or are consciously established, over a period of time. The definition itself, is therefore, situation-specific.
2.0. Activity Clusters
In the rural development context, the concept of cluster has been of very recent use. The possible reason is the lack of suitable criteria for identification of clusters. Activities and regions need not always correspond. Therefore, while some activities may be located in a particular region, this may be because of some natural advantages.
Lack of suitable criteria for identification makes, the concept of cluster, of limited operational meaningfulness in the context of rural development. In the new approach of the Ministry of Rural Development, activity clusters have been chosen as the focal point for implementing a programme meant to raise the assisted families above the poverty line within a period of three years. The strategy involves identification of a few selected key activities in each Block, and to attempt to develop all aspects of these activities. While this new approach facilitates, coordinated action of a different kind, the dependence on administrative units like Blocks and Districts, is likely to put a constraint on the successful implementation of this programme.
Instead of taking either an individual approach, or an administratively straight- jacketed cluster approach, we have chosen a functional definition of a cluster. According to this approach, we attempt to address to the question as to why poor people in a particular Panchayath (or Block) are concentrated in a particular locality. The plausible explanations are that: (1) these poor people have limited accessibility to resources; or (2) that they have some perceived locational advantages. While such a discussion has been done elsewhere, we have identified four clusters of poor households based on the observed concentration of these households (table 4.1)
Table: 4.1
Scheme/Cluster-Wise Distribution of Samples
Scheme Elamkunnapuzha Nayarambalam Narakkal Pallipuram Total
CRSP 4 1 3 1 9 DWCRA - 1 - - 1
IAY 3 5 9 2 19 IRDP 11 15 4 14 44
JRY - 1 - - 1
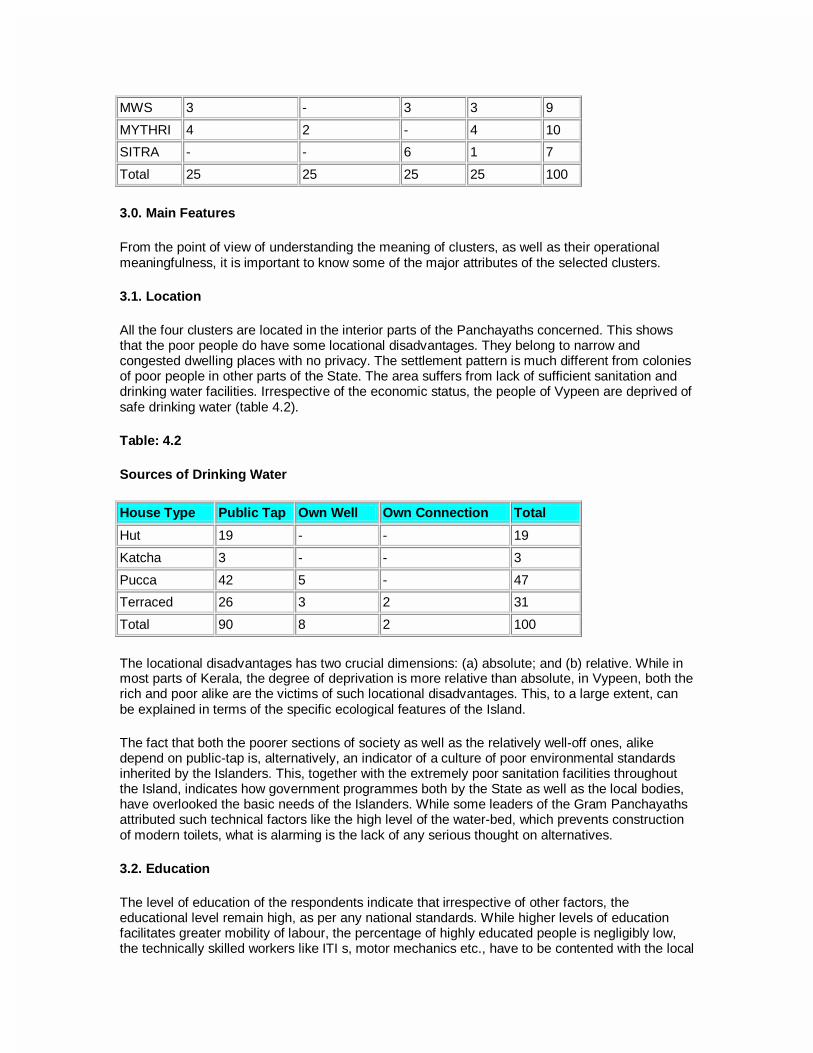
MWS 3 - 3 3 9
MYTHRI 4 2 - 4 10 SITRA - - 6 1 7
Total 25 25 25 25 100
3.0. Main Features
From the point of view of understanding the meaning of clusters, as well as their operational meaningfulness, it is important to know some of the major attributes of the selected clusters.
3.1. Location
All the four clusters are located in the interior parts of the Panchayaths concerned. This shows that the poor people do have some locational disadvantages. They belong to narrow and congested dwelling places with no privacy. The settlement pattern is much different from colonies of poor people in other parts of the State. The area suffers from lack of sufficient sanitation and drinking water facilities. Irrespective of the economic status, the people of Vypeen are deprived of safe drinking water (table 4.2).
Table: 4.2
Sources of Drinking Water
House Type Public Tap Own Well Own Connection Total
Hut 19 - - 19
Katcha 3 - - 3
Pucca 42 5 - 47 Terraced 26 3 2 31
Total 90 8 2 100
The locational disadvantages has two crucial dimensions: (a) absolute; and (b) relative. While in most parts of Kerala, the degree of deprivation is more relative than absolute, in Vypeen, both the rich and poor alike are the victims of such locational disadvantages. This, to a large extent, can be explained in terms of the specific ecological features of the Island.
The fact that both the poorer sections of society as well as the relatively well-off ones, alike depend on public-tap is, alternatively, an indicator of a culture of poor environmental standards inherited by the Islanders. This, together with the extremely poor sanitation facilities throughout the Island, indicates how government programmes both by the State as well as the local bodies, have overlooked the basic needs of the Islanders. While some leaders of the Gram Panchayaths attributed such technical factors like the high level of the water-bed, which prevents construction of modern toilets, what is alarming is the lack of any serious thought on alternatives.
3.2. Education
The level of education of the respondents indicate that irrespective of other factors, the educational level remain high, as per any national standards. While higher levels of education facilitates greater mobility of labour, the percentage of highly educated people is negligibly low, the technically skilled workers like ITI s, motor mechanics etc., have to be contented with the local

market which is already flooded. Mobility of labour even to the nearby Cochin city is difficult because of inadequate transport facilities as well as for the "sons-of-the-soil" policies promoted by trade unions.
Table: 4.3.
Educational Level of Respondents
Panchayath Primary Secondary High-School College
Elamkunnapuzha 9 9 7 - Nayarambalam 11 4 9 1
Narakkal 9 5 10 1 Pallipuram 11 9 4 1
Average Age (56) (48) (41) (30)
Total 40 27 30 3
3.3. Ownership of Assets
Ownership of assets is a crucial factor which empowers the poor in terms of a flow of income as well as the capabilities to look for alternative sources of income. We have noted that land accounts for the major asset and the majority of the respondents were tenants who got land under the Land Reforms Act. While the asset value of land is relatively low because of their location in the interior areas, any form of trade-off based on land itself is rather difficult. Hence, these poor households have to depend exclusively on wage income for their survival.
Table: 4.4
Land Ownership of Households (In Cents)
Land Owned No
<5 29
5-10 57
11-15 8
16-20 2
>20 4
Total 100
3.4. Social Background
The peculiar social background of the people is a characteristic feature of the clusters. The majority of the respondents belong to the erstwhile category of agriculture labourers, belonging to the backward pulaya community. Another prominent group is the tree climbers who belong to the Araya community.
Table: 4.5

Religion/Caste of Respondents
Religion No
Hindu 24
SC/ST 47
XIAN 29
Total 100
3.5. The Health Trap
A vicious circle of poor health standards of the community is a notable feature of these clusters. Due mainly to environmental factors the overall health standards remain low. Contagious diseases are common. Such objective factors, however, have not led to a proportionate expansion of medical infrastructure. Even while the Island is densely populated, the poor purchasing power of the majority makes setting up of such infrastructure unviable. The private sector thus gets dissuaded to invest. The public medical infrastructure on the other hand, is constrained because of low investment in the sector.
It is important to note that Vypeen is one of the centres where government health infrastructure was originally initiated. While such infrastructure has considerably helped in fighting frequent outbreak of contagious diseases, the facilities available have not improved significantly in relation to the demand.
3.6. Lack of External Development Support
A critical minimum effort which is capable of raising the clusters from their present state of stagnation is vital. While such endogenous efforts cannot be expected significantly, external interventions alone can help to improve the situation. Many forms of external support were heard of in the past, though none of them have materialised. However, a major recent initiative has been the Vypeen Bridge project which has already been started. Two other projects like, the CNG project, as well as the Vallarpadam Container Terminal project have been in different stages of negotiation.

Government Programmes in Vypeen
1.0. Introduction
As we have noted earlier, unemployment and poverty are major problems which constrain development of Vypeen. These problems have been addressed to by several governmental agencies as well as by NGOs. However, the role played by the governmental agencies is more crucial than that of the NGOs. Therefore, our discussion in this Chapter will be focussed on these governmental programmes.
The governmental programmes can be broadly categorised into two: a) social sector programmes; b) programmes which are addressed essentially to the economic sectors.
2.0. Social Sector Programmes
The social sector programmes may be discussed under the following heads:
Anti poverty/rural development programmes
Health
Water-supply and sanitation
Social Welfare Programmes
Education and Culture
The social sector programmes have a distributional content in programme design and implementation. This content is more pronounced in the case of the anti-poverty or rural development programmes which are specifically targeted to the people below the poverty-line. The other programmes in this category, such as health, water-supply, education and social welfare, are largely not targeted and are meant to be of an overall impact in the community as a whole.
2.1. Antipoverty Programmes
Among the various anti-poverty and rural development programmes, 7 programmes have been implemented in Vypeen. They are, IRDP, DWCRA, TRYSEM, SITRA, IAY, MWS, JRY and CRSP. While SITRA has been implemented only since 1994-95, data regarding all the other programmes are available from 1994-95 onwards.
Table: 5.1
Implementation of IRDP in Vypeen Block
Year No. of Households Assisted Investment
(Rs. Lakh)
Per Household Investment
SC ST Others Total Women P.H. Subsidy Loan

1993-94 222 3 186 411 179 11 14.73 22.08 8956
Dist. Total
2577 17 2502 5096 2142 103 165.63 260.35 8359
Dist. Avg 171.8 1.13 166.8 339.73 142.8 6.86 11.042 17.35 557.26
1994-95 223 2 173 398 167 4 18.29 29.58 12028
Dist.Total 2406 31 2536 4973 2284 67 198.00 383.32 11669
Dist. Avg.
160.4 2.0 169.06 331.5 152.26 4.46 13.2 25.554 777.93
1995-96 168 - 168 336 160 5 14.68 36.23 15152
Dist.Total 1839 16 2974 4829 2002 55 208.70 572.41 16175
Dist.Avg 122.6 1.0 198.26 321.9 133.46 3.66 13.91 38.160 1078.333
1996-97 167 - 169 336 135 3 14.82 41.04 16625
1997-98 154 - 206 360 144 - 18.4 47.06 18183.33
1998-99 98 - 180 278 111 - 11.43 40.15 18553
Source: District Rural Development Agency (DRDA), Ernakulam
Table: 5.2
Implementation of TRYSEM in Vypeen Block
Year No. of trainees Post-Training
SC ST Others Total Women P.H. Self.
Empl Wage Empl
Under-going Trg.(No.)
1993-94
23 - 12 35 31 - - 27 -
Dist. Total
204 3 305 512 404 9 91 260 229
Dist. Avg.
13.6 0.2 20.33 34.13 26.93 0.6 6.06 17.33 15.26
1994-95
27 - 15 42 38 - 19 23 -
Dist. Total
282 3 414 699 554 3 282 346 200
Dist. Avg
18.8 0.2 27.6 46.6 36.93 0.2 18 23 13
1995-96
18 - 12 30 19 1 2 26 -
Dist. Total
177 2 259 438 309 1 70 319 321
11.8 0.13 17.26 29.2 20.6 0.06 4.66 21.26 21.4
Avg.
1996-97
4 - 4 8 6 - - 6 -
1997-98
11 - 23 34 34 - 34 - -
1998-99
5 - 10 15 15 - - 7 -
Source: District Rural Development Agency (DRDA), Ernakulam
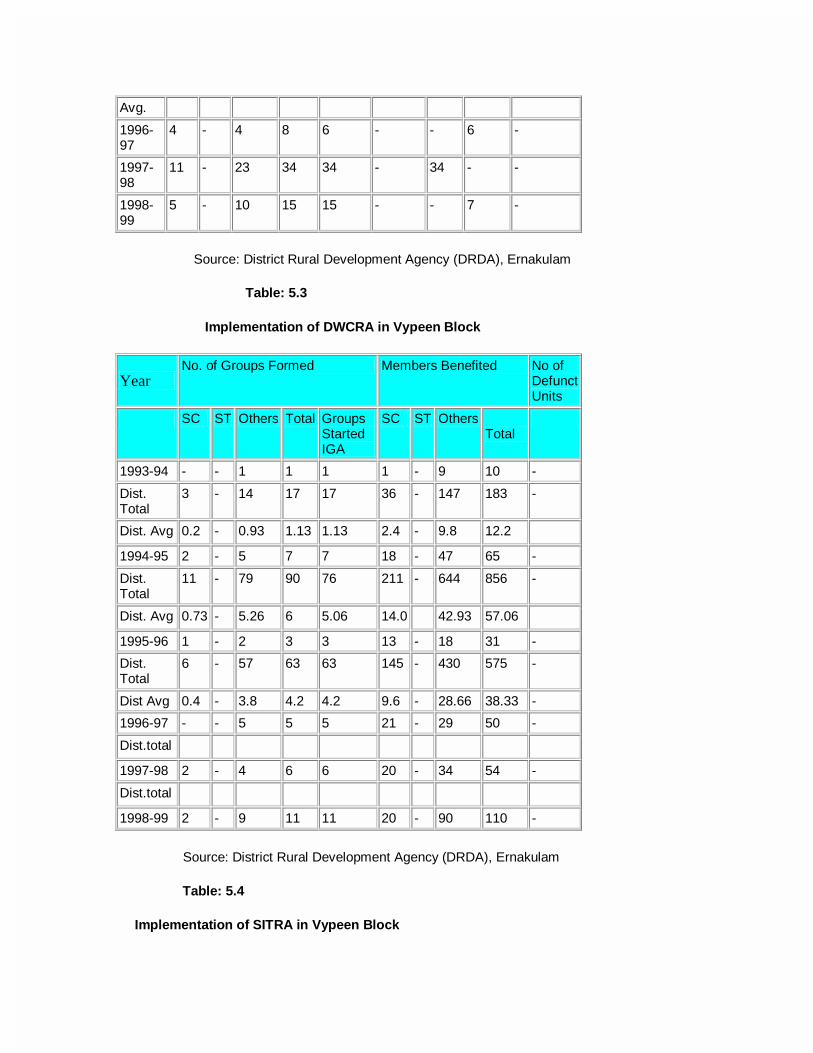
Table: 5.3
Implementation of DWCRA in Vypeen Block
Year No. of Groups Formed Members Benefited No of
Defunct Units
SC ST Others Total Groups Started IGA
SC ST Others Total
1993-94 - - 1 1 1 1 - 9 10 -
Dist. Total
3 - 14 17 17 36 - 147 183 -
Dist. Avg 0.2 - 0.93 1.13 1.13 2.4 - 9.8 12.2
1994-95 2 - 5 7 7 18 - 47 65 -
Dist. Total
11 - 79 90 76 211 - 644 856 -
Dist. Avg 0.73 - 5.26 6 5.06 14.0 42.93 57.06
1995-96 1 - 2 3 3 13 - 18 31 - Dist. Total
6 - 57 63 63 145 - 430 575 -
Dist Avg 0.4 - 3.8 4.2 4.2 9.6 - 28.66 38.33 - 1996-97 - - 5 5 5 21 - 29 50 -
Dist.total
1997-98 2 - 4 6 6 20 - 34 54 -
Dist.total
1998-99 2 - 9 11 11 20 - 90 110 -
Source: District Rural Development Agency (DRDA), Ernakulam
Table: 5.4
Implementation of SITRA in Vypeen Block
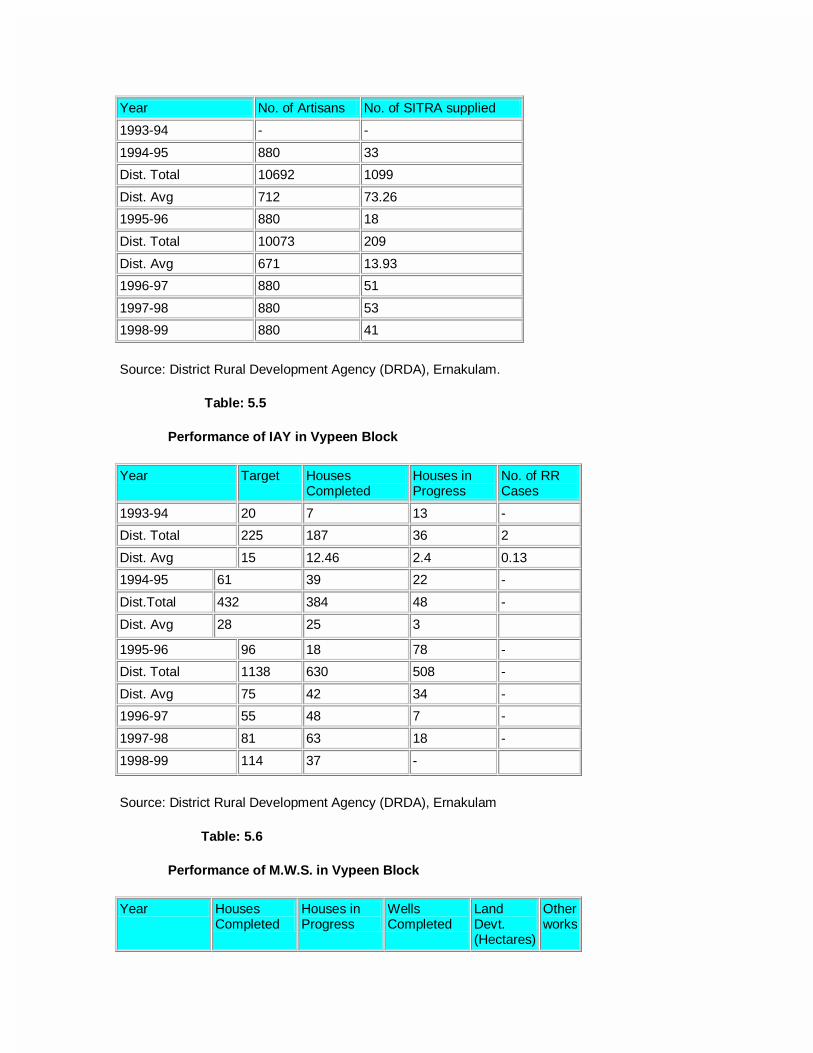
Year No. of Artisans No. of SITRA supplied
1993-94 - -
1994-95 880 33 Dist. Total 10692 1099
Dist. Avg 712 73.26 1995-96 880 18
Dist. Total 10073 209
Dist. Avg 671 13.93 1996-97 880 51
1997-98 880 53 1998-99 880 41
Source: District Rural Development Agency (DRDA), Ernakulam.
Table: 5.5
Performance of IAY in Vypeen Block
Year Target Houses Completed
Houses in Progress
No. of RR Cases
1993-94 20 7 13 - Dist. Total 225 187 36 2
Dist. Avg 15 12.46 2.4 0.13 1994-95 61 39 22 -
Dist.Total 432 384 48 -
Dist. Avg 28 25 3
1995-96 96 18 78 - Dist. Total 1138 630 508 -
Dist. Avg 75 42 34 - 1996-97 55 48 7 -
1997-98 81 63 18 -
1998-99 114 37 -
Source: District Rural Development Agency (DRDA), Ernakulam
Table: 5.6
Performance of M.W.S. in Vypeen Block
Year Houses Completed
Houses in Progress
Wells Completed
Land Devt. (Hectares)
Other works

1993-94 14 9 - - -
Dist. Total 224 39 47 5.68 7 Dist. Avg 14 2 3 0.37 0.46
1994-95 12 16 - 11 - Dist. Total 244 52 37 20 16
Dist. Avg. 16.26 3 2 1 1
1995-96 23 5 - - - 1996-97 - - - - -
1997-98 - - - - - 1998-99 (Spill over
cases) 13 26 - - -
Source: District Rural Development Agency (DRDA), Ernakulam
Table: 5.7
Implementation of J.R.Y. in Vypeen Block
Year Roads Kms
Houses in completed no.
Sanitary Latrines no.
Drinking water Wells
Irrig. Wells Nos
Irrig. Tanks Nos
School Bldgs. No.
Empt. Generated (Mandays)
1993-94
5.260 21 94 - - - - 0.57
Dist. Total
139.096 534 488 8 12 9 - -
Dist. Avg
9.27 35.6 33 1 1 1 - -
1994-95
3.610 47 89 8 - - - 0.880
1995-96
3.800 34 55 9 - - - 0.430
Dist. Total
78.519 489 511 22 14 7 - 2.633
Dist. Avg
5.23 33 35 1 1 1 - 0.17
!996-97
- - - - - - - -
1997-98
12 24 - - - - -
1998-99
- - - - - - - -
Source: District Rural Development Agency (DRDA), Ernakulam
Table: 5.8

Performance of CRSP in Vypeen Block
Year Target No. of Latrines Constructed
SC ST Others Total
1993-94 89 32 - 57 89 Dist. Total 1012 269 1 742 1012
Dist. Avg. 67.46 17.93 0.06 49.46 67.46 1994-95 60 26 - 34 60
Dist. Total 726 219 - 507 726 Dist. Avg 48.4 14.6 - 33.8 48.4
1995-96 61 24 - 37 61
Dist. Total 881 253 3 625 881 Dist. Avg 58.73 16.86 0.2 41.66 58.73
1996-97 49 12 - 37 49 1997-98 57 14 - 43 57
1998-99 48 7 - 41 48
Source: District Rural Development Agency (DRDA), Ernakulam
The physical and financial figures on anti-poverty programes themselves do not explain how these programmes have contributed to a structural change in the rural economy of Vypeen. What is more important are: (1) how the new assets created perform in offering a flow of services to the people whom they are meant for; and (2) to what extent the new employment created has led to a structural change in the overall position of household income, savings and investment. An understanding of these aspects requires a more detailed analysis of income flows and assets created. This has been attempted in the subsequent chapters.
2.1.1. Implementation of SGSY
The congruence two factors, the newly initiated SGSY programme, as well as the new planning methodology adopted by the State, should offer considerable hopes for the design and implementation of rural development programmes in a novel way. Viewed from this angle, we made an indepth study of selected Activity Clusters identified by the Block under the SGSY. The following Activity Clusters were selected for the study.
Table: 5.9
SGSY Clusters in Vypeen
Cluster Location
1. Assembling of Umbrellas Narakkal
2. Fishermen's Collective Nayarambalam 3. Handlooms Nayarambalam
4. Handicrafts Pallipuram

The leaders as well as members of these clusters were interviewed with the help of a structured interview schedule. Besides, qualitative data also were collected. Our broad findings are as follows:
The Block officials are ignorant of the perspective that guides SGSY. It was pointed out that SGSY as a new programme is complex and difficult to implement.
The Block officials consider this programme just as another version of the erstwhile programmes. The selection of programme beneficiaries and the implementation of the programme has substantial adhocism. Most of the activity clusters identified so far, are erstwhile DWCRA units or cooperatives (eg., Umbrella-making unit at Narakkal)
The new programme entrusts greater responsibilities on the Block staff in identifying potentially viable activity clusters. However, these officials preferred to play safe by selecting only the so-called "proven clusters ".
2.2. Health
Considering the ecological and environmental features of the village as well as its high density of population, Vypeen has a record of high vulnerability to contageous diseases. While the situation was graver until 1960s, it has improved since. However, an outbreak of Cholera in 1982, costing the lives of 73 persons has been recorded during the modern times. According to the records of the Department of Health, no such major outbreak has been recorded since 1982, though cases like Cholera, Jaundice, Typhoid and Dungy Fever have been recorded off and on.
Though environmental factors significantly influence the overall health status of the community, the development strategy in the health sector has been largely geared to setting up of infrastructure such as hospitals. Details regarding such infrastructure available in the village are given in the following table.
Table: 5.10
Medical Infrastructure in Vypeen
Name of Hospital/PHC No. of Doctors
Other Medical Staff
Community Health Workers
Other employees
Total
Government Hospital, Narakkal
3 21 - 5 33
Government Hospital, Ayyampilly
1 12 - 14 27
Government Hospital, Munambam
2 19 1 2 24
C.H.C., Malippuram 4 14 26 5 49
P.H.C., Edavanakkad 1 4 20 3 28 P.H.C., Nayarambalam 1 2 8 3 14
P.H.C., Puthuvyppe 1 1 8 3 13
P.H.C., Valarpadam 1 2 2 3 8 P.H.C., Mulavookad 1 2 6 3 12
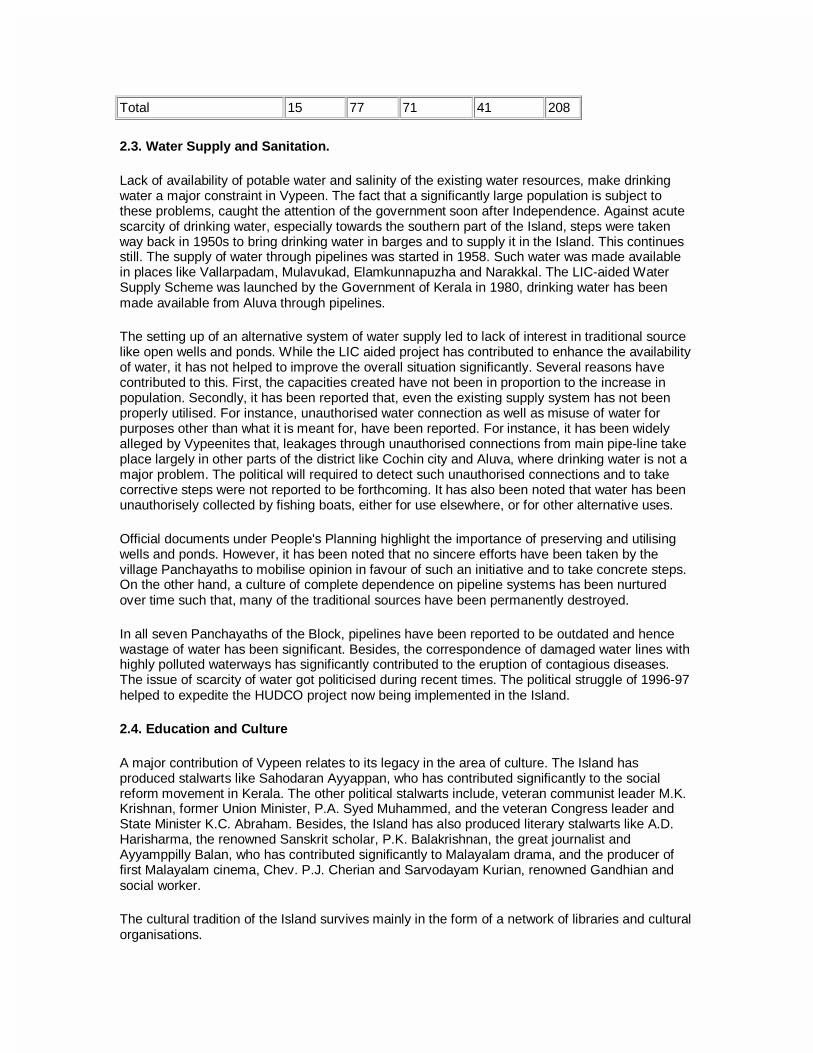
Total 15 77 71 41 208
2.3. Water Supply and Sanitation.
Lack of availability of potable water and salinity of the existing water resources, make drinking water a major constraint in Vypeen. The fact that a significantly large population is subject to these problems, caught the attention of the government soon after Independence. Against acute scarcity of drinking water, especially towards the southern part of the Island, steps were taken way back in 1950s to bring drinking water in barges and to supply it in the Island. This continues still. The supply of water through pipelines was started in 1958. Such water was made available in places like Vallarpadam, Mulavukad, Elamkunnapuzha and Narakkal. The LIC-aided Water Supply Scheme was launched by the Government of Kerala in 1980, drinking water has been made available from Aluva through pipelines.
The setting up of an alternative system of water supply led to lack of interest in traditional source like open wells and ponds. While the LIC aided project has contributed to enhance the availability of water, it has not helped to improve the overall situation significantly. Several reasons have contributed to this. First, the capacities created have not been in proportion to the increase in population. Secondly, it has been reported that, even the existing supply system has not been properly utilised. For instance, unauthorised water connection as well as misuse of water for purposes other than what it is meant for, have been reported. For instance, it has been widely alleged by Vypeenites that, leakages through unauthorised connections from main pipe-line take place largely in other parts of the district like Cochin city and Aluva, where drinking water is not a major problem. The political will required to detect such unauthorised connections and to take corrective steps were not reported to be forthcoming. It has also been noted that water has been unauthorisely collected by fishing boats, either for use elsewhere, or for other alternative uses.
Official documents under People's Planning highlight the importance of preserving and utilising wells and ponds. However, it has been noted that no sincere efforts have been taken by the village Panchayaths to mobilise opinion in favour of such an initiative and to take concrete steps. On the other hand, a culture of complete dependence on pipeline systems has been nurtured over time such that, many of the traditional sources have been permanently destroyed.
In all seven Panchayaths of the Block, pipelines have been reported to be outdated and hence wastage of water has been significant. Besides, the correspondence of damaged water lines with highly polluted waterways has significantly contributed to the eruption of contagious diseases. The issue of scarcity of water got politicised during recent times. The political struggle of 1996-97 helped to expedite the HUDCO project now being implemented in the Island.
2.4. Education and Culture
A major contribution of Vypeen relates to its legacy in the area of culture. The Island has produced stalwarts like Sahodaran Ayyappan, who has contributed significantly to the social reform movement in Kerala. The other political stalwarts include, veteran communist leader M.K. Krishnan, former Union Minister, P.A. Syed Muhammed, and the veteran Congress leader and State Minister K.C. Abraham. Besides, the Island has also produced literary stalwarts like A.D. Harisharma, the renowned Sanskrit scholar, P.K. Balakrishnan, the great journalist and Ayyamppilly Balan, who has contributed significantly to Malayalam drama, and the producer of first Malayalam cinema, Chev. P.J. Cherian and Sarvodayam Kurian, renowned Gandhian and social worker.
The cultural tradition of the Island survives mainly in the form of a network of libraries and cultural organisations.

Table: 5.11
Libraries in Vypeen
Name of the Library Year of establishment
Grade No. of Members No. of Books
Grammena Vayanasala, Panambukad
1940 C 1020 4485
AKG Vayanasala, Mulavukad
No information
Ashan Samara Public Library, Ochanthuruth
1922 A 320 14800
Ajantha Library, Malippuram
1982 D 99 3200
Aliyar Samaraka Vayanasala, Malippuram
1968 B 246 6449
Kasthurba Samaraka Vayanasala, Elamkunapuzha
1958 A 350 12738
Narakkal Panchayath Kendra Grantashala, Narakkal
- A - 9600
Veenjann Bhavan Vayanasala, Nayaramablam
1976 E 98 2200
Grameena Vayanasala, Nayarambalam
1931 A 150 8212
S.P. Mukherjee Samaraka Vayanasala, Nayaramablam
1953 A 237 8670
Cherai Public Library 1914 A 450 15215
Janatha Vyanasala, Pallipuram
1952 B 330 8000
Table: 5.12
Social and Cultural Institutions (in numbers)
Block Library Reading Rooms
Cinema Theatres
Auditori -ums
Places of Worship
Angana -wadies
Bala -wadies
Pre-Primary Schools
Vypeen 16 23 11 12 118 105 2 31
Dist. Total
303 313 84 104 1549 403 278 225
20.2 20.86 5.6 6.93 103.26 26.86 18.53 15

Average
2.5. Social Welfare Programmes.
As Vypeen stands first in the District in terms of the percentage of population below the poverty line, social welfare activities assume particular significance. Public programmes in this area form broadly of two categories: (1) programmes targeted to women and children; and (2) special programmes for SC/ST communities. The following table gives an indication of infrastructure available in this area.
Table: 5.13
Aganwadis in Vypeen
Gram Panchayath No.of Aganwadis
With Own Bldg. Without Own Bldg
Total
Mulavookad 4 9 13
Elamkunapuzha 5 21 26
Narakkal 6 8 14
Nayarambalam 9 5 14
Edavanakkad 8 5 13
Kuzhuppilly 9 3 12
Pallipuram 18 9 27
Block Panchayath 59 60 119
Among the other welfare programmes include, the specific economic programmes targeted to women. Training and support services for women have appeared prominently in the Plan documents of all Gram Panchayaths. Unfortunately, the vital linkages are often missing. For instance, in one of the Panchayaths 50 women were trained in a particular trade called manufacturing of electronic chokes. It has been indicated that none of these trainees have been sticking on to their area of expertise, nor have they been provided escort services.
In the new approach to planning in Kerala, projects/programmes relating to the welfare of SC/STs have been given a special status and thrust. Traditionally, occupation-wise, the SC/ST communities are largely agricultural labourers. Of these, paddy cultivation provided employment to a significant extent. While the area under paddy as well as employment therein has significantly come down during recent times, other activities like fish and crab culture which substituted it, are not capable of compensating this decline.
While political and administrative compulsions have necessitated earmarking a fixed portion of Plan funds for the welfare of these communities, there has not been serious effort to chalk out sustainable strategies and programmes. Naturally, there has been significant misutilisation of funds as evident from our field investigation. Besides, most of Gram Panchayaths have spent the bulk of such funds for training activities.

Another crucial area of programmes targeted to the SC/ST communities is the anti-poverty programmes.
Table: 5.14
Financial Allocations under Anti-poverty Programmes for SC/STs. - 1997-98
(in lakhs)
Scheme Block Contribution Allocation of fund to SC/STs
% of fund
IRDP 2,57,600 1,28,800 50
TRYSEM 1,10,000 55,000 50 IAY 2,06,800 1,25,400 60
MWS 8,55,500 5,51,740 67.33 JRY 3,02,400 68,040 22.5
CRSP 92,000 28,000 30%
3.0. Economic Programmes
The economic programmes are, general programmes which are meant for the overall economic development of the region, though such programmes may have an indirect distributional impact in the community. We may broadly include the following under this category: (a) agriculture; (b) industries; and (c) fisheries.
3.1. Agriculture
As we have already noted, Vypeen is a basically agrarian economy. The support programmes of the Government relating to agriculture need to be situated against the peculiarities of agricultural economy of the Island. The major peculiarities relate to the ecology itself, i.e., prominence of crops such as paddy and coconut, which requires proper irrigation. Vypeen has this natural advantage, as the whole area is connected with waterways large and small which inturn, are connected with the sea. The direct inlet of saline water at the village Puthuvype, prevents paddy cultivation here. This ecological peculiarity facilitates a diversified development of the agricultural sector. During the off-season, fish culture is made possible.
Despite the opportunities, agriculture remains stagnant in the Island since 1970s. The enactment of land reforms in 1970, and its faithful implementation resulted in access to land ownership for a large number of tenants. The small plots, which, a large number of tenants got entitled, have not been properly cultivated. Besides, the large farmers lost much of their interest in cultivation, due to several reasons such as high cost of production and lack of remunerative prices for agricultural products like paddy and coconut, enhanced vulnerability of crops like coconut to diseases. This situation led to some forms of absentee landlordism by which the farmers increasingly lost interest in periodic maneuvering and planned protection measures.
While cultivation of paddy become unremunerative, the mainstay of the agricultural economy of Island now is coconut. Hence the fulcrum of any agricultural development strategy in the Island need to be to enhance the productivity of coconut cultivation. This requires a sustained effort to maintain and improve agricultural practices according to the changing needs. While in the past cleaning of waterways and gathering of slurry implied an indirect maneuvering for coconut trees.

While an almost complete stoppage of this practice has resulted in a virtually demaneuvering process as well as to several environmental problems arising out of blocked waterways. It has been noted by several experts that, a ground of the root-wilt disease itself can be explained in terms of such blockage of waterways.
Considering environmental and human geographic factors of Vypeen, it is vital to evolve relatively large agricultural development project with the active involvement of governmental agencies. While the Gram Panchayath have several constraints, considering their limited resources and expertise, this task need to be performed by District Panchayath or directly by the agricultural department through non-plan funds. We have noted that no such important initiative has taken place in the recent past. Besides, much of the funding for agricultural developments in the are have been spread over several tiny projects, implies poor results. Besides, several of the conventional type of projects (eg. Promotion of vegetable cultivation) are not appropriate to the situation of Vypeen.
3.2. Industries
Though not far away from the Cochin-Aluva industrial belt, which is the largest of its kind in Kerala, Vypeen is industrially one of the most backward parts of Kerala. While, the locational disadvantages the private sector reluctant to invest in the Island, no worthwhile government programmes, has tried to explore the industrial potential of the Island. While the rich fishery resources could have made an equal chance for this Island to come up with other parts of Ernakulam, where the industry is concentrated, no such major initiative have come up in this area. A possible reason is the inadequacy of clear and safe drinking water as well as overall lack of sanitation facilities, which are vital for the industry to thrive. However, there are a few small fish processing units as well as ancillary industries like Iceplants. The governmental initiatives in the past have been largely as part of state level industrialisation programme, where there could be no reason why any single block can be left out. There is one industrial estate and 16 industrial cooperative society. The industrial cooperative societies are all in the traditional sectors like Coir, Handloom, Khadi and Village Industries, beedi and printing. The following table shows that, most of the existing industrial units are resource based with primitive technologies and offering very limited linkages.
Table: 5.15
Industrial Enterprises in Vypeen Block
Sl.no Industrial units No. of units
1 Fish Processing Units 79
2 Peeling Sheds 112
3 Ice Plants 51 4 Boat Yards 25
5 Fishery ancillaries 102 6 Flour Mills 68
7 Oil Mills 12
8 Bakeries etc 16 9 Cattle Feed 3
10 Handloom Co-operatives 3 11 Coir Products 8

12 Furniture Units 28
13 Saw Mills 15 14 Cements/Mosaic Units 25
15 Electronics Units 12 16 Garments Units 34
17 Candle manufacture 5
18 Others 162 Total 760
While the projects envisaged under the Plan of the Gram Panchayaths are of a highly repetitive nature, there has been very limited allocations under the state sponsored schemes for this Block. While the level of unemployment is exceptionally large in the Island, the subject has not been addressed to, any significant extent by the industries department of the Government of Kerala. While motivational activities like business awareness programmes, EDPs have been organised frequently in other parts of the state, no such initiative has taken place in the Island except for one EDP which was organised at Cherai in 1996. While, the importance of resource based rural industries have been cursorily treated in the Plan documents of the Block as well as of the Gram Panchayaths, such priorities have not been translated into practice through relevant agencies like the Khadi and Village Industries Commission/Khadi and Village Industries Board, Coir Board etc.
Though not directly addressed to the development imperatives of Vypeen Island, two major industrial initiatives deserves special mention: 1) the Container Terminal of the Cochin Port at Vallarpadam; and 2) the proposed Liquid Natural Gas unit at Puthuvyppu. While thse projects have been on their earlier stages of initiation, it has been noted that several problems cast doubts on their actual implementation.
3.4. Fisheries
The initiatives of the Government of Kerala in the Fisheries sector have been focussed on two crucial areas: registration of fishing villages; 2) distribution of fishing inputs to traditional fishermen; 3) creation of infrastructure such as construction of harbours , development of landing centres and setting up of Ice-plants and other infrastructure. The Fisheries Department has initiated registration of welfare socieits. The Island has 12,473 fishermen, among a total of 20,173 fishermen in the area. A major initiative of Government of Kerala has been the Munambam Fishing Harbour. Besides private harbours in Munambam and Murikkumpadam cater to the needs of mechanised fisheries. While the support given by Marine Products Export Development Authority has facilitated setting up of ancillary industries this has not helped significantly as designing peeling sheds, hygienic fish peeling activities. While there are 70 Ice -plants and 400 peeling sheds, this is not adequate considering requirements of the industry.
Another major area were initiatives have been made by the Central and State Government institutions has been fish culture. The activities of MPEDA, ADAC and BFFBA have helped to promote fish hatching activities both in the private and public sector. The experimental station of Indian Council of Agricultural Research at Narakkal as well as Krishi Vynjan Kendra have made some contribution to awareness building among fish farmers. However, the industrial use of fishing resources remains a totally neglected area, despite the presence of premiere institutions like Central Institute of Fisheries Technology and Integrated Fisheries Project in the nearby city.
Despite the significant initiatives of both the Government of India and State Government as outlined above, the trickle-down effect on the community has been found to be negligible. Our Team discusses in detail with officials of several of these institutions as well as with the

fishermen. The impression we gather is that the fishermen are not keen on adopting many of the new technologies initiated by the ICAR system. While many of these technologies are not significantly over the time-tested know-how and practices of the fishermen, it has also been noted that the extension services offered are of a continuous nature.
We have also noted that in some new areas (eg. Ornamental fisheries) new entrepreneurs have ventured without having any formal institutional support from governmental agencies. There has also been some changes in occupation pattern. For example, while prawn culture was basically an activity of medium and large farmers of the Christian community, this has undergone some change across the other communities.
4.0. Creation of Public Assets
In order to get a holistic view of the role of panchayaths, in relation to their leadership and credibility, details on public assets created by them during the Eighth and Ninth Five Year Plans were collected. Such data were gathered from the Assets Register (Work Book) of the relevant Panchayaths. The following tables indicate the progress of asset creation and the broad present status of these assets. Based on such information, our team made a physical verification of assets, which lead us the following conclusions:
The Development Reports of all the four Panchayaths rationalise the need for a significant portion of the plan resources for creation of public assets. However, the data available to us indicate that the public assets created during the Eighth and Ninth Five Year Plans form only a small portion of the allocations concerned. The bulk of the Plan outlay has been utilised on maintenance of assets and on expenses other than for assets creation.
The tables (annexure) indicate that the new assets created during Eighth Five Year Plan were totally insignificant, whereas, the Ninth Plan, with its new approach, has initiated creation of atleast some new assets. However, it is a matter of concern that most of these assets remain incomplete (eg., Gowriswaram South-Line Road, Pipelines in Pallipuram, bridge connecting Wards I & II of Nayarambalam Panchayath).
Even with a significant expansion of resources available with the Panchayaths under Peoples planning, maintenance expenses remain the most significant component and, expenditure on new assets created remains insignificant.
The above observations broadly suggest that, the will of the people, as reflected in the deliberations of the Gram Sabha, has not adequately got translated into concrete projects which assure a continuous flow of benefits to the people.
4.1. Performance of Public Assets
A physical verification of assets done by our team provides substantial insights into various aspects of programme implementation at the Panchayath level. Though our discussion in this report is confined to the four clusters, our findings, by and large, are applicable to Vypeen as a whole. Our observations may be discussed broadly under the following heads:
4.1.1. Public Agenda and Action
The meaningfulness of a public asset depends largely upon the flow of income that it may create over the years. Such income is both qualitative and quantitative. We have noted that there is an inadequate effort to link the assets created, with the expected ultimate income contributions. For instance, construction of a road requires that it should provide a continuous flow of services to it

users over a period of time. Hence, keeping a road open without finding adequate allocations for its maintenance as well as provision for a few culverts which are vitally needed, alternatively means that the efficiency of the assets is stolen away. This also implies questions of investment criteria.
The pattern of assets creation over the two Plan periods and their economic performance indicates a crucial mismatch between the aspirations of the people vis-à-vis what has been realised in the form of assets. For instance, allocations have been made by all the Panchayaths for cleaning the drainage. The drainages remain full, though the allocations have been utilised. However, the explanations given by the Panchayath is that the cleaning work has been done only during the rainy season, because during rains, cleaning is "easier". Such a uniform explanation by all the Panchayaths raise questions as to how they respond to the wisdom of the Gram Sabha. It is important to note that the Development Reports of all the Panchayaths have identified bad environment as a crucial problem, and have identified improper drainage as the villain.
4.1.2. Perception in Public Assets
Conventionally, in most discussions on public assets, there is largely as an engineering concept behind . For example, school buildings have been constructed in various parts of Kerala as well as in Vypeen, without regard to the basic comforts required for their inhabitants, ie., teachers and students. The concept of a school building does not often include an airy space for children to take rest or to play, shelves for keeping books, food-packets etc. There has been too much of conceptual rigidity which prevents any sort of informal mingling between teachers and the pupil. Such perception was observed in the case of construction of shopping complex by two of the Panchayaths also. Shops have been built on some arbitrary criteria relating to the size and facilities and are rented out at nominal rates, which in no way reflect the market rate. It is also important to note that, the subsidy thus given is enjoyed largely by well-to-do people, who manages to rent-in the shops. The same perception applies in the case of other civil constructions like construction of an office for the Krishi Bhavan, and for a Veterinary hospital. While the services offered by the Krishi Bhavan and the Veterinary hospital remains much to be desired and that the functions of these offices have been conceptually meant to be more field-oriented, it is difficult to rationalise such investment. However, there have also been encouraging initiatives where support has been given for renovation of a public library by Nayarambalam Panchayath.
4.1.3. People Initiative Vs Panchayath Initiative
During the 1950s and 1960s the initiative of the Panchayath had only a supportive role in relation to such initiatives by the people. Our experience from Vypeen indicates that the process has been significantly eroded. While, public wells were the original source of drinking water in the Island, the introduction of water supply system implied access to safer drinking water. The secondary demand that was generated implied an enhanced use of tap-water even for purposes other than drinking. The problem of acute scarcity in drinking water resulted in.
We have noted cases where water supply installations have been completed for the Public Health Centre at Nayarambalam during 1998-99; but the water requirements are still met from an open well . Part of the drinking water requirements are met from the nearby public-tap which is also not a reliable regular source.
There are also cases where, the people have initiated developmental activities at their own cost without any support from the Panchayath. The teachers of the Government New L.P School at Elamkunnapuzha constructed a compound wall at their own expense during the year 1999-2000. Similarly, the teachers of another School at Elamkunnapuzha, the Government L.P. School,

complained that it is rather difficult to get any funds from the Panchayath for maintenance of school buildings.
4.1.4. Mismanagement
Our physical verification of assets indicate several anomalies regarding their performance. Some of the assets that have been completed long back, remain unutilised (eg. burial ground in ward-V and Television set in the same ward at Elamkunnapuzha; Pipeline in Pallipuram; around 315 public watertaps in Elamkunnapuzha). Similarly, several roads which have been completed recently, remain unmotorable (A.K. Mohanan Road and Mosque Road East at Pallipuram).

Employment, Income and Asset Creation
1.0. The Framework
Rural poverty like in other parts of the country, is a major problem in Kerala. The limited absorptive capacity of the agricultural sector, to a large extent, explains the incidence of rural poverty. Therefore, in order to reduce unemployment and underemployment, it is necessary to add to this absorptive capacity through external interventions. Attempts to create additional wage employment in agricultural and agro-related rural works, and self-employment schemes in the rural-non farm sector are such external interventions. While the former is a short-run strategy, the latter one indirectly attempts at removing poverty through sustainable income-generating activities. Despite the differences in approach, the primary objective of both types of programmes is to remove the extent of poverty. If this objective is not met with, the programmes lose their meaningfulness. This Chapter attempts to analyse some of the major structural variables. While, to a large extent, explain how the several government programmes have fared on in the Island. While on some of the crucial variables such as employment and income, a comparative static picture is available, a still picture, based on cross-sectional data, are available on others.
To assess the overall impact of several anti-poverty programmes, it is necessary to view them form two major angles: 1) their contribution to the beneficiary households; and 2) the structural changes it may trigger in the economy, and regional economy in specific. While the former category includes a few variables such as, household income, investment, savings and the wage income/asset income mix. A direct enhancement of household income will have an impact on consumption, savings and investment, to a possible long-run structural change within the household itself. Structural changes within the economy occur through the backward and forward linkages that the new activities may generate. This include an enhanced demand for inputs including labour, as well as an enhanced market for wage goods, it may be generated through the additional income that may be created in the regional economy.
2.0. Employment: Structure and Changes
The existing structure of employment in the regional economy of Vypeen is dependent on the non-farm activities that have come up in the recent past. An analysis of the employment structure indicates that wage labour and non-farm activities contribute significantly to the survival of the majority of poor households.
Table: 6.1
Annual Employment and Earning Pattern of Respondents.
Occupation No. of Respondents
Average Days of Work
Average Annual Income From Main Occupation (Rs)
Barber 1 312 9360
Carpenter 11 179 25418
Casual Labour 30 110 12100
Coir Worker 2 180 13140
Fishing 7 173 12712
Maison 12 160 23981

Petty Shop 7 264 11843
Domestic Servant 3 110 5500
Skilled Worker 6 183 21887
Pensioner 5 - -
Sick/Aged Population
13 - -
Unemployed 3 - -
Total 100 186 15105
Table: 6.2
Change in Average Annual Working Days and Daily Earnings of Respondents
Occupation Days of Work Daily Earnings (Rs)
95-96 98-99 99-00 CGR 95-96 98-99
99-00 CGR
Barber 312 312 312 0.00 30 30 30 0.00
Carpenter 173 174 179 1.14 110 130 143 9.14
Casual Labour 117 117 111 -1.74 75 77 81 2.60
Coir Worker 90 90 180 25.99 40 40 73 22.20
Fishing 179 184 173 -1.13 76 74 79 1.30
Maison 171 135 160 -2.19 113 134 150 9.90
Petty Shop 282 255 264 -2.17 33 34 44 10.06
Domestic Servant
113 120 110 -0.89 27 28 33 6.92
Skilled Worker 182 180 183 0.18 80 93 97 6.63
Average 180 174 186 2 65 71 81 8
Table: 6.3
Change in Average Annual Working Days and Daily Earnings of Earning Members
Occupation Average Working Days Average Daily Earnings
95-96 98-99 99-00 CGR 95-96 98-99 99-00 CGR
Carpenter 129 131 188 13.38 68 80 111 17.74
Casual Labour
142 135 121 -5.19 58 80 97 18.70
Dairy 365 365 365 0.00 115 95 85 -9.59
Fishing 123 96 123 0.00 43 60 61 12.36

Maison 147 140 160 2.86 20 30 57 41.78
Painting 80 130 177 30.31 63 103 117 22.92
Peeling 30 118 120 58.74 4 17 22 76.52
Private Job 73 287 287 57.83 29 67 70 34.14
Servant 340 340 340 0.00 40 40 40 0.00
Skilled 108 154 169 16.10 68 70 80 5.57
Sweeper 300 300 300 0.00 46 46 46 0.00
Tailoring 90 78 55 -15.14 23 35 25 2.82
Average 160.58 189.50 200.42 13.24 48.08 60.25 67.58 18.58
The comparative statistics of employment between 1995-96 and 1999-00 provides some broad indications on the form of structural changes that have taken place over time.
Table: 6.4
Pattern of Average Household Income
Sources of Income
Scheme No of resp. Respondent Other Earning Members
Agri. Income
Others Total
CRSP 9 11579 6533 297 10446 28558 DWCRA 1 2200 26400 0 0 28600
IAY 19 8798 6720 704 3882 19400
IRDP 44 11881 8556 885 3029 23466 JRY 1 12000 31200 715 4800 48000
MWS 9 8247 7861 919 2037 18145 MYTHRI 10 6000 11713 235 2044 19757
SITRA 7 24414 13314 231 0 37728 Total Average
100 10640 14037 498 3280 27957
Table: 6.5
Share in Household Income of Respondents and other Earning Members
Scheme Household Income Share of Respondent Share of Earning Member
CRSP 28558 41 23
DWCRA 28600 8 92
IAY 19400 45 35 IRDP 23466 51 36

JRY 48000 25 65
MWS 18145 45 43 MYTHRI 19757 30 59
SITRA 37728 66 36 Average 27898.75 38.88 48.63
Table: 6.6
Pattern of Age/Education of Other Earning Members
Scheme Age Education
CRSP 33 High-School DWCRA 50 Primary
IAY 41 Primary IRDP 34 High-School
JRY 25 High-School MWS 28 Primary
MYTHRI 42 Primary
SITRA 32 Primary
The above table indicates that the respondent's income form only 38.88% of the total household income. The antipoverty programmes have only the limited role of performing a largely supplementary supportive role rather than as a major inducement mechanism. It is important to note that a large number of beneficiaries are aged or infirm and their contribution to productive activities is negligible.
The low percentage contribution of the respondents income in total household income, has implications on the survival strategies of the household. The other members of the household have to perform a subsidising role. In performing this role, the other members are forced to join the labour market at a relatively early age. This, together with the poor economic status of the household results in a low level of education for these members. Table 6.6 shows that the average level of education in the clusters is only PRIMARY level. This contrasts very much with the situation which is relevant in other parts of the State. Our research in Idukki has shown that the percentage of respondents having education above primary level is as high as 73%. Even in Devikulam, the most backward area of Idukki district, the respondents below secondary level of
education is only 42%.

The relative stagnancy of average annual working days and average daily earnings of respondents are important observations which require special attention. The compound growth rate (CGR) for working days is 2%, whereas for earnings per day, the rate is 8%. This finding need to be related to the average age of respondents, which is 36. The broad implication is that, even after years of participation in the work-force, the process of graduation of labour into higher income-earning opportunities is negligible. This has been compensated by the subsidy added to household income by other members of the household. The respondent's meager income is supported by the income of other members. The implication of all these is that the income level of households remains absolutely low and household survival strategies are complex. These results also indicate that the average longevity of labour also is relatively low, probably because of adverse environmental factors.
A comparision of the findings emerging from the research at Idukki suggests some crucial differences. While in Idukki, agriculture contributes significantly to household income, in Vypeen these households are almost exclusively dependent on wage income. However, the average household income in Vypeen remains larger than in Idukki. To what extent this higher household income is beneficial on a relative sense, need to be examined in relation to the expenditure pattern. While agriculture performs a subsidy function in the family budget, this role is totally absent where the households are exclusively dependent on wage income.
3.0. Income Behaviour
While employment is a spill-over of the process of investment and income generation, inorder to analyse its sustainability, it is necessary to analyse income changes in detail. A comparative static analysis of income structure may give insights into the relationship between income and employment.
Table: 6.7
Distribution of Annual Household Income
Income (Rs) Elamkunnapuzha Nayarambalam Narakkal Pallipuram Total < 10000 5 3 - 5 13 10000- 20000 9 8 7 7 31
20000- 30000 6 4 11 9 30
30000- 40000 3 7 3 4 17 40000- 50000 2 3 4 - 9
Total 25 25 25 25 100
This table indicates that the selection of beneficiaries fair in Vypeen. This may also be a reflection of the presence of large number of BPL households in the area. An analysis of the income distribution in Idukki, on the contrary, indicates anomalies in the selection of beneficiaries. Unlike in Idukki where approximately 33% of the respondents belong to the above BPL category, the respondent in Vypeen belong largely to the BPL category.

Table: 6.8
Share of Respondent's Income in Total Household Income
Respondent Category
Respondent Income
Household Income
% Share of Respondent
% Share of other Earning Members
DWCRA 2200 31600 7 92
IRDP 11881 21324 56 34
JRY 12000 43915 27 65 MWS 8247 17027 48 43
SITRA 24414 37960 64 36 Average 11748 30365 40 54
Note: Percentages cover only wage income
Table: 6.9.
Change In Household Income
Respondent Category Average Present Income (Rs)
% Change Over 3 Years
DWCRA 28600 37 IRDP 25457 23
JRY 48000 32 SITRA 37264 57
Average 34830 37
3.1 Dependency Ratio
While total household income gives an overall indication of living standards, a more meaningful measure is income related to dependency ratio. . If income changes have taken place significantly, and there exists a high pressure on household income in the form of a high dependency ratio, it means that the income effect is nullified.
Table: 6.10
Dependency Ratio of Households
Scheme Average Household Size
Average No. of Earning Members
Dependency Ratio
CRSP 5 2 60
DWCRA 5 2 60 IAY 5 1 80
IRDP 5 1 80

JRY 5 3 40
MWS 5 2 60 MYTHRI 5 1 80
SITRA 5 2 60 Average 5 1.75 65
Note: Dependency ratio is defined as the number of non-earning members on total household size.
Table: 6.11
Cluster-Wise Dependency Ratio of Households
Panchayath Average Household Size
Average Earning Members
Dependency Ratio
Elamkunnapuzha 5 1 80 Nayarambalam 4 1 80
Narakkal 5 2 60 Pallipuram 5 2 60
Average 5 1.5 70
The table 6.10 and 6.11 indicate a relatively high dependency ratio of 70%, which is even much higher that that of Idukki. This alarming figure shows that, irrespective of the programmes implemented by the various departments, sustainable employment as a major problem which has to be dealt with on a war footing.
4.0. Asset Creation
Assets are the outcome of past savings or are externally provided. A higher asset position enhances the household’s command over productive resources, which in turn, lead to future enhancement in income. Total assets per earning member, can be a meaningful indicator of this process.
The following table shows that average household assets is higher in the case of DWCRA beneficiaries, and lowest for IAY beneficiaries. Such results are as per our expectation, as being self-employment programmes, their beneficiaries should have some reasonable command over assets.
Table: 6.12
Structure of Assets And Debts of Sample Households (In Rs.000s)
Scheme No of Respondents
Avg. Asset Per Earning Member
Average Asset per Household
Average Debt (Rs.000's)
DAR
CRSP 9 72.95 113.8 10.78 9
DWCRA 1 122.65 245.3 9.8 5

IAY 19 54.02 79.41 12.66 28
IRDP 44 93.33 131.6 13.41 13
JRY 1 17.4 52.2 25 48
MWS 9 72.68 145.37 7.89 7
MYTHRI 10 127.96 153.55 9.75 13
SITRA 7 62.14 115.57 30.5 23
Total 100 623.13 1036.80 119.79 146
A comparison with the situation in Idukki suggests that command over assets do not equip the poor of Vypeen to improve their economic position over time. The average asset per household is relatively low. Likewise, the debt-asset ratio is relatively higher. This reflects on the composition of total assets as well. While in Idukki, productive land is the major form of asset, in Vypeen it is mainly land and houses. Hence, in the latter case of the latter, the flow of income is negligible, whereas in Idukki, land is an important source of income.
4.1 Disparities in Asset-base
Disparities in asset-base, to some extent, explain the disparities in income. This is because the second major source of income in poor households is assets. The following Lorenz curve gives a picture of asset disparities among households.
New assets created through anti-poverty programmes add to the existing asset position of households, and one would expect that they may generate new income which will add to the current income of households.
Asset position in itself does not tell the full story. A more meaningful understanding of the role of assets require relating them with the debt position of the households. Therefore, debt/asset ratio provides a more meaningful explanation of how the assets of households fare in the present circumstances.
4.2 Morbidity and Mortality
An important objective of this study is to examine whether assets created under the various anti-poverty programmes have survived. While survival is a relative concept, it is more important to examine the extent of morbidity/health status of these assets. In this section we propose to examine only those assets which are functional atleast to some extent.
The following table gives an indication on absolute sickness versus survival in the case of assets created under IRDP.
Table: 6.13
Assets under IRDP Programme
Scheme No. of Assets
Created Survived
Value of Assets(Rs.)
Survival Rate(%)
Barber 1 1 15000 100

Carpenter 6 4 25000 67
Fishing 7 5 8550 71
Petty Shop 11 7 18000 64
Agriculture/Dairy 4 1 12800 25
Workshop/Auto 8 4 12400 50
Painting Unit 4 0 12000 0
Tailoring Unit 3 0 15000 0
Average 6 3 14844 47

The fact that more than one-tenth of the assets created have already been exchanged, and that a significant portion of the remaining ones are totally sick in their performance, gives a disquieting picture of the design and implementation of the antipoverty programme in Idukki district. This necessitates a further detailed look into their causatives.
An important point to be noted in this context is that the exchange of assets is the highest in the relatively less developed Blocks. This corresponds to the higher levels of anomalies we have observed in programme implementation in these Blocks. In the case of number of sick assets also, the same behaviour pattern is observed.
5.0. Indebtedness
The overall balance of survival and survival strategies is a crucial concern of our study. While many studies on poverty and rural development focus on the indebtedness as an absolute factor,

in the present study, we would like to examine it terms of its two dimensions: (a) endogenous dependency; and exogenous dependency. Endogenous dependency (measured by dependency ratio) is a crucial factor influencing the viability and sustainability of households. Exogenous dependency, on the other hand, is the excess of debts which the households have on their assets. While both forms of dependency influence the viability, it is important to examine the structure of such dependency.
Table: 6.14
Distribution of Earning and Non-Earning Members
Scheme Name Household Size
Earning Members
Children/ Non-Earning Members
Aged
CRSP 5 2 0 3
DWCRA 5 2 2 1
IAY 5 1 1 3
IRDP 5 1 1 3
JRY 5 3 0 2
MWS 5 2 1 2
MYTHRI 5 1 1 3
SITRA 5 2 1 2
Average 5 2 1 2
The table above on the age status of non-earning members gives an alarming picture. The data apparently shows that the small family norm has been picking up among the poor households. On the other hand, the earning members bear the burden of supporting an exceptionally large number of old and unhealthy members, with negative implications on the household budget. This adds significantly to the debt position of the household.
The results relating to expenditure pattern of the household is much more revealing. The following table shows that expenditure on health-care is much crucial in the household budget. Spending 10.11% of the household income on health-care itself is something exceptional among poor households in other parts of Kerala. The other significant item is repayment of old debts (9.76%), which is also exceptionally high. All these get reflected in another crucial item as per Kerala standards: education of children. The budgetary share on education in this village remains relatively low as per the Kerala standards.
Table. 6.15
Expenditure Pattern of Households
Debt
Scheme Education Health Repayment
Amount % Amount % Amount %
CRSP 740 2.59 4733 16.57 2267 7.94

DWCRA 1050 3.67 4800 16.78 0 0.00
IAY 865 4.46 1263 6.51 2195 11.31
IRDP 680 2.67 1901 7.47 2045 8.03
JRY 580 1.21 2400 5.00 8400 17.50
MWS 707 3.90 2607 14.37 920 5.07
MYTHRI 850 4.30 1440 7.29 2352 11.90
SITRA 1029 2.76 2571 6.90 6086 16.33
AVERAGE 812.63 3.20 2714.38 10.11 3033.13 9.76
6.0 Overall Assessment
The broad conclusion emerging from this analysis is that the contribution of the government programmes, especially anti-poverty programmes, regarding asset creation in Vypeen is not significant. It has not led to a progressive enhancement of income levels as well as for reducing income disparities. Besides, asset creation has not helped most households to come out of the debt trap.

The Sustainability Question
1.0. Introduction
A basic principle of the theory of the firm is that, the economic activities initiated by it should, not only generate adequate income in the short-run, but also that, it should create adequate surpluses to be nutrient for future income. While the principle holds true in all cases, two catagories of factors are crucial: 1) objective factors; and 2) subjective factors. The surplus generated by the economic activities directly decides the sustainability of those activities. However, it is also important that adequate saving for investment is also maintained to save for future investment.
2.0. Perceptions
The perception of enterpreneurs indicate how an additional unit of income goes for consumption or investment. An analysis of average household consumption among different income groups indicates their relative perception on consumption versus investment. Savings-income ratio is an important indicator of the perceptions of households relating to present consumption as it is related to future consumption. Our analysis shows that, the level of savings is negligibly low for any reinvestment. This is also a reflection of the low level of income.
Table: 7.1
Savings-Income Ratio (SIR) of Beneficiary Households
Occupation Average Annual Household Income
Average Annual Household Saving
SIR
Barber 45000 750 1
Carpenter 36200 477 1
Casual Labour 22672 199 1
Coir Worker 24230 75 Neg
Fishing 19411 164 1
Maison 23117 802 3
Pensioner 25753 200 1
Petty Shop 20431 907 3
Servant 23507 167 1
Skilled Worker 31625 733 2
Average 27195 475 1.48
3.0. The Determinants of Sustainability
From the point of view of policy, it is necessary to understand the crucial variables explaining sustainability. An attempt was made to identify the relevant variables in this regard, and to perform a multiple regression exercise.

Sustainability demands that, with the creation of a new asset, the household income flows also get enhanced. A part of the new income is saved and get invested, to be of support to further income generation. In the following exercise, saving income ratio is the dependent variable. The independent variables are: 1) average days of work of the respondents; 2) wage rate/daily earnings; 3) education. The regression results indicate that, variables one and two alone play a significant positive role in adding to household savings. Alternatively, it means that, if daily wage rates and number of working days go up, the absolute income level of the household goes up, and savings is facilitated. But in reality, working days do not go up; changes in wages are significant also.
Table: 7.2
Multiple Regression Results
Summary Output F Of Regression Table
Regression Statistics
Multiple R 0.772810464
R Square 0.597236014
Adjusted R Square
0.355577622
Standard Error
5573.652163
Observations 9
ANOVA
df SS MS F Significance F
Regression 3 230327125 76775708.18 2.471406 0.17669726
Residual 5 155327992 31065598.43
Total 8 385655117
4.0. Transaction Costs
In most discussions on sustainability, economic costs and returns alone are taken into account. On these basic premises, productivity enhancing measures have been discussed. In the case of anti-poverty programmes, however, consideration of direct costs per se is not enough to assess their sustainability. Transaction costs, play a significant role in explaining the meaningfulness of these programmes .
It is difficult to estimate the transaction costs involved in a project/activity, since, such costs are distributed over a variety of items, which, most respondents may not even like to disclose. However, within several constraints, an attempt was made to collect such information as realistically as possible. An examination of this variable in relation to several others, shows results which raises valid questions on the role and relevance of anti-poverty programmes as they have been implemented in Idukki district.
Table: 7.3

Project Transaction Costs of Households
Scheme Name Loan Amount Transaction Cost Percentage Cost on Loans
CRSP 7389 206 3
DWCRA 15000 500 3 IAY 19916 381 2
IRDP 13680 325 2
JRY 4000 50 1 MWS 5089 264 5
MYTHRI 14850 479 3 SITRA 7500 241 3
Average 10928 306 2.8
The very purpose of anti-poverty programmes is to reduce extreme forms of poverty. While it does not attempt at poverty eradication altogether, the success of these programmes in their mission depends upon how quickly and easily they reach the poor people whom they are meant for. However, the very fact that an average of 8% of the project cost is borne as transaction costs partially explains why these programmes have only limited success.
5.0. General Vulnerability: The Quest for Alternative Policy Initiatives
Our discussion in Chapter-4 probes into the utility of a cluster approach to dealing with the problem of rural under- development and poverty. This discussion has been situated in the context of the rural development programmes as they have been implemented, as well as the new policy thrusts of the Ministry of Rural Development, where, activity clusters are the focal point of development action.
As we have noted in Chapter-4, our thrust on clusters has been based on the observed phenomenon of location-specificity of poverty. The presence of location specific poverty, however, need not imply some homogenous behavioural pattern for these clusters. In an attempt to explore a behavioural pattern, we attempted an ANOVA test. The following variables were used for the test:
X1 Number of earning members in the household.
X2 Level of education
X3 Age
X4 Annual number of working days.
X5 Daily earnings.
The average values of the variables under consideration are given in the following table:
Table: 7.4

Region-wise Details of the Clustering Variables
Variables Elamkunnapuzha Nayarambalam Narakkal Pallipuram
X1 1 1 2 2
X2 6 5 6 5
X3 50 46 47 52
X4 121 130 127 117
X5 76 76 94 57
Table: 7.5
Anova Table
SUMMARY Count Sum Average Variance
Row 1 4 6 1.5 0.333333333
Row 2 4 22 5.5 0.333333333
Row 3 4 195 48.75 7.583333333
Row 4 4 495 123.75 34.25
Row 5 4 303 75.75 228.25
Column 1 5 254 50.8 2512.7
Column 2 5 258 51.6 2876.3
Column 3 5 276 55.2 2994.7
Column 4 5 233 46.6 2203.3
Table: 7.6
ANOVA
Source of Variation
SS df MS F P-value F crit
Rows 41722.7 4 10430.675 200.172877 7.16E-11 3.25916
Columns 186.95 3 62.31666667 1.195905965 0.352894 3.4903
Error 625.3 12 52.10833333
Total 42534.95 19
The ANOVA results, as shown above, indicates only negligible inter-variation among the variables. Alternatively, this indicates lack of intra-cluster consistency and homogeneity, which one would expect under a cluster approach.

The result, as given above, has significant policy implications. The state of absolute poverty among all sections of the poor, irrespective of their locational and occupational specificities, implies that, small individual-oriented projects are not likely to make any significant sustainable impact. Alternatively, this indicates that efforts of a critical minimum effort alone can be helpful in making any significant developmental impact. Linking the Island with the mainland through a bridge, massive efforts like clearance of waterways, construction of roads, comprehensive sanitation and water-supply schemes etc., are important to make any sustainable impact even on the present individual oriented development programmes.
6.0. Transparency
Improper maintenance of records relating to anti-poverty programmes is a wide-spread problem in most states. This has been noted in several evaluations reports of these programmes. We have noted that, none of the Panchayaths in our area of investigation maintain such records, especially the muster rolls, properly. While some of the Panchayaths were reluctant to show us the muster rolls, and for which cited some reason or the other, others did not even know that irrespective of the guidelines given under people's planning, the Panchayaths are bound to keep such records, under stipulations from the Ministry of Rural Development.
The reasons why Panchayaths try to manipulate accounts relating to the Rural Development Programmes need to be looked into. In many cases, the wages stipulated by the Ministry of Rural Development do not in any way agree with the market wages, and therefore, it alternatively compels the Panchayaths to manipulate the accounts. Whatever be the reasons, under an innovative model like people's planning, were the people are expected to be more participative in planning and programme implementation, such things need to be made more transparent. It may also be suggested that, taking into account the specific situation of states, the guidelines of the Ministry of Rural Development may be made more flexible.

Issues of Governance
1.0. Background
The specific features of Vypeen, both geographic and human geographic, as well as its historical legacy, has moulded the behaviour of the people of the Island. The people of the Island as well as those from outside alike agree that it is an agitating community. Such an agitating spirit should naturally lead to an active process of conscientisation as well as immediate response to problems. Unfortunately, these have not borne fruit.
It is necessary to look into this paradoxical situation. One plausible reason is that, the political leadership of the Island has not been successful in chalking out a development agenda, which, with the active support of the people could be put forth. On the other hand, no radical political movements, apart from narrow party politics, has not emerged, in order to make a qualitative change in the existing order of things. While the objective background for such a movement is present, because wide disparities in income between the rich and poor exist, such objective ground has not got translated into radical political and economic action. In fact, the overall deprivation of the Island in the areas of health, environment and infrastructure has enveloped the local issues of inequality in income and wealth. This, in turn, created a sense of helplessness in dealing with wider developmental issues.
The Gram Sabha, which is supposed to perform an active role in articulating issues and coming out with concrete suggestions, has been found to be a very ineffective forum. Participation in the Gram Sabha was even much lower than the ten-percent norm stipulated. Even the limited participants were largely interested in gaining individual benefits rather than in raising local issues. While they look at the Panchayath for any sort of benefits and incentives, most of the respondents whom we met did not find any need for a more favourable attitude from the State or the central government in dealing with the developmental issues of the Island. During our discussions with the people's representatives at the Panchyath level, many of our respondents did not agree with any 'step-motherly' treatment from the Government of Kerala.
Our field research indicates that, a parasitic developmental culture has been deep-rooted in the minds of the people in general, whereby the Gram Panchayath have been overburdened in their activities. While several of the developmental activities could be successfully implemented only with the active participation of the people at the ground level, it was noticed that, initiatives of this kind have not been taking place to a significant extent. On the other hand, there has been a mishandling of the situation: the people's representatives keep an antagonistic relationship with the Panchayath bureaucracy. The Panchayath bureaucracy, on the other hand, complained inadequacy of staff in carrying out the day-to-day activities of the Panchayath. It has, however, been observed by our team, that the staff do not have necessary expertise to carry out their normal duties efficiently in a situation of high density of population and associated problems.
The inefficiency of the bureaucracy is not an isolated issue. It is also visible in the local level leadership in general as well as in the political leadership of the Panchayath. For instance, Vypeen is one of the first centres in Kerala to introduce a water-supply system. Unfortunately, while complaining of its inadequacies, the Panchayaths have not been able to maintain (or to ensure it) the existing system effectively, by providing timely maintenance of the pipelines, thereby preventing leakages and water pollution.

Table: 8.1
Rating Pattern of Respondent on Local Govt. Institutions
Rating Gram Sabha
Village Admn. (%)
Block Admn. (%)
Average
No Opinion 8 6 3 6
Bad 20 18 20 19
Good 40 49 40 43
Satisfactory 32 27 37 32
2.0. People's Participation
The importance of people's participation in planing and programme implementation has been highlighted by several policy documents of the Planning Commission as well of the State Planning Board, the basic ground for facilitating this process has been created by the Constitutional amendment which brought in Panchayathi Raj as a major instrument of rural development. The Gram Sabha has been visualised as the fulcrum of the new regime. While several states of India have failed to present the Gram Sabha as a truly participatory mechanism, Kerala has gone ahead in this regard. This can be cited in terms of two major reasons. Firstly, the high level of political consciousness of the people, coupled with other factors such as higher level of literacy, have helped much for a meaningful trickle-down of the concept of Panchayathi Raj as well as of the role of Gram Sabha. Secondly, political parties of Kerala, and especially the ruling Left Democratic Front have played a significant role to make the Panchayath as a truly powerful democratic institution at the grass-root level. It was because of this conducive environment that the process of decentralised planning with greater involvement of the people at the grassroot level, could take off.
In order to make people's participation meaningful, there are two imperatives: 1) the people should have adequate knowledge of the various economic programmes, interms of their emergence and trickle-down; 2) the people should be vigilant and active enough to translate this knowledge into practice to the extent to which these two factors work altogether, besides the effectiveness of programme implementation.
In an attempt to understand people's participation in the Gram Sabha, we attempted to measure the knowledge, attitude and practice of the respondents with suitable proxy variables. The results indicates that, knowledge is a highly significant, but attitude and practice are so unfavourable to make Gram Sabha an operationally meaningful concept in Vypeen. On the contrary, the overall rating of respondents on Panchayathi Raj institutions was found to be generally good.
In an attempt to measure the discrepancy in rating as observed above, we made a detailed analysis of the actual process of implementation of particular projects. We have noted the relevant data for two periods. The pre-project and on-project periods. It has been noticed that the participation of both the beneficiary as well as the officials concerned are much lower during the on-project period than the pre-project period. This suggests that, both the officials and the beneficiaries consider the programmes as sources of government funds rather than as a support programme which should lead to sustainable economic activities.

Table: 8.2
Programme Implementation: Pattern of Association Between The Roles of the Beneficiary and 0ffical
Cluster Beneficiary Officials
Pre-project On-project
Pre-project
On-project
Elamkunnapuzha 0.40 0.24 0.22 0.06 Nayarambalam 0.72 0.16 0.42 0.12
Narakkal 0.52 0.40 0.38 0.04
Pallipuram 0.62 0.42 0.20 0.16 Average 0.56 0.31 0.31 0.09
2.1. The Issue of Absentee Participation
The above findings, though indirectly, suggests that a large number of respondents became beneficiaries of particular projects through a less transparent process, and that, they have only good things to say about the role of Panchayathi Raj institutions. These respondents are less participative in nature and therefore, they do not translate their knowledge on the role of the Panchayathi Raj institutions into practice. Though conceptually, beneficiaries of programmes can be selected only from the participants of Gram Sabha, we have noted that, many of the respondents have not participated in the Gram Sabha at all.
The fact that the actual participation of Gram Sabha, except for those Gram Sabhas, meant for identifying potential beneficiaries of programmes, is a dangerous trend, which has far reaching implications on the practice of people's planning. The fact that the people are not interested and involved in the stage of programme design, makes possible the entry of vested interests. Programmes of limited or no relevance have been imposed on the people by vested interests (politicians, bureaucrats, contractors or a combination of these interests). The programmes thus designed have been presented and got sanctioned at the Gram Sabha through manipulative techniques. Such manipulative techniques are facilitated when the participants of the Gram Sabha remain passive, or when they have been silenced through clearly thought-out strategies. Our study in Idukki shows a variety of strategies being employed by vested interests, ranging from intimidative techniques down to misinformation.
3.0. Democratisation and Bureaucracy
The democratisation process under Panchayathi Raj demands creation of much capbilities for both the people's representatives as well as the bureaucracy. Such capacity building should not simply mean imparting of some "skills", but more importantly, it is vital to cultivate a higher level of understanding and mutual respect between the bureaucracy and the elected leaders.
We have noted from the field that the transitory problems of a changeover of power is graver and more complex in Kerala than elsewhere. The bureaucracy itself was found to be divided on political lines, one favouring the ruling party/coalition and the other opposing it. Such opposition was found to affect developmental activities adversely.
"Empowering the people" does not simply mean giving much powers into the hands of the people, which they are unable to exercise effectively. People's Campaign for the Ninth Plan

perceived this danger and had taken steps to prepare the people for such a changeover. The series of training programmes/workshops initiated under the Campaign during its initial stages were meant to address to this imperative. Though the Campaign was largely successful in raising the morale of the people cutting across political lines, the tempo could not be maintained during the subsequent stages. This failure can be attributed to the following reasons:
3.1. Unlimited Powers with the Political Leadership
Unlike in the past, the constitution of several expert bodies like the District Planning Committee (DPC) have not been run in the right spirit of an expert body. While, expert bodies like the DPC, DLEC and BLEC were visualised as expert bodies, they were not adequately transparent. There was not much rationalisation or cross-reference to the deliberation of these committees. Since the committees did not play any vital role, most of the experts in specific areas kept away from the deliberations.
3.2. Capacity Building for Bureaucracy
In government, the appropriateness of training is a more crucial subject than training per se. In Gram Panchayaths, the training needs of the bureaucracy are of two forms: (1) provision of soft skills; (2) creation of the right orientation.
Under people's planning, training in soft skills were provided to the bureaucracy largely in the areas of programme implementation. Such training, however, was infact, an extension of the traditional forms of training imparted to government employees.
Creation of an orientation of the right type for bureaucracy is vital for the successful conduct of any decentrlisation process. In Panchayathi Raj institutions, this is too crucial because the bureaucracy is the vehicle which translate the aspirations of the people into concrete reality.
While during the above translation process, it is vital to ensure the cooperation various experts (mostly of the locality), either because of their potential or of the constraints of the Panchayaths, it is the bureaucracy which should work effectively as the link between the people and the people's representatives. This is important because bureaucracy is permanent whereas the people's representatives are not. It is the bureaucracy that should perform the functions of the government.

Some Key Areas of Concern
1.0. Introduction
The crucial objective of this study is not simply to evaluate programme implementation. On the otherhand, the major task is to make concrete suggestions for corrective action, if needed. Viewed from this angle, it is necessary to take stock of activities being undertaken in some crucial areas of concern. It is also necessary to explore how better these activities could be organised and implemented in order to lead to better results. The purpose of this chapter is primarily, to outline some of these key areas. The discussions in this chapter, along with our observations in the penultimate one, would lead us to more concrete alternative courses of action, which can be considered by the planners and the implementing agencies.
2.0. The Vital Areas
The discussion in the preceding chapters demonstrates that, both under more centralised planning, as well as under people's planning, the results of programmes have not trickled down to a significant extent in several key areas. Some of these key areas, specific to Vypeen Island, are:
Rural development/Poverty alleviation programmes.
Coconut and Paddy cultivation
Fisheries
Dairy, Poultry and Piggery
Credit delivery system
Micro-enterprises and entrepreneurship
Sanitation
Health programmes
Water supply
Infrastructure
Local Tourism
While some of these areas are of direct economic implications, the others need to be touched upon in order to improve the quality of life of the people. However, it is necessary to understand and appreciate the complementarity of these programmes and their implications on the overall development of the Island.
2.1. Rural Development/Poverty Alleviation Programmes
Unlike in other parts of the State, Vypeen demonstrates a significant break-down of antipoverty programmes. This owes largely to two reasons:

Most of these programmes are individual beneficiary-oriented, and are poorly managed.
The collective programmes like DWCRA are not prominent in this area. Where the number of poor people is relatively large, competition among these poor to grab the benefits of such programmes is natural. This also explains the high extent of corruption.
Sustainability of the anti-poverty programmes should receive an enhanced attention. This can be achieved through a greater focus on collective rather than on individual programmes. SGSY as a programmes, is likely to offer substantial potential in the Island. However, meticulous effort is needed at two stages: a) identification of dynamic activity clusters; b) organisation. The formal launching of the SGSY with effect from April, 1999 however, has not resulted in a meaningful implementation of the programme. A major constraint relates to identification of activity clusters, on which the Block officials were found to be left with very little ideas. Some Groups have already been formed under SGSY. We find that a few other activity clusters need to be identified for more meaningful implementation of the programme. To our mind, some of the clusters having potential are, Coir, fish and crab culture, ornamental fisheries, marine and inland fisheries, handicrafts, lime-shell collection and fish processing. However, to be implemented meaningfully, a comprehensive programme need to be drawn up. The District Panchayath may hire the services of an expert institution to develop a cluster plan for the Island. It can make use of its own funds as well as can draw from the line-Departments.
2.2. Coconut and Paddy Cultivation
One of the notable features of the Island is its special natural advantages relating to coconut cultivation. The premier role of this crop for the last several decades has even shaped the human geography of the Island in terms of a large number of people who are employed in this sub-sector as tree-climbers, coconut traders, agricultural labourers, and those involved micro-enterprises which draw raw-materials from this sub-sector. Several factors have contributed to the decline of this sub-sector over time. Diseases like root- wilt and viral diseases have curtailed production and productivity. It has also to be noted that, tampering with the ecosystem, in the form of land reclamation, also have influenced production and productivity in a negative way.
The problems of the sub-sector, however, has not received attention from a holistic angle. While, developmental schemes have approached the problem from the point of view of curbing diseases, providing inputs at subsidized rates, marketing facilities etc., attention get distorted, and the farmers progressively lose their interest to enhance production and productivity. An enhancement in costs of production especially labour costs, also has contributed to this passiveness.
Given the above situation, any development policy for this sub-sector should adopt a holistic approach. Two aspects need to be given key attention: 1) effective measures to curb diseases; and 2) to reduce costs of production at various stages.
The core of any policy in this regard should be to bring down the number of agencies, which are involved in the development of this sub-sector and to provide an umbrella, which delivers efficient services to the farmers. The best alternative one can think of is Farmer's Self-Help Groups (FSHGs) attached to the Gram Panchayats. These Groups, functioning as representative bodies, should get a legal standing, by which, the various support programmes of several departments need to get channalised. The officials of various relevant departments should work with these groups.

Our field research indicates that much of the programmes being implemented by the Gram Panchayaths and the Department of Agriculture do not yield any significant result. The inputs supplied are mostly of poor quality; services like spraying breeds much corruption. Besides, the implementation of such schemes are not cost effective. What the Gram Panchayats and Krishi Bhavans can, at best, do is to facilitate availability of equipments like, tractors, pump-sets, and adequate supply of tree-climbers (through for example, Labour Contract Societies). The Farmers' Groups, jointly with the officials of the Krishi Bhavan, can make an assessment of the productivity, yield and requirements of each garden. Based on such an assessment, a production incentive can be offered to the farmers.
The thrust of future policy in this area should be to hand over much of the support services being offered by the various governmental agencies to the FSHGs. There should also be a serious effort to bring down administrative and transaction costs, and to extend the same to the direct advantage of the farmers.
Paddy cultivation peasants a case where, farmers have almost completely stopped cultivation and have started using the fields for alternative purposes. The situation has been compounded because of acute shortage of labour during agricultural seasons. Government of Kerala has responded to this crisis in the form of an institutional mechanism called the Paddy Board. The indications available from Vypeen suggest that, it is difficult to enthuse the farmers exclusively for paddy cultivation, but only as part of a mixed cropping strategy, based on indepth regional studies. This strategy need to be worked out with the help of FSHGs.
The concept of FSHGs is different from the existing one called Group Farming. The FSHGs are expected to be truly independent groups and the Panchayaths as well as the Krishi Bhavans are expected to extend their services as per the collective decisions of the former.
2.3. Fisheries
Vypeen is one of the areas in the State where a large number of governmental promotional agencies are concentrated. Despite their promotional schemes, it is a reality that output in this sector has been significantly coming down. The support programmes through the primary fishermen's societies has been found to be small in relation to the enhanced need for craft by fishermen. It is vital that the scheme itself is further looked into and the services of the primary societies are extended to more fishermen.
Organised efforts for processing and marketing of by-products can be a new area. A number of micro-enterprises can be initiated in this area. Hygienic dry fish is one such product with great potential. Similar products are, fish manure, fishmeal etc. Ornamental fisheries is an emerging area where a number of micro-enterprises can be initiated.
Lime-shell collection is a major fishery-ancillary activity in and around the Vembanad Lake. Considering the substantial demand from the consuming industries such as Travancore Cements Ltd and the Travancore Electrochemicals Ltd., there is likely to be substantial potential for organising this activity as an industry. While, at Kottayam, the other end of the Vembanad Lake, lime-shell collectors are organised in cooperatives, it is worthwhile to think of some collective initiative in Vypeen as well.
One of the major threats of fisheries in Vypeen Island is the environmental degradation arising from indiscriminate garbage disposal into the waterways as well as to the backwaters. A consistent effort to prevent this should be the first step towards enhancing the fishery resources of the Island.
2.4. Dairy, Poultry and Piggery

Poultry in the clusters have been constrained by the enhanced inflow of poultry products from Tamil Nadu. The lower costs of production in Tamil Nadu has attracted entry of cheap poultry products into this area. As a result, even those who have undertaken poultry as a venture have either stopped it over time, or have transformed themselves into local agency firms of other large firms in Tamil Nadu. Given these constraints, it is not worthwhile to initiate poultry as a viable commercial venture.
Rearing of ducks and piggery however, offers some potential. Rearing of ducks is a rare occupation in Vypeen and is confined to only a few pockets in the Island. Salinity of water is a constraint. However, this can be overcome with the help of introduction of new species of ducks.
Piggery is another area which has been totally neglected. The high density of population as well as the volume of bio-wastes (eg. from hotels, fish processing units, butcher's shop etc.) generated in the Island should be conducive factors both on the demand and supply sides. It is possible that clusters or self-help groups can be promoted in the panchayath areas and a large number of poor people, especially women, can be gainfully employed in these activities. The public sector, Meat Products of India (MPI) at Kothattukulam also offers a regular market for meat products.
2.5. Credit Delivery System
Regarding credit delivery, the human geography of Vypeen offers a problem as well as potential. A notable feature of the Island, especially among poor households, is the predominant role of consumption credit. Consumption credit offered by money-lenders, virtually put them in a debt-trap.
There is obviously a need for alternative channels of credit. SHGs obviously have a potential, especially against the large volume of business they can transact in this highly populated Island. While the consumption credit needs being fulfilled, the SHGs should also initiate setting up of micro-enterprises where women labour can be increasingly used. Examples of such enterprises are, food processing, fish processing, coir etc.
2.6. Micro-enterprises and Entrepreneurship
As already noted, micro and small enterprises is a totally neglected area in the Island. However, the objective situation remains conducive. On the one hand, a highly significant level of unemployment, opens up these enterprises as the only alternative. On the other hand, the geographical position of the Island permits significant access to a relatively wide market.
Our field studies indicate that, the Panchayaths lack significantly in ideas relating to development of small and micro-enterprises. We have noted that, even after the introduction of Peoples' Planning, allocations for this crucial sector has not been utilised (eg. Nayarambalam Panchayath). Attempts in the past were largely geared to collectives like co-operative institutions, especially in traditional activities and sectors. This thrust was largely at the expense of capacity creation among the unemployed people. Given the conducive objective environment, the task of Gram Panchayats should not be concentrated on identifying specific activities, but to identify the entrepreneurial potential itself.
The situation today is that, atleast a small section of the population move out of Vypeen to become entrepreneurs. This negative development, alternatively implies some constraints, the resolution of which may lead to an improvement in the present situation. The immediate task, therefore, should be directed at two things: 1) an indepth assessment of the entrepreneurial potential of the region in terms of constraints and opportunities. This can be done through scientific skill mapping exercises. The second task should be, to nurture entrepreneurship as a

resource, irrespective of the number of units that may be set in the short-run. Scientific training models need to be implemented with the help of expert institutions and the impact has to be closely monitored for a period, say five years.
The Swarna Jayanthi Gram Swarorgar Yojana (SGSY), being implemented by the Blocks, offers a flexible programme under which viable micro-enterprises can be identified and can be implemented with due consideration for different related aspects.
A crucial constraint on micro-enterprise development programmes has been a substantial lack of project ideas both for the planners and implementers. It is high time that the initiatives of the Panchayaths are adequately supported/monitored. A continuous flow of project ideas and information need to be assured. It is high time to think of the concept of a Small-enterprise Observatory, which can extend support and services while planning for micro-enterprises.
2.7. Sanitation
Total sanitation is the key, not only to maintain the health status of the community, but also to keep all other economic programmes sustainable. Community health is the cornerstone of all other economic activities. From this point of view, it is vital to implement a total sanitation programme where, a technology appropriate to Vypeen has to be chosen and has to be implemented. It is possible that, analogous lessons can be drawn from pollution control activities (e.g. Common Effluent Treatment Plants). There are also lessons to be drawn from countries the Netherlands, which face a similar situation.
It is important to note that, the major health problems of the Island are only a sub-set of the wider problems of environment and sanitation. Though the gravity of these problem have been clearly understood in Development Reports of various Gram Panchayaths and the Block Panchayaths, we have noted that, the will of the people has not been faithfully implemented by the Panchayaths. For eg., though deepening of canals has been included as a top priority by the Gram Sabhas, projects in this regard remain incomplete.
Our suggestion in this regard is that, in order to deal with this crucial problem of environment and sanitation, a total sanitation programme need to be chalked out by the District Panchayath, and the same should be implemented with the cooperation of the Gram Panchayaths. The resources required should be met through a common pool, and with contributions from the public.
2.8.Health Programmes
While the medical infrastructure in Kerala has been characterised by the co-existence and healthy competition between the private and public sectors, in Vypeen, this competitive environment is relatively weak. While the public infrastructure is constrained by the high demand for health care facilities vis-a-vis the limited available facilities, in addition to the inefficiencies, the private sector has not grown to a significant extent as in other parts of the State.
A detailed examination of the Development Reports of all Gram Panchayaths in the area indicate that, the people as well as political leadership generally perceive a hospital-centered approach to public health where a case for expanding the existing facilities have been articulated. This, infact, leads to a diversion of attention from the vital environmental issues which, to a large extent, influence the general levels of health in the village.
While the NGOs who argue for greater health care facilities in the village, also play down environmental factors. They on the other hand, confine themselves to participation in governmental programmes like awareness camps etc., without offering themselves a viable alternative approach to improvement of health standards of the community. The Primary Health

Centres which are expected to be more oriented to improvement of overall community health standards, also confine themselves to an in-house health care approach rather than performing a wider role.
The major challenge facing the Island today is to keep atleast the existing medical and public health services sustainable. The social environment of Kerala is such that the demand for health care facilities is going to be enhanced in the coming years. While the extent of subsidisation now is as high as 99.16%, any attempt in future should be geared to bringing down overall health-care cost per head rather than offering additional facilities indiscriminately.
The imperative for cuts in subsidies should be addressed through a reduction in the average cost of health-care per household. This can be done only through an effective management of environment-related diseases and the costs involved therein. Two points need to be taken care of urgently: (a) a massive awareness programme on sanitation and protection of environment; and (b) a vigorous effort to clean the environment.
2.9. Water Supply
Environmental pollution, especially through poor sanitation, is a major problem which has a direct bearing on the health status of the community. Such pollution occurs due to reasons like the prevalence of open latrines which pollute the waterways, poor facitilities for garbage disposal and indiscriminate disposal of processed wastes such as from fish peeling sheds and from butcher's shops.
It was found that the Gram Panchyaths, if at all interested, were not prepared to take regulatory steps and the needed sustainable measures with active involvement of the people. Even where open wells are practically only of limited use, many Panchayaths have initiated to provide wells for poor people. It is also important to note that, in one of the Panchayaths, there are about 23 open wells during the 1950s, which are still remaining unused. The NGOs also were not found to be keen on initiating steps which may radically improve the situation.
Drinking water has been a contentious issue in Vypeen for the last several decades. Despite some major projects which have been already implemented as well as a new project that is going to be commissioned soon, the demand-supply situation still remains much less transparent. It is important that a specific plan for drinking water has to be chalked out for Vypeen, taking into account appropriate demand projections as well as a realistic assessment of the supply constraints. Thinking large, rather than the way it is now being done by the Gram Panchayaths, is vital in this context.
2.10. Infrastructure
Like drinking water, infrastructure also is a contentious issue. The major debates in the recent past relates to the proposed Vypeen Bridge. Taking objections were raised by an environmentalist group regarding the potential danger the bridge may cause to fishery resources of the Cochin backwaters. These objections have subsequently got subsided, and the initial phase of the bridge project has already started. The bridge is expected to be completed within a period of five years.
The discussion on infrastructure, too has been based on very narrow grounds. Any discussion on infrastructure should be based on the sustainable impact it may make on the region concerned. Most arguments in the Vypeen context have too mechanical whereby, it is assumed that, a connection with the mainland will automatically lead to the development of Vypeen. This conclusion is likely to be far from true. Any true and sustainable development of the region should

emerge from a process of triggering new income earning opportunities to the people of the region. Unfortunately, a bridge in itself will not lead to any such positive result.
In this context, it is vital to think about an integrated infrastructure development programme for the region. Fortunately, the waterways which connect different Panchayaths of the area, itself is Nature's real gift, which has to be properly utilised. Developing these waterways into transportable inlets should be the key to such an integrated programme. Examples to similar situations are available from countries like the Netherlands. The city of Amsterdam, and the city of Cochin are much alike in terms of the existing as well as potential physical infrastructure and the resource endowment. Can an effectively develop network of waterways lead to wider business opportunities?
2.11. Local Tourism
Tourism can be one among the answers to the above question. The Government of Kerala has identified one of the centres in the Island - Cherai - as a tourist destination. Infact, it is anachronistic to think about a tourist centre in an Island which is virtually an environmental anachronism. Can tourists be attracted to Vypeen in its present form? Of course, it is too doubtful.
It is necessary to think about an alternative model of tourism for the Island. We may tentatively name it, " Little India - Little Kerala" . The concept of modeling a village in another part of the globe, is nothing new in the practice of tourism today. Cochin is one of the tourist destinations in the South, and here lies the potential. We may suggest that a model village which presents a typical Kerala village as well as the diversity of India as a monolithic country, if properly planned can be one of the best tourist attractions, on which Kerala can boast of during the coming years. The advantage of such a model is likely to be that it can attract not only international tourists, but also national tourists.
3.0. An Alternative Developmental Approach
The developmental challenges of Vypeen are so complex that, the programmes as they have now been implemented, are likely to lead the Island to a very serious development crisis. Therefore, a way-out lies in thinking of an alternative developmental approach, where the Gram Panchayaths continue with some of their existing roles, but as part of a wider Development Plan for the region as a whole. This Development Plan should be more out of a consensus, rather than as an administrative exercise.
The regression results in table 7.2, implicitly suggests the vital need for massive employment generation programmes in Vypeen, in order to have any sustainable positive impact on income levels of the poor people. This alternatively suggests that, small programmes, as they have been implemented now, are not likely to make any sustainable effect on rural development as well as on poverty eradication.
A major objective of the people’s planning programme has been on a massive mobilisation of resources. Such a massive mobilisation should include resources of all forms. The initiatives being carried out in Vypeen indicate that a series of programmes, to be of a critical minimum size, should be the answer to the pressing problems of the island. In such programmes, the role of individuals and institutions (like NGOs, religious communities etc.) should be clearly defined in terms of money and other forms of support. The best example is the success story of the Cochin International Airport Limited (CIAL), where people’s initiative and enthusiasm rather than direct governmental intervention, which led to the success of the project.
3.1. Capabilities of Panchayaths

Thinking big, as outlined above, and chalking out plans and programmes of a sustainable nature, requires building up the constituent Panchayaths as powerful instruments of local action. This demands vigorous efforts to design a development plan for the region as a whole, and to define the role of the gram Panchayaths in such a wider design.

Policy Imperatives
1.0. Introduction
While for specific programme(s) of Ministries and Departments, the policy imperatives can be discussed in general terms, in village studies, it is rather difficult to pinpoint policy options. The development of a village has been constrained by several endogenous and exogenous variables which are to be listed and analysed. However, what can actually be done is to examine broadly the relationship among different development actors: the government; the NGOs and the People. Since the purpose of our investigation is to examine the role of the government in the development process, we will largely confine to the question as to how governments at various levels can perform a more meaningful role in stimulating the overall development of Vypeen Island. But before going into such a discussion, it is vital to examine the limits of the overall policy environment.
2.0. Limits to the Policy Environment
The overall policy environment has to be discussed in terms of three areas: 1) the planning process; 2) hierarchy; 3) co-ordination.
2.1. Planning Process
Planning being a political process, requires the interplay of two factors: a) the enthusiasm and morale of the people for identifying their needs and articulating them; 2) a meaningful information base.
Under centralised planning of the kind which existed in Kerala prior to 1996, people's involvement in the plan process was restricted to political as well as expert bodies which take decisions largely on a representative basis. While the structure of State Planning Board remains more or less the same, at the district level, planning was done through the mechanism of Working Groups. The Working Groups consisted of, people's representatives, officials and experts.
Under people's planning, a major ingredient of true democratic governance has been introduced whereby, the people themselves are facilitated to identify their development priorities. People who thus participate in the special Gram Sabha for plan discussion will remain as idle spectators or as inactive figure heads, if they do not have the right enthusiasm and morale. Enthusiasm and morale are the outcome of right information. On the other hand, the presence of such enthusiasm and morale enthuses people to look for the right information. The task of any planning authority or the political leadership should be to provide the people with the right information which, in turn, facilitate them to get it applied in their collective wisdom at the Gram Sabha. In the people's planning process, this has been envisaged as a campaign, where training opportunities were offered to different levels of activists, who in turn were expected to bring it down to the people. While under a departmental approach to planning, information simply mean awareness on government programmes, under people's planning, they were envisaged to be situated in the relevant political and social contexts. Thus, the Development Seminars and Development Reports which formed the backbone of such seminars, were situated under such socio-political context.
As the veteran political leader E.M.S. Nambooripad, who was also architect of people's planning movement, rightly pointed out, the politics of planning cannot be sectarian. Put into practice, this right vision of people's planning has succeeded or not? The evidences from Vypeen make some concrete suggestions.

We made an attempt to capture the beneficiary perception on how the programmes are designed and implemented, as well as of the role of various implementing agencies. The respondents were asked concrete questions on the role and relevance of different tiers of government as far as programme design and implementation are concerned. Based on such data, the responses were analysed with the following results (Table - 10.1). The opinion ratings of beneficiaries are given in the table. It shows that 35% of the respondents have only heard about people's planning, whereas another 25% has no knowledge at all. Together, this 60% of the beneficiaries have managed to enjoy the advantage of people's planning without even knowing what it is.
Table 10.2 explains the probable ways by which they manage to get the advantage of development projects through people's planning. The table shows the knowledge (K), attitude (A), practice (P) relationship, which in turn, explains people's participation in the planning process. Those respondents who have heard about Gram Sabha have been given a positive score for the variable K. Similarly, those who have attended Gram Sabha at least once, have been given a positive score for variable A. On the contrary, those who are aware of the role of Gram Sabha and have participated in the special meeting of the Sabha for selection of beneficiaries have been rated as having a positive score for variable P.
The table shows that, only 47% of the respondents who are also beneficiaries of some programmes, do practice (P). It is instructive to relate tables 24 and 25 in order to get the probable causation. The fact that 47% of the beneficiaries who have participated in the Special Gram Sabha have indicated anomalies in the selection of beneficiaries, is the best proof for lack of transparency in the process of selection of beneficiaries.
Table: 10.1
Respondents Perception on People's Planning Programme
Opinion Percentage
People empowered 8
It is a scheme for the people 10
Good, not properly implemented 10
More corruption 12 Heard, but unable to explain 35
No knowledge 25
Total 100
Table: 10.2
Association Score of Beneficiaries Towards the Concept of Gram Sabha
Panchayath K A P
Elamkunnapuzha 0.88 0.50 0.44 Nayarambalam 0.81 0.60 0.42

Narakkal 0.92 0.58 0.40
Pallipuram 0.93 0.49 0.50 Average 0.88 0.54 0.47
Table: 10.3
Association Score of Beneficiaries Towards Different Stages of People's Planning
Factors Elamkunnapuzha Nayarambalam Narakkal Pallipuram Total
Selection of Innovative Projects
0.22 0.16 0.13 0.12 0.63
Selection of Beneficiaries
0.17 0.15 0.13 0.10 0.55
Implementation of Programmes
0.17 0.10 0.08 0.09 0.44
2.1.1. The Issue of People's Participation
Though Plan documents since the Sixth Five Year Plan reiterate the importance of people's participation in the Plan process, the methods by which such participation can be assured is, virtually a thorny issue. The officials as well as people's representatives of all the Gram Panchayaths which we visited, complained of the poor people's participation in the plan process. The most crucial issue is the poor participation in the Gram Sabha. A scrutiny of the Panchayath records show that none of the Panchayaths are able to assure the 10% norm of attendance in the meetings of the Gram Sabha.
Image49.gif (6180 bytes)

Image50.gif (8949 bytes)
Our team make an attempt to investigate and analyse the causatives. The political leaders of the Panchayaths noted that the people were demanding more and more, while the Panchayath, with its limited resources, were not unable cope with the demands of all of them. Those who do not get such demands fulfilled, get disillusioned and make baseless allegations against the political leadership of the Panchayaths. It was also noted that, based on such "bad" experience during the first two years of the Ninth Plan, the strategy was shifted from individual programmes to group-oriented programmes.
Much against the above opinion, our team got evidences from several villagers who actively participated in the Gram Sabha that, this crucial political institution has not been able to perform its role effectively because of the inefficiency or corruption of the leadership. It was also pointed out (even by political activists) that the differences between the ruling party/coalition and the opposition was notional rather than real.
Based on such conflicting positions taken by the people's representatives and the people per se, we analysed the Panchayath finances and their utilisation, in relation to the projects being initiated. The evidences available to us suggest that, several of the new (innovative?) projects mooted by the Gram Sabha have not been properly implemented or are getting lagged. On the other hand, several other projects of a routine nature (e.g. maintenance work for roads etc.) have been implemented in due time.
The above indications on subverting the people's mandate is likely to have serious implications on the working of the Panchayati Raj system itself. It is also necessary to examine in detail the reasons for this behaviour pattern. If it is a case of lack of competency, efforts should be taken to tone up the working of the Panchayaths. If it is a case of naked corruption, it is vital to think of

ways and means of making the Gram Sabha, a more vital forums. Our impression is that a combination of both is present.
2.1.2. Information Dissemination
In order to make people’s planning a meaningful exercise, there should be a continuous flow of information to the context of decision making by the people. Under the earlier regime, the officials were expected to be the information gatherers and disseminators. While, it is likely that several subjective elements influence such flow of information, the net result was likely to be biased. Under people’s planning, it does not mean that the laymen who man the Gram Sabha are aware of all the intricacies of planning which is largely a technical exercise. But beyond gaining any such technical capabilities, what is expected is the creation of an environment of consensus even against political or ideological differences. Such sense of consensus alone will prompt the Gram Sabha to delegate its powers to other experts who in turn may be able to help them in the planning process. This, by no means is a simple exercise. The Gram Sabha should put faith in the relevant experts of their locality, and these experts, in turn should win over the Gram Sabha. This circuitous process will raise the deliberations of the Gram Sabha to a qualitatively higher plane and will in turn help to raise the morale and enhanced participation of the people.
The process of information dissemination, therefore involves, four crucial stages:
Identification of relevant information
Identification of appropriate dissemination mechanism
The process of dissemination
Evaluation \ Feedback
Our review of the Plan documents prepared by various Gram Panchayathhs as well as the Block Panchayaths indicate substantial repetative projects as well as even factual errors. This, in no case can be explained away in terms of "the people’s will argument ". The task of the people is just some prioritisation in a regional context. The remaining task has to be performed by the planning mechanism.
The introduction of people’s planning approach implies greater powers in the hands of the political leadership than for the executive authority. This change, at least in the short run, has resulted in some sort of clash between the bureaucracy and the political leadership. While this is largely a transitory problem, it is necessary to overcome this through a clear definition of roles. We have observed that, capacity building, both at the level of political leadership as well as the bureaucracy, is an imperative. While the former may be relatively less easy, in the case of the latter, it is possible. We have noted that all the Panchayaths which we visited were facing a dual problem of incompetence as well as surplus staff. The focus, therefore, should be on the introduction of modern, but appropriate, management practices in the administration of Gram Panchayaths.
2.2. Hierarchy
Planning and programme implementation to be made meaningful, it is vital to make the hierarchical system effective through continuous and effective communication. This should not only be within the Gram Panchayaths; there should be an outreach. The task of the Gram Panchayaths is to mobilise the maximum number of people at the local level through mobilisation and expertise. At the second stage, the Gram Panchayaths, based both on their mandate as well

as the strength of their mobilisation, should communicate with other Gram Panchayaths of the region, the Block and the District Panchayath so that, long-run strategies, are evolved. Such communication and mobilization are indispensable in a region like Vypeen where collective action as well as large programmes alone will help to make sustainable changes in the region.
It is in the above context that the need for sub-regional policies arise. The programmes by Ministries are often uniform in design and therefore, the possibilities of sub-regional co-ordination is difficult. For example, for rural development programmes, the Ministry of Rural Development and the state governments have a uniform three-tier structure of DRDA, Blocks and the Gram Panchayaths. It is difficult for the Ministry or its counterpart Departments in the State to give instructions to the contrary. However, under a meaningful regional planning the possibilities are enormous. If the Gram Sabhas of three or four Panchayaths in a region make a joint resolution, based on the same, a regional policy involving those Panchayaths can be evolved and jointly implemented. Such joint action may also help to ease the problem of additional resource mobilisation significantly.
2.3. Co-ordination
Co-ordinated action, as outlined above, will not emerge spontaneously. In a democratic system spontaneous economic action by the people is the exception than the rule. The District Panchayaths and the State Planning Board should play a key role in undertaking in-depth investigation on potential clusters/regions where wider projects can play a key developmental role. The State Planning Board and the Planning Commission should see to it that such ad-hoc studies are conducted on a regular basis. It is important to note that the State Planning Board has initiated steps to document success stories in specific Gram Panchayaths of Kerala. While this is important from the point of view of demonstration, it is also important to identify the success/failure factors and to monitor them at the level of programme implementation. Being a key actor of the design and implementation of people's planning model, it is important that the State Planning Board keep away from undertaking such studies and entrust it to other independent institutions.
Plan co-ordination, even in a Gram Panchayath is a difficult task. Under people's planning, the process become much more complex, because, beyond facts and figures that go into the actual process of plan formulation, it also involves the active participation of people at various levels. To begin with, preparation of a development report and its presentation in a village Panchayath are as serious exercise as the presentation of the Economic Review or Budget Papers in the Legislative Assembly. If this seriousness is given to the whole process, co-ordinated action by the bureaucracy as well as the people's representatives will be necessary. Our scrutiny of the Development Reports of various Panchayaths give us the impression that such seriousness has not gone into this annual exercise. The Development Reports of the first year of the Ninth Plan, both in the Panchayaths as well as Block, gives an overview of the issues of the region, and are therefore, valuable reference material for any outsider. During subsequent years, these have become just documents giving income-expenditure statements. We have also noted that no serious professional effort has gone into such Reports, as they do not contain any review of the previous year's programmes, references to evaluation if any, and a clear statement of perspectives. Factual errors are many. Income-expenditure statements often do not tally. In short, these give only the picture of all-purpose reports.
While in a Gram Panchayath, the constraints are many, it is necessary to introduce professionalism in such vital exercises as preparation of a budget and of Plan documents. While the whole exercise need to be supervised by people's representatives, it is necessary to generate vital capacities among Panchayath bureaucracy in order to make the business of plan formulation and implementation a more serious exercise. It will also bring in greater transparency of the activities initiated, and will improve their credibility.

Concluding Observations and Suggestions
1.0. Introduction
In this chapter, we attempt to tie-up our discussion in the preceding pages regarding the findings, emerging issues and major areas of concern, and to suggest suitable alternative courses of action to be considered. As we have noted in chapter-2, unlike impact studies on particular programme(s) of some Ministry or Department, taking stock of the overall impact of several governmental programmes which often function in overlaps or in conflict, is a difficult task. Where village is the concern of a study, how the village gets benefited from changes over time is contingent upon a variety of historical, social and cultural factors which need to be understood in their totality and specificities. This quick study has tried to examine only the milestones, while trying to see how the poor people in identified clusters behave and express themselves as social beings, economic men, and as citizens having the potential of shaping the course of history, as also the policy environment which influence them.
2.0. Overall Impact
The crucial concern of this study is to examine as to what extent development programmes by several tiers of government have shaped the economic social and political life of the people of this village. This overall impact need to be examined in terms of the major structural changes that have taken place in the village over time.
An Island with a historical legacy and located in a strategic part of the State, Vypeen has not been able to change its economic structure or the quality of life of the people significantly. The economic structure continues to be one of relatively primitive production relations, unlike other parts of the State. Governmental interventions have taken place in several sectors of the economy, as well as social sectors, but with negligible impact on the quality of life of the people. Put together, all these programmes have not so far been able to offer even the basic necessities, like drinking water, sanitation, medicine and transport to a satisfactory extent.
The government programmes have not gone beyond the routine approach of spreading the benefits thinly over a highly dense population. Thus, the effective benefit of such programmes on the common man is often negligible or negative. Water supply and sanitation are two areas which are totally mismanaged. Naturally, expenditure on medicare stands as a major item in the budget of poor households. This, together with the stagnating income levels of households, pose indebtedness as a major problem.
The decades of neglect at the political and administrative levels on this Island, in turn, has nurtured a culture where the Vypeenites have not even been able to articulate their needs properly. Even under people's planning which is expected to be more transparent in content, the situation remains far from satisfactory. The role of Gram Sabha remains much to be desired. People's awareness on its role and relevance is not satisfactory. Transparency in programme implementation is not adequate. Panchayaths do not maintain muster rolls of anti-poverty programmes. The nexus of contractors, officials and politicians is present. The Panchayaths, infact, are taken aback by the multiplicity of local problems they are facing. However, they do not try to swim against the tides and make clear cases for the development imperatives of Vypeen. People obviously want a change in the existing order of things, as reflected in the Development Reports of the Panchayaths, but the change does not get materialised.
The broad conclusion emerging from our study is that Vypeen is such a case where it is rather futile for a policy maker to think small. Lack of appropriate programmes itself is a problem, particularly programmes involving the participation and involvement of a large number of people, are necessary to make even a short-run attack on underdevelopment and poverty. The disinterest

of a large number of people in developmental activities, is symptom of a wider problem rather than a cause.
3.0. Specific Observations
Our specific observations can be summarised as follows:-
3.1. Government programmes at the Gram Panchayath level have only a cosmetic effect in relation to the wider problems of the Island. Even under People's Planning, the magnitude of the problems have not been properly understood by the Gram Panchayaths. It is this impression that we gather from the policy documents of the Gram Panchayaths as well as on discussions with the people's representatives and officials.
3.2. The programmes being implemented by the Block, the District Panchayath as well as the line departments (under non-plan funds) are mostly inappropriate. They do not address to the wider problems of the Island in a significant way.
3.3. Absenteeism in programme implementation is one of our major findings. Evidences to this effect are available from such factors as beneficiary and official association in programme implementation. The low survival rate of the IRDP assets is also a clear indication.
3.4. Despite several governmental programmes, the mounting social cost relating to environment is an aspect which has not yet been addressed to properly. Alternatively speaking, even the benefits of various economic programmes meant for the poor have been stolen away in the form of poor environment, and consequent poor health standards of the community. Total pollution of the Island is unparalleled in the whole of Kerala. Surprisingly we note that neither the Pollution Control Board nor the Health Department have taken steps to undertake normal e-coli tests in order to measure the environmental hazards. We note with grave concern that the outbreak of contagious diseases has not caught the attention of the governments in the form of clear policies and action. While capital has moved out of Vypeen, especially to nearby Cochin City, mobility of labour remain far less to one's expectation. This also implies a ratchet effect both in the labour market as well as at the cultural plane. We therefore, feel that a physical-cultural integration with the mainland is going to be the key to sustainable development of Vypeen.
3.5. Another crucial observation relates to the absolute lack of relevant programmes in some sectors/areas. While programmes have been piled-up in areas like women's development, awareness building, fishermen development etc., in areas like industry, programmes are negligible and inappropriate. Even the existing programmes are far from relevant to the needs of the region and the people.
3.6. We strongly feel that the potential of anti-poverty and employment programmes in their present form, in dealing with the problems of unemployment and poverty are limited. What is needed is large projects of a critical minimum size, which can, at a time, create substantial employment opportunities as well as can create new assets and income opportunities. We have identified eleven areas which deserve special mention.
3.7. We do also find the need for a consortium approach to development of Vypeen. The Planning Commission and the State Planning Board should look into the potential of a such an approach from a policy angle.
3.8. People's planning, despite its several positive aspects, has not been successful in assuring transparency of programme design and implementation. However, the situation can be improved through more supervised functioning of the Panchayaths. At the political level, there should be a consensus on the need for capacity building of the Panchayaths. The Planning Commission

should try to convince the State Government that such capacity building does not mean curtailing the powers of the elected bodies. The Planning Commission can also look into the feasibility of a monitoring mechanism on lines of what is being done by the Ministry of Rural Development.
4.0. Overall Conclusion
The significant democratisation of planning and programme implementation is a major and unique achievement of Kerala. But, planning is at a time, a political as well as an economic process. While the will of the people is the ultimate word, it also has the danger of getting manipulated through misinformation, and sometimes, subversion as well. Therefore, the primary task of Panchayati Raj should be to assure a high level of participation of the people in the Gram Sabha. A Gram Sabha with a high participation of the people, in turn, would look for expertise in identification of innovative projects, based on a principle of "……………I authorise and give up the right of governing myself to another body of persons …………………". The evidences available from our study suggests that, a more supervised effort is required to improve the quality of programme design and implementation. The urge for this, however, should come from the Gram Sabha itself.

Selected Bibliography
Albin, A (1990): "Manufacturing Sector in Kerala: Comparative Study of its Growth and Structure", Economic and Political Weekly (EPW), September 15.
Anderson, Dennis (1982a): "Small Industry in Developing Countries - Some Issues", World Bank Staff Working Paper, 518 (Washington, D.C).
Asheim, B.T. (1992): "Flexible Specialisation, Industrial Districts and Small Firms: A Critical Appraisal", H. Ernst & V. Meier (eds.) - Regional development and Contemporary Industrial Response. Extending Flexible Specialisation, pp. 45-63. London: Belhaven Press.
Atterton, Tim (1996): Strategic Issues in Small Business Association Development: International Experience and Lessons for India (Occasional Paper) ( Cochin, Institute of Small Enterprises and development).
Awasthy, Dinesh N and Jose Sebastian (1996) : Evaluation of Entrepreneurship Development Programme ( New Delhi, Sage Publications)
Beaumont, Sue and Kavil Ramachandran (1992): Development of Micro Enterprises by Women (New Delhi, Indian Institute of Management/British Council).
Canara Bank(1994): Report of the Committee on Credit-Deposit Ratio in Kerala (Trivandrum, Canara Bank).
Chandrasekharan C. (1973): Forest Resources of Kerala: Quantitative Assessment (Trivandrum, Kerala Forest Department).
Chenery, H.B, Montek S. Ahluwalia, CLG, Bell, J.H. Duely and Richard Jolly (1974): Redistribution With Growth (London, World Bank/IDS).
Das, K .S. and Panayiolopolos (1996): "Flexible Specialisation: New Paradigm for Industrialisaion of Developing Countries", Economic and Political Weekly, December-28
Dijik, M.P. Van (1996): "Recent Theoritical Discussion About Flexible Specilisation and Industrial Districts". (Paper presented at the Salitaga Seminar International Seminar)
Eapen, Mridul(1994): "Rural Non-agricultural Employment in Kerala", Economic and Political Weekly, May 21.
Gibb, Allan, and Mohammed Salleh Hg. Din (1990): "Universities, Small Business and Entrepreneurship Education: Towards a Holistic Approach", Small Enterprise Development, 1 (4).
Godar, B and V.Seth, (1989): "Spatial Variation in the State of Industrial Growth in India", Economic and Political Weekly, 24 (22)
Government of Kerala: Economic Review (various issues) (Trivandrum, State Planning Board).
Government of Kerala (1964): Report of the Evaluation Committee on the Welfare of the Scheduled Castes, Scheduled Tribes and other Backward Communities in Kerala State.(Trivandrum, Govt. Press).

Government of India (GOI): Ministry of Finance, Economic Survey (various issues), 1995-96.
Government of Kerala (1984): Report of the High Level Committee on Industry Trade and Power Vol. I & II( Trivandrum, State Planning Board).
Government of Kerala (1990): Report of the Steering Committee (Trivandrum, State Planning Board).
Government of Kerala (1998) Economic Review-1998 (Trivandrum, State Planning Board)
Government of Kerala (GOK) (1994): State Planning Board, Eighth Five Year Plan - 1992-97, (Trivandrum).
Government of Kerala(1984): Report of the High-level Committee on Industry Trade and Power(vol. I)( Trivandrum, State Planning Board).
Government of Kerala(1990) : Report of the Steering Committee on Industry and Mining ( Trivandrum, State Planning Board).
Government of Kerala(1994): Eighth Five Year Plan, 1992-97: Mid-term Preview (Trivandrum, State Planning Board).
Government of Kerala, District Panchayat, Development Report (various issues), (Ernakulam, District Panchayat)
Government of Kerala, Statistics for Planning (various issues) (Trivandrum, Directorate of Economics and Statistics).
Govt. of India (1974): Report of the High Powered Study Team on the Problems of Handloom Industry (New Delhi, Ministry of Commerce)
Govt. of India, Ministry of Industry (1997): Report of the Expert Committee on Small Enterprises, (New Delhi, Dept. of Small Scale Industries and Agro and Rural Industries)
Govt. of India, Ministry of Industry (1997): The Report of the Committee of Officials to Review Manufacture in the Small-scale Sector, (New Delhi, Dept. of SSI & ARI)
Govt. of India, Ministry of Planning (1997): Approach Paper to the Ninth Five Year Plan, 1997-2002
Govt. of Kerala (1996): Ninth Five Year Plan: Task Force Report on Modern Small-scale Industries, (Trivandrum, State Planning Board)
Gram Panchayath, Elamkunapuzha, Development Report (various issues)
Gram Panchayath, Narakkal, Development Report (various issues)
Gram Panchayath, Nayarambalam, Development Report (various issues)
Gram Panchayath, Pallipuram, Development Report (various issues)

Hill, Hal (1996) : "Small and Medium Enterprises and Rapid Industrialisation : The Asian Experience".( Paper presented at the Salatiga International Seminar.)
Institute of Small Enterprises and Development (1996): "New Opportunities and Challenges for Small Business Associations in India" (Proceedings of the Indo-British Workshop held in Cochin, March 25, 1996), (Cochin, Institute of Small Enterprises and Development)
Issac, T.M. Thomas (1999): "The Socio Economic and Political Context of Peoples Planning Campaign" (paper presented at Achuta Menon Smrithi, Trichur, August 15-16, 1999)
Issac, T.M, and M. Tharakan (1986): "An Enquiry into the Historical Roots of Industrial Backwardness of Kerala: A Study of Travancore Region", Working Paper No. 215 (Trivandrum, Centre for Development Studies).
Issac, T.M. and M. Tharakan (1995): "Kerala: Towards a New Agenda", Economic and Political Weekly, August 5-12
Kannan, K.P. (1999): "Keralathinte Vikasanarashtreeyam", (paper presented at Achuta Menon Smrithi, Trichur, August 15-16, 1999)
Kibly, P. (1971): "Hunting the Fefalump", in Peter Kibly (ed) Entrepreneurship and Economic Development (New York, The Press).
KIRTADS (1990): A Study on the Impact of Village and Small-scale Industries Under SCP and TSP Programmes on SCS and STS of Kerala (Calicut, KIRTADS).
Knorringa Peter (1995): Economics of Collaboration in Producer-Trader Relations: Transaction regimes between market and hierarchy in the Agra footwear cluster, India (Amsterdam, The Free University of Amsterdam).
Knorringa, P. & Kox, H(1992): Transaction Regimes: An Instrument for Research in Industrial Organisation, Research Memorandum, 1992-94, (Amsterdam, Faculty of Economics and Econometrics, Free University of Amsterdam).
Knorringa,P.(1991): "Small Enterprises in the Indian Footwear Industry. A Case Study of the Agra Cluster". Report to the Ministry of Development Co-operation (Amsterdam, Free University of Amsterdam).
Mathew P. M. and M.K.S Nair. (1995): A Situational Analysis of Small Industry Associations in India (Cochin, Institute of Small Enterprises and Development)
Mathew P.M. ( 1994): Flexible Specialisation: Can It Be The Alternative?: A Study On Cane and Bamboo Industry (Tokyo, Asian Productivity Organisation).
Mathew P.M. (1996): " More Politics of Business Than Business", Economic and Political Weekly, August 03
Mathew P.M. (1996): "The Indian Experience of SME Promotion: Lessons for the International Community".(Paper presented at the International Seminar on Entrepreneurship and Small Enterprise Development, Salatiga, Indonesia, November 6-7, 1996)

Mathew P.M. (1997): "Dependent Entrepreneurship and Industrialisation Strategies: Some Preliminary Observations" (Occasional Paper) (Cochin, Institute of Small Enterprise and Development)
Mathew P.M. (1997): "Unorganised Industry", Alternative Economic Survey, 1996- 97 (New Delhi, Delhi Science Forum)
Mathew P.M.(1996) : "Liberalisation from Below: An Alternative Agenda" ( Cochin, Institute of Small Enterprises and Development).
Mathew, P.M. (1984): "Industrial Policy, Planning and the Structure of Industrial Growth: The Kerala Experience", Man and Development, June/July.
Mathew, P.M. (1987): The Industrial Informal Sector in a Developing Economy: An Inter-regional Study (ICSSR Report) (Surat, Centre for Social Studies).
Mathew, P.M. (1988): "Integrated Entrepreneurship Development Programmes", Economic and Political Weekly, October 1.
Mathew, P.M. (1990): "State Sector Enterprises in Kerala", Economic and Political Weekly, June 16-23.
Mathew, P.M. (1990): Understanding Informalism : An Inquiry into some Aspects of the Industrial Development of Kerala. (a project of Planning Commission, New Delhi) (Cochin, Institute of Small Enterprises and Development).
Mathew, P.M. (1995): Parentage and Entrepreneurial Performance: A Study on Small-scale Industry (Cochin, Institute of Small Enterprises and Development).
Mathew, P.M. (ed.) (1995): Informal Sector in India : Critical Perspectives (New Delhi, Khama Publishers).
Mathew, P.M. and N. Rajagopal (1996): Decentralised Planning for Small Enterprise Development : An Experiment at Kalady, South India, (Cochin, Institute of Small Enterprises and Development).
Mathew, P.M.(1994): Flexible Specialisation: Can it be the Alternative?: A Study on Cane and Bamboo Industry, (Tokyo, Asian Productivity Organisation).
Mathew, P.M.(1995) : Parentage and Entrepreneurial Performance: A Study on Small-scale Industry in Kerala(ICSSR Project) (Cochin, Institute of Small Enterprises and Development).
Mathew, P.M.(1995): Productivity and Economic Transformation: Towards A Flexible Specialisation Model for Rural Industries (Monograph) Tokyo, Asian Productivity Organisation).
Mathew, P.M.(1996): "India Needs a Small Enterprise Commission"(Cochin, Institute of Small Enterprises and Development).
Mathew, P.M.(1996): "More Politics of Business than Business", Economic and Political Weekly, August 3).

Mathew, PM and N. Rajagopal (1996): "Decentralised Planning For Small Enterprises Development; An Experiment at Kalady, Kerala, South India"(Cochin, Institute of Small Enterprises and Development).
Mathew,P.M.(1996): Aasoonthranathinte Puthiya Maanavum Vyavasayavalkaranavum (Cochin, Institute of Small Enterprises and development).
Mathew.,.P.M. (1999): Rural Development Programmes in Idukki District, Kerala: An Impact Assessment Study (New Delhi, Ministry of Rural Development, Govt. of India)
Mencher, Joan P.(1980): "Lessons and non-lessons of Kerala", Economic and Political Weekly, 15(41-42)
Nair, R. Viswanathan (1982): Reed Craft Among the Parayas of Calicut (Calicut, KIRTADS).
Oommen , M.A. (1995): Devolution of Resources from the State to the Panchayati Raj Institutions(New Delhi, Institute of Social Sciences).
Oommen, M.A(1996): Panchayati Raj Development Report 1995( New Delhi, Institute of Social Sciences).
Prakash B.A. (ed) (1994): Kerala's Economy: Performance, Problem and Prospects. (New Delhi, Sage Publication)
Prakash, B.A. (ed) (1999): Kerala's Economic Development (New Delhi, Sage Publication)
Ramankutty, V (1999): " "Keralathinte Arogyavikasanam", (paper presented at Achuta Menon Smrithi, Trichur, August 15-16, 1999)
Saith, Ashwani (1992): Rural Non-farm Economy: Process and policies (Geneva, International Labour Organisation).
Sandee, Henry (1995): Innovation Adoption in Rural Industry (Amsterdam, Free University of Amsterdam)
State Planning Board ( 1996 ) : Power to the People ( Trivandrum, State Planning Board)
Subrahmanian, K.K. (1990): "Development Paradox in Kerala: Analysis of Industrial Stagnation", Economic and Political Weekly, September 15.
Subrahmanian, K.K. and P.Mohanan Pillai (1986): "Kerala's Industrial Backwardness: Exploration of Alternative Hypotheses", Economic and Political Weekly, April 5.
Subramanian, K.K. and P.M. Pillai (1986): "Kerala's Industrial Backwardness; Exploration of Alternative Hypothesis", Economic and Political Weekly, 21 (14).
Sukumaran Nair, M.K. and P.M. Mathew (1991): Change and Choice in Gender Structure : An Inquiry into the Declining Female Labour Participation in Kerala Industry (a project of Ministry of Welfare, Government of India) (Cochin, Institute of Small Enterprises and Development).

Tornquist, O and P.K.M. Tharakan( 1996): "Democratisation and Attempts to Remove the Radical Political Development Project: Case of Kerala", Economic and Political Weekly, XXXI(29), July 20.
UNIDO (1996): Restructuring and Modernisation of SME Clusters in India. (New Delhi, UNIDO)
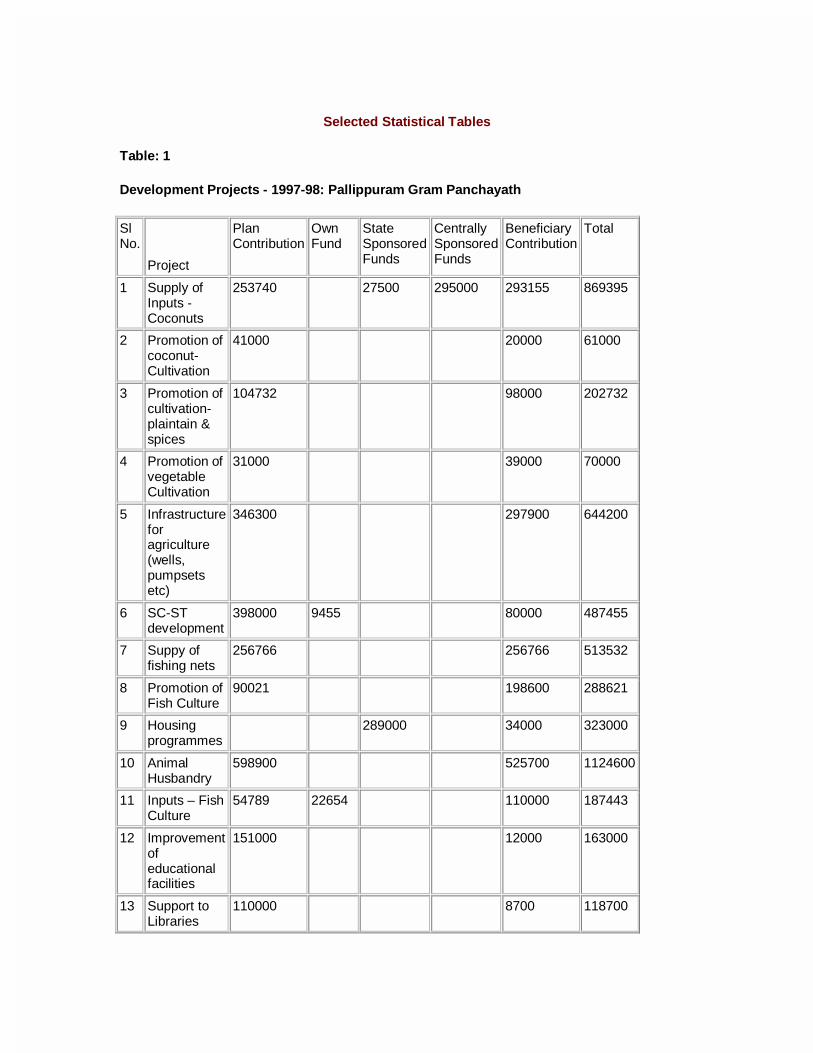
Selected Statistical Tables
Table: 1
Development Projects - 1997-98: Pallippuram Gram Panchayath
Sl No.
Project
Plan Contribution
Own Fund
State Sponsored Funds
Centrally Sponsored Funds
Beneficiary Contribution
Total
1 Supply of Inputs - Coconuts
253740 27500 295000 293155 869395
2 Promotion of coconut- Cultivation
41000 20000 61000
3 Promotion of cultivation-plaintain & spices
104732 98000 202732
4 Promotion of vegetable Cultivation
31000 39000 70000
5 Infrastructure for agriculture (wells, pumpsets etc)
346300 297900 644200
6 SC-ST development
398000 9455 80000 487455
7 Suppy of fishing nets
256766 256766 513532
8 Promotion of Fish Culture
90021 198600 288621
9 Housing programmes
289000 34000 323000
10 Animal Husbandry
598900 525700 1124600
11 Inputs – Fish Culture
54789 22654 110000 187443
12 Improvement of educational facilities
151000 12000 163000
13 Support to Libraries
110000 8700 118700

14 Health – General
131415 212765 200000 544180
15 Co-operative stores
100600 350000 450600
16 Anganwadis 620700 90800 711500
17 Energy – general
315640 91000 406640
18 Public Works – Roads
1010900 513400 200200 1724500
19 Total 4615503 758274 666500 295000 6335277
Source: Pallippuram Gram Panchayath - Padhati Rekha – 1997-98
Table: 2
Development Projects - 1998-99 : Pallippuram Gram Panchayath
Sl
No.
Project
Plan Contribution
Own Fund
State Sponsored Funds
Centrally Sponsored Funds
Beneficiary Contribution
Total
1 Supply of Inputs-Coconuts
295545 38500 560000 448955 1343000
2 Promotion of coconut- Cultivation
45000 15000 60000
3 Promotion of cultivation -plaintain & spices
123632 120000 243632
4 Promotion of vegetable Cultivation
40000 42300 82300
5 Infrastructure for agriculture (wells,pumpsets etc)
366500 366500 733000
6 SC-ST development
455699 9075 97960 562734
7 Supply of fishing nets
243750 243750 487500
8 Promotion of Fish Culture
1067101 394500 1461601
9 Housing programmes
345000 50000 395000
10 Animal 588400 565400 1153800

Husbandry
11 Inputs – Fish Culture
88133 31877 150000 270010
12 Improvement of educational facilities
247000 18000 265000
13 Support to Libraries
110000 17700 127700
14 Health – General
243435 333765 298000 875200
15 Co-operative stores
176090 502000 678090
16 Aganwadis 713700 108800 822500
17 Energy – general
415400 143000 558400
18 Public Works – Roads
1423900 811600 245500 2481000
19 Total 6643285 1186317 885500 560000 3325365 12600467
Source : Pallippuram Gram Panchayath : Padhathi Rekha 1998-1999
Table: 3 Development Projects - 1999-2000 : Pallippuram Gram Panchayath
Sl No.
Project
Plan Contribution
Own Fund
State Sponsored Funds
Centrally Sponsored Funds
Beneficiary Contribution
Total
1 Special Assistance for Paddy Cultivation
87000 12600 10800 110400
2 Supply of Inputs- Cocunuts
506000 60000 114000 680000
3 Promotion of Vegatable Cultivation
261750 58500 320250
4 Conscientisation of Programme for farmers
7101 7101
5 Cutting of deceased Coconut trees
861851 372600 660550 1895001
6 Promotion of Dairy Activities
316031 442500 758531

7 Promotion of Fish Culture
649530 454920 1104450
8 Supply of inputs for Fishermen
50000 50000 100000
9 Physical Infrastructure for Fishermen Households
100000 335000 100000 535000
10 Marketing Assistance- Fishermen
12500 450000 92500 555000
11 Matsya Bhavans
250000 250000
12 Promotion of Women's Enterprises
60000 312000 372000
13 Housing for the Poor
1600000 2077000 75000 3752000
14 Support to Libraries
105000 5000 5000 5000 120000
15 Infrastructure for Schools
160000 5000 165000
16 Support for Anganawadis
170000 51300 75000 296300
17 Nutrition Programmes
240000 240000
18 Mosquito Control
20000 20000
19 Construction of Toilets
320000 320000 640000
20 Infrastructure for Government Hospitals
20000 25000 45000
21 Comfort Stations
20000 250000 275000
Table 3 (Contd.)
22 Renovation /Clearance of Wells and Tanks
30000 250000 10000 290000
23 Input Support for Coir & Handloom Cooperatives
150000 150000
24 Construction of 2250000 95000 2345000
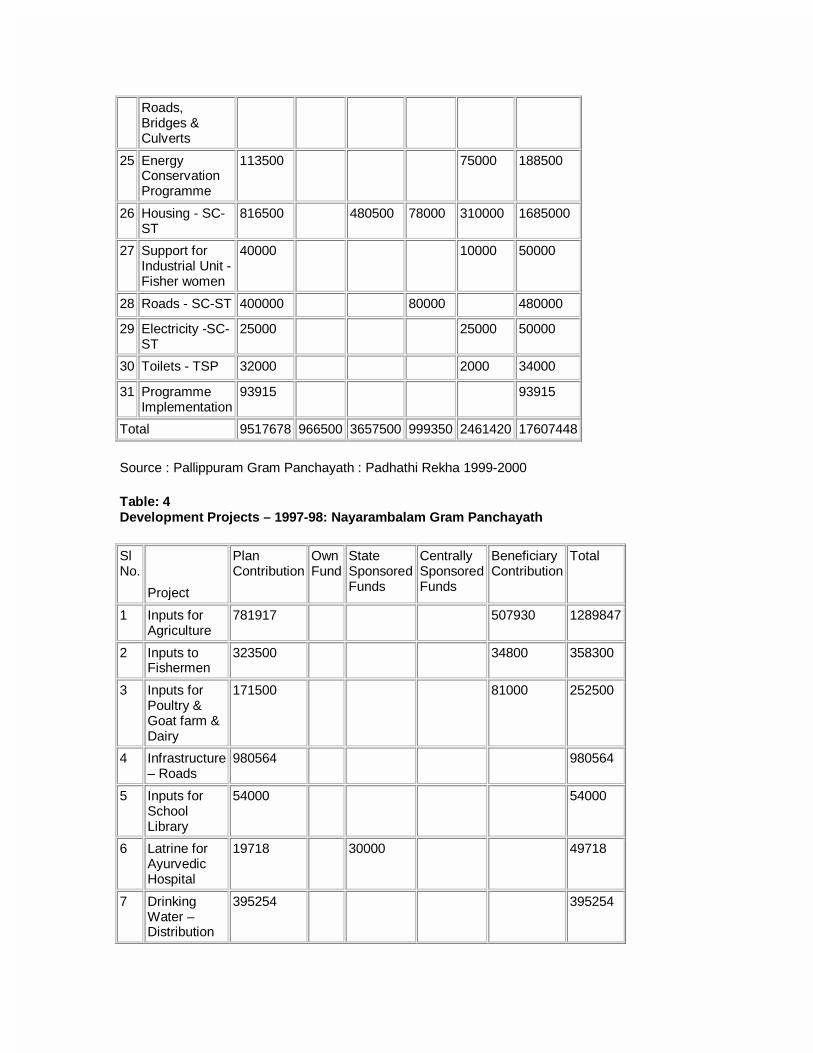
Roads, Bridges & Culverts
25 Energy Conservation Programme
113500 75000 188500
26 Housing - SC-ST
816500 480500 78000 310000 1685000
27 Support for Industrial Unit -Fisher women
40000 10000 50000
28 Roads - SC-ST 400000 80000 480000
29 Electricity -SC-ST
25000 25000 50000
30 Toilets - TSP 32000 2000 34000
31 Programme Implementation
93915 93915
Total 9517678 966500 3657500 999350 2461420 17607448
Source : Pallippuram Gram Panchayath : Padhathi Rekha 1999-2000
Table: 4 Development Projects – 1997-98: Nayarambalam Gram Panchayath
Sl No.
Project
Plan Contribution
Own Fund
State Sponsored Funds
Centrally Sponsored Funds
Beneficiary Contribution
Total
1 Inputs for Agriculture
781917 507930 1289847
2 Inputs to Fishermen
323500 34800 358300
3 Inputs for Poultry & Goat farm & Dairy
171500 81000 252500
4 Infrastructure – Roads
980564 980564
5 Inputs for School Library
54000 54000
6 Latrine for Ayurvedic Hospital
19718 30000 49718
7 Drinking Water – Distribution
395254 395254

8 Construction of Latrines
435842 4000 439842
9 Construction of Houses
507500 432500 940000
10 Xerox machine for Panchayath Office
100000 100000
11 Inputs for Education
49500 49500
12 Total 3819295 34000 1056230 4909525
Source: Nayarambalam Gram Panchayath - Padhati Rekha – 1997-98
Table: 5 Development Projects - 1998-99 : Nayarambalam Gram Panchayath
Sl No.
Project
Plan Contribution
Own Fund
State Sponsored Funds
Centrally Sponsor-ed Funds
Beneficiary Contribution
Total
1 Agricultural Inputs
603750 77 403673 200000 1207500
2 Irrigation facilities
485000 452500 32500 970000
3 Anti-rabies drive
20000 20000 40000
4 Dairy Development
75000 25000 50000 150000
5 Inputs - fishermen
502000 256000 246000 1004000
6 Construction of Wells
135000 67500 67500 270000
7 Promotion of Womens’ Enterprises
330000 165000 165000 660000
8 Support to Schools –Infrastructure
28000 2000 26000 56000
9 Cash awards for Students
17000 17000 34000
10 Cultural Activities
50000 6000 35000 9000 100000
11 Infrastructure for Hospitals
225000 225000 450000
12 Infrastructure for
250000 2000 168000 80000 500000

Fishermen Households
13 Nutrition - Anganwadis
177500 4 177496 355000
14 Housing Programmes for the poor
1015000 655000 360000 2030000
15 Development Activities for panchayath
25000 25000 50000
16 Dustbins for Schools
4500 3000 1500 9000
17 Public Works- Road Tarring
1174786 208543 385480 520876 59977 2349662
18 Street lighting
100000 100000 200000
19 Inputs for Overall development
2048206 21 2028455 150000 459250 4685932
20 Total 7265742 235645 5218104 670876 1730727 15121094
Source : Nayarambalam Gram Panchayath : Padhathi Rekha 1998-1999
Table: 6 Development Projects - 1999-2000 Nayarambalam Gram Panchayath
Sl. No
Project Plan Allocation
Own fund
State sponsored
Centrally sponsored
Benefici-ary contr-ibution
others Total allocation
1. Cutting diseased Coconut tree
100000 - 50000 150000 300000
2. Treatment for diseased trees
111389 - - - 55200 - 165589
3. Distribution of Vegetable Seed Kit
20000 - - - 5000 - 25000
4. Seminar/Discussion –farmers
10000 - - - - - 10000
5. Building for Krishi Bhavan
400000 - - - - - 400000
6 Cattle Insurance 36000 - - - 9000 - 45000 7. People's Fish
culture - - 25000 - - - 25000
8. Distribution of inputs for fish vendors
- - 26415 - 19300 - 45715
9. Awareness 10000 - - - - - 10000

Programme for fishermen
10. Protective walls for canals
533500 125 - - - - 533625
11 Distribution of Pumpsets-farmers
30000 - - - 30000 - 60,000
12 Training – Electronic Equipments
32280 - - - - - 32280
13 Industrial Umbrella 550000 - - - 275000 275000 1100000 14 Fish booth - - 50000 - - - 50000 15 Building for
Hospitals and Aganawadis
469772 48 217180 - - - 687000
16 Mosquito control 25000 - - - - - 25000 17 Distribution of mid-
day meal 8000 - - - - - 8000
18 Keralostav 15000 6000 - - - 4000 25000 19 Grant for
construction of toilets
115000 75000 - - - - 190000
20 General expenditure for People's Planning
117000 - - - 44000 - 161000
21 Women's Seminar 15000 - - - - - 15000 22 Construction and
maintenance of Roads
1250189 118543 150000 461658 - 5977 1851367
23 New Electricity lines
100000 - - - - - 100000
24 Special component plan
1780678 120974 - 135000 1650 30000 2068302
25 House construction 292500 - - - - 232500 525000 Total 6021308 320690 518595 596658 589150 547477 8457878
Source : Nayarambalam Gram Panchayath : Padhathi Rekha 1999-2000
Table: 7 Development Projects – 1997-98: Elamkunnapuzha Gram Panchayath
Sl No.
Project Plan Contribution
Own Fund
State Sponsored Funds
Centrally Sponsored Funds
Beneficiary Contribution
Total
1 Inputs for Agriculture
617000 617000
2 Inputs for Irrigation, Agricultural training
919672 919672

3 Animal Husbandry
535000 535000
4 Inputs to fishermen
285625 285625
5 Hygiene, Mosquito control
1156757 1156757
6 Women welfare
258688 258688
7 Distribution of Umbrellas
29271 29271
8 Development of Sports & Cultural activities
16000 16000
9 Xerox machine
100000 100000
10 Infrastructure for Anganwadis
148831 148831
11 Infrastructure for Energy production
623724 623724
12 Infrastructure for Road Transport
662966 662966
13 Goat Rearing - SC
45000 45000
14 Houses for SCs
902500 902500
15 Supply of Latrines - SC
226000 226000
16 Electrification of SC Houses
173250 173250
17 Repairing of Houses – SC
150000 150000
18 Inputs for Education – SC
24600 24600
19 Distribution of Sewing Machines -SC
74304 74304
20 Transport - SC
56773 56773

21 Inputs for STs
25200 25200
22 Total 6475861 6475861
Source: Elamkunnapuzha Gram Panchayath - Padhati Rekha – 1997-98
Table: 8 Development Projects - 1998-99: Elamkunnapuzha Gram Panchayath
Sl No.
Project Plan Contribution
Own Fund
State Sponsored Funds
Centrally Sponsored Funds
Beneficiary Contribution
Total
1 Promotion of Vegetable Cultivation
165750 99750 66000 331500
2 Promotion of Agriculture Paddy & Tuber Crops
71850 35225 15625 122700
3 Construction of Canals & Sluice
1810000 256816 1290000 452000 3808816
4 Inputs to Fishermen 525000 282500 242500 1050000
5 Distribution of SanitaryEquipments
375000 375000 750000
6 Inputs for Anganwadis &School for the retarded
3300000 150000 450000 3900000
7 Mosquito Control & maintenance of Hygiene
320000 110000 210000 640000
8 Construction of Roads
3065000 785000 1277500 284000 5411500
9 Aid for Building Houses
217500 217500 43500
10 Aid for Anganwadis & for Education
305000 114777 190223 610000
11 Cultural Activities 87500 87500 175000
12 Expenses for the functioning of Gram Sabha
75000 75000 150000
13 ST – Development Programmes
2133500 114553 1195572 99475 2347528
14 Total 12451100 1531146 5785770 1159600 19340544
Source : Elamkunnapuzha Gram Panchayath : Padhathi Rekha 1998-1999

Table: 9 Development Projects - 1999-2000: Elamkunnapuzha Gram Panchayath
Sl. No.
Project Beneficiary contribution
Plan allocation
Total
1 Integrated Development of Coconut
265000 632500 897500
2 Grafting-Budding Trng. 15000 15000 30000 3 Training for farmers - 35000 35000
4 Distribution of Planting materials
13125 13125 26250
5 Production incentive for paddy growers
- 17500 17500
6 Distribution of vegetable seed Kit
- 50000 50000
7 Irrigation 97500 97500 195000
8 Compound wall for cultural centre
- 150000 150000
9 Watershed programmes 75000 230000 305000
10 Awareness programme for fishermen
- 15000 15000
11 Distribution of fishing craft 312500 412500 725000 12 Women's industrial centre - 500000 500000
13 Live-stock development 179000 584427 763427 14 Mosquito control - 200000 200000
15 Maintenance of Aganwadis - 1105000 1105000 16 Housing 1318500 1696500 3015000
17 Construction of Roads - 1865000 1865000
18 Special component Plan - 1911500 1911500 Total 2275625 9530552 11806177
Source : Elamkunapuzha Gram Panchayath : Padhathi Rekha 1999-2000
Table: 10 Development Projects - 1997-98: Narakkal Gram Panchayath
Sl No.
Project Plan Contribution
Own Fund
State Sponsored Funds
Centrally Sponsored Funds
Beneficiary Contribution
Total
1 Promotion of Agriculture
311705 73605 385310
2 Dairy Development
100590 452590 553180
3 Development 214200 163800 378000

of Irrigational facilities
4 Vegetable cultivation
3000 100 100 3200
5 Construction & Maintenance of Roads
985177 590 133893 1119660
6 Street Lighting
355340 57012 412352
7 Compound walls for L.P. School
62827 62827
8 Construction of Latrines
220000 220000
9 Deposit for Water Taps
500000 500000
10 Chicken Hatchery
48350 48350
11 Funds for marriage
6560 2800 9360
12 Construction of bund- Housing colony
137427 137427
13 House - for ST& Mythri Scheme
232000 232000
14 Inputs to Fishermen
350000 350000
15 Supply of Sewing Machines - for Women
99463 99463
16 Sewing Machines for SC-ST
417766 417766
17 Xerox machine for Panchayath Office
100000 100000
18 Total 3726639 60502 133893 690095 4611129
Source: Narakkal Gram Panchayath - Padhati Rekha – 1997-98

Selected Statistical Tables
Table: 11
Development Projects - 1998-99: Narakkal Gram Panchayath
Sl No.
Project
Plan Contribution
Own Fund
State Sponsored Funds
Centrally Sponsored Funds
Beneficiary Contribution
Total
1 Inputs for cultivation
32433 67348 199781
2 Awareness Programmes
19060 19060
3 Scientific Butcher’s Shop
234614 234614
4 Supply of Inputs to Fishermen
195100 43575 238675
5 Small Scale Industrial Units
344022 45000 389022
6 Nutrition for students
29893 29893
7 Contribution to Liberaries
65000 65000
8 Sliding Chutes for G.L.P. Schools
29250 29250
9 Inputs for Homeo Dispensary
31769 15000 46769
10 Construction of Latrines
70000 28500 98500
11 Construction of Houses for the Homeless
160250 3750 50000 214000
12 Nutrition & Inputs to Anganwadis
114053 5000 119053
13 Upgradation for Houses
221000 221000
14 Expenses for Seminar & Printing – Gram Sabha
45770 45770

15 Expenses for Electrification
96049 13441 109490
16 Construction of Roads
730462 13166 12368 12060 768056
17 Extension of Panchayath 0ffice Building
4894 4894
18 Total 2523619 95357 12368 201483 2832827
Source : Narakkal Gram Panchayath : Padhathi Rekha 1998-1999
Table: 12
Development Projects 1999-2000: Narakkal Gram Panchayath
Sl.no Project Plan Allocation
Beneficiary Contribution
Own fund
State Sponsored
Centrally Sponsored
Others Total
1 Treatment of deceased trees
250114 34122 100000 384236
2 Garden Kitchen
61443 61250 122693
3 Distribution of vegetable kit
20000 350000 370000
4 Bonus-farmers
40600 34800 75400
5 Plumpest farmers
7000 7000 14000
6 Integrated pepper development plan
750 3750 4500
7 Scientific Butcher’s shop
341400 341400
8 Insurance-cattle
42600 32100 74700
9 Prevention of rabies
1000 1500 2500
10 Supply of chicken
15000 5000 20000
11 Infrastructure development for fishermen
322625 63800 20000 180714 587139
12 Small scale industries
350793 34000 5000 389973

13 Contribution to libraries
50000 50000
14 Construction of Latrines
93043 61000 35457 170000 359500
15 JRY/water supply
250000 250000
16 Aganvadies 125000 77939 110389 313328
17 House construction/ maintenance
1046250 80000 1126250
18 Peoples planning
96240 96240
19 Transportation 1100753 121738 1055508 27000 634158 107535 3046692 20 SC- pumpset 52500 17500 70000
21 SC- SSI units 732670 15000 747670
22 SC-construction of latrine/house
286500 6749 255251 548500
23 SC- colony development
926421 53425 30000 1009846
24 ST-colony development
1000 500 500 2000
25 ST-house construction
37240 37240
Total 6202592 938685 1226153 540703 893159 142335 10023636
Source : Narakkal Gram Panchayath : Padhathi Rekha 1999-2000

Table 13
Development Projects of Vypeen Block: 1997-98
Sl no
Name of the Scheme
Year Location of the Project/Scheme
Sector Allocation (Rs)
Objective
1 Supply of vegetable seed kits
97-98
Block area Agricultural & Allied sectors
1,20,000 To increase vegetables Productivity
2 Soil Conservation supply of bio-fertilizers
97-98
Do Do 5,00,000 To increase fertility of soil
3 1. Financial help for cattle seeds 2. Fodder awareness programme
97-98
Do Do 1,68,560 To protect health of cattle
4 Dairy-Milk collecting & preserving unit
97-98
Do Do 2,50,000 To improve milk marketing
5 Fishing-financial help for Motor & Pump-set
97-98
Do Do 2,50,000 Promotion of fish culture
6 Fishlanding Centre
97-98
Do Do 2,30,000 Fish marketing assistance
7 Society 97-98
Do Do 50,000 To improve co-operative sector
8 Self employment for youths-Electronics
97-98
Do Rural Development
1,50,000 Training for Youths
9 Widening / deepening of Canals
97-98
Do Irrigation 1,76,400 To increase deepness of Canals
10 Awareness Camps-Energy
97-98
Do Energy 50,000 Availability of energy
11 Engineering Unit-3 nos
97-98
Do Small-scale Industries
2,25,000 To find out first generation entrepreneurs
12 Cheruvyppu Bridge (Construction) -Ward 6,7 &8
97-98
Kuzhuppilly Transportation 5,00,000 To develop infrastructure of Panchayath
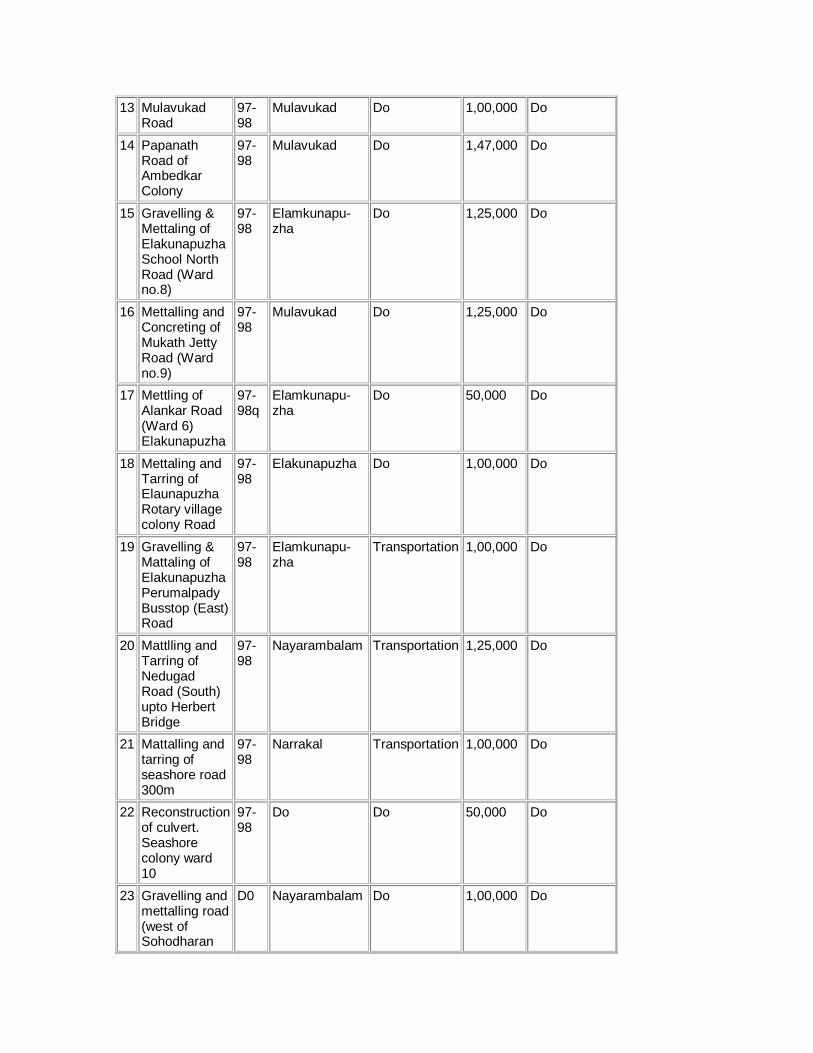
13 Mulavukad Road
97-98
Mulavukad Do 1,00,000 Do
14 Papanath Road of Ambedkar Colony
97-98
Mulavukad Do 1,47,000 Do
15 Gravelling & Mettaling of Elakunapuzha School North Road (Ward no.8)
97-98
Elamkunapu-zha
Do 1,25,000 Do
16 Mettalling and Concreting of Mukath Jetty Road (Ward no.9)
97-98
Mulavukad Do 1,25,000 Do
17 Mettling of Alankar Road (Ward 6) Elakunapuzha
97-98q
Elamkunapu-zha
Do 50,000 Do
18 Mettaling and Tarring of Elaunapuzha Rotary village colony Road
97-98
Elakunapuzha Do 1,00,000 Do
19 Gravelling & Mattaling of Elakunapuzha Perumalpady Busstop (East) Road
97-98
Elamkunapu-zha
Transportation 1,00,000 Do
20 Mattlling and Tarring of Nedugad Road (South) upto Herbert Bridge
97-98
Nayarambalam Transportation 1,25,000 Do
21 Mattalling and tarring of seashore road 300m
97-98
Narrakal Transportation 1,00,000 Do
22 Reconstruction of culvert. Seashore colony ward 10
97-98
Do Do 50,000 Do
23 Gravelling and mettalling road (west of Sohodharan
D0 Nayarambalam Do 1,00,000 Do

Ayyappan road)
24 Mettalling and tarring of poochethara-vazhathara road ward 3
Do Do Do 1,47,000 Do
25 Gravelling and mettalling of co-operation road ward3
Do Kuzhuppily Do 2,25,00 Do
26 Thaithara colony road ward 13
Do Pallipuram Do 1,47,000 Do
27 Mettalling and Tarring of OLH colony road ward 4
Do Edavakkad Do 2,25,00 Do
28 Mechally SC-colony road ward 2
Do Do Do 1,47,000 Do
29 St; Francis road ward 4
Do Narrakkal Do 30,000 Do
30 Parrakkal road ward 3
Do Do Do 75,000 Do
31 Tharish road ward 7
Do Do Do 60,000 Do
32 Rajeevji road ward 8
Do Do Do 60,000 Do
33 Pulayas colony road ward 1
Do Do Do 65,000 Do
Development Projects of Vypeen Block: 1997-98 (Contd.)
34 Thathankiri settlement colony road
Do Do Do 82,000 Do
35 Convent road ward 4,6. Do Pallipuram Do 2,25,000 Do
36 Raktheswary road reconstruction
Do Do 1,47,000 Do
37 Pallampilly settlement colony road ward 12
Do Elankunnapuzha Do 47,000 Do
38 School mittam boat jetty road ward 5
Do Do Do 2,00,000 Do

39 Improve education facilities Do Social Service
50,000 To improve educational level
40 Improve education facilities Do Do 2,00,000 Do
41 Development of physical situation Health
Do Do 1,08,800 Do
42 Development of Hospital,community health center and Health camp
Do Do 3,00,000 To improve health of rural peoples
43 Cleaning of wells Do Do 50,000 To increase drinking water availability
44 Buying vehicles for cleaning purpose
Do Do 2,47,600 To remove wastes
45 Maintains of House Do Do 2,00,000 Shelter for poor people
46 Improving the Physical condition of houses in SC/ST colony
Do Do 5,19,000 To improve life style SC/ST
47 Training and supply of tailoring machines
Do Do 1,00,000 To promote job for women
48 Development of Anganvadies
Do Do 1,00,000 To improve health of children
49 Old age home Do Do 1,00,000 To give shelter for old people
50 Reference books for library Do Do 1,00,000 To increase ruralpeople’s reading habit
51 Keralotsav, Souvenir Do Do 40,000 To improve art and sport level of people
52 Environmental programme Do Do 48,200 Awareness

cleanliness
53 EntrepreneurshipAwareness Programme
Do Do 48,000 EDPs
54 Setting up Engineering Units
Do Social Service (for SC/ST)
6,00,000 Self employment for SC/ST
55 Computer Centre Do Do 4,00,000 Do
56 Supply of tool-kit Do Do 2,20,000 Do
57 Supply of goats Do Do 26,000 Do
Source : Vypeen Block Pachayath: Padhathi Rekha 1997-2000
Table: 14 Development Projects of Vypeen Block – 1998-99
Sl no
Name of the Scheme Year Location of the Project/Scheme
Sector Allocation (Rs)
1 Supply of machinery to societies for development of paddy cultivation
98-99
Block area Agricultural Sector
1,75,000
2 Pest control measures for coconut trees
98-99
Block area Do 2,52,656
3 Agricultural Seminar 98-99
Block area Do 20,000
4 Milk-Freezing unitPallippuram 98-99
Pallippuram Do 1,56,250
5 Modern Butcher’s shop Edavanakkad
98-99
Edavanakkad Tertiary 3,00,000
6 Modern Butcher’s shop Edavanakkad
98-99
Elankunnappuzha Do 3,00,000
7 Deepening of Bandar Canal 98-99
Block Area Irrigation 1,40,000
8 Fish farm 98-99
Block Area Agri 2,50,566
9 Deepening of Karuthala Canal
98-99
Block Area Irrigation 1,20,000

10 Deepening of Canal near Pashuekkar Bund
98-99
Nayarambalam Agri 1,00,000
Development Projects – Vypeen Block – 98-99 (contd.)
11 Pozhiyil Canal-Side protection
98-99
Block Area Agri 1,50,000
12 Reinforcement of Kurudamparambilsociety buildings
98-99
Block Area Services 1,00,000
13 SC-ST Bund protection 98-99
Block Area Irrigation 1,00,000
14 Side protection Nikathil- Kuzhuppilly Canal
98-99
Kuzhuppilly Irrigation 1,70,000
15 Reinforcement of Aniyil Canal 98-99
Block Area Irrigation 1,15,000
16 West-chira Veliyathamparambu – side protection
98-99
Block Area Irrigation 1,00,000
17 R.M.P. West-chiraside protection
98-99
Block Area Irrigation 1,00,000
18 4 cent Colony side protection 98-99
Block Area Services 1,00,000
19 Kaimalam Canalside protection
98-99
Block Area Irrigation 1,50,000
20 West-coast side protection 98-99
Block Area Agri 1,00,000
21 Janatha CanalProtection 98-99
Block Area Agri 1,00,000
Development Projects – Vypeen Block – 98-99 (contd.)
22 Ayyampilli Canalside protection
98-99
Block Area Agri 2,00,000
23 Ayyampilli Bamblai Canal side protection
98-99
Block Area Agri 2,10,000
24 Thollayirampadam - chira 98-99
Block Area Agri 1,00,000
25 Boat Jetty –side protection Elamkunnappuzha
98-99
Elamkunnappuzha Services 1,00,000
26 School – North – side protection Elamkunnappuzha
98-99
Elamkunnappuzha Services 1,50,000

27 Side protection From Vadayil Canal to Karuthala Canal
98-99
Block Area Services 2,00,000
28 Ananda Chinnar Maniside protection
98-99
Block Area Agri 1,00,000
29 Thathamgiri Canalside protection
98-99
Block Area Agri 1,00,000
30 Moorippadam Canalside protection
98-99
Block Area Agri 2,50,000
31 Village office Canalside protection
98-99
Block Area Agri 1,00,000
32 Sluice construction Elamkunnappuzha
98-99
Elamkunnappuzha Agri 1,83,000
Development Projects – Vypeen Block – 98-99 (contd.)
33 Sluice construction – 2nd & 7th wards - Nayarambalam
98-99
NayarambaLam Agri 1,83,000
34 Sluice construction3rd ward –Elamkunnappuzha
98-99
Elamkunnapuzha Agri 1,10,000
35 Sluice construction4th ward – Near Boat Jetty - Mulavukad
98-99
Mulavukad Agri 1,83,000
36 Sluice over Olatthodu 98-99
Block Area Agri 268000
37 Thrikkadappilly Canal protection
98-99
Block Area Agri 1,40,000
38 Side protection – Vettuva Colony - chira
98-99
Block Area Agri 1,00,000
39 Theatre Canal Mulavukad 98-99
Mulavukad Agri 1,00,000
40 Lovania Canal – side protection Edavanakkad
98-99
Edavanakkad Agri 1,00,000
41 Vallarpadam Church Canal – side protection
98-99
Block Area Agri 1,00,000
42 Fish-farm side Canalside protection
98-99
Block Area Agri 1,00,000
43 Velam Canalside protection 98-99
Block Area Agri 1,00,000

Development Projects – Vypeen Block – 98-99 (contd.)
44 Side protection nearAnganwadi –Nayarambalam
98-99 Nayarambalam Services 1,50,000
45 Valiyaparambil side protection
98-99 Block Area Irrigation 1,50,000
46 Pookkottu chiraside protection
98-99 Block Area Agri 1,00,000
47 Kunnappillyside protection 98-99 Block Area Agri 1,30,000
48 Market Canal side Protection - Narakkal
98-99 Narakkal Services 1,20,000
49 Women’s Industrial Park Pallippuram
98-99 Pallippuram Industries 2,50,000
50 Women’s Industrial UnitNarakkal
98-99 Narakkal Industries 2,50,000
51 IRDP Sales Centre 98-99 Block Area Agri 1,70,000
52 Refresher course for U.P. School teachers
98-99 Block Area Services 25,000
53 Reading Room –Improvement of facilities
98-99 Block Area Services 1,05,000
54 Improvement of facilities – PallippuramHospital
98-99 Pallippuram Services 75,000
Development Projects – Vypeen Block – 98-99 (contd.)
55 Improvement of facilities – Narakkal Govt. Hospital
98-99 Narakkal Services 1,25,000
56 Improvement of Facilities – Malippuram Health Centre
98-99 Block Area Services 1,75,000
57 Improvement of Facilities – Ayyampilli Hospital
98-99 Block Area Services 75,000
58 Construction of latrines 98-99 Block Area Services 5,58,000
59 Anganawadi building Pulaya Colony – Elamkunnappuzha
98-99 Elamkunnappuzha Services 1,00,000
60 Training for Anganwadi teachers
98-99 Block Area Services 7,000

61 Anganawadi building - Elamkunnappuzha
98-99 Elamkunnappuzha Services 1,50,000
62 Anganawadi building –Pallippuram
98-99 Pallippuram Services 1,50,000
63 Anganawadi building –Nayarambalam
98-99 Nayarambalam Services 1,00,000
64 Construction of walls around Anganwadi
98-99 Block Area Services 60,000
65 Maintenance works –Anganwadi
98-99 Block Area Services 30,000
66 Toys for Anganwadis 98-99 Block Area Services 57,000
Development Projects – Vypeen Block – 98-99 (contd.)
67 Technical Training for the handicapped
98-99 Block Area Services 40,000
68 Awareness programmesfor women
98-99 Block Area Services 21,000
69 Training aid for the Mentally Handicapped
98-99 Block Area Services 34,324
70 Expenses for People’s planning activities
98-99 Block Area Services 75,000
71 Public Cemeterybuilding - Narakkal
98-99 Narakkal Services 1,50,000
72 Sodium Vapour Lamps 98-99 Block Area Services 3,27,250
73 Beach Road - Tarring 98-99 Block Area Services 2,00,000
74 St.Mary’s Church Convent Road
98-99 Block Area Services 1,40,000
75 Padinjare Aarattuvazhi Elamkunnappuzha
98-99 Elamkunnappuzha Services 1,40,000
76 Convent Junction metalling upto Raveendrappalam Pallippuram
98-99 Pallippuram Services 2,25,000
77 Metalling of Beach Road Elamkunnappuzha
98-99 Elamkunnappuzha Services 2,25,000
78 Rakteshwari Sanketam –Road – Metalling Pallippuram
98-99 Pallippuram Services 1,99,673
Development Projects – Vypeen Block – 98-99 (contd.)

79 Murikkumpadam Jetty Road-Elamkunnappuzha
98-99 Elamkunnappuzha Services 31,100
80 Iqbal Road 98-99 Block Area Services 1,10,000
81 Construction of Kadappuram RoadEdavanakkad
98-99 Edavanakkad Services 2,25,000
82 Construction of road from Hospital junction to West AarattuvazhiNarakkal
98-99 Narakkal Services 2,25,000
83 Jaihind Road Re-construction 98-99 Block Area Services 1,20,000
84 Bank Road – West Extension Edavanakkad
98-99 Edavanakkad Services 1,00,000
85 Kadekurisu Foot Bridge 98-99 Block Area Services 7,00,000
86 Kannappilla Kettu Palam Edavanakkad
98-99 Edavanakkad Services 2,65,000
87 Appangadu Bridge 98-99 Block Area Services 4,00,000
88 Cheruvyppu Bridge 98-99 Block Area Services 4,00,000 89 Metalling – Nedungadu –
Narayambalam 98-99 Narayamba-lam Services 45,000
90 Metalling – SahodaranAyyappan Road –Narayambalam
98-99 Narayamba-lam Services 31,265
Development Projects – Vypeen Block – 98-99 (contd.)
91
Metalling & Tarring of Convent Road –Pallippuram
98-99 Pallippuram Services 1,15,000
92 O.L.H. Colony Road –Edavanakkad
98-99 Edavanakkad Services 1,25,000
93
Metalling & Tarring –Sahakarana Road – Kuzhippilly
98-99 Kuzhippilly Services 1,33,000
94 Panchayath Concrete Road - Mulavukad
98-99 Mulavukad Services 50,000
95 Seashore Road –Nayarambalam
98-99 Nayaramba-lam Services 10,000
96 Mukkathu Jetty Road –Mulavukad
98-99 Mulavukad Services 62,000
97 School Mittam Jetty Road -lamkunnappuzha
98-99 Elamkunna-ppuzha
Services 70,000
98 Village Office Building –Pallippuram
98-99 Pallippuram Services 1,50,000
99 98-99 Nayaramba-lam Services 1,50,000

Nayarambalam
100 V.E.O. Office Building –Edavanakkad
98-99 Edavanakkad Services 1,50,000
101 Information Centre –Elamkunnappuzha
98-99 Elamkunna-ppuzha
Services 2,00,000
102 Road – Under Nabard Scheme
98-99 Block Area Services 50,00,000
Development Projects – Vypeen Block – 98-99 (contd.)
103 Combined Agricultural Development Progra-mmes for Villages
98-99 Block Area Agri 24,04,000
104 IRDP - Industry 98-99 Block Area Agri 30,28,000
105 TRYSEM 98-99 Block Area Agri 1,09,200
106 DWCRA 98-99 Block Area Agri 42,46,286
107 Fish Farming &Deepening of Fish-farms
98-99 Block Area Agri 50,000
108 Deepening of Prawn-farm 98-99 Block Area Agri 1,50,000
109 Prawn farming of SC – Co-operative Society - Narakkal
98-99 Narakkal Agri 94,550
110 Sluice – Seashore Colony 98-99 Block Area Agri 1,25,000
111 Sluice – Malippuram Pulaya Colony
98-99 Block Area Agri 1,20,000
112 Sluice – Ambedkar Village - Mulavukad
98-99 Mulavukad Agri 1,25,000
113 Mini Industrial Estate –for women
98-99 Block Area Industries 3,29,864
114 Cloth Printing Unit –Nayarambalam
98-99 Nayaramba-lam Industries 14,79,000
Development Projects – Vypeen Block – 98-99 (contd.)
115 Computer Centre –Edavanakkad
98-99 Edavanakkad Services 4,62,137
116 Computer Centre – Mulavukad
98-99 Mulavukad Services 4,62,137
117 Construction of latrines 98-99 Block Area Services 1,44,000
118 Construction of Houses 98-99 Block Area Services 28,26,000 119 Repairing of Houses 98-99 Block Area Services 1,25,000

120 Repairing of Houses 98-99 Block Area Services 25,000
121 Community Centre 98-99 Block Area Services 3,54,193 122 Mukkathu Jetty Road –
Mulavukad 98-99 Mulavukad Services 1,00,000
123 Pallamppilly Chira –Protection
98-99 Block Area Agri 1,25,000
124
Panchayath IHDP Colony Drainage construction –Nayarambalam
98-99 Nayaramba-
lam
Services 1,20,000
125
Footh Path construction Ponnarimangalam
98-99 Block Area Services 1,02,040
126 Fisheries Bund –Side Protection
98-99 Block Area Agri 1,95,000
Development Projects – Vypeen Block – 98-99 (contd.)
127
Metalling & Tarring of Puchethara Vazhathara Colony Road –Nayarambalam
98-99 Nayaramba-lam Services 1,10,250
128 Rotary Village Road Elamkunnappuzha
98-99 Elamkunna-ppuzha
Services 50,000
129
Pappanath Ambedkar Colony Road – ward 4,5 -Mulavukad
98-99 Mulavukad Services 1,02,500
130 Thythala Colony Road Construction – Pallippuram
98-99 Pallippuram Services 32,750
131 Million Wells Scheme 98-99 Block Area Services 5,15,226
132 Service Sector 98-99 Block Area Services 22,27,000 133 Construction of Houses –2
Nos. 98-99 Block Area Services 70,000
Source: xxx
Table: 15
Development Projects of Vypeen Block Panchayath: 1999-2000
Sl no.
Project name Grand in aid
State sponsored
Central sponsored
Beneficiary contribut-ion
Others Total
1 Medicine for coconut
145000 46406 41250 232656

2 Promotion of Vegetable cultivation
1008861 1008861
3 Modern Butcher’s shop
579650 579650
4 Clearance of water ways
1547220 1547220
5 Promotion of women industrial unit
844140 844140
6 Maintace work of hospitals
445500 445500
7 Anganavadies Maintain
67860 67860
8 Toilets-construction awarence building
275959 275959
9 Plan implication
100000 100000
10 Instillation of public lamps
80850 80850
11 Construction of roads
1668365 1668365
12 SC/ST programs
4498051 479000 100000 5077051
13 Construction of canal roads
100000 100000
14 Landslide 1500000 1500000
15 Roads 940000 940000
16 Buildings 57000 598000 9540447 7000000 17195447
17 S.J.G.Y.(JRY) 790477 790477
Total 11318456 1123406 12970924 41250 7000000 32454036
Source : Vypeen Block Pachayath: Padhathi Rekha 1999-2000
Table: 16
Public Assets Created During Ninth Plan: Nayarambalam Panchayath
SI.No Name of Assets Year of Commencement
Year of completion
Remarks
1. Beach Rd. 1997-98 1998

Gravelling1316m*3m
2. Priyadharshini Rd. Gravelling 1280m*3m
1997-98 1998(S.O)
3. Holly Oushadhalayam Rd. Gravelling 245m*3m
1997-98 1998(S.O)
4. River Rd. Gravelling 913m*3m 1997-98 1998(S.O)
5. Boat Jetty-Parekapallythara Colony Rd. Gravelling 420m*3m
1997-98 1998(S.O)
6. Latrine Facility(Ayurveda Hosppital)
1997-98 1998(S.O)
7. Gas Furnace(Ayurveda Hospital)
1997-98
8. Maintenance of drinking water wells
1997-98
9 Public Latrine SC colony 1997-98
10. Photostat machine For Panchayath
1997-98 Yet not procured
11. Electrification of Aganwadis (9nos)
1998-99
12. Ayurveda Hospital Building 1998-99
13. Public News Boards(12nos) 1998-99
14. Coastline Rd. Gravelling (350m*3m) &Construction of Culvert
1998-99
15. DVUPS West Rd.Gravelling 1998-99
16. Sidewall in Kochabalam Rd. 1998-99
17. Sidewall in Link Rd. between Co-operative Rd. & Nedungad Rd.
1998-99
18. W-5 Kuttathara colony Rd. Gravelling 330m*3m
1998-99
19. Kollathara Rd. sidewall 83m 1998-99
20. W-7 Footpath Gravelling 250m*2.3m
1998-99
21. Culvert (Beach Rd.) 1998-99
22. W-2 3cent colony Rd. Gravelling 170m*2.5m
1998-99
23. W-10 Harigen settlement colony Rd. gravelling 325m*2.1m
1998-99
24. W-3 SC colony Rd. Gravelling 370m*3m
1998-99

25. W-8 Ponnadithara colony Rd. Gravelling 235m*2m
1998-99
26. Lakhamveeducolony Rd. Retaining wall
1998-99
27. North Pazhuvekar Bund Protection
1999-2000 Not completed
28. South Pazhuvekar Bund Protection
1999-2000 Not completed
29. Shopping complex 1999-2000 Work is progressing
30. PHC renovation 1999-2000
31. Kirishibhavan Building 1999-2000 Work is progressing
32. Veterinary Hospital Building 1999-2000 Work is progressing
33. Govt. Ayurveda Hospital Building 2nd stage
1999-2000 Work is progressing
34. Homeo Dispensary renovation 1999-2k Work is not started.
35. Maintaince Drinking water wells 1999-2k Routine work
36. Renovation of Reading room & Furniture & Books for reading room
1999-2k
37. Protection of Punchayil Thodu (Side wall)
1999-2k
38. Deepening work of Various canals (Rs.2,23,500)
Work is not yet started
39. Drainage cleaning 1999-2k Waiting for rainy season
40. Bridge connecting W-1& W-2 1999-2k Work in progress
Note: Data on public assets created during the Eighth Plan are not available

Table: 17
Public Assets Created During Eighth & Ninth Plans: Pallipuram Panchayath
SI. No
Name of assets Year of Commencement
Year of completion
Remarks
1 Shopping complex at Cherai Junction (10 rooms)
!993-94 1995-96
2 Marayithode Culvert W-7
1997-98
3 Vetenary Hospital Rd.Culvert
1997-98
4 Culvert in W-13 Near Anathan’s House
1998-99
5 Punnathode Culvert W-4
1998-99
6 Capithan Rd. Culvert W-3
1998-99
7 Drainage Facility 50metre in W-7 50metre in W-5
1998-99
8 Aganwady 1no in W-7
1998-99
9 Drinking water well-1no
1998-99
10 Pipeline 500metre
1998-99
11 Pipeline 1999- Paid Rs. 5Lakhs But work yet not started
12 Creation of newRds0.77kms A.K MohanamRd.W-14 0.24km Mosque Rd. East W-4 0.28km Dispensery Rd.Westend W-
1997-98

0.25km
13 Creation of new roads1.394kms A.K.G Rd. W-2 0.235km Bakery EastRd. 0.569km Village office -Marayil Thodu Lane: W-5 - 0.50km BeachRd.W-2 - 0.34km Gowariswaram Southlane W-14 - 0.20km
1998-99
Table: 18
Public Assets Created During Eighth & Ninth Plans: Elamkunapuzha Panchayath
SI. No
Name of Assets
Year of Commencement
Year of Completion
Remarks
1 Sanitary Facility in PHC 6No’s
2 Kanjipura in Govt. New L.P School
1997-98
3 Television set – 2 nos Malipuram W-10 & W-5
Television set in W-5 is not installed
4 Street Tap 635 nos
More than 50% of them not functioning
5 Burial Ground 2nos
6 Anganavady-28nos 4 in own building
1997-98
7 Renovation work in Govt.L.P School
1997-98
8 Public 1994-95

building 5 rooms
9 Public wells 11nos
10 Streetlights 918nos
11 Culverts 15 nos
Table: 19
Public Assets Created During Eighth & Ninth Plans: Narakal Panchayath
SI.No Name of Assets Year of Commencement
Year of Completion
Remarks
1. Construction of Pipe culvert across the thodu in W-X
1992-93
2. Construction of Pipe culvert near the light house colony W-8
1992-93
3. Formation of Priyadharshini Rd. W-3
1992-93
4 Formation of Thaliyathu Rd. W-3
1992-93
5 Formation of I.T.C Rd.
1992-93
6 Formation of Rajeev Rd.
1992-93
7 Eletrification of Panchayath office
1992-93
8 Formation of Parapilly Rd.
1993-94
9 Deepening the Pt. Thodu
1993-94
10 Construction of a Footbridge across the Thodu atcherupushpalayam Rd. in W-9
1993-94
11. Construction of a Pipe culvert Across the Thodu in W-7
1993-94
12. Pipe culvert near the House of Sadanadan W-4
1993-94

13 Pipe culvert Across the thodu at the Azheekodu Rd. in W-8
1993-94
14 Pipe culvert in OLHC Rd.
1993-94
15 Deepening the Thodu through the market
1993-94
16 Retaining wall for Priyadharshini Rd.
1993-94
17 Formation of Lotus Rd. W-10
1993-94
18 Formation of L.P.G.S Rd.
1993-94
19 Pipe Culvert in Eastern side of Boat jetty Rd.
1994-95
20 Formation of Azheekodu Rd. W-8
1994-95
21 Formation of Vellanthodu Rd.
1994-95
22 Retaining wall at Koreparambu Rd.
1994-95
23 Deepening of Vellan Thodu
1995-96
24 Pipe culvert & Drainage facilities in W-7
1995-96
25 Construction of Shopping complex
1995-96
26 Retaining wall Convent Rd.
1996-97
27 Pipe Culvert in W-7 1996-97
28 Formation of Appangad North canal Rd.
1996-97
29 Jawahar Rd. 1997-98
30 Reconstruction of Seashore bridge in W-10
1997-98
31 Formation of Jawahar Rd. west side of Pozhiyil Rd. W-7
1997-98

32 Formation of Appangad Thodu Rd.W-8
1997-98
33 Pipe culvert at K.T.X Rd. W-10
1997-98
34 Maintaince of Reading room W-3
1997-98
35 Maintaince of Public Latrine W-2
1997-98
36 Retaining wall in Peoples Rd. W-4
1997-98
37 Culvert in W-4 1997-98
38 Drainage at Perumpilly Market Rd.
1997-98
39 Deepening the Thodu at east side of Puthunar Rd. W-7
1998-99
40 Construction of two Pipe culvert in W-6
1998-99
41 Construction of 1st floor over Panchayath shopping complex
1998-99
Table: 20
Grant-in-Aid and its Utilisation: Vypeen Block (1997-98)
Item Grant-in-aid (1997-98)(Rs)
Incorporated in Projects (Rs)
Changed in Projects
Expenditure upto June 30
Actual Utilisation
General 4977000 5264935 5694028 4651554 322446 Special Component Plan
3184000 3752380 3905970 3313864 (-)129864
Tribal Sub Plan
63000 63000 69055 45545 (-)17455
Total 8224000 9080315 9669053 8013963 (-) 210037
Source: Block Panchayath, Vypeen

Table: 21
Grant-in-Aid and its Utilisation: Vypeen Block (1998-99)
Item Grant-in-aid outstanding
(97-98)
Grant-in-aid (98-99)
Total Grant-in-aid
Expenditure until (March 31, 99)
Col 4-5 Carryover Amount lapsed
1 2 3 4 5 6 7 8 General 192582 5886000 6078582 4895177 1183405 - -
Special Component Plan
- 3255000 3255000 2164272 1090728 - -
Tribal Sub Plan
17455 63000 80455 13000 67455 - -
Total 210037 9204000 9414037 7072449 2341588 - - Own funds NIL
Source: Block Panchayath, Vypeen
Table: 22
Grant-in-Aid and its Utilisation:Pallipuram Gram Panchayath (1997-98)
Item Grant-in-aid Outstanding (96-97)
Grant-in-aid (97-98)
Total Grant-in-aid
Expendit-ure until (June 30, 98)
Col 4-5 Carryover Amount lapsed
1 2 3 4 5 6 7 8
General - 5058000 5058000 4864472 193528 - -
Special Component Plan
- 1392000 1392000 1392000 - - -
Tribal Sub Plan
- 14000 14000 14000 - - -
Total 6464000 6464000 6270472 193528 - -
Source: Pallipuram Gram Panchayath
Table: 23
Grant-in-Aid and its Utilisation:Pallipuram Gram Panchayath (1998-99)
Item Grant-in-aid Grant- Total Expendit- Col 4-5 Carryover Amount lapsed

(97-98) (98-99) in-aid (March 31, 99)
1 2 3 4 5 6 7 8
General 193528 6206000 6399528 3342548 3056980 - - Special Component Plan
- 1424000 1424000 635843 788157 - -
Tribal Sub Plan
- 27000 27000 2500 24500 - -
Total 193528 7657000 7850528 3980891 3869637 - -
Source: Pallipuram Gram Panchayath
Table: 24
Grant-in-Aid and its Utilisation:Pallipuram Gram Panchayath (1999-2000)
Item Grant-in-aid Outstanding (98-98)
Grant-in-aid (99-00)
Total Grant-in-aid
Expendit-ure until (March 31, 00)
Col 4-5 Carryover Amount lapsed
1 2 3 4 5 6 7 8
General 3097779 5320956 8418735 6895008 1523727 - - Special Component Plan
787791 953529 1741320 1193827 547493 - -
Tribal Sub Plan
24500 24500 49000 36500 12500 - -
Total 3910070 6298985 1020985 8125335 2083720 - -
Source: Pallipuram Gram Panchayath
Table: 25
Grant-in-Aid and its Utilisation: Narakkal Gram Panchayath (1997-98)
Item Grant-in-aid Outstanding (96-97)
Grant-in-aid (97-98)
Total Grant-in-aid
Expendit-ure until (June 30, 98)
Col 4-5
Carryover Amount lapsed
1 2 3 4 5 6 7 8
General - 2828000 2828000 2825000 3000 - -
Special Component Plan
- 1402000 1402000 1365000 37000 - -
- 16000 16000 - - - -

Plan
Total - 4246000 4246000 4190000 40000 - - Source: Narakkal Gram Panchayath

Table: 26
Grant-in-Aid and its Utilisation:Narakkal Gram Panchayath (1998-99)
Item Grant-in-aid Outstanding (97-98)
Grant-in-aid (98-99)
Total Grant-in-aid
Expendit-ure until (March 31, 99)
Col 4-5 Carryover Amount lapsed
1 2 3 4 5 6 7 8 General 31489 3113000 3144489 2165175 979314 - -
Special Component Plan
20131 1433000 1453131 701265 751866 - -
Tribal Sub Plan
- 31000 31000 30000 1000 - -
Total 51620 4577000 4628620 2896440 1732180 - -
Source: Narakkal Gram Panchayath
Table: 27
Grant-in-Aid and its Utilisation:Narakkal Gram Panchayath (1999-2000)
Item Grant-in-aid Outstanding (98-98)
Grant-in-aid (99-00)
Total Grant-in-aid
Expendit-ure until (March 31, 00)
Col 4-5 Carryover Amount lapsed
1 2 3 4 5 6 7 8 General 978714 3060093 4038807 3309361 729446 - -
Special Component Plan
740444 1103732 1844176 1164481 679695 - -
Tribal Sub Plan
1000 33552 34552 2666 31886 - -
Total 1720158 4197377 5917535 4476508 1441027 - -
Source: Narakkal Gram Panchayath
Table: 28
Grant-in-Aid and its Utilisation:Nayarambalam Gram Panchayath (1997-98)
Item Grant-in-aid Outstanding (96-97)
Grant-in-aid (97-98)
Total Grant-in-aid
Expendit-ure until (June 30, 98)
Col 4-5 Carryover Amount lapsed

1 2 3 4 5 6 7 8
General - 2830447 2830447 2793928 36519 - - Special Component Plan
- 1556553 1556553 1482442 74111 - -
Tribal Sub Plan
- - - - - - -
Total - 4387000 4387000 4276370 110630 - -
Source: Nayarambalam Gram Panchayath
Table: 29 Grant-in-Aid and its Utilisation: Nayaramblam Gram Panchayath (1998-99)
Item Grant-in-aid Outstanding (97-98)
Grant-in-aid (98-99)
Total Grant-in-aid
Expendit-ure until (March 31, 99)
Col 4-5 Carryover Amount lapsed
1 2 3 4 5 6 7 8
General 36519 3250000 3286519 1877876 1408642 821629 587012 Special Component Plan
74111 1570000 1644111 763296 880814 411027 469786
Tribal Sub Plan
- 5000 5000 50 4950 1250 3750
Total 110630 482500 4935630 2641223 2294407 1233907 1060549
Source: Nayarambalam Gram Panchayath
Table: 30 Grant-in-Aid and its Utilisation: Nayarambalam Gram Panchayath (1999-2000)
Item Grant-in-aid Outstanding (98-98)
Grant-in-aid
(99-00)
Total Grant-in-aid
Expendit-ure until (March 31, 00)
Col 4-5 Carryover Amount lapsed
1 2 3 4 5 6 7 8
General 1408642 2795378 4204020 3873477 330543 - -
Special Component Plan
880815 1081393 1962208 1389847 572361 - -
Tribal Sub Plan
4950 - 4950 4950 - - -
Total 2292407 3876771 6169178 5268274 900904 - -
Source: Nayarambalam Gram Panchayath

Table: 31
Grant-in-Aid and its Utilisation: Elamkunnapuzha Gram Panchayath (1997-98)
Item Grant-in-aid Outstanding (96-97)
Grant-in-aid
(97-98)
Total Grant-in-aid
Expendit-ure until (June 30, 98)
Col 4-5 Carryover Amount lapsed
1 2 3 4 5 6 7 8 General - 5891600 5891600 5353534 583066 - -
Special Component Plan
- 1803200 1803200 1652427 150773 - -
Tribal Sub Plan
- 25200 25200 25200 - - -
Total - 7720000 7720000 7031161 688839 - -
Source: Elamkunnapuzha Gram Panchayath
Table: 32
Grant-in-Aid and its Utilisation: Elamkunnapuzha Gram Panchayath (1998-99)
Item Grant-in-aid Outstanding (97-98)
Grant-in-aid
(98-99)
Total Grant-in-aid
Expendit-ure until (March 31, 99)
Col 4-5 Carryover Amount lapsed
1 2 3 4 5 6 7 8
General 538066 6854000 7392066 4966470 2425596 - -
Special Component Plan
150773 1843000 1993773 1628453 365320 - -
Tribal Sub Plan
- 49000 49000 28500 20500 - -
Total 688839 8746000 9434839 6623423 2811416 - -
Source: Elamkunnapuzha Gram Panchayath
Table: 33 Grant-in-Aid and its Utilisation: Elamkunnapuzha Gram Panchayath (1999-2000)

Item Grant-in-aid Outstanding (98-98)
Grant-in-aid (99-00)
Total Grant-in-aid
Expendit-ure until (March 31, 00)
Col 4-5 Carry- over
Amount lapsed
1 2 3 4 5 6 7 8 General 2425596 6696494 9122090 8853608 268482 - -
Special Component Plan
366320 1530768 1896088 1330314 565774 - -
Tribal Sub Plan
20500 55193 75693 40728 34965 - -
Total 2812416 8282455 11093871 10224650 869221 - -
Source: Elamkunnapuzha Gram Panchayath
Table: 34 State Sponsored Schemes in identified Gram Panchayaths: Nayarambalam
1994-95 1995-96 1996-97 1997-98 1998-99 1999-2000 1995-2000 Sectors Inc. Exp Inc. Exp. Inc. Exp. Inc. Exp. Inc. Exp. Inc. Exp. Inc. Exp. Agriculture 42445 89970 24555 49525 206495 1,99,947 Animal Husbandry 200 22123 35300 16330 9540 83493 83044
Health 79600 56455 76950 27943 12338 253286 191544 Education 0 11127 5024 14440 25300 55891 31909 SC Welfare 0 37300 17106 29200 1180 84786 55183 ST Welfare 0 0 0 0 0 0 0 Minor Irrigation 0 0 0 0 0 0 0
Fisheries 0 0 379000 157500 25000 561500 440500 Industry 0 0 4700 0 16000 20700 Social Welfare 0 226950 364615 331750 438160 1367475 1233905
Rural development 0 33497 15400 0 0 48897 37124
Dairy development 0 4300 8250 2000 0 14550 0
Source: Nayarambalam Gram Panchayath Note: 1. Data as on 1994-95 is not available. 2. All figures are in Rupees

Table: 35
State Sponsored Schemes in identified Gram Panchayaths: Narakkal
1994-95 1995-96 1996-97 1997-98 1998-99 1999-2000 1995-2000 Sectors Inc. Exp. Inc. Exp Inc. Exp Inc. Exp Inc. Exp Inc. Exp Inc. Exp. Agriculture - - 35195 32738 96870 2915 21654 66907 40864 30242 300 40564 194883 173366 Animal Husbandry
- - 0 0 1400 1400 19800 2664.70 16250 32829 - - 37450 36893
Health - - 0 0 173 173 650 410 3128 1564 2300 2470 6251 4617 Education - - 0 0 19894 4070 12764 9419 13912 11768 22800 35562 69370 60819 SC Welfare - - 2000 0 53200 25648 21000 22656 58966 30100 21225 28026 156391 106430 ST Welfare - - 0 0 500 0 0 0 0 0 0 0 500 0 Minor Irrigation
- - 0 0 0 0 0 0 0 0 0 0 0 0
Fisheries - - 0 0 0 300000 0 238214 173000 220000 220065 758214 393065 Industry - - 0 0 0 0 4700 1250 0 0 0 0 4700 1250 Social Welfare
-- - - - 369500 169296 428398 484304 497520 256747 542700 668803 1838118 1579150
Rural development
- - 0 0 36426 0 36000 0 0 10685 0 0 72426 10685
Dairy development
- - 0 0 4830 0 8910 3100 0 8250 0 1150 13740 12500
Source: Narakkal Gram Panchayath Note: 1. Data as on 1994-95 is not available. 2. All figures are in Rupees
Table: 36 State Sponsored Schemes in identified Gram Panchayaths: Pallipuram
1994-95 1995-96 1996-97 1997-98 1998-99 1999-2000 1995-2000 Sectors Inc. Exp. Inc. Exp. Inc. Exp. Inc. Exp. Inc. Exp. Inc. Exp. Inc. Exp. Agriculture - - 36901 30320 36901 36901 187970 113179 11630 71819 Animal Husbandry
- - 100 100 2050 1050 24100 12558 5950 15554 0 0 32200 29262
Health - - 0 0 12700 1562 130320 49820 26400 25000 21900 23800 191320 98282 Education - - 0 0 26342 290. 28520 18952 49318 30894 0 0 104188 50136 SC Welfare - - 6000 6000 2700 2500 15270 3168 25400 2344. 1170 32195 50540 46207 ST Welfare - - 0 0 0 0 0 0 0 0 1000 0 1000 0 Minor Irrigation
- - 0 0 0 0 0 0 0 0 0 0 0 0
Fisheries - - 0 0 0 0 340000 160000 1033214 95000 74000 72000 1447214 327000 Industry -- - 0 0 0 0 4817 0 0 0 0 0 4817 0 Social Welfare
- - 364809 343388 500351 426739 280965 302965 874306 761489 1154782 878182 3175213 2712763
Rural development
- - 0 0 0 0 0 0 0 0 0 0 0 0
Dairy development
- - 0 0 22520 9500 8920 0 2000 12250 0 0 33440 21750
Source: Pallipuram Gram Panchayath Note: 1. Data as on 1994-95 is not available. 2. All figures are in Rupees

Table: 37
State Sponsored Schemes in identified Gram Panchayaths: Elamkunnapuzha
1994-95 1995-96 1996-97 1997-98 1998-99 1999-2000 1995-2000 Sectors Inc. Exp. Inc. Exp. Inc. Exp. Inc. Exp. Inc. Exp. Inc. Exp. Inc. Exp. Agriculture - - 488525 0 181370 43960 130797. 153460 120000 135435 450 134814. 921142. 467669 Animal Husbandry
- - - - 1400. 1400. 17860. 16460. 17450. 17450. 100. 100. 36810. 35410.
Health - - 157500.00 1500. 44108 5137 43877 44755 35707. 61153 28094 40679 309286. 153224. Education - - - - 32692 3970 16300 17303 40000 40446 65300 54606 154292 11325 SC Welfare - - - - 23000 21000 28200 8218 30400 3328 1200 8090 82800 40636 ST Welfare - - - - 2000 2000 5300 5300 9000 9000 7300 7300 23600 23600 Minor Irrigation
- - 0 0 0 0 0 0 0 0 0 0 0 0
Fisheries - - 0 0 0 0 324000 0 123214 6500 260000 45000 707214. 51500 Industry - - 0 0 0 0 0 0 0 0 0 0 0 0 Social Welfare
- - 0 0 0 0 821471 601363 910568 793656 626338 536444 2358377 1931463
Rural development
- - 0 0 31613 0 0 0 0 0 0 0 0 0
Dairy development
- - 0 0 1500 0 8550 0 0 0 250 0 10300 0
Source: Elamkunnapuzha Gram Panchayath
Note: 1. Data as on 1994-95 is not available.
2. All figures are in Rupees

NGO Programmes in Vypeen
(1995-96 to 1999 – 2000 )
1. Promotion of Medicinal Plants cultivation- Awareness Camps
2. Medicinal Plants-distribution of seedlings.
3. Awareness Programme against AIDS
4. Awareness Programme against diarrhoea and tuberculosis
5. Cleaning of Local hospitals
6. Awareness Programme on Micro-credit
7. Free Computer Training Programme. Computer Awareness Programme for school children
8. Library Camps
9. Award for top-scorer in SSLC Examination
10. Cleaning of Public wells
11. Awareness Programme for mothers and children
12. Family Planning Awareness Camps
13. Training for women in garment making
14. Social Forestry Awareness programme
15. Distribution of Seedlings for Social Forestry
16. Free Tuition Programme for students
17. Awareness programme on Panchayaths and Peoples’ Planning