NATIONAL AIDS PROGRAMMES
83
A number of indicators included this guide is still being refined and tested. For updates on these indicators or for examples of tools to collect these indicators please go to the following website: http://www.unaids.org/en/in+focus/monitoringevaluation/m_e+library.asp NATIONAL AIDS PROGRAMMES A guide to indicators for monitoring and evaluating national HIV/AIDS prevention programmes for young people WORLD HEALTH ORGANIZATION
-
Upload
khangminh22 -
Category
Documents
-
view
3 -
download
0
Transcript of NATIONAL AIDS PROGRAMMES
A number of indicators included this guide is still being refined and tested. For updates on these indicators or for examples of tools to collect these indicators please go to the following website:
http://www.unaids.org/en/in+focus/monitoringevaluation/m_e+library.asp
NATIONAL AIDS PROGRAMMESA guide to indicators for monitoring and evaluating national HIV/AIDS prevention programmes for young people
WORLD HEALTH ORGANIZATION

WHO Library Cataloguing-in-Publication Data
World Health Organization.National AIDS programmes : a guide to indicators for monitoring and evaluating national HIV/AIDS prevention programmes for young people.
1.HIV infections - prevention and control 2.Acquired immunodeficiency syndrome - prevention and control 3.National health programs - organization and administration 4.Adolescent health services - organization and administration 5.Outcome and process assessment (Health care) - methods 6.Program evaluation - methods 6.Guidelines I.Title II.Title: A guide to indicators for monitoring and evaluating national HIV/AIDS prevention programmes for young people.
ISBN 92 4 159257 5 (NLM classification: WC 503.6)
© World Health Organization 2004All rights reserved. Publications of the World Health Organization can be obtained from Marketing and Dissemination, World Health Organization, 20 Avenue Appia, 1211 Geneva 27, Switzerland (tel: +41 22 791 2476; fax: +41 22 791 4857; email: [email protected]). Requests for permission to reproduce or translate WHO publications – whether for sale or for noncommercial distribution – should be addressed to Marketing and Dissemination, at the above address (fax: +41 22 791 4806; email: [email protected]). The designations employed and the presentation of the material in this publication do not imply the expression of any opinion whatsoever on the part of the World Health Organization concerning the legal status of any country, territory, city or area or of its authorities, or concerning the delimitation of its frontiers or boundaries. Dotted lines on maps represent approximate border lines for which there may not yet be full agreement.
The mention of specifi c companies or of certain manufacturers’ products does not imply that they are endorsed or recommended by the World Health Organization in preference to others of a similar nature that are not mentioned. Errors and omissions excepted, the names of proprietary products are distinguished by initial capital letters.
All reasonable precautions have been taken by WHO to verify the information contained in this publication. However, the published material is being distributed without warranty of any kind, either express or implied. The responsibility for the interpretation and use of the material lies with the reader. In no event shall the World Health Organization be liable for damages arising from its use.
Printed in France.

1
A guide to indicators for monitoring and evaluating national HIV/AIDS prevention programmes for young people
National AIDS programmes
A GUIDE TO INDICATORS FOR MONITORING AND EVALUATING NATIONAL HIV/AIDS PREVENTION PROGRAMMES FOR YOUNG PEOPLE
A number of indicators included this guide is still being refined and tested. For updates on these indicators or for examples of tools to collect these indicators please go to the following website:
http://www.unaids.org/en/in+focus/monitoringevaluation/m_e+library.asp

2
CONTENTS
Chapter 1:Introduction _____________________________________________________________________________ 4
Chapter 2:Methodological considerations _______________________________________________________________ 12
Chapter 3: Programmatic indicators __________________________________________________________________ 16
Chapter 4:Determinant indicators (risk factors and protective factors) ________________________________________ 35
Chapter 5: Behavioural indicators ____________________________________________________________________ 48
Chapter 6:Impact indicators ________________________________________________________________________ 63
Annex:Methodology ___________________________________________________________________________ 71
References_____________________________________________________________________________ 78

3
A guide to indicators for monitoring and evaluating national HIV/AIDS prevention programmes for young people
ABBREVIATIONS
AIDS acquired immunodeficiency syndrome
ANC antenatal clinic
API AIDS programme effort index
ART antiretroviral therapy
ARV antiretroviral
BSS Behavioural Surveillance Surveys
CDC United States Centers for Disease Control and Prevention
CRIS Country Response Information System
CSW commercial sex workers
DHS Demographic and Health Surveys
FHI Family Health International
FP family planning
HIV human immunodeficiency virus
IDU injecting drug user (or use)
IEC information, education, communication
M&E monitoring and evaluation
MCH maternal and child health
MICS Multiple Indicator Cluster Surveys
MSM men who have sex with men
MTCT mother-to-child transmission (of HIV)
NAFCI National Adolescent Friendly Clinic Initiative (South Africa)
NGO nongovernmental organization
NIDI Netherlands Interdisciplinary Demographic Institute
OVC orphans and vulnerable children
PHC primary health care
PMTCT prevention of mother-to-child transmission (of HIV)
PSI Population Services International
STI sexually transmitted infection
T&C testing and counselling (for HIV)
UNAIDS Joint United Nations Programme on HIV/AIDS
UNESCO United Nations Educational, Scientific and Cultural Organization
UNFPA United Nations Population Fund
UNGASS United Nations General Assembly Special Session
UNICEF United Nations Children’s Fund
USAID United States Agency for International Development
WHO World Health Organization

4
Chapter 1: Introduction
CHAPTER 1
INTRODUCTION
Why focus on young people in HIV/AIDS prevention programmes?
Why is it necessary to have a separate guide to indicators for monitoring and evaluating HIV/AIDS prevention programmes that focus on young people?
Young people are at the centre of the global HIV/AIDS pandemic*. This is true both in countries with a generalized epidemic and in those with a concentrated epidemic. Young people are at high risk of contracting HIV because, once they become sexually active, they often have several, usually consecutive, short-term sexual relationships and do not consistently use condoms. In many countries a significant proportion of young people start sexual activity before the age of 15. In some regions, intravenous drug use is spreading at an alarming rate in this age group (1). Furthermore, young people often have insufficient information and understanding about HIV/AIDS. They may not be aware of their vulnerability to it or of how best to prevent it. They also often lack access to the means to protect themselves.
In areas where HIV/AIDS is subsiding or even declining there has been a genuine commitment to HIV prevention, particularly among young people (2). Young people can make responsible decisions about their health if they are given the information, services and support necessary for adopting safe behaviours. With support, moreover, young people can help to educate other people and motivate them to make safe decisions. Working with young people represents one of our greatest hopes in the struggle against AIDS.
Significant developments have occurred during the past decade in the collection, analysis and use of data on young people and HIV/AIDS. One of the most important lessons learned has been that young people are at the centre of the global pandemic, as well as one of the greatest hopes in the struggle against this disease. In response, there have been increasing efforts to develop or tailor programmes specifically to the needs and realities of young people.
Many of these programmes have also been evaluated, and this collective experience has shown that: • Young people do not constitute a homogeneous group, and therefore interventions should
be designed for specific subgroups. This requires the data collected on young people to be disaggregated by, for instance, age, sex, school attendance and marital status.
• Data are needed that help to define and understand young people who are especially vulnerable, e.g. injecting drug users (IDUs), commercial sex workers (CSW), and men who have sex with men (MSM).
• In its cause and effect, HIV/AIDS is linked to other public health problems of young people, e.g. sexually transmitted infections (STIs), unplanned pregnancies, alcohol and substance abuse, and gender-based violence.
• There is a need for data differentiating between individual and contextual factors that increase young people’s likelihood of engaging in high-risk behaviour. Increasingly, the importance of determinants (risk and protective factors) in influencing individual behaviours is recognized, and needs to be measured.
* The term “young people” encompasses ages 10-24
5
A guide to indicators for monitoring and evaluating national HIV/AIDS prevention programmes for young people
Therefore, a special guide is needed for monitoring and evaluating national policies and programmes for HIV prevention among young people. The present guide complements the indicators included in National AIDS programmes: a guide to monitoring and evaluation (3), by refining the indicators that have already been defined and proposing new ones that are in relatively early phases of development and use. These new indicators are included so as to ensure that policies and programmes benefit from the lessons learnt during the past decade and to provide experience of their measurement and use.
Main reasons for the present guide• To provide guidance, through selection of indicators, for monitoring and evaluating
policies and programmes for HIV prevention among young people. • To tailor existing widely-used indicators and methods so that they are relevant to national
programmes for HIV prevention among young people. • To introduce new measures specific to the determinants (risk factors and protective
factors) which influence vulnerability and risk behaviours.
For whom is this guide intended?This guide is intended for use by programme managers at the national level, particularly managers of national AIDS programmes. It may also be useful for programme managers and planners at subnational levels who seek to align their measurement efforts with national ones.
What does the guide contain?This guide identifies a set of indicators, methods for measuring them, and their strengths and limitations. Their purpose is to help national AIDS programme managers in planning and monitoring HIV prevention programmes for young people. The indicators are organized into four chapters in accordance with a logic model linking programmatic action to expected outcomes and, ultimately, to epidemiological impact. The chapters cover the following categories of indicators:
programmatic; determinants (risk factors and protective factors);behavioural outcomes; impact.
This model is closely linked to the established model of programme monitoring and evaluation, which classifies indicators into categories of input, output, outcome and impact.
For a programme to achieve its goals, inputs such as money and staff time must result in outputs such as new or improved services, trained staff and information materials. If these outputs are well designed and reach the populations for which they are intended, the programme is likely to have positive outcomes, e.g. increased condom use or reduced needle-sharing among drug injectors. These positive outcomes should lead to changes in the impact of the programme, measured as fewer new cases of STIs and HIV infection (3).
The main difference in the present guide is that the outcomes considered are split up into the risk and protective factors and the behavioural outcomes. The category of outcomes is thus elaborated in accordance with the different effects a programme may have (i.e. targeting individual behaviour or the determinants of that behaviour). This is based on more than a decade of research and programme evaluation demonstrating that changes in adolescent behaviour are influenced by various factors,
6
Chapter 1: Introduction
including individual knowledge and attitudes, relationships with parents and peers, schools, economic status, faith beliefs and the prevailing social norms. Some of these factors help us to understand the context in which young people live and make decisions; others help to guide our programmatic focus. It is therefore important to measure them and to track trends in key indicators relating to these areas at the national level.
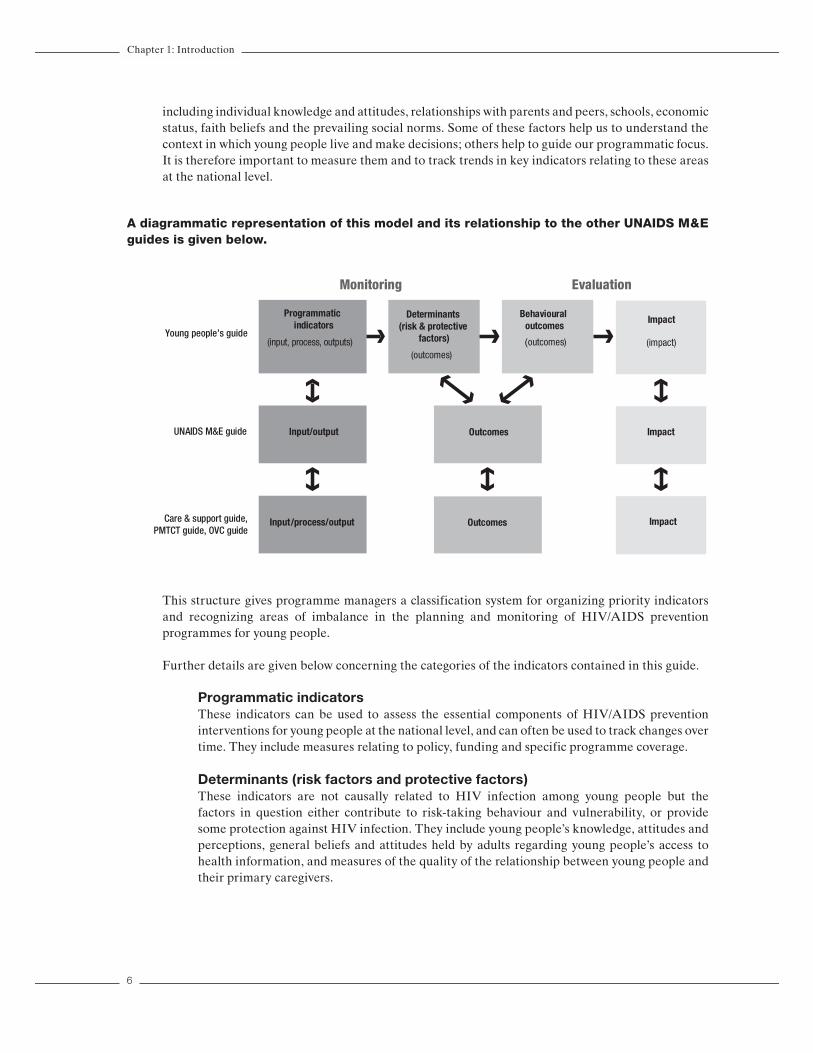
A diagrammatic representation of this model and its relationship to the other UNAIDS M&E guides is given below.
Programmatic indicators
(input, process, outputs)
Determinants (risk & protective
factors)
(outcomes)
Behavioural outcomes
(outcomes)
Impact
(impact)
Input/output Outcomes Impact
Input/process/output Outcomes Impact
Monitoring Evaluation
Young people’s guide
UNAIDS M&E guide
Care & support guide,PMTCT guide, OVC guide
This structure gives programme managers a classification system for organizing priority indicators and recognizing areas of imbalance in the planning and monitoring of HIV/AIDS prevention programmes for young people.
Further details are given below concerning the categories of the indicators contained in this guide.
Programmatic indicators These indicators can be used to assess the essential components of HIV/AIDS prevention interventions for young people at the national level, and can often be used to track changes over time. They include measures relating to policy, funding and specific programme coverage.
Determinants (risk factors and protective factors)These indicators are not causally related to HIV infection among young people but the factors in question either contribute to risk-taking behaviour and vulnerability, or provide some protection against HIV infection. They include young people’s knowledge, attitudes and perceptions, general beliefs and attitudes held by adults regarding young people’s access to health information, and measures of the quality of the relationship between young people and their primary caregivers.

7
A guide to indicators for monitoring and evaluating national HIV/AIDS prevention programmes for young people
Behavioural outcomesThese indicators measure individual young people’s actions that directly affect biological outcomes. They include measures of condom use, injecting drug use, commercial sex, the proportion of young people who have had sex by the age of 15, and the numbers of sexual partners that young people have had. In addition, several indicators are included that are not causally related to HIV infection, but which contribute to young people’s vulnerability to it, e.g., forced sexual relations, and cross-generational sexual partnerships (especially among young women).
ImpactThese indicators capture measures of impact at the population level, i.e. epidemiological measures, most notably HIV prevalence rates among young people, and specific subgroups of young people.
Overview of indicatorsThe choice of appropriate indicators varies with the goals of the programme, which are determined by the type of the epidemic. Because the diversity of HIV epidemics has grown, two sets of core indicators are suggested: one for low-level and concentrated epidemics, the other for generalized epidemics. It is important to give attention to HIV prevention and care among young people in both scenarios. Countries should supplement the core indicators with appropriate additional indicators selected from the list presented below.
As stated previously, these indicators are best analysed by disaggregating the data by age, sex, marital status and other important characteristics of young people. The age breakdown is especially important because sexual behaviour can vary widely between age groups. In general, adolescents aged 10−14 years are probably much less sexually active than those aged 15−19 years, who differ from people aged 20−24 years. This breakdown of age groups allows national programme managers to look for cohort trends that occur over time. For example, if respondents aged 15−19 report lower proportions of sexual initiation before the age of 15 than respondents aged 20−24, this may suggest a decline in early sexual debut. Whenever possible, data should be disaggregated into the age groups 10−14, 15−19 and 20−24 years. In addition, the disaggregation of data by background characteristics (e.g. urban vs. rural residence, school attendance and marital status) allows programme managers to determine which populations may be at increased risk. It also allows them to make better-informed programmatic decisions, for instance concerning the inclusion of HIV/AIDS education based on life skills for the younger grades in schools. In order to avoid misinterpretations and erroneous programmatic decisions, indicators should not be reported on if suitable data are unavailable.
Below is an overview of indicators by category, tools for measurement and priority for different stages of the epidemic.

8
Chapter 1: Introduction
Indicator Tools for measurementPriority
Generalizedepidemic
PriorityConcentrated/
low-levelepidemic
Programmatic indicators
1. National index on policy related to young people and HIV/AIDS
• Country assessment questionnaire C C
2. National funds spent by government on HIV/AIDS prevention programmes for young people
• UNAIDS/UNFPA/NIDI survey on fi nancial resource fl ows A A
3. Provision of life-skills-based HIV/AIDS education in schools
• School-based survey C C
4. Institutionalizing youth-friendly health services
• Nationally representative survey of health service delivery points
C C
5. Use of specifi ed health services by young people
• Nationally representative general population survey
• Service statistics from a health services survey
C C
6. Condom availability for young people • MEASURE Evaluation/WHO/ PSI compiled condom availability and quality protocol retail survey (4)
C C
7. Young injecting drug users reached by HIV/AIDS prevention services
• Prevalence estimation methods• Service statistics from projects,
programmes and treatment facilitiesA C
8. Young people’s participation in HIV prevention programmes
• Country assessment questionnaire A A
Determinant indicators (risk factors and protective factors)
9. Knowledge of HIV prevention among young people
• Nationally representative general population survey
C C
10. Knowledge of a formal source of condoms among young people
• Nationally representative general population survey
A A
11. Sexual decision-making among young people
• Nationally representative general population survey
A A
12. Perceptions of peers’ sexual activity • Nationally representative general population survey
A A
13. Connection to a parent or primary caregiver
• Nationally representative general population survey
A A
14. Regulation of young people’s behaviour by a parent or primary caregiver
• Nationally representative general population survey
A A
15. Adult support of education on condom use for prevention of HIV/AIDS among young people
• Nationally representative general population survey C C

9
A guide to indicators for monitoring and evaluating national HIV/AIDS prevention programmes for young people
Behavioural indicators
16. Sex before the age of 15 • Nationally representative general population survey
C C
17. Condom use among young people who had higher-risk sex in the preceding year
• Nationally representative general population survey C C
18. Safe sexual behaviour among young people (composite indicator)
• Nationally representative general population survey
C C
19. Forced sex among young people • Nationally representative general population survey
C C
20. Age-mixing in sexual partnerships among young women
• Nationally representative general population survey
C A
21. Sex with commercial sex workers among young people
• Nationally representative general population survey
C C
22. Sex among young people while intoxicated
• Nationally representative general population survey
A A
23. HIV testing behaviour among young people
• Nationally representative general population survey
C A
24. Condom use during anal sex among young men who have sex with men (MSM)
• Special surveys among MSM A C
25. Safe practices among young injecting drug users (IDUs)
• Special surveys among IDUs A C
26. Condom use among young commercial sex workers
• Special surveys among commercial sex workers
C C
Impact indicators
27. HIV prevalence among young pregnant women
• Sentinel surveillance C A
28. HIV prevalence among young people in community-based surveys
• Nationally representative general population survey
C* A
29. HIV prevalence in subpopulations of young people with high-risk behaviour
• UNAIDS/WHO second-generation surveillance guidelines (5)
• FHI guidelines on sampling in subpopulations (6)
A(C**)
C
30. Young people with a sexually transmitted infection
• Nationally representative general population survey
A A
A = additional indicator.C = core indicator. C* = core in countries with relatively high prevalence levels (i.e. above 3%).C**= core for commercial sex workers; additional for other high-risk groups.

10
Chapter 1: Introduction
Note on monitoring and evaluation It is necessary to monitor and evaluate programmes designed to promote health and development to account for resources, improve programmes and show whether the interventions are having the intended effect. The following definitions are taken from a previous UNAIDS document on monitoring and evaluating HIV/AIDS interventions (3).
• Monitoring is the routine tracking of priority information about a programme (at national or project level) and its intended outcomes. It includes the monitoring of inputs and outputs through record-keeping and regular reporting systems as well as health observation and client surveys. It can be called programme monitoring, process monitoring or output monitoring.
• Evaluation is a collection of activities designed to determine a programme’s effect or value. Evaluation focuses on whether the programme has had the intended effect on specified outcomes. In this guide, outcomes are considered to be both individual behaviours and the determinants (risk and protective factors) of these behaviours. Evaluation can also involve looking for evidence of programme impact, i.e. the attribution of long-term changes to specific programmes.
• Surveillance activities are related to but are not the same as programme monitoring and evaluation. Surveillance is the routine tracking of diseases or behaviours by means of the same data collection system over time but not necessarily in relation to any specific programme or intervention. Surveillance can help to describe and monitor an epidemic and its spread. Behavioural surveillance helps to describe patterns of behaviour in particular populations. Surveillance can contribute to the prediction of future trends in diseases or behavioural patterns. Surveillance systems as part of second-generation HIV surveillance typically track HIV and STI prevalence, AIDS case-reporting and sexual risk behaviours.
True impact evaluations that can attribute changes in HIV prevalence to specific programmes are very rare because they require complex and costly experimental designs and are generally difficult to perform for national-level interventions. Instead, the monitoring of impact indicators such as HIV prevalence, taken in conjunction with process and outcome indicators, is considered sufficient to indicate the overall impact of a national response to the epidemic. It is therefore important to track changes in behaviours that are causally related to the prevalence of disease. Similarly, behaviour change may take some time to be demonstrated in a target group. In order to obtain a better assessment of whether a programme can be expected to result in behaviour change, it is important to track changes in the determinants of the behaviours in question, i.e. changes in the risk and protective factors that contribute to these behaviours.
The indicators in this guide are intended for use at the national level. The guide provides a menu of basic indicators common to most national programmes and thus achieves the following purposes:
• It gives guidance on the common minimal components for the implementation and monitoring of HIV/AIDS prevention programmes for young people.
• It gives guidance on the measurement of common behaviours that drive the spread of the epidemic and of common determinants that influence these behaviours.
• It provides a common way of measuring progress in implementation and the effect of a national prevention programme so that the efforts may be comparable across time and between countries
In deciding on a national set of indicators it is important that countries, i.e. national AIDS programmes, realize that they are not limited to this set of indicators and that they do not necessarily have to collect all of them. The choice of indicators should be based on the goals, objectives and activities of each national HIV/AIDS prevention programme, the stage of the HIV epidemic and the main modes of HIV transmission in various subpopulations. These indicators also have an international role in helping donors and agencies to:

11
A guide to indicators for monitoring and evaluating national HIV/AIDS prevention programmes for young people
• track trends in the epidemic among young people and the global response to it;• identify regional trends or patterns in the epidemic among young people; • highlight persistent programmatic problems; • advocate for expanded resources in programmes focusing on young people.
This guide does not provide instructions for the design of a monitoring and evaluation plan for a national HIV/AIDS prevention programme. Such a plan must be tailored to the specifics of the interventions implemented at national, regional and project levels. Other UNAIDS guides (3) include a more in-depth discussion on this topic, (see: http://www.unaids.org), and additional resources relevant to the monitoring and evaluation of programmes for young people are also available (7−9).
Note to users This guide represents the first occasion on which global indicators targeting national-level programmes for HIV/AIDS prevention among young people have been brought together. However, new developments and lessons learnt in the field of monitoring and evaluation of HIV/AIDS prevention programmes for young people are likely to result in a need to revise and update these indicators. The guide is, therefore, a work in progress and will be refined in future editions.

12
Chapter 2: Methodological Considerations
CHAPTER 2
METHODOLOGICAL CONSIDERATIONS
This chapter focuses on issues related to collecting data from individual young respondents, which are particularly relevant for Determinants (Risk and Protective Factors), Behavioural Outcomes, and Impact Indicators (Chapters 4-6). There is also a section about the specific challenges associated with gathering data from young adolescents, primarily those between the ages of 10-14 years. The Methods Annex provides a more comprehensive description of some of the issues of data collection.
1. Validity, reliability, and bias:One of the most important concerns in collecting data on young people is that it be comparable over time. When data are comparable, national programme managers can identify trends and changes in the HIV epidemic among young people. To achieve this, data must be valid, reliable and unbiased. Valid data are data that are as close to the truth as possible. Reliable data are data that are consistently answered the same when the same or similar questions are asked. When data errors are systematic or follow a regular pattern, they are called bias.
There are several types of biases that can occur in data collection. One type of bias that affects data collection among young people is interviewer bias. An interviewer can influence the responses in many ways, even by the tone in his/her voice. Other characteristics, such as gender, age, race, ethnicity, education status, and attitudes may also influence how a young person responds to questions. Researchers have found that participants are generally most likely to develop trust with people who are like themselves, and thus may report sensitive behaviour to such interviewers. For example, the most appropriate person to interview a rural adolescent girl may be a young woman of a similar background.
Interviewer bias can be reduced by ensuring all interviewers are well trained and tested in interviewing skills, the research protocol and research ethics. Interviewer training should also involve a discussion of the importance of valid data, ways to reduce bias, and the research goals themselves to foster the interviewers’ sense of ownership and personal commitment to those goals even in the absence of supervision (10).
Another type of bias that may be especially common among young respondents is social desirability bias, which occurs when study participants do not answer questions honestly because they perceive the truth to be socially unacceptable or undesirable. For example, a person may falsely deny having had a sexually transmitted infection because of fear of the social stigma related to it. Researchers have generally found that behaviours that are seen as socially undesirable will be under-reported rather than over-reported (11). However, perceptions of desirability may vary within a population, and what may be considered unacceptable for one group may be considered desirable for another. In some cultures, for example, young women’s abstinence from sex is highly valued, so they may under-report their total number of sexual partners to interviewers, while young men in the same culture may take pride in sexual experience, and thus exaggerate their total number of partners (12,13).
A number of techniques have been developed to reduce social desirability bias. One is to explain the research goals before the interview, including their social value and legitimacy, and the importance
13
A guide to indicators for monitoring and evaluating national HIV/AIDS prevention programmes for young people
of honest reports. Another is to ensure the privacy of the interview and the confidentiality of any information obtained from it, and to make this as evident as possible to respondents.
There are a number of ways to reduce the possibility of bias through questionnaire wording and design. For a further discussion on this topic, including tips on questionnaire design, please refer to the Methods Annex.
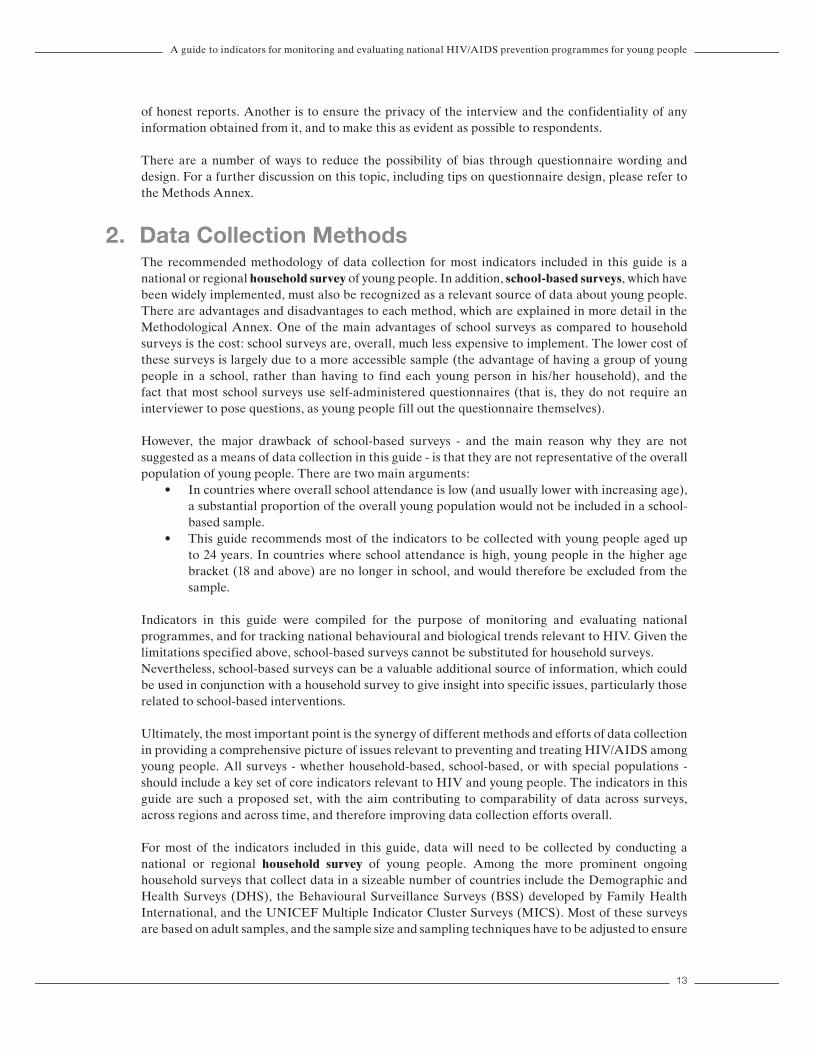
2. Data Collection MethodsThe recommended methodology of data collection for most indicators included in this guide is a national or regional household survey of young people. In addition, school-based surveys, which have been widely implemented, must also be recognized as a relevant source of data about young people.There are advantages and disadvantages to each method, which are explained in more detail in the Methodological Annex. One of the main advantages of school surveys as compared to household surveys is the cost: school surveys are, overall, much less expensive to implement. The lower cost of these surveys is largely due to a more accessible sample (the advantage of having a group of young people in a school, rather than having to find each young person in his/her household), and the fact that most school surveys use self-administered questionnaires (that is, they do not require an interviewer to pose questions, as young people fill out the questionnaire themselves).
However, the major drawback of school-based surveys - and the main reason why they are not suggested as a means of data collection in this guide - is that they are not representative of the overall population of young people. There are two main arguments:
• In countries where overall school attendance is low (and usually lower with increasing age), a substantial proportion of the overall young population would not be included in a school-based sample.
• This guide recommends most of the indicators to be collected with young people aged up to 24 years. In countries where school attendance is high, young people in the higher age bracket (18 and above) are no longer in school, and would therefore be excluded from the sample.
Indicators in this guide were compiled for the purpose of monitoring and evaluating national programmes, and for tracking national behavioural and biological trends relevant to HIV. Given the limitations specified above, school-based surveys cannot be substituted for household surveys. Nevertheless, school-based surveys can be a valuable additional source of information, which could be used in conjunction with a household survey to give insight into specific issues, particularly those related to school-based interventions.
Ultimately, the most important point is the synergy of different methods and efforts of data collection in providing a comprehensive picture of issues relevant to preventing and treating HIV/AIDS among young people. All surveys - whether household-based, school-based, or with special populations - should include a key set of core indicators relevant to HIV and young people. The indicators in this guide are such a proposed set, with the aim contributing to comparability of data across surveys, across regions and across time, and therefore improving data collection efforts overall.
For most of the indicators included in this guide, data will need to be collected by conducting a national or regional household survey of young people. Among the more prominent ongoing household surveys that collect data in a sizeable number of countries include the Demographic and Health Surveys (DHS), the Behavioural Surveillance Surveys (BSS) developed by Family Health International, and the UNICEF Multiple Indicator Cluster Surveys (MICS). Most of these surveys are based on adult samples, and the sample size and sampling techniques have to be adjusted to ensure

14
Chapter 2: Methodological Considerations
a representative number of young people within the overall sample. There are also household surveys that are adolescent-specific, such as Reproductive Health and Adolescent Reproductive Health Surveys undertaken by the U.S. Centers for Disease Control and Prevention (CDC), and the Asian Young Adult Reproductive Risk Surveys, supported by USAID. In addition to these “international” surveys, many countries also undertake annual or more frequent national surveys (e.g., quarterly labour force or economic surveys). The volume and types of data on adolescents varies tremendously across these national surveys. However, as such surveys might serve as a vehicle for adding questions on adolescent health and development, they are worthy of note.
3. Collecting Data on 10-14 year olds: Challenges of Data Collection and AnalysesTo date, most large-scale surveys of young people and most programmes (from life skills to provision of health services to livelihood interventions) are targeted at young people ages 15 and older. In many cases, however, many 15 year old young people have matured sexually and begun to have sex, and in many settings a large proportion of 15 year old girls has already been married.
There is clearly a need to collect data from - and to target appropriate interventions at - adolescents aged 10-14. However, there are a number of methodological and ethical issues surrounding data collection with this population. Some school-based surveys (see the Methodological Annex) have indeed included adolescents younger than 15 years of age, and have provided valuable lessons in collecting data with this population. Still, there is overall little information available about the bestpractices in collecting data with this age group particularly in household surveys, and this clearly deserves further investigation. The principal areas of consideration are outlined below.
This Guide recommends that in each setting, the possibility of collecting data with 10-14 year old adolescents should be explored. In some cases it may be possible to ask sexuality-related questions of this age group; in others, it may not. For settings where such questions cannot be asked, the Guide recommends to focus (for this age group) on the indicators in the Determinants chapter relating to relevant knowledge of HIV prevention, to young people’s perceptions of peers’ sexual activity, and to describing the context in which young people take sexuality-related decisions.
3.1. Collecting biological dataBy and large, this group is left out of the estimations of HIV prevalence. Prevalence data is largely drawn from testing pregnant women at antenatal services. Young girls aged 10-14 are likely to comprise a very small proportion of this clientele in any given setting, even in settings where sexual activity is not uncommon at an early age. Data collection at antenatal sites should be in any event collected by specific age (year-specific), allowing for analysis according to different age brackets. Population-based surveys usually do not include this age group either, and gathering biological specimens from this age group presents ethical and parental consent issues. By and large, HIV prevalence estimation among this group will likely remain based on modelling prevalence from other age groups.
3.2. Appropriateness of survey questionsIn many settings, parents and other adults may resist asking sexual behaviour questions of adolescents aged 10-14. In settings where behavioural questions can be asked of younger adolescents, the wording of the questions must be carefully considered to ensure their full comprehension and cultural sensitivity.
Sometimes, proxy behavioural questions are used. For example, young adolescents are asked whether they think their peers have already had sex (or have used drugs, etc), as it is assumed

15
A guide to indicators for monitoring and evaluating national HIV/AIDS prevention programmes for young people
that the respondent is answering about a group similar to him/herself. It is not possible, however, to assume that these types of questions substitute self-response questions. Some research has shown, for example, that adolescents often believe their friends are engaging in risk behaviours at a much higher rate than they actually are (14,15,16).
Questions about perceptions of certain actions are also used as a proxy for predicting whether young adolescents are engaging in such actions (i.e., whether the respondent considers it acceptable or not for him/herself to be having sex). It has been found that attitudes about sex are strongly related to actual sexual activity. However, the onset of sexual activity may be brought about by circumstances unrelated to the young persons’ attitudes (e.g., forced sex), and therefore this measure cannot substitute direct behavioural questions.
Some surveys have opted for designing an additional module to replace the sexual behaviour questions where these are not possible to ask (e.g., “Optional core module for countries that cannot ask sexual behaviour questions,” in the Global School-based Student Health Survey, World Health Organization.) However, in some settings, even attitude and knowledge questions about sexuality, contraceptives, and reproductive health services can be judged as inappropriate for this age group.
3.3. Consent & parental permissionObtaining appropriate consent from the young person and/or his or her guardian is in most countries mandated by the laws which protect minors; often they are also mandated by the ethical policies of investigating bodies. The process of obtaining consent is influenced by a number of factors: the development of the young person involved, the setting in which he or she is interviewed, and the social perceptions of the appropriateness of young people to be interviewed regarding the topic at hand.
a) Development: emotional and brain development in this age group is in fact not homogeneous: it differs by year, and also between boys and girls. Regardless of the stage of development, however, written or oral consent is usually sought from the respondent. Most often, parental consent is also sought.
b) Settings: the most common settings where young people are interviewed are their own homes, and schools. In both, there is usually a need to obtain parental permission or consent to conduct the interview. There may be a bias introduced in both cases between the parents that allow their child to be interviewed and those that do not. The setting itself can also influence the interview, that is, whether the young respondent considers it comfortable and confidential. When young people are reached through other settings, such as the street, or a workplace, parental consent is often not sought.
c) Social perceptions: Parental consent may be more or less difficult to obtain depending on the topics to be covered in a questionnaire, and on the prevailing norms and perceptions about appropriate topics for this age group. A survey focusing on sexuality, for example, is probably likely to get a lower rate of parental consent than a survey focusing on a broader range of health and development outcomes.
There are many unanswered questions in deciding on the best methodology of collecting data with 10-14 year olds. These questions should be recognized and acknowledged, but should not paralyse efforts to collect data from this group - clearly needed to better reach this young population.

16
Chapter 3: Programmatic indicators
CHAPTER 3
PROGRAMMATIC INDICATORS
Programmatic indicators are intended to monitor key interventions for the prevention of HIV at the national level. They focus principally on inputs, process and outputs, and can be used to track progress in implementing programmes over time.
This chapter begins with two indicators measuring overall government response to HIV/AIDS prevention among young people through policies specifically relating to them, and through the provision of national funds for prevention programmes for them.
Five indicators concerned with specific intervention areas were selected on the premise that the minimal components of any national programme for HIV/AIDS prevention among young people should include the provision of relevant information and skills through schools, access to condoms and access to key health services specified as HIV testing, STI diagnosis or treatment, and family planning/contraceptives. These are considered to be core indicators in any type of epidemic and in any setting. An additional indicator specifically measures the inclusion of young people in programmes for IDUs. This is a core indicator for settings and epidemics in which intravenous drug use is a major mode of HIV transmission. These five indicators focus on programme coverage rather than quality, because the assessment of quality has to be based on the specific characteristics of an intervention, which differ between settings.
As it is recognized that young people should be involved in the design, implementation and assessment of national HIV/AIDS prevention programmes directed at them, a further indicator measures young people’s participation in these matters.
These eight indicators include and build on all programmatic indicators specific to young peopleincluded in previous guidelines (3, 17).

17
A guide to indicators for monitoring and evaluating national HIV/AIDS prevention programmes for young people
Indicator Tools for measurementPriority
Generalized epidemic
PriorityConcentrated
low-level epidemic
1. National index on policy related to young people and HIV/AIDS
• Country assessment questionnaire C C
2. National funds spent by government on HIV/AIDS prevention programmes for young people
• UNAIDS/UNFPA/NIDI survey on financial resource flows A A
3. Provision of life-skills-based HIV/AIDS education in schools
• School-based survey C C
4. Institutionalizing youth-friendly health services
• Nationally representative survey of health service delivery points
C C
5. Use of specified health services by young people
• Nationally representative general population survey
• Service statistics from a health services survey
C C
6. Condom availability for young people • MEASURE Evaluation/WHO/ PSI Compiled Condom Availability and Quality Protocol, retail survey
C C
7. Young injecting drug users reached by HIV/AIDS prevention services
• Prevalence estimation methods
• Service statistics from projects, programmes and treatment facilities
A C
8. Young people’s participation in HIV prevention programmes
• Country assessment questionnaire A A
A = additional.C = core.

18
Chapter 3: Programmatic indicators
1. National index on policy related to young people and HIV/AIDSPriority: Core.
Definition Progress in the development of national-level HIV/AIDS policies and strategies in six key areas:1. identification of HIV prevention among young people as a priority in the national strategic plan
on AIDS; 2. application of a multisectoral approach to HIV prevention among young people; 3. existence of a policy or strategy to promote HIV information, education and communication
(IEC) for young people;4. existence of a policy promoting life-skills-based education in schools; 5. existence of a policy providing youth-friendly health services;6. existence of a policy promoting young people’s access to condoms.
Target population Key informants knowledgeable about national policies
Numerator N/A
Denominator N/A
Measurement tools The items proposed in this indicator are to be added to the Country Assessment Questionnaire, as included in the Appendix 3 of the UNAIDS document Monitoring the Declaration of Commitment on HIV/AIDS: guidelines on construction of core indicators (17).
What it measures This indicator is a measure of progress in the development of HIV/AIDS policies and strategies at the national level in six key areas relating to young people. It complements the National Composite Index Indicator in the UNAIDS document Monitoring the Declaration of Commitment on HIV/AIDS: guidelines on construction of core indicators (17).
How to measure it The questions pertaining specifically to policies on young people should be added to the Country Assessment Questionnaire (Appendix 3 in UNGASS on HIV/AIDS Guidelines on construction of core indicators) in the “strategic plan” and “prevention” areas. The questionnaire is conducted with key informants from a designated mix of institutions so as to obtain opinions about central areas of commitment and programming. Each item is given a score (yes = 1, no = 0). The items can be incorporated into the National Composite Policy Index (from UNAIDS guidelines) and can also be analysed separately as a stand-alone index of youth-specific policies. The items are as follows.
1. Relating to the national strategic plan:1.1. The country has identified HIV prevention and awareness among young people as a
priority in the national strategic plan on HIV/AIDS.1.2. The country applies a multisectoral approach to HIV prevention in young people (at
least involving the health and education sectors).2. Relating to prevention policies:
2.1. The country has a policy or strategy targeted specifically at young people for promoting HIV/AIDS information, education and communication ( IEC).
2.2. The country has a policy that promotes life-skills-based education in schools. 2.3. The country has a policy of providing young-people-friendly health services.2.4. The country has a policy that promotes young people’s access to condoms.
The indicator is the sum of the scores resulting from this assessment.

19
A guide to indicators for monitoring and evaluating national HIV/AIDS prevention programmes for young people
Strengths and limitations
The indicator is simple to assess and is designed to complement the National Composite Policy Index. Because of its simple quantitative nature, however, it gives no information on the quality or effectiveness of national policies and strategies. It is restricted to indicating whether they exist. Moreover, because it relies on the opinions of key informants, the outcome depends entirely on the choice of informants, who can be expected to change from year to year. This makes it difficult to detect true differences between countries and changes over short periods of time, as any change in the composition of the respondents is likely to lead to a change in assessment.
Concern has also been raised about the value of a single composite score, in which improvements in some areas may be masked by deterioration in others. For planning and monitoring purposes it may be more useful to present the indices separately.
This is a qualitative exercise in which information is collected from a limited number of informants. Respondents for policy assessment are usually not meant to be representative but are carefully selected for their knowledge and viewpoint. The policy assessment may therefore be affected by subjectivity bias on the part of the respondents. In most countries the selected respondent is the manager of the national AIDS programme. However, more than one respondent can be interviewed in order to obtain a more comprehensive picture, and efforts can be made to retain the same informants over a number of years so as to guard against differential recall bias.
Links to other indicators Reference (3). Link to policy indicator No. 1: AIDS programme effort index (API).Reference (17). Link to national commitment and action indicator No. 2: National composite policy index.

20
Chapter 3: Programmatic indicators
2. National funds spent by government on HIV/AIDS prevention programmes for young peoplePriority: Additional
Definition The amount of national funds spent by governments on HIV/AIDS prevention programmes for young people
Target population Key informants knowledgeable about government HIV/AIDS spending; or a review of government expenditures
Numerator N/A
Denominator N/A
Measurement tools UNAIDS/UNFPA/NIDI survey on financial resource flows. (This survey does not currently include disaggregation of the financial data to specify spending on programmes for young people. However, such disaggregation is proposed as an additional measurement task in connection with gathering data for this indicator.)
What it measures This indicator complements core indicator 2 included in the UNAIDS Guidelines on construction of core indicators (17). The UNAIDS indicator measures spending on HIV prevention, and consists of measures of expenditure in four areas: STD control activities, HIV prevention, HIV/AIDS clinical care and treatment, and HIV/AIDS impact mitigation. The present indicator, however, is concerned only with the economic commitment to enhance the prevention response to HIV/AIDS for young people, including life-skills-based education through schools, IEC campaigns targeted at young people, and programmes for the provision of condoms.
How to measure it A survey is conducted of national government expenditures on HIV/AIDS programmes, and, within them, of expenditures particularly for programmes targeting young people. The estimates should exclude the cost of any multilateral, bilateral or international donor-funded government programmes. All local NGO programmes should also be excluded, except programmes or parts thereof that are funded by the national government.
Strengths and limitations
In some settings it may be difficult to obtain even general government expenditure figures relevant to HIV/AIDS programming. Where general figures are available it may be difficult to isolate, within them, expenditures on specific programmes, such as prevention programmes aimed at young people. Nevertheless, it is important to attempt to capture governmental financial commitment to HIV/AIDS programming for young people.
The main weakness of this indicator is that it does not capture the financial commitment to all relevant programming for young people. For example, it does not cover the provision of youth-friendly health services, as these tend not to be defined within prevention activities. Moreover, it is not intended to be used as a measure of resource availability but as an indicator of political commitment to responding to HIV among young people. All governments reflect their political priorities in their allocation of internal resources. Changes in funding allocated to HIV prevention among young people is therefore a good indicator of the importance that governments attach to the epidemic.
Links to other indicators: Reference (3). Link to policy indicator No. 2: Spending on HIV prevention. Reference (17). Link to national commitment and action indicator No. 1: Amount of national funds spent by governments on HIV/AIDS.

21
A guide to indicators for monitoring and evaluating national HIV/AIDS prevention programmes for young people
3. Provision of life-skills-based HIV/AIDS education in schoolsPriority: Core(This is an UNGASS indicator)
Definition The percentage of schools with at least one teacher who has been trained in participatory life-skills-based HIV/AIDS education and who has taught the subject during the last academic year.
Target population Primary and secondary schools.
Numerator The number of schools with at least one teacher trained in, and regularly teaching, life-skills-based HIV/AIDS education.
Denominator The number of schools surveyed.
Measurement tools School-based survey, or interview with school principals or directors.
What it measures This indicator is a measure of progress in implementing life-skills-based HIV/AIDS education in schools. It reflects coverage by school, estimating the proportion of schools that report having such programmes. It is not a measure of the quality of such programmes. For this indicator to be as meaningful as possible it should be combined with measures of quality.
How to measure it Principals/directors of a nationally representative sample of schools (including both private and public schools, and primary and secondary schools) are briefed on the meaning of life-skills-based HIV/AIDS education and are then asked the following questions.
1. Does your school have at least one qualified teacher who has been trained in participatory life-skills-based HIV/AIDS education in the last five years? • A “qualified teacher” is one who has participated in and successfully completed
a training course focusing on the skills required to conduct participatory learning experiences that aim to develop knowledge, positive attitudes and skills (e.g. interpersonal communication, negotiation, decision-making and critical thinking skills and coping strategies) that assist young people in maintaining safe lifestyles.
2. If the answer to question 1 is “Yes”: Did this person teach life-skills-based HIV/AIDS education on a regular basis in your school throughout the last academic year? • “Throughout” means at least 5–15 hours of life-skills-based HIV/AIDS education
programming per year per grade of pupil. • The criterion of teaching “on a regular basis” is grounded in research showing that
programmes of high quality can produce good outcomes after 5–15 hours of life-skills-based HIV/AIDS education programming per year per grade of pupil.
• The time dimension of “the last academic year” depends on the educational calendar in the country concerned (usually 9−10 months in one calendar year, designed to allow students to complete one educational level or grade).
If the sample has been selected to represent different strata the results should be disaggregated by school type (i.e. primary and secondary female and male, large and small, urban and rural, and private and public). If a school combines primary and secondary education, information should be collected and reported separately for each level.
In addition there should be a statement of primary and secondary school attendance rates pertaining to the most recent academic year for which they are available.
The sample of schools must be such as to ensure that the data are nationally representative. A complete listing of all schools is needed, both public and private, including schools with special curricula or programmes (e.g. vocational schools and boarding schools). For the results to be valid for each subgroup of schools as well as at the national level, sampling must be done in each subgroup

22
Chapter 3: Programmatic indicators
of interest. If a particular subcategory comprises fewer than 20 schools there is no advantage in randomly sampling it. In this case a representative sample can be selected with regard to factors such as size, location and the socioeconomic level of the student body. There is no need to sample within schools, as the information for this indicator is collected from a head administrator or similar person.
If resources permit, the following additional questions can be asked (if the answer to question No. 1, above, was “Yes”).
1. How many teachers at your school have received training in participatory life-skills-based HIV/AIDS education in the last five years?
2. How many of these teachers taught a life-skills-based HIV/AIDS education programme in your school during the last academic year?
3. How many classes and students in each grade in your school received life-skills-based HIV/AIDS education last year?
4. What was the duration in hours of the programme or course for each grade?
A guide on the quality aspects of life-skills-based HIV/AIDS education is available from: http://www.unicef.org/lifeskills/
Strengths and limitations
This overall measure of coverage of the life-skills-based programme in schools is fairly simple to collect, although it requires a national sampling frame of all schools. Vocational schools and work-school programmes should be included in the sample.
The life-skills programme should be implemented in primary schools and continued through secondary schools, with content and methods adapted to the age and experience of the students. This indicator shows whether life-skills-based education is taught at each level of schooling but reveals nothing about the quality of the content, the approach or the materials used.
When making comparisons across countries or even between regions of a country the differing rates of school attendance and enrolment must be taken into consideration.
The indicator is concerned with the provision of life-skills-based HIV/AIDS education through schools and, specifically, through the curriculum taught by teachers. Programmes conducted by outside agencies or facilitators should be excluded. The indicator may not capture the total effort of providing HIV education through schools, because students may be able to obtain some information from extracurricular sources (e.g. educational pamphlets, posters, special assemblies). However, such sources are likely have an ad hoc basis, whereas the indicator purposefully focuses on the systematic inclusion of HIV education in curricula.
Links to other indicators:Reference (17). Same as national programme and behaviour indicator No. 1: Percentage of schools with teachers who have been trained in life-skills-based HIV/AIDS education and who taught it during the last academic year.

23
A guide to indicators for monitoring and evaluating national HIV/AIDS prevention programmes for young people
4. Institutionalizing youth-friendly health services Priority: Core
Definition The estimated number of health facilities with arrangements in place to provide youth-friendly services.
Target population Selected health facilities.
Numerator The number of health facilities with specific policy on the treatment of young clients and with at least one health care provider trained in the provision of youth-friendly services.
Denominator The number of health facilities surveyed.
Measurement tools Nationally representative survey of health facilities
What it measures This indicator measures two key characteristics in the institutionalization of youth-friendly services: the existence of facility-based policies and guidelines for the treatment of young clients, and the training of health providers in youth-friendly approaches and methods. Both the existence of youth-friendly policies and youth-friendly health care providers are key elements of the WHO-recommended generic characteristics of a youth-friendly health service (18).
This is a facility-based indicator, i.e. it does not assess policy at the national level. It is an estimate of the effort to institutionalize youth-friendly services but does not measure service delivery at health facilities or the quality of the services provided. For tools that focus on operationally improving health services at facility level, reference may be made to guides such as those of NAFCI (19) and FOCUS (20).
How to measure it A nationally representative sample of health service delivery points is preferred for this measurement. Depending on the setting, the sample may include facilities at the primary, secondary and tertiary levels. The sample should be limited to facilities offering one or more of the three essential services related to HIV/AIDS prevention: STI diagnosis and treatment, contraceptive/family planning services, and HIV testing. If possible, both public and private facilities should be included.
Furthermore, in cases where intravenous drug use is a major factor in driving the epidemic, substance abuse prevention and treatment programmes can be included. If this is done the type of staff trained is likely to change, e.g. the personnel may not be doctors and nurses but other types of professionals. The questions below should be tailored accordingly.
Directors/heads of a nationally representative sample of health service delivery points are asked the following questions.
1. Does your facility have written policies and/or guidelines for health professionals specifically on how to treat young clients? • “Young clients” are aged 10−24; the relevant facility policies may include the entire
age range or only a subrange, e.g. up to 19 years of age.• Experience indicates that it is important to ask to see the written guidelines, in addition
to asking whether they exist.2. Does your facility have at least one qualified health professional (doctor, nurse, counsellor,
etc.) who has been trained in the provision of youth-friendly services in the last five years?

24
Chapter 3: Programmatic indicators
Strengths and limitations
This measure of the institutionalization of youth-friendly health services is simple to collect. For it to be representative, however, a national sampling frame of all health service delivery points is required.
This indicator is useful in allowing national programme managers to keep track of the proportion of health settings that are making efforts to become youth-friendly. The tracking of changes over time in this measure can provide a useful overview of the trend in implementing such services. It must be kept in mind, however, that for a health setting to qualify as fully youth-friendly a series of characteristics and functions must be in place, including convenient opening hours, the treatment of young clients with respect, affordability, and effectiveness of the services. Written guidelines and trained health professionals are only the most basic of the requirements. In order to be most useful for individual service delivery points the quality of services is best assessed in depth at the level of each health facility through a quality improvement approach or a similar process.
For these data to be representative at the national level the sample of health facilities must also be nationally representative. Criteria must be established with respect to the types of facilities to be considered (e.g. primary, secondary, and tertiam-level care, public and private). It is very important to differentiate between facilities aimed at young people and those targeting the general population, as the former are more likely to have staff trained in youth-friendly services. Once the criteria have been established a complete listing of all eligible health facilities is needed. For the results to be validly disaggregated for each subgroup of facilities as well as aggregated at the national level, sampling must be done for each subgroup. If a particular subcategory includes less than 20 facilities there is no advantage in randomly sampling it. In this case a representative sample of facilities can be selected with regard to factors such as client volume, location and the socioeconomic level of the catchment area. There is no need to sample within facilities because the information for this indicator is collected from a director, head doctor or similar person.

25
A guide to indicators for monitoring and evaluating national HIV/AIDS prevention programmes for young people
5. Use of specified health services by young people Priority: Core
Definition The use of specified health services by young people can be measured through either facility-based records (measuring service utilization only) or population-based methods such as surveys (which can give an estimate of the coverage of health services).
1) Facility-based: the number of young people seeking specified health services and the proportion of all clients at health services who are young people.
2) Population-based: the proportion of young people receiving specified health services.
Target population 1) Facility-based: sample of health facilities
2) Population-based: Persons aged 10−24 years.
Numerator 1) Facility-based: the number of young people using a specified health service in a defined period. Health services of particular interest include those concerned with HIV testing, STI diagnosis and treatment, and family planning / contraceptive use.
2) Population-based: the number of young people who report receiving any of the specified health services (HIV testing, STI diagnosis and treatment, and family planning / contraceptive use) in the preceding12 months.
Denominator 1) Facility-based: clients using a specified health service in a defined period.
2) Population-based: young people surveyed who report being sexually active (have ever had sex).
Measurement tools 1) Facility-based: facility-based surveys, routinely collected facility-based data.
2) Population-based: nationally representative general population survey.
What it measures 1) Facility-based This indicator tracks the number of young people seeking health services and the proportion of all clients of health services who are young people. It can be an estimate of the changes in care-seeking behaviour among young people.
It is well known that young people do not access health services in proportion to the health problems experienced in this population. A basic aim of an HIV/AIDS prevention programme, therefore, is to increase the use of services by young people, specifically for STI testing and treatment, family planning /contraceptive use, and HIV testing. This indicator provides the crude numbers and the proportion of all clients, per specific service if possible, who are young people.
Generally, an increase in the number and proportion of young clients is considered positive. However, the number and the proportion must be interpreted together, as the proportion of clients who are young people may decrease if the use of clinics by adults increases, even though the number of young clients may be increasing as well.
The correct interpretation of these numbers, moreover, requires some population-based estimates to be available, because it is necessary to know the magnitude of need in order to interpret increases or decreases in service use. For example, if it is known that 40% of the population served by a particular health service are young people aged 20–24, and that in this population the prevalence of Chlamydia is 20%, an estimate can be obtained of the maximum number and proportion of young clients who could, ideally, be expected to seek STI testing and treatment. In other words a ceiling is provided against which to gauge the increase or decrease in young clients.

26
Chapter 3: Programmatic indicators
2) Population-based This indicator estimates the proportion of sexually active young people who report seeking specified health services. In addition, if data are available on the proportion of young people in need of specific health services, either through epidemiological estimates or other surveys, this measure can be an estimate of the coverage of the specific health services. For example, if it is known that in a given region the proportion of sexually active females in the 15−19 age group is 50%, this provides a benchmark against which to gauge the number and proportion of females aged 15−19 years who report seeking health services in order to obtain contraceptives. If more details are known about sexual risk behaviours (e.g. if, of the 50% who are sexually active, 40% report more than one partner in the preceding year and only 30% report frequent use of condoms) they can be benchmarks for the proportion of girls aged 15-19 who would potentially need HIV testing services.
How to measure it 1) Facility-based The minimal data required for this indicator are obtained by disaggregation of all clients by age and by sex. The focus is on primary care facilities. However, depending on the setting, the use of other types of facilities can also be tracked.
Data can be collected from a nationally representative sample of health facilities. A brief discussion on sampling health facilities appears in the final paragraph on indicator No. 4 in this chapter.
Data can be obtained from record books, logbooks, etc. used by facilities to keep track of clients. The number of clients who are young people is summed for a defined period. In facilities that are youth-specific the period chosen may be short, e.g. a month; however, in facilities where young people are a small proportion of the client load the period must be extended to capture enough young clients. The proportion of clients in a chosen time frame who are young people can also be calculated by dividing the number of young clients by the total number of clients during the period in question. These data can be summarized at several points in time so as to provide an idea of the trends in service use.
Whenever possible the type of service provided should be specified. With regard to HIV prevention programmes for young people, at least the following services should be specified: STI testing and treatment, family planning services and HIV testing. Depending on the setting (both the level of the epidemic and the existence of a facility-based tracking system), PMTCT and antenatal care services can also be specified, as well as needle exchange services. In most resource-constrained settings, however, these specifications are impossible. In this circumstance it is of value simply to record young clients by age, sex and the type of service sought.
In settings with more sophisticated tracking systems, first visits should be distinguished from follow-up/repeat visits. First visits measure the increase in uptake of the services. Follow-up/repeat visits may reflect continued treatment (e.g. a first visit for an HIV test and a second visit for obtaining the result), or a recurring health problem (e.g. a return visit because of an STI that had not been successfully diagnosed or treated).
Other important characteristics of young people using the services should also be measured (e.g. rural/urban status), as this can provide useful information on the portion of the population not using the services.
2) Population-based Data are collected through population-based surveys in which respondents are asked whether they have received specified services. Most often, such questions are put only to respondents who report being sexually active (have ever had sex). If the question of service utilization is asked of all young people, those who have never had sex should be excluded from the denominator.

27
A guide to indicators for monitoring and evaluating national HIV/AIDS prevention programmes for young people
A defined time limit must be specified in the service utilization question. This can be defined on a national level (12 months is proposed here).
For HIV prevention programmes among young people, at least the following services should be specified: STI testing and treatment, family planning services and HIV testing. The question put is as follows.
Did you receive any of the health services listed below during the past 12 months?• STI diagnosis or treatment. • Family planning / contraceptives. • HIV testing.
The numerator comprises the number of respondents who report having used any of the specified health services, and the denominator is the number of all respondents. As before, the disaggregation of the respondents, if possible, by sex and age group is crucial for obtaining information on what part of the population is not using the services.
In order to estimate coverage from these data, population-based estimates of the need for the services must be available. These can be socio-demographic estimates (e.g. the proportions of sexually active adolescents by age and sex), epidemiological estimates (of STI/HIV prevalence, pregnancy or birth rates, contraceptive use, etc.) or estimates of the perceived need for services collected by other surveys. As illustrated in the previous section, if it is known that in a given region the proportion of sexually active females in the 15−19 age group is 50%, this provides a benchmark against which to gauge the number and proportion of females aged 15−19 years who report seeking health services in order to obtain contraceptives. The difference between the two can be an estimate of the unmet need for a particular service.
Strengths and limitations
1) Facility-basedThe strength of this indicator is that it uses existing service-based mechanisms of data collection and record-keeping. In settings with sufficient resources a simple coding scheme can be established both to code the type of service received and to distinguish first visits from repeat visits. If this is impossible, however, valuable information is obtainable by simply tallying the total number of young clients.
As these data build on monitoring systems, they are ideally collected continuously throughout the year. Trend data should be observed at intervals, e.g. quarterly, and not only at specific points in time, because service utilization is affected by seasonal events. In each setting the important sociocultural events should be recognized, but at least the local school year and major religious holidays should be taken into account when collecting and interpreting the data.
It should be kept in mind that an increase in the number of young people seeking services does not necessarily mean an increase in the proportion of young people with health needs or issues. The increase may well be attributable to other factors, such as an IEC campaign advertising the services or a health promotion programme that enables more young people to recognize the need for services, e.g. to recognize the symptoms of an STI or to increase the demand for contraceptives.
A major weakness of this indicator is that it depends on facilities having well-maintained and accurate records and logbooks, including age-specific records or at least records in age brackets allowing for disaggregation of young people from adults. In many countries there may be no such records, or the recording of services in facilities may not be standardized, i.e. some clinics may keep updated and well-maintained records whereas others may not. Even where well-maintained clinical records exist by measuring the quality and effectiveness of health services. the way in which the information is recorded may limit the ability to collect data for this indicator. For example, some facilities include
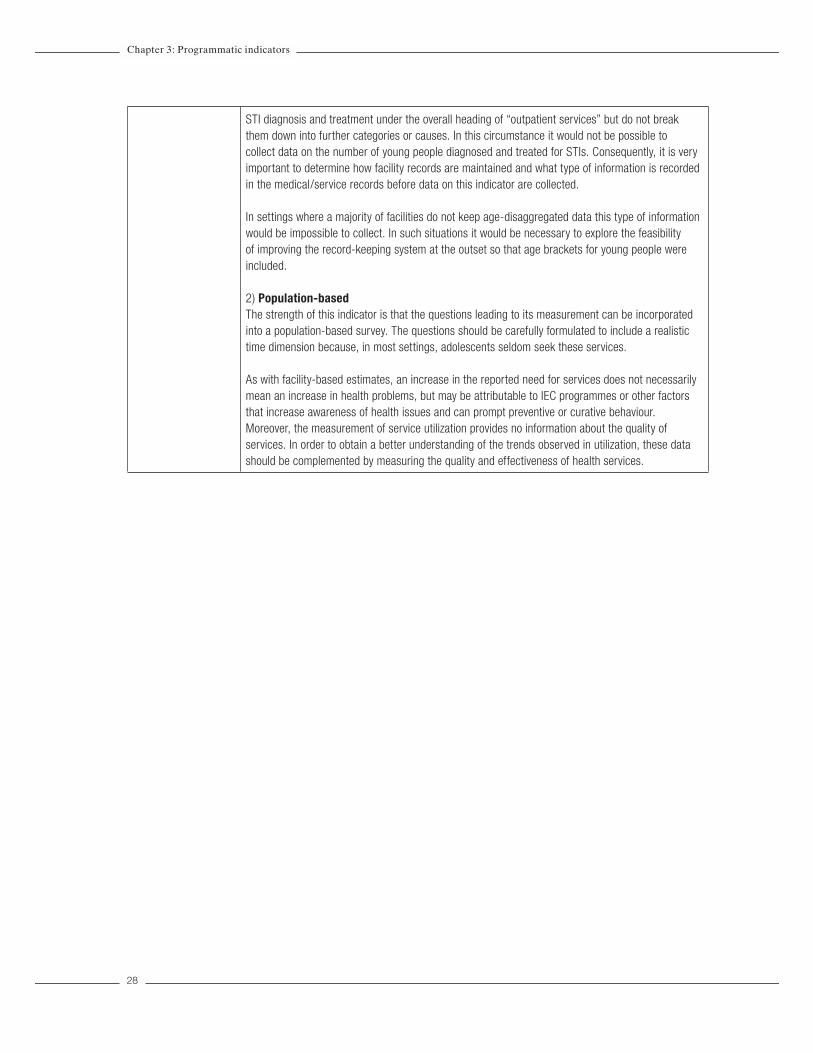
28
Chapter 3: Programmatic indicators
STI diagnosis and treatment under the overall heading of “outpatient services” but do not break them down into further categories or causes. In this circumstance it would not be possible to collect data on the number of young people diagnosed and treated for STIs. Consequently, it is very important to determine how facility records are maintained and what type of information is recorded in the medical/service records before data on this indicator are collected.
In settings where a majority of facilities do not keep age-disaggregated data this type of information would be impossible to collect. In such situations it would be necessary to explore the feasibility of improving the record-keeping system at the outset so that age brackets for young people were included.
2) Population-basedThe strength of this indicator is that the questions leading to its measurement can be incorporated into a population-based survey. The questions should be carefully formulated to include a realistic time dimension because, in most settings, adolescents seldom seek these services.
As with facility-based estimates, an increase in the reported need for services does not necessarily mean an increase in health problems, but may be attributable to IEC programmes or other factors that increase awareness of health issues and can prompt preventive or curative behaviour. Moreover, the measurement of service utilization provides no information about the quality of services. In order to obtain a better understanding of the trends observed in utilization, these data should be complemented by measuring the quality and effectiveness of health services.

29
A guide to indicators for monitoring and evaluating national HIV/AIDS prevention programmes for young people
6. Condom availability for young peoplePriority: Core.
Definition The percentage of randomly selected retail outlets and service delivery points typically accessed by young people which have condoms in stock at the time of the survey.
Target population Persons aged 15−24 years.
Numerator The number of retail outlets and service delivery points that are typically accessed by young people and have condoms in stock at the time of the survey. Sites and venues that are typically accessed by young people should be identified either through key informants or from survey responses concerning the places where young people obtain or prefer to obtain condoms.
Denominator The number of retail outlets and service delivery points typically accessed by young people.
Measurement tools MEASURE Evaluation/WHO/PSI Compiled Condom Availability and Quality Protocol, retail survey (4). The statistical departments or finance ministries of many countries conduct regular, usually quarterly, retail surveys that include price and availability data for a wide variety of commodities.
What it measures The actual distribution of condoms at designated points, typical of youth access, at any one time. It highlights programme efforts to broaden the distribution of condoms so that they are available at the location types that young people prefer.
How to measure it Sites of different types are randomly selected for a retail survey. The sampling frame should be stratified in order to ensure geographical and demographic spread (e.g. rural/urban). It is better to limit the type of venue that could or should provide condoms to young people, and to focus on a defined set that must consistently provide them, e.g. youth centres, health clinics, school clinics, and pharmacies. Accordingly, this indicator should focus mainly on the priority venues and include additional ones as resources permit. These additional sites could be as diverse as bus stops, car parks, barbers’ shops, hair salons, night clubs, bars, fast food shops, kiosks, pharmacies, markets and petrol stations. However, it may be difficult and costly to obtain a full list of all possible sites where young people obtain condoms. For this reason, criteria should be developed for the types of venues to be included, focusing on venues that, in the particular national context, must consistently provide condoms for young people.
The data should be disaggregated by condom type (male/female), geographical location, e.g. region, state, district, county or ward, and outlet type. Data disaggregated by outlet type provide invaluable information for programme managers and for persons seeking to improve the marketing of condoms.
Strengths and limitations
The statistical departments or finance ministries of many countries already conduct regular retail surveys that include price and availability data for a wide variety of commodities. They typically use a well-established sampling frame covering a wide range of venues throughout the countries concerned. Where such surveys exist, condoms can simply be added to the box relating to commodities for which data are collected. Certain venues, where young people typically access condoms, are not traditionally covered in retail surveys. In this case, special surveys of these extra venues can be undertaken to provide the necessary additional data.
This indicator focuses on static sites and venues. Consequently, in countries where a special effort is being made to distribute condoms through non-static outreach sites, the indicator would be of limited value.
Another limitation of this measure is that it only indicates condom availability at a particular point in time. In countries where the supply of condoms varies significantly, data collected on this indicator maylead to an invalid conclusion about the true availability of condoms. In such countries the data collected at a given time could show a high availability of condoms whereas availability could be low at other times. Moreover, low availability in this circumstance would not be caused by poor distribution but by problems at the central level.

30
Chapter 3: Programmatic indicators
This limitation can be partially addressed by including an additional numerator item: the number of retail outlets and service deliver points that are typically accessed by young people and which have experienced a stockout in condoms for five or more consecutive days in the previous three months. This additional numerator item can give a longitudinal dimension to the indicator, which is otherwise limited to the time of the survey. The methodology for collecting this additional item should include a brief interview with the manager of the venue concerned. This could consist simply of asking the manager to recall whether there have been stockouts, or, for a more rigorous assessment, could include a review of merchandise logbooks and records. For this information to be as useful as possible the reasons for stockouts should be ascertained so that interventions can be designed in order to address whatever problems exist.
As with the other indicators in this chapter which require a sample of institutions, i.e. schools for indicator No. 3 and health facilities for indicators Nos. 4 and 5, the present indicator requires a decision to be taken on the types of site that are to be considered eligible, as it may be very difficult and costly to obtain a full list of all sites where young people can access condoms. Once this has been done, a complete list of all sites meeting the established criteria is required so that a representative sample can be obtained. If the data are to be disaggregated by venue type, separate sampling must be performed for each type. If a subgroup comprises fewer than 20 venues, sampling is not needed and a number of venues can be selected purposefully.
The availability of condoms at the time of the survey is verifiable by the person carrying out the survey. In order to obtain the additional part of the numerator relating to stockouts, however, it is necessary to consult a key informant, e.g. the manager of each venue surveyed, or to review the merchandise logbooks and records. This means that additional planning and work are necessary. It should be borne in mind that data collection based on interviews is subject to recall and response bias among the informants.
Links to other indicators:This indicator can be interpreted together with indicator No. 2 in Chapter 4, concerning knowledge of a formal source of condoms among young people. It is also linked to an indicator in the UNAIDS Guide to monitoring and evaluating national HIV/AIDS programmes (reference 3): “condom availability indicator No. 1”: Condoms available for distribution, nation-wide.
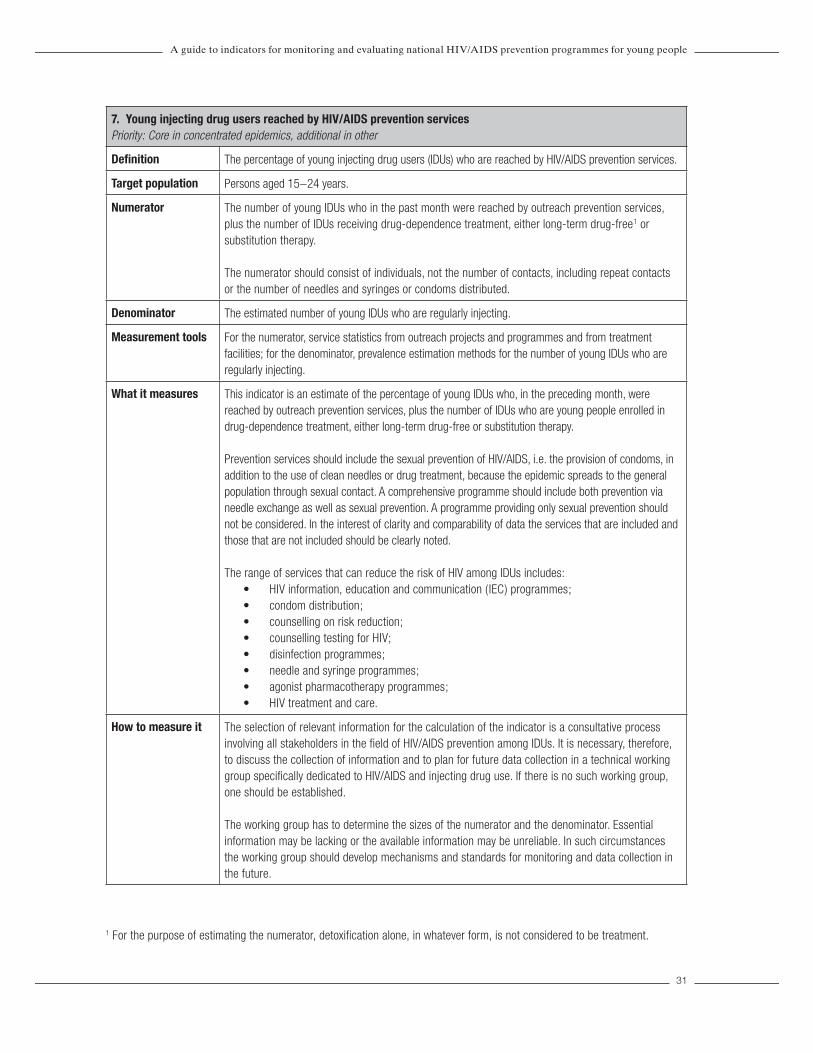
31
A guide to indicators for monitoring and evaluating national HIV/AIDS prevention programmes for young people
7. Young injecting drug users reached by HIV/AIDS prevention services Priority: Core in concentrated epidemics, additional in other
Definition The percentage of young injecting drug users (IDUs) who are reached by HIV/AIDS prevention services.
Target population Persons aged 15−24 years.
Numerator The number of young IDUs who in the past month were reached by outreach prevention services, plus the number of IDUs receiving drug-dependence treatment, either long-term drug-free1 or substitution therapy.
The numerator should consist of individuals, not the number of contacts, including repeat contacts or the number of needles and syringes or condoms distributed.
Denominator The estimated number of young IDUs who are regularly injecting.
Measurement tools For the numerator, service statistics from outreach projects and programmes and from treatment facilities; for the denominator, prevalence estimation methods for the number of young IDUs who are regularly injecting.
What it measures This indicator is an estimate of the percentage of young IDUs who, in the preceding month, were reached by outreach prevention services, plus the number of IDUs who are young people enrolled in drug-dependence treatment, either long-term drug-free or substitution therapy.
Prevention services should include the sexual prevention of HIV/AIDS, i.e. the provision of condoms, in addition to the use of clean needles or drug treatment, because the epidemic spreads to the general population through sexual contact. A comprehensive programme should include both prevention via needle exchange as well as sexual prevention. A programme providing only sexual prevention should not be considered. In the interest of clarity and comparability of data the services that are included and those that are not included should be clearly noted.
The range of services that can reduce the risk of HIV among IDUs includes: • HIV information, education and communication ( IEC) programmes;• condom distribution;• counselling on risk reduction; • counselling testing for HIV;• disinfection programmes; • needle and syringe programmes; • agonist pharmacotherapy programmes; • HIV treatment and care.
How to measure it The selection of relevant information for the calculation of the indicator is a consultative process involving all stakeholders in the fi eld of HIV/AIDS prevention among IDUs. It is necessary, therefore, to discuss the collection of information and to plan for future data collection in a technical working group specifi cally dedicated to HIV/AIDS and injecting drug use. If there is no such working group, one should be established.
The working group has to determine the sizes of the numerator and the denominator. Essential information may be lacking or the available information may be unreliable. In such circumstances the working group should develop mechanisms and standards for monitoring and data collection in the future.
1 For the purpose of estimating the numerator, detoxification alone, in whatever form, is not considered to be treatment.

32
In order to determine the numerator it is necessary to review data of all the government and nongovernmental treatment and outreach programmes and projects in the country concerned. This usually requires the establishment of an inventory of all ongoing governmental and nongovernmental projects and programmes that provide face-to-face services (either information and counselling only, or information, counselling and the provision of clean needles/syringes, or drug-dependence therapies such as methadone treatment and abstinence-based programmes). The collation of data from these programmes and projects is necessary. If a country has no inventory of ongoing programmes and projects it is strongly recommended that a database be rapidly established.
Data from all relevant services are combined in order to calculate the numerator for this indicator. However, when this indicator is being reported on a national basis the types of services available, and the types included in the numerator, should be specifi ed.
It may be problematic to ask for an age breakdown that results in enquiries about possibly illegal activities. A general age bracket of “under 25” is therefore recommended as a core indicator, and an additional breakdown for persons aged under 18 years is suggested as optional where appropriate.
A number of methods may be used to estimate of the actual size of a specifi c population vulnerable to HIV infection, in this case the number of injecting drug users in a country (6). These methods are designed to produce estimates of the sizes of populations that are hidden or hard to reach.
Strengths and limitations
This indicator gives a strong programmatic measure of the availability of harm reduction services to young IDUs. The denominator data could have a considerable margin of error, however, as estimates are derived from different sources. These may be biased or extrapolated from data obtained at the subnational level. If there are different sources of data the best available estimate has to be used.
It is necessary to keep track of the number of IDUs reached through outreach, to avoid double counting and to protect and maintain confi dentiality with respect to the identifi cation of IDUs, especially vis-à-vis law enforcement agencies where these activities are legally problematic. For example, it may be illegal in some places to distribute needles to people under 18, whereas many outreach services function on a “no questions asked” basis and therefore do not collect any data on their clients. Drug-dependence treatment programmes are more likely to keep age data.
Links to other indicators:This indicator is linked to an indicator in the UNAIDS Guidelines on construction of core indicators (17): “Percentage of IDUs who have adopted behaviours that reduce transmission of HIV”
Chapter 3: Programmatic indicators
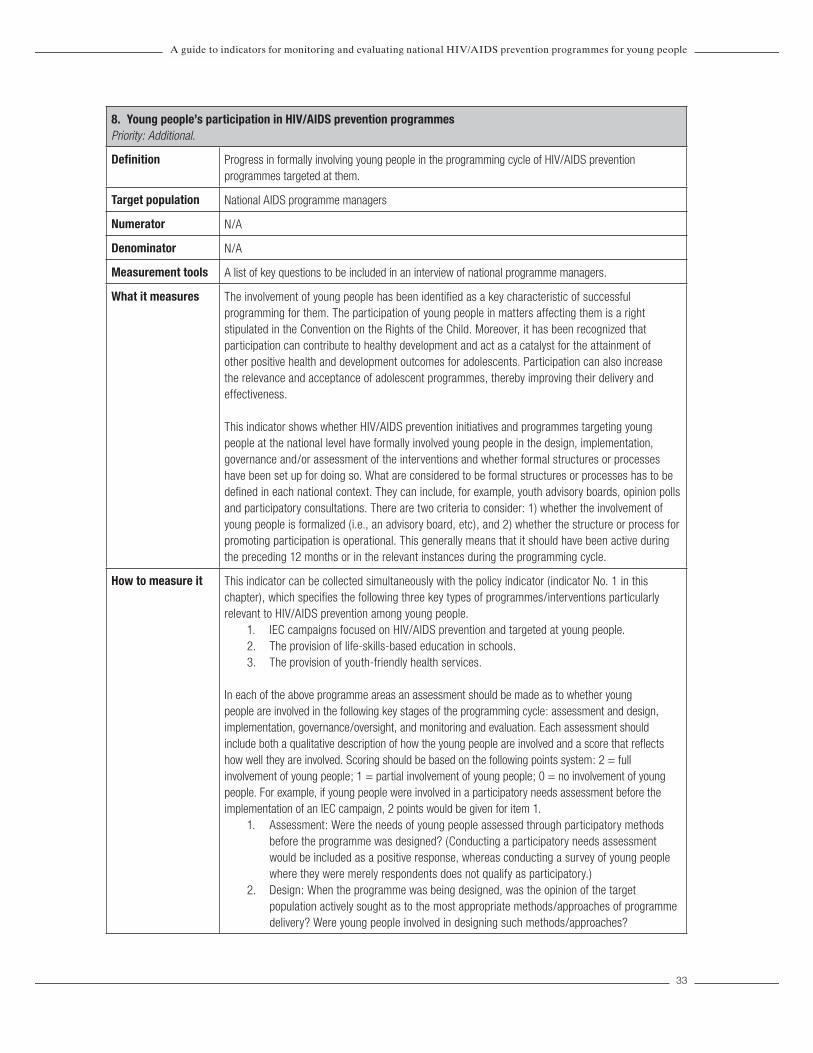
33
A guide to indicators for monitoring and evaluating national HIV/AIDS prevention programmes for young people
8. Young people’s participation in HIV/AIDS prevention programmesPriority: Additional.
Definition Progress in formally involving young people in the programming cycle of HIV/AIDS prevention programmes targeted at them.
Target population National AIDS programme managers
Numerator N/A
Denominator N/A
Measurement tools A list of key questions to be included in an interview of national programme managers.
What it measures The involvement of young people has been identified as a key characteristic of successful programming for them. The participation of young people in matters affecting them is a right stipulated in the Convention on the Rights of the Child. Moreover, it has been recognized that participation can contribute to healthy development and act as a catalyst for the attainment of other positive health and development outcomes for adolescents. Participation can also increase the relevance and acceptance of adolescent programmes, thereby improving their delivery and effectiveness.
This indicator shows whether HIV/AIDS prevention initiatives and programmes targeting young people at the national level have formally involved young people in the design, implementation, governance and/or assessment of the interventions and whether formal structures or processes have been set up for doing so. What are considered to be formal structures or processes has to be defined in each national context. They can include, for example, youth advisory boards, opinion polls and participatory consultations. There are two criteria to consider: 1) whether the involvement of young people is formalized (i.e., an advisory board, etc), and 2) whether the structure or process for promoting participation is operational. This generally means that it should have been active during the preceding 12 months or in the relevant instances during the programming cycle.
How to measure it This indicator can be collected simultaneously with the policy indicator (indicator No. 1 in this chapter), which specifies the following three key types of programmes/interventions particularly relevant to HIV/AIDS prevention among young people.
1. IEC campaigns focused on HIV/AIDS prevention and targeted at young people. 2. The provision of life-skills-based education in schools. 3. The provision of youth-friendly health services.
In each of the above programme areas an assessment should be made as to whether young people are involved in the following key stages of the programming cycle: assessment and design, implementation, governance/oversight, and monitoring and evaluation. Each assessment should include both a qualitative description of how the young people are involved and a score that reflects how well they are involved. Scoring should be based on the following points system: 2 = full involvement of young people; 1 = partial involvement of young people; 0 = no involvement of young people. For example, if young people were involved in a participatory needs assessment before the implementation of an IEC campaign, 2 points would be given for item 1.
1. Assessment: Were the needs of young people assessed through participatory methods before the programme was designed? (Conducting a participatory needs assessment would be included as a positive response, whereas conducting a survey of young people where they were merely respondents does not qualify as participatory.)
2. Design: When the programme was being designed, was the opinion of the target population actively sought as to the most appropriate methods/approaches of programme delivery? Were young people involved in designing such methods/approaches?

34
3. Implementation: Is young people’s participation in the implementation of the programme, e.g. as peer educators, an integral part of the delivery strategy?
4. Governance/oversight: Does the governance/oversight structure of the programme include young people? ( It could be a separate structure specifically for young people, e.g. a youth board, or it could be incorporated into structures led by adults. In either case, the role of young people vis-à-vis the adult-led oversight/governance structures should be assessed.)
5. Monitoring and evaluation: Are young people involved in tracking progress in programme implementation (monitoring) or in assessing its effects (evaluation), e.g. as junior researchers or in similar roles, but not merely as respondents in surveys or other means of data collection?
Within each of the three key programme types specified above the points given to each individual item can be summed so as to obtain an overall score:
Sum of scores from each individual item 5 (number of total items)
If there is more than one respondent the numerator should include the sum of all the respondents’ scores and the denominator should be multiplied by the total number of respondents.
These scores provide an overall assessment of the extent to which young people have been actively involved in the programmes targeted at them and can even be used to compare participatory efforts in different programmes because most interventions, regardless of their topic and means of delivery, go through the stages of the programme cycle specified above. However, the overall scores are of limited value as the most meaningful information is in the qualitative description of the extent of young people’s participation in each stage of the programme cycle.
Strengths and limitations
This indicator is simple to collect and, if assessed simultaneously with the policy indicator, does not require any additional data collection. Being a national-level indicator, it is limited to overarching categories and structures of participation. In order to describe the participatory processes undertaken in a programme properly, measurement must occur at the level of the intervention and should capture the quantity as well as the quality of participation, i.e. the proportion of young people involved at any stage of the programming cycle as well as the quality of their involvement. Nevertheless, the indicator is a useful measure of whether, and to what extent, national-level programmes targeted at young people are seeking to involve them.
This is a qualitative exercise: information is collected by means of interviews with a limited number of informants. In most countries the selected respondent is likely to be the manager of the national AIDS programme. The score of the indicator depends on a somewhat subjective assessment of the level of participation in the programme concerned. For this reason it is desirable that more than one respondent be interviewed so that a more comprehensive picture can be obtained. An effort should be made to retain the same composition of the informant group over a number of years in order to guard against differential recall bias.
Links to other indicators:This indicator could be collected and be interpreted together with indicator No. 1 in this chapter, concerning existence of policies and strategies for HIV/AIDS prevention among young people.
Chapter 3: Programmatic indicators

35
A guide to indicators for monitoring and evaluating national HIV/AIDS prevention programmes for young people
CHAPTER 4
DETERMINANT INDICATORS (RISK FACTORSAND PROTECTIVE FACTORS)
OverviewThe indicators included in this chapter give information about the determinants that underlie behaviours directly linked to HIV transmission in young people. Adolescent behaviours are influenced by various factors which, in turn, reflect differences in relationships, settings, cultures and economic conditions. These factors are called “determinants” as they determine, or influence, individual behaviours. Determinants can be either positive or negative, and, depending on their effects, are often referred to as risk factors or protective factors.
Definition of risk factors and protective factors (21)
Risk factors are conditions or variables associated with a reduced likelihood of positive outcomes and an increased likelihood of negative or unhealthy outcomes.
Protective factors have the reverse effect: they increase the likelihood of positive outcomes and reduce the likelihood of negative consequences from exposure to risk.
In the context of HIV/AIDS prevention, risk factors increase the probability that adolescents will engage in sexual risk-taking or be exposed to HIV. Protective factors decrease this probability. An example of a risk factor for early sexual initiation is the perception that one’s friends are sexually active. Young people who perceive this are more likely to have had sex themselves than young people who do not have this perception. Examples of protective factors include holding positive attitudes toward contraception and having the ability to refuse unsafe sex.
Some determinants, such as age, sex, beliefs and attitudes, relate to the individual. Others relate to peer, family and community influences, and the broader socioeconomic environment. All of these together can contribute to a safe and supportive environment, which is fundamental to adolescent health and development (22).
Why is collecting data on determinants important for managers?
The routine collection of data about the context of young people’s lives is important for programme managers in relation to:
• advocacy, so that a compelling case can be made for investing in interventions that decrease young people’s vulnerability and increase the likelihood of them adopting behaviours that decrease the transmission of HIV;
• targeting interventions such as information, life skills and health services, in order to ensure that those young people who are most vulnerable are not excluded from the provision of key interventions;

36
• developing and implementing interventions that are not only directed to individual young people, such as information, skills and services, but also to the environments in which they live, learn and work;
• policies, so that these can include a focus on those factors that increase young people’s vulnerability and ensure that their rights are protected, and so that a way can be provided of regularly assessing the implementation of the policies that have been developed.
The key indicators that should be considered by programme managers are outlined in this guide under three headings: sociodemographic characteristics, vulnerable subpopulations and the key determinants of HIV-relevant behaviours.
The sociodemographic characteristics of target populations are age distribution, marital status, religious affiliations, living arrangements, urban/rural residence, etc. Many of these data are widely collected through censuses and established surveys, e.g. the Demographic and Health Surveys (DHS) and the Multiple Indicator Cluster Surveys (MICS). Details on the collection of these indicators are not provided because new data collection is not required. However, the disaggregation of existing data by age, sex and marital status is frequently necessary so that information specific to young men and women is available. Indicators in this category include the following:
1. The proportions of the national population aged 10−14, 15−19 and 20−24, 2. The proportions of the population aged 10−14, 15−19 and 20−24 living in rural and in
urban areas. 3. The proportions of young males and females aged 10−14, 15−19 and 20−24 who are
attending school.4. The proportions of young males and females aged 10−14, 15−19 and 20−24 who are
currently married.5. The median age at first marriage of young men and women. 6. The median age at first birth. 7. The proportions of young people aged 10−14, 15−19 and 20−24 living on income below the
nationally defined poverty line.8. The distribution of population (adults and young people) aged 10−14, 15−19 and 20−24 by
religious denominations.9. The proportions of young males and females aged 10−14, 15−19 and 20−24 working outside
their homes. 10. The proportions of young males and females aged 10−14, 15−19 and 20−24 living with their
father, mother, or both parents.
The indicators in the second group are related to specific vulnerable subpopulations of young people, such as IDUs, young people orphaned by HIV/AIDS, and commercial sex workers. Details of the collection of data for these indicators are not provided in the present guide, as other guides give detailed information on this matter (6, 20). Indicators in this category include the following:
1. The numbers and proportions of IDUs aged 10−14, 15−19 and 20−24.2. The numbers and proportions of commercial sex workers aged 10−14, 15−19 and 20−24.3. The numbers and proportions of young males aged 10−14, 15−19 and 20−24 who have sex
with men.4. The proportions of young people aged 10−14 and 15−17 who are orphaned (the age
limit here is 17 years, because in the majority of countries, 18 is the legal age of reaching adulthood).
The indicators in the third group describe the key determinants (risk factors and protective factors) of behaviours particularly relevant for HIV prevention. Some of these indicators are still in the development stage but they have been included in this guide in order to give programme managers
Chapter 4: Determinant indicators (risk factors and protective factors)

37
A guide to indicators for monitoring and evaluating national HIV/AIDS prevention programmes for young people
an idea of the aspects of young people’s lives that should be monitored. It is anticipated that the experience gained in measuring these indicators will allow important contributions to be made to future versions of the guide. Below is a list of these indicators, followed by further details on each of them.
Indicator Tools for assessmentPriority
Generalized epidemic
PriorityConcentrated/
low-level epidemic
1. Knowledge of HIV prevention among young people
• Nationally representative general population survey
C C
2. Knowledge of a formal source of condoms among young people
• Nationally representative general population survey
A A
3. Sexual decision-making among young people
• Nationally representative general population survey
A A
4. Perceptions of peers’ sexual activity • Nationally representative general population survey
A A
5. Connection to a parent or primary caregiver
• Nationally representative general population survey
A A
6. Regulation of young people’s behaviour by a parent or primary caregiver
• Nationally representative general population survey A A
7. Adult support of education on condom use for prevention of HIV/AIDS among young people
• Nationally representative general population survey C C
A = additional.C = core.

38
1. Knowledge of HIV prevention among young people Priority: Core(This is an UNGASS indicator, and a Millennium Development Goal indicator.)
Definition The percentage of young people who both correctly identify ways of preventing the sexual transmission of HIV and reject major misconceptions about HIV.
Target population Persons aged 10−24 years.
Numerator The number of respondents who give correct answers to all five questions relating to the transmission of HIV and misconceptions about HIV.
Denominator All young people.
Measurement tools A nationally representative general population survey.
What it measures This indicator combines measures of knowledge of HIV transmission and prevention with measures of the prevalence of most common misconceptions about HIV.
How to measure it Responses to the following series of questions, recommended in UNAIDS Guidelines on construction of core indicators (17), are used to construct this indicator.
1. Can the risk of HIV transmission be reduced by having sex with only one faithful uninfected partner?
2. Can the risk of HIV transmission be reduced by using condoms?3. Can a healthy-looking person have HIV infection?4. Can a person get HIV infection from mosquito bites?5. Can a person get HIV infection by sharing a meal with someone who is infected?
Those who have never heard of HIV/AIDS should be excluded from the numerator but included in the denominator.
Items 4 and 5 may be replaced with the two most common local or national misconceptions about HIV transmission or prevention, e.g. “Can an HIV-infected male be cured of HIV if he has sex with a young girl who is a virgin (meaning, a girl who has never had sex before)?”
Items 1 and 2 measure the correct knowledge for preventing HIV transmission. Item 3 measures the common misconception that healthy-looking people cannot have HIV infection. This widespread misconception among young people can result in unprotected sex with an infected partner. Items 4 and 5 refer to two other misconceptions about HIV transmission. The five items, taken together, provide programme managers with a measure of the overall knowledge that young people have of how to avoid HIV.
In addition to prevention items 1 and 2, abstinence can also be an important prevention option for young people. Although research in many settings shows that people who are already sexually active rarely use abstinence as a primary HIV prevention method, young people in particular may be practising secondary abstinence, i.e. a prolonged period of voluntary sexual inactivity following sexual initiation. Programmes focusing on delaying the age of sexual initiation among young people may choose to add a knowledge indicator that includes correct responses to a question about abstinence as a prevention method in the numerator, e.g. “Can the risk of HIV transmission be reduced by abstaining from sexual intercourse?”
Chapter 4: Determinant indicators (risk factors and protective factors)

39
A guide to indicators for monitoring and evaluating national HIV/AIDS prevention programmes for young people
This indicator should be presented as separate percentages for males and females, disaggregated by age in the following groups: 10–14, 15–19, 20–24 and 10–24 (eight categories). It should also be presented for the 15−24 age group, as the Millennium Development Goals and the UNGASS HIV Goals are specified for this age group.
The indicator can also be disaggregated by question to show gaps in knowledge and the prevalence of misconceptions.
Strengths and limitations
A sound knowledge of HIV transmission and prevention is a prerequisite, although insufficient in itself, for the adoption of behaviour that reduces the risk of HIV transmission. A correct knowledge of false modes of transmission is as important as knowing the correct modes, and a correct basic understanding of how to protect oneself is critical for young people. Disaggregated data on this matter can provide meaningful guidance for national programmes of health promotion.
This indicator is easy to measure in a survey. It is especially informative in countries where overall knowledge of HIV/AIDS is low, because it permits easy measurement of incremental improvement over time. In countries where knowledge in this field is high the indicator can show whether high levels are maintained.

40
2. Knowledge of a formal source of condoms among young people Priority: Additional.
Definition The percentage of young people who know of at least one formal source of male or female condoms.
Target population Persons aged 15−24 years
Numerator The number of young people aged 15−24 years who can name at least one formal source of condoms.
Denominator All young people.
Measurement tools A nationally representative general population survey.
What it measures This indicator measures the proportion of young people who can name at least one formal source of condoms. Studies have demonstrated that adolescents who know of at least one source of condoms are much more likely than other adolescents to use them (24, 25).
It should be noted that there may be many acceptable answers to the question on sources, e.g. health centres, pharmacies, stores, outreach clinics, vending machines or any other formal structure or setting where condoms can be purchased or obtained free of charge. A definition of the exact range of acceptable sources should be produced in each national setting.
How to measure it This indicator is assessed by asking respondents to name at least one source where they can obtain condoms. The question should allow for more than one source to be listed. The maximum number can be defined in each national setting but three sources represent an acceptable option. For a questionnaire administered by a surveyor the interviewer should simply record the sources listed, probing the respondent to think of another source until the set number of sources has been achieved or the respondent cannot name an additional source. In a self-administered questionnaire there should be a number of blank spaces where respondents can write their answers. At the analysis stage, certain stated sources may be considered unacceptable or incorrect, e.g. friends or family members may not be considered as formal sources of condoms.
This indicator should be presented as separate percentages for males and females, disaggregated by age in the following groups: 15–19, 20–24 and 10–24 years (six categories).
Strenghts and limitations
In many parts of the world the vast majority of young people can be expected to know of at least one formal source of condoms. In order to obtain a meaningful answer in this circumstance, one option is to increase the minimum number of sources to be listed for a correct answer, i.e. the numerator is the number of respondents who can list, say, at least two formal sources of condoms.
Knowing a source of condoms is the first requisite for obtaining them but is not the same as actually being able to do so. Various barriers can prevent young people from accessing condoms, among the more common being their cost and the stigma associated with obtaining them. It is very important to examine these barriers, as interventions can be targeted at overcoming them, e.g. the provision of subsidies for the purchase of condoms or the organization of media campaigns aimed at reducing stigma.
This indicator can be interpreted together with indicator No. 6 in Chapter 3 (condom availability for young people).
Chapter 4: Determinant indicators (risk factors and protective factors)

41
A guide to indicators for monitoring and evaluating national HIV/AIDS prevention programmes for young people
3. Sexual decision-making among young peoplePriority: Additional
Definition Percentage of young people who believe they have the ability to refuse unwanted sex.
Target population Unmarried persons aged 15−24 years.
Numerator The number of young people who feel that they have the ability to refuse unwanted sex.
Denominator All young people.
Measurement tools A nationally representative general population survey.
What it measures This indicator measures whether young people feel confident that they have some degree of control over their sexual lives and activities. Related to self-efficacy at the individual level, it reveals the extent to which young people feel capable of protecting themselves. If young people feel that sex is something that happens to them over which they have little control, they will probably be unable to avoid unwanted sex, or demand the use of condoms.
How to measure it For the numerator, culturally appropriate questions about young people’s perceived ability to refuse sex should be developed, e.g. “If you did not want to have sexual intercourse, how confident are you that you would be able to refuse it?” Possible responses and scores corresponding to this question would be:
• definitely could not (0); • probably could not (1); • probably could (2); • definitely could (3).
In an interviewer-led survey these options would be read out to the respondent, who would be asked to choose one of them.
In order to calculate the indicator as a percentage the “probably could” or “definitely could” answers can be classified as “Yes” and the others as “No”. Alternatively, the distribution of all the answers can be presented as percentages totalling 100% for each subgroup of interest, e.g. male and female, age groups.
This indicator should be presented separately for males and females, disaggregated by age in following groups: 15−19, 20−24 and 15−24 years (six categories).
Strengths and limitations
This indicator is useful because it measures an essential attribute of the context in which young people live and their perceptions of it. If young people perceive that the context or cultural environment in which they live limits their power to refuse or negotiate sex, efforts in HIV prevention must be tailored accordingly and the evaluation of existing prevention efforts must take this limitation into account.
If more in-depth information is desired concerning the types of sexual relationships and situations of young people, this question can be expanded, e.g. to cover the ability to refuse sex with a long-term partner, with someone who offers money or gifts, or with someone who holds power over the respondent, such as a teacher or employer. Additionally, respondents can be asked if they are confident of being able to negotiate condom use. This question could be expanded to cover the ability to use a condom after drinking or taking drugs, to insist on condom use even if a partner is reluctant, and to refuse sex if a condom is not used. For further insight into how such questions are formulated, reference can be made to the FOCUS guide (7).
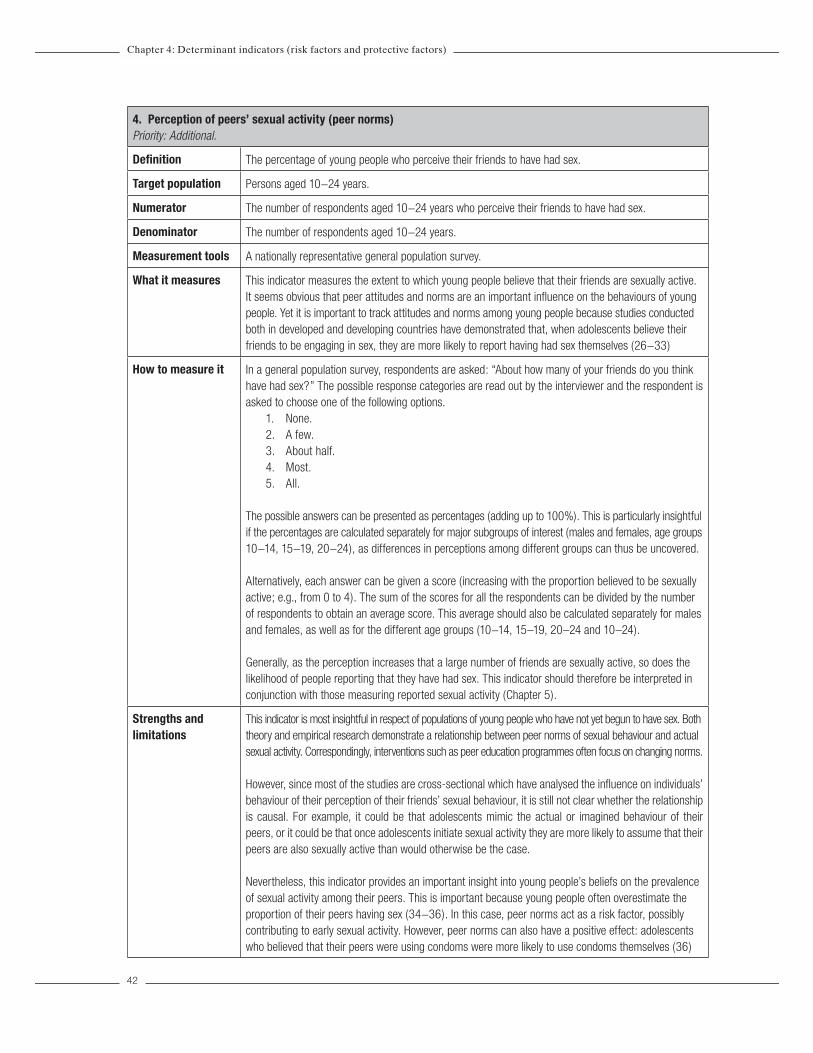
42
4. Perception of peers’ sexual activity (peer norms) Priority: Additional.
Definition The percentage of young people who perceive their friends to have had sex.
Target population Persons aged 10−24 years.
Numerator The number of respondents aged 10−24 years who perceive their friends to have had sex.
Denominator The number of respondents aged 10−24 years.
Measurement tools A nationally representative general population survey.
What it measures This indicator measures the extent to which young people believe that their friends are sexually active. It seems obvious that peer attitudes and norms are an important influence on the behaviours of young people. Yet it is important to track attitudes and norms among young people because studies conducted both in developed and developing countries have demonstrated that, when adolescents believe their friends to be engaging in sex, they are more likely to report having had sex themselves (26−33)
How to measure it In a general population survey, respondents are asked: “About how many of your friends do you think have had sex?” The possible response categories are read out by the interviewer and the respondent is asked to choose one of the following options.
1. None.2. A few.3. About half.4. Most.5. All.
The possible answers can be presented as percentages (adding up to 100%). This is particularly insightful if the percentages are calculated separately for major subgroups of interest (males and females, age groups 10−14, 15−19, 20−24), as differences in perceptions among different groups can thus be uncovered.
Alternatively, each answer can be given a score (increasing with the proportion believed to be sexually active; e.g., from 0 to 4). The sum of the scores for all the respondents can be divided by the number of respondents to obtain an average score. This average should also be calculated separately for males and females, as well as for the different age groups (10−14, 15–19, 20–24 and 10–24).
Generally, as the perception increases that a large number of friends are sexually active, so does the likelihood of people reporting that they have had sex. This indicator should therefore be interpreted in conjunction with those measuring reported sexual activity (Chapter 5).
Strengths and limitations
This indicator is most insightful in respect of populations of young people who have not yet begun to have sex. Both theory and empirical research demonstrate a relationship between peer norms of sexual behaviour and actual sexual activity. Correspondingly, interventions such as peer education programmes often focus on changing norms.
However, since most of the studies are cross-sectional which have analysed the influence on individuals’ behaviour of their perception of their friends’ sexual behaviour, it is still not clear whether the relationship is causal. For example, it could be that adolescents mimic the actual or imagined behaviour of their peers, or it could be that once adolescents initiate sexual activity they are more likely to assume that their peers are also sexually active than would otherwise be the case.
Nevertheless, this indicator provides an important insight into young people’s beliefs on the prevalence of sexual activity among their peers. This is important because young people often overestimate the proportion of their peers having sex (34−36). In this case, peer norms act as a risk factor, possibly contributing to early sexual activity. However, peer norms can also have a positive effect: adolescents who believed that their peers were using condoms were more likely to use condoms themselves (36)
Chapter 4: Determinant indicators (risk factors and protective factors)

43
A guide to indicators for monitoring and evaluating national HIV/AIDS prevention programmes for young people
5. Connection to a parent or primary caregiverPriority: Additional
Definition The percentage of young people who feel connected with their parents and/or primary caregivers.
Target population Persons aged 10−19 years
Numerator The number of young people aged 10−19 in each of the three connection categories (low, medium and high).
Denominator The number of young people aged 10−19 years.
Measurement tools A nationally representative general population survey.
What it measures This indicator measures the percentage of adolescents aged 10−19 who feel connected with their parents or primary caregivers. This is one of the key aspects of the environment in which young people live. “Connection” is measured in terms of the closeness of relationships between adolescents and parents or primary caregivers.
Adolescents who perceive that their caregivers support them in the ways measured in this indicator have statistically higher levels of well-being and lower levels of risk behaviours (e.g. 37, 38). Adolescents who live in a family where there is conflict are more likely to experience depression and use illicit substances (39). HIV is ultimately driven by individual behaviour; however, the context in which young people grow up and make decisions, including sexual decisions, contributes greatly to the types of decisions taken (i.e. whether to engage in risk behaviour). Connection describes one aspect of this context, in this case the family context, and its contribution to adolescent health and development.
A set of items has been compiled from a careful review of theory, empirical work and existing programming in many developed and developing countries (38). It therefore represents a comprehensive assessment of the supportive behaviours of caregivers which help to create a positive connection with adolescents. It is limited, of course, to the perceptions among adolescents of the occurrence of these behaviours, which may or may not be consistent with how the caregivers would assess the same behaviours.
How to measure it This indicator is measured by calculating proportions or a mean score from 15 attitudinal items in a survey that includes young people. The items for measuring connection have been tested and validated in 12 different cultural settings. The 15 statements that comprise the connection indicator are about the young person’s relationship with parents or primary carergivers.
The respondents are asked to choose from a list of adults, e.g. mother, father, grandparent, aunt/uncle and guardian, the one with whom they spend most time. They are asked to choose an answer for each statement from a three-point Likert-type scale, indicating whether the primary caregiver does each stated thing (i) not at all, (ii) sometimes, or (iii) often, with scores of 1, 2 and 3 respectively. The statements are as follows.
1. Supports and encourages me.2. Gives me attention and listens to me.3. Shows me affection.4. Praises me.5. Comforts me.6. Respects my sense of freedom.7. Understands me.8. Trusts me. 9. Gives me advice and guidance.

44
10. Provides for my necessities.11. Gives me money.12. Buys me things.13. Has open communication with me.14. Spends time with me.15. Supports me in my school work (not applicable if the respondent does not attend school).
The results are calculated as the proportions of young people who feel little, somewhat, or very connected to their parents or caregivers. As the scale has only three items the results can be categorized as low, medium and high connection.
In addition, the outcome can be correlated with the health behaviour or health outcome of interest, e.g. sexual initiation or condom use. This yields a measure of the importance of positive connection between young people and parents or caregivers and its effect on behaviour and health outcomes.
This indicator should be presented as separate percentages for males and females, disaggregated by age in the following groups: 10–14, 15–19 and 10-19 (six categories). If suitable data are not available this indicator should not be reported.
NOTE: this indicator is most relevant for the youngest age group (ages 10-14), as parental relationships tend to be more influential in early adolescence. In many countries, age 18 is considered as legal adulthood, in which case the indicator might be more significant for young people aged 17 or younger.
Strengths and limitations
It is often difficult to address contextual factors through programmes. Connection to parents is, however, one such factor that has been addressed programmatically. This has usually been done by focusing on the improvement of communication between parents and adolescents, particularly on sensitive issues such as sexual and reproductive health, through campaigns of information and communication targeted at parents and through school-based efforts to involve parents more actively in communication with their children. While connection is certainly composed of different aspects of the parent-child relationship, open and positive communication is an important aspect of connection and one that can be successfully promoted through interventions. Where the level of connection is low It may be desirable to have programmes for parents or primary caregivers or to provide alternative mentors. In such a programme, evaluators may use this indicator as an intermediate outcome indicator in order to measure improvements in the social environment for young people in the programme’s intended population.
NOTE: this indicator should be interpreted together with the measure for parental regulation of adolescent behaviour (see the following indicator), which focuses on parental knowledge of adolescent actions, an aspect of parental regulation related to structure and boundaries, particularly around young people’s behaviours. Evidence has recently been published that both positive connection combined with regulation by parents and caregivers contribute most effectively to young people’s positive health and development outcomes.
Chapter 4: Determinant indicators (risk factors and protective factors)
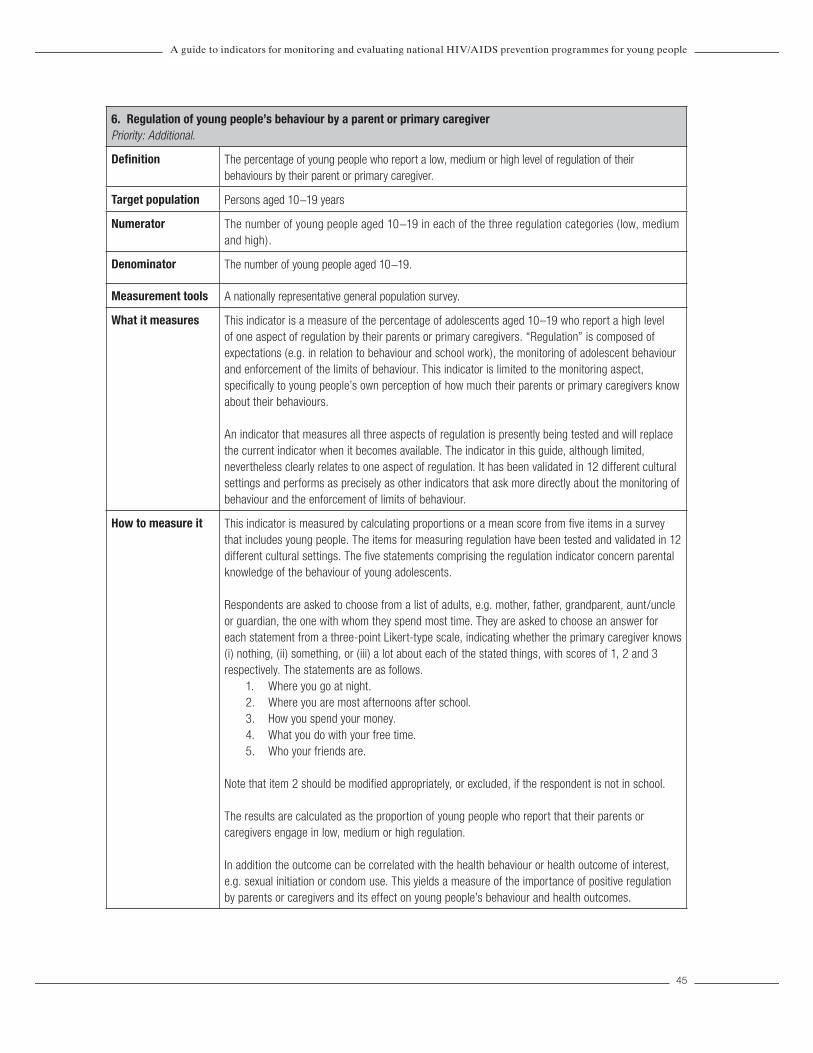
45
A guide to indicators for monitoring and evaluating national HIV/AIDS prevention programmes for young people
6. Regulation of young people’s behaviour by a parent or primary caregiverPriority: Additional.
Definition The percentage of young people who report a low, medium or high level of regulation of their behaviours by their parent or primary caregiver.
Target population Persons aged 10−19 years
Numerator The number of young people aged 10−19 in each of the three regulation categories (low, medium and high).
Denominator The number of young people aged 10−19.
Measurement tools A nationally representative general population survey.
What it measures This indicator is a measure of the percentage of adolescents aged 10–19 who report a high level of one aspect of regulation by their parents or primary caregivers. “Regulation” is composed of expectations (e.g. in relation to behaviour and school work), the monitoring of adolescent behaviour and enforcement of the limits of behaviour. This indicator is limited to the monitoring aspect, specifically to young people’s own perception of how much their parents or primary caregivers know about their behaviours.
An indicator that measures all three aspects of regulation is presently being tested and will replace the current indicator when it becomes available. The indicator in this guide, although limited, nevertheless clearly relates to one aspect of regulation. It has been validated in 12 different cultural settings and performs as precisely as other indicators that ask more directly about the monitoring of behaviour and the enforcement of limits of behaviour.
How to measure it This indicator is measured by calculating proportions or a mean score from five items in a survey that includes young people. The items for measuring regulation have been tested and validated in 12 different cultural settings. The five statements comprising the regulation indicator concern parental knowledge of the behaviour of young adolescents.
Respondents are asked to choose from a list of adults, e.g. mother, father, grandparent, aunt/uncle or guardian, the one with whom they spend most time. They are asked to choose an answer for each statement from a three-point Likert-type scale, indicating whether the primary caregiver knows (i) nothing, (ii) something, or (iii) a lot about each of the stated things, with scores of 1, 2 and 3 respectively. The statements are as follows.
1. Where you go at night.2. Where you are most afternoons after school.3. How you spend your money. 4. What you do with your free time. 5. Who your friends are.
Note that item 2 should be modified appropriately, or excluded, if the respondent is not in school.
The results are calculated as the proportion of young people who report that their parents or caregivers engage in low, medium or high regulation.
In addition the outcome can be correlated with the health behaviour or health outcome of interest, e.g. sexual initiation or condom use. This yields a measure of the importance of positive regulation by parents or caregivers and its effect on young people’s behaviour and health outcomes.

46
This indicator should be presented as separate percentages for males and females, disaggregated by age in the following groups: 10–14, 15–19 and 10–19 (six categories). If suitable data are not available this indicator should not be reported.
NOTE: this indicator is most relevant for the youngest age group (ages 10-14), as parental relationships tend to be more influential in early adolescence. In many countries, age 18 is considered as legal adulthood, in which case the indicator might be more significant for young people aged 17 or younger.
Strengths and limitations
This indicator, while limited to being a measure of parental knowledge of adolescent behaviours, provides a proxy for parental regulation. Adolescents who live in a social environment that provides meaningful relationships, encourages self-expression and provides structure and boundaries are less likely to initiate sex at an early age, to experience depression and to use psychoactive substances than other adolescents. Regulation is a measure of the positive structure and boundaries that are necessary for healthy development, i.e. expectations, monitoring and limit-setting.
As noted in section 5, HIV is ultimately driven by individual sexual behaviour, and the context in which young people grow up and make decisions, including sexual decisions, contributes greatly to the types of decision taken (e.g. whether to engage in risk behaviour). Regulation describes one aspect of this context, in this case the family context, and its contribution to adolescent health and development.
It is often difficult to address contextual factors through programmes. However, regulation by parents is one contextual factor that has been addressed programmatically, most often through campaigns of information and communication targeted at parents and through school-based efforts to involve parents more actively in their children’s decision-making and activities. In settings where the level of regulation is low it may be desirable to have programmes for parents or primary caregivers or to provide alternative mentors, i.e. experienced and trusted advisers. In such a programme, evaluators may use the indicator as an intermediate outcome indicator to measure improvements in the social environment of young people in the programme’s intended population.
NOTE: this indicator should be interpreted together with the measure for connection (see previous indicator). The connection indicator measures the closeness of the relationship between young people and their parents or caregivers. Evidence has recently been published that both positive connection combined with regulation by parents and caregivers contribute most effectively to young people’s positive health and development outcomes.
Chapter 4: Determinant indicators (risk factors and protective factors)

47
A guide to indicators for monitoring and evaluating national HIV/AIDS prevention programmes for young people
7. Adult support of education on condom use for prevention of HIV/AIDS among young people Priority: Core.
Definition The percentage of adults who are in favour of young people being educated about the use of condoms in order to prevent HIV/AIDS.
Target population Adults (persons aged 18 and above).
Numerator The number of adults who agree that young people aged 12−14 years should be taught about using condoms in order to prevent HIV/AIDS.
NOTE: The DHS version of this indicator limited the question to children aged 12−14. For this reason, countries may want to keep this limit. Moreover, in most settings this age group is likely to represent young people before their sexual initiation, which is a crucial time to begin education on sexuality. The specific age group could be adjusted to local situations, however, in accordance with the median age of first sex.
Denominator All adults (persons aged 18 and above).
Measurement tools A nationally representative general population survey.
What it measures Adult perceptions of HIV prevention programmes for young people are crucial to programme success because of the key role that adults play in shaping the attitudes and perceptions of adolescents. If parents and adults in the community disapprove of a programme, their lack of support often influences the attitudes and behaviour of young people.
How to measure it This indicator is based on existing questions addressed in the DHS. It assesses the general level of support among adults for information and skills programmes that focus on adolescents. In a household survey, adults are asked whether young people should be taught about the use of condoms to prevent HIV/AIDS.
Ostensibly, the parents of adolescents are the most important group, and, depending on the survey, disaggregation may be possible so as to provide data specifically for them. However, the opinions of adults as a whole are influential on the programmes and services provided for young people and, consequently, a knowledge of the general attitudes of adults is useful.
If even more detailed information is desired on the support, or lack of it, attributable to the type of influential adult, the same information can be measured from interviews with selected key informants. Such interviews can yield a deeper understanding of the level of adult support for, or resistance to, HIV prevention programmes for young people, and can reveal differences in support for programmes between older and younger adolescents.
Strengths and limitations
For the success of any programme focused on adolescents it is crucial to assess adult support for it. Many interventions that ultimately benefit young people are targeted not at young people but at adults whose values strongly influence adolescents. For example, the support of parents or teachers for HIV prevention programmes in schools may positively influence the acceptance of and interest in the programmes among young people. Furthermore, the support of an important local political, religious or other leader can positively influence the perceptions of adults.
The importance of adult perceptions and support was demonstrated in a recent study in Zambia, which found that trends in the use of reproductive health services by adolescents were strongly associated with adult acceptance of the provision of such services to young people rather than with the attributes of the services themselves (40).
If used in a general population survey this indicator does not distinguish between different types of influential adults such as parents, teachers and health workers. Instead it assesses the general level of support among adults for information and skills programmes that focus on adolescents. If collected over time it can provide important data on trends in opinion or support among adults with respect to programmes for young people, especially if qualitative follow-up occurs.

48
CHAPTER 5
BEHAVIOURAL INDICATORS
OverviewIndividual behaviours affect the spread of HIV infection, both directly and indirectly. Sexual behaviour is directly causal in contributing to HIV infection and worldwide, most HIV infections are acquired through sexual transmission. Another common mode of HIV transmission, primarily in South-East Asia and Eastern Europe, is through the sharing of needles. The majority of HIV prevention programmes therefore aim to reduce the occurrence of unsafe sexual behaviour or unsafe drug injection that can transmit HIV infection in a given population.
The main determinants of the spread of HIV in any population are probably a complex product of the degree and extent of sexual networking. Certain high-risk sexual behaviours require special consideration, i.e. sexual partnerships with sex workers, and young men having anal sex with multiple partners. This chapter presents nine indicators of sexual behaviours.
In the field of public health, considerable experience has been gained in the collection of behavioural indicators. Demographic and Health Surveys and Behavioural Surveillance Surveys have collected sexual behaviour data in a number of countries over a number of years. This chapter builds on the lessons learnt and goes beyond the standard behavioural measures by introducing a composite indicator that provides a more comprehensive picture of risk behaviour among young people (indicator 3).
The composite indicator creates a comprehensive picture of the various characteristics of young people’s sexual risk behaviours which were previously analysed independently. It is most easily represented in stacked bar charts, placing every survey respondent in one of six categories based on key criteria of HIV risk. Because the indicator combines multiple pieces of data it illustrates two key points that are not always clear when the separate components are examined: the change in the size of one risk category relative to another, and the size of each category relative to the total population. This is significant in the interpretation of data. Large changes in behaviour within one part of a population may be unimportant if the group in question represents only a tiny fraction of the total population. Conversely, small changes in risk behaviour within a large group may have a large impact on the potential for HIV infection to spread. Although complex, this indicator provides a better understanding of the behavioural trends that drive the HIV epidemic, with the result that the planning of interventions and the evaluation of their effects can be improved.
In addition, some of the main determinants that increase risk take place among young people who may be under the influence of alcohol or drugs. An overlap of risky situations may exist, e.g. if IDUs have sex with sex workers. Two indicators (number 7 and 10) related to these situations are included in this chapter.
Finally, HIV testing behaviour among young people is an essential protective behaviour factor, and this is measured by one indicator (number 8).
Chapter 5: Behavioural indicators

49
A guide to indicators for monitoring and evaluating national HIV/AIDS prevention programmes for young people
Indicator Tools for measurementPriority
Generalized epidemic
PriorityConcentrated/
low-level epidemic
1. Sex before the age of 15 • Nationally representative general population survey
C C
2. Condom use among young people who had higher-risk sex in the preceding year
• Nationally representative general population survey C C
3. Safe sexual behaviour among young people (composite indicator)
• Nationally representative general population survey
C C
4. Forced sex among young people • Nationally representative general population survey
C C
5. Age-mixing in sexual partnerships among young women
• Nationally representative general population survey
C A
6. Sex with commercial sex workers among young people
• Nationally representative general population survey
C C
7. Sex among young people while intoxicated
• Nationally representative general population survey
A A
8. Condom use during anal sex among young men who have sex with men (MSM)
• Special surveys among MSMA C
9. Safe practices among young injecting drug users (IDUs)
• Special surveys among IDUsA C
10. Condom use among commercial sex workers
• Special surveys among commercial sex workers
C C
11. HIV testing behaviour among young people
• Nationally representative general population survey
C A
A = additional.C = core.
Most of the indicators are for the age group 15−24 years. In many instances, however, a clearer picture of trends becomes possible if the indicators are looked at for the age groups 15−19 and 20−24 separately. This can only be done if the sample sizes are large enough to permit accurate measurement among these age groups.
In order to put the proposed indicators in perspective it is important to know the proportion of young people involved in high-risk activities. For example, it is useful to know the proportions of young men having sex with men, of young people engaged in commercial sex work, of young people with multiple partners, and of young people using injectable drugs. These background indicators allow programme managers to prioritize appropriately the importance of changes in the indicators described in this chapter.

50
1. Sex before the age of 15Priority: Core.
Definition Percentage of young people who have had sex before the age of 15.
Target population Persons aged 15-24 years.
Numerator The number of respondents who report their age at sexual initiation as under 15 years.
Denominator The number of respondents aged 15−24 years.
Measurement tools A nationally representative general population survey.
What it measures This indicator provides information on the prevalence of early sexual initiation among young people.
Sex at young ages is thought to be more risky than sex later in life. The female genital tract is more susceptible to infection with HIV before it has fully matured. Typically, young people have partnerships that are more often of short duration and perhaps less formal than those of older people. Moreover, they are less likely to live with their sexual partners, and this can often result in one of the partners having additional concurrent partners, increasing the risk of infection. People who begin having sex at young ages may spend a longer time in such less stable sexual relationships than people who delay their first sexual intercourse. Moreover, they may be more likely than older people to be bullied or exploited in sexual relationships.
How to measure it This indicator is derived from answers to a question about the age of the respondents when they first had penetrative sex, either vaginal or anal. Typically, this question follows one on whether the respondents have ever had sex.
The indicator should be presented as separate percentages for males and females, and should be disaggregated by the age groups 15–19 and 20–24 years. It is difficult to monitor change in this indicator over a short period because only individuals entering the group, i.e. those aged under 15 at the beginning of the period for which the trends are to be assessed, can influence the numerator. If the indicator is assessed every two to three years it may be better to focus on changes in the levels for the 15−17 age group. If it is assessed every five years the possibility exists of looking at the 15−19 age group.
Strengths and limitations
The advantage of using the reported age at sexual initiation is that it makes the most use of data that are already collected. Previously, sexual initiation has been measured by calculating the median age at first sex. Three different methods of calculating this value were proposed, each of which had unique limitations and produced different results. The above calculation is simple and allows easy comparison between times.
The denominator is easily defined because all members of the survey sample contribute to this measure. For most people, first sex is a significant event that they probably remember with little difficulty. People may, however, be unsure of their exact age.
The responses of young people of both sexes may be influenced by views on young people’s sexuality in the society in which they live. An analysis of the reporting of age at first sex, however, has shown that the occurrence, extent and direction of reporting or recall bias are not predictable.
Chapter 5: Behavioural indicators

51
A guide to indicators for monitoring and evaluating national HIV/AIDS prevention programmes for young people
2. Condom use among young people who had higher-risk sex in the preceding yearPriority: Core.(This is an UNGASS indicator, and a Millennium Development Goal indicator)
Definition The percentage of young people who had higher-risk sex in the preceding year and who used a condom on the last occasion of higher-risk sex.
Target population Persons aged 15−24 years.
Numerator The number of respondents aged 15−24 years who had sex with a non-cohabiting, non-marital partner in the preceding 12 months and used a condom the last time they had sex with such a partner.
Denominator The number of respondents aged 15−24 years who had sex with a non-cohabiting partner in the preceding 12 months.
Measurement tools A nationally representative general population survey.
What it measures This indicator shows the extent to which condoms are used by young people who engage in non-regular sexual relationships.
When trends in this indicator are being interpreted it should be noted that changes may reflect variations in the numbers of persons having higher-risk sex and not necessarily variations in condom use during higher-risk sex. The indicator should therefore be analysed carefully. This means considering changes in the proportion of young people having higher-risk sex, i.e. with a non-cohabiting partner, in order to understand the programmatic implications.
How to measure it The respondents are first asked if they have ever had sex. Among those who have, questions are asked about their last three partners. Information on the type of partner (e.g. spouse, live-in partner, boyfriend/girlfriend, acquaintance or commercial sex worker) is used to determine whether they had higher-risk sex in the preceding 12 months (sex with anyone other than a spouse or live-in partner) and thus are counted in the denominator. Respondents are also asked about condom use with their last three partners in the preceding 12 months. If they had higher-risk sex, and used a condom with the last higher-risk partner they are included in the numerator.
This indicator should be presented as separate percentages for males and females in the age groups 15–19, 20–24 and 15–24 years. When progress towards the UNGASS goals is being reported the results for urban and rural residents should be given separately for the 15–24 age group.
Strengths and limitations
This indicator is measured among people who have had sex in the preceding 12 months with a partner not living with or not married to them. This group provides the most relevant denominator for the indicator because condom use is of paramount importance in the group.
In the population as a whole there are measures that reduce the risk of HIV infection in uninfected people. If people can delay first sex, abstain from sex and reduce the number of partners they have, the spread of HIV infection can be reduced. However, in the group already identified as having higher-risk sex, condom use is the most pertinent prevention measure.
Use at last higher-risk sex is a good measure because it is a definite occasion and recent sex should be recalled most accurately. Thus the data should be subject to less reporting and recall bias than other types of data on condom use. However, condom use at last sex provides no measure of the consistency of condom use. To some extent, more consistent condom use in the population as a whole is reflected as an increase in use at last sex. Even so, this can be affected by the type of partner and the rate at which new partners are acquired, especially if condoms are used more often with new partners than in more established relationships. If new partners are acquired at a high rate, and condoms are used on the first, but not subsequent, occasions with each new partner, the cross-sectional prevalence of reported condom use at last sex could rise while the consistency of use remains the same. Increases in the prevalence of condom use at last sex, therefore, while a positive sign, do not mean that the people reporting condom use have not placed themselves at risk of acquiring HIV infection at any time in the preceding 12 months.

52
Composite indicator: an explanatory note
The following indicator is a composite. It represents a departure from the usual focus on discrete behaviours. Sexual behaviours are interdependent and so it is difficult to interpret any single aspect in isolation. The advantages of this new approach are as follows.
• Instead of focusing on one specific aspect it summarizes a range of interrelated behaviours.• Information presented in this way reveals the fractions of the total population which are in the different categories
of risk.
3. Safe sexual behaviour among young peoplePriority: Core.
Definition A composite of safe sexual behaviour among young people.
Target population Persons aged 15−24 years.
Numerator Part 1 Number of respondents who have never had sex
Part 2 Number of respondents who have had sex but not in the preceding 12 months
Part 3 Number of respondents who had sex with only one partner in the preceding 12 months and who used a condom the last time
Part 4 Number of respondents who had sex with only one partner in the preceding 12 months and who did not use a condom the last time
Part 5 Number of respondents who had sex with more than one partner in the preceding 12 months and who used a condom the last time
Part 6 Number of respondents who had sex with more than one partner in the preceding 12 months and who did not use a condom the last time
Denominator Number of respondents aged 15−24
NOTE: This denominator is to be used for each part of the numerator
Measurement tools A nationally representative general population survey.
What it measures This indicator describes the proportions of people having no partner, one partner and multiple partners over 12 months, and the prevalence of condom use at the last sex among those people who have had only one partner or more than one.
These aspects of behaviour are considered together here because each component affects the other and each is of progressively riskier behaviour. Programme managers are thus encouraged to consider all aspects of sexual behaviour in order to understand what portion of the population is vulnerable to HIV. Moreover, changes in this composite indicator over time can be expected to be much more informative than changes in a single indicator.
In the example illustrated below there were changes over time that resulted in a smaller fraction of the population being in the highest category of risk. There was an initial increase in sex with only one partner between 1996 and 2000. This was followed by an increase in the number of respondents reporting abstinence or no sex in the preceding year between 2000 and 2003.
Chapter 5: Behavioural indicators

53
A guide to indicators for monitoring and evaluating national HIV/AIDS prevention programmes for young people
How to measure it The respondents are first asked if they have ever had sex. Among those who have, questions are asked about their last three partners. Information on the type of partner (e.g. spouse, live-in partner, boyfriend/girlfriend, acquaintance or commercial sex worker) and whether a condom was used at last sex is requested for each of the last three partners in the preceding 12 months. (The information on partner type is used for calculating the previous indicator.)
This indicator should be presented as a stacked bar graph, separately for men and women, in the age groups 15–19, 20–24 and 15–24 years.
0
20
40
60
80
100
1996 2001 2003Year
%
Sex with more than one partner, no condom last timeSex with more than one partner, condom last time
Sex with only one partner, no condom last time
Sex with only one partner, condom last time
No sex in last yearNever had sex
Strengths and limitations
Delaying sexual initiation, reducing the number of partners, and protecting against HIV through the use of condoms are ways of preventing HIV infection which form the central message of many AIDS control programmes. This indicator describes the extent to which this message is understood and put into practice. ( In some settings, these behaviours are also referred to as “ABC” or “abstinence, being faithful, and using condoms.”)
The indicator highlights the size of the group of people who have sex with more than one partner and who do not consistently use condoms. It also illustrates the prevalence of one-sided monogamy and of condom use in sexual relationships. This is important because the classification for this indicator is based only on the behaviour of the survey respondents. A respondent’s partner may not be similar to the respondent in this respect, i.e. the only partner of a survey respondent may have other partners as well. Condom use among people who report only one partner is therefore important because the partner may present a risk.
Having more than one partner in a year may be common and may not indicate multiple or concurrent partnerships but merely that the end of one partnership and the start of the next occurred within 12 months of each other. This indicator assigns people to the same category who regularly have several concurrent sexual partners and people who have ended one relationship and begun another in the same year.
The limitation on measuring condom use which was discussed in respect of the previous indicator also applies to the present one.

54
4. Forced sex among young peoplePriority: Core.
Definition The proportion of young people who were forced to have sex during the preceding 12 months.
Target population Persons aged 15−24 years.
Numerator The number of respondents aged 15−24 years who report having been forced to have sex in the preceding 12 months.
Denominator The number of respondents aged 15−24 years.
Measurement tools A nationally representative general population survey.
What it measures Sex should take place only between entirely willing partners. Forcing a person to have sex may have a number of negative consequences, ranging from physical and psychological traumas to unwanted pregnancy and HIV infection. This indicator attempts to measure the proportion of respondents who have experienced forced sex. These data are important in enabling programme managers to know who is being forced to have sex, so that programmes and interventions can be appropriately targeted and monitored.
How to measure it The reality of sexual violence is difficult to capture in a household survey. However, if interviewers are well trained, questions are well thought out and interviews are conducted in a private setting, information on sexual violence can provide valuable information for understanding the spread of HIV in a country. A useful review of the issues around the measurement of sexual violence is available from the World Health Organization (41).
The indicator can be collected by asking all respondents “In the last 12 months has any sexual partner forced you to have sexual relations against your will?” The question should be put to all persons aged 15-24 in order to ensure that respondents have not erroneously reported never having sex because they were not including forced sex in their replies.
This indicator should be presented as separate percentages for males and females in the age groups 15–19, 20–24 and 15–24 years.
Strengths and limitations
This indicator may be especially subject to reporting bias, and the extent to which people are willing to admit having been forced to have sex is likely to vary greatly both within and between countries.
What is considered to be “forced sex” is likely to vary between settings. Because there has only been limited experience of asking such questions in household surveys, pilot-testing in countries is critical. For example, a survey in South Africa revealed that a high proportion of boys reported that they had been forced to have sex. An examination of the findings, however, suggested that respondents may have interpreted peer pressure from male friends to have sex as forced sex (A. Pettifor, personal communication).
It may be desirable to add a question on the proportion of respondents who have ever been forced to have sex and to tabulate the results. This could provide additional information on forced sex that occurred to respondents as younger children.
Additional information on defining and conducting research on forced sex in developing countries can be found at: http://www.popcouncil.org/pdfs/wp/seasia/seawp16.pdf
Chapter 5: Behavioural indicators

55
A guide to indicators for monitoring and evaluating national HIV/AIDS prevention programmes for young people
5. Age-mixing in sexual partnerships among young womenPriority: Core in generalized epidemics.
Definition The proportion of young women who have had sex in the preceding 12 months with a partner who is 10 or more years older than themselves.
Target population Sexually active females aged 15−24 years.
Numerator The number of female respondents aged 15−24 years who have had sex in the preceding 12 months with a partner who was 10 years or more older than themselves.
Denominator Female respondents aged 15−24 years who have had sex in the preceding 12 months.
Measurement tools A nationally representative general population survey.
What it measures This indicator measures the proportion of young women having sex with older men.Sex between young women and older men is often risky because young women lack the power in the relationship to negotiate safe sex. It is also an efficient means of spreading HIV infection, since, for physiological reasons, younger women are more likely to become infected. Each sexual act with an infected man carries a higher risk of infection for a young girl, and older men are more likely than younger men to be infected. AIDS prevention programmes sometimes try to address this issue through IEC campaigns aimed at making sex with younger women socially unacceptable among older men and through initiatives to increase girls’ negotiating power.
How to measure it In a general population survey respondents are first asked whether they have had sex in the preceding 12 months. Those who answer in the affirmative are asked whether any of their last three partners during this period were at least 10 years older than themselves. The numerator includes all respondents who answer that this was the case.
This indicator should be reported as separate percentages for the age groups 15–19, 20–24 and 15–24 years. If possible it should be further disaggregated by current marital status.
Strengths and limitations
This measure has two major limitations, the first being that people often do not know the exact age of their sex partners. This is more likely to be true of casual partners than of spouses. The second is that the age difference constituting an elevated risk of exposure to HIV is not precisely known.When uncertain about a partner’s age, respondents frequently give numbers clustering around numbers such as 20 or 30. This may well distort the indicator. It should be noted, however, that the biases introduced through age clustering or age misreporting are unlikely to change greatly over time, so this may be of little consequence when trends are being examined.
This measure cannot give an exact picture of patterns of age-mixing and cannot capture small shifts in the age gap between partners. Nevertheless, it should capture the substantial changes in age-mixing promoted by programmes on HIV prevention and life skills, since women are unlikely to mistake a peer for a man much older than themselves. If women increasingly choose to have sex with their peers rather than with older men, or if older men become less likely to seek out substantially younger partners, these changes will be reflected in the indicator, regardless of errors in age-reporting.

56
6. Sex with commercial sex workers among young peoplePriority: Core.
Definition The proportion of young people who have had sex with a commercial sex worker (CSW) in the preceding 12 months.
Target population Persons aged 15−24 years
Numerator The number of respondents aged 15–24 years who have had sex with a CSW in the preceding 12 months.
Denominator Respondents aged 15−24 years.
Measurement tools A nationally representative general population survey.
What it measures In places where CSWs are important sources of new HIV infections it is a priority to reduce the number of young people having sex with them. This indicator measures the prevalence of commercial sex in the preceding year which, although not a good estimate of the lifetime prevalence of this behaviour, is more able to detect changes in such behaviour over time.
Attempts to collect and analyse data on the basis of a wider definition of commercial sex, with the use of questions such as “Have you given or received money or gifts in exchange for sex?”, have not yielded useful information. In the context of the HIV/AIDS epidemic, sex workers are of interest because they have a high turnover of partners and are therefore at high risk of being exposed to infection, becoming infected and passing on the infection to others. In many cultures, this is true of only a fraction of those who have “received money or gifts in exchange for sex”. If there is no locally specific term for prostitution, this indicator is unlikely to be relevant to the programme and should not be used.
The inclusion in the denominator of all young people makes it simple to describe and monitor the size of a group of young people who may be especially vulnerable to HIV infection. If the denominator were the number of sexually active young people, a shift in the number sexually active could affect the proportion visiting commercial sex workers. This would complicate the analysis of the indicator.
How to measure it Respondents are first asked if they have ever had sex. Those who reply in the affirmative are asked about their last three partners in the preceding 12 months. Information on the type of partner (e.g. spouse, live-in partner, boyfriend/girlfriend, acquaintance or commercial sex worker) is requested in respect of each of the last three partners.
The indicator should be given as the percentages of all males who report this behaviour in the age groups 15–19, 20–24 and 15–24 years. If appropriate it should also be presented for women.
Strengths and limitations
This indicator assumes that condom use is not consistent among sex workers. The inequality of power between sex workers and their clients suggests that this is often true. The indicator also assumes that any sex with sex workers is unsafe. However, in countries where condom promotion has been successful among sex workers, an alternative indicator on the use of a condom on the occasion of the last commercial sexual encounter might be more appropriate.
In concentrated and low-level epidemics, sex work can play a major part in spreading HIV infection. However, it is very difficult to define commercial sex in a way that translates from one place to another. This is the principal limitation of the indicator. Once commercial sex has been described for a country, however, this is unlikely to change much with the passage of time. Once a question has been satisfactorily phrased the indicator can be used to track trends in the prevalence of this behaviour over time.
This indicator is of limited use in very high-level epidemics, since the differences in risk associated with sex with a sex worker compared with any other casual partner may not be very substantial.
Chapter 5: Behavioural indicators

57
A guide to indicators for monitoring and evaluating national HIV/AIDS prevention programmes for young people
7. Sex among young people while they are intoxicatedPriority: Additional.
Definition The proportion of young people who have had sex while intoxicated during the preceding 12 months.
Target population Persons aged 15−24 years.
Numerator The number of respondents aged 15−24 years who have had sex while intoxicated during the preceding 12 months.
NOTE: Intoxicating substances should be defined and reported at the country level, e.g. alcohol, cannabis, injectable drugs. The substances most relevant in each country can therefore be used in this indicator.
Denominator The number of respondents aged 15−24 years.
Measurement tools A nationally representative general population survey.
What it measures Sexual intercourse, while one or both partners are intoxicated, is more likely than otherwise to be unplanned, and couples are therefore less likely to use condoms. This indicator describes the prevalence of sexual intercourse in such circumstances. In order to avoid double counting when both partners are included in a survey, the indicator is limited to asking whether the respondent was intoxicated (not whether his or her partner was intoxicated).
By including all young people in the denominator instead of sexually active young people, any complication due to a shift in the number sexually active is avoided.
How to measure it In a general population survey the respondents are first asked whether they had sex during the preceding 12 months. Those who answer affirmatively are asked whether they were intoxicated, as defined in the country concerned, during the last three occasions when they had sex during this period.
This indicator should be presented as a percentage and disaggregated by sex and into the age groups 15–19, 20–24 and 15–24 years.
Strengths and limitations
The point at which people describe themselves as intoxicated is subjective. Moreover, the effects of intoxication depend on the substance used. This indicator is therefore difficult to interpret as between cultures in which different substances are used.
The context of substance use must be carefully considered. The indicator could include sex after social drinking, sex after taking a sedative or drug rape.
This indicator is best used for comparison within a defined population over time. Information on the proportion of all young people who have used a substance of interest in the year before the survey may be of value in aiding the interpretation of the indicator.

58
8. Condom use during anal sex among young men who have sex with men Priority: Core in concentrated epidemics, additional in others.
Definition The proportion of young men who report using a condom on the last occasion when they had anal sex with a male partner in the preceding six months.
Target population Men aged 15−24 years who have sex with men (MSM).
Numerator The number of young MSM who report using a condom on the last occasion when they had anal sex with a male partner in the preceding six months
Denominator All young MSM who have had anal sex with a man in the preceding six months.
Measurement tools Special surveys among MSM.
The proportion of the general population reporting MSM behaviour can be expected to be very small except where this behaviour is widely prevalent. As a rule, therefore, a very large sample would be needed in a general population survey to provide a reliable estimate of the behaviour.
What it measures Both unprotected anal sex and multiple partners put MSM at higher risk of being infected with HIV. The monitoring of both the proportion of MSM who have protected anal sex and the proportion who avoid multiple partners is important, however, in the age range 15−24. Because young men are less likely to remain with one partner, protected anal sex is the more critical indicator to monitor.
How to measure it In a behavioural survey of a sample of MSM the respondents are questioned about their sexual partnerships with other men in the preceding six months. The respondents are asked about the last time they had anal or oral sex and whether they or their partners used a condom.
This indicator should be reported as a percentage and broken down for the age groups 15–19, 20–24 and 15–24 years.
Strengths and limitations
The time reference is six months because most surveys of MSM use a sampling strategy that interviews respondents in areas where men congregate in order to meet male partners. These men are thus at the high end of the spectrum of risk behaviours and are also likely to have a high turnover of partners. The smaller time frame reduces any recall bias in respect of the number of partners.
A limitation of surveys among high-risk groups is that it is not usually possible to find a representative probability sample. This means that it is difficult to estimate the extent to which an indicator based on the data describes all members of such a group. Furthermore, it is difficult to duplicate this type of survey in order to examine trends.
This indicator gives no idea of risk behaviour in sex with women on the part of men who have sex with both men and women. In countries where men in the subpopulation surveyed are likely to have partners of both sexes it is necessary to consider the prevalence of sex between men and women as well as the frequency of condom use with partners of each sex.
Reporting may be biased as a result of the stigma associated with homosexual behaviour in many communities, resulting in the underreporting of frequency or in non-admission.
Chapter 5: Behavioural indicators

59
A guide to indicators for monitoring and evaluating national HIV/AIDS prevention programmes for young people
9. Safe practices among young injecting drug users Priority: Core in concentrated epidemics, additional in others.(This is an UNGASS indicator.)
Definition The percentages of young IDUs who report never having shared injecting equipment during the preceding month and who also report that a condom was used the last time they had sex.
Target population Sexually active IDUs aged 15−24 years.
Numerator The number of respondents who report not having shared injecting equipment during the preceding month and who also report that a condom was used the last time they had sex during this month.
Denominator The number of respondents who report injecting drugs and having sexual intercourse during the preceding month.
Measurement tools Special surveys among IDUs.
What it measures Injecting drug use does not, in itself, expose a drug user to HIV infection. The additional risk for drug users arises from the practice of sharing needles. Intravenous injections with needles that someone else has used can be an efficient mode of transmission of HIV infection.
The extent to which IDUs share needles varies. The prevalence of IDUs alone, therefore, does not accurately describe the size of the group at risk of HIV. This indicator shows what proportion of IDUs has adopted behaviour intended to avoid HIV transmission. The separate components can be used to track trends in unsafe needle use and unsafe sex among IDUs. The results for the various categories stipulated below should be carefully considered because changes in the indicator could reflect real behavioural change, changes in reporting or changes in the overall composition of the group.
This indicator should be reported as separate percentages for men and women and for the age groups 15–19, 20–24 and 15–24 years. The results should be compared with those for other high-risk age groups.
How to measure it In a behavioural survey among IDUs the respondents are asked whether they shared a needle at any time in the preceding month. They are then asked whether they had sex in the preceding month, and, if so, whether a condom was used. It is essential to make sure that locally appropriate terminology is used in order to collect the correct information.
Strengths and limitations
The time limit of one month is used because it minimizes recall bias, which may be a particular problem for IDUs. This time limit also means that the indicator gives some perspective on the consistency of the behaviours.
A limitation of surveys among high-risk groups is that it is not usually possible to find a representative probability sample. This means that it is difficult to estimate the extent to which an indicator based on the data describes all members of such a group. Furthermore, it is difficult to duplicate this type of survey in order to examine trends.

60
10. Condom use among commercial sex workersPriority: Core.
Definition The percentage of young commercial sex workers who used a condom the last time they had sex with a client.
Target population Commercial sex workers aged 15−24 years.
Numerator The number of commercial sex workers aged 15−24 years who used a condom the last time they had sex with a client.
Denominator Commercial sex workers aged 15−24 years who were interviewed.
Measurement tools Special surveys among commercial sex workers.
What it measures This indicator is one measure of the success of campaigns promoting condom use in commercial sex.
One of the goals of programmes that work with sex workers is to increase the number of these workers who always use a condom and thus are protected from HIV infection. The indicator refers to men and women actually working as providers of sex (though in many countries this indicator may be relevant only for young women). The data can be compared to data on commercial sex as reported by clients.
How to measure it In a special survey of commercial sex workers the respondents are asked whether they used a condom with their most recent client.
This indicator should be disaggregated by sex and by the age groups 15–19, 20–24 and 15–24 years.
Strengths and limitations
In areas where the patronage of commercial sex is highly stigmatized, clients may hesitate to report visits to commercial sex workers. Moreover, clients may desire to affirm that they used a condom at last sex even though they did not, especially in areas where programmes have stressed condom use in commercial and other sex. The indicator seeks responses from sex workers who may not have the same motivation to give socially desirable answers and who offer a different perspective.
A limitation of surveys among high-risk groups is that it is not usually possible to find a representative probability sample. This means that it is difficult to estimate the extent to which an indicator based on the data describes all members of such a group. Furthermore, it is difficult to duplicate a survey of this kind at a later date with in order to examine trends.
Chapter 5: Behavioural indicators

61
A guide to indicators for monitoring and evaluating national HIV/AIDS prevention programmes for young people
12. HIV testing behaviour among young peoplePriority: Core in generalized epidemics, additional in others.
Definition The proportion of sexually active young people who had an HIV test in the preceding 12 months and know the results.
Target population Persons aged 15−24 years.
Numerator The number of respondents aged 15−24 years who had an HIV test in the preceding 12 months and who know the results.
Denominator Respondents aged 15−24 years who have had sex in the preceding 12 months.
Measurement tools A nationally representative general population survey.
What it measures This indicator aims to give an idea of the reach of HIV testing services in the general population and of the percentage of sexually active young people who are aware of their HIV status. This topic has special significance for young people because they may feel that there are barriers to accessing and using many services and facilities, particularly for sensitive concerns relating to sexual health.
The indicator can provide a measure of the effectiveness of interventions that promote HIV counselling and testing. If the interventions are targeted at a particular subgroup it may be appropriate to restrict the indicator to this subgroup.
How to measure it In a general population survey, respondents are first asked if they have ever been tested for HIV. Those replying affirmatively are asked whether they were tested in the preceding 12 months and, if so, whether they know the results of the test.
This indicator should be presented separately for men and women and for the age groups 15–19, 20–24 and 15–24 years.
The indicator may be affected by reporting bias because respondents may not want to admit to knowing their status for fear of being pressed to disclose it. The privacy of the interview may affect this matter, i.e. respondents are more likely to be reticent if data are collected in the presence of other people than if they are collected in strict privacy.
Strengths and limitations
This indicator has several components: young people who have a test and return for the results must consider themselves or their partners to be at risk of having contracted HIV, must know where to get a test and feel able to have it and, after the test, must want to know the results and be able to return to the testing centre to get them.
Factors that could influence a young person’s access to testing facilities are their location, the availability of transport, the cost, the person’s perception of the confidentiality of the process, and, especially, of the result, and the perceived attitude of the staff towards young people. Changes in this indicator could be associated with some or all of these factors.
Used alone, this indicator cannot show whether the number of people having an HIV test is limited by the availability of testing resources or whether the testing facilities are underutilized (and the reason for which they are underutilized). This is important to direct programmatic response: in some cases, it may be necessary to conduct campaigns aimed at raising awareness about the availability of HIV testing. However, if testing is limited because of the unavailability of tests, or poor quality of testing programmes, such campaigns would be inappropriate. The services that accompany testing are important if interventions are to be successful and behaviour change is to be achieved. Further research on testing behaviour should include a consideration of the services being offered in relation to the present indicator.

62
In areas where HIV is highly stigmatized, respondents may be unwilling to admit to having taken an HIV test, which may be regarded as an admission that they fear themselves to be infected. This is particularly so when the question is asked as an item in a questionnaire on risk behaviour. On the other hand, in countries where taking a test has been heavily promoted as a responsible thing to do, some people may say they have been tested when in fact they have not. Despite these possible biases the indicator gives an approximate idea of the proportion of young people who are likely to know their HIV status.
In low-level and concentrated epidemics the indicator may yield extremely low percentages if measured in the general population. If this is the case it can be used effectively in surveys of behaviour in subpopulations at higher risk of infection. However, IDUs who are not yet sexually active are not reflected in this indicator.
The indicator is restricted to tests performed in the preceding 12 months so that programme managers can see changes over time. It might be useful to tabulate also the proportion ever tested, possibly a more useful indicator in populations where there is a low prevalence of HIV infection.
Chapter 5: Behavioural indicators

63
A guide to indicators for monitoring and evaluating national HIV/AIDS prevention programmes for young people
CHAPTER 6
IMPACT INDICATORS
OverviewThe best measure of the long-term impact of all HIV prevention activities is the HIV incidence rate, namely the number of new cases of HIV infection per year divided by the number of HIV-negative individuals in the population at the start of the year. Data on HIV incidence are scarce, however, and usually relate to small groups rather than nationally representative samples. It is easier to measure the prevalence of HIV infection, i.e. the proportion of the total population that is infected with HIV.
The goal of HIV prevention programmes is to reduce the transmission of HIV. Since people aged under 25 have had a relatively short time in which to become infected, most infections in this age group have been recently acquired. Prevalence in this group can therefore be a good measure of the rate at which the epidemic is progressing and can show where prevention programmes are making a difference. The number of new HIV infections occurring among young people may reflect behaviour change among all age groups because young people can be infected by older partners. It is important to be able to construct a good measure of both the proportion of young people infected with HIV and the trends in the prevalence of HIV infection over time. Changes in HIV prevalence among a particular group can occur for many reasons. It is almost as important to be able to explain changes in prevalence as to be able to detect the changes as they occur.
This section defines indicators that describe levels of HIV infection among young people.
Indicator Tools for measurementPriority
Generalized epidemic
PriorityConcentrated/
low-level epidemic
1. HIV prevalence among young pregnant women
• Sentinel surveillanceC A
2. HIV prevalence among young people in community-based surveys
• Nationally representative general population survey
C* A
3. HIV prevalence in subpopulations of young people with high-risk behaviour
• UNAIDS/WHO second generation surveillance guidelines (5)
• FHI guidelines on sampling in subpopulations (6)
A(C**)
C
4. Young people with a sexually transmitted infection
• Nationally representative general population survey
A A
A = additional.C = core.C* = core in countries with relatively high prevalence levels (i.e. above 3%).C** = core for commercial sex workers; additional for other high-risk groups.

64
1. HIV prevalence among young pregnant womenPriority: Core in generalized epidemics, additional in others.(This is an UNGASS indicator, and a Millennium Development Goal indicator.)
Definition The proportion of young pregnant women testing positive for HIV during sentinel surveillance at selected antenatal clinics.
Target population Pregnant women aged 15−24 years.
Numerator The number of young pregnant women who, while attending antenatal clinics (ANCs), test positive for HIV infection in sentinel surveillance.
Denominator All young pregnant women who are tested for HIV infection while attending ANCs in sentinel surveillance.
Measurement tools UNAIDS/WHO Guidelines for conducting HIV sentinel serosurveys (42).
What it measures In most countries, young women who attend ANCs are a reasonably representative sample of young women in the general population. Young women who are pregnant have had unprotected sex at some time in the preceding 10 months, and potentially, therefore, have been sexually exposed to HIV infection. On average they are not a group characterized by other high-risk behaviour. Participation bias is relatively low in this sample because HIV testing is carried out, either anonymously with blood that is routinely taken from all pregnant women for other routine tests, or as a routine offer as part of the PMTCT programme. Most HIV infections among young women have been recently acquired. Trends in HIV prevalence in this group may therefore reflect trends in the incidence of new HIV infections.
How to measure it HIV prevalence is estimated from testing of blood samples that are routinely taken from pregnant women of all ages at sentinel ANCs. The quality of the data depends on the structure of the surveillance system. An ideal sentinel surveillance system would include clinics chosen to reflect a country’s urban, rural, ethnic and other socio-geographical divisions. However, in most countries ANC clinics that participate in sentinel surveillance are not nationally representative, with ANC’s in urban areas overrepresented. The methods used for surveillance should be the same at all sites.
The indicator should be reported as separate percentages for the groups 15–19, 20–24 and 15–24 years. It should also be reported by parity for primigravidas and multigravidas for 15-24 year olds. If the sample is large enough the results can be disaggregated by both age and parity. Parity is important because prevalence among women having their first pregnancy provides a better estimate of incidence.
The median prevalence of contributing clinics should be reported, together with the number of clinics contributing data, the number of women tested and the number testing positive for HIV infection. The data should be presented for the capital city, other urban areas and rural areas.
Strengths and limitations
In countries where the epidemic is driven heterosexually this indicator gives a fairly good idea of relatively recent trends in HIV infection nationwide. It is less reliable as an indicator of overall epidemic trends in areas where the bulk of HIV infection remains confined to subpopulations with especially high-risk behaviour. In this circumstance it is a useful way of monitoring whether HIV infection is spreading beyond these subpopulations.
In order to interpret changes in the prevalence of HIV infection at ANCs it is important to isolate real changes in the proportion of young women who are infected with HIV from artefacts of the surveillance system. The HIV prevalence observed among young women attending ANCs may change for a number of reasons not directly connected with the true prevalence of HIV infection among young women in the general population. Changes that affect the number of young women who become pregnant, the proportion of those who seek antenatal care, and the stage of pregnancy at which women first visit an ANC could all affect the HIV prevalence observed in ANCs. Some of these changes, such as
Chapter 6: Impact indicators

65
A guide to indicators for monitoring and evaluating national HIV/AIDS prevention programmes for young people
an increase in the age at first sex, may also affect the incidence of new HIV infections among young women. For these reasons, trends in the prevalence of HIV infection among young pregnant women should be interpreted carefully.
When trends are being monitored the sample composition is very important. The representativeness of the clinic sample is only as good as the data on which the sampling frame was based. Accurate information about the size and location of clinics allows this to be treated with more confidence.
Interpretation is easier if the same sample of clinics is used in several rounds of surveillance. When changes are considered in the clinics that constitute the ANC surveillance system, clinics for which past data exist should be retained in the sample, so as to enable trend analysis.
HIV prevalence among young pregnant women can be used to estimate HIV prevalence among young women in the general population. Software is available (43, 44) for developing the adjustments necessary to make the data representative of the general population. However, detail on this estimation is beyond the scope of the present guide.
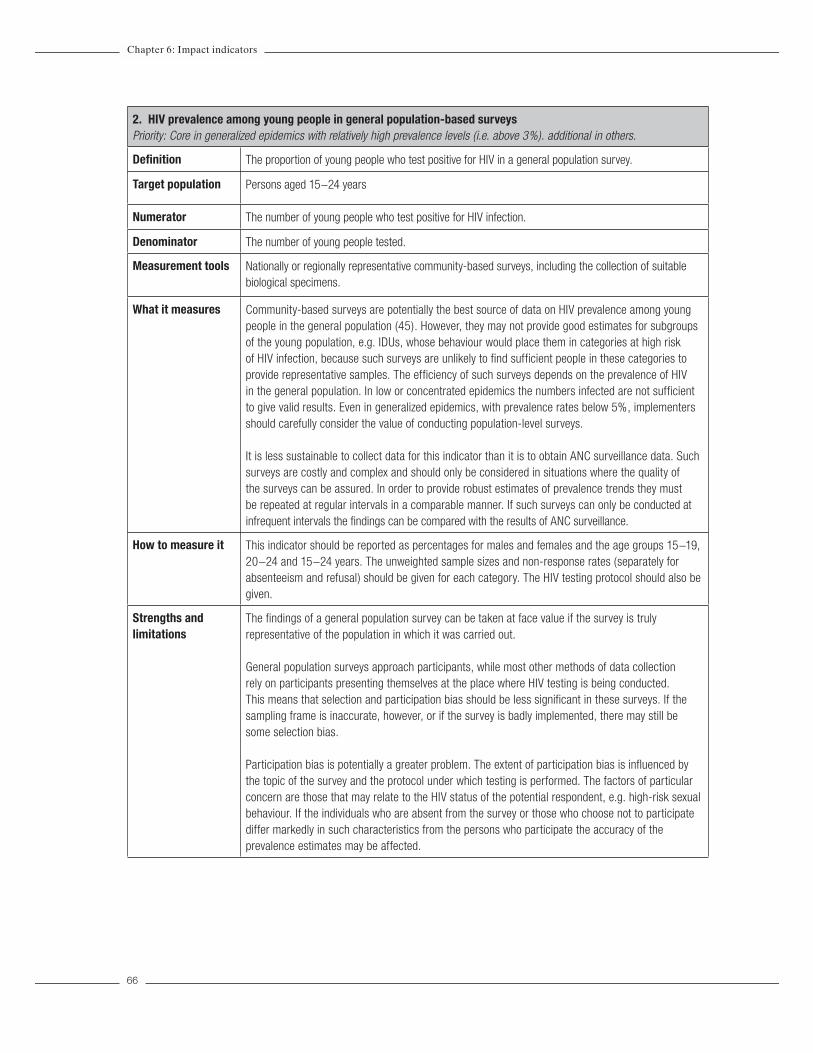
66
2. HIV prevalence among young people in general population-based surveysPriority: Core in generalized epidemics with relatively high prevalence levels (i.e. above 3%). additional in others.
Definition The proportion of young people who test positive for HIV in a general population survey.
Target population Persons aged 15−24 years
Numerator The number of young people who test positive for HIV infection.
Denominator The number of young people tested.
Measurement tools Nationally or regionally representative community-based surveys, including the collection of suitable biological specimens.
What it measures Community-based surveys are potentially the best source of data on HIV prevalence among young people in the general population (45). However, they may not provide good estimates for subgroups of the young population, e.g. IDUs, whose behaviour would place them in categories at high risk of HIV infection, because such surveys are unlikely to find sufficient people in these categories to provide representative samples. The efficiency of such surveys depends on the prevalence of HIV in the general population. In low or concentrated epidemics the numbers infected are not sufficient to give valid results. Even in generalized epidemics, with prevalence rates below 5%, implementers should carefully consider the value of conducting population-level surveys.
It is less sustainable to collect data for this indicator than it is to obtain ANC surveillance data. Such surveys are costly and complex and should only be considered in situations where the quality of the surveys can be assured. In order to provide robust estimates of prevalence trends they must be repeated at regular intervals in a comparable manner. If such surveys can only be conducted at infrequent intervals the findings can be compared with the results of ANC surveillance.
How to measure it This indicator should be reported as percentages for males and females and the age groups 15−19, 20−24 and 15−24 years. The unweighted sample sizes and non-response rates (separately for absenteeism and refusal) should be given for each category. The HIV testing protocol should also be given.
Strengths and limitations
The findings of a general population survey can be taken at face value if the survey is truly representative of the population in which it was carried out.
General population surveys approach participants, while most other methods of data collection rely on participants presenting themselves at the place where HIV testing is being conducted. This means that selection and participation bias should be less significant in these surveys. If the sampling frame is inaccurate, however, or if the survey is badly implemented, there may still be some selection bias.
Participation bias is potentially a greater problem. The extent of participation bias is influenced by the topic of the survey and the protocol under which testing is performed. The factors of particular concern are those that may relate to the HIV status of the potential respondent, e.g. high-risk sexual behaviour. If the individuals who are absent from the survey or those who choose not to participate differ markedly in such characteristics from the persons who participate the accuracy of the prevalence estimates may be affected.
Chapter 6: Impact indicators

67
A guide to indicators for monitoring and evaluating national HIV/AIDS prevention programmes for young people
In countries with relatively low levels of adult HIV prevalence (between 1 and 3%), general population-based surveys are likely to underestimate prevalence levels. Indeed, people at higher risk of HIV are more likely to missed by general population-based surveys, either because they are typically excluded from the sample (e.g. military or police living in barracks, sex workers working in brothels), or because they live outside of households for reasons related to their risk behaviour (sex workers, IDU), or because of their mobility (e.g. truckers, fishermen, other mobile groups). In addition, where prevalence is low (e.g. in the 0-3% range) it will be difficult to observe significant changes in prevalence over time, unless a unusually large sample size is used.
If basic information is collected from the people who do not take part in the survey or part of it, participation bias can be detected and adjusted for at the analysis stage. Response rates for the survey should always be reviewed and presented.
A lack of continuity is a potentially serious limitation of community-based survey data. Because surveys are expensive and time-consuming, the scope and format of successive surveys may vary. This introduces an unquantifiable error into the estimates. The collection of reliable data on HIV prevalence over time requires a series of comparable surveys to be carried out periodically in the same population.

68
3. HIV prevalence in subpopulations of young people with high-risk behaviour Priority: Core among commercial sex workers in all epidemics. Core among other groups (e.g., IDU, MSM) in concentrated epidemics, and additional in generalized epidemics
Definition The proportion of young members of defined subpopulations at high risk of contracting or transmitting HIV infection who test HIV-positive.
Target population Young people with high-risk behaviour aged 15−24 years.
Numerator The number of young people participating in high-risk behaviour who test positive for HIV infection.
Denominator The number of young people tested for HIV infection.
Measurement tools UNAIDS/WHO second-generation surveillance guidelines (5) and FHI guidelines on sampling in subpopulations (6).
What it measures This indicator is most useful in countries where HIV infection has not spread to the general population but remains concentrated in certain groups; however, it is essential to estimate the prevalence among commercial sex workers in generalized epidemics. This is because the prevalence in this group is likely to be considerably higher than among the general population, representing a «reservoir» of the virus within the generalized epidemic. The prevalence of HIV infection among members of these groups identifies important areas and groups for intervention. Trends in prevalence can indicate whether interventions are having an impact or whether some other factors are driving prevalence up or down.
In a concentrated epidemic the groups of interest generally include one or more of the following: IDUs, MSM, sex workers and frequent clients of sex workers.
How to measure it This indicator should be reported as percentages for males and females and the age groups 15–19, 20–24 and 15–24 years. Any data available on young people aged 10–14 years can also be given. The sample sizes should be given for each category and the HIV testing protocol should be given. It may be appropriate to give estimates disaggregated by the duration of the high-risk behaviour.
In surveys conducted among groups with high-risk behaviour, sampling should not be restricted to young people. Instead, this indicator should be based on data from a subset of respondents. It is important that surveys among these groups cover a sufficiently large sample to provide reliable estimates for young people.
If sample sizes are small and, as a consequence, such subdivisions would prejudice anonymity, or if information is not available on HIV status, it is not necessary to provide the prevalence data subdivided by age or duration of the high-risk behaviour. Instead, the age distribution of whole groups should be reported, regardless of HIV status. The groups can be described in the age groups <15, 15–19 and 20–24 years. If available, the median duration of the high-risk behaviour should be reported for each age group.
Tracking HIV in subpopulations can be logistically and ethically difficult, especially if the groups are marginalized or their activities are illegal. The sampling and estimation of total population sizes are key issues. An understanding of how the sampled population relates to any larger population sharing similar risk behaviour is critical for the interpretation of the indicator. For some groups, population-based sampling strategies are necessary. In other cases, sentinel sites are available. Sentinel sites for these populations tend to be linked to the provision of health services, e.g. a men’s health clinic in an area with a high concentration of gay sex bars, or a drug rehabilitation centre.
Chapter 6: Impact indicators

69
A guide to indicators for monitoring and evaluating national HIV/AIDS prevention programmes for young people
Strengths and limitations
A limitation of surveys among groups with high-risk behaviour is that it is not usually possible to find a representative probability sample. At best, this indicator represents the members of the subgroup with high-risk behaviour from which the sample has been drawn, and may not represent all persons displaying the behaviour. This means that it is difficult to estimate the extent to which an indicator based on these data describes prevalence among all members of the group. Information on the sizes of groups with high-risk behaviour is necessary in order to put these prevalence data in a national or regional context.
Because of the difficulties of access to subpopulations the biases in subpopulation serosurveillance data are likely to be far greater and much less predictable than those in data from a more general population, such as women at antenatal clinics. Where sentinel sites provide health services to the subpopulation in question, for example, the use of the facilities may be associated with problems that are themselves related to HIV infection.
It is especially difficult to minimize biases associated with age, since the age of participation in especially high-risk behaviour may be very variable. With regard to the explanation of observed patterns, chronological age is less important in groups with high-risk behaviour than the duration of the high-risk behaviour. It is essential, however, to collect and present data by age because this information allows the targeting of interventions and policies.
Changes in HIV prevalence in these groups may reflect the success or failure of attempts to achieve prevention but they may also reflect changes in recruitment and exposure, which are unrelated to prevention efforts. This indicator should be considered in conjunction with the behavioural indicators that refer to the membership and activity of groups with high-risk behaviour, because changes in recruitment to or exit from the groups may be responsible for changes in observed prevalence. Prevalence is also affected by changes in the number of new infections and in mortality.
Despite these difficulties it is essential to track HIV infection in people with high-risk behaviour in concentrated epidemics. The information cannot be perfect but some measure of progress or lack of it is essential for maintaining support for prevention programmes in critical subpopulations.

70
4. Young people who have a sexually transmitted infection Priority: Additional
Definition The proportion of young people with STIs that were detected during diagnostic testing
Target population People aged 15−24 years.
Numerator The number of diagnostic tests carried out for persons aged 15−24 years confirming the existence of an STI.
NOTE: The type or types of STI taken into account should depend on what is locally important. If more than one type of STI is considered the results should be given for each separately, as well as aggregated total.
Denominator The total number of persons aged 15−24 years who had diagnostic tests for STIs.
Measurement tools Population-based surveys
What it measures In countries where the prevalence of HIV infection is low, this indicator measures the likelihood of its potential spread. Also, STI prevalence provides a way of monitoring the levels of risky sexual behaviour.
How to measure it The prevalence of an STI must be determined from laboratory diagnoses of infection, because many STIs are asymptomatic (and will be detected only by laboratory testing) and many have similar symptoms (making an accurate clinical diagnosis difficult). In many countries the availability of suitable laboratory facilities is limited, restricting the sources of data for this indicator.
Data for this indicator should not be collected from patients attending STI clinics or from persons for whom a test is being carried out because they have STI symptoms. The reason for this is that these people constitute a very highly selected group in which the prevalence of infection does not provide information on the prevalence of infection among young people in the general population.
STI testing within a population based survey, however, is complex and expensive. To detect infection, either samples of genital tract secretions or urine, or blood, must be obtained and samples must be transported under appropriate conditions to a laboratory for testing. These difficulties are a hindrance but have been successfully overcome in multiple household surveys.
This indicator should be given as separate percentages for males and females in the age groups 15–19, 20–24 and 15–24 years.
Non-response rates should be considered before reporting the results of these surveys.
Strengths and limitations
While screening for STIs during a general population based survey is expensive and complicated, general population based surveys have the advantage of reduced participation and selection bias and, if properly conducted, give the best information on prevalence of infection among the general population. These studies can also be augmented by additional studies among specific populations of interest, e.g., injection drug users.
For further information, see Guidelines for STI surveillance, section on prevalence assessment and monitoring (WHO/CHS/HIS/99.2 UNAIDS/99.33E).
Chapter 6: Impact indicators

71
A guide to indicators for monitoring and evaluating national HIV/AIDS prevention programmes for young people
METHODOLOGICAL ANNEX
This annex provides some basic guidance on the issues of collecting data for monitoring and evaluation. Many of the issues discussed here are pertinent to data collection with different populations (i.e., are not specific to collecting data with young people).
1. Validity, reliability, and bias:One of the most important concerns in collecting data on young people is that it be comparable over time. When data are comparable, researchers and programmers can identify trends and changes in the HIV epidemic among young people. To achieve this, data must be valid, reliable and unbiased. There is no way to ensure that data are perfectly valid, but in some cases, invalid data can be clearly identified and rejected. Many errors can occur in data collection that can affect the validity of the data: there could be errors in the way the sample was selected, or with the way the interview was conducted, or even with how the data was analysed. One of the goals of this chapter will be to help readers ensure that they collect valid data.
Equally important is reliability. To assess reliability, researchers may repeat questions within an interview in exactly the same or somewhat different forms, or they may repeat them during a follow-up interview (46). For example, if early on in a questionnaire, a respondent reports that he has never used a condom during sex, and then later, he reports that he used a condom the last time he had sex, his responses would be unreliable and invalid. While unreliable data indicate that data are invalid, reliable data are not necessarily valid. An example of this is when respondents report consistently and reliably that they have never had sexual intercourse, when in fact, they have already done so.
• Valid data are data that are as close to the truth as possible.
• Reliability is the consistency of an individual’s responses to the same or similar questions.
When data errors are systematic or follow a regular pattern, they are called bias. No data are likely to be completely free of bias, but its extent must be recognized and minimized. There are several types of biases that can occur in data collection. One type of general bias, called sample bias, occurs when the respondents who participate in a study (the sample) do not adequately represent the group of interest. Having people volunteer to be in a study, or having public officials choose which villages or provinces are selected for a survey makes it very likely that the sample will be different from the rest of the group of interest. Sample bias is also likely to occur when people or organizational units are selected for a survey but refuse to participate. Some researchers have identified this special type of sample bias as participation bias. An example of this is when there is a difference in past sexual risk behaviour between those agreeing to be tested for HIV and those refusing. To minimize sample bias, it’s important to select random samples of participants, which are samples in which each member of the population has an equal chance of being selected. Details about random sampling are provided on pages 5-6.
72
A second general type of bias is called information bias, which occurs whenever the data show systematic differences across the sample. The two most common types of information bias are interviewer bias and recall bias. An interviewer, in particular, can influence the responses in many ways, even by the tone in his/her voice. Other characteristics, such as gender, age, race, ethnicity, education status, and attitudes may also influence how a study participant responds to questions. Researchers have found that participants are generally most likely to develop trust with people who are like themselves, and thus may report sensitive behaviour to such interviewers. For example, the most appropriate person to interview a rural adolescent girl may be a young woman of a similar background.
Another way interviewer bias can occur is when interviewers systematically code the data differently. For example, if respondents are asked to describe all family planning methods they have used in the past, and some report “wearing a magical charm,” bias may occur if one interviewer systematically codes this as “local/traditional methods,” while another codes it as “no method.” Interviewer bias can be reduced by ensuring all interviewers are well trained and tested in interviewing skills, the research protocol and research ethics. Interviewer training should also involve a discussion of the importance of valid data, ways to reduce bias, and the research goals themselves to foster the interviewers’ sense of ownership and personal commitment to those goals even in the absence of supervision (10).
Recall bias may also arise when individuals give false information about a past event. The ability to accurately recall events changes with the time elapsed since their occurrence and with their frequency. For example, data on condom use at last sex could suffer from recall bias: someone who had sex a long time ago may not accurately recall whether they used a condom or not. A respondent who had sex very recently, however, could say for certain whether they did. To reduce recall bias, one simple technique is to ensure that participants have enough time to reflect before answering, and another is to have participants think through a sequence of events in their life history (47, 48).
A third type of bias that may be especially common among young respondents is social desirability bias, which occurs when study participants do not answer questions honestly because they perceive the truth to be socially unacceptable or undesirable. For example, a person may falsely deny having had a sexually transmitted infection because of fear of the social stigma related to it. Researchers have generally found that behaviours that are seen as socially undesirable will be under-reported rather than over-reported (11). However, perceptions of desirability may vary within a population, and what may be considered unacceptable for one group may be considered desirable for another. In some cultures, for example, young women’s abstinence from sex is highly valued, so they may under-report their total number of sexual partners in research studies, while young men in the same culture may take pride in sexual experience, and thus exaggerate their total number of partners (12, 13).
A number of techniques have been developed to reduce social desirability bias. One is to explain the research goals before the interview, including their social value and legitimacy, and the importance of honest reports. Another is to ensure the privacy of the interview and the confidentiality of any information obtained from it, and to make this as evident as possible to respondents.
• Interviewer bias occurs when there are differences in how the interviews are being conducted and the data being coded.
• Recall bias happens when people systematically make errors when remembering events.• Social desirability bias occurs when study participants do not answer questions honestly
because they perceive the truth to be socially unacceptable or undesirable
Methodological Annex

73
A guide to indicators for monitoring and evaluating national HIV/AIDS prevention programmes for young people
2. Questionnaire Design and WordingQuestionnaire design and wording may also contribute to bias. For example, if respondents are asked about sexual behaviour early in the questionnaire, social desirability may be greater than if they were asked later, after becoming more familiar with and trusting of the interview process. The length of the questionnaire and the duration of the interview may also be important, as if it takes too long respondents may become tired or frustrated, and stop responding in a meaningful way (46).
There are other ways in which the order and content of questions and answers can influence respondents’ reports. If the wording of the question suggests a possible answer, respondents may consider it and report it when they would not have otherwise. Similarly, early questions and answers may suggest and influence answers to later questions (46). As an example, if the question, “Have you ever used condoms to prevent pregnancy?” is asked before the request, “Name all family planning methods that you know,” the first question will have provided one possible answer to the second that some respondents may not otherwise have considered or reported.
Another problem often contributing to misunderstanding on the part of the researcher or the respondent has to do with vague or relative terminology, such as “often” or “frequent” (49). For example, if respondents are asked how often they have had sex, one young man may feel he has sex often because he has sex once a month, whereas another may feel he does not have sex often, because he only has sex once per week. Ideally, questionnaires should avoid such vague terms, or if necessary, clearly define them.
In many developing countries, the first languages of researchers and respondents may be different, and questionnaire translation becomes a potential source of error or bias (46, 50). Error may simply occur due to the poor quality of the translation, but also because many terms may not have conceptual equivalents in the other research language(s), and/or may have multiple, undesired meanings. For example, in English the term “to seduce” suggests successfully persuading someone to have sex, but in another language the closest conceptual equivalent may only suggest an attempt at seduction (not necessarily resulting in sexual intercourse). If the two terms are used interchangeably, reports of attempted seduction may be misunderstood as seduction that results in intercourse.
The issue of mis-translation is particularly problematic in sexual behaviour research, because its sensitive nature makes it difficult to identify appropriate terms. In many cultures, for example, the literal translations for “vaginal intercourse” are obscure or are considered to be offensive. In contrast, euphemisms such as “to make love” may be widespread and relatively inoffensive, but also may be ambiguous and suggest other activities to respondents, such as sexual play/exploration, non-penetrative sex, or anal intercourse.
During questionnaire development, there are a number of ways to reduce the possibility of bias. If a draft questionnaire requires translation, a new translator should do a back-translation into the original language, for researchers to be able to assess errors and unanticipated meanings. This process can be repeated several times during questionnaire development to ensure the best quality of translation. Pre-tests can be done with a small number of respondents, focusing on specific questions and following up closely to see if there were any areas of misunderstandings. Pre-tests are particularly useful for clarifying problem issues, such as appropriate sexual terminology to use in research with young people. Once the study protocol has been drafted, pilot tests (small-scale models of the study itself) can take place in a similar setting to that proposed for the study and with respondents who are similar to the anticipated study population (46).

74
Tips for designing the questionnaire: • Begin with general, non-sensitive questions (i.e., avoid asking whether a young person has
ever had sex in the first few questions)• Use simple formatting and wording.• Use language familiar in the culture and sub-group.• Avoid ambiguous terms or, if necessary, clearly define them (i.e., for some populations, it
may be important to define the meaning of sex before it is asked in questions).• Avoid a question that suggests a response to that question or to a later question
Tips for developing and testing the questionnaire:• Arrange for a series of independent translations and back-translations. The questionnaires
need to be translated into the respondents’ local language before the survey beings. In a separate operation, another translator should translate the new questions back into English (or the original language) without referring to the original questionnaire. This new translation should match the original version.
• Pre-test questionnaire to identify problem areas, misinterpretations, or cultural objections to the questions.
• Pilot test questionnaire when almost final using respondents similar to the respondents for the actual data collection.
3. Data Collection MethodsA range of research methods have been used for adolescent sexual behaviour research, each of which has strengths and weaknesses in reducing biases and increasing data validity. Quantitative methods involve collecting data from a large number of people for statistical analysis. For practical reasons, the large scale of quantitative studies usually requires that surveys be structured, or follow an exact question and answer format. The uniform nature of such structured questions can help minimize interviewer bias. For example, if a structured interview is conducted correctly, there is less chance of interviewers using different terms for the same questions, and thus less chance of suggesting a different possible answer to respondents. Qualitative methods generally involve collecting more in-depth information from far fewer people than in a quantitative study, using semi-structured and unstructured interviews. Qualitative interviews allow for a more detailed and complex exploration of topics than is usually possible in quantitative interviews, and since they are less structured, researchers can adapt and respond to issues that arise spontaneously. For example, a study focusing on sexual behaviour may have no specific questions about violence in relationships, but if a respondent unexpectedly reported engaging in high-risk behaviours due to a threat of violence, there would be scope to explore this in a semi-structured interview.
The recommended methodology of data collection throughout most of this guide is a national or regional household survey of young people. School-based surveys are also used occasionally to collect data on young people. One of the main advantages of school surveys as compared to household surveys is the cost: school surveys are, overall, much less expensive to implement. The lower cost of these surveys is largely due to a more accessible sample (the advantage of having a group of young people in a school, rather than having to find each young person in his/her household), and the fact that most school surveys use self-administered questionnaires (that is, they do not require an interviewer to pose questions, as young people fill out the questionnaire themselves).
Another difference between these methodologies is that school-based surveys, in comparison with household-based surveys, tend to produce a higher prevalence of adolescent risk behaviours (51, 52).
Methodological Annex

75
A guide to indicators for monitoring and evaluating national HIV/AIDS prevention programmes for young people
The main hypothesis for this finding is that privacy appears to be the critical determinant of whether young people are willing to report risky (often stigmatised) behaviours (Kann et al, 2002). This is in fact a disadvantage of household surveys: they are often unable to ensure the privacy for respondents and this might impact the report of risk behaviours. However, evidence to establish if the higher prevalence found in school-based surveys is closer to “true” prevalence has not been conclusive, and there is also evidence to suggest that data from school surveys may be less valid than data from household surveys (53)
The major drawback of school-based surveys - and the main reason why they are not suggested as the means of data collection in this guide - is that they are not representative of the overall population of young people. There are two main arguments:
• This guide recommends most of the indicators to be collected with young people aged up to 24 years. In countries where school attendance is high, young people in the higher age bracket (18 and above) are no longer in school, and would therefore be excluded from the sample.
• In countries where overall school attendance is low (and usually lower with increasing age), a substantial proportion of the overall young population would not be included in a school-based sample.
Indicators in this guide were compiled for the purpose of monitoring and evaluating national programmes, and for tracking national behavioural and biological trends relevant to HIV. Given the limitations specified above, school-based surveys cannot be substituted for household surveys.
Nevertheless, school-based surveys can be a valuable additional source of information, which should be used in conjunction with a household survey to give insight into specific issues, particularly those related to school-based interventions. There are a number of high quality school-based surveys which have been applied in many countries:
• The Global Youth Tobacco Survey (sponsored by the World Health Organization and Centers for Disease Control), is survey of tobacco use and its determinants among 13-15 year old students. It has been conducted in 140 countries.
• The Health Behaviour of School-going Children Survey (sponsored by the World Health Organization), is a survey of health behaviours and their determinants among 11, 13 and 15 year old students. It has been conducted in 29 countries.
• The Global School-based Student Health Survey (sponsored by the World Health Organization in collaboration with UNICEF, UNESCO, UNAIDS and CDC), is a survey of priority health risk behaviours and their determinants among 13-15 year old students. It was launched in 2003 and has, to date, been conducted in 7 countries.
Ultimately, the most important point is the synergy of different methods and efforts of data collection in providing a comprehensive picture of issues relevant to preventing and treating HIV/AIDS among young people. All surveys - whether household-based, school-based, or with special populations - should include a key set of core indicators relevant to HIV and young people. The indicators in this guide are such a proposed set, with the aim contributing to comparability of data across surveys, across regions and across time, and therefore improving data collection efforts overall.
For most of the indicators included in this guide, data will need to be collected by conducting a national or regional household survey of young people. Household surveys are widely used to collect population-based national- and sub-national-level data on the health status and behaviours of adolescents and young adults. Among the more prominent ongoing household surveys that collect data in a sizeable number of countries include the Demographic and Health Surveys (DHS), the Behavioural Surveillance Surveys (BSS) developed by Family Health International, and the UNICEF Multiple Indicator Cluster Surveys (MICS). These surveys are based on adult samples,

76
and the sample size and sampling techniques have to be adjusted to ensure a representative number of young people within the overall sample. There are also household surveys that are adolescent-specific, such as Reproductive Health and Adolescent Reproductive Health Surveys undertaken by the U.S. Centers for Disease Control and Prevention (CDC). In addition to these “international” surveys, many countries also undertake annual or more frequent national surveys (e.g., quarterly labour force or economic surveys). The volume and types of data on adolescents varies tremendously across these national surveys. However, as such surveys might serve as a vehicle for adding questions on adolescent health and development, they are worthy of note.
Advantages and Disadvantages of Household Surveys
Advantages:• High feasibility of collecting national representative data on youth, both in-school and
out-of-school• Lower susceptibility to sample bias• Considerable experience with acceptance of surveys as a means of monitoring by most
governments around the world• The relative ease of standardization of surveys across settings, which makes intra-
national and international comparison more feasible.
Disadvantages:• Moderate-to-high cost• Relative inefficiency in obtaining measurements for vulnerable sub-population of youth
(i.e., street children, orphans who do not have a fixed place of residence), the result of a lack of suitable sampling frames
• The fact that youth are highly mobile and often not at home may make it difficult to find them to be interviewed.
• Difficulty in ensuring privacy and the subsequent impact this may have on behavioural prevalence estimates
For an in-depth discussion of different surveys and methods of sampling populations of young people, refer to the “Guidelines of sampling of youth” paper, which is available on www.childinfo.org.
Methodological Annex

77
A guide to indicators for monitoring and evaluating national HIV/AIDS prevention programmes for young people
4. SamplingSampling is the process of systematically choosing a sub-set of the total population to be studied. Due to their lower risk of bias, surveys undertaken using probability sampling methods are generally preferred to those based on non-probability samples. For collecting data on the indicators of this guide, it is critical that probability sampling methods be used as they are the only way that the data can be compared over time. Probability sampling methods require that every person in the population has a chance of being selected for the survey. All of the international household surveys mentioned previously use some form of probability sampling, typically multi-stage cluster sampling. Conversely, non-probability sampling methods are not based on probability theory. With these methods, samples are not chosen by random chance. Examples of non-probability sampling methods can include obtaining a sample of subjects on the basis of opportunity (i.e., surveying all youth you meet walking down a street), or basing sample selection on referrals from other sample subjects (often referred to as snowball sampling).
There are several types of probability sampling methods. The simplest of these methods is simple random sampling, in which subjects are chosen at random so that each element has an equal chance of selection. For example, survey subjects are chosen from a hat or, ideally, from a table of random numbers in a statistical textbook. Another type of probability sampling method is stratified sampling,in which the population to be sampled is divided into homogenous groups based on characteristics that are important to the indicators being measured, such as youth who are sexually active. A simple random sample is then chosen from each group. Large-scale surveys, like DHS and MICS, are based on multi-stage cluster sampling, which typically involves selecting random samples of clusters (such as districts or regions in a country) and then enumerating all the households within these districts, and taking a simple random sample of each cluster.
The availability of a sampling frame is an important requirement for probability sampling. Indeed, it is the lack of a usable sampling frame and the high cost of creating one from scratch that is often the rationale for using non-probability methods. For the general population of adolescents, usable sampling frames in the form of a recent census, “master” sampling frames developed by the national statistics office, and/or other sampling frames used by other large-scale surveys are likely to be available in most countries. However, usable sampling frames for vulnerable sub-groups of youth (i.e., commercial sex workers) are not likely to exist in most settings, and either appropriate sampling frames will have to be developed or non-probability methods resorted to.
Probability sampling methods are based on probability theory, a mathematical concept based on accepted statistical principles that refers to the ability to predict the statistical likelihood that a random event will occur.

78
1. UNAIDS. Report on the global HIV/AIDS epidemic, 2002 update. Geneva: UNAIDS; 2002 (available at: www.UNAIDS.org).
2. UNICEF, UNAIDS, WHO. Young people and HIV/AIDS: opportunity in crisis. New York and Geneva: UNICEF, UNAIDS, WHO: 2002.
3. UNAIDS. National AIDS programmes: A guide to monitoring and evaluation. Geneva: UNAIDS; 2000.
4. MEASURE Evaluation/WHO/PSI Compiled Condom Availability and Quality Protocol, retail survey (http://www.cpc.unc.edu/measure/publications/unaids-00.17e/tools/measurecondom.pdf)
5. WHO, UNAIDS. Initiating second generation HIV surveillances: practical guidelines. Geneva: World Health Organization; 2002 (WHO/HIV/2002.17).
6. Family Health International (FHI). Guidelines for repeated behavioural surveillance surveys in populations at risk of HIV. Arlington (VA): Family Health International; 2000.
7. Adamchak S, Bond K, McLaren L, Magnani R, Nelson K, Seltzer J. A guide to monitoring and evaluating adolescent reproductive health programs, Tool Series 5. Washington DC: FOCUS on Young Adults; 2000.
8. Rehle T, Saidel T, Mills S, Magnani R, editors. Evaluating programs for HIV/AIDS prevention and care in developing countries: a handbook for program managers and decision makers. Washington DC: Family Health International; 2001 (available at: http://www.fhi.org).
9. Webb D, Elliot L. Learning to live: monitoring and evaluating HIV/AIDS programmes for young people. London: Save the Children; 2000 (available at: http://www.savethechildren.org.uk).
10. Bachrach, C. and Newcomer, S. F. 2002. Addressing bias in intervention research: Summary of a workshop. Journal of Adolescent Health 31:311-321.
11. Catania, J. A., Gibson, D. R., Chitwood, D. D. and Coates, T. J. 1990. Methodological problems in AIDS behavioral research: Influences on measurement error and participation bias in studies of sexual behaviour. Psychological Bulletin 108(3): 339-362.
12. Siegel, D. M., Aten, M. J. and Roghmann, K. J. 1998. Self-reported honesty among middle and high school students responding to a sexual behaviour questionnaire. Journal of Adolescent Health 23 (1): 20-28.
13. Catania, J. A., Turner, H., Pierce, R., Golden, E., Stocking, C., Binson, D., and Mast, K. 1993. Response bias in surveys of AIDS-related sexual behavior. In Methodological Issues in AIDS Behavioral Research. Ostrow, D. G., Kessler, R. C. Plenum Press: New York. 133-162.
14. Robinson K, Telljohan S, Price J. Predictors of sixth-graders engaging in sexual intercourse. Journal of School Health 1999;69:369-75.
15. Kinsman SB. Romer D. Furstenberg FF. Schwarz DF. Early sexual initiation: the role of peer norms. Pediatrics, 1998;102:1185-92.
16. Romer D, Black M, Ricardo I, Feigelman S, Kaljee L, Galbralth J, et al. Social influences on the sexual behavior of youth at risk of HIV exposure. American Journal of Public Health, 1994;84(6):977-85.
17. UNAIDS. Monitoring the Declaration of Commitment on HIV/AIDS: guidelines on construction of core indicators. Geneva: United Nations General Assembly Special Session of HIV/AIDS; 2002.
18. WHO. Adolescent-friendly health services: Making it happen. And Global consultation on adolescent-friendly health services. A consensus statement. Geneva: World Health Organization; 2001 (available at: http://www.who.int/child-adolescent-ealth/publications/ADH/WHO_FCH_CAH_02.18.htm).
REFERENCES
References

79
A guide to indicators for monitoring and evaluating national HIV/AIDS prevention programmes for young people
19. Going for gold: A clinic guide to the National Adolescent Friendly Clinic Initiative. South Africa: NAFCI; 2000.
20. Nelson K., MacLaren L., Magnani R.. Assessing and planning for youth-friendly reproductive health services. FOCUS Tool Series 2. Washington DC: FOCUS on Young Adults Program/Pathfinder International; 2000.
21. Jessor R, Turbin MS, Costa FM. Risk and protection in successful outcomes among disadvantaged adolescents. Applied Developmental Science 1998;2(4):194-208.
22. WHO. Framework for programming for adolescent health and development. Action for adolescent health: towards a common agenda: Recommendations from a joint study group - WHO, UNFPA, UNICEF. Geneva: World Health Organization; 1997 (http://www.who.int/child-adolescent-health.htm).
23. UNAIDS, UNICEF. Guide to monitoring and evaluation of the national response for children orphaned and made vulnerable by HIV/AIDS. Upcoming.
24. Meekers D, Calves A. Gender differentials in adolescent sexual activity and reproductive health risks in Cameroon. African Journal of Reproductive Health 1999;3(2):51-67.
25. Kamya M, McFarland W, Hudes ES, Ssali A, Busuulwa R, Hearst N. Condom use with casual partners by men in Kampala, Uganda. AIDS 1997;11(Suppl.1):S61-6.
26. Kirby D. Emerging answers: research findings on programs to reduce sexual risk-taking and teen pregnancy. Washington DC: National Campaign to Prevent Teen Pregnancy Task Force on Effective Programs and Research; 2001.
27. Murray N, Zabin L, Toledo-Dreves V. Gender differences in factors influencing first intercourse among urban students in Chile. International Family Planning Perspectives 1998;24(3):139-44,152.
28. Magnani RJ, Seiber EE, Gutierrez EZ, Vereau D (2001).Correlates of sexual activity and condom use among secondary-school students in urban Peru. Studies in Family Planning 2001;32(1):53-66.
29. Park I, Sneed C, Morisky D, Alvear S, Hearst N. Correlates of HIV risk among Ecuadorian adolescents. AIDS Education and Prevention 2002;14(1):73-83.
30. Magnani RJ, Karim AM, Weiss LA, Bond KC, Lemba M, Morgan GT. Reproductive health risk and protective factors among youth in Lusaka, Zambia. Journal of Adolescent Health 2002;30:76-86.
31. Kiragu K, Zabin L. The correlates of premarital sexual activity among school-age adolescents in Kenya. International Family Planning Perspectives 1993;19:92-7.
32. Selvan M, Ross M, Kapadia A. Study of perceived norms, beliefs, and intended sexual behavior among higher secondary school students in India. AIDS Care 2001;13(6):779-88.
33. Laguna E. On their own: effect of home- and school-leaving on Filipino adolescents’ sexual initiation. East-West Center Working Papers 2001;108-19.
34. Isarabhakdi P. Factors associated with sexual behavior and attitudes of never-married rural Thai youth. Journal of Population and Social Studies 1999;8(1):21-44.
35. Podhisita C, Xenos P, Varangrat A. The risk of premarital sex among Thai youth: individual and family influences. East West Center Working Papers 2001;108-5.
36. Bearman P, Bruckner H. Power in numbers: peer effects on adolescent girls’ sexual debut and pregnancy. Washington DC: National Campaign to Prevent Teen Pregnancy; 1999.
37. Schaefer EW. Children’s reports of parental behavior: an inventory. Child Development 1965;36:413-24.
38. Barber BK, Olsen JA. Socialization in context: connection, regulation, and autonomy in the family, school, and neighborhood, and with peers. Journal of Adolescent Research 1997;12(2),287-315.
39. WHO. Broadening the horizon: balancing risk and protection for adolescents. Geneva: World Health Organization; 2001 (available at: http://www.who.int/child-adolescent-health/publications/ADH/WHO_FCH_CAH_01.20.htm )
40. Nelson K, Magnani R. The effects of youth-friendly service projects on service utilization among youth in Lusaka, Zambia. Washington DC: FOCUS on Young Adults Program; 2000.

80
41. WHO. Putting women’s safety first: ethical and safety recommendations for research on domestic violence against women. Geneva: World Health Organization; 2001(available at: http://www.who.int/gender/violence/womenfirtseng.pdf).
42. UNAIDS/WHO Working Group on global HIV/AIDS and STI surveillance. Guidelines for conducting HIV sentinel serosurveys among pregnant women and other groups. (UNAIDS/03.49E.) Geneva, 2003
43. UNAIDS. UNAIDS/WHO Working Group on HIV/AIDS/STI Surveillance. (2003) Estimating the Size of Populations at Risk for HIV: Issues and Methods. Updated July 2003. (UNAIDS/03.36E) (available at www.UNAIDS.org).
44. Futures Group. “Spectrum” Estimation package, available at www.tfgi.com.
45. Boerma et al. Estimates of HIV-1 prevalence from national population-based surveys as a new gold standard. Lancet 2003, 362: 1929-1931.
46. Smith, P. G. and Morrow, R. H. 1996. Field Trials of Health Interventions in Developing Countries: A Toolbox. Oxford: Macmillan.
47. Auriat, N. 1993. ‘My wife knows best’: A comparison of event dating accuracy between the wife, the husband, the couple, and the Belgium population register. Public Opinion Quarterly 57: 165-190.
48. Bradburn, N. M., Reps, L. J., and Shevell, S. K. 1987. Answering autobiographical questions: The impact of memory and inference on surveys. Science 236: 157-163.
49. Bradburn, N. B. and Miles, C. 1989. Vague Quantifiers. In Survey Research Methods: A Reader. Eds. Singer, E. and Presser, S. University of Chicago Press: Chicago. 155-164.
50. Bulmer, M. and Warwick, D. P. 1983. Data collection. In Social Research in Developing Countries: Surveys and Censuses in the Third World. Eds. Bulmer, M. and Warwick, D. P. John Wiley & Sons: New York. 145-160.
51. Brener, ND; Kann, L.; Smith, TK. 2003. Reliability and validity of the School Health Policies and Programs Study 2000 questionnaires; J Sch Health; 2003 Vol. 73, p29-37, 9p.
52. KANN, L.; BRENER, N.D.; WARREN, C.W.; COLLINS, J.L.; GIOVINO, G.A.. 2002 An assessment of the effect of data collection setting on the prevalence of health risk behaviors among adolescents; J. Adolesc. Hlth; Vol. 31, p327-335, 9p.
53. Gregson, Simon: “The performance of face to face interviews and self-administered/more anonymous techniques,” Workshop on Measurement of Sexual Behaviour in the Era of HIV/AIDS. London, 4th to 6th September 2003.
References

WORLD HEALTH ORGANIZATIONDepartment of HIV/AIDS20, avenue AppiaCH-1211 Geneva 27SwitzerlandE-mail: [email protected]://www.who.int/hiv/en
ISBN 92 4 159257 5