Optimal non-linear income taxation for the alleviation of income-poverty
24
Pollcy, Research, and ExternalAffairs WORKING PAPERS Development Economic j Office of the Vice President The World Bank March1991 WPS616 Optimal Nonlinear Income Taxation for the Alleviation of Poverty Ravi Kanbur MichaelKeen and MattiTuomala Poverty-minimizing marginal tax rates on the poor are in the range of 60-70 percent. The Policy. Rcsearch, and External AffairsConaplexdistributes PRE Working Papers todisseminate the findings of work in progress and to encouragc the exchange of ideas among Bank staff and all others interested in development issues. Thesc papers carry the names of the authors, reflect only their views, and should be used and cited accordingly. The findings. intcrpretations, and conclusions are the authors' own. They should not be attributed to the World Bank, its Board of Directors, its management, or any of its mcmber countries. Public Disclosure Authorized Public Disclosure Authorized Public Disclosure Authorized Public Disclosure Authorized
-
Upload
independent -
Category
Documents
-
view
4 -
download
0
Transcript of Optimal non-linear income taxation for the alleviation of income-poverty

Pollcy, Research, and External Affairs
WORKING PAPERS
Development Economic jOffice of the Vice President
The World BankMarch 1991WPS 616
Optimal NonlinearIncome Taxation
for the Alleviationof Poverty
Ravi KanburMichael Keen
andMatti Tuomala
Poverty-minimizing marginal tax rates on the poor are in therange of 60-70 percent.
The Policy. Rcsearch, and External Affairs Conaplex distributes PRE Working Papers todisseminate the findings of work in progress andto encouragc the exchange of ideas among Bank staff and all others interested in development issues. Thesc papers carry the names ofthe authors, reflect only their views, and should be used and cited accordingly. The findings. intcrpretations, and conclusions are theauthors' own. They should not be attributed to the World Bank, its Board of Directors, its management, or any of its mcmber countries.
Pub
lic D
iscl
osur
e A
utho
rized
Pub
lic D
iscl
osur
e A
utho
rized
Pub
lic D
iscl
osur
e A
utho
rized
Pub
lic D
iscl
osur
e A
utho
rized

I Policy, Research, and External Affairs
Development Economics
WPS 616
This paper- a product of the Research Administrator's Office, Office ofl thc Vice Prcsidentc, DcvelopmncntEconomics - is part of a larger eftort in PRE to understand the design of poverty alleviation policies.Copies are available free from the World Bank, 1818 H Street NW, Washington DC 20433. Please contactJane Sweeney, room S3-026, extension 31021 (19 pages).
There has been much discussion recently of using a noitwelfarist objective function that"targeting" in the design of social security and seems to accord well with the common concciersincome transfers - that is, the structuring of tax of the policy debate: an income-based povertyand transfer profyrams to ensure that resources go index.to the poor, witl ainimal leaks to the nonpoor.
They show that one of the key theoreticalIncentive effects force one to rule out 100 results of the welfarist literature is overturned: if
percent marginal tax rates on the poor (implicit it is desirable for everybody to work, the optimalin benefit withdrawal). With a marginal tax rate marginal tax rate on the very poorest individualsof 100 percent, the poor have no incentive to is strictly negative (a marginal subsidy).earn income. But how high or low the marginalrate of taxation should be, and how they should They argue that the nonwelfarist perspectivevary with income, is more complex - and points toward lower marginal tax rates in tlheopinion varies widely. lower part of the income distribution than does
the welfarist perspective. But numerical simu1a-Social security schemes that withdraw tions suggest that this effect is of limited quanti-
benefits represent an extremely high effective tative significance.marginal tax rate; other schemes call for rcla-tively low marginal tax rates at the bottom of the Using conventional functional fonns andincome distribution. Which tax-tranfer schedule parameter values, optimal marginal tax rates ondoes most to reduce poverty? the poor are in the 60-70 percent ranlge.
The issue, say Kanbur, Keen, and Tuomala,is one of optimal nonlinear income taxation-
Thc PRE Working Plaper Scrics disseminates the findings of work under way in thc Bank's Policy, Rcscarch, and ExtemalAffairs Complex. An objcctivc of thc scrics is to get thcsc findings out quickly, even if prcsentations are lcss than fully polished.IThe findings, intcrprctations, and conclusions in thcse papers do not necessarily represent official Bank policy.
Produced by the l'RE Dissemination Centcr

Optimal Non-Linear Income Taxation for the Alleviationof Income Poverty
byRavi KanburMichael Keen
and Matti Tuomala*
Table of Contents
1. Introduction 1
2. Lessons from the welfarist literature 4
3. Income poverty minimization: Theory 6
4. Numerical simulations 11
5. Conclusion 15
Appendix 17
References 19
*Acknowledgements: We are grateful to Tim Besley for many very helpful discussionson these and related issues. Our collaboration began at the 1988 Warwick SummerWorkshop, and we thank the Department of Economics at Warwick for its hospitality.

1. Introduction
In bc"' developed and developing countries there has recently been much
disc---.on of 'targeting' In the design of social security and income
transfers. By this Is meant the structuring of tax and transfer programmes so
as to ensure that resources are concentrated on the poor with leakages to the
non-poovr minimised. Two dimensions of the targeting problem are of paramount
interest. One Is the Issue of how best to use non-income information on
various contingencies - such as labour market status (unemployment,
retirement), demographic characteristics or region of residence - to
differentiate transfers. Aspects of this have been analysed by Besley and
Kanbur (1988) In a developing country context and by Kanbur and Keen (1989)
In a model of group-specific linear tax schedules. This work has typically
assumed income-relation to be Infeasible or restricted it to take a very
simple form, so precluding any consideration of the second general issue.
This is the appropriate nature and degree of income-relation ('means
testing') In determining the extent of an Individual or household's
transfer/tax. It Is to this Issue that the present paper is addressed.
In the absence of Incentive effects the design of a perfectly-targeted
non-linear income tax is a trivial exercise. Having established a poverty
line, simply give everyone who is Initially below it exactly that transfer
needed to bring them just above It.I Such a scheme involves no leakages. But
once Incentive effects are admitted an obvious and familiar difficulty
arises. Since the scheme implies a marginal tax rate on those below the
poverty line of 100%, the poor have no Incentive to earn income. Their
rational labour supply decisions would then be liable to greatly Increase the
revenue cost of alleviating their poverty. Incentive effects may thus force
one to rule out marginal rates on the poor of 100%/.. The questions of
precisely how high or low those rates should be, and of how they should vary
with income, then become considerably more complex. Opinion seems to vary
widely. On the one hand, many social security schemes observed In practice
face the poor with extremely high effective marginal tax rates (inclusive of
1This assumes that the resources available are suffclient to entirelyeradicate poverty; a distinct set of Issues arises If they are not.
1

the taxation Implicit In benefit withdrawal). In the UK, for instance, while
'). Fowler reforms eliminatec the poverty trap In the extreme form of
marginal rates In excess of 100% they ar- likely to have had the effect of
extending the range of incomes over whilch the poor face very high marginal
rates (Dilnot and Stark (1990)). In the US, the AFDC programme alone has
implied marginal rates in the order of 70%. Some reform proposals, in
contrast - such as those seeking to restore a reduced rate band for income
tax of the kind implemented In the UK from 1978 to 1980 - call for relatively
low marginal tax rates at the bottom of the distribution, presumably in the
hope of encouraging the low-paid to help themselves by their own efforts.
Such fundamentally different strategies for poverty alleviation raise clearly
the underlying issue of principle: What Is the shape of the tax-transfer
schedule that does most to reduce poverty?
It seems clear that this shape Is unlikely to be a simple one. In particular,
restricting attention to linear tax schedules would instantly rule out of
court much of the interesting area of debate. Thus while in Kanbur and Keen
(1989) the analysis Is restricted to linear schedules - in order to
concentrate on the use of non-income Information - here we take the opposite
approach of assuming individuals to be identical In all but their pre-tax
wage rates (so removing any role for non-income information) whilst allowing
for fully non-linear taxation.
The question being asked here is of course closely related to that addressed
in the literature, Initiated by Mirrlees (1971), on optimal non-linear income
taxation. In this framework, the issue of work Incentives is tackled directly
by modeling Individuals as choosing between work and leisure given the
tax-transfer schedule they face. The government then chooses a schedule which
maximises a social welfare function based on Individuals' welfare, that Is on
the utility they derive from their consumption-leisure bundles. There is,
however, a striking and fundamental dissonance between this 'welfarist'
literature and the tone of the policy debates around, for instance, the
Fowler reforms. For while the welfarist literature takes into account the
values of both net Income and leisure in the individual welfare functions,
the policy discussion focusses almost exclusively on Incomes. It is the
consequences of reform for the incomes of the poor - the money In their
2

pockets, not something akin to money metric measures of their wt.lfare - that
is commonly debated and analysed. Their valuations of u:e associated
consumption-leisure bundle are typically ignored. Even when work Incentives
are discussed explicitly It Is the implications for government revenue and
Individual Incomes that are paramount; little weight Is typically given to
such disutility as the poor experience from working. We do not attempt to
explain why this Is so, tnough that Is an Interesting and Important question
In itself. Rather our purpose is to take the concerns of the policy debate as
given and examine their implications: we seek to investigate, both
qualitatively and quantitatively, the central features of the non-linear tax
schedules that minimise Income-based measures of poverty.
The present analysis is thus squarely in the 'nor.-welfarist' camp. This Is
not to say that the welfarist viewpoint is misplaced. it is simply to suggest
that an alternative which appears more closely related to the normal terms of
practical policy formulation and evaluation merits close analysis. Despite
growing interest in non-welfarist approaches to policy problems, there has
been little discussion of the robustness of welfarist ;esults to the adoption
of non-welfarist perspectives (an exception being Seade (1980)). Thus while
our central aim is to address the policy debate on income-testing our results
can also be seen as contributing to the evaluation of the sensitivity of
qualitative results.. of the traditional literatur.e to variations in one
fundamental premis es.
The plan of the paper is as follows. Section 2 reviews the key qualitative
features of the welfarist literature on optimal non-linear Income taxation.
Section 3 contains our main analytical results, on the pattern of marginal
rates that minimises some measure (within a wide class) of poverty defined on
net incomes (or, equivalently, consumption). This pattern turns out to be
qualitatively verv different from that which emerges from the traditional
welfarist approach. These distinctive results pertain, however, primarily to
a neighbourhood at the lower end of the schedule, so that it Is important to
investigate the quantitative pattern of the schedule over the whole range.
For this numerical simulation is needed. Section 4 presents and discusses
such results. Section 5 concludes, and an Appendix outlines both the
derivation of the main analytical results and the method of the simulations.
3

2. Lessons from the welfarist literature
We assume there to be a continuum of consumers, each having preferences
I .,y) defii.ed over consumption x and hours worked y, with u >O and u <O
(subscripts Indicating partial derivatives). Individuals differ only In the
pre-tax wage n they can earn, which Is distributed across the population with
continuous density f(n) on support ln,n]. Writing gross Income as z *- ny and
defining
s(x,z,n) = -u y(xz/n)/nux(x,z/n) > 0, (2.1)
preferences are taken to s&tisfy the further restriction that
s < 0. (2.2)n
This is Assumption B of Mirrlees (1971) and the Agent Monotonicity assumption
of Seade (1982). It Implies that indifference curves in consumption-gross
Income space become flatter the higher is an individual's wage rate, which in
turn ensures that both consumption and gross ea nings Increase with the wage
rate. Each individual maximises utility by choice of hours worked, solving
max u(x,y) subject to x = ny - T(ny). (2.3)
This gives rise to consumption, gross income and maximised utility denoted
x(n), z(n) and v(n) respectively.
The problem of a welfarist government Is then to
max JW[v(n)]f(n)dn subject to fT[z(n)Jf(n)dn = R (2.4)
where W[.l, which is taken to be concave and increasing, gives the social
valuation of utility and R denotes the revenue requirement. The
self-selection constraint imposed by individuals' optimisation, implicit in
(2.4), is conveniently characterised in terms of the necessary condition for
(MZS), which can be written as
u [1-t(z)] + u /n = 0, (2.5)x y
where t(z) = T' (z) denotes the marginal tax rate at z.
Omittirg details - which are analogous to those given in Appendix A for the
analyils of poverty minimisation in the next section - the first order
conditions for the welfarist problem imply a pattern of marginal rates
4
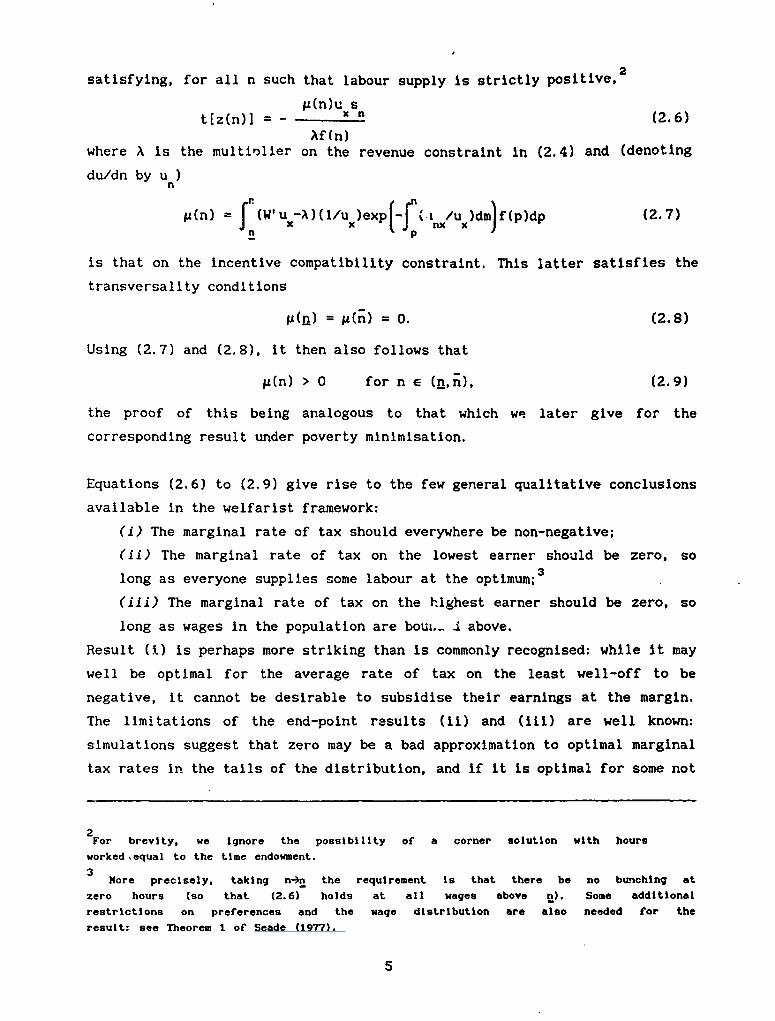
satisfying, for all n such that labour supply Is strictly positive.2
p (n) u st[z(n)] = - - x n (2.6)
Af(n)where X Is the multinlier on the revenue constraint in (2.4) and (denoting
du/dn by u )n
A (n) J (u x W A)(1/ux)exp (-T nx/ux)dm)f(p)dp (2.7)
is that on the Incentive compatibility constraint. This latter satisfies the
transversality conditions
p(n) = M(n) = o. (2.8)
Using (2.7) and (2.8), it then also follows that
g(n) > 0 for n e (_,n), (2.9)
the proof of this being analogous to that which we later give for the
corresponding result under poverty minimisation.
Equations (2.6) to (2.9) give rise to the few general qualitative conclusions
available in the welfarist framework:
(i) The marginal rate of tax should everywhere be non-negative;
(ii) The marginal rate of tax on the lowest earner should be zero, so
long as everyone supplies some labour at the optimum; 3
(iii) The marginal rate of tax on the highest earner should be zero, so
long as wages In the population are boui.. JA above.
Result (1) is perhaps more striking than is commonly recognised: while it may
well be optimal for the average rate of tax on the least well-off to be
negative, it cannot be desirable to subsidise their earnings at the margin.
The limitations of the end-point results (li) and (iii) are well known:
simulations suggest that zero may be a bad approximation to optimal marginal
tax rates in the tails of the distribution, and if It is optimal for some not
2For brevity, we Ignore the possibility of a corner solution with hours
worked equal to the time endowment.
3More precisely, taking n4n the requlrement Is that there be no bunching at
zero hours (so that (2.6) holds at all wages above n). Some additional
restrictions on preferences and the wage distribution are also needed for the
result: see Theorem 1 of Seade (1977).
5

to work then the optimal marginal tax rate at the bottom of the distribution
can be shown to be strictly positive (T..mala (1990)). Nevertheless, these
results continue to colour professional Thinking on Issues of rate structure.
The lower end-point result, In particular, has been taken as suggestive in
arguing against the very high effective rates on the poor In the U.K. (as for
Instance by Kay and King (1986)).
Here then are three substantive implications of the welfarist approach. It Is
natural to ask whether they continue to apply when the objective is not
social welfare maximisation but Income poverty minimisation. Clearly if
income here were to be Interpreted as equivalent income In the sense of King
(1983) then we have money metric utility and the welfarist conclusions will
go through unaltered. But in policy discussions It is the minimisation of
poverty defined on measured income - income actually received - which often
appears to be the objective. The purpose of the next section is to see
whether the welfarist conclusions survive In such a non-welfarist setting.
3.Income poverty minimisation: Theory
Suppose then that the sole aim of policy Is to minimise an Income-based
poverty index of the general additively separable form analysed by Atkinson
(1987):
P = f G[x(n),x*]f(n)dn (3.1)n
where G[. I can be thought of as a generalised poverty gap: non-negative for
x < x*, zero otherwise, and satisfying
G [x,x*]< 0 and G [x,x*] > 0 V x e (O,x*). (3.2)x xx
It is further assumed that
G [x,x*] = 0. (3.3)x
This tspecification precludes a number of widely-used poverty indices,
Including the headcount ratio (which would have very strange Implications In
the present context). Nevertheless, the class of measures Is a broad one.
6

As In the welfarist framework. Individuals solve problem (2.3). The
government faces the same revenue and Incentive compatibility constraints.
The only difference is that It now seeks to minimise poverty P. Denoting by A
and p the multipliers on the two constraints, exactly as before, it Is shown
in the Appendix that the first order conditions imply, again where
labour supply is strictly positive, that
G s gi(n)uxst[z(n)] = x x (n4
A Xf(n)where
g(n) = -| (G +A)(1/ux)exp(-f (unx/nux)dm)f(p)dp (3.5)P
satisfies
p (n) = 1A (n) = 0. (3.6)
g(n) > 0 for n E (n,n). (3.7)
To establish (3.7) note first, from (3.5), that the transversality conditions
(3.6) Imply that G +A changes sign as n Increases. Since G Is strictly convex
(by assumption) and x(n) is increasing in n (as a consequence of the
preference restriction (2.2)), G +A Is strictly Increasing in n. Thus -(G +x)
must change sign only once, and must start off positive. But then if g were
ever to become negative it could not recover to IA(n)=O.
The characterisatinn (3.4) has an appealing Interpretation. Recalling (2.6),
and comparing (3.5) with (2.7), note that the second term in (3.4) is of
precisely the same form as the welfarist tax formula except that W'u , the
social marginal valuation of consumption, is replaced by -G , the marginal
reduction in the generalised poverty gap associated with an Increase in
consumption. Loosely spe;:lng, this term can thus be thought of as
corresponding to a welfarist calculation based on a social valuation of the
form G[v(n),x*]; measuring poverty, that Is, In terms of shortfalls of
utility from some threshold. But our concern is with income poverty, so that
in this sense it is the first term In (3.4) that captures the distinctive
features of the non-welfarist approach. And the direction in which the
concern with income rather than utility points then emerges as unambiguous:
it tends towards lower marginal tax rates on the working poor. The reason Is
straightforward. Consider the local effect of a compensated reduction in the
7

marginal tax rate at some point In the, schedule. This will lead to an
Increase in the gross Incomes of those located at that point, associated with
which wlll be an Increase in their net Incomes of -u /nu = s. From they x
welfarist perspectlve, these consequences fcr Individual behaviour are a
matter of Indifference, since only utility matters and that is unchanged. In
terms of the present non-welfaristic perspective, hcwever, the higher net
income Induced by this lowering of tht marginal tax rate is desirable In
Itself: it reduces the generallsed poverty gap by the amount G s appearing In
the first term of (3.4).
Do the three central welfarist results continue to apply? Result (111)
clearly does. Using Lun) = 0 In (3.4) and noting that G [x(n),xt] = 0 (so
long as the highest earner Is not poor), it follows that t[z(n)) = 0: the
marginal rate at the top of a bounded distribution should again be zero. This
Is as one would expect. For In the context of poverty alleviation the only
reason to care about the highest earner - Indeed about any of the non-poor -
is as a source of revenue, and It is well known that in these circumstances
one would want a zero marginal rate at the top: If It were strictly positive,
additional revenue couild be extracted by slightly lowering it and thereby
inducing the highest earner to earn additional taxed income.
Results (1) and (Ii), in contrast, are overturned. Taking limits In (3.4)
thereby assuming that it is optimal for all to work - and using the first
part of (3.6) one finds
t(n) = G Ix(n),x*]s[x(L),z(n),n]/A < 0 (3.8)
by the first condition in (3.2) (and assuming too that poverty Is not
entirely eliminated). In these circumstances the marginal rate at the bottom
of the gross income distribution should be strictly negative: if it is
optimal to have everybody work, poverty alleviation calls for a marginal
subsidy on the earnings of the very poorest. Indeed the conclusion to be
drawn here is of a rather - re general kind than the welfarist lower
end-point result (ii) above: whereas the latter applieL. only at the lower
extreme of the distribution, a set of measure zero, (3.8) Implies - given
continuity - that there exists an Interval over which a negative marginal
rate is appropriate.
8

The rationale for this result can be seen ±com Figure 1. Suppose that the
initial postiorn is one In whl-h the marginal tax rate on the very pooresthousehold Is Indeed strictly negative. This initial equilibrium is shown as
point a, an indifference curve of an n-household being tangential to thesegment AA of the budget constraint implied by thxe tax system In force. (For
clarity, but inessentially, budget constraints are drawn as If they werelinear in the relevant range). The assumption of a negative marginal r a
FIJWREI A BC
Gross irncornc ()implies that the slope of AA exceeds that of CC, which is the 4S line
through a. Consider now a tax reform that Increases the marginal rate at Xwhilst retaining a itself as a feasible point; diagramatically, the budgetconstraint rotates clockwise about a to arrive at BB. Though not shown, onecan imagine that the tax function Is simultaneously amended further up the
distribution so as to leave all other households unaffected. Is this reformdesirable? From the perspective of social welfare maximisation It certainlyIs, there then being two effects pointing In the same direction. The first is
that this poorest hausehold now attains a higher utility level, moving to apoint like 1. The second Is that tax revenue Increases: since 3 lies below CC
9

net income falls by more than gross. From the perspective of poverty
alleviation, however, judgement must be suspended. For while the increase in
revenue Is still to be welcomed It Is then Income that matters, not utility;
and the labour supply response to this reform has the effect of reducing the
poorest h, sehold's nat Income, so deepening Its measured poverty. It Is the
need to balance considerations of this kind that gives rise - when it is
optimal to induce all to work - to negative margii,al rates on the lowest
earners.
What though If it Is optimal for the poorest Individuals to be Idle? There
are then two cases to consider. The first is that in which n > 0, so that
everyone Is capable of earning at least some small income. It can then be
opt'mal for some not to work only if the marginal rate is non-positive at the
bottom of the distribution. For suppose, to the contrary, that the marginal
fate at the bottom Is strictly positive and that the poorest Individuals work
zero hours. Let z' be some level of gross income that lies within the range
over which the marginal rate is strictly positive and which is also less than
nL, where L denotes the time endowment. Now consider a reform which leaves
the tax schedule at and above z' unchanged while lmposing an average rate of
100% below z'. Those who had previously earned less than z', including In
particular the idle, will now choose to earn exactly z'; all others will be
unaffected. The consumption associated with z' can be no less than that
previously associated witn lower gross incomes, otherwise those initially at
z' would have chosen to work fewer hours. Therefore poverty cannot be
increased by this reform. Strict positivity of the marginal rate up to z'
implies, moreover, that the labour supply effects of the reform lead to
higher tax revenue. And with this Increased revenue it will generally be
possible to bring about a strict reduction In poverty. Thus the initial
schedule cannot be optimal. The second and less clear-cut case is that In
which n = 0. The preceding argument then falls, since for any strictly
positive level of gross Income there will be a measurable set of individuals
unable to earn that income even by working all of their time endowment. Tax
reforms of the kind just described, intended to induce those who can earn
some income to do so and thereby reduce the revenue cost of their support,
will inescapably reduce the consumption of the very poorest and to that
extent worsen poverty. The desirability of such a reform. then becomes
10

unclear, being liable to depend, for instance, on the form of the poverty
Index. We have been unable to find any general results on the sign of the
optimal marginal rate at the bottom of the distribution when n = 0.
The possibility of optimally negative marginal tax rates is certainly
conflned, however, to the poorest of the poor. At the poverty line wage n,
deflned by x(n*) = x*, one finds (from (3.3),(3.4) and (3.7)) that
t(n*) > 0. (3.9)
Thus, invoking continuity once more, there exists some wage strictly below
that required to escape poverty such that all those with higher wages -
whether poor or not - face a positive marginal tax rate.
The results of this section thus point towards a pattern of marginal tax
rates below the poverty line that is both complex and potentially of a kind
very different from that to which the welfarist tradition has pointed. But
there remain the questions of how far the considerations that point to low or
even negative marginal tax rates on the very poorest individuals extend Into
the range of incomes, and of how the poverty-minimising rate structure Is
affected by the precise location of the poverty line x and by the form of
the poverty gap measure G[.]. These Issues can be addressed only by numerical
simi'lation, a task to which we now turn.
4. Numerical simulations
Recognising both the difficulties of obtaining closed form solutions for
optimal non-linear taxes and the potential limitations of end-point results,
the welfarist literature has developed a tradition of numerical simulation (a
tradition reviewed In Tuormala (1990)). The original Mirrlees simulations, and
many others since, have been carried out for the benchmark case of
Cobb-Douglas preferences
I u = ln(x) + ln(1-y) (4.1)
(the time endowment being normallsed at unity) and under the assumption that
n Is distributed lognormally, with the mean of ln(n) being -1 and Its
11

standard deviation 0.39. We retain these basic specifications. The revenue
requirement R will be taken to be 10% of gross Income, again a conventional
figure (intended as a very rough approximation to the levels of expenditure
on public goods commonly observed). The essential novelty is the form of the
objective function. For this we take a poverty index of the form developed by
Foster, Greer and Thorbecke (1984):
n=| (x(n) , xj f(n)dn, X> 1. (4.2)
This has been widely used in the analytical literature on targeting (as for
Instance in Besley (1990) and Kanbur and Keen (1989)), the parameter a
providing a convenient parameterisation of alternative degrees of poverty
aversion.
One implication of this specification should be noted. With Cobb-Douglas
preferences (so that the marginal rate of substitution between consumption
and work is strictly positive at zero hours) and a lognormal wage
distribution (so that n = 0), there are some who will work only If the
marginal tax rate at the bottom of the distribution Is Infinitely negative.
In both the welfarist context and that of poverty minimisation one would then
expect it to be optimal to have some of the population Idle. In the welfarist
case, the optimal marginal rate at the bottom must then be.strictly positive.
As discussed in the preceding section, however, when the objective Is to
minimise income poverty and n = 0 the sign of the optimal marginal rate at
the lower end-point is in general ambiguous. The simulations can thus provide
some indication of the extent to which the argument for non-positive marginal
rates at the lower end when n > 0 continues to exert some force when Instead
the wage distribution Is not bounded away from zero.
Simulation results are reported in Table 1 below, which gives optimal average
and marginal tax rates at various percentiles of the wage distribution,
starting with the marginal tax rate at the bottom and Including the point at
which the assumed poverty line is to be found. Panels (a)-(c) all take a=2,
and differ in taking successively higher poverty lines. Panel (d) looks at
12

Table 1. Simulation results
Panel (a): F(nl)=0.31, a=2, X/Z=0.9
F(n) ATR(%) MTR(%)
0.06 -100 69
x 0.31 -3 62
0.50 12 53
0.90 29 35
0.99 29 23
F(n0) = 0.06, x(n 0 = 0.06.
Panel (b): F(n*)=0.43, a=2, X/Z =0.9
F(n) ATR(%) MTR(%)
0.02 -100 63
x 0.43 0 54
0.50 9 53
0.90 27 34
0.99 27 17
(nO) = 0.02, x(no) = 0.06.
Panel (c): F(n*)=0.56, o=2, X/Z=0.9
F(n) ATR(%) MTR()
0.003 -87 56
0.50 8 54
x 0.56 16 48
0.90 26 34
0.99 26 17
F(nM) = 0.003, x(n ) = 0.06
13

Panel (d): Maximin (a=c), X/Z=O.9
F(n) ATR(%) MTR(%)
0.16 -100 73
0.50 17 S3
0.90 32 35
0.99 32 26
F(n ) = 0.16, x(n ) = 0.07
Notes: (a) n denotes the wage below which individuals choose not to work.0
(b) X/Z denotes the ratio of aggregate consumption to aggregate
output.(c) ATR (HTR) denotes the average (marginal) tax rate.
the maximin case, 4 which corresponds to =o.
Several features of these results are noteworthy. First, and as anticipated,
it is always optimal to have some of the poorest Individuals idle. Second,
the marginal rate on the lowest gross income - which, as just noted, is
ambiguous in sign when n = 0 - emerges as very strongly positive: not only is
it not negative, it is not even low. Third, marginal tax rates decline
monotonically from the poorest to the richest individuals. This is in marked
contrast to the welfarist tradition, in which the pattern of optimal marginal
rates typically has a mild inverse-U shape. Indeed it Is notable that the
poverty-minimising schedules - unlike those of Mirrlees (1971)- could not be
described as approximately linear. This confirms our earlier remarks on the
importance of relaxing non-linearity, and, moreover, tends to weaken the
common argument that - given its administrative advantages - the social loss
through restricting oneself to linear Income taxes Is likely to be small.
Fourth, comparing panels (a) to (c), increases in the poverty line lead to a
4Since the poorest Individuals do not work at the optimum for either the
welfarist or poverty minimisation problems, 'maximin' here refers
simultaneously to both Income and utility.
14

reduction In optimal marginal rates at and below the poverty line.
Intuitively, the explanation for this appears to be that the case for low
marginai rates in order to encourage those at or near the poverty line to
move over It becomes stronger as the poverty line moves Into denser parts of
the distribution. Flfth, comparing panel (d) with the rest, Increases In the
extent of aversion to Inequality tend to Increase marginal rates on the poor.
This Is perhaps as would be expected, since the greater one's concern with
poverty alleviation the more attractive schemes approaching minimum Income
guarantees are likely to be.
But perhaps the most Important feature of the results Is the finding of
marginal tax rates on the poor that are invariably rather high (bearing in
mind the fairly minimal revenue requirement). In most cases marginal rates on
the bulk of the poor exceed 60%, and In all cases they exceed 50%. These
rates are somewhat lower than those (of around 80 to 90%) found by Garfinkel,
Moreland and Sadka (1982) for the welfarist case. To that extent the informal
argument following equation (3.4) that the non-welfarist perspective is
likely to point towards somewhat lower marginal rates on the working poor Is
borne out. Nevertheless, the case for low marginal tax rates falls to leave
as discernible a trace in the simulations as one might have expected. Even
with the relatively elastic labour supply responses Implicit In Cobb-Douglas
preferences, a stronger mark Is left by the case for high marginal rates
associated with the unattainable ideal of perfect targeting described at the
outset.
5. Conclusion
The central thrust of the present non-welfarist analysis is to strengthen the
case for lower marginal tax rates on the poor. But not by much. This
alternative perspective has been shown to overturn the lower end-point result
of the traditional literature: when everybody works at the optimum, the
minimisation of income poverty requires that the lowest earner face a
strictly negative marginal tax rate and, by continuity, that the marginal
rates on the not-quite-so-poor also be negative. However, we have also seen
that the optinal marginal tax rate at the poverty line Is strictly positive.
15

Putting these two observations together points to a potentially complex rate
structure, the shape of which can only be fleshed out by numerical methods.
These suggest optimal marginal rates on the poor that are only a little lower
than is typical In a welfarist framework. But while the rates we calculate -
unlike those we observe - are nowhere near 100%, they are not close to zero
elther. Taking conventional functional forms and parameter values, the Income
poverty minimising marginal tax rates on the poor are In the order of 60-70%.
16

APPENDIX
A. Derivation of (3.4) and (3.5)
Substituting for x from the budget constraint, differentiation of
u(x(n),y(n)] with respect to n gives
du/dn = u (1-t)y + {u (1-t)n + u }dy/dn. (A.1)
Using the first order condition (2.3), Individual optimisation thus implies
the envelope condition
du/dn = -yu /n a u (x,y,n). (A.2)
To simplify the optimisation, we take u and y to be the objects of choice.
Inverting direct utility then gives x = h(u,y), where
h = -u /u, h = 1/u. (A.3)y y x u x
Defining too g(u,y,n) = u [h(u,y),y,n], it is straightforward to check thatn
gv= -nu s , g = u/u. (A.4)
The optimum is then characterised by a pair of functions u(n) and y(n) which
minimise the poverty index subject to the Incentive compatibilty condition
du/dn = g and the overall resource constraint. Introducing multipliers X and
p(n) for these constraints and integrating by parts, the Lagrangean becomes
L = n (t-G(x,x*) + ACny - x)]f(n) - ,'u - pg) dn
+ (tn)u(n) - W(n)u(n). (A.5)
Differentiating with respect to u and y gives the first order conditions:
L = -lG + M]h f(n) - g' - (g±(n)u /u ) = 0 (A.6)
L = [-G h + X(n-h )]f(n) + g(n)nu s = 0. (A.7)y X y y x n
Dividing (A.7) by Af and rearranging, one finds
i - (h /n) = (G h /Xn) - (puxs /Af). (A.8)y x y xIn
Using (2.3) and the first part of (A.3), (A.8) becomes (3.4). Solving (A.6),
using' (3.6), gives (3.5).
17

B. Outline of the computation method
For an additively separable utility function, as in (4.1), u = 0 and so
(A.6) becomes
-[G + A]f(n)/ux - A' (B.1)x
Using (A.9), the solution of (B.1) is
np(n) = - (Gx+A)(l/ux)f(p)dp. (B.2)
Equation (A.7) is now
[-G h + A(n-h )lf(n) + #A(n)(u +yu )/n = 0 (B.3)x y y Y yY
which can be written as
n 2rf(n) - | lG + AM(/Au =f(p)dp = (B.4)n
where r = [(G u /Anu )+ 1 +(u /nu )]/(u + yu ). Differentiating (B.4) gives
the differential equation
-r[2 + (nf'/f)]/n + [G /Au ) + (1/u )]'n ; x < xdr/dn = x x x (B.5)
-r[2 + (nf'/f)]/n + 1/u n2 ; x > x*.x
The formulae (B.5) and (A.2) form a pair of non-linear differential equations
in u and r. They provide the solution to our problem, together with the
conditions (2.5) and ji(n) = 0 (rn2f 4 0 as n 4 ).
A fourth order Runge-Kutta method is used to solve the non-linear
differential equation system (B.5) and (A.2). Instead of solving for A, a
value is assumed for it. It can be shown that there is a critical n0 such
that
y(n) = 0 for n s no (B.6)
y(n) > 0 for n > n .
Trial and error is used to find a value of no which enables us to sa.isfy the
condition y(n ) = 0. From (B.4) we can solve x(n ) using the Newton method.When A is given and x(n ) is solved, the Integration of (B.5) and (A.2) canbe started. When u 1+ and r1 1 are obtained (i referring to an iteration
cycle), the new values for y and x are calculated from (B.5) and the utility
function by using the Newton method.
18

References
Atkinson, A.B. (1987). 'On the measurpment of poverty', Econometrica 55.749-764.
Besley, T. (1990). 'Means testing versus iuniversal provision in povertyalleviation programmes', Economica 57, 119-129.
Besley, T. and R. Kanbur (1988). 'Food subsidies and poverty alleviation',Economic Journal 92, 701-719.
Dilnot, A. and G. Stark (1989). 'The pcverty trap, tax cuts and the reform ofsocial security'. In Dilnot and Walker (1989).
Dilnot, A., and I. Walker (eds) (1989). The Economics of Social Security(Clarendon Press, Oxford).
Foster, J., J. Greer and E. Thorbecke (1984). 'A class of decomposablepoverty measures', Econometrica 52, 761-766.
Garfinkel, I., K. Moreland and E. Sadka (1982). 'Income testing and socialwelfare: An optimal tax-transfer model'. In I. Garfinkel (ed) IncomeTested Transfer Programs: The Case For and Against (Academic Press, NewYork).
Kanbur, R. and M.J. Keen (1989). 'Poverty, Incentives and linear incometaxation'. In Dilnot and Walker (1989).
Kay, J.A. and M.A. King (1986). The British Tax System, 4th edition (OxfordUniversity Press, Oxford).
King, M.A. (1983). 'Welfare analysis of tax reforms using household data',Jour al of Public Economics 21, 183-215.
Mirrlees, J.A. (1971). 'An exploration In the theory of optimum Incometaxation'. Review of Economic Studies 38, 175-208.
Seade, J. (1977). 'On the shape of optimal tax schedules'.Journal of Public Economics 7, 203-235.
Seade, J. (1980). 'Optimal non-linear policies for non-utilitarian motives'.In Collard, Lecomber and Sle.ter (eds) Income Distribution:The Limits to Redistribution (John Wright and Sons, Bristol).
Seade, J. (1982). 'On the sign of the optimum marginal Income tax'.Review of Economic Studies 49, 637-643.
Tuomala, M. (1990). Optimal Income Tax and Redistribution (Clarendon Press,
Oxford).
19

PRE Working Paper Series
Contact~Autho XL for 12paer
WPS596 The Mexican Sugar Industry: Brent Borrell February 1991 P. KokilaProblems and Prospects 33716
WPS597 Rent Sharing in the Multi-Fibre Refik Erzan February 1991 G. llogonArrangement: Theory and Evidence Kala Krishna 33732from U.S. Apparel Imports from Ling Hui TanHong Kong
WPS598 Africa Region Population Projections: Patience W. Stephens February 199i 0. Nadora1990-91 Edition Eduard Bos 31091
My T. VuRodolfo A. Bulatao
WPS599 Asia Region Population Projections: Eduard Bos February 1991 0. Nadora1990-91 Edition Patience W. Stephens 31091
My T. VuRodolfo A. Bulatao
WPS600 Latin America and the Caribbean My T. Vu February 1991 0. NadoraRegion Population Projections: Eduard Bos 310911990-91 Edition Patience W. Stephens
Rodolfo A. Bulatao
WPS601 Europe, Middle East, and North Eduard Bos February 1991 0. NadoraAfrica Region Population Projections: Patience W. Stephens 310911990-91 Edition My T. Vu
Rodolfo A. Bulatao
WPS602 Firm Output Adjustment to Trade Mark A. Dutz February 1991 S. FallonLiberalization: Theory with 38009Application to the MoroccanExperience
WPS603 The Role of Officially Supported Asli DemirgUc,-Kunt February 1991 G. IlogonExport Cr,dits in Sub-Saharan Refik Erzan 33732Africa's External Financing
WPS604 Foreign Trade and Its Relation to Faezeh Foroutan February 1991 S. FallonCompetition and Productivity in 37942Turkish Industry
WPS605 Overview of Contractual Savings Dimitri Vittas March 1991 W. Pitayato-Savings Institutions Michael Skully nakarn
37666
WPS606 Adjustment Policies and Investment Luis Serven March 1991 E. KhinePerformance in Developing Andres Solimano 39361Countries: Theory, Country Experiences,and Policy Implications

PRE Working Pager S'Iel
ContactAuIbQI for paper
WPS607 Abolishing Green Rates: The Effects Donald F. Larson March 1991 D. Gustafsonon Cereals, Sugar, and Oilseeds Simon Glance 33714in West Germany Brent Borrell
Merl.nda IngcoJonathan Coleman
WPS608 Cross-Country Studies of Growth Ross Levine March 1991 CECMGand Policy: Methodological, David Renelt 39175Conceptual, and Statisti-al Problems
WPS609 A Sensitivity Analysis of Cross- Ross Levine March 1991 CECMGCountry Growth Regr^ssions David Renelt 39175
WPS610 Can Preshipment Inspection Offset Alexander J. Yeats March 1391 J. JacobsonNoncompetitive Pricing of Developing 33710Countries' Imports? The Evidencefrom Madagascar
WPS611 Tariff-based Commodity Price Jonathan R. Coleman March 1991 S. LipscombStabilization Schemes in Venezuela Dunald F. Larson 33718
WPS612 Education and Productivity in Lawrence J. Lau March 1991 WDR OfficeDeveloping Countries: An Aggregate Dean T. Jamison 31393Production Function Approach Frederic F. Louat
WPS613 Price-Wage Dynamics and the Simon Commander March 1991 0. Del CidTransmission of Inflation in Socialist Fabrizio Coricelli 39050Economies: Empirical Models forHungary and Poland
WPS614 Accountability in Public Services: Samuel Paul March 1991 E. MadronaExit, Voice, and Capture 37496
WPS615 Socialist Economic Growth and Heng-fu Zou March 1991 A. BhallaPolitical Investment Cycles 37699
WPS616 Optimal Nonlinear Income Taxation Ravi Kanbur March 1991 J. Sweeneyfor the Alleviation of Poverty Michael Keen 31021
Matti Tuomala
WPS617 International Poverty Projections Sudhir Anand March 1991 J. SweeneyRavi Kanbur 31021
WPS618 Poverty and Development: The Ravi Kanbur March 1991 J. SweeneyHuman Development Report and the 31021World Development Report, 1990