Taxation and Gender Equity - cawtar
348
-
Upload
khangminh22 -
Category
Documents
-
view
1 -
download
0
Transcript of Taxation and Gender Equity - cawtar

Researchers, activists and analysts concerned about gender equity have not paidsufficient attention to the taxation system and the manner in which taxes and taxpolicies may impact on the gendered nature of economic and social life.Similarly, tax analysts and policymakers have not paid attention to how tax poli-cies and tax reforms may interact with gendered social norms. Yet, around theworld, there are concerns that tax systems are biased against women, and thatcontemporary tax reforms may increase the incidence of taxation on the poorestwomen while failing to generate enough revenue to fund the programmes neededto improve these women’s lives.
Drawing on a three-year eight-country study Taxation and Gender Equity out-lines why gender equity advocates need to interrogate the revenue side of publicfinances, and why tax analysts and policymakers should carefully consider thegender impacts of tax policies and tax reforms. This book develops a conceptualframework and methodology for examining and evaluating the impacts of directand indirect taxation on different types of households, based on sex compositionand employment status; presents the results of the in-country and cross-countryresearch; and suggests a set of principles and guidelines for gender-equityenhancing tax policies and tax reforms in developing and developed countries.
This is the first book to systematically examine gender and taxation within andacross countries at different levels of development. It presents original researchon the gender equity dimensions of personal income taxes, value-added taxes,excise taxes, and fuel taxes in Argentina, Ghana, India, Mexico, Morocco, SouthAfrica, Uganda and the United Kingdom. This book will be of interest to tax ana-lysts and policymakers, gender analysts and activists, and postgraduate studentsand researchers studying Public Finance, International Economics, DevelopmentStudies, Gender Studies, and International Relations, among other disciplines.
Caren Grown is Economist-In-Residence at American University, WashingtonDC, USA.
Imraan Valodia is Associate Professor in the School of Development Studies atthe University of KwaZulu-Natal, Durban, South Africa.
Taxation and Gender Equity

‘This book shows that taxation is often not neutral between the genders when itshould be, and is sometimes neutral when it should not be. Taking the perspec-tive of horizontal and vertical equity, its case studies illuminate how tax systemsand tax reforms can be inequitable across genders, and much of the time becausethe gendered structure of economy and society is not an integral part of the taxdesign debate. The book represents an important contribution to that debate, andwill be very useful to researchers and practitioners, particularly in developingcountries.’
—Ravi Kanbur, Cornell University, USA
‘As the pendulum swings once again towards greater state economic involvementand therefore an increased need for state resources, there is an urgent need tounderstand whether tax systems are biased against women and if they could bereinforcing gender inequalities. This groundbreaking volume examines thegender dimensions of tax systems in seven developing and one developed countryand is the first systematic treatment of its kind. The conceptual framework that itposes should be part of the toolkit of policy professionals, donor staff, and genderspecialists in years to come.’
—Manuel F. Montes, Development Policy and Analysis Division,UNDESA, USA
‘Equity issues are again attracting attention from academics and policy analystsconcerned with taxation. This book makes a substantial contribution to this newawareness by emphasizing the important role that gender, like other social strati-fications such as race and income, often plays in determining the impact of taxa-tion on well-being. The editors have done a fine job not only in setting out thequestions considered in the volume clearly and in context but also by establish-ing a uniform methodological approach that has been followed in the countrypapers, thus allowing them to present the results in a comparable and compre-hensible form. In turn, the case studies of mainly developing countries are richin detail and make it clear that those concerned with the extent to which taxationperpetuates or alters distributional outcomes in any country need to pay closeattention to how taxes on consumption are structured and administered as well asto such more traditional gender-related income tax issues as the treatment ofhousehold income. This book should be on the shelf of anyone concerned witheither tax policy or gender issues in both developing and developed countries.’
—Richard Bird, University of Toronto, Canada

1 Private Banking in EuropeLynn Bicker
2 Bank Deregulation and MonetaryOrderGeorge Selgin
3 Money in IslamA study in Islamic political economyMasudul Alam Choudhury
4 The Future of European FinancialCentresKirsten Bindemann
5 Payment Systems in GlobalPerspectiveMaxwell J. Fry, Isaak Kilato, SandraRoger, Krzysztof Senderowicz, DavidSheppard, Francisco Solis and JohnTrundle
6 What is Money?John Smithin
7 FinanceA characteristics approachEdited by David Blake
8 Organisational Change and RetailFinanceAn ethnographic perspectiveRichard Harper, Dave Randall andMark Rouncefield
9 The History of the BundesbankLessons for the European CentralBankJakob de Haan
10 The EuroA challenge and opportunity forfinancial marketsPublished on behalf of the SociétéUniversitaire Européenne deRecherches Financières (SUERF)Edited by Michael Artis, Axel Weberand Elizabeth Hennessy
11 Central Banking in Eastern EuropeEdited by Nigel Healey and BarryHarrison
12 Money, Credit and Prices StabilityPaul Dalziel
13 Monetary Policy, Capital Flows andExchange RatesEssays in memory of Maxwell FryEdited by William Allen and DavidDickinson
14 Adapting to Financial GlobalisationPublished on behalf of the SociétéUniversitaire Européenne deRecherches Financières (SUERF)Edited by Morten Balling, Eduard H.Hochreiter and Elizabeth Hennessy
15 Monetary MacroeconomicsA new approachAlvaro Cencini
16 Monetary Stability in EuropeStefan Collignon
17 Technology and FinanceChallenges for financial markets,business strategies and policy makersPublished on behalf of the SociétéUniversitaire Européenne deRecherches Financières (SUERF)Edited by Morten Balling, FrankLierman and Andrew Mullineux
18 Monetary UnionsTheory, history, public choiceEdited by Forrest H. Capie andGeoffrey E. Wood
19 HRM and Occupational Health andSafetyCarol Boyd
Routledge International Studies in Money and Banking

20 Central Banking SystemsComparedThe ECB, the pre-Euro Bundesbankand the Federal Reserve systemEmmanuel Apel
21 A History of Monetary UnionsJohn Chown
22 DollarizationLessons from Europe and theAmericasEdited by Louis-Philippe Rochon andMario Seccareccia
23 Islamic Economics and FinanceA glossary, 2nd EditionMuhammad Akram Khan
24 Financial Market RiskMeasurement and analysisCornelis A. Los
25 Financial GeographyA banker’s viewRisto Laulajainen
26 Money DoctorsThe experience of internationalfinancial advising, 1850–2000Edited by Marc Flandreau
27 Exchange Rate DynamicsA new open economymacroeconomics perspectiveEdited by Jean-Oliver Hairault andThepthida Sopraseuth
28 Fixing Financial Crises in the 21stCenturyEdited by Andrew G. Haldane
29 Monetary Policy andUnemploymentThe U.S., Euro-area and JapanEdited by Willi Semmler
30 Exchange Rates, Capital Flows andPolicyEdited by Peter Sinclair, RebeccaDriver and Christoph Thoenissen
31 Great Architects of InternationalFinanceThe Bretton Woods eraAnthony M. Endres
32 The Means to ProsperityFiscal policy reconsideredEdited by Per Gunnar Berglund andMatias Vernengo
33 Competition and Profitability inEuropean Financial ServicesStrategic, systemic and policy issuesEdited by Morten Balling, FrankLierman and Andy Mullineux
34 Tax Systems and Tax Reforms inSouth and East AsiaEdited by Luigi Bernardi, AngelaFraschini and Parthasarathi Shome
35 Institutional Change in thePayments System and MonetaryPolicyEdited by Stefan W. Schmitz andGeoffrey E. Wood
36 The Lender of Last ResortEdited by F.H. Capie and G.E. Wood
37 The Structure of FinancialRegulationEdited by David G. Mayes andGeoffrey E. Wood
38 Monetary Policy in Central EuropeMiroslav Beblavý
39 Money and Payments in Theoryand PracticeSergio Rossi
40 Open Market Operations andFinancial MarketsEdited by David G. Mayes and JanToporowski
41 Banking in Central and EasternEurope, 1980–2006Stephan Barisitz

42 Debt, Risk and Liquidity in FuturesMarketsEdited by Barry A. Goss
43 The Future of Payment SystemsEdited by Stephen Millard, Andrew G.Haldane and Victoria Saporta
44 Credit and CollateralVania Sena
45 Tax Systems and Tax Reforms inLatin AmericaEdited by Luigi Bernardi, AlbertoBarreix, Anna Marenzi and PaolaProfeta
46 The Dynamics of OrganizationalCollapseThe case of Barings BankHelga Drummond
47 International Financial Co-operationPolitical economics of compliancewith the 1988 Basel AccordBryce Quillin
48 Bank PerformanceA theoretical and empiricalframework for the analysis ofprofitability, competition andefficiencyJacob Bikker and Jaap W.B. Bos
49 Monetary Growth TheoryMoney, interest, prices, capital,knowledge and economic structureover time and spaceWei-Bin Zhang
50 Money, Uncertainty and TimeGiuseppe Fontana
51 Central Banking, Asset Prices andFinancial FragilityÉric Tymoigne
52 Financial Markets and theMacroeconomyWilli Semmler, Peter Flaschel, CarlChiarella and Reiner Franke
53 Inflation Theory in EconomicsWelfare, velocity, growth andbusiness cyclesMax Gillman
54 Monetary Policy over Fifty YearsHeinz Herrman (DeutscheBundesbank)
55 Designing Central BanksDavid Mayes and Geoffrey Wood
56 Inflation ExpectationsPeter J.N. Sinclair
57 The New International MonetarySystemEssays in honour of AlexanderSwobodaEdited by Charles Wyplosz
58 Taxation and Gender EquityA comparative analysis of direct andindirect taxes in developing anddeveloped countriesEdited by Caren Grown and ImraanValodia

This page intentionally left blank

Taxation and GenderEquityA comparative analysis of direct andindirect taxes in developingand developed countries
Edited byCaren Grown and Imraan Valodia
International Development Research CentreOttawa • Cairo • Dakar • Montevideo • Nairobi • New Delhi • Singapore

First published 2010by Routledge2 Park Square, Milton Park, Abingdon, Oxon, OX14 4RN
Simultaneously published in the USA and Canadaby Routledge270 Madison Avenue, New York, NY 10016
Routledge is an imprint of the Taylor & Francis Group, an informabusiness
Published in association with theInternational Development Research CentrePO Box 8500, Ottawa, ON K1G 3H9, Canadawww.idrc.ca / [email protected] 978–1–55250–469–7 (ebook)
© 2010 selection and editorial matter; Caren Grown and Imraan Valodia,individual chapters; the contributors
Typeset in Times New Roman byBook Now Ltd, LondonPrinted and bound in Great Britain byCPI Antony Rowe, Chippenham, Wiltshire
All rights reserved. No part of this book may be reprinted or reproducedor utilised in any form or by any electronic, mechanical, or other means,now known or hereafter invented, including photocopying and recording,or in any information storage or retrieval system, without permission inwriting from the publishers.
British Library Cataloguing in Publication DataA catalogue record for this book is available from the British Library
Library of Congress Cataloging in Publication DataTaxation and gender equity: a comparative analysis of direct and indirecttaxes in developing and developed countries/edited by Caren Grown andImraan Valodia.
p.cmInlcudes bibliographical references and index.1. Taxation—Developing countires. 2. Taxation—Developed countreis. 3.Fiscal policy—Developing countires 4. Fiscal policy—Developedcountires 5. Women—Government policy—Developing countires 6.Women—Government policy—Developed countires I. Grown, Caren II.Valodia, Imraan.HJ2351.7.T385 2010336.2009172'4—dc22 2009043115
ISBN10: 0–415–56822–6 (pbk)
ISBN13: 978–0–415–56822–7 (pbk)

Contents
List of figures xiList of tables xvNotes on contributors xixAcknowledgements xxiiiList of abbreviations xxvii
1 Taxation and gender equality: A conceptual framework 1CAREN GROWN
2 Methodology and comparative analysis 23CAREN GROWN AND HITOMI KOMATSU
3 Gender equality and taxation in Argentina 64CORINA RODRÍGUEZ ENRÍQUEZ, NATALIA GHERARDI
AND DARÍO ROSSIGNOLO
4 Gender equality and taxation in India: An unequal burden? 94PINAKI CHAKRABORTY, LEKHA CHAKRABORTY,
KRISHANU KARMAKAR AND SHASHI M. KAPILA
5 Gender analysis of taxation in Mexico 119LUCÍA C. PÉREZ FRAGOSO AND FRANCISCO COTA GONZÁLEZ
6 An investigation into the gender dimensions of taxationin Ghana 151ERNEST ARYEETEY, ISAAC OSEI-AKOTO, ABENA D. ODURO
AND ROBERT DARKO OSEI
7 Gender equality and taxation in Morocco 179AHMED EL BOUAZZAOUI, ABDESSALAM FAZOUANE,
HIND JALAL AND SALAMA SAIDI
8 Gender equality and taxation in South Africa 206DEBBIE BUDLENDER, DANIELA CASALE AND IMRAAN VALODIA

9 Gender equality and taxation in Uganda 233SARAH SSEWANYANA, LAWRENCE BATEGEKA,
MADINA GULOBA AND JULIUS KIIZA
10 Gender equality and taxation: A UK case study 261JÉRÔME DE HENAU, SUSAN HIMMELWEIT AND CRISTINA SANTOS
11 Conclusion and policy recommendations 299IMRAAN VALODIA
Index 314
x Contents

Figures
3.1 Argentina: Gross tax burden, 1991–2007 663.2 Argentina: Composition of tax revenue as percentage of
total revenue 673.3 Argentina: Total tax incidence by quintile and household type 773.4 Argentina: VAT incidence by quintile and household type 783.5 Argentina: Excise incidence by quintile and household type 793.6 Argentina: Fuel tax incidence by quintile and household type 803.7 Argentina: Basic food basket incidence by quintile and 81
household type3.8 Argentina: VAT zero rate on food simulation – total incidence –
by quintile and household type 843.9 Argentina: Combined policy simulation – total incidence – by
quintile and household type 874.1 India: Indian labour force by sex: rural and urban differences 954.2 India: Tax to GDP ratio, 1950–51 to 2006–07 994.3 India: Structure of taxes, 1990–91 1004.4 India: Structure of taxes, 2006–07 1004.5 West Bengal: The structure of tax revenues, 2005–06 1054.6 West Bengal: Total VAT incidence, across household type 1134.7 West Bengal: Total tax incidence, across household type 1144.8 West Bengal: Total excise tax incidence, across household type 1144.9 West Bengal: Food tax incidence, across household type 1155.1 Mexico: Incidence on expenditure: total indirect tax incidence by
household type 1325.2 Mexico: Incidence on expenditure: total indirect tax incidence by
household type and location 1325.3 Mexico: Incidence on expenditure: total indirect tax incidence by
occupational status and quintile 1335.4 Mexico: Incidence on income: total indirect tax incidence by
household type 135

5.5 Mexico: Incidence on income: total indirect taxes by household type and location 136
5.6 Mexico: Incidence on income: total indirect taxes by incomegeneration, number of dependants and quintile 137
5.7 Mexico: Simulations: tax incidence on expenditure 1445.8 Mexico: Simulations: tax incidence on expenditure by quintile 1455.9 Mexico: Simulations: tax incidence on income 147
5.10 Mexico: Simulations: tax incidence on income by quintile 1486.1 Ghana: Composition of central government revenue 1536.2 Ghana: Incidence of indirect tax on fuel for transport by
household type and expenditure quintile 1716.3 Ghana: Incidence of indirect tax on household fuel by
household type and expenditure quintile 1716.4 Ghana: Incidence of indirect tax on clothing and footwear by
household type and expenditure quintile 1726.5 Ghana: Incidence of indirect tax on tobacco by household
type and expenditure quintile 1736.6 Ghana: Incidence of indirect tax on alcoholic beverages by
household type and expenditure quintile 1736.7 Ghana: Incidence of indirect tax on communication by
household type and expenditure quintile 1747.1 Morocco: Economically active rate by sex and residence area in 2007 1807.2 Morocco: Evolution of tax revenue, 1996–2007 1827.3 Morocco: Structure of tax revenue in 2007 1837.4 Morocco: Evolution of tax revenue structure, 1996–2007 1847.5 Morocco: Tax incidence by gender, employment status and quintile 1937.6 Morocco: Excise tax incidence by gender, employment status
and quintile 1948.1 South Africa: Tax/GDP ratio: 1994–2010 2088.2 South Africa: Total tax incidence by employment status, quintile and
presence of children 2218.3 South Africa: VAT incidence by employment status, quintile
and presence of children 2218.4 South Africa: Excise incidence by employment status, quintile and
presence of children 2228.5 South Africa: Fuel levy incidence by employment status, quintile
and presence of children 2228.6 South Africa: Food tax incidence by employment category and
quintile 2278.7 South Africa: Alcohol tax incidence by employment category
and quintile 2278.8 South Africa: Tobacco tax incidence by employment category
and quintile 2289.1 Uganda: Workforce composition, persons aged over 18 years
by sex 234
xii Figures

Figures xiii
9.2 Uganda: Patterns and trends of tax type in total centralgovernment revenue 238
9.3 Uganda: Incidence of indirect tax by type of tax and householdtypology 244
9.4 Uganda: Incidence of tax by sex of head and expenditure quintile 2479.5 Uganda: Tax incidence by employment status and expenditure
quintile 2489.6 Uganda: Incidence of non-zero expenses on taxable consumption
of categories by sex of head 2509.7 Uganda: Percentage change in VAT incidence with salt zero-rated 2579.8 Uganda: Percentage change in indirect tax incidence with paraffin
levy halved 25810.1 United Kingdom: Total government receipts and taxes (incl.
national insurance contributions) as a percentage of GDP,1978–79 to 2007–08 plus projections to 2013–14 264
10.2 United Kingdom: Composition of government current receipts 2007–08, 1996–97 and 1978–79 265
10.3 United Kingdom: Total tax incidence by household employment status and children 279
10.4 United Kingdom: VAT incidence by household employment status and children 281
10.5 United Kingdom: Excise duty incidence by household employmentstatus and children 281
10.6 United Kingdom: Fuel levy incidence by household employmentstatus and children 282
10.7 United Kingdom: Commodity incidence by employment status across quintiles – fuel for transport 286
10.8 United Kingdom: Commodity incidence by employment status across quintiles – alcohol 286
10.9 United Kingdom: Commodity incidence by employment status across quintiles – tobacco 287
10.10 United Kingdom: Commodity incidence by employmentstatus across quintiles – adult clothing 288
10.11 United Kingdom: Commodity incidence by employment status across quintiles – domestic services 288
10.12 United Kingdom: Commodity incidence by employment status across quintiles – meals out 289
10.13 United Kingdom: Policy simulation: percentage change from base scenario – increasing fuel excise duty 289
10.14 United Kingdom: Policy simulation: percentage change from base scenario – standard rating all food 291
10.15 United Kingdom: Policy simulation: percentage change from base scenario – full stimulus package 293

This page intentionally left blank

Tables
1.1 Types of explicit and implicit bias in PIT 122.1 Key deductions and exemptions in PIT (excluding those
for non-earning spouses and dependant children) 262.2 Tax relief for non-earning spouses and dependant children 292.3 On which type of household does the PIT incidence fall at each
income level? 312.4 Zero rating and exemptions 382.5 Which quintile bears the highest incidence of each type of tax? 402.6 Incidence of indirect taxes by household type 412.7 Which household type, by quintile, bears the highest tax
incidence on selected commodity items? 433.1 Argentina: Income tax applicable by income bracket 703.2 Argentina: Annual individual personal allowances 703.3 Argentina: Monthly Monotributo payments: activities related
to the hiring and/or performance of services 713.4 Argentina: Monthly Monotributo payments: other activities 713.5 Argentina: Household composition and income by type 723.6 Argentina: Income tax by type of household and income source 723.7 Argentina: Excise tax rates 743.8 Argentina: Tax rates on fuels 753.9 Argentina: Overall incidence by household type: tax as
percentage of expenditure 763.10 Argentina: Incidence by quintile: tax as percentage of expenditure 773.11 Argentina: Tax incidence by type of tax: base estimates and
simulation of zero tax on food products 833.12 Argentina: Excise tax rates 853.13 Argentina: Estimated revenue comparison 863.14 Argentina: Tax incidence by type of tax: base estimates and
overall tax simulation 86A.1 Estimate of PIT by household type and contribution category 914.1 India: Gender disparities in Indian labour force participation
rates, 2004–05 95

4.2 India: Employment structure of the labour force, 2004–05 964.3 India: Employment by sector, 2004–05 964.4 India: Employment in organized sectors 974.5 India: Ratio of female to male wages 984.6 India: Wage/salary per day received by regular salaried
employees, 2004–05 984.7 India: Income tax rates and brackets, 2008–09 1024.8 India: Income tax paid by dual- and single-income household categories 1044.9 India: Number of effective taxpayers 104
4.10 West Bengal: Nature of commodities and the applicable VAT rate 1054.11 West Bengal: Tax rate on commodities outside the VAT 1064.12 West Bengal: Incidence of consumption tax in households 1074.13 West Bengal: Overall incidence by household type 1084.14 West Bengal: Rural and urban tax incidence by household type 1094.15 West Bengal: Incidence of sex composition, presence of children,
and quintile 1104.16 West Bengal: Tax incidence for each consumption category by sex
composition and quintile 1114.17 India: Policy simulation 1: tax on all food = 0 1174.18 India: Policy simulation 2: tax on tobacco doubled 117
5.1 Mexico: Economically active population by job position, 2006 1205.2 Mexico: Economically active population by income level, 2006 1215.3 Mexico: Federal revenue by source, 2005–08 1225.4 Mexico: Percentage structure of federal government revenues, 2005–08 1235.5 Mexico: Rates for calculating monthly annual income tax, 2001
and 2006 1265.6 Mexico: Earnings schedule for wage credit, 2006 1275.7 Mexico: Tax calculation and application of wage credit 1275.8 Mexico: VAT rates, 2006 1295.9 Mexico: Revenue from indirect taxes 130
5.10 Mexico: Household categories 1315.11 Mexico: Total indirect tax incidence by consumption categories
and employment status 1405.12 Mexico: Estimate of additional tax revenue through the application
of standard VAT rate to exempt or zero-rated products 1436.1 Ghana: Tax revenue–GDP ratio 1526.2 Ghana: Personal income tax rates, 2000–06 1566.3 Ghana: Hypothetical annual income and tax paid by household
with three children in school 1596.4 Ghana: Excise tax rates 1616.5 Ghana: Tax as a percentage of ex-pump price, January 2006 1616.6 Ghana: Overall indirect tax incidence by household type 163
xvi Tables

Tables xvii
6.7 Ghana: Tax incidence, by employment status, presence of childrenand quintile 164
6.8 Ghana: Tax incidence for main commodity groups by employmentstatus and quintile 166
6.9 Ghana: Tax incidence for main commodity groups by HH adultsex composition and quintile 169
6.10 Ghana: Effects of changes in indirect tax rates on tax incidenceby household type and expenditure quintile 176
7.1 Morocco: Women’s payroll share by sector and year 1817.2 Morocco: Household classification 1817.3 Morocco: Cross-tabulation of household categories by employment
status and sex composition 1827.4 Morocco: Normal PIT rates on salary revenues in 2009 1877.5 Morocco: Distribution of employed people across tax brackets
by sex, 2007 1887.6 Morocco: Comparison of effective average individual tax rates 1897.7 Morocco: Overall incidence by household type 1937.8 Morocco: Tax incidence by gender and employment status,
presence of children and quintile 1957.9 Morocco: Expenditure on basic services and commodities by
household type 1967.10 Morocco: Tax incidence of commodities, by household
employment status and quintile 1977.11 Morocco: Simulation 1: Tax incidence using 2009 tax rates
applied to yr 2000 expenditure (by quintile, household employment category and children) 201
7.12 Morocco: Simulation 2: Tax incidence with selective rate increasesand decreases applied to yr 2000 expenditure (by quintile,presence of children and employment category) 202
8.1 South Africa: Tax structure, 1988–2008 2088.2 South Africa: Distribution of employed people across tax
brackets by sex (September 2005) 2108.3 South Africa: Personal income tax rates, 2007–08 2108.4 South Africa: Hypothetical tax burden of PIT for households,
2007–08 2158.5 South Africa: Indirect tax rates and specific duties 2178.6 South Africa: Overall indirect tax incidence by household type 2198.7 South Africa: Indirect tax incidence by employment status,
presence of children and quintile 2208.8 South Africa: Indirect tax incidence for main commodity groups by
employment status and quintile 224

8.9 South Africa: Indirect tax incidence and government revenueeffect of Vat and zero-rating (selected items) 229
9.1 Uganda: Median employment earnings per person per year,2005–06 235
9.2 Uganda: Distribution of household typology by income 2369.3 Uganda: Share of type of tax to GDP and total tax revenue,
2002–07 2379.4 Uganda: Share of PAYE by income tax bracket 2399.5 Uganda: Tax impact on households by earner 2429.6 Uganda: Distribution of household type by PAYE income tax
bracket and gender 2439.7 Uganda: Incidence of indirect tax by tax type and household
typology 2449.8 Uganda: Incidence of tax by employment status and presence
of children 2469.9 Uganda: Incidence of indirect tax for consumption categories
by employment status, presence of children and quintile 25110.1 United Kingdom: PIT brackets and rates by source of
income, 2008–09 26710.2 United Kingdom: Main taxable personal income, exemptions
and reductions, 2008–09 26910.3 United Kingdom: Tax incidence (income tax + NICs – tax credits)
as percentage of gross household income, couple with two children 273
10.4 United Kingdom: VAT rates and liable goods, April 2005 27510.5 United Kingdom: Excisable goods: incidence of duty and
tax for typical items, April 2005 27710.6 United Kingdom: Overall incidence by household type 27810.7 United Kingdom: Incidence by employment status, presence
of children and quintile 28010.8 United Kingdom: Tax incidence for main commodity groups
by employment status and quintile 28310.9 United Kingdom: Effects of changes in indirect tax rates on
tax incidence by employment status and expenditure quintile 29010.10 United Kingdom: Effects of government’s 2008 stimulus
package on tax incidence by employment status andexpenditure quintile 292
xviii Tables

Contributors
Ernest Aryeetey is the Director of the Institute of Statistical, Social andEconomic Research (ISSER) of the University of Ghana, Legon, Accra. He isa current member of the Boards of the United Nations University WorldInstitute for Development Economics Research (UNU-WIDER) and theGlobal Development Network. He studied Economics at the University ofGhana and holds a PhD from the University of Dortmund, Germany.
Lawrence Bategeka is a Senior Research Fellow with the Economic PolicyResearch Centre at Makerere University in Kampala. His main areas ofresearch are public sector policy, vulnerability, and institutional performance.Mr Bategeka holds a Master’s Degree in Economic Policy and Planning fromMakerere University, and a Master’s Degree in Education from the Universityof Bristol, UK.
Debbie Budlender is a specialist researcher with the Community Agency forSocial Enquiry (CASE), a non-governmental organization working in the areaof social policy research. Previous employment includes administrative andresearch work for trade unions, and research for the Cape Town University-based Southern African Labour and Development Research Unit at the time ofthe Second Carnegie Enquiry into Poverty.
Daniela Casale is a Senior Research Fellow in the School of DevelopmentStudies at the University of KwaZulu-Natal, Durban, South Africa. She worksmainly in the fields of labour and household economics, and is particularlyinterested in the gender aspects of development. She completed her PhD inEconomics at the University of Natal in 2003.
Lekha Chakraborty is a Fellow at the National Institute of Public Finance andPolicy (NIPFP), New Delhi, India. Her research areas are macroeconomicissues in public finance, fiscal decentralization, gender budgeting, and humandevelopment. She holds an MPhil in Applied Economics and a PhD inEconomics from the Centre for Development Studies at Jawaharlal NehruUniversity, New Delhi.
Pinaki Chakraborty is a Professor at the National Institute of Public Financeand Policy (NIPFP), New Delhi, India. His main research areas are macroeco-
nomics and public finance. He was a consultant for the Eleventh FinanceCommission of India, and holds both a PhD in Economics and an MPhil inApplied Economics from the Centre for Development Studies, JawaharlalNehru University, New Delhi.
Jérôme De Henau is a Lecturer in Economics at the Open University. His cur-rent research areas include gender, intra-household inequalities and social poli-cies across Europe. He holds a PhD in Economics and Management from theFree University of Brussels (ULB), Belgium.
Ahmed El Bouazzaoui works in the Moroccan Ministry of Finance. His researchfields include taxation, gender, personnel wages and human resource manage-ment. He holds a Master’s Degree in Information Sciences from the Instituteof Information Sciences, Rabat, Morocco, along with a Certificate ofManagement from the Business School of Al Akhawayn University, Ifrane,Morocco, and a Certificate of Management from the Institute of Managementand Business Administration ISCAE, Rabat, Morocco.
Corina Rodríguez Enríquez is a researcher at the National Council ofScientific Research (Consejo Nacional de Investigaciones Científicas yTécnicas) and the Interdisciplinary Centre for the Study of Public Policies(Centro Interdisciplinario para el Estudio de Políticas Públicas), Argentina.She works on issues related to labour markets, the care economy, poverty andincome distribution, and social and fiscal policies. She holds a Master’sDegree in Public Policy and Administration from the Institute of SocialStudies, The Hague, The Netherlands and a PhD in Social Sciences fromFacultad Latinoamericana de Ciencias Sociales (FLACSO), Argentina.
Abdessalam Fazouane is a statistician demographer. He is Professor of HigherEducation at the National Institute of Statistics and Applied Economics(INSEA). He is a specialist in the areas of population, gender and development,and statistical sampling.
Lucía C. Pérez Fragoso is an economist. She has been working for the past nineyears on gender budget analysis and formulation in the non-governmentalorganization, Equidad de Género: Ciudadanía, Trabajo y Familia (GenderEquity: Citizenship, Work and Family), located in Mexico City. She holds aMaster’s Degree in Economics from the University of Manchester, England.
Natalia Gherardi received an LLM with honours from the London School ofEconomics and Political Sciences (LSE). She is also the Executive Director ofEquipo Latinoamericano de Justicia y Género (ELA) in Argentina.
Francisco Cota González is an independent consultant dealing in strategic plan-ning, economic analysis and forecasting, and part-time professor in the eco-nomics departments of Universidad Anahuac and Universidad del Valle deMéxico. He holds a Bachelor’s Degree in Economics from the UniversidadAnahuac, Mexico City, and a Master’s Degree in Development Banking fromAmerican University, Washington, DC.
xx Contributors

Caren Grown is Economist-In-Residence at American University, Washington,DC. Her current research focuses on assets and women’s well-being, genderequality and public finance, and international trade and gender. She is anAssociate Editor of Feminist Economics and holds a PhD in Economics fromthe New School for Social Research in New York City.
Madina Guloba is an Assistant Research Fellow at the Economic Policy ResearchCentre at Makerere University, Uganda. She holds a Master’s Degree inEconomics from the University of Dar Es Salaam under the CollaborativeMasters Programme of the African Economic Research Consortium.
Susan Himmelweit is Professor of Economics at the Open University. Herresearch is on gender issues in economics. She is an Associate Editor of FeministEconomics, past president of the International Association for FeministEconomics (IAFFE), and the first chair of the UK Women’s Budget Group.
Hind Jalal works in the Moroccan Ministry of Economy and Finance. Her areasof research include gender and macroeconomics, gender-responsive budgeting,and international trade and investment. She holds a PhD in Law and Economyof Development from Nice Sophia Antipolis University, France, a Certificateof Management from the Business School of Al Akhawayn University, Ifrane,Morocco, and a Management Degree from the Institute of Management andBusiness Administration ISCAE, Rabat, Morocco.
Shashi M. Kapila is currently practising as an advocate and tax consultant ondirect taxes. From 1992–2001, she was Head, Taxation Unit of ANZ GrindlaysBank and from 1976–92 worked as an Officer of the Indian Revenue Service-Direct Taxes and in the Indian Income Tax Department in various capacities.She is a member of the International Fiscal Association.
Krishanu Karmakar is currently a graduate student at the Andrew YoungSchool of Policy Studies, Georgia State University, USA. He holds a Master’sDegree in Economics from the Delhi School of Economics and worked at theNational Institute of Public Finance and Policy, New Delhi, India.
Julius Kiiza teaches political economy of development and public policy analy-sis in the Department of Political Science and Public Administration atMakerere University. He holds a Bachelor’s (Honours) Degree from MakerereUniversity, and received both a First Class Master of Public Policy and a PhDin economics from the University of Sydney, Australia.
Hitomi Komatsu is a doctoral candidate in Economics at the AmericanUniversity, Washington, DC. Her research interests include labour, fertilityand time use. She holds a Bachelor’s Degree in Economics from UniversityCollege London and a Master’s Degree in Development Economics from theSchool of Oriental and African Studies at the University of London, UK.
Abena D. Oduro is a Senior Lecturer in the Department of Economics at theUniversity of Ghana, Legon, Accra. During 2003, she was a Visiting Lecturer,Council on African Studies, Yale University, New Haven, USA. She holds a
Contributors xxi

Master’s (Honours) Degree in Political Economy and Geography and an MLittin Political Economy from the University of Glasgow, Scotland.
Robert Darko Osei is a Research Fellow in the Economics division of theInstitute of Statistical, Social and Economic Research (ISSER), of theUniversity of Ghana, Legon, Accra. He is currently involved in the develop-ment of a micro-simulation model for Ghana and was part of the Ghana teamthat developed the MCA-Ghana programme, in the capacity as lead economist.
Isaac Osei-Akoto has been working with the Institute of Statistical, Social andEconomic Research (ISSER), University of Ghana, Legon, as a ResearchFellow since 1999. His main research areas relate to household economics,poverty and the provision of public goods and services. He holds a PhD inDevelopment Economics.
Darío Rossignolo has been working as a consultant for various internationalorganizations and is currently a Professor of Macroeconomics and PublicFinance at the University of Buenos Aires, Argentina. His main research areasare public sector economics and the extra fiscal effects of fiscal policy. He is adoctoral candidate in Economics at the University of La Plata in Argentina, andholds a Bachelor’s Degree in Economics from the University of Buenos Airesand a Master’s Degree in Economics from the University Di Tella in Argentina.
Salama Saidi is a former United Nations Regional Advisor on Gender, Populationand Development, and currently President of the Rawabit Association, Morocco,and an international consultant on gender and development. She has conductedresearch in the social sciences with a focus on gender, population and reproduc-tive health, and programme development, monitoring and evaluation. She holds aPhD and a Master’s Degree in Demography from the University of Pennsylvania,and a Master’s Degree in Economics from Temple University, USA.
Cristina Santos is a Lecturer in Economics at the Open University and a researchfellow at the Center for Advanced Studies in Management and Economics ofthe University of Évora (CEFAGE-UE). Her research interests focus ongender, individual and intrahousehold decision-making, poverty, human devel-opment, and domestic violence. She holds a Master’s Degree in Economicsfrom University College London, UK, where she is studying for a PhD.
Sarah Ssewanyana is Senior Research Fellow at the Economic Policy ResearchCentre, Makerere University, Kampala, Uganda. She has carried out appliedpolicy-relevant research in the areas of income poverty, food security, health,education, labour-related issues and on issues related to social service deliveryand has published widely on these topics. She holds a PhD in AgriculturalEconomics from the University of Sydney, Australia.
Imraan Valodia is Associate Professor in the School of Development Studies at theUniversity of KwaZulu-Natal, South Africa. His current research interests includegender and economic policy, the informal economy, and industrial policy. Heholds a doctorate in Economics from the University of KwaZulu-Natal.
xxii Contributors

Acknowledgements
This book is the result of a two-and-a-half-year project which examined thegender dimensions of tax policies and tax reforms in eight countries: Argentina,Ghana, India, Mexico, Morocco, South Africa, Uganda and the United Kingdom.The project emerged from discussions at the workshops and international confer-ences of the Gender and Macroeconomics International Working Group (GEM-IWG), organized at the University of Utah, Salt Lake City, in 2004 and 2005, ofwhich several authors are members. It grew to include individuals and institutionsfrom several countries and policy and academic networks.
The project had three goals: (1) to advance understanding of the genderimpacts of tax policies and tax reforms in countries at various levels of develop-ment; (2) to engender and improve current tools and techniques for analysing taxpolicies and reforms; and (3) to influence tax policy-makers in the focus coun-tries and internationally. Undertaking the work involved multiple expertise andexperiences; within each country, a project team was constituted, comprised ofpublic finance or development economists, feminist economists, lawyers, andpolitical scientists. The institutional partners in each country are:
Argentina Centro Interdisplinario para el Estudio de PolíticasPublicas (CIEPP – Interdisciplinary Centre for the Studyof Public Policies)
Ghana Institute for Statistical, Social and Economic Research(ISSER), University of Ghana
India National Institute for Public Finance Policy (NIPFP)Mexico Equidad de Género: Ciudadana, Trabajo y Familia A.C.
(Equidad)Morocco Rawabit AssociationSouth Africa School of Development Studies, University of
KwaZulu-NatalUganda Economic Policy Research Centre (EPRC), Makerere
UniversityUnited Kingdom Open University

In addition to chapters in this book, each of the country teams also produced threeother outputs in their local languages: (1) a country report on personal incometaxes; (2) a country report on the incidence of indirect taxes; (3) and a policybrief. The chapters in this book synthesize those longer country papers and thereader may wish to consult those papers for more details on methodology andadditional findings not discussed herein.
The project was made possible through the generous financial assistance pro-vided by the International Development Research Centre (Canada), the FordFoundation, the Government of Japan through the United Nations DevelopmentProgramme/Japan Women in Development Fund (UNDP/JWIDF) and the UnitedNations Development Programme (UNDP) Gender Team.
The policy focus of this project cannot be overstated. Over the duration of theproject we have consistently engaged policy-makers at both national and interna-tional levels. Each of the country teams engaged with the relevant tax and treasuryauthorities in their countries, sharing the research findings and pointing to the needto consider adequately the gender implications of tax policies and reforms. At theinternational level, we have had close engagement with a number of key actorsincluding the United Nations, the United Nations Development Programme(UNDP), the World Bank and the International Monetary Fund (IMF).
Participants at the international conference on Gender and Taxation:Improving Equity and Revenue Generation, organized by the UNDP, theAmerican University and the University of KwaZulu-Natal, and hosted by theWorld Bank in December 2008, gave excellent comments on the interim countrypapers, which improved them considerably. The UNDP and the World Bank pro-vided both financial and in-kind support for that conference. The InternationalAssociation of Feminist Economics (IAFFE) also granted us a podium for pre-senting, discussing and disseminating this research on gender equity and taxationduring two annual conferences in 2008 and 2009. The United Nations ResearchInstitute for Social Development (UNRISD) provided support to Imraan Valodia,where he was based on a visiting fellowship, during the final editing states of thisbook and gave him a platform for presenting and discussing this work.
We owe thanks to many people who gave us both guidance and personal andprofessional support during the various stages of the project. We would especiallylike to thank Martha Melesse, Brent Herbert-Copley and Andres Rius fromIDRC, and Winnie Byanyima and Anna Falth from UNDP for their unwaveringinterest in, enthusiasm for and commitment to this project. Shaianne Osterreichprovided useful feedback and ideas to the teams at two project meetings. DebbieBudlender, Diane Elson, Susan Himmelweit, Janet Stotsky and Stephen Youngerserved as members of the project’s Technical Advisory Group. They each con-tributed generous amounts of time and provided words of wisdom, critical intel-lectual guidance and constructive feedback. We owe them our deepest gratitudeand absolve them of any mistakes, for which we are entirely responsible!
The project would also like to recognize Hitomi Komatsu, who provided excel-lent research support throughout the project. We are looking forward to contin-ued collaboration with her on issues of gender and taxation. We received
xxiv Acknowledgements

Acknowledgements xxv
substantial administrative support from our colleagues. At American University,Marie-Ellen Ehounou kept the project focused and on track. At the University ofKwaZulu-Natal, Kanagie Naidoo assisted with the financial administration, andPriya Gayadeen assisted with logistics for various project meetings. We thank allof these colleagues for their diligence and hard work.
Ahmed Elbouazzaoui, Hind Jalal and Salama Saidi, from Rawabit in Morocco,and Corina Rodríguez-Enríquez and Agustina Fornasier, from CIEPP inArgentina, hosted valuable meetings for the project teams to develop the concep-tual and methodological issues and to work through earlier drafts of the countrypapers. We thank them for their warm hospitality and generous contributions oftime and help.
Karen Judd edited all the chapters of this book. Her unique talents improvedthe manuscript immeasurably, and we could not have finished this book withouther assistance.
Finally, we would like to acknowledge the members of the country teams, truepartners who also became good friends. We thank each of them for their adven-turous intellectual spirits, collegiality, timeliness, and good humour. We look for-ward to future opportunities for partnership in a second phase of the project.
Caren Grown, Washington, DCImraan Valodia, Durban
July 2009

This page intentionally left blank

Abbreviations
CASE Community Agency for Social Enquiry (South Africa)CEDAW Convention on the Elimination of All Forms of Discrimination
Against WomenCIT corporate income taxCOICOP Classification of Individual Consumption by PurposeCONAPO National Population Council (Mexico)CTL Commercial Transaction LevyEFS Expenditure and Food SurveyENIGH National Household Income and Expenditure Survey (Mexico)ENOE National Occupational Employment Survey (Mexico)FISIM Financial intermediation services indirectly measuredGDP Gross Domestic ProductGEM-IWG Gender and Macroeconomics International Working GroupGLSS 5 Ghana Living Standards Survey 5GNP Gross National ProductHH HouseholdHUF Hindu Undivided Family (India)IAFFE International Association for Feminist EconomicsIDE Tax on Cash Deposits (Mexico)IETU Corporate Flat Rate Tax (Mexico)IMF International Monetary FundINEGI Instituto Nacional de Estadística y Geográfia (National Institute
of Statistics) (Mexico)INSEA National Institute of Statistics and Applied EconomicsISSER Institute of Statistical, Social and Economic Research (Ghana)LST Local Service Tax (Uganda)MDGs Millennium Development GoalsNHIL National Health Insurance Levy (United Kingdom)NICs National Insurance Contributions (United Kingdom)NIPFP National Institute of Public Finance and Policy (India)PEAP Poverty Eradication Action PlanPIT Personal Income TaxRPI Retail Price Index (Uganda)

SARS South African Revenue ServicesSHCP Secretaría de Hacienda y Crédito Público (Mexico)SITE Standard Income Tax on Employees (South Africa)SSNIT Social Security and National Insurance TrustSTPS Secretaría del Trabajo Prévision Social (Mexico)STPS Special Tax on Production and Services (Mexico)UNDP United Nations Development ProgrammeUNRISD United Nations Research Institute for Social DevelopmentURA Uganda Revenue AuthorityVAT Value-Added TaxWFTC Working Families Tax Credit (United Kingdom)
xxviii Introduction

1 Taxation and gender equalityA conceptual framework
Caren Grown
Introduction
Governments everywhere grapple with the problem of generating enough resourcesto reduce poverty and fund essential public services. Fiscal policy, including tax-ation, is at the heart of the debate on which services government should provideand who should pay for them, including the share paid by men and women asconsumers, workers, and employers. The global financial crisis of 2008–09 hasthrown millions of people into poverty worldwide, highlighting the need forstronger, more equitable and efficient tax systems that can ensure a stable flow ofpublic services, even during periods of downturn.
Over the decades, many countries have embarked on extensive reforms of theirtax systems, with some achieving lasting improvements and others managing onlyshort-term or transitional improvements that are gradually undone. Since the1990s, several trends have been seen worldwide. These include reforms to personalincome tax systems to broaden their bases and reduce the highest marginal tax rates,reduction of the highest corporate income tax rates, increasing reliance on broad-based value-added taxes (VATs), and reduced reliance on trade taxes through a flat-tening of the tax structure and removal of discrimination against imported goods inboth indirect and trade taxes (Bahl and Bird 2008). Countries have sought to makeup revenue losses from declining trade taxes, in particular, through a shift to indi-rect taxes, especially the VAT. More than 125 countries now have some form of aVAT, and it is the mainstay of revenue systems in much of the world (Bird 2005).
One of the cornerstones of tax policy, and central to tax reform efforts, is theissue of equity, along with issues of efficiency and ease of administration. A keychallenge facing developing countries is to be able to generate sufficient publicresources in a way that does not place an undue burden on the poor and marginal-ized. Since women are particularly vulnerable to poverty, systematic and robustassessments of the manner in which developing countries are attempting to increasetheir revenue pool and the impact of this on poor women are urgently needed.
To date, however, neither the tax literature nor public debates have adequatelyaddressed how gender-based differences in behaviour affect tax equity consider-ations and outcomes. For example, an assessment of the effect of consumption

taxes on patterns of regressivity, which ignore the fact that men and women havesystematically different expenditure patterns, will fail to capture the differentialeffect of these reforms on different types of households – single parent versusdual-earner parent – across the income distribution.
This book is the result of a two-and-a-half-year project which examined thegender dimensions of tax policies and tax reforms in eight countries: Argentina,Mexico, South Africa, Ghana, Uganda, Morocco, India and the United Kingdom.Like other studies, this volume is concerned with who contributes the greatestshare of their income in taxes. But the work in this volume broadens the under-standing of equity in taxation to include gender differences as a core element indefining notions of tax equity and outcomes. Because women are more likelythan men to be poor, understanding where gender inequities are of greatest con-cern necessarily involves analysis by income and hence a specific focus ongender inequalities among the poor.
The book makes several unique contributions. To evaluate gender equality intaxation, we first develop a conceptual framework based on the Convention for theElimination of All Forms of Discrimination Against Women (CEDAW) and prin-ciples used in the economics literature on taxation. Second, we develop a consistentempirical methodology to analyse on which households – categorized by selectedgender attributes – the incidence of selected indirect taxes is highest. We apply thismethodology to recent household-level data from the eight countries. Third, thefocus on developing countries (seven out of eight countries in our sample) isunique, as virtually nothing has been written on the gender impacts of taxation inthese countries. Finally, based on our conceptual framework and our empirical find-ings, we develop a set of principles for evaluating the gender equity aspects of taxpolicy that we hope will influence real-world tax policy design and implementation.
Tax concepts and issues: a brief summary
A frequently used summary measure of taxation, for purposes of internationalcomparison, is the ratio of total tax revenue to Gross Domestic Product (GDP). Ahigh tax/GDP ratio has also been used by feminist economists as an indicator ofresources that are available for expenditure that promotes poverty reduction andgender equality. This ratio varies widely among both developed and developingcountries. Overall, as countries develop, they tend to be able to generate greaterrevenue relative to GDP. Fox and Gurley (2005) use data from 165 countries andreport that tax ratios range from well under 10 per cent in several countries, mostof which are small and low-income (such as Myanmar, Nepal, Guatemala, Haiti,Niger, Chad and the Central African Republic), to well over 40 per cent in manycountries, mostly in Western Europe (The Netherlands, Denmark, Italy, Franceand Sweden). But these patterns are not uniform, and even among countries at asimilar level of income, there can be considerable variation in revenue yields. Forinstance, some lower-income countries, such as the Democratic Republic of Congo,Sudan, Ukraine, and Belarus, also had high tax ratios. Similarly, some higher-income countries, such as the United States, had notably lower tax ratios than others
2 C. Grown

in that group. A low tax/GDP ratio may reflect an inadequate tax system and/orweak tax administration, or there may be other substantial non-tax sources ofincome, such as petroleum in Nigeria. Alternatively, it may be the result of con-scious policy such as in South Africa where a national tax/GDP target was set in1996 at no more than 25 per cent, or the United States, where it reflects a con-scious effort in recent decades to reduce taxes on high-income earners.
The countries in this volume also have widely varying tax revenue to GDPratios, from 9–15 per cent in Mexico, Uganda and India, to 20 per cent in Ghana,and Morocco, to 27–28 per cent in Argentina and South Africa, and, finally, to36 per cent in the United Kingdom.
All tax systems – in both developed and developing countries – include thesame basic tax categories: direct taxes on income and wealth; indirect taxes onconsumption; property taxes; and trade taxes. The most common direct taxes arethe personal income tax, the corporate income tax, and wealth or inheritancetaxes. The most common indirect taxes are the value-added tax (VAT) andselected sales and excise taxes (e.g., taxes on alcohol and cigarettes). Propertytaxes tend to be imposed on real estate such as land and housing, or on personalproperty such as cars and boats. Trade taxes often take the form of import orexport duties. This volume, rather than focusing on all types of taxes, concen-trates on personal income tax, the VAT, selected excises and fuel levies, whichcan together be considered the basic ‘pillars’ of taxation in most countries(Barreix and Roca 2007).
While all countries generate tax revenue from broadly the same sources, the taxsystem of each country reflects its specific history, legal tradition, political structureand economic base (Bahl and Bird 2008). The structure of tax revenue also varieswith the level of national income. Across low-income countries, about two-thirds oftax revenue is raised through indirect taxes. In contrast, across high-income coun-tries, indirect taxes account for only about one-third of tax revenue, with the remain-ing two-thirds coming from direct taxes. In low-income countries, personal incometax accounts for just over a quarter of tax revenue, while in high-income countries,it accounts for over a third of tax revenue.
The countries in this volume generally reflect this pattern but with some indi-vidual variation. In 2006–08, as a share of total tax revenue, personal income tax(PIT) represented between 14 and 21 per cent in Argentina, India, Morocco andUganda. The percentage was substantially higher in the United Kingdom at 27per cent, although Mexico and South Africa, much poorer countries, had a highshare of PIT in total tax revenue, at 56.4 and 30 per cent, respectively, in 2007.1
The share of VAT in total tax revenue varied from 15 to 18 per cent in Uganda,Ghana,2 and the United Kingdom, and was about ten percentage points higher inArgentina, Morocco and South Africa, and 46 per cent for Mexico.3
Gender differences that affect taxation
It is important to clarify upfront our use of the term ‘gender’ throughout this volume.Average differences between men and women observed in economic, social and
Taxation and gender equality 3

political life are not the result of sex (e.g., biology) but rather are the result of socialrelations that ascribe different roles, rights, responsibilities and obligations to malesand females.4 The structures that govern gendered social relations have basic com-monalities across different societies, although how they are manifest in specificbeliefs, norms, organizations, behaviours and practices can and do vary.
Gender analysis involves examining the inequalities between women and menthat result from social power relations in households, markets, and organizations.Social power relations are based not only on gender but also arise from class,race, ethnicity, caste, and location (e.g., urban or rural), which again vary acrosssocieties. Gender is a social stratifier that interacts with these other powerfulsocial stratifiers. When analyzing the distributional impact of tax systems, it istherefore important to go beyond a mere focus on women as a distinct group inrelation to men as a distinct group and to incorporate all relevant social stratifiers.Several of the chapters in this volume therefore include income, race and locationas stratifiers in the gender analysis of taxation.
Barnett and Grown (2004) note four ‘stylized facts’ about gender differencesin economic activity that should be used to understand the impact of taxation onmen and women. These are:
1 gender differences in paid employment – including formal/informal employ-ment, wages and occupational segregation;
2 women’s work in the unpaid care economy;3 gender differences in consumption expenditure;4 gender differences in property rights and asset ownership.
Gender differences in employment
In all countries, women’s labour force participation rates are lower than men’s,although women contribute more time in total to paid and unpaid work (UnitedNations Development Programme 1995; United Nations Development Fund forWomen 2000; United Nations 2009). Within paid employment, several gender dif-ferences are important to note in a gender analysis of taxation. First, women enterand exit the labour force more frequently than do men, which means their partici-pation is more discontinuous than is men’s, and they are more likely to be in part-time and seasonal jobs, while men are concentrated more than women in full-timepositions (International Labour Organization 2009b). Second, women earn lessthan men, even after controlling for standard human capital variables (age, educa-tion, job experience), though the gap has narrowed in some countries, over the lastdecade (Tzannatos 1999; Artecona and Cunningham 2002; Oostendorp 2004;International Labour Organization 2009a). Third, in many countires, especiallydeveloping countries, women work predominately in informal employment whichin many cases puts them outside the income tax net either because they earn toolittle to file returns or choose not to do so knowing that the tax system has fewways to track their income, which may not otherwise be reported. Informal employ-ment includes market-oriented employment in small workshops, family busi-nesses, contract or subcontract work often undertaken in the home, and domestic
4 C. Grown

work for others. Informal employment represents about 80 per cent of women’semployment in Sub-Saharan Africa, Southern Asia and the Pacific, compared toabout 74 per cent of men’s, although for developing countries as a whole, it rep-resents 67 per cent of women’s employment and 60 per cent of men’s employment(United Nations 2009).
The result of women’s employment profile – their discontinuous employment,lower relative earnings and predominance in the poorly paid forms of informalemployment – means that they are unlikely to bear a large share of the personalincome or direct tax burden in many countries. However, their inferior employ-ment status may also prevent them from accessing certain benefits affordedthrough the tax system to employees.
Unpaid work and care
Taxes are generally assessed on income. But as the recent literature on povertynotes, there are different concepts of income, depending on what is included, e.g.,market income, non-market income from household production, the value ofleisure, or other factors (Martinez-Vazquez 2001). Most countries do not includenon-market production in income that is liable to tax.
In every country around the world, women do most of the unpaid care work,that is, tasks such as housework, cooking and caring for children, the elderly, andsick people, where the person doing this work is not paid (Budlender 2002).Unpaid care work also includes volunteer work, where individuals assist otherhouseholds or the community more generally. As Elson (1995) points out, these areall vital services that enable the paid economy to function. In many developingcountries, unpaid work that goes beyond care includes subsistence production –production for home use of goods and services such as food, clothing, and otheritems – and unpaid work in family businesses.5
The issue of whether and how to value unpaid work is a subject of debate inthe feminist economics and feminist legal communities. It affects the notion ofincome and consequently the interpretation of who bears the burden of taxes. Thisis discussed further below.
Gender differences in expenditure
Not only do women allocate their time differently than do men – between paidwork, unpaid work and leisure – but there is also evidence that gender relationsand bargaining power among household members affect the types of expenditureshouseholds make, the amount and type of savings and other allocation decisions,which is especially important for understanding the incidence of consumptiontaxes, that is, value-added, excise and fuel taxes.
Across a wide range of cultures, empirical studies have revealed gender dif-ferentials in expenditure (Haddad et al. 1997; Lundberg et al. 1997; Browningand Bonke 2006; Doss 2006). Women, compared to men, tend to spend a higherproportion of income under their control on goods such as food, education andhealth care that enhance the well-being and capabilities of children (Thomas
Taxation and gender equality 5

1993; Haddad et al. 1997; Quisumbing and Maluccio 2000). Indeed, gender dif-ferences in expenditure emerge across all countries in this project, as will be dis-cussed further below and in subsequent chapters. It is therefore important toanalyse how changes in the relative prices of various commodities will affectwomen’s and men’s expenditure patterns and household welfare.
Gender differences in property rights
In many developing countries, women are frequently denied the right to own andinherit property. In many regions of Africa and Asia, men hold formal land titlewhen land is private. Social norms may dictate that businesses are owned by malefamily members although women may supply labour to them. In light of this sit-uation, some countries (e.g., India, see Chapter 4) are using the tax system to pro-vide incentives to increase female property ownership.
Nonetheless, in recent decades, women have made strides in some areas ofproperty ownership, most notably in entrepreneurship and business development.Yet tax systems may not recognize female business ownership even when itexists. Stotsky (1997) found that family business income is attributed in manycountries (e.g., Tanzania) to the husband regardless of the spouse’s role in thebusiness and that in some countries, limitations are placed on the allocation ofincome from a family business to an unpaid family member because when thespouses are taxed separately, shifting the income to the spouse who pays tax at alower marginal tax rate is one form of tax avoidance. Gender differences in busi-ness and other forms of property ownership are becoming relatively more impor-tant but have not yet systematically been addressed in the tax literature.
Gender equality and tax equity: conceptual framework
Although there are gender issues in all facets of tax policy, including efficiencyand ease of administration, this volume concentrates on equity. Gender equalityin tax policy can be examined from several perspectives. Our framework buildson the work of two scholars: Janet Stotsky and Diane Elson. Stotsky (1997) pio-neered one of the first assessments of the gender implications of taxation systemsin developing countries and her work provides a useful framework for assessingthe notion of gender ‘bias’ in taxation systems.
Stotsky distinguishes between explicit and implicit bias. Explicit forms ofgender bias refer to specific regulations or provisions in tax law that treat men andwomen differently. They are more common in personal income tax arrangementsthan in other forms of taxation in both developed and developing countries.Implicit forms of gender bias, on the other hand, relate to provisions in tax sys-tems that, because of systematically gendered social and economic customs andarrangements, have different impacts on men and women. These may be found inpersonal income tax systems if they have joint filing requirements that tax secondary-earner income (primarily women’s) at a higher marginal tax rate than primary-earner income, thus affecting women’s labour supply and other decisions.
6 C. Grown

Implicit bias may also be found in consumption taxes as a result of gender dif-ferences in spending behaviour.
There is much that is useful in Stotsky’s framework, but Elson (2006) pointsout that it has some limitations. She argues that the term ‘bias’ is a normative andpejorative term, implying an unjustified asymmetry that stems from treating menand women differently. By contrast, a non-biased system would treat them thesame. Yet, Elson argues that a gender analysis of taxation must go beyond theprinciple of sameness to recognize that discrimination and bias take differentforms, and that, in order to achieve substantive equality, different groups insociety may require different treatment. Different treatment is, therefore, not nec-essarily biased treatment.
Elson (2006) develops the implications of the Convention on the Eliminationof All Forms of Discrimination Against Women (CEDAW) for tax systems.Although there is no specific mention in CEDAW of taxation, CEDAW requiresthat families be based on ‘principles of equity, justice and individual fulfilmentfor each member’ (General Recommendation 21, para. 4). It implies that womenbe treated as equal to men in tax laws: as individual, autonomous citizens, ratherthan as dependants of men. Article 1, for instance, specifies that marital status isnot an acceptable basis for any ‘distinctions, exclusions or restrictions’ whichimpair women’s equality with men in the enjoyment of human rights.6
CEDAW also recognizes that to achieve substantive (as opposed to formal)equality, different treatment of males and females may be permissible when thattreatment is aimed at overcoming discrimination. Article 5 ‘requires State partiesto modify social and cultural patterns of men and women to eliminate practicesbased on the idea of sex role stereotyping or the inferiority or superiority of eitherof the sexes’ (Inter-Parliamentary Union 2003). Thus, one could argue (as Elsondoes) that taxation systems should seek to help transform the traditional genderedroles in society that are inequitable. In other words, personal income tax systems(e.g., the structure of rates, exemptions, deductions, allowances, credits, etc.)should be designed to actively promote an equal sharing of both paid and unpaidwork between women and men as well as eliminate incentives for the perpetua-tion of gender inequitable roles. This is quite a different interpretation from thatprovided by standard welfare economics, which takes individual utility as thebasis of a social evaluation function to assess whether a policy reform improvessocial welfare and which adheres to the principle that reforms that make onegroup better off while making other groups worse off are undesirable.
Re-interpreting horizontal and vertical equity from aCEDAW perspective
The ideas put forth by Elson and Stotsky can be used to re-examine the notion ofequity in tax theory and policy. Public finance theory and practice have long dis-tinguished ‘equity’ or fairness as one pillar of taxation (Musgrave and Musgrave1989). Equity in taxation expresses the idea that taxes should be ‘fair’ and is aconcept used in all tax policy analysis. However, it should be noted that
Taxation and gender equality 7

equity/fairness is a normative, value-based concept and its interpretation differsacross individuals, countries, cultures and time, making it difficult to apply in anyconsistent and meaningful way to facilitate comparisons across countries.
Tax equity is commonly discussed according to two definitions of ‘fairness’.These definitions are also normative, and sometimes conflict, so they too are dif-ficult to apply in practice. However, they are a common reference point for dis-cussion. Horizontal equity posits that taxpayers who are equally situated ineconomic terms should be treated equally for tax purposes. Vertical equity positsthat taxpayers who are not identical from an economic standpoint, but are differ-ently situated, should be treated appropriately differently for tax purposes.7 Inpractice, it is difficult to come to any definite consensus as to what counts asequivalent and what counts as different. And, even if there is rough agreement onwhat count as equivalent and what counts as different, it can be very difficult toapply these concepts in tax policy. Many countries do achieve some degree ofvertical equity, but horizontal equity is nearly impossible to achieve for reasonsthat are discussed below.
Horizontal equity in personal income taxes
As noted above, horizontal equity is defined as the requirement that equals betreated equally. From a gender perspective, there are a number of problemswith this concept. The first is that horizontal equity is equivalent to whatCEDAW considers to be formal equality. Yet, as noted above, formal equalityis not necessarily sufficient to change the underlying conditions that producegender (and other forms of) inequality. As Claire Young (2000: 7) notes, agender analysis must
encompass the concept of substantive equality. An approach based on for-mal equality would treat all individuals the same regardless of the differ-ences between them. This approach is inadequate to the task of creatingreal equality because it does not encompass or even acknowledge inequal-ity of condition.
Julie Nelson (1996: 97) raises another problem with the traditional notion ofhorizontal equity:
The conception of horizontal equity not only requires that one answer thequestion of what ‘the same situation’ means across units, but also, morefundamentally, that one determine a proper unit across which to make thecomparison. The notion of horizontal equity requires a belief in a funda-mental similarity among the units being compared, something that is mucheasier envisioned in the abstract, than in concrete cases.
She goes on to note that the translation of the ideal of horizontal equity into actual taxpolicy has been strongly influenced by ‘patriarchal’ interpretations of what constitutes
8 C. Grown

the same situation and what constitutes the appropriate unit of taxation, e.g., the indi-vidual, the family, or the household. This is taken up in the next section.
The proper unit of taxation: individuals or households?
An important question for all countries is whether the proper unit of taxation isthe household or the individual. Every country in this study has adopted individ-uals as the filing unit for personal income taxes.8 Under an individual filing sys-tem, all persons are responsible for filing a tax return if they have taxable income.Married individuals file a separate return based on their own labour earnings,and non-labour earnings and exemptions or deductions for children and otherpurposes are allocated in some way determined by the tax law (Stotsky 1997).Systems that use joint filing assess tax liability on the combined income of bothpartners and the couple is the filing unit.
An individual filing structure is considered by many feminist economists to bemore gender-equitable than joint or family taxation.9 As Sue Himmelweit (2002:16) states:
[S]eparate taxation means men and women are taxed on and therefore faceincentives based on their own income alone. This can be seen as a steptowards gender equality in employment, since it favours a household withtwo earners over a single-earner household with the same income. Separatetaxation also improves women’s bargaining power within their households;as women usually earn less than their husbands, wives will generally gainfrom being taxed at an individual, rather than a joint, rate.
Because individual filing systems avoids incentives to have male-breadwinnerfamilies with female dependants, they are more gender-equitable.
Although individual filing systems are more gender-equitable than joint orfamily taxation systems, most analyses of horizontal tax equity take the house-hold as the unit of analysis. Assessing equity on a household (as opposed to indi-vidual) basis shows that many individual filing systems are not horizontallyequitable. First, individualization of personal income tax results in an overall sys-tem that is less well targeted on household income, and, therefore, for the sameoverall tax take, can be less progressive in terms of the distribution of after-taxincome between households as compared to systems of joint taxation (ibid.).
Second, as the chapters on Argentina, Ghana, India, South Africa, Ugandaand the United Kingdom illustrate, individual filing systems also introduceinequities between households with two earners and those with one earner anda financially dependent spouse, both of which have the same number ofchildren and the same total household income.10 Households with the singleearner and financially dependent spouse generally pay higher tax on theirincome than dual-earner households. Some have argued that this constituteshorizontal inequity, although others counter that it may not because thesehouseholds are not ‘the same’.
Taxation and gender equality 9

If financially dependent spouses provide unpaid work in male-breadwinnerhouseholds, this household ‘production’ creates in-kind income which should befactored into total household income (Pechman 1987). As Young (1999: 4) states:
The issue is that the value of women’s labour in the home is earned incomein kind, a form of imputed income, and one that gives a personal benefiteither to the person who performs it or to other members of the family.Ignoring its value for tax purposes is problematic.
Nelson (1996) echoes this view, arguing that horizontal equity requires that taxsystems should take into account the value of the output of unpaid work done inthe home, as well as the value of income earned outside the home. If this is notdone, she concludes, there will be unfair treatment of households in which bothhusband and wife do paid work, as compared to those with a male breadwinnerand a financially dependent female homemaker who provides a significantamount of unpaid work (see also Staudt 1996).
The idea that unpaid domestic work should be quantified and included in totalhousehold income for tax purposes is, however, controversial. Some are con-cerned that the tax burden of low-income households would increase more thanthe tax burden of high-income households. Phillips (2002: 65) notes that manytax analysts agree that it is appropriate for one-earner couples with a breadwin-ner and stay-at-home spouse to pay somewhat more tax on their market incomein order to offset the substantial tax-free economic benefits (goods and services)generated by the stay-at-home spouse’s unpaid work. Moreover, as Elson (2006:82) points out, taxes have to be paid in money, and cannot be paid through unpaiddomestic work (one cannot bake a cake and take it to the tax office as part of thepayment of the tax bill). She suggests that the value of unpaid work can beaddressed in other ways, for instance, through the provision of tax allowances towomen who participate in paid employment in order to offset some of the costsof buying substitutes for the unpaid domestic work they would otherwise do, orthrough the expenditure side of the budget in the provision of subsidized depend-ent care and other services.
Households with one earner, a stay-at-home spouse and children should alsobe compared to households with one earner, no stay-at-home spouse and children.In Argentina, Ghana and Morocco, the availability of a deduction for a depend-ent spouse causes single-parent households to bear a larger burden than male-breadwinner households with financially dependent spouses.
If household services are counted as income, the ability to pay of a householdwith one earner and a stay-at-home spouse will be higher than a household withtwo earners and the same money income because the two-earner couple needsmore income to purchase market goods to replace home production. The abilityto pay of a household with one earner and a stay-at-home spouse will also behigher in single-parent households. Although older children in both householdsare likely to provide some household production, the level will probably notapproach that provided by a full-time adult homemaker. Young children are
10 C. Grown

likely to provide even fewer services and may in fact require more attention fromthe adult earner. As Nelson (1996: 104) asks, why, with less household production,should the single parent have to often pay more in taxes than the dual-earner cou-ple with the same money income? This is clearly a relevant issue for several coun-tries in this study. In Ghana, for instance, a substantial minority, and in SouthAfrica, a majority of single-earner households with children are headed by women,and they bear a heavier burden of income tax than other types of households.
These arguments suggest that the discussion of horizontal equity is not simpleand can only be implemented in practice if adjustments are made to account for dif-ferences in household composition/earning structure and to incorporate unpaidwork in the definition of taxable ‘income’. The tax analyst would have to determinewhether there are non-earning adults in single-earner households who provide childcare, cooking, cleaning and other services that a dual-earner couple would have topurchase from their own earnings or supply themselves and then calculate the valueof that in the income that is liable to tax. Issues of valuation raise other problems,including the lack of consensus in the literature on the appropriate method.
Vertical equity in personal income taxes
These issues can also be examined from the perspective of vertical equity, whichposits that taxpayers who are not identical from an economic standpoint, but aredifferently situated, should be treated appropriately differently for tax purposes.Personal income taxes can achieve vertical equity if they have progressive rates;in other words, those with lower incomes should pay lower average tax rates thanthose with higher incomes. Evaluating vertical equity typically involves compar-ing households at different levels of income.
The example discussed above of the differential taxes paid by single- and dual-earner households can be reexamined from the principle of vertical equity.According to this principle, the incidence of single-earner and dual-earner house-holds should be different because these households are different in relevant ways,as explained above. CEDAW principles can add greater weight to the argumentthat single-breadwinner/stay-at-home spouse households should bear a heaviertax burden than dual-earner households. As Diane Elson (2006) has suggested:
What is at stake is not equality in terms of incidence of PIT on householdincome but equality in terms of implications of PIT for the set of gender rela-tions. Many gender equality advocates would argue that the PIT should notresult in a lower tax burden for families with breadwinner husbands andfinancially dependent housewives who do not engage in paid employmentbut should result in a lower tax burden for families in which both husbandsand wives undertake unpaid domestic work and are in paid employment. Thegrounds for doing this are that dual-earner-dual-carer families constitute amore equal gender regime than male breadwinner – female carer families.
This volume also adopts this point of view.
Taxation and gender equality 11

Explicit and implicit gender biases in personal income tax
Even though individual filing systems may be generally more gender-equitablethan joint filing in the respects suggested above, they still often contain explicitand implicit gender biases noted by Stotsky (1997). Table 1.1 illustrates the type
12 C. Grown
Table 1.1 Types of explicit and implicit bias in PIT
Explicit bias Implicit bias
Allocation of Joint property filed in non-labour income/ husband’s tax returns.family business However, women could income face a lower tax burden
because income earned from property is filed by the husband(Argentina)
Allocation of tax Reduction of tax for Professional exemptions preferences, dependants benefit men and deductions benefit exemptions and (Morocco) professionals and formal deductions Exemption limits higher employment – men more
for women (India) likely to be in this category(Argentina, Ghana, Mexico, Morocco, South Africa, the UK, Uganda)Exemptions for interest or dividend payments – menmore likely to own stocks and equities (Argentina, Ghana, South Africa)Household-based means testing of income for tax credit system in effect causes secondary earner to face a higher marginal tax rate.Inheritance tax exemption – paternal inheritance benefit (Uganda)
Rate structure or Hypothetical household tax burden example shows
single-headed households face higher tax burden – female single heads (Argentina, Ghana, Morocco, South Africa)Fiscal drag (Ghana, Uganda the UK)
Collection of Collection of taxes at source income tax and does not adjust for
income at the end of the year – women’s incomes is more irregular (South Africa)

of explicit and implicit gender biases in the personal income tax systems of thecountries studied in this volume.
Explicit gender biases exist in three countries in our study, but implicit genderbiases arise in all countries. One manifestation of explicit gender bias is the allo-cation of deductions, exemptions and other tax preferences on the basis of sex.This is the case in Morocco where married men are entitled to take deductions fordependent spouses and up to six children but married women can do so only ifthey can prove legally that they are the heads of their households. Another occur-rence of explicit gender bias in tax codes is the allocation of all non-labourincome to the husband regardless of the circumstances. Argentina is an exampleof this type of gender bias. In Argentina, all non-labour income from a jointly-owned business or financial investment is allocated to the husband to report onhis tax form. Although this may result in a lower tax burden on women, this pro-vision in the tax code constitutes discrimination. A third type of explicit bias is inIndia, which provides the rare example of explicit bias in favour of women.Women can receive a higher exemption for income tax than men can receive irre-spective of the circumstances they live in. The rationale for providing suchexemptions is to encourage women’s workforce participation
Stotsky (1997) observes that it is much more difficult to identify implicit genderbias, since this depends in large part on value judgements regarding desirablesocial and economic behaviour. Nonetheless, implicit gender biases are also pres-ent in all countries studied in this project. For instance, in Argentina, Ghana,Mexico, Morocco, South Africa, the United Kingdom and Uganda, it takes theform of professional exemptions and deductions that benefit professionals andthose in formal employment, for which men are more likely to be eligible, or inArgentina, Ghana and South Africa, exemptions for interest or dividend paymentson stocks and equities, two types of financial assets that men more than womenare likely to own.
Another type of bias was found in the Working Families Tax Credit (WFTC)in the United Kingdom which contained a disincentive to men taking on more ofthe unpaid work of child care that has traditionally been seen as women’s role.Introduced in 1999, the WFTC was intended to provide an income supplementto families of low-paid earners with children. It included a supplement if oneparent was employed for more than 30 hours per week, but this supplementcould not be claimed if the parents were employed for 30 hours between them,so that each did some paid work and some unpaid child-care work. It thereforecreated an incentive to maintain the traditional division of labour and a disin-centive to share paid and unpaid work more equally within families. This is aninteresting case in which feminist intervention on tax policy was successful; asa direct result of representations by the UK Women’s Budget Group, this biaswas removed from the new Tax Credits introduced in 2003, and the supplementfor 30 hours employment now applies however these hours are divided betweena couple.
Finally, the way tax is collected could also cause implicit gender biases. InSouth Africa, tax is collected by an automatic deduction of earnings at sourcecalled the Standard Income Tax on Employees (SITE). Budlender, Casale and
Taxation and gender equality 13

Valodia (Chapter 10) raise the possibility that the system disadvantages those whodo not work consistently over the year because the tax is deducted as if the workerderives consistent earnings, although many, especially women, work irregularly.
Vertical and horizontal equity in indirect taxes11
Indirect taxes are perceived to be horizontally equitable but vertically inequitable.They are seen to be horizontally equitable because equally wealthy (poor) peopletend to consume relatively equal amounts of goods and services. They are seen tobe vertically inequitable, as poor people tend to spend a larger proportion of theirincome on consumption than do the wealthy, so they pay relatively more tax as apercentage of income. Analytical studies find mixed support for the propositionthat VAT and other indirect taxes are regressive.12 Three studies in Sub-SaharanAfrica (Ghana, Madagascar and Uganda) that use data from the 1990s find that theVAT is progressive or mildly progressive, although excise taxes on kerosene andexport duties on traditional agricultural exports are regressive (Younger 1996;Younger et al. 1999). Some studies from Latin America and the Caribbean findsimilar results (Edmiston and Bird 2007).13
No study has yet examined the horizontal and vertical equity dimensions of indi-rect taxes from a gender perspective. This is due largely to a fundamental conceptualand empirical challenge, namely that expenditure (and often income) data are col-lected at the household level. The conventional approach to ‘gender’ at the householdlevel is to disaggregate households by the sex of the household head; this is themethod used by Bird and Miller (1989) that is discussed in Chapter 2, which is theonly other known study of the incidence of indirect taxation with a gender dimension.Yet, there are many problems with classifying households on the basis of headship.
One issue is that the definition of the household head is often conceptuallyfuzzy and empirically messy. The definition used by the Morocco StatisticalInstitute illustrates this well: ‘Any person who is considered by the members ofthe household as such, and generally contributes for a great part in the householdexpenses (breadwinner) and generally has the responsibility for the managementof the household expenditures.’ What is particularly problematic about this defi-nition is that it conflates two concepts: the person who contributes the greatestpart of household income may not be the same person who is responsible formanagement of household expenditure. Moreover, in countries such as SouthAfrica, if a head is said to be absent, an ‘acting head’ is designated instead; thisis often done in households with migrant members working abroad. Data codingdoes not distinguish between a ‘real’ head and an ‘acting’ head, so the catego-rization combines some very different situations. A more pragmatic challenge isthat different countries use different definitions of headship, which makes itimpossible to make valid comparisons across countries. The comparative analy-sis in Chapter 2, therefore uses the category of household headship as a baselineto compare to other work but then develops an alternative approach.
Ideally, to do a gender-aware incidence analysis, data are needed on expendi-ture by individuals, even though that expenditure may purchase goods and
14 C. Grown

services that are for individual use, for household use, and for others outside thehousehold. Data are also be needed to understand the gender relations that pro-duce male and female expenditure patterns, including the assignment of expendi-ture to specific individuals, control over expenditure, and the rules that govern theallocation of purchased goods across household and non-household members.Unfortunately, individual level expenditure data do not exist in most countries,especially developing countries, and the data that do exist do not have sufficientinformation to do a gender analysis.
Given the lack of intra-household information, there was considerable discus-sion in the project of how to do a gender analysis using household expendituredata. It was decided to exploit several demographic variables in the country-leveldata sets that are used in the incidence analysis in the chapters that follow, specif-ically, household sex composition and adult employment. Sex composition isused as a proxy for the gender relations in each country that produce observablemale and female expenditure patterns. The analysis distinguishes between house-holds with a greater number of adult females, households with a greater numberof adult males, and households with an equal number of adult males and females.A lack of information within each country on the gender relations that underlieexpenditure patterns makes it difficult to develop a priori hypotheses about whichhouseholds will bear the incidence of different taxes (e.g., the VAT, excisesor fuel).
Second, employment is used as a proxy for bargaining power; the analysis distin-guishes between female-breadwinner households (with no employed males), male-breadwinner households (with no employed females), dual-earner households, andhouseholds with no employed adults. In light of empirical information fromseveral studies, we hypothesize that employment and the income from that employ-ment will allow women to exert greater control over household expenditure, result-ing again in different expenditure patterns and tax incidence than in male-breadwinner and dual-earner households (Thomas 1993; Doss 2006).
Explicit and implicit bias in indirect taxes
Stotsky (1997) notes that taxes on goods and services, such as VAT, the retailsales tax, and the excise tax, tend not to show explicit gender bias in that the taxliability is established based on the purchase or production of a commodity.However, she does argue that implicit biases can be present in indirect taxes,manifested, for instance, through the choice of coverage of the tax (some goodsmay be exempt or zero rated), or through tax preferences given to certain pur-chasers or producers. Implicit biases may also result from differential expenditurepatterns by men and women of various goods. Indeed, Stotsky (ibid.: 11) arguesthat: (1) high rates of excise tax (as compared to the standard VAT) on alcoholand tobacco are implicitly biased against men, who disproportionately consumethese goods; and (2) lower rates of VAT (than the standard rate) on medical careare implicitly biased against men, who consume less of these goods than dowomen.
Taxation and gender equality 15

A problem with this interpretation is that it implies that governments shouldn’ttake account of whether alcohol, tobacco, and medical care are equally sociallyvaluable consumption goods. Yet there are grounds from both a public financeand a gender equality perspective to distinguish different types of goods andservices. For instance, in the public finance literature, ‘merit goods’, which aresocially valuable and have positive externalities are distinguished from ‘demeritgoods’, which are goods that may have adverse effects both on those who con-sume them and on others. Tobacco fits the description of a demerit good, whilehealth care is a merit good. The public finance literature also distinguishes basicnecessities, which are essential for a decent standard of living, from luxuries,which are optional extras. Health care is also a necessity, while alcohol con-sumption can be considered an optional extra.
Many tax economists accept these distinctions and consider it justifiable to taxmerit goods and basic necessities at a lower rate than demerit goods and luxuries.Once this distinction is accepted, inequality in tax incidence between those whoconsume demerit or luxury goods that attract higher tax rates and those who con-sume merit goods or basic necessities that attract less tax would not in itself con-stitute an implicit gender bias. Recall also the discussion earlier in the chapterwhether the meaning of the word ‘bias’ implies an unjustified asymmetry. It maybe that women have different health needs (e.g., reproductive health) that requirethem to make more use of medical facilities than men. Reproductive health isboth essential for economic development and a basic human right. From aCEDAW perspective, then, this would be an additional argument for differentialtax treatment of those goods/services that promote substantive gender equalityand higher overall social welfare.
Approach to the country studies
A gender analysis of taxation would examine the content of tax laws and taxrules, the burden or incidence of taxes, and the behavioural responses to taxchanges. Chapters 3–10 undertake the first two types of analysis for personalincome tax and selected indirect taxes (the VAT, excises, and fuel levies). In sixof the eight countries represented in these chapters, this is the first gender analy-sis of tax laws and rules and the burden of direct taxes. In most countries, this isthe first gender analysis of the incidence of indirect taxes.14 Although we wereunable to examine behavioural responses to tax changes in the current project,this is an important issue that will be a subject of future research.
Each of the country chapters follows the same overall approach. They beginwith an analysis of the gender differences in economic activity, discussed above,that are relevant to the analysis of the impact of the country’s tax system onwomen and men.
Next, the studies examine, from a gender equality perspective, the various dimen-sions of the personal income tax system, including rate structure, definition ofincome subject to tax, exemptions, tax preferences and whether the system adjustsfor inflation. They also analyse the tax burden of different types of households,
16 C. Grown

according to selected gender characteristics, at the median income, one-half themedian income, and twice the median income.
Following the analysis of PIT, each country team undertook an incidenceanalysis of indirect taxes using national-level household income and expendituresurveys. The goal of tax incidence analysis is to determine the share of taxes paidby different groups in society, in this case for different gendered household typesat different levels of income. The incidence analysis was conducted for the totalof value-added taxes, excise taxes, and fuel levies; for each specific tax; and forspecific commodities, such as food, children’s clothing, and alcohol, items thatwere chosen because they highlight the gendered nature of expenditure. To do theanalysis, the research teams developed a consistent empirical methodology forboth direct taxes and indirect taxes that can be used across countries. In severalcountries in this project, the gender analysis is also disaggregated by race andethnicity. The methodology is described in detail in Chapter 2.
Third, each chapter simulated a number of context-relevant tax policy reformsand examined how such reforms would change tax incidence. One common sim-ulation across countries was to either exempt or zero-rate commodities that areboth important for the poor and that can advance at least one dimension of genderequality, for instance, by reducing women’s unpaid work burdens or by makingit easier for women to engage in paid employment.15 In order to compensate forpossible revenue losses as a result of these reductions, country teams also simu-lated raising taxes, for instance, on luxury items, fuel for private transport,tobacco or alcohol, and other items. Finally, each chapter made a series ofrecommendations for reform of the national tax system.
Chapter 2 describes the above approach in greater detail and brings togetherthe findings from each country in a comparative perspective. Chapter 11 discussesthe implications of the findings of the comparative analysis and the countrychapters for international and national tax policy. While some countries (theUnited Kingdom and South Africa) have undertaken reforms to remove explicitgender biases in their personal income tax laws, no personal income tax systemcan yet be classified as transforming unequal gender relations. For instance, inSouth Africa, reforms in 1995 eliminated separate schedules for taxpayers basedon their marital status but introduced new inequities against non-nuclear familiesinto the system (see Chapter 8). Similarly, the United Kingdom has a progressiveindividual filing system but tax credits that are means-tested at the family levelare based on two problematic concepts, that of ‘main carer’ and ‘main earner’which go against the equal sharing of paid and unpaid household roles. The taxsystems of a few countries (Morocco and India) actually reinforce certain genderinequalities, while others are at best gender-neutral. As a result, in most countriesthere is an urgent need for reform of some aspects of the personal income taxsystems to eliminate explicit and implicit gender biases.
The analysis of indirect taxes found that in some countries indirect taxes areboth pro-poor and gender-aware in relation to expenditure. This depends, though,on the structure of zero-rated and exempt goods.16 In other countries the findingsare not so clear-cut. The policy simulations, however, show that there are steps
Taxation and gender equality 17

that governments can take to increase the degree of gender equality through thetax system while maintaining revenue neutrality. At the same time, major trans-formations should happen outside the tax system through government expendi-ture on public services for poor households.
Conclusion
This volume seeks to make the case that gender equality in taxation is worthyof academic and policy attention. The project on which it is based developed auseful methodological approach that was successfully applied in countries at verydifferent levels of development and with different tax systems. This methodologycould be extended to other countries that have the requisite consump tion expen-diture and taxation data. The project has also generated a set of very detailedcountry studies that provide important information for tax policy-makers, as wellas some specific recommendations for steps that could be taken to promotegender equality in ongoing country tax reforms.
However, the research discussed herein is only a first step in opening up a newarea of research, and much more analysis needs to be undertaken. Chapter 11 dis-cusses several areas for future research. Three of these are highlighted here as ahigh priority for next steps.
First, the tax incidence analyses in this volume explore only one dimension offiscal policy. Yet, most analysts would point out that the effects of tax policyshould be seen in conjunction with government expenditure. As Bird andGendron (2007: 18) note, what matters most fundamentally are the overall effectsof the fiscal system on income and well-being of different people. And, becausemany social policy instruments are designed to ‘work’ on both the revenue andexpenditure sides of the budget, it is important to devise a methodology forresearch that combines gender-aware tax incidence with gender-aware benefitincidence.
Second, this volume has focused only on first-order approximations of tax inci-dence and has not considered the behavioural impacts of tax changes. A secondline of research could fruitfully examine behavioural responses to changes in thePIT, such as in female and male labour supply in developing countries (which hasnot yet been done) or to changes in indirect taxes and excises, such as intra-household income shifting and changes in time allocation in both paid and unpaidwork. Examining some of these behavioural responses would have to go beyondtraditional economic approaches. It will require delving into issues of intra-household power and distribution, drawing on techniques and information fromother disciplines such as anthropology and sociology.
Finally, it would be useful to broaden the gender analysis of taxation to the twoother cornerstones of tax policy, namely, efficiency and administration, which arewide open areas for study. With solid research on these issues, and appropriate pol-icy attention, it may be possible to develop systems of revenue and expenditure thatboth are gender-equitable and generate sufficient revenue to fund governmentservices aimed at reducing poverty and improving social welfare.
18 C. Grown

Notes
1 It is difficult to distinguish income tax from corporate tax revenue in Mexico, so this figureincludes both. Moreover, the total tax revenue figure in Mexico is high between the years2006–08 because the fuel tax was actually a subsidy in those years. Although the fuel taxis classified as a Special Tax on Production and Services, its rate varies according to inter-national prices. It is calculated as the difference between Mexican and international pricesdivided by the international price. Thus, when Mexican fuel prices are higher than inter-national fuel prices, the tax rate is positive, when Mexican fuel prices are lower than inter-national fuel prices, the rate applied is negative and the tax effectively becomes a subsidy.
2 The share of VAT is a percentage of total revenue; the latter including non-tax revenue(fees, income and foreign assistance) for Ghana.
3 Mexico is not strictly comparable to the other countries because of the inclusion of fueltaxes in the denominator, which, as explained above, was effectively a subsidy in 2007.
4 In much of the mainstream economics literature, gender is often conflated with biolog-ical sex and interpreted to mean a focus on the needs of men equally with women. Forfeminist economists, the concept of gender is much richer, implying the social relationsof power that govern hierarchies among people based on biological sex, age, life-cycleposition, and family status (Ferber and Nelson 1993).
5 The System of National Accounts, a set of internationally accepted rules for calcu-lating Gross National Product (GNP), distinguishes between ‘production’ and ‘non-production activity,’ with the former activities being included and the latter excludedin the calculation. Production is defined as any activity that one could, at least intheory, pay someone else to do. Unpaid domestic services are considered non-pro-duction activities and are therefore not counted as part of the GNP. By contrast,some kinds of unpaid subsistence production, such as collecting fuel and water andgrowing subsistence crops, are now regarded as being production and should there-fore be counted in the GNP.
6 Elson (2006) noted that in one instance the CEDAW committee expressed concernsabout taxation systems that perpetuate stereotypical expectations for married women(Germany, CEDAW, A/55/38 part I (2000) 29 at para. 314).
7 Underpinning these criteria is the principle of ability to pay, which recognizes that someindividuals are more easily able to contribute than others. The hallmark of this princi-ple is the progressivity of the tax system.
8 Nelson (1996) notes that many governments, especially in OECD countries, which haveadopted independent filing have also incorporated some consideration of family andhousehold relationships, through manipulation of exemptions, deductions, credits andrate schedules. So, while individuals may be the filers, the tax paid is usually not basedon the individual’s earnings alone, but also takes into account whether they are singleor married, have children or are childless, and whether they are or are not the singleearners in their household.
9 Joint taxation has been shown to have a number of implicit gender biases (Stotsky1997). In the presence of a progressive rate schedule, the gross income earned by thesecondary worker is taxed at the (high) marginal rate that applies to the last dollarearned by the principal earner (OECD 2005). In this way, joint taxation creates disin-centives for the second earner (generally the woman) to enter the labour market.
10 In the United Kingdom, the existence of the Child Tax Credit and Working Tax Creditreduces the total tax burden on both single-earner and dual-earner households, more sofor the latter.
11 The discussion in this section draws extensively on two memoranda prepared by DebbieBudlender and Diane Elson for a project meeting in Durban, South Africa, February2007. We are grateful for their insights on this topic.
12 A tax is progressive if the proportion of income paid in tax increases as income increases,regressive if the proportion of income paid in tax decreases as income increases, and pro-portional if the proportion of income paid in tax is constant as income increases.
Taxation and gender equality 19

13 These studies use expenditure as the base to calculate incidence (see Chapter 2 for anexplanation of how incidence is calculated). Using expenditure as the base gives differ-ent results than using income as the base because the marginal propensity to saveincreases as income increases. It is possible that if these studies had used income data,the incidence of consumption taxes would be less progressive and even mildly regres-sive (Bird and Gendron 2007).
14 As part of the South Africa Women’s Budget Initiative, James and Simmonds (1997)and Smith (2000) undertook analyses of indirect taxes, but not at the same level ofcoverage or quantitative detail.
15 Zero rating is when the rate of tax applied to sales is zero although a credit is still givenfor taxes paid on inputs. Exemptions are similar to zero rating in that taxes are notcharged on outputs but are different in that tax paid on inputs cannot be reclaimed. Thisis explained more fully in Chapter 2.
16 Some countries also conducted the incidence on the basis of income instead of expen-diture. By the measure of income, the incidence of indirect taxation becomes regressive.See Mexico (Chapter 5).
References
Artecona, R. and Cunningham, W. (2002) ‘Effects of Trade Liberalization on the GenderGap in Mexico’, Policy Research Report on Gender and Development, Working Paper21, Washington, DC: World Bank.
Bahl, R.W. and Bird, R.M. (2008) ‘Tax Policy in Developing Countries: Looking Back –and Forward’, National Tax Journal 61(2): 279–301.
Barnett, K. and Grown, C. (2004) Gender Impacts of Government Revenue Collection:The Case of Taxation, London: Commonwealth Secretariat.
Barreix, A. and Roca, J. (2007) ‘Strengthening a Fiscal Pillar: The Uruguayan DualIncome Tax’, CEPAL Review 92 (August): 121–40.
Bird, R. (2005) ‘Value-Added Taxes in Developing and Transitional Countries: Lessonsand Questions’, International Tax Program Papers 0505, International Tax Program,Toronto: Institute for International Business, Joseph L. Rotman School of Management,University of Toronto. Available at: www.rotman.utoronto.ca/iib/ITP0505.pdf.
Bird, R. and Gendron, P. (2007) The VAT in Developing and Transitional Countries, NewYork: Cambridge University Press.
Bird, R. and Miller, B. (1989) ‘The Incidence of Indirect Taxes on Low-Income Householdsin Jamaica’, in Economic Development and Cultural Change, Chicago: University ofChicago Press.
Browning, M. and Bonke, J. (2006) ‘Allocation Within the Household: Direct SurveyEvidence’, University of Oxford Department of Economics Discussion Paper No. 286,Oxford: University of Oxford, August.
Budlender, D. (2002) Why Should We Care about Unpaid Work?, Harare, Zimbabwe:UNIFEM Southern African Region Office.
Doss, C. (2006) ‘The Effects of Intra-Household Property Ownership on ExpenditurePatterns in Ghana’, Journal of African Economies 15(1): 149–80.
Edmiston, K.D. and Bird, R. (2007) ‘Taxing Consumption in Jamaica’, Public FinanceReview 35(1): 26–56.
Elson, D. (1995) Male Bias in the Development Process, Manchester: Manchester UniversityPress.
20 C. Grown

—— (2006) Budgeting for Women´s Rights: Monitoring Government Budgets forCompliance with CEDAW, New York: UNIFEM.
—— (2007) ‘Vertical Equity, Horizontal Equity and Gender Equality in Taxation’, DraftNote for Methodology Meeting of Gender and Taxation Project, Durban, South Africa.
Ferber, M. and Nelson, J. (eds) (1993) Beyond Economic Man: Feminist Theory andEconomics, Chicago: University of Chicago Press.
Fox, W.F. and Gurley, T. (2005) ‘An Exploration of Tax Patterns around the World’, TaxNotes International February 28: 793–807.
Haddad, L., Hoddinott, J. and Alderman, H. (eds) (1997) Intrahousehold ResourceAllocation in Developing Countries: Methods, Models, and Policy, Baltimore, MD:Johns Hopkins University Press for the International Food Policy Research Institute.
Himmelweit, S. (2002) ‘Making Visible the Hidden Economy: The Case for Gender-Impact Analysis of Economic Policy’, Feminist Economics 8(1): 49–70.
International Labour Organization (2009a) Global Wage Report 2008–09, Geneva: ILO.—— (2009b) Global Employment Trends for Women: March 2009, Geneva: ILO.Inter-Parliamentary Union (2003) The Convention on the Elimination of All Forms of
Discrimination Against Women and Its Optional Protocol, New York: United Nations.James, B. and Simmonds, G. (1997) ‘Energy’, in D. Budlender (ed.) The Second Women’s
Budget, Cape Town: Institute for Democracy in South Africa, pp. 200–48.Lundberg, S., Pollak, R. and Wales, T. (1997) ‘Do Husbands and Wives Pool Their
Resources?: Evidence from the United Kingdom Child Benefit’, Journal of HumanResources 32(3): 463–80.
Martinez-Vazquez, J. (2001) ‘The Impact of Fiscal Policy on the Poor: Fiscal IncidenceAnalysis’. Available at: www.fiscalreform.net/library/pdfs/martinez_2001.pdf (accessedJuly 2007).
Musgrave, R. and Musgrave, P. (1989) Public Finance in Theory and Practice, New York:McGraw-Hill.
Nelson, J. (1996) ‘Feminist Theory and the Income Tax’, in Feminism, Objectivity, andEconomics, New York: Routledge.
OECD (2005) ‘Taxing Working Families: A Distributional Analysis’, in OECD Tax PolicyStudies, Paris: OECD.
Oostendorp, R.H. (2004) ‘Globalization and the Gender Wage Gap’, Policy ResearchWorking Paper 3256, Washington, DC: World Bank.
Pechman, J. (1987) ‘Tax Reform: Theory and Practice’, Journal of Economic Perspectives1(1): 11–28.
Phillips, L. (2002) ‘Tax Law and Social Reproduction: The Gender of Fiscal Policy in anAge of Privatization’, in B. Cossman and J. Fudge (eds) Privatization, Law and theChallenge to Feminism, Toronto: University of Toronto Press, pp. 42–85.
Quisumbing, A. and Maluccio, J. (2000) Intrahousehold Allocation and Gender Relations,FCND Briefs 84, Washington, DC: International Food Policy Research Institute (IFPRI).
Smith, T. (2000) ‘Women and Tax in South Africa’, in D. Budlender (ed.) The FifthWomen’s Budget, Cape Town: IDASA (Institute for Democracy in South Africa).
Staudt, N. (1996) ‘Taxing Housework’, Georgetown Law Journal 84: 1571–647.Stotsky, J. (1997) ‘Gender Bias in Tax Systems’, Tax Notes International 9 June,
pp. 1913–23.Thomas, D. (1993) ‘The Distribution of Income and Expenditure within the Household’,
Annales d’Economique et de Statistique 29: 109–36.
Taxation and gender equality 21

Tzannatos, Z. (1999) ‘Women and Labour Market Changes in the Global Economy:Growth Helps, Inequalities Hurt and Public Policy Matters’, World Development 27(3):551–69.
United Nations (2009) The Millennium Development Goals Report 2009, New York:United Nations.
United Nations Development Fund for Women (2000) Progress of World’s Women, NewYork: UNIFEM.
United Nations Development Programme (1995) Human Development Report 2005, NewYork: Oxford University Press.
Young, C. (1999) ‘Taxing Times for Women: Feminism Confronts Tax Policy’, DunhillMadden Butler Lecture, Faculty of Law, University of Sydney. Available at: www://80-web.lexis-nexis.com.osiyou.cc.
—— (2000) ‘Women, Tax and Social Programs: The Gendered Impact of Funding SocialPrograms Through the Tax System’, in Status of Women, Canada. Available at:www.sws-cfc.gc.ca/pubs/.
Younger, S. (1996) ‘Estimating Tax Incidence in Ghana: An Exercise Using HouseholdData’, in D. Sahn (ed.) Economic Reform and the Poor in Africa, Oxford: Clarendon Press.
Younger, S., Sahn, D., Haggblade, S. and Dorosh, P. (1999) ‘Tax Incidence inMadagascar: An Analysis Using Household Data’, The World Bank Economic Review13(2): 303– 31.
22 C. Grown

2 Methodology and comparativeanalysis
Caren Grown and Hitomi Komatsu
Introduction
This chapter explains the methodology that each country team used to inves-tigate gender bias in personal and indirect taxes. It also synthesizes the findingsacross countries and puts them into perspective against other literature on taxincidence, especially in developing country economies.
Personal income tax (PIT) analysis
The analysis of the personal income tax system examined several features of eachnational tax system, including whether the system is schedular or global; the rulesfor filing tax returns; the definition of taxable income and exemptions in each sys-tem; the rate structure applied to taxable income; the various tax preferences thatreduce the tax base and lower taxable income; and how tax rates are adjusted forinflation.
Schedular versus global tax systems
Under a schedular income tax, each source of income, such as from wage employ-ment or self-employment or capital gains faces a different schedule of tax rates.Under a global income tax system, income from various sources is aggregated andtypically one schedule of tax rates is applied. Global income taxes often haveschedular elements applying to income from certain sources, such as capital gains.Global income taxes may be subdivided into two main types based on whether tax-payers file joint returns or individual returns. Of the countries in this study,Argentina, Mexico, Morocco, South Africa and the United Kingdom have globaltax systems (with schedular elements), while India, Ghana and Uganda haveschedular systems. The filing unit in all countries is the individual taxpayer.
Stotsky (1997) has examined the presence of explicit and implicit genderbiases in both systems. She notes that global income taxes have typically beenthe source of explicit gender bias through rules governing the allocation ofshared non-labour or business income, the allocation of exemptions, deduc-tions and other tax preferences, the setting of tax rates and the responsibility

for filing tax returns, and hence have been the focus of efforts to eliminatesuch bias, particularly in industrialized nations. Explicit gender discriminationin a pure schedular income tax is rare because tax liability is established withrespect to a particular source of income rather than a particular taxpayer. Inother words, income from wages might be withheld from workers according to a specific rate schedule, income from interest income under another rateschedule, and so on.
However, implicit gender bias can be present in a schedular system, as evi-denced by the case in Argentina, where the PIT system provides for three distinctemployment categories, each with its own rules: employees, self-employed tax-payers (high- and medium-income independent workers) and monotributistas(individuals registered under the simplified tax regime for small and medium-sized taxpayers, who are mostly low-income independent workers). As seen inChapter 3, the taxes paid by the self-employed and monotributistas are wellabove those of paid employees at the same level of income; since women pre-dominate among the self-employed and monotributistas, this can constitute animplicit bias against women.
Rate structure
Within most personal income tax systems, income is sliced into brackets. Theincome in these brackets is taxed at increasing marginal rates, which is the basicmodel of a progressive tax system. The degree of progressivity depends on thewidth of the brackets and the steepness of the increase in the marginal rate appliedto income in each bracket, on the one hand, and on the tax threshold – the level ofearnings at which income tax is first paid, on the other. Most countries in this studyhave between five and seven income brackets, although the United Kingdom hasfewer.
In most countries discussed in this volume – Argentina, Ghana, India, Mexico,South Africa and Uganda – a large percentage of the working population fallsoutside the income tax net. Women are less likely to be inside the tax net in thesecountries because they earn less income and are more likely to work in the infor-mal economy, often as self-employed or unpaid family workers, where their earn-ings are not otherwise reported and therefore more likely to escape tax. In India,the average income is less than the income tax threshold and hence only 2.7 percent of the population (and less than 0.3 per cent of working-age women) areinside the income tax net, and in Uganda, 82 per cent of the labour force (and 89per cent of employed women) have income that is below the income tax thresh-old. In South Africa, 73 per cent of employed women and 65 per cent ofemployed men have earnings below the income tax threshold, while in Mexico,64 per cent of the labour force and 72 per cent of women workers fall outside ofthe income tax net. In Ghana, 40 per cent of working women and 27 per cent ofworking men earn less than the income tax threshold. In Morocco, 26 per cent and35 per cent of men and women, respectively, in the private sector fall outside ofthe income tax net in contrast to nearly all public sector employees who are withinit. Finally, and not surprisingly, the United Kingdom has the largest coverage in
24 C. Grown and H. Komatsu

income tax for the population. Most adults pay personal income tax, includingmany of those who receive tax credits.
Definition of income and exemptions
It is important to delineate what each country’s tax code considers as taxableincome and what it exempts from taxes. Provisions that define taxable incomeand exemption from income tax can create implicit gender biases. In Argentinaand Ghana, exempt income includes dividend payments and interest paid to indi-viduals by financial institutions and interest paid on government bonds. Theseexemptions not only predominantly benefit higher-income groups but also tend tobenefit men more than women because men are more likely to own financialassets, creating an implicit bias. In Uganda, property gained by gift, bequest orinheritance is exempt from personal income tax. Since men are more likely toinherit property due to the patrilineal inheritance system dominant in most com-munities, this tax provision favours men. Further, income earned from certainprofessions is exempt from tax in Uganda. For example, wage earnings ofmembers of the Defence Force, the armed forces, the police and the prisonservices are exempt from income tax. This disproportionately favours men sincethey make up 95 per cent of the Defence Force and 75 per cent of the police force.
Tax preferences
In most countries, taxpayers may claim various forms of tax relief – deductionsor allowances – which can be structured differently (e.g., as flat amounts or as apercentage of income or according to a particular formula), and credits againsttax on personal income.1 Table 2.1 lists key deductions/allowances and creditsby country, excluding those for financially dependent spouses and childrenwhich are discussed separately below.
Deductions and allowances that reduce total taxable income disproportionatelybenefit those with higher incomes who pay higher marginal tax rates. Further, inmost countries discussed in this volume, individuals with higher incomes are theheaviest users of deductions and allowances, largely deductions for professionalexpenses, interest on loans or insurance premiums. This tends to undermine theprogressivity of income tax. Since men predominate in the higher-income cate-gories and women predominate in the lower-income categories, the structure ofdeductions can also contain implicit gender biases, given the gendered nature ofemployment and care-giving roles.
In Morocco and the United Kingdom, there are also specific deductions andallowances available to taxpayers which favour high-income earners who aredisproportionately male. For example, in Morocco, certain groups of employees –casino workers, night workers and selected other professions – can claim deduc-tions of up to 28,000 dirham per year. Men predominate in these professions.More broadly, deductions for certain types of expenses that may enable womento participate in paid employment – such as child care – are not available. In theUnited Kingdom, deductions also show a pattern that somewhat favours men.
Methodology and comparative analysis 25

Table 2.1 Key deductions and exemptions in PIT (excluding those for non-earningspouses and dependant children)
Deductions Exemptions
Argentina Deductions only available Minimum threshold annual to self-employed income of less than AR$9,000 (high-income) workers and (for self-employed and wage workers in formal earners)employment for: Incomes from labour-related contributions to pension awards and seniority and health care schemes, compensation, but excludes life insurance premiums, damages to women dismissed funeral expenses, retirement for pregnancyinsurance, medical coverage Interest payment or dividendscosts of taxpayers and from financial institutions orfamily members, interest governmentson mortgage-backed loans, expenses on domesticworkers
Ghana Interest on loans, rent on Tax-free threshold of GH¢240. land or building occupied by Interest payment or dividend or the business, repair and any other income of an approved maintenance costs of financial institutionequipment and utensils, bad Capital sums paid to a person debts, research and as compensation or for personal development expenditure, injuries or the death of another capital allowances, foreign personexchange losses incurred Scholarship, bursary or similar with respect to the conduct endowmentof the business and carry Pension incomesover losses Salary, allowances, pension and Life insurance premiums, gratuity of the Presidentcontributions to pension funds
India Entertainment allowance Men’s exemption threshold is and business expenses 150,000 Rs while women’s
exemption threshold is higher at 180,000 RsAllowance for research
Mexico Professional expenses, Monthly exemption threshold of goods and raw materials for $4,380.30 Mexican pesos. businesses. Medical and Overtime pay, reimbursements funeral costs, charitable for medical and funeral expenses, donations, mortgage interest social security payments, payments. Inherited wealth, insurance indemnities or revenues from jointly owned compensation, work-related goods of married couples travel expenses
Morocco Donations to charity, interest Exemption threshold is 28,000 payment on borrowing, dirhams. Pension incomes, life mortgage payments, insurance payments, alimony,insurance premiums and student tuition, lay-off work contributions to social indemnities, employers’ security contribution to social security

Deductions are more often available to higher earners, mostly men, and tend torecognize expenses that are directly incurred during employment better than theydo the costs for those with care-giving responsibilities in getting to employment.For instance, deductions for child-care expenses are limited and available only tothose whose employers participate in a national scheme.
Methodology and comparative analysis 27
Table 2.1 (Continued)
Deductions Exemptions
Pension incomesDeductions for professionalexpenses for certain employee (e.g., journalists,pilots, life insurance agents,casino employees)
South Africa Contributions to medical Exemption threshold is R40,000 insurance, contributions to for those under age 65 and retirement funds, subsistence R65,000 for the elderlyand entertainment Investment income up to allowances, travel expenses, R19,000 for those under age 65 donations to certain charities and R27,500 for the elderly(subject to limits)Normal expenditures and losses incurred in the production of income
Uganda Expenditures and losses Minimum income exempt from incurred in the production PAYE is Shs 130,000 per month.of income and disposal Educational grants, property of assets inheritance, pension income, life
insurance payments. Earners of agriculture, plantation or horticulture income. Wage incomes of employees of the armed forces, Defence Force, police and prison services
United Professional expenses for Exemption threshold of £6,035 Kingdom employees (business mileage (higher for older people)
and fuel, professional fees Incomes from most means-tested and subscriptions, tools and social security benefits and some specialist clothing, capital non-means-tested such as child allowances, household benefits; income from certain expenses for working at savings products, such as home, travel and subsistence National Savings Certificates, costs.) Personal Equity Plans and Child-care expenses Individual Savings Accountsprovided or funded byemployer, up to £55 a weekNon-refundable tax creditsfor donation to charitiesNon-refundable tax credit on dividends

Although tax allowances or deductions erode the tax base, tax credits reducethe tax due, and may explicitly benefit lower-income groups, which increases theprogressivity of the income tax. In the United Kingdom, for example, Child andWorking Tax Credits are means-tested payments to families. The inclusion ofthese tax credits in the UK tax system makes it highly redistributive towards bothpoorer households and women within both poor- and median-income households(see Chapter 10). However, the family-based means testing of income underminesthe individual filing system and results in secondary earners facing a higher mar-ginal tax rate. The Working Tax Credit is paid to families with at least one memberin paid employment and is not increased when there is a second earner. It there-fore provides an incentive for only one earner in a family or household to takeemployment. Since women are more likely to be seen as secondary earners, thishas the effect of reinforcing existing gender roles and inequalities.
Deductions for dependent children and non-earning spousesor other adults
Many countries with individual filing systems take account of family and house-hold relationships through exemptions, deductions, credits and rate schedules.While ‘individuals’ may be the filers, the tax paid can also take into accountwhether they are single or married, have children or are childless and whether ornot they are the sole earners in their household (Nelson 1996).
Table 2.2 shows the tax relief given in each system for financially dependentspouses and children. Argentina, Ghana and Morocco make provisions for depen -dent children and also include relief for financially dependent spouses. The UnitedKingdom provides tax credits for children but not spouses. India, Mexico, SouthAfrica and Uganda make no provisions for non-earning spouses or dependentchildren. The system of deductions for a financially dependent spouse in Argentina,Ghana and Morocco can create a bias against single parent households as will bediscussed in the vertical and horizontal equity section below.
Inflation
Finally, the analysis in each country study considers the effects of inflation, andspecifically whether personal income tax brackets are indexed to inflation and thefrequency of rate adjustments. The fiscal drag caused by infrequent inflationadjustments in Ghana and Uganda resulted in an implicit gender bias. In Ghana,since income tax brackets are not indexed, it has resulted in an increase in the realvalue of taxes paid by households. Low-income earners – who are likely to bewomen – have seen an increasing proportion of their nominal income move intoa higher tax bracket. In Uganda, if the minimum monthly tax exemption thresh-old had stayed at the same real value, the threshold of Shs 130,000 in 1997 shouldhave been raised to Shs 197,271 in 2007. But since the threshold was held con-stant for over a decade, wage earners whose monthly incomes in 1997 wereexempted from income tax had to pay tax in 2007. This group includes a higher
28 C. Grown and H. Komatsu

proportion of women than men, suggesting that a tax system that fails to adjustfor fiscal drag can burden women disproportionately.
Vertical and horizontal equity
Each of the country chapters illustrates – with either real data or hypotheticalexamples – the impacts of the PIT on different household types according to
Methodology and comparative analysis 29
Table 2.2 Tax relief for non-earning spouses and dependant children
Non-earning spouse Dependent children
Argentina Deductions for financially Family deductions for dependent dependent spouse children or parents, provided provided they do not earn they do not have individual individual income over income of over AR$9,000a certain threshold Maximum deductions: AR$ Maximum deductions, 5,000 per year per childAR$ 10,000 per year
Ghana Tax relief for financially Tax relief for those who have at dependent spouse whose least two dependent children.income is less than An education allowance of GH¢35 in a year. No GH¢30 can also be claimed for restriction on the sex up to three children or wards in of spouse registered educational institutions
India None NoneMexico None NoneMorocco Reduction in PIT for a Reduction in PIT for own
financially dependent children and children under his spouse. Women are legal responsibility if they meet considered the dependant the following conditions: of male taxpayers. (1) They must not have an incomeWomen can benefit from above a threshold; andthese tax reductions if she (2) They are not older than 21 can prove legally that her (or 25 years if studying). husband and children are 200 dirhams for each of the firstdependent on them three children and 30 dirhams
for each of the next three South Africa None NoneUganda None NoneUnited None Refundable Child Tax Credit forKingdom low- to middle-income families
according to the number of children under the age of 16 (or 18 if in full-time education). CTC is means-tested at family level (low threshold for maximum amount, then tapered)1
Note: 1 Refundable Child Tax Credit is much more generous for low-income families thannon-means-tested Child Benefit.

vertical and horizontal equity. Each country’s PIT rates were applied to individualincome, which was then summed for the following household types:
• One male earner with two dependent children and a financially dependentwife. We refer to this household as the male-breadwinner household.
• A single parent (either male or female) who is employed with two dependentchildren. We refer to this household as the single-parent household.
• A dual-earner married couple with two dependent children, where male earningsare higher than female earnings. We refer to this as the dual earner household.
Note that we do not consider single-person households in this analysis.To explore vertical equity, we examined households at half the median income, the
median income, and twice the median income. Most countries have achieved a mod-est degree of progressivity in their personal income tax systems. In other words, richerhouseholds pay a higher proportion of their income in tax than do poorer households.
We explored horizontal equity by examining differences across each type ofhousehold at each of the three income levels described above. It is somewhattreacherous to make comparisons across countries. First, as noted, in many coun-tries, the majority of the population falls outside the personal income tax net.Second, although we tried to develop uniform household categories, there remainvariations across countries in the distribution of households of different types, andin the proportion of households that do not fit into these categories. Nonetheless,some interesting findings do emerge.
In all countries, male-breadwinner households with a single earner, a financiallydependent spouse and two dependent children by and large pay a higher share oftheir income in tax than dual-earner households with two dependent children (seeTable 2.3). This is a characteristic result of individual filing systems. But impor-tant differences show up on closer examination of these categories.
For instance, in Morocco, dual-earner households where the woman’s income ishigher than the man’s pay more tax than those households where the man earns thehigher income. The difference arises because tax reductions for dependants are avail-able only to men. A woman can benefit from tax reductions only if she can provelegally that her spouse and children are financially dependent on her. Hence, womenin dual-income couples in Morocco cannot claim dependants even when they earnmore than their husbands.
In India, tax incidence is also lower for dual-earner than for male-breadwinneror single-parent households, but within the latter two categories, incidence ishigher when the single breadwinner or single parent is male.2 This is because theincome tax threshold for male and female taxpayers differs: for male taxpayers itis Rs. 150,000, while for female taxpayers, it is Rs. 180,000. Dual-earner house-holds with earnings totalling Rs. 300,000 do not attract tax if both spouses earnbelow their respective exemption limits. Male-breadwinner or male single-parenthouseholds with the same earnings pay Rs. 15,000 in tax, while female-breadwinneror female single-parent households pay Rs.12,000. This is an example of a rareexplicit bias against men in a schedular system.
30 C. Grown and H. Komatsu

Other horizontal inequities exist in some countries. In Ghana, single-parenthouseholds bear a heavier burden of tax than do both dual-earner and male-breadwinner households. A household with two earners and three children, witha combined yearly income of GH¢650, in which one worker earns GH¢450 andthe second earns GH¢200 per annum, pays GH¢3 in tax. This contrasts with ahousehold with the same yearly income but only one earner and a financiallydependent spouse who pays tax of GH¢13.50. Nevertheless, the largest burden isborne by single-parent households with the same number of children but nodependent spouse because they cannot claim tax relief for a financially dependentspouse. As Chapter 6 notes, about 34 per cent of single-earner households do nothave an adult male and about 44 per cent of single-headed households are headedby women.
In Argentina, the income tax paid depends both on household composition andon whether taxpayers are employees, self-employed or monotributistas (small ormedium-sized taxpayers).3 At twice median income (median income falls belowthe tax threshold), a self-employed single-parent household with two childrenpays an income tax of 7,420 AR$, whereas a wage-employed male-breadwinner
Methodology and comparative analysis 31
Table 2.3 On which type of household does the PIT incidence fall at each income level?
Single parent Female Male Couple withwith children breadwinner: breadwinner: children:and no a female earner, a male earner, dual earnersother adult one dependent one dependent
man and children woman andchildren
2 x median Argentina,1 South Africa, India, household Ghana,2 India,3 Uganda, South Africa, income Morocco, United Kingdom Uganda,
South Africa, UnitedUganda, KingdomUnited Kingdom
Median Ghana,2 India,3 Uganda, India, Uganda,household Morocco, United Kingdom United income Uganda, Kingdom
United Kingdom½ median Morocco, United Unitedhousehold United Kingdom Kingdom Kingdomincome
Notes: When a country is listed more than once in a row, this means that the incidence of PIT fallsmost heavily on the household category indicated in the column. 1 Incidence varies by type of employment in Argentina. Self-employed single-parent households
with children bear the largest burden.2 Single-parent households with children bear the highest incidence in Ghana, although this category
was not analysed in the country chapter.3 Single-parent households bear more tax than female-breadwinner or dual-earner households in
India only if the single parent is a man.

household with two children and a dependent spouse pays no income tax.4 Sincemen are more likely to be employees and less likely to be a single parent thanwoman are, men are more likely to be in households facing a lower PIT incidence.This constitutes an implicit bias against women, who predominate among self-employed single-parent households. It is also the case that two wage earners in adual-earner household pay more income tax (2132 AR$) than a wage employee ina male-breadwinner household with a financially dependent spouse (0 AR$).Therefore, even though Argentina follows an individual filing system, the systemof spousal deductions undermines it if the taxpayers are employees. The system ofdeductions also makes it more similar to a joint taxation system, which might cre-ate a disincentive for financially dependent spouses, usually women, to join thelabour force. Note that dual-earner households pay less income tax than do single-parent households or male-breadwinner households if the earners are self-employed or monotributistas.
In all countries in this study, with the exception of Argentina, dual-earnerhouseholds face the lowest PIT incidence. This could be viewed as transforma-tive since it does not create a disincentive for women to join the labour market,nor does it reinforce existing gender roles. However, in some countries, namelyArgentina, Morocco and Ghana, single-parent households with children bear alarger PIT burden than do male-breadwinner households with children and adependent spouse. Single parents have to play the dual roles of breadwinner andcaregiver and doing so has costs, not least for care of children, which is a causefor alarm. It also has gender implications since single parents across the world aremore likely to be women.
Indirect tax incidence
Three main indirect taxes are considered in this analysis: value-added tax (VAT),excise taxes and fuel levies. A value-added tax is a tax on consumption. More for-mally, VAT can be defined as ‘a broad-based tax levied on commodity sales up toand including, at least, the manufacturing stage, with systematic offsetting of taxcharged on commodities purchased as inputs – except perhaps on capital goods –against that due on outputs’ (Ebrill et al. 2001: 2). Value-added taxes are favouredby economists because they constitute a tax on consumption rather than on inter-mediate transactions between firms. Different countries have different rate struc-tures, but generally all countries have some goods that are either zero-rated orexempt. Zero rates are when sales have a tax rate of zero although a credit is stillgiven to firms for taxes paid on inputs. In many countries, including those in thisstudy, exports are zero-rated, meaning they leave the country free of VAT.5
Exemptions are similar to zero-rating in that taxes are not charged on outputs butare different in that tax paid on inputs cannot be reclaimed.
Excise taxes are selective taxes on consumption items such as alcoholic bever-ages, tobacco products, motor vehicles and fuels – items with sufficiently lowprice elasticity of demand and high potential revenue yields to warrant specialattention. In addition to being administratively feasible and politically acceptable,
32 C. Grown and H. Komatsu

these taxes are also justified on the grounds that they reduce negative externali-ties associated with drinking, smoking and polluting.
Indirect tax incidence analysis
The goal of indirect tax incidence analysis is to determine the proportion ofbefore-tax income paid by different groups.6 Usually, the groups are definedby some measure of welfare, either income or consumption expenditure. Usingone of these measures, the groups are ordered from rich to poor by quintiles ofthe population on the basis of a number of assumptions about who bears thefinal burden. For each tax, a portion of the revenues collected is imputed as taxpaid by each income group, based on a number of assumptions about whobears the final burden (see below). For example, as Martinez-Vazquez (2001:16) explains:
Revenues from excise taxes on tobacco products are allocated to differentincome groups in proportion to their relative share in the consumption oftobacco products … The incidence for each tax is calculated separately foreach income or expenditure group and the results are added up across alltaxes to arrive at the total tax incidence for each group.
There is some debate in the literature about the best welfare measure to use inincidence analysis. The two most common measures are income and consump-tion expenditures. Some argue that income is a preferred base for equity compar-isons because income provides well-being whether it is spent immediately orsaved for the future (Bird and Gendron 2007). However, studies of developingeconomies more often use consumption expenditure (Bird and Miller 1989;Casperson and Metcalf 1994; Younger et al. 1999; Edmiston and Bird 2007).Income data are frequently less reliable than expenditure data because householdstend to ‘misreport’ or hide income. Second, expenditures may be a better meas-ure of well-being if households smooth their consumption, especially in countrieswhere current income is subject to large fluctuations. Finally, a practical reasonfor using consumption expenditure rather than income in anticipation of futureshocks was that not all countries in this project had income data.
The indirect tax incidence analysis in the country chapters used the samemethodology.7 Information on total income, sources of income, and expenditurepatterns is typically obtained from national consumption expenditure surveys.8
Data on taxes collected are obtained from the tax administration authorities.Most countries’ national consumption expenditure surveys are based on theClassification of Individual Consumption by Purpose (COICOP), agreed by theUnited Nations Statistical Commission. But the ways that countries adapt thisclassification vary considerably so it was necessary to standardize classifications(insofar as the country data allowed) in order to make comparisons across coun-tries. We focused on 33 categories of expenditures, detailed in the Annex andgrouped into the main categories below:
Methodology and comparative analysis 33

• Food, divided into basic non-processed food, basic processed food and non-basic food
• Meals out• Non-alcoholic beverages• Alcoholic beverages, divided into beer and cider, spirits and wine• Tobacco• Clothing and footwear, divided into adult and children’s clothing• Housing expenditure, divided into housing excluding utilities, water, elec-
tricity, gas, and other utilities such as sewerage• Household fuel• Household equipment• Domestic and household services• Health• Transport, divided into collective transport, flights and private transport• School transport• Fuels and lubricants (transport use)• Communications• Recreation, culture and holiday• Education• Personal care, divided into necessities, baby products and other personal care
items• Gambling• Miscellaneous.
Home-produced goods are a substantial component of household consumption inlow-income countries, but they become less substantial as countries move up theincome ladder. Given the diversity of countries in the project and the focus onexpenditure as the base for the incidence analysis, we omitted home-producedgoods. We also omitted remittances, donations, direct taxes, investments, pensioncontributions, savings, repayments, dowries and net losses of self-employment.
After deriving the classification system for expenditure items across countries,the next step involved deriving a distribution of comparable standard expenditureunits for the analysis. Expenditure data are produced at the household level.Individuals, however, live in different size households. Deriving a distributionrequires taking household size into account, which is done by dividing expendi-ture either by the number of household members or by some adult equivalent foreach particular household composition. A number of adult equivalence scaleshave been devised, each giving different emphasis to family size, the age ofhousehold members and economies of scale in household consumption, and eachproduces different results (OECD 2005: 25).9
Neither the per-capita nor the equivalence-scale method is ideal from a gender-equality perspective and for other reasons. The per-capita rule ignores the factthat expenditure across individual household members is usually not equal. Moreimportantly, the per-capita rule ignores gender power differentials that underlieunequal intra-household resource allocation. However, the use of equivalence
34 C. Grown and H. Komatsu

scales is no better since equivalence scales refer to resource needs and notresource allocation and control.10 The choice of a particular equivalence scalealso involves using subjective judgement, between scales that confer the sameweight to all household members and others that confer a lower weight to depend-ent children and take account of economies of scale for household members shar-ing costs of living (ibid.).
In light of these problems, the project considered adopting anthropological oreconometric methods to identify allocation rules among household members fordifferent classes of goods, but this too seemed to be both arbitrary and unsatisfac-tory, as for most countries, little case study or other research exists on the intra-household allocation of resources that could inform our choice of such rules. Inthe end, the project adopted an equal allocation rule by dividing expenditureequally among all members, adults and children alike, to calculate per-capitaexpenditure, which was thought to be somewhat less arbitrary than any equiva-lence-scale approach. Individuals were then sorted into quintiles based on per-capita household expenditure.
The next step in the analysis involved classifying households into categoriesbased on gender relations. The typical approach is to disaggregate households intothose headed by males and those headed by females. But this is unsatisfactory forthe reasons explained in Chapter 1. We take female and male household headship(using the country definition) as a baseline but then develop two richer gender cat-egories that can be applied across different country contexts for the analysis.
The first category, based on the sex composition of adults in each household,distinguishes between households with a greater number of adult females fromhouseholds with a greater number of adult males and from households with anequal number of adult males and females. We use sex composition as a proxy forthe underlying gender relations that produce ‘male’ and ‘female’ expenditure pat-terns. Clear differences in expenditure patterns emerge from this classificationin the country data. For instance, in Argentina, Mexico and Morocco, householdswith a greater number of females than males typically allocate a greater propor-tion of their expenditure to medical goods and services than do male-majorityhouseholds.
The second category is based on employment status of the adults in each house-hold. It distinguishes among female-breadwinner households (with no employedmales), male-breadwinner households (with no employed females), dual-earnerhouseholds and households with no employed adults. We use employment statusas a proxy for bargaining power. As noted in Chapter 1, it is likely that employ-ment and outside income allow members to exert greater control over householdexpenditure, resulting again in different expenditure patterns and tax incidencebetween male- and female-breadwinner households, and between these and dual-earner and no-earner households.
For both sex composition and employment status, households are disaggre-gated by those with and without children. It is likely that the composition ofexpenditure will differ between households with and without children, whichwould affect tax incidence.
Methodology and comparative analysis 35

As shorthand, we use the term ‘male-type households’ to refer to male-breadwinner, male-headed and male-dominated households, and female-typehouseholds to refer to female-breadwinner, female-headed and female-dominatedhouseholds.
The final step in the methodology was to apply scheduled tax rates to thereported expenses and estimated tax paid on each expenditure item, assuming thatall the burden of the tax is shifted on to consumers via a higher product price. Thisis computed as:
taxpaidij = ratej * (expendij /(1+Σjratej))
where taxpaidij is the tax paid by household i on item j, ratej is the tax rate on itemj and expendij is the reported expenditure for household i on item j.11 For a unittax, the amount of tax paid by the household per item is calculated as:
taxpaidSij = (expendij /pricej) * dutyj
where taxpaidSij is the tax S paid by household i on item j, expendij is the reportedexpenditure for household i on item j, pricej is the retail price of that item anddutyj is the per unit duty on item j.
The levy on fuel used as an input in the production of many goods and servicesmay be passed through to the consumer in the final price. A full and accurateanalysis of this would require using detailed input– output tables, which was notpossible with this group of developing countries. However, we do make anadjustment for the public transport sector, in which we assume fuel makes up 30per cent of input costs in this sector.12
This method of calculating tax incidence does not take into account behav-ioural responses to a tax change; it provides only a first-order approximationof a tax’s final incidence. A second source of inaccuracy is the use of simpleassumptions about how statutory taxes translate into economic incidence.Almost uniformly, markets are assumed to be competitive, and consumptionand excise taxes are assumed to be shifted fully forward onto consumers.Questions of tax avoidance via informal markets or corruption are mostlyignored, even though the ratio of actual taxation to expenditures is often asmall fraction of what the statutory rates suggests should be collected.Unfortunately, to address these limitations requires considerably more com-plex analysis of the behaviour of both consumers and producers in the rele-vant markets than was possible.
Indirect tax incidence findings
The indirect tax systems in most countries in our study zero-rate or exempt somegoods and services, especially those that are important for poor households. Forinstance, education and public sector medical services are exempt in SouthAfrica, the United Kingdom, Uganda and Ghana. Some basic foods have reduced
36 C. Grown and H. Komatsu

Methodology and comparative analysis 37
rates in Argentina, are zero-rated in Uganda, Mexico, the United Kingdom andSouth Africa, and are exempt in India and Morocco. Exports are zero-rated inArgentina, India, Mexico, South Africa and the United Kingdom. Each countryhas a number of other specific goods and services that are also zero-rated orexempt (see Table 2.4).
For the purposes of comparative analysis in the chapters in this book, the taxrate for exempt goods was assumed to be zero. While the tax rate for exemptgoods would be greater than zero if their inputs attract VAT, the effective ratewas not calculated because, as noted above, it would require detailed input–outputtables, and published ones were either too aggregated or not available for severalcountries.
Table 2.5 presents the comparative findings of tax incidence on expendi-ture across countries for total indirect taxes, and separately for the VAT,excises and fuel levies. It shows that overall indirect tax incidence falls mostheavily on the top expenditure quintiles in Uganda, Mexico and Morocco;falls most heavily on households in the middle quintiles in South Africa andthe United Kingdom; is U-shaped in Ghana (i.e., falls on the richest and poor-est households); falls on the poorest in India, and is proportional or slightlyprogressive in Argentina.13 The incidence of VAT is mildly progressive inmost countries, except for India where it falls on the poorest quintiles, andArgentina and Ghana, where it is proportional. Incidence of excises in mostcountries falls on the poorest or middle quintiles, while fuel tax is generallyprogressive.
The analysis shows more complicated and nuanced patterns when takinggendered household structure into account. The main finding suggested byTable 2.6 is that male-headed households bear the highest burden of overall taxincidence, in all countries except India, where female-headed households bear theheaviest incidence. The result is similar for VAT (except in India and Morocco),excises (except in the United Kingdom) and fuel taxes (except in Mexico14).
By employment classification, the incidence of indirect taxes falls gener-ally on male-breadwinner households or dual-earner households. Male-bread-winner households bear the heaviest incidence of total indirect taxes, VAT,and excises in Ghana, Mexico, South Africa and Uganda (in Argentina, thisis only the case for excises, while male-breadwinner and dual-earner house-holds bear the heaviest incidence on total indirect taxes, VAT and fuel taxes).They also bear the heaviest incidence of fuel levies in Ghana, Uganda andMorocco. Dual-earner households bear the heaviest incidence of VAT inArgentina, Mexico, Morocco and the United Kingdom, excises in Morocco,and fuel levies in Argentina,15 Ghana, Morocco, South Africa and the UnitedKingdom.16 Households with no employed adults bear the heaviest overallindirect tax incidence and the heaviest incidence of excise taxes in the UnitedKingdom.17 By sex composition, the results again are similar. Male-majorityhouseholds bear the largest incidence of indirect taxes in all countries and thelargest incidence of the VAT in all countries except Morocco, Mexico and theUnited Kingdom.

Table 2.4 Zero-rating and exemptions
Argentina Ghana India Mexico Morocco South Africa Uganda UnitedKingdom
Zero-rating Exports Exports, locally All food Exports, 19 basic foods, Export goods, Food (except produced (except for fertilizers, paraffin, milk, seeds, for sugar andtextbooks, yogurt and agriculture exports, petrol fertilizers, confectionary),locally fruit juice), tools, and diesel, educational children’s manufacturing medicine, acquisition of farming inputs, materials, clothing and agricultural drinking water, vehicles for certain grants cereals, footwear, tools unprocessed taxi usage, by government machinery public
food, exports, residential for agriculture, transport, fishing and building printing books andagricultural construction services for newspapers, services products and educational medical
equipment, material expenditure,medicine, education, donations water and
sewage, and helmets for motorcycles and pedal cycles
Exemptions Books, Some imported Basic food, Medical and All food of Residential Financial and Financial and brochures, items (including basic clothing, education basic necessity rental and insurance banking milk, medicine, food), animal domestic services, (cereals, accommodation, services, services,education products, services, basic non-profit bread, milk, educational education private services medical supplies, stationery and activities, fish, meat, services services, education
financial books. books and fruits and (including medical, and health services, water, magazines, vegetables), creches), dental (excluding electricity, residential and unprocessed public road and spectacles

Table 2.4 (Continued)
Argentina Ghana India Mexico Morocco South Africa Uganda UnitedKingdom
printed matter, land buildings, food, sugar, and rail nursing lenses, petroleum passenger salt, paraffin transport, services sunglasses,products (VAT transportation, and candles, non-fee-related most mobilityexempt1) lottery books and financial and hearing
newspapers, services, equipment, medicine, self- medical aid non-NHS construction and medicine, medical of main home, medical services products and healthcare, provided by services), dental and public health registered care nursing institutions services and services, childcare, education, postal charges, handicrafts, betting and agricultural funeralsproducts and services, micro credit,
Reduced Food, meat, water Domestic fuel,rate fruits and household
vegetables, energy-saving bread equipment,
women’s sanitary products, children’s car seats
Note: 1 A number of petroleum products taxed ad valorem excise duties.

The fact that male-type households, however classified, generally bearlarger incidence may not be surprising since the female-type households inthe countries in our study tend to be clustered in lower expenditure quintilesthan male-type households. All countries further disaggregated the incidenceof indirect taxes for each household employment category by quintile (see thetables in Chapters 4–10). Total indirect tax incidence falls most heavily on the richest male-breadwinner or dual-earner households in Argentina, Moroccoand Uganda, while it falls on middle quintile dual-earner households in SouthAfrica and no-employed households in the United Kingdom. The incidence ofexcises generally falls on male-breadwinner or dual-earner households in themiddle quintiles in most countries. The United Kingdom is an exception,where excise tax incidence falls on the poorest dual-earner and no-employedhouseholds. The pattern of VAT incidence by household type and quintile isnot uniform. It is borne by the richest male-breadwinner and dual-earner house-holds in Morocco and Uganda, middle-quintile dual-earner households in SouthAfrica, and the poorest male-breadwinner and dual-earner households inArgentina. The United Kingdom is again an exception where it falls on the richestno-employed households.
40 C. Grown and H. Komatsu
Table 2.5 Which quintile bears the highest incidence of each type of tax?
Quintile on which Total indirect taxes VAT Excises Fuel taxincidence falls most heavily:
Quintile 5 Ghana,1 Mexico, Mexico, Argentina, Uganda, Morocco Morocco, Ghana,
Uganda, India, United Morocco, Kingdom South Africa,
UgandaQuintile 3–4 South Africa, South Africa Argentina,
United Kingdom Morocco,SouthAfrica
Quintiles 1–2 Ghana,1 India India Ghana, Mexico,4
India, United Mexico, KingdomUnited Kingdom
Proportional Argentina2 Argentina,3 UgandaGhana
Notes: 1 Indirect taxes are U-shaped, falling on the lowest and highest quintiles.2 Indirect taxes are slightly progressive.3 VAT is slightly regressive.4 Fuel tax was a subsidy and lower quintiles received less subsidy than higher quintiles.

Table 2.6 Incidence of indirect taxes by household type
Incidence falls Total indirect taxes VAT Excises Fuel taxmost heavily on:
By headship (comparing male-headed versus female-headed)Male-headed Argentina, Ghana, Argentina, Argentina, Argentina, households Mexico, Morocco, Ghana, Ghana India, Ghana, India,
South Africa, Mexico, Mexico, Morocco, Uganda, UK South Africa, Morocco, UK,
Uganda, South Africa, South UK Uganda, UK1 Africa,
UgandaFemale-headed India India, UK1 Mexicohouseholds Morocco
By employment status (comparing male-breadwinner, female-breadwinner,dual-earner, none-employed)Male- Argentina,2 Ghana, Argentina,2 Argentina, Ghana,2
breadwinner Mexico, South Ghana, Ghana, Uganda, households Africa, Uganda Mexico, Mexico, Morocco2
South Africa, Morocco,2
Uganda South Africa,Uganda
Female- Mexicobreadwinner householdsDual-earner Argentina,2 Argentina,2 Morocco2 Argentina, households Morocco Mexico, Ghana,2
Morocco, Morocco,2
UK South Africa,UK
No-employed UK UK
By household sex composition (comparing male-dominated, female-dominated andequal numbers)Male-majority Argentina, Ghana, Argentina, Argentina, Argentina, households India, Mexico, Ghana, India, Ghana, India, Ghana,3
Morocco, South Mexico,3 Mexico, India, Africa, Uganda, South Africa, Morocco, Uganda,UK Uganda South Africa, UK
Uganda, UKFemale-majority MexicohouseholdsEqual-number Mexico,3 Ghana,3
households UK South AfricaProportional Morocco Morocco
Notes: In Mexico, fuel tax was a subsidy and therefore the cells indicate which household typereceived less subsidy.1 The differences in incidence for female-headed and male-headed households are not statistically
significant.2 The differences in incidence between male-breadwinner and dual earners are not statistically
significant.3 The differences in incidence between male-majority and equal number households are not
statistically significant.

42 C. Grown and H. Komatsu
Importantly, the existence of children in the household has an impact on the inci-dence of indirect taxes. Generally, incidence falls more heavily on households withoutchildren. An exception is the VAT in Morocco, where households with children beara larger incidence of VAT. Finer differences emerge when the analysis is disaggre-gated by quintiles. Poorer households with children bear a greater incidence of VATrelative to equally poorer households without children in Ghana, Mexico and Uganda.In South Africa, female-breadwinner and no-employed households with children in themiddle quintiles bear a higher VAT and fuel levy tax incidence than do female-breadwinner and no-employed households without children in the same quintiles.
What might explain these results? One reason could be that households with-out children allocate a higher proportion of their expenditure to alcohol, tobacco,and luxury goods than households with children. In many countries, goods suchas alcohol and tobacco carry higher tax rates. Households with children allocatea higher share of expenditure than households without children on necessities andgoods that improve children’s welfare. As we will see in the following section,the incidence of children’s clothing in Ghana and South Africa, food in Morocco,South Africa and Uganda, and fuel for household use in Ghana, Mexico,Morocco, South Africa and Uganda is generally regressive. However, furtheranalysis is needed to understand the behavioural issues that underlie these results.
First, because of gender-specific expenditure patterns, the incidence on specificcommodities brings out the gender-differentiated results far more starkly than theresults by type of tax. Table 2.7 shows indirect tax incidence for specific commod-ity groups, including various categories of food, clothing, medical expenditure,housing, fuel, alcohol and tobacco. These commodity groups were chosen for sev-eral reasons, but most importantly because they highlight the gendered nature ofexpenditure.
First, because women are often ascribed the role of securing family survivalthrough food production and preparation, we focused on basic necessities, asdefined in the basket of goods used to calculate each country’s poverty line(where applicable).18 Second, because women are largely ascribed the roles ofcaring for children, and more children tend to live with women than with menthough most live with both, we focused on children’s goods (e.g., clothing).Third, we were interested in goods and services that substitute for or reducewomen’s unpaid work, such as child care, medical care, basic processed foods,meals out, public and private transport and water and energy services. And,finally, we were interested in examining leisure goods, such as electronic games,and ‘demerit’ goods with negative externalities, such as alcohol, tobacco and fuelfor transport, which are primarily consumed by men in many countries
Table 2.7 indicates which household type, disaggregated by quintile, bears thehighest tax incidence on specific commodity items. For example, the columnlabelled ‘food’ shows that female-breadwinner households in the middle quintilesbear the highest incidence of tax on food in Mexico compared to other householdcategories disaggregated by quintile. Scrolling down the column of particularcommodity items, the reader will note that a country is sometimes indicatedtwice. In the column on total food, the United Kingdom is indicated in two cells:

Table 2.7 Which household type, by quintile, bears the highest tax incidence on selected commodity items?
Incidence falls most Quintile Total food Food: basic unprocessed1 Food: basic processed Food: basic2 Food: non-basicheavily on:
i. Male-breadwinner Quintile 5households
Quintiles 3–4 Uganda UgandaQuintiles 1–2 Argentina Argentina Argentina5, Morocco6 India
ii. Female-breadwinner Quintile 5 Ghana Ghanahouseholds
Quintiles 3–4 Mexico South Africa7
Quintiles 1–2 India3, UK4 Ghana Morocco6
iii. Dual-earner households Quintile 5Quintiles 3–4Quintiles 1–2 India3 Argentina5, Morocco6 India
iv. No-employed Quintile 5Quintiles 3–4 Mexico, South Africa7
Quintiles 1–2 South Africa, UK4 Morocco6
Notes: Lack of data in India restricts the analysis to household sex composition. Therefore, incidence in India refers to incidence on male-majority (in lieu of male-breadwinner), female majority (in lieu of female-breadwinner) and equal-number (in lieu of dual earner) households. Countries that zero-rate food and medical expenditure are not included in this table.
1 In Argentina, Ghana, Morocco and Uganda, basic food was disaggregated by non-processed and processed.2 In India, Mexico and South Africa, food was disaggregated by basic and non-basic food.3 Female-breadwinner and dual-earner households in the 1st and 2nd quintiles bear the incidence most heavily.4 Female-breadwinner and no-employed households in the 1st and 2nd quintiles bear the incidence most heavily.5 Male-breadwinner and dual-earners in the 1st and 2nd quintiles bear the incidence most heavily.6 All households in the 1st and 2nd quintiles bear incidence most heavily.7 Female-breadwinner and no-employed households in the middle quintiles bear the most incidence.
(Continued)

Table 2.7 (Continued) Which household type, by quintile, bears the highest tax incidence on selected commodity items?
Incidence falls most Quintile Children’s clothing Medical expenditure Fuel for household use Housing Water, electricity heavily on: and gas
i. Male-breadwinner Quintile 5 Ugandahouseholds
Quintiles 3–4 MoroccoQuintiles 1–2 Argentina, South Argentina, Ghana,
Africa8 India10, Morocco11, South,Africa12, Uganda13, UK
ii. Female-breadwinner Quintile 5 Moroccohouseholds
Quintiles 3–4 MoroccoQuintiles 1–2 Ghana, South India10 UK15
Africa8, Uganda9
iii. Dual-earner households Quintile 5 India Morocco, IndiaSouth Africa14
Quintiles 3–4Quintiles 1–2 Mexico, Uganda9 South Africa12 UK15
iv. No-employed Quintile 5 Argentina, Mexico, Argentina, South AfricaSouth Africa Mexico,
South Africa14
UKQuintiles 3–4 Uganda13
Quintiles 1–2 South Africa8 Mexico, Morocco11 Ghana Argentina, Mexico, UK15
Proportional Ghana
Notes: 8 Male-breadwinner, female-breadwinner and no-employed households in the 1st and 2nd quintiles bear the most incidence.9 Male-breadwinner and dual-earner households in the 1st and 2nd quintiles bear the most incidence.
10 Male-breadwinner and female-breadwinner households in the lowest two quintiles bear the most incidence.11 Male-breadwinner and no-employed households in the lowest two quintiles bear the most incidence.12 Male-breadwinner and dual earner households in the first two quintiles bear the most incidence.13 Male-breadwinner in the first two quintiles and no-employed households in the middle quintiles bear the most incidence.14 Dual-earner and no-employed households in the highest quintile bear the most incidence.15 Female-breadwinner, dual-earner and no-employed households in the lowest quintiles bear the most incidence.

Table 2.7 (Continued)
Incidence falls most Quintile Alcohol Tobacco Fuel for transportheavily on:
i. Male-breadwinner households Quintile 5 Mexico, Morocco, Uganda Ghana, India Argentina, Ghana, India, Mexico18, UgandaQuintiles 3–4 South Africa South AfricaQuintiles 1–2 Argentina16, India Argentina17, Uganda
ii. Female-breadwinner households Quintile 5Quintiles 3–4Quintiles 1–2
iii. Dual-earner households Quintile 5 Mexico18, Morocco, South AfricaQuintiles 3–4Quintiles 1–2 India, UK (2Q) Argentina17, Morocco UK
iv. No-employed Quintile 5 GhanaQuintiles 3–4 MexicoQuintiles 1–2 Argentina16 UKProportional
Notes:16 Male-breadwinner and no-employed households in the lowest quintiles bear the most incidence.17 Male-breadwinner and dual-earner households in the lowest quintiles bear the most incidence.18 Male-breadwinner and dual-earner households in the highest quintile bear the most incidence.

female-breadwinner households and no-employed households. This means thatthe incidence of tax on total food falls most heavily on these two household typesin the 1st and 2nd quintiles.
Female-breadwinner households bear a larger tax incidence on food relative tomale-breadwinner households in most countries, except Argentina and Uganda.Households in the poorest or middle-income households bear the greatest food taxincidence in India, Mexico and the United Kingdom, while in South Africa the poor-est no-employed households – which are mostly female-headed – bear the highesttax incidence on food. These findings suggest that the incidence of tax on food gen-erally falls most heavily on poorer female-type households across countries.
By employment status, the incidence of tax on medical expenditure generallyfalls on higher-income households, reflecting in part the fact that only wealthierhouseholds in many of these countries can afford to purchase medicine and health-related expenditure and in part the fact that in most countries in this study, someportion of medical expenditure is exempted from tax. However, when householdsare grouped by sex composition, some pronounced differences emerge. The inci-dence of tax on medical expenditure falls on the richest female-majority householdsin Argentina, Mexico and Morocco, and the richest equal-number households inIndia and South Africa.
Turning to children’s goods, the picture is mixed. The incidence of children’sclothing falls on the poorer quintiles, but the incidence by gender-specific householdtype varies by country. The poorest male-breadwinner households in Argentina andthe poorest dual-earner households in Mexico and Uganda bear the highest tax inci-dence on children’s clothing. The poorest female-breadwinner households in Ghanaand Uganda bear the highest tax incidence on children’s clothing. In South Africa,three household types – the poorest male-breadwinner, female-breadwinner andthose with no-employed adults – bear the incidence on children’s clothing.
The patterns of tax incidence on goods that may reduce or substitute for theunpaid work of women do not show a single pattern across countries. Tax inci-dence on water and electricity services falls on the richest male-breadwinnerhouseholds in Uganda, the richest dual-earner households in India, the middlefemale-breadwinner quintiles in Morocco, the poorest female-breadwinner, dual-earner and no-employed households in the United Kingdom, and the poorest no-employed households in Argentina and Mexico.
When the analysis is by household sex composition as opposed to employmentstatus, the gender differences become more apparent.19 The incidence of tax on util-ities (water, gas and electricity) falls on the bottom or middle quintiles for mostcountries, except for India, Uganda and South Africa where it falls on the richesthouseholds. The progressivity of tax on utilities in these countries masks the factthat the poor cannot afford to purchase them in these countries and rely instead onother sources of fuel and water. Yet, despite the variation in the progressivity oftaxes on utilities in some countries, female-majority households largely bear the taxincidence of these services. This is due to the importance of water, gas and electric-ity on women’s socially assigned roles within the household. These items have sig-nificant time-saving consequences on women, despite their higher monetary cost.
46 C. Grown and H. Komatsu

Tax incidence on fuel for household use is regressive in all countries. This isconsistent with findings of previous studies on Ghana and Madagascar (Younger1996; Younger et al. 1999). Incidence falls almost exclusively on the poorestmale-breadwinner households in three countries (Argentina, Ghana and theUnited Kingdom), but on both male bread-winner households and the poorestfemale-breadwinner households in India, the poorest dual-earner households inSouth Africa, households with no employed households in the middle quintiles inUganda, and the poorest no-employed households in Morocco also bear the inci-dence of fuel for household use.
The incidence of domestic services is generally progressive in all countries,but the incidence by gender-specific household type again varies. The richestfemale-breadwinner households bear the highest incidence of tax on domesticservices in Ghana and the United Kingdom, along with the richest dual-earnerhouseholds in the United Kingdom. In contrast, the richest male-breadwinnerhouseholds bear the burden of tax on domestic services in Mexico, and the inci-dence is generally low. Among other goods that may reduce women’s unpaidtime burdens, tax incidence on fuel for transport is progressive, except in theUnited Kingdom, but the incidence is heaviest on the richest male-breadwinnerhouseholds in Argentina, Ghana, India, Mexico and Uganda, and the richestdual-earner households in Mexico, Morocco and South Africa. The poorestdual-earner households in the United Kingdom bear the highest incidence of taxon fuel for transport.
The patterns of tax incidence on alcohol and tobacco are not surprising giventhe gendered patterns of expenditure on these items. Male-breadwinner house-holds by and large bear the highest incidence of tax on both alcohol and tobaccoexpenditures in all countries in the study, although tax incidence of these goodsalso falls on dual-earner households in India, the United Kingdom, Argentina andMorocco, and no-employed households in Argentina, Ghana, Mexico and theUnited Kingdom.
There is no evidence of explicit gender bias in the incidence of indirect taxesacross the eight countries. However, our findings suggest that some implicitgender biases may exist in some countries for specific commodities that areessential for meeting basic needs, providing care, and reducing women’s unpaidwork burdens. The poorest female-breadwinner households in India, the UnitedKingdom, and South Africa bear the heaviest incidence of taxes on food, andfemale-dominated households generally bear the heaviest incidence of taxes onutilities. The poorest female-breadwinner households in Uganda, Ghana andSouth Africa bear the largest incidence of tax on children’s clothing. Finally, therichest female-dominated households bear the heaviest incidence of taxes onmedical expenditure in Argentina, Mexico and Morocco.
There is very little other work against which to compare these findings. Onlyone known study has examined the incidence of indirect taxes with a genderdimension. Bird and Miller (1989) analyze the incidence of various indirect taxesin Jamaica of low-income households in six household expenditure categories,three each in urban and rural areas.
Methodology and comparative analysis 47

Unlike other studies, Bird and Miller disaggregate their sample into couple-and female-headed households and take into account the age composition of thesehouseholds. They find that taxes overall are a heavier burden on couple-headedthan female-headed households. They suggest this is because female-headedhouseholds are predominantly in urban areas and have higher expenditures thancouple-headed households, who are predominantly in rural areas and low income.Seventy-two per cent of rural coupled-headed households are low income com-pared to 48 per cent of rural female-headed households, while only 20 per cent ofurban couple-headed households are low-income sample compared to 26 per centof female-headed households.
The authors do not provide much explanation for these results but examinationof their data suggests that the higher tax incidence on couple-headed householdscould be driven by the fact that these households bear the burden of food tax, whichis the highest of all commodities and greater for both rural and lower-expendituregroups. Indeed, incidence on food is higher for couple-headed households (2.43)than for female-headed households (2.15). In contrast, female-headed householdswho are predominantly in urban areas and have higher weekly expenditures thanrural couple-headed households, have a higher incidence on transport (1.72) thando couple-headed households (1.66). Since the differences in incidence for mostother goods are small, it appears that the results are driven by food and transporttax incidence with the latter not high enough to offset the incidence of the former,so that couple-headed households bear the greatest overall indirect tax incidence.
Policy simulations
Finally, the authors of each chapter undertook a series of simulations of policyreforms designed to reduce the burden of indirect taxes on the poor and on female-type households. They also experimented with various reforms to increase taxeson goods consumed primarily by higher-income and male-type households so asto offset potential revenue declines as a result of the first set of simulations. Thesesimulations are designed to show changes in indirect tax incidence but it is impor-tant to note they are essentially static and do not take into account behaviouralchanges. Nonetheless, they provide important empirical evidence on the variedfirst-order effects that tax reforms can have on different income groups and gen-dered household types.
For their simulations, several countries, including Argentina, India and Morocco,reduced or zero-rated key items in the basic food basket in their countries. SouthAfrica zero-rated all non-confectionary food items that are currently not zero-rated,along with children’s clothing and footwear; and a basket of basic personal careitems (toilet paper, toothpaste/toothbrushes, soap, tissues, contraception and sani-tary towels). Ghana simulated the complete removal of VAT on children’s clothesand footwear and reduced by half kerosene tax rates. Uganda removed the VAT onsalt and halved the tax on paraffin. The United Kingdom raised tax on fuel for trans-portation, which is higher in households with a man in paid employment.
48 C. Grown and H. Komatsu

Generally, these simulations show that it is possible to reform VAT andexcises in most countries in selective ways that promote gender equality withoutcompromising the system’s ability to raise revenue. Some key findings are:
• Reducing or zero-rating selected basic food items: In Argentina, zero-ratingbasic food reduced the incidence of the VAT and total taxes on poorer house-holds. Female-breadwinner households experienced the smallest reduction inincidence due to the reform although male-breadwinner and dual-earnerhouseholds continued to bear the largest incidence. In Morocco, reducing theVAT on tea, coffee and edible oils reduced the tax incidence for poorer female-and male-breadwinner and no-employed households. Lastly, in Uganda,removing VAT on salt benefited poorer and female-headed households morethan other types of households. India is the only exception, whereby the zero-rating of VAT on all food items did not reduce the higher incidence amongfemale-headed households.
• Removing VAT on children’s clothing and footwear: In Ghana, reducing thetax incidence on children’s goods benefited poorer female-breadwinner andfemale-dominated households more than their male-household counterparts.In South Africa, zero-rating of children’s goods resulted in the largest gainsfor poorer and female-type households.
• Reducing VAT on kerosene and paraffin: In Ghana, halving the tax onkerosene benefited poorer households more than richer households but hadno additional impact across different household types. In Uganda, halvingthe tax on paraffin disproportionately benefited poorer and male-headedhouseholds.
In countries which already zero-rate or have reduced rates on basic necessities,the authors simulated the impact of increasing the VAT on these items in order todemonstrate the positive impact that reduced and zero rates have on poorer andfemale-type households. In South Africa, introducing a 14 per cent VAT rate onbasic food and paraffin had the largest negative impact on the poor and female-type households. In the United Kingdom, removing the zero rate on basic foodincreased incidence disproportionately among poorer households and those withno employed adults. Likewise, in Mexico, a rise in the tax rate from 0 to 15 percent on basic and non-basic food disproportionately affected poorer householdsbut had no impact on any of the gendered household types. These results confirmthat reducing tax on basic necessities such as basic food, household fuel andchildren’s clothing generally decreases the incidence of tax for both poorerhouseholds and female-type households.
In summary, we can infer from these simulations that reducing the relativeprices of necessities would increase the disposable income of poorer women. Thisin turn is likely to increase their bargaining power within the household. Hence,we can view a reform that zero-rates or exempts necessities to be a policy thatpromotes gender equality.
Methodology and comparative analysis 49

The simulations described above entail some loss in revenue. Each countrytherefore also simulated a set of reforms to offset these revenue losses. Argentinaincreased tax on luxury items (cars, boats, some electronics), tobacco and wineto enhance progressivity and gender equity; the United Kingdom increased taxeson fuel for private transport; Ghana, India and Morocco increased tax rates ontobacco; Morocco also increased rates on the entire recreational category, andGhana increased rates on alcohol and communications (the talk tax). In mostcases, the reforms to reduce tax on food, children’s clothing and fuel for house-holds, when coupled with measures to increase tax on luxury items, tobacco andalcohol, turned out to be revenue-neutral. Exceptions were the simulation for theUnited Kingdom, which resulted in a loss in revenue, and for Morocco, whichresulted in a revenue increase.20
Generally, the results also showed that raising taxes on luxury goods increasedincidence for both male-type and richer households. As expected, an increase intax on tobacco and alcohol also increased incidence for male-type households,except in the United Kingdom where a tax hike on tobacco increased the inci-dence for poorer female-breadwinner and no-employed households, whichinclude many single-mother households.
The impact on the quintiles among male-type households is less clear-cut. InGhana and the United Kingdom, increasing tax on tobacco and alcohol resultedin a larger increase in incidence on poorer than richer male-headed households.In contrast, in Argentina, which simulated an overhaul of the tax system, exciseswere made more progressive because the simulations increased rates on tobacco,wine, electronics and private transport, all goods which are largely consumed byricher households.
Raising taxes on alcohol and tobacco could have negative effects beyondincreasing the incidence of taxes on the poor. Increasing taxes on tobacco couldinduce a shift to cheaper and inferior tobacco products with negative effects onhealth. There could also be a potential negative gender impact from increasingtaxes on both alcohol and tobacco if men reduce their contributions to women’shousehold allowances as a result of the price increases on these goods. However,since we have not considered such behavioural consequences in general, sucheffects can only be confirmed through a better understanding of the nature ofhousehold decision-making, a task for future research.
Conclusion
This chapter compared the various dimensions of the personal income tax systemof the eight countries in this study and commented on the degree to which the ratestructure, definition of income exemptions, tax preferences and other featurescontain implicit and explicit gender biases. It found that personal income taxcodes in all countries in this study contain implicit gender biases, and, in threecountries, they also contain explicit biases. These biases are candidates for policyreform in all countries, as is discussed in Chapter 11.
50 C. Grown and H. Komatsu

In addition, this chapter also explored which households in the eight countriesbear the highest and lowest incidence of total indirect taxes, VAT, excises, fuellevels, and taxes on selected commodities such as food, children’s clothing, alco-hol and tobacco. In all countries, male-type households (by employment statusand sex composition) were found to bear the heaviest incidence of indirect taxes(with the exception of India), of VAT (with the exception of India and Morocco)and of excises (with the exception of the United Kingdom).
Yet, the picture becomes much more varied when the analysis disaggregates inci-dence by type of commodity, with the poorest female-type households largely bear-ing the highest incidence of taxes on food and children’s clothing in several countries.The presence of children, as noted above, also affects the incidence results. We mightconclude, therefore, that women’s roles in care-giving, which impact householdexpenditure, underlie the gender differences in indirect taxes found in this study. Thisstudy has not found any explicit gender biases in indirect tax incidence, but uncov-ered implicit gender biases in some countries for commodities that are essential formeeting basic needs, providing care, and reducing women’s unpaid work burdens.
Finally, the policy simulations showed that it is possible in all countries toincrease the gender equity of indirect taxes by reducing or zero-rating key com-modity items and to offset any revenue losses entailed by these reforms by rais-ing rates on luxury items or selected ‘demerit’ goods (e.g., tobacco).
Before concluding this comparative analysis, two reflections are in order. First,the methodology we have developed in this project is an improvement overapproaches that do not distinguish between different types of households, becauseit brings out more precise patterns of tax incidence within and across countries.Because the household categories are common across a broad range of countries,this methodology can be easily replicated by analysts and policy-makers inter-ested in gaining a fuller and more accurate picture of tax incidence.
Nonetheless, this methodology has some limitations. First, the various house-hold categories, while chosen as the most illuminating household forms for taxpurposes, do not capture the multiple variations that exist in practice, and thatmay be important in specific countries (such as South Africa, where a substantialproportion of grandparents raise children). Moreover, household sex compositionand employment status are still only proxies for the underlying gender relation-ships that determine patterns of household expenditure; understanding the under-lying gender relationships requires information on individual expenditure anddecision-making patterns. However, lacking such information, the typology usedhere together with information on expenditure quintile provides a useful pictureof the differential impact of tax systems on males and females, enabling policy-makers to design them more equitably.
Second, while our results have generated a comprehensive and detailed set ofresearch findings, and enable us to identify some useful policy recommendations(see Chapter 11), we also exercise some caution. The emphasis of our research,particularly the incidence analyses of indirect taxes, has been on evaluating thedistributional dimensions of prevailing tax systems. Yet, tax policy changes
Methodology and comparative analysis 51

induce important behavioural responses which data limitations prevent us frommodelling in any detail. That said, this research not only provides a useful base-line against which future work can be measured but has also yielded some unex-pected findings on gender differences, which must be considered in any effort tomake tax policy more equitable, both in the eight countries considered in thisvolume and elsewhere.
Acknowledgements
We are deeply indebted to Stephen Younger for his assistance in developing theincidence analysis methodology, including sharing his stata code and extensiveguidance to project teams when problems arose and clarifications were requested.Cristina Santos took the lead to standardize the commodity categories acrosscountries, and Francisco Cota González and Dario Rossignolo provided keyinputs into the final incidence methodology.
Annex
Expenditure classifications across countries
1 FOOD1.1 Food01.1.1 Bread and cereals01.1.1.1 Rice01.1.1.2 Bread01.1.1.3 Pasta products01.1.1.4 Pastry-cook products01.1.1.5 Other products01.1.2 Meat01.1.2.1 Fresh, chilled or frozen meat of bovine animals01.1.2.2 Fresh, chilled or frozen meat of swine01.1.2.3 Fresh, chilled or frozen meat of sheep and goat01.1.2.4 Fresh, chilled or frozen meat of poultry01.1.2.5 Dried, salted or smoked meat and edible meat offal01.1.2.6 Other preserved or processed meat and meat preparations01.1.2.7 Other fresh, chilled or frozen edible meat01.1.3 Fish01.1.3.1 Fresh, chilled or frozen fish01.1.3.2 Fresh, chilled or frozen seafood01.1.3.3 Dried, smoked or salted fish and seafood01.1.3.4 Other preserved or processed fish and seafood and fish and seafood
preparations01.1.4 Milk, cheese and eggs01.1.4.1 Whole milk01.1.4.2 Low fat milk
52 C. Grown and H. Komatsu

01.1.4.3 Preserved milk01.1.4.4 Yoghurt01.1.4.5 Cheese and curd01.1.4.6 Other milk products01.1.4.7 Eggs01.1.5 Oils and fats01.1.5.1 Butter01.1.5.2 Margarine and other vegetable fats01.1.5.3 Olive oil01.1.5.4 Edible oils01.1.5.5 Other edible animal fats01.1.6 Fruit01.1.6.1 Citrus fruits – fresh01.1.6.2 Bananas – fresh01.1.6.3 Apples – fresh01.1.6.4 Pears – fresh01.1.6.5 Stone fruits – fresh01.1.6.6 Berries – fresh01.1.6.7 Other fresh, chilled or frozen fruits01.1.6.8 Dried fruit and nuts01.1.6.9 Preserved fruit and fruit-based products01.1.7 Vegetables01.1.7.1 Leaf and stem vegetables (fresh or chilled)01.1.7.2 Cabbages (fresh or chilled)01.1.7.3 Vegetable grown for their fruit (fresh, chilled or frozen)01.1.7.4 Root crops, non-starchy bulbs and mushrooms (fresh, chilled or
frozen)01.1.7.5 Dried vegetables01.1.7.6 Other preserved or processed vegetables01.1.7.7 Potatoes01.1.7.8 Other tubers and products of tuber vegetables01.1.8 Sugar, jam, honey, chocolate and confectionery01.1.8.1 Sugar01.1.8.2 Jams, marmalades01.1.8.3 Chocolate01.1.8.4 Confectionery products01.1.8.5 Edible ices and ice cream01.1.8.6 Other sugar products01.1.9 Food products necessary01.1.9.1 Sauces, condiments01.1.9.2 Salt, spices and culinary herbs01.1.9.3 Baker’s yeast, dessert preparations, soups01.1.9.4 Other food products necessary20.2.1 Food stamps, other food-related expenditure20.2.1.1 Food stamps, other food-related expenditure
Methodology and comparative analysis 53

1(A) Meals out11.1 Catering services11.1.1 Restaurants, cafes and the like11.1.1.1 Restaurants11.1.1.2 Cafes, bars and the like11.1.2 Canteens11.1.2.1 Canteens1(B) Non-Alcoholic Drinks01.2.1 Coffee, tea and cocoa01.2.1.1 Coffee01.2.1.2 Tea01.2.1.3 Cocoa and powdered chocolate01.2.2 Mineral waters, soft drinks, fruit and vegetable juices01.2.2.1 Mineral or spring waters01.2.2.2 Soft drinks01.2.2.3 Fruit juices01.2.2.4 Vegetable juices02.1.1 Spirits02.1.1.1 Spirits and liqueurs02.1.2 Wine02.1.2.1 Wine from grape or other fruit02.1.2.2 Other02.1.3 Beer02.1.3.1 Beer2(B) Tobacco02.2.1 Tobacco02.2.1.1 Cigarettes02.2.1.2 Cigars02.2.1.3 Other tobacco
3 CLOTHING AND FOOTWEAR – for adults3.1 Clothing03.1.1 Clothing materials03.1.1.1 Clothing materials03.1.2 Garments03.1.2.1 Garments for men03.1.2.2 Garments for women03.1.3 Other articles of clothing, clothing accessories and haberdashery03.1.3.1 Other articles of clothing, clothing accessories and haberdashery03.1.4 Cleaning, repair and hire of clothing03.1.4.1 Cleaning, repair and hire of clothing3.2 Footwear03.2.1 Shoes and other footwear03.2.1.1 Footwear for men03.2.1.2 Footwear for women03.2.1.3 Footwear for children (5 to 15 years) and infants (under 5 years)
54 C. Grown and H. Komatsu

03.2.2 Repair and hire of footwear03.2.2.1 Repair and hire of footwear
3 CLOTHING AND FOOTWEAR – for children3.1 Clothing03.1.1 Clothing materials03.1.1.1 Clothing materials03.1.2 Garments03.1.2.3 Garments for children (5 to 15 years) and infants (under 5 years)03.1.3 Other articles of clothing, clothing accessories and haberdashery03.1.3.1 Other articles of clothing, clothing accessories and haberdashery03.1.4 Cleaning, repair and hire of clothing03.1.4.1 Cleaning, repair and hire of clothing
4 HOUSING4.1 Actual rentals for housing04.1.1 Actual rentals paid by tenants04.1.1.1 Actual rentals paid by tenants04.1.2 Other actual rentals04.1.2.1 Other actual rentals20.1 Housing: accommodation costs, repairs and improvements20.1.1 Mortgages and housing costs20.1.1.1 Mortgages and housing costs20.1.2 Purchase of a main dwelling20.1.2.1 Purchase of a main dwelling20.1.3 Capital improvements main and second dwelling20.1.3.1 Capital improvements main and second dwelling20.1.4 Second dwelling costs20.1.4.1 Second dwelling costs4.3 Maintenance and repair of the dwelling04.3.1 Materials for maintenance and repair of the dwelling04.3.1.1 Materials for maintenance and repair of the dwelling04.3.2 Services for maintenance and repair of the dwelling04.3.2.1 Services for maintenance and repair of the dwelling12.5.2 Insurance connected with the dwelling12.5.2.1 Insurance connected with the dwelling
4 HOUSING UTILITIES – Water4.4 Water supply and miscellaneous services relating to the dwelling04.4.1 Water supply04.4.1.1 Water supply
4 HOUSING UTILITIES – Electricity4.5 Electricity and gas04.5.1 Electricity04.5.1.1 Electricity
Methodology and comparative analysis 55

4 HOUSING UTILITIES – Gas4.5 Electricity and gas04.5.2 Gas04.5.2.1 Town gas and natural gas04.5.2.2 Bottled gas04.5.5 Heat energy04.5.5.1 Hot water, steam and ice
4 HOUSING UTILITIES – Other04.4.2 Refuse collection04.4.2.1 Refuse collection04.4.3 Sewerage collection04.4.3.1 Sewerage collection04.4.4 Other services relating to the dwelling necessary04.4.4.1 Other services relating to the dwelling necessary4(B) Other Fuels04.5.3 Liquid fuels04.5.3.1 Liquid fuels04.5.4 Solid fuels04.5.4.1 Solid fuels
5 FURNISHINGS, HOUSEHOLD EQUIPMENT and ROUTINE-MAINTENANCE OF HOUSE
5.1 Furniture, furnishings carpets and other floor coverings05.1.1 Furniture and furnishings05.1.1.1 Furniture and furnishings (household and garden)05.1.2 Carpets and other floor coverings05.1.2.1 Carpets and other floor coverings05.1.3 Repair of furniture, furnishings and floor coverings05.1.3.1 Repair of furniture, furnishings and floor coverings5.2 Household Textiles05.2.1 Household textiles05.2.1.1 Household textiles5.3 Household appliances05.3.1 Major household appliances whether electric or not05.3.1.1 Refrigerators, freezers and fridge-freezers05.3.1.2 Clothes washing-machines, clothes drying machines and dish
washing machines05.3.1.3 Cookers05.3.1.4 Heaters, air conditioners05.3.1.5 Cleaning equipment05.3.1.6 Sewing and knitting machines05.3.1.7 Other major household appliances05.3.2 Small electric household appliances05.3.2.1 Small electric household appliances
56 C. Grown and H. Komatsu

05.3.3 Repair of household appliances05.3.3.1 Repair of household appliances5.4 Glassware, tableware and household utensils05.4.1 Glassware, tableware and household utensils05.4.1.1 Glass and crystal-ware, tableware05.4.1.2 Cutlery, flatware and silverware05.4.1.3 Household utensils05.4.1.4 Repair of glassware, tableware and household utensils5.5 Tools and equipment for house and garden05.5.1 Major tools and equipment05.5.1.1 Major tools and equipment05.5.2 Small tools and miscellaneous accessories05.5.2.1 Small tools and miscellaneous accessories5.6 Goods and services for routine household maintenance05.6.1 Non-durable household goods05.6.1.1 Cleaning and maintenance products05.6.1.2 Other non-durable household articles5(B) Domestic Services and Household Services05.6.2.1 Domestic services05.6.2.2 Household services
Childcare
6 HEALTH6.1 Medical products appliances and equipment06.1.1 Pharmaceutical products06.1.1.1 Pharmaceutical products06.1.2 Other medical products06.1.2.1 Other medical products06.1.3 Therapeutic appliances and equipment06.1.3.1 Therapeutic appliances and equipment6.2 Out-patient services06.2.1 Medical services06.2.1.1 Medical and optical services06.2.2 Dental services06.2.2.1 Dental services06.2.3 Paramedical services06.2.3.1 Services of medical analysis laboratories and X-ray centres06.2.3.2 Services of medical auxiliaries06.2.3.3 Other non-hospital services6.3 Hospital services06.3.1 Hospital services06.3.1.1 Hospital services12.5.3 Insurance connected with health12.5.3.1 Insurance connected with health
Methodology and comparative analysis 57

7 TRANSPORT – collective forms except flights7.3 Transport Services07.3.1 Passenger transport by railway07.3.1.1 Passenger transport by railway and tube (excluding school travel)07.3.2 Passenger transport by road07.3.2.1 Passenger transport by road07.3.4 Passenger transport by sea and inland waterway07.3.4.1 Passenger transport by sea and inland waterway07.3.5 Combined passenger transport07.3.5.1 Combined passenger transport and school travel07.3.6 Other purchased transport services07.3.6.1 Other purchased transport services
7 TRANSPORT – flights7.3 Transport Services07.3.3 Passenger transport by air07.3.3.1 Passenger transport by air
7 TRANSPORT – private transports7.1 Purchase of vehicles07.1.1 Motor cars07.1.1.1 Purchase of new motor cars07.1.1.2 Purchase of second-hand motor cars07.1.2 Motor cycles07.1.2.1 Motor cycles of all types, scooters and powered bicycles07.1.3 Bicycles07.1.3.1 Bicycles07.1.4 Animal-drawn vehicles07.1.4.1 Animal-drawn vehicles7.2 Operation of personal transport equipment07.2.1 Spare parts and accessories for personal transport equipment07.2.1.1 Spare parts and accessories07.2.3 Maintenance and repair of personal transport equipment07.2.3.1 Maintenance and repairs07.2.4 Other services in respect of personal transport equipment07.2.4.1 Other services in respect of personal transport equipment12.5.4 Insurance connected with transport12.5.4.1 Insurance connected with transport7(B) Fuels and lubricants07.2.2.1 Fuels and lubricants7(C) School Transport
8 COMMUNICATION8.1 Postal services08.1.1 Postal services08.1.1.1 Postal services
58 C. Grown and H. Komatsu

8.2 Telephone and telefax equipment08.2.1 Telephone and telefax equipment08.2.1.1 Telephone and telefax equipment8.3 Telephone and telefax services08.3.1 Telephone and telefax services08.3.1.1 Telephone and telefax services
9 RECREATION and CULTURE9.1 Audio visual, photographic and information processing equipment09.1.1 Equipment for the reception, recording and reproduction of sound
and pictures09.1.1.1 Equipment for the reception, recording and reproduction of sound09.1.1.2 Television sets, video-cassette players and recorders09.1.2 Photographic and cinematographic equipment and optical instruments09.1.2.1 Photographic and cinematographic equipment09.1.2.2 Optical instruments09.1.3 Information processing equipment09.1.3.1 Information processing equipment09.1.4 Recording media09.1.4.1 Recording media for pictures and sound09.1.5 Repair of audio-visual, photographic and information processing
equipment09.1.5.1 Repair of audio-visual, photographic and information processing
equipment9.2 Other major durables for recreation and culture09.2.1 Major durables for outdoor recreation09.2.1.1 Major durables for outdoor recreation09.2.2 Musical instruments and major durables for indoor recreation09.2.2.1 Musical instruments09.2.2.2 Major durables for indoor recreation09.2.3 Maintenance and repair of other major durables for recreation and
culture09.2.3.1 Maintenance and repair of other major durables for recreation and
culture9.3 Other recreational items and equipment, gardens and pets09.3.1 Games, toys and hobbies09.3.1.1 Games, toys and hobbies09.3.2 Equipment for sport, camping and open air recreation09.3.2.1 Equipment for sport, camping and open air recreation09.3.3 Gardens, plants and flowers09.3.3.1 Gardens, plants and flowers09.3.4 Pets and related products09.3.4.1 Pets and related products09.3.5 Veterinary and other services for pets09.3.5.1 Veterinary and other services for pets, e.g., grooming, boarding, tattooing
and training
Methodology and comparative analysis 59

9.4 Recreational and cultural services09.4.1 Recreational and sporting services09.4.1.1 Recreational and sporting services09.4.2 Cultural services09.4.2.1 Cinemas, theatres, concerts09.4.2.2 Museums, zoological gardens and the like09.4.2.3 Television and radio taxes and hire of equipment09.4.2.4 Other services09.4.3 Games of chance09.4.3.1 Games of chance9.5 Newspapers, books and stationery09.5.1 Books09.5.1.1 Books09.5.2 Newspapers and periodicals09.5.2.1 Newspapers, magazines and periodicals09.5.3 Miscellaneous printed matter09.5.3.1 Miscellaneous printed matter09.5.4 Stationery and drawing materials09.5.4.1 Stationery and drawing materials9.6 Package holidays09.6.1 Package holidays09.6.1.1 Package holidays20.4 Holiday spending20.4.1 Holiday spending20.4.1.1 Holiday spending11.2 Accommodation services11.2.1 Accommodation services11.2.1.1 Accommodation services
10 EDUCATION10.1.(A) creche10.1 Pre-primary and primary education10.1.1 Pre-primary and primary education10.1.1.1 Pre-primary and primary education10.2 Secondary education10.2.1 Secondary education10.2.1.1 Secondary education10.3 Post-secondary non-tertiary education10.3.1 Post-secondary non-tertiary education10.3.1.1 Post-secondary non-tertiary education10.4 Tertiary education10.4.1 Tertiary education10.4.1.1 Tertiary education10.5 Education not definable by level10.5.1 Education not definable by level
60 C. Grown and H. Komatsu

10.5.1.1 Education not definable by level
12(A) PERSONAL CARE – necessities12.1.3 Other appliances, articles and products for personal care12.1.3.1 Other appliances, articles and products for personal care
12(A) PERSONAL CARE – baby products12.1.3 Other appliances, articles and products for personal care (baby-related)12.1.3.1 Other appliances, articles and products for personal care
12(A) PERSONAL CARE – other12.1.1 Hairdressing, salons and personal grooming establishment12.1.1.1 Hairdressing, salons and personal grooming establishment12.1.2 Electrical appliances for personal care12.1.2.1 Electrical appliances for personal care12.1.3 Other appliances, articles and products for personal care (except
baby-related or necessities)12.1.3.1 Other appliances, articles and products for personal care
12 MISCELLANEOUS GOODS and SERVICES12.2 Prostitution12.2.1 Prostitution12.2.1.1 Prostitution2.3 Narcotics02.3.1 Narcotics02.3.1.1 Narcotics12.3 Personal effects necessary12.3.1 Jewellery, clocks and watches12.3.1.1 Jewellery, clocks and watches12.3.2 Other personal effects12.3.2.1 Travel goods and other carriers12.3.2.2 Other personal effects12.4 Social protection12.4.1 Social protection services12.4.1.1 Social protection services12.5 Insurance12.5.1 Life insurance12.5.1.1 Life insurance12.5.5 Other insurance12.5.5.1 Other insurance12.6 Financial services necessary12.6.1 Financial intermediation services indirectly measured (FISIM)12.6.1.1 Financial intermediation services indirectly measured (FISIM)12.6.2 Financial services necessary12.6.2.1 Financial services
Methodology and comparative analysis 61

12.7 Other services necessary12.7.1 Other services necessary12.7.1.1 Other services necessary20.3 Licences
Pocket money
Notes
1 Tax allowances are subtracted from income subject to tax and can be a fixed amount orrelated to gross income subject to tax (e.g., in Mexico). Tax credits are deducted fromthe tax due (e.g., the United Kingdom).
2 There is no deduction for a financially dependent spouse in India, so the PIT paid by amale-breadwinner household and a single male-parent household who earn the samelevel of income is the same.
3 Monotributistas are mostly low-income independent workers, whereas self-employedare middle- to high-income earners.
4 A spousal deduction is not available to common-law partners in Argentina.5 This is consistent with the ‘destination principle’ which requires that the total tax paid
on a good be determined by the rate levied in the jurisdiction of its final sale. The ‘ori-gin principle’, in contrast, requires that tax be paid at the rate in and to the country inwhich the item is produced rather than consumed (Ebrill et al. 2001: 3).
6 This definition of indirect tax incidence, or the economic incidence of taxes, differsfrom legal or statutory incidence in that the burden of the tax is assumed to fall on thefinal consumer.
7 Greater detail on technical details of all papers can be found in the country papers athttp://www.sds.ukzn.ac.za/default.php?7,12,85,4,0 and www.american.edu/cas/economics/programs/gender.cfm
8 Given data constraints, the incidence analysis in India was carried out only in WestBengal.
9 The OECD equivalence scale, designed in 1982, awards the value of 1 to the principaladult household member, the value of 0.7 to other adults, and 0.5 to children under 14.A modified scale was established in 1994 that lowers the value to other adults from 0.7to 0.5 and values to children from 0.5 to 0.3. This scale results in less weight beinggiven to large families. Some scales are estimated based on parametric methods using achosen parameter, θ, with 0 < θ < 1. An example of a parametric scale uses square roots;it divides gross or net income (expenditures) by the square root of the number of house-hold members (OECD 2005).
10 Equivalence scales were developed to capture consumption, but the careful readerwill note that expenditure and consumption are quite distinct although clearly relatedconcepts. Our focus in this volume is on the former.
11 Since the VAT base normally includes excises and fuel taxes, the effective VAT rate onthe pretax base was calculated for goods and services subject to excises and fuel taxes.Moreover, since excises and fuel taxes could have been levied on a unit or combinationunit and on an ad valorem basis and often on the wholesale, not retail price, furtheradjustments to get effective excise and fuel tax rates were made. See country papers fordetails.
12 In his study of Ghana, Younger (1996) assumed that fuel for public transport made up20 per cent of input costs, which was near the average of the input–output tables forNiger, Madagascar and Cameroon. Lacking country input–output table data andaccounting for current prices, we adjusted this figure upward.
13 We define a tax to be progressive if incidence falls on the highest quintile, and regres-sive if incidence falls on the lowest quintiles.
62 C. Grown and H. Komatsu
14 Female-headed households receive the lowest fuel subsidy.15 However, the difference in incidence between male-breadwinner and dual-earner
households is not statistically significant.16 In Mexico, fuel taxes in the year of the study were actually a subsidy (see Chapter 5 for
more explanation). Thus, in Mexico, female-breadwinner households received the low-est subsidy compared to other households.
17 The incidence of tobacco on the poorest, no-employed households is almost double thatof female-breadwinner and male-breadwinner households and almost triple that of dual-earner households.
18 Not all countries, e.g., South Africa, have an official poverty line measured in this manner.19 These results are reported in the country case studies.20 Mexico and South Africa carry out a counterfactual exercise of imposing VAT on items
that are currently zero-rated. Uganda only considers reducing tax on salt and paraffinwithout measures to meet the revenue shortfall.
References
Bird, R. and Gendron, P. (2007) The VAT in Developing and Transitional Countries, NewYork: Cambridge University Press.
Bird, R. and Miller, B. (1989) ‘The Incidence of Indirect Taxes on Low-IncomeHouseholds in Jamaica’, Economic Development and Cultural Change 37(2): 393–409.
Casperson, E. and Metcalf, G. (1994) ‘Is a Value Added Tax Regressive? Annual VersusLifetime Incidence Measures’, National Tax Journal 47: 731–46.
Ebrill, L., Keen, M., Bodin, J.P. and Summers, V. (2001) The Modern VAT, Washington,DC: the International Monetary Fund.
Edmiston, K.D. and Bird, R. (2007) ‘Taxing Consumption in Jamaica’, Public FinanceReview 35(1): 26–56.
Martinez-Vazquez, J. (2001) ‘The Impact of Fiscal Policy on the Poor: Fiscal IncidenceAnalysis’. Available at: www.fiscalreform.net/library/pdfs/martinez_2001.pdf (accessedJuly 2007).
OECD (2005) ‘Taxing Working Families: A Distributional Analysis’, OECD Tax PolicyStudies No. 12, Paris: OECD.
Stotsky, J. (1997) ‘Gender Bias in Tax Systems’, Tax Notes International, June 9,pp. 1913–23.
Younger, S. (1996) ‘Estimating Tax Incidence in Ghana: An Exercise Using HouseholdData’, in D. Sahn (ed.) Economic Reform and the Poor in Africa, Oxford: Clarendon Press.
Younger, S., Sahn, D., Haggblade, S. and Dorosh, P.A. (1999) ‘Tax Incidence in Madagascar:An Analysis Using Household Data’, World Bank Economic Review 13(2): 303–31.
Methodology and comparative analysis 63

3 Gender equality and taxation inArgentina
Corina Rodríguez Enríquez, NataliaGherardi and Darío Rossignolo
Introduction
A consistent, planned policy of tax reform in Argentina, while badly needed, iscurrently on hold. In line with the dominant economic paradigm in the region(and the world), public spending is regarded as the main tool by which to reduceincome inequalities, neglecting the potential of tax reform. Instead of compre-hensive reform, therefore, there have been ad hoc changes to the tax system overthe years, as well as the addition of specific taxes in response to fiscal needs orsectoral interests.
Perhaps the main reason for the absence of fiscal reform on the current publicpolicy agenda is the multiplicity of interests involved together with a lack ofpolitical will. This chapter will evaluate the impact on gender equality of the cur-rent tax structure – particularly income tax and indirect taxes – as well as possi-ble reforms. It is hoped that it will also encourage policy-makers in Argentina totake up the issue of comprehensive tax reform.
Following an overview of the economic and tax structure, and the key dimen-sions for the analysis of gender equality, the chapter looks at income taxes andindirect taxes, then presents the results of a policy simulation designed to makethe tax system more equitable from a gender perspective. It then summarizes keyfindings and offers some policy suggestions to address them.
The Argentine economy
Argentina is a middle-income country in South America, with a population of36 million (51 per cent women; 49 per cent men) and a GDP of US$270 billion.Life expectancy averages 73.8 years. Almost 30 per cent of the population is under14 years old, while nearly 15 per cent is over 60 years old, with older womenmaking up a substantial part of this group. Family organization has been slowlychanging, with an increasing number of single-parent households and a decline inextended family households. Nuclear families now make up 55.7 per cent of allhouseholds, the majority (94 per cent) headed by a man. In contrast, women head57 per cent of one-person households and 81.7 per cent of one-parent households.
Argentina’s economy has undergone a number of crises and recoveries overthe past 20 years. In 1991, after several years of hyperinflation, the local

Gender equality and taxation in Argentina 65
currency was pegged to the dollar. This helped stabilize the economy, whichtogether with the support of multilateral financial institutions, facilitated aseries of structural reforms, including reduced import taxes, market deregula-tion and privatization of all state-owned industries and some state-providedservices (LoVuolo 2001). An important element of these reforms was a policyto reduce labour costs. Together they had a severe impact on the labour market,the principal source of income for most people, as well as on levels of povertyand indigence.
Despite the ups and downs of the economy over the decade 1991–2001, thelabour market showed a clear downward trend, as unemployment, under-employ-ment and job insecurity all increased. Although men’s situations worsened morequickly than women’s, women continued to be over-represented in all forms ofunemployment, under-employment and precarious jobs. Indeed, a feature of theeconomy in those years was its reduced capacity to generate employment, evenas production and investment rose.1
The economy began once more to slow down definitively in mid-1998, reach-ing a crisis at the end of 2001. To ensure social stability, the government termi-nated the currency board, devalued the local currency and adopted emergencysocial welfare measures. Assisted by a favourable international economic climate,a sustained process of economic recovery began in 2003: production, investment,consumption and employment all rose. Since then, the GDP has grown 8 per centannually. The change in relative prices that resulted from devaluation has allowedproduction to gradually recover, thus improving labour market conditions. By theend of 2006, unemployment had decreased to 10 per cent – 8.5 per cent for menand 11.6 per cent for women. The level and quality of employment rose, and theproportion of informal wage earners dropped, although it still represented over 40per cent of the labour force.
Data also show that labour market opportunities increased, although this didnot lead to greater female labour market participation. The presence of smallchildren at home remains a major constraint on women’s participation in thelabour market, especially among low-income women, whose economic activityrate is substantially lower than that of higher-income women, and lower still com-pared to male rates.
In addition to having fewer employment options than men, women continuedto be over-represented in the lowest quality and less-skilled jobs in the informaleconomy (56.5 per cent of female workers compared to 43.1 per cent of maleworkers). Domestic service, which is especially precarious, continued to be thelargest source of female employment, representing 17.2 per cent of the femalelabour force and 22.7 per cent of female wage earners. For all of these reasons,women’s income from paid work remains on average 73 per cent of men’sincome.
In short, the economic recovery did not change the main features of genderinequality. Women find it more difficult to participate fully in the labour marketthan men do, which translates into greater income vulnerability. This becomeseven more important when considering that women are over-represented in single-parent households.

66 C. Rodríguez Enríquez, N. Gherardi and D. Rossignolo
The tax structure in Argentina
Argentina’s tax/GDP ratio is moderate, although it has grown rapidly since 2001.From the beginning of the 1990s to the present, two stages can be distinguished:in the first, from 1991 until the end of 2002, the tax/GDP ratio averaged 20.9 percent of GDP, while in the second, from 2003 to 2008, it averaged 27 per cent ofGDP (see Figure 3.1). The growth in recent years is the result of the collection ofincreased revenues from sources that were only sporadically used in the past,such as export duties and tax on debts and credits in saving accounts, andincreased revenues from corporate profits (due to a more stable macroeconomicenvironment).
As illustrated in Figure 3.2, in 2007, indirect taxes make up almost 60 per centof total tax revenue (including social security contributions). The share of con-sumption taxes, value-added tax (VAT), excises and fuel taxes, remains thelargest component of revenue (over 30 per cent), although taxes on internationaltrade had grown to over 10 per cent by 2007. Of the direct taxes, income taxmakes up 18.6 per cent of total revenue.
A number of factors have contributed to the changes in the tax structure overthe past two decades, with shifts in policy often contradicting earlier policystances. After the 1991 crisis, tax policies aimed to broaden the tax basethrough the VAT; reduce income tax rates; eliminate export duties; and modifyfuel and gas taxes. In the middle of the 1990s, however, financial turmoilresulted in another series of measures, some of which contradicted the previous
0.0
5.0
10.0
15.0
20.0
25.0
30.0
35.0
1991 1993 1995 1997 1999 2001 2003 2005 2007
National Provincial
Figure 3.1 Gross tax burden, Argentina, 1991–2007.
Source: Ministry of Economy data, successive years.

Gender equality and taxation in Argentina 67
ones. The VAT rate was increased from 18 per cent to 21 per cent and its basewas broadened, import tariffs were increased, tax refunds on exports and capi-tal assets subsidies were reduced, and the tax base of income and personalassets was expanded. The persistent fiscal deficit led to additional measures,including raising the gasoline tax and reimposing the gasoil tax. Several minortaxes were created, including the Simplified Tax and Social Security Regime(Monotributo).
At the end of 1999, as the financial crisis deepened, the new governmentimplemented further tax measures. The VAT base was further broadened andsome exemptions were repealed. In addition, the use of differential rates wasextended, taxing different services at 10.5 per cent. Furthermore, the personalincome tax was amended, broadening the tax base through the reduction of non-taxable income, dependant deductions and special deductions. Once again, in
1999
16.8
1.8
30.5
9.33.92.5
16.8
18.4
2007
18.6
7.6
25.75.4
11.7
0.8
15.4
14.8
1991
6.8
6.9
20.2
155.6
4.8
25.4
15.3
Income tax
Property tax
VAT
Excise and fuel
Import and export taxes
Other taxes
Social security contributions
Provincial taxes
Figure 3.2 Composition of tax revenue as percentage of total revenue, Argentina.
Source: Based on Ministry of Economy data.

May 2001, new tax amendments were introduced, the most important being theimplementation of a tax on debits and credits in saving accounts.
Finally, after the economic crisis of 2001, export duties were implemented,generating revenues of up to 2.5 per cent of the GDP in 2007. This measureresponded to the government’s need to appropriate part of the gains produced bythe currency devaluation, and to establish a barrier against the impact that fluctu-ating international prices of primary goods could have on domestic goods prices.
In short, the initial intention of simplifying the tax system was superseded bythe need to address financial emergencies, causing a series of reforms. A large partof the recent growth in the tax burden can be explained by an increasing numberof what could be considered extraordinary or emergency taxes. It is now importantto introduce more comprehensive tax reform, which would give the system betterstability, simplicity, and most importantly, greater social and gender equity.
Personal income tax and gender equality
Personal income tax (PIT) is governed by the Income Tax Act 20628, enactedin 1973 and subsequently supplemented and amended by some 173 regulations.PIT is levied on both individuals and undivided estates resident in the country. Inaddition, foreign beneficiaries pay income tax on income earned in Argentina.
Each taxpayer in Argentina, regardless of his or her civil status, must file a sep-arate return (where required to do so) and pay the tax based on income subject totax (Article 29 of the Income Tax Law). However, Article 30 of the Income TaxLaw establishes some exceptions, with allocation to the husband of certain jointincome earned on joint property in the case of married couples:
Art. 30. Joint income shall be totally allocated to the husband unless: a) theproperty was acquired by the wife (under certain specified conditions);b) there has been a legal separation of assets; c) the wife manages thecommon property by court order.
Two observations are pertinent here. First, Article 30 is prima facie discrimina-tory because it does not recognize women as subject to tax on income from ‘mar-ital property’. Under the Civil Code, all property acquired by the spouses aftermarriage is marital property, that is, owned in equal parts (except specific caseswhere declared otherwise at time of purchase). It can be argued, however, thatthis formal discrimination does not hurt women, who therefore have a lower taxburden than their husband because of the joint title to the property.
Second, the exceptions provided in the law contradict the general provisions incivil law governing matrimonial assets. Without prejudice to the individual taxa-tion system, the law allocates to the husband income from certain assets that mayhave been acquired and managed by the wife. According to tax specialists, theapplicable system is not, strictly speaking, individual taxation, as it would appear,but rather a hybrid, as it involves a sort of joint taxation for marriage partners andis higher for such partners.
68 C. Rodríguez Enríquez, N. Gherardi and D. Rossignolo

The law also permits taxpayers to deduct certain amounts for each familymember for which they are responsible, provided the family member resides inthe country, and has a net income below a certain level. Deductions can beclaimed for spouses (but not common-law partners), ancestors and descendants.In general, these deductions can only be claimed by the most immediate relative.It is important to note that in the case of children, if both the father and motherhave taxable income, then both may claim the deduction.
The special deduction is allowed for resident individuals who have net incomefrom employment (salaried workers) or the professions (as self-employed).However, the maximum ‘special deduction’ is almost four times higher foremployed workers than for those who are self-employed. As the proportion ofself-employed women is greater than the proportion of self-employed men, whilethe reverse is the case for salaried workers, this is an implicit gender bias in thesystem. Although this disparity has been questioned, the 2008 reforms reducedbut did not eliminate it.
The law provides that certain entities, and income from certain sources, areexempt from tax. Among tax-exempt incomes are proceeds of court or adminis-trative labour-related awards and seniority compensation in dismissals. It is inter-esting to note, however, that the law does not exempt tax on damages awarded towomen dismissed during pregnancy or within one year after giving birth.
Furthermore, some exemptions are questionable because of their implicit dis-crimination by class and gender. In the 1990s reforms, the law established exemp-tions for income from stocks, bonds, certificates, bills, notes and other securitiesthat have been or may in the future be issued by government agencies, andincome derived from the purchase, sale, exchange, transfer, or disposition ofstocks, bonds and other securities by individuals and undivided estates. Theseexemptions clearly benefit only persons with a sufficient level of income andunderstanding to engage in transactions covered by this tax break. Women areunder-represented in this group.
PIT contributions by employment category
One of the features of personal income taxation in Argentina is its segmentation.The system provides for three distinct employment categories, each having itsown PIT dispensation: employees, self-employed taxpayers (high- and medium-income independent workers) and monotributistas (individuals registered underthe simplified tax regime known as Monotributo for small and medium-sized tax-payers, who are mostly low-income independent workers).
Self-employed taxpayers must pay income tax in five advance payments of20 per cent each of total annual tax owed. Monthly income of salaried workers issubject to withholding by the employers, who are responsible for paying the taxto the tax authorities. In the case of monotributistas, income tax is included in asingle tax payment based on income bracket and, to ease administrative burden,there are no rules related to the assessment of income or deductions. Accordingto information provided by tax authorities, although women are a minor share of
Gender equality and taxation in Argentina 69

70 C. Rodríguez Enríquez, N. Gherardi and D. Rossignolo
taxpayers in all three categories, they are under-represented among self-employed taxpayers (27.9 per cent) and employees (22.2 per cent) and over-represented among monotributistas (38.9 per cent).
In the case of employees and self-employed taxpayers, the tax is determinedas per taxable net income bracket. Table 3.1 shows non-taxable income brack-ets, the fixed amounts for each bracket and their corresponding rates. These tax-payers are allowed certain deductions, as outlined in Table 3.2. In addition, inthe case of the employed and self-employed, further deductions – including con-tributions to pension and health care schemes, life insurance premiums, funeralexpenses, retirement insurance, medical coverage and interest on mortgage-backed loans – are allowed. Beginning in 2005, it is also possible to deduct allpayments made as salaries and employers’ contributions to domestic workers.
In the case of monotributistas, on the other hand, the tax is a fixed amount estab-lished according to the Monotributo category into which taxpayers fall, which isdetermined based on invoicing and/or the surface area of the facilities and/or theuse of power during the production process. Tables 3.3 and 3.4 show the totalamount to be paid monthly as Monotributo, according to their activities and grossincome determined on an annual basis. As we will see below, the amount of taxespaid differs substantially for the different categories of PIT taxpayers, partlybecause monotributistas do not enjoy any tax deductions or allowances.
Table 3.1 Income tax applicable by income bracket, Argentina
Accumulated taxable net income Payment
Over AR$ Up to AR$ AR$ Plus % On the excess of AR$
0 10,000 9 10,000 20,000 900 14 10,000 20,000 30,000 2,300 19 20,000 30,000 60,000 4,200 23 30,000 60,000 90,000 11,100 27 60,000 90,000 120,000 19,200 31 90,000
120,000 Above 28,500 35 120,000
Source: Income Tax Law, Section 90.
Table 3.2 Annual individual personal allowances, Argentina (in AR$)
Personal allowance Self-employed taxpayers Employees
Non-taxable income 9,000 9,000 Spouse 10,000 10,000 Children (each) 5,000 5,000 Other dependants (each) 3,750 3,750 Special deduction (for income 9,000 34,200deriving from personal work)
Source: Income Tax Law, Section 23.

Gender equality and taxation in Argentina 71
Vertical and horizontal (in)equity of personal income tax
This section analyses PIT payments for different types of households to considerissues of horizontal and vertical equity. In order to do this, we apply the PIT pro-visions, rates and deductions to the following household types: a male-breadwin-ner household, a single-income female-breadwinner household, and a dual-incomehousehold,2 each with two dependent children.
In order to assess vertical equity, we consider three levels of householdincome: the median, half the median and twice the median. In the case ofArgentina, the first two cases are below the PIT threshold and therefore do notpay income tax. Households whose income is twice the median income or abovedo contribute, with the rates increasing with income, as shown in Table 3.1. Thismakes the PIT vertically equitable.
We also consider, for each household type, the PIT payment depending on thesource of income, that is, whether the income is taxed in terms of the employeeor monotributistas provisions. The household types are shown in Table 3.5.
Table 3.6 shows the taxes paid at the median income by the different house-hold types (full calculations are shown in Annex 1). In the first two cases(employees and self-employed taxpayers), income tax would be higher for those
Table 3.3 Monthly Monotributo payments: activities related to the hiring and/or performanceof services, Argentina
Category Gross Tax Pension fund Health insurance Totalincome amount contributions plan contribution payable
A Up to AR$ 12,000 AR$ 33 AR$ 35 AR$ 37 AR$ 105B Up to AR$ 24,000 AR$ 39 AR$ 35 AR$ 37 AR$ 111C Up to AR$ 36,000 AR$ 75 AR$ 35 AR$ 37 AR$ 147D Up to AR$ 48,000 AR$ 128 AR$ 35 AR$ 37 AR$ 200E Up to AR$ 72,000 AR$ 210 AR$ 35 AR$ 37 AR$ 282
Source: Based on General Resolution AFIP Nº 2431/2008.
Table 3.4 Monthly Monotributo payments: other activities, Argentina
Category Gross Tax Pension fund Health insurance Totalincome amount contributions plan contribution payable
F Up to AR$ 12,000 AR$ 33 AR$ 35 AR$ 37 AR$ 105 G Up to AR$ 24,000 AR$ 39 AR$ 35 AR$ 37 AR$ 111 H Up to AR$ 36,000 AR$ 75 AR$ 35 AR$ 37 AR$ 147 I Up to AR$ 48,000 AR$ 118 AR$ 35 AR$ 37 AR$ 190 J Up to AR$ 72,000 AR$ 194 AR$ 35 AR$ 37 AR$ 266 K Up to AR$ 96,000 AR$ 310 AR$ 35 AR$ 37 AR$ 382 L Up to AR$ 120,000 AR$ 405 AR$ 35 AR$ 37 AR$ 477 M Up to AR$ 144,000 AR$ 505 AR$ 35 AR$ 37 AR$ 577
Source: Based on General Resolution AFIP Nº 2431/2008.

72 C. Rodríguez Enríquez, N. Gherardi and D. Rossignolo
in common-law marriages since they cannot take the deduction for the spousewho does not earn any income, which currently amounts to AR$10,000 per year.
Argentina’s PIT is not horizontally equitable by two other measures. First, thesource of income affects the tax paid. For all household types, taxes paid by theself-employed and monotributistas are well above those of paid employees.Women predominate among the self-employed and monotributistas. Second,within each of the tax categories, there are significant differences in the taxespaid by different household types. These differences occur mainly because thedeductions and tax credits available to taxpayers in Argentina favour high-income earners; likewise, several income sources that are excluded from the taxbase are more concentrated in the aggregate income of high-income earners.Males dominate high-income earners, while females dominate lower earners.Thus, because women are more concentrated in the lower-income groups andamong the self-employed and monotributistas, the system contains an implicitbias against women.
As mentioned, given that the system taxes individuals, the second income –usually that of the female spouse – is not subject to a higher marginal tax burden
Table 3.5 Household composition and income by type, Argentina
Type of Number of members Number of Household annual household income earners net income
A Two married people, one Only the male member AR$ 72,000male provider with two has an income underage children
B Single parent household, The female member AR$ 72,000one female provider with has an income two underage children
C Two married people, both Both members earn an AR$ 72,000have an income, with two income: the male’s income underage children is high, the female’s
income is low
Table 3.6 Income tax by type of household and income source, Argentina (AR$)
Type of household
A B C
Income source Employees 0 2,132 male = 2,132 female = 0
Self-employed taxpayers 5,120 7,420 male = 4,660 female = 0
Monotributistas 2,520 2,520 male = 900 female = 468
Notes: A = married male breadwinner with financially dependent spouse and two children.B = unmarried (single) female earner and two children.C = married dual-earner household and two children.

Gender equality and taxation in Argentina 73
because it is not added to the first. If both spouses have taxable income, non-taxableincome is deducted by both. Both spouses can also take deductions for theirdependent children, provided the remaining conditions are present. However, it isimportant to note that only self-employed workers or employees benefit fromthese provisions, and employees benefit more than self-employed workers due tothe fact that their non-taxable income is higher. Taxpayers in the monotributistascategory are most disadvantaged.
Thus, in sum, the PIT system is Argentina is not horizontally equitable. The sys-tem disadvantages single-parent households, and self-employed and monotributistas,all categories where women are over-represented. The tax system also favourstwo-parent single-earner households and the typical male-breadwinner householdwhere the income earner is an employee.
From the standpoint of gender equality, therefore, there are both strengthsand weaknesses in the personal income tax system. One of the strengths is thatof being an individual filing system, which does not discourage a prioriincome generation by women. Furthermore, there is no explicit discriminationin the application of deductions and other tax benefits, which are availableequally to men and women. However, an explicit bias against women arisesfrom the treatment of community property income, in that while there is nonegative economic impact, women are ignored as individuals with legal rightsand duties.
Indirect taxation: impact and incidence
As stated previously, indirect taxes represent the largest proportion of theArgentine tax revenues. Although some efforts have been made to examine indi-rect tax incidence in Argentina (Beccaria 1979; Gómez Sabaini and Santiere1993; Ahumada et al. 1996; Gasparini 1998; Santiere et al. 2000, 2002; Santiereand Gómez Sabaini 2001; Gómez Sabaini and Rossignolo 2008), none have beendone from a gender perspective. In order to estimate the tax burden faced byhouseholds among different gender classifications, therefore, we estimated thetax incidence of three kinds of indirect taxes: VAT, excise taxes and fuel taxes,which together represent more than 30 per cent of total revenue.
The exercise allocated the theoretical tax burden to different types of house-holds, based on information on household consumption in the National Survey onHousehold Expenditure 2004–05 (although the 2007 tax rates were applied). Itassumed that tax burden on goods and services is fully passed onto consumers.Calculations using these data show average tax collections in 2005 were 66 percent of actual tax revenues, with 69 per cent being collected through VAT, 63 percent through fuel taxes, and 49 per cent through excises. All figures have beenannualized and are expressed in thousand pesos.
Indirect tax rates
Argentina has three VAT rates, plus exemptions (exports are zero-rated). Thegeneral tax rate is 21 per cent. A higher rate of 27 per cent is applied to invoices

74 C. Rodríguez Enríquez, N. Gherardi and D. Rossignolo
for public services to companies. A lower rate of 10.5 per cent is applied to basicconsumption goods such as fruit and vegetables, legumes, grains, bread andhoney, some agricultural goods such as live animals and leather, and new homesales. Publications, water, milk, medicine for resale, educational services, life insur-ance, housing property rental, and a few other specific items are exempt from VAT.A full list of the VAT provisions is provided in Annex 2.
The basis for calculating the tax due is the net price of the operation, includingthe cost of services provided together with the operation or as a result of it, andfinancing considerations. The base does not include the VAT generated by theoperation itself and domestic taxes applicable to the operation.
Excise taxes apply to the domestic sale and importation of a specific list ofgoods and transactions: alcoholic beverages, beer, soft drinks and other nonalco-holic beverages, automobiles, gasoline motors and insurance.
In all taxes on goods, the taxable basis includes the tax itself. The taxable basis isthe net price billed by the responsible party, defined as the remainder after deductionof discounts and bonuses, financing interest, and the VAT generated by the opera-tion. In the case of cigarettes, the taxable basis is the sale price to the end user, exclu-sive of the VAT; in the case of insurance, the taxable basis does not include the taxitself, which is the only case in domestic taxes where the legal or nominal rate isapplied to the taxable basis. Table 3.7 shows the tax rates for the excises considered.
Table 3.7 Excise tax rates, Argentina
Goods taxed Rate
TobaccosCigarettes 60Cigars, etc. 16Chewing tobacco, snuff, etc. 20Alcoholic beverages Whisky 20Cognac, brandy, pisco, gin, vodka, rum, gin, etc. 20Others based on proof First class, from 10 to 29 proof 20Second class, 30 proof and higher 20Beer 8Nonalcoholic beverages, syrups, extracts, concentrates, and mineral water 4/8 Luxury items 20Pleasure or sports vessels and aircraft Sale price between 15000 and 22000 pesos 4Sale price over 22000 pesos 8Electronics 17Services taxed Labour accident insurance 2.5Others 1Cell and satellite telephone service 4
Source: Tax law.

Gender equality and taxation in Argentina 75
Fuel taxes are applied on liquid fuels and compressed natural gas. For fuels, thegas tax applies to all forms of gasoline, solvent, turpentine, gas oil, diesel oil, andkerosene. On natural gas, there is a tax on what is distributed by networks for useas compressed natural gas in vehicles. The tax is applied in a single stage at the pointof sale of products of national or imported origin. Exports are exempt. The tax iscalculated by applying the respective rates to the net sales price on the invoice orequivalent document for operators engaged in resale at distribution points, issuedby those required to do so. Table 3.8 shows the products taxed, tax rates and min-imum amounts per unit of measure.
Incidence of indirect taxation
Table 3.9 shows the aggregate results of the estimated incidence of the indirecttaxes under consideration, by sex of household head; by employment status andby gender composition. It shows that the incidence for all households and taxesis 16.8 per cent. Most of that results from the impact of the VAT, the total aver-age incidence of which is 13.8 per cent.
The highest tax incidence is borne by male-type households. The overall taxincidence is relatively higher for households with a male head (16.9 per cent),dual-earner households (17.1 per cent), male-breadwinner households (17.0 percent) and male-majority households (17.5 per cent).
As regards VAT, although the difference in tax burden borne by differenthouseholds is statistically significant with male-type households having a higherincidence, the magnitudes of the differences are not large. For example, the inci-dence for male-majority, female-majority and equal-adult households is respec-tively 13.9 per cent, 13.8 per cent and 13.8 per cent. The incidence of excise taxesand fuel taxes also falls mainly on male-type households. The differences aremore significant for these taxes.
Table 3.8 Tax rates on fuels, Argentina
Product Rate Minimum amountimposed per litre/m3
Unleaded gasoline, up to 92 octane 70 0.5375Unleaded gasoline, more than 92 octane 62 0.5375Leaded gasoline, up to 92 octane 70 0.5375Leaded gasoline, more than 92 octane 62 0.5375Straight-run gasoline 62 0.5375Natural gasoline 62 0.5375Solvent 62 0.5375Turpentine 62 0.5375Gas oil 19 0.15Diesel oil 19 0.15Kerosene 19 0.15Compressed natural gas for use as a fuel 16
Source: Tax law.

76 C. Rodríguez Enríquez, N. Gherardi and D. Rossignolo
In the aggregate, the incidence by quintile shows that indirect taxes are overallproportional, and very slightly progressive (see Table 3.10). In the 1st quintile,that is, households with lower consumer spending, the burden is 16.2 per cent,increasing to 17.2 per cent in the highest quintile. In the analysis by tax, how-ever, the VAT is regressive between quintiles 1 and 4, although it has a U-shaped curve, because the 5th quintile has a burden slightly higher than thatof quintiles 3 and 4.
The impact of excises is not clearly defined, because their incidence shows aninverted, U-shaped curve. The 1st quintile faces a tax incidence of 1.2 per cent;the 3rd quintile, 1.4 per cent; and the 5th quintile, 0.9 per cent. The overall inci-dence of excises is strongly conditioned by the progressive nature of the fuel tax,in which the 1st quintile faces a burden of 0.79 per cent and the 5th quintile, 2.48per cent.
Table 3.9 Overall incidence by household type: tax as percentage of expenditure,Argentina (standard errors in italics)
Total tax VAT Excise tax Fuel tax Households (%)
Headship
Male headed 16.97 13.82 1.26 1.89 75.83 0.042 0.018 0.022 0.034
Female headed 16.18 13.80 1.25 1.13 24.17 0.037 0.020 0.023 0.026
Total 16.78 13.82 1.26 1.70 0.040 0.019 0.022 0.033
Employment categories
Male breadwinner 17.05 13.84 1.40 1.81 36.21 0.043 0.019 0.024 0.036
Female breadwinner 15.82 13.77 1.02 1.03 11.49 0.035 0.020 0.021 0.023
Dual earner 17.11 13.82 1.32 1.97 43.11 0.039 0.017 0.021 0.033
None employed 15.36 13.76 0.67 0.93 9.20 0.040 0.024 0.021 0.027
Total 16.78 13.82 1.26 1.70 0.041 0.019 0.022 0.033
Household sex composition
Male majority 17.46 13.86 1.62 1.98 20.68 0.045 0.018 0.027 0.037
Female majority 16.35 13.83 1.15 1.37 27.01 0.038 0.019 0.021 0.028
Equal number adult 16.73 13.79 1.17 1.77 52.31 0.040 0.019 0.021 0.033
Total 16.78 13.82 1.26 1.70 0.041 0.019 0.022 0.033

Gender equality and taxation in Argentina 77
These general considerations may differ if the situation is analysed concurrentlyby household and quintile type, as we did for the employment status householdclassification. The results for the taxes under consideration as a whole are shown inFigure 3.3. The higher tax incidence is borne by male-breadwinner and dual-earnerhouseholds, for all expenditure quintiles. In all cases (except households with noadults employed), the tax incidence is higher for households with no children.
Table 3.10 Incidence by quintile: tax as percentage of expenditure, Argentina (standard errors in italics)
Quintile Total tax VAT Excise tax Fuel tax
1 16.23 14.22 1.22 0.79 0.040 0.021 0.029 0.025
2 16.57 13.75 1.43 1.38 0.043 0.019 0.025 0.033
3 16.87 13.68 1.44 1.75 0.044 0.019 0.023 0.036
4 17.02 13.66 1.25 2.12 0.041 0.017 0.018 0.035
5 17.21 13.78 0.94 2.48 0.034 0.016 0.013 0.031
Total 16.78 13.82 1.26 1.70 0.041 0.019 0.022 0.033
14
15
16
17
18
19
1 2 3 4 5
Quintile
Male-breadwinner w/ch Male-breadwinner no/ch
Female-breadwinner w/ch Female-breadwinner no/ch
Dual-earner w/ch Dual-earner no/ch
None-employed w/ch None-employed no/ch
Figure 3.3 Total tax incidence by quintile and household type, Argentina.

78 C. Rodríguez Enríquez, N. Gherardi and D. Rossignolo
In the case of male-breadwinner and dual-earner households, the incidenceprofile of indirect taxation seems to be slightly more progressive3 than for the restof households. Moreover, this difference is substantial as compared to female-breadwinner households, which show a proportional incidence in the case ofhouseholds with children,4 and a slightly regressive one in the case of householdswith no children.5
The case of non-employed households is more erratic, with a progressiveimpact on households with children and a slightly regressive impact on house-holds with no children. It is difficult to analyse this latter category, whichincludes mainly retired adults, but also households where all adults are unem-ployed. Moreover, since these households comprise only 5 per cent of the total,no further inferences may be made.
The impact on distribution of the total tax incidence is explained by the simul-taneous existence of a certain regressivity of VAT, a marked regressivity ofexcises and a marked progressivity of the fuel tax. Indeed, the 1st expenditurequintile bears a VAT incidence higher than the other quintiles, with respect to allhousehold types. This regressivity reaches a plateau in the middle segments ofdistribution and reverts in the 5th quintile (see Figure 3.4).
Although differences in VAT incidence among household types are not sig nifi-cant, female-breadwinner households clearly face the most regressive VAT inci-dence, implying a gender bias against poor female-type households. VAT is
12
13
14
15
1 2 3 4 5
Quintile
Male-breadwinner w/ch Male-breadwinner no/ch
Female-breadwinner w/ch Female-breadwinner no/ch
Dual-earner w/ch Dual-earner no/ch
None-employed w/ch None-employed no/ch
Figure 3.4 VAT incidence by quintile and household type, Argentina.

Gender equality and taxation in Argentina 79
regressive between quintiles 1 and 3 for all household types. For male-type house-holds, it becomes proportional between quintiles 3 and 5. In the case of female-typehouseholds, it is regressive for all quintiles. It is likely that this results from the factthat most basic consumer goods, including food, are subject to the general tax rate,and only a small number of food items are subject to a differentiated rate. We willfurther explain this in the analysis by type of good and in the policy simulations.
Excises are overall regressive between quintiles 2 and 5, though with dif-ferences according to household type. The incidence is still higher for male-breadwinner and dual-earner households, among those households in the lowerquintiles, but these differences almost disappear as progress is made in thedistribution scale (see Figure 3.5).
Similarly, for most household types, the impact of this tax is progressive in thelowest quintiles, but as noted above becomes regressive in the highest quintiles.The most significant exception occurs for male-breadwinner households with nochildren, for which the impact is clearly regressive.
The incidence of fuel tax is progressive for quintiles 1 through 4, and for allhousehold types (see Figure 3.6). As in the previous cases, the highest incidence isborne by male-breadwinner and dual-earner households (with and without child -ren). Female-breadwinner households with children bear the lowest incidence.
1
1
0
2
2 3 4 5
Quintile
Male-breadwinner w/ch Male-breadwinner no/ch
Female-breadwinner w/ch Female-breadwinner no/ch
Dual-earner w/ch Dual-earner no/ch
None-employed w/ch None-employed no/ch
Figure 3.5 Excise incidence by quintile and household type, Argentina.

80 C. Rodríguez Enríquez, N. Gherardi and D. Rossignolo
In summary, indirect taxation in Argentina shows a proportional incidence inthe aggregate and a relative higher incidence on male-type households. Takinginto account the employment status classification, the incidence is higher onmale-breadwinner and dual-earner households. The proportional effect of theaggregate tax incidence takes a more progressive character on such householdsand a more regressive (or less progressive) character on female-breadwinnerhouseholds.
The aggregate incidence results are driven largely by a slightly regressive VATincidence faced by poorer households, proportional VAT burden faced by house-holds of medium-high expenditure level, the regressive nature of excises and theprogressive nature of fuel taxes. The strengthening of these general featuresamong different types of households results from a combination of the character-istics of different consumption structures and the particular taxation of differenttypes of goods.
To illustrate the issue, Figure 3.7 shows tax incidence by type of householdand quintile for items in the basic food basket. The analysis suggests that taxincidence on food items is the most regressive. The basic food basket is also decid-edly regressive, weighing heaviest on the first quintiles, although the incidence
1 2 3 4 5
Quintile
Male-breadwinner w/ch Male-breadwinner no/ch
Female-breadwinner w/ch Female-breadwinner no/ch
Dual-earner w/ch Dual-earner no/ch
None-employed w/ch None-employed no/ch
0
1
2
3
4
Figure 3.6 Fuel tax incidence by quintile and household type, Argentina.

Gender equality and taxation in Argentina 81
is higher for male-breadwinner households. Moreover, female-breadwinnerhouseholds face the highest tax burden on expenditure on sugar and confectioneryeven though the tax is progressive.
Although the data are not shown here, our previous work found that the taxlevied on nonalcoholic beverages is progressive overall, but female-breadwinnerhouseholds face the highest burden. An opposite situation occurs with alcoholicbeverages; tax on beer shows an inverted U-shaped curve for the average,although the burden is regressive for male-breadwinner households; female-breadwinner households face a lighter burden.
Regarding other commodities, we found the tobacco tax to be very regressivefor male-breadwinner and dual-earner households, while for female-breadwinnerhouseholds there is an inverted U-shaped curve, as there is for children’s clothing,where female-breadwinner households face a lower burden than the others.Household utility taxes (housing, water, electricity, etc.) are also regressive, andthe tax incidence is similar for the various household type. Although taxation oneducation is progressive, the heaviest burden falls on female-breadwinner house-holds. The same occurs with the categories of miscellaneous and other necessi-ties for personal care. In the case of health, the heaviest burden is faced byhouseholds with no one employed. Tax incidence on public transport is slightly
Male-breadwinner HH Male-breadwinner HH
Female-breadwinner HH Female-breadwinner HH
Dual-earner HH Dual-earner HH
None-employed HH None-employed HH
1 2 3 4 5
Quintile
0
1
2
3
4
Figure 3.7 Basic food basket incidence by quintile and household type, Argentina.

82 C. Rodríguez Enríquez, N. Gherardi and D. Rossignolo
regressive and higher for female-breadwinner households. School transportationtaxation shows a U-shaped curve for female-breadwinner households, which byfar have the highest incidence. For the rest of the households the tax is more pro-gressive. The incidence of taxes on fuels and lubricants is progressive and higherfor male-breadwinner households. The tax on communications expenditures hasa higher incidence for female-breadwinner households. And, finally, the incidenceof the taxes on baby products is regressive and clearly higher for male-breadwinnerhouseholds.
In summary, the analysis by commodity groups suggests that: (1) the tax bur-den becomes more regressive for certain type of expenditures; and (2) the burdenbecomes relatively higher for female-breadwinner households for certain type ofexpenditures. The regressive pattern is particularly clear for food (mainly foodincluded in the basic basket), housing utilities, collective forms of transport andbaby products.
Furthermore, female-breadwinner households are especially affected by thetax burden of consumption expenditures on some particular foods (sugar and con-fectionery, non-alcoholic beverages), education, necessities for personal care,collective forms of transport, school transport and communication.
On the basis of this evidence we propose specific changes to the tax structure toallow a higher level of distributive justice. This would be attained by improvingthe progressive pattern of indirect taxation, as well as by lightening the tax burdenon the most economically vulnerable households, such as female-breadwinnerhouseholds.
Indirect tax policy simulations
Given the regressive impact of food taxes, we conduct two simulations to correctthis impact and to assess its effect on the overall incidence. First, we propose azero tax rate for food products included in the basic basket. While this has a pos-itive effect on the system’s equality, it results in tax losses. As an alternative,therefore, we suggest a comprehensive amendment which includes changes to theVAT and to domestic taxes and which has a neutral impact on tax collection.
The first alternative recognizes that taxes on food are generally regressive,because the impact is heaviest on lower-income households, who spend most oftheir income on food. In Argentina the only exempt products are milk and natu-ral water, and there is a lower rate for a limited group, including meat, bread, andwheat flour. However, application of a zero-tax rate to foods in the basic basketentails a loss of revenue, estimated to be about 10.2 per cent of actual revenue,lowering the burden of the tax system to 14.5 per cent from the baseline of 16.8per cent. As shown in Table 3.11, male-breadwinner and dual-earner householdsstill face the highest tax burden, and the three categories without children aremore heavily taxed than those with children.
The main result of this policy measure is that the system becomes more pro-gressive, as can be seen in Figure 3.8. Compared to the baseline, both the totaltax incidence and even the VAT become progressive. The main reduction in tax

Gender equality and taxation in Argentina 83
incidence applies to non-employed households (15.6 per cent) and the least todual-earner households (12.5 per cent). It is interesting to note that while the dif-ferences in tax incidence reduction are small between household type and quin-tile, female-breadwinner households experienced the smaller reduction.
The second simulation sought to make the system more progressive whileavoiding revenue losses, reducing the tax burden on those goods with larger rel-ative consumption by poor households (Gómez Sabaini and Rossignolo 2008), aswell as on so-called merit goods while increasing it on so-called demerit goods.
To do this, we changed the VAT tax rates and some excise rates. For the former,although we saw in the first simulation the potential for progressivity by establish-ing zero-tax rates on foods in the basic basket, this is probably not possible, owingboth to its high tax cost (more than 10 per cent of tax revenue, about 3.2 billionpesos), and to the belief that this tax is widely evaded in Argentina. It is thereforemore desirable to grant reduced rates rather than a zero rate (which is rarely appliedfor domestic transactions). This generates incentives to report transactions in orderto get the cumulative tax credits that otherwise would not be available.
The procedure regarding the VAT was therefore as follows:
• We analysed the concentration of consumer goods expenditures in the first threefood groups, that is, basic unprocessed, basic processed, and confectionery.
• We selected consumption with a high concentration in the lowest income quin-tile that was equal to or greater than that in the 5th quintile. We verified thatthe indicated consumption was of goods from the basic unprocessed basket.
Table 3.11 Tax incidence by type of tax: base estimates and simulation of zero tax on foodproducts, Argentina
Total tax VAT
Base Simulation Base Simulation
Headship
Male headed 16.972 14.674 13.825 11.522 Female headed 16.179 13.903 13.796 11.516 Total 16.780 14.487 13.818 11.520
Employment status
Male breadwinner 17.053 14.566 13.843 11.351 Female breadwinner 15.823 13.624 13.774 11.570 Dual earner 17.108 14.975 13.820 11.682 None employed 15.363 12.969 13.763 11.365 Total 16.780 14.487 13.818 11.520
Household sex composition
Male majority 17.465 15.017 13.863 11.410 Female majority 16.348 14.113 13.831 11.591 Equal adults 16.732 14.471 13.793 11.528 Total 16.780 14.487 13.818 11.520

84 C. Rodríguez Enríquez, N. Gherardi and D. Rossignolo
• From these (accounting for between 10 and 15 per cent of total consumptionin the lowest quintiles) we removed those that could constitute a minimumdiet, such as bread, stew beef, eggs, milk, wheat flour and cooking oil.
• We applied a reduced tax rate of 10.5 per cent to the rest of the productsconsidered in the food basket (basic unprocessed and basic processed).
• Given the upward trend in the tax burden on public transportation expendi-tures, we decided to restore the exemption that was in force in the mid-1990s;we also added an exemption for children’s clothing.
• For the rest of the goods and services the current regulatory situationremained unchanged.
Regarding excises, the simulation sought to strengthen the importance of taxes ongoods and services based on increased tax rates for demerit goods, in order togenerate tax revenue to compensate for the loss of income from the exemptionapplied to foods in the basic basket.
This implies substantial hikes in the tax rates for products already taxed, andnew taxes on goods considered as luxuries, which are purchased more by male-breadwinner or dual-earner households (see Elson 2007). We applied the followingchanges:
• Addition of excise taxes on household appliances (category of furnishings,household equipment and routine maintenance of the house), with a rate of20 per cent.
• Increase of the tax rate on luxury items (cars, boats, etc.) to 30 per cent in theprivate transport group. It should be noted that the survey does not show highpurchases in this expenditure group, so the selected tax rate is uniform.
13
14
15
16
17
18
1 2 3 4 5
Quintile
Male-breadwinner w/ch Male-breadwinner no/ch
Female-breadwinner w/ch Female-breadwinner no/ch
Dual-earner w/ch Dual-earner no/ch
None-employed w/ch None-employed no/ch
12
Figure 3.8 VAT zero rate on food simulation – total incidence – by quintile and house-hold type, Argentina.

Gender equality and taxation in Argentina 85
• Increase in the tax on electronics, in the recreation and culture group, to30 per cent.
• Higher tax on tobacco and alcohol (beer, spirits), continuing and increas-ing those from the earlier exercises but now extending them to tobaccousers.
• Increase of the wine tax to 15 per cent.• We decided to exclude VAT in services because taxation on communications
group is progressive and female-type households bear a heavy burden.
Table 3.12 summarizes the changes in excises rate proposed.It should be noted that the alternative proposal to increase tax collection by
increasing tax rates on demerit goods, mostly consumed by predominantly malehouseholds, does not exclude other alternatives that might also contribute togender equality. In addition to potential increases in transfers through publicexpenditure, which are not considered in this study, we may look at increases inother taxes, such as personal income tax, for example.
Of course these proposals are purely for the purposes of the exercise and do notrepresent judgements regarding the sectors’ profitability and the possibility ofabsorbing the tax, although in all cases the changes are not so great that they
Table 3.12 Excise tax rates, Argentina
Goods taxed Original tax rate Revised tax rate
Tobaccos
Cigarettes 60 90 Cigars, etc. 16 32 Chewing tobacco, snuff, etc. 20 40 Pipes, lighters 0 40
Alcoholic beverages
Whisky 20 40 Cognac, brandy, pisco, gin, vodka, rum, gin, etc. 20 40 Others based on proof First class, from 10 to 29 proof 20 40 Second class, 30 proof and higher 20 40
Beer 8 20 Nonalcoholic beverages, syrups, extracts, 8 8concentrates, and mineral waterLuxury items 20 30 Pleasure or sports vessels and aircraftSale price between 15000 and 22000 pesos 4 30 Sale price over 22000 pesos 8 30 Electronics 17 30
Services taxed Labour accident insurance 2.5 2.5Others 1 1Cell and satellite telephone service 4 4

86 C. Rodríguez Enríquez, N. Gherardi and D. Rossignolo
would shrink production in the sector. These examples are based on models ofpartial equilibrium.
Table 3.13 compares the results of the proposed reform with the baseline. Thereform generates increased tax revenue of about 2 billion pesos; the loss of rev-enue from the VAT due to the exemptions is more than offset by the increasedincome from excise taxes. The latter’s share increases from 6 per cent to 24 percent, while that from the VAT drops to 65 per cent.
Table 3.14 summarizes the results of the simulation. Tax incidence as a per-centage of expenditure is 16.9 per cent, slightly higher than in the baseline.However, there is a change in the composition of the tax burden because VATincidence drops by more than two percentage points, while that of excise taxesincreases by the same proportion.
Households that have the highest tax incidence in the reformed scheme are themale-headed, dual-earner, male-majority and equal-number-adult households, while
Table 3.13 Estimated revenue comparison (in millions of current pesos), Argentina
Baseline Structure Proposed reform Structure Difference(%) (%)
VAT 25,360.21 81.5 21,449.72 64.9 −3,910.5Excise tax 1,985.10 6.4 7,806.51 23.6 5,821.4Fuel tax 3,771.72 12.1 3,771.76 11.4 0.0Total 31,117.03 100.0 33,027.99 100.0 1,911.0
Table 3.14 Tax incidence by type of tax: base estimates and overall tax simulation
Total tax VAT Excises
Base Simulation Base Simulation Base Simulation
Headship
Male headed 16.972 17.230 13.825 11.410 1.261 3.933 Female headed 16.179 15.922 13.796 11.343 1.248 3.443
Total 16.780 16.914 13.818 11.394 1.257 3.815
Employment status
Male breadwinner 17.053 17.248 13.843 11.312 1.404 4.131 Female breadwinner 15.823 15.412 13.774 11.430 1.018 2.520 Dual earner 17.108 17.467 13.820 11.388 1.322 4.114 None employed 15.363 14.876 13.763 11.706 0.675 2.245
Total 16.780 16.914 13.818 11.394 1.257 3.815
Household sex composition
Male majority 17.465 17.764 13.863 11.324 1.618 4.457 Female majority 16.348 16.123 13.831 11.458 1.149 3.297 Equal adults 16.732 16.986 13.793 11.390 1.171 3.828
Total 16.780 16.914 13.818 11.394 1.257 3.815

Gender equality and taxation in Argentina 87
households that benefit most are the female-headed, non-employed, female-bread-winner and female-majority households. The proposed reforms would thereforehave a positive impact on gender equality by improving income and consumption infemale-type households in comparison with the rest.
In terms of vertical equity of the tax burden, this reform makes the system quiteprogressive. The overall incidence for the 1st quintile is almost four percentagepoints lower than that for the 5th quintile. This increased progressivity is achievedby eliminating the regressivity of VAT (which is now progressive although with aU-shaped curve), and by making excise taxes decisively progressive. The inci-dence remains higher for male-breadwinner households and for households withno children. Female-breadwinner households as a whole have a substantially lowertax burden than male-breadwinner households (see Figure 3.9).
Conclusion and policy recommendations
This chapter has explored the gender dimensions of taxation in Argentina. In look-ing at how women and men are affected by the tax system in Argentina, we askedwhether the tax system promotes greater gender equality by transforming patriar-chal gender relations, and how we can transform tax policies in this direction. It ishoped that our findings might stimulate debate on the need for a comprehensive taxreform to gain substantive gender equity in Argentina. Over the past two decadesthe tax system has undergone frequent changes, designed as stopgap measures tocover budget deficits. Very few of these reforms were intended to improve equityin the system. There is an urgent need for policy-makers in Argentina to considerthorough and systematic reforms to make the system equitable.
131415161718192021
1 2 3 4 5
Quintile
Male-breadwinner w/ch Male-breadwinner no/ch
Female-breadwinner w/ch Female-breadwinner no/ch
Dual-earner w/ch Dual-earner no/ch
None-employed w/ch None-employed no/ch
Figure 3.9 Combined policy simulation – total incidence – by quintile and household type.

88 C. Rodríguez Enríquez, N. Gherardi and D. Rossignolo
Personal income taxation in Argentina has strengths and weaknesses in termsof gender equality. The individual taxation principle is one of the system’sstrengths because it does not a priori discourage income earning by women. Alsopositive is the equal treatment of women and men regarding contributing thresh-old, deductions and exemptions. An important issue is that for a married couple,each spouse is entitled to claim the deductions for their joint children. However,some explicit discrimination remains in the case of failing to recognize women’stax liability for ‘income in common’, by attributing to the husband income pro-duced from some assets that may have been acquired and managed by his wife.
An important aspect of Argentina’s PIT system is its segmentation into threedifferent categories (salaried workers, high-income self-employed and low-income self-employed, or monotributistas), and the different treatment theyreceive regarding threshold and deductions. Our analysis showed that there is dis-crimination against the last group, which does not receive the same tax benefits.Women are over-represented among monotributistas.
Some discrimination also exists in terms of the PIT system, specifically againstsingle-parent households, not-married couples, self-employed workers and lowerincome female self-employed living in a dual-earner household. This last point isimportant, because while the PIT system does not discourage women´s participationin the labour market, this might not be entirely true in the case of low-income women.
Another form of discrimination regards exemptions, and implies both horizontaland vertical inequity. In Argentina, while people who earn their income fromemployment pay income tax (providing their income is above the threshold), thosewho earn their income from financial investments do not. It should be noted that thelatter group is more likely to be mainly high-income people, and mostly men.
Among the policy recommendations this analysis leads to is, first, that explicitdiscrimination in the PIT code should be eliminated immediately. Second, mostexemptions should be eliminated, while the role of deductions for dependantsshould be reviewed. A gender perspective would link the level of these deduc-tions more closely to the dependant care expenses that justify them. The fact thatthey are not available to all (especially those with lower incomes, who are notdirectly taxable), suggests that this issue should be addressed outside the tax sys-tem. Specifically, a public care-giving policy should be adopted that guaranteesaccess to quality care-giving services for all who need them. In line with this, theproposal for a universal cash benefit for children is now widely promoted.Adopting either of these policies would allow deductions for dependents in the PITto be eliminated.
Finally, in order to deepen this type of analysis, it is important that the NationalTax Authority supply relevant statistical information disaggregated by sex, andthat they incorporate this disaggregated data into their own reports.
Our incidence analysis of indirect taxation focused on VAT, excises and fueltax. Overall tax incidence is 16.8 per cent, distributed somewhat proportionallyamong households at different socio-economic levels (classified by per-capitaexpenditure). This result is driven largely by a slightly regressive pattern of VAT(steeper for households with lower consumption levels), a greater regressivepattern of excise taxes, and marked progressivity of fuel taxes.

Gender equality and taxation in Argentina 89
Analysing incidence by household type, in general, male-type households bear thehighest incidence. Differences among household types are statistically significant, butnot very great, although they increase when taxes are considered separately. Householdswithout children (except those with no employed adult) generally have a higher taxincidence than those with children. Finally, the proportionality of indirect taxation isdeeper for female-type households than for male-type households. Clearly, any actionto provide indirect taxation with a more progressive pattern would improve theoverall equity of the system and also enhance gender equality.
Analysing the different commodity groups shows that taxation on food is highlyregressive. Despite the higher incidence borne by male-breadwinner households, theincidence is higher for female-breadwinner households for some commodities(sugar, confectionery, nonalcoholic beverages, public transport, school transport).Taxes on goods such as tobacco and alcoholic beverages have a higher incidence formale-breadwinner and dual-earner households, while the same is true for fuel taxes.
These observations suggest two alternative tax policy measures to improve thesystem’s equity. The first is the implementation of a zero tax rate for foods in thebasic basket. This policy measure would involve a reduction of two percentagepoints (13 per cent regarding the baseline) in the overall incidence of indirect tax-ation, and would make the system more progressive. This increased progressivitywould affect all household types.
The main incidence reduction favors none-employed households, and, the dual-earner households, to a lesser extent. The greater progressivity arises from the fact thatthis decrease is higher in the incidence faced by households in the lower quintiles. Itis interesting to note that while the differences in incidence decrease are small,female-breadwinner households experienced the smaller reduction in incidence.
The problem with this type of measure is its fiscal cost, which would be 10 percent of the total tax revenue. A second alternative is more comprehensive,designed to increase the progressivity of indirect taxation, and do so with neutralrevenue consequences. The procedure for this reform was to reduce some rates ofthe VAT together with an increase in the rates of excises on goods such astobacco and alcoholic beverages.
The result of this proposal is a moderate increase in the tax burden of male-headed, dual-earner, male-majority, and equal-adult households. Conversely,households that benefit most, in terms of reduced tax incidence, are female-headed, none-employed, female-breadwinner and female-majority households. Inother words, the proposed reform appears to have a positive impact on female-type households, which could increase gender equity by improving the consump-tion and income of these households.
In terms of vertical equity, the reform would add substantial progressivity to thesystem. The overall incidence borne by the 1st quintile becomes almost four per-centage points less than that for the 5th quintile. While this would affect all house-hold types, the change is greater for poorer female-type households. This lastexercise is important because it shows that it is possible to design reforms thatimprove progressiveness without generating any fiscal cost.
It should be noted that although not included in this chapter, if householdincome rather than household expenditure is used as an indicator, the taxation

90 C. Rodríguez Enríquez, N. Gherardi and D. Rossignolo
system appears even more regressive. Estimates show that considering all threeindirect taxes, the poorest households bear a tax incidence that is nearly 10 per-centage points higher than that faced by richest households, owing mainly to thestrong regressive nature of VAT.
This is only one reason to support reforms that make the system more pro-gressive and do not punish (or even improve the situation of) poor female-typehouseholds. If no systemic reform is possible, even partial transformation of indi-rect taxation on specific commodity groups can be conducted.
To summarize, this work has shown the weak capacity of the current Argentinetaxation system to improve gender equality. It has also demonstrated the persist-ence of explicit and implicit biases in personal income taxation, as well asinequality in indirect taxation, primarily owing to the regressive nature of indirecttaxation. Further research is needed in order to fully understand the picture andwhat sort of policy space and alternatives are available. In this regard, we wouldlike to highlight the following:
• First, it is imperative that the government review its statistics policy, which cur-rently focuses on restricting public access, as well as on reducing the technicalquality of the data. If we are to deepen the analysis on this or any issue, we needto count on good quality, systematic, and freely available relevant data.
• A key element for gender analysis regards what happens inside households.For instance, at this point we can say nothing about the situation of womenwho live in male-breadwinner or dual-earner households, who are in fact themajority of women. Research on intra-household resource allocation anddecision-making processes, both quantitative and qualitative, is critical.
• Although overall we concluded that tax system in Argentina does not dis-courage female participation in the labour market, a deeper analysis of fiscalincentives on male and female behaviour might provide insights for policyanalysis. An analysis of the impact of tax policy on the national care-givingsystem might also be useful for policy recommendations.
• The analysis conducted for PIT and the three types of indirect taxes consid-ered in this chapter might be extended to the full tax structure. In Argentina,the analysis of import taxes and export duties might be of special relevance.
• Finally, it would be useful to develop net impact analysis of public expendi-ture and taxation. This would make it possible to establish the overall distri-bution of fiscal policy in Argentina, and to design policy alternatives forgreater gender equality.
Although there is still a lot of work to be done, we hope we have begun to highlight therelevance of this type of analysis, to encourage readers to undertake further research,and to remind everyone of the need to keep working for more equitable societies.
Acknowledgements
The Argentina team would like to acknowledge the contribution of GabrielaColombo to the analysis of personal income tax.

Annex 1Table A.1 Estimate of PIT by household type and contribution category
Employees Type of household
A B C
Tax calculation By the employer on behalf of the employee through withholding and payment regime
Net earnings AR$ 72,000 AR$ 72,000 AR$ 50,000 – male AR$ 22,000 – female
Non-taxable (AR$ 9,000) (AR$ 9,000) (AR$ 9,000) – male income AR$ 0 – female Family AR$ 5,000 AR$ 5,000 AR$ 5,000 deductiondeductions deduction per child, deduction per child per child – by male
AR$ 10,000 (AR$ 10,000) female is exempt deduction for spouse (AR$ 10,000) – male (AR$ 20,000)
Special deduction (AR$ 34,200) (AR$ 34,200) (AR$ 34,200) Total deductions (AR$ 63,200) (AR$ 53,200) (AR$ 53,200) – male Taxable amount AR$ 8,800 AR$ 18,800 AR$ 18,800 – male
AR$ 0 – femaleFixed amount and AR$ 0 AR$ 900 + AR$ 900 + 14% of applicable rate 14% of AR$ 8,800 AR$ 8,800 – male
AR$ 0 – femaleTotal tax owed AR$ 0 AR$ 2,132 AR$ 2,132 – male
AR$ 0 – femaleHousehold net AR$ 72,000 AR$ 69,868 AR$ 69,868income
Type of household
Self-employed A1 B1 C1 taxpayers
Tax calculation By each income earner through a tax return and the payment of the and payment resulting amount in five advance bimonthly payments
Net earnings AR$ 72,000 AR$ 72,000 AR$ 50,000 – male AR$ 22,000 – female
Non-taxable (AR$ 9,000) (AR$ 9,000) (AR$ 9,000) – male income Family AR$ 5,000 AR$ 5,000 AR$ 5,000 deductiondeductions deduction per child; deduction per child per child – male
AR$ 10,000 (AR$ 10,000) female is exemptdeduction for spouse (AR$ 10,000) – male (AR$ 20,000)
Special deduction (AR$ 9,000) (AR$ 9,000) (AR$ 9,000) – husband Total deductions (AR$ 38,000) (AR$ 28,000) (AR$ 28,000) – male Taxable amount AR$ 34,000 AR$ 44,000 AR$ 44,000 – male Fixed amount and AR$ 4,200 + AR$ 4,200 + AR$ 4,200 + 23% of applicable rate 23% of AR$ 4,000 23% of AR$ 14,000 AR$ 2,000 – male –
0% – female Total tax owed AR$ 5,120 AR$ 7,420 AR$ 4,660 – male
AR$ 0 – female total: AR$ 4660
Household net AR$ 66,880 AR$ 64,580 AR$ 67,340income
(Continued)

92 C. Rodríguez Enríquez, N. Gherardi and D. Rossignolo
Annex 2
Items with 10.5 per cent VAT rate
The 10.5 per cent rate applies to new house sales and to a limited list of goodsand services, including:
• work directly or indirectly performed on a third party’s real estate, intendedfor residential purposes, but excluding work performed on pre-existingconstructions that are not works in progress;
• live animals belonging to the bovine, ovine, camelid or caprine species, theirmeat and edible remains, either fresh, refrigerated or frozen;
• fresh, refrigerated or frozen fruits, legumes and vegetables;• grains – cereals and oily seeds, excluding rice – and dry legumes – beans,
green beans and lentils;• certain works, construction and services contracts related to the procurement
of live animals of the bovine and ovine species, fruits and legumes;• fresh vegetables, grains – cereals and oily seeds, excluding rice – and dry
legumes – beans, green beans and lentils;• dry fresh or salted bovine leather;• honey in bulk;• domestic transportation services for passengers by land, water or air, except
for taxis and rental car services on routes less than 100 km;• medical and paramedical sanitary services rendered or hired by cooperatives,
social security entities and prepaid medical systems, if not exempted. Thedirect rendering of these services to a private patient and without reimburse-ment rights is taxable with a 21 per cent rate.
• Newspapers, magazines and journals. The lease of advertising spaces istaxable with a 10.5 per cent rate when the publishing house is a small ormedium-sized company (PYME).
Table A.1 (Continued)
Type of household
Monotributistas A2 B2 C2
Tax calculation By the income earner, on the basis of an income bracket that and payment determines the amount of the fixed monthly tax to be paid
Annual gross AR$ 72,000 AR$ 72,000 AR$ 50,000 – male income AR$ 22,000 – female Taxpayer E E C – male B – female category Tax payable AR$ 210 AR$ 210 AR$ 75 – male monthly AR$ 39 – female Tax payable AR$ 2,520 AR$ 2,520 AR$ 900 – male annually AR$ 468 – female
total household: AR$ 1368
Household net AR$ 69,480 AR$ 69,480 AR$ 70,632 income

Gender equality and taxation in Argentina 93
• Capital goods specifically listed.• Bread, cookies, bakery products and/or pastries, cookies and biscuits, made
with wheat flour, not previously packaged for marketing.
Notes
1 During this period, the average employment rate decreased from 37.1 per cent to 36.1 percent, while the unemployment rate increased from 7.9 per cent to 15.4 per cent.Rodríguez Enríquez (2008) disaggregates these indicators for men and women and pro-vides additional data on the deterioration of individual labour trajectories over the period.
2 The example presented here assumes that the man in the household earns more than thewoman. The result would be the same in the case of the woman earning more than theman.
3 Incidence is progressive between quintiles 1 and 2, regressive between 2 and 3, progres-sive between 3 and 4 and proportional between 4 and 5.
4 Incidence is proportional between quintiles 1 and 3, progressive between quintiles 3 and4 and regressive between quintiles 4 and 5.
5 Regressivity is clear between quintiles 1 and 2, and between quintiles 3 and 4. It is alsoregressive if we compare quintiles 1 and 5.
References
Ahumada, H., Canavese, A., Gasparini, L. et al. (1996) ‘Impacto distributivo de la políticafiscal’, Documentos de investigación, Buenos Aires: Instituto Torcuato Di Tella.
Beccaria, L. (1979) ‘El impacto de los impuestos indirectos sobre la distribución delingreso’, CIE, Buenos Aires: Instituto Di Tella (mimeo).
Elson, D. (2007) ‘Vertical equity, horizontal equity and gender equality in taxation’, draftnote for methodology meeting of Gender and Taxation Project. Durban.
Gasparini, L. (1998) ‘Incidencia distributiva del sistema impositivo argentino,’ in Lareforma tributaria en la Argentina, Córdoba: Fundación de Investigaciones EconómicasLatinoamericanas.
Gómez Sabaini, J.C. and Rossignolo, Darío A. (2008) ARGENTINA: Análisis de lasituación tributaria y propuestas de reformas impositivas destinadas a mejorar la dis-tribución del ingreso, Buenos Aires: ILO.
Gómez Sabaini, J.C. and Santiere, J.J. (1993) ¿Quién paga los impuestos en Argentina?,Buenos Aires, Doc. CIET/OEA N° 1073.
Lo Vuolo, R. (2001) Alternativas: La economía como cuestión social, Buenos Aires:Altamira.
Rodríguez Enríquez, C. (2008) ‘Causas y azares. Oportunidades de vida, trayectoriaslaborales y asistencialismo en Argentina’, PhD dissertation, Flacso, Buenos Aires.
Santiere, J.J. and Gómez Sabaini, J.C. (2001) ‘Los impuestos y la distribución del ingreso en laArgentina. Un análisis para 1986, 1993 y 1997’, in C. Vaitsos, Cohesión social y gobernabilidadeconómica en Argentina, Buenos Aires: Editorial Universitaria de Buenos Aires.
Santiere, J.J., Gómez Sabaini, J.C. and Rossignolo, Darío A. (2000) ‘Impacto de losimpuestos sobre la distribución del ingreso en Argentina en 1997’, Buenos Aires: BancoMundial, SPEyR, Ministerio de Economía.
—— (2002) ‘La equidad distributiva y el sistema tributario. Un análisis para el casoargentino’, Santiago: ILPES-CEPAL.

4 Gender equality and taxation inIndiaAn unequal burden?
Pinaki Chakraborty, Lekha Chakraborty,Krishanu Karmakar and Shashi M. Kapila
Introduction
Until India’s structural adjustment programme was introduced in 1991, much ofthe discussion about tax policy in the country was shaped by a debate on how toraise sufficiently large amounts of revenue to eliminate poverty and raise stan-dards of living while at the same time support national industries under a pro-tected regime. Fiscal reforms since 1991 have made rapid and significant changesin tax policy and have brought down the rates of both direct and indirect taxessharply. They have also touched off some new discussion on the gender dimen-sions of such changes, especially in the case of direct taxes.
To understand these and other impacts of tax policy, this chapter presents agendered picture of employment and income in India, and reviews the overall taxstructure, including a series of tax reforms and the gender impacts thereof. It presentsthe results of several simulated policy changes that might advance gender equalityand concludes with a consideration of their implications.
A study of the gender impacts of tax policies in India is both timely and impor-tant. India is, as we shall see, one of the few examples where taxes have been usedas an affirmative action policy – women in India are explicitly advantaged by someaspects of the tax system and reforms. Is this effective, and does it really advantagewomen, especially those in low-income groups? The central government and stategovernments of India are now considering the introduction of an integrated goodsand services tax in fiscal year 2010/11. What are the likely impacts of this newsystem on women and on poor households? The analysis here suggests that indirecttaxes currently place an unfair burden on women, especially those in low-incomehouseholds; if this burden is not taken into account in the reforms, these women arelikely to bear a large negative share of the impact from the reforms.
Gender and employment
India has a total population of around 1.2 billion. Of this, some 417.9 millionpeople are in the labour force, with 323 million in the rural labour force and 94.7million in the urban labour force. Women are over-represented in the rural work-force. Of a total of 139.4 million women in the labour force, 118.3 million are in

the rural labour force while only 21.1 million are in the urban labour force (seeFigure 4.1).
The disparity between male and female labour force participation rates hasremained quite substantial over the years (see Table 4.1). Urban women’s labourforce participation is also low compared to that of rural women, particularly whensubsidiary economic activities such as maintaining kitchen gardens, tending poul-try, and so on are included. Since the scope for such activities is limited in urbanareas, urban women’s labour force participation rates do not change much evenwhen the subsidiary category is included.
Self-employment accounts for the major share of employment for women andmen, especially in rural areas (Table 4.2). Those in regular salaried/wage employ-ment represent about 7 per cent of the total labour force in rural India and only
Gender equality and taxation in India 95
0.050.0
100.0150.0200.0250.0300.0350.0400.0450.0
Rural Urban Total
(In
mill
ion
s)
204.9
118.3
323.2
73.5
21.1
94.7
278.5
139.4
417.9
Male Female Total
Figure 4.1 Indian labour force by sex: rural and urban differences.
Table 4.1 Gender disparities in Indian labour force participation rates, 2004–05 (in %)
Male Female
Principal Principal and Principal Principal and status subsidiary status status subsidiary status
Rural2004–05 53.5 54.6 24.2 32.71999–00 52.2 53.1 23.1 29.91993–94 53.8 55.3 23.4 32.81987–88 51.7 53.9 24.5 32.3
Urban2004–05 54.1 54.9 13.5 16.61999–00 51.3 51.8 11.7 13.91993–94 51.3 52.1 12.1 15.51987–88 49.6 50.6 11.8 15.2
Source: NSSO (2005).

4 per cent of the female rural labour force. Around one-third of the total labourforce (both male and female) are in the casual labour category. In urban India, theshare of the labour force engaged in regular/salaried employment is much higher,at about 37 per cent with women’s share at 33 per cent. A greater proportion ofwomen workers than male workers are employed in casual work, which tendsto be less remunerative and have poorer working conditions than regular work.
96 P. Chakraborty, L. Chakraborty, K. Karmakar and S.M. Kapila
Table 4.2 Employment structure of the labour force, India, 2004–05
Male Female Total(weighted)
RuralSelf-employed 57.2 62.5 59.1Regular salaried/wage employed 8.8 3.7 6.9Casual labour 32.4 32.0 32.2Total employed (work force) 98.4 98.2 98.3Unemployed 1.6 1.8 1.7Labour force 100 100 100
UrbanSelf-employed 43.1 44.4 43.4Regular salaried/wage employed 39.1 33.1 37.8Casual labour 14.0 15.6 14.3Total employed (work force) 96.2 93.1 95.4Unemployed 3.8 6.9 4.5Labour force 100 100 100
TotalSelf-employed 53.5 59.8 55.6Regular salaried/wage employed 16.8 8.1 13.9Casual labour 27.5 29.5 28.2Total employed (work force) 97.8 97.4 97.7Unemployed 2.2 2.6 2.3Labour force 100 100 100
Source: NSSO (2005).
Table 4.3 Employment by sector, India, 2004–05 (in millions)
Rural Urban
Male Female Total Male Female Total(weighted) (weighted)
Agriculture and Allied 134 97 231 4 4 8Manufacturing 32 12 43 24 6 31Services 36 8 44 42 10 52Total 202 116 318 71 20 90
Sectoral employment share ( %)Agriculture and Allied 66 83 73 6 18 9Manufacturing 16 10 14 34 32 34Services 18 7 14 59 49 57Total 100 100 100 100 100 100

Thus, not only do women get paid less than men for similar work, but the kind ofwork they are employed in tends to be less remunerative.
Looking at employment by sector, two things are clear. First, the predominantoccupation in rural India is agriculture and related activities and 83 per cent ofworking women are engaged in this work (see Table 4.3). Second, in urban India,the service sector, which has seen massive growth in recent years, now predomi-nates, employing about 60 per cent of the employed labour force, and 49 per cent ofthe female employed labour force.
The organized sector is made up of all public sector and non-agriculturalestablishments in the private sector with 10 or more workers. Women are over-represented in the unorganized sector of the economy. Women make up only 19per cent of the workforce employed in the organized sector. It is important to notethat women’s share of organized public sector employment has been as low as16 per cent, while it is 26 per cent in the private sector. The share of organizedsector employment is only 6.5 per cent of the total employed labour force (5.3 percent male; 1.23 per cent female); the share of women’s organized sector workis only 3.6 per cent of the total female labour force.
Gender equality and taxation in India 97
Table 4.4 Employment in organized sectors, India (in millions)
Organised sectors 2005
Public sectorMale 15.1Female 2.9Persons 18
Private sectorMale 6.4Female 2.1Persons 8.5
Public and private sectorsMale 21.4Female 5.0Persons 26.5
Shares in employment (in %)
Public sectorMale 83.8Female 16.2Persons 100
Private sectorMale 75.2Female 24.8Persons 100
Public and private sectorsMale 81.0Female 19.0Persons 100
Source: Ministry of Finance (2008a).

Employment and earnings
Despite laws legislating equality in wages, gender disparities in wages have per-sisted over the past decade (see Table 4.5). In fact, gender wage disparity appearsto have increased between 1993–94 and 2004–05.
Considerable gender disparities persist even in regular employment, includingamong workers with higher educational qualifications (graduate and post-graduate);female workers tend to receive lower wages than do their male co-workers, althoughthe gender gap tends to decrease with increasing education (see Table 4.6).
The structure of taxation in India
India’s three-tier federal fiscal system gives rise to an extremely complicated taxstructure. At the federal level, the major taxes collected are personal income tax(PIT), corporate income tax (CIT), and customs and excise duties. State-level taxesare primarily on consumption, and include the value-added tax (VAT), state exciseduty on liquor, stamps and registration fees and taxes on vehicles. The central gov-ernment also has the power to tax services, but these are done on a stand-alone basis
98 P. Chakraborty, L. Chakraborty, K. Karmakar and S. Kapila
Table 4.5 Ratio of female to male wages, India
1993–94 2004–05
Rural regular 0.60 0.59Urban regular 0.80 0.75Rural casual 0.66 0.63Urban casual 0.55 0.58
Source: NSSO Reports.
Table 4.6 Wage/salary per day received by regular salaried employees, India, 2004–05 (in Rs)
Male rural Female rural Male urban Female urban
Not literate 72.47 35.74 98.79 48.7(1.7) (0.8) (2.3) (1.1)
Literate and up to primary 98.59 47.75 111.44 64.79(2.3) (1.1) (2.5) (1.5)
Secondary and higher 158.04 100.19 182.58 150.41secondary (3.6) (2.3) (4.2) (3.4)Diploma/certificate 214.38 200.4 274.87 237.02
(4.9) (4.6) (6.3) (5.4)Graduate and above 270.02 172.7 366.76 269.17
(6.2) (3.9) (8.4) (6.2)All 144.93 85.53 203.28 153.19
(3.3) (2.0) (4.6) (3.5)
Source: NSSO (2005).
Note: Figures within brackets are dollar equivalence wage rate. Exchange rate in 2004–05 wasUS $1 = 43.75 Indian Rupees.

and are not integrated with the goods tax.1 Major local level taxes are property taxesand entertainment tax. The share of local taxes in the combined revenues of all lev-els of governments is negligible.
Beginning in 1991, the central government undertook a major tax reform pro-gramme. States also reformed their tax system by introducing the VAT in 2005.At the central government level the major reforms have included reducing therate on CIT, reducing customs and excise duties, and steps towards broadeningthe tax base (Rao and Rao 2005). Services are taxed on a stand-alone basis.Together, these reforms have greatly influenced tax structure and revenue mobi-lization. The combined tax–GDP ratio increased from just over 5 per cent duringthe first half of the 1950s to more than 16 per cent during the mid-1980s. Withthe introduction of rapid tax reforms during the 1990s, the tax to GDP ratiodeclined initially, but started showing improvement from early 2000 onwards(see Figure 4.2).
Following the reforms, the tax structure at the central level, which was heavilydependent on excise and trade taxes, shifted significantly. The share of directtaxes (PIT and CIT together) which was only 18 per cent in 1990–91 increased to51 per cent in 2006–07 (see Figures 4.3 and 4.4).
Analysis of gender and taxation
Having outlined some of the contextual issues related to gender and the tax struc-ture in India, we now move on to examine the gender issues in the tax system.We first explore the issues in direct taxation, specifically examining the PIT sys-tem, and then consider issues of indirect taxes through an incidence analysis ofVAT, excise taxes and fuel taxes. Given different tax structures in different states,
Gender equality and taxation in India 99
02468
1012141618
(Per
cen
t to
GD
P)
Direct Indirect Total
1950
–51
1953
–54
1956
–57
1959
–60
1962
–63
1965
–66
1968
–69
1971
–72
1974
–75
1977
–78
1980
–81
1983
–84
1986
–87
1989
–90
1992
–93
1995
–96
1998
–99
2001
–02
2004
–05
(B.E
)
Figure 4.2 Tax to GDP ratio, India, 1950–51 to 2006–07.

our incidence analysis is limited to one state – West Bengal – using from the 61stround of the National Sample Survey in West Bengal.
Personal income tax (PIT)
The PIT code in India is schedular in structure and tax liability is determinedaccording to the source of income. It is based on individual filing, whichimplies that any person liable for income tax files an individual tax return, andeach individual is assessed independent of the income of the rest of the house-hold. For salaried individuals, in most cases returns are filed by the employer.PIT is imposed on income earned in India, though certain provisions of the taxcode provide for foreign earnings to be deemed to have been earned in India.PIT is imposed on all persons who earn income in India, whether resident ornon-resident. However, agricultural income is not taxed but is taken intoaccount along with any other sources of income from investments, propertyand so on, while calculating tax on them, so that tax is paid at a higher rate onother income.
The tax code classifies income earned from salaried employment, business andprofessional activities, capital gains, house property, and certain other sources astaxable income. Income from house property is taxed only if the income is
100 P. Chakraborty, L. Chakraborty, K. Karmakar and S. Kapila
PIT9% CIT
9%
Trade taxes35%
Excise47%
Figure 4.3 Structure of taxes, India, 1990–91.
PIT18%
CIT33%
Trade taxes19%
Excise30%
Figure 4.4 Structure of taxes, India, 2006–07.

derived from a second residential or other property (i.e., the primary residence isnot taxed). If the property is not leased, a deemed market rent is applied. Alltransfer of capital assets attracts capital gains taxes. If assets are held for morethan 36 continuous calendar months prior to transfer, they are called long-termassets and their transfer results in long-term capital gains, which is taxed at a rateof 20 per cent. The only exception to this is with respect to securities, for whichthe period of holding prior to transfer is 12 months, to be considered as long-termcapital assets, and the rate of tax is nil, provided the securities transaction tax hasbeen paid. Any transfer of assets held for less than these periods would result inshort-term capital gains, which is taxed at rates common to all assets exceptsecurities. For securities, the rate of tax is 10 per cent, together with a securitiestransaction tax.
Any individual or group of individuals or artificial bodies which haveearned income during the previous years are required to pay tax on that income.The legislation makes provision for a special category of taxpayer called theHindu Undivided Family (HUF), for which there are specific tax provisions(see below).
The definitions and computation of taxable income are the same for both menand women; the legislation defining different types of income does not make anyspecific provision for gender. There are no provisions for joint tax filing. Non-labour income is treated in a gender-neutral fashion and all joint property andincome are assessed on the basis of who has earned that income.
The Indian taxation system recognizes the Hindu Undivided Family as a sepa-rate and distinct taxable legal entity, reflecting a typical social and economicarrangement that is inherently biased against women. The HUF ensured the accu-mulation and consolidation of wealth in male hands, as a Hindu male alone hada right in the ancestral property at birth; a male alone could put his individualproperty into Joint Family Property, whereas a Hindu female could not do so. Theright to enforce partition was customarily enjoyed only by male members of aHindu undivided family. Female members were only entitled to maintenance outof the family property. Income of ancestral property was also taxable as incomeof the Hindu undivided family.
As the inherent inequity and gender bias in the Hindu Law and therefore in thetaxation system became subject to increasing public debate, Parliament intro-duced the Hindu Succession Act in 1956, which significantly reduced the genderinequities in the HUF. Although not abolishing the joint family and joint familyproperty provisions of the HUF, the Act confers full and heritable capacity on afemale heir in respect of all property acquired by her, whether before or after theAct came into force, with the result that by retroactive operation of that section,she holds the property in her possession as full owner and not as a limited owner.The restraints and limitations on the powers of a female heir have ceased to existeven regarding existing property. Thus, with the amendments in the HinduSuccession Act, a significant explicit bias in the tax system against women hasnow been removed.
Gender equality and taxation in India 101

Exemptions and rate structure of the PIT
In 2008–09, the income tax threshold was increased from Rs. 110,000(US$2,733, based on an exchange rate of 40.24 Rs. = 1 US($) to Rs. 150,000and from Rs. 145,000 to Rs. 180,000 for women income earners. For bothmales and females over 65, it is even higher, at Rs. 225,000. It is important tonote that India is one of the few countries, and the only one in this volume,where the tax system provides such positive discrimination for women. Until2001, the tax rates on individuals, both men and women, were the same. In 2001,women were given a special rebate up to Rs. 5,000 against taxes payable, unlessthey were above 65, in which case they received the senior citizen rebate of Rs.20,000. In 2005, the minimum non-taxable income was raised to Rs. 125,000 forwomen taxpayers as against the general threshold of Rs. 100,000. In 2005, thetax exemption limit for women was raised to Rs. 1,35,000, while the Rs. 5,000tax rebate was discontinued and in 2007, this limit was raised to Rs. 1,45,000(see Table 4.7).
Apart from the higher exemption thresholds for women, most deductionsand exemptions are available to all individuals paying income tax, irrespective ofsex – making them both gender-neutral and gender-blind. These tend to be fairlystandard allowances and deductions – for items such as entertainment allowances,expenditure on uniforms and travel allowances.
Horizontal and vertical equity: a hypothetical example
The application of income tax in India provides preferential tax treatment to womenby the higher basic exemption limit. Also income tax is levied on individuals
102 P. Chakraborty, L. Chakraborty, K. Karmakar and S. Kapila
Table 4.7 Income tax rates and brackets, India, 2008–09
Income Tax rate Income Tax rate Income Tax ratebracket: bracket: bracket: general women senior citizen
Up to Nil Up to Nil Up to NilRs. 150,000 Rs. 180,000 Rs. 225,000Rs. 150,001 to 10 per cent Rs. 180,001 to 10 per cent Rs. 225,001 to 10 per centRs. 300,000 Rs. 300,000 Rs. 300,000Rs. 300,001 to 20 per cent Rs. 300,001 to 20 per cent Rs. 300,001 to 20 per centRs. 500,000 Rs. 500,000 Rs. 500,000Rs. 500,001 30 per cent Rs. 500,001 30 per cent Rs. 500,001 30 per centand above and above and above
Source: Ministry of Finance (2008b).
Note: Figures within brackets are dollar equivalence income. Exchange rate in 2008–09 wasUS$1 = 40.24 Indian Rupees.

irrespective of their family size and number of dependants. However, the tax inci-dence differs significantly in dual and single-earner households because of thebasic exemption.
A simple exposition of differential incidence of personal income tax in dual-earnerand single-earner households is given in Table 4.8. This shows that in a dual-earner household, income earned by both male and female earners together, if upto Rs. 300,000, would not attract any tax if both of them earned below theirrespective exemption limits of Rs. 150,000 and Rs. 180,000. However, in a malesingle-earner household, it would attract, Rs. 15,000 as tax and in a femalesingle-earner household, it would attract Rs. 12,000 as tax, showing that thehousehold with a single female earner would attract less tax on the same amountof income.
Although the Indian tax system positively discriminates by gender due to thehigher tax threshold for women, the effectiveness of such a policy is limited asthe number of women within the income tax net is a miniscule proportion of thetotal number of income taxpayers and an even more minuscule proportion of thetotal number of adult women in India. Currently, the total number of individualtaxpayers is about 27 million out of a total population of about 1 billion, soapproximately 2.7 per cent of the population falls within the income tax net (seeTable 4.9). Women likely constitute less than 3 per cent of this small number.Since, as per the 2001 census, women constitute 49 per cent of the population,tax-paying women are only about 0.00001 per cent of all women and 0.27 percent of working-age women. In other words, the use of income tax as a means tofurther gender equality seems limited.
More importantly, there is little evidence that the higher tax threshold has apositive impact on women’s lives in India. The higher threshold may have hadthe impact of shifting some property ownership from men to women (to exploitthe higher tax threshold), which would give women more power within thehousehold, but the impact would be limited to the very small proportion ofwomen inside the tax net.
Indirect tax incidence
As each of the 28 state governments and 7 centrally administered union territo-ries has an independent tax system and administration, in looking at the incidenceof indirect consumption tax, we have focused on the middle-income state of WestBengal, in which VAT constitutes the single largest share (59 per cent) of owntax revenues for the state (see Figure 4.5). The nature of the goods falling underdifferent categories of VAT rate is given in Table 4.10. Basic food items, such ascereals and vegetables, basic clothing, domestic services, basic stationery andbooks are exempted from VAT. The main food items that are exempted fromVAT are: bread (except pizza bread containing any type of fruit or vegetable),coarse grains, curd, buttermilk, separated milk, fresh milk and pasteurized milk,fresh vegetables and fruits.
Gender equality and taxation in India 103

Table 4.8 Income tax paid by dual- and single-income household categories, India
Household 1 Household 2 Household 3
Scenario 1: Hypothetical median income of Rs: 300,000Household 5 5 5sizeComposition Male and female Male earner Female earner
earner 4 dependants 4 dependants3 dependants
Total income 300,000 300,000 300,000Tax rate 10% 10% 10%Exemption Rs. 150,000 for Male Rs. 150,000 Rs.180,000
Rs. 180,000 for FemaleTax paid Nil 15,000 12,000
Scenario 2: Hypothetical half the median income: Rs. 150,000 ($3727.63)
Total income 150,000 150,000 150,000Tax rate 10% 10% 10%Exemption Rs. 150,000 for male Rs. 150,000 Rs. 180,000
Rs. 180,000 for femaleTax paid Nil Nil NilWith Tax Nil Nil NilCredit forhigherexemption
Scenario 3: Hypothetical double the median income: Rs. 600,000
Total income 600,000 600,000 600,000Tax rate 10% on (150,001 to 10% on (150,001 to 10% on (150,001 to
300,000 for men) 300,000 for men) 300,000 for men)10% on (180,001 to 10% on (180,001 to 10% on (180,001 to 300,000 for women) 300,000 for women) 300,000 for women)
20% on (on 300,000 to 20% on (on 300,000 to 500,000 for men) 500,000 for men)30% on Rs. 500,000 30% on Rs. 500,000 and above and above
Tax paid 27,000 75,000 72,000
Table 4.9 Number of effective taxpayers, India
Year Company Individual HUF Firms Trusts Others Total
2000–01 334,261 20,662,926 553,194 1,336,861 63,999 51,035 23,002,2762001–02 349,185 23,734,413 607,519 1,378,706 97,272 58,784 26,225,8792002–03 365,124 25,935,556 644,489 1,345,232 117,304 57,224 28,464,9292003–04 372,483 26,624,224 654,848 1,338,613 154,276 57,952 29,202,3962004–05 373,165 24,792,990 620,468 1,235,373 71,375 65,190 27,158,5612005–06 382,021 27,370,659 642,759 1,234,424 74,543 58,077 29,762,483

Gender equality and taxation in India 105
Table 4.10 Nature of commodities and the applicable VAT rate, West Bengal
Tax rate No. of goods Nature of goodsunder VAT
Exempt 170 Basic food items like cereals and vegetables, basicclothing, domestic services, basic stationery and books
1% 3 Jewellery and ornaments4% 79 Food items other than basic, processed fruits and
vegetables, household goods, medicine, etc. 12.50% 81 Beverages, processed food, food in restaurant, electronic
goods, some medical equipments and expenses, household goods which can be classified as luxuries and other items not listed in the 4 per cent and exempted category
Source: West Bengal Commercial Taxes Department (n.d.).
Stamp and registration11%
VAT59%
Taxes on vehicles5%
Excise7%
Electricity duty4%
Other taxes14%
Figure 4.5 The structure of West Bengal tax revenues, 2005–06.
Food items, other than basic, are taxed at 4 per cent and include biscuits, dryfruits, edible oil, fried and roasted grains, maize starch, glucose, maize gluten,maize germ and oil, pizza-bread, bun or bread containing any type of fruit or veg-etable, porridge and cottage cheese, processed meat, poultry and fish, processedand preserved vegetables and fruits, skimmed milk powder, dairy whitener,spices and hydrogenated vegetable oil. Food eaten at restaurants is taxed atthe highest VAT rate of 12.5 per cent. The state also has a list of exemptedcommodities, which are treated as goods of local importance and exemptedfrom VAT.
Selected items currently under sales tax are kept outside the VAT and taxed ata higher rate, including diesel, petrol and aviation turbine fuel (ATF), crude oil

and liquor (see Table 4.11). Floor rates for all these taxes are 20 per cent for allthe states. In West Bengal, except for petrol and diesel which are taxed at 25 percent, non-VATable commodities are taxed at the floor rate of 20 per cent.
In addition to examining the tax incidence in the aggregate, we have examinedthe incidence for the urban and rural sub-samples. We anticipate that rural andurban households will have different expenditure patterns and thereby a differenttax incidence. As India’s economy is predominantly rural, with more than two-thirds of the population living in rural areas and relying primarily on subsistenceagriculture, it is important to analyse the urban and rural sectors separately.
Unlike the other countries in this volume, we have not been able to do the taxincidence according to the employment status of the households, as consumerexpenditure surveys do not include data on employment status of householdmembers. Employment surveys are conducted separately and the consumptionexpenditure survey data cannot be mapped against employment survey data.
In addition to data from the 61st round of the National Sample Survey of con-sumer expenditure, we have taken a sub-sample of combined estimates based onall rounds. The survey collects data on household characteristics, demographicdetails and household-level expenditure on almost 400 items. For some fre-quently purchased items the expenditure data are collected for a 30-day referenceperiod, while for not so frequently purchased items the data are collected for botha 30-day and a 365-day reference period. For certain items data about both quan-tity and value are collected, but for others only values are collected. Finally, forconsumer durables, only the 365 days reference period is used.
Our sample consists of 7,877 households, both urban and rural, from WestBengal. Table 4.12 shows the mean tax incidence for households in each quintile.This indicates that for both urban and rural households, the tax incidence fallsmost heavily on the poorest quintile, and this regressivity is much higher in urbanhouseholds than in rural households. It also shows that the VAT incidence ishigher than the incidence of the fuel levy and excise tax and that, unlike excisetaxes, the fuel levy appears to be progressive, its incidence rising with expendi-ture quintile. However, when broken down into the levy for household fuel and
106 P. Chakraborty, L. Chakraborty, K. Karmakar and S. Kapila
Table 4.11 Tax rate on commodities outside the VAT, West Bengal
Item Tax rate
Country liquor 20.00Beer 20.00Foreign liquor or refined liquor 20.00Petrol 25.00Diesel 25.00
Source: West Bengal Commercial Taxes Department (n.d.).

that for transport, we see that the incidence of the former is regressive. The urbanpoor in particular bear a high incidence for indirect taxes, and this is drivenprimarily by VAT.
Table 4.13 presents the incidence of tax by gender of the head of the householdand household sex composition. Households are classified into five categories:male-headed; female-headed; having a greater number of males (male-domi-nated); having a greater number of females (female-dominated); and having anequal number of males and females. Looking at the incidence based on house-hold headship, we see that the aggregate incidence of tax is higher for female-headed households than it is for male-headed households. The incidence ofexcise and fuel levy is greater in male-headed than in female-headed house-holds. Looking at incidence based on household sex composition, by contrast, wefind that the aggregate tax incidence is highest in male-dominated households,followed by households with an equal number of males and females and lowestfor female-dominated households. This result is consistent with the incidenceshown for the male and female headship category as the number of male-headed households is 8.66 times higher than the number of female-headedhouseholds.
The distribution of incidence is different in urban and rural areas (see Table 4.14).In urban India, looking at household headship, we see that male-headed households
Gender equality and taxation in India 107
Table 4.12 Tax incidence of consumption tax in households in West Bengal (% of expenditure)
Total
Quintile Total tax VAT Excise Fuel levy
1st 1.37 1.28 0.04 0.0012nd 0.58 0.54 0.02 0.0033rd 0.48 0.44 0.02 0.0044th 0.52 0.48 0.01 0.0125th 0.69 0.62 0.01 0.051
Rural1st 0.83 0.75 0.03 0.0012nd 0.42 0.39 0.02 0.0013rd 0.40 0.36 0.01 0.0034th 0.41 0.38 0.01 0.0085th 0.49 0.43 0.01 0.046
Urban1st 3.89 3.75 0.08 0.0002nd 1.33 1.25 0.02 0.0133rd 0.79 0.74 0.02 0.0104th 0.78 0.73 0.02 0.0205th 0.84 0.76 0.02 0.054

bear a higher tax incidence than do female-headed households, while in ruralIndia, the incidence is higher in female-headed households than in male-headedhouseholds. In all household categories, VAT is the predominant tax. This resultis obvious as the tax structure is predominantly VAT based with its relative sharein total tax revenue at around 60 per cent.
Table 4.15 disaggregates the results by whether or not the respective householdshave children. It indicates that the tax incidence is highest for male-dominatedhouseholds without children. Within male-dominated households with children,the incidence is highest in the richest quintile, although higher in the poorestquintile than in the middle quintiles. In overall terms, the tax incidence formale-dominated households is relatively higher than it is for female-dominatedhouseholds across all quintiles, for households both with and without children.Further, in male-dominated households, households in the poorest quintilebear the highest tax incidence, while among female-dominated households,those in the richest quintile bear the highest incidence. The pattern of overallincidence for male-dominated households is U-shaped, being highest in quin-tile 1 (2.96), declining to 1.75 in quintile 2 and 1.77 in quintile 3 and thenincreasing to 2.78 in quintile 5; while for female-dominated households it isprogressive, with the lowest incidence (1.67) in quintile 1 and the highest (2.69)in quintile 5.
Table 4.16 shows how the tax burden is distributed across quintiles for differ-ent commodity groups within each household category. Taking all the commodi-ties together, for all households, the tax incidence is much higher in the lowestexpenditure quintile. However, looking at the specific commodities, it is clearthat this higher tax incidence for the lowest expenditure quintile is due primarilyto the high incidence of taxes on basic necessities and on beverages (i.e., food,clothing and footwear, fuel, tobacco and alcoholic and non-alcoholic beverages).The highest expenditure quintile also bears the highest incidence of tax for hous-ing, water, electricity and gas, health care and medicine and fuel and transport.However, among households with an equal number of males and females, the taxincidence is highest for quintiles 4 (2.184) and 5 (2.944).
108 P. Chakraborty, L. Chakraborty, K. Karmakar and S. Kapila
Table 4.13 Overall tax incidence by household type, West Bengal (% of expenditure)
Total VAT Excise Fuel Number oftax tax tax households
HeadshipMale-headed 2.08 1.90 0.05 0.06 7,066Female-headed 2.12 2.02 0.03 0.02 821
Household sex compositionMale-dominated 2.24 2.04 0.05 0.07 3,282Female-dominated 1.95 1.81 0.03 0.05 2,552Equal number of females and males 2.01 1.85 0.04 0.05 2,043

Table 4.14 Rural and urban tax incidence by household type, West Bengal (% of expenditure)
Urban Rural
Total tax VAT Excise tax Fuel tax Number of Total tax VAT Excise tax Fuel tax Number ofhouseholds households
HeadshipMale-headed 2.98 2.69 0.12 0.11 254 1.74 1.61 0.02 0.04 4516Female-headed 2.76 2.65 0.05 0.06 349 1.82 1.72 0.02 0.01 472
Household sex compositionMale-dominated 3.33 3.02 0.14 0.11 1277 1.78 1.62 0.02 0.05 2006Female-dominated 2.55 2.36 0.08 0.07 907 1.73 1.61 0.02 0.04 1645Equal number 2.77 2.49 0.09 0.13 706 1.73 1.61 0.02 0.02 1337

Table 4.15 Tax incidence by sex composition, presence of children, and quintile, West Bengal
Quintile Total tax VAT Excise tax Fuel tax Number of HHs Quintile Total tax VAT Excise tax Fuel tax Number of HHs
Male-dominated with children Male-dominated without children1 1.79 1.68 0.01 0.00 222 1 4.32 4.00 0.15 0.00 2922 1.54 1.44 0.01 0.00 389 2 2.35 2.23 0.02 0.02 1493 1.69 1.55 0.01 0.01 484 3 2.00 1.83 0.03 0.05 1614 1.92 1.80 0.04 0.03 525 4 2.30 2.15 0.06 0.02 2125 2.59 2.21 0.10 0.25 571 5 3.12 2.64 0.16 0.30 277Total 1.90 1.73 0.04 0.06 2191 Total 2.97 2.7 0.09 0.09 1091
Female-dominated with children Female-dominated without children
1 1.53 1.47 0.01 0.00 248 1 1.92 1.84 0.03 0.00 2142 1.62 1.52 0.01 0.00 365 2 2.03 1.94 0.00 0.00 713 1.62 1.54 0.01 0.01 393 3 2.19 2.16 0.01 0.00 684 1.91 1.78 0.03 0.05 456 4 2.41 2.22 0.01 0.12 775 2.57 2.27 0.10 0.17 530 5 3.17 2.87 0.12 0.15 130Total 1.86 1.72 0.03 0.05 1992 Total 2.29 2.15 0.04 0.05 560
Equal number of females and males with children Equal number of females and males without children
1 1.49 1.31 0.02 0.00 138 1 1.71 1.59 0.01 0.00 2802 1.53 1.46 0.01 0.00 241 2 1.94 1.76 0.03 0.00 1373 1.70 1.60 0.01 0.00 269 3 2.09 1.96 0.06 0.07 1124 1.90 1.81 0.03 0.02 274 4 2.79 2.57 0.09 0.09 1375 2.59 2.29 0.08 0.20 269 5 3.42 3.04 0.13 0.24 186Total 1.83 1.69 0.03 0.04 1191 Total 2.28 2.08 0.05 0.07 852
Note: Tax as a percentage of post-tax expenditure.

Table 4.16 Tax incidence for each consumption category by sex composition and quintile, West Bengal
Category Male-dominated Female-dominated Equal number females and males
1 2 3 4 5 Total 1 2 3 4 5 Total 1 2 3 4 5 Total
Food subtotal 0.37 0.37 0.36 0.33 0.30 0.34 0.40 0.36 0.36 0.33 0.31 0.35 0.40 0.37 0.37 0.33 0.31 0.36Basic 0.18 0.21 0.20 0.18 0.14 0.18 0.23 0.22 0.21 0.18 0.15 0.20 0.24 0.22 0.21 0.18 0.14 0.20Other 0.15 0.13 0.13 0.12 0.12 0.13 0.15 0.12 0.12 0.11 0.12 0.12 0.14 0.12 0.12 0.11 0.13 0.13Sugar/confectionery 0.04 0.03 0.03 0.03 0.04 0.03 0.02 0.03 0.03 0.04 0.04 0.03 0.02 0.03 0.03 0.04 0.04 0.03and others
Meals out 1.17 0.18 0.09 0.09 0.09 0.30 0.09 0.07 0.03 0.04 0.03 0.05 0.02 0.03 0.09 0.06 0.06 0.05Non-alcoholic 0.28 0.14 0.12 0.12 0.12 0.15 0.1 0.12 0.10 0.11 0.12 0.11 0.12 0.11 0.09 0.11 0.11 0.11beveragesBeer 0.00 0.00 0.00 0.00 0.00 0.00 0.00 0.00 0.00 0.00 0.00 0.00 0.00 0.00 0.00 0.00 0.00 0.00Spirits 0.13 0.09 0.12 0.06 0.03 0.08 0.05 0.09 0.06 0.06 0.04 0.06 0.13 0.08 0.07 0.04 0.02 0.07Tobacco 0.07 0.02 0.02 0.04 0.12 0.05 0.02 0.01 0.01 0.03 0.11 0.03 0.01 0.02 0.02 0.05 0.10 0.04Clothing and footwear 0.24 0.23 0.22 0.23 0.24 0.23 0.24 0.23 0.23 0.24 0.24 0.24 0.21 0.22 0.23 0.24 0.23 0.22subtotalHousing, water, electricity, 0.01 0.02 0.03 0.11 0.27 0.09 0.02 0.04 0.06 0.13 0.30 0.11 0.03 0.04 0.07 0.18 0.32 0.12gas subtotalUtilities 0.01 0.02 0.03 0.10 0.27 0.09 0.02 0.04 0.06 0.13 0.30 0.11 0.03 0.04 0.07 0.18 0.32 0.12Housing 0.00 0.00 0.00 0.00 0.00 0.00 0.00 0.00 0.00 0.00 0.00 0.00 0.00 0.00 0.00 0.00 0.00 0.00
Fuel for HH use 0.12 0.12 0.09 0.09 0.05 0.09 0.12 0.10 0.09 0.08 0.05 0.09 0.11 0.11 0.09 0.08 0.04 0.09Furniture, HH equipment 0.01 0.01 0.01 0.01 0.02 0.01 0.01 0.01 0.01 0.01 0.01 0.01 0.01 0.01 0.01 0.02 0.02 0.01and maintenanceDomestic and household 0.00 0.00 0.00 0.00 0.00 0.00 0.00 0.00 0.00 0.00 0.00 0.00 0.00 0.00 0.00 0.00 0.00 0.00servicesMedical expenditure 0.13 0.20 0.30 0.44 0.52 0.33 0.21 0.28 0.32 0.40 0.52 0.35 0.21 0.29 0.29 0.45 0.66 0.37Transportation subtotal 0.01 0.02 0.01 0.02 0.02 0.02 0.00 0.01 0.01 0.01 0.02 0.01 0.01 0.01 0.01 0.02 0.02 0.01Collective forms of 0.01 0.02 0.01 0.02 0.02 0.02 0.00 0.00 0.00 0.00 0.00 0.00 0.01 0.01 0.01 0.02 0.02 0.01transport
Private transport 0.00 0.00 0.00 0.00 0.00 0.00 0.00 0.01 0.01 0.01 0.02 0.01 0.00 0.00 0.00 0.00 0.00 0.00including air
(Continued)

Table 4.16 (Continued) Tax incidence for each consumption category by sex composition and quintile, West Bengal
Category Male-dominated Female-dominated Equal number females and males
1 2 3 4 5 Total 1 2 3 4 5 Total 1 2 3 4 5 Total
Fuel for transport 0.00 0.00 0.02 0.03 0.27 0.07 0.00 0.00 0.00 0.06 0.16 0.05 0.00 0.00 0.02 0.04 0.22 0.05Communication 0.03 0.03 0.03 0.08 0.29 0.09 0.02 0.02 0.03 0.09 0.33 0.10 0.02 0.02 0.04 0.14 0.39 0.11Recreation 0.03 0.04 0.04 0.08 0.17 0.07 0.03 0.03 0.05 0.08 0.17 0.07 0.01 0.04 0.06 0.13 0.17 0.08Education 0.00 0.00 0.00 0.00 0.00 0.00 0.00 0.00 0.00 0.00 0.00 0.00 0.00 0.00 0.00 0.00 0.00 0.00Miscellaneous 0.01 0.01 0.01 0.02 0.01 0.01 0.01 0.01 0.01 0.01 0.01 0.01 0.01 0.01 0.01 0.02 0.01 0.01Personal care subtotal 0.34 0.30 0.29 0.28 0.28 0.30 0.37 0.30 0.29 0.32 0.29 0.31 0.35 0.30 0.31 0.30 0.27 0.31Necessary personal CareOtherTOTAL 2.96 1.76 1.77 2.02 2.78 2.24 1.67 1.68 1.69 1.98 2.69 1.95 1.63 1.66 1.79 2.18 2.94 2.01Number of HHs in quintile 514 538 645 737 848 3282 462 436 461 533 660 2552 418 378 381 411 455 2043

Within the subcategories, among male-dominated households, the tax incidencerelated to meals out is significantly higher for quintile 1; while among female-dominated households, the incidence related to basic food, medical expenses andclothing is highest in quintile 1, reflecting the fact that female-dominated house-holds have higher expenditure on these items. Male-dominated households havea higher indirect tax incidence for expenditure on non-alcoholic beverages,spirits in quintile 1, tobacco and transportation.
Figures 4.6–4.8 show that the overall tax incidence is highest for the lowestquintile in the male-dominated households without children compared to all otherhousehold categories, and remains highest for this quintile even after disaggre-gating the tax incidence due to VAT and excise. This result may be driven bymeals taken out and by processed foods, which are taxable goods consumed inurban areas. But for the poorest male-dominated households, actual liability maybe less than what is evident from the table because much of these food items,especially ‘meals taken out by the poor’, would invariably be in theinformal/unorganized food chain managed by roadside food venders who do notcome under the tax net. But NSS data do not give us a way to determine howmany of the meals taken out are in the formal chains of restaurants liable to taxand how many are from the informal food chain outside the tax net. So the actualliability may be less than what is presented in Table 4.16.
Gender equality and taxation in India 113
0
0.5
1
1.5
2
2.5
3
3.5
4
4.5
Male-dominated with children Male-dominated without children
Female-dominated with children Female-dominated without children
Equal number of females andmales with children
Equal number of females andmales without children
1 2 3 4 5
Quintile
Figure 4.6 Total VAT incidence, across household type, West Bengal.

00.5
11.5
22.5
33.5
44.5
5
1 2 3 4 5
Quintile
Male-dominated with children Male-dominated without children
Female-dominated with children Female-dominated without children
Equal number of females andmales with children
Equal number of females andmales without children
Figure 4.7 Total tax incidence, across household type, West Bengal.
Note: Shown as percentage of total post-tax expenditure.
0
0.02
0.04
0.06
0.08
0.1
0.12
0.14
0.16
0.18
1 2 3 4 5
Quintile
Male-dominated with children Male-dominated without children
Female-dominated with children Female-dominated without children
Equal number of females andmales with children
Equal number of females andmales without children
Figure 4.8 Total excise tax incidence, across household type, West Bengal.
Note: Shown as percentage of post-tax expenditure.

Gender equality and taxation in India 115
Apart from this, the highest tax incidence is among the higher quintiles in house-holds with an equal number of males and females without children. In addition, theVAT incidence is relatively higher for female-dominated households withoutchildren than for female-dominated households with children, perhaps because hav-ing children in the household shifts consumption toward basic food items that areVAT exempt. Among male-dominated households also, the tax incidence is rela-tively lower in households with children than in households without children.
However, the pattern of food tax incidence is entirely contradictory (see Figure4.9). Among female-dominated households, the lowest quintile bears a higher taxincidence than does the lowest quintile in male-dominated households, although theincidence of the lowest quintile of female-dominated households is comparable tohouseholds with an equal number of males and females. This result is also likelydue to the composition of the food basket which clearly differs across householdtypes. In addition, across all categories, the lowest quintiles bear a higher food taxincidence than do the higher quintiles, which has serious policy implications relatedto taxing the essential commodities. Our results suggest that there is a significantmismatch between the basic food items exempt from VAT and the basic food itemsthat the poor consume. This is clearly an area for policy intervention.
Policy simulations
Given the fact that tax on items of basic necessities is one of the main reasons forthe regressive tax incidence in the results presented above, we conducted two
0.25
0.3
0.35
0.4
0.45
1 2 3 4 5
Quintiles
Male-dominated Female-dominated
Equal number of females and males
Figure 4.9 Food tax incidence, across household type, West Bengal.
Note: Shown as percentage of total post-tax expenditure.

policy experiments to assess how changing the rate structure of taxes affects theincidence of taxes across various groups. First, we examine the incidence out-come that results from zero-rating all food items in the consumption basket thatattract VAT; and, second, the incidence outcome across households of a simula-tion that doubles the rate of tax on tobacco items. The objectives of this policysimulation are two-fold. First, policy simulations should provide alternativesources to generate new tax revenues to replace tax losses arising due to the zero-rating of food items. In other words, the issue is how to maintain revenue neu-trality while advancing gender equality through tax policy. Thus, if food iszero-rated, is it possible for the government to tax tobacco at a higher rate whichis primarily consumed by men to increase revenues? The second objective of thissimulation is to see how the indirect tax incidence pattern changes when two dif-ferent consumption items, specifically, food and tobacco, are treated differentlyby policy reforms.
As indicated in Table 4.10, the food items that attract VAT are processed food,food in restaurants, packed foods, edible oils, spices, and so on. As some of thebasic ingredients of food such as spices and oil are taxed at a 4 per cent rate, thepoor would have a disproportionate burden of tax on these items given their heav-ily food-dependent consumption basket. Also, as the food eaten in restaurantsattracts the highest rate of 12.5 per cent, it would also be important to see how theoverall tax incidence pattern behaves when all the food items are zero-ratedacross quintiles.
Zero-rating of food does reduce the overall tax burden in all household cate-gories, but it does not change the pattern of tax incidence. Even when food is zero-rated, for example, the female-headed households still bear a higher incidencecompared to male-headed households. However, when the rates are increased ontobacco, which is primarily consumed by men, we see that aggregate tax incidencein male-headed households becomes higher than it is in female-headed house-holds. This result is not only due to the differences in the consumption basketbut also due to the differential rate structure of these two commodities. Amonghouseholds differentiated by sex composition, the tax incidence falls mostheavily on male-dominated households followed by households with an equalnumber of males and females and by female-dominated households (see Tables4.17 and 4.18).
Conclusion and policy implications
Our aim in this chapter has been to examine India’s direct and indirect taxes froma gender perspective. For indirect taxes, the analysis was restricted to the state ofWest Bengal. The analysis of personal income tax shows that there is no appar-ent explicit negative gender bias in the Indian tax code, India does not have jointfiling, and there is no differential treatment of non-labour income in the tax code.The gender biases that were present under the HUF have been removed by alter-ing the Hindu Act as well as through judicial rulings. In fact, India is one of thefew cases in which women are specifically privileged by the tax system because
116 P. Chakraborty, L. Chakraborty, K. Karmakar and S. Kapila

of a higher income tax threshold that applies to women. We have shown that onlya very small proportion of women in India are able to enjoy this tax advantage,and we remain unconvinced that this is good public policy.
Our overview of direct taxes has revealed that the tax system in India is verycomplex with a plethora of exemptions serving very limited purposes. There isthus a need to consolidate and rationalize exemptions. It must be emphasized thatincome tax has very limited power as an instrument for a pro-gender fiscal stanceas tax-paying women constitute a miniscule proportion of the total number ofworking women in India.
In the case of indirect taxes, we found that while in the aggregate, the tax systemis regressive in West Bengal, there was greater variation in the incidence of taxesaccording to household characteristics. Thus, while our results suggest that female-headed households bear a higher tax incidence, this is not the case for female-dominated households. Nevertheless, our results do suggest the VAT on basicconsumption goods especially places a greater burden on poor households in
Gender equality and taxation in India 117
Table 4.17 India policy simulation 1: tax on all food = 0
Total tax VAT Excise tax Fuel tax Number ofhouseholds
HeadshipMale-headed 1.51 1.33 0.04 0.06 7066Female-headed 1.63 1.53 0.03 0.02 821
Total 1.52 1.35 0.04 0.06 7877
Household sex compositionMale-dominated 1.52 1.32 0.05 0.07 3282Female-dominated 1.49 1.36 0.03 0.05 2552Equal number offemales and males 1.55 1.39 0.04 0.05 2043
Total 1.52 1.34 0.04 0.06 7877
Table 4.18 India policy simulation 2: tax on tobacco doubled
Total tax VAT Excise tax Fuel tax Number ofhouseholds
HeadshipMale-headed 2.17 1.90 0.13 0.06 7066Female-headed 2.16 2.02 0.07 0.02 821
Total 2.17 1.91 0.12 0.06 7877
Household sex compositionMale-dominated 2.33 2.04 0.14 0.07 3282Female-dominated 2.01 1.81 0.10 0.05 2552Equal number offemales and males 2.09 1.85 0.12 0.05 2043
Total 2.17 1.91 0.12 0.06 7877

specific household categories when we look at the incidence of various commoditiesacross expenditure quintiles. The tax incidence on basic necessity items and onfood and beverages was found to be higher for the lowest expenditure quintile. Itis interesting too that the tax incidence for the highest expenditure quintile washigher for housing, water, electricity and gas, fuel and transport as well as healthcare and medicine. The latter is particularly difficult to interpret in the Indian con-text. The relatively low incidence of consumption tax on these items for poorerhouseholds could result from the fact that these poorer households lack access tothe formal modern health care system, especially in the rural areas. The sameapplies to the incidence of taxes on consumption of housing, electricity and gas.
The analysis conducted here is particularly timely since in India, the centralgovernment as well as all state governments are considering the introduction ofan integrated goods and services tax for the 2010/11 fiscal year. Our analysis forWest Bengal suggests that the burden of such taxes may place an undue burdenon women, and on poorer households unless the rate structure or the design of thetax is calibrated properly. Of course, we have considered only one dimension offiscal policy. On the expenditure side, programmes such as food subsidies and thesubsidy for household fuel may well counter some of the negative impacts ofindirect taxes on poor households. Nevertheless, our findings do suggest that anyextension of indirect taxes needs carefully to consider the gender and povertyimpacts.
References
Ministry of Finance (2008a) Economic Survey 2007–8, New Delhi: Government of India.—— (2008b) Union Government Budget Document 2008–9, New Delhi: Government of
India. Available at: www.indiabudget.nic.in.National Sample Survey Organisation (NSSO) (2005) Employment and Unemployment
Situation in India 2004–5, Report No. 515, Ministry of Statistics and ProgrammeImplementation, New Delhi: Government of India.
Rao, M.G. and Rao, R.K. (2005) ‘Trends and Issues in Tax Policy and Reform in India’,Tax Research Unit, Working Paper I, New Delhi: National Institute of Public Financeand Policy.
West Bengal Commercial Taxes Department (n.d.) ‘Schedules Under the West BengalValue Added Tax Act 2003’. Available at: www.wbcomtax.nic.in/Act Rule ScheduleForm/vatschedule.pdf.
118 P. Chakraborty, L. Chakraborty, K. Karmakar and S. Kapila

Introduction
Income distribution in Mexico, as in many Latin American countries, is veryunequal. Nearly 43 per cent of the population lives below the poverty line,according to the National Institute of Statistics (INEGI 2006). This presents fis-cal policy-makers with the challenge of financing economic growth and socialwelfare at a time when total financial resources are insufficient to meet thecountry’s social protection needs. In part, this reflects a long-standing reluctanceby Mexican policy-makers to confront the need to address the problem of grow-ing income inequality through a more equitable tax policy.
In examining the options for such a policy, this chapter looks at the current taxstructure and its impact on different household income groups and considers sev-eral ways in which tax policy might be revised in order to lessen the burden on thelowest income households. It also examines the ways in which current tax policydifferentially affects men and women, particularly in lower-income households.Finally, it offers a series of recommendations for modifying both personal incometax and indirect taxation in order to expand social protection to all income groups.
A gendered picture of the economy
Gender research on taxation, as on other economic topics, strengthens economicanalysis, since it provides insights into how public policies reinforce or disman-tle traditional gender roles. A gender analysis questions the assumed neutrality oftax policy. Gender analysis of taxation seeks to understand the impact of taxationon diverse households and social groups by taking into account the different rolesthat women and men perform in the economy.
In analysing tax policy from a gender perspective, the first task is to establishwhether a given tax has a similar impact on women and men, given their respec-tive economic situations, as, for example, differences in jobs, markets and salaries,as well as ownership over productive assets. These factors influence the amountof tax owed. This differential economic power will also affect men’s andwomen’s ability to identify and take advantage of tax loopholes. For example, asmen are often paid more, they are more likely to be able to hire expensive lawyersand accountants who can help them devise ways to avoid paying taxes.
5 Gender analysis of taxation inMexico
Lucía C. Pérez Fragoso and Francisco CotaGonzález

120 L.C. Pérez Fragoso and F. Cota González
A gender analysis also takes into account the contribution of women to thenational economy, which includes unpaid work, such as caring for relatives andraising children. Time use data in Mexico show that 293,176 million hours arespent yearly on domestic and care-giver chores, and 84 per cent of them are car-ried out by women (INEGI 2002). Women age 15 and older provide more than30 hours a week of unpaid domestic work, which can be considered a substantialcontribution to the overall economy, even though it is not captured in the officialgross national product.
Employment and income differences
From 2000 to 2006, the Mexican population increased by 7 million people (7.4 percent), bringing the total to 105.2 million. Women represented approximately 52per cent of this growth, according to the Department of Labour and Social Welfare.Women represent only 37.5 per cent of the economically active population over age14 in Mexico even though they make up 53.1 per cent of the total population over14 years of age (Secretaría del Trabajo y Previsión Social 2006). Only 41 per centof women and girls aged 14 and older report being economically active.
Female and male labour force participation rates differ in most sectors ofemployment. While women make up only 38 per cent of salaried employees, theycomprise 55 per cent of unpaid workers (see Table 5.1). Women tend to be clus-tered in the tertiary or service sector in roles similar to those they perform athome, such as work in child-care centres (ibid.).
Gender gaps in income are evident both within and between income levels.The average minimum wage in 2006 was 48 Mexican pesos per day.1 As Table5.2 shows, if we add the proportion of the total population that does not have anyearned income (9 per cent) to the proportion that earns three times the minimum
Table 5.1 Economically active population by job position, Mexico, 2006
Position Women (%) Men (%) Total (%)
Paid workers and 10,393,394 37.1 17,655,104 62.9 28,048,498 100subordinates 64.9% 65.8% 65.5%
Salaried 9,921,791 38.2 16,018,474 61.8 25,940,265 10061.9% 59.7% 60.5%
Non-salaried 471,603 22.4 1,636,630 77.6 2,108,233 1002.9% 6.1% 4.9%
Employers 385,768 18.5 1,704,805 81.5 2,090,573 1002.4% 6.4% 4.9%
Self-employed 3,551,115 36.7 6,125,190 63.3 9,676,305 10022.2% 22.8% 22.6%
Unpaid workers 1,690,556 55.8 1,340,209 44.2 3,030,765 10010.6% 5.0% 7.1%
Total 16,020,833 — 26,825,308 – 42,846,141 —
Source: STPS. National Labour Survey. Fourth Quarter 2006.
Note: The percentage column indicates the proportion of women and men according to the total in eachcategory. Percentages below amounts in each column show the share of the total for women and men.

Gender analysis of taxation in Mexico 121
wage (the threshold under which people do not have to pay income taxes) or less(55 per cent), we see that 64 per cent of the total economically active populationearns less than three times the minimum wage and consequently do not payincome taxes.2 Among women, however, this share rises to 71.8 per cent.
Working hours are another vital element in a gender analysis of the labourmarket. A majority of the economically active population (72.3 per cent) work 35hours a week or more. However, 39 per cent of women work less than 35 hourseach week, while only 20 per cent of men do so (ibid.). Due to the sexual divisionof labour, which leaves women primarily responsible for household and care-giving tasks, many women can take on only part-time jobs, often in the informalsector, which are insecure, lacking in benefits and often very poorly paid.
Finally, a gender analysis is not complete without looking at social securitybenefits, which include health care insurance and pensions. Only about 21 millionworkers in the public and private sectors are covered by these benefits in Mexico,which extends to about 58 million including dependants. Among governmentemployees, women make up 47 per cent of those covered and men 53 per cent.In the private sector, however, only 38 per cent of those covered are women while62 per cent are men. These figures support the premise that the public sectoroffers better terms of employment to women than does the private sector.
Gender inequalities in the household
Understanding the differential participation of Mexican women in the labourmarket requires an examination of household structure. According to the National
Table 5.2 Economically active population by income level, Mexico, 2006
Women Men Total
Up to 1 minimum wage 2,842,612 2,746,652 5,589,26417.7% 10.2% 13.0%
Between 1 and 2 minimum wages 3,812,743 4,902,550 8,715,29323.8% 18.3% 20.3%
Between 2 to 3 minimum wages 3,130,989 6,187,077 9,318,066 19.5% 23.1% 21.7%
Between 3 to 5 minimum wages 2,247,231 5,485,808 7,733,03914.0% 20.5% 18.0%
More than 5 minimum wages 1,418,386 3,700,238 5,118,6248.9% 13.8% 11.9%
No income 1,735,667 2,104,326 3,839,99310.8% 7.8% 9.0%
Unspecified 8,33,205 1,698,657 2,531,8625.2% 6.3% 5.9%
Total 16,020,833 26,825,308 42,846,141100% 100% 100%
Source: STPS. National Labour Survey. Fourth Quarter 2006.
Note: Percentages below amounts in each column show the share of the total for women and men.

122 L.C. Pérez Fragoso and F. Cota González
Population Council (CONAPO), the average household has four members, at leasttwo of whom are usually related by blood or by marriage to the head of household.
Of the 24.8 million households identified in 2005, 22.8 million comprisedmembers of a family. The other 2 million comprised individuals living alone orpeople not related to each other. Of the family households, 17.1 million consistedof nuclear families, according to the Department of Interior. The average house-hold had 2.1 income earners.
The tax structure in Mexico
In 2006, three sources of public revenue made up 20.2 per cent of Mexico’s grossdomestic product (GDP). Oil revenues, at 7.3 per cent, were the largest single con-tributor, followed by three main taxes: income tax (including personal income taxand corporate income tax), value-added tax (VAT) and Special Tax on Productionand Services, which together totalled 8 per cent of GDP. The other major sourcesof government revenue were social security payments and Federal ElectricityCommission payments (not shown).
From 2005 to 2008, tax revenues as a percentage of GDP stood at approxi-mately 8.5 per cent. Table 5.3 shows the change in the federal revenue structureas a percentage of GDP from 2005 to 2008; the revenue structure as a percentageof total federal revenue from 2005 to 2008 is presented in Table 5.4. Tax revenues
Table 5.3 Federal revenue by source, Mexico, 2005–08 (% GDP)
2005 2006 2007 2008
Total federal revenues 15.4 15.1 15.3 16.9Tax revenues 8.8 8.6 8.9 8.2Income taxes 4.2 4.3 4.7 5.0Value-added tax 3.5 3.7 3.6 3.8Excises1 0.5 –0.1 –0.1 –1.4Import taxes 0.3 0.3 0.3 0.3Others2 0.3 0.3 0.3 0.4Non-tax revenue 6.5 6.5 6.3 8.7Products, services3 1.2 0.7 1.2 1.0Others4 0.0 0.0 0.0 0.0Duties on hidrocarbon 5.1 5.6 4.9 7.5Non-hidrocarbon duties 0.2 0.2 0.2 0.2
Source: Ingresos presupuestales del Sector Público. Secretaría de Hacienda y Crédito Público (SHCP)and Instituto Nacional de Estadística y Geografia (INEGI).
Notes:1 Includes gasoline and diesel, alcoholic beverages, beer and soft drinks, tobacco, lotteries and raffles.2 Includes tax on excess oil yield, tax on cash deposits, tax on automobile use, new cars and public
interest services.3 Includes sale of goods owned by government, interest earned on bonds, loans and securities, sales
of public enterprises, central bank operating surplus.4 Includes contribution to public works and infrastructure.

Gender analysis of taxation in Mexico 123
constitute about 49 per cent of federal revenues in 2008. The percentage ofincome tax in total tax revenues increases from 27 per cent in 2005 to over 29 percent in 2008. Similarly, the share of VAT in total tax revenues remains constantat 22 per cent from 2005 to 2008. The change in the composition of tax revenuesis driven by the variation in fuel taxes, explained below.
The federal government recently passed legislation establishing two newdirect taxes: the corporate flat rate tax (IETU), implemented on 1 January 2008,and a tax on cash deposits (IDE), implemented in June 2008. The IETU wasdesigned to complement the income tax and increase the tax base. It is much eas-ier to administer than the corporate income tax and provides less opportunity forpreferential treatment. This prevents tax evasion, a major factor in the country’schronically low tax revenue. Similarly, the tax on cash deposits was specificallydesigned to prevent tax evasion in the large informal sector and provides a wayof establishing control over money in circulation. The IDE levies a 2 per cent taxon cash deposits over $25,000 pesos a month whether held by private individu-als or by businesses. It is not imposed on cheque deposits or money transfers.
Personal income tax
Taxes on individual and corporate income, generated by a product or activity thatincreases income, whatever its nature, origin or denomination during the tax year,
Table 5.4 Percentage structure of federal government revenues, Mexico, 2005–08 (% totalfederal revenues)
2005 2006 2007 2008
Total federal revenues 100.0 100.0 100.0 100.0Tax revenues 57.4 57.1 58.6 48.5Income taxes 27.2 28.7 30.8 29.6Value-added tax 22.5 24.4 23.9 22.3Excises1 3.5 –0.3 –0.4 –8.2Import taxes 1.9 2.0 1.9 1.7Others2 2.2 2.2 2.4 3.0Non-tax revenue 42.6 42.9 41.4 51.5Products, services3 8.0 4.5 7.9 5.9Others4 0.0 0.0 0.0 0.0Duties on hidrocarbon 33.2 37.1 32.1 44.2Non-hidrocarbon duties 1.4 1.3 1.5 1.4
Source: Ingresos presupuestales del Sector Público. Secretaría de Hacienda y Crédito Público (SHCP)and Instituto Nacional de Información Estadística y Geográfica (INEGI).
Notes:1 Includes gasoline and diesel, alcoholic beverages, beer and soft drinks, tobacco, lotteries and raffles. 2 Includes tax on excess oil yield, tax on cash deposits, tax on automobile use, new cars and public
interest services.3 Includes sale of goods owned by government, interest earned on bonds, loans and securities, sales
of public enterprises, central bank operating surplus4 Includes contribution to public works and infrastructure.

124 L.C. Pérez Fragoso and F. Cota González
make up the bulk of Mexico’s tax revenue. Income taxes are paid by private indi-viduals, corporations and businesses, Mexican residents overseas with permanentbusinesses in Mexico, who are taxed on any revenue obtained from their activity,and permanent foreign residents, on any income generated in Mexico. Thischapter looks only at the effect of personal income tax on individuals.
Income tax forms must be submitted individually, as joint filing is not permit-ted. Individual income tax is owed on the following types of revenue, irrespec-tive of whether it is generated in cash, in kind, as services, loans, by accumulationor in any other way:
• earnings from economic activities (including wages);• earnings from rendering professional services;• earnings from gains in exchange rate transactions;• salaries and other remuneration for services performed for federal, state or
municipal government; and• advance payments, monetary benefits and other types of revenue.
The Income Tax Law exempts certain types of earnings, including:
• non-salary earnings for those who make less than the minimum wage;• compensation for overtime;• reimbursements for medical and funeral expenses;• social security payments;• non-salary earnings (bonuses) of wage workers;• insurance indemnities or compensation; and• per diems and travel allowances incurred while on the job and at the expense
of the employer, as well as similar compensation.
Exemptions reduce taxable income. In a country such as Mexico, where most ofthe population live on very little income, and more men than women have formaljobs, exemptions are mainly claimed by men, whose earnings are more likely toput them within the tax net.
Article 123 of the Income Tax Law stipulates that individuals who earn rev-enue through business activities or professional services are entitled to the fol-lowing tax deductions, among others: reimbursements, discounts and bonusesonce base revenue has been taxed; goods, raw materials and discontinued prod-ucts used to render services, to manufacture or to dispose of merchandise;expenses; and investments. Article 176 includes additional deductions of a per-sonal nature, including: payments for medical, dental, hospital fees, and similarexpenses; funeral costs; charitable donations; and mortgage interest, inflation-adjusted. In addition, Article 108 specifies that tax deductions are also availablefor inherited wealth and for revenues gained from jointly owned goods ofmarried couples.
The Income Tax Law establishes earning brackets used to calculate taxes onmoney income and determine subsidies and wage credits for individuals with

Gender analysis of taxation in Mexico 125
incomes below a specified threshold. Each year the government issues tablesthat set the tax-earning brackets and their corresponding tax rates, taking intoaccount the consumer price index and other factors (simplicity, ease of calcula-tion, income redistribution and tax burden). As Table 5.5 indicates, the numberof brackets and the tax rate applied both decreased between 2001 and 2006. In2001, the highest earnings bracket was anything over $212,744.85 pesos a month,with income above that taxed at 40 per cent. In 2006, the top rate was 29 per cent,applied on monthly earnings over $8,601.51 pesos. This sharp reduction in taxbrackets and rates over a short period of time acts to ease the burden on thewealthy at the expense of middle-income groups. In the absence of othertaxes/fees, it also reduces the amount of desperately needed public funds toincrease social welfare for the 42.5 per cent of the population living below thepoverty line.
The Income Tax Law also establishes subsidies for taxpayers who earn lessthan a specified amount, currently $7,382.34 pesos a month. Any individual whoearns below that amount gets a ‘wage credit’ based on the beneficiary’s salarybracket.
Table 5.6 shows the salary brackets set by the Income Tax Law and the corre-sponding subsidy in 2006. For instance, a person earning between $1,768.97 and$2,653.38 pesos a month is entitled to a monthly subsidy of $406.83 pesos. Thissubsidy is progressive: the greater the beneficiary’s income, the smaller the sub-sidy. However, only wage workers are eligible; independent or self-employedworkers are not eligible, which may constitute an implicit gender bias againstwomen as there are more men than women paid workers and subordinates.Taxpayers with incomes over $7,382.34 pesos a month are not entitled to the wagecredit, under the assumption that they are earning enough to make ends meet.
Table 5.7 shows how income tax would be calculated in three different cases:two cases represent workers who deserve the wage credit (workers A and B).Worker A earns three times the minimum wage and does not pay taxes andworker B earns a bit more than four minimum wages, entitled to the wage creditand pays taxes. The third case is a worker earning an amount where she/he is notentitled to the wage credit (worker C). In 2006, thanks to the wage credit, workerA (those earning $4,380.30 pesos, triple the minimum wage) and below did notpay income tax. As noted above, 64 per cent of the economically active popula-tion falls into this category, including 72 per cent of women workers.
Tax laws divide taxpayers into two distinct categories: those who derive theirincome from business activities or professional services, and wage earners. Theself-employed, including businesspeople and independent workers paid profes-sional fees, fall under a tax system similar to the corporate income tax, but theirrate follows the individual tax brackets. This system allows them to deduct thecost of what they pay for goods and services necessary for their work, as well asexpenses and investments, in addition to taking the personal deductions allowedto all individual taxpayers. On the other hand, only wage earners can benefit fromtax subsidies, since their employers collect income tax on a pay-as-you-earnbasis. They can claim their tax credit at the end of the fiscal year.

Table 5.5 Rates for calculating monthly income tax, Mexico, 2001 and 2006 (pesos and %)
2001 2006
Lower bracket Higher bracket Fixed levy % over the Lower bracket Higher bracket Fixed levy % over the limit limit excess limit limit excess
0.01 435.72 0 3 0.01 496.07 0 3.0435.73 3,698.27 13.07 10.0 496.08 4,210.41 14.88 10.0
3,698.28 6,499.38 339.32 17.0 4,210.42 7,399.42 386.31 17.06,499.39 7,555.25 815.52 25.0 7,399.43 8,601.50 928.46 25.07,555.26 9,045.69 1,079.49 32.0 8,601.51 Onwards 1,228.98 29.09,045.70 18,243.86 1,556.42 33.0
18,243.87 53,186.21 4,591.82 34.053,186.22 159,558.62 16,472.20 35.0
159,558.63 212,744.84 53,702.56 37.5212,744.85 Onwards 73,647.39 40.0
Source: Servício de Administración Tributaria (SAT).

Gender analysis of taxation in Mexico 127
Gender bias in the personal income tax (PIT) code
Since it tends to be expressed in laws, codes, norms and rules, explicit gender bias isclearly evident in tax law and in the way it is applied. The Mexican tax system in gen-eral, and the Income Tax Law specifically, exhibit no explicit gender bias of any kind.
Implicit gender bias is apparent, however, in the ‘different ways in which thetax system affects the welfare of men and women’ (Stotsky 2005: 2). It can befound in direct taxation systems that treat individuals and groups in the same waybut have different impacts for males and females because of their unequal socialand economic arrangements. The same rules are applied to both women and men,with no acknowledgement of the different social roles that they fulfil in thehousehold and the economy and without taking into account the uneven distribu-tion of power in society.
Table 5.6 Earnings schedule for wage credit, Mexico, 2006 (pesos)
Earnings from To Monthly wage credit
0.01 1,768.96 407.021,768.97 2,604.68 406.832,604.69 2,653.39 406.832,653.39 3,472.85 406.623,472.85 3,537.87 392.773,537.88 3,785.54 382.463,785.55 4,446.15 382.464,446.16 4,717.18 354.234,717.19 5,335.42 324.875,335.43 6,224.67 294.636,224.68 7,113.90 253.547,113.91 7,382.33 217.617,382.34 Onwards 0
Source: SHCP, SAT.
Table 5.7 Tax calculation and application of wage credit, Mexico (pesos)
Concept Worker A Worker B Worker C
Taxable income 4,371.30 6,000 18,000Minus: The amount that corresponds 4,210.42 4,210.42 8,601.51
to the lower limit of thebracket
Equals: Excess over that lower limit 160.88 1,789.58 9,398.49Multiplied by: Tax rate applicable to excess 17% 17% 29%Equals: Tax levy 27.35 304.23 2,725.56Plus: Fixed levy by racket 386.31 386.31 1,228.98Equals: Total tax 413.66 690.54 3,954.54Minus: Credit to wage 382.46 294.63 0Equals: Total tax liability (tax due): 31.20 395.91 3,954.54

128 L.C. Pérez Fragoso and F. Cota González
Personal income tax is levied on particular individuals with no considerationof the sources and amount of income derived by those living under the same roof.Implicit gender biases are embedded in exemptions, deductions and the employ-ment subsidy. The Income Tax Law for individuals limits its benefits to wageearners. However, a higher proportion of men than women have full-time, formaljobs and men typically also earn more than women. More women earn incomefrom part-time and informal employment, and are consequently not entitled todeductions or even the wage credit. As a result they implicitly benefit men morethan women since with similar incomes, men are likely to face a lower tax liability.
In addition, even if only a relatively small number of women pay taxes, theycan only take advantage of possible exemptions and deductions if they are famil-iar with the Income Tax Code for Individuals or hire an accountant. Since womenearn less, hiring an accountant represents a proportionally greater expense forthem than it does for a man. Therefore the complexity of the code is effectivelydiscriminatory against women.
A fair system of direct taxation must take the contribution of women’s unpaidwork to the national economy into account, which requires additional research.Changes in direct taxation can only go so far, however, in advancing genderequality in Mexico since economically active women make up just 41 per cent ofthe female population 14 years of age and older and only 28 per cent of the femalepopulation is subject to income taxes.
Tax calculations are made without distinctions based on the taxpayers’ age,gender, marital status or whether or not they have children. Any subsidies anddeductions are applied solely on the basis of income.
Indirect taxes and gender
Mexico has two kinds of indirect taxes. The value-added tax (VAT) is a tax onconsumption paid by individuals and legal entities on the exchange of goods, theprovision of services, the temporary use of goods, or the import of goods andservices. The VAT has three different rates: a general rate of 15 per cent; a rateof 10 per cent on transactions in the border area and a 0 per cent rate. Specificgoods, as shown in Table 5.8, are exempt.
The Special Tax on Production and Services (STPS) is an excise tax levied onthe final consumer through an addition to the price, on top of the VAT, to con-sumption of alcoholic beverages, soft drinks and sports drinks, tobacco, gasolineand diesel fuel. It varies between 20 per cent and 110 per cent, depending on theproduct. The tax rate for alcoholic beverages and beer is determined by alcoholcontent: beverages with up to 14 per cent alcohol (mainly beer) are taxed at 25per cent, those between 14 per cent and 20 per cent (mostly wine) at 30 per centand those above 20 per cent (mainly liquor) at 50 per cent. The tax on soft drinksand sports drinks is a flat 20 per cent. For tobacco, the rates are 110 per cent forcigarettes and 21 per cent for cigars and loose leaf tobacco.
Although the fuel tax is classified as an STPS, it has a different objectivefrom the others. Taxes are imposed on gasoline and diesel for transportation and

Gender analysis of taxation in Mexico 129
industrial use to compensate for the reduction in tax revenue generated by theproduction and export of crude oil. The rate varies according to internationalprices as follows: (1) the international price of gasoline and diesel, includingtransportation cost, is set as a reference price; (2) the Mexican price for gasolineand diesel fuel is calculated excluding the profit margin and VAT; and (3) the dif-ference between Mexican and international prices is calculated. This price differ-ential, divided by the international price, becomes the tax rate. Thus, whenMexican fuel prices are higher than international fuel prices, the tax rate is posi-tive and it increases as the price difference becomes greater.
On the other hand, when Mexican fuel prices are lower than international fuelprices, the rate applied is negative and effectively becomes a subsidy. The logicbehind this tax is that, when international fuel prices are low, oil-related incomeand the public revenue oil generates are also low and need to be compensatedwith a higher tax on fuels. When international fuel prices are high, so too are oil-related income and taxes, and some of this surplus can be transferred to con-sumers in the form of a fuel subsidy. After November 2005, the internationalprices of crude oil and diesel fuel were higher than Mexican prices so in 2006 thefuel ‘tax’ was actually a subsidy.
The VAT is by far the most important indirect tax as a proportion of total rev-enue from this source – consistently comprising more than 60 per cent, as can beseen in Table 5.9. Over time, the VAT share has increased as the fuel tax hasdecreased, and in 2006, due to the increase in international fuel prices, it becamea subsidy. However, if we eliminate the volatility created by fluctuations in thefuel tax, the VAT share in total indirect tax revenue has remained stable at 90 percent, with the remaining 10 per cent coming from STPS.
Table 5.8 VAT rates, Mexico, 2006
General Exemptions Zero rate Other preferentialVAT rate rates
15 per cent • Medical services • Exports 10 per cent in the • Educational services • Foods border area• Not-for-profit activities • Medicines• Sport and cultural services • Milk• Books and magazines • Potable water• Overland passenger • Non-processed
transportation animals• Lottery • Fishery and • Residential land and agricultural
buildings services• Wholesale trade
of gold andjewellery
Source: Ley del Impuesto al Valor Agregado. SHCP.

130 L.C. Pérez Fragoso and F. Cota González
Tax incidence analysis
An analysis of expenditure patterns in different types of household revealswhether the goods and services bought generate a higher or lower tax incidence,and how this in turn affects household income. This can provide a better under-standing of the impact of indirect taxes on different social groups and identify dif-ferences that can and should be mitigated.
The first studies of fiscal incidence in Mexico were carried out in the 1980sand focused mainly on vertical tax incidence, which this study of horizontaltax incidence is intended to complement. The information came primarily fromthe National Household Income and Expenditure Survey (ENIGH) compiledby the INEGI (INEGI 2006). The survey provides information about the distri-bution, amount and structure of household income and expenditure. It alsoprovides socio-demographic information: activity status and occupational char-acteristics of all household members aged 12 or older, as well as householdinfrastructure and home furnishings. For this study, we used the 2006 survey,which was implemented through direct personal interviews between Augustand November 2006.
Since the ENIGH provides data on both income and expenditure of households,the analysis was conducted using these two measures. We first examine the inci-dence of indirect taxes on household expenditure by type of household (see below)and by quintiles of per capita expenditure. We also examine the tax incidence ofdifferent categories of goods. This allows us to observe the effect of differentexpenditure patterns on the total tax paid, which will vary according to the pro-portion of exempt or zero-rated VAT goods, or the presence of additional indirecttaxes, in a household’s total expenditure. Second, we analyse the incidence ofindirect taxes in total household income for different household types, per capitaincome quintiles and types of commodities. To avoid confusion between thesetwo types of analysis, we will refer to the incidence calculated on householdexpenditures as expenditure incidence and that on household income as incomeincidence.
Table 5.9 Revenue from indirect taxes, Mexico (millions of pesos)
Year VAT STPS Fuel tax Total
2000 257,929.31 20,858.42 90,069.57 368,857.302001 266,534.16 30,054.65 111,505.81 408,094.622002 265,985.46 29,267.18 136,646.35 431,898.992003 296,336.42 35,148.99 102,002.98 433,488.402004 317,849.04 35,585.77 59,476.97 412,911.782005 340,679.14 36,846.89 16,247.39 393,773.432006 392,904.59 38,173.71 −43,585.11 387,493.20
Source: Ingresos Presupuestales del Sector Público. SHCP.

Gender analysis of taxation in Mexico 131
Incidence analysis by expenditure
Tax incidence was calculated for each type of tax (VAT, STPS and fuel tax), aswell as for total indirect taxes, in each of the three household types used in thestudy (see Table 5.10). The analysis shows that tax incidence by expenditure ishigher for all male-type households than female-type households. In householdswith no clear male or female predominance (dual-breadwinner or equal numberof men and women), tax incidence is comparable to that of male-headed or male-breadwinner households.
This pattern is readily apparent in Figure 5.1, which shows the way in whichmale-type households have a higher tax incidence by expenditure than do female-type households. It also shows that the incidence is higher when households areclassified according to sex composition as opposed to employment status. Thispattern is similar for the VAT, fuel tax and total tax incidence. The STPS (alco-hol, soft drinks and tobacco taxes) pattern is similar, with the slight differencethat equally gendered households bear a similar incidence as female-type house-holds, rather than male-type households.
When the analysis disaggregates households into rural and urban (more than2,500 inhabitants) areas, the pattern is similar. Male-headed, dual-breadwinner,and equal number male/female households all bear a higher tax incidence thanfemale-type households in both rural and urban areas.
However, as Figure 5.2 shows, rural and urban households exhibit some note-worthy differences. First, overall tax incidence is higher in urban than in ruralareas. This can be explained largely by the lower level of income in rural areasand the tendency of rural households to spend more on basic goods, which areuntaxed. The only exception is in the no-employed category, where tax incidenceis higher in rural areas. However, it is worth pointing out that the no-employedcategory includes households with revenues not directly related to employment,such as pensions, rental incomes and federal subsidy programmes that maygenerate different expenditure patterns.
Table 5.10 Household categories, Mexico
• Household Head – Whether the household head is male or female.• Occupational Status – Defined as:
Male breadwinner: Only men in the household are employed.Female breadwinner: Only women in the household are employed.Dual breadwinner: There are as many women as men in the household with someform of employment.Unemployed: All household members are unemployed.
• Household Gender Composition – Classified according to the number of women andmen in the household as:Majority of men: more men than women in the household.Majority of women: more women than men in the household.Equal number: men and women are equal in the household.

Male Female Both None
Headship 7.4617 7.1306
7.4744 7.4323 7.2810
7.5889 7.1338 7.5184
6.90
7.00
7.10
7.20
7.30
7.40
7.50
7.60
7.70
7.80
HHcomposition
Employmentstatus
7.0268
Figure 5.1 Incidence on expenditure: total indirect tax incidence by household type,Mexico.
6.40
6.60
6.80
7.00
7.20
7.40
7.60
7.80
Male Female Both None
Fis
cal b
urd
en (
%)
Household Type
Headship URBAN Headship RURAL
Occupational status URBAN Occupational status RURAL
Gender composition URBAN Gender composition RURAL
Figure 5.2 Incidence on expenditure: total indirect tax incidence by household type andlocation, Mexico.

Gender analysis of taxation in Mexico 133
Urban female-headed households also bear a slightly lighter tax burden thanmale-headed rural households. Female-type households overall pay less indirecttax; among these, rural female-type households (either headed by a woman orwhere the main breadwinner is a woman) bear a significantly lower burden
This pattern holds true for the VAT and the fuel tax. However, the pattern forSTPS is the opposite: in all categories, tax incidence is greater in rural areas,where households spend a greater proportion of their incomes on goods such assoft drinks, alcoholic beverages and tobacco. In all categories, male-headed andmale-breadwinner households have a higher STPS tax burden.
Figure 5.3 shows tax incidence by expenditure quintile for households withand without children. Total tax incidence is greater in higher expenditure quin-tiles and in households without children than in lower expenditure quintilesand households with children. The largest variation can be found in house-holds without dependants: those with a male breadwinner have the highest taxburden; those with a female breadwinner have the lowest; and dual-earnerhouseholds are somewhere in between, especially in the top three quintiles. Inthe lower two quintiles, female-breadwinner and dual-earner households havesimilar tax burdens; male-headed households pay more of their expenditure ontaxes. This indicates that households without dependants in high expenditurequintiles devote a larger proportion of their expenditures to taxed goods thanto exempt goods or products with lower tax rates, such as basic foodstuffs,health and education.
Expenditure behaviour tends to be variable in households with no employedmembers. The explanation may be that individuals and families in different
5.20
5.60
6.00
6.40
6.80
7.20
7.60
8.00
8.40
8.80
9.20
Tax
bu
rden
(%
)
Male w child
Male w/o child
Female w child
None w child None w/o child
Female w/o child
Both w child
Both w/o child
1 2 3 4 5
Quintiles
Figure 5.3 Incidence on expenditure: total indirect tax incidence by occupational status and quintile, Mexico.

134 L.C. Pérez Fragoso and F. Cota González
expenditure quintiles have different expenditure patterns, which can be tempo-rary or not, depending on income and other factors, such as the timing of thereceipt of children’s scholarships in the lower quintiles or the interest on finan-cial assets in higher quintiles.
Although the STPS contribution to total tax revenue is small compared to thatof the VAT, its incidence is greatest in households in the lower expenditure quin-tiles and is lowest in higher expenditure quintiles. This is particularly evident inmale-breadwinner households without dependants. This indicates that lower-income households spend a higher proportion of their earnings on products suchas soft drinks, alcoholic beverages and tobacco. Female-breadwinner households,irrespective of whether they have any dependants, show the smallest STPS bur-den, suggesting that women do not spend as much on these products as do men.These same patterns hold when households are classified by sex composition.
Incidence analysis by income
In analysing the incidence of indirect taxes in relation to household income,3 we usedthe same household categories as we did for expenditure in order to facilitate a com-parison of results. In this analysis, incidence is derived from total household incomeand households are classified into quintiles based on per capita income rather thanper capita spending. Since we have data on source of income by household member,we are also able to include an additional category to our household classification –one that reflects which family member generates the most household income. Werefer to male-maintained households as those in which men are responsible for 60per cent or more of the total household income. Similarly, female-maintained house-holds are those in which women contribute 60 per cent or more of householdincome. Finally, households where neither partner contributes 60 per cent or moreof total household income are referred as jointly-maintained households.
In contrast to the results based on per capita household expenditure, tax inci-dence relative to income among different household type exhibits no consistentpattern. Figure 5.4 shows that total tax incidence is similar between householdswith both male and female heads. In households categorized by employmentstatus, incidence is similar for male and female breadwinners, and householdswith no earners, and all of these households bear a higher tax incidence thanhouseholds with dual earners.
However, when we differentiate households by their sex composition, the pat-tern is similar to what we found using expenditure: households where women arein the majority have a lower tax incidence than those with equal numbers of menand women, and these in turn have a lower incidence than households where menare in the majority; in other words, male majority households bear the highestincidence of households in this categorization.
Classification by income generation also reveals some contrasting results.Households in which most income is earned by women have a higher tax inci-dence than households where men earn most of the income. Incidence is lowestin households where men and women both contribute their earnings.

Gender analysis of taxation in Mexico 135
What explains these different results? It could be that in households wherewomen contribute the largest share of household income, or where they are themain breadwinner, they have greater power to decide on household spending, andthey spend a larger fraction of their income than do other types of households onthose goods and services that attract tax. Indeed, an analysis of the compositionof consumption expenditures shows that female-maintained households have ahigher share of their income allocated to items such as personal care, adult cloth-ing, housing, house furnishing and equipment, and communications, especially astheir income increases, than consumption expenditure in male and jointly-main-tained households.
This pattern is similar for VAT, fuel tax and total tax incidence. The pattern forSTPS incidence is similar to what we saw in the analysis by expenditure. Malehouseholds of all types have the highest incidence of STPS.
Disaggregating households by their urban or rural location shows that, similar toexpenditure, rural households generally bear a lower incidence of total tax than dourban households. But, two issues are worth noting here. First, when the classification
Male Female Both None
Headship 5.8509 5.8211
6.0198 5.6693 6.0302
5.9386 5.7359 5.8788
5.8157 5.9866 5.7623
HHcomposition
IncomeGeneration
Employmentstatus
6.0137
5.60
5.70
5.80
5.90
6.00
6.10
6.20
Figure 5.4 Incidence on income: total indirect tax incidence by household type, Mexico.
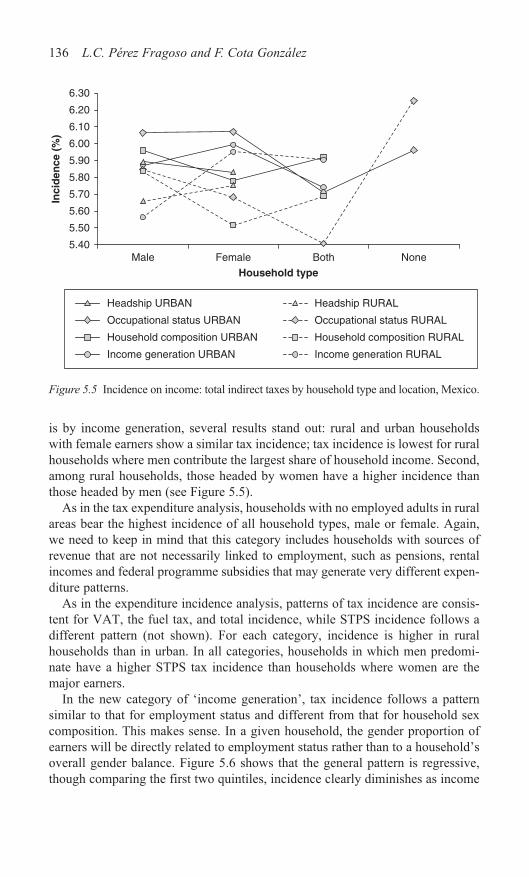
136 L.C. Pérez Fragoso and F. Cota González
is by income generation, several results stand out: rural and urban householdswith female earners show a similar tax incidence; tax incidence is lowest for ruralhouseholds where men contribute the largest share of household income. Second,among rural households, those headed by women have a higher incidence thanthose headed by men (see Figure 5.5).
As in the tax expenditure analysis, households with no employed adults in ruralareas bear the highest incidence of all household types, male or female. Again,we need to keep in mind that this category includes households with sources ofrevenue that are not necessarily linked to employment, such as pensions, rentalincomes and federal programme subsidies that may generate very different expen -diture patterns.
As in the expenditure incidence analysis, patterns of tax incidence are consis-tent for VAT, the fuel tax, and total incidence, while STPS incidence follows adifferent pattern (not shown). For each category, incidence is higher in ruralhouseholds than in urban. In all categories, households in which men predomi-nate have a higher STPS tax incidence than households where women are themajor earners.
In the new category of ‘income generation’, tax incidence follows a patternsimilar to that for employment status and different from that for household sexcomposition. This makes sense. In a given household, the gender proportion ofearners will be directly related to employment status rather than to a household’soverall gender balance. Figure 5.6 shows that the general pattern is regressive,though comparing the first two quintiles, incidence clearly diminishes as income
5.40
5.50
5.60
5.70
5.80
5.90
6.00
6.10
6.20
6.30
Inci
den
ce (
%)
Male Female Both None
Household type
Headship URBAN Headship RURAL
Occupational status URBAN Occupational status RURAL
Income generation URBAN Income generation RURAL
Household composition URBAN Household composition RURAL
Figure 5.5 Incidence on income: total indirect taxes by household type and location, Mexico.

Gender analysis of taxation in Mexico 137
increases, whereas hardly any difference appears in the highest three quintiles.This differs from the results of employment status using per capita expenditure asopposed to income, where the higher the quintile, the larger the tax burden.
Figure 5.6, which shows tax incidence by income generation, dependants, andquintiles, establishes a similar pattern between households where women con-tribute most of the earnings, and those in which men bring in most of revenue,although incidence tends to be higher in women-maintained homes, except for thefirst quintile for male-type households without dependants and the last quintile ofboth maintainers without dependants. In all quintiles except the 2nd, tax inci-dence is greater in households with dependents. In the lower two quintiles, taxincidence is higher in households with no dependants, but the difference betweenhouseholds with and without dependants practically disappears in the other threequintiles.
There is a steady decline from the 1st quintile to the 5th quintile, mainly inhouseholds where men contribute most of the income and there are no depen-dants. If we compare total tax incidence of households by income generation andquintile, we see that the general pattern is regressive. Closer examination revealsthat for the first two quintiles incidence clearly diminishes as income increases,whereas for the highest three quintiles, it is practically flat. With respect to depen-dants, incidence falls most heavily on the poorest male- and female-maintainedhouseholds without children and female-maintained households with children.Households that are maintained jointly by male and female incomes, both with
5.20
5.60
6.00
6.40
6.80
7.20
7.60
8.00
Inci
den
ce (
%)
1 2 3 4 5
Quintile
Male w dependants Male w/o dependants
Female w dependants Female w/o dependants
Both w dependants Both w/o dependants
Figure 5.6 Incidence on income: total indirect taxes by income generation, number ofdependants and quintile, Mexico.

138 L.C. Pérez Fragoso and F. Cota González
and without dependants, tend to have the lowest incidence compared to male andfemale-maintained households, except in the richest quintile. The pattern forVAT and STPS follows previous analysis.
Finally, comparing the results of the incidence analysis based on income ver-sus expenditure (using the household classification of income generation for theformer and employment status for the latter) shows that total indirect taxes areborne more heavily by the poor using the metric of income. The results forincome and expenditure are similar for the 2nd quintile, whereas from the 3rdquintile onwards, the pattern switches – incidence by the metric of expenditure ishigher than incidence by the metric of income with the gap between the twowidening, the higher the quintile. In strictly numerical terms, this seems to implythat, in the 1st quintile, household income may be less than expenditure, so thattax incidence with regards to income is greater than the tax incidence withregards to spending. In the 2nd quintile, income and expenditure are similar. Forquintiles 3, 4 and 5, income seems to be greater than spending, with the gapbetween the two becoming greater in the higher quintiles. As before, VAT inci-dence rates account for almost the totality of indirect tax incidence.
This is consistent with a priori expectations, since when incidence is measuredon income, the analysis captures the effect of the higher propensity to save, pro-ducing a lower incidence on higher income, whereas on expenditure the analysisis only on the share on total expenditure, and not on total income allocation.
Moreover, income-based quintiles are not necessarily comprised of the samegroup of households as expenditure-based quintiles. Expenditure quintiles likelyinclude a more diverse group of households than income quintiles. They are madeup of individuals who spend similar amounts on the same product basket, regard-less of income level, reasons to do so, and other uses of their income. By contrast,households grouped by income quintile allocate income based on preferences,peer pressure, social conditioning, education level and other factors that are cor-related to income, which makes the groups more uniform. A deeper understand-ing of the differences between income-based and expenditure-based incidencerequires an analysis of the determinants of household income allocation, which isnot possible with household-level data.
In summary, several patterns emerge from this analysis. When measured onexpenditure, the highest incidence falls on all types of male-households, on urbanhouseholds and on households without children. Expenditure incidence is similarfor female-headed and female-breadwinner households, as well as for male-headed and male-breadwinner households, with the two male-type householdsbearing a larger incidence than the two female-type households. Moreover, inci-dence by expenditure increases with quintiles, that is, is progressive. By contrast,the patterns for income incidence are more varied. Incidence on income resemblesexpenditure incidence only in households classified by sex composition but not inhouseholds classified by headship and occupational status. Female-maintained andfemale- and male-breadwinner households, along with households with no incomeearners, bear the highest income incidence of indirect taxes. Income incidence ishigher for urban than for rural households. Finally, in contrast to tax incidence by

Gender analysis of taxation in Mexico 139
expenditure, tax incidence by income is relatively regressive and much higher forthe lowest quintiles.
Incidence analysis by consumption categories, employment status andquintile
This section examines various categories of goods and services in relation to totalhousehold monthly income in order to understand the different contribution of eachto overall tax incidence. Table 5.11 lists the incidence on income for individualcommodity categories by quintile and occupational status.
Consider first the incidence on by commodity for male-breadwinner house-holds. Like the previous analysis, the first two quintiles have similar incidencerates for the same goods and services. However, the 3rd, 4th and 5th quintilesshow high tax incidence in four categories: private means of transportation,entertainment, communication and meals out. In these categories, the 5th quin-tile shows the highest incidence rates, except in communications, where the 4thquintile is higher. These four categories of goods and services show a clearlyprogressive tax incidence, that is, the incidence is higher for higher-incomequintiles.
For the 1st quintile the categories with the highest tax incidence are non-alcoholic beverages, home equipment and maintenance, children’s clothing,meals out, basic personal care products, and adult clothing. For all of these, thetax incidence is clearly regressive, except for meals out and adult clothing.
By contrast, in female-breadwinner households, the lowest incidence overall isfor public transportation, basic foods, spirits, sugar, confectionery and other food-stuffs, water, and wine. One key difference with male-breadwinner households isthat the peaks in the 5th quintile are limited to private transport, recreation, andfuel for transport.
The commodities with the highest incidence are the same in both female- andmale-breadwinner households in the 1st quintile, but the rates differ. Similar tomale-breadwinner households, the trend is regressive for non-alcoholic bever-ages, home equipment and maintenance, children’s clothing, and personal careproducts. Electricity and communications have a higher tax incidence than doesadult clothing. Unlike in male-breadwinner households, meals out has one of thehighest incidences for female-breadwinner households in the 1st quintile.
In dual-breadwinner households, tax incidence of commodities consumed bythe lower quintiles resembles that in male-breadwinner households, except forprivate means of transportation which has the highest incidence for households inthe 5th quintile. Households with no employed members are more like female-breadwinner households although the dispersion of incidence rates between thequintiles is lower and non-alcoholic drinks are inversely related to income. Also,unlike for other household types in the 1st quintile, commodities with the highestincidence in no-employed households include utilities like gas and electricityinstead of meals out and adult clothing. Finally, the six commodities with thehighest incidence show a regressive pattern.

Table 5.11 Total indirect tax incidence by consumption categories and employment status,Mexico (tax as a percentage of income)
Category Male Breadwinner Female Breadwinner
1 2 3 4 5 1 2 3 4 5
Food subtotal 0.0326 0.0267 0.0246 0.0228 0.0163 0.0301 0.0277 0.0350 0.0435 0.0247Basic Basket 0.0000 0.0000 0.0000 0.0000 0.0000 0.0000 0.0000 0.0000 0.0000 0.0000Non Basic 0.0326 0.0267 0.0246 0.0228 0.0163 0.0301 0.0277 0.0350 0.0435 0.0247Sugar, 0.0000 0.0000 0.0000 0.0000 0.0000 0.0000 0.0000 0.0000 0.0000 0.0000confectionaryand other
Meals out 0.6112 0.5838 0.6972 0.8107 0.8163 0.7536 0.6535 0.7764 0.7710 0.6982Non alcoholic 0.9723 0.8081 0.6691 0.5031 0.1912 0.9449 0.7069 0.6260 0.4093 0.1882beveragesAlcoholic 0.0927 0.0903 0.1040 0.1190 0.1172 0.0056 0.0136 0.0205 0.0233 0.0367beverages subtotalSpirits 0.0227 0.0048 0.0116 0.0115 0.0234 0.0000 0.0102 0.0078 0.0077 0.0104Wine 0.0000 0.0000 0.0026 0.0000 0.0075 0.0000 0.0000 0.0000 0.0023 0.0055Beer 0.0700 0.0855 0.0898 0.1076 0.0863 0.0056 0.0033 0.0127 0.0133 0.0208
Tobacco 0.1394 0.1592 0.1596 0.1615 0.1115 0.0845 0.0475 0.0623 0.0870 0.0558Apparel and 1.1542 0.8324 0.7718 0.7127 0.5384 1.2188 0.9685 0.8359 0.7520 0.6866footwear subtotalAdult’s clothing 0.5121 0.3908 0.4379 0.4721 0.4105 0.4647 0.4891 0.4209 0.4814 0.5392Children’s 0.6421 0.4416 0.3338 0.2406 0.1279 0.7540 0.4794 0.4149 0.2706 0.1474clothing
Housing and 0.8515 0.8363 0.7919 0.7158 0.5119 0.9824 0.9976 0.9264 0.7572 0.5615utilities subtotalUtilities 0.7317 0.7269 0.6939 0.6072 0.3842 0.8798 0.9314 0.8198 0.6405 0.4115Water 0.0000 0.0000 0.0000 0.0000 0.0000 0.0000 0.0000 0.0000 0.0000 0.0000Electricity 0.4205 0.3905 0.3880 0.3617 0.2434 0.4973 0.4892 0.4337 0.3653 0.2314Gas 0.3087 0.3316 0.3007 0.2347 0.1187 0.3800 0.4362 0.3775 0.2648 0.1480Others 0.0024 0.0048 0.0052 0.0107 0.0221 0.0025 0.0059 0.0087 0.0104 0.0321
Housing 0.1198 0.1094 0.0980 0.1086 0.1277 0.1027 0.0662 0.1065 0.1167 0.1500Fuel for 0.0542 0.0187 0.0120 0.0081 0.0030 0.0691 0.0331 0.0171 0.0090 0.0053household useHome equipment 0.9603 0.6840 0.6405 0.5403 0.3585 1.0610 0.7591 0.7073 0.6268 0.4123and maintenanceDomestic 0.0080 0.0087 0.0110 0.0238 0.0672 0.0008 0.0099 0.0110 0.0233 0.0515ServicesMedical expenses 0.0878 0.0938 0.1219 0.0747 0.0915 0.1758 0.0922 0.0972 0.0754 0.1127Transportation 0.0462 0.1048 0.2826 0.4587 0.8606 (0.0544) (0.0340) 0.0446 0.3041 0.8071subtotalPublic (0.0556) (0.0466) (0.0379) (0.0273) (0.0097) (0.0797) (0.0722) (0.0580) (0.0419) (0.0178)transportationAir 0.0000 0.0048 0.0145 0.0238 0.0719 0.0034 0.0000 0.0016 0.0122 0.0773transportationPrivate 0.1019 0.1465 0.3061 0.4623 0.7984 0.0218 0.0382 0.1011 0.3338 0.7475transportation
Fuel for 0.1854 0.2530 0.3246 0.3940 0.3496 0.0619 0.0917 0.1353 0.2349 0.2806transportsCommunications 0.2285 0.3536 0.4721 0.5786 0.4776 0.4738 0.5245 0.6214 0.6970 0.5886Recreation 0.2172 0.2209 0.3405 0.4923 0.7127 0.1261 0.2219 0.3100 0.3669 0.6394Education 0.0206 0.0159 0.0105 0.0099 0.0096 0.0382 0.0320 0.0097 0.0150 0.0108Personal care 0.9485 0.8104 0.6653 0.5519 0.3285 1.0919 0.8367 0.7574 0.6361 0.4815subtotalPersonal care 0.5557 0.4240 0.3443 0.2731 0.1387 0.6202 0.4601 0.3811 0.3168 0.1763basicsPersonal care for 0.1627 0.1697 0.1057 0.0608 0.0139 0.1540 0.1033 0.0865 0.0365 0.0139babiesOther 0.2302 0.2167 0.2154 0.2180 0.1758 0.3176 0.2733 0.2898 0.2828 0.2914
Miscellaneous 0.1168 0.1127 0.1312 0.1692 0.1750 0.1679 0.1011 0.1290 0.1882 0.2165TOTAL 6.7274 6.0133 6.2304 6.3471 5.7366 7.2319 6.0835 6.1224 6.0202 5.8580Number of 1945 1906 1537 1367 1464 562 519 538 577 642householdsin quintile

Table 5.11 (Continued)
Dual Breadwinner No Employed
1 2 3 4 5 1 2 3 4 5
0.0199 0.0215 0.0229 0.0239 0.0176 0.0616 0.0356 0.0523 0.0259 0.02040.0000 0.0000 0.0000 0.0000 0.0000 0.0000 0.0000 0.0000 0.0000 0.00000.0199 0.0215 0.0229 0.0239 0.0176 0.0616 0.0356 0.0523 0.0259 0.02040.0000 0.0000 0.0000 0.0000 0.0000 0.0000 0.0000 0.0000 0.0000 0.0000
0.6409 0.7050 0.6388 0.7272 0.6658 0.4838 0.6939 0.6477 0.6415 0.52790.8954 0.6902 0.5500 0.4268 0.1852 1.5503 0.9989 0.6922 0.4664 0.2353
0.0659 0.0723 0.0720 0.0634 0.0542 0.0468 0.0624 0.0211 0.0436 0.0969
0.0070 0.0043 0.0038 0.0130 0.0144 0.0376 0.0000 0.0000 0.0142 0.03760.0000 0.0000 0.0002 0.0012 0.0068 0.0000 0.0000 0.0000 0.0000 0.00080.0590 0.0679 0.0680 0.0493 0.0331 0.0093 0.0624 0.0211 0.0294 0.05850.0877 0.1585 0.1493 0.1084 0.0755 0.0819 0.1360 0.2079 0.1980 0.10101.1060 0.8329 0.7820 0.7506 0.6393 1.0165 0.6755 0.6959 0.6705 0.3721
0.4979 0.4208 0.4484 0.4920 0.4806 0.4109 0.2817 0.3403 0.4615 0.31520.6081 0.4122 0.3336 0.2585 0.1588 0.6056 0.3938 0.3556 0.2090 0.0568
0.7766 0.7664 0.6988 0.6321 0.4824 1.3962 1.1879 1.0732 0.9877 0.8081
0.6820 0.6692 0.6063 0.4944 0.3525 1.2826 1.0750 0.9104 0.8812 0.57670.0000 0.0000 0.0000 0.0000 0.0000 0.0000 0.0000 0.0000 0.0000 0.00000.4042 0.3551 0.3368 0.2792 0.2212 0.6982 0.5640 0.4744 0.5090 0.34900.2756 0.3097 0.2647 0.2087 0.1159 0.5794 0.5050 0.4310 0.3450 0.17070.0022 0.0044 0.0047 0.0066 0.0154 0.0050 0.0060 0.0051 0.0272 0.05690.0946 0.0972 0.0926 0.1377 0.1299 0.1136 0.1129 0.1628 0.1065 0.23140.0524 0.0187 0.0110 0.0065 0.0030 0.0764 0.0312 0.0248 0.0146 0.0028
0.9110 0.6459 0.5851 0.5212 0.3723 1.0991 0.7914 0.7717 0.6582 0.5021
0.0013 0.0049 0.0105 0.0199 0.0370 0.0050 0.0154 0.0128 0.0308 0.0547
0.0714 0.0649 0.0807 0.0637 0.1010 0.1262 0.0861 0.0547 0.1091 0.20280.0052 0.0635 0.1346 0.3650 0.9298 (0.0171) 0.0110 0.0508 0.3741 0.6995
(0.0624) (0.0565) (0.0486) (0.0353) (0.0102) (0.0535) (0.0409) (0.0417) (0.0354) (0.0112)
0.0000 0.0038 0.0012 0.0040 0.0630 0.0047 0.0000 0.0041 0.0274 0.0838
0.0676 0.1161 0.1820 0.3962 0.8770 0.0317 0.0519 0.0883 0.3821 0.6269
0.1126 0.1730 0.2327 0.3259 0.3501 0.1587 0.1275 0.1852 0.2701 0.3074
0.2987 0.3541 0.4670 0.5468 0.4671 0.4327 0.6783 0.6718 0.7865 0.47700.2000 0.2232 0.2938 0.4355 0.6423 0.1192 0.2360 0.2692 0.4721 0.52870.0242 0.0221 0.0135 0.0171 0.0185 0.0101 0.0355 0.0417 0.0082 0.00550.9074 0.7552 0.6706 0.5481 0.3675 1.0889 0.8242 0.7001 0.6239 0.3447
0.5303 0.4101 0.3373 0.2642 0.1445 0.6195 0.4654 0.3784 0.3242 0.1473
0.1358 0.1015 0.0904 0.0506 0.0217 0.2280 0.1096 0.0599 0.0453 0.0160
0.2412 0.2435 0.2429 0.2333 0.2013 0.2414 0.2493 0.2618 0.2544 0.18140.0954 0.1184 0.1322 0.1771 0.2077 0.0858 0.1125 0.1582 0.1040 0.31116.2722 5.6907 5.5456 5.7591 5.6165 7.8220 6.7391 6.3311 6.4853 5.59801279 1446 1790 1942 1702 380 295 301 280 359

142 L.C. Pérez Fragoso and F. Cota González
To summarize, the pattern of tax incidence is similar between male- and dual-breadwinner households, and between female-breadwinner and unemployedhouseholds. Commodities with the lowest tax incidence include basic goods,some of which are exempt or zero-rated, such as public transport, basic foods andgoods that are not heavily consumed such as wine and air transport, especially inlow-income quintiles.
All income quintiles show roughly the same pattern for commodities with thelowest tax incidence. This is not the case for commodities that have the highesttax incidence. In low-income quintiles some of these high tax incidence com-modities are necessities: non-alcoholic beverages, household equipment, basicpersonal care items, and clothing, both adult and children, as well as householdutilities like gas and electricity. But other high tax incidence commodities are‘luxury’ items consumed in greater proportion by the fourth and fifth quintiles.The last thing to note is that, contrary to initial expectations, meals out has a hightax incidence across all income quintiles, suggesting that this category is impor-tant to both high- and low-income groups.
Policy simulations: VAT
This section turns to a set of policy simulations designed to make tax incidenceless burdensome for both poor and female-type households. We ran three simu-lations to establish whether taxing some exempt goods and services would gen-erate changes in tax incidence. For this purpose, we assumed an increase to 15per cent in the VAT (from the current zero rate) in different categories of goods:
• Simulation 1: Non-basic foods and confectionary products• Simulation 2: As above, plus medicines• Simulation 3: As above, plus basic foodstuffs.
We calculated tax incidence using both household income and household expen-diture, the latter in order to be consistent with the other studies in this volume.4
All changes in tax levies generate two opposing effects: on the one hand, anincrease or decrease in total tax revenues; on the other, a shift in the tax incidenceand its impact on different sectors of society. To measure both effects for each sim-ulation, we calculated and analysed two types of results: the increase in total tax rev-enue and the variation in both the absolute level of tax incidence and its distribution.
To estimate the increase in the total collection of indirect taxes, we did thefollowing:
1 We increased the tax to 15 per cent for each product under the categorieslisted.
2 We calculated the additional tax paid by households and by product based onthe level of expenditure as determined by the ENIGH (INEGI 2006).
3 We calculated the total additional expense using the expansion factorsprovided by ENIGH 2006.

Gender analysis of taxation in Mexico 143
4 We totalled the additional tax expense and calculated the rate of increaseover the original baseline tax revenue for indirect levies.
5 We applied this rate of increase to the total revenue actually generated byindirect taxes in 2006.
Table 5.12 shows the results of the simulations. In simulation 1, the applicationof VAT to the 173 products in the categories of ‘non-basic foods’ (e.g., popcorn,fried foods, pizzas, carnitas, T-bone steaks, shrimp, salmon and capers) and ‘con-fectionary products’ (pastries, potato crisps, etc.) increased revenue by 91,300million pesos, an increase of 23.99 per cent over what was actually collected fromindirect taxes in 2006. Although all of the products included in the simulationsare widely consumed (which is why they are not currently taxed), these two foodcategories are the least important, since neither contains basic foods, and manyitems in both categories could be considered luxuries. It is also worth mentioningthat this simulation generates the most additional tax revenue.
Simulation 2 taxes medicines (a total of 41 products). This produces the small-est increase in indirect tax revenue, 24,200 million pesos, or an extra 6.35 per cent.
Table 5.12 Estimate of additional tax revenue through the application of standard VATrate to exempt or zero-rated products, Mexico (million of pesos)
Assumptions Base Simulation Simulation Simulation calculation 1 2 3
Actual 2006 Additional Additional Additional 15% indirect 15% tax on: 15% tax on: tax on: Non-basic tax scheme Non-basic Non-basic food, Sugar
food, Sugar food, Sugar products, products products, Medicine, Basic
Medicine food
Total 14,389.66 17,841.26 18,755.62 21,220.69calculated indirect tax revenue (sample * expansion factor)Additional 3,451.60 4,365.96 6,831.03revenue% increase 23.9% 30.3% 47.4%Actual 2006 380,576.10 380,576.10 380,576.10 380,576.10indirect tax revenueCalculated 91,287.45 115,470.46 180,666.23increase from simulation (actual revenue* % increase)

144 L.C. Pérez Fragoso and F. Cota González
Simulation 3 taxes 33 basic food items, including tortillas, bread, mincedbeef, steaks, milk, oil and margarine, tinned tuna, sugar and chilies. This gener-ates an increase in total indirect tax revenue of 65,200 million pesos, or an extra17.1 per cent. Although this is the product category with the fewest items, it hassignificant social importance: families with modest resources consume foodsmainly from this group. An increase on a tax on this category would be difficultto justify.
To ascertain the change in indirect tax incidence based on the three VATincreases proposed, we simulated: (1) the change in tax incidence based on totalhousehold expenditure; and (2) the change in the incidence of indirect tax based onhousehold income. Although tax incidence increases with the taxation of additional
7.0
7.5
8.0
8.5
9.0
9.5
10.0
10.5
11.0
BASE CALCULATIONActual 2006 tax scheme
SIMULATION 315% Tax on:• Non-basic food• Sugar products• Medicine• Basic food
SIMULATION 215% Tax on:• Non-basic food• Sugar products• Medicine
SIMULATION 115% Tax on:• Non-basic food• Sugar products
Male Female Both None
Headship Occupational status Household composition
Figure 5.7 Simulations: tax incidence on expenditure, Mexico.

Gender analysis of taxation in Mexico 145
products, as is evident in the figures, Figure 5.7 also demonstrates that its distri-bution among household types remains practically unchanged. Female-typehouseholds and those in which women are a majority still pay the lowest amountproportionally, while male-earner and dual-earner households continue to shoul-der a high tax burden. Hence, we cannot conclude, based on these simulations,that this hypothetical increase in VAT would have any effect on the distributionof the tax burden among household types.
On the other hand, if we look at the expenditure incidence by employment status,it seems that most of the increase is borne by the lower quintiles (see Figure 5.8).When the impact is broken down by gender composition, households composed ofa majority of women continue to have the lowest tax burden in all quintiles.
5.0
5.5
6.0
6.5
7.0
7.5
8.0
8.5
9.0
9.5
10.0
10.5
11.0
11.5
12.0
BASE CALCULATIONActual 2006Tax scheme
SIMULATION 315% Tax on:• Non-basic food• Sugar products• Medicine• Basic food
SIMULATION 215% Tax on:• Non-basic food• Sugar products• Medicine
SIMULATION 115% Tax on:• Non-basic food• Sugar products
1 2 3 4 5
Male Female Both None
Figure 5.8 Simulations: tax incidence on expenditure by quintile, Mexico.

146 L.C. Pérez Fragoso and F. Cota González
Finally, it is worth highlighting that even though imposing VAT on non-basicfoods (simulation 1) and medicines (simulation 2) increases the tax burden dis-proportionately on the lower quintiles, households in these quintiles pay an evenhigher share of an indirect tax increase on basic foodstuffs (simulation 3). Thus,these simulations show two things: the incidence of indirect tax is currently quiteprogressive, and increasing the tax rate on basic goods would be a regressive move.
It is important to point out that these calculations were made under the assump-tion that the expenditure patterns of the different households and quintiles wouldnot change as a consequence of the VAT increase. This means that we are under-estimating the behavioural change effect of any tax burden redistribution since itis logical to assume that different households, according to their level of income,will react differently to a tax increase by adapting their patterns of spending.
Just as the tax incidence on expenditure increases when additional products aretaxed, so does tax incidence on income, as we can observe in Figures 5.9 and5.10. Using the household classification, by income generation, the simulationsgenerate an absolute increase in the rate of tax incidence but its distributionamong household types remains practically unchanged. However, the increase inincidence is greater in households where women are the main contributors ofincome than in male-maintained and joint-maintenance households, which havethe lowest incidence among them, as in the baseline.
Conclusion and policy implications
Five general policy recommendations emerge from this analysis:
1 Incorporate a gender perspective in the design of tax policies, both directand indirect taxes. The gendered roles of men and women in society and theunequal distribution of power between them make it necessary to consider thedifferential impact of policies on each, in addition to considering women’scontribution to the economy through non-remunerated domestic work. Forexample, in the simulations carried out, one can see that although the appli-cation of a VAT to all foods and medicines disproportionately burdens thepoorer sectors of society, the incidence is even greater among householdsmaintained by women.
2 Increase research on gender in the economy. The incorporation of a genderperspective in public policies implies carrying out research on the relation-ship between the labour market, spending patterns and the tax system, whileat the same time taking into consideration women’s contribution to the econ-omy through non-remunerated domestic work.
3 Reconsider recent tax reforms that benefit the wealthy. The governmentcould benefit women by increasing the direct tax rate for very wealthy indi-viduals. This would generate funds needed to implement economic andsocial programmes that could mitigate the unequal distribution of income.
4 Extend the VAT. The government could consider increasing revenue throughthe taxation of less socially and politically popular items that are currently

untaxed, such as most non-basic foods. Our analysis of indirect taxes indi-cates that with the current indirect tax system, households in which womenmake up a majority of earners have a higher income incidence. The policysimulations described above show that the current untaxed status of manynon-basic food and sugar items keep VAT revenue roughly 25 per centbelow what it could be. In order to generate revenue and not affect the lower-income population, attention should be given to a targeted tax on the non-essential foods such as specialty meats; lobster and other fresh and processedseafood; fine cheeses and processed snacks. Although the women-maintainedhouseholds with and without dependants would be affected by this increase
Gender analysis of taxation in Mexico 147
5.5
6.0
6.5
7.0
7.5
8.0
8.5
9.0
9.5
Male Female Both None
Headship Occupational status
Household composition Income generation
BASE CALCULATIONActual 2006 Tax scheme
SIMULATION 315% Tax on:• Non-basic food• Sugar products• Medicine• Basic food
SIMULATION 215% Tax on:• Non-basic food• Sugar products• Medicine
SIMULATION 115% Tax on:• Non-basic food• Sugar products
Figure 5.9 Simulations: tax incidence on income, Mexico.

in VAT policy, the best option might be to enact expenditure policies thatbenefit women-maintained households with children.
5 Target government spending. Look for transparent and efficient mechanismsto reach the target population with economic programmes that combatpoverty through the expenditure side of the budget.
In Mexico, the direct tax system, which includes an obligation to pay taxes andthe right to exemptions, is limited to those who earn more than three times theminimum wage. This category excludes 64 per cent of the economically activepopulation and 72 per cent of all women in the labour force, in addition to the vastnumber of women who perform non-remunerated domestic tasks. As long as
148 L.C. Pérez Fragoso and F. Cota González
5.0
6.0
7.0
8.0
9.0
10.0
11.0
12.0
13.0
14.0
15.0
16.0
1 2 3 4 5
BASECALCULATIONActual 2006 Tax scheme
SIMULATION 315% Tax on:• Non-basic food• Sugar products• Medicine• Basic food
SIMULATION 215% Tax on:• Non-basic food• Sugar products• Medicine
SIMULATION 115% Tax on:• Non-basic food• Sugar products
Male Female Both
Figure 5.10 Simulations: tax incidence on income by quintile, Mexico.

women are disadvantaged by the unequal distribution of income and limited gov-ernment ability to generate formal employment, the proportion that would bene-fit from deductions and exemptions for dependants (child rebates) will remainsmall, and among these beneficiaries would be households with high incomes.Therefore, the capacity of the direct tax system to improve gender equality is limited.
Tax incidence analysis and simulations show that the current indirect taxschedule, which includes a zero rate for the basic food basket, has greater bene-fits for lower-income households. However, the higher tax incidence amongfemale-earner households with dependants in every income group should alertpolicy-makers to the need to formulate fiscal policy with a gender perspective.
Given the inability of the direct tax system to have an impact on gender equal-ity and contribute to a more equitable distribution of resources in the economy, aswell as the limited ability of the indirect tax system to achieve these goals, a betterpolicy approach would be to focus on the revenue-generating capacity of directtaxes and rely on government spending policies to promote gender equality. Thechallenge for Mexico is to develop policies that use both revenue generation andgovernment expenditures to improve the distribution of wealth, promote economicgrowth and development and meet the needs of all of its citizens.
Acknowledgements
The Mexico team is grateful to Fausto Hernández-Trillo, Centro de Investigacióny Docencia Económica (CIDE), for his advice and generous assistance through-out the project.
Notes
1 US$1.00 on average = $11.14 Mexican pesos in 2008.2 In 2006, the minimum wage was 48 pesos per day. The average exchange rate was about
11 pesos per dollar. The poverty line (using the $2/day metric) was roughly half theminimum wage. In urban areas, 42.5 per cent of the Mexican population was consideredto be living in poverty.
3 Incidence studies carried out by Hernández Trillo et al. (2001, 2002) point out that per-sonal income that is freed up as a result of buying untaxed goods should be considereda subsidy that increases disposable income, and should be included when measuring taxincidence. This would imply additional calculations that are not considered here.
4 Our simulations assume that the VAT increase does not change expenditure patterns,even though it is likely that households at each income level would alter their spendingpatterns in different ways.
References
Hernández Trillo, F., Guerrero Amparán, J.P. and Zamudio, A. (2002) Los impuestos enMéxico ¿Quién y cómo se pagan?, México: Centro de Investigación y DocenciaEconómicas, Programa de Presupuesto y Gasto Público. Available at: www.presupuestoygastopublico.org/documentos/incidencia_ingreso/Folleto_Impuestos_Mexico.pdf(accessed November 2008).
Gender analysis of taxation in Mexico 149

Hernández Trillo, F., Scott Andreta, J. and Zamudio Carrillo, A. (2001) La ReformaHacendaria Integral: algunos retos, México: Centro de Investigación y DocenciaEconómica Proyecto de Presupuesto. Available at: www.internationalbudget.org/cdrom/papers/tax/CIDE.htm (accessed November 2008).
INEGI (Instituto Nacional de Estadística y Geografía) (2002) Encuesta Nacional sobreUso del Tiempo. Available at: www.inegi.gob.mx (accessed November 2008).
—— (2006) Encuesta Nacional de Ingreso y Gasto de los Hogares. Available at: www.inegi.gob.mx (accessed November 2008).
Secretaria de Hacienda y Credito Publico (SHCP) (2005–2008) Ingreso Presupuestales delSecor Publico. Available at: www.apartados.hacienda.gob.mx/clon_estadisticas/ index.html (accessed April 2010).
Secretaría del Trabajo y Previsión Social (2006) Encuesta Nacional de Ocupación y Empleo2006, México. Available at: www.stps.gob.mx (accessed December 2008).
—— (2008) Estadísticas del Sector, México. Available at: www.stps.gob.mx (accessedDecember 2008).
Servício Administracíon tributario (SAT) (2001) Available at: ftp://ftp2.sat.gob.mx/asistencia_servicio_ftp/publicaciones/legislacion01/tarifasanuales2001.doc.
—— (SAT) (2006) Available at: ftp://ftp 2.sat.gob.mx/ asistencia_servicio_ftp/publiciones/da2006/DA_tt2006.pdf.
Stotsky, J.G. (2005) ‘Sesgos de género en los sistemas fiscales’, Instituto de EstudiosFiscales, Madrid, p. 2. Available at: www.presupuestoygenero.net/media/stotsky.pdf(accessed December 2008).
150 L.C. Pérez Fragoso and F. Cota González

6 An investigation into the genderdimensions of taxation in Ghana
Ernest Aryeetey, Isaac Osei-Akoto, Abena D. Oduro and Robert Darko Osei
Introduction
Recent discussions on mobilizing domestic resources as part of the financing fordevelopment agenda have highlighted the fact that relatively little attention ispaid to gender biases in taxation and the way in which reducing gender dispari-ties in tax liability can help reduce household poverty in developing countries.
This chapter seeks to fill this gap by addressing three questions: (1) do the personalincome tax laws in Ghana ensure formal and substantive equality for women andmen? (2) who bears the burden of indirect taxes in Ghana? and (3) what can be learntabout the gender dimensions of tax burden in Ghana? More specifically, followinga brief summary of the structure of the labour force, it analyses how tax policies andtax reforms are impacting differentially on women and men, and in particular onpoor women. In so doing, it goes beyond the traditional approach to understandinggender, which is typically to group households by headship status. Rather, theapproach is to group households not only by headship but by other characteristicssuch as employment and demographic structure, and to use a richer typology for taxincidence. The chapter then considers the impact of different policy scenarios inGhana for different household types and proposes recommendations for change.
The gendered structure of the labour force
Agriculture has traditionally played an important role in Ghana’s economy. In2006, the sector accounted for approximately 36 per cent of the gross domesticproduct (GDP). Next in importance is the services sector, which accounted for 30per cent of GDP. The share of manufacturing is low and is estimated at 8.8 per centof GDP. Industry has been the fastest-growing sector at 7.3 per cent per annumfollowed by the services sector at 6.5 per cent and agriculture at 5.7 per cent.
In 2005–06, it was estimated that about 67 per cent of women and 71 per centof men aged 15 years and older were in the labour force. About 50 per cent ofemployed women and 55 per cent of employed men aged 15 years and abovewere working in agriculture, which is the single largest sector of the labour force.
About 27 per cent of men and fewer than 10 per cent of women are employedin regular paid work – that is, receiving a salary or wages from an employer. The
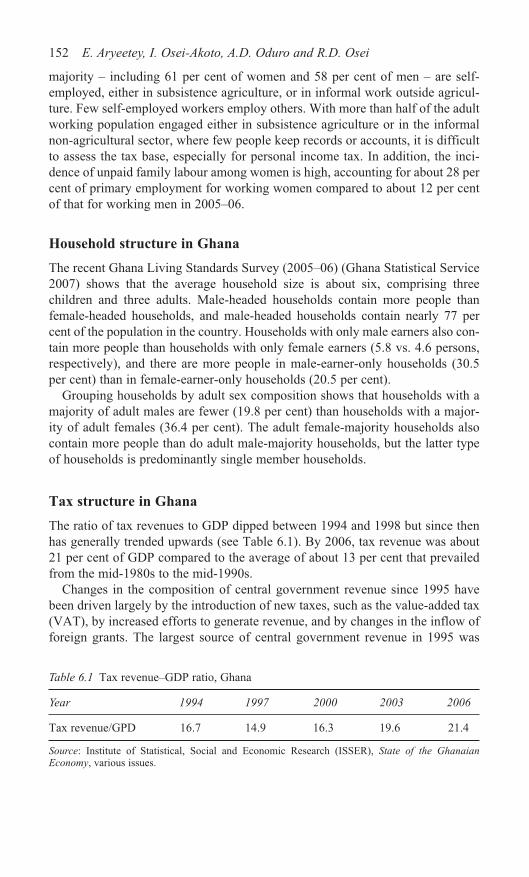
majority – including 61 per cent of women and 58 per cent of men – are self-employed, either in subsistence agriculture, or in informal work outside agricul-ture. Few self-employed workers employ others. With more than half of the adultworking population engaged either in subsistence agriculture or in the informalnon-agricultural sector, where few people keep records or accounts, it is difficultto assess the tax base, especially for personal income tax. In addition, the inci-dence of unpaid family labour among women is high, accounting for about 28 percent of primary employment for working women compared to about 12 per centof that for working men in 2005–06.
Household structure in Ghana
The recent Ghana Living Standards Survey (2005–06) (Ghana Statistical Service2007) shows that the average household size is about six, comprising threechildren and three adults. Male-headed households contain more people thanfemale-headed households, and male-headed households contain nearly 77 percent of the population in the country. Households with only male earners also con-tain more people than households with only female earners (5.8 vs. 4.6 persons,respectively), and there are more people in male-earner-only households (30.5per cent) than in female-earner-only households (20.5 per cent).
Grouping households by adult sex composition shows that households with amajority of adult males are fewer (19.8 per cent) than households with a major-ity of adult females (36.4 per cent). The adult female-majority households alsocontain more people than do adult male-majority households, but the latter typeof households is predominantly single member households.
Tax structure in Ghana
The ratio of tax revenues to GDP dipped between 1994 and 1998 but since thenhas generally trended upwards (see Table 6.1). By 2006, tax revenue was about21 per cent of GDP compared to the average of about 13 per cent that prevailedfrom the mid-1980s to the mid-1990s.
Changes in the composition of central government revenue since 1995 havebeen driven largely by the introduction of new taxes, such as the value-added tax(VAT), by increased efforts to generate revenue, and by changes in the inflow offoreign grants. The largest source of central government revenue in 1995 was
152 E. Aryeetey, I. Osei-Akoto, A.D. Oduro and R.D. Osei
Table 6.1 Tax revenue–GDP ratio, Ghana
Year 1994 1997 2000 2003 2006
Tax revenue/GPD 16.7 14.9 16.3 19.6 21.4
Source: Institute of Statistical, Social and Economic Research (ISSER), State of the GhanaianEconomy, various issues.

international trade taxes, followed by non-tax revenue (comprised of income,fees and foreign assistance). Direct taxes came a distant third, accounting for 15per cent of the total (see Figure 6.1). The share of direct taxes followed a cycli-cal but upwards trend until 2002 when it stood at 31 per cent of the total. In2006, the revenue composition changed, with the largest share coming from non-tax revenue, followed by direct taxes. The contribution of the VAT increasedsignificantly over the period from about 5 per cent to 18 per cent of centralgovernment revenue.
Focusing first on tax revenues, we see that the share of direct taxes in total cen-tral government tax revenue was about 21 per cent in 1994. It peaked at about 33per cent in 2002 and declined to 29 per cent in 2006. As a share of GDP, direct taxeshave risen almost continuously from 3.4 per cent in 1994 to 6.3 per cent in 2006.
The relatively low share of direct taxes in central government tax revenue is inpart due to the large number of unpaid family workers and the large proportionof the workforce employed in agriculture and the informal urban and rural sec-tors. Only about 20 per cent of the adult workforce is in paid (salary or waged)employment and thus likely to fall within the pay-as-you-earn (PAYE) tax net.Tax from self-employment is very low, reflecting the difficulty of taxing theinformal sector.
Tax structure reforms
The Internal Revenue Act 592, adopted in 2000, amended and consolidated thelaws relating to income tax, capital gains tax and the gift tax. In 2002, a number
Gender dimensions of taxation in Ghana 153
0
5
10
15
20
25
30
35
Direct taxes Other indirecttaxes
VAT Internationaltrade taxes
(%)
Sources of revenue
Non-taxrevenue
1995 2000 2006
Figure 6.1 Composition of central government revenue, Ghana.
Source: ISSER, State of the Ghanaian Economy, various issues.

of measures were taken to increase the efficiency and effectiveness of revenuecollection. First, the Revenue Agencies Governing Board was established, taskedwith coordinating the operations of the three revenue-collecting agencies (InternalRevenue Services, VAT Secretariat, and Customs Excise and Preventive Services),monitoring their performance and establishing a system for the exchange of infor-mation between them. The same year, a Non-tax Revenue Unit was establishedin the Ministry of Finance and Economic Planning to coordinate and monitor theactivities of the non-tax revenue agencies. Finally, a system of uniform, computer-based clearing procedures was set up through the Ghana Customs ManagementSystem and the Ghana Community Network, designed to reduce revenue leak-ages and improve efficiency in clearing goods.
Since a small number of entities are responsible for more than 60 per cent ofincome tax revenue and about 90 per cent of VAT, the Large Taxpayers Unit wasestablished in 2003 in an effort to monitor the bulk of tax receipts and to improvethe efficiency of tax collection. The Taxpayers Identification Number Law wasadopted in 2002.
Changes in indirect taxes
A major reform was the replacement of the sales tax with the value-added tax in1995. The initial introduction of the VAT was poorly implemented and was with-drawn three months later. It was re-introduced in 1998 at 10 per cent and increasedto 12.5 per cent in 2002. A new VAT-related levy – the National Health InsuranceLevy – was introduced at 2.5 per cent in August 2004. A Communications ServiceTax (‘talk tax’) was introduced in 2008 to help finance social development pro-grammes, such as the National Youth Employment Programme. The law charges6 per cent of all expenses on the use of communication and related services, ofwhich 20 per cent is devoted to youth employment programmes. To reduce theburden on consumers, some other import taxes were abolished, including thoseon mobile, cellular and satellite phones.
An additional measure to increase revenues was the introduction of theNational Development Levy on top of the usual corporate tax in 2001. This initiallyranged from 7.5 per cent to 10 per cent on company profits, but was reduced to5.5 per cent and 2.5 per cent for some companies and abolished for others in 2006and removed altogether in 2007.
Personal income tax
Income tax is paid by residents and non-residents earning income derived fromor accruing in Ghana and is charged on income received in or brought into Ghana.Individuals file taxes separately, and the tax code does not identify the individualby sex or by marital status. The tax system may be described as marriage neutral.If the income of an individual remains unchanged before and after marriage, thetax paid before marriage will remain the same after the person gets married. Theincome tax law does not explicitly discriminate against women. It can therefore
154 E. Aryeetey, I. Osei-Akoto, A.D. Oduro and R.D. Osei

be concluded that Ghana’s laws with respect to personal income tax pass the testof formal gender equality.
Although traditional norms and practices in some parts of the country maymake it difficult for women to own land and other forms of property, there are nolegal restrictions on their ownership. Property acquired through marriage doesnot automatically become the property of both the husband and wife. The InternalRevenue Act states that in order to ascertain income from a joint investment,inclusions and deductions with respect to the investment must be divided amongthe joint owners in proportion to their respective interests in the investment.
Ghana has adopted a schedular system of income taxation (by which tax ratesvary according to source of income). Personal income from employment andfrom running a business is subject to a graduated set of income tax rates. Incomefrom self-employment is subject to the graduated personal income tax scheduleand not subject to the laws governing corporate tax. Investment income fromdividends is subject to a different tax rate. Rental income either is subject to thegraduated income tax rate schedule once deductions stated in the law have beenapplied, or in the absence of deductions, can be subject to a flat rate.
The income tax schedule is progressive, although rates have been reducedover the period 2000 to 2006 in order to encourage compliance. The tax-freebrackets were raised by 100 per cent between 2000 and 2006, from GH¢120 toGH¢240 (about US$192 and $2481). Between 2000 and 2005, there were a totalof six income brackets, starting from a provision of basic relief provided toall taxpayers irrespective of the size of total income, and moving up to tax ratesof 5, 10, 15, 20 and 30 per cent, respectively (see Table 6.2). The tax rate inthe top bracket was reduced from 30 per cent to 28 per cent in 2005, and to 25per cent in 2006. In 2006, the fourth and fifth income brackets were merged,resulting in a lower tax rate on incomes in the fifth bracket and a higher rateon incomes in the fourth bracket, thus benefiting individuals earning higherincomes. However, taxes on those earning minimum wage were also abolishedin 2006, and those with incomes only marginally above the minimum wagewere charged a rate of only 2.5 per cent to ensure that disposable incomes stayabove the minimum wage.
Personal income tax deductions
Act 592 lists deductions that can be made from business, employment or invest-ment income. Allowable deductions include interest on loans or mortgages, renton land or building occupied by the business, repair and maintenance costs ofequipment and utensils, bad debts, research and development expenditure, capi-tal allowances, foreign exchange losses incurred with respect to business opera-tions and carry-over losses.
Allowable deductions also include contributions to a retirement fund madeeither by the employee or by the employer on behalf of the employee (subject toconditions set out in Section 60(3) of Act 592). The Social Security and NationalInsurance Trust (SSNIT) is the largest pension scheme in the country.2 Although
Gender dimensions of taxation in Ghana 155

Table 6.2 Personal income tax rates, Ghana, 2000–06
2000 2002 2004 2005 2006
Chargeable Rate Chargeable Rate Chargeable Rate Chargeable Rate Chargeable Rateincome (%) income (%) income (%) income (%) income (%)GH¢ GH¢ GH¢ GH¢ GH¢
First 120 Free 120 Free 150 Free 180 Free 240 FreeNext 120 5 120 5 150 5 180 5 240 5Next 300 10 300 10 300 10 480 10 1,200 10Next 1,860 15 1,860 15 2,100 15 2,760 15 .. ..Next 2,400 20 2,400 20 3,300 20 3,600 20 7,920 17.5Exceeding 4,800 30 4,800 30 6,000 30 7,200 28 9,600 25

the proportion of female contributors to the SSNIT scheme rose between 1992and 2006, women account for only 28.6 per cent of the contributors.
Personal relief, that is, reductions in taxable income by stipulated amounts, isprovided on an individual basis. Act 592 provides for relief for taxpayers withdependent spouses or with at least two dependent children. Access to this type ofrelief is open to both men and women who have a dependent spouse and marriedand unmarried people with at least two dependent children. A dependent spouseor child is someone whose income was less than GH¢20 a year until 2007, whenthe income threshold was raised to less than GH¢35 a year. This current levelis low enough to exclude low-income working spouses from the definition ofdependent spouse. This is of not much value to middle- and high-income earnersbut is significant for low-income earners, especially those with incomes close tothe minimum wage threshold. Where reference is made to a spouse, the sex of thespouse is not defined.
The education allowance, which can be claimed for up to three children orwards in registered educational institutions in Ghana, was also increased in 2007,from GH¢24 to GH¢30. This is of particular value to low-income households whosend their children to public schools, which are tuition-free, as it covers a signifi-cant proportion of the direct costs of sending the child to school. Relief for educa-tion expenses is available to either parent/guardian of the child but not to both.
Allowances for dependent relatives 60 years or older are rather low, at GH¢25per person, with a maximum number of two. This relief can be claimed by anyone of the relatives responsible for older dependants. The income of a personaged 60 years and above from employment or business qualifies for old-agerelief. The relief is GH¢35 or the total income if it is the lower of the two.
Section 57 of the Internal Revenue Act allows for life insurance premiums tobe deducted from taxable income before taxes are charged, provided they do notexceed 10 per cent of the assured sum or 10 per cent of the individual’s total tax-able income, whichever is lower.
Tax-exempt income
Exempt income includes interest paid to an individual by a resident financialinstitution, interest paid on bonds issued by the Ghanaian government, capitalsums paid to a person as compensation or a gratuity in relation to personal injuriesor death. Also exempt is interest, dividends or other income of an approved unittrust scheme or mutual fund or interest or dividends paid or credited to a personwho has invested in a venture capital financing company. Scholarships, tuitiongrants, bursary or similar educational awards are exempt, along with income froma tax-exempt retirement funds and proceeds from life insurance.
Finally, the income of some categories of individuals is also exempt from personalincome tax, such as salary, allowances, pension and gratuity of the country’spresident; and the income of a non-resident person from any business thatoperates ships or aircraft so far as an equivalent exemption is proven to begranted by that person’s country of residence to persons resident in Ghana.
Gender dimensions of taxation in Ghana 157

The gender implications of personal income tax
The Ghana personal income tax system does not explicitly disadvantage either sex.Although a larger proportion of men than women are directly affected by theincome tax laws and regulations, this is because men generally tend to earn higherincomes than do women. In the absence of data on the proportion of working menand women who pay income tax, pension contributions can be used as a proxyindicator. Of persons recorded as contributing to the SSNIT, less than 30 per centare women, suggesting that a smaller number of women than men are subject topersonal income tax. By the ability to pay principle, men’s share of taxes shouldbe higher than women’s because they have a higher share of taxable income thando women. Women constitute a large proportion of unpaid family workers (78 percent), the self-employed (60 per cent) and those engaged in informal microenter-prises (57 per cent). Their lower level of education, skills and training, comparedto men, deters entry into formal sector jobs. Norms and practices that disempowerwomen result in their being unpaid family workers and not taxpayers.
One could also evaluate whether there are gender biases that arise in the waythat different sources of income are taxed. In Ghana, the personal income tax sys-tem does not discriminate between wage and salaried workers (mostly men) andown-account workers (mostly women). The lower proportion of women who arewage or salaried workers is not a source of implicit gender bias as income earnedfrom self-employment is subject to the same tax schedule, except when the busi-ness is incorporated.
Another form of gender bias could arise in the way that concessions on incometax are granted. Ghana has allowed concessions on income tax from farming. Thechoice of concessions for specific crops is informed by concerns about food secu-rity (e.g., cassava, maize and rice) as well as the need to promote non-traditionalexports such as pineapple. Concessions to agro-processing fit neatly into theobjective of promoting rural development as well as industrialization. These con-cessions do not formally discriminate against either sex. The wording of the taxcode is such that it covers all categories of crops, regardless of whether they aretree crops or cash crops.
Because taxes are filed by individuals and tax rates do not explicitly discrimi-nate between men and women or on the basis of marital status, the taxes paid bymen and women with the same taxable income will not be different (see Table 6.3on p. 159). The implication of the tax code for total household income dependsnot on how income is divided between the two sexes but on how it is distributedamong all household income-earners and what proportion of income of any indi-vidual member falls in the higher tax brackets. The separate filing of taxes and theforms of personal relief do not discourage second earners among married couples(unlike in some other countries).
However, while there is formal gender equality in the Ghanaian personalincome tax system, there is not always substantive gender equality, as can be seenin the following ways. Income tax brackets are not indexed, and nominal taxbrackets are not always adjusted for inflation. Despite inflation rates of 15 per cent
158 E. Aryeetey, I. Osei-Akoto, A.D. Oduro and R.D. Osei

in 2002 and 23 per cent in 2003, the tax brackets remained unchanged from 2000until 2004, when they were adjusted by 25 per cent. This failure to adjust taxbrackets resulted in an increase in the real value of taxes paid by households, aphenomenon known as fiscal drag. This is particularly burdensome for low-income earners, who find that an increasing proportion of their nominal incomemoves into a higher tax bracket. Estimates based on the 2005–06 household sur-vey show that about 40 per cent of adult working women and 27 per cent of adultworking men who reported earnings were in the tax-free bracket, suggesting thatfailure to adjust tax brackets for inflation results in a larger proportion of womencompared to men being pushed into the higher tax bracket.
Income tax is progressive in Ghana, meaning that households with higherincome must pay more tax. However, households with two earners pay lower taxthan households with only a single earner. For example, a household with twoearners and three children, with a combined yearly income of GH¢650, in whichone worker earns GH¢450 and the second earns GH¢200 per year, will oweGH¢3 in tax, whereas a similar household with the same yearly income but onlyone earner will owe GH¢13.50 (see Table 6.3). The single-earner household istherefore being discriminated against (Smith 2000). Although it might be arguedthat the single-earner household benefits from the unpaid work of the home-maker, this assumes that the single earner has a spouse who provides suchservices. In Ghana, however, where about 34 per cent of single-earner householdsdo not have an adult male and about 44 per cent of single-headed households areheaded by women, the woman is both the earner and the homemaker.Alternatively the unpaid work may be done by a girl child.
Households headed by women constitute the largest proportion of householdsheaded by separated, widowed or divorced individuals. Women heads of house-holds who are divorced, separated or never married have on average more of their
Gender dimensions of taxation in Ghana 159
Table 6.3 Hypothetical annual income and tax paid by household with three children inschool, Ghana
Household income (GH¢) 325.0 650.00 1,300.00Tax paid by household (GH¢): 0.0 16.50 81.50Male earner onlyFemale earner only 0.0 16.50 81.50Male and female earners 0.0 3.00 45.75
Salaried worker Self-employed
Household income (GH¢) 650 650Tax paid by household (GH¢) 13.25 13.25Male earner onlyFemale earner only 13.25 13.25
Note: In a dual-earner household with total earned income of GH¢650, the distribution of income isGH¢450 and GH¢200. In a dual-earner household with total earned income of GH¢1,300, the distributionof income is GH¢825 and GH¢475.

own children aged 18 years or younger living with them than do householdsheaded by men and are therefore more likely to qualify for marriage/responsibil-ity relief for dependent children. This form of relief is currently only GH¢35,about 6 per cent of annual earnings from minimum wage employment. Thus fordivorced, separated or widowed heads of low-income households – the largeshare of whom are women – it is of great value.
The structure and incidence of indirect taxes
This section reviews three main types of indirect taxes: VAT, excise taxes andfuel taxes, and analyses their impact on different households from a gender equal-ity perspective.
Value-added tax
Ghana reintroduced the VAT to replace sales tax in 1998 after an earlier attemptin 1995 was abandoned owing to inadequate institutional capacity and otherimplementation difficulties (Addison and Osei 2001). In Ghana as elsewhere,VAT is consumption-based, uses the invoice credit method, and the tax is col-lected on a destination basis.
The VAT rate started at 10 per cent but was raised to 12.5 per cent in 1999 withthe additional 2.5 per cent saved in a separate account (Ghana Education TrustFund or GETFund) for the use of capital investment in the educational sector. In2004, an additional 2.5 per cent was introduced to fund the National HealthInsurance Scheme, which was introduced in the previous year. In 2007, an attemptto widen the tax base and improve collection led to the introduction of a differentsystem (presumptive tax), mainly for small retailers, using a flat rate of 3 per cent.The VAT rates used to compute tax burden in this study exclude the 2007 changeas the expenditure data used for this study are from 2005 to 2006.
Goods and services under VAT are taxed differently; some are taxed at almostfull rates while other items entail no retail taxation. Items that attract zero taxrates under VAT are exports of taxable goods and services, goods shipped instorage by sea or air, locally produced textbooks and exercise books and locallymanufactured agricultural machinery and implements. These items attract nopayments from individuals.
Certain goods and services are exempt from VAT. Exempt goods differ fromzero-rated goods in that the former are exempted only at the final stage in thevalue chain. These items include live animals and edible animal products such asmeat and offal, goods for the disabled, educational items and services, medicalsupplies and financial services like the provision of insurance. Others are water,which excludes distilled and bottled; electricity supply up to a specified con-sumption level prescribed in regulations by the minister responsible for energy;and printed matter such as books and newspapers and postal services. It is worthnoting that all items exempted from VAT are also exempted from the NationalHealth Insurance Levy (NHIL).
160 E. Aryeetey, I. Osei-Akoto, A.D. Oduro and R.D. Osei

Since the application of the VAT system uses the destination principle, importsare taxed in the same way as domestically produced goods. We therefore appliedthe full VAT rate to imported food items and to domestic goods which have sig-nificant competing imports in the domestic market. Other zero-rated and exemptitems attracted zero VAT rate in the analysis.
Excise and fuel taxes
Excise taxes are applied to certain commodities, including tobacco products, beer,table waters, malt drinks and spirits. Since 2007, calculation of excise duty rates hasbeen based on the units or quantity and on branding. Other criteria include factorssuch as percentage of alcoholic content, volumetric measure in a litre, and numericmeasure by number of sticks for cigarettes (tobacco products). However, at the timeof the survey in 2005–06, excise taxes were collected mainly on specific ad valorembases (see Table 6.4) as explained below. All alcoholic beverages and tobacco prod-ucts are also subject to a VAT rate of 12.5 per cent and a NHIL rate of 2.5 per cent.
Even though petroleum products are exempt from VAT, Ghana levies anumber of taxes on petroleum products in addition to the 15 per cent ad valoremexcise duties on ex-refinery current prices that were reintroduced in 2006 (seeTable 6.5). The fuel taxes are collected from oil marketing companies, which pass
Gender dimensions of taxation in Ghana 161
Table 6.4 Excise tax rates, Ghana
Item Rate (%)
Beer 50Spirits and wine 25Akpeteshie (local distilled gin) 20Mineral or aerated water 20Malt 5Tobacco 140
Table 6.5 Tax as a percentage of ex-pump price, Ghana, January 2006
Type Excise Fuel levies Total fuel tax
Premium 7.2 33.9 41.1Kerosene 10.0 5.5 15.5Gasoil 9.1 18.4 27.5Premix 9.1 15.8 24.9LPG 12.3 −21.3 −9.0
Source: Calculations are based on National Petroleum Authority data for January 2006.
Note: The ex-refinery prices, which are essentially the cost, insurance and freight (cif) at world prices,attract the ad valorem excise duties of 15 per cent. The different taxes and levies approved by law areadded to the ex-refinery prices to get the ex-depot prices. Adding the margins for transporters, deal-ers and marketers to the ex-depot prices gives us the ex-pump prices, which are therefore the pricescharged at the pumps.

them on to the final consumer. Expressed as a proportion of ex-pump prices, thetotal indirect levies involved translate to about 9.1 per cent and 18.4 per centrespectively for excise tax and other fuel levies for diesel (gasoil). The corre-sponding rates for other products are also presented in Table 6.5.
Transportation by public transport is VAT-exempt. However, we looked at taxincidence for the use of public transport because of the levels of fuel levies thatare passed on to households. Osei-Akoto et al. (2009) estimate an excise tax rateof 5.1 per cent and other fuel levies at a rate of 16.5 per cent.
Gender and incidence of indirect taxes
The analysis of incidence of indirect taxes relates VAT, excise taxes and fuellevies to total household expenditures, using expenditure data from the GhanaLiving Standards Survey (GLSS 5), tax rate data from the Ministry of Financeand Economic Planning and additional tax data from the Valued-Added TaxService (VAT), Internal Revenue Service (IRS) and Customs, Excise andPreventive Service (CEPS) (see Osei-Akoto et al. 2009, for details on themethodology).
The distribution of total indirect taxes by type of household suggests that rela-tively more female-type households pay lower indirect taxes than do male-typehouseholds. Since Ghana does not have differential indirect tax rates for womenand men and also has no specific exemptions for female-specific expenditureitems, it could be inferred that the social dimensions of indirect tax incidencereally depend on the mix of consumer items families choose. The followinganalysis further tries to isolate commodities that potentially lead to such differ-ences in the burden of indirect taxes.
A total of 8,637 households – 5,048 rural and 3,589 urban – of the 8,687 sur-veyed purchased at least one of the items reported in GLSS 5. For a number ofthe items, urban households reported a higher proportion of expenditures thanrural households except on alcohol, tobacco, household fuel and medical care.The proportion of households reporting expenditures on clothing and footwear;housing, water and electricity; and house furnishing, equipment and routinemaintenance are almost equally high for all male and for all female householdtypes. However, more male-headed households (11.7 per cent) than female-headed households (1.6 per cent) reported expenditures on tobacco as well as onalcoholic beverages (42.9 per cent and 18.7 per cent, respectively).
Incidence of indirect taxes by type of household
The results show that on average, households in Ghana lay out about 7.3 per centof total expenses on indirect taxes. The tax incidence of VAT is higher than it isfor excise duties and taxes on fuel. The overall incidence is higher for male-typehouseholds as compared to female-type households (see Table 6.6). The story issimilar for all the components of taxes shown in Table 6.6, underlining the factthat, in general, Ghanaian households with a high concentration of males (as main
162 E. Aryeetey, I. Osei-Akoto, A.D. Oduro and R.D. Osei

Gender dimensions of taxation in Ghana 163
Table 6.6 Overall indirect tax incidence by household type, Ghana (as % of expenditure)
Total tax VAT Excise tax Fuel tax Number of households
HeadshipMale-headed 7.57 5.66 0.98 0.94 6,224Female-headed 6.68 5.40 0.66 0.62 2,412Employment categoriesMale-breadwinner 7.85 5.80 1.10 0.95 2,902Female-breadwinner 6.79 5.45 0.70 0.65 1,935Dual-earner 7.37 5.57 0.85 0.97 2,257None employed 6.95 5.42 0.91 0.64 1,542Household sex compositionMale-majority 7.81 5.83 1.09 0.90 2,242Female-majority 6.88 5.45 0.72 0.72 3,033Equal number of females 7.47 5.59 0.94 0.95 3,361and malesAll groups 7.34 5.60 0.90 0.86 8,636
Source: Calculations based on data from GLSS 2005–06.
income earners, as heads of families or those with more adult males than adultfemales) bear a higher burden of taxes.
The incidence of total indirect tax is higher for male-type households withoutchildren than it is for male-type households with children for all types of taxesconsidered (see Table 6.7). The same pattern of differences is also seen for house-holds that have both employed males and employed females or have an equalnumber of adult males and females. The richest female-type households with nochildren have higher incidence rates than the richest female-type households withchildren, while the reverse is the case for the poorest female-type households.
The results show that total indirect taxes are generally proportional for male-breadwinner households, with the exception of the 3rd quintile for male-breadwinnerhouseholds with children, which tend to have lower total indirect tax incidencethan the others. On the other hand, total indirect tax incidence among female-breadwinner households (with or without children) is higher for those in quintiles5 and 1 (for households with children) and 2 (for households without children),in other words, both the richest and poorest households.
Excise taxes are generally regressive for male-breadwinner households, irre-spective of whether or not they have children, except for those without childrenin quintile 2. This is not surprising, since as noted earlier, male-type householdsare likely to spend more on goods such as alcoholic beverages and tobacco.Incidence rates for fuel taxes for this group are generally progressive, meaningthat richer male-breadwinner households have higher incidence rates than dopoorer ones.
The pattern for female-breadwinner households is not consistent for differentlevels of expenditures. Excise taxes for female-breadwinner households with

Table 6.7 Tax incidence, by employment status, presence of children and quintile, Ghana
Quintile Total tax VAT Excise tax Fuel tax No. of HHs Quintile Total tax VAT Excise tax Fuel tax No. of HHs
Male-breadwinner with children Male-breadwinner without children1 7.68 5.44 1.45 0.78 477 1 8.52 5.33 2.50 0.69 282 7.62 5.68 1.13 0.82 425 2 7.42 5.59 1.33 0.50 503 7.16 5.62 0.86 0.69 332 3 8.18 5.76 1.64 0.78 1194 7.20 5.84 0.79 0.57 267 4 8.07 5.99 1.35 0.73 2115 7.58 5.33 0.91 1.34 216 5 8.62 6.27 1.34 1.02 777Total 7.43 5.56 0.95 0.93 1717 Total 8.54 6.21 1.35 0.98 1185
Female-breadwinner with children Female-breadwinner without children1 6.65 5.32 0.79 0.54 119 1 6.17 4.52 1.23 0.41 72 6.29 5.07 0.64 0.58 254 2 7.76 5.60 0.96 1.20 213 6.19 5.08 0.55 0.57 325 3 5.88 4.76 0.67 0.45 654 6.38 5.10 0.62 0.67 366 4 6.77 5.19 0.72 0.87 1095 6.95 5.67 0.67 0.61 316 5 7.65 5.95 0.96 0.74 353Total 6.59 5.35 0.63 0.62 1380 Total 7.47 5.80 0.92 0.75 555
Dual-employed with children Dual-employed without children1 8.51 6.06 1.59 0.86 296 1 6.01 4.62 0.84 0.56 62 7.34 5.67 0.98 0.69 390 2 8.18 6.04 1.49 0.64 253 7.13 5.48 0.86 0.80 420 3 8.29 5.99 1.55 0.76 334 6.61 5.30 0.67 0.64 466 4 7.09 5.47 0.87 0.75 715 7.63 5.63 0.81 1.20 416 5 8.22 5.82 1.02 1.41 134 Total 7.30 5.54 0.83 0.94 1988 Total 8.00 5.77 1.03 1.23 269
No-employed with children No-employed without children1 7.53 5.18 1.55 0.80 468 1 7.06 5.17 1.46 0.44 432 6.99 5.41 0.95 0.64 173 2 5.99 4.5 1.13 0.36 693 6.5 5.21 0.71 0.63 120 3 6.41 5.31 0.72 0.38 794 6.31 5.12 0.57 0.62 88 4 6.88 5.39 0.98 0.52 1175 6.57 5.21 0.87 0.50 86 5 7.44 5.81 0.90 0.73 299Total 6.72 5.22 0.90 0.61 935 Total 7.27 5.69 0.91 0.67 607
Source: Calculations based on data from GLSS 2005–06.

children are generally regressive but incidence rates for female-breadwinnerhouseholds without children are generally proportional, with statistically significantlower rates for the 3rd and 4th quintiles (ibid.). Fuel taxes for female-breadwinnerhouseholds (with or without children) are also generally progressive, with somedegree of proportionality for the 1st and 3rd quintiles.
The amount of VAT paid generally rises with income for all sex-specificemployment groups of households, except for male-breadwinner households,which were found to be U-shaped, meaning that the middle-expenditure quintileshave lower VAT incidence rates than the others.
Incidence on selected commodity groups by type of household andexpenditure quintile
Tables 6.8 and 6.9 on pp. 166–70 show the tax incidence for selected commoditygroups. Commodity groups with relatively high tax incidence rates, which also depictinteresting and clear differences among female-type and male-type households,have been selected to illustrate gender differences in the burden of taxes that house-holds face. A review of these differences will enable us to look at policy consider-ations involved in changing the tax rates associated with these commodity groups.
Tax burden on fuel for transport and fuel for household use
Figure 6.2 shows that male-type households generally bear a higher burden oftaxes on fuel for transport. Fuel taxes on female-type households are largely borneby the richer quintiles. In general, the incidence of tax on fuel for transport appearsto fall largely on the middle and the richest households relative to the poorest-expenditure quintiles, and is highest for the middle male-majority households thatoperate private vehicles. The petroleum pricing policy assumes that people withprivate cars, in general, are richer than other people, so they can afford cross-subsidies embedded in premium fuel, which is the most popular fuel for privatecars. This constitutes a heavy burden on non-target households which operate pri-vate vehicles, however, and efforts should be made to address this inequity.
Figure 6.3 shows that the incidence of taxes on fuel for household use isperfectly regressive, indicating that poorer households spend relatively higherproportions of their income on household fuel than do richer households, acrossall household groups. These results are consistent with those of a study on taxincidence in Ghana in the 1990s (Younger 1996). The regressive nature of thekerosene tax is largely due to the use of kerosene in poor households, in bothurban and rural areas. Estimated tax incidence for household fuel is relatively lowcompared to other taxes but due to the highly regressive nature of this tax, policyreforms to minimize or completely remove its burden will impact quite stronglyon the extreme poor, the majority of which are female.
Tax burden on clothing and footwear
Tax incidence rates for clothing in general are higher for male-type households,in particular for male-earner households, than for female-type households (see
Gender dimensions of taxation in Ghana 165

Table 6.8 Tax incidence for main commodity groups by employment status and quintile (%), Ghana
Category Male-breadwinner household Female-breadwinner household Dual-earner household No-employed household
1 2 3 4 5 Total 1 2 3 4 5 Total 1 2 3 4 5 Total 1 2 3 4 5 Total
Food subtotal 1.90 2.08 2.27 2.19 1.91 2.02 2.36 2.31 2.30 2.41 2.40 2.38 1.93 2.31 2.21 2.27 1.95 2.09 1.75 2.07 2.38 2.27 2.26 2.21Basic 0.97 1.15 1.15 1.02 0.76 0.90 1.35 1.29 1.19 1.14 1.01 1.09 0.91 1.04 1.06 1.03 0.80 0.92 0.79 0.97 1.16 1.10 0.99 1.01unprocessed foodBasic 0.47 0.54 0.62 0.71 0.65 0.64 0.60 0.60 0.62 0.69 0.79 0.73 0.50 0.77 0.63 0.67 0.63 0.65 0.53 0.57 0.67 0.69 0.76 0.70processed foodSugar/ 0.26 0.18 0.16 0.14 0.16 0.17 0.18 0.14 0.15 0.15 0.16 0.16 0.21 0.17 0.15 0.14 0.13 0.14 0.25 0.18 0.17 0.15 0.17 0.17ConfectioneryOther HH 0.57 0.44 0.52 0.46 0.50 0.49 0.69 0.51 0.50 0.52 0.48 0.50 0.60 0.52 0.48 0.48 0.41 0.45 0.49 0.59 0.60 0.53 0.49 0.52food items
Meals out 0.24 0.24 0.33 0.39 0.63 0.50 0.27 0.35 0.37 0.33 0.30 0.32 0.29 0.21 0.30 0.25 0.22 0.24 0.37 0.36 0.51 0.61 0.62 0.57Non-alcoholic 0.26 0.25 0.30 0.38 0.55 0.47 0.19 0.23 0.27 0.37 0.55 0.46 0.21 0.28 0.31 0.37 0.45 0.40 0.29 0.24 0.31 0.39 0.60 0.49beveragesAlcoholic 0.89 1.12 1.03 1.03 1.28 1.17 0.46 0.71 0.66 0.65 0.83 0.76 1.19 1.03 0.76 0.69 0.59 0.70 0.91 0.87 0.73 1.03 1.36 1.09beverages
Beer 0.67 0.86 0.92 0.61 1.12 1.05 0.73 0.96 0.79 0.85 0.88 0.87 1.64 1.37 0.67 0.69 0.64 0.68 0.00 0.75 0.46 0.74 1.16 1.05Spirits 1.29 1.20 1.04 1.13 0.93 1.04 0.89 0.78 0.61 0.49 0.51 0.54 1.56 0.91 0.69 0.58 0.43 0.65 1.40 1.18 0.89 1.03 1.08 1.12Wine 0.15 0.08 0.00 0.00 0.06 0.00 0.14 0.09 0.00 0.00 0.00 0.01 0.10 0.05 0.00 0.00 0.00 0.00 0.22 0.05
Tobacco 2.43 2.12 1.74 2.78 2.81 2.42 1.44 1.70 1.38 1.03 1.12 1.17 2.55 1.80 2.01 0.95 1.03 1.54 2.28 1.91 2.28 2.43 1.17 1.84

Table 6.8 (continued) Tax incidence for main commodity groups by employment status and quintile (%), Ghana
Category Male-breadwinner household Female-breadwinner household Dual-earner household No-employed household
1 2 3 4 5 Total 1 2 3 4 5 Total 1 2 3 4 5 Total 1 2 3 4 5 Total
Clothing and 1.40 1.41 1.17 1.17 0.93 1.07 1.20 1.06 1.01 0.97 0.97 0.99 1.43 1.28 1.22 1.03 0.98 1.07 1.22 1.14 0.99 0.94 0.85 0.95footwear subtotalClothes and 1.09 1.09 0.90 0.94 0.83 0.90 0.78 0.75 0.72 0.74 0.82 0.78 1.09 0.98 0.94 0.80 0.81 0.85 0.93 0.87 0.80 0.79 0.77 0.80footwear – Adults Clothes and 0.34 0.34 0.30 0.29 0.19 0.26 0.45 0.34 0.33 0.27 0.22 0.27 0.36 0.33 0.29 0.25 0.20 0.24 0.33 0.31 0.25 0.25 0.22 0.26footwear – ChildrenHousing, 0.20 0.23 0.33 0.27 0.27 0.27 0.16 0.18 0.16 0.13 0.31 0.23 0.20 0.22 0.26 0.25 0.29 0.27 0.40 0.28 0.20 0.22 0.25 0.25water, electricity, gas, sub total
Housing 0.04 0.03 0.03 0.04 0.04 0.04 0.02 0.04 0.03 0.04 0.03 0.03 0.04 0.03 0.04 0.04 0.04 0.04 0.03 0.03 0.04 0.05 0.05 0.05utilitiesHousing 0.19 0.23 0.34 0.27 0.28 0.28 0.18 0.19 0.17 0.12 0.31 0.24 0.20 0.23 0.26 0.25 0.28 0.27 0.43 0.30 0.22 0.23 0.27 0.27general
Fuel for 1.06 0.68 0.49 0.33 0.29 0.40 0.91 0.64 0.51 0.38 0.20 0.33 0.97 0.62 0.46 0.25 0.11 0.27 0.94 0.71 0.53 0.44 0.23 0.43HH useFurniture, HH 0.25 0.25 0.24 0.27 0.28 0.27 0.22 0.23 0.26 0.22 0.28 0.26 0.25 0.24 0.26 0.24 0.23 0.24 0.24 0.27 0.24 0.23 0.26 0.25Equipment andMaintenanceDomestic and 0.08 0.54 0.53 0.00 0.00 0.00 0.03 0.77 0.75 0.00 2.04 0.02 0.28 0.42 0.41 0.00 0.00 0.00 0.00 0.25 0.25household servicesMedical 0.00 0.00 0.00 0.00 0.00 0.00 0.00 0.00 0.00 0.00 0.00 0.00 0.00 0.00 0.00 0.00 0.00 0.00 0.00 0.00 0.00 0.00 0.00 0.00expenditure
(Continued)

Table 6.8 (Continued) Tax incidence for main commodity groups by employment status and quintile (%), Ghana
Category Male-breadwinner household Female-breadwinner household Dual-earner household No-employed household
1 2 3 4 5 Total 1 2 3 4 5 Total 1 2 3 4 5 Total 1 2 3 4 5 Total
Transportation 0.78 0.89 0.79 0.91 0.96 0.92 0.72 0.77 0.69 0.81 0.76 0.77 0.63 0.75 0.75 0.86 0.88 0.84 0.68 0.89 0.72 0.79 0.89 0.84subtotal
Transport – 0.87 0.93 0.79 0.81 0.84 0.83 0.96 0.79 0.70 0.81 0.76 0.77 0.79 0.78 0.77 0.80 0.64 0.71 0.83 0.80 0.73 0.80 0.89 0.85collectiveTransport – 0.39 0.26 0.18 0.62 0.68 0.57 0.21 0.28 0.09 0.14 0.30 0.27 0.35 0.24 0.17 0.50 0.77 0.64 0.40 0.58 0.25 0.15 0.32 0.35private
Fuel for 1.65 1.95 2.01 1.62 3.20 2.74 0.00 1.06 0.23 1.43 1.67 1.63 3.87 2.33 3.08 1.25 2.81 2.72 3.99 3.14 4.73 2.97 2.00 2.64transportCommunication 0.20 0.21 0.20 0.33 0.56 0.47 0.12 0.15 0.19 0.23 0.41 0.34 0.17 0.23 0.19 0.26 0.38 0.32 0.16 0.12 0.19 0.22 0.50 0.42Recreation 0.59 0.56 0.58 0.49 0.48 0.51 0.57 0.45 0.38 0.38 0.42 0.41 1.01 0.56 0.53 0.41 0.51 0.51 0.56 0.45 0.45 0.38 0.34 0.39Education 0.00 0.00 0.00 0.00 0.00 0.00 0.00 0.00 0.00 0.00 0.00 0.00 0.00 0.00 0.00 0.00 0.00 0.00 0.00 0.00 0.00 0.00 0.00 0.00Personal 0.54 0.45 0.37 0.31 0.25 0.31 0.55 0.41 0.37 0.31 0.24 0.29 0.57 0.41 0.34 0.27 0.19 0.27 0.62 0.46 0.38 0.35 0.30 0.36care subtotalMiscellaneous 0.16 0.18 0.12 0.24 0.23 0.21 0.14 0.10 0.09 0.11 0.15 0.13 0.12 0.20 0.13 0.13 0.33 0.23 0.09 0.16 0.10 0.11 0.12 0.12TOTAL 6.39 6.17 5.69 5.73 6.60 6.28 5.09 4.95 4.67 4.87 5.34 5.10 7.10 5.65 5.62 4.95 6.05 5.72 6.18 5.37 5.07 5.08 5.52 5.43Number of 711 628 543 460 562 2903 156 357 447 512 464 1935 373 444 474 514 452 2257 585 300 233 182 243 1542HHs in quintile

Table 6.9 Tax incidence for main commodity groups by HH adult sex composition and quintile (%), Ghana
Category Male-majority household Female-majority household Household with equal number of males & females
1 2 3 4 5 Total 1 2 3 4 5 Total 1 2 3 4 5 Total
Food subtotal 1.87 2.31 2.19 2.14 1.98 2.07 1.96 2.15 2.3 2.36 2.15 2.21 1.93 2.13 2.32 2.38 2.08 2.18Basic – 0.93 1.12 1.08 0.99 0.78 0.90 0.96 1.11 1.14 1.09 0.91 1.00 0.96 1.12 1.18 1.12 0.85 0.98unprocessed foodBasic – processed 0.49 0.76 0.62 0.64 0.68 0.66 0.52 0.57 0.64 0.71 0.69 0.67 0.50 0.57 0.63 0.73 0.67 0.66foodSugar/ 0.24 0.17 0.15 0.14 0.16 0.16 0.21 0.17 0.15 0.15 0.15 0.15 0.27 0.16 0.17 0.14 0.14 0.15ConfectioneryOther HH 0.54 0.48 0.48 0.48 0.48 0.49 0.61 0.51 0.50 0.49 0.44 0.47 0.54 0.52 0.55 0.50 0.47 0.49food items
Meals out 0.34 0.29 0.36 0.39 0.65 0.51 0.22 0.26 0.35 0.27 0.24 0.27 0.29 0.25 0.30 0.34 0.27 0.29Non-alcoholic 0.23 0.26 0.30 0.35 0.59 0.48 0.25 0.27 0.30 0.37 0.50 0.43 0.27 0.20 0.30 0.40 0.45 0.41beveragesAlcoholic 1.06 1.07 0.88 0.88 1.24 1.10 0.96 0.97 0.81 0.65 0.66 0.73 0.84 0.97 0.83 0.95 0.79 0.84beverages
Alcoholic – Beer 1.08 1.21 0.77 0.66 1.05 0.98 0.49 1.16 0.78 0.74 0.72 0.75 0.61 0.71 0.69 0.74 0.84 0.81Alcoholic – Spirits 1.54 1.07 0.89 0.89 0.91 0.96 1.36 0.95 0.74 0.53 0.46 0.67 1.23 1.15 0.83 1.01 0.58 0.80Alcoholic – Wine 0.00 0.00 0.00 0.02 0.15 0.07 0.00 0.00 0.01 0.00 0.09 0.04 0.00 0.00 0.00 0.00 0.14 0.09
Tobacco 2.62 1.92 1.71 1.57 2.15 2.04 2.35 1.56 1.92 0.92 0.80 1.42 1.76 2.87 2.36 2.48 2.15 2.34Clothing and footwear subtotal 1.45 1.25 1.14 1.06 0.97 1.06 1.33 1.27 1.15 1.03 0.93 1.02 1.21 1.28 1.12 1.05 0.97 1.04Clothes and 1.11 0.96 0.89 0.84 0.85 0.88 1.01 0.95 0.85 0.79 0.77 0.81 0.90 0.98 0.86 0.85 0.85 0.86footwear – AdultsClothes and 0.36 0.32 0.28 0.26 0.20 0.25 0.35 0.34 0.32 0.27 0.21 0.26 0.34 0.33 0.29 0.25 0.20 0.24footwear – ChildrenHousing, water, 0.21 0.21 0.31 0.23 0.35 0.30 0.21 0.25 0.19 0.23 0.26 0.24 0.31 0.18 0.26 0.19 0.24 0.23electricity, gas subtotal
Housing utilities 0.04 0.03 0.03 0.04 0.04 0.04 0.04 0.03 0.03 0.04 0.04 0.04 0.02 0.03 0.04 0.04 0.03 0.03Housing general 0.21 0.22 0.33 0.24 0.37 0.32 0.21 0.26 0.20 0.23 0.24 0.24 0.33 0.18 0.27 0.18 0.24 0.23
(Continued)

Table 6.9 (Continued) Tax incidence for main commodity groups by HH adult sex composition and quintile (%), Ghana
Category Male-majority household Female-majority household Households with equal number of males & females
1 2 3 4 5 Total 1 2 3 4 5 Total 1 2 3 4 5 Total
Fuel for HH use 1.00 0.62 0.50 0.28 0.27 0.37 0.98 0.62 0.45 0.31 0.16 0.30 1.03 0.81 0.55 0.40 0.15 0.34Furniture, HH Equipment and Maintenance 0.24 0.25 0.25 0.25 0.29 0.27 0.25 0.24 0.26 0.24 0.24 0.24 0.23 0.25 0.25 0.23 0.25 0.25Domestic and household services 0.11 0.00 0.00 0.32 0.32 0.30 0.01 0.00 0.20 0.00 0.41 0.41 0.25 2.04 0.00 0.10 0.69 0.68Medical expenditure 0.00 0.00 0.00 0.00 0.01 0.00 0.00 0.00 0.00 0.00 0.00 0.00 0.00 0.00 0.00 0.00 0.00 0.00Transportation subtotal 0.64 0.82 0.77 0.85 0.93 0.88 0.7 0.77 0.69 0.85 0.82 0.8 0.87 0.9 0.8 0.88 0.91 0.89Transport – collective 0.75 0.86 0.79 0.80 0.88 0.85 0.85 0.77 0.70 0.79 0.66 0.71 1.07 0.95 0.81 0.87 0.70 0.77Transport – private 0.36 0.28 0.19 0.48 0.48 0.42 0.36 0.35 0.17 0.54 0.76 0.63 0.42 0.28 0.17 0.35 0.83 0.67Fuel for transport 1.63 2.84 3.67 1.69 2.75 2.63 1.29 1.31 2.02 1.32 2.88 2.68 1.58 2.57 1.17 1.10 2.61 2.48Communication 0.22 0.17 0.20 0.28 0.55 0.44 0.16 0.23 0.19 0.25 0.38 0.33 0.13 0.21 0.19 0.26 0.42 0.36Recreation 0.78 0.48 0.54 0.44 0.45 0.47 0.71 0.57 0.47 0.42 0.51 0.50 0.64 0.55 0.52 0.39 0.42 0.44Education 0.00 0.00 0.00 0.00 0.00 0.00 0.00 0.00 0.00 0.00 0.00 0.00 0.00 0.00 0.00 0.00 0.00 0.00Personal care subtotal 0.55 0.43 0.35 0.29 0.25 0.30 0.59 0.43 0.36 0.30 0.22 0.29 0.52 0.42 0.37 0.30 0.22 0.29Miscellaneous 0.13 0.15 0.11 0.16 0.24 0.19 0.11 0.17 0.12 0.15 0.21 0.18 0.20 0.20 0.12 0.13 0.28 0.21TOTAL 6.64 5.70 5.53 5.23 6.57 6.07 6.46 5.50 5.18 4.99 5.60 5.43 6.01 5.94 5.50 5.26 5.83 5.67Number of HHs in quintile 741 733 682 651 679 3,485 688 691 680 728 708 3,495 277 306 370 355 348 1,657

0.0
0.5
1.0
1.5
2.0
2.5
3.0
3.5
4.0
4.5
2nd Quintile 3rd Quintile 4th Quintile 5th Quintile
Inci
den
ce (
%)
1st Quintile
Male majority Female majority
Male earner Female earner
Figure 6.2 Incidence of indirect tax on fuel for transport by household type andexpenditure quintile (%), Ghana.
2nd Quintile 3rd Quintile 4th Quintile 5th Quintile
Inci
den
ce (
%)
1st Quintile0.1
0.3
0.5
0.7
0.9
1.1
1.3
1.5
Male majority Female majority
Male earner Female earner
Figure 6.3 Incidence of indirect tax on household fuel by household type and expenditurequintile (%), Ghana.

Figure 6.4). The rates for children’s clothes are the same for most households,except the poorest female-earner households, which bear the highest burden oftaxes on children’s clothing and footwear. Policy change in this area will impactthese households more positively than the others.
Tax burden on tobacco, alcoholic beverages and communication
With the exception of male-earner households, the incidence of taxes on tobaccoproducts generally falls on poorer households. It can also be seen in Figure 6.5that tobacco tax incidence for a male-type household is significantly higher thanthe incidence for a female-type household. With respect to the tax burden of alco-holic beverages for households, Figure 6.6 shows that the incidence tends to begenerally higher for the households in the richest quintiles, except for householdsthat have more adult females than adult males, for which the tax incidence tendsto be higher for the poorest households and lower for the richest.
Simulations: shifting tax rates for selected commodity groups
In light of the results discussed above, the following analysis considers variouspolicy reforms designed to reduce the burden of indirect taxes on the poor andfemale-type households identified in the preceding section that bear a relativelyhigh incidence, as well as experiments to increase taxes on goods consumed
172 E. Aryeetey, I. Osei-Akoto, A.D. Oduro and R.D. Osei
2nd Quintile 3rd Quintile 4th Quintile 5th Quintile
Inci
den
ce (
%)
1st Quintile
Male majority Female majority
Male earner Female earner
0.0
0.1
0.2
0.3
0.4
0.5
0.6
0.7
0.8
0.9
1.0
Figure 6.4 Incidence of indirect tax on clothing and footwear by household type andexpenditure quintile (%), Ghana.

0.2
0.6
1.0
1.4
1.8
2.2
2.6
3.0
2nd Quintile 3rd Quintile 4th Quintile 5th Quintile
Inci
den
ce (
%)
1st Quintile
Male majority Female majority
Male earner Female earner
Figure 6.5 Incidence of indirect tax on tobacco by household type and expenditurequintile (%), Ghana.
2nd Quintile 3rd Quintile 4th Quintile 5th Quintile
Inci
den
ce (
%)
1st Quintile
Male majority Female majority
Male earner Female earner
0.2
0.4
0.6
0.8
1.0
1.2
1.4
Figure 6.6 Incidence of indirect tax on alcoholic beverages by household type andexpenditure quintile (%), Ghana.

primarily by higher-income and male-type households so as to offset potentialrevenue declines. We simulate two policy options for reducing the tax burden onpoor and female-type households: (1) complete removal of VAT on children’sclothes and footwear; and (2) a 50 per cent reduction in kerosene tax rates.
The analysis also evaluates the possibility of raising resources from tax revenueto finance these tax cuts. One obvious set of candidates for policy reforms to raiserevenue is tobacco and alcohol products, both because of the ‘negative’ externali-ties they produce, in terms of their adverse health and environmental effects, andthe fact that male-type households will pay disproportionately more. There is astrong case in public finance theory for taxing demerit goods at a higher rate thanmerit goods. The idea is appealing, especially if excise tax increases on these com-modities could be used to offset tax cuts on commodities (merit goods) that areconsumed more by female-type households than male-type households.
However, in Ghana, the tax incidence for these consumption items is higherfor poor and for some female-type households than it is for other households.Moreover, the nature of household gender inequality could defeat the purpose ofthis kind of policy reform, because men who have strong control of householdresources could reduce consumption of essential commodities in order to financepurchase of these demerit goods, a shift that could reduce household welfare.Although this analysis could not consider the intra-household impacts of taxreform, this is an important area for further study.
174 E. Aryeetey, I. Osei-Akoto, A.D. Oduro and R.D. Osei
2nd Quintile 3rd Quintile 4th Quintile 5th Quintile
Inci
den
ce (
%)
1st Quintile
Male majority Female majority
Male earner Female earner
0.0
0.1
0.2
0.3
0.4
0.5
0.6
0.7
0.8
Figure 6.7 Incidence of indirect tax on communication by household type and expenditurequintile (%), Ghana.

Another area for policy consideration is an increase in indirect taxes on com-munication. Tax incidence is generally low but highly progressive (see Figure6.7). With the increasing trend in the use of mobile phones (GLSS 2007), morerevenue could be raised from an increase in the tax rates to offset revenue lossresulting from tax cuts. In that sense, the new Communication Service Tax lawpassed in 2008 may be a step in the right direction.
Thus, two options for financing are considered. Despite the caveats notedabove, the first is a combined increase of tax rates on two categories, tobacco andalcoholic beverages, by 100 per cent, and the second is the recent introduction ofa communication service tax of 6 per cent, popularly known as the ‘talk tax’. Theanalysis of both options relied heavily on conservative assumptions, particularlythe assumption that affected households will maintain the same pattern of con-sumption for the short-to-medium term after the introduction of the proposedreform(s). Also, since the partial nature of the analysis makes it impossible to pre-dict the impact of such policy shifts on other sectors of the economy, it assumesthat there will be no immediate repercussions in other areas of the economy thatwould wipe out the anticipated effects.
Effects of proposed policy changes on tax incidence
Table 6.10 shows that zero-rating taxes on children’s clothes and footwear willreduce the incidence of total indirect taxes for all gender household types by lessthan 3 per cent, but will reduce incidence rates for poorer households relativelymore than for richer households. Differences in the impact on male-headed andfemale-headed households are negligible. However, households with more adultfemales than adult males or households in which females are the only breadwin-ners will benefit more than their comparable male-type households.
The reduction of kerosene taxes will have less effect on tax incidence. The aver-age expected reduction in tax incidence is about 1.9 per cent with little or no sig-nificant gender differences. This policy will, however, have a higher relative benefitfor the poor. On average, tax incidence for the poorest quintile will be nearly 6 percent (5.8 per cent), while that for the 5th quintile will be about 1 per cent.
On the financing side, as expected, doubling tax rates on tobacco and alcoholicbeverages will affect male types of household more than female types. Since itwill also affect poorer households more than richer ones, it would be necessaryto devise other transfer packages for the poor if the policy is to be fair. Moreover,it may not be equitable to double the tax rates on tobacco and alcoholic beveragesto finance the elimination of taxes on children’s clothes and footwear, since theincrease in tax incidence resulting from the former will more than offset the ben-efits derived from the latter.
Table 6.10 also shows that the introduction of the 6 per cent across-the-boardcommunication service charge has little effect on total indirect tax incidence, asit constitutes a relatively small share of total indirect taxes in Ghana. There areno marked gender differences in expected tax incidence increase, which will befelt most among the 4th and 5th expenditure quintiles.
Gender dimensions of taxation in Ghana 175

Effects of proposed policy changes on household disposable incomesand tax revenues
The results indicate that all the policy options are attractive in terms of reducingpoverty and gender inequality. This is because the ratio of the gain in disposableincome due to tax cuts for the group that appeared to be disadvantaged by the tax sys-tem (adult female-majority households) to the gain for the advantaged group (adultmale-majority households) is higher than similar ratios derived from their expenditureshares. Also, the ratios of the gains for the first four expenditure quintiles to that forthe 5th quintile are higher than the ratios of their respective expenditure shares.
Projections from the data show that the government would have transferredabout GH¢1,084.1 billion (US$117 million) to households if the government hadimplemented the policy change on zero-rating children clothes and footwear in2005–06. This is about 0.9 per cent of GDP or 3.4 per cent of projected indirecttax revenue for 2005–06. The expected fall in government revenue from the otheroptions is relatively smaller, GH¢664 billion or US$71.4 million.
The expected gain for the tax authority from the alcohol and tobacco taxincrease or communication tax increase would be GH¢734.4 billion (US$79million) or GH¢314.7 billion (US$33.8 million) respectively, amounting to about2.3 per cent or 1 per cent of projected indirect tax revenue, respectively, in 2005–06. On revenue grounds, therefore, the government can finance a policy shift to
176 E. Aryeetey, I. Osei-Akoto, A.D. Oduro and R.D. Osei
Table 6.10 Effects of changes in indirect tax rates on tax incidence by household type andexpenditure quintile, Ghana
Household Base scenario Effects on tax incidence (% change)category
Average Zero-rate Reduce Double Increasetax children kerosene alcohol and communication incidence clothes and rates by tobacco rates service rates(%) footwear 50% by 6%
Male-breadwinner 7.9 −2.2 −2.2 3.3 1.3Female-breadwinner 6.8 −3.1 −2.1 1.3 1.0Dual-earner 7.4 −2.8 −1.5 2.3 1.1None employed 7.0 −2.2 −2.4 3.0 1.2Male-majority 7.8 −1.7 −1.5 3.5 1.5Female-majority 6.9 −2.9 −2.0 1.5 1.0Equal number of 7.5 −3.1 −2.1 2.5 0.9males and femalesMale-headed 7.6 −2.6 −1.8 2.9 1.2Female-headed 6.7 −2.8 −2.2 1.0 1.2Lower 20% 7.8 −4.2 −5.8 5.0 0.1Next 20% 7.2 −4.2 −3.9 3.5 0.3Next 20% 6.9 −3.8 −3.0 2.6 0.4Next 20% 6.8 −3.3 −1.9 2.2 0.9Upper 20% 7.7 −1.8 −1.0 2.1 1.6Total 7.3 −2.6 −1.9 2.5 1.1
Source: Calculations based on data from GLSS 2005–06.

zero-rating children’s clothing and footwear by doubling the tax rates for tobaccoand alcohol and continuing the communication service tax. The communicationservice tax alone cannot finance any of the proposed tax cuts unless the rate isincreased considerably.
Conclusion and policy recommendations
Broad-based consumption taxation is increasingly becoming a key strategy tofinance development programmes in Ghana and elsewhere in Africa. Despite itsimportance, however, little attention has been paid to how governments can usetax policies to reduce inequalities in income and well-being by minimizing exist-ing gender differences (both explicit and implicit) in tax liabilities. This chapterhas explored the differential gender impact of both the personal income tax sys-tem and the incidence of indirect taxes in Ghana in an effort to highlight thegender dimensions of taxation, showing how tax policies and tax reforms canimpact differentially on men and women, especially on poor women.
The results show that on average, households in Ghana pay about 7.3 per centof total expenses on indirect taxes. Using current expenditure as a proxy for per-manent income, the study shows that the incidence of indirect taxes for the nationas a whole in 2005–06 decreases from 7.8 per cent for the 1st quintile of house-holds to 6.8 per cent for the 4th quintile and rises again to about 7.7 per cent forthe top quintile. The degree of progressiveness differs across localities and acrossmale and female types of households.
The analysis suggests that on equity grounds, policy reforms are needed to lessenthe burden of taxation on poor households that have more children. Such reformscould target dual earner households within the middle-income group to finance thistax cut. The analysis also suggests that tax reform policies should target and reducethe burden of taxes on commodities such as fuel for household use, since such taxesare disproportionately regressive for female-majority households.
The simulations of policy options points to the fact that shifting different taxrates has various gender- and poverty-related effects. Examples which are feasi-ble in terms of reducing the disparities in tax burden without reducing revenueinclude the removal of taxes on children’s clothes and footwear, and a 50 per centreduction in kerosene tax. Possible sources of funding within the indirect tax sys-tem include doubling of tax rates for tobacco and alcoholic beverages (althoughthe degree of intra-household shifting needs further study) and the continued useof the newly introduced communication service tax.
A review of the personal income structure shows considerable formal equality.Tax laws do not explicitly differentiate between men and women and tax rates arethe same for both sexes. There is no reference to marital status except with regardto relief provided to married dependent spouses. In terms of substantive equality,the evidence shows that the tax system discriminates against single-earner house-holds, many of which are headed by women. On the other hand, the marriage/responsibility allowance provides valuable relief to households headed by wid-owed, separated and divorced persons, the majority of whom are women. Thesehouseholds on average tend to contain more children than similar households
Gender dimensions of taxation in Ghana 177

headed by widowed, divorced or separated men. It is recommended that the valueof the responsibility relief should be increased as well as graduated for differentincome groups, declining as the income of the individual increases above athreshold level. Such targeting would increase relief to low-income householdswithout burdening the budget.
The negative effects of fiscal drag on low-income persons negatively impactsa higher proportion of women in the tax net compared to men. This is because alarger proportion of women have incomes in the first income tax bracket. It is rec-ommended that income tax brackets be adjusted more frequently to protect thereal disposable income of low-income taxpayers. Fiscal drag when it occurs is asource of revenue for the central government. It is therefore recommended thatgovernment strengthens its tax collection mechanisms to reduce tax evasion as ameans of maintaining, if not increasing its tax revenues, and eliminate incentivesto ignore fiscal drag.
Finally, missing from this study is information on the sex profile of personalincome taxpayers. It is recommended that the Internal Revenue Service shouldcollect information on the sex of personal income taxpayers. This will make pos-sible more detailed analysis on the gender dimensions of income tax policies.
Notes
1 In 2008 Purchasing Power Parity values.2 All employers, with the exception of judges, lecturers and security institution personnel,
are required to register employees.
References
Addison, T. and Osei, R. (2001) ‘Taxation and Fiscal Reform in Ghana’, UNU-WIDER,Discussion Paper, 2001/97.
Ghana Statistical Service/Ghana Living Standard Survey (2007) ‘Poverty Trends inGhana: 1991/92–2005/06’, Accra.
Institute of Statistical, Social, and Economic Research (ISSER), State of the GhanaianEconomy, Accra, Ghana, various years.
Osei-Akoto, I., Osei, R. and Aryeetey, E. (2009) ‘Gender and Indirect Tax Incidence inGhana’, ISSER Technical Publication (forthcoming).
Smith, T. (2000) ‘Women and Tax in South Africa’, in The Women’s Budget Series, CapeTown: Institute for Democracy in South Africa (IDASA), Community Agency forSocial Enquiry (CASE) and the Parliamentary Committee on the Quality of Life andStatus of Women.
Younger, S.D. (1996) ‘Estimating Tax Incidence in Ghana: An Exercise Using HouseholdData’, in D. Sahn (ed.) Economic Reform and the Poor in Africa, Oxford: Clarendon Press.
178 E. Aryeetey, I. Osei-Akoto, A.D. Oduro and R.D. Osei

7 Gender equality and taxation inMorocco
Ahmed El Bouazzaoui, AbdessalamFazouane, Hind Jalal and Salama Saidi
Introduction
Morocco has taken significant steps in the past 15 years towards achievinggreater gender equality. It ratified CEDAW in 1993 and in December 2008announced the forthcoming withdrawal of its reservations.1 The government isalso committed to achieving the Millennium Development Goals (MDGs),including Goal 3 – to promote gender equality and empower women (see HighCommission for Planning, 2005, 2007). The new Family Code, adopted in 2004,and the Nationality Code of 2007 should also be considered major gender equal-ity reforms. Among other things, these reforms give women greater autonomywith regard to divorce and citizenship rights.
Government efforts to implement gender-responsive budgeting began in 2002,under the direction of the Ministry of Finance. The first positive impacts arealready evident, especially with regard to expenditure on education, health, basicinfrastructure and justice. However a gender perspective has yet to be applied onthe revenue side of the budget.
This chapter investigates the gender dimensions of taxation in Morocco.2 Itfirst provides a brief summary of the country’s income and employment structurefrom a gender perspective and reviews the overall tax structure, highlightingmajor trends and current policy debates. It then examines personal income tax(PIT) in detail, pointing out explicit and implicit gender biases and illustratinghow it affects different types of households, and reviews the way in which indi-rect taxes, primarily value-added tax (VAT), excise tax and fuel tax, affect differ-ent gender groups. The chapter concludes with a discussion of the results ofseveral policy simulations and offers policy recommendations.
A gendered picture of employment and income3
The economically active population in Morocco aged 15 years and older was 11.1million in 2007. Women’s labour force participation rate was 27.1 per cent, muchlower than the rate for men. In urban areas, 71.5 per cent of men were in thelabour force, compared to 19.6 per cent of women. In rural areas, the rates were84.6 per cent in 2007 for men and 37.7 per cent for women.

Most women in the labour force work in agriculture, forestry and fisheries,industry and handicrafts. In rural areas, 92 per cent of women work in agriculture,while in urban areas, the majority have jobs in manufacturing and services.Women also play a significant role in the textile and food industries, despiteunfavourable working conditions. Men are frequently employed in trade, construc-tion, public works, mining and industry. In the informal sector, although 86.7 percent of the workers are men, women form a clear majority of those who do workat home (69.9 per cent), in crafts, embroidery, sewing and weaving carpets.
The public and private sectors
As household income data are not available, this profile is based on data relatedto wages in the public and private sectors.4 In 2007, women represented 31.2 percent of private-sector employees and 36.1 per cent of civil servants (see Table7.1). Female civil servants received 32 per cent of the total payroll in 2007, ver-sus 28 per cent in 1999. In the private sector, women received only 27 per centof the total payroll in 2007, up from 24 per cent in 1999.5
Female civil servants are better paid than female employees in the private sec-tor. The average monthly salary in the public sector climbed from 4618 dirhamin 1999 to 7518 in 2007 (US$543.30 to US$884.50),6 a total increase of 62.8 percent. The average monthly wage of women in this sector is 18.7 per cent belowthat of men, and the gender wage gap varies between 17.6 and 20.2 per cent,although it closed slightly between 1999 and 2007. By contrast, the averagesalary in the private sector increased from 2845 dirham in 1999 to 3617 dirham
180 A. El Bouazzaoui, A. Fazouane, H. Jalal and S. Saidi
71.5
19.6
82.6
37.7
76.1
27.1
(%)
Urban Rural Both
Male Female
Figure 7.1 Economically active rate by sex and residence area in 2007, Morocco.
Source: Employment Survey, High Commission for Planning (HCP) 2008.

in 2007, an overall increase of only 27.1 per cent. Wage gaps are higher in the pri-vate than in the public sector. Women’s average monthly wages are 25.8 per centless than men’s monthly wages, and the gender wage gap ranges from 19 to 32.1per cent, although it narrowed much more than did the public wage gap between1999 and 2007 (for a disaggregated picture, see El Bouazzaoui et al. 2009).
Household structure
Similar to the other studies in this volume, we defined households in terms ofheadship (male-headed versus female-headed), employment status (male-bread-winner households, female-breadwinner households, dual-earner households andhouseholds with no employed person) as well as in terms of their gender compo-sition: adult male-majority households (M > F), adult female-majority households(F > M), and households with an equal number of male and female adults (M = F).
Looking at the gendered typology of households in Morocco (see Table 7.2),17 per cent of households are female-headed, 7.8 per cent had female breadwin-ners and 35 per cent had a larger share of adult females than adult males (HighCommission for Planning, 2001).
Table 7.3 shows the cross-tabulations of employment status and sex composi-tion. Of the female-breadwinner households, 80 per cent are adult female major-ity households, while of the male-breadwinner households, only 28.8 per cent areadult male-majority. A relatively small proportion of male-breadwinner house-holds are households in which there are a majority of adult females, which corre-sponds to the traditional pattern of the Moroccan family. It is important to note
Gender equality and taxation in Morocco 181
Table 7.1 Women’s payroll share by sector and year, Morocco, (%)
Sector 1999 2000 2001 2002 2003 2004 2005 2006 2007
Public 28 29 29 29 30 30 31 31 32Private 24 24 25 24 27 27 27 27 27Both 25 26 26 26 28 28 28 28 29
Source: Authors’ calculations based on data from National Social Security Fund (CNSS), StatisticalYearbook of Morocco.
Table 7.2 Household classification, Morocco
Total Headship Household employment categories Household sex composition
Male Female Male- Female- Dual- No one M>F F>M M=Fbreadwinner breadwinner breadwinner employed
14,243 11,819 2,424 8,726 1,114 2,742 1,661 3,392 4,980 5,871100% 83% 17% 61% 8% 19% 12% 24% 35% 41%
Source: Authors’ calculations from National Household Consumption and Expenditure Survey, 2001.

182 A. El Bouazzaoui, A. Fazouane, H. Jalal and S. Saidi
that 53 per cent of households with no one employed are female-majority house-holds. On the other hand, three-quarters of adult male-majority households aremade up of male-breadwinner households (ibid.).
Tax structure in Morocco
As a proportion of GDP, tax revenues increased from 17 per cent in 1996 to22.5 per cent in 2007. During this period, direct taxes climbed most sharply, from5.4 per cent to 10.1 per cent, while indirect taxes edged up from 7.4 per centto 8.7 per cent (see Figure 7.2). Consequently, as a percentage of GDP, the shareof total tax revenue from customs duties slipped from 3.3 per cent to 2.2 per cent(Economics and Finance Ministry, 2008).
20.1 22.0
18.019.4 18.8 18.1 18.1 17.5 17.6
19.1 19.719.0
0
5
10
15
20
25
1996 1997 1998 1999 2000 2001 2002 2003 2004 2005 2006 2007
(%)
Direct taxes Indirect taxes Custom duties Total tax
Figure 7.2 Evolution of tax revenue, Morocco, 1996–2007 (as % of GDP).
Source: Authors’ calculations based on Ministry of Finance data.
Table 7.3 Cross-tabulation of household categories by employment status and sexcomposition, Morocco (%)
Household classification Household sex composition Total
Adult male Adult female Equal number of majority majority females and males
Dual-earner 19.30 41.30 39.40 100Female-breadwinner 4.90 79.90 15.20 100Male-breadwinner 28.80 23.30 47.90 100No-one emplyed 13.30 53.00 33.70 100Total 23.20 34.70 42.00 100
Source: Author’s calculations from National Household Consumption and Expenditure Survey, 2001.
Em
ploy
men
tca
tego
ries

As a proportion of GDP, VAT revenues increased from 3.5 per cent in 1996 to5.8 per cent in 2007. Corporate tax revenues went up most steeply during the sameperiod, from 2 per cent to 5.1 per cent, while PIT revenues rose from 2.4 per centto 4.6 per cent. In 2006, corporate tax revenue exceeded PIT revenue for the firsttime. The share of GDP from excise duties dipped from 3.9 per cent to 2.9 per cent.
Tax revenue structure
Tax revenues represented about 87 per cent of total government receipts in 2007.Tax revenues climbed 15 per cent in 2007 to 135 billion dirham, compared to113.5 billion a year earlier. This increase is generally attributed to improved taxadministration and more accurate taxpayer declarations and control. It could alsobe explained by expansion of the tax base and the global impact of increased eco-nomic activity.
Direct taxes made up 44 per cent (60.4 billion dirham) of government taxationin 2007, while indirect taxes made up 39 per cent (52.1 billion dirham) (seeFigure 7.3).
The decline in the share of customs duties over the past 10 years is primarilydue to tariff reductions following free trade agreements concluded with theEuropean Union (EU), the United States, Turkey, the European Free Trade
Gender equality and taxation in Morocco 183
Corporate tax30 42723%
Business rates3020%
VAT34 84426%
Excise tax17 34013%
Customs duties13 41510%
Stamps and registrationduties9 1137% PIT
27 73921%
Figure 7.3 Structure of tax revenue in 2007, Morocco.
Source: Authors’ calculations based on Ministry of Finance data.

Association and Arab countries. Over the next decade these treaties will virtuallyeliminate customs receipts from import duties. Stamp and registration dutiesremained globally stable, rising slightly beginning in 2005 due to the boom in theproperty market (see Figure 7.4).
The increase in VAT revenues was due primarily to higher revenues from theVAT on imports and to a moderate increase in the domestic VAT. The strong per-formance of the import VAT stemmed from the overall growth of imports, morerigorous customs controls and a campaign against the undervaluation of imports,along with high prices for imported oil.
The jump in corporate tax revenues reflects the dynamism of economic activ-ity, rising company profits and improved tax collection and fiscal controls. Thegrowth in PIT revenues can be ascribed to various reforms to upgrade and increasethe salaries of state employees and to widen the overall tax base. Globally, thechallenge for Morocco’s tax policy will be to maintain the current level of publicresources by compensating for the drastic reduction in trade tariffs through anincrease in domestic tax revenues.
Tax reform strategy
The overall goal of the government’s proposed tax reforms is to widen the taxbase and reinforce transparency, simplicity and rationality. This is meant to beachieved primarily through the following strategies:
• freezing tax deductions and exemptions at current levels and graduallyeliminating them entirely;
184 A. El Bouazzaoui, A. Fazouane, H. Jalal and S. Saidi
0
5
10
15
20
25
30
1996 1997 1998 1999 2000 2001 2002 2003 2004 2005 2006 2007
%
VAT Corporate tax PIT Excise
Figure 7.4 Evolution of tax revenue structure, 1996–2007, Morocco.
Source: Authors’ calculations based on Ministry of Finance data.

• introducing in-depth reform of the VAT, mainly by reducing progressivelytax preferences, harmonizing tax thresholds, and taxing the agriculture sec-tor by 2014;
• implementing a PIT reform based mainly based on rates reductions andexemption threshold increases;
• pursuing the modernization of the tax administration.
The success of tax policy reform will largely depend on the modernization of thetax administration system to ensure revenue generation and collection whileimproving the quality of services to taxpayers. The major political obstacle tothese reforms is likely to be the resistance of lobbies wishing to preserve theircurrent fiscal privileges. Greater transparency in the tax system and the develop-ment of a targeted communication policy would play an important role in over-coming this resistance (see Akesbi 2008).
Personal income tax
Personal income tax (PIT) was introduced in 1990 to replace the system ofschedular taxes on professional income, wages, and income on capital, land andother sources. This new system was introduced primarily to reduce distortionsand inequities in the distribution of the tax burden between individuals and cor-porations and applies a single tax with a single scale to total income.
PIT is based on individual filing. Self-employed individuals are liable to file areturn. Employers have the responsibility to file a return on behalf of theiremployees. They deduct the PIT directly from employee wages or salaries and payit over to the tax authority. Deductions from the source make up 89 per cent of PITrevenue. The low share of non-salary revenues shows the necessity for improvingPIT revenue collection. Taxpayers with farm income from a single property andthose whose only income is wages paid by a single employer resident or estab-lished in Morocco who is required to deduct withholding tax are not required toprovide a statement of total income, unless they believe they were overcharged orwant to claim deductions (for details on liabilities and exemptions, see Akesi2008).
In Morocco, PIT is levied on five different types of income, each of which issubject to different tax rules: professional income; agricultural income (exemptfrom the PIT until the end of 2013); salary income; land profits and income; andcapital gains and profits. This study focuses only on the income tax applied onsalaries, owing to the lack of available data on the other types of income.
For tax purposes, in addition to income derived directly from wages, the salarycategory includes income allowances and pay; special allowances, reimburse-ment of standard fees and other remuneration to the directors of corporations;pensions; and benefits in money or in kind awarded in excess of these payments.Income and profits subject to tax at a lower rate are excluded.
According to Article 2-II of the general tax code, corporations and limited lia-bility corporations created in Morocco and including only individuals (physical
Gender equality and taxation in Morocco 185

persons) can choose to file corporate tax rather than PIT, as long as the revenueservice is notified (Economics and Finance Ministry, 2009). Taxes on wagesmake up the bulk of PIT revenue, about 71.6 per cent in 2007. Revenue fromother types of income, such as professional income, is low because of benefitsfrom exemptions and deductions. This inequity has increased over time. Box 7.1shows the range of exemptions that reduce taxable income.
186 A. El Bouazzaoui, A. Fazouane, H. Jalal and S. Saidi
Box 7.1 Exemptions that reduce total taxable income, Morocco
1 Function indemnities
2 Family allowances
3 Pension increases for family size
4 Disability pensions allocated to army members and their legalclaimants
5 Temporary life annuities allocated to work accident victims
6 Payments for sick leave, accident, maternity and death
7 Lay-off and voluntary resignation indemnities
8 Alimony
9 Complementary pensions
10 Life insurance contracts of at least 10 years
11 Employer social security contributions
12 Employer insurance subsidies for illness, maternity, invalidity anddeath
13 Meal subsidies by employers
14 Salaries paid to employees by the Islamic Development Bank
16 Monthly trainee subsidies for workers recruited by the private sector
17 Student tuition
18 Training subsidies for university graduates recruited by the privatesector
19 Rent revenues from new construction
20 Donations of assets between progenitors, descendants, spouses andsiblings
21 Interest earned by individuals from an account in the National SavingsFund.
Rate structure and tax preferences
Several reforms have altered both tax rates and exemption thresholds. The mar-ginal tax rate has been gradually reduced to encourage investment and harmonize

Gender equality and taxation in Morocco 187
Table 7.4 Normal PIT rates on salary revenues in 2009, Morocco
Gross annual salary brackets Rate (%) Fixed deduction
0–28,000 0 028,001–40,000 12 3,36040,001–50,000 24 8,16050,001–60,000 34 13,16060,001–150,000 38 15,560150,001–and more 40 18,560
the PIT rate with the corporate tax rate, which has been fixed at 35 per cent. Thenumber of PIT brackets were reduced from eight to five, including the zero rate.In addition, the threshold for income exempt from taxes has been raised to givelow-income earners more purchasing power.
Between 1989 and 2009, the top marginal rate was reduced in stages from 60per cent to 40 per cent (Table 7.4). The rates in other brackets have also beencut. The exemption threshold, set initially at 8,400 dirham per year in 1989, hasbeen lifted several times, and rose to 28,000 dirham in 2009. Tax brackets areusually adjusted upward in relationship to increases in the private sector legalminimum wage to address fiscal drag.
Morocco’s tax preferences are extremely complex and are found in all types oftaxes (corporate, PIT, VAT, registration fees and stamp, licence and urban taxes).They are still increasing, with the enactment of specific new preferences. In responseto this situation, in 2005, the government, with support from the European Union,initiated its first evaluation of tax preferences and their budgetary consequences.Several reports showing the cost of these tax preferences were published andannexed to the financial law.
Morocco’s tax code, like those in many other countries, contains a numberof deductions that reduce total income (such as donations or interest paymentson loans) and deductions for professional expenses (Economics and FinanceMinistry, 2009).
Explicit and implicit biases in the PIT code
A review of the tax code reveals both an implicit and explicit gender bias (seeStotsky 1997; Elson 2006). First, an implicit gender bias may be present in theway that deductions for professional expenses are structured. Certain groups ofemployees – casino workers, night workers and selected other professions – canclaim deductions of up to 28,000 dirham per year according to specific formu-las. Males predominate in these professions; those in which women predominateare not subject to deductions for professional expenses. More broadly, deduc-tions for certain types of expenses that may enable women to participate in paidemployment – such as child care – are not available.
Second, there is an explicit bias in the way that Article 74 of the PIT code consid-ers dependants of the taxpayer (male). These dependants include his wife; his own

children and other children for whom he has legal responsibility. Women receivereductions for dependants only if they are able to prove legally that their husbandsand children are financially dependent on them. This provision in Article 74 shouldbe removed from the tax code. It conflicts with the Convention on the Eliminationof All Forms of Discrimination against Women (CEDAW), as well as Article 4 ofthe 2004 Moroccan Family Code, which specifies that both spouses are responsiblefor a family. CEDAW Article 5 mandates signatory states to take all appropriatemeasures (to modify the social and cultural patterns of conduct of men and women)required to achieve substantive equality (Elson 2006). This suggests that the designof the income tax system not only should give males and females the same taxpayerstatus with equal entitlements but also might consider additional deductions aimedat alleviating inequalities in the labour market and in unpaid work.
Table 7.5 shows the distribution of employed people across tax brackets by sex.It is calculated from data on public and private sector employees in 2007. Thistable shows that women are more likely to be found in the lower salary bracketsexempt from PIT: 34.8 per cent in the private sector and 1.6 per cent in the publicsector. The table also shows that more women in the upper revenue brackets workin the public sector (50.4 per cent) than in the private sector (11.5 per cent), how-ever, the percentage of men in the upper brackets is higher in both sectors.
Hypothetical PIT scenarios
Three hypothetical cases depicting PIT treatment of individuals in differenthouseholds with two children illustrate the biases that exist in PIT by detailing thewide variation in the burden it places on each household type due to the waydeductions are structured. The households in each of the three cases have thesame total income (half the median; median; and twice the median). In all scenar-ios, all households except the single-breadwinner household include dependants(spouse + two children).
188 A. El Bouazzaoui, A. Fazouane, H. Jalal and S. Saidi
Table 7.5 Distribution of employed people across tax brackets by sex, Morocco, 2007
Gross annual PIT rate % of employees – 2007tax brackets 1999 to 2006 (%)
Public sector Private sector
M F MF M F MF
0 to 20,000 0 0.3 1.6 0.7 25.5 34.8 28.420001 to 24,000 13 0.8 1.1 0.9 14.5 16.0 15.024,001 to 36,000 21 11.7 12.3 11.9 30.9 28.0 30.036,001 to 60,000 35 24.7 34.7 28.3 14.4 9.8 13.060,001 and up 44 62.5 50.4 58.1 14.7 11.5 13.7Total 100 100 100 100 100 100
Source: Authors’ calculations from Statistical Yearbook of Morocco, CNSS.

Case 1: Half the median income
In Case 1, all households earn the same total income, 2912 dirham. Couples witha spouse and two children in either male-/female-breadwinner or dual-earnerhouseholds earning half the median are below the exemption ceiling and pay notax. On the other hand, single breadwinners with or without adult dependants(mother, father, brothers or sisters) pay the heaviest effective average tax rate.This applies to all scenarios (see Table 7.6).
Case 2: Median income
In Case 2, each household earns 5825 dirham. Globally, single-breadwinnerhouseholds at the median income pay more taxes than other types of households.Deductions for dependants lower the tax burden on both male- and female-bread-winner households with children. In addition, households with dual breadwinnerswho have equal incomes pay less tax than other households with the same totalearnings. However, an implicit gender bias shows up in dual-earner householdswhere the woman’s income is higher than the man’s; those households pay moretax than those where the man earns a higher income, because the tax reduction fordependants favours male breadwinners as noted above. This bias was not evidentin Case 1, where most households have incomes under the exemption thresholdand therefore pay zero tax (see Table 7.6).
Case 3: Twice the median income
Each household in this case earns 11,649 dirham. Globally, single-breadwinnerhouseholds that earn twice the median income pay more taxes than other types ofhousehold. On the other hand, the reduction for dependants slightly eases the taxburden on male- and female-breadwinner households with dependants. Dual-earner households where the two earners have equal incomes pay less tax than the
Gender equality and taxation in Morocco 189
Table 7.6 Comparison of effective average individual tax rates, Morocco (%)
Category of taxpayer ½ median Median income Median income 2 times income
Single-breadwinner HH (no children) 2.1 13.2 23.1Male-breadwinner HH 0.6 12.4 22.7Female-breadwinner HH 0.6 12.4 22.7Dual-breadwinner egalitarian M 0.0 0.6 12.4Dual-breadwinner egalitarian F 0.0 2.1 13.2Dual-breadwinner (M earn > F) M 0.0 4.4 16.4Dual-breadwinner (M earn > F) F 0.0 0.0 8.2Dual-breadwinner (F earn > M) M 0.0 0.0 7.1Dual-breadwinner (F earn > M) F 0.0 5.6 17.1
Source: E1 Bouazzaoui et al. (2009).

other categories. Just as in Case 2, dual-breadwinner households where thewoman earns a higher income than the man pay more tax than those where theman’s income is higher, due to the tax reduction for dependants that systemati-cally favours male breadwinners (see Table 7.6).
It is also noteworthy that child allowances (200 dirham for each of the firstthree children and 30 dirham for each of the next three) are granted based on thesame criteria as dependants for male and female taxpayers. This systematic biaswidens the differing net tax burdens among male and female dual-earner house-holds, with the least tax owed by households in which the man and woman haveequal incomes. This bias occurs in all three income categories.
Indirect taxes
This section analyses the incidence of the VAT, excise taxes, the fuel tax and theincidence of the total of these three indirect taxes. The data are drawn from theMorocco National Household Consumption Expenditure Survey of 2000–01. Wecompared the tax revenue estimate from the year 2000 household survey used forthis study with the tax revenue reported in Morocco’s official accounting systemfor the same year. The household survey data report a lower estimate of total tax(16,014 billion dirhams) than Morocco’s national accounts (30,216 billiondirhams); the difference is 14,202 billion dirhams. The greatest discrepancy isfound in fuel taxes followed by excise taxes. For fuel taxes, this discrepancy canbe explained by the fact that the national accounts reflect two categories of fuelconsumers: households and the industrial sector; most fuel is consumed byMoroccan industry. For excise taxes, the gap could be explained by the inclusionof consumption by non-residents (tourists) in government revenues; their alcoholconsumption is significantly higher than that of Moroccans. Furthermore, manypeople may underreport their consumption in the survey of alcohol consumptionand expenditures.
Given the nature of the data, which collects expenditure by households, theanalysis is done at the household level. Nonetheless, using the typology describedabove, we attempt to explore incidence across households with different gendercharacteristics. Following the incidence analysis, we present a set of simulationsto highlight how different policy reforms would affect tax incidence. We then usethe results of the simulations to suggest some potential reforms in the country’stax policies that make them more gender-aware.
Morocco has four VAT rates: a standard rate of 20 per cent and three reducedrates of 14, 10 and 7 per cent. The Moroccan VAT system also includes bothzero-rating and exemptions. With zero-rating, a VAT of 0 per cent is levied onsales, but VAT incurred in producing the good or service can be claimed on a taxreturn. With exemptions, no VAT is levied and no input costs can be claimed (seeBox 7.2).
190 A. El Bouazzaoui, A. Fazouane, H. Jalal and S. Saidi

Box 7.2 VAT rate structure, Morocco
Exemptions • All basic foods (cereals, bread, milk, fish, meat, fruits andvegetables, etc.). unprocessed food, sugar, salt
• Paraffin and candles• Books and newspapers• Medicine • Self-construction of main home less than 300 m²• Health care acts, dental and nursing services• Education• Handicrafts• Agriculture products and services• Tools and machinery for handicapped persons• Micro credit
Zero-rating • Exports• Fertilizers• Agriculture tools• Acquisition of vehicles for taxi usage• Residential building construction• International passenger transport and services• Acquisition of busses and lorries for transport by international
transport enterprises• Goods and services for movies production by foreign companies• Purchases of goods and services by diplomats• Products and equipment for haemodialysis and medicine against
cardiovascular diseases, diabetes, asthma and AIDS• Donations• Purchase of equipment for NGO
7% In the case of a VAT rate of 7%, it is possible to claim VAT for thefollowing:
• Mass consumption products (water, gas and petroleum oils,pharmaceuticals, school supplies, etc.)
• Refined sugar• Animal feed• Economical car and all products and materials used in its
manufacture, and the benefits of assembling the car• The toll due on the highways
10% In the case of a VAT rate of 10%, it is possible to claim VATincurred in producing goods or services related to:
• Hotel and tourist services• Restaurant services• Catering services to employees• Comestible oil• Rice, pasta and salt• Financial and banking services• Lawyers, interpreters, veterinarians ... etc.

192 A. El Bouazzaoui, A. Fazouane, H. Jalal and S. Saidi
Box 7.2 (Continued) VAT rate structure, Morocco
14% In the case of VAT rate of 14%, it is possible to claim VAT incurredin producing the following: construction work, tea, butter, transport,electricity, economical commercial vehicle, economical moped, etc.But no VAT can be claimed for insurance services provided bybroker-dealers
SpecificVAT rates
• 100 DH per hectolitre of wine applied to wine and alcoholicbeverages sales for take away
• 4 DH per gram of gold• 0.05 DH per gram of silver
The VAT is computed according to the following formula:
τ2 = t2Pπc(1 + t2)
Where the tax paid (τ2) = expenditure (Pπc) × tax rate (t2)/ (1 + tax rate) andincidence is defined by the ratio of tax paid divided by expenditure.
Excise tax is computed on the basis of the tax paid on the per unit price (i.e.,dirhams per hectolitre of wine, beer and liquors sold). Added to that is a specificVAT of 100 dirhams/Hl+ other fiscal items. Fuel and energy taxes are computedon the basis of import duties plus 7 per cent of VAT rates on all components ofenergy products (petroleum, butane, kerosene, etc.). The tax on imported tobaccois computed according to basic import duties on each specific product (i.e.,unprocessed and raw tobacco, cigarettes, cigars, snuff and other raw products), towhich an ad valorem rate of 65 per cent and supplementary taxes are applied. Thetax on domestic tobacco products is based on the amount of sales of finishedproducts and is 65 per cent of the retail price.
Indirect tax incidence analysis
The incidence of indirect taxes is computed for each type of tax as well as specificcategories of goods consumed. Beginning first with type of tax and consideringhousehold employment categories, the data in Table 7.7 and Figure 7.5 show thatdual-earner households bear the highest tax incidence across total indirect taxes andeach type of tax – VAT, excise and fuel. They have a higher overall tax incidencethan either male- or female-breadwinner households. Male-breadwinner householdsbear a higher overall tax incidence than do female-breadwinner households.
Table 7.8 indicates how the pattern of indirect tax incidence can vary acrossquintiles and be affected by the presence of children, who shift household expendi-ture patterns. Generally, households with children bear a higher burden of total ofindirect taxes across quintiles than households without children. The highest totaltax incidence falls on the richest (5th) quintile of the dual-earner category withchildren; the pattern is similar for VAT and fuel taxes. The pattern is different for

Gender equality and taxation in Morocco 193
Table 7.7 Overall incidence by household type, Morocco
Total tax VAT Excise tax Fuel tax Number of households
Head of household
Male-headed 0.05565 0.04468 0.00807 0.0029 11,819Female-headed 0.05336 0.04538 0.00649 0.001748 2,424
Employment categories
Dual-earner 0.05954 0.04774 0.00871 0.00309 2,742Female-breadwinner 0.05108 0.04516 0.0045 0.00141 1,114Male-breadwinner 0.05494 0.04387 0.00826 0.0028 8,726No one employed 0.05071 0.04371 0.00498 0.00201 1,661
Household composition by gender
Adult male-majority 0.05695 0.04454 0.00961 0.00279 3,392household (HH)Adult female-majority HH 0.05376 0.04556 0.00574 0.00246 4,980Equal number of 0.05575 0.04418 0.00865 0.00291 5,871females and males Total 0.05535 0.04477 0.00786 0.00271 14,243
Q2 Q3 Q4 Q5
Inci
den
ce
Q1
Dual-breadwinner Male-breadwinner
Female-breadwinner No-employed
Quintile
Figure 7.5 Tax incidence by gender, employment status and quintile (as % of taxexpenditure), Morocco.
excise taxes: dual earners without children in the second and third quintiles bear thehighest burden of those taxes.
Further examination shows the VAT is progressive for all household cate-gories, with and without children, increasing steadily from across households inthe first to the last expenditure quintiles. Tax incidence is roughly the same for

female- and male-breadwinner households, while households with no employedindividuals bear the lowest incidence.
Excise taxes show a less consistent pattern, falling most heavily on dual-earnerand male-breadwinner households (see Figure 7.6). Among dual-earner house-holds, the 2nd and 3rd quintiles bear the largest incidence, while the 3rd quintileof male-breadwinner households bears the largest incidence. Female-breadwinnerhouseholds bear the smallest incidence of excise taxes.
What do we make of these results? It is reassuring that the incidence both oftotal indirect taxes and of the VAT specifically is progressive. At the same time,the system contains horizontal inequities between households with one adultearner and a financially dependent spouse and households with two adult earnerswho have the same income. The elimination of this type of horizontal inequitymay be a subject of consideration for future to reforms of the Moroccan personalincome tax system.
Tax incidence by consumption patterns
The gendered pattern of consumption affects the way tax incidence will be feltamong different household types. Female-type households purchase differentbaskets of goods than do male-type households, which will directly affect the taxburden each bears (see Table 7.9). We highlight first the commodities that have
194 A. El Bouazzaoui, A. Fazouane, H. Jalal and S. Saidi
0.003
0.004
0.005
0.006
0.007
0.008
0.009
0.010
Exc
ises
tax
inci
den
ce
Q2 Q3 Q4 Q5Q1
Dual-earner Female-breadwinner
Male-breadwinner No-employed
Quintiles
Figure 7.6 Excise tax incidence by gender, employment status and quintile (as % ofexpenditures), Morocco.

Table 7.8 Tax incidence by gender and employment status, presence of children and quintile, Morocco
Quintiles Total VAT Excise Fuel Number Total VAT Excise Fuel Number Total VAT Excise Fuel Number tax tax tax HH tax tax tax HH tax tax tax HH
Dual-earner with children Dual-earner without children Dual-earner Total
Q1 4.72 3.68 0.95 0.09 402 3.97 3.73 0.19 0.05 18 4.69 3.68 0.92 0.09 420Q2 5.16 4.07 0.94 0.15 440 5.40 3.89 1.36 0.16 61 5.18 4.05 0.98 0.15 501Q3 5.66 4.52 0.96 0.19 446 5.32 4.02 1.19 0.11 95 5.62 4.45 0.99 0.18 541Q4 6.31 5.09 0.89 0.34 419 5.56 4.48 0.84 0.24 138 6.18 4.98 0.88 0.32 557Q5 7.57 6.26 0.60 0.71 530 7.54 6.10 0.81 0.63 193 7.57 6.23 0.65 0.69 723Total 5.92 4.76 0.86 0.30 2237 6.16 4.88 0.94 0.34 505 5.95 4.77 0.87 0.31 2,742
Female-breadwinner with children Female-breadwinner without children Female-breadwinner Total
Q1 4.14 3.58 0.45 0.11 130 3.45 3.37 0.00 0.08 13 4.07 3.48 0.47 0.11 34Q2 4.61 3.95 0.51 0.15 130 4.07 3.48 0.47 0.11 34 4.09 3.73 0.32 0.05 65Q3 4.87 4.24 0.54 0.10 151 4.09 3.73 0.32 0.05 65 4.65 4.11 0.45 0.08 103Q4 5.53 4.88 0.56 0.09 131 4.65 4.11 0.45 0.08 103 6.20 5.56 0.35 0.29 198Q5 6.27 5.74 0.33 0.21 159 6.20 5.56 0.35 0.29 198 5.19 4.65 0.37 0.18 413Total 5.08 4.48 0.48 0.13 701 5.19 4.65 0.37 0.18 413 4.14 3.58 0.45 0.11 130
Male-breadwinner with children Male-breadwinner without children Male-breadwinner Total
Q1 4.62 3.69 0.81 0.12 1568 4.04 3.44 0.48 0.12 64 4.87 4.24 0.54 0.10 151Q2 4.96 3.99 0.77 0.19 1609 4.40 3.42 0.87 0.12 132 5.53 4.88 0.56 0.09 131Q3 5.50 4.28 0.96 0.25 1504 4.59 3.64 0.87 0.08 258 6.27 5.74 0.33 0.21 159Q4 6.04 4.81 0.85 0.38 1398 5.35 4.10 1.03 0.21 381 5.08 4.48 0.48 0.13 701Q5 7.04 5.82 0.62 0.60 1190 6.66 5.20 0.98 0.47 622 4.10 3.57 0.43 0.11 143Total 5.49 4.39 0.81 0.28 7269 5.54 4.33 0.94 0.27 1457 4.54 3.88 0.51 0.15 164
No-employed with children No-employed without children No-employed Total
Q1 4.39 3.68 0.59 0.12 135 3.83 3.19 0.57 0.06 39 5.27 4.65 0.53 0.09 234Q2 4.74 4.05 0.56 0.13 135 4.52 3.55 0.92 0.05 46 6.24 5.66 0.34 0.24 357Q3 4.62 4.08 0.42 0.12 176 4.01 3.69 0.16 0.17 72 5.11 4.52 0.45 0.14 1,114Q4 5.53 4.68 0.60 0.25 245 4.37 3.71 0.53 0.12 177 4.04 3.44 0.48 0.12 64Q5 5.92 5.22 0.39 0.31 255 5.47 4.75 0.42 0.31 381 4.40 3.42 0.87 0.12 132Total 5.14 4.43 0.51 0.20 946 4.87 4.19 0.47 0.21 715 4.59 3.64 0.87 0.08 258

the highest incidence and then examine which households bear the highest inci-dence of different goods. We focus especially on goods that are essential tohousehold well-being as well as those that affect the amount of unpaid work and,therefore, the gender division of labour in households.
All basic unprocessed food products, as well as airline travel, education and per-sonal hygiene products are zero-rated in Morocco. These items were omitted fromTable 7.10, which presents tax incidence by product and by quintile. Examiningthe data in this table, it appears that the commodity with the highest incidenceis basic processed goods, followed by furniture, equipment, maintenance and bytobacco. The commodity category with the lowest incidence is non-alcoholicdrinks. However, the incidence of tobacco is small, and both tobacco and alcoholicbeverages have no tax incidence in most quintiles, with the exception of wealthiermale-breadwinner and dual-earner households. Taxes for meals out are progres-sive for male-breadwinner, female-breadwinner and dual-earner households, andregressive for households with no earners in quintiles 2 through 5.
Across the income distribution, one might ask the question: which householdtypes bear the highest tax incidence and on what commodities? All householdtypes in the 1st (poorest) quintile bear the largest burden, compared to the rich-est households, of taxes on basic processed food. Compared to households inthe richest quintile and to female-breadwinner households, the poorest male-breadwinner and dual-earner households bear a higher incidence of tax on
196 A. El Bouazzaoui, A. Fazouane, H. Jalal and S. Saidi
Table 7.9 Expenditure on basic services and commodities by household type, Morocco (%)
Dual-earner Female-breadwinner Male-breadwinner No-employed Total
Total Food 22.7 6.8 60.2 10.2 100.0Food: Basic 22.2 6.7 60.8 10.2 100.0unprocessedFood: Basic 22.3 7.0 60.0 10.7 100.0processedChildren’s 24.0 5.7 60.9 9.3 100.0clothing and footwearAlcohol 43.5 2.1 46.7 7.6 100.0Tobacco 25.7 3.9 64.0 6.4 100.0Medical 24.2 9.4 53.0 13.4 100.0ExpenditureFuel for 34.2 3.9 54.8 7.1 100.0transportFuel for 17.0 6.0 66.1 10.8 100.0household useHousing 23.3 7.6 56.8 12.3 100.0Water 25.4 7.6 57.2 9.8 100.0electricity and gas (*)

Table 7.10 Tax incidence of commodities, by household employment status and quintile (%)
Male-breadwinner Female-breadwinner Dual-earner No-employed
Categories Q1 Q2 Q3 Q4 Q5 Total Q1 Q2 Q3 Q4 Q5 Total Q1 Q2 Q3 Q4 Q5 Total Q1 Q2 Q3 Q4 05 Total
Basic 1.104 0.965 0.892 0.823 0.730 0.914 1.150 1.043 0.957 0.849 0.776 0.933 1.058 0.920 0.850 0.769 0.660 0.838 1.191 1.033 0.869 0.902 0.822 0.098processedSugar/ 0.235 0.174 0.139 0.110 0.080 0.152 0.224 0.194 0.155 0.131 0.086 0.149 0.228 0.164 0.134 0.110 0.073 0.137 0.232 0.162 0.142 0.119 0.092 0.136confectionery and others Meals out 0.109 0.155 0.171 0.189 0.194 0.161 0.045 0.053 0.096 0.100 0.142 0.094 0.115 0.168 0.204 0.242 0.212 0.191 0.068 0.095 0.082 0.080 0.079 0.081Non-alcoholic 0.016 0.025 0.42 0.055 0.088 0.043 0.004 0.028 0.054 0.059 0.108 0.057 0.013 0.030 0.055 0.063 0.099 0.055 0.012 0.016 0.049 0.064 0.088 0.055beveragesAlcoholic 0.000 0.000 0.002 0.000 0.003 0.001 0.003 0.000 0.000 0.000 0.000 0.000 0.000 0.000 0.000 0.000 0.007 0.001 0.000 0.000 0.000 0.008 0.000 0.002beveragesTobacco 0.817 0.792 0.963 0.880 0.700 0.834 0.431 0.503 0.496 0.523 0.337 0.449 0.929 0.996 0.991 0.887 0.630 0.873 0.594 0.630 0.376 0.578 0.402 0.499Adult clothing 0.174 0.242 0.299 0.365 0.478 0.302 0.170 0.221 0.345 0.361 0.548 0.354 0.187 0.279 0.371 0.477 0.581 0.393 0.123 0.248 0.224 0.291 0.412 0.287Children’s 0.274 0.278 0.289 0.308 0.259 0.282 0.288 0.298 0.236 0.249 0.205 0.249 0.242 0.277 0.275 0.281 0.244 0.263 0.241 0.321 0.266 0.282 0.245 0.268clothingUtilities 0.192 0.230 0.254 0.260 0.226 0.232 0.208 0.223 0.309 0.319 0.265 0.268 0.224 0.265 0.244 0.269 0.216 0.243 0.268 0.278 0.309 0.309 0.294 0.294Housing 0.078 0.126 0.149 0.156 0.201 0.138 0.075 0154 0.105 0.209 0.139 0.138 0.108 0.128 0.169 0.201 0.209 0.167 0.063 0.084 0.121 0.183 0.183 0.142Fuel for 0.314 0.324 0.296 0.260 0.171 0.278 0.292 0.261 0.236 0.220 0.164 0.227 0.302 0.263 0.212 0.156 0.108 0.201 0.344 0.282 0.297 0.239 0.207 0.259HH useFurniture, 0.506 0.507 0.503 0.561 0.679 0.545 0.500 0.567 0.481 0.596 0.695 0.579 0.487 0.516 0585 0.556 0.664 0.568 0.385 0.479 0.432 0.542 0.644 0.524equipment & maintenanceMedical 0.140 0.204 0.209 0.257 0.286 0.215 0.185 0.183 0.226 0.322 0.443 0.290 0.139 0.222 0.249 0.277 0.278 0.237 0.165 0.175 0.319 0.265 0.383 0.284expenditureCollective 0.080 0.082 0.099 0.123 0.141 0.103 0.058 0.122 0.184 0.159 0.212 0.156 0.089 0.123 0.160 0.213 0.148 0.148 0.083 0.077 0.102 0.128 0.113 0.106forms of transportPrivate 0.024 0.042 0.066 0.123 0.433 0.124 0.010 0.009 0.018 0.074 0.252 0.090 0.038 0.038 0.070 0.102 0.588 0.190 0.015 0.100 0.021 0.046 0.187 0.088TransportFuel for 0.071 0.156 0.220 0.369 0.640 0.273 0.065 0.119 0.053 0.058 0.248 0.119 0.040 0.121 0.167 0.344 0.793 0.322 0.068 0.078 0.093 0.204 0.321 0.184transportCommunication 0.065 0.104 0.192 0.291 0.419 0.202 0.060 0.092 0.267 0.318 0.500 0.277 0.069 0.152 0.202 0.369 0.487 0.271 0.073 0.167 0.267 0.326 0.397 0.282Recreation 0.086 0.123 0.143 0.205 0.282 0.162 0.089 0.134 0.143 0.147 0.263 0.166 0.102 0.148 0.158 0.204 0.341 0.200 0.070 0.149 0.129 0.209 0.214 0.170Health care 0.119 0.133 0.142 0.146 0.162 0.139 0.106 0.159 0.164 0.178 0.242 0.177 0.122 0.157 0.166 0.188 0.220 0.174 0.108 0.139 0.113 0.128 0.139 0.127productsBaby products 0.004 0.005 0.005 0.007 0.008 0.006 0.009 0.003 0.002 0.004 0.001 0.003 0.002 0.003 0.004 0.005 0.006 0.004 0.003 0.003 0.013 0.007 0.003 0.006Miscellaneous 0.187 0.257 0.328 0.451 0.762 0.378 0.117 0.162 0.191 0.380 0.606 0.324 0.189 0.202 0.343 0.454 0.994 0.469 0.224 0.187 0.289 0.326 0.505 0.340Number of 1632 1741 1762 1779 1812 8726 143 164 216 234 357 1114 420 501 541 557 723 2742 174 181 248 422 636 1661households

tobacco products and on fuel for household use. Male breadwinner households,female-breadwinner households and dual-earner households in the richest (5th)quintile bear the highest tax incidence on fuel for transport, medical expendi-ture, housing, and alcohol, compared to households in the poorest quintiles andto female-breadwinner households (the exception is medical expenditure,which is higher among female-breadwinner households). The richest female-breadwinner households have the highest incidence of all households on collec-tive forms of transport.
For male-breadwinner households, the tax incidence is increasing with level ofexpenditure for meals out and private transport, and this trend is reversed forbasic processed food, tobacco and housing. For female-breadwinner households,the tax incidence is felt more by the higher bracket of household expenditure oncollective forms of transport and health care products. For both dual-earner andno-earner households, taxes are increasing as the level of expenditures decreaseson basic foods and this pattern is reversed for fuel transport, communication, andrecreation and baby products. Tax incidence remains nearly proportional forchildren’s clothing (see El Bouazzaoui et al. 2009).
In conclusion, the poorest brackets of consumers bear the highest tax incidenceon the basic goods, and the richest bracket bears the highest tax on alcoholicdrinks. Female breadwinners bear a higher tax incidence on basic processed foodsand collective forms of transport, while male breadwinners bear a higher tax inci-dence on meals out, tobacco, private transport and fuel for transport, and thisshows that the male-earner household are better off economically as compared tofemale households.
Policy simulations
Government revenue from current tax rates is estimated at 16,014 billion dirham.The losses or gains on this revenue due to the various scenarios in our simulationswill be computed with reference to this current value.
We simulated two policy experiments. The first simulates changes in ratesfor selected household goods, namely food, leisure and recreation. Between2000 (the year of our data) and 2009, the Moroccan government made a numberof changes to the VAT rates on these items. VAT rates were increased on anumber of basic food items, a number of tobacco products and leisure goods(especially computer games, which were previously exempt from VAT andare now taxed at the top VAT rate of 20 per cent). The first scenario appliesthe new 2009 rates to the 2000 expenditure data. The objective was to see theimpact on tax incidence if the prevailing tax rates of 2009 were applied to theconsumption pattern of the year 2000–01. The second scenario reduces tax rateson three staple products – tea, coffee and edible oil – and balances that by anincrease of tax rates on tobacco and leisure. This scenario maintains revenueneutrality by applying the maximum VAT rate on these two items. Box 7.3shows the VAT rates on 19 items in 2000, along with the rates in 2009 and inthe two simulations.
198 A. El Bouazzaoui, A. Fazouane, H. Jalal and S. Saidi

Box 7.3 VAT rates for 19 expenditures in 2000, 2009 and policy simulation, Morocco
Item code Expenditure item VAT rate(2000)
VAT rate(2009)
Simulation
DAMP016 016 Pasta 7 10 7
DAMP031 031 Butter Exemption 14 Exemption
DAMP032 032 Edible oil 7 10 0
DAMP111 111 Tea 14 14 7
DAMP112 112 Coffee 14 20 7
DAMP121 121 Salt Exemption 10 Exemption
DAMP161 161 Cigarettes and Cigars Exemption 20 20
DAMP162 162 Tobacco (includingcigarettes)
Exemption 20 20
DAMP163 163 Other smoked products Exemption 20 20
DAMP715 715 Computer and videogames appliances
Exemption 20 20
DAMP724 724 Pets Exemption Exemption 20
DAMP731 731 Cinema, theatre, musicperformances, shows andassimilated activities
0 0 20
DAMP732 732 Sports shows Exemption Exemption 20
DAMP733 733 Other commonentertainment activities
Exemption Exemption 20
DAMP735 735 Books (excl. schooltextbooks), newspapers andassimilated
Exemption Exemption 20
DAMP736 736 Photos and films 0 Exemption 20
DAMP737 737 Gambling games Exemption 20 20
DAMP738 738 Audiovisual subscriptions 7 7 20
DAMP741 741 Expenditure related toholidays spent abroad (4 daysminimum)
10 10 20
DAMP742 742 Expenditure related toholidays spent in Morocco (4 days minimum)
10 10 20
DAMP743 743 Expenditure related toweekend leisure activities orshort trips abroad
10 10 20
DAMP744 744 Expenditure related toweekend leisure activities
10 10 20

Impact on government revenue
As noted above, based on the consumption survey of 2000–01, total govern-ment tax revenue amounted to somewhat more than 16 billion dirham. Ourfirst scenario, which applies the 2009 rate to selected items based on the 2000consumption pattern, raises government revenue to 17.5 billon dirham, Oursecond scenario, which cuts the tax rate on tea from 14 per cent to 7 per centand on edible oil from 7 per cent to 0 per cent while increasing the tax rate ontobacco from 0 to 20 per cent and boosting the rates of the entire recreationcategory to 20 per cent, generates a slight increase in total revenue, to 16.5billion dirham.
Globally, the first scenario increases government revenue by 9 per cent and thesecond by 3 per cent. The gain in government revenue generated by increasingtax rates has differential effects on tax incidence across the various categories ofhouseholds.
In the first scenario, 40 per cent of the 1.5 billion dirham increase in govern-ment revenue comes from households in the richest (5th) quintile, 24 per cent ispaid by the 4th quintile and 28 per cent by the middle (2nd and 3rd) quintiles.The poorest (1st) quintile contributes only 8 per cent (see El Bouazzaoui et al.2009, Table 21).
Similarly, in the second simulation, the 4th and 5th quintiles pay 20 per centand 68 per cent, respectively, of the increase in the government revenue. The 2ndand 3rd quintiles contribute about 12.5 per cent, while the poorest quintile isbarely affected (see ibid.).
Impact on household employment categories
Table 7.11 shows the variation between the suggested new tax rates and the taxrates of 2000 by quintile, household employment category and presence of childrenin the household. The results of simulating the 2009 rates to selected expendituresin 2000 show that tax incidence on all households increases but, regardless of thepresence of children in the household, male-breadwinner households experience thelargest increase – about 12 per cent – in tax incidence among all household types.Dual-earner households bear the second highest increase in overall incidence, 11.3per cent, but the distribution varies by quintile and presence of children. Dual-earner households with children in the poorest quintile and dual-earner householdswithout children in quintiles two and three experience a 16 per cent increase, andthese contributions are larger than those experienced by male-breadwinner house-holds. Female-breadwinner households without children in the second quintile, andthe poorest households with no employed adults also bear about 13 per cent of theincrease in tax incidence, but as noted, this is less than either male-breadwinner ordual-earner households. Broadly, these results show that the 2009 rates have dispro-portionately increased the incidence of VAT on poorer households. The genderresults show that: male breadwinners with/without children in the poorest bracket(Q2–Q4) bear a higher tax incidence than females, and this pattern remains validacross most quintiles.
200 A. El Bouazzaoui, A. Fazouane, H. Jalal and S. Saidi

Table 7.12 shows the results of simulating rate reductions on tea, coffee andedible oil and rate increases on leisure and recreation goods by quintile, presenceof children in the household and employment category. The gender pattern ismixed: tax incidence declines among some household types, such as total inci-dence for female-breadwinner households and households with no one employed,but increases among others, such as dual-earner households.
Regardless of the presence of children in the household, the data suggest thatfemale-breadwinner households in the lowest three quintiles benefit most from thedecrease in tax incidence; the pattern is similar for households with no employedadults (except for households without children in the second quintile). In contrast,male-breadwinner and dual-earner households generally experience the heaviesttax incidence increase in this exercise, except for the poorest male-breadwinner anddual-earner households who also experience reductions in tax incidence but by lessthan female-breadwinner households. Comparing the households with and withoutchildren, we note that, in general, households that bear the largest burden of thechanges in tax rates are those without children. The results of this simulation sug-gest that these changes are both pro-poor and gender-sensitive.
Conclusion and policy recommendations
Our review of the personal income tax code in Morocco reveals the existence ofboth implicit and explicit gender bias. Implicit gender bias arises from the man-ner in which tax deductions are structured. Certain groups of employees – casino
Gender equality and taxation in Morocco 201
Table 7.11 Simulation 1: Tax incidence using 2009 tax rates applied to yr 2000 expenditure (byquintile, household employment category and children), Morocco (%)
Quintile Dual-earner Female- Male-breadwinner No-employed Totalbreadwinner
Without Q1 9.2 6.7 11.4 14.6 11.1children Q2 16.9 14.7 16.5 16.4 16.5
Q3 16.0 9.9 15.3 8.7 14.4Q4 11.9 10.5 14.7 11.7 13.2Q5 7.8 5.8 10.5 7.7 8.8Total 11.2 8.0 12.9 9.6 11.5
With Q1 15.9 11.9 14.9 13.5 14.9children Q2 14.2 12.5 13.1 10.9 13.2
Q3 12.9 11.2 13.2 9.7 12.9Q4 10.6 9.4 11.1 9.8 10.8Q5 6.6 5.9 7.4 6.8 7.0Total 11.4 9.8 12.0 9.6 11.6
Total Q1 15.7 11.6 14.9 13.6 14.8Q2 14.4 12.8 13.2 11.6 13.4Q3 13.3 11.0 13.4 9.6 13.0Q4 10.8 9.7 11.5 10.2 11.1Q5 6.9 5.9 8.1 7.2 7.5Total 11.3 9.4 12.1 9.6 11.6

workers, night workers and selected other professions – can claim deductions ofup to 28,000 dirham per year according to specific formulas. Males predominatein these professions. More broadly, deductions for certain types of expenses thatmay enable women to participate in paid employment – such as child care – arenot available.
Explicit bias exists in the way that the PIT code defines dependants. A male ispermitted to claim allowances for his wife, his own children and other childrenfor whom he has his legal responsibility, while a female can claim these only ifshe is able to prove that her husband and children are legally dependent on her.
Our analysis of the incidence of indirect tax suggests that male-type house-holds and higher-income households bear a higher incidence of indirect taxes,which conforms to the principles of vertical equity. However, the analysis showsthat dual-earner households bear the highest tax incidence across all types oftaxes: total, VAT, excise and fuel. As noted above, this seems to provide rein-forcement to the male-breadwinner model of the household.
The analysis of tax incidence by consumption shows that because the expendi-ture patterns of women and men differ, the impact of indirect taxes differs as well.The analysis reveals that female-breadwinner households have a higher tax inci-dence on basic processed foods, collective forms of transport and on health careproducts, while male-breadwinner households have a higher tax incidence onmeals out, tobacco, private transport and fuel for transport. Across quintiles, thetax incidence on basic processed foods is steadily benefiting to the lowest bracketof expenditure. Tax incidence on basic foods is second highest, after tobacco
202 A. El Bouazzaoui, A. Fazouane, H. Jalal and S. Saidi
Table 7.12 Simulation 2: Tax incidence with selective rate increases and decreases applied toyr. 2000 expenditure (by quintile, presence of children and employment category),Morocco (%)
Quintile Dual-earner Female-breadwinner Male-breadwinner No-employed Total
Without Q1 −8.3 −11.6 −6.3 −4.0 −6.7children Q2 6.9 −5.1 1.1 2.6 2.6
Q3 7.1 −5.9 1.8 −6.7 1.8Q4 4.4 −2.2 4.7 −2.3 3.0Q5 5.3 0.4 5.5 0.0 3.9Total 5.2 −1.6 3.9 −1.1 2.9
With Q1 1.7 −5.0 −0.9 −3.6 −0.7children Q2 3.0 −2.9 0.5 −1.9 0.7
Q3 4.1 −0.8 3.2 −2.2 2.9Q4 4.4 1.4 3.5 1.3 3.4Q5 4.6 1.8 3.5 0.9 3.5Total 3.7 −0.7 1.9 −0.6 2.1
Total Q1 1.4 −5.3 −1.0 −3.6 −0.8Q2 3.4 −3.2 0.5 −1.3 0.8Q3 4.5 −1.6 3.1 −2.8 2.8Q4 4.4 0.4 3.6 0.6 3.4Q5 4.7 1.2 3.9 0.5 3.6Total 3.9 −1.0 2.1 −0.7 2.2

products, for dual-earner households, and highest of all for households with noemployed persons.
Following this analysis, we ran two tax policy simulations to determine howtax rate changes would affect the tax burden on households with a variety ofemployment and consumption characteristics. The first simulation focused onthree major categories of expenditure, namely food, leisure and recreation inorder to see what would happen if the prevailing tax rates of 2009 were appliedto the consumption pattern of the year 2000–01. The second scenario attemptedto determine the effect of reducing the tax rate on tea, coffee and edible oil, threestaples in Morocco, based on consumption patterns in the 2000–01 survey andincreasing tax rates on tobacco and recreation to compensate for revenue lossescaused by reducing the other rates.
The main finding of this exercise was that the first scenario increases govern-ment revenue by 9 per cent and the second scenario increases revenues by 3 percent, a difference of 1.5 billion dirham. In the first simulation the wealthiest quin-tile pays 40 per cent of the increase, while 24 per cent of the burden falls on the4th quintile, and 28 per cent on the 2nd and 3rd quintiles. The poorest quintilepays for only 8 per cent of the growth in government revenue. Looking at theresults by household employment category, male-breadwinner households bearthe largest burden of the tax increase, regardless of whether their household haschildren. The impact is greatest in the lowest three quintiles. Dual-earner house-holds have the second highest increase.
In the second simulation, the two wealthiest quintiles pay nearly all of the revenueincrease, 20 per cent and 68 per cent, respectively. The middle quintiles contributeonly 12.5 per cent and the tax burden of the poorest quintile stays virtually the same.
Policy recommendations: personal income tax
The findings on gender biases and gender discrimination in the Moroccan taxcode lead to several policy recommendations designed to promote greater equal-ity and fairness:
• Data and information systems. The Tax Administration must release tax-payer data disaggregated by sex.
• Reductions for family loads. Our review of the PIT code reveals that Article74 has an explicit gender bias, treating women as dependants of men. Thisprovision should be removed. CEDAW General Recommendation No. 21bars discrimination against women (‘Women must be treated as equal to menin tax laws; as individual, autonomous, citizens, rather than as dependants ofmen’). To be in compliance, the tax code must grant separate tax reductionsfor male and female breadwinners. Another option would be to providedirect transfers to families outside the tax code (see Chapter 1).
• Deductions. The tax code allows a deduction for professional expenses of 20per cent of the normal rate for both women and men. However, when we takeinto account the greater burden imposed on women for unpaid work, their
Gender equality and taxation in Morocco 203
narrower access to the formal labour market (they made up 27.3 per cent ofthat workforce in 2007), and the cost of paying others to perform householdtasks in their absence, it would be more equitable to give them a larger deduc-tion than men. This would also encourage them stay in the labour market.
• Efficiency. Criteria such as transparency, clarity, ease of use, durability andefficiency should be established to ensure that tax preferences are designedand drafted in a manner that ensures their effectiveness. In judging taxreforms, those responsible for monitoring and post-evaluation of perform-ance and results should pay particular attention to their success in promotinggender equality.
Policy recommendations: indirect taxes
The results of our indirect tax incidence analysis lead to several additional policyrecommendations:
• Any future changes in VAT should recognize that female-breadwinnerhouseholds already bear the highest VAT tax incidence and cannot afford tobe taxed more than other households.
• Tax reform should avoid the adverse effect of further tax incidence on somebasic goods that put a heavy burden on the poorest Moroccan consumers.This is vital, for example, regarding fuel for household use, and for tobacco,even if this last item is a demerit product.
• A combination of tax rate changes should be considered, with the goal ofincreasing the government revenue without burdening the poorest householdsexcessively. The second simulation presented here is an example of how thismight be done, since it simultaneously reduces tax rates on some goods (tea,coffee, edible oil) and balances that by increasing the VAT rate on otherexpenditures. This approach could generate a slight increase in total govern-ment revenue without burdening the poorest quintiles, since the tax incidenceincrease would fall primarily on the wealthiest category of consumers.
• However, it has to be recognized that the VAT system is Morocco is verycomplex – with four rates being applied at present. The system needs to beoverhauled. Our analysis suggests that this reform process should pay partic-ular attention to issues of gender.
This study of the Moroccan tax system highlights the manner in which tax sys-tems can reinforce gender inequalities. The personal income tax system is basedvery much on a male-breadwinner conceptualization of the household. Equally,the system of indirect taxes in Morocco needs some policy attention. One of thekey issues here is the complexity of the system. Our simulations suggest that the2009 reforms are not appropriate for Morocco – and our analysis reveals that poorhouseholds bear a disproportionate burden for these reforms. While reform isclearly needed, more careful attention to their impacts on poverty and genderinequality are required.
204 A. El Bouazzaoui, A. Fazouane, H. Jalal and S. Saidi

Notes
1 Royal letter addressed to the ‘Conseil Consultatif des Droits de l’Homme à l’occasiondu 60ème anniversaire de la Déclaration Universelle des Droits de l’Homme’.
2 This chapter is based on the Moroccan Country Study by Ahmed El Bouazzaoui,Abdessalam Fazouane, Hind Jalal and Salama Saidi, 2009. Available online at:www://sds.ukzn.ac.za/default.php?7,12,85,4,0.
3 This section is based on data from the employment survey of the High Commission forPlanning (2007).
4 For the public sector, calculations are based on data from the Statistical Yearbook ofMorocco, 1996 to 2007. For the private sector, calculations are based on statistics onpayroll provided by CNSS (National Social Security Fund), 1996 to 2008.
5 Authors’ calculations based on Statistical Yearbook of Morocco and CNSS data.6 Based on the rate of 8.5 dirham to US$1.
References
Akesbi, N. (2008) ‘Evaluation du système fiscal au Maroc’, La revue ECONOMIA no. 3,June–September 2008.
Economics and Finance Ministry, Kingdom of Morocco (2008) ‘Tableau de bord desfinances publiques’, December. Available at: www.finances.gov.ma/DEPF/publications/en_chiffres/ind_fin_pub/ind_fin_pub.pdf.
—— (2009) ‘Code général des impôts’. Available at: www.finances.gov.ma/esp_doc/util/file.jsp?iddoc = 2914.
El Bouazzaoui, A. Fazouane, A. Jalal, H. and Saidi, S. (2009) ‘Gender and Taxation:Moroccan Country Study’. Available at: www.sds.ukzn.ac.za/default.php?7,12,85,4,0.
Elson, D. (2006) Budgeting for Women’s Rights: Monitoring Government Budgets forCompliance with CEDAW, New York: UNIFEM.
High Commission for Planning, Kingdom of Morocco (1999–2007) Statistical Yearbookof Morocco, Rabat: HCP.
—— (2001) Enquête Nationale sur la Consommation et les Dépenses des Ménages, Rabat:HCP.
—— (2007) Activité, Emploi et Chômage en 2007, Rabat: HCP.Stotsky, J. (1997) ‘Gender bias in tax systems’, Tax Notes International, June 9,
pp. 1913–1923.
Gender equality and taxation in Morocco 205

8 Gender equality and taxation inSouth Africa
Debbie Budlender, Daniela Casale andImraan Valodia
Introduction
South Africa is a particularly interesting case study for understanding the gen-dered impacts of taxation. One of the major victories of the democratic transitionin South Africa was the commitment to gender equality, outlined in the newConstitution adopted after the political transition in 1994. This commitment hasbeen translated into a broad range of gender-related institutions, including theCommission on Gender Equality, as well as the numerous gender units that havebeen established within government departments. At a more global level, theSouth African government has ratified the Convention on the Elimination of AllForms of Discrimination Against Women (CEDAW) and agreed to a number ofinternational instruments, including the Beijing Declaration and Platform forAction, aimed at improving the status and condition of women.
Women in South Africa are also much better represented at the highest levelsof politics and the economy than they are in many other countries. Nevertheless,the majority of women continue to be economically marginalized (see Casale andPosel 2005; Hassim 2006). While there are some notable exceptions, for the mostpart, the political commitment to gender equality has not been matched at thelevel of policy implementation, and progress has been slow and concentratedamong women at the top of the income distribution.
One of the many ways in which these gender disparities are perpetuated, despitegovernment commitments, is through the differential impact of the national budgeton men and women, including not only expenditures, but also taxation. The firstpublication of the South African Women’s Budget Initiative (1996) thereforeincluded not only several chapters on public expenditure from a gender perspective,but also the first study of taxation from a gender perspective (Hartzenburg 1996).Based on research done in 1995, one year after the first democratic elections in thecountry, the chapter reviewed, among other things, some of the changes in personalincome taxes, pensions and retirement funds, unemployment insurance and medicalaid contributions, company taxes and value-added tax (VAT) in South Africa after1994. The overall conclusion of the research was that while the new governmenthad quickly addressed the explicit bias in the tax system which existed prior to1994, government needed to collect sex-disaggregated data on taxes and considerthe more subtle gender implications of its taxation policies.
In the fifth year of the Women’s Budget Initiative, Smith (2002) conducted a sec-ond study, which updated and expanded upon Hartzenburg’s work, particularlywith regard to capital transfer taxes, taxation of non-profit organizations, transferduties, the fuel levy and the then recently set up national lottery. Smith’s study alsoexamined changes in the status of the South African Revenue Service (SARS). Aspart of the same series, Goldman examined customs and excise from a gender per-spective (Goldman 2002), while Coopoo (2002) did the same with regard to localgovernment taxation. For the most part, these studies reached similar conclusionswith regard to the impact of taxation on gender equality, specifically, that althoughtax policies no longer explicitly discriminated against women, government neededto do much more to consider the gender impacts of its policies.
This chapter extends this work by updating previous studies of personalincome taxes (PIT) and indirect taxes, in order to determine which householdsbear the incidence of these different types of taxes and whether there are implicitor explicit gender biases. Following a review of the overall structure of taxationin South Africa, including tax reforms over the last few decades, it looks both atthe PIT and at the incidence of indirect taxes. It then presents some simulationsfor alternative taxation policies and concludes with recommendations for policychange.
Tax structure, trends and reform in South Africa
The structure of taxes in South Africa in the past two decades is shown in Table 8.1.In the most recent period, direct taxes have comprised 61 per cent of total revenue,with personal income taxes and corporate taxes the two largest contributors (30 percent and 27 per cent, respectively). Indirect taxes make up 39 per cent of total rev-enue, with the value added tax (VAT), the main component, contributing 26 per centof total revenue. The indirect taxes considered here – VAT, excises and fuel taxes –jointly make up 33 per cent of total revenue. Unlike other developing countries,South Africa does not rely very heavily on trade taxes for government revenues.
Some important changes can be seen over the past decade, especially the shiftaway from indirect taxes to direct taxes. While this shift is in line with govern-ment policy (see below), it has resulted less from active government policy thanfrom increased corporate tax revenues and more effective tax collection on thepart of SARS. Profit rates fell after the transition in 1994 but rose significantly inthe economic boom that took place after 1999. Although as a proportion of totalrevenue individual personal income taxes have fallen, collection of PIT hasincreased and SARS has been able to extend the PIT net.
Since the political transition, the African National Congress government hasbeen able to increase the tax/gross domestic product (GDP) ratio from 23 per centin 1993 to 28 per cent in 2007–08 (see Figure 8.1), thereby creating the fiscalspace needed for increased expenditure. This ratio is above the government’starget of 25 per cent for 2002 and beyond (National Treasury 1999). It is worthnoting also that actual tax collections by SARS have up until very recently con-sistently exceeded budget projections, and significant progress has been made inwidening the tax net and improving tax compliance.
Gender equality and taxation in South Africa 207

Table 8.1 Tax structure, South Africa, 1988–2008
Tax/source 1988–89 1998–99 2007–08of revenue
Revenue % of total Revenue % of total Revenue % of total raised tax raised tax raised taxin R’m revenue in R’m revenue in R’m revenue
Individuals 14,910 30 76,400 42 191,046 30Companies 11,244 22 23,330 13 176,471 27Other 657 1 5,558 3 23,978 4Total – direct 26,811 53 105,288 58 391,495 61taxesVATa 13,123 26 43,600 24 167,028 26Excise duties 2,508 5 8,338 5 22,083 3Fuel levy 2,555 5 13,600 8 26,434 4Customs duties 2,466 5 6,200 3 31,473 5Other 3,054 6 40,441 2 3,755 1Total – 23,707 47 75,782 42 250,773 39indirect taxesTotal tax revenue 50,518 100 181,070 100 642,268 100
Source: Authors’ calculations from National Revenue Account, National Treasury, South Africa.
Note: a South Africa levied a general sales tax prior to the introduction of VAT in 1991.
0
500,000
1,000,000
1,500,000
2,000,000
2,500,000
3,000,000
0.00
0.05
0.10
0.15
0.20
0.25
0.30
1994
1995
1996
1997
1998
1999
2000
2001
2002
2003
2004
2005
2006
2007
2008
2009
2010
Revenue GDP Revenue/GDP ratio
Figure 8.1 Tax/GDP ratio: South Africa 1994–2010.
Source: National Treasury (2008). Figures for 2009 and 2010 are projections.

The current process of reforming South Africa’s tax system began in 1986 withthe Margo Commission of Inquiry into the Tax Structure of the Republic of SouthAfrica. The Margo Commission was an important component of a more extensivereform programme of the then-apartheid government, which sought both to shiftthe economy onto more market-based principles and to incorporate segments ofthe black population into the economic mainstream (Morris and Padayachee1988). One of the main recommendations of the Margo Commission, of specificimportance to women, was that the unit of taxation for PIT be changed from thecouple to the individual. The Commission also recommended a move towardsa simpler income tax structure with fewer, broader income brackets and lowermarginal rates. Many of the Commission’s recommendations were accepted, butmarried couples continued to be taxed jointly.
In 1994, the new government appointed the Commission of Enquiry into CertainAspects of the Tax Structure of South Africa, known as the Katz Commission, toundertake a comprehensive review of the tax system. This appointment was partof the attempt by the new state to adopt a more developmental approach to eco-nomic policy, and to link taxation with issues of income distribution and povertyrelief.
In line with the recommendations of the Katz Commission, the SouthAfrican government has introduced a number of tax policy changes since1994. Some of the changes that relate broadly to gender equality include: theamendment of various tax laws in order to comply with the new Constitution,including the elimination of formal discrimination based on gender; the intro-duction of a unified income tax rate structure for individuals (i.e., eliminatingthe distinction between married and unmarried people, with its related differ-ence in treatment of women and men in respect of marital status); and theintroduction of tax relief for low- and middle-income taxpayers throughadjustments to tax rates and income tax brackets. Since 1994, the most signif-icant change in the tax structure has been the reversal of the emphasis on directtaxation, established by the Margo Commission in the mid-1980s, in favour ofindirect taxation.
Personal income taxes
In 1999, as a result of pressure from the Women’s Budget Initiative amongothers, SARS for the first time reported separately on the number of individualtaxpayers. As of October 1998, the total number of taxpayers was 2,263,079,of whom only 746,816 (33 per cent) were women (see Smith 2002). The muchsmaller number of women than men is expected given that more men than womenare employed, and employed men are more likely than employed women toearn above the tax threshold. This is borne out by Table 8.2, based on LabourForce Survey (LFS) data from September 2005, which suggests that nearly three-quarters (73 per cent) of employed women would not have had to pay PIT, ascompared to 65 per cent of men.
Table 8.3 gives the PIT tax rates for the financial year 2007–08. It shows thatPIT in South Africa is progressive, in that the percentage of income paid in tax
Gender equality and taxation in South Africa 209

increases with increases in taxable income. In 2007–08, given the level of the pri-mary tax rebate, taxation was imposed only when personal income reached alevel of R40,000 per annum (US$ 5,670)1 for those under 65 years and R65,000(US$ 9,214) for the elderly. Above this threshold, tax was charged at 18 cents inevery rand. For the highest income group, any amount over R450,000 per yearwas taxed at 40 cents in the rand.
In many respects, the PIT structure in 2007 is similar to that in 1994. Similaritiesinclude age-differentiated thresholds and rebates (although at different levels) aswell as the progressive structure of the tax. However, there also have been somesignificant changes.
One of the changes introduced during the early post-apartheid years was areduction in the number of tax brackets. Thus Hartzenburg (1996: 223) lists tenPIT brackets, as opposed to the six that are now in place. Smith (2002) observesthat this change helped reduce the impact of ‘bracket creep’ whereby inflation-linked increases in earnings push people into a bracket that is taxed at a steeper
210 D. Budlender, D. Casale and I. Valodia
Table 8.2 Distribution of employed people across tax brackets by sex, South Africa(September 2005) (%)
Tax bracket Male Female Total
No tax 65 73 68<R80,000 20 16 19R80,000–130,000 8 7 8R130,001–180,000 3 2 3R180,001–230,000 1 0 1R230,001–R300,000 1 1 1R30,001 plus 2 1 1Total 100 100 100
Source: Authors’ calculations from LFS, September 2005.
Table 8.3 Personal income tax rates, South Africa, 2007–08
Taxable income (R) Rates of tax (R)
1–100,000 18% of each rand100,001–180,000 20,250 + 25% of the amount above 112,500180,001–250,000 37,125 + 30% of the amount above 180,000250,001–350,000 58,125 + 35% of the amount above 250,000350,001–45,000 93,125 + 38% of the amount above 350,000450,001 and above 131,125 + 40% of the amount above 450,000Rebates (individuals only)Under 65 years 7,74065 years and older 12,420Tax thresholdsUnder 65 years 43,00065 years and older 69,000
Source: National Treasury (2007: 197).

rate than previously. Alongside this change, tax thresholds also increased. Someof this increase reflected adjustment for inflation, but the adjustment went beyondthis. Thus the top of the lowest bracket was R60,000 per annum in 1995–96 asagainst R100,000 in 2007–08, with the value of R60,000 in 2007 about R87,000in 1995/96 terms.
The PIT system is global in that the assessment is made on total income, irre-spective of source. Income from investments, limited to a maximum, for the taxyear 2007–08, of R19,000 for those under the age of 65 years and R27,500 forthose aged 65 years and older, is exempt. Certain deductions, including contribu-tions to medical insurance, retirement funds, subsistence and entertainmentallowances, travel expenses and donations to charities are allowed. There are nochild or dependant allowances. For those earning their income through trading,normal expenditure and losses incurred in the production of income are allowedas deductions before taxable income is determined. All of these deductions aresubject to limits.
Explicit and implicit biases in personal income taxes
During the apartheid years, the tax system contained several explicit elements ofgender discrimination. At the time of the first democratic elections, for example,the tax schedules defined a ‘married person’ as male, with a separate categoryprovided for ‘married women’. Married persons (male) were taxed at a lower ratethan unmarried persons (who could be male or female). Unmarried persons were,in turn, taxed at a lower rate than married women. Allowances for dependantsaccrued only to married men. There were also different primary rebates for thethree categories, and different provisions regarding deductions for contributionsto retirement annuity funds when calculating taxable income.
The distinction between married men and women was based on the assumptionsthat married couples would enjoy economies of scale; that a married women’sincome would be an ‘extra’ that could therefore be taxed at a higher rate; and thatmarried couples would share their income equitably so that the higher rate on thewoman’s income would be offset by the lower rate on the man’s income. To caterfor atypical or ‘unusual’ families, provision was made for a married woman whowas the main earner to have herself declared a ‘married person’. These provisionsclearly constituted direct formal discrimination in terms of both gender and mari-tal status, both of which were explicitly outlawed by the new Constitution. Thus,from March 1995, in line with both the Constitution and the first report of the KatzCommission, a single tax structure was imposed on all individuals irrespective ofgender or marital status, a single primary rebate (for those under 65 years) wasintroduced, and the differential retirement annuity deductions were removed. Therebates for dependants were also removed. Since 1995, no rebates are allowed forchildren or other dependants.
While theses changes eliminated explicit formal gender discrimination in thetax system, Smith (2002) argues that they have in fact introduced a new form ofinequity into the system. Smith questions whether removing discriminatory
Gender equality and taxation in South Africa 211

gender and marital provisions resulted in a more equitable system. He comparestwo hypothetical households, both containing two adults and two children. Thefirst household consists of a husband who earns R2,000 per month, a wife whoearns R1,000 per month and their two children. The second household consists ofan employed woman who earns R3,000 per month, her two children, and her non-earning mother. He shows that the earlier tax regime placed these two householdsin more or less equal positions given their equal needs, but with some reductionin tax for the married couple so as not to discourage women’s employment. Thetaxes that the households would have owed in 1994–95 were R3,435 and R5,055respectively, the married couple paying less tax than the single-income house-hold. After removing the discriminatory provisions, however, and using the1999–2000 tax tables, the first household pays R850, while the second paysR3,460, more than four times as much.
Although formal discrimination on the basis of gender and marital status hasbeen removed, it seems to have been replaced by a more severe, indirect form ofdiscrimination against the non-nuclear family. The issue is not insignificant in acountry where only 50 per cent of employed women aged 15 years and above arerecorded as married or living with a partner, and a further 36 per cent report neverhaving been married, according to the General Household Survey of 2005.
As this discussion illustrates, the PIT system still contains some implicitbiases. These biases are not simple gender biases in the sense of treating womendifferently from men. Instead, they discriminate against women with particular –and common – forms of living arrangements.
Two further examples of gender-related bias are found in the Standard IncomeTax on Employees (SITE) tax deductions and tax payments for non-standardemployment.
Standard Income Tax on Employees tax deductions
Tax on employees’ earnings is deducted at source by employers and paid overto SARS. This tax is divided into two categories: one, known as SITE isdeducted for all employees earning up to R60,000 (2005–06); the other, knownas Pay As You Earn (PAYE), is deducted on the remainder of the earnings ofthose earning above R60,000. Only those subject to PAYE are required by lawto submit an annual tax return so that SARS can reconcile total earnings withdeductions made through the SITE and PAYE system. The SITE system there-fore exists to ease the administrative burden of PIT, and the assumption ismade that taxes collected by the employer and passed on to SARS are donecorrectly.
For the higher earning employee, the distinction between SITE and PAYE isnot all that important. For those who fall below the SITE cut-off, more likely tobe women than men, the absence of a requirement to submit an individual taxreturn can be seen as an advantage. It may create a disadvantage, however, whena person does not earn consistently over the year, as the tax will be deducted onthe assumption of consistent monthly earnings.
212 D. Budlender, D. Casale and I. Valodia

In cases where income and tax obligations fluctuate and the person submits atax return, SARS makes the adjustments either through a refund or by requiringadditional payment. In similar cases but where the person does not submit a taxreturn, the employer is meant to make the adjustment at the end of the tax year.The problem is that many employers do not do this, and many employees may beunaware of, or unable to enforce, their right to an adjustment. For the most part,the error is likely to work against the employee, for example, where she or he didnot work a full year. These workers will then have paid more than they need topay, out of already small earnings. Women, more than men, are less likely towork a full year, because of reproductive demands among others.
The upper SITE threshold has remained at the level of R60,000 since 1998.Since this time, two factors have probably reduced the impact of SITE. First,many taxpayers, through inflation-related wage increases, would have migratedout of the SITE system. Women, who are more likely than men to have low earn-ings, would have formed a significant proportion of these taxpayers. As a result,whereas in 1998, according to Smith (2002), women accounted for 33 per cent oftaxpayers above the SITE threshold, this increased to 42 per cent in the 2008–09tax year (National Treasury 2007; SARS 2008: 32). Second, while the upperSITE threshold has remained at R60,000, the lower threshold has changed. In2008–09 at R54,200, it was very close to the SITE threshold. SITE is thus nowpaid on a very small band of income. Given that the gap between the SITE andtax thresholds is now so small, the Treasury is considering scrapping the SITEsystem and replacing it with a waiver on the requirement to submit a tax returnfor taxpayers with only one employer.
Tax payments for non-standard employment
A similar bias results from the fact that SARS applies an administrative rule forpersons in non-standard employment (part-time or casual employment), requiringthe employer to deduct 25 per cent of earnings for SITE and PAYE. These work-ers are meant to submit a tax return at the end of the financial year but, given thatmany may be relatively unskilled and unfamiliar with this procedure, largenumbers are unlikely to submit returns and may bear an unfair burden.
Another example of implicit bias, which typically operates against women,relates to the taxation of retirement earnings. Retirement-related taxes are coveredby both the Income Tax Act, 1962 and the Tax on Retirement Funds Act, 1996.There have been significant changes over the period under review in the way inwhich retirement-related income is dealt with. In March 1996, for example, a tax of17 per cent was introduced on retirement fund incomes. The rate was increased to25 per cent from 1 March 1998, but by 2006 had dropped again to 9 per cent. Thetax is applied to pension, provident, retirement annuity and untaxed policy-holderfunds of long-term assurance companies (SARS 2006).
A 2007 discussion document produced by the Department of Social Develop -ment in relation to social security reform notes that tax can be levied (or subsi-dies provided) on retirement money at three different points: at the point where
Gender equality and taxation in South Africa 213

contributions are made; at the point where investments increase in value; and atthe point when benefits are received. South Africa currently exempts contributionsfrom tax, and taxes both investment earnings and benefits received. TheDepartment’s document notes, however, that the tax rate on retirement fund inter-est earnings was decreased substantially from 18 per cent to 9 per cent in 2006. Itobserves that this change ‘altered the balance significantly in favour of higherincome groups’ (Department of Social Development 2007: 80).
More generally, the document estimates that the subsidy of contributions pro-vided by the South African tax regime amounted to about R17.8 billion net ofdeferred taxation in 2005. When the subsidy on retirement investment earnings isadded, the amount was R28.5 billion (ibid.: 11). The Department notes that thisamount is far larger than the R8 billion that it would cost to universalize the oldage pension by removing the means test. In essence, then, the government is pro-viding far greater assistance to wealthier people in respect of provision for retire-ment than it would if it dropped subsidies and universalized the old age grant.Thus subsidies that are generally motivated on the grounds that they will encour-age people to save for their own coverage, rather than depending on government,cost more than would government provision.
As noted above, contributions are exempt from tax, at least up to a certainamount. For contributions, the individual can deduct up to 7.5 per cent of remu-neration or R1,750, whichever is the greater, when calculating taxable income.Those contributing for themselves (and who may or may not be employees) toretirement annuities can deduct up to 15 per cent of taxable income, or R3,500less current deductions to a pension fund, or R1,750. In essence, these deductionsconstitute subsidization of retirement coverage for the individuals concerned.
Surveys give some idea of the extent of coverage of employees in terms ofemployer contributions. In the Labour Force Survey of March 2006, employerswere said to make contributions to a pension or other retirement fund for 55 per centof male employees, as opposed to 48 per cent of female employees. In absoluteterms the differences are even greater because a smaller number of women thanmen are employed overall. Thus employer contributions were made on behalf of3.2 million male employees versus 1.9 million female employees. This suggeststhat subsidies for pension contributions disproportionately benefit men.
Hypothetical PIT payments
Table 8.4 shows hypothetical PIT payments for different household types at vary-ing levels of income, namely, half the median, the median and twice the medianincome. The median household income in South Africa for 2005 is estimated atR26,291. Reflecting the very unequal distribution of income, the median incomeis significantly lower than the average household income of R74,588 (StatisticsSouth Africa 2008).
Unfortunately, the results for South Africa are not very revealing for a numberof reasons. First, there is no dependant allowance so, unlike some other countriesin the project, whether the male or female member of the household enjoys this
214 D. Budlender, D. Casale and I. Valodia

benefit is irrelevant. Second, because of the skewed income distribution, allhouseholds at the median and half the median do not pay any personal incometaxes. Third, South Africa has a global, not schedular, income tax system so thesource of the income is also irrelevant. Table 8.4 shows that only single-incomehouseholds at twice the median income pay personal income taxes. However, thisresult does reinforce the important point made earlier that horizontal inequityexists across households with the same total income.
Indirect tax incidence
This section examines the incidence of indirect taxes from a gender perspective,explaining how households are classified in terms of their ‘gender’ characteris-tics and describing the distribution of individuals across the varying householdtypes in South Africa. After reviewing the results, we consider further possiblepolicy changes to the indirect tax system.
The indirect tax rate structure
Indirect taxes contribute just under 40 per cent of tax revenue in South Africa. Themain component is the VAT, which accounts for 25.7 per cent of total tax revenue(see Table 8.1), with much smaller shares derived from excise duties (3.4 percent), the fuel levy (4.2 per cent) and customs duties (4.7 per cent).
In South Africa, the VAT is a multi-stage single-rate tax levied on the consump-tion of most goods and services (whether they are produced locally or imported).The VAT rate has remained at 14 per cent on the value of most goods and servicessince 1993, although there are a number of zero-ratings and exemptions. Zero-rated goods and services, include: basic food items (brown bread, eggs, vegetableoil, grains, rice, milk, fresh fruit and vegetables, dried legumes and canned fish),illuminating paraffin, goods subject to the fuel levy (petrol and diesel), interna-tional transport services, certain farming inputs, sales of going concerns and cer-tain government grants. The zero-rating of basic food items and paraffin (usedpredominantly by the poor as a fuel for cooking, lighting and heating) was imple-mented specifically to alleviate the burden of VAT on poorer households.2
Gender equality and taxation in South Africa 215
Table 8.4 Hypothetical tax burden of PIT for households, South Africa, 2007–08 (Rands)
Half the median Median Twice the median
Total households 13,146 26,291 52,582Single-income household NIL NIL 1725Dual-earner household Equal earners NIL NIL NILDual-earner householdMale or female earns twice as NIL NIL NILmuch as partner
Source: Authors’ calculations.

The goods and services which are VAT-exempt are residential rental andaccommodation; educational services (including child-care centres or crèches);public road and rail transport; non-fee-related financial services; and medicalaid and medicine/medical services provided by public health institutions.Unlike with goods that are zero-rated, suppliers of VAT-exempt goods are notable to claim back the input VAT. This implies that, to the extent that the inputsattract VAT themselves, some of the VAT may be passed on to the final con-sumer. An effective rate would be between zero and 14 per cent. However, forthis project, we rate these goods at zero per cent, given that the largest inputcost in these sectors is likely to be labour. While we could estimate the effec-tive VAT rate from an input–output table for South Africa, this would lead to aloss of detail (and precision) as the Income and Expenditure Survey that we usehas far more detailed expenditure categories than the input–output table that isavailable.
Specific unit excise duties are levied on sorghum meal, non-alcoholic bever-ages, alcoholic beverages and tobacco products. Details of these unit taxes areprovided in Table 8.5. It is important to note that the taxes on alcoholic beveragesand tobacco are particularly high. The fuel levy is also a unit tax, levied at 110.1cents per litre of petrol and 89.4 cents per litre of diesel. For this study, we cal-culate the incidence of the fuel levy on petrol and diesel for household use andfor private transport only. We do not estimate the impact of a transfer of the fuellevy onto the consumer where fuel is an input in other production processes.However, we do make a rule-of-thumb adjustment for the public transport sec-tor, where it is assumed that the total amount of the fuel levy is passed on to theconsumer and that fuel constitutes 30 per cent of input costs in this sector.
Data and definitions
The expenditure data used to calculate the tax incidence are drawn from theIncome and Expenditure Survey (IES) of 2000.3 The IES is conducted everyfive years by the national statistical agency, Statistics South Africa, among anationally representative sample of 30,000 households. The survey containsvery detailed information on the spending patterns of households, with data onalmost 600 expenditure items.4 The tax rate and price information used to cal-culate the tax incidence per item comes from various government sources(National Treasury 2000; South African Revenue Service VAT Guide forVendors; monthly retail prices collected by Statistics South Africa 2000).5
To estimate the gendered incidence of indirect taxes, we use three sets ofhousehold classifications that categorize households as ‘male-type’ or ‘female-type’. The first, based on the number of male and female adults (aged 18 yearsand older) in the household, includes three categories: adult male-majority house-holds, adult female-majority households and equal-number adult households. Thesecond and third classifications take into account gendered spending power in thehousehold by adding the dimension of control over resources, measured throughheadship and employment status.
216 D. Budlender, D. Casale and I. Valodia

Table 8.5 Indirect tax rates and specific duties, South Africa
Tax Item Ad valorem rate/specific duty
VATVAT-rated Most goods and services (incl. imports) 14%Zero-rated goods 19 basic food items 0%
(brown bread, dried mealies and mealie rice, brown bread flour, samp, eggs, fruit, vegetables, dried beans, lentils, maize meal, rice, pilchards in tins or cans, vegetable cooking oil, milk, cultured milk, milk powder and dairy powder blend, edible legumes and pulses of leguminous plants, i.e., peas, beans and peanuts)ParaffinExportsPetrol and dieselFarming inputsSales of going concernsCertain grants by government
Exempt goods Residential rental and accommodation Assumed to be 0%Educational services (including creches) Public road and rail transport Non-fee-related financial services Medical aid and medicine/medical services provided by public health institutions
Excise duties Preparations of sorghum for making 33 cents/kgbeveragesMineral water and non-alcoholic 8 cents/litrebeveragesBeer 2,239 cents/litre of
absolute alcoholSorghum beer 745 cents/100 litresUnfortified wine 6,790 cents/100 litresFortified wine 15,360 cents/100 litresSparkling wine 18,811 cents/100 litresSpirits 303,365/100 litres of
absolute alcoholCigars 56,989 cents/kgCigarettes 141.5 cents/10
cigarettesCigarette tobacco 6,412 cents/kgPipe tobacco 3,893 cents/kg
Fuel levya Petrol 110.1 cents/litreDiesel 89.4 cents/litre
Source: Budget Review 2000, Department of Finance, South Africa.
Note: a The levy consists of a fuel levy component and a Road Accident Fund component.

The headship classification consists of male-headed and female-headed house-holds.6 We recognize that the concept of headship is problematic and, in particular,often does not capture the phenomenon that analysts assume it does (Budlender2003). However, we have used it here to be consistent with the other countries inthis volume, and because it does highlight an important gendered group in SouthAfrica. Households that report being headed by women are concentrated at thelower end of the income distribution, and draw their resources predominantly fromfemale employment, migrant labour remittances and social grants.
The employment classification results in four categories of household – ‘male-breadwinner households’ with at least one employed adult male and no employedadult females,7 ‘female-breadwinner households’ with at least one employedadult female and no employed adult males, ‘dual-earner households’ with at leastone employed adult male and one employed adult female, and households withno employed persons. In South Africa, this latter group consists mostly of house-holds where either pensions and grants (predominantly through the government’ssocial welfare programme) or remittances from migrant workers form the mainsource of income (87 per cent of all no-employed households), with a muchsmaller proportion of households reporting the sale of farm products or other non-farm income as the main source.8
Table 8.6 shows the distribution of individuals across the different householdtypes (see the last column). In South Africa, 40 per cent of individuals live infemale-headed households, a far higher percentage than in other countries.Among other reasons, this is due to a high incidence of labour migration, partic-ularly among men (resulting in the female in the household being reported as thede facto resident head), and relatively low levels of marriage and partnership.
For South Africa, there is a large overlap across the three gendered householdclassifications (see Casale 2009: Table 4). For example, just over 80 per cent offemale-headed households fall into two employment status categories: 40.7 percent are in the ‘female-breadwinner’ category and 40.6 per cent are in the ‘no-employed’ category. The majority of female-headed households (71 per cent) arefemale adult majority households. About 73 per cent of female adult majorityhouseholds fall into the categories of ‘female-breadwinner’ (36.6 per cent) and‘no-employed’ (35.9 per cent).
The female-type households and those with no employed tend to be among theless well-off, concentrated in the lower quintiles of the expenditure distribution.In contrast, the male-type households, the dual-earner households, and the equalnumber adult households are more heavily concentrated at the upper end of theexpenditure distribution (Casale 2009). This means that any tax policy that haspositive gender equality implications will also result in strong income equalityoutcomes.
Gendered indirect tax incidence analysis
The results of the incidence analysis are presented in Tables 8.6 to 8.8. Table 8.6reports the overall tax incidence for the different household types using the three
218 D. Budlender, D. Casale and I. Valodia

gendered household classifications. Due to the strong correlations across house-hold categories noted above, the story that emerges from these results is consis-tent regardless of which household classification is used. Total indirect taxincidence is lower in female-type households than in male-type households, byaround a full percentage point on a base of approximately 8 per cent. This resultalso holds for the different types of taxes, specifically VAT, excise duties and thefuel levy. The pattern of incidence among households with no employedmembers is similar to the pattern among female-type households, while the dual-earner and equal-number adult households resemble the male-type households intheir tax incidence.
While there are statistically significant gender differences for all three types oftaxes, the largest gender differentials are reported for the excise duties and thefuel levy.9 Most of the excise and fuel tax burden borne by male-type householdsis a result of their larger expenditure on alcohol and tobacco and on fuel for pri-vate transport. The gender difference in the incidence of the fuel levy would havebeen even more pronounced if we had not adjusted for the pass through of the fuellevy to consumers in the public transport sector. This is because female-typehouseholds (and households with children) are relatively more intensive users ofpublic transport, while male-type households (and households without children)are relatively more intensive users of private transport.
Table 8.7 and Figures 8.2 to 8.5 report the incidence results for the employ-ment status classification only, disaggregated by expenditure quintile and thepresence of children (aged 17 years or younger) in the household. For the mostpart, regardless of the presence of children in the household or the quintile,
Gender equality and taxation in South Africa 219
Table 8.6 Overall indirect tax incidence by household type, South Africa (% of expenditure)
Total tax VAT Excise tax Fuel tax Distribution of individuals acrosshousehold types (%)
Household sex compositionAdult male-majority 9.23 7.29 1.1 0.84 21.9Adult female-majority 8.13 7.07 0.47 0.59 42.0Equal-number adult 8.84 7.12 0.85 0.88 36.1Employment categoriesMale-breadwinner 9.36 7.36 1.12 0.88 26.4Female-breadwinner 8.14 7.05 0.45 0.64 21.6Dual-earner 9.15 7.13 0.89 1.14 24.2No-employed 7.84 6.99 0.49 0.37 27.8HeadshipMale-headed 9.06 7.17 0.96 0.94 59.1Female-headed 7.99 7.08 0.44 0.48 40.9
Source: Authors’ calculations from IES 2000.
Note: Data are weighted.

Table 8.7 Indirect tax incidence by employment status, presence of children and quintile, South Africa (% of expenditure)
Quintile Total tax VAT Excises Fuel Total tax VAT Excises Fuel Total tax VAT Excises Fuel
Total male-breadwinner Male-breadwinner children Male-breadwinner w/o children
1 8.17 6.98 0.85 0.35 8.13 6.97 0.81 0.35 9.36 7.25 1.85 0.262 8.95 7.4 1.08 0.47 8.88 7.38 1.01 0.48 9.77 7.6 1.85 0.323 9.64 7.78 1.24 0.62 9.61 7.83 1.15 0.64 9.82 7.51 1.77 0.544 9.92 7.53 1.31 1.08 9.77 7.54 1.12 1.11 10.22 7.51 1.67 1.045 9.36 6.97 0.99 1.4 8.83 6.64 0.65 1.53 9.84 7.26 1.29 1.29Total 9.36 7.36 1.12 0.88 9.14 7.34 0.98 0.82 9.95 7.39 1.51 1.06
Total female-breadwinner Female-breadwinner children Female-breadwinner w/o children
1 6.9 6.27 0.29 0.33 6.87 6.26 0.29 0.32 8.36 7.03 0.59 0.742 8.2 7.27 0.52 0.41 8.2 7.28 0.52 0.4 8.18 7.08 0.58 0.513 8.72 7.59 0.49 0.64 8.78 7.65 0.47 0.66 8.36 7.23 0.61 0.524 8.73 7.43 0.53 0.77 8.83 7.5 0.55 0.78 8.41 7.19 0.47 0.745 8.08 6.41 0.41 1.25 7.87 6.19 0.4 1.28 8.37 6.73 0.43 1.21Total 8.14 7.05 0.45 0.64 8.11 7.06 0.45 0.6 8.37 7.01 0.5 0.86
Total dual-breadwinner Dual-earner children Dual-earner w/o children
1 7.95 6.73 0.9 0.33 7.94 6.72 0.89 0.33 8.62 7.07 1.35 0.212 9.24 7.45 1.23 0.57 9.22 7.45 1.19 0.58 9.72 7.43 1.9 0.383 9.5 7.7 1.04 0.76 9.48 7.71 0.97 0.8 9.79 7.67 1.79 0.334 10.07 7.78 1.01 1.27 10.02 7.73 0.95 1.34 10.35 8.09 1.39 0.875 8.69 6.4 0.61 1.68 8.57 6.35 0.56 1.66 8.99 6.54 0.74 1.71Total 9.15 7.13 0.89 1.14 9.11 7.14 0.86 1.11 9.39 7.02 1.03 1.33
Total no-employed No-employed children No-employed w/o children
1 7 6.39 0.39 0.23 6.98 6.38 0.37 0.23 7.66 6.48 0.97 0.212 7.82 7.12 0.44 0.26 7.83 7.14 0.43 0.26 7.76 6.84 0.72 0.23 8.56 7.63 0.59 0.34 8.56 7.7 0.51 0.36 8.54 7.34 0.93 0.284 8.96 7.67 0.72 0.56 8.91 7.87 0.42 0.62 9.01 7.46 1.04 0.515 8.72 6.73 0.56 1.43 8.76 6.59 0.32 1.85 8.71 6.77 0.62 1.32Total 7.84 6.99 0.49 0.37 7.7 6.97 0.42 0.31 8.58 7.09 0.85 0.64
Source: Own calculations from IES 2000.
Note: Data are weighted.

Gender equality and taxation in South Africa 221
2 4 5
Tax
/exp
sh
are
(%)
16
6.5
7
7.5
8
8.5
9
9.5
10
10.5
11
Male w child
Male w/o child
Female w child
None w child None w/o child
Female w/o child
Dual w child
Dual w/o child
3
Quintile
Figure 8.2 Total tax incidence by employment status, quintile and presence of children,South Africa.
2 4 5
Tax
/exp
sh
are
(%)
16
6.5
7
7.5
8
8.5
Male w child
Male w/o child
Female w child
None w child None w/o child
Female w/o child
Dual w child
Dual w/o child
3
Quintile
Figure 8.3 VAT incidence by employment status, quintile and presence of children,South Africa.
female-breadwinner households and those with no employed members bear a lower incidence than do male-breadwinner and dual-earner households, for total indirect taxes and for the different types of taxes. Two exceptions are that

female-breadwinner households without children in the lowest two quintiles beara higher incidence of the fuel levy than the other categories of household withoutchildren in those quintiles, and no-employed households with children in thehighest quintile bear a higher burden of the fuel levy and VAT than most otherhousehold types in that quintile.
222 D. Budlender, D. Casale and I. Valodia
2 4 5
Tax
/exp
sh
are
(%)
1
Male w child
Male w/o child
Female w child
None w child None w/o child
Female w/o child
Dual w child
Dual w/o child
3
Quintile
0
0.5
1
1.5
2
2.5
3
Figure 8.4 Excise incidence by employment status, quintile and presence of children,South Africa.
2 4 5
Tax
/exp
sh
are
(%)
1
Male w child
Male w/o child
Female w child
None w child None w/o child
Female w/o child
Dual w child
Dual w/o child
3
Quintile
00.20.40.60.8
11.21.41.61.8
2
Figure 8.5 Fuel levy incidence by employment status, quintile and presence of children,South Africa.

Within each household category, households with children bear a lower totalindirect tax burden than those without children, driven mostly by the differencesin the incidence of excise duties and the fuel levy. However, there are some excep-tions by quintile: for example, female-breadwinner and no-employed householdswith children in the middle quintiles have a higher total tax incidence than thosefemale-breadwinner and no-employed households without children. This is gen-erally because the VAT and fuel levy incidence are higher in those quintilesamong the households with children.
For all four of the employment status household categories, total indirect taxincidence tends to fall most heavily on the middle quintiles, particularly quintiles3 and 4, with the poorest quintile paying a smaller share of expenditure on taxthan the richest quintile. For VAT and excise duties, the incidence is predomi-nantly on the middle quintiles, while the fuel levy is strongly progressive. Whendisaggregated by the presence of children in the household, some differences inthe patterns of tax incidence across the quintiles emerge (see Figures 8.2–8.5): forboth male-breadwinner and female-breadwinner households without children, theincidence of excise duties tends to be more ‘regressive’ and the VAT incidencemore ‘proportional’ (i.e., the inverted-U shape of the VAT curves is less pro-nounced) compared to those households with children.
Table 8.8 shows total indirect tax incidence by consumption category. Thegender differences that emerge are consistent with the broader international liter-ature on gendered spending patterns. Female-breadwinner households bear a greatertax incidence on food (non zero-rated items as well as sugar items/confectionaryitems), utilities, children’s clothing, personal care items (essential and non-essen-tial), household fuel and education-related items (although education is VAT-exempt, textbooks and stationery in this category attract VAT). Male-breadwinnerhouseholds bear a greater tax incidence on meals out, non-alcoholic beverages,alcoholic beverages (particularly beer), tobacco, adult clothing, private transport,fuel for transport, medical expenditure (mostly due to private health care), com-munication and recreation. Again, dual-earner households for the most part resem-ble the male-breadwinner households, and no-employed households resemble thefemale-breadwinner households in their spending patterns.
Consumption items for which taxes are generally more ‘progressive’ (for allhousehold types) are housing, meals out, private transport, fuel for transport,communication and recreation; while items for which taxes are more ‘regressive’are food, children’s clothing, personal care necessities, fuel for household use andeducation. The tax incidence on non-alcoholic and alcohol beverages and tobaccogenerally falls most highly on the middle quintiles (see Figures 8.6 to 8.8, whichplot tax incidence by quintile on food, alcohol and tobacco). It is interesting tonote that many of the items for which the tax is more ‘regressive’ and that mightalso be considered ‘good’ or necessity items are those consumed more intensivelyby female-breadwinner and no-employed households.
Although the data are not shown here due to space constraints, when the taxincidence results by consumption item are further disaggregated by presence ofchildren in the household, the earlier findings are reinforced. A comparison
Gender equality and taxation in South Africa 223

Table 8.8 Indirect tax incidence for main commodity groups by employment status and quintile, South Africa (% of expenditure)
Category Male-breadwinner Female-breadwinner
1 2 3 4 5 Total 1 2 3 4 5 Total
Housing and utilities 0.55 0.52 0.69 0.73 0.73 0.67 0.48 0.7 0.84 0.8 0.79 0.72*Housing 0.04 0.02 0.04 0.07 0.14 0.07 0.03 0.04 0.05 0.08 0.13 0.06*Utilities 0.52 0.51 0.64 0.66 0.59 0.6 0.45 0.66 0.79 0.72 0.66 0.66
Food 2.6 2.69 2.52 2.26 1.43 2.22 2.49 2.7 2.64 2.35 1.49 2.4*Basic 0 0 0 0 0 0 0 0 0 0 0 0*Other 1.99 2.23 2.18 2.01 1.29 1.9 1.89 2.22 2.27 2.06 1.33 2.01*Sugar/confectionery 0.61 0.46 0.34 0.25 0.15 0.32 0.6 0.48 0.37 0.29 0.16 0.4
Meals out 0.01 0.07 0.1 0.14 0.27 0.14 0.04 0.03 0.07 0.13 0.21 0.09Non-alcoholic beverages 0.36 0.43 0.44 0.4 0.31 0.39 0.35 0.4 0.39 0.39 0.27 0.37Alcoholic beverages 0.39 0.61 0.7 0.73 0.63 0.64 0.09 0.23 0.22 0.3 0.17 0.21*Spirits 0.03 0.06 0.09 0.11 0.17 0.1 0.01 0.03 0.03 0.05 0.05 0.03*Wine 0.03 0.03 0.03 0.03 0.03 0.03 0.01 0 0.01 0.02 0.02 0.01*Beer 0.33 0.51 0.58 0.59 0.43 0.51 0.07 0.2 0.18 0.23 0.1 0.16
Tobacco 0.9 1.02 1.16 1.23 0.85 1.05 0.31 0.52 0.45 0.47 0.41 0.44Clothing and footwear 0.79 0.88 0.91 0.86 0.68 0.82 0.69 0.87 0.89 0.89 0.66 0.81*Adult clothing 0.33 0.48 0.59 0.63 0.55 0.54 0.25 0.42 0.52 0.6 0.46 0.45*Children’s clothing 0.45 0.4 0.31 0.23 0.13 0.28 0.44 0.45 0.37 0.29 0.19 0.36
Personal care 0.74 0.79 0.72 0.63 0.48 0.65 0.8 0.81 0.81 0.77 0.56 0.77*Necessities 0.43 0.39 0.35 0.28 0.16 0.3 0.42 0.42 0.36 0.3 0.17 0.35*Baby products 0.01 0.02 0.01 0.01 0.02 0.01 0 0.01 0.01 0.01 0.02 0.01*Other 0.3 0.38 0.36 0.34 0.3 0.34 0.37 0.39 0.44 0.46 0.38 0.41
Fuel for HH use 0.41 0.28 0.18 0.12 0.05 0.17 0.31 0.27 0.23 0.12 0.06 0.21Furniture, HH Equipment 0.66 0.63 0.74 0.69 0.6 0.66 0.6 0.64 0.74 0.77 0.5 0.66and MaintenanceDomestic and household 0 0.01 0.02 0.01 0.02 0.01 0.01 0.01 0.01 0.01 0.01 0.01services

Table 8.8 (Continued)
Category Male-breadwinner Female-breadwinner
1 2 3 4 5 Total 1 2 3 4 5 Total
Transportation 0.01 0.05 0.1 0.22 0.7 0.26 0.02 0.02 0.06 0.09 0.54 0.12*Private Transport 0.01 0.05 0.1 0.22 0.7 0.26 0.02 0.02 0.06 0.09 0.54 0.12*Public/Collective transport 0 0 0 0 0 0 0 0 0 0 0 0
Fuel for transport 0.34 0.45 0.62 1.07 1.4 0.87 0.33 0.41 0.64 0.77 1.24 0.63Medical expenditure 0.05 0.07 0.07 0.07 0.1 0.08 0.04 0.06 0.07 0.07 0.11 0.07Education 0.06 0.05 0.03 0.03 0.03 0.04 0.1 0.06 0.05 0.05 0.04 0.06Communication 0.12 0.11 0.2 0.26 0.36 0.23 0.09 0.14 0.22 0.26 0.43 0.21Recreation 0.08 0.11 0.21 0.25 0.48 0.26 0.04 0.1 0.16 0.24 0.38 0.17Gambling 0.02 0.03 0.03 0.03 0.02 0.03 0 0.01 0.02 0.02 0.01 0.01Miscellaneous 0.08 0.16 0.21 0.17 0.23 0.18 0.1 0.21 0.22 0.24 0.2 0.19TOTAL 8.17 8.95 9.64 9.92 9.36 9.36 6.9 8.2 8.72 8.73 8.08 8.14
Dual-earner No-employed
Housing and utilities 0.35 0.5 0.68 0.83 0.8 0.7 0.48 0.64 0.87 0.94 1.08 0.68*Housing 0.04 0.06 0.08 0.12 0.19 0.12 0.03 0.05 0.07 0.08 0.17 0.06*Utilities 0.31 0.45 0.61 0.71 0.61 0.58 0.45 0.59 0.79 0.86 0.91 0.63
Food 2.55 2.57 2.5 2.32 1.28 2.03 2.67 2.72 2.67 2.45 1.63 2.6*Basic 0 0 0 0 0 0 0 0 0 0 0 0*Other 1.95 2.12 2.17 2.07 1.15 1.75 1.93 2.15 2.22 2.13 1.45 2.04*Sugar/confectionery 0.6 0.44 0.33 0.25 0.14 0.28 0.73 0.58 0.45 0.33 0.18 0.56
Meals out 0.07 0.07 0.13 0.15 0.19 0.14 0.02 0.02 0.1 0.07 0.15 0.05Non-alcoholic beverages 0.35 0.39 0.39 0.38 0.22 0.32 0.37 0.41 0.43 0.42 0.27 0.39Alcoholic beverages 0.35 0.78 0.53 0.49 0.35 0.47 0.12 0.18 0.28 0.39 0.32 0.21*Spirits 0.05 0.08 0.08 0.09 0.15 0.1 0.02 0.02 0.04 0.05 0.13 0.03*Wine 0.02 0.04 0.04 0.03 0.04 0.03 0.01 0.01 0.01 0.01 0.05 0.01*Beer 0.29 0.65 0.41 0.37 0.17 0.33 0.1 0.15 0.23 0.33 0.14 0.16
Tobacco 0.96 1.13 1.01 1 0.54 0.85 0.43 0.46 0.59 0.69 0.5 0.5Clothing and footwear 0.63 0.92 0.97 0.95 0.53 0.77 0.68 0.83 0.8 0.76 0.42 0.73*Adult clothing 0.25 0.49 0.59 0.67 0.4 0.49 0.24 0.36 0.44 0.54 0.35 0.35*Children’s clothing 0.37 0.43 0.38 0.29 0.13 0.27 0.44 0.47 0.36 0.22 0.07 0.39
(Continued)

Table 8.8 (Continued) Indirect tax incidence for main commodity groups by employment status and quintile, South Africa (% of expenditure)
Category Dual-earner No-employed
1 2 3 4 5 Total 1 2 3 4 5 Total
Personal care 0.81 0.74 0.77 0.65 0.43 0.62 0.74 0.8 0.74 0.71 0.5 0.74*Necessities 0.46 0.38 0.34 0.25 0.12 0.26 0.42 0.4 0.37 0.32 0.16 0.38*Baby products 0 0.01 0.01 0.02 0.03 0.02 0.01 0.01 0 0.01 0 0.01*Other 0.35 0.35 0.42 0.38 0.29 0.35 0.31 0.39 0.37 0.38 0.33 0.35
Fuel for HH use 0.4 0.32 0.18 0.12 0.04 0.16 0.29 0.29 0.29 0.19 0.07 0.27Furniture, HH Equipment 0.64 0.67 0.76 0.72 0.47 0.62 0.62 0.71 0.71 0.71 0.45 0.66and MaintenanceDomestic and household 0.02 0.02 0.01 0.01 0.02 0.02 0.01 0.01 0.01 0.01 0.02 0.01servicesTransportation 0.05 0.05 0.08 0.29 0.87 0.4 0.01 0.04 0.04 0.17 0.46 0.07*Private transport 0.05 0.05 0.08 0.29 0.87 0.4 0.01 0.04 0.04 0.17 0.46 0.07*Public/Collective transport 0 0 0 0 0 0 0 0 0 0 0 0
Fuel for transport 0.33 0.54 0.76 1.24 1.66 1.13 0.23 0.25 0.33 0.55 1.41 0.36Medical expenditure 0.1 0.07 0.08 0.07 0.12 0.09 0.06 0.08 0.08 0.09 0.22 0.09Education 0.07 0.06 0.05 0.03 0.03 0.04 0.06 0.04 0.04 0.04 0.05 0.05Communication 0.09 0.14 0.2 0.3 0.41 0.28 0.08 0.13 0.17 0.27 0.44 0.15Recreation 0.07 0.1 0.17 0.28 0.5 0.3 0.06 0.07 0.13 0.22 0.54 0.12Gambling 0 0.02 0.04 0.02 0.02 0.02 0 0.01 0.01 0.02 0.03 0.01Miscellaneous 0.1 0.16 0.21 0.2 0.19 0.18 0.09 0.14 0.26 0.25 0.17 0.16TOTAL 7.95 9.24 9.5 10.07 8.69 9.15 7 7.82 8.56 8.96 8.72 7.84
Source: Own calculations from IES 2000.
Note: Data are weighted.

between male-type households with children and female-type households withchildren, finds that male-type households with children bear a higher incidence oftaxes particularly on housing, meals out, alcoholic beverages, tobacco, adult cloth-ing, private transport, fuel for transport, communication and recreation; whilefemale-type households with children bear a higher burden on food, children’sclothing, basic personal care items and other non-essential personal care items,fuel for household use and furniture, equipment and household maintenance items.
Both male-type and female-type households with children bear a lower inci-dence overall compared to the households without children, but a higher inci-dence on certain consumption items, such as housing, food, children’s clothing,
Gender equality and taxation in South Africa 227
2 4 5
Tax
/exp
sh
are
(%)
1 3
Quintile
Male Female NoneDual
0
0.5
1
1.5
2
2.5
3
Figure 8.6 Food tax incidence by employment category and quintile, South Africa.
2 4 5
Tax
/exp
sh
are
(%)
1 30
0.20.1
0.40.3
0.60.5
0.80.7
0.91
Quintile
Male Female NoneDual
Figure 8.7 Alcohol tax incidence by employment category and quintile, South Africa.

personal care (especially necessities and baby products), household fuel, furnitureequipment and household maintenance items and education. In contrast, male-type and female-type households without children bear a higher incidence onmeals out, non-alcoholic and alcoholic beverages, tobacco, other non-necessitypersonal care items, adult clothing, transport, fuel for transport, (private) medicalexpenditure, communication and recreation. These results suggest that, if we had todivide spending very crudely into ‘good’/necessity items and ‘bad’/luxury items,the presence of women (with spending power) and children in the household isassociated with a greater proportion of spending on the former basket of goods.
Policy simulations
The impact of zero-rating additional items that would benefit poor female-breadwinner and no-employed households (and those that contain children) isconsidered here. We estimate the distributional and revenue consequences ofzero-rating all non-confectionary food items that are not currently zero-rated;and more specifically, poultry; children’s clothing and footwear; and a basket ofbasic personal care items (toilet paper, toothpaste/toothbrushes, soap, tissues,contraception, and sanitary towels). These goods were chosen on the basis that(1) they are recurring expenditure items; (2) they do not impose any obvious neg-ative externalities; and (3) they make up a larger relative share of the budget offemale-breadwinner and no-employed households (particularly those withchildren in the lower quintiles) compared to male-breadwinner and dual-earnerhouseholds.10 This last criterion by definition results in strong gender- and income-distributional outcomes for all of the policy experiments; we are interested, there-fore, in which policy changes have the largest relative effect without resulting inundue revenue losses. For comparison, we also estimate the effect of VAT ratingitems that are currently zero-rated, specifically, basic food items and paraffin.
228 D. Budlender, D. Casale and I. Valodia
2 4 5
Tax
/exp
sh
are
(%)
1 30
0.2
0.4
0.6
0.8
1
1.2
1.4
Quintile
Male Female NoneDual
Figure 8.8 Tobacco tax incidence by employment category and quintile, South Africa.

The results of the policy simulations are presented in Table 8.9. The findingssuggest that the largest income equality gains have already been exhausted throughthe current zero-rating of basic food items and paraffin. The zero-rating of theseitems has also resulted in substantial gender equality outcomes, benefiting female-breadwinner and no-employed households the most in relative terms. The poten-tial zero-rating of children’s clothing would offer the next largest gain in terms ofincome equality, and even stronger gender benefits than the current zero-rating offoodstuffs and paraffin. This would seem to be the most attractive policy recom-mendation, also because of its perfect targeting to households with children.
Although the revenue loss resulting from this policy change (R576 million perannum in 2000 prices) is more than double the loss incurred through the zero-rating of paraffin, it amounts to a relatively small percentage of the total VATintake (1.2 per cent). By comparison, the reduction in revenue from the zero-ratingof all other non-confectionary foodstuffs would amount to a loss of over 10 per centof the total VAT intake. Put another way, the loss of revenue from the zero-rating of
Gender equality and taxation in South Africa 229
Table 8.9 Indirect tax incidence and government revenue effect of VAT and zero-rating(selected items), South Africa
Base Effect of Effect of zero-ratingincidence VAT rating (% change)
(% change)
Tax Basic Paraffin Other Children’s Basic Poultryincidence food non-conf. clothing personal (% of exp) food items care items
Male-breadwinner 9.36 23.29 2.03 −20.19 −2.99 −3.21 −4.38Female-breadwinner 8.14 33.91 2.95 −24.45 −4.42 −4.18 −5.59Dual-earner 9.15 19.56 1.42 −19.02 −2.95 −2.73 −3.68No-employed 7.84 45.92 4.34 −25.89 −4.85 −4.72 −6.60Ratio female/ 1.46 1.45 1.21 1.48 1.30 1.28male % changeQ1 7.28 60.03 5.22 −26.37 −5.91 −5.77 −7.29Q2 8.36 41.27 4.07 −25.96 −5.26 −4.78 −6.76Q3 9.11 29.09 2.74 −24.15 −3.95 −3.95 −5.65Q4 9.56 18.83 1.36 −21.44 −2.72 −2.93 −4.07Q5 8.82 8.39 0.23 −14.17 −1.59 −1.59 −1.81Ratio Q1–3/Q4–5 4.79 7.57 2.15 3.51 3.21 3.35% changeTotal 8.63 30.13 2.55 −22.25 −3.82 −3.71 −5.00
Loss/gain to 3,876 229 −4,788 −576 −618 −761fiscus per year (millions Rands, 2000 prices)
Source: Own calculations from IES 2000.
Note: Data are weighted.

children’s clothing is the equivalent of about one per cent of the education budgetfor that year and only about half a per cent of the total social services budget.
We would not encourage balancing the revenue loss from this change withother indirect tax increases. Given that it is not possible to estimate accurately thegender incidence of indirect taxes within the household or to measure any behav-ioural change following a tax policy adjustment, a tax increase based on statichousehold incidence results may have unintentional negative effects. Forexample, raising the excise duties on alcohol and tobacco (based on the demeritargument) could result in negative gender equality effects within the household ifincome is taken away from ‘necessity’ goods to finance the inelastic demand forthese items. It is also important to note that while the majority of women (56 percent) in South Africa live in female-breadwinner or no-employed households, 21per cent live in male-breadwinner households and 23 per cent live in dual-earnerhouseholds and are therefore affected by policies targeting these households.
Conclusion and policy recommendations
Tax reforms in South Africa following the political transition have addressed theexplicit gender biases in the PIT system, and have gone a long way to reducingimplicit bias against female-type households in the indirect tax system. As wehave demonstrated, however, a number of implicit gender biases continue toexist. On the PIT side, some of this bias arises as a result of systems which seekto ease the administrative burden, both for the revenue authorities and for the tax-payer. The SITE system, which presumes that taxes collected by the employer areaccurate, may well be placing an undue tax burden on poor women, especiallythose working in irregular employment.
Horizontal inequity across households with the same income but differentnumbers of income earners remains a feature of the PIT system. The tax burdenis particularly borne by low-income, single female-earner households. This isclearly an issue that needs some attention. We would not, however, propose areturn to household filing as this will further disadvantage women. The issue isprobably best dealt with on the expenditure side of the budget. To some extent,this is already the case with programmes such as the child support grant, whichcater for poor households with child dependants
For the indirect tax system, there is no implicit bias overall against ‘female-type’ households, those in the lowest quintiles and those with children. Instead,the high taxes on alcohol and tobacco and the fuel levy result in a higher inci-dence on ‘male-type households’ and those without children. The zero-rating ofbasic food items and paraffin, goods which are consumed relatively more by poorfemale-type households with children, has helped to protect these householdsfrom carrying a disproportionate share of the indirect tax burden.
Implicit bias against female-type households in the indirect tax system is visi-ble only when the results are disaggregated into different consumption items:female-type households (in the lowest quintile and with children) bear a higherburden on ‘good’ or necessity items such as food, basic personal care items,
230 D. Budlender, D. Casale and I. Valodia

children’s clothing and fuel for household use. Our policy simulations suggestthat the zero-rating of children’s clothing in particular may be a feasible recom-mendation as it has large gender- and income-distributional impacts and perfectlytargets households with children, but has relatively small revenue implications.
However, any change to the indirect tax system that benefits female-typehouseholds needs to be evaluated against the trade-off of introducing furtherhorizontal inequality (and complexity) into the indirect tax system. In addition,changes to the indirect tax system (that are feasible in terms of revenue loss) arelikely to have a rather marginal effect on pre-tax gender and income inequali-ties. Policies designed to reduce unequal outcomes for women and childrenmay be more effective on the expenditure side of the budget, particularlythrough the continued and extended provision of social welfare grants to thosein need.
Notes
1 The average exchange rate of the ZAR to the US$ for 2007 is 7.0544.2 Paraffin was only zero-rated in April of 2001. However, our expenditure data are from
October 2000. We calculate tax incidence as if the zero-rating had applied in 2000, i.e.,using the spending behaviour information of households on paraffin from 2000, in orderto get a more realistic picture of the current incidence on the poor. This assumptionignores any knock-on effects that an effective reduction in the price of paraffin wouldhave on other spending patterns.
3 The 2005 IES was released in early 2008, but we chose not to use this survey as someof the expenditure data are not considered reliable (Statistics South Africa 2008). In par-ticular, the share of spending on food was found to be much lower than in 2000 acrossall quintiles in the distribution (and compared to other countries of similar levels ofdevelopment), which would affect our incidence results substantially.
4 The quality of the income data from the 2000 survey has been called into question (seeSimkins 2004), so we use only the expenditure data from the IES. We use a cleaned ver-sion of the dataset (prepared by Global Insight) which has had many of the anomaliescorrected or removed, and we also use revised and updated sampling weights based onthe 2001 Census provided by Statistics South Africa.
5 Thanks to Morné Oosthuizen and Ingrid Woolard for sharing their price and exciseduty data.
6 Statistics South Africa (2002: 90) defines headship for the IES as:
The head is the person in whose name the dwelling is registered. It may be the personwho owns the dwelling, or is responsible for the rent, or gets the dwelling throughtheir work, or through their relationship to the owner. If two or more persons haveequal claim to be head of the household, or if people state that they are joint heads orthat the household has no head, then choose the eldest as the head.
It is not clear to what extent this definition is followed by fieldworkers when conduct-ing the survey, even though Statistics SA instructs enumerators to explain it.
7 In the IES 2000, employment status is based on the following question and prompt:‘During the past seven days, did . . . do any work for pay, profit or family gain?Formal/informal work, working on a farm, casual/seasonal work, etc.’
8 Authors’ own calculations from the South African Labour Force Survey of September2001.
Gender equality and taxation in South Africa 231

9 For standard errors of the estimates and t-tests of the equality of mean incidence acrossgroups, see Casale (2009).
10 Baby food (milk and grain only) and other fuels for household use (particularly coal,firewood and candles) were also possible candidates, but were not considered furtherhere because, for the former, there is some concern about the implications for breast-feeding, while for the latter, there are possible environmental consequences (for details,see Casale 2009). White bread, white sugar and tea were also excluded because of thenutritional implications, although they do form a larger relative share of the budgets of(poor) female-type households compared to male-type households.
References
Budlender, D. (2003) ‘The Debate about Household Headship’, Social Dynamics 29(2):48–72.
Casale, D. (2009) ‘Indirect Taxation and Gender Equity: Evidence from South Africa’,country report prepared for the project on Taxation and Gender Equity coordinated byAmerican University and the University of KwaZulu-Natal.
Casale, D. and Posel, D. (2005) ‘Women and the Economy: How Far Have We Come?’,Agenda 64: 21–9.
Coopoo, S. (2002) Municipal Taxation, Cape Town: Women’s Budget Initiative.Department of Social Development (2007) ‘Building a Caring Society Together: Reform
of Retirement Provisions, Discussion Document’, Pretoria.Goldman, T. (2002) Customs and Excise, Cape Town: Women’s Budget Initiative.Hartzenburg, T. (1996) ‘Women and Taxation’, in D. Budlender (ed.) The Women’s
Budget, Cape Town: Institute for Democracy in South Africa.Hassim, S. (2006) ‘The Women’s Movement’, in R. Ballard, A. Habib and I. Valodia (eds)
Voices of Protest: Globalisation, Marginalisation and New Social Movements in Post-apartheid South Africa, Pietermaritzburg: University of KwaZulu-Natal Press.
Morris, M. and Padayachee, V. (1988) ‘State Reform Policy in South Africa’,Transformation 7: 1–26.
National Treasury (1999) Medium Term Budget Policy Statement, Pretoria.—— (2000) Budget Review 2000, Pretoria.—— (2007) Budget Review 2007, Pretoria.—— (2008) Budget Review 2008, Pretoria.Simkins, C. (2004) ‘What Happened to the Distribution of Income in South Africa
Between 1995 and 2001?’, in I. Woolard et al., Tax Incidence Analysis for the FiscalIncidence Study Conducted for the National Treasury, Final Report, 2005.
Smith, T. (2002) Women and Tax in South Africa, Cape Town: Women’s Budget Initiative.South African Revenue Service (SARS) (2005) ‘Taxation in South Africa 2005/06’, Pretoria.—— (2006) 2006/7 Budget Tax Guide: A Synopsis of the Most Important Tax, Duty and
Levy Related Information for the 2006/7 Tax Year, Pretoria.—— (2008) Tax Statistics 2008, Pretoria.Statistics South Africa (2002) ‘Income and Expenditure of Households, 2000’, Statistical
release P0111, Pretoria.—— (2008) ‘Income and Expenditure of Households 2005/6: An Analysis of Results’,
Report No. 01-00-01, Pretoria.
232 D. Budlender, D. Casale and I. Valodia

9 Gender equality and taxation inUganda
Sarah Ssewanyana, Lawrence Bategeka,Madina Guloba and Julius Kiiza
Introduction
Uganda is a low-income country that has registered strong economic growth inrecent years, averaging about 8 per cent since 1992. Tax reforms introduced inJuly 1996 have resulted in an increase in tax revenue from about 11 per cent ofgross domestic product (GDP) in 1997–98 to 13 per cent in 2005, where it hasremained. One of the key challenges facing government is how to increase rev-enues and generate the funding needed to eradicate poverty and pay for criticaldevelopment investments, thereby reducing its dependency on foreign aid. ManyUgandans have not shared in the country’s economic growth and income inequal-ity is growing. Poverty remains high, with about 31 per cent of the population livingbelow the poverty line in 2005–06 (Ssewanyana and Okidi 2007). It is unclear,however, whether the country’s policy-makers view taxation as primarily a meansof raising revenue or as a redistributive instrument.
Since the 1990s the government has introduced a number of reforms in the taxa-tion system. Several studies (Bahiigwa et al. 2004; World Bank 2006; Ssewanyanaand Okidi 2008) have assessed the impact of these reforms on household welfare,while others (Chen et al. 2001 and Ssewanyana and Okidi 2008) provide usefulanalyses of the incidence of taxation by focusing on the tax burden by povertystatus and expenditure quintile. This chapter examines the shifts in the burdenof taxation resulting from the reforms from a gender perspective. More specifi-cally, it is an attempt to analyse the differential impact tax policies and taxreforms have had on men and women, particularly on poor women. It focuses onboth domestic indirect taxes, including the Value-Added Tax (VAT) and exciseduties, and direct taxes, with specific reference to personal income tax (PIT)including Pay-As-You-Earn (PAYE) and the Local Service Tax (LST). Our analy-sis relies heavily on the Uganda National Household Survey of 2005–06 (UNHS III)data and administrative data from the Uganda Revenue Authority (URA).
Gendered structure of earnings and income
Uganda is one of a growing number of countries in Sub-Saharan Africa that arebeginning to take gender into account when developing economic policy. Gender

is one of the cross-cutting issues identified in Uganda’s Poverty EradicationAction Plan (PEAP) and a number of recent policies explicitly promote genderequality and equity. For example, under a recent affirmative action policy, girlswishing to enrol in public universities are given 1.5 extra points on their applica-tions. Gender inequalities in access to social services, adult literacy and other out-come indicators have steadily narrowed. However, these efforts to improvegender equality through expenditures have not been matched by similar reformsin revenue generation.
The participation of women in the labour market has increased over time, alongwith their share of decision-making high positions in government and Non-Governmental Organizations (NGOs) (Okurut et al. 2006; Kiiza 2006). Nearly 53per cent of the employed population aged 18 years and above are women. Almost79 per cent of Ugandans are self-employed, of which 34 per cent are unpaid familyworkers, and women represent about 83 per cent of this category. Only 16 per centof the paid workforce (1.67 million) is in the formal sector; 80 per cent of thesework for private employers. Nearly three-quarters of all salaried employees aremen – approximately 1.21 million compared to 0.47 million women. Figure 9.1depicts the distribution of Uganda’s workforce by gender.
In 2005–06, 15.5 per cent of workers, primarily women, earned less than half themedian income, which was on average UGX434,400 (equivalent to US$241.29).Table 9.1 shows that nearly two-thirds of all wage workers received less than twicethe median income. Disaggregating the results by sector, we note that most paidworkers in the private sector earn less than half the median income. Despite itssmall share in total employment, the public sector provides far better wages. It alsohas a narrower gap between male and female wages than does the private sector.
Nearly 44 per cent of all households reported expenditures below the minimumPAYE threshold of UGX130,000 per month (equivalent to US$ 72.21 per month).Government has been compensating low-income households through transfers,
234 S. Ssewanyana, L. Bategeka, M. Guloba and J. Kiiza
0.0 10.0 20.0 30.0 40.0 50.0 60.0 70.0 80.0
Self-employment
Public employment
Private employment
Others
Not stated
All
Male Female
Figure 9.1 Workface composition, persons aged over 18 years by sex, Uganda (in %).
Source: Authors’ calculations based on Uganda National Household Survey-UNHSIII 2005–06.

such as provision of basic social services, although, as noted, these are largelydonor-supported. Benefit incidence analysis demonstrates that the poor have ben-efitted from such services, particularly primary education and access to basicpublic health facilities (Deininger and Mpuga 2008). However, the quality ofthese services leaves a lot to be desired.
Household structure
In 2005–06, Uganda had nearly 5.2 million households, each averaging 5.2 people.This chapter classifies households in three ways: according to the sex of the ‘head’;by the sex composition of adults (considered to be 18 years and older) in the house-hold (female-majority, male-majority or equal numbers); and by the employmentstatus of adult members (male-earner, female-earner and dual-earner). Table 9.2shows that nearly one in every three Ugandan households is majority female, about27 per cent have female heads and 21.1 per cent are female breadwinners. Thesefemale-type households predominate among the poorest households; the proportionof male-headed households increases with income level. Looking at households byadult sex composition, we observe a concentration of male-majority households inthe wealthiest quintile. Similarly, a comparison by employment status shows thathouseholds with male breadwinners are concentrated in the top quintile.
More disaggregated analysis shows that female-headed households are morelikely to have a higher concentration of female breadwinners with no male bread-winners, and tend to be heavily dominated by adult females. On the other hand,
Gender equality and taxation in Uganda 235
Table 9.1 Median employment earnings per person per year, 2005–06, Uganda
Employees % persons below: UGX per annum
Half of median Median Twice the median Mean Median
All employees
Female 24.4 63.2 79.3 702,597 240,000Male 11.0 37.1 60.1 1,335,176 600,000All 15.5 45.9 66.6 1,120,095 434,400
Public sector
Female 2.7 5.5 12.0 2,487,105 1,716,000Male 1.5 6.2 15.6 3,221,970 1,800,000All 1.8 6.0 14.6 3,018,688 1,800,000
Private sector
Female 26.7 69.3 86.4 514,016 217,200Male 12.4 41.6 66.6 1,056,334 480,000All 17.4 51.3 73.5 867,366 384,000
Source: Authors’ calculations based on Uganda National Household Survey, UNHSIII, 2005–06.

236 S. Ssewanyana, L. Bategeka, M. Guloba and J. Kiiza
Table 9.2 Distribution of household typology by income, Uganda (%)
Household typology All Expenditure quintile Numbers ofHH (‘000)
Q1 Q2 Q3 Q4 Q5
Gender of headFemale 26.9 17.8 16.6 17.7 21.4 26.5 1,408Male 73.1 15.8 18.0 19.4 21.0 25.9 3,821
Adult sex compositionFemale-majority 29.7 16.9 16.9 18.7 21.0 26.4 1,552Male-majority 20.1 9.2 12.1 15.1 20.3 43.4 1,050Equal gender 50.2 18.8 20.3 20.6 21.4 18.9 2,627
Employment statusDual-earner 54.0 18.2 20.4 21.4 21.5 18.5 2,826Female-breadwinner 21.1 19.0 16.7 18.7 19.0 26.5 1,104Male-breadwinner 16.0 7.8 9.3 11.4 20.8 50.7 836No-earning-adult 8.9 13.7 17.7 17.9 24.3 26.6 463
Source: Ssewanyana (2009).
households designated as male-headed have a higher concentration of dual earn-ers. Eight in every 10 female-type households live with children, compared toonly 5 in 10 male-type households. Nine in every 10 dual-earner households andthose with an equal number of adult males and females live with children.Female-type households have a higher proportion of children than male-typehouseholds, which themselves have a higher proportion of children than thenational average. Similar results are noted for dual-earner households and thosewith an equal-number of males and females households.
Taxation and tax revenue since 1997
Like many countries in Sub-Saharan Africa, Uganda has relied heavily on foreigndevelopment assistance, although this dependency has gradually diminished frommore than 50 per cent of the total national budget in 1992 to an estimated 28 percent in 2008–09 (Government of Uganda 2008). Even so, donor financing playsa major role in social protection programmes, including the provision of basicsocial services, reflecting the country’s inability to fully fund its developmentneeds through domestic resources. Uganda’s domestic revenue base remainsvery low. The share of tax revenue in GDP has remained about 13–14 per centsince 2005 (see Table 9.3), much lower than the proportion in neighbouring Kenya(23 per cent) and Tanzania (16 per cent).
Despite efforts to improve the efficiency of domestic revenue collection, thegovernment has yet to achieve its target of increasing domestic revenues by 0.5per cent of GDP per annum. The recent discovery of oil, production of which isscheduled to begin at the end of 2009, should improve this situation, primarilythrough the licensing fees levied on oil companies.

Gender equality and taxation in Uganda 237
Figure 9.2 shows the patterns and trends in revenue performance by type oftax. As can be seen in this figure, PAYE has remained the major source of incometax revenue, followed by corporate income tax and withholding tax. The contri-bution of PAYE to total tax revenue (and GDP) has been growing over time, froma low of 6 per cent in 1997–98 to about 14 per cent in 2006–07, representingabout 1.89 per cent of GDP. This trend is a result of both more rigorous taxenforcement as well as job and salary growth in the formal sector, even thoughthis sector’s share in total employment has remained at about 16 per cent.
Indirect taxes on consumption are also an important source of revenue. Since2002–03, the contribution of excise duties has remained almost flat, at less than8 per cent of total revenue – a significant drop from its 12 per cent share in 1997–98.Further disaggregated analysis reveals stagnating excise duties from beer and cig-arettes and a rising contribution from phone talk time. Excise duties on domesti-cally produced beer have been reduced by 10 per cent, effective FY 2008–09. Thisis supposedly meant to promote local value addition, modernization of agriculture
Table 9.3 Share of type of tax to GDP and total tax revenue, Uganda, 2002–07
2002–03 2003–04 2004–05 2005–06 2006–07
% share of tax to GDP
Net URA collections 11.97 12.45 12.68 12.86 12.47(excluding govt taxes and tax refunds)Gross revenues 12.33 12.86 13.09 13.47 14.43o/w Total domestic taxes 6.09 6.24 6.67 6.87 7.23Direct domestic 3.05 3.44 3.8 3.92 4.16Taxes + fees and licencesPAYE 1.43 1.52 1.62 1.81 1.89Indirect domestic taxes 3.04 2.8 2.87 2.95 3.07o/w govt VAT payments 0 0 0 0 0.01on behalf of private co.Taxes on international trade 6.14 6.53 6.32 6.5 7.06Government taxes on imports 0.11 0.09 0.1 0.1 0.14
% share in total tax revenue
Net URA collections 97.07 96.79 96.89 95.49 93.32(excluding govt. taxes and tax refunds)Gross revenues 100.00 100.00 100.00 100.00 100.00o/w Total domestic taxes 49.00 48.53 50.96 51.02 50.09Direct domestic taxes and 24.73 26.75 29.04 29.10 28.83fees and licensesIndirect domestic taxes 24.63 21.78 21.92 21.91 21.25o/w govt VAT payments on 0.00 0.00 0.00 0.87 0.07behalf of private co.Taxes on international trade 49.76 50.77 48.27 48.27 48.92Government taxes on imports 0.88 0.70 0.77 0.71 0.99
Source: Authors’ calculations based on data from Uganda Revenue Authority (2007–08).

and overall poverty reduction. The VAT contribution to revenues has fluctuatedbetween 15 and 18 per cent since 1997. It is worth noting that an increase in theVAT rate from 17 to 18 per cent in 2005 has not generated significant growth intax revenue. Finally, the contribution of other taxes remains at about 60 per cent,of which the largest proportion is from international trade (see Table 9.3).
Tax reforms
Since the mid-1990s, Uganda has implemented several tax reforms, several ofwhich are relevant to this analysis. The Income Tax Act of 1997 was enacted in1997. Recent direct tax reforms have included the abolition of the graduated taxin 2005, a local government head tax paid by all economically active males andfemales aged 18–60 years. This was a severe blow to local government, whichrelied heavily on this tax as a major source of revenue. To compensate for this loss,in 2008, the government introduced the Local Service Tax (LST) on individuals,mainly those with monthly wage incomes.
The VAT was introduced in July 1996 to replace the sales tax on goods and theCommercial Transaction Levy (CTL) on services. There are three categories ofVAT: exempt, zero-rated and a standard rate of 17 per cent, which was raised to18 per cent in 2005–06 (see Ssewanyana 2009). Commodities that attract taxinclude processed foods and beverages such as sugar, salt, beer, soda; householdappliances such as flat irons; utilities including piped water, electricity; childrenand adult clothing and footwear; and dry cleaning services, to mention a few.
The excise tax system is not as broad-based as the VAT. It covers only a fewitems, such as alcoholic and processed soft drinks, telephone airtime, spirits and
238 S. Ssewanyana, L. Bategeka, M. Guloba and J. Kiiza
0.0
1997
/98
1998
/99
1999
/00
2001
/02
2000
/01
2002
/03
2003
/04
2004
/05
2005
/06
2006
/07
10.0
20.0
30.0
40.0
50.0
60.0
70.0
80.0
VAT Excise PAYE Other taxes
Figure 9.2 Patterns and trends of tax type in total central government revenue, Uganda (%).
Source: Uganda Revenue Authority (URA) 2008.

waragi (locally distilled spirits), cigarettes and tobacco, and petroleum products(petrol, diesel and paraffin). Ad valorem excise duty is expressed as a percentageof expenditure on a given service or product (e.g., beer) and flat rate excise dutyis levied per unit of the physical quantity of a given good (e.g., petroleum prod-ucts). Like VAT, excise duty treatment was altered in significant ways in 2005–06. Beer was further divided into malt and non-malt, with a 60 per cent and 20per cent excise duty, respectively, on the ex-factory price. The tax on spirits wasset at 60 per cent of the ex-factory price. The excise duty on phone talk timeincreased from 10 per cent in 2004–05 to 12 per cent in 2005–06. The tax on cig-arettes was changed from ad valorem to a flat rate. A flat rate of UGX50 per kgwas levied on sugar. On average, the levy per litre on petrol and diesel rose fromUGX490 (equivalent to US$0.27) in 2002–03 to UGX560 (equivalent to US$0.31)in 2005–06. The tax on kerosene has remained at UGX200 (equivalent to US$0.11)per litre since 2002–03.
Personal income tax
The PAYE income tax brackets and tax rates have remained the same since 1997.PAYE is a progressive direct tax; better paid workers pay a higher proportion oftheir income in tax. Every bracket of paid employment contains more men thanwomen, and the incidence of PAYE is correspondingly greater among maleworkers than female workers, especially in the highest income bracket. As can beseen in Table 9.4, the pattern is similar for the Local Service Tax (LST).
Employees in the public sector contributed 45.8 per cent of total PAYE rev-enue in 2005–06 and would have contributed 43.7 per cent of LST if the tax wasintroduced during that time. The incidence of LST is less gender-responsive rel-ative to PAYE. Overall, women workers contributed 13 per cent of PAYE buttheir contribution to LST would be estimated at 18.9 per cent.
At the household level, the incidence of PAYE as a percentage of income is 11.3per cent for dual-earner, female-majority households, higher than the percentagefor dual-earner, male-majority households. A comparison among single-earnerhouseholds shows that the incidence of PAYE on single-male-earner householdsis almost twice that of single-female-earner households. This is partly owing to
Gender equality and taxation in Uganda 239
Table 9.4 Share of PAYE by income tax bracket, Uganda (%)
PAYE income tax Tax rate % Share of total PAYE Share of total LST brackets (‘000UGX) Of which Of which:
All Female Male All Female Male
< 1,560 0 0.0 0.0 0.0 11.3 3.2 8.11,560–2,820 10 4.5 0.9 3.6 17.2 4.0 13.22,820–4,920 20 17.9 2.9 15.0 23.2 3.7 19.5> 4,920 30 77.6 9.2 68.4 48.3 7.9 40.4
Source: Uganda National Household Survey-UNHS III, 2005–06.

the fact that single-male-earner households predominate in the higher PAYE taxcategories. These households are more often found in the highest quintile andcontribute 54.3 per cent of total PAYE. Single-female-earner households makeup the majority in the 1st and 2nd quintiles. Single-female and dual-earner,female-majority households contribute just 5.7 per cent and 7 per cent of totalPAYE, respectively.
Gender biases in direct taxes
Uganda’s direct tax system contains no obvious explicit gender biases. TheIncome Tax Act treats men and women with the same level of income the sameway. The majority of income taxpayers are men, owing to their relatively higherparticipation in the wage labour market and other income-generating activities.Increasing women’s contribution to total personal income tax will require increas-ing women’s participation in wage employment.
However, equal treatment in the tax code does not translate into substantivegender equality, and Uganda’s system of personal income tax does containimplicit gender biases. For example, there are no adjustments of tax thresholdsand brackets to compensate for inflation, which as discussed below results in animplicit gender bias against females. In addition, there is horizontal inequity inthe system: households with the same level of earnings but a different taxpayercomposition have different personal income tax burdens; households with thesame level of income and composition of taxpayers pay the same amount ofincome tax regardless of whether they contain children and other dependants.
Income tax policies have not really addressed gender concerns. Women aretreated the same way as men, with no deductions or allowances to compensate fortheir greater vulnerability to poverty. A few amendments to the Income Tax Act1997 have some gender relevance, though only incidentally. One provision ofthe Income Tax (Amendment) Act 2003 exempts earners engaged in agriculture,plantation or horticultural farming from paying tax. This has gender relevanceonly in the sense that most employed women work in agriculture. Similarly, theIncome Tax (Amendment) Act 2008 provides incentives to earners engaged inagro-processing. Again the gender relevance of the amendment is only to theextent that agro-processing is key to agriculture, where as noted, the majority ofwomen work for a living.
Tax exemptions tend to benefit males more than females, primarily because ofoccupational segregation in the labour market. For instance, the value of any prop-erty acquired by gift, bequest, or inheritance that is not included in business,employment or property income is exempt from personal income tax. This exemp-tion favours men relatively more than women because in Uganda most commu-nities are patrilineal and inheritances mainly benefit men.
Pension income is also exempt from tax. This provision benefits men relativelymore than women, fewer of whom are in employment with pensions. A lump-sum payment that is made by a resident retirement fund to a member of the fundor a dependant of a member of a fund is exempt from income tax. The exemption
240 S. Ssewanyana, L. Bategeka, M. Guloba and J. Kiiza

again benefits men relatively more than women because of the relatively largerproportion of men in pensionable employment. Finally, the official employmentincome of people employed in the armed forces, the police or prison services isexempt from income tax. Until very recently, the forces employed only men.Even now, the proportion of women in the Uganda People’s Defence Force isbelow 5 per cent, and women make up only 25 per cent of Uganda’s police force.
Another source of implicit bias comes from fiscal drag, whereby tax thresholdsare not adjusted for inflation. Although inflation has been low since the 1997Income Tax Act was enacted, it has steadily eroded the value of Ugandan wages;income tax brackets have not been adjusted upwards. Bategeka et al. (2009)demonstrate that even though the UGX130,000 minimum income exempt fromPAYE in 1997 was equivalent to UGX197,271 a decade later, the governmenthas kept the same tax thresholds. This means that wage earners whose monthlyincomes were in the range of UGX130,000–197,271 and who were previouslyexempted from income tax now have to pay. This group includes a higher propor-tion of women than men, suggesting that inflation has burdened them dispropor-tionately. In 2007, compensation for this implicit gender bias generated byinflation would have required a 52 per cent upward adjustment of income taxbrackets. Making such an adjustment would eliminate this source of implicitgender bias in the tax system.
Uganda’s personal income tax system treats men and women the same way solong as both sexes earn similar incomes. In line with the principle of verticalequity, higher income individuals pay a larger fraction of their income in taxcompared to lower income individuals. However, the tax system contains hori-zontal inequities, as the tax code results in differential treatment of differenthousehold types. The tax paid by each household depends on the incomes of theindividuals within it and not on the total income of the household.
Dual-earner households (i.e., households with equal numbers of female andmale earners, with dependants) dominate across income tax brackets, making upmore than 50 per cent of the total. The second largest group is composed ofhouseholds that contain one male earner with dependants. Tax incidence is higherin single-earner (whether male or female) households than it is in dual-earnerhouseholds. We show this by using data from the Uganda National HouseholdSurvey 2005–06 (UNSH III) and classifying households by annual income cate-gories. We present two scenarios: one that shows the tax liability for householdswith approximately median household income and one that shows the tax liabil-ity for high-income households.
In Table 9.5, in the first scenario, we consider two households that have totalannual household income of UGX3 million. The first household has only one earnerwho makes UGX3 million. The second household has two earners, a female earningUGX1.2 million (which puts her in the lowest tax bracket at the zero rate) and a maleearning UGX1.8 million per annum (which puts him in the second bracket at a 10 percent rate). Both households live with children. Applying the PAYE statutory rules in2005–06, the total tax payable per annum for the first household is UGX162,000whereas the tax liability of the second household is UGX24,000 per annum. Although
Gender equality and taxation in Uganda 241

the two households have the same total earnings per annum, the tax burden on thesingle-earner household (5.4 per cent) is almost seven times greater than the taxburden on the two-earner household (0.8 per cent). Note the burden will be the samefor households with the same earning structure and no children.
In the second scenario, both households are in the top tax bracket, with totalannual household income of UGX5.76 million. The first household has a singleearner (either male or female) who makes UGX5.76 million and pays a PAYEof UGX798,000 per annum. The second household has a male who earnsUGX4,800,000 (which falls in the second highest tax bracket) and a female whoearns UGX960,00 per annum (again below the tax threshold) and owesUGX378,000 in PAYE per annum – less than half as much as the first household.
These examples show that the Ugandan PIT is progressive in income terms.As Table 9.6 indicates, it can also be considered progressive in gender terms inthat 31 per cent of females, compared to 69 per cent of males, in dual-earnerhouseholds are in the lowest tax bracket, and hence have no tax liability. The per-centage of female- and male-single-earner households in the lowest bracket isequivalent at 17 per cent. By contrast, 20 per cent of females in dual-earnerhouseholds are in the highest tax bracket compared to 80 per cent of males, and11 per cent of single-earner households in the highest brackets are female com-pared to 29 per cent of males. Households with children bear a higher burden ofincome tax, as the tax system does not offer child rebates or allowances to house-holds with children, who are predominantly cared for by women.
Thus, while the Ugandan personal income tax system is vertically equitable, itmakes no provision for horizontal equity. Households with the same total incomepay different amounts of tax, because of differences in the earning structure ofindividual members. And, households with children bear a larger burden of taxesthan do households without children, as the personal tax system contains noprovision for dependants. This calls for the government to put in place tax meas-ures that could reduce gender inequality in terms of disposable income.
242 S. Ssewanyana, L. Bategeka, M. Guloba and J. Kiiza
Table 9.5 Tax impact on households by earner, Uganda
HH earner Children/ Female Male Female Male Total Total dependant annual annual annual annual HH HH
income income income income annual annual tax tax income income
tax
Household total income UGX3 million
One earner male W/C – 3,000,000 – 162,000 162,000 3,000,000One earner female W/C 3,000,000 – 162,000 – 162,000 3,000,000Dual earner W/C – 3,000,000 – >24,000 24,000 3,000,000more males
Household total income UGX5.76 million
One earner male W/C – 5,760,000 – 798,000 798,000 5,760,000One earner female W/C 5,760,000 – 798,000 – 798,000 5,760,000Dual earner W/C 960,000 4,800,000 – 378,000 378,000 5,760,000more males

Gender equality and taxation in Uganda 243
Table 9.6 Distribution of household type by PAYE income tax bracket and gender,Uganda (%)
PAYE Dual- Single Single No- Total % Dual-earner by genderbrackets earner female- male- earning
earner earner adult PAYE Females Malesbrackets
<130,000 63.50 16.73 17.07 2.71 2,373,849 <130,000 31.11 68.89130,000–235,000 56.23 13.99 28.86 0.92 286,762 130,000–235,000 17.94 82.06235,000–410,000 58.73 12.95 28.32 0.00 140,186 235,000–410,000 10.25 89.75>410,000 56.82 10.58 28.92 3.68 85,312 >410,000 19.79 80.21Total 1,799,371 464,373 552,360 70,005 2,886,109
Source: Authors’ calculations based on Uganda National Household Survey-UNHS III, 2005–06.
Gender and indirect tax incidence
In examining the incidence of indirect tax, we have used the UNHS III data aswell as administrative data from URA. Throughout the chapter, the incidence oftax is defined as the share of a specific type of tax in total household consump-tion expenditure – the higher the incidence, the higher the burden of tax on agiven household. To capture the gender dimension, households are classified intothe categories described earlier, specifically, according to the sex of householdhead, the sex composition of adult members, and the employment status of adultmembers.
The incidence of indirect tax is significantly greater for male-type householdsthan for female-type households (see Figure 9.3 and Table 9.7). As noted above,VAT imposes a greater burden on households than do excise duties or the fuellevy. Total indirect taxes are moderately progressive: the share of total indirecttax in total expenditure increases with expenditure quintile (see Figures 9.4(a) and9.5(a)). Within each quintile, female-type households have a significantly lowerincidence of total indirect tax than their male counterparts. The only exception isin female-majority households, where significant gender differences appear in the4th and 5th quintiles (Ssewanyana 2009).
Gender differences do appear in the incidence of some types of tax, althoughnot in others. Regardless of household category, no significant gender differ-ences are evident in the incidence of the fuel levy except in the richest quintile.Incidence of the fuel levy is significantly greater for the richest male-type house-holds than for their female counterparts. Not surprisingly, since it is a broad-based tax, the VAT imposes a higher tax burden than do excise duties for allexpenditure quintiles. With the exception of the sex composition category, theresults reveal a significantly higher VAT and excise tax burden for male-typehouseholds relative to their female counterparts with similar householdincome.
With regard to excise duties, female-majority households have a lower inci-dence than do male-majority households, except in the poorest quintile. In termsof VAT, female-majority households in the poorest and wealthiest quintiles havea significantly lower VAT tax burden than do male majority households. It isimportant to note that gender differentials in the tax burden are more pronounced

0.00
1.00
2.00
3.00
4.00
5.00
6.00
Totaltax
VAT Exciseduties
Fuellevy
% t
ax in
exp
end
itu
re
(b) By sex composition of adult members
0.00
1.00
2.00
3.00
4.00
5.00
6.00
Totaltax
VAT Exciseduties
Fuellevy
% t
ax in
exp
end
itu
re
(a) By gender of household head
0.001.002.003.004.005.006.00
Totaltax
VAT Exciseduties
Fuellevy
% t
ax in
exp
end
itu
re
(c) By adult member employment status
7.008.00
Female-headed Male-headed Adult female-majority
Adult male-majority
Equal gender
Dual-earners
Male-breadwinner No-employed
Female-breadwinner
Figure 9.3 Incidence of indirect tax by type of tax and household typology, Uganda (%).
Table 9.7 Incidence of indirect tax by tax type and household typology, Uganda (%)
Household type Total tax Tax type Number of households (‘000)
VAT Excises Fuel
Sex of head
Male-headed 5.22 3.11 1.52 0.59 3,820.8Female-headed 4.11 2.58 1.06 0.47 1,408.5
Adult sex composition
Male-majority 5.52 3.11 1.73 0.67 1,049.8Female-majority 4.28 2.67 1.10 0.52 1,552.4Equal number 5.06 3.08 1.44 0.54 2,627.1

Gender equality and taxation in Uganda 245
among the richest than among the poorest quintiles. Overall, the findings indicatethat analysing gender differentials in the taxation system by considering the adultsex composition of households might not suggest significant policy recommen-dations. For this reason, the subsequent analysis examines the incidence of indi-rect taxes on households classified by the sex of the head and by the employmentstatus of adult members, controlling for the presence of children.
Nearly 17 per cent of Ugandan households are not living with children. Becausethey are clustered in the highest quintile, on average these households have a signifi-cantly higher tax burden compared to their counterparts living with children (seeTable 9.8). This suggests that these households have higher disposable incomes,making it possible for them to spend more on taxable goods and services. On the otherhand, higher taxes leading to higher prices might prevent households living withchildren from consuming certain goods and services. More importantly, the incidenceof tax is significantly lower for female-type households relative to their male coun-terparts regardless of whether the household includes children. The patterns of genderdifferences in the incidence of tax on households with children do not change muchafter controlling for expenditure quintile (see Figures 9.4(b) and 9.5(b)). Householdswithout children exhibit no discernible patterns (see Figures 9.4(c) and 9.5(c)).
Gender differences in consumption
Figure 9.6 portrays gender differentials in consumption patterns of goods andservices that attract tax. Households headed by males were more likely to reportspending on alcohol beverages, tobacco and cigarettes, and transport and com-munication than were households headed by females, which in turn were morelikely to report expenditures on food than were their male counterparts. The highincidence in the food category is driven largely by purchases of salt, which isconsumed by nearly 93 per cent of Ugandan households.
Disaggregated incidence analysis of various consumption categories providesinsights into possible tax reforms (see Table 9.9). Gender differences are significantat the aggregate level, with few exceptions. However, the impact varies according tohousehold type. Female-majority households have a higher incidence of indirect taxon food, children’s clothing and footwear and fuel than male-majority households.
Table 9.7 (Continued)
Household type Total tax Tax type Number of households (‘000)
VAT Excises Fuel
Employment status
Male-breadwinner 6.81 3.79 2.18 0.83 836.3Female-breadwinner 4.18 2.64 1.34 0.47 1,104.1Dual-earner 4.85 2.97 1.34 0.55 2,825.8No- employed 3.69 2.23 1.15 0.31 463.1
Source: Authors’ calculations based on Uganda National Household Survey-UNHS III, 2005–06.

Table 9.8 Incidence of tax by employment status and presence of children, Uganda
Quintile Total VAT Excises Fuel Number of Total VAT Excises Fuel Number of Total VAT Excises Fuel Number oftax HH (‘000) tax HH (‘000) tax HH (‘000)
All male-breadwinner Male-breadwinner with children Male-breadwinner with no children
1 4.12 2.58 1.43 0.11 65.4 4.16 2.66 1.38 0.12 57.4 3.83 2.00 1.83 0.00 8.02 5.83 3.29 2.27 0.28 78.0 5.45 2.16 1.82 0.33 63.2 7.47 3.25 4.17 0.05 14.83 5.13 3.15 1.50 0.48 95.3 5.23 2.27 1.47 0.40 69.1 4.88 2.62 1.59 0.67 26.24 6.32 3.62 2.05 0.65 173.5 6.43 3.80 1.76 0.86 113.8 6.11 3.28 2.59 0.24 59.75 7.98 4.29 2.49 1.20 424.2 7.74 4.27 2.27 1.18 142.4 8.10 4.29 2.60 1.20 281.8All 6.81 3.79 2.18 0.83 836.3 6.23 3.66 1.84 0.73 445.8 7.46 3.94 2.57 0.95 390.5
All female-breadwinner Female-breadwinner with children Female-breadwinner without children
1 2.90 1.83 0.90 0.16 209.7 2.91 1.84 0.90 0.17 207.2 1.32 0.87 0.46 0.00 2.42 3.49 2.29 0.93 0.27 184.8 3.52 2.30 0.94 0.28 180.3 2.45 1.75 0.61 0.08 4.53 3.94 2.53 1.04 0.36 206.9 3.87 2.52 0.97 0.38 193.7 4.90 2.72 2.11 0.08 13.24 4.33 2.79 0.99 0.54 209.8 4.34 2.81 0.95 0.58 185.1 4.25 2.65 1.31 0.29 24.75 5.59 3.40 1.35 0.84 293.0 4.88 3.10 1.00 0.77 194.8 7.02 4.01 2.03 0.98 98.2All 4.18 2.64 1.34 0.47 1,104.1 3.89 2.51 0.95 0.43 961.2 6.11 3.53 1.84 0.73 142.9
All dual-earner Dual-earner with children Dual-earner with no children
1 3.99 2.50 1.31 0.18 515.3 4.00 2.51 1.31 0.18 511.7 2.82 1.88 0.94 0.00 3.62 4.39 2.75 1.34 0.30 576.7 4.39 2.75 1.33 0.31 567.0 4.37 2.55 1.77 0.05 9.73 4.56 2.82 1.27 0.47 605.5 4.59 2.84 1.27 0.47 579.6 3.92 2.41 1.21 0.30 25.94 5.12 3.04 1.35 0.73 606.1 5.05 3.00 1.30 0.75 559.7 5.94 3.47 2.00 0.48 46.45 6.25 3.75 1.42 1.09 522.1 6.16 3.73 1.33 1.09 454.4 6.86 3.88 1.99 0.99 67.7All 4.85 2.97 1.34 0.55 2,825.8 4.80 2.94 1.31 0.55 2,672.4 5.83 3.37 1.82 0.64 153.4
All no-employed No-employed with children No-employed with no children
1 2.84 1.74 0.95 0.16 63.3 2.90 1.77 0.95 0.19 52.7 2.54 1.58 0.97 0.00 10.62 3.30 2.02 1.08 0.20 81.8 3.49 2.16 1.03 0.30 56.1 2.90 1.70 1.20 0.00 25.63 3.51 2.20 1.09 0.22 82.7 3.47 2.27 0.94 0.26 40.9 3.55 2.12 1.24 0.19 41.84 3.55 2.09 1.18 0.28 112.4 3.13 1.95 0.84 0.34 55.0 3.95 2.22 1.51 0.23 57.35 4.61 2.78 1.30 0.53 123.0 4.23 2.70 0.96 0.57 55.0 4.92 2.84 1.58 0.50 68.0All 3.69 2.23 1.15 0.31 463.1 3.45 2.17 0.94 0.34 259.8 3.99 2.31 1.41 0.27 203.3

0
2
4
6
8
0
2
4
6
8
1 2 3 4 5 1 2 3 4 5
Total indirect taxes VAT
Excise duties Fuel levy
Female Male
% t
ax in
exp
end
itu
re%
tax
in e
xpen
dit
ure
Expenditure quintile
(a) Incidence of tax by sex of head and expenditure quintile, Uganda (%)
0
2
4
6
0
2
4
6
Total indirect taxes VAT
Excise duties Fuel levy
(b) Tax incidence by sex of head with children and expenditure quintile, Uganda (%)
1 2 3 4 5 1 2 3 4 5
Expenditure quintile
Female-headedMale-headed
Figure 9.4 Incidence of tax by sex of head and expenditure quintile, Uganda (%).(Continued).

Figure 9.4 (Continued) Incidence of tax by sex of head and expenditure quintile,Uganda (%).
Female-headedMale-headed
% t
ax in
exp
end
itu
re
0
2
4
6
8
0
2
4
6
8
Total indirect taxes VAT
Excise duties Fuel levy
(c) Tax incidence by sex of head without children and expenditure quintile, Uganda (%)
1 2 3 4 5 1 2 3 4 5
Expenditure quintile
0
2
4
6
8
0
2
4
6
8
1 2 3 4 5 1 2 3 4 5
Total indirect taxes VAT
Excise duties Fuel levy
Dual-earners Female-breadwinnerOnly male earners No earners
% t
ax in
exp
end
itu
re
Expenditure quintile
(a) Incidence of tax by employment status and expenditure quintile, Uganda (%)
Figure 9.5 Tax incidence by employment status and expenditure quintile, Uganda (%).

Dual-earners Female-breadwinnerMale-breadwinner No-employed
Expenditure quintile1 2 3 4 5 1 2 3 4 5
0
2
4
6
8
0
2
4
6
8
Total indirect taxes VAT
Excise duties Fuel levy
% t
ax in
exp
end
itu
re
(c) Tax incidence by employment status without children and expenditure quintile, Uganda (%)
Figure 9.5 (Continued) Tax Incidence by employment status and expenditure quintile,Uganda (%).
Dual-earners Female-breadwinnerMale-breadwinner No-employed
Expenditure quintile1 2 3 4 5 1 2 3 4 5
0
2
4
6
8
0
2
4
6
8
Total indirect taxes VAT
Excise duties Fuel levy
% t
ax in
exp
end
itu
re
(b) Tax incidence by employment status with children and expenditure quintile, Uganda (%)

The results are quite different for the other household types. Notably, male-typehouseholds have a greater incidence of tax on alcoholic beverages, tobacco andcigarettes, transport, communication and adult clothing and footwear than dofemale-type households. This is partly explained by differences in consumptionpatterns across gendered household types. Broadly speaking, households withchildren have a greater incidence of indirect tax than do their counterpartswithout children. The only exceptionally high consumption categories in thesehouseholds are adult clothing and footwear, water and electricity, paraffin, com-munication and miscellaneous goods and services. Gender differences varyacross consumption category for household types with similar income levels. Thepatterns and level of significance remain the same after controlling for presenceof children.
The incidence of indirect tax on food does not show any systematic patternby employment status of adult household members, although significant genderdifferences are evident in the 3rd and 5th quintiles (see Tables 9.8 and AppendixTable A.1). Households in the wealthiest quintile with female breadwinners have
250 S. Ssewanyana, L. Bategeka, M. Guloba and J. Kiiza
0.0 20.0 40.0 60.0 80.0 100.0
Food
Meals out
Non-alcoholic beverages
Alcoholic beverages
Tobacco and cigarettes
Clothing and footwear
Housing, water, electricity
Fuel for house use
House furnishings, equipment, etc.
Domestic services and household services
Health care
Transport
Fuel levy
Communication
Recreation and culture
Education
Personal care
Miscellaneous
Male Female
Figure 9.6 Incidence of non-zero expenses on taxable consumption of categories by sexof head, Uganda (%).
Note: Consumption categories such as personal care, education, health care, domestic services andhousehold services and meals out in the figure above are zero because at the time of study in Uganda,they did not attract tax.

Table 9.9 Incidence of indirect tax for consumption categories by employment status, presence of children and quintile, Uganda (%)
Consumption category Expenditure quintile Expenditure quintile Expenditure quintile
1 2 3 4 5 All 1 2 3 4 5 All 1 2 3 4 5 All
All male-breadwinner Male-breadwinner with children Male-breadwinners without children
Food 0.84 1.16 1.33 1.26 0.83 1.01 0.93 1.32 1.50 1.45 1.08 1.25 0.20 0.44 0.88 0.88 0.71 0.73a) Processed foods 0.58 0.71 0.71 0.73 0.50 0.60 0.64 0.85 0.79 0.85 0.68 0.76 0.14 0.12 0.51 0.49 0.41 0.41b) Sugar 0.25 0.45 0.62 0.53 0.33 0.41 0.28 0.48 0.71 0.60 0.39 0.49 0.06 0.32 0.37 0.40 0.30 0.31c) Unprocessed foods 0.00 0.00 0.00 0.00 0.00 0.00 0.00 0.00 0.00 0.00 0.00 0.00 0.00 0.00 0.00 0.00 0.00 0.00
Meals out 0.00 0.00 0.00 0.00 0.00 0.00 0.00 0.00 0.00 0.00 0.00 0.00 0.00 0.00 0.00 0.00 0.00 0.00Non-alcoholic beverages 0.18 0.26 0.23 0.35 0.73 0.50 0.19 0.30 0.24 0.30 0.50 0.34 0.09 0.05 0.21 0.44 0.84 0.69Alcoholic beverages 0.41 0.86 0.55 0.77 1.48 1.09 0.41 0.52 0.50 0.69 1.26 0.78 0.39 2.35 0.66 0.93 1.59 1.43
a) Beer 0.05 0.15 0.07 0.25 1.02 0.60 0.06 0.19 0.10 0.35 1.12 0.50 0.00 0.00 0.00 0.05 0.97 0.71b) Other alcoholic beverages 0.36 0.71 0.47 0.53 0.46 0.49 0.35 0.33 0.40 0.34 0.14 0.29 0.39 2.35 0.66 0.88 0.62 0.72
Tobacco and cigarettes 0.55 1.16 0.30 0.82 0.55 0.63 0.44 0.77 0.26 0.45 0.48 0.48 1.28 2.83 0.40 1.52 0.59 0.82Clothing and footwear 0.44 0.55 0.42 0.52 0.56 0.52 0.44 0.60 0.43 0.58 0.58 0.54 0.45 0.33 0.38 0.42 0.54 0.50
a) Adults’ clothing 0.26 0.38 0.30 0.40 0.46 0.41 0.25 0.39 0.28 0.40 0.39 0.36 0.33 0.33 0.36 0.40 0.50 0.47and footwear
b) Children’s clothing 0.15 0.14 0.10 0.10 0.07 0.09 0.16 0.17 0.13 0.15 0.16 0.15 0.05 0.00 0.00 0.00 0.02 0.02and footwear
c) Others 0.02 0.02 0.02 0.02 0.02 0.02 0.02 0.02 0.02 0.02 0.02 0.02 0.01 0.01 0.02 0.01 0.02 0.02Housing, water, electricity 0.04 0.08 0.14 0.20 0.30 0.22 0.04 0.10 0.16 0.27 0.36 0.23 0.01 0.00 0.09 0.08 0.26 0.21
a) Housing 0.00 0.00 0.00 0.00 0.00 0.00 0.00 0.00 0.00 0.00 0.00 0.00 0.00 0.00 0.00 0.00 0.00 0.00b) Water and electricity 0.04 0.08 0.14 0.20 0.30 0.22 0.04 0.10 0.16 0.27 0.36 0.23 0.01 0.00 0.09 0.08 0.26 0.21
Fuel for house use 0.23 0.20 0.22 0.17 0.14 0.17 0.23 0.19 0.21 0.14 0.09 0.15 0.27 0.23 0.27 0.21 0.16 0.18a) Paraffin/kerosene 0.23 0.20 0.22 0.17 0.13 0.16 0.23 0.19 0.21 0.14 0.09 0.15 0.27 0.23 0.27 0.21 0.16 0.18b) Generator/lawn mower 0.00 0.00 0.00 0.00 0.00 0.00 0.00 0.00 0.00 0.00 0.00 0.00 0.00 0.00 0.00 0.00 0.00 0.00c) Others 0.00 0.00 0.00 0.00 0.00 0.00 0.00 0.00 0.00 0.00 0.00 0.00 0.00 0.00 0.00 0.00 0.00 0.00
House furnishings, equipments 0.22 0.24 0.34 0.25 0.36 0.31 0.18 0.24 0.36 0.28 0.30 0.28 0.47 0.22 0.30 0.21 0.38 0.35and routine maintenanceDomestic services and 0.00 0.00 0.00 0.00 0.00 0.00 0.00 0.00 0.00 0.00 0.00 0.00 0.00 0.00 0.00 0.00 0.00 0.00household servicesHealth care 0.00 0.00 0.00 0.00 0.00 0.00 0.00 0.00 0.00 0.00 0.00 0.00 0.00 0.00 0.00 0.00 0.00 0.00Transport 0.20 0.20 0.10 0.14 0.20 0.17 0.23 0.19 0.12 0.13 0.23 0.18 0.00 0.27 0.03 0.15 0.18 0.17Fuel levy 0.11 0.28 0.48 0.65 1.20 0.83 0.12 0.33 0.40 0.87 1.19 0.73 0.00 0.05 0.67 0.24 1.20 0.95
(Continued)

Table 9.9 (Continued) Incidence of indirect tax for consumption categories by employment status, presence of children and quintile, Uganda (%)
Consumption category Expenditure quintile Expenditure quintile Expenditure quintile
1 2 3 4 5 All 1 2 3 4 5 All 1 2 3 4 5 All
Communication 0.03 0.08 0.22 0.34 0.81 0.52 0.03 0.09 0.23 0.47 0.94 0.47 0.00 0.04 0.19 0.09 0.75 0.57Recreation and culture 0.00 0.00 0.01 0.05 0.10 0.06 0.00 0.00 0.00 0.06 0.09 0.04 0.00 0.00 0.01 0.02 0.11 0.08Education 0.00 0.00 0.00 0.00 0.00 0.00 0.00 0.00 0.00 0.00 0.00 0.00 0.00 0.00 0.00 0.00 0.00 0.00Personal care 0.00 0.00 0.00 0.00 0.00 0.00 0.00 0.00 0.00 0.00 0.00 0.00 0.00 0.00 0.00 0.00 0.00 0.00Miscellaneous 0.88 0.76 0.80 0.81 0.73 0.77 0.91 0.79 0.81 0.75 0.63 0.75 0.67 0.64 0.79 0.93 0.78 0.79
All female-breadwinner Female-breadwinner with children Female-breadwinner without children
Food 0.62 1.04 1.04 1.25 1.11 1.02 0.63 1.05 1.06 1.29 1.10 1.02 0.14 0.84 0.84 0.88 1.13 1.03a) Processed foods 0.40 0.54 0.53 0.67 0.63 0.56 0.40 0.54 0.55 0.69 0.65 0.56 0.14 0.54 0.28 0.54 0.60 0.55b) Sugar 0.22 0.50 0.51 0.57 0.48 0.46 0.22 0.50 0.51 0.60 0.45 0.45 0.00 0.30 0.56 0.35 0.53 0.49c) Unprocessed foods 0.00 0.00 0.00 0.00 0.00 0.00 0.00 0.00 0.00 0.00 0.00 0.00 0.00 0.00 0.00 0.00 0.00 0.00
Meals out 0.00 0.00 0.00 0.00 0.00 0.00 0.00 0.00 0.00 0.00 0.00 0.00 0.00 0.00 0.00 0.00 0.00 0.00Non-alcoholic beverages 0.08 0.15 0.17 0.19 0.30 0.19 0.08 0.15 0.16 0.19 0.23 0.16 0.03 0.08 0.34 0.25 0.46 0.39Alcoholic beverages 0.23 0.22 0.33 0.23 0.61 0.35 0.23 0.23 0.27 0.20 0.30 0.25 0.00 0.00 1.24 0.44 1.25 1.05
a) Beer 0.00 0.02 0.08 0.11 0.52 0.17 0.00 0.02 0.08 0.12 0.25 0.09 0.00 0.00 0.11 0.00 1.05 0.73b) Other alcoholic beverages 0.23 0.21 0.26 0.12 0.09 0.17 0.23 0.21 0.20 0.08 0.04 0.15 0.00 0.00 1.13 0.44 0.20 0.32
Tobacco and cigarettes 0.23 0.15 0.14 0.07 0.07 0.13 0.23 0.16 0.10 0.06 0.04 0.12 0.00 0.07 0.76 0.15 0.13 0.18Clothing and footwear 0.35 0.43 0.44 0.49 0.53 0.46 0.35 0.43 0.46 0.50 0.49 0.44 0.21 0.27 0.22 0.43 0.63 0.54
a) Adults’ clothing 0.18 0.22 0.26 0.30 0.36 0.27 0.18 0.22 0.27 0.29 0.28 0.25 0.18 0.24 0.19 0.37 0.52 0.45and footwear
b) Children’s clothing 0.14 0.17 0.15 0.16 0.12 0.14 0.14 0.17 0.16 0.18 0.16 0.16 0.00 0.00 0.00 0.01 0.04 0.03and footwear
c) Others 0.02 0.03 0.02 0.02 0.04 0.03 0.02 0.03 0.02 0.02 0.03 0.02 0.03 0.03 0.02 0.02 0.05 0.04Housing, water, electricity 0.03 0.05 0.09 0.15 0.25 0.13 0.03 0.06 0.10 0.16 0.21 0.11 0.00 0.00 0.00 0.11 0.33 0.25
a) Housing 0.00 0.00 0.00 0.00 0.00 0.00 0.00 0.00 0.00 0.00 0.00 0.00 0.00 0.00 0.00 0.00 0.00 0.00b) Water and electricity 0.03 0.01 0.09 0.15 0.25 0.13 0.03 0.01 0.10 0.16 0.21 0.11 0.00 0.00 0.00 0.11 0.33 0.25
Fuel for house use 0.20 0.17 0.18 0.16 0.14 0.17 0.19 0.17 0.17 0.14 0.12 0.16 0.27 0.16 0.26 0.30 0.20 0.22a) Paraffin/kerosene 0.19 0.17 0.17 0.16 0.14 0.17 0.19 0.17 0.17 0.14 0.12 0.16 0.27 0.16 0.26 0.30 0.19 0.22b) Generator/lawn mower 0.00 0.00 0.00 0.00 0.00 0.00 0.00 0.00 0.00 0.00 0.00 0.00 0.00 0.00 0.00 0.00 0.00 0.00c) Others 0.00 0.00 0.00 0.00 0.00 0.00 0.00 0.00 0.00 0.00 0.00 0.00 0.00 0.00 0.00 0.00 0.00 0.00
House furnishings, equipments 0.21 0.21 0.26 0.25 0.39 0.28 0.22 0.21 0.25 0.25 0.39 0.27 0.07 0.24 0.31 0.22 0.40 0.35and routine maintenance

Table 9.9 (Continued)
Consumption category Expenditure quintile Expenditure quintile Expenditure quintile
1 2 3 4 5 All 1 2 3 4 5 All 1 2 3 4 5 All
Domestic services and 0.00 0.00 0.00 0.00 0.00 0.00 0.00 0.00 0.00 0.00 0.00 0.00 0.00 0.00 0.00 0.00 0.00 0.00household servicesHealth care 0.00 0.00 0.00 0.00 0.00 0.00 0.00 0.00 0.00 0.00 0.00 0.00 0.00 0.00 0.00 0.00 0.00 0.00Transport 0.03 0.06 0.09 0.06 0.13 0.08 0.03 0.06 0.09 0.07 0.18 0.08 0.00 0.00 0.14 0.00 0.01 0.02Fuel levy 0.16 0.27 0.36 0.54 0.84 0.47 0.17 0.28 0.38 0.58 0.77 0.43 0.00 0.08 0.08 0.29 0.98 0.73Communication 0.01 0.04 0.08 0.14 0.45 0.17 0.01 0.04 0.08 0.15 0.36 0.13 0.00 0.00 0.06 0.03 0.61 0.43Recreation and culture 0.01 0.00 0.00 0.01 0.05 0.02 0.01 0.00 0.01 0.01 0.07 0.02 0.00 0.00 0.00 0.00 0.01 0.01Education 0.00 0.00 0.00 0.00 0.00 0.00 0.00 0.00 0.00 0.00 0.00 0.00 0.00 0.00 0.00 0.00 0.00 0.00Personal care 0.00 0.00 0.00 0.00 0.00 0.00 0.00 0.00 0.00 0.00 0.00 0.00 0.00 0.00 0.00 0.00 0.00 0.00Miscellaneous 0.75 0.70 0.74 0.78 0.72 0.74 0.75 0.70 0.75 0.74 0.63 0.71 0.59 0.70 0.66 1.14 0.89 0.90
All dual-earner Dual-earner with children Dual-earner without children
Food 0.83 0.98 1.09 1.07 0.99 1.00 0.83 0.98 1.09 1.07 1.00 1.00 0.21 0.74 0.95 1.08 0.90 0.94a) Processed foods 0.52 0.51 0.58 0.59 0.59 0.56 0.52 0.51 0.58 0.60 0.60 0.56 0.17 0.49 0.61 0.57 0.49 0.53b) Sugar 0.31 0.47 0.51 0.48 0.41 0.44 0.31 0.48 0.52 0.47 0.40 0.44 0.04 0.25 0.34 0.51 0.42 0.41c) Unprocessed foods 0.00 0.00 0.00 0.00 0.00 0.00 0.00 0.00 0.00 0.00 0.00 0.00 0.00 0.00 0.00 0.00 0.00 0.00
Meals out 0.00 0.00 0.00 0.00 0.00 0.00 0.00 0.00 0.00 0.00 0.00 0.00 0.00 0.00 0.00 0.00 0.00 0.00Non-alcoholic beverages 0.15 0.16 0.19 0.22 0.31 0.21 0.15 0.17 0.19 0.22 0.29 0.20 0.11 0.11 0.11 0.22 0.42 0.28Alcoholic beverages 0.49 0.55 0.50 0.62 0.62 0.56 0.49 0.54 0.51 0.57 0.59 0.54 0.37 1.14 0.21 1.16 0.81 0.83
a) Beer 0.02 0.05 0.11 0.21 0.45 0.17 0.02 0.05 0.12 0.21 0.46 0.16 0.00 0.00 0.00 0.24 0.41 0.25b) Other alcoholic beverages 0.47 0.51 0.39 0.40 0.17 0.39 0.47 0.50 0.40 0.36 0.13 0.38 0.37 1.14 0.21 0.93 0.40 0.57
Tobacco and cigarettes 0.39 0.36 0.29 0.28 0.21 0.31 0.40 0.36 0.29 0.26 0.16 0.30 0.13 0.47 0.38 0.52 0.52 0.49Clothing and footwear 0.53 0.58 0.60 0.60 0.67 0.59 0.53 0.58 0.60 0.60 0.66 0.59 0.54 0.42 0.52 0.60 0.70 0.62
a) Adults’ clothing 0.33 0.38 0.40 0.40 0.46 0.39 0.33 0.38 0.39 0.39 0.43 0.38 0.53 0.33 0.46 0.55 0.62 0.55and footwear
b) Children’s clothing 0.16 0.16 0.16 0.16 0.16 0.17 0.16 0.17 0.16 0.16 0.17 0.19 0.00 0.04 0.02 0.02 0.01 0.04and footwear
c) Others 0.02 0.03 0.03 0.03 0.02 0.03 0.02 0.03 0.03 0.03 0.02 0.03 0.01 0.03 0.03 0.02 0.03 0.03Housing, water, electricity 0.04 0.03 0.05 0.07 0.23 0.08 0.04 0.03 0.05 0.07 0.24 0.08 0.00 0.01 0.03 0.07 0.18 0.10
a) Housing 0.00 0.00 0.00 0.00 0.00 0.00 0.00 0.00 0.00 0.00 0.00 0.00 0.00 0.00 0.00 0.00 0.00 0.00b) Water and electricity 0.04 0.03 0.05 0.07 0.23 0.08 0.04 0.03 0.05 0.07 0.24 0.08 0.00 0.01 0.03 0.07 0.18 0.10
(Continued)

Table 9.9 (Continued) Incidence of indirect tax for consumption categories by employment status, presence of children and quintile, Uganda (%)
Consumption category Expenditure quintile Expenditure quintile Expenditure quintile
1 2 3 4 5 All 1 2 3 4 5 All 1 2 3 4 5 All
Fuel for house use 0.21 0.19 0.17 0.14 0.11 0.16 0.21 0.19 0.17 0.13 0.10 0.16 0.27 0.20 0.27 0.18 0.23 0.22a) Paraffin/kerosene 0.21 0.19 0.17 0.13 0.09 0.16 0.21 0.19 0.16 0.13 0.09 0.16 0.27 0.20 0.27 0.18 0.12 0.17b) Generator/lawn mower 0.00 0.00 0.00 0.01 0.02 0.00 0.00 0.00 0.00 0.01 0.01 0.00 0.00 0.00 0.00 0.00 0.11 0.00c) Others 0.00 0.00 0.00 0.00 0.00 0.00 0.00 0.00 0.00 0.00 0.00 0.00 0.00 0.00 0.00 0.00 0.00 0.00
House furnishings, equipments 0.24 0.24 0.24 0.29 0.46 0.29 0.24 0.23 0.25 0.28 0.47 0.29 0.16 0.40 0.15 0.37 0.42 0.35and routine maintenanceDomestic services and 0.00 0.00 0.00 0.00 0.00 0.00 0.00 0.00 0.00 0.00 0.00 0.00 0.00 0.00 0.00 0.00 0.00 0.00household servicesHealth care 0.00 0.00 0.00 0.00 0.00 0.00 0.00 0.00 0.00 0.00 0.00 0.00 0.00 0.00 0.00 0.00 0.00 0.00Transport 0.11 0.18 0.17 0.20 0.36 0.20 0.11 0.18 0.17 0.20 0.37 0.20 0.00 0.04 0.16 0.16 0.28 0.20Fuel levy 0.18 0.30 0.47 0.73 1.09 0.55 0.18 0.31 0.47 0.75 1.10 0.55 0.00 0.05 0.30 0.48 1.00 0.64Communication 0.04 0.07 0.13 0.22 0.60 0.21 0.04 0.08 0.14 0.23 0.59 0.20 0.00 0.00 0.08 0.15 0.73 0.38Recreation and culture 0.00 0.00 0.01 0.03 0.07 0.02 0.00 0.00 0.01 0.03 0.08 0.02 0.00 0.00 0.00 0.00 0.02 0.01Education 0.00 0.00 0.00 0.00 0.00 0.00 0.00 0.00 0.00 0.00 0.00 0.00 0.00 0.00 0.00 0.00 0.00 0.00Personal care 0.00 0.00 0.00 0.00 0.00 0.00 0.00 0.00 0.00 0.00 0.00 0.00 0.00 0.00 0.00 0.00 0.00 0.00Miscellaneous 0.78 0.74 0.66 0.65 0.53 0.00 0.78 0.74 0.65 0.63 0.51 0.00 1.03 0.78 0.75 0.96 0.65 0.00
All no-employed No-employed with children No-employed without children
Food 0.45 0.83 0.82 0.79 0.95 0.80 0.44 0.90 0.95 0.77 0.96 0.80 0.53 0.67 0.69 0.82 0.95 0.80a) Processed foods 0.25 0.42 0.40 0.30 0.47 0.00 0.24 0.42 0.42 0.37 0.46 0.00 0.27 0.43 0.38 0.23 0.48 0.00b) Sugar 0.20 0.41 0.42 0.49 0.48 0.42 0.19 0.48 0.54 0.39 0.50 0.42 0.26 0.24 0.32 0.58 0.47 0.43c) Unprocessed foods 0.00 0.00 0.00 0.00 0.00 0.00 0.00 0.00 0.00 0.00 0.00 0.00 0.00 0.00 0.00 0.00 0.00 0.00
Meals out 0.00 0.00 0.00 0.00 0.00 0.00 0.00 0.00 0.00 0.00 0.00 0.00 0.00 0.00 0.00 0.00 0.00 0.00Non-alcoholic beverages 0.11 0.09 0.17 0.16 0.27 0.17 0.13 0.11 0.22 0.20 0.21 0.17 0.04 0.04 0.13 0.12 0.32 0.18Alcoholic beverages 0.24 0.39 0.43 0.49 0.49 0.43 0.29 0.41 0.21 0.19 0.29 0.28 0.00 0.37 0.64 0.77 0.65 0.61
a) Beer 0.00 0.00 0.00 0.00 0.29 0.08 0.00 0.00 0.00 0.01 0.25 0.05 0.00 0.00 0.00 0.00 0.33 0.11b) Other alcoholic beverages 0.24 0.39 0.43 0.48 0.20 0.35 0.29 0.41 0.21 0.18 0.04 0.23 0.00 0.37 0.64 0.77 0.32 0.50
Tobacco and cigarettes 0.37 0.31 0.24 0.33 0.39 0.33 0.36 0.18 0.14 0.15 0.09 0.19 0.42 0.61 0.35 0.50 0.63 0.52
(Continued)

Table 9.9 (Continued)
Consumption category Expenditure quintile Expenditure quintile Expenditure quintile
1 2 3 4 5 All 1 2 3 4 5 All 1 2 3 4 5 All
Clothing and footwear 0.26 0.31 0.27 0.33 0.39 0.32 0.28 0.38 0.35 0.37 0.41 0.36 0.14 0.14 0.20 0.28 0.38 0.27a) Adults’ clothing and 0.12 0.19 0.18 0.22 0.29 0.21 0.12 0.22 0.18 0.21 0.24 0.20 0.14 0.13 0.17 0.22 0.33 0.23
footwearb) Children’s clothing and 0.12 0.08 0.08 0.06 0.06 0.08 0.15 0.12 0.13 0.13 0.13 0.13 0.00 0.00 0.03 0.00 0.01 0.01
footwearc) Others 0.01 0.01 0.01 0.01 0.03 0.01 0.01 0.02 0.02 0.01 0.03 0.02 0.00 0.01 0.00 0.01 0.02 0.01
Housing, water, electricity 0.01 0.03 0.10 0.06 0.17 0.09 0.02 0.03 0.15 0.09 0.19 0.09 0.00 0.01 0.06 0.03 0.16 0.08a) Housing 0.00 0.00 0.00 0.00 0.00 0.00 0.00 0.00 0.00 0.00 0.00 0.00 0.00 0.00 0.00 0.00 0.00 0.00b) Water and electricity 0.01 0.03 0.10 0.06 0.17 0.09 0.02 0.03 0.15 0.09 0.19 0.09 0.00 0.01 0.06 0.03 0.16 0.08
Fuel for house use 0.19 0.20 0.21 0.23 0.16 0.20 0.16 0.21 0.21 0.18 0.20 0.19 0.31 0.19 0.22 0.29 0.14 0.21a) Paraffin/kerosene 0.19 0.20 0.21 0.23 0.16 0.20 0.16 0.21 0.21 0.18 0.20 0.19 0.31 0.19 0.22 0.29 0.14 0.21b) Generator/lawn mower 0.00 0.00 0.00 0.00 0.00 0.00 0.00 0.00 0.00 0.00 0.00 0.00 0.00 0.00 0.00 0.00 0.00 0.00c) Others 0.00 0.00 0.00 0.00 0.00 0.00 0.00 0.00 0.00 0.00 0.00 0.00 0.00 0.00 0.00 0.00 0.00 0.00
House furnishings, equipments 0.23 0.23 0.21 0.16 0.33 0.24 0.24 0.21 0.20 0.15 0.28 0.22 0.17 0.29 0.23 0.18 0.36 0.26and routine maintenanceDomestic services and 0.00 0.00 0.00 0.00 0.00 0.00 0.00 0.00 0.00 0.00 0.00 0.00 0.00 0.00 0.00 0.00 0.00 0.00household servicesHealth care 0.00 0.00 0.00 0.00 0.00 0.00 0.00 0.00 0.00 0.00 0.00 0.00 0.00 0.00 0.00 0.00 0.00 0.00Transport 0.12 0.06 0.09 0.05 0.13 0.09 0.14 0.09 0.18 0.07 0.23 0.14 0.00 0.00 0.00 0.04 0.06 0.03Fuel levy 0.16 0.20 0.22 0.28 0.53 0.31 0.19 0.30 0.26 0.34 0.57 0.34 0.00 0.00 0.19 0.23 0.50 0.27Communication 0.01 0.03 0.02 0.05 0.20 0.08 0.01 0.03 0.03 0.07 0.18 0.07 0.00 0.02 0.02 0.04 0.21 0.08Recreation and culture 0.00 0.00 0.08 0.00 0.09 0.04 0.00 0.00 0.00 0.01 0.15 0.03 0.00 0.00 0.16 0.00 0.05 0.05Education 0.00 0.00 0.00 0.00 0.00 0.00 0.00 0.00 0.00 0.00 0.00 0.00 0.00 0.00 0.00 0.00 0.00 0.00Personal care 0.00 0.00 0.00 0.00 0.00 0.00 0.00 0.00 0.00 0.00 0.00 0.00 0.00 0.00 0.00 0.00 0.00 0.00Miscellaneous 0.69 0.62 0.62 0.60 0.51 0.60 0.65 0.65 0.57 0.54 0.49 0.58 0.92 0.56 0.68 0.66 0.52 0.62

256 S. Ssewanyana, L. Bategeka, M. Guloba and J. Kiiza
a higher incidence of indirect tax than do their male counterparts. This pattern isreversed in the 3rd quintile. Among other household categories, female-majorityhouseholds have a significantly higher incidence than do male-majority house-holds, except in the 1st and 3rd quintiles. Male-headed households in the poorestquintile have a significantly higher incidence than do their female counterparts.This pattern is reversed in the 5th quintile. Indirect taxes on foods are mainlyVAT on processed foods such as rice, bread, cooking oils and sugar.
The incidence of indirect tax on alcoholic beverages and tobacco and cigarettesis neither progressive nor regressive, but households in the poorest quintile havea lower incidence than do their counterparts in the richest quintile. More specifi-cally, the incidence falls more on male-type households than on female-typehouseholds, and is significantly higher in the 2nd, 4th and 5th quintiles. In everyquintile, male-headed households have a significantly higher incidence of indirecttax on alcoholic beverages than do female-headed households, largely becausethey spend more of their income on these goods.
The incidence of indirect tax on clothing and footwear is less affected by income,but in the two poorest quintiles it is significantly greater in male-breadwinnerhouseholds than in female-breadwinner households (see Table 9.7). A similarpattern is evident when male-headed households are compared with female-headed households. This is true in every quintile. The tax incidence for adult cloth-ing and footwear is also similar. On the other hand, except in the two poorestquintiles, female-majority households have a significantly higher incidence ofindirect tax on children’s clothing and footwear than do male-majority households.However, the sex of the head of household does not seem to generate significantdifferences.
Regardless of whether they are headed by males or females, households inlower-income quintiles pay a higher percentage of their income on paraffin taxthan do richer households. This is partly due to higher paraffin consumptionamong households in the lower quintiles. Furthermore, in the three lowest quin-tiles, the tax incidence is much higher in female-type households than in male-type households. A similar pattern is evident for the miscellaneous goods andservices.
The incidence of tax on water and electricity is somewhat progressive. Whilethere are no significant gender differences by employment status for householdswith similar income, households in the second quintile with female heads have asignificantly higher incidence than their male counterparts. On the other hand, theincidence of indirect tax on communication is progressive. Female-type house-holds bear a significantly lower tax burden than do their male counterparts withsimilar income. The only exception to this pattern is in the poorest householdsbased on employment status.
Policy simulations on consumption
Our simulations are based on the analysis of the consumption categoriesdescribed above, the current tax debate in Uganda, and the FY 2008/09 tax reforms.Our goal is to explore whether or not changes in the salt and kerosene/paraffin

Gender equality and taxation in Uganda 257
taxes would affect households with male heads differently from their femalecounterparts. Each of these simulations generates a new incidence of indirect tax.However, the results must be considered with the caveat that the simulations areessentially static and show partial effects only. Nonetheless, they provide impor-tant empirical evidence on the varied effects tax reforms have on different gen-dered household types.
Removal of taxes on salt
Although more than 90 per cent of Ugandan households reported consumingsalt, nearly 28.5 per cent reported that they had borrowed salt from neighboursin the 30 days prior to their survey interview, including 31.8 per cent of female-headed households and 27.3 per cent of male-headed households. On a positivenote, the government has recently reduced the burden by adding salt to the listof VAT-exempted goods. Based on 2005–06 data, this would cut governmentrevenues by nearly UGX5.6bn annually, equivalent to 28 per cent of the totalgovernment budget for social development in FY 2008/09 (Government ofUganda 2005, 2008).
Since nearly all Ugandan households consume salt and the VAT on this itemmade up only 1 per cent of total household indirect taxes, eliminating this tax willhave little impact on the overall progressivity of indirect taxes. Households in thelower quintile, regardless of the sex of the household head, stand to benefit morethan their counterparts in higher expenditure quintiles (see Figure 9.7) from theremoval of tax on salt. This demonstrates that the tax on salt represented a higher pro-portion of consumption expenditure for households in the poorer quintiles.Furthermore, VAT drops faster as a percentage of consumption expenditure in house-holds with female heads compared to households with male heads. In other words,although removal of taxes on salt was meant to target the poorest households over-all, the greatest beneficiaries are the poorest households with female heads, whichcan be considered a gender-responsive policy reform.
0.00
1.00
2.00
3.00
4.00
5.00
Quintile 1 Quintile 2 Quintile 3 Quintile 4 Quintile 5
Female-headed Male-headed
Figure 9.7 Percentage change in VAT incidence with salt zero-rated, Uganda.

258 S. Ssewanyana, L. Bategeka, M. Guloba and J. Kiiza
Cutting the paraffin tax by 50 per cent
The oil lamp (locally known as tadobba) is the main source of lighting used by themajority of households in Uganda, especially in rural areas. Up to 79 per cent ofrural households rely on these lamps, compared to only about 12 per cent who useparaffin lanterns. While tadobbas consume less paraffin than do lanterns, theirhealth hazards are far greater. Furthermore, the use of paraffin in general hasbecome much more expensive as a result of the current global financial crisis, put-ting it beyond the reach of most rural households. This has prompted proposalsthat the current excise levy on paraffin of UGX200 per litre be cut in half. Theresulting revenue loss of nearly UGX8bn per annum would be almost equivalentto the estimated budget for the Universal Primary Education capitation grant in FY2008/09. The overall impact on the incidence of indirect tax would be small, butinversely proportionate to income. However, the benefits to female-headed house-holds would be less than those accruing to their male counterparts (see Figure 9.8).
Overall, the indirect tax policy simulations explored above would definitely havea negative impact on government efforts to mobilize domestic resources. As noted,public spending on the social sector already relies heavily on foreign support. In thecurrent global financial crisis, that assistance is likely to decline, increasing theneed for greater domestic resource mobilization and greater efficiency in revenuecollection in order to sustain existing social investment. For this reason, the gov-ernment should consider revisiting its budget priorities and introducing cost-savingmeasures such as a reduction in public administration expenditures.
Conclusion and policy recommendations
Uganda’s domestic tax revenue sources are still fairly limited, reflecting its limitedindustrial capacity and large informal sector. For this reason, like other countries in
0.00
0.50
1.00
1.50
2.00
2.50
3.00
3.50
Quintile 1 Quintile 2 Quintile 3 Quintile 4 Quintile 5
Female-headedMale-headed
Figure 9.8 Percentage change in indirect tax incidence with paraffin levy halved, Uganda (%).

Gender equality and taxation in Uganda 259
the region, Uganda has chosen to emphasize indirect taxes, which affect the largestresource base. Indirect taxes are difficult to evade, but seem to deter poorer house-holds from purchases of basic items such as paraffin, salt, piped water and so on. Inother words, indirect taxes interfere with the consumption choices of households byraising the prices of taxed goods and services relative to untaxed ones.
In terms of advancing gender equality, our policy simulations show that reduc-tions in taxes on goods and services reduce the tax burden on female-headedhouseholds significantly more than on male-headed households. We have demon-strated, for example, that the recent decision to eliminate taxes on salt is gender-responsive, and that halving the current excise duties on paraffin would benefitfemale-headed households to a greater extent than it would male-headed house-holds, especially in the lower income quintiles.
Reducing taxes on such goods and services will benefit some households, butat the expense of lost tax revenues. The government might address this situationby altering budget priorities and introducing cost-saving measures such as tightercontrols on public administration expenditures. If it decides to retain the taxes onthese items, it could compensate lower-income households through the provisionof transfer payments.
With regard to direct taxation, the share of PAYE in total government tax revenuehas been increasing steadily since 1997 and is likely to increase modestly in the future.While this relative success at mobilizing domestic resources should continue, PAYEcomes from the formal sector, which makes up only 16 per cent of total employment.This suggests that the best way of raising tax revenue is through creating new jobopportunities. The job creation strategy should take into account the gender disparitiesdiscussed above to ensure equitable access to decent jobs for both men and women.
In addition, policy debates have recently begun on whether and how to for-malize informal work in order to reduce the tendency of informal workers toavoid paying taxes and so improve the country’s domestic tax revenue base.Should this be accepted, the benefits of formal employment, including proposedmedical health insurance and pension benefits, minimum wage requirements,maximum working hour regulations and other labour protections generally faroutweigh the advantages of tax evasion, especially for poorer workers. It isimportant to make sure also that the types of informal work in which women areoften concentrated, such as small-scale trade and service provision, are broughtinto the formal sector on the same basis as the informal work done by men.
Unlike indirect taxation, however, Uganda’s personal income tax system hasimplicit gender biases stemming from vertical and horizontal inequities at thehousehold level. As the share of PAYE taxes in total tax revenue increases, it isimportant for policy-makers to address these inequalities. One way in which todo this is by extending tax exemptions that promote gender equality. For example,extending tax deductions for the presence of children in the household would pri-marily benefit women, since women provide most of the support for young depen-dants. Women in the lower tax brackets could also be given deductions based onthe equity principle that women make less money than men and should pay fewertaxes. In addition, policy-makers should consider indexing income tax brackets toinflation to address the implicit gender biases noted earlier.

260 S. Ssewanyana, L. Bategeka, M. Guloba and J. Kiiza
Since the 1990s, Uganda has introduced several major reforms of its tax system.However, policy-makers have not examined the differential impact of thesereforms on women and men. This chapter has examined these differences andattempted to show the impact of various policy changes in terms of advancinggender equality. Broadly, tax reforms have not been towards the realization ofgender equity. The proposals made in this chapter, if implemented, would markthe beginning of ‘engendering’ Uganda’s tax system.
References
Bahiigwa, G., Ellis. F., Fjeldstad, O-H. and Iversen, V. (2004) Uganda Rural TaxationStudy: Final Report, Economic Policy Research Centre, Kampala: Makerere University.
Bategeka, L., Madina, G. and Kiiza, J. (2009) ‘Gender and Taxation in Uganda: Analysisof Personal Income Tax (PIT)’, Economic Policy Research Centre, Research SeriesNumber 58, Kampala: Makerere University.
Chen, D., Matovu, J.M. and Reinikka-Soininen, R. (2001) ‘A Quest for Revenue and TaxIncidence in Uganda’, IMF Working Paper WP/01/24, Washington, DC: IMF.
Deininger, K. and Mpuga, P. (2008) ‘Economic and Welfare Impact of the Abolition ofHealth User Fees: Evidence from Uganda’, Journal of African Economies 13(3).
Government of Uganda (2005) National Budget Framework Paper for Financial Years2005/06–2007/08, Kampala: Ministry of Finance, Economic Planning and Development.
—— (2008) National Budget Framework Paper for Financial Years 2008/09, Kampala:Ministry of Finance, Economic Planning and Development.
Kiiza, J. (2006) ‘Political Regimes and Women’s Economic Empowerment: A CriticalAnalysis of Ugandain Comparative Perspective’, in S. Ssali and A. Madanda (eds)Negotiating Public Space: Activism and Democratic Politics, Kampala: MakerereUniversity Printery, pp. 257–95.
Okurut, N., Ssewanyana, S. and Adebua, A. (2006) ‘Poverty and Labour Market Responsein the Context of Economic Reforms in Uganda, 1992–2003’, African EconomicResearch Consortium Research Report, Kampala: African Economic Policy ResearchConsortium.
Ssewanyana, S. (2009) ‘Gender and Incidence of Indirect Tax: Evidence from Uganda’,Economic Policy Research Centre, Research Series No. 57, Kampala: MakerereUniversity.
Ssewanyana, S. and Okidi, J.A. (2007) ‘Poverty Estimates from the Uganda NationalHousehold Survey III, 2005/06’, Economic Policy Research Centre Occasional PaperNo. 34, Kampala: Makerere University.
—— (2008) ‘A Microsimulation of the Uganda Tax System (UGATAX) and the Poor from1999 to 2003’, mimeo, Economic Policy Research Centre Research Series No. 55Kampala: Makerere University.
Uganda Bureau of Statistics (UBoS) (2003) Socio-economic Survey Reports, Kampala:UBoS.
—— (2006) ) Socio-economic Survey Reports, Kampala: UBoS.—— (2007) Uganda: Demographic and Health Survey, 2006, Kampala: UBoS.World Bank (2006) Uganda Poverty and Vulnerability Assessment, Washington, DC:
World Bank.

10 Gender equality and taxationA UK case study
Jérôme De Henau, Susan Himmelweit andCristina Santos
Introduction
The issue of taxes has always been a highly politicized one in the UK, and nevermore so than in 2009 as the UK government weighed how best to rebalance itsbudget after rescuing its banking sector while its economy suffered its mostsevere financial crisis since the 1930s. Debates about taxes, however, tended tofocus mainly on the overall level of taxation and government expenditure and ondistributional effects among households. With the exception of the work of theWomen’s Budget Group, a think tank that regularly comments on the genderimplications of the Chancellor of the Exchequer’s annual budgets, little attentionhas been paid to the gender aspects of the taxation system. In particular, there hasbeen little debate about what effects any proposals for tax rises to pay for a 2008stimulus package, or for bailing out the banking sector, are likely to have on bothmen and women.
This chapter seeks to address this gap by analysing some gender aspects of theUnited Kingdom’s personal income tax system and its expenditure taxes. Taxeshave both distributional and behavioural impacts and both of these can be gen-dered. In this chapter we consider impacts on both inter- and intra-householdinequalities, as well as whether taxes reinforce or challenge existing genderroles.
Following a brief overview of existing gender inequalities in the UnitedKingdom, its tax system and fiscal changes brought about in the past 30 years,this chapter will present a gender analysis of the UK personal income tax system,including its tax credits. It will then analyse the incidence of expenditure taxes onhouseholds of different gendered types before the 2008 stimulus package, andsimulate the impact of the stimulus package as well as some alternative policyoptions. Finally, it presents a set of policy proposals based on these analyses andconsiders the extent to which taxation could be used to tackle gender inequalitiesin the United Kingdom.
A gendered picture of employment and income
In order to assess the gendered impact of taxes, we need to understand the natureof gender divisions in the United Kingdom. The inequalities that are most

relevant to the distributional impact of tax are gender differences in employmenthours and wage rates, in the income of the households in which men and womenlive, and in their access to that household income when living with others. Taxesalso have a behavioural impact through their incentive effects. Here the most rel-evant inequalities concern unequal gender roles, especially with respect to thelabour market and care-giving responsibilities.
Employment hours and wages
Rates of adult employment (ages 16–64) are high in the United Kingdom com-pared with the rest of Europe, for both men and women, with rates of femaleemployment (65.8 per cent in 2006) close to those of the Scandinavian coun-tries (European Commission 2008). However, while men work long hours,more than 40 per cent of female employment is part-time, a proportion whichhas remained unchanged since the mid-1980s, and is one of the highest inEurope.
High rates of women’s part-time employment, together with a relatively lowminimum wage compared with European countries of similar levels of GDP percapita, have been significant factors in sustaining the United Kingdom’s largegender pay gap, and explain why around two-thirds of low-paid employees arewomen (Palmer et al. 2008). On top of this, the United Kingdom has a particu-larly large part-time wage penalty by European standards, with a median hourlywage of part-time employees only 63 per cent that of full-time employees. Eventhe full-time gender pay gap is high in the United Kingdom, particularly at the topend of the earnings distribution (ONS 2008).
The gender pay gap reinforces a traditional division of care-giving responsibil-ities within households. Because child-care provision is patchy and expensive inthe United Kingdom, it often makes financial sense, at least in the short term, forwomen, particularly low-paid women, to reduce their hours of employment tocover family care needs. This, combined with men’s long working hours, leaveslittle scope for challenging traditional gender roles. Women not only receivelower pay but also work fewer hours, often in part-time jobs, with the result thattheir lifetime earnings are considerably lower than men’s; for women born in1970, earnings up to retirement are projected to be only 62 per cent of those ofmen (Joshi 2005).
Household composition and income distribution
A large proportion of UK households (28 per cent in 2006–7) are single-personhouseholds, and about half of these are retirees, the vast majority of which (76 percent) are women (Jones 2008). There are also a relatively large number of single-parent households; in 2006, 24 per cent of children lived in single-parent house-holds, 90 per cent of these living with their mother (McConnell and Wilson2007). The distribution of different household types is not even across householdincome quintiles. Children are disproportionately concentrated in lower quintiles,
262 J. De Henau, S. Himmelweit and C. Santos

as are full-time students and retirees, particularly women retirees living on theirown. Single-parent families are heavily concentrated in lower quintiles, whilehouseholds consisting of two adults without children are disproportionately inhigher quintiles (Jones 2008).
According to a recent report on poverty in the United Kingdom (Palmer et al.2008), women are slightly more likely to live in low-income households (below60 per cent of the median household income). Overall poverty rates (after housingcosts) were 20 per cent for women and 18 per cent for men in 2006–07. This gapis mainly driven by higher poverty rates for single retirees and for single parents,both of whom are primarily women (50 per cent of single parents lived inpoverty). However, when men and women live together, as Fagan et al. (2006: 52)point out, ‘the extent of women’s greater risk of poverty may be underestimatedbecause income and other resources are not always shared equally within house-holds’. In particular, when resources are tight, women are more likely than mento go without. In such cases, they also tend to have the stressful burden of budg-eting and managing debt (Vogler 1994; Women’s Budget Group 2005).
The UK tax structure
In contrast to other countries studied in this volume, the United Kingdom is clearlya developed economy. In fact, it is the sixth largest economy in the world in termsof output, with an estimated GDP of nearly US$2,800 billion, although it ranksonly 22nd by size with a population of just over 61 million (IMF 2008). Like otherdeveloped economies, it has a well-developed taxation system that raises a largeproportion of its revenue from personal income tax, which is used not only to fundpublic expenditure, including the welfare state, but also for transfer payments thatredistribute income. Some of these payments, such as Child Benefit or CaregiverAllowance, compensate individuals and families for extra expenses or for timespent out of the labour market due to care-giving responsibilities. Others are sim-ply designed to relieve poverty. Since women tend to bear most of the costs bothin time and money of caring for children and adults, and are over-representedamong the poor, both types of payments tend to be paid to women more than men.Women also benefit more from much direct expenditure on welfare services; theyare both greater users of the health service, for example, and the ones who throughtheir own efforts compensate for any failure of state welfare services. Since bothtransfer payments and these expenditures have to be paid for from taxation, theoverall level of taxation has a clear gender impact.
Level of taxation
Figure 10.1 shows how net tax revenues (including social security contributions)have varied as a share of GDP in the United Kingdom over the past 30 years. Theyear 1979 is a convenient starting point since it marked the election of aConservative government that promised to reduce government spending and cuttaxes. Although this government succeeded in making taxation highly unpopular,
Gender equality and taxation in the UK 263

264 J. De Henau, S. Himmelweit and C. Santos
30
32
34
36
38
40
42
44
46
48
50
1979 1982 1985 1988 1991 1994 1997 2000 2003 2006 2009 2012
% o
f G
DP
Public sector total receipts Net taxes and NICs
Projected Projected
Figure 10.1 Total government receipts and taxes (incl. national insurance contributions)as a percentage of GDP, UK, 1978–79 to 2007–08 plus projections to2013–14.
Source: Adam et al. (2008).
they were not in the end successful in cutting taxes, as Figure 10.1 shows: by theend of its period of office, taxes were higher than when the government was firstelected. The other notable date is 1997 when the New Labour government waselected, promising to no longer be the party of high spending and taxation. Since1997, taxes have risen as a share of GDP, but only slightly, remaining lower thanat their peak in the early 1980s, when there were also substantial non-tax rev-enues (e.g., from national industries that have since been privatized). The shareof national income taken in tax in the United Kingdom is now around the aver-age for developed countries: lower than in most of the EU-15 countries (such asFrance, Italy and the Scandinavian countries), but higher than in most of the newEU countries of Eastern Europe and than in the USA, Japan and Australia.
Before 2008, the share of government revenues was projected to stabilize atabout 40 per cent of GDP, which was relatively low by European standards(Adam et al. 2008). In November 2008, the government announced a stimuluspackage which included an immediate temporary cut in VAT and permanentchanges in some other taxes, and some increases in spending to be paid for byfuture tax rises (from April 2011), including the introduction of a higher personalincome tax rate for the highest incomes. Excluding the cost of partial nationaliza-tion of several banks, these measures were projected to reduce the share of taxa-tion in GDP to 34 per cent in 2009–10 before climbing again to 36 per cent in2013–14 (HM Treasury 2008).

Composition of taxation
Figure 10.2 shows the composition of government total receipts in 2007–08, andfor comparison in 1978–79 and 1996–97, years which coincide with the changesin government mentioned above. In 2007–8, about 45 per cent comes from per-sonal income tax and national insurance contributions (NICs), roughly the sameproportion as before the Conservative government was elected in 1979; they hadsucceeded in cutting this share to 40 per cent by 1997, but the Labour governmentthen reversed that trend. The Conservatives increased the share coming from indi-rect taxes from 23 per cent to 31 per cent; this had fallen to 26 per cent by 2007–08and decreased further while the stimulus package’s cut in VAT was in force.
These longer-term developments are in line with those seen internationally.They include a switch within indirect taxation from taxes on specific goods
Gender equality and taxation in the UK 265
Income tax23%
NationalInsurance
17%
Local tax4%
VAT16%Other
indirecttaxes15%
Corporationtax
10%
Capital tax1%
Other14%
Income tax28%
NationalInsurance
17%
Local tax9%
VAT7%
Otherindirecttaxes16%
Corporationtax6%
Capital tax1%
Other16%
Income tax27%
NationalInsurance
18%
Local tax4%
2007–08
1996–97 1978–79
VAT15%
Otherindirecttaxes11%
Corporationtax8%
Capital tax2% Other
15%
Figure 10.2 Composition of government current receipts, UK, 2007–08, 1996–97 and 1978–79.
Source: Based on HM Treasury (2008, 1997) and Adam and Browne (2006).
towards value-added tax (VAT) and a reduction in the progressivity of personalincome tax through a reduction in the number of income brackets and throughrate cuts (mainly in pre-election budgets1). And in line with most, but not all,European countries, the United Kingdom completed the move from joint to indi-vidual filing for married couples in 1990.2 However, since 1999, the effect ofindependent filing has been counterbalanced by the introduction of jointly means-tested refundable tax credits for low earners and families with children.
Since the election of the New Labour government in 1997, there has been aslight shift away from indirect taxes towards income tax and national insurance(Figure 10.2). However, comparison with 1979 shows much bigger changes, witha doubling of the share of revenue coming from VAT (rates were substantiallyincreased by the incoming Conservative government) and corresponding fallsin other expenditure taxes. Substantial cuts in income tax rates in the period1979–97 were counteracted by rising incomes, leaving the share of revenue con-tributed by income tax much the same (see Figure 10.2). There was also a sub-stantial reduction in the proportion of revenue coming from local taxes (andcorresponding fall in local government autonomy).
Distributional effects of the tax and benefits system
Although there has been little gender analysis of the UK tax system, a distribu-tional analysis of its impact on households of different income levels is publishedannually by the Office for National Statistics. Because a substantial proportion oftax receipts is redistributed in the form of benefits and tax credits affecting house-hold disposable income, effects on distribution can be assessed only by examin-ing the tax and benefit system together.
The net effect of this system is redistributive. Before any government interven-tion, the top quintile of households has an average income 14.8 times that of thebottom quintile; after taking account of (net) cash benefits this ratio is 6.6 to 1. Theeffect of direct taxation – personal income tax, national insurance contributions(NICs) and local taxes3 – is to reduce this ratio to 5.5 to 1 for disposable income,but taking account of indirect taxation pulls it back up to 7 to 1 (Jones 2008: 39).Direct taxation is therefore mildly progressive while expenditure taxes are mostlyregressive with respect to household income, and the largest contribution to reduc-ing inequality is made by cash benefits and refundable tax credits.
Personal income tax
To examine the impact of the UK personal income tax (PIT) system from agender perspective, we need to include national insurance contributions and totake into consideration the system of refundable tax credits (introduced in 1999),which plays an important role in the redistribution of income across householdsof different types. While personal income tax and national insurance are paid bymost adults (30.6 million individuals in 2008–09, about half the total UK popu-lation) (HMRC 2009), by adding those who receive tax credits we can cover
266 J. De Henau, S. Himmelweit and C. Santos

nearly all working-age adults (except those living below the income tax thresh-old in households with neither children nor anyone employed).
None of these components of the PIT system have explicit gender biases.However, as will be seen below, given gender divisions and inequalities in theUnited Kingdom, the PIT system as a whole has significant indirect genderedeffects on the distribution of income, both between and within households, andon labour market incentives for men and women.
Since 1990, UK personal income tax has been filed on an individual basis. Mostemployees are automatically enrolled in ‘Pay As You Earn’ (PAYE), wherebyemployers deduct tax and national insurance payments directly from employees’wages. Many UK taxpayers therefore rarely fill in a tax form. Self-employedpersons, however, are responsible for making their own payments.
Income tax schedule
Each taxpayer in the United Kingdom receives a tax-free personal allowance,and there are extra personal allowances for elderly people with incomes undera certain limit, as well as for older married couples (or civil partners) and somedisabled persons. Until 2010; income from earnings (and some benefits) abovepersonal allowances is taxed according to a schedule with only two brackets, abasic rate of 20 per cent and a higher rate of 40 per cent (see Table 10.1) withabout 83 per cent of taxpayers liable only to the basic rate (HMRC 2009). Thereis a reduced lower rate for savings that applies only to individuals whose tax-able non-savings income falls below a low threshold. Income from dividends isalso taxed at lower rates and further reduced by a non-refundable dividend taxcredit of 10 per cent, to remove double taxation of company profits alreadytaxed through corporation tax when paid out as dividends. When calculatinginto which tax bracket different income sources fall, dividend income is treatedas the top slice of income, followed by savings income, followed by otherincome.
The UK personal income tax system is progressive, but only mildly so com-pared to 30 years ago, and also compared to countries of comparable levels of percapita GDP. Both Conservative and Labour governments have ‘simplified’ the
Gender equality and taxation in the UK 267
Table 10.1 PIT brackets and rates by source of income, UK, 2008–09
Income brackets (£) Rate (%)
Savings Dividends Other income
0–2,230 starting 10 10 202,231–34,800 basic 20 10 20>34,800 higher 40 32.5 40
Source: HM Treasury (2008).
Note: UK£1 = US $1.62 (FT quote on 27 August 2009, at 10.00 GMT).

PIT system in ways that make it less progressive, and have made only smallchanges to national insurance contributions. This means that the lowest earners,most of whom are women, are likely to pay more income tax in the UnitedKingdom than they would in more progressive systems, such as those in mostother parts of Western Europe. Nevertheless, because of their lower average earn-ings, women pay less income tax than men overall.
National insurance contributions
Working individuals under state retirement age must also pay NICs, which areeffectively just another form of income tax since they are used to fund generalgovernment expenditure, and payments have little impact on an individual’s eli-gibility for benefits (Adam and Browne 2006). NICs must be paid by bothemployees and their employers for all earnings above a threshold correspondingmore or less to the basic personal allowance.4 Employees pay NICs at 11 per centon any earnings between this threshold and an upper earnings limit (similar to thethreshold for the highest income tax band), and at only 1 per cent of earningsabove that upper limit. Thus NICs are regressive, as higher earners pay a lowermarginal rate than lower earners, and further reduce the already slight progressiv-ity of the income tax brackets. Again, while women pay lower taxes and NICs onaverage than men and are the ones most likely not to pay anything in this system,those with lower incomes, who are disproportionately women, pay relativelymore tax and NICs in the United Kingdom than they would in more progressivesystems.
Exemptions and deductions
Table 10.2 shows which income is taxable, which is tax exempt, the deductionsthat can be made from taxable income and the tax credits that reduce tax paid.Given the gendered nature of employment and care-giving roles in the UnitedKingdom, deductions show a pattern that somewhat favours men. Deductions areworth more to higher earners, mostly men, and tend to recognize expenses thatare directly incurred during employment better than they do the problems forthose with care-giving responsibilities in getting to employment. For instance,deductions for child-care expenses are limited and available only to those whoseemployers participate in a national scheme.
Net deductions for pension contributions are a major loss of revenue, costingthe government as much as a third of its total expenditure on state pensions,which have increasingly lagged behind earnings since 1982 (Blundell andEmmerson 2003; HM Treasury 2008). Tax-free pension contributions aresubject to a lifetime limit that is more than the amount that all but the very high-est paid could hope to save in their lifetimes. Deductions for pension contribu-tions are therefore a significant form of redistribution to the well-paid and tomen, since the poor and women are far less likely to take out personal pensions.Occupational pension schemes are further subsidized by tax not being payable
268 J. De Henau, S. Himmelweit and C. Santos

on employer as well as employee contributions. Women are far less likely thanmen to be offered the chance to enrol in an occupational pension scheme, or totake up such an offer.
In recognition of the unsustainably low savings rate of the less well-off, and inpartial recognition of gender differences in savings opportunities, the pension sys-tem is being reformed. However, although it will include default employee andemployer contributions, the new system will continue to encourage savings by offer-ing tax incentives, which will inevitably favour men as those more likely to have anuninterrupted employment history and be better-paid employees (Price 2007).
Child and working tax credits
The introduction of tax credits was New Labour’s flagship policy to combatpoverty, particularly child poverty, which is among the highest in Europe. Thecurrent Child and Working Tax Credits are an extension of the previous WorkingFamilies Tax Credit (WFTC) introduced in 1999, which in turn was based on a
Gender equality and taxation in the UK 269
Table 10.2 Main taxable personal income, exemptions and reductions, UK, 2008–09
Taxable income
Earnings fromemployment, self-employment andnon-incorporatedbusinessesRetirementpensionsIncome fromproperty (rents)Interests onsavingsDividends onsharesNon-means-testedbenefits asreplacementincome (statepension, jobseeker’sallowance)
Exemptions
Means-testedsocial securitybenefitsChild benefitsIncome fromcertain savings anddividends(National SavingsCertificates,Individual SavingsAccounts)
Deductions from taxableincome
Contributions tooccupational pensions byemployee and employerProfessional expenses(e.g., professional feesand subscriptions, toolsand specialist clothing,capital allowances,household expenses forworking at home, traveland subsistence costs)Child-care expensessupported by employer(up to a limit of £55 aweek, worth a quarter ofthe cost of an averagechildcare centre place)Personal tax allowance(£6,035 – about a quarterof median householdincome); furtherreductions available toelderly and/or disabledpeople, up to a certainlimit
Reductions of tax liability(tax credits)
Non-refundable taxcredit on dividendsNon-refundable taxcredit for donationto charitiesRefundable,means-tested (onfamily income),child and workingtax credits (seedetails in the text)

much less generous system of Family Credit, a benefit for families with childrenin employment. Modelled on the Earned Income Tax Credit of the United States,these tax credits are refundable (so reach those with incomes below the taxthreshold) and aim both to ‘make work pay’ and to combat child poverty. Theyare paid directly to recipients, rather than deducted from tax liabilities. InitiallyWFTC was intended to be paid through the pay packet to one earner; however, inresponse to feminist protest at this change from Family Credit, which had beenpaid to the mothers, the government allowed families to choose to whom the creditwould be paid. It was recognized that paying tax credits intended for childrenthrough the pay packet, and thus more often to the man, could have made theobjective of reducing child poverty more difficult to achieve (Goode et al. 1998).
In 2003, the system was extended to support more low-income families (notjust those with children), and to provide seamless support for children to parentsin and out of work. An integrated scheme of two separate tax credits was intro-duced: the Child Tax Credit (CTC) for low-income families, working or not, andthe Working Tax Credit (WTC) for working families, with or without children.Each is paid directly to one person, but they are jointly means-tested on familyincome.
In these respects tax credits are very similar to other benefits. However, theyare treated as part of the tax system in order to reduce the level of taxation andspending in the national accounts (since tax credits count as revenue foregonerather than expenditure) and to free tax credits from the stigma attached to means-tested benefits in the United Kingdom.
Unlike the rest of the individual-based income tax system, tax credits aremeans-tested at the family level. WTC is paid directly to one earner, but theamount of WTC paid to that earner will depend on the earnings and possiblyhours of employment of both partners. Although two-earner couples can choosewho receives WTC, they cannot request that it be split between them. CTC is paiddirectly to the ‘main caregiver’ (nominated by the partners, but in most cases themother). WTC also provides a substantial subsidy to child-care costs for workingparents, which is paid to the main caregiver.
Both the WTC and CTC introduce problematic new categories into the tax sys-tem. The WTC implicitly introduces a problematic category of a ‘main earner’even though it does not explicitly use that language. The CTC category of ‘maincaregiver’ was introduced with the Tax Credits in 2003, implying a householddivision of labour in which one person takes the main responsibility for care-giv-ing that not all would accept. Both concepts – ‘main caregiver’ and ‘main earner’– go against the equal sharing of paid and unpaid household roles.
Both CTC and WTC are jointly means-tested and subject to a progressivetaper. The poorest families, with gross total family income below about two-thirds of the median (for families with children) and a quarter of the median (forthose without children) receive the maximum amounts, which tapers off steeplyabove these thresholds. A small ‘family’ element of the CTC, however, is notwithdrawn until family income exceeds approximately twice the median incomeand then is tapered away much less steeply. Thus, the smallest element of the
270 J. De Henau, S. Himmelweit and C. Santos

CTC is paid to most families, but WTC and the more substantial child-based ele-ments of CTC tend to be paid only to poorer families (though the maximum child-care element is sufficiently large that, despite means testing, even somemiddle-income families receive some support through it).
This family-based means-testing of tax credits effectively undermines the indi-vidual filing of income tax for lower-income families, producing the same labourmarket disincentive effects for second earners, especially the low paid, as jointtaxation. Given the gender pay gap and gender roles that typically regard womenas second earners in couples, this is a gender bias that reinforces rather than chal-lenges existing inequalities.
Inflation and uprating
Tax brackets and allowances are automatically increased annually in line with theretail price index (RPI), unless Parliament intervenes. Indexing by prices ratherthan average earnings increases revenues when real earnings rise (see Sutherlandet al. 2008). These welcome boosts to the exchequer have relied on earnings ris-ing faster than prices. During expansions, such revenue increases have often beenused to reduce tax rates or introduce new forms of spending (such as tax credits).However, they will not be available in a recession, when wages may not riseabove inflation as employment levels fall.
Tax credit levels and thresholds are periodically revised but not automaticallyindexed. The family element of the CTC, paid to most families, has not beenuprated since its introduction in 2003. By contrast, the child element of CTC, paidonly to poor families, has been indexed annually to average earnings, and thegovernment has reaffirmed its commitment to helping low-income families byraising the maximum child element above indexation. Nevertheless, incomethresholds for computation of both CTC and WTC are not expected to change innominal terms; so the number of eligible families will fall if incomes continue torise (ibid.). Only the very poorest households would be entitled to the increasedmaximum amounts, which should favour single-parent households, in whichwomen predominate.
Distributional effects of the UK income tax system
While the UK income tax system is one of the least progressive in Europe if weexclude tax credits, the inclusion of tax credits makes the UK system highly redis-tributive towards very low-income working families, especially families withchildren, in comparison with other European countries (De Henau et al. 2007).
To illustrate this and explore its gender effects, we have calculated the totalincome tax incidence, with and without tax credits, on different types of familiesat three different levels of gross household income: half median, median and twicethe median.5 We look at male/female households with two dependent children, inthree employment situations: dual-earner (in which the man’s income is twice thewoman’s); male single-earner; and female single-earner.6 For the purpose of tax
Gender equality and taxation in the UK 271

credits, the woman is assumed to be the main caregiver in the first two cases; inthe third case, where the woman is the sole earner, we consider one situation inwhich the man is the main caregiver and a second in which the woman is both thesole earner and the main caregiver7 (see Table 10.3).
Looking at the second column of Table 10.3, we can see that without tax cred-its the PIT system is only moderately progressive across sole-earner families,who are taxed more highly than dual-earner families of the same income, aswould be expected from an individual filing system. Across dual-earner families,the PIT system is more progressive.
The third column including tax credits shows greater redistribution of incomeamong families. However, at twice median income, tax credits have practicallyno effect; only the family element of the CTC still operates to reduce the total taxincidence on the household and on the main caregiver by 1.2 percentage points(whatever the distribution of gross income within the family).
At median income, tax credits are more powerful and reduce the total tax inci-dence: irrespective of the number of earners, the main caregiver receives CTCequal to 11 per cent of gross household income but no-one receives WTC. Forsingle-breadwinner families, this halves their tax incidence. For dual-earner cou-ples, it reduces it by two-thirds. The impact of tax credits is much stronger at halfmedian income: CTC is paid at its maximum rate and couples are eligible forsome WTC, in total worth about half of the couple’s initial gross income, so thatcouples at this income level are net gainers.
The tax credit system also operates to redistribute income between partnerstowards more equality, specifically, towards the partner with lower income andtowards the main caregiver (in three of our cases assumed to be the same person).This can be seen by comparing the share of female income before and after taxes(Table 10.3, columns 1 and 4). For couples of twice median income, the effect onthe distribution of income within the household is tiny, reflecting the low progres-sivity of the income tax system and the small amount of CTC paid. At medianincome, there is more redistribution within the household, mostly because themain caregiver gains relative to her or his partner.
At half median income, CTC is more than WTC so the greater gain goes to themain caregiver. For single-breadwinner families, CTC increases a non-earningmain caregiver’s share of total net income from 0 to 28 per cent. In the dual-earnercase, because the woman is the main caregiver, her share of income goes up fromone-third to almost half of the household’s income. Note that if the (female) sin-gle earner is also the main caregiver, there is no redistribution between partners atany level of income.
Thus while the tax system on its own does relatively little to redistributeincome within and among households, tax credits are an effective way of redis-tributing income both towards poorer households and, based on the assumptionswe made, to women within both poor and median-income households. The poor-est couples are most likely to be single – (or no) earner households within whichwomen are more likely to be the main caregiver. For these couples, the tax creditsystem has been particularly effective in both raising household income and
272 J. De Henau, S. Himmelweit and C. Santos

Table 10.3 Tax incidence (income tax + NICs – tax credits) as percentage of gross household income, UK couple with two children
Female share Total household Total household Female Total male Total female of total gross tax incidence tax incidence share of total incidence incidencehousehold (tax + NICs) (tax + NICs − net householdincome tax credits) income
Half median income (£11,518)(i) male higher income 33.3 5.0 −56.1 47.6 −15.1 −40.9(ii) male sole earner 0.0 15.3 −45.7 28.1 −4.8 −40.9(iiia) female sole earner 100.0 15.3 −45.7 71.9 −40.9 −4.8(iiib) female sole earner-caregiver 100.0 15.3 −45.7 100.0 0.0 −45.7
Median income (£23,036)(i) male higher income 33.3 15.3 4.3 43.7 12.8 −8.5(ii) male sole earner 0.0 23.2 12.1 12.5 23.2 −11.0(iiia) female sole earner 100.0 23.2 12.1 87.5 −11.0 23.2(iiib) female sole earner-caregiver 100.0 23.2 12.1 100.0 0.0 12.1
Twice median income (£46,072)(i) male higher income 33.3 23.2 22.0 36.0 16.7 5.2(iia) male sole earner 0.0 27.9 26.7 1.6 27.9 −1.2(iiia) female sole earner 100.0 27.9 26.7 98.4 −1.2 27.9(iiib) female sole earner-caregiver 100.0 27.9 26.7 100.0 0.0 26.7
Source: Authors’ calculations using 2008–09 tax rules.

increasing women’s share of it. However this happens largely through the pay-ment of CTC, which is meant for the benefit of children rather than for the maincaregiver who receives the tax credits.
Gender impact of PIT
There is no explicit gender bias in the UK personal income tax system, as menand women are treated alike. Moreover, unlike in some other European coun-tries (e.g., France, Germany and Spain), the UK income tax system is individ-ualized, removing the indirect gender bias of a higher effective marginal ratefor the second earner found in joint taxation systems. However, given the largegender wage gap and even larger gender earnings differential due to differenthours of work, the impact of income taxation differs for men and women; thelatter are less heavily taxed because their incomes are generally lower. But thisis less true in the United Kingdom than it would be in countries with more pro-gressive income tax systems.
Efforts to target low-income families by concentrating on the tax credit sys-tem have some adverse effects for women in couples, as the means-testing oftax credits raises the effective marginal tax rate of second earners, while CTCmakes women’s income dependent on the presence of children and on beingtheir main caregiver. While this recognizes the contribution made by thosewho care for children, it undermines incentives to develop a more gender-equitable division of labour and women’s financial autonomy by replacingindividually taxed earnings with household-based means-tested tax creditsas a source of income for women in poor families. By reducing incentivesto seek employment, it may also harm these women’s long-term financialprospects and their children’s chance of escaping poverty (Fagan et al. 2006);research on the WFTC showed that it increased single women’s labour-marketparticipation but decreased, albeit only slightly, partnered women’s participa-tion (Blundell et al. 2000; Bennett and Hirsch 2001; Brewer et al. 2006).An individualized tax credit system would be more efficient and would reducethe disincentive to the second earner. However, it would be much more expen-sive if current levels of support were to be maintained and would provide amuch more explicit subsidy to low pay, potentially substituting for wageincreases.
Indirect taxation
Turning to the incidence of indirect (expenditure) taxes, we begin by describingthe structure of expenditure taxes in the United Kingdom, as well as the data andthe definitions used. Because expenditure data is always aggregated to the house-hold level, we can analyse the incidence of indirect taxes only on households, notindividuals, raising the issue of how to define gender categories for households.After examining the distribution of individuals across defined categories, we dis-cuss the main results of the incidence analysis, paying particular attention to
274 J. De Henau, S. Himmelweit and C. Santos

where there are gendered effects, and simulate actual and potential policychanges to analyse the distributional impact of such changes.
The structure of indirect taxation
Indirect taxes raised 23 per cent of UK tax revenue in 2005. Most comes fromVAT, with the remainder being raised by excise duties on alcohol, tobacco, fueland betting (including the National Lottery), customs duties and a few more spe-cific taxes, such as motor vehicle duties; air passenger duty; insurance premiumtax; driving and television licences; stamp duties and fossil fuel levy. Our inci-dence analysis includes only VAT and excise duties, as the two types of indirecttax that raise the most significant revenue.
There are three VAT rates and some VAT exemptions. Over 50 per cent of theexpenditure of the typical household is on goods charged at the standard rate, over30 per cent on goods that are exempt or zero-rated and only a small proportion is onreduced rate goods, which has however been slightly increasing in recent years(HMRC 2007). Table 10.4 describes the goods that were subject to each rate in April2005. The main feature is that most food, domestic fuel and some goods which thegovernment might want to encourage people to consume are zero- or reduced-rated.Under European Union (EU) rules the government can reduce but not zero-rate fur-ther goods. This explains the anomaly whereby children’s car seats are subject to thereduced rate of 5 per cent, while motorcycle helmets are zero-rated because the lat-ter was introduced before these EU regulations were in force. On zero-rated goodssuppliers can claim back VAT paid on inputs, but on exempted goods they cannot.8
Most excise duties are specific or unit taxes, that is, they are an actual amountper unit purchased. Some goods, such as cigarettes, also have an ad valorem orpercentage tax, which charges a percentage of the market price. The fuel levy isby far the most important excise duty, and the most significant green tax, in termsof its contribution to government revenue.
Gender equality and taxation in the UK 275
Table 10.4 VAT rates and liable goods, UK, April 2005
VAT rate (%) Applied to
17.5 Most goods supplied within the UK (standard rate)5 Domestic fuel, ‘good practice’ goods or services (e.g., installation of
energy-saving materials, renovation and alteration of dwellings, installation of heating equipment, security goods or connection of gas supply), women’s sanitary products and children’s car seats
0 Most food, children’s clothing and footwear, public transport, books and newspapers, water and sewerage services and helmets for motorcycles and pedal cycles
Exemptions Financial and banking services, private education and health (excl. spectacles, lenses, sunglasses, most mobility and hearing equipment and non-National Health Service medical products and services), postal charges, betting and funerals
Source: HMRC (2007).

Incidence analysis
The main data source for this analysis is the Expenditure and Food Survey(EFS) which covers about 7,000 households in the United Kingdom eachyear. We used the most recent available data at the end of 2007 (see ONS2005, 2007), based on information collected in late 2005 and early 2006 (thesample period covers 12 months of the year to avoid seasonal effects). Thisdata set covers only private households,9 excluding people living in hotels,shared flats, lodging houses, homes for the elderly, and so on, and includeslevels and sources of income, benefits and contributions, housing character-istics, together with socio-demographic information on all members in thehousehold. It also contains detailed household expenditure data, collected viaa face-to-face interview and a diary for respondents to record their expendi-ture over two weeks.
The number of households responding to the EFS in 2005–06 was 6,258 (about1 in 4,000) with an additional sample of 527 covering Northern Ireland. Theresponse rate was 57 per cent. The recorded expenditure patterns may under-report some expenditures, notably on tobacco, alcohol and confectionery, forwhich we cannot reliably correct.
Methods of calculation
From our expenditure data, we know only the total amount spent; we do not knowthe number of units purchased or the actual average price they were charged perunit. However, excise taxes on tobacco and alcohol are charged on amounts pur-chased, or for tobacco on a combination of amount and price. To calculate accu-rately the total amount of excise duty tax households pay on these categories, wewould therefore need the retail price of all different goods within them. Becausenot all retail prices were available, we estimated the amount of excise duty paidby households on each category of goods using the retail prices and excise dutypaid on some typical excisable goods (Table 10.5), together with data publishedby HM Customs and Excise on the amounts of each excisable good released forconsumption.
For betting and gaming, excise duty depends on type of activity, level of prof-its or potential profits. Gambling expenditures are not subject to VAT and calcu-lating excise duties based on household expenditure was straightforward (fordetails on methods of estimation and calculation, see Santos 2009).
Definitions of household types
Three different categorizations of households are used. The first is by ‘headship’,defined as the household reference person, or ‘householder’ in whose name theaccommodation is owned or rented.10 If there are joint householders, which iscommon in the United Kingdom, the household reference person is the one withthe higher income, or where incomes are the same, the eldest householder. Thesecond classifies households by its members’ employment status (as this might
276 J. De Henau, S. Himmelweit and C. Santos

affect control over resources), resulting in four categories: male-breadwinner (nofemale earner and at least one male earner), female-breadwinner, dual-earner andhouseholds in which no one is employed. The third is based on numbers of maleand female adults and include those with more adult men, those with more adultwomen and those with an equal number of adults of both sexes.
While headship is not a very useful categorization in the United Kingdom, itmay give us some information about power within households; but only if it isassociated with formal control over accommodation, a higher share of householdincome or age. As would be expected, while the vast majority of male-breadwin-ner households are male-headed and female-breadwinner households female-headed (91 per cent and 85 per cent respectively), women are also the head of 25per cent of dual-earner households (Santos 2009).
The majority of households (64 per cent) have an equal number of adult menand women, while 17 per cent have more men than women and 19 per cent morewomen than men. Nearly all of these gender imbalanced households consist ofadults living on their own or with children. Although in most male/female couplehouseholds both partners are in employment, where only one is employed, it isusually because the woman has left employment because of care-giving respon-sibilities, so the sole breadwinner is male. While overall there are roughly equalnumbers of men and women who are the sole household breadwinners, 56 percent of male-breadwinner households are couples and only 41 per cent are men
Gender equality and taxation in the UK 277
Table 10.5 Excisable goods: incidence of duty and tax for typical items, UK, April 2005
Item Retail Excise VAT Total Total tax asprice in duty tax percentagepence of price
Packet of 20 cigarettes(a) 498 314 74 386 78Pint of beer (bitter) in on-licensed 209 29 31 60 29premises(b)
Pint of lager in on-licensed premises(c) 228 30 34 64 284 large (440 ml) cans of lager 276 93 41 134 49in retail outlet(c)
75cl bottle of table wine in retail outlet 333 126 50 175 5370cl bottle of whisky in retail outlet(d) 1171 548 174 722 6275cl bottle of vodka in retail outlet(d) 1088 550 162 712 66Litre bottle of cider in retail outlet(e) 175 26 26 52 30Litre of ultra low sulphur petrol 85 47 13 60 70Litre of ultra low sulphur diesel 90 47 13 60 67
Source: HMRC (2005), table D1.
Notes: 20 pence = £1.(a) Excise duty consists of 204.78 pence in specific duty and 109.56 pence in ad valorem.(b) Typical strength of 3.9% alcohol by volume.(c) Typical strength of 4.1% alcohol by volume.(d) Strength of 40% alcohol by volume.(e) Typical strength of less than 7.5% alcohol by volume.

living on their own or with children, while only 22 per cent of female-breadwin-ner households are couples and 77 per cent are single parents or women living ontheir own (authors’ calculations using BHPS 2005).
Regarding female retirees living on their own and single parents, both of whichfigure prominently in tax policy discussions, we find that female retirees, liketheir male counterparts, are found almost exclusively in households in which noone is employed, while 65 per cent of female single parents with dependentchildren are in female-breadwinner households and 35 per cent are in householdsin which no one is employed.
Gender differences in indirect tax incidence
Incidence by type of taxes
Table 10.6 presents summary results of the incidence by type of tax (total tax,VAT, excises and fuel levy) according to three gendered measures: sex of house-hold head, employment status of household members, and gender balance ofhousehold adults. It shows that female-headed households have a slightly lowerincidence for tax overall and for VAT, while male-headed households have a con-siderably higher incidence of fuel tax. By employment status, single-breadwinnerhouseholds, probably because more of their expenditure is child-related, havelower incidence rates for total tax, VAT and excise taxes than either dual-earneror no-earner households. Fuel tax has a higher incidence on the households inwhich there is a male earner, suggesting that the gendered nature of fuel consump-tion is, at least in part, a result of men commuting longer distances by car thanwomen (Hamilton et al. 2002).
Analysis by household adult sex composition shows a slightly different gen-dered picture. Fuel tax has a higher incidence on households with more men than
278 J. De Henau, S. Himmelweit and C. Santos
Table 10.6 Overall incidence by household type, UK (tax as % of expenditure)
Total tax VAT Excise tax Fuel tax Number ofhouseholds
HeadshipFemale-headed 11.37 7.34 3.97 2.02 2,639Male-headed 11.56 7.53 3.94 2.43 4,145
Employment categoriesMale-breadwinner 10.99 7.04 3.84 2.31 1,171Female-breadwinner 11.21 7.31 3.77 2.19 902Dual earner 11.91 7.84 4.05 2.57 2,051None-employed 12.27 7.78 4.34 2.15 1,163
Household adult sex compositionMale-majority 12.32 7.47 4.71 2.67 1,349Female-majority 11.41 7.40 3.95 2.18 2,010Equal # females and males 11.32 7.50 3.74 2.26 3,425
Source: Authors’ calculations based on EFS 2005–06.
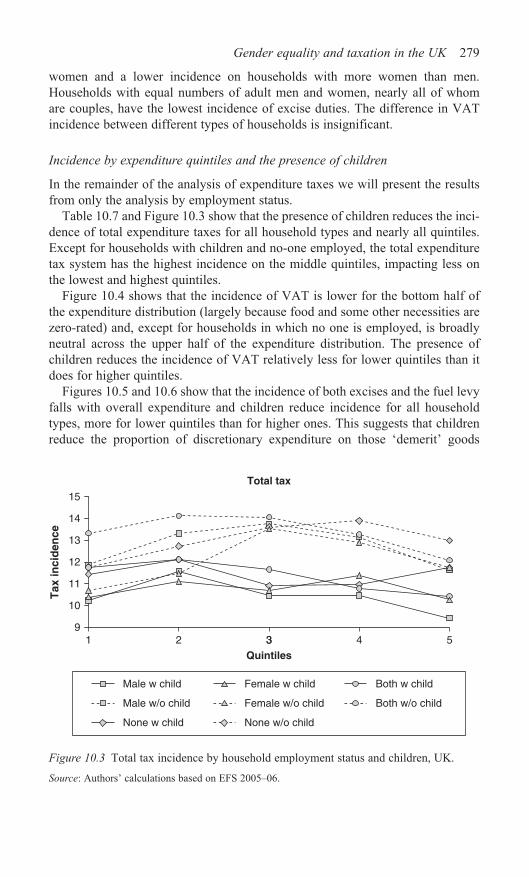
Gender equality and taxation in the UK 279
women and a lower incidence on households with more women than men.Households with equal numbers of adult men and women, nearly all of whomare couples, have the lowest incidence of excise duties. The difference in VATincidence between different types of households is insignificant.
Incidence by expenditure quintiles and the presence of children
In the remainder of the analysis of expenditure taxes we will present the resultsfrom only the analysis by employment status.
Table 10.7 and Figure 10.3 show that the presence of children reduces the inci-dence of total expenditure taxes for all household types and nearly all quintiles.Except for households with children and no-one employed, the total expendituretax system has the highest incidence on the middle quintiles, impacting less onthe lowest and highest quintiles.
Figure 10.4 shows that the incidence of VAT is lower for the bottom half ofthe expenditure distribution (largely because food and some other necessities arezero-rated) and, except for households in which no one is employed, is broadlyneutral across the upper half of the expenditure distribution. The presence ofchildren reduces the incidence of VAT relatively less for lower quintiles than itdoes for higher quintiles.
Figures 10.5 and 10.6 show that the incidence of both excises and the fuel levyfalls with overall expenditure and children reduce incidence for all householdtypes, more for lower quintiles than for higher ones. This suggests that childrenreduce the proportion of discretionary expenditure on those ‘demerit’ goods
2 3 4 5
Tax
inci
den
ce
1 3
Quintiles
Total tax
Male w child
Male w/o child
Female w child
None w child None w/o child
Female w/o child
Both w child
Both w/o child
9
10
11
12
13
14
15
Figure 10.3 Total tax incidence by household employment status and children, UK.
Source: Authors’ calculations based on EFS 2005–06.

Table 10.7 Incidence by employment status, presence of children and quintile, UK (%)
Total tax VAT Excises Fuel Total tax VAT Excises Fuel Total tax VAT Excises Fuel
Male-breadwinner Male-breadwinner with children Male-breadwinner without children
Quintile 1 10.40 6.21 4.06 2.63 10.27 6.20 3.88 2.52 11.93 6.21 6.33 4.01Quintile 2 11.86 7.29 4.50 2.59 11.56 7.29 4.21 2.50 13.30 7.31 5.88 3.07Quintile 3 11.23 7.38 3.70 2.36 10.46 7.22 3.09 2.12 13.71 7.94 5.65 3.15Quintile 4 11.38 7.46 3.77 2.15 10.44 7.16 3.17 1.92 13.11 8.07 4.85 2.59Quintile 5 10.34 7.41 2.92 1.53 9.40 6.68 2.53 1.28 11.63 8.32 3.48 1.88Total 10.99 7.04 3.84 2.31 10.50 6.81 3.54 2.20 12.65 7.85 4.84 2.66
Female-breadwinner Female -breadwinner with children Female-breadwinner without children
Quintile 1 10.41 6.40 3.85 2.30 10.38 6.42 3.80 2.20 10.71 6.27 4.38 3.44Quintile 2 11.21 7.06 3.99 2.28 11.12 7.16 3.83 2.22 11.53 6.77 4.53 2.46Quintile 3 11.41 7.40 3.81 2.13 10.65 7.27 3.11 1.92 13.53 7.76 5.73 2.73Quintile 4 12.09 8.26 3.90 2.32 11.37 8.03 3.31 2.06 12.84 8.54 4.52 2.59Quintile 5 11.23 8.26 2.95 1.76 10.27 7.95 2.00 1.42 11.80 8.43 3.51 1.96Total 11.20 7.31 3.76 2.19 10.75 7.09 3.47 2.07 12.28 7.84 4.45 2.47
Dual-earner Dual-earner with children Dual-earner without children
Quintile 1 11.91 7.12 4.75 3.44 11.77 7.10 4.62 3.30 13.32 7.34 6.23 4.96Quintile 2 12.52 7.65 4.81 2.83 12.10 7.67 4.37 2.68 14.04 7.59 6.44 3.36Quintile 3 12.31 8.00 4.35 2.72 11.67 7.78 3.93 2.59 14.07 8.58 5.48 3.09Quintile 4 11.59 7.88 3.62 2.27 10.75 7.58 3.05 1.99 13.21 8.53 4.74 2.82Quintile 5 11.24 8.27 3.05 1.96 10.49 7.97 2.55 1.58 12.07 8.58 3.59 2.38Total 11.91 7.84 4.05 2.57 11.39 7.62 3.73 2.44 13.13 8.37 4.80 2.88
No-employed No-employed with children No-employed without children
Quintile 1 11.55 6.68 4.77 2.22 11.41 6.68 4.65 1.98 11.85 6.68 5.01 2.69Quintile 2 12.48 7.82 4.51 2.10 12.15 7.62 4.23 1.65 12.74 7.96 4.73 2.46Quintile 3 12.93 8.75 4.08 2.35 10.91 8.10 2.52 1.17 13.64 8.97 4.62 2.76Quintile 4 13.33 9.30 3.79 2.19 10.98 7.76 2.83 1.52 13.92 9.69 4.03 2.35Quintile 5 12.76 9.82 2.87 1.59 11.67 9.03 2.54 1.99 13.00 10.02 2.95 1.50Total 12.27 7.78 4.34 2.15 11.54 7.15 4.22 1.82 12.91 8.30 4.45 2.44
Source: Authors’ calculations based on EFS 2005–06.

Gender equality and taxation in the UK 281
which attract excise duty and the fuel levy (a higher proportion of expenditure inlower quintiles) and on goods that attract VAT (a higher proportion of expendi-ture in higher quintiles).
2 3 4 5
Tax
inci
den
ce
1 3
Quintiles
Male w child
Male w/o child
Female w child
None w child None w/o child
Female w/o child
Both w child
Both w/o child
VAT
6
7
8
9
10
Figure 10.4 VAT incidence by household employment status and children, UK.
Source: Authors’ calculations based on EFS 2005–06.
2 3 4 5
Tax
inci
den
ce
1 3
Quintiles
Male w child
Male w/o child
Female w child
None w child None w/o child
Female w/o child
Both w child
Both w/o child
Excise duties
2
3
4
5
6
7
Figure 10.5 Excise duty incidence by household employment status and children, UK.
Source: Authors’ calculations based on EFS 2005–06.
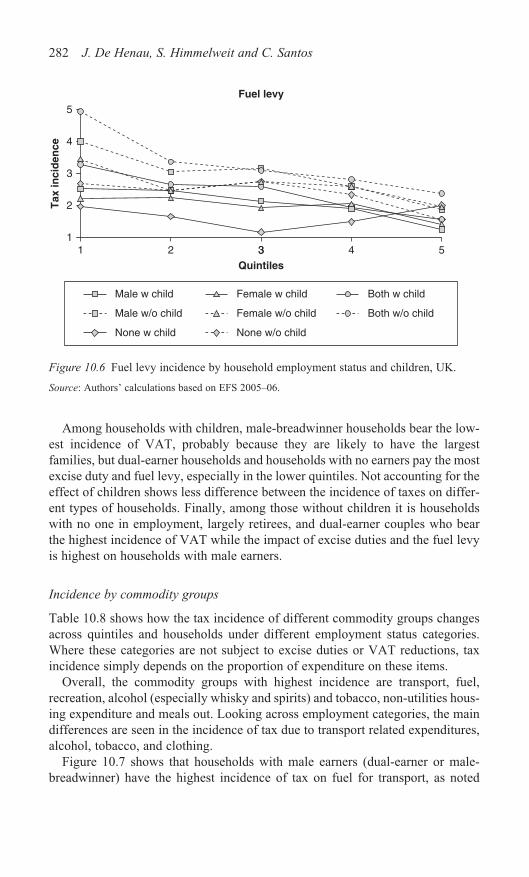
282 J. De Henau, S. Himmelweit and C. Santos
1
2
3
4
5
2 3 4 5
Tax
inci
den
ce
1 3
Quintiles
Male w child
Male w/o child
Female w child
None w child None w/o child
Female w/o child
Both w child
Both w/o child
Fuel levy
Figure 10.6 Fuel levy incidence by household employment status and children, UK.
Source: Authors’ calculations based on EFS 2005–06.
Among households with children, male-breadwinner households bear the low-est incidence of VAT, probably because they are likely to have the largestfamilies, but dual-earner households and households with no earners pay the mostexcise duty and fuel levy, especially in the lower quintiles. Not accounting for theeffect of children shows less difference between the incidence of taxes on differ-ent types of households. Finally, among those without children it is householdswith no one in employment, largely retirees, and dual-earner couples who bearthe highest incidence of VAT while the impact of excise duties and the fuel levyis highest on households with male earners.
Incidence by commodity groups
Table 10.8 shows how the tax incidence of different commodity groups changesacross quintiles and households under different employment status categories.Where these categories are not subject to excise duties or VAT reductions, taxincidence simply depends on the proportion of expenditure on these items.
Overall, the commodity groups with highest incidence are transport, fuel,recreation, alcohol (especially whisky and spirits) and tobacco, non-utilities hous-ing expenditure and meals out. Looking across employment categories, the maindifferences are seen in the incidence of tax due to transport related expenditures,alcohol, tobacco, and clothing.
Figure 10.7 shows that households with male earners (dual-earner or male-breadwinner) have the highest incidence of tax on fuel for transport, as noted

Table 10.8 Tax incidence for main commodity groups by employment status and quintile, UK (%)
Categories Male-breadwinner Female-breadwinner Dual-earner None-employed
Q1 Q2 Q3 Q4 Q5 Total Q1 Q2 Q3 Q4 Q5 Total Q1 Q2 Q3 Q4 Q5 Total Q1 Q2 Q3 Q4 Q5 Total
Food subtotal 0.13 0.12 0.08 0.06 0.06 0.10 0.14 0.12 0.07 0.08 0.03 0.10 0.13 0.10 0.08 0.06 0.04 0.08 0.13 0.14 0.10 0.07 0.04 0.12*Basic 0 0 0 0 0 0 0 0 0 0 0 0 0 0 0 0 0 0 0 0 0 0 0 0unprocessed*Basic 0 0 0 0 0 0 0 0 0 0 0 0 0 0 0 0 0 0 0 0 0 0 0 0processed*Sugar/ 0.13 0.12 0.08 0.06 0.06 0.10 0.14 0.12 0.07 0.08 0.03 0.10 0.13 0.10 0.08 0.06 0.04 0.08 0.13 0.14 0.10 0.07 0.04 0.12confectionaryand others
Meals out 0.63 0.70 0.63 0.56 0.53 0.61 0.62 0.76 0.58 0.60 0.39 0.61 0.72 0.74 0.75 0.65 0.55 0.68 0.66 0.72 0.68 0.67 0.42 0.66Non-alcoholic 0.17 0.13 0.10 0.08 0.06 0.12 0.16 0.16 0.12 0.09 0.05 0.13 0.16 0.12 0.10 0.08 0.05 0.10 0.20 0.13 0.12 0.07 0.05 0.14beveragesAlcoholic 0.69 1.04 1.23 1.23 0.98 0.99 0.65 0.92 1.21 1.20 0.93 0.96 0.96 1.55 1.44 1.29 1.00 1.27 0.94 1.45 1.37 1.47 1.13 1.21beveragessubtotal*Beer and 0.32 0.45 0.44 0.40 0.26 0.37 0.17 0.24 0.26 0.30 0.18 0.23 0.33 0.62 0.49 0.43 0.27 0.43 0.34 0.49 0.38 0.32 0.18 0.37Cider*Spirits 0.19 0.34 0.29 0.35 0.23 0.27 0.22 0.32 0.54 0.47 0.27 0.36 0.28 0.47 0.39 0.32 0.26 0.35 0.40 0.59 0.40 0.41 0.28 0.44*Wine 0.19 0.25 0.50 0.48 0.48 0.35 0.27 0.36 0.42 0.43 0.48 0.38 0.35 0.45 0.56 0.54 0.47 0.49 0.20 0.37 0.59 0.74 0.67 0.40
Tobacco 1.13 1.43 0.58 0.73 0.35 0.90 1.30 1.26 0.99 0.74 0.43 1.01 0.79 1.09 0.76 0.55 0.23 0.67 2.30 1.59 0.89 0.51 0.25 1.56Clothing and 0.29 0.62 0.46 0.43 0.46 0.44 0.49 0.67 0.59 0.64 0.55 0.59 0.58 0.59 0.60 0.57 0.53 0.57 0.65 0.62 0.85 0.71 0.60 0.67footwearsubtotal*Children’s 0 0 0 0 0 0 0 0 0 0 0 0 0 0 0 0 0 0 0 0 0 0 0 0clothing*Adult 0.29 0.62 0.46 0.43 0.46 0.44 0.49 0.67 0.59 0.64 0.55 0.59 0.58 0.59 0.60 0.57 0.53 0.57 0.65 0.62 0.85 0.71 0.60 0.67clothing
(Continued)

Table 10.8 (Continued) Tax incidence for main commodity groups by employment status and quintile, UK (%)
Categories Male-breadwinner Female-breadwinner Dual-earner No-employed
Q1 Q2 Q3 Q4 Q5 Total Q1 Q2 Q3 Q4 Q5 Total Q1 Q2 Q3 Q4 Q5 Total Q1 Q2 Q3 Q4 Q5 Total
Housing, Water, 0.37 0.50 0.58 0.94 1.32 0.69 0.55 0.44 0.54 0.62 1.63 0.68 0.40 0.52 0.60 0.72 1.38 0.75 0.45 0.62 1.05 1.24 1.78 0.77Electricity, Gas Subtotal*Housing 0.19 0.37 0.48 0.83 1.24 0.57 0.35 0.29 0.40 0.49 1.54 0.53 0.19 0.38 0.48 0.63 1.31 0.63 0.24 0.44 0.88 1.11 1.69 0.59*Water 0 0 0 0 0 0 0 0 0 0 0 0 0 0 0 0 0 0 0 0 0 0 0 0*Electricity 0.09 0.07 0.06 0.05 0.04 0.07 0.12 0.08 0.08 0.06 0.05 0.08 0.12 0.08 0.06 0.05 0.04 0.06 0.12 0.09 0.09 0.07 0.05 0.10*Gas 0.08 0.06 0.05 0.05 0.03 0.06 0.08 0.07 0.07 0.06 0.04 0.07 0.09 0.06 0.05 0.04 0.03 0.05 0.10 0.08 0.08 0.06 0.04 0.08*Other (inc. 0 0 0 0 0 0 0 0 0 0 0 0 0 0 0 0 0 0 0 0 0 0 0 0sewerage)
Fuel for HH use 0.05 0.02 0.02 0.01 0.02 0.03 0.02 0.02 0.01 0.01 0.01 0.02 0.02 0.03 0.02 0.01 0.01 0.02 0.03 0.02 0.02 0.01 0.02 0.03Furniture, HH 0.49 0.53 0.68 0.73 0.82 0.63 0.73 0.50 0.85 0.74 1.05 0.75 0.43 0.63 0.67 0.78 0.76 0.68 0.58 0.86 1.02 1.13 1.23 0.83Equipment andMaintenanceDomestic and 0.01 0.02 0.01 0.03 0.05 0.02 0.00 0.02 0.04 0.06 0.11 0.04 0.01 0.02 0.01 0.03 0.11 0.04 0.01 0.03 0.03 0.07 0.10 0.03household servicesHealth 0.05 0.08 0.05 0.07 0.06 0.06 0.03 0.07 0.18 0.15 0.06 0.10 0.05 0.08 0.06 0.10 0.07 0.07 0.07 0.07 0.21 0.17 0.15 0.11Transportation 1.43 1.30 1.58 1.73 1.94 1.57 0.84 1.31 1.31 1.71 1.60 1.30 1.31 1.35 1.59 1.48 1.80 1.53 1.05 1.23 1.09 2.01 2.05 1.29Subtotal*Collective 0.28 0.17 0.14 0.21 0.15 0.20 0.22 0.16 0.15 0.22 0.12 0.18 0.17 0.20 0.14 0.15 0.14 0.16 0.27 0.09 0.06 0.15 0.06 0.16formsof transport*Flights 0.04 0.06 0.05 0.17 0.45 0.14 0.00 0.02 0.03 0.13 0.18 0.06 0.00 0.06 0.03 0.05 0.22 0.08 0.00 0.06 0.00 0.12 0.28 0.05*Private 1.11 1.07 1.39 1.35 1.34 1.23 0.62 1.13 1.13 1.35 1.30 1.06 1.14 1.08 1.42 1.28 1.44 1.29 0.78 1.08 1.04 1.74 1.72 1.07Transport
School 0 0 0 0 0 0 0 0 0 0 0 0 0 0 0 0 0 0 0 0 0 0 0 0transportFuel for 2.97 3.07 2.81 2.47 1.75 2.67 2.63 2.68 2.54 2.65 2.08 2.55 4.14 3.32 3.27 2.68 2.30 3.05 2.47 2.54 2.90 2.57 1.94 2.52transport

Table 10.8 (Continued)
Categories Male-breadwinner Female-breadwinner Dual-earner No-employed
Q1 Q2 Q3 Q4 Q5 Total Q1 Q2 Q3 Q4 Q5 Total Q1 Q2 Q3 Q4 Q5 Total Q1 Q2 Q3 Q4 Q5 Total
Communication 0.57 0.49 0.32 0.30 0.22 0.40 0.56 0.51 0.39 0.40 0.30 0.45 0.49 0.46 0.39 0.31 0.23 0.36 0.51 0.45 0.33 0.31 0.23 0.42Recreation 0.89 1.31 1.53 1.45 1.31 1.25 1.03 1.14 1.34 1.74 1.57 1.31 1.16 1.25 1.40 1.61 1.56 1.42 0.96 1.42 1.67 1.65 2.09 1.35Education 0 0 0 0 0 0 0 0 0 0 0 0 0 0 0 0 0 0 0 0 0 0 0 0Personal care 0.33 0.32 0.35 0.29 0.22 0.30 0.27 0.33 0.33 0.40 0.26 0.32 0.31 0.30 0.30 0.32 0.25 0.30 0.34 0.33 0.34 0.36 0.25 0.33subtotal*Necessities 0.09 0.10 0.09 0.08 0.05 0.08 0.11 0.12 0.13 0.10 0.06 0.11 0.15 0.11 0.10 0.10 0.07 0.10 0.13 0.12 0.12 0.09 0.05 0.12*Baby 0.09 0.06 0.05 0.05 0.02 0.06 0.04 0.01 0.01 0.01 0.00 0.02 0.04 0.03 0.02 0.02 0.01 0.02 0.07 0.03 0.01 0.01 0.00 0.04products*Other 0.14 0.16 0.20 0.16 0.14 0.16 0.12 0.21 0.19 0.29 0.19 0.19 0.13 0.16 0.18 0.20 0.18 0.18 0.14 0.18 0.21 0.25 0.19 0.18
Gambling 0.05 0.06 0.07 0.06 0.02 0.05 0.07 0.07 0.04 0.05 0.03 0.06 0.06 0.07 0.07 0.04 0.03 0.06 0.10 0.14 0.12 0.09 0.04 0.11Miscellaneous 0.15 0.13 0.15 0.22 0.18 0.16 0.28 0.21 0.33 0.21 0.14 0.24 0.18 0.32 0.19 0.30 0.34 0.27 0.08 0.11 0.13 0.19 0.37 0.13TOTAL 10.40 11.86 11.23 11.38 10.34 10.99 10.41 11.21 11.46 12.09 11.23 11.21 11.91 12.52 12.31 11.59 11.24 11.91 11.55 12.48 12.93 13.33 12.76 12.27Number of 160 177 194 259 381 1171 94 153 172 207 276 902 150 298 438 545 619 2051 341 299 208 173 142 1163households
Source: Authors’ calculations based on EFS 2005–06.

earlier, perhaps owing to men commuting longer distances by car, while womenare greater users of public transport (Hamilton et al. 2002). The difference is par-ticularly striking in the lowest quintiles, which also have the highest incidenceoverall. Tax on fuel for transport is more than 2.5 per cent of total expenditure inthe lowest quintile for all household types.
The highest incidence of tax on alcohol is on dual-earner households and thosewith no earner (see Figure 10.8). Alcohol tax has relatively low incidence over-all at around 1 per cent of total expenditure.
286 J. De Henau, S. Himmelweit and C. Santos
2 3 4 5
Tax
inci
den
ce
1 3
Quintiles
Male breadwinner Female breadwinner
None employedDual earner
1.50
2.00
2.50
3.00
3.50
4.00
4.50
Figure 10.7 Commodity incidence by employment status across quintiles – fuel fortransport, UK.
Source: Authors’ calculations based on EFS 2005–06.
2 3 4 5
Tax
inci
den
ce
1 3
Quintiles
0.00
0.30
0.60
0.90
1.20
1.50
1.80
Male breadwinner Female breadwinner
None employedDual earner
Figure 10.8 Commodity incidence by employment status across quintiles – alcohol, UK.
Source: Authors’ calculations based on EFS 2005–06.

Gender equality and taxation in the UK 287
Tobacco tax impacts particularly on households in which no one is employedand on poor female-breadwinner households. This is particularly striking in thelower two quintiles, where in these two categories there are many single parents.There is particular concern in the United Kingdom about smoking among youngwomen, with girls having consistently higher rates of smoking than boys (CancerResearch UK 2009). Our figures show an average tobacco tax incidence of around1 per cent. Given that only about 20 per cent of the population smokes, this meansthat the overall incidence of tobacco tax on households that do smoke is high.
The incidence of tax on adult clothing is highest on female-breadwinner house-holds and lowest on dual-earner households, but the incidence overall of tax onclothing is fairly low (see Figure 10.10).
Domestic services and meals outside the house, which might have a role inenabling traditional gender roles to be challenged, have relatively low total inci-dence; less than 1 per cent for any household category (see Figure 10.11). The taxincidence of domestic services depends more on expenditure quintile, thoughincidence is higher on female-breadwinner households and on households withno earner (these may be retiree households employing home help). Meals outshow no consistent pattern across household categories or expenditure quintiles,reflecting the heterogeneous reasons why people eat out (see Figure 10.12).
Simulations of policy changes on indirect taxes
Table 10.9 on page 290 shows the simulated impacts by household employmentcategories and across expenditure quintiles of increasing fuel tax, of reducing thestandard rate of VAT and of applying VAT standard rate to food, either all foodor just basic food.11
2 3 4 5
Tax
inci
den
ce
1 3
Quintiles
0.00
0.50
1.00
1.50
2.00
2.50
Male breadwinner Female breadwinner
None employedDual earner
Figure 10.9 Commodity incidence by employment status across quintiles – tobacco, UK.
Source: Authors’ calculations based on EFS 2005–06.

288 J. De Henau, S. Himmelweit and C. Santos
One change that we considered was raising tax on fuel for transportation,which is higher in households with a man in employment. Long hours spent com-muting inevitably restrict the time men can spend with their families. Reducingmen’s commuting times is therefore relevant to transforming gender roles. Figure10.13 shows that an increase of 4.3 pence per litre (or kg) for all types of fuelwould, within each quintile, impact more on households with a male earner, butwould also impact most on households in the lowest quintile. Unless such a taxrise was spectacularly effective in changing behaviour, it would be a good source
2 3 4 5
Tax
inci
den
ce
1 3
Quintiles
0.00
0.02
0.04
0.06
0.08
0.10
0.12
Male breadwinner Female breadwinner
None employedDual earner
Figure 10.11 Commodity incidence by employment status across quintiles – domesticservices, UK.
Source: Authors’ calculations based on EFS 2005–06.
2 3 4 5
Tax
inci
den
ce
1 3
Quintiles
0.00
0.20
0.40
0.60
0.80
1.00
Male breadwinner Female breadwinner
None employedDual earner
Figure 10.10 Commodity incidence by employment status across quintiles – adult clothing,UK.
Source: Authors’ calculations based on EFS 2005–06.

of extra revenue, which could be spent, at least in part, on better public transportwhich by reducing congestion on roads might also impact on men’s commutingtimes.
For comparison with other countries, we also considered removing the zero-rating of either all food or just basic food. These simulations, shown in Figure10.14, demonstrate the importance of zero-rating food for poor households, as astandard rate applied to basic food (or to all food) would greatly increase the total
Gender equality and taxation in the UK 289
2 3 4 5
Tax
inci
den
ce
1 3
Quintiles
0.40
0.50
0.60
0.70
0.80
Male breadwinner Female breadwinner
None employedDual earner
Figure 10.12 Commodity incidence by employment status across quintiles – meals out, UK.
Source: Authors’ calculations based on EFS 2005–06.
0.0
0.5
1.0
1.5
2.0
2.5
3.0
Q1 Q2 Q3 Q4 Q5 Total
Quintiles
Per
cen
tag
e ch
ang
e fr
om
the
bas
e sc
enar
io
All Male breadwinner Female breadwinner
Dual earner None employed
Figure 10.13 Policy simulation: percentage change from base scenario – increasing fuelexcise duty, UK.
Source: Authors’ calculations based on EFS 2005–06.

Table 10.9 Effects of changes in indirect tax rates on tax incidence by employment statusand expenditure quintile, UK
Average Percentage change from the base scenario taxincidence
Base Increasing Standard-rating Standard-ratingscenario fuel tax basic food all food
AllQuintile 1 10.74 1.92 17.06 20.40Quintile 2 11.99 1.74 11.68 14.11Quintile 3 11.96 1.76 9.54 11.69Quintile 4 11.74 1.60 7.97 9.83Quintile 5 11.23 1.40 5.60 6.86Total 11.00 1.71 10.84 13.13Male breadwinnerQuintile 1 10.43 2.15 16.40 19.44Quintile 2 11.86 1.88 11.06 13.35Quintile 3 11.23 1.78 10.36 12.80Quintile 4 11.38 1.62 8.35 10.08Quintile 5 10.34 1.25 6.31 7.61Total 11.20 1.79 11.12 13.37Female breadwinnerQuintile 1 10.41 1.86 16.06 19.60Quintile 2 11.21 1.74 12.57 15.62Quintile 3 11.41 1.60 9.47 11.72Quintile 4 12.09 1.62 7.71 9.51Quintile 5 11.23 1.33 5.47 6.65Total 11.91 1.66 10.88 13.40Dual earnerQuintile 1 11.91 2.48 14.35 17.25Quintile 2 12.52 1.93 10.32 12.53Quintile 3 12.31 1.87 8.59 10.65Quintile 4 11.59 1.66 7.57 9.43Quintile 5 11.25 1.54 5.30 6.62Total 12.28 1.85 8.79 10.80None employedQuintile 1 11.55 1.63 18.18 21.37Quintile 2 12.48 1.44 13.37 15.82Quintile 3 12.94 1.56 11.09 13.06Quintile 4 13.31 1.39 8.74 10.69Quintile 5 12.78 1.07 5.99 6.98Total 11.51 1.49 13.73 16.21Overall Annual Tax 71,288 72,365 77,112 78,376Receipts (£1000s)Percentage change 1.51 8.17 9.94in revenues frompolicy
Source: Authors’ calculations based on EFS 2005–06.
Note: Using quarterly weights from the EFS and extrapolating the sample to the whole population.

incidence on poor households, especially those in which no one is employed, andfar more than it would on higher quintiles.
We also conducted a policy simulation based on the stimulus package intro-duced in December 2008 that ran until January 2010 which reduced the standardVAT rate to 15 per cent while increasing (permanently) the excise duties on alco-hol and tobacco. Table 10.10 and Figure 10.15 show that this package resulted ingreater overall expenditure inequality, by favouring higher quintiles (who paymore VAT); however, within the lower two quintiles this change favours female-breadwinner households, presumably because they consume less of the goods onwhich tax rose. Given that putting money in the hands of the poor rather than therich is recognized to be more effective in stimulating an economy, this measure(which reduced total revenue by almost 9 per cent) did nothing to foster genderequality or reduce inequalities, and was less effective than cutting taxes paid bythose on lower incomes or increases in public spending would have been in stim-ulating the economy.
Conclusion and policy recommendations
Policy to rectify gender inequalities via direct or indirect taxation can be of twobroad types. Some attempt to make the distributional impact of such taxationfairer in order to reduce gender inequalities between and within households.Others aim to produce behavioural change in order to transform existing genderinequalities.
Gender equality and taxation in the UK 291
0.0
5.0
10.0
15.0
20.0
25.0
Per
cen
tag
e ch
ang
e fr
om
the
bas
e sc
enar
io
Q1 Q2 Q3 Q4 Q5 Total
Quintiles
All Male breadwinner Female breadwinner
Dual earner None employed
Figure 10.14 Policy simulation: percentage change from base scenario – standard ratingall food, UK.
Source: Authors’ calculations based on EFS 2005–06.

Unfortunately in some cases these two aims are in conflict. Tax changes thatcreate behavioural incentives, such as labour-market engagement, which is cur-rently disproportionately carried out by men, can be expected to have a direct dis-tributional impact that favours men. But by making employment more worthwhile
292 J. De Henau, S. Himmelweit and C. Santos
Table 10.10 Effects of government’s 2008 stimulus package on tax incidence by employ-ment status and expenditure quintile, UK
Average Percentage change from the base scenario tax incidence
Base Updating Increasing Increasing Full scenario VAT rate alcohol tobacco stimulus
to 15% duty duty package
AllQuintile 1 10.74 −7.21 0.31 0.35 −6.57Quintile 2 11.99 −7.54 0.44 0.29 −6.83Quintile 3 11.96 −7.97 0.48 0.17 −7.33Quintile 4 11.74 −8.34 0.47 0.14 −7.74Quintile 5 11.23 −8.93 0.40 0.07 −8.47Total 11.00 −7.85 0.38 0.21 −7.26Male breadwinnerQuintile 1 10.43 −7.25 0.28 0.28 −6.71Quintile 2 11.86 −7.49 0.34 0.31 −6.85Quintile 3 11.23 −8.12 0.46 0.13 −7.53Quintile 4 11.38 −8.11 0.47 0.16 −7.48Quintile 5 10.34 −8.73 0.43 0.09 −8.22Total 11.20 −8.00 0.36 0.23 −7.41Female breadwinnerQuintile 1 10.41 −7.51 0.27 0.32 −6.93Quintile 2 11.21 −7.75 0.35 0.29 −7.11Quintile 3 11.41 −8.04 0.43 0.22 −7.40Quintile 4 12.09 −8.21 0.42 0.16 −7.64Quintile 5 11.23 −8.96 0.37 0.10 −8.49Total 11.91 −8.00 0.46 0.14 −7.41Dual earnerQuintile 1 11.91 −7.16 0.34 0.17 −6.65Quintile 2 12.52 −7.44 0.51 0.22 −6.72Quintile 3 12.31 −7.85 0.50 0.16 −7.20Quintile 4 11.59 −8.36 0.48 0.12 −7.76Quintile 5 11.25 −8.90 0.39 0.05 −8.46Total 12.28 −7.75 0.40 0.33 −7.04None employedQuintile 1 11.55 −6.98 0.32 0.51 −6.18Quintile 2 12.48 −7.68 0.45 0.33 −6.92Quintile 3 12.94 −8.23 0.46 0.18 −7.61Quintile 4 13.31 −8.67 0.50 0.10 −8.08Quintile 5 12.78 −9.41 0.42 0.05 −8.95Total 11.51 −7.92 0.42 0.22 −7.30
Source: Authors’ calculations based on EFS 2005–06.

for women, such tax changes may help women break out of existing gender rolesand thus be an important step in transforming existing gender inequalities.
This dilemma disappears when we consider tax changes to create incentives foractivities currently carried out more by women, such as care-giving, or to dis-courage harmful social or environmental behaviour in which men engage morethan women, such as car driving. The current distributional effect of such taxchanges should favour women. This suggests that to remove such dilemmas,transformational policies might be better targeted at changing the behaviour ofmen than that of women.
This suggests that taxation alone may not be the best tool to achieve thesegoals, but should be combined with other policy changes, discussed below.Nevertheless, changes to some features of the UK tax system may still be a use-ful contribution to such policy changes.
Personal income tax
In order to create a personal income tax system in the United Kingdom that pro-vides fiscal autonomy to both members of couples, that is, truly independenttaxation for individuals, the system of tax credits must be revised. Tax creditscould be removed from the tax system and transferred to the benefit system.However, as long as those credits/benefits are assessed on a household basis(and also to some extent means-tested), they carry employment disincentivesfor second earners and thus may also reinforce an unequal division of care-giv-ing responsibilities. Non-targeted (non-means-tested) child benefit wouldtherefore be more appropriate. However, raising this to a level sufficient tocompensate the poorest families for the loss of tax credits would require consid-erably greater expenditure.
Gender equality and taxation in the UK 293
0.0
−2.0
−4.0
−6.0
−8.0
−10.0
Per
cen
tag
e ch
ang
e fr
om
the
bas
e sc
enar
io
Q1 Q2 Q3 Q4 Q5 Total
Quintiles
All Male breadwinner Female breadwinner
Dual earner None employed
Figure 10.15 Policy simulation: percentage change from base scenario – full stimuluspackage, UK.
Source: Authors’ calculations based on EFS 2005–06.

To remove the implicit gender biases of the current tax system, it would there-fore be better to have a more progressive income tax system that raises sufficientrevenue to permit all benefits and allowances to be provided on a non-means-testedbasis. Removing household means-testing would abolish the disincentive problemsit causes for second earners; funding it by more progressive taxation would allowthe overall system to remain adequately redistributive. Such a system wouldinvolve substantial redistribution among those with higher incomes, towards thosewho would now qualify for benefits and allowances (parents, the disabled, etc.),along with considerable spending levels and higher tax for all better-off individu-als. It would therefore take a considerable change in attitudes to make this politi-cally feasible. However, as long as the gender pay gap remains, a more progressiveincome tax system would also reduce gender inequalities.
Indirect taxation
The United Kingdom must have one of the world’s few expenditure tax systemswith an explicit gender content. VAT was removed from female sanitary productsbecause it was thought unfair to tax these gender-specific necessities. Expendituretaxes also have some hidden gender biases, but these largely come through thepresence of children. Because many products consumed by children are zero-ratedfor VAT and children are counted in our analysis equivalently to adults, the pres-ence of children reduces the incidence of VAT. Indirectly this reduces the inci-dence of VAT on households with women members since they are somewhat morelikely than men to live with children, though by employment status incidence islowest on male-breadwinner households, who have the most children.
For indirect taxes, we have only been able to consider inter-household distrib-utional aspects of gender inequality. Like all indirect tax systems, the UK systemis regressive with respect to income, but the regressivity of VAT is reducedbecause most foods and children’s clothing are zero-rated. For this reason, zero-rating ‘merit’ basic goods such as food and children’s clothing should remain, butzero rating should not be extended to sugar products and confectionery, the con-sumption of which is highest among poor households and those with morewomen and children. Measures other than removing the tax on these items, suchas reforming tax credits perhaps, should be used to boost the income of thesehouseholds and encourage healthier eating.
The above simulations showed that, without accounting for possible behav-ioural change, increasing the fuel levy would have the greatest impact on house-holds in which there is a male earner. A gender-impact analysis therefore addsadditional support to environmental and other arguments for an increase in fueltaxes. Despite inevitable protest, the government should reinstate the automaticsystem by which fuel tax rose annually, provided this is supported by extensiveimprovements to the public transport system, which women use far more thanmen (Hamilton et al. 2002). Policies should also be introduced to reduce theextent of long-distance commuting in the United Kingdom, which must restrictmen’s ability to participate in caring for their children.
294 J. De Henau, S. Himmelweit and C. Santos

This would be a case of using the indirect taxation system to effect a change in thebehaviour of men. However, the increase would also impact disproportionatelyon lower quintiles. If an increase in fuel levy proved ineffective in discouragingcar use, it would squeeze the budgets of some of the poorest households andmight reduce the well-being of all household members, including women andchildren.
The United Kingdom is unique among the countries looked at in this volumein that tobacco tax has a higher incidence on the households in which womenpredominate, poorer female-breadwinner households and those with no oneemployed, which include many single mothers. We do not think an appropri-ate response to this would be to lower tobacco taxes; indeed, price has beenshown to be effective in cutting tobacco use so tax should continue to beraised, provided other measures are taken to boost the income of these house-holds. Understanding how such households would respond to increases intobacco tax rates is needed before drawing further conclusions, though obvi-ously other methods of discouraging tobacco consumption, especially bymothers, should be tried. Our analysis of the impact of tobacco tax suggeststhat anti-smoking programmes need to be better targeted on members of suchhouseholds, particularly those with children.
The incidence of alcohol duties is highest in middle quintiles, suggesting thatthere may be a degree to which consumption responds to prices, and is slightlyhigher on households with a majority of men (Santos 2009). The United Kingdomhas a well-known problem with alcohol abuse, especially among the young. Tocombat alcoholism, the Chief Medical Officer has suggested a minimum price perunit at which alcohol can be sold (Donaldson 2009). This suggests that the pres-ent policy of raising alcohol taxes each year should be continued, together withother programmes to discourage consumption.
In the United Kingdom at least, policies other than the tax system could prove moreeffective in transforming gender roles and outcomes, particularly in conjunction withtax reforms. We suggest that improvements in public transport and in programmes toreduce alcohol abuse and female smoking should be adopted to reinforce any taxchanges. Similarly, improving child-care affordability and availability, reducinggender wage gaps, and improving the pay and conditions of part-time jobs could beeffective in reducing the labour market disincentives that tax credits provide. Deeplyentrenched factors affecting gender roles with respect to the labour market and care-giving responsibilities cannot be fully counteracted by the tax system alone.
Indirectly, however, tax reforms could help. As was argued at the beginning ofthis chapter, the overall level of government revenue and spending is itself agender issue. An important step in achieving a more gender equitable society istherefore a more progressive tax system that would fairly raise greater revenuesto fund public services, such as high-quality child and elder care, well-fundedfamily-friendly policies (e.g., well-paid parental leave and limited working hours),good quality education and training, efficient and affordable public transport andeffective equal opportunities monitoring, needed to support the creation of a moregender-equal labour market and remove wider gender inequalities in society.
Gender equality and taxation in the UK 295

Notes
1 The Conservative government cut the top income tax rates from 83 per cent to 40 percent (for earnings) in 1980 and abolished the starting rate of 25 per cent. The startingrate was re-introduced in 1992 at 20 per cent and then cut to 10 per cent (except for sav-ings) by the New Labour government in 1999 and abolished in 2008.
2 With the exception of a married couple’s allowance for couples in which one partnerwas born before 1935.
3 Local taxation (‘council tax’) is charged on housing and despite rebates available tolow-income families is highly regressive, with the poorest quintile paying about 5 percent of their gross income and the highest only 1.7 per cent. Only the lowest quintilepays more in local than in national direct taxation.
4 Employers pay NICs for each employee who earns over the lower threshold, at a rate of12.8 per cent. The self-employed pay a fixed amount of NICs plus a percentage of theirtaxable profits.
5 Median gross household income of £23,036 (or approximately US$37320, according tothe FT quote on the 27th August 2009, 10.00 GMT) per year is taken from the FamilyResources Survey 2006–7 (DWP 2008).
6 We assume that all earners are employees rather than self-employed, because the self-employed and employees pay different rates of national insurance, though the differ-ence on total tax incidence is small.
7 We have not calculated the effects of the child-care element of WTC which par-tially offsets child-care costs, since it would be misleading to count such subsidiesbut not the costs that give rise to them. The main effect of the child-care element islikely to be behavioural: reducing the employment disincentive effect for secondearners who need paid child-care to be able to take employment, and increasing theuptake of child care. Capturing such behavioural effects would require a differentform of simulation.
8 The most important exempt goods included in this analysis do not include substantialVAT-rated goods or services in their production process (Mahajan 2006) so will betreated as zero-rated.
9 There is some evidence of sampling bias (Foster 1996). For reasons why we do not cor-rect for under-reporting, see Santos (2009).
10 In the UK all government-sponsored surveys have replaced the concept of householdhead with a concept of a household reference person. We use this to define headship.
11 Aggregate tax incidence was estimated by applying the policy rates for each household,then using the EFS quarterly weights to extrapolate to the whole population. The basescenario raises an estimated £80 billion (about US$43.5 billion), far lower than the offi-cial estimates of £121 billion (US$65.8 billion) for 2006 (HM Treasury 2007, exchangerate is the average 2006 rate, US$1 = £0.5434). This discrepancy may be due to under-reporting as well as the exclusion of some commodities from our analysis.
References
Adam, S. and Browne, J. (2006) ‘A Survey of the UK Tax System’, IFS Briefing Note 10,London: Institute for Fiscal Studies.
Adam, S., Browne, J. and Heady, C. (2008) ‘Taxation in the UK’, document prepared forthe Report of a Commission on Reforming the Tax System for the 21st Century, Chairedby Sir James Mirrlees, London: Institute for Fiscal Studies.
Bennett, F. and Hirsch, D. (2001) The Employment Tax Credit and Issues for the Future ofIn-Work Support, York: Joseph Rowntree Foundation.
296 J. De Henau, S. Himmelweit and C. Santos

BHPS (2005) ‘British Household Panel Survey, Wave 15’, Institute of Social andEconomic Research. University of Essex. Available at: www.data-archive.ac.uk/findingData/snDescription.asp?sn = 5151.
Blundell, R.W., Duncan, A., Mc Crae, J. and Meghir, C.H. (2000) ‘The Labour MarketImpact of the Working Families’ Tax Credit’, Fiscal Studies 21(1): 75–104.
Blundell, R.W. and Emmerson, C. (2003) ‘Fiscal Effects of Reforming the UK StatePension System’, London: Institute for Fiscal Studies WP03/13.
Brewer, M., Duncan, A., Shephard, A. and Suarez, M.J. (2006) ‘Did Working Families’Tax Credit Work? The Impact of In-Work Support on Labour Supply in Great Britain’,Labour Economics 13(6): 699–720.
Cancer Research UK (2009) ‘Lung Cancer and Smoking Statistics’. Available at:www.info.cancerresearchuk.org/cancerstats/types/lung/smoking.
De Henau, J., Meulders, D. and O’Dorchai, S. (2007) ‘Support for Market Care:Comparing Child Cash and Tax Benefits’, in D. Del Boca and C. Wetzels (eds) SocialPolicies, Labour Markets and Motherhood: A Comparative Analysis of EuropeanCountries, Cambridge: Cambridge University Press, pp. 107–51.
Donaldson, L. (2009) ‘150 years of the Annual Report of the Chief Medical Officer: Onthe State of Public Health 2008’, Department of Health. Available at: www.dh.gov.uk/en/Publicationsandstatistics/Publications/index.htm.
DWP (2008) ‘Family Resources Survey 2006–7’, Department for Work and Pension,ESDS Government, UK Data Archive. Available at: www.data-archive.ac.uk/findingData/snDescription.asp?sn = 6079.
European Commission (2008) Report on Equality between Women and Men 2008,Luxembourg: Office for Official Publications of the European Communities.
Fagan, C., Urwin, P. and Melling, K. (2006) Gender Inequalities in the Risks of Povertyand Social Exclusion for Disadvantaged Groups in Thirty European Countries,Luxembourg: Office for Official Publications of the European Communities.
Foster, K. (1996) ‘A Comparison of the Census Characteristics of Respondents and Non-Respondents to the 1991 Family Expenditure Survey’, Survey Methodology Bulletin,ONS, vol. 38.
Goode, J., Callender, C. and Lister, R. (1998) Purse or Wallet? Gender Inequalities andIncome Distribution Within Families on Benefits, London: Policy Studies Institute.
Hamilton, K., Hoyle, S.R. and Jenkins, L. (2002) ‘The Public Transport Gender Audit’,University of East London. Available at: www.uel.ac.uk/womenandtransport/audit.htm.
HMRC (2005) Annual Report 2004–5: Tables and Statistics, London: HM Revenue andCustoms. Available at: www.hmrc.gov.uk/about/reports.htm.
—— (2007) Annual Report 2006–7: Tables and Statistics, London: HM Revenue andCustoms. Available at: www.hmrc.gov.uk/about/reports.htm.
—— (2009) National Statistics, London: HM Revenue and Customs. Available at:www.hmrc.gov.uk/thelibrary/national-statistics.htm.
HM Treasury (1997) Pre-Budget Report, London: HM Treasury. Available at: www.hm-treasury.gov.uk/prebud_pbr97_index.htm.
—— (2007) Budget Summary, London: HM Treasury. Available at: www.budget.treasury.gov.uk/budget2007/bud07_leaflet.pdf.
—— (2008) Pre-Budget Report, London: HM Treasury. Available at: www.hm-treasury.gov.uk/d/pbr08_completereport_1721.pdf.
IMF (2008) World Economic Outlook, Washington, DC: International Monetary Fund.Available at: www.imf.org/external/pubs/ft/weo/2008/02/pdf/text.pdf.
Gender equality and taxation in the UK 297

Jones, F. (2008) ‘The Effects of Taxes and Benefits on Household Income, 2006/07’,Economic and Labour Market Review 2(7): 37–A27.
Joshi, H. (2005) ‘Gender Differences in Earnings over the Lifecourse’, paper given atGeNet seminar on Gender and Ageing, Cambridge, 4 October.
McConnell, H. and Wilson, B. (2007) ‘Families’, in S. Smallwood and B. Wilson (eds)Focus on Families, London: Palgrave Macmillan/Office for National Statistics, pp. 1–34.
Mahajan, S. (2006) United Kingdom Input–Output Analyses, London: Office for NationalStatistics.
Office of National Statistics (ONS) (2005) Family Spending: A Report on the 2004–5Expenditure and Food Survey, ed. C. Gibbins and G. Julian. Available at www.statis-tics.gov.uk/ downloads/ theme_social/Family_Spending_2004–5/FS04–05.pdf (accessed 15 January 2009).
—— (2007) Expenditure and Food Survey 2005–6, Office for National Statistics, ESDSGovernment, UK Data Archive. Available at: www.data-archive.ac.uk/findingData/snDescription.asp?sn = 5688.
—— (2008) Annual Survey of Hours and Earnings, London: Office for National Statistics.Available at: www.statistics.gov.uk/downloads/theme_labour/ASHE_2008/2008_all_employees.pdf.
Palmer, G., McInnes, T. and Kenway, P. (2008) Monitoring Poverty and Social Exclusion,York: Joseph Rowntree Foundation.
Price, D. (2007) ‘Closing the Gender Gap in Retirement Income: What Difference WillRecent UK Pension Reforms Make?’, Journal of Social Policy 36(4): 561–83.
Santos, C. (2009) ‘Gender Incidence Analysis of Indirect Taxes in the UK’, OpenDiscussion Papers in Economics, 73, Milton Keynes: Open University. Available at:www.open.ac.uk/socialsciences/about-the-faculty/departments/economics/research/discussion-papers.php.
Sutherland, H., Evans, M., Hancock, R., Hills, J. and Zantomio, F. (2008) The Impact ofBenefit and Tax Uprating on Incomes and Poverty, York: Joseph Rowntree Foundation.
Vogler, C. (1994) ‘Money in the Household’, in M. Anderson, F. Bechhofer and J. Gershuny(eds) The Social and Political Economy of the Household, Oxford: Oxford UniversityPress.
Women’s Budget Group (2005) Women’s and Children’s Poverty: Making the Links.Available at: www.wbg.org.uk/documents/WBGWomensandchildrenspoverty.pdf.
298 J. De Henau, S. Himmelweit and C. Santos
www.open.ac.uk/socialsciences/about-the-faculty/departments/economics/research/discussion-papers.php

11 Conclusion and policyrecommendations
Imraan Valodia
There is now a growing analytical literature that highlights the importance ofconsidering gender issues in taxation (e.g., Apps and Rees 1988, 2004;Hartzenberg 1996; Nelson 1996; Stotsky 1997; Bargain et al. 2006), reflectingthe growing recognition of women as household income earners and economicdecision-makers. To date, however, the tax policy literature has paid very little,if any attention to the gender impacts of tax policies. To address this gap, thischapter outlines a set of principles for considering the gender implications of taxpolicies and presents some key policy messages that emerge from the researchpresented in this volume.
Tax policy, like all economic policy, has evolved over time. It has also tendedover particular periods to converge across countries around the same set of broadconsiderations, irrespective of national or political context. Thus, E.R. Schlesinger,in one of the early surveys of tax policy issues, noted that
It is extremely sobering to recognize that very often the recommendationsof the individual expert writing about different developed, semi-developedand under-developed countries tend to bear much closer resemblance toone another than do the views of different experts dealing with the samecountry.
(1965: 444)
Tax policy-making is a complex process and is usually shaped by a number ofinterests and factors, all of which may themselves frequently change. As Bahl andBird have pointed out: ‘tax policy is usually heavily shaped by past decisionsand frequently overtaken by current events. Economic, administrative, political,and social realities have always shaped tax policy decisions and constrained whatcould be done’ (2008: 283).
This presents a number of challenges for drawing out the policy messages thatemerge from the studies in this volume, including the need to couch the messagewithin the policy parameters of the current period: the need to address the politi-cal and economic realities of the day; and at the same time the need not to be tooconstrained by any prevailing policy mindsets and consensus. It is important alsoto take account of the great diversity across the countries studied.

The key objective of tax policy is of course to raise sufficient levels of revenueto fund government’s desired expenditure. The ability to collect sufficient revenuesto fund public expenditure is fundamentally important for building a capable stateand for maintaining or enhancing the legitimacy of that state. As highlighted byBahl and Bird (2008), the failure to mobilize sufficient resources constrains govern-ments’ ability to provide and improve necessary public services – a critical issue forgender equality. Elson (2006) has shown that countries that are unable to raise suf-ficient revenues are likely to under-provide social services, thereby increasing theburden of unpaid care and social provision shouldered by women. Higher tax rev-enues enable governments to spend more on social programmes. These tend tohave positive gender outcomes because women gain from such expenditure in anumber of ways. Government-provided social services, especially in educationand health, also actively benefit women in terms of employment, since largenumbers of women are employed in the provision of such services. Moreover, theprovision of public services such as health and public transport, which are usedmore by women and low-income groups, tends also to favour women. Finally, theprovision of transfer payments to low-income households tends to favour women,who tend to be clustered in low-income groups. Thus, on gender equality grounds,as on many others, policies that generate sufficient revenues are to be encouragedand supported.
The objective of equity, which featured prominently in tax policies throughoutthe world up until the mid-1970s, reflected the consensus up until then that taxpolicy is an important instrument to redistribute income. Tax policies were seenas a powerful means of mitigating income inequality, with high tax rates onwealthy groups, sometimes with marginal tax rates up to 70 per cent, justifiedeven when additional revenues were not needed (Goode 1993).
In recent times, the World Bank and the International Monetary Fund (IMF)along with other mainstream economic policy organizations and most govern-ments, have tended to focus less on equity and progressivity in tax policies (seeBird and Zolt 2005), and more on efficiency and ease of tax administration. Thisis partly the result of the current focus on promoting market-based, supply-sideeconomic reforms and the liberalization of trade and capital mobility, both ofwhich are regarded as key to economic growth. In much of the developing world,the problem of weak state capacity has also contributed to a reluctance to use thetax system for redistributive purposes.
This is not to suggest that policy-makers have not been concerned about thegrowing income inequality of recent years or about the poverty and equity impli-cations of economic policies. There is certainly a concern among most policy-makers that tax policies should not hurt the poor. However, some public financeanalysts (e.g., Shah 2005) have shifted away from the view that tax policy per seshould be concerned principally with equity and poverty reduction in favour ofthe view that distributional concerns are better dealt with through transfers andother programmes on the expenditure side of the budget. Consequently thesepublic finance analysts argue that tax policies should focus less on redistributingincome from the rich to the poor and more on raising revenue in a manner that
300 I. Valodia

broadens the tax base and improves and simplifies tax administration and pro-motes compliance.
The focus of tax policy on resource mobilization, tax efficiency and adminis-tration is important for gender equality goals. As noted earlier, tax revenue createsthe possibility for state expenditure and the provision of public services, soimportant for promoting a gender equitable society. However, an important mes-sage emerging from the studies presented here is that policy-makers need also toconsider how taxes and tax policies per se impact on gender relations, the degreeto which tax policies may be reinforcing existing gender inequalities and theextent to which tax policies may assist in transforming these gender inequalities.
As pointed out in Chapter 1, all social relations are ‘bearers’ of gender in thatthey reflect the social norms that ascribe different roles, responsibilities, rightsand obligations to males and females in households, markets and organizations.Gender norms underpin differences between males and females in work andemployment, property rights, incomes and consumption, all of which in turninteract with the tax system. The principles outlined in the Convention on theElimination of All Forms of Discrimination Against Women (CEDAW) stateclearly that tax policies must take account of equity in taxation. CEDAW alsorequires that the concept of equity in taxation move beyond a focus strictly on for-mal equity (that everyone should be treated in the same manner) to a more sub-stantive concept of equity that recognizes the need to transform traditionalgendered roles in society that are presently inequitable.
For policy discussions, this framework suggests that policy-makers shouldadopt more powerful and transformative policy evaluation criteria than thoseused by standard welfare economics, that is, that only those policy reforms thatmake some persons or groups better off without making other persons or groupsworse off are economically desirable. Drawing on Himmelweit (2002), such atransformative and gender-aware tax policy evaluation matrix would be based onthe following four principles.
First, in addition to the standard concerns about the distributional impacts of taxpolicies on income groups and other forms of social stratification, the distribu-tional impacts between women and men (and girls and boys) need to be carefullyevaluated. Policy-makers need to be aware of the extent to which tax policies, suchas the tax treatment of income derived from jointly owned assets or the tax rulesfor child allowances, have a differential effect on women and men and the degreeto which these measures reinforce or overcome gender inequalities.
Second, policy-makers should consider the impact of taxation policies and taxreforms on both paid and unpaid work, including unpaid care work, and the inter-dependence between these two spheres of the economy. For example, provisions inpersonal income tax (PIT) systems such as higher marginal taxes on secondaryincomes constitute a disincentive for married women to participate in paid employ-ment while encouraging them to ‘specialize’ in or carry a disproportionate burdenof unpaid work relative to men. Other features in tax systems, such as the VATon ‘care’ services, may also alter the distribution of paid and unpaid work, andthus policy-makers need to be aware of the possible effect of these tax policies on
Conclusion and policy recommendations 301

the rewards to people whose work is differentially distributed across thesespheres of the economy. Evaluating the impact of tax policies on both paid andunpaid work may require looking at the costs and benefits, in terms of bothmoney and time, that accrue to women and men.
Third, policy-makers need to be aware of the impact of tax policies both amonghouseholds and within households. Thus, in addition to impacts on the race, spatialor income profile of households, the impact of tax policies on different genderedhousehold types – dual-earner households, single-parent households, female-breadwinner households, multiple-generation households, households living onsavings, pensions or some form of social security, same-sex partnership house-holds, among others – needs to be carefully assessed. For example, policy-makers need to be aware of how systems of individual filing of PIT affect thetotal taxes paid by these different household types. They need also to considerhow tax policies impact on women and men within these households and thedegree to which gender inequalities within the household are mitigated or rein-forced by taxation policy. Policy-makers should be aware not only that increas-ing VAT on children’s clothing may reduce the disposable income of womenmore than that of men, but that such action, by reducing women’s disposableincomes, may impact negatively on women’s power to influence household deci-sion-making, including in areas such as education and family nutrition.
Fourth, policy-makers need to consider that tax policies affect people differ-ently over their life cycle. This is an important gender issue because women,more so than men, take on many different roles and live in different situations andhouseholds over their lives. Tax policies should take account of these transitionsin roles and household types. For example, as demonstrated by Apps and Rees(2005), in many developed countries, women’s labour force participation ishigher before they have children, but decreases after the birth of the first child.This is less so for men. Unless tax policies account for these gendered rolechanges, taxes can have the effect of reinforcing gender inequalities and genderedsocial norms. Thus, the presence of children in combination with the tax treat-ment of the household’s second earner in systems that tax the household’s jointincome, may lead to a further fall in women’s labour force participation. Anotherexample of this is that a woman’s poverty in retirement can be caused by the(unequal) tax treatment of her husband’s deceased estate, which combined withher care-giving responsibilities in her previous households, may result in inade-quate provision for her future. It is therefore important that tax policies take a life-time perspective on the impact of taxation.
Having outlined a set of principles for evaluating tax policy in a gender-sensitive framework, it is also important to note some limitations of tax policymeasures to achieve gender equality and to highlight some caveats in interpretingthe findings presented in this volume.
First, as mentioned earlier, there is a view among some public finance econo-mists that the tax system should be designed so as to raise maximum revenue forpublic expenditure, which can then be channelled into social protection, safetynets, public infrastructure and public services and programmes that meet the
302 I. Valodia

needs of the poor and other disadvantaged groups. As we have argued, raisingadditional revenues for expenditures on social protection, safety nets and publicservices does have the potential to achieve substantial gender-equality outcomes.However, it is important to recognize that very often expenditure programmes donot reach the poor and other targeted groups. Moreover, these expenditure pro-grammes tend to target households, not individuals. Where tax systems place anundue burden on poor women and other disadvantaged groups, it is by no meanscertain that expenditure programmes can successfully correct these burdens.
Second, as is highlighted in many of the country case studies, a large portionof women’s paid work in developing countries occurs either in the informal econ-omy or in formal sector occupations where earned incomes are often well belowthe income tax threshold. In these developing country contexts, the majority ofwomen fall outside the personal income tax net. Using tax allowances in thesecontexts to achieve some social goals, for example, by providing allowances tosocialize child-care costs, impacts only on the small proportion of women that fallinside the tax net. In such cases removing tax deductions for financially depend-ent adults and children and targeting them through the expenditure side of thebudget may be more effective. Tax policies therefore need to be judged in con-junction with and complemented by other policy instruments, especially expen-diture policies, and taking income and employment distribution and levels intoaccount. In short, there is a lot that tax policy can do to promote greater genderequality but tax policy is but one of a set of policy instruments available and, tobe most effective, it should be considered together with expenditure policy.
While the chapters in this volume have generated a comprehensive anddetailed set of research findings, some caution must be exercised in drawing outthe policy issues and recommendations of the various studies undertaken. Policy-makers are often concerned with both the distributional and the potential behav-ioural impacts of taxation. While the studies here have certainly explored somebehavioural dimensions of taxation (e.g., PIT and labour supply decisions), theemphasis of the research, particularly the incidence analyses of indirect taxes, hasbeen on the distributional dimensions. None of the studies has modelled behav-ioural changes. Tax policy changes most often do impact on behaviour, so anypolicy recommendations flowing from the country studies need carefully to con-sider their behavioural implications.
Policy implications of the research findings
The principles outlined above for promoting gender-equitable tax policies pro-vide the framework in which to take up some of the policy issues that flow fromthe country findings.
In order to rectify gender inequalities in the tax system, policy-makers willhave two main policy objectives. The first is to improve the distributional impactof the tax system by reducing the gender inequalities it fosters among and withinhouseholds. The second is to use the tax system to induce behavioural changes inorder to transform existing gender inequalities. These distributional and behavioural
Conclusion and policy recommendations 303

goals may in some cases be in conflict, and in others may reinforce each other.For example, personal income tax policies that promote paid employment, whichis currently disproportionately done by men, will have a current distributionalimpact that favours men. However, changes in deductions and exemptions thatmake employment more attractive for women can have the long-term effect ofchallenging and potentially transforming existing gender norms and inequalities.On the other hand, VAT reforms that lower the price of merit goods or activitiesthat are currently disproportionately done by women, such as care-giving activi-ties, or that increase the price of luxury goods disproportionately consumed bymen, could both improve the gender distribution of tax policies and potentiallytransform existing gender inequalities.
This suggests two important lessons for policy-makers. First, as suggested ear-lier, tax policies need to be combined with other policy instruments. Second, andimportantly, tax policies that can challenge and potentially transform existinggender inequalities need to be targeted to both women and men.
Personal income taxes
As demonstrated in the country case studies, personal income taxes representan important source of revenue for developing countries. PIT can be enhancedin many ways, and there are several design features which can be introduced torender PIT more gender aware.
All of the PIT systems studied in this volume have progressive rate structures andare all based on individual filing. As discussed in Chapter 2, three cases of explicitgender bias are evident in the countries studied. In Argentina, where income isearned on jointly owned assets, the tax code allocates this income to the husbandby default, and a female taxpayer would be allocated the income only under excep-tional circumstances. Although the tax impact of this provision is to decrease thetaxes paid by the female taxpayer, the tax system is operating to reinforce existinggender inequalities in the allocation and control of income earned jointly by house-hold members. In Morocco, the tax code defines dependants to include a male tax-payer’s wife. A female taxpayer’s husband and children are, however, not definedas dependants, and she cannot claim a dependant’s tax allowance unless she canprovide evidence that her husband and children are financially dependent on her.
In both these countries, the tax legislation is clearly in contravention ofCEDAW, to which these countries are signatories and therefore legislativeamendments are necessary to correct these explicit biases.
The third case, India, presents an interesting example of positive explicitgender bias, where the tax threshold for women is higher than that for men. Thistax measure was introduced specifically to promote gender equality. There isunfortunately very little evidence to suggest that this measure has effectivelyimproved women’s position in India. In any event, it will have impacted on onlya very small proportion of Indian women – those inside and on the margins of theincome tax net – so any positive impacts are likely to have been minimal. Theefficacy of this measure is open to question and without evidence to the contrary,
304 I. Valodia

higher income tax thresholds for women cannot be recommended to rectifygender inequality.
The country studies have all uncovered implicit biases in the PIT systems intheir countries. These are mainly the result of the nature and structure of exemp-tions and deductions provided by the particular tax regime, and the manner inwhich these relate to the distribution of employment and income. In many of thecountries, for example, contributions to pension funds attract generous tax benefits.Since men tend to be employed disproportionately in the formal sector and earnhigher incomes, men disproportionately benefit from these allowances. Becausethey differ from country to country, the reforms necessary to address theseimplicit biases can be dealt with only on a country-specific basis. As a broadguideline, however, the evidence from the country studies suggests that policy-makers should review exemptions and deductions in PIT to ensure that they donot reinforce existing gender inequalities. Since these biases are linked to genderdifferences in employment and income opportunities, policies that promotedecent work for women and improve women’s incomes would go some waytowards addressing these inequalities.
The issue of allowances for children and financially dependent adults is espe-cially important given that women bear a disproportionate burden of care pro -vision in the household. The countries studied in this volume take differentapproaches to this issue. Argentina, Ghana and Morocco all make provisions fordependent children and financially dependent spouses. India, Mexico, SouthAfrica and Uganda make no provisions for non-earning spouses and other finan-cially dependent adults, nor for dependent children in the tax system. Mexico andSouth Africa do have programmes on the expenditure side of the budget to sup-port the costs of child care. The United Kingdom (UK) system of means-testedsupport for children and child care, while formally within the tax system, is inpractice indistinguishable from an expenditure-side programme of child support.
There are a number of points to be emphasized regarding tax allowances forchildren and financially dependent adults. First, clearly the system in Morocco,which allocates dependant allowances automatically to a male taxpayer but requireswomen to prove that they have dependants, is biased and requires reform. Wheresuch allowances do exist, they should apply to all taxpayers on equal terms and thetax authorities need to find an equitable means of allocating such allowances indual-income households to ensure that gender inequalities are not reinforced. Theyalso need to consider whether allowances for financially dependent members ofhousehold who contribute unpaid labour, usually women, should continue, sincethese allowances favour male-breadwinner households that benefit from suchunpaid labour over dual-earner households. In this case, the allowance is effectivelya payment for unpaid labour that goes not to the worker herself but to her spouseand results in a disincentive for her to enter paid employment.
Second, in some cases where most women and poor households are inside theincome tax net, such allowances can have positive gender-equality outcomes.However they will still exclude non-taxpayers and are likely to be worth more tobetter-off households and therefore less effective than using directly targeted
Conclusion and policy recommendations 305

expenditures. The only exception is a system of refundable tax credits as in theUK which is highly redistributive towards both poorer households and women.However, the UK Child and Working Tax Credit system, as noted above, is inpractice just a form of expenditure under another name.
Third, the case of South Africa, where all dependant allowances have beeneliminated and child support grants introduced, shows that in those contextswhere most women fall outside the income tax net, it may be more appropriate todeal with care provision on the expenditure side of the budget. Given that taxallowances will not reach most low-income households, the provision of grantsor subsidies is likely to be a more effective mechanism than a child and depen-dant care allowance in the tax system.
However, as discussed in Chapter 2 and exemplified by the UK system, wheresuch tax credits, grants or subsidies are means tested at the household level, theycreate disincentives, especially for low income earners, who would otherwise falloutside the income threshold, but now find their earnings result in lower subsi-dies to their households (because the grant or subsidy is means-tested). Thisimpacts particularly heavily on women who are more likely to have low earnings,creating a disincentive for them to seek paid work, thereby reinforcing genderinequalities.
Fourth, in a number of cases, including Mexico, South Africa and the UK, childsupport payments are made to the care-giver rather than to the main incomeearner in the household. This is an improvement in cases where there is clearly asole/main care-giver, but these systems should also avoid enshrining the idea thathouseholds need to have a division of labour that involves creating such a role, ascurrent systems do.
Fifth, in many instances, the real value of the tax allowances has been signifi-cantly reduced over time so that there is often a large gap between the true costsof child and dependant care and the child and dependant tax allowances. Wherethese allowances are paid, it is important that the allowances are adjusted regularlyso they bear some relationship to the actual costs of child and dependant care.
Given these various considerations, it is difficult to make an unequivocal rec-ommendation about whether or not allowances for children and financiallydependent adults should or should not feature in the tax system, though in generalit seems that dealing with the costs of children through the expenditure system canreach poorer households more effectively and equitably and that tax allowancesfor financially dependent spouses may have particularly deleterious effects ongender relations. The particular choice that governments make on this will dependon a range of local factors including the administrative capacity of the tax author-ity, the level of economic development and the income and earnings distributionwithin the population. Each country will have to resolve these issues being mind-ful of the trade-offs involved. Where such allowances do feature in individual fil-ing systems, the tax authorities will need to find ways of equitably distributingthese allowances between taxpayers in households with more than one taxpayer.
The simulations done in each country for the PIT have explored the issues ofhorizontal and vertical equity at the household level. The findings suggest that,
306 I. Valodia

for systems of individual filing, it is very difficult for horizontal equity to beachieved at the household level. Households that may be deemed similar in termsof need, but which have different numbers of income earners, pay differentamounts in PIT. Single-income households tend across all the countries to bear ahigher PIT incidence than do dual-income households. These differences occurbecause, under single-filing systems, dual-income households benefit twice fromthe tax threshold and possibly from other tax allowances and credits, and moveinto higher tax brackets only at higher levels of household income. Systems ofjoint filing would overcome this inequity with respect to household moneyincome but would fail to take into account the benefits in kind provided by finan-cially dependent spouses doing unpaid work in male-breadwinner households (orconversely the extra costs of dual-earner households of having to provide for thoseservices in other ways). Joint filing also provides labour market disincentives tosecond earners whose initial income is taxed at their spouse’s marginal rate. Thus,joint filing introduces a number of other gender inequalities. Further, joint filingis likely to reinforce existing intra-household gender inequalities. Although noneof the studies have explicitly explored joint-filing systems, there are thus goodreasons to believe that single filing is preferable on gender equality grounds.
The Ghana, Uganda and UK case studies raise the importance of fiscal drag asa gender-related issue. In a relatively high-inflation environment, where taxthresholds are not indexed so that the values are automatically adjusted for infla-tion, women, because they tend to be concentrated in low income brackets, areincreasingly drawn into the tax net, even while their real incomes are at levels atwhich they would have previously been excluded. Furthermore, as discussedabove, tax allowances for child care are often eroded by inflation. Policy-makersshould review these thresholds and allowances regularly or consider the introduc-tion of automatic inflation indexing.
Indirect taxes: VAT, excises and fuel taxes
Consistent with international trends, indirect taxes and especially VAT are animportant and increasing source of government revenues for the countries stud-ied in this volume. Although it is not validated by many recent empirical studies,there is a popular perception that indirect taxes, and especially the VAT, may beregressive and may place an undue burden on vulnerable households. Owingto the gendered nature of expenditure, indirect taxes such as VAT could alsocontain implicit gender biases.
The findings in this research show that the overall indirect tax incidence, withrespect to expenditure, falls most heavily on households in high-income quintilesin Uganda, Mexico and Morocco; on middle-income quintiles in South Africaand the United Kingdom; and is U-shaped in Ghana (i.e., falls on the richest andpoorest households). In Argentina, overall indirect tax incidence is proportional.In India, the lowest income quintile has the higher indirect tax incidence. Thoughmore nuanced, the overall findings with respect to gender are also encouraging.In general, male-type households bear the highest incidence of indirect taxes,
Conclusion and policy recommendations 307

with much of this being driven by these households’ greater consumption ofgoods that attract excise taxes and fuel taxes. Using the employment-based defi-nition of households, the country studies show that male-breadwinner householdsbear the heaviest incidence of total indirect taxes in Argentina, Ghana, Mexico,South Africa and Uganda, largely owing to these households’ greater consump-tion of goods that attract excises taxes. They also bear the heaviest incidence offuel levies in Ghana, Uganda and Morocco.
Dual-earner households bear the heaviest incidence of VAT in Argentina,Mexico, Morocco and the United Kingdom, excises in Morocco, and fuel levies inArgentina, Ghana, Morocco, South Africa and the United Kingdom.1 Householdswith no employed adults bear the heaviest overall indirect tax incidence and theheaviest incidence of excise taxes in the United Kingdom. India stands out as the onecase where, based on headship, female-headed households bear the highest inci-dence of indirect taxes. Using headship, in both India and Morocco, female-headedhouseholds bear a higher incidence of VAT than male-headed households do.
It is worth noting that these results may be sensitive to the fact that the inci-dence analysis is conducted on expenditure. In Mexico, the one country surveywhich included income data, the incidence analysis on income suggested some dif-ferent trends. In particular, Mexican households in which most income is earnedby women have a higher indirect tax incidence than households where men earnmost income. Incidence is lowest in households where men and women earn sim-ilar incomes.
It is worth noting also that the differences in the incidence of indirect taxesbetween female-type households and male-type households in some of thecountry studies are of relatively small magnitude. For example, in Argentina,although the incidence of indirect taxes on male-headed households (16.97) ishigher than that on female-headed households (16.18), the difference is not large.Similarly, in the United Kingdom, using the employment status category, theVAT incidence for male-breadwinner, female-breadwinner, dual-earner and no-earner households is respectively 7.04, 7.31, 7.84 and 7.78. While these small dif-ferences between male- and female-type households may not be enough to warrantpolicy reform, disaggregating household types across the income distributionmay provide more revealing information.
Indeed, female-type households are generally clustered in the lower-incomebrackets, and it turns out that most of the countries in this volume do make exten-sive use of zero-rating and exemptions in VAT to protect households in lowerincome brackets. For policy purposes, the results suggest that measures such as zero-rating and exemptions are effective at protecting vulnerable households from payinga disproportionate share of indirect taxes, which can explain the overall results ofthe country studies. The simulations conducted by each country further reinforcethe point that, without zero-rating, the incidence of VAT would have been higherfor female-type households and the relatively small differences in the incidenceresults would possibly have been larger.
A number of trends emerge from the simulations that each country conductedto make the system of indirect taxes more gender aware. First, the results in South
308 I. Valodia

Africa (where the impact of introducing VAT on basic consumption goods thatare currently zero-rated is simulated), Morocco (where a reduction in VAT onsome staples is simulated) and Uganda (where zero-rating of salt is simulated) areparticularly instructive. The South African simulation shows that zero-rating ofbasic food items resulted in substantial gender equality and poverty reductionoutcomes, benefiting female-breadwinner households and households with nopersons employed the most in relative terms. Similarly, in Morocco a reductionin VAT on staples goes some way to countering the high incidence of VAT onfemale-headed households. The Ugandan example demonstrates that identifyingsome very specific items consumed by vulnerable households, namely salt andparaffin, can effectively reduce the vulnerability of low-income female-typehouseholds, without significantly impacting on total revenue. Collectively, thesimulations suggest that there are grounds for specific and targeted usage of thetax system to improve gender equality outcomes. Zero-rating of children’s cloth-ing in the United Kingdom and paraffin in South Africa are other useful ways todo this, as shown by the simulations.
To reiterate, all of the countries studied have extensive exemptions and zero-rating in the VAT system. This is one reason why across the countries studied theVAT system is found not to be excessively inequitable in gender terms. Exemptionsand zero-rating are discouraged in the policy literature because they are deemed tonarrow the VAT base and to create multiple VAT rates, resulting in revenue lossesand complex tax administration. Recognizing that countries at different levels ofdevelopment have very different tax administration capabilities, the results never-theless suggest that it is possible, even in low-income countries, to administer VATsystems with at least some zero-rating of basic consumption goods. Moreover, theresults suggest that there may be ways to compensate for any losses resulting fromzero-rating in a manner that promotes gender equity in taxation.
With respect to excise taxes, the results, especially the simulations, suggest thatthere may be good grounds for raising tax rates on some ‘leisure’ and demeritgoods which are disproportionately consumed by men. Tobacco and alcohol areobvious examples but so may be some others: sports and entertainment, forexample. However, the issues are complex. Raising taxes on alcohol and tobaccocould have negative effects beyond increasing the potential regressivity of thesetaxes. Increasing taxes on tobacco could induce a shift to cheaper and inferiortobacco products with additional negative health outcomes. There could also bea potential negative gender impact from increasing taxes on both alcohol andtobacco if men reduce their contributions to women’s household allowances as aresult of the price increases on these goods (see Black and Mohamed 2006).Although data limitations prevented analysis of intra-household income effects inthe country studies, it may well be the case that males can shift the incidence ofany tax increases to their female partners.
The findings on fuel taxes suggest that these are an effective form of taxation,with particularly progressive outcomes, on both income-equality and gender-equality grounds. Because the desired behavioural effect would be on men,increasing taxes on fuel for private transport is one area where the distributional
Conclusion and policy recommendations 309

and behavioural goals of taxation policies may reinforce each other. In otherwords, by discouraging potentially negative social behaviour such as unnecessarycar use that appears to be undertaken disproportionately by men, the tax systemcan also have both positive distributional and behavioural impacts. By contrast, itis important also to recognize the possible poverty and gender impacts of loweredtaxes on specific types of household fuel, which is disproportionately consumedby women. Here, the results for South Africa, where the effect of levying VATon paraffin, which is currently zero-rated, was simulated, shows that specific andwell-targeted measures can generate very favourable outcomes.
A future research agenda
As noted in Chapter 1, the studies in this volume, in addition to suggesting pol-icy recommendations, also indicate areas of future research in order to extend anddeepen the analysis, methodology and conceptual understandings that inform thiswork.
Although the studies have limited the analysis to personal income taxes andVAT, excises and fuel taxes, there is clearly significant scope for extending theanalysis to consider the gender issues associated with other forms of taxes, suchas local and regional government taxes, trade taxes, taxes on capital, land taxesand corporate taxes, among others. The current development policy focus ondecentralization of governance structures has been associated with increasedpowers of taxation being given to local and regional governments. In a number ofcountries, local and regional tiers of government raise much of their revenuesthough property and land taxes, as well as consumption taxes. The comparativeanalysis of personal income taxes has shown that the taxation of householdincome earned from jointly-owned assets such as property and land is complexand sometimes gives rise to gender bias.
As discussed earlier, following the adoption of trade liberalization policies,many developing countries have had to introduce VAT in order to counter the fallin revenues from trade taxes. The gender implications of these reforms and thepossible impacts on, for example, women’s employment is another fruitfulresearch avenue to pursue.
An important area for further research to move beyond the inter-householdanalysis undertaken in this volume is to extend the analysis to consider the intra-household dimensions of taxation. The issues here are complex because house-hold income, expenditure and consumption would have to be disaggregatedamong household members. In short, it requires moving away from the implicitequal sharing rule used in this volume. This requires overcoming serious method-ological and data challenges. Although there is a promising emerging literatureon collective models and sharing rules (see Apps and Rees 2004; Bargain et al.2006; Couprie 2007), exploring tax issues requires very detailed informationabout household behaviour. Even if expenditure data for individual members ofthe household were available, which currently to the best of our knowledge is not,information on who in the household consumes what is purchased will be
310 I. Valodia

required. It may therefore, in the first instance, be more appropriate to explorethese issues using anthropological and sociological approaches to generatedetailed case study evidence of how tax policies impact on gender relations insidethe household.
The analysis here explores only one dimension of fiscal policy, namely, taxa-tion. Yet, most analysts would point out that the effects of tax policy should beseen in conjunction with government expenditure. Many social policy instru-ments are designed by policy-makers to ‘work’ on both the revenue and expendi-ture sides of the budget. In order to provide comprehensive evidence we need toexamine both sides of the budget. Supplementing the analysis done in this volumeand incorporating assessments on the expenditure side will provide a more com-plete picture of the gender equality issues associated with public finance.
The analysis in each of the chapters would also benefit from a fuller consider-ation of taxation in the informal economy. There are a number of reasons whythis is so. First, the informal economy is not only very large but likely increasingin most developing countries. Second, in most of the developing world, a dispro-portionate number of the poor, especially women, earn their incomes in the infor-mal economy. While most of the tax literature is concerned mainly with theinability of the tax authorities to reach those operating in the informal economy,there are some grounds for concern about how those operating in the informaleconomy may be affected by the tax system. A practical example in India is quiteillustrative. There, a reduction in tax rates on tobacco significantly reduceddemand for bidis, a popular substitute for tobacco, thereby causing a fall indemand for bidis. Significant numbers of women in India earn their incomes asbidi rollers, and their livelihoods would have been negatively affected by the taxpolicy changes. This example suggests that tax policies that do not take accountof interactions between the formal and informal economy may significantly mis-read the impact of tax policy measures.
Here the work of Emran and Stiglitz (2005) is sobering. The mainstream pol-icy advice to developing countries has been to liberalize trade, and to compensatefor losses in revenues from trade taxes by introducing VAT, or increasing the VATrate. Emran and Stiglitz argue that VAT is essentially a tax on the formal sector,and that its coverage in the informal economy is very limited. In their model, theintroduction of VAT in a setting with a large informal economy induces a shifttoward informal and home production, resulting in negative welfare outcomes.Thus, Emran and Stiglitz argue that trade taxes in these settings may be prefer-able to VAT. Keen (2007) disputes this conclusion, arguing that since VAT isimposed on all imports, its effect is similar to that of a trade tax. In other words,for those in the informal economy that are not registered under the VAT regulations,and can therefore not claim an input credit, VAT is in effect an import tariff. Bird(2008), on the other hand, argues that VAT may be effective at making it moreattractive for enterprises to operate in the formal economy rather than remaininginformal because they can claim VAT credits. It is not the purpose of this chapter totake a view on this debate, but rather to demonstrate the importance of systemati-cally considering the impact of tax policies on the informal economy.
Conclusion and policy recommendations 311

Conclusion
Taxation is ultimately part of a political process, revealing significant insightsinto the legitimacy of the state and the power of different interest groups, both inthe private sector and in civil society. Tax policy is shaped not only by state insti-tutions and various social interests, but also by ideas. As argued earlier, tax poli-cies are also influenced by preconceived mindsets about what the objectives oftax policies ought to be. Evidence-based research, such as that presented in thisvolume, can go some way toward challenging these ideas and mindsets, andinfluencing thinking about what are appropriate goals for taxation policies andhow these may be best achieved.
The current policy consensus is that tax policies should focus on raising revenuein a manner that broadens the tax base, and improves and simplifies tax administra-tion and promotes compliance, thereby generating sufficient resources to fundexpenditure on public services and social safety nets that can address poverty andinequality. Tax regimes that effectively raise revenue do create the fiscal space foraddressing gender inequality. However, the approach in this volume has been to sug-gest that in order to promote gender equality in taxation, policy-makers also need toconsider the equity dimensions of taxation. Such considerations need to movebeyond formal equality to substantive equality by adopting a conceptual frameworkaimed at transforming existing inequalities. For tax policy-makers, this implies con-sidering how taxes reinforce or challenge current gender and other social inequali-ties and how to design tax instruments so that such inequalities are overcome.
The evidence presented in this volume suggests that there is scope for policy-makers and analysts to shape tax policies to both raise revenue and address andovercome gender inequalities. In terms of PIT, the studies have uncovered someexplicit bias and a significant amount of implicit bias. Addressing these requiressome amount of legislative amendments and careful design of tax instruments.Consistent with most empirical analysis and contrary to popular perceptions, theevidence presented in this volume suggests that indirect taxes in the countries stud-ied do not place an undue burden on women. This is largely due to exemptions andzero-rating, which effectively protects vulnerable groups. The evidence presentedpoints to a number of ways in which policy-makers can improve the design taxpolicies so that they both promote gender equality and raise additional revenue.
The analysis also highlights the need for further research on the gender dimen-sions of tax policies and tax reforms. It is hoped that this volume will lay the basisfor research that extends and deepens the analysis presented here, so that taxinstruments may be more effectively designed to challenge and potentially trans-form existing gender inequalities.
Note
1 In Argentina, the difference in incidence between male-breadwinner and dual-earnerhouseholds is not statistically significant. In Mexico, fuel taxes in the year of the studywere actually a subsidy (see Chapter 5 for more explanation). Thus, in Mexico, female-breadwinner households received the lowest subsidy compared to other households.
312 I. Valodia

References
Apps, P.F. and Rees, R. (1988) ‘Taxation and the Household’, Journal of PublicEconomics 35(3): 355–69.
—— (2004) ‘The Household, Time Use and Tax Policy’, CESifo Economic Studies 50(3):479–500.
—— (2005) ‘Gender, Time Use, and Public Policy over the Life Cycle’, Oxford Bulletinof Economic Policy 21(3): 439–61.
Bahl, R.W. and Bird, R.M. (2008) ‘Tax Policy in Developing Countries: Looking Back –and Forward’, National Tax Journal LXI (2), June, 279–301.
Bargain, O., Beblo, M., Beninger, D., Blundell, R., Carrasco, R., Chiuri, M.-C., Laisney,F., Lechene, V., Moreau, N., Myck, M., Ruiz-Castillo, J. and Vermeulen, F. (2006)‘Does the Representation of Household Behavior Matter for Welfare Analysis of Tax-benefit policies? An Introduction’, Review of Economics of the Household 4: 99–111.
Bird, R.M. (2008) ‘Tax Challenges Facing Developing Countries’, Institute forInternational Business Working Paper No. 9, Joseph L. Rotman School of Management,University of Toronto.
Bird, R.M. and Zolt, E. (2005) ‘Redistribution via Taxation: The Limited Role of thePersonal Income Tax in Developing Countries’, UCLA Law Review 52(6): 1627–95.
Black, P.A and Mohamed, A.I. (2006) ‘Sin Taxes and Poor Households: UnanticipatedEffects’, South African Journal of Economics 74(1): 131–6.
Couprie, H. (2007) ‘Time Allocation Within the Family: Welfare Implications of Life in aCouple’, Economic Journal 117: 287–305.
Elson, D. (2006) Budgeting for Women’s Rights: Monitoring Government Budgets forCompliance with CEDAW, New York: UNIFEM.
Emran, M.S. and Stiglitz, J.E. (2005) ‘On Selective Indirect Tax Reform in DevelopingCountries’, Journal of Public Economics 89: 599–623.
Goode, R. (1993) ‘Tax Advice to Developing Countries: An Historical Survey’, WorldDevelopment 21(1): 37–54.
Hartzenberg, T (1996) ‘Taxation’, in D. Budlender (ed.) The Women’s Budget, Cape Town:Institute for Democracy in South Africa.
Himmelweit, S. (2002) ‘Making Visible the Hidden Economy: The Case for Gender-Impact Analysis of Economic Policy’, Feminist Economics 8(1): 49–70.
Keen, M (2007) ‘Vat Attacks’, IMF Working Paper WP 07/142, Washington, DC:International Monetary Fund.
Nelson, J. (1996) ‘Feminist Theory and the Income Tax’, in J. Nelson, Feminism,Objectivity, and Economics, New York: Routledge.
Schlesinger, E.R. (1965) ‘Tax Policy Recommendations of Technical AssistanceMissions: Evolution, Pattern and Interpretation’, in Organization of American States,Inter-American Development Bank, and Economic Commission for Latin America,Fiscal Policy for Economic Growth in Latin America, Baltimore, MD: Johns HopkinsUniversity Press.
Shah, A. (2005) Fiscal Management, Washington, DC: World Bank.Stotsky, J. (1997) ‘Gender Bias in Tax Systems’, Tax Notes International June 9, 1913–23.
Conclusion and policy recommendations 313

Index
Adam, S. 264, 265, 268Addison, T. 160Ahumada, H. 73Akesbi, N. 185Apps, P. 299, 302, 310Argentina: composition of tax revenue 66, 67,
67–8; demographics 64; economy 64–5;employment categories for personalincome tax 69, 70, 70, 71, 71; food taxesproposals 82, 83, 83, 84, 89; horizontaland vertical equity of personal income tax71, 72, 72–3, 88, 304; incidence of indirecttaxation 73, 75, 76, 76, 77, 77, 78, 78, 79,79, 80, 80, 81, 81–2, 88–9, 90; indirect taxrates 73, 74, 74, 75, 75, 92–3; personalincome tax system 68–9, 91–2; researchproposals 90; tax/GDP ratio 66, 66; VATand excise tax changes 83, 84, 85, 85, 86,86, 87, 87, 89
Artecona, R. 4
Bahiigwa, G. 233Bahl, R. 1, 3, 299, 300Bargain, O. 299, 310Barnett, K. 4Barreix, A. 3Bategeka, L. 241Beccaria, L. 73behavioural impacts of tax changes
18, 303, 304Bennett, F. 274Bird, R. 1, 3, 14, 18, 33, 48, 299, 300, 311Black, P. 309Blundell, R. 268, 274Bonke, J. 5Brewer, M. 274Browne, J. 265, 268Browning, M. 5
Budlender, D. 5, 218
Cancer Research UK 286Casale, D. 206, 218Casperson, E. 33CEDAW 7, 188, 301Chen, D. 233children’s clothing and footwear: removing
VAT 49; see also Ghanacommodities: incidence of indirect taxes by
commodities 43–5, 45–8; see also indirecttaxes; individual countries
Convention on the Elimination of All Forms ofDiscrimination Against Women (CEDAW)7, 188, 301
Coopoo, S. 207Couprie, H. 310Cunningham, W. 4
De Henau, J. 271deductions and allowances 25, 26–7; implicit
gender bias 25, 27, 305, 306; see alsoindividual countries
Deininger, K. 235Department of Social Development (South
Africa) 214direct taxes 3; see also personal income taxdistributional concerns of tax policies 300, 301,
303, 304Donaldson, L. 295Doss, C. 5, 15
Ebrill, L. 32Economics and Finance Ministry, Kingdom of
Morocco 182, 186, 187Edmiston, K. 14, 33El Bouazzaoui, A. 181, 198, 200 Elson, D. 5, 6, 7, 10, 11, 84, 187, 188, 300
Note: page number in bold refer to tables or figures.

Emmerson, C. 268employment: gender differences 4–5; see also
individual countriesEmran, M. 311European Commission 262excise taxes 32–3; raising excise taxes on
demerit goods 309; see also indirect taxesexempt income 25, 26–7; see also individual
countriesexpenditure: gender differences 5–6; see also
commodities; indirect taxesexplicit gender bias 6; indirect taxes 15;
personal income tax 12, 13, 304–5; seealso individual countries
Fagan, C. 263, 274Fox, W. 2fuel levies 32–3; changing rates on fuel taxes
309–10; see also indirect taxesfuture research 18, 310–11
Gasparini, L. 73gendered social relations 4Gendron, P. 18, 33Ghana: allowable deductions 155, 157;
employment sectors 151; excise taxes 161,161; fuel taxes 161, 161–2; governmentrevenue 152, 153, 153; household structure152; incidence of indirect taxation 162,163, 163, 164, 165, 166–72, 172, 173–4,177; income tax coverage 153; indirecttaxation 154; inflation adjustments 158,159; labour force participation 151, 152,158; personal income tax and genderissues 158, 159, 159, 160, 177–8; personalincome tax system 154–5, 156; policyreform simulations 172, 174–5, 176, 176,177; tax-exempt income 157; tax/GDPratio 152, 152, 153; tax reforms 153–4; taxreliefs 157; unpaid work 152, 158; value-added tax 160, 161
Ghana Statistical Service/Ghana LivingStandard Survey 152, 175
global income tax systems 23–4; see also SouthAfrica
Goldman, T. 207Gómez Sabaini, J. 73, 83Goode, J. 270Goode, R. 300government expenditure: in conjunction with
tax policy 18, 311 Government of Uganda 236, 257Grown, C. 4Gurley, T. 2
Haddad, L. 5, 6Hamilton, K. 278, 286, 294Hartzenburg, T. 206, 210, 299Hassim, S. 206High Commission for Planning, Kingdom of
Morocco 179, 181Himmelweit, S. 9, 301Hirsch, D. 274HM Treasury (UK) 264, 265, 268HMRC 267, 275horizontal equity 8; indirect taxes 14;
individual/households unit of taxation9–11; personal income tax 8–11, 29–32,306–7; see also individual countries
household structures: impact of tax policies302; incidence of indirect taxes byhousehold types 37, 41, 45, 307–8;individual/households unit of taxation9–11, 307; see also individual countries
IMF 263, 300implicit gender bias 6–7; indirect taxes 15–16,
307; personal income tax 12, 13–14,305–6; see also individual countries
income groups: incidence of types of indirecttax by income groups 37, 39, 307; see alsoindividual countries
income tax coverage 24–5; see also individualcountries
India: deductions and allowances 102; foodtaxes proposals 116, 117; Hindu UndividedFamily 101; horizontal and vertical equityof personal income tax 102–3, 104, 116,117, 304–5; incidence of indirect taxation103, 106, 107, 107, 108, 108, 109–13, 113,114, 115, 115, 117–18; income taxcoverage 103, 105, 117; indirect tax rates103, 105, 106, 106; indirect tax revenuesstructure 105; integrated goods andservices tax 94, 118; labour forceparticipation 94, 95, 95, 96, 96, 97, 97;personal income tax rates 101, 102, 102;personal income tax system 100–01, 117;tax/GDP ratio 99, 99; tax policy 94, 99;tax structure 98, 99, 100; tobacco taxesproposals 116, 117; wage disparities 98, 98
indirect tax analysis 32–3; indirect taxincidence analysis 33–6, 52–62 ; indirecttax incidence findings 36–48; see alsoindividual countries
indirect taxes 3; changing rates on fuel taxes309–10; excise taxes 32–3; explicit genderbias 15; fuel levies 32–3; horizontal andvertical equity 14; implicit gender bias
Index 315

15–16, 307; incidence of indirect taxes bycommodities 43–5, 45–8; incidence ofindirect taxes by household types 37, 41,45, 307–8; incidence of types of tax byincome groups 39, 39, 307; raising excisetaxes on demerit goods 309; value-addedtax 32, 49, 310, 311; zero-rating andexemptions 36, 38–9, 39, 308–9; see alsoindirect tax analysis; individual countries
individual/households unit of taxation9–11, 307
INEGI 119, 120, 130, 142inflation: income tax brackets 28, 29, 307; see
also Ghana; Uganda; United Kingdominformal employment 4–5, 311; see also
individual countriesInter-Parliamentary Union 7International Labour Organization 4International Monetary Fund (IMF) 263, 300
joint/single filing systems 9–11, 307Jones, F. 262, 263, 266Joshi, H. 262
Keen, M. 311kerosene: reducing tax 49; see also Ghana;
paraffin; South AfricaKiiza, J. 234
labour force participation 4–5; see alsoindividual countries
life cycles: impact of tax policies 302Lo Vuolo, R. 65Lundberg, S. 5
McConnell, H. 262Maluccio, J. 6Martinez-Vazquez, J. 5, 33Metcalf, G. 33Mexico: direct taxes 123; federal revenue
structure 122, 122, 123, 123; gender biasin personal income tax 127–8; householdsstructure 121, 122; incidence of indirecttaxation 130, 131, 131, 132, 133, 133–4,135, 135, 136, 136, 137, 137–9, 140–41,142; income tax coverage 125, 148–9;income tax rates 124–5, 126; indirecttaxation rates 128, 129, 129; indirecttaxation revenue structure 129, 130; labourforce participation 120, 120; personalincome tax system 123–5; policyrecommendations 146, 147, 148, 149;social security benefits 121; tax/GDP ratio122, 122; unpaid work and care 120; VAT
increase simulations 142, 143, 143, 144,144, 145, 145–6, 147, 148; wage credit125, 127; wage levels 120, 121, 121;working hours 121
Miller, B. 14, 33, 48Mohamed, A. 309Morocco: change in tax rates simulations 198,
199, 200, 201, 201, 202, 203; deductions187; gender bias in personal income tax187, 188, 189, 190, 201, 202, 203–4, 304;gender equality 179; gender wage gap 180,181, 188; household structure 181, 181,182, 182; incidence of indirect taxation190, 192, 193, 193, 194, 194, 195–6, 196,197, 198, 202–3, 204; income tax rates186, 187, 187; labour force participation179, 180, 180; personal income tax system185–6, 188, 189, 189, 190; tax/GDP ratio182, 182, 183; tax reform strategy 184–5;tax revenue structure 183, 183, 184, 184;value-added tax 190, 191–2
Morris, M. 9Mpuga, P. 235Musgrave, P. 7Musgrave, R. 7
National Treasury (South Africa) 207, 213, 216Nelson, J. 8, 10, 11, 28, 299
OECD 34Okidi, J. 233Okurut, N. 234Oostendorp, R. 4Osei, R. 160Osei-Akoto, I. 162, 165
Padayachee, V. 209Palmer, G. 262, 263paraffin: reducing tax 49; see also kerosene;
South Africa; UgandaPechman, J. 10personal income tax (PIT): explicit gender bias
12, 13, 304–5; horizontal and verticalequity 8–11, 29–32, 306–7; implicitgender bias 12, 13–14, 305–6;individual/households unit of taxation9–11, 307; inflation adjustments28, 29, 307; see also individual countries;personal income tax (PIT) analysis
personal income tax (PIT) analysis 23;deductions and allowances 25, 26–7, 27;definition of income 25; exemptions 25,26–7; inflation 28, 29; rate structure 24;reliefs for spouses and children, 28, 29;
316 Index

schedular/global tax systems 23–4;tax credits 28; vertical and horizontalequity 29–32
Phillips, L. 10policy reform simulations 48–50; see also
individual countriesPosel, D. 206Price, D. 269property rights: gender differences 6property taxes 3
Quisumbing, A. 6
Rao, M. 99Rao, R. 99Rees, R. 299, 302, 310Roca, J. 3Rossignolo, D. 73, 83
Santiere, J. 73Santos, C. 276, 277, 295SARS 213, 216schedular income tax systems 23, 24; see also
Ghana; India; MoroccoScheslinger, E. 299Secretaría del Trabajo y Previsión
Social 120Shah, A. 300single/joint filing systems 9–11, 307Smith, T. 159, 207, 209, 210, 211, 213 South Africa: allowable deductions 211; excise
duties 216, 217; fuel levy 216, 217; genderbias in personal income tax 211–14, 215,215, 230; gender equality 206; incidenceof indirect taxation 216, 218, 219, 219,220–21, 221, 222, 222–3, 224–7, 227, 228,228, 230–31; income tax coverage 209,210; income tax rates 209, 210, 210;indirect taxation 215–16, 217; personalincome tax system 209–11; tax/GDP ratio207, 208; tax reforms 209; tax revenuestructure 207, 208; value-added tax215–16, 217; VAT rate change simulations228, 229, 229–30, 231
South African Revenue Service (SARS)213, 216
Ssewanyana, S. 233, 238, 243Statistics South Africa 214, 216Stiglitz, J. 311Stotsky, J. 6, 7, 9, 13, 15, 23, 127, 187, 299structure of tax revenue 3; see also individual
countriessubstantive equality 8, 16, 301Sutherland, H. 271
tax credits 28; see also United Kingdomtax policy 299, 300, 312; behavioural changes
18, 303, 304; in conjunction withgovernment expenditure 18; distributionalconcerns 300, 301, 303, 304; efficiencyand administration 300, 301; gender-awarepolicies 301–3, 312; generating sufficientrevenues 300
tax revenue/GDP ratios 2–3; see also individualcountries
Thomas, D. 5, 15trade taxes 3; see also indirect taxesTzannatos, Z. 4
Uganda: economy 233; excise duties 238, 239;foreign development assistance 236;gender bias in personal income tax240–43, 259; gender equality 233;household structure 235, 236, 236;incidence of indirect taxation 243, 244,244, 245, 245, 246–50, 250, 251–5, 256,259; inflation adjustments 241; informalwork 259; labour force participation 234,234; paraffin excise levy reduction 258,258, 259; personal income tax system 239,239, 240, 259; removal of VAT on salt257, 257, 259; social services 235, 236;tax/GDP ratio 233, 236, 237, 237, 238; taxreforms 233, 237, 238, 239; tax revenuestructure 237, 238; unpaid work 234;value-added tax 238; wage levels234, 235
unit of taxation: individual/households9–11, 307
United Kingdom: allowable deductions 268,269; changing rates of indirect tax 287,288, 289, 290–91, 294, 295; distributionaleffects of tax system 266, 271–2, 273, 274;excise duties 275; fuel levy 275; genderbias in personal income tax 274, 293–4;gender pay gap 262; government revenuesstructure 265, 265, 266; householdstructure 262–3; incidence of indirecttaxation 274, 275, 276, 277, 277, 278,278–9, 280–81, 281, 282, 282, 283–6, 286,287, 288, 289, 294; indirect taxation 275;inflation adjustments 271; labour forceparticipation 262; national insurancecontributions 268; pensions 268, 269;personal income tax system 266, 267, 267,268, 269, 269; policy recommendationsto accompany tax reforms 294, 295;poverty rates 263; stimulus package 264,289, 292, 293; tax credits 269, 269–71,
Index 317

271–2, 273, 274, 293; tax/GDP ratio263, 264, 264; unpaid work 262;value-added tax 275, 275; welfareservices 263
United Nations 4, 5United Nations Development Fund for
Women 4United Nations Development Programme
(UNDP) 4unpaid work and care 5, 10, 11, 301–2; see also
individual countries
Value-Added Tax (VAT) 32, 310, 311; reforms49; see also indirect taxes
vertical equity 8; indirect taxes 14; personalincome tax 11, 29–32, 306–7; see alsoArgentina; India
Vogler, C. 263
wage levels 4; see also individual countriesWilson, B. 262Women’s Budget Group (UK) 263World Bank 233, 300
Young, C. 8, 10Younger, S. 14, 33, 47, 165
Zolt, E. 300
318 Index

eBooks - at www.eBookstore.tandf.co.uf
A library at your fingertips!
eBooks are electronic versions of printed books. You canstore them on your PC/laptop or browse them online.
They have advantages for anyone needing rapid accessto a wide variety of published, copyright information.
eBooks can help your research by enabling you tobookmark chapters, annotate text and use instant searchesto find specific words or phrases. Several eBook files wouldfit on even a small laptop or PDA.
NEW: Save money by eSubscribing: cheap, online accessto any eBook for as long as you need it.
Annual subscription packages
We now offer special low-cost bulk subscriptions topackages of eBooks in certain subject areas. These areavailable to libraries or to individuals.
For more information please [email protected]
We're continually developing the eBook concept, sokeep up to date by visiting the website.
www.eBookstore.tandf.co.uk