Optimal Income Taxation in an Equilibrium Unemployment Model : Mirrlees meets Pissarides
Upload
khangminh22Category
view
1download
0
CBN ECONOMIC & FINANCIAL REVIEW, VOL. 37 No. 3 18-43
RECENT REFORM IN PERSONAL INCOME TAXATION IN NIGERIA
By
Chief J. 0. Osakwe*
The recent reform of Individual Income Taxation in Nigeria entails generous tax reliefs and allowances granted to tax payers. The reform aims at increasing the disposable income of workers so that they can adjust for the impact of inflation and the rising cost of living. Other objectives of the reform include alleviation of poverty, redistribution of income and promotion of economic development. The paper examined in detail the extent to which these objectives have been achieved by the reform. The study showed that the increase in the disposable income of workers particularly in the low income group was too insignificant to enhance their purchasing power to a level that would enable them to combat the rising cost of living or alleviate poverty. The paper contends that, if a major objective of the reform is to enhance workers ' purchasing power, Government should undertake an upward review of total emoluments particularly of the public sector employees. The paper also addressed the fear earlier entertained by the state governments that the ref orm would result in substantial loss of revenue to them.
I. INTRODUCTION
The direction of Government policy with regard to Personal (Individual) Income Tax in the past four years has been to give generous tax reliefs and allowances to individual tax payers; reduce their marginal rates of tax as well as raise taxable limit on earned income. The present administration has a strong be! ief that a low tax regime would increase disposable income of workers sufficiently enough to enable them combat the continued rising high cost ofliving. Increased disposable income could, in turn, be an in1portant step forward towards reflating an economy that has long been in depression. For exan1ple, by increasing the purchasing power of workers, a low tax regime could generate increase in demand for manufactured goods which could, in turn, lead to increase in capacity utilization, manufacturing output and employment opportunities. The low income tax policy could also be regarded as an important fiscal tool for promoting economic development, redistributing income and alleviating poverty.
• Chief J. 0 . Osakwe is lhe MD/CEO of Josenos Consuliancy ltd. He was /ormely a Depar1me111a/ Chief. Research Depl. and Admi11is1ra1or of Computer Services Depl., Ceniral Bank of Nigeria.
18

Osakwe 19
On the other extreme, state governments which are the beneficiaries of the revenue from the individual income tax do not feel comfortable with the low tax regime as they feel that their continued loss of revenue as a result of generous tax reliefs is counter productive to theirrevenue efforts. States such as Lagos, Delta. Rivers and Oyo which derive the bulk of their internal revenue from individual income tax are not quite convinced that they will be adequately and equitably compensated from the new general consumption tax - Value Added Tax (VAT). for the loss of revenue from the individual income tax.
This contentious issue will be examined in Part IV.4. The study will, among other things, evaluate
(i) the extent to which the recent tax reform has affected the tax burden of individual income tax payer:
(ii) the effects of the reform on the disposable income of tax payers; (iii) the capacity of the present reform to provide sufficient income to enable
workers combat the rising cost ofliving; and (iv) the effects of the reform on the state governments· revenue. The paper is organised into five parts as follows: Part I contains the background
and the general objectives of the paper: Part II highlights the elements of the recent tax reform as they relate to individual income tax ; Part III presents critical analysis of tax burden on the individual tax payers as well as the equity aspect of the tax structures that have emerged since 1995; Part IV reviews the administrative efficiency of the individual income tax as well as the probable impact of the reform on the economy; while Part V contains summary and conclusion.
II. ELEMENTS OF THE INDIVIDUAL INCOME TAX REFORM
11.1 Income Covered By Tax
Individual Income Taxation in Nigeria is governed by the Income Tax Management Act (ITMA), 1961 and as amended by the Income Tax Management (Uniform Taxation Provisions, etc) Decree No. 7, 197 5 and other subsequent amendments to date. Under the 1961 Act. tax is levied on aggregate amount of individual income which consists of:
(a) gain or profit from any trade, business, profession or vocation; (b) employment income such as salary, wage, fee, allowance or other
gain from employment including bonuses, premiums and benefits received as part of pay compensation;
(c) dividends, interest and discount; ( d) gain or profit including any premiums arising from a right granted to
any other person for the use or occupation of any property; ( e) any pension, charge or annuity; and (f) any profit, gain or other payment not falling within paragraphs (a) to

20 CAN ECONOMIC & rINANl"l,\! REVIFW. VOL 37 No J
(e) above. Although the inclusion of non-employment and cash incomes can be justified in
principle: in practice. the administrative problems associated with them are enonnous. Most importantly. success in tax collection depends on the honesty of tax payers and employers in making accurate returns to the Inland Revenue Department. Since it is very difficult to collect tax from self-employed workers, most revenue derived from income tax are those collected under Pay As You Earn (PAYE) system. The present study focuses on all employment and earned incomes.
11.2 Tax Reliefs And Allowances
Details of the recent increases in tax reliefs and allO\vances are sho,.,11 in Table 1. The highlights are summarised below:
(a) the increase in personal allowance from N3.000 plus 15 percent of earned income in 1997 to NS.000 plus 20 per cent of earned income in 1998;
(b) additional disabled allowance ofN2.000 or 15 per cent of earned income; this was increased to N3,000 or 20 per cent of earned income in 1998;
( c) the increase in children allowance from N 1.000 per unmarried child (subject to a maximum of four children) in 1995 to N 1.500 per unmarried child in 1996 and 1997: this was again increased to N2,500 per w11narried child in 1998;
(d) the increase in allowance for dependent relatives from N 1,000 (subject to a limit of one dependant) in,! 995 to N 1,500 each (for two dependants) in 1997, and N2.000 for two dependent relatives in 1998;
(e) removal in 1996 limitations and restrictions imposed on tax relief on premium paid on Ii fc assurance: for example, before 1996. tax exempt from premium paid on life assurance was limited to IO per cent of capital a<;sured;
(f) reliefs on rent which are based on locations are as follows: (i) Lagos and Ahuja: 28 per cent of basic salary or N l 0,000
maxnnum; (ii) State capitals: 28 per cent of basic salary or N6,000 maximum;
and
(iii) Others: 28 per cent of basic salary or N4,000 maximum: and (g) reliefon transport allowance is N2.436 per annum across the board. A more recent development in reliefs and allowances is that they are no longer
based on gender, hut on individual basis, irrcspecti ve of sex provided there is no dual claim by husband and wife for children allowances. The law emphasises that allowances must be claimed in writing by completing and filing the relevant tax fom1 within due date.

Osakwe 21
11.3 Rate Structure: Taxable Income and Tax Rates
Further efforts by Government to reduce tax burden on individuals are reflected in the reduced marginal rates of tax for all income brackets. Details of chargeable incomes and tax rates for the period, 1995 to 1998 are shown in Table 2. It must be observed that Government tried to adopt progressive rates to ensure equitable distribution of tax burden although the implication of the recent policy is to ensure that more incomes or taxable income will be taxed at reduced rates.
From Table 2 it would be observed that the lowest marginal rate of tax was reduced to 5 per cent in 1995 (from l O per cent in 1994); while the highest marginal rate which was reduced from 35 per cent to 30 per cent in 1995 was reduced further to 25 per cent in 1997 and 1998. It is equally significant that the taxable income in which the reduced marginal rate applied has been increased sharply. For example, the marginal rate of 5 per cent applies to the first N20,000 of taxable income in 1988 as against l 0 per cent applicable to the first Nl0,000 in 1995-1997 while the maximum rate of25 per cent applies to taxable income of over N 120,000 in 1998 as against only N60,000 in 1996-97.
11.4 Increase In Tax Free Earned Income For Individuals
Following the generous tax allowances and reliefs outlined in Part Il.2 above, Government also considered it necessary to give further tax reliefs to low income workers and maintain equity in the income tax structure. Consequently, the level of workers· earned income which would be exempted from tax wasincreasedfromN7,500in 1995toN10,000in 1996andtoN30,000in 1998. It must be emphasised, at this point, that the tax reliefs are for employed workers only; they are not for those who engage in trade and business or receive investment income such as rent, dividend or interest. As a result of these reliefs, a person whose only source of income in any year of assessment is employment in which he earns N30,000 or below is exempted from filing tax returns.
However, Government recognises the need to make every adult a responsible citizen of the country and his state of resident and had accordingly introduced a minimum tax payable by individual worker at a reduced rate of0.5 per cent (from a previous level of l percent) of total income where:
(i) tax payer has no taxable income because oflarge personal relief; or (ii) taxable income produces tax payable lower than minimum tax; or (m) earned income does not exceed N30,000 in 1988.

12 CBI\; l'CONOMIC & FTNA~CIAL REVIEW. VUL. 37 r--:o 3
III. ANALYSIS OF INCOME TAX
III. 1 Tax Liability and Burden
Table 3 shows the computed tax liability of a married tax payer at various levels of income. This table is typical of a Nigerian situation where almost every worker filing income tax assessment form would normally claim the maximum allowances for children and dependent relatives. Subsequent analyses in this part are based on this scenario, that is, tax liability of a married person who has four children and two dependent relatives. The sharp upward movement in exemption limit is also reflected in Table 3.
Several important points could be deduced from the Table. First, a married tax payer on income ofN30,000 per annum enjoys a bigger reduction in tax burden than those workers on income ofN20.000 or N l 0,000 per annum in 1998. This is because the last two categories of tax payers would not enjoy further reliefs in 1998 while the three categories of tax payers would pay the same minimum tax of 0.5 per cent of total income. Secondly, Table 3, columns 4-7. also showed that there would be a progressive reduction in tax burden for the entire range of personal incomes in 1998. For example, tax burden in 1998 is expected to be reduced by 84 per cent for a tax payer on income of N30.000as against 10.6 percent for a tax payer on income ofNl ,000.000. This compared with 87.5 per cent and 25 .4 per cent respectively, for the corresponding income levels between 1995 and 1998. llirdly, given that a married tax payer enjoys generous children allowances, it is obvious that an unmarried tax payer would bear a greater tax burden than a manied tax payer. lb.is development could lead to false statement on family circumstance in order to avoid tax. In the extreme case, it could trigger early marriages and encourage couples to have many children. The long term implication is that Government could lose more revenue.
III. 2 Progressivity of Tax Structure
There appears to be a general agreement among public finance experts that progressivity in individual income tax structure is the rest measure of taxable ability because under such structure individuals on high income brackets, faced with higher marginal tax
rates than individuals in low income brackets, pay larger proportion of their incomes as tax. Thus, a progressive tax structure serves as a tool for redistribution of income from the rich to the poor. Moreover, the higher tax rates imposed on high incomes capture windfall gains and quasi-rents that result in imperfections in the economic system.
In the light of theory, this part examines in depth the degree of progressivity of Nigeria's individual income tax structures that have emerged from the recent reform in the individual income tax. The analyses are shown in Tables 3-5. The following points can

- Q,wkwe 23 --be deduced from those Tables. First in Tables 3-5, columns 1-3, the figures showed that the tax structures remain progressive from 1995-1998, that is, the higher income employees pay increasingly larger proportion of their incomes as tax than the lower income employees. In other words, workers on higher income brackets generally bore greater tax burden than those in the lower income brackets. The only distortion was for incomes up to N30,000 where free earned income earners pay a uniform tax of0.5 per cent.
Secondly, comparing the structures that emerged between 1995 and 1998, Table 4, columns 4-6 showed that the income tax structure was slightly more progressive in 1997 and 1998 than in 1995, that is, there was no significant shift in the structure of individual income tax over the period, 1995 to 1998 ( see Appendix for Mathematical Note On Measurement oflncome Tax Progressivity)
Tbirdly, Table 4 also showed that tax payers on the same income will pay less tax
in l 998 than in 1997 and far less than in 1995. This trend confirms the deliberate government policy to reduce tax burden of the working population and shift emphasis from income tax to general consumption tax (VAT).
Although the recent tax structures are progressive, the equity aspect is distorted. In table 5, columns 4-6, it would be observed that both the absolute and the relative changes in disposable income for low group are insignificant and much less than those of middle and high income groups (I). This finding conflicts with Government objective of using a low tax regime to alleviate poverty, particularly, among the low income workers and indirectly increasing the disposable income to enable this group of workers adjust for the impact ofinflation on the cost ofliving. The analysis further indicate that workers in the middle and high income brackets would benefit more from the reform than workers in the income group. It must also be observed that the Tables do not tell the full story. Both progressivity and equity aspect of our tax structures could have been more distorted if we have taken account that most employees, particularly the executive and top management staff in both the public and private sectors enjoy numerous fringe benefits in cash and kind which are not captured by tax; while those in low income brackets enjoy fewer fringe benefits which are far cry, in terms of number and value compared to those enjoyed by management and executive staff. It is generally believed that if such benefits were to be quantified in monetary terms and added to the disposable income, the income tax structure will be very highly regressive and inequitable!
Iv. EVALUATION OF THE TAX REFORM
IV.1 Administrative Efficiency
Administrative efficiency as it relates to individual income tax means the minimization of the cost of real resources needed to administer such tax. This implies that a minimum

24 CBN ECONOMIC & FINANCIAL REVIEW. VOL 37 No. 3
level of tax receipts should be achieved with the least cost. Such resources include, among other things, the cost of service rendered by government officials and tax consultants, the expenditure of employers in administering their part of the tax, time and convenience caused to the entire tax payers and tax advisers. For technical measurement of efficiency, tax administration will be regarded as efficient if revenue-cost ratio is above unity. Tax administration will also be regarded as efficient if it works towards reducing tax avoidance (i.e, legal method of minimizing tax liabilities) and tax evasion (i.e., reducing tax liabilities
by withholding information or submitting false information). This paper noted that, in spite of efforts made in the recent past in improving
income tax administration, it is still difficult to measure the level of efficiency achieved with regard to individual income tax. Admittedly, revenue from individual income tax has improved substantially but the resources employed to achieve bigger revenue is believed to be enormous when quantified. For example, while the Inland Revenue Departments still retain their regular staff, the recent practice of hiring tax consultants to collect income tax revenue at enormous costs to state governments persists. As at now, majority of those who pay tax are those on employment income or under PAYE while a large number of self-employed pay very little or no tax; some potential tax payers also completely evade tax even with the connivance of some corrupt and unscrupulous tax officers. Moreover, even under the PA YE, it is perfectly possible for an individual ta-x payer to declare that he/ she is married with four children, maintains two dependent relatives, etc.; while in fact, he may be a bachelor or spinster. It is also widely knov,,n that some employers in the private sector tend to shift emphasis to increase in fringe benefits rather than on the basic salary in an attempt to reduce tax liabilities of their employees. Finally, poor equipment and low level of computerization are still the bane oflnland Revenue Departments. On the whole, tax administration is yet to develop to a level where the majority of potential tax payers are
properly assessed or brought into tax net.
IV. 2 Effects on the Economy (Macroeconomic Impact)
One of the major objectives of the recent tax reform was to increase workers' disposable incomes in order to enable them adjust for the impact of inflation and the rising cost of living. In order to achieve this objective, Government increased tax reliefs and allowances. These measures were expected to increase the purchasing power of tax payers. This meant that the money which the tax P<!yers would have paid to Government as tax would be retained by them for their own use because of tax reliefs. In other words, both disposable income and purchasing power are increased by the amount that could have been paid as tax. Table 5, columns4-6, clearly illustrate this development (also, see Table 3, columns 4-5). These Tables showed that increases in the disposable income of workers earning up to N30,000 per annum are very insignificant in both absolute and relative terms. Considering that public servants (excluding commercialised parastatals)

Osakwe 25
constitute the bulk of workers in Nigeria and about 75 percent of them earn less than a total income ofN30,000 per annum, this paper believes that granting of tax reliefs to workers since 1995 did not have any significant impact on their standard ofliving. lbis is corroborated in Table 3 which showed that workers on income up to N 10,000 had no increase in reliefs since 1996 refonn while those on income up to N20,000 would have an increase of only N200 per annum in their disposable income in 1998.
Table 6 shows the distribution of the Federal Civil Service by Basic Salary (as this is usually the income identified for taxation) while Table 6B shows distribution by Total Emoluments. These Tables serve as proxies for the entire public service as distributions of salaries and emoluments in states and local governments are expected to follow the same pattern. Thus, it can be seen that workers are concentrated in low income group and hence the reliefs would make little or no change in their incomes. The high rate of inflation is also expected to continue to reduce their purchasing power.
One important implication of the above tables is that the Government may not succeed in reviving the saging purchasing power by mere tax reliefs. Certainly, a tax relief that gives a worker 1-2 per cent increase in his total income is clearly too insignificant to prop up his purchasing power or compensate him for rising cost of living. Another implication is that the more Government attempts to give more reliefs, the more the tax structure becomes inequitable without fulfilling one ofits major objectives of alleviating poverty. It can be seen very easily from Table 3 that employees on income ofN60,000 and above have both larger and relative changes in disposable income than those below that income.
This paper does not believe that further increase in tax exemption limit to even N60,000 will resolve the problem oflow purchasing power of the workers in the low income group. For example, if such a step were to be taken it would not make any sense to workers in the low income group who would not benefit from further tax reliefs since such reliefs would not increase their disposable income. The paper believes that tax reliefs are not alternative to direct increases in basic pay and fringe benefits. lbis paper therefore suggests that the much awaited enhancement of the purchasing power can be achieved by significant increases in salaries and wages. However. any salaries/wages award should be implemented quietly and \vith caution to avoid unpleasant price effects on workers.
On the positive side, Tables 3 and 5 showed that employees who are likely to be paying bulk of the tax will be those who will be enjoying large increases in their disposable incomes; hence increase in the disposable income will have two important implications. First. it will boost consumption tax as this category of workers are likely to be major consumers of VA Table goods. Secondly, if disposable income increases as a result of the refonn, capacity/ability of individual to save will tend to increase and hence incentive to save may also increase. However, incentive to save depends not only on ability to save (level of disposable income) but also, on marginal propensity to save (MPS), the rate of

26 CBN ECONOMIC & FINANCIAL REVIEW. VOL 37 No. J
inflation and the level of interest rates, among other. For example, Table 5 columns 4-6 showed that the disposable income would increase but, on the average, the rate of increase would be lower than the inflation rate in 1998. On the other hand, a real positive rate of interest would be expected in 1998 and given that MPS would increase faster than increase in the disposable income at high income level, savings might increase at that level, while no savings might occur at low income level. On the whole, the aggregate effects of the reform on savings may not be significant.
Moreover, since the increase in disposable income might not be significant, the reform may not lead to increase in domestic prices. This contrasts with general pay awards in Nigeria which always invariably must lead to sharp increases in domestic prices.
IV.3 Other Economic Effects
IV.3.1 Effects on Incentives to Work and Save
Individual income tax affects allocation of resources not only by diverting funds from private hands to the public sector (income effect) but also by its effects on incentive to work and save (substitution effect). Generally, these two effects reinforce each other the greater the tax rate, the greater the revenue for Government but the lesser the resources available for private consumption and saving, and hence less inducement to take risk (to invest); conversely, the smaller the tax rates, the smaller the Government revenue but the greater the resources available for private consumption and saving. The recent reform is expected to increase savings because of the anticipated increase in the disposable income.
A critical analysis showed that the reform will not disturb incentive to work particularly of employees in the middle to high income brackets. This is because the new tax structures have built-in unutilized tax capacity at all income levels above N60,000 and also given the present harsh economic environment, the supply cUJVe of efforts in terms of demand for income for most workers would still be relatively inelastic. The reform will, also, not reduce the incentive to work and earn income for workers in the low income group since given that the rate ofinflation will still be higher than the perceived increase in their disposable income, there might be greater effort to maintain a desired level of income.
IV.3.2 Individual Income Tax As A Built-in Stabilizer
Individual income tax is generally accepted as one of the most practicable and efficient tool used as a built-in stabilizer to the economy. For the individual income tax to be used as a sound instrument of stabilization policy, it must be income elastic. A tax is income elastic, if with an unchanged tax structure, the ratio of incremental tax revenue/ change in the GDP ( or GNP) is greater than the ratio of average tax revenue/GDP, i.e., the rate of an increase in revenue is greater than the corresponding rate of increase in GDP.

Osakwe 27
Thus. measuring the yield of individual income tax with regard to National Income or GDP. the elasticity of a tax yield can be estimated from a simple statistical relationship
as follows:
Thus,
and
T =a+ bY;
dT = b. dY
E = b.Y*T*
where T represents the tax yield, Y represents the GDP, T* and Y* their respective mean yields.bis the coefficient of GDP and E defines elasticity. Thus for E >I, the structure is income elastic and for E <I. the tax structure is income inelastic. ff the tax system is income elastic, revenue increases at a faster rate than the growth of GDP and thereby supplies Government with gradually increasing proportionofrevenue to GDP to meet the expanding needs for development expenditure. Moreover, at the same time, an elastic tax system supplies a built-in stabilizer to the economy, tending to offset cyclical upturns and downturns. For example, a rise in revenue during an upswing tends to dampen
private spending, and a decline in revenue during a dowswing may be offset by greater Government spending. On the other hand. if the tax structure is income inelastic, the economy would be more vulnerable to financing rising expenditure by credit creation with all the attendant dangers of inflation and balance of payments difficulties. m
Although the present study did not investigate the current elasticity of income tax because of paucity of data, earlier studies, <31 however, showed that the buoyancy ratio of individual income tax yield was significantly greater than unity. Two factors tend to confirm that the situation might not have changed for Nigeria. First. there has been substantial blTO\l\1h in income tax revenue over the years and this growth has been much faster than the growth in the GDP. Secondly. in spite of increases in tax reliefs and allowances. tax administration and tax efforts have so substantially improved that revenue continued to show a positive trend even though it was increasing at a reduced rate. On the whole, the tax structure is flexible and broadly based and can still be easily manipulated to serve as countercyclical fiscal policy tool. However, since Government is shifting emphasis from direct tax to general consumption tax. it appears unlikely that Government will quickly resort to the use of individual income tax as a built-in stabilizer to the economy.
IV. 4 Effects On Government Revenue
The recent individual income tax reform showed Government determination to shift revenue generation gradually from the individual income tax to VAT. Consequently, state governments which are the beneficiaries from the income tax have anticipated a fall in

28 CBN ECONOMIC & FINANCIAi. REVIE\\·. VOL. 37 i'-o .l
their revenue as a result of the reform. States which appeared to be most adversely affected by the reform include Lagos, Delta and Rivers, and these states derive more than 50 per cent of their internally generated revenue from the individual income tax. Moreover, in these states, tax revenue constitutes significant proportions of their revenue. Some states that would marginally lose revenue because oflow level of economic activities in their states and which are also low income based complained about the adverse revenue effect of the low tax regime. Whether these complaints are justified or not is an empirical question which will be briefly addressed below.
Information made available by some state governments and the CBN survey reports showed that, in spite of the reforms, revenue from the individual income taxation registered significant increases in Lagos, Delta and Rivers states; moderate increases were observed in about fifteen states while revenue fluctuated in the remaining other states from marginal increases to marginal decline. However, state governments have generally contended that their revenue would have been larger/increased faster than what they finally collected were it not for the perpetuation of the low income tax regime.
The study noted that the continued upward trend in income tax revenue in spite of the low tax system, was largely as a result of substantial improvement in the individual state's tax administration and tax efforts. Exceptionally, some states such as Lagos, Rivers and Delta which could have been more adversely affected by the reform. have sustained increase in revenue from income tax because they have large urban labour force in the high income brackets and they also enjoy much higher kvel of economic activities than most other states which are not so privileged to have these facilities.
It would be recalled that following the fear and complaints of states that low tax regime would reduce their revenue, the Federal Government had in its recent budgets modified twice within three years the VAT sharing formula in favour of states and local governments. For example, the share of state government in VAT proceeds was 45 per cent in 1998 compared to 40 per cent and 35 per cent in 1996-1997 and 1995, respectively. These figures represent increases of28.6 per cent and 25.5 per cent between 1995 and 1998, and 1997 and 1998, respectively. Given the substantial increase in states' shares of VAT revenue and that the anticipated loss in revenue from income tax would be substantially reduced by improved tax administration and tax efforts. increase in VAT revenue would be expected to more than offset further anticipated loss ofrevenue from the individual income tax. Since VAT revenue is distributed primarily on the basis of derivation, states that have high consumption potential will, on the average, be adequately compensated from VAT proceeds. Incidentally, these are almost the same states that have been vocal in complaining about their loss of revenue from income tax. This observation is confirmed by actual figures which showed Lagos, Rivers and Delta to be among the states that have the largest shares of VAT allocations. Hi Kano, Kaduna and Oyo states

Osakwe 29
also have large shares of VAT proceeds because of their fairly large urban labour force in high income brackets and because of their large population.
The low tax base states such as Yohe, Kebbi, Niger, Jigawa, etc. will also benefit from increased VAT revenue which will more than compensate them for possible marginal loss of revenue from income tax. On the whole, if the two taxes - individuals income tax and VAT - are efficiently administered, the reform may lead to an overall increase in total government revenue. If Government employs the additional revenue to finance
developmental - oriented projects, there will be compensating rise in employment opportunities in the private sector. If this were to happen, the gain of the reform will rebound to the economy.
V. SUMMARY AND CONCLUSION
The recent reform of individual income taxation underscores Government commitment to shift from direct tax to consumption tax (V A1). Although, VAT is a regressive
tax, it has been discovered to be more fruitful of government revenue than income tax.
The present study showed that a low individual income tax regime, if efficiently administered, could foster development of VAT, and thus could still be regarded as an important fiscal tool for promoting Government revenue from VAT.
The paper noted that the fear earlier entertained by the state governments that low tax regime would lead to substantial reduction in their revenue was not validated by the
present study. First, the low tax system is expected to increase the disposable income of workers which will, in tum, boost VAT revenue. Secondly, the continued adjustment of
VAT revenue in favour of states is to ensure that states are fully compensated from VAT
proceeds for any anticipated loss of revenue from the individual income tax. On the whole, if the two taxes are effectively and efficiently administered, the reform may impact more
positively on overall government revenue than anticipated and thus, there would be additional revenue for states to finance their development-oriented projects and programmes.
The paper regarded the low individual income tax policy recently being pursued
by Government as a landmark in the development of fiscal federalism in Nigeria. Hitherto,

30 CBN ECONOMIC & FINANCIAL REVIEW, VOL 37 No. 3
the tendency was to emphasise a tax system that would directly yield more revenue to Government but the present individual income tax policy is not pre-occupied with revenue yielding tax per se; rather, it tends to emphasise tax reliefs as a method of increasing disposable income of workers and enhancing their purchasing power. It was expected that such increases in personal income would stimulate consumption of workers, cushion the impact of inflation on their cost ofliving and alleviate poverty.
The study showed that these objectives were hardly achieved. Although the low tax system still retains some elements of progressivity in its structure; however, it is inefficient
in terms of providing equitable increases in income for all categories of tax payers. For example, the reform resulted in an increase of below 5 per cent in the disposable income
of tax payers in the low income group in 1998; whereas it is this category of workers that
require most substantial increases in their disposable incomes to enhance their low purchasing power. If the reliefs and allowances cannot provide significant increase in the
disposable income, the reform cannot be said to be capable of achieving its primary objectives of alleviating poverty of workers in the low income group or/ and ameliorating
the impact of inflation on their rising cost ofliving. Therefore, if the stance of Government policy is to enhance purchasing power
and alleviate poverty, this paper suggests that Government should review total emoluments upward, especially those of the public sector employees, majority of whose total incomes per annum are below N60,000 mark! Substantial increase in emolument would almost
immediately enhance the purchasing power of workers and that would enable them to
adjust to the present rising cost ofliving. Such pay award would also reflate the economy.
Unpleasant price consequences from such award could be mitigated by appropriate monetary and exchange rate policies. Government, on its own should not politicize or
give undue publicity to any pay award as that could send wrong signal to the economy. The paper suggests the following modifications to the present income tax system.
First, the uniform tax on tax free earned income should be modified to improve the progressivity and equity aspect of the tax for all categories of workers on tax free earned income. Secondly, children and dependent relative allowances should continue to be
adjusted upward to reflect the present high cost of social services and the increasing
burden of extended family. Thirdly, most states' tax authorities lack adequate and efficient machinery to cover some aspects ofincomes chargeable to tax; such incomes include
fringe benefits, interest, gains and profits outside direct employment. The paper suggests

Osakwe 31
that tax laws should be reviewed to ensure that the administrative costs of tax collection
and enforcement are at a minimum. Finally, reliefs on rent and transport allowances which
were presumably determined on the basis oflow allowances granted to civil servants
should be substantially reviewed upward to reflect current high rental accommodation
and transport costs incurred by workers.

TABLE 1
TAX RELIEFS AND ALLOWANCES
Tax Reliefs & Allowances 1997
I. Tax Free Earned Income* Exempt. N 10.000
2. Personal Allowance NJO00 plus 15% of earned income
3. Additional Disabled Higher of: N2000 or 15% of earned income.
4. Children Allowance N 1,500 p.a. per unmarried child, subject to maximum of 4 children
5. Dependent Relati\'es N 1000 subject to a limit of two (2) dcpendants
1995
1. Tax Free Earned Income* Exempt, N7.500
2. Personal Allowance NJ00O plus 15% of e..imed income
3. Children Allowance N 1.000 p. J. per unmarried child. subject to maximum of• chi!Jren
4. Dependent Relatives N l 000 subtL·t to a limit of one dcpem ant.
5. Life Assurance Scheme Tax excmlt or premium paid up to IO O a Capital Assured
* Minimum Tax of0.5 per cent on income exempt from tax
SOURCE: Federal Govt. Budgets. 1995-1998.
1998
Exempt, N30,000
N5000 plus 20%ofeamed income
Higher of: NJ000 or 20% of earned income.
N2,500 p. a. per unmarried child, su~ject to ma.xi mum of 4 children
~2000 subject to a limit of tv,o (2) dependants
1996
Exempt, N7.500
N3000 plus 15% of earned income
N 1.500 p.a. per unmarried child. subject to maximum of 4 children
N 1000 subject to u limit of one dependant
I .imitation & restrictions on Life Assurance Premiw11 relief removed.
.,, ,.,
z > t
'J
/ 0

TABLE 2
JAXABLE INCOME AND TAX RATES
1995 1996-1 997
Taxable Income Rate of Tax Taxable Income Rate of Tax % N %
FIRST 10,000 5 10,000 5
NEXT 10,000 10 10,000 10
NEXT 10,000 15 20,000 15
NEXT I 0,000 20 20,000 20
NEXT 20,000 25
OVER 60,000 30 60,000 25
SOURCE: As in Table 1.
1998
Taxable Income
20.000
20,000
40,000
40,000
120,000
RateofTax %
5
10
15
20
25
w w

TABLE 3
TAX LIABILITY OF A MARRIED TAX-PAYER*
Income Tax Li a b i I it y (=N=) Difference Between fN=)
N'000) 1995 1997 1998 (1) & (3) (2) & (3) At
(1) (2) (3) (4) (5)
10 50 50 50 0 0 20 425 300 100 325 200 30 1200 950 150 1050 800 40 2325 1950 650 1675 1300 60 5625 4500 1900 3725 2600 80 9875 7900 3750 6125 4150
100 14950 12000 6150 8800 5850 120 20050 16250 8550 11 500 7700 140 25 150 20500 11 600 13550 8900 160 30250 24750 14800 15450 9950 180 35350 29000 18250 17100 10750 200 40450 33250 22250 18200 l 1000 300 65950 54500 42250 23700 12250 400 91450 75750 62250 29200 13500 500 11 6950 97000 82250 34700 14750 1000 244450 203250 182250 62200 21000
* Based on maximum allowances for children and dependent relatives NOTES: Columns 4 & 5 show absolute increases in Disposable Income or
reduction of tax liability. Columns 6 & 7 show relative reduction in tax liability.
SOURCE: Computation is based on information in Tables l and 2.
Perecentage Diff. Between
(1) & (3) (2) & (3)
(6) (7)
0.0 0.0 76.5 66.7 87.5 84.2 72.0 66.7 66.2 57.8 62.0 52.5 58.9 48.8 57.4 47.4 53.9 43.4 51.1 40.2 48.4 37. 1 45.0 33.1 35.9 22.5 31.9 17.8 29.7 15.2 25.4 10.3
w ....
() CD z m ()
0 z 0 s:: n fl,,
< 0 r w _,
z 0
w

TABLE4
PROGRESSIVITY OF TAX STRUCTURE: A MARRIED TAX-PAYER
Income Ta'<. Liability as% oflncome Degree of Progressi\·ity Between
(N'000) 1995 1997 1998 (I) & 2 (1)&(3)
At (1) (2) (3) (4) (5)
10 0.5 0.5 0.5 0.71 0.23 20 2.1 1.5 0.5 1.1 2 0.53 30 4.0 ", .),_ 0.5 1.05 2.22 40 5.8 4.9 1.6 0.94 1.23 60 9.4 7.5 3.2 1.01 1.12 80 12 .3 9.9 --L7 0.97 1.09
100 15.0 12.0 6.2 1.01 1.03 120 16.7 13.5 7 .1 1.00 1.09 140 18.0 14.6 8.3 1.00 1.06 160 18.9 15.5 9.3 1.00 1.05 180 19.6 16.1 10.1 0.97 1.06 200 20.2 16.1 11. 1 1.04 1.16 300 22.0 18.'.2 14.1 1.00 1.06 400 22.9 18.9 15.6 1.00 1.03 500 23.4 19.4 16.5 1.00 1.05
1000 24.4 20.3 18.2
Note: Progressivity index > 1 indicates that a new structure is more progressive than a preceding structure.
SOURCE: Computation from Information in Table 3 and Mathematical Note in the Appendix.
(2)&(3)
(6)
0.33 0.47 2.08 1.30 I.I I 1.09 1.02 1.08 I.OS 1.04 0.99 1.1 2 1.06 1.03 1.05
( 1
w v ,

TABLE 5
CHANGES IN TAX BURDEN OF A MARRIED TAX-PAYER
Income Tax Liability as % of Income
(N'000) 1995 1997
At (1) (2)
10 0.5 0.5 20 2. 1 1.5 30 4.0 3.2 40 5.8 4.9 60 9.4 7.5 80 12.3 9.9
100 15.0 12.0 120 16.7 13.5 140 18.0 14.6 160 I 8.9 15.5 180 I 9.6 16.1 200 20.2 16.6 300 22.0 18.2 400 22.9 18.9 500 23.4 19.4
1000 24.4 20.3
* DY = Change in Disposable Income SOURCE: Computation is based on Table 3.
1998
(3)
0.5 0.5 0.5 1.6 3.2 4.7 6.2 7.1 8.3 9.3
10.1 11.1 14.1 15.6 16.5 18.2
DY* as a% of Income Between
1995 & 1997 1995 & 1998
(4) (5)
0.0 0.0 0.6 1.6 0.8 3.5 0.9 4.2 1.9 6.2 2.4 7.6 3.0 8.8 3.2 9.6 3.4 9.7 3.4 9.6 3.5 9.5 3.6 9. 1 3.8 7.9 4.0 7.3 4.0 6.9 4.1 6.3
1997 &1998
(6)
0.0 1.0 2.7 3.3 4.3 5.2 5.8 6.4 6.3 6.2 6.0 5.5 4.1 3.3 2.9 2.1
n Cll z rr. r: 0 z 0 $'. ri ~ ..,., z > z n • r ;,:, m ~ m J: < Q
w .....
z 0

TABLE6A
FEDERAL CIVIL SERVICE: DISTRIBUTION BY BASIC SALARY*
Staff Category Salary Group Salary Range Percentage of (Grade Level) From To Number in Group**
=N = =N =
1. Junior 01 - 06 4356 11 220 75.6 2. Supervisory and Senior 07 - 13 8748 3 1800 23.3 3. Management 14 - 15 24276 36950 0.9 4. Top Management 16- PS/DG 29112 45000 0.2
* Includes Extra - Ministerial Departments ** Average 1993- 1996
TABLE6B
FEDERAL CIVIL SERVICE: DISTRIBUTION BY TOTAL EMOLUMENTS
Staff Category lnomeGroup Income Range Percentage of (Grade Level) from To Number in Group
=N= =N=
1. Junior 01 - 06 15040 30150 75.6 2. Supervisory and Senior 07 - 13 25520 70520 28.3 3. Management 14 - 15 60330 87560 0.9 4. Top Management 16 - PS/DG 72380 180000 0.2
* Includes Extra- Ministerial Departments * * Average I 993-96 SOURCES: Computed from information obtained from:
1. Federal Ministry of Establishment 2. Approved Estimates of the Federal Republic ofNigeria. l,J _,

38 CBN ECONOM IC & r' INANCIAL REVIEW, VOL. 37 No. 3
(I)
(2)
(3)
(4)
FOOTNOTES
For convenience, the present study classified socio-economic groups, using total income as follows:
(a) Under N60,000 (b) N60,000 - NS00,000 -(c) Above NS00,000
Low Income Group Middle Income Group High Income Group
Osakwe, 1.0., " Harmonization of Personal Income Taxation in Nigeria". p. 16 (Akey paper presented to the Internal Revenue Allocation Review Committee on the case for Uniform Income Taxation in Nigeria), Nov., 1968.
Osakwe, J.O. Op. cit., see footnote 2 above.
Federal Minister of Finance Budget Briefings, 1995-98.

Osakwe 39
SELECTED REFERENCES
Central Bank of Nigeria, Annual Report and Statement of Accounts, 1987, 1993, and 1995-6.
Douglas, Roger, Statement On Taxation And Benefit Reform, 1985 (Wellington, New Zealand, 1985).
Goode, Richard, The Individual Income Tax (Washington Brooking Institution, rev. ed. , 1976).
Federal Government ofNigeria Approved Budgets and Federal Minister of Finance Budget Briefings, 1995-98.
Federal Republic ofNigeria, "Income Tax Management (Uniform Taxation Provisions, etc., Decree No.7, 1975) in Supplement to Official
Gazette, February, 1975.
Herschel, Federico J., "Tax Evasion and its Measurement in Developing Countries". Public Finance (The Hague) Vol. 33, No.3 , 1978, pp.232-68.
International Monetary Fund, "Personal Income Taxation", INST/75 -Xl/13, Washington, D.C.
Osakwe J.O. et al, "Tax reform: 1966-67", Central Bank of Nigeria Economic and Financial Review: Vol. 5 No. 1, June 1967, pp 12-26.
Smith, Stephen,"Tax Enforcement and the Black Economy, Cost Effectiveness and Compliance", Public Money (London) , Vol. 6, December, 1986, pp. 25-28.
Tait, Alan A , Value Added Tax: International Practice and Problems, IMF, Washington D.C. , 1988.

40 CBN ECONOMIC & FINANCIAL REVIEW. VOL 37 No. 3
APPENDIX
MATHEMATICAL NOTE ON MEASUREMENT OFT AX PROGRESSIVITY
(I) Measuring the degree of tax progressivity between different income levels within one tax structure. The following parameters are given: (1) As a starting point, two persons, A and B, earn incomes Y. and Yb
respectively. (2) Yb is greater than Y .-
(3) Taxes paid by A and Bare denoted by T. and Tb, respectively. ( 4) Both tax payers have the same maximum allowances and tax reliefs
appropriate to their respective levels of incomes. From assumptions ( 1) to ( 4 );
Ratio of A's tax to his income T = -L y
• ~ Ratio of B's tax to his income = Yb
For tax paid by A and B to be proportional,
. TY L e., Tb y • = 1.. ............... (I)
a b
From assumption (2), if TY T\• > I, (tax is progressive)
a b
TY and r\" < 1, (tax is regressive)
a b
Equation (1) can be extended to apply to all income levels within the same tax structure as follows:
Osakwe 41
Denoting T • as
T I
y Y. a I
and
For Tax to be proportional at all income lt::vels
T. I T I+ == t 1.e.
Y. I
Ti+I Yi
Yi. yi+I . ............... (2)
(Where i = 1. 2, 3 ....... n incomes lewls, and Y. 1> Y.)
r+ I
From the computation based on equation(?.) abo\'c, the entire tax structure can be seen to be proportional. progressive or regressi\'e.
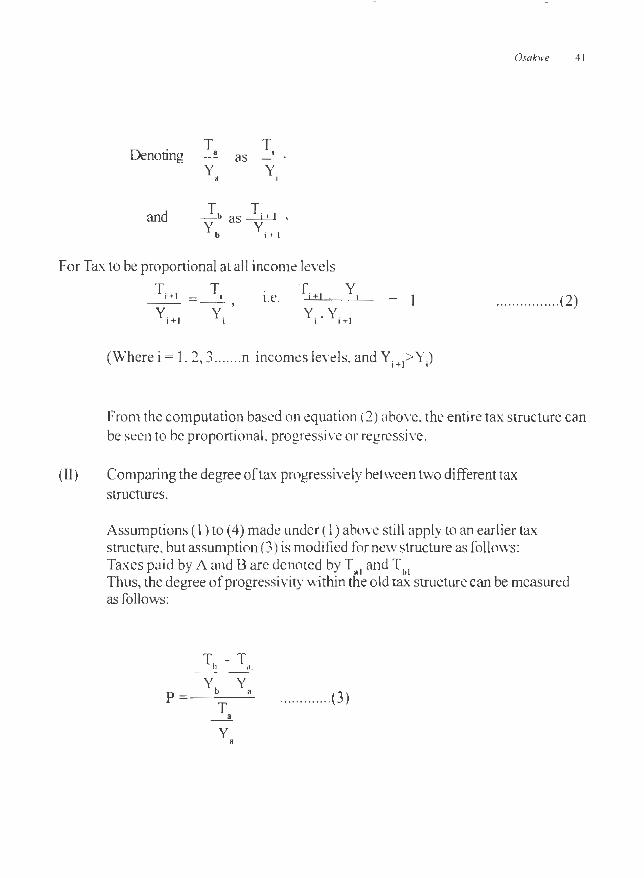
(II) Comparing the degree of tax progressively between two different tax structures.
Assumptions ( 1) to ( 4) made under ( 1) a bow still apply to an earlier tax stmcture. but assumption (3) is modified for new structure as follows: Taxes paid by A and Bare denoted by T.
1 and T 1,i
Thus, the degree of progressivity within the old tax structure can be measured as follows:
T - T b ,, . --
P= Yb y"
T ............. (3)
_a
y a

~2 cs:,._ LCON0'.11l" & FlN,\NCIAI. IU'\ill'W. Vt)!. .17 I\,, J
Similarly, the degree of probrressivity within the new tax structure can be measured a-; follmYs:
T T __ b_J ~•-1
Y y PI= ~b~--~" ··············(4)
For both structures to be equally progressive. P = p
I •
. r, 1.e .• p = 1 ................... (5)
Using equations (3) and ( 4 ). Equation (5) becomes
Tbl T T --'!.l. "
Yb y Y,. X
T,., T., - T a
= 1 ..................... (6)
--y yh y • "
Equation (7) becomes:
X = 1 ................................ (7)
= t3(11 - t 1) .................. (8)
= 1 ............................... (10)
Ta . Tb1 Yb Ya
= l ......................... ( 11) y Yb Tb T a al

TT I.e .. _a_b_l
For equal progressivity,
T. Tb,
"' 1 .......... ... .. ...................... (12)
T., Th TT
hence, • bl > 1, T.,Tb
Osakwe 4.3
Cl ne new tax structure is more progressive than an earlier structme being compared)
TT a bl and, for
T T a I h
< 1.
CI ·he new tax strncture is less progressive than an earlier structure). Thus, equation (12) can be applied to compute tax progressi\ity in a pairwise fashion, in ascending order. for all levels of incomes \Vithin two tax structures.
Copyright © 2022 FDOKUMEN