
MODELLING PERSONAL INCOME TAXATION IN SPAIN
88
MODELLING PERSONAL INCOME TAXATION IN SPAIN: REVENUE ELASTICITIES AND REGIONAL COMPARISONS JOHN CREEDY JOSÉ FÉLIX SANZ-SANZ FUNDACIÓN DE LAS CAJAS DE AHORROS DOCUMENTO DE TRABAJO Nº 528/2010
-
Upload
khangminh22 -
Category
Documents
-
view
1 -
download
0
Transcript of MODELLING PERSONAL INCOME TAXATION IN SPAIN

MODELLING PERSONAL INCOME TAXATION IN SPAIN:
REVENUE ELASTICITIES AND REGIONAL COMPARISONS
JOHN CREEDY JOSÉ FÉLIX SANZ-SANZ
FUNDACIÓN DE LAS CAJAS DE AHORROS DOCUMENTO DE TRABAJO
Nº 528/2010

De conformidad con la base quinta de la convocatoria del Programa
de Estímulo a la Investigación, este trabajo ha sido sometido a eva-
luación externa anónima de especialistas cualificados a fin de con-
trastar su nivel técnico. ISSN: 1988-8767 La serie DOCUMENTOS DE TRABAJO incluye avances y resultados de investigaciones dentro de los pro-
gramas de la Fundación de las Cajas de Ahorros.
Las opiniones son responsabilidad de los autores.
Modelling Personal Income Taxation in Spain:
Revenue Elasticities and Regional Comparisons
John Creedy
José Félix Sanz-Sanz1
Abstract
This paper derives analytical expressions for the revenue elasticity of the Spanish
personal income tax system, as applied to tax units and in aggregate. This is
complicated by the schedular nature of the system, and the role of central and
regional governments, along with the existence of a range of tax credits and eligible
expenditures and deductions. Empirical estimates are obtained using a cross-sectional
dataset which enables a number of important ancillary elasticities (relating to
allowances and tax credits, and different income sources) to be estimated. It was
found that there is considerable variation among tax units in the revenue elasticity,
with highly (positively) skewed distributions. The nature of the distributions varies
among regions of Spain, and the aggregate elasticities for each region were found to
display some variation associated with income distribution differences. The national
aggregate is found to be around 1.3. The paper also derives aggregate tax revenue as
a function of characteristics of the distribution of taxable income in each region. This
allows the sources of revenue differences among regions to be identified.
Key words: revenue elasticity, personal income taxation, regional tax revenue. JEL Classification: D31 H24 H30
1 Department of Economics, The University of Melbourne and Universidad Complutense de Madrid,
respectively. We are grateful for support from the Fundacion de las Cajas de Ahorros (FUNCAS).

2
3
1 Introduction
An important characteristic of any personal income tax structure is the elasticity of
income tax revenue with respect to changes in gross income, when there are no
adjustments to income thresholds or other discretionary changes to the tax structure.
The revenue elasticity provides, at individual and aggregate levels, a measure of
‘fiscal drag’ arising from the failure to adjust income tax thresholds when incomes
increase. Fiscal drag, or ‘built-in flexibility’, has implications for both the revenue
and redistributive effects of taxation over the business cycle.2 This measure is also
useful when considering the ‘automatic stabilisation’ properties of the tax system.3
For tax planning purposes it is also important to be able to estimate the implications
for total income tax revenue of a range of exogenous changes.
The aim of this paper is to estimate the revenue elasticity properties of the Spanish
personal income tax structure and to provide a method of examining the implications
for total tax revenue of a number of changes, including changes in the distribution of
income and in the tax structure itself. Although the focus of attention is the Spanish
structure, the methods used are more widely applicable.
The Spanish tax system differs from that of many other countries and has undergone
significant reforms, in additional to the type of base-broadening and rate-reducing
changes which have been common in many other countries.4 In particular, income
taxation (since 2002) is shared between Central and Regional Governments,
consisting of 15 autonomous regions within the Common Territory. In addition,
different tax rates and thresholds, and other rules influencing the difference between 2 The revenue elasticity is closely linked to one of the measures of progressivity proposed by
Musgrave and Thin (1948), and the link with progressivity is examined further in Podder (1997). On a
possible relationship between the elasticity and government expenditure, see Craig and Heins (1980)
and Misiolek and Elder (1988). 3 On automatic stabilisation aspects of revenue elasticity, see Pohjola (1985), van den Noord (2000)
and Mabbett (2004). A reduced importance was predicted to follow the ‘death of inflation’, by
Heinemann (2001). 4 On the recent reforms, see OECD (2006).

4
gross and taxable income, apply to a range of income sources: this involves the use of
a multi-schedular tax structure. There are numerous deductions, allowances and tax
credits (at central and regional levels) which apply at various stages. A number of
these elements depend on non-income as well as income characteristics of tax units.
This complexity means that extensions need to be made to standard methods of
obtaining revenue elasticities.5
The approach followed here is to derive an analytical expression for the revenue
elasticity of tax units. This is shown to depend on a number of ‘ancillary elasticities’
which affect the way in which eligible expenditures and deductions, and tax credits,
vary with unit income, along with the relative movements of each income source. A
large cross-sectional sample of Spanish tax units is then used to estimate values of
the ancillary elasticities, allowing for a substantial degree of heterogeneity whereby
the elasticities differ according to total tax unit income, the demographic composition
of the unit, the location (autonomous region) and the income source. The aggregate
revenue elasticity for each region and for the country as a whole is then obtained as a
tax-share weighted sum of tax unit revenue elasticities, where the weights depend on
the way in which each tax unit’s income changes when total income changes.
Having examined revenue elasticities, this paper then turns to the derivation of an
expression for aggregate tax revenue, depending on proportions of people (within
each region) and proportions of total income between the income thresholds of the
income tax function. In carrying out the aggregation process in a tractable manner, it
is necessary to begin from a given distribution of taxable income. This contrasts with
the approach used to calculating revenue elasticities, where the latter are related to
changes in gross incomes. The approach allows the sources of differences in tax
revenue among regions to be identified.
5 Alternative methods include times series regressions and simulation. An early study of the US is
Greytak and Thursby (1979). Important contributions were made in a series of papers by Hutton
(1980) and Hutton and Lambert (1980, 1982a, 1982b, 1983, 1989). See also Caminada and
Goudswaard (1996). For a survey of analytical properties, see Creedy and Gemmell (2002, 2006).
5
Section 2 provides a description of the Spanish personal income tax system and
formulates analytical expressions for the tax liability of each tax unit. Revenue
elasticities relating to each tax unit are derived in Section 3, which also provides
some numerical illustrations of their variation with tax unit income. Section 4 turns to
the empirical estimation of revenue elasticities. First it obtains the distribution over
tax units, using the ancillary elasticity estimates. Second, aggregate revenue
elasticities for each region are reported. Section 4 also considers the potential
implications of alternative income dynamic processes which allow ‘regression’ away
from or towards the geometric mean income. Aggregate tax revenue is then examined
in more detail in Section 5. Brief conclusions are given in Section 6.
2 The Tax Structure
This section describes the main elements of the personal income tax structure in
Spain. The accounting period is the tax year, which corresponds to the calendar year.
Subsection 2.1 provides a basic description of the structure as it applies to an
individual tax unit, where the unit may consist of single individuals or married
couples who decide to file jointly. In view of the operation of tax credits, several
special cases need to be distinguished, as discussed in subsection 2.2.
2.1 Income Taxation of a Tax Unit
Let hiy denote the gross income of tax unit h from source 1,...,i I . In transforming
from gross to taxable income, there are tax-deductible expenditures and non-income
allowances. Let hiE denote the tax-deductible expenditure for unit h relating to
source i. In general these expenditures are expected to be a function of gross income:
this is examined in more detail below. Non-income allowances for tax unit h relating
to source i are denoted hiA . Taxable income, hix is given by:
max 0,hi hi hi hix y E A (1)
If the sum of actual tax-deductible expenditures and non-income allowances exceeds
gross income for any income source, the unit effectively has ‘losses’ associated with

6
that source.6 A distinction can therefore be drawn between actual expenditures and
those which are claimed in a year: in the following discussion, hiE refers to actual
expenditures. A complication is that any ‘losses’ can be carried forward for a period
of four years, to be deducted against future income for the same source. However, no
allowance is made for this dynamic element on the grounds that the losses form a
very small component of income, as shown in Appendix A.
The income tax structure has marginal tax rates kit and thresholds kia for 1,...,k K ,
where kit applies between kia and 1,k ia (with 1,K ia ).7 In addition, as mentioned
above, separate rates are imposed at the central and regional government levels,
although the income thresholds are common. Letting superscripts C and R refer to
central and regional rates respectively:
C Rki ki kit t t (2)
For a multi-step tax structure with K steps, 0T x for 0 10a x a ,
1 1T x t x a for 1 2a x a , and 1 2 1 2 2T x t a a t x a for 2 3a x a ,
and so on. Then in general, if 1k ka x a , Creedy and Gemmell (2006, p. 25) show
that:
'k kT x t x a (3)
where:
11
1'
k
k j j jjk
a a t tt
(4)
Hence in the present context, if 1,ki hi k ia x a , unit h is in the kth tax bracket for
source i and the following expressions describe income taxation at central and
regional levels.
1, 'C C Ci hi ki hi k i kih hi kihT y a x a t x a (5)
1, 'R R Ri hi ki hi k i kih hi kihT y a x a t x a (6)
6 This creates a tax asymmetry similar to that associated with corporation taxation, where its role is
much more significant. 7 From 2007, there is an exception in that Madrid has a slightly different tax structure from that of the
other regions. This minor difference is neglected here.

7
The terms 'Ckia and 'Rkia are the corresponding thresholds such that tax liability in a
multi-threshold tax structure can be expressed in terms of an equivalent single-rate
structure. In writing the expressions (5) and (6) the marginal tax rate terms, t, along
with the effective thresholds, 'a , need the h subscripts, in order to clarify the point
that the tax rates and thresholds indicated are those that apply to the tax unit in
question, depending on the tax bracket into which the unit falls.
In addition, there are central and regional government non-refundable tax credits of
CC and RC . Total tax paid by unit h is expressed as:
1 1
( ) max 0 , ( ) max 0 , ( )I I
C Rhi i hi C i hi R
i i i
T y T y C T y C
(7)
In addition, there are refundable tax credits, unrelated to income. However, it is
argued that such refundable credits, since they can in principle be administered by a
separate authority and their cost is unrelated to the income tax structure, should not
be included where – as here – emphasis is on the revenue elasticity from the point of
view of revenue growth and fiscal drag. This issue is discussed further in Appendix
B.
The existence of non-refundable tax credits means that several cases must be
distinguished. These are discussed in the following subsection.
2.2 Special Cases
Consider the most common situation where tax unit h is such that 1
IC
i hi Ci
T y C
and 1
IR
i hi Ri
T y C
. The expression given in (7) above for tax liability is thus
simplified to:
1
( ) ( ) ( )I
C Rhi i hi i hi R C
i i
T y T y T y C C
(8)
and:
1
( ) ( ' ' )I
C C R Rhi kih hi kih kih kih kih R C
i i
T y t x t a t a C C
(9)
Furthermore, where 0hix this becomes:

8
1
( ) ( ' ' )I
C C R Rhi kih hi hi hi kih kih kih kih R C
i i
T y t y E A t a t a C C
(10)
A further simplification is available in view of the fact that the central and regional
income thresholds are the same. Using the above expression for 'ka , it can be shown
that:
1,1
' 'ihk
C C R Rkih kih kih kih ji ji j i
j
t a t a a t t
(11)
If, alternatively, 1
IC
i hi Ci
T y C
but 1
IR
i hi Ri
T y C
, tax liability is thus:
1
( ) ( )I
Chi i hi C
i i
T y T y C
(12)
and if 0hix this becomes:
1
( ) ( ' )I
C C Chi kih hi hi hi kih kih C
i i
T y t y E A t a C
(13)
with 1,1
'k
C C C Cki ki ji ji j i
j
t a a t t
. Similarly, if 1
IC
i hi Ci
T y C
but 1
IR
i hi Ri
T y C
,
the above expressions apply with C replaced by R.
3 Individual Revenue Elasticities
This section considers the tax revenue elasticity, measuring the extent to which tax
revenue increases when gross income increases, at the level of the tax unit.
Consider the effect on tax paid by a tax unit of a small increase in gross income,
arising from changes in each of the sources, which does not take the unit into a higher
tax bracket.8 First, define ( )hi hi
T y T as the total tax paid by the unit.
Furthermore, define h hii
y y as total gross income from all sources.
The change in tax paid by the unit when total gross income changes is given by:
8 It is common not to allow for such transitions when using analytical expressions. However, when
using a simulation approach which actually computes discrete income and tax changes, considerable
care is needed because very large individual values, for a very small number of units, can distort the
aggregate results.

9
1
Ih h hi
ih hi h
dT T y
dy y y
(14)
Hence:
1
Ih h hi h h hi
ih h h hi hi h
y dT y T y y
T dy T y y y
(15)
In general denote the elasticity of A with respect to B using the notation ,A B . Thus:
, , ,1
h h h hi hi h
I
T y T y y yi
(16)
The elasticity of total tax paid by unit h therefore depends on the way in which the
individual components of income change when the unit’s total gross income changes,
determined by ,hi hy y .
Consider the component elasticity ,h hiT y . Here it is not possible to obtain a
component elasticity defined in terms of the revenue from a single source, because
the non-refundable tax credits are related to total income tax rather than its
components. If it were possible to distinguish revenue from each source, as for
example hiT , the elasticity ,h hT y could be expressed as a tax-share ( /hi hT T ) weighted
sum of the product of individual elasticities ,hi hiT y and ,hi hy y .
For those with positive taxable incomes in excess of the tax credits, and supposing
that eligible expenditures and allowances change when income from source q
changes:
1 hq hqhkqh
hq hq hq
E ATt
y y y
(17)
This can be rewritten:
, 1h hq
hq kqh hq hq hqhT y
h hq h hq hq
y t y E AT
T y T y y
(18)
The ratio /h hqT y is the total tax paid by unit h as a proportion of h’s income from
source q, which may be denoted by 'hqATR : the prime is added here as it is not the
averate rate associated with source q. It can thus be interpreted as a kind of average
10
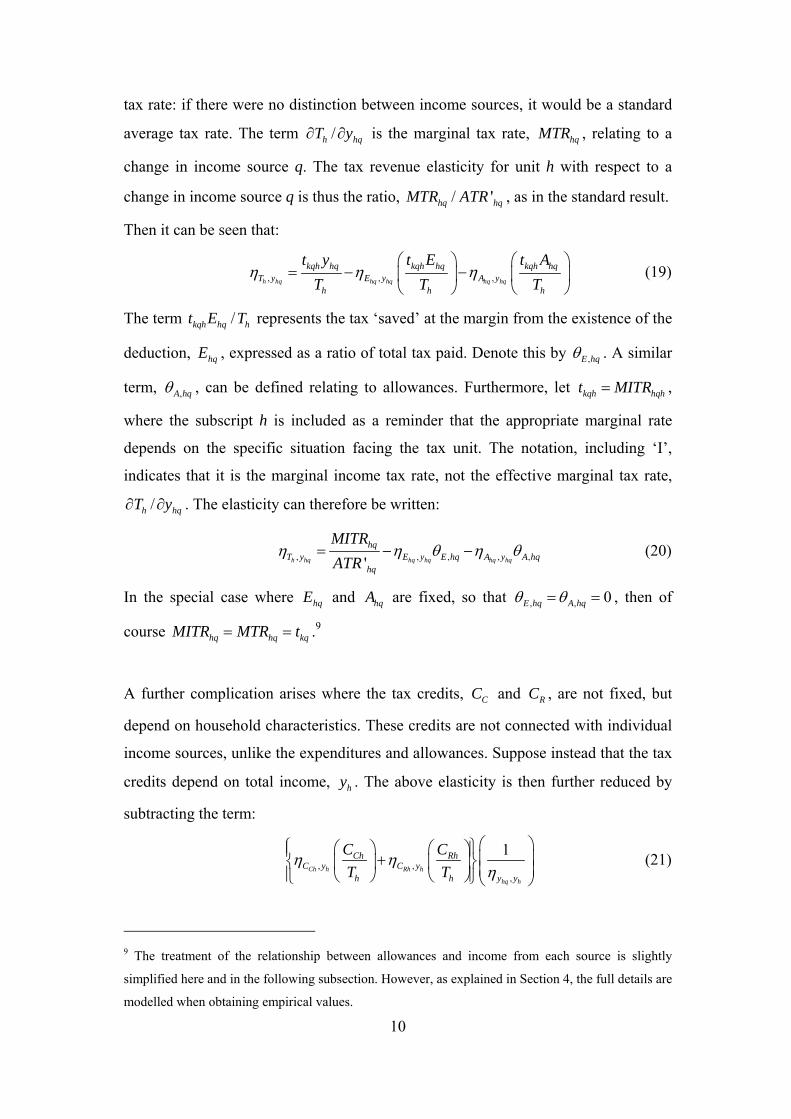
tax rate: if there were no distinction between income sources, it would be a standard
average tax rate. The term /h hqT y is the marginal tax rate, hqMTR , relating to a
change in income source q. The tax revenue elasticity for unit h with respect to a
change in income source q is thus the ratio, / 'hq hqMTR ATR , as in the standard result.
Then it can be seen that:
, , ,h hq hq hq hq hq
kqh hq kqh hq kqh hqT y E y A y
h h h
t y t E t A
T T T
(19)
The term /kqh hq ht E T represents the tax ‘saved’ at the margin from the existence of the
deduction, hqE , expressed as a ratio of total tax paid. Denote this by ,E hq . A similar
term, ,A hq , can be defined relating to allowances. Furthermore, let kqh hqht MITR ,
where the subscript h is included as a reminder that the appropriate marginal rate
depends on the specific situation facing the tax unit. The notation, including ‘I’,
indicates that it is the marginal income tax rate, not the effective marginal tax rate,
/h hqT y . The elasticity can therefore be written:
, , , , ,'h hq hq hq hq hq
hqT y E y E hq A y A hq
hq
MITR
ATR (20)
In the special case where hqE and hqA are fixed, so that , , 0E hq A hq , then of
course hq hq kqMITR MTR t .9
A further complication arises where the tax credits, CC and RC , are not fixed, but
depend on household characteristics. These credits are not connected with individual
income sources, unlike the expenditures and allowances. Suppose instead that the tax
credits depend on total income, hy . The above elasticity is then further reduced by
subtracting the term:
, ,,
1Ch h Rh h
hq h
Ch RhC y C y
h h y y
C C
T T
(21)
9 The treatment of the relationship between allowances and income from each source is slightly
simplified here and in the following subsection. However, as explained in Section 4, the full details are
modelled when obtaining empirical values.
11
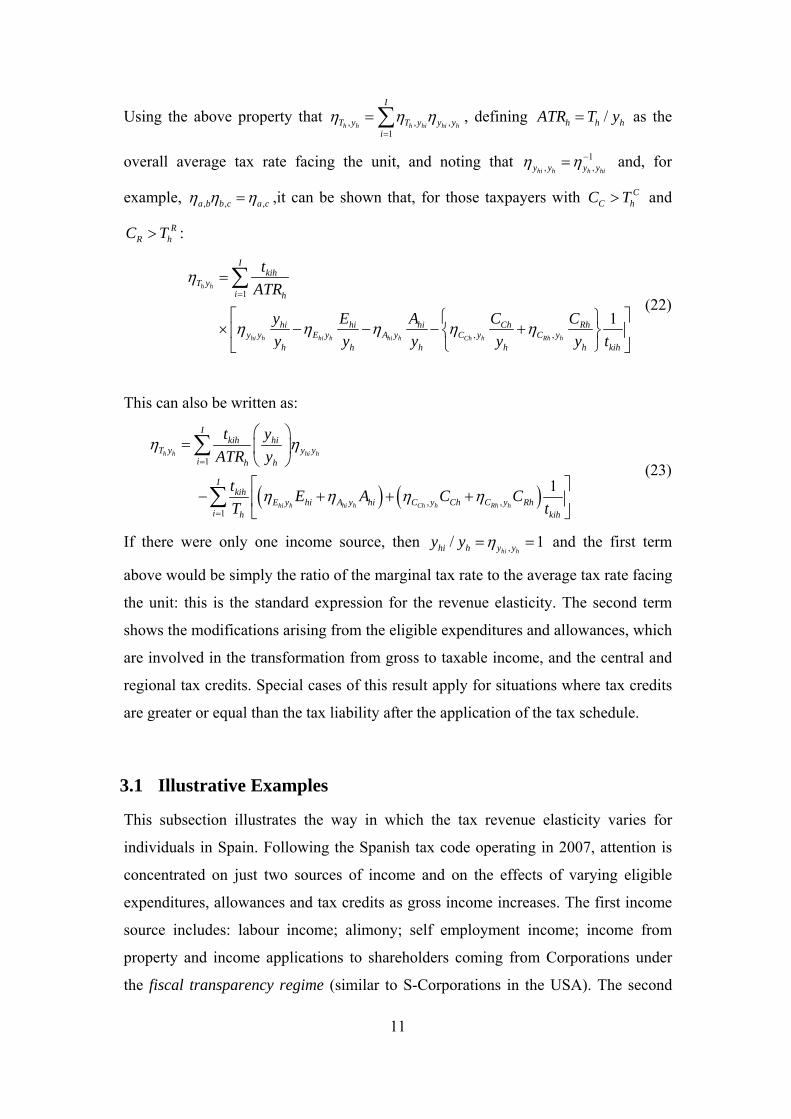
Using the above property that , , ,1
h h h hi hi h
I
T y T y y yi
, defining /h h hATR T y as the
overall average tax rate facing the unit, and noting that 1, ,hi h h hiy y y y and, for
example, , , ,a b b c a c ,it can be shown that, for those taxpayers with CC hC T and
RR hC T :
1
, ,
1
h h
hi h hi h hi h Ch h Rh h
Ikih
T yi h
hi hi hi Ch Rhy y E y A y C y C y
h h h h h kih
t
ATR
y E A C C
y y y y y t
(22)
This can also be written as:
1
, ,1
1
h h hi h
hi h hi h Ch h Rh h
Ikih hi
T y y yi h h
Ikih
E y hi A y hi C y Ch C y Rhi h kih
t y
ATR y
tE A C C
T t
(23)
If there were only one income source, then ,/ 1hi hhi h y yy y and the first term
above would be simply the ratio of the marginal tax rate to the average tax rate facing
the unit: this is the standard expression for the revenue elasticity. The second term
shows the modifications arising from the eligible expenditures and allowances, which
are involved in the transformation from gross to taxable income, and the central and
regional tax credits. Special cases of this result apply for situations where tax credits
are greater or equal than the tax liability after the application of the tax schedule.
3.1 Illustrative Examples
This subsection illustrates the way in which the tax revenue elasticity varies for
individuals in Spain. Following the Spanish tax code operating in 2007, attention is
concentrated on just two sources of income and on the effects of varying eligible
expenditures, allowances and tax credits as gross income increases. The first income
source includes: labour income; alimony; self employment income; income from
property and income applications to shareholders coming from Corporations under
the fiscal transparency regime (similar to S-Corporations in the USA). The second

12
income source includes: capital gains and any form of income derived from financial
savings such as interest rates from bank accounts and deposits, share dividends, bond
interest or any other type of yield earned from debt saving instruments. Incomes
include both monetary compensations and fringe benefits.
The allowable tax deductions, E , are income related specific deductions which
generally include a shortlist of necessary expenditures incurred in order to earn the
relevant income. Good examples of this are the employee Social Security
contributions and union membership fees for labour income, loan interest payments,
maintenance costs or economic depreciation in the case of property income, or a
restricted list of some operating expenses from savings or entrepreneurship. Together
with this, E entails the existence of a fixed labour-specific tax deduction of 4,000 €
for earnings less than or equal to 9,000 €. Notwithstanding, this tax deduction turns
out to be income-decreasing for earnings between 9,000 € and 13,000 € and
becoming fixed again at a reduced amount of 2,600 € for earnings of 13,000 € and
above.
Allowances, A , incorporate non-specific tax allowances and deductions. This
includes paid palimony, contributions to Pension Schemes and personal and family
allowances. Examples of the latter are the allowances recognized for special
circumstances such as age, disability or the existence of dependants (ancestors and/or
descendants). These non-specific income allowances are normally capped and
present some limitations for its application in terms of the taxpayer’s income level
and type of income. Finally, tax credits include all non-refundable tax relief enjoyed
by the taxpayers in order to compute the final tax due after applying the tax
schedules. For a detailed description of the specific quantities applied in year 2007
see Agencia Tributaria (2008), and for an evolution of all these concepts through
time in the Spanish case, see Romero and Sanz-Sanz (2007).
The marginal rates and thresholds for the first income source are shown in Table 1.
For the second source, tax is paid at fixed central and regional (marginal and average)
rates of 0.111 and 0.069.
13
Table 1 Tax Structure for Income Source 1
Income Threshold (€s)
Central Govt MTR
Regional Govt MTR
Total MTR
0 0.1566 0.0834 0.24 17,360 0.1827 0.0973 0.28 32,360 0.2414 0.1286 0.37 52,360 0.2713 0.1587 0.43
Four different cases, for parameters listed in Table 2, are illustrated. In each case a
fixed ratio of income from the two sources is assumed, whereby source two is 10 per
cent of source one. Case 1 takes the (unrealistic) extreme of fixed eligible expenses,
allowances and credits. The following cases gradually introduce elasticities, assumed
to be constant, so that Case 4 allows all deductions and credits to vary as income
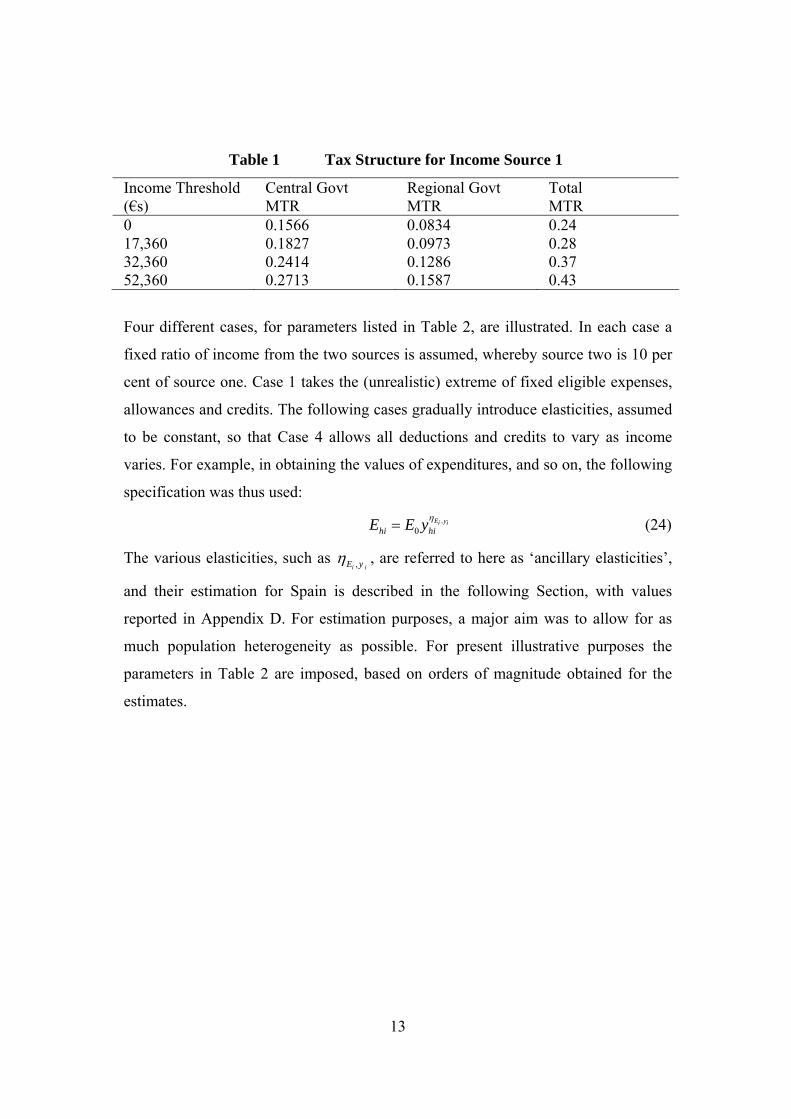
varies. For example, in obtaining the values of expenditures, and so on, the following
specification was thus used:
,
0E yi i
hi hiE E y (24)
The various elasticities, such as ,i iE y , are referred to here as ‘ancillary elasticities’,
and their estimation for Spain is described in the following Section, with values
reported in Appendix D. For estimation purposes, a major aim was to allow for as
much population heterogeneity as possible. For present illustrative purposes the
parameters in Table 2 are imposed, based on orders of magnitude obtained for the
estimates.
14
Table 2 Alternative Parameters for Four Cases
Case 1 Case 2 Case 3 Case 4 Source 1 E0 3500 98 98 98 Elasticity 0 0.4 0.4 0.4 A0 5000 5000 7000 7000 Elasticity 0 0 0.005 0.005 Source 2 E0 35 0.3 0.3 0.3 Elasticity 0 0.8 0.8 0.8 A0 5000 5000 4750 4750 Elasticity 0 0 0.05 0.05 Credits CC0 1200 1200 1200 800 Elasticity 0 0 0 0.05 CR0 550 550 550 13 Elasticity 0 0 0 0.4
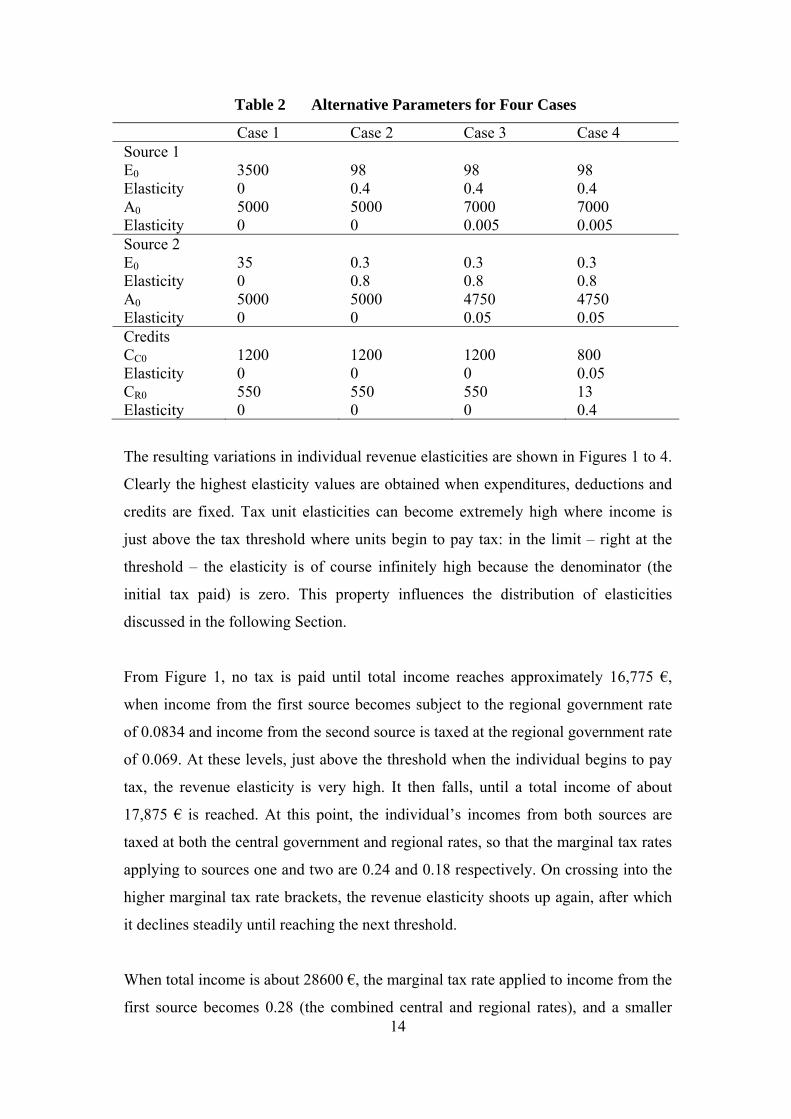
The resulting variations in individual revenue elasticities are shown in Figures 1 to 4.
Clearly the highest elasticity values are obtained when expenditures, deductions and
credits are fixed. Tax unit elasticities can become extremely high where income is
just above the tax threshold where units begin to pay tax: in the limit – right at the
threshold – the elasticity is of course infinitely high because the denominator (the
initial tax paid) is zero. This property influences the distribution of elasticities
discussed in the following Section.
From Figure 1, no tax is paid until total income reaches approximately 16,775 €,
when income from the first source becomes subject to the regional government rate
of 0.0834 and income from the second source is taxed at the regional government rate
of 0.069. At these levels, just above the threshold when the individual begins to pay
tax, the revenue elasticity is very high. It then falls, until a total income of about
17,875 € is reached. At this point, the individual’s incomes from both sources are
taxed at both the central government and regional rates, so that the marginal tax rates
applying to sources one and two are 0.24 and 0.18 respectively. On crossing into the
higher marginal tax rate brackets, the revenue elasticity shoots up again, after which
it declines steadily until reaching the next threshold.
When total income is about 28600 €, the marginal tax rate applied to income from the
first source becomes 0.28 (the combined central and regional rates), and a smaller
15
jump in the revenue elasticity is observed. The next income threshold is about 45,100
€ when income from the first source begins to be taxed at a combined rate of 0.37.
The effect is that the pattern of revenue elasticities displays the familiar ‘saw tooth’
pattern.
Figure 1 Variation in Individual Revenue Elasticity with Total Gross
Income: Case 1
0
5
10
15
20
25
30
35
40
45
50
110
0
385
0
660
0
935
0
121
00
148
50
176
00
203
50
231
00
258
50
286
00
313
50
341
00
368
50
396
00
423
50
451
00
478
50
506
00
533
50
561
00
588
50
y
η
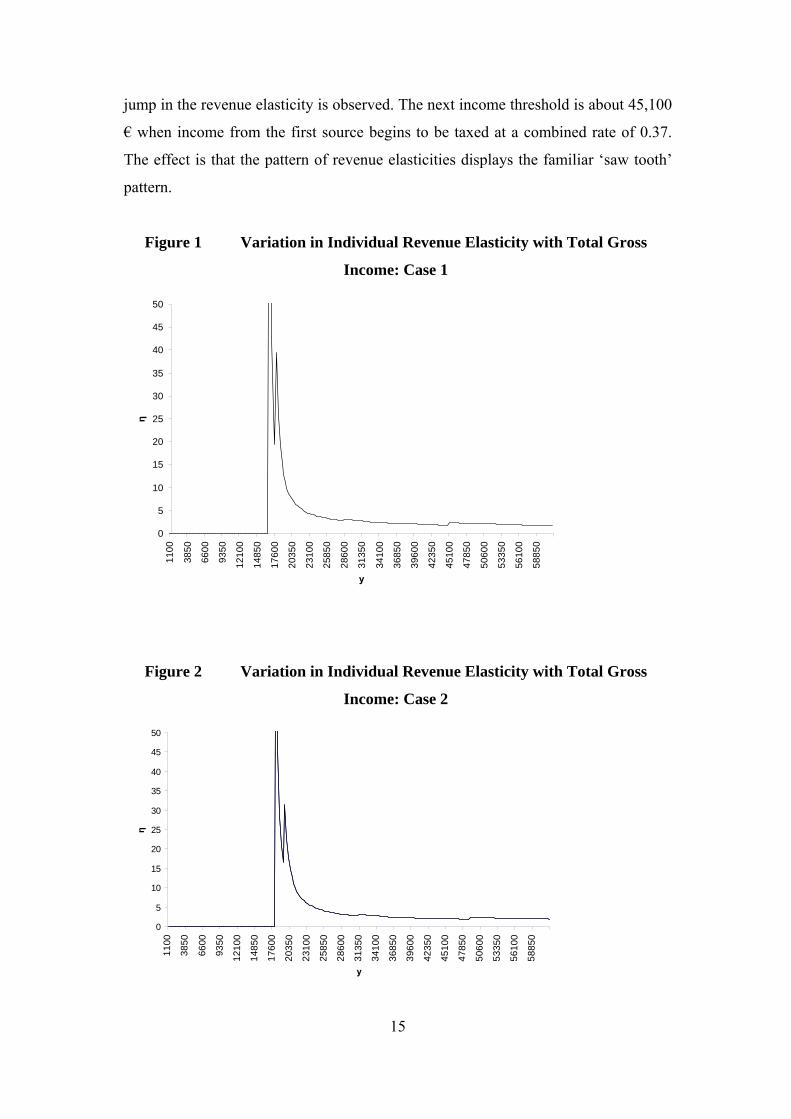
Figure 2 Variation in Individual Revenue Elasticity with Total Gross
Income: Case 2
0
5
10
15
20
25
30
35
40
45
50
11
00
38
50
66
00
93
50
12
10
0
14
85
0
17
60
0
20
35
0
23
10
0
25
85
0
28
60
0
31
35
0
34
10
0
36
85
0
39
60
0
42
35
0
45
10
0
47
85
0
50
60
0
53
35
0
56
10
0
58
85
0
y
η
16
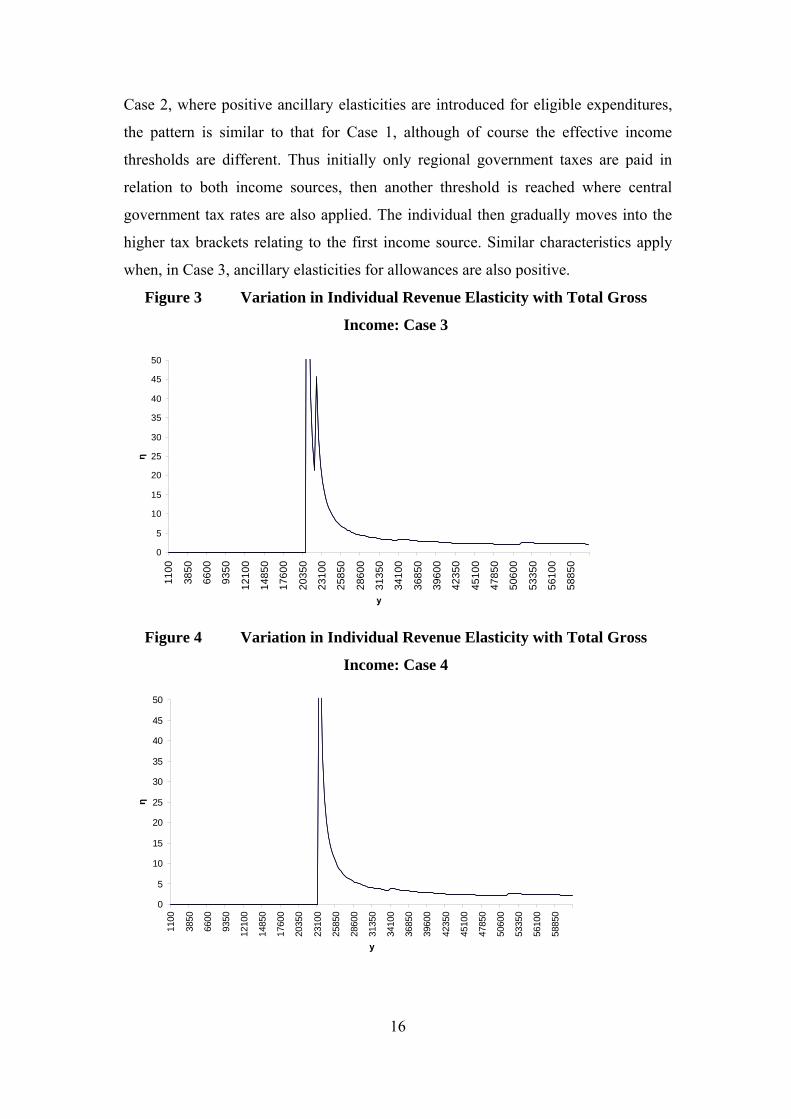
Case 2, where positive ancillary elasticities are introduced for eligible expenditures,
the pattern is similar to that for Case 1, although of course the effective income
thresholds are different. Thus initially only regional government taxes are paid in
relation to both income sources, then another threshold is reached where central
government tax rates are also applied. The individual then gradually moves into the
higher tax brackets relating to the first income source. Similar characteristics apply
when, in Case 3, ancillary elasticities for allowances are also positive.
Figure 3 Variation in Individual Revenue Elasticity with Total Gross
Income: Case 3
0
5
10
15
20
25
30
35
40
45
50
110
0
385
0
660
0
935
0
121
00
148
50
176
00
203
50
231
00
258
50
286
00
313
50
341
00
368
50
396
00
423
50
451
00
478
50
506
00
533
50
561
00
588
50
y
η
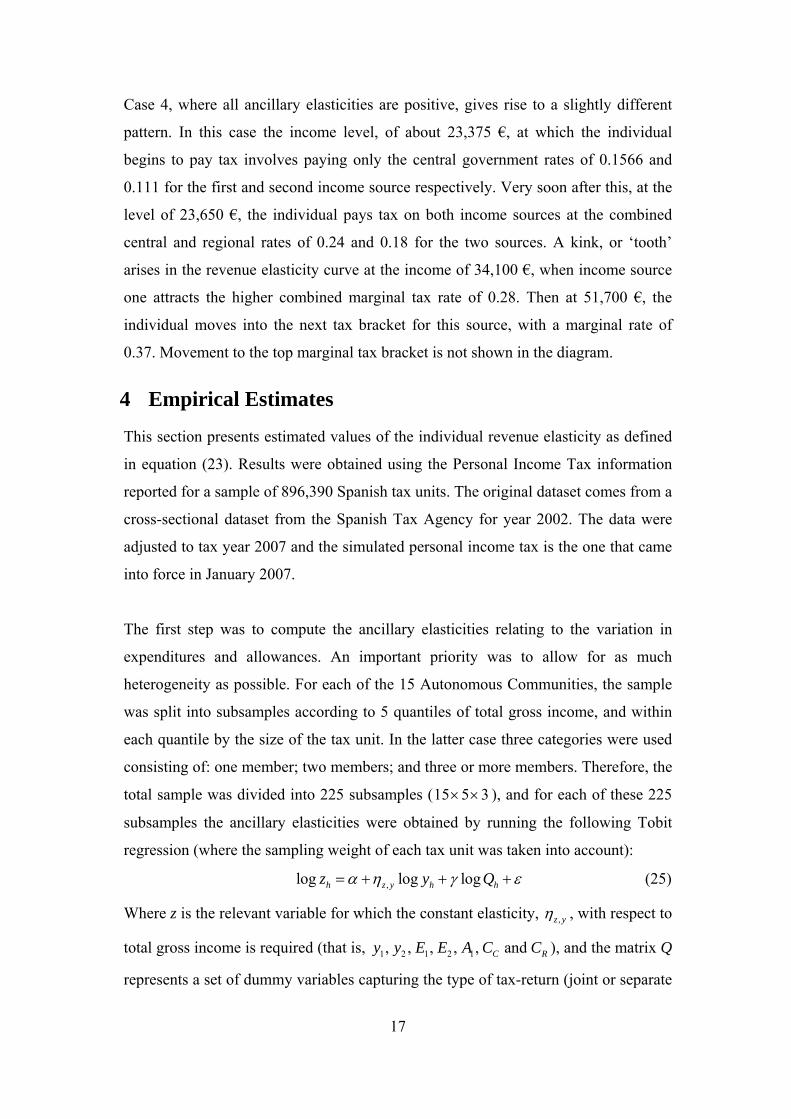
Figure 4 Variation in Individual Revenue Elasticity with Total Gross
Income: Case 4
0
5
10
15
20
25
30
35
40
45
50
1100
3850
6600
9350
1210
0
1485
0
1760
0
2035
0
2310
0
2585
0
2860
0
3135
0
3410
0
3685
0
3960
0
4235
0
4510
0
4785
0
5060
0
5335
0
5610
0
5885
0
y
η
17
Case 4, where all ancillary elasticities are positive, gives rise to a slightly different
pattern. In this case the income level, of about 23,375 €, at which the individual
begins to pay tax involves paying only the central government rates of 0.1566 and
0.111 for the first and second income source respectively. Very soon after this, at the
level of 23,650 €, the individual pays tax on both income sources at the combined
central and regional rates of 0.24 and 0.18 for the two sources. A kink, or ‘tooth’
arises in the revenue elasticity curve at the income of 34,100 €, when income source
one attracts the higher combined marginal tax rate of 0.28. Then at 51,700 €, the
individual moves into the next tax bracket for this source, with a marginal rate of
0.37. Movement to the top marginal tax bracket is not shown in the diagram.
4 Empirical Estimates
This section presents estimated values of the individual revenue elasticity as defined
in equation (23). Results were obtained using the Personal Income Tax information
reported for a sample of 896,390 Spanish tax units. The original dataset comes from a
cross-sectional dataset from the Spanish Tax Agency for year 2002. The data were
adjusted to tax year 2007 and the simulated personal income tax is the one that came
into force in January 2007.
The first step was to compute the ancillary elasticities relating to the variation in
expenditures and allowances. An important priority was to allow for as much
heterogeneity as possible. For each of the 15 Autonomous Communities, the sample
was split into subsamples according to 5 quantiles of total gross income, and within
each quantile by the size of the tax unit. In the latter case three categories were used
consisting of: one member; two members; and three or more members. Therefore, the
total sample was divided into 225 subsamples (15 5 3 ), and for each of these 225
subsamples the ancillary elasticities were obtained by running the following Tobit
regression (where the sampling weight of each tax unit was taken into account):
,log log logh z y h hz y Q (25)
Where z is the relevant variable for which the constant elasticity, ,z y , with respect to
total gross income is required (that is, 1 2 1 2 1, , , , , andC Ry y E E A C C ), and the matrix Q
represents a set of dummy variables capturing the type of tax-return (joint or separate

18
filing), marital status (four categories) and type of main source of income (three
categories).
As a consequence of the procedure described above 1,575 estimations were run
(seven ancillary elasticities for each of the 225 subgroups). The tables in Appendix D
report the ancillary elasticities for each region according to the quantile and the size
of the tax unit. These Tables report the required elasticities as long as they are
statistically significant at a significance level of 5 per cent – otherwise a zero is
reported.
For the case of 2 hA y the procedure was slightly different, as follows. The values of
2A are positive only if the magnitude of 1A has not been entirely absorbed by the
first income source 1y . In those cases, the excess of 1A can be transferred as an
allowance to reduce the second source of income 2y . Thus 2A is positive only for
tax units for whom 1y is sufficiently small not to absorb all its entitled 1A . In other
words, tax units which are rich in income from source 1 will not enjoy any transfer
and as a result they will have 02 A . This fact is confirmed by the basic data as can
be seen in the tables reported in Appendix D, which report the magnitude of 2A by
quantiles of 1y .
As a result, the ancillary elasticity 2 hA y was calculated following the same procedure
as for the other ancillary elasticities, but using the quintiles of 1y instead of hy .
Specifically, 2A exists only for the first two quintiles of 1y and mainly in the first
one, so that the elasticity is reported in greater detailed for the first quintile (divided
into three household sizes) whereas the rest of the tabulated quintiles are taken
together without discriminating by household size. As can be seen, 2 hA y is zero for
the last 4 quintiles of 1y and negative for the first quintile regardless of household
size and region. There are three exceptions: Andalucia; Castilla y León; and Cataluña
present a strong positive elasticity for the second quintile.
19
To compute the remaining terms in equation (23) for each tax unit, the 2007 tax
structure was applied to each tax unit in the sample. For each tax unit the appropriate
values of 1y , 2y , ty , 1A , 2A , CC , rC and the marginal tax rates levied on each
income source, kiht , as well as the weighted total marginal tax rate, 1 21 2k h k h
h h
y yt t
y y ,
and the average tax rate ( ATR ). The last segment of Appendix C reports some basic
statistics for relevant variables, both for the whole country and for each of the
Autonomous Communities (regions).
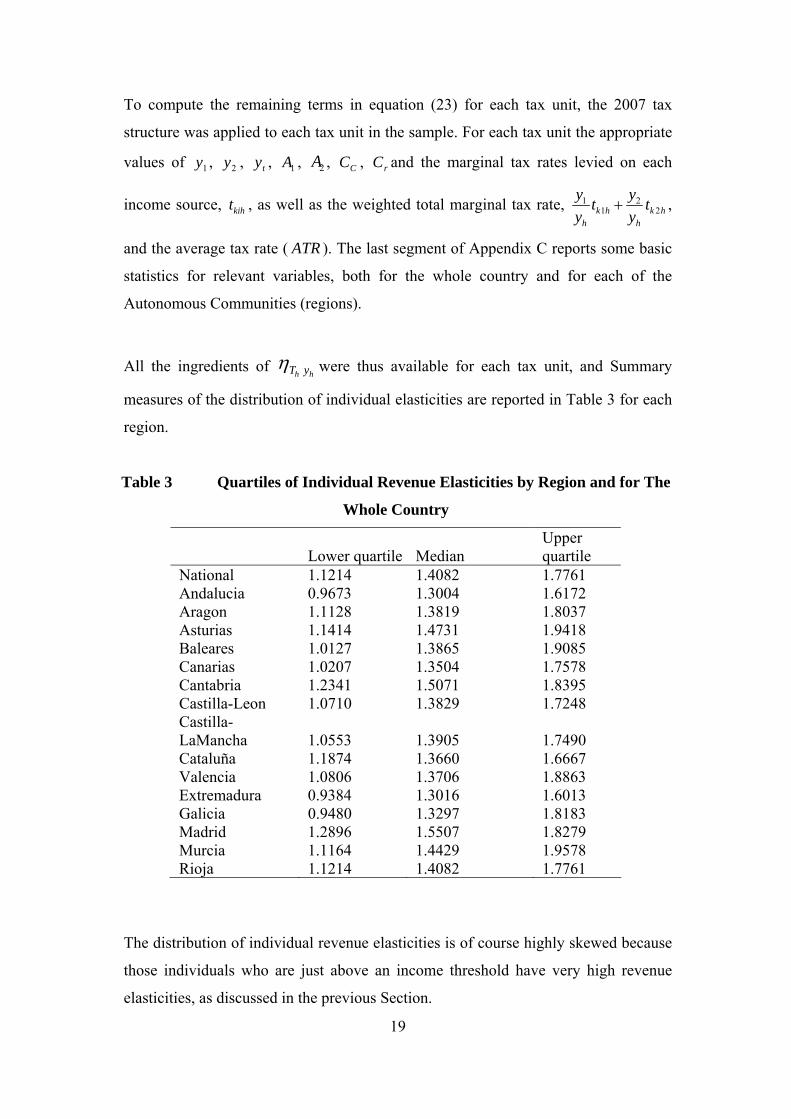
All the ingredients of hh yT were thus available for each tax unit, and Summary
measures of the distribution of individual elasticities are reported in Table 3 for each
region.
Table 3 Quartiles of Individual Revenue Elasticities by Region and for The
Whole Country
Lower quartile Median Upper quartile
National 1.1214 1.4082 1.7761 Andalucia 0.9673 1.3004 1.6172 Aragon 1.1128 1.3819 1.8037 Asturias 1.1414 1.4731 1.9418 Baleares 1.0127 1.3865 1.9085 Canarias 1.0207 1.3504 1.7578 Cantabria 1.2341 1.5071 1.8395 Castilla-Leon 1.0710 1.3829 1.7248 Castilla-LaMancha 1.0553 1.3905 1.7490 Cataluña 1.1874 1.3660 1.6667 Valencia 1.0806 1.3706 1.8863 Extremadura 0.9384 1.3016 1.6013 Galicia 0.9480 1.3297 1.8183 Madrid 1.2896 1.5507 1.8279 Murcia 1.1164 1.4429 1.9578 Rioja 1.1214 1.4082 1.7761
The distribution of individual revenue elasticities is of course highly skewed because
those individuals who are just above an income threshold have very high revenue
elasticities, as discussed in the previous Section.
20
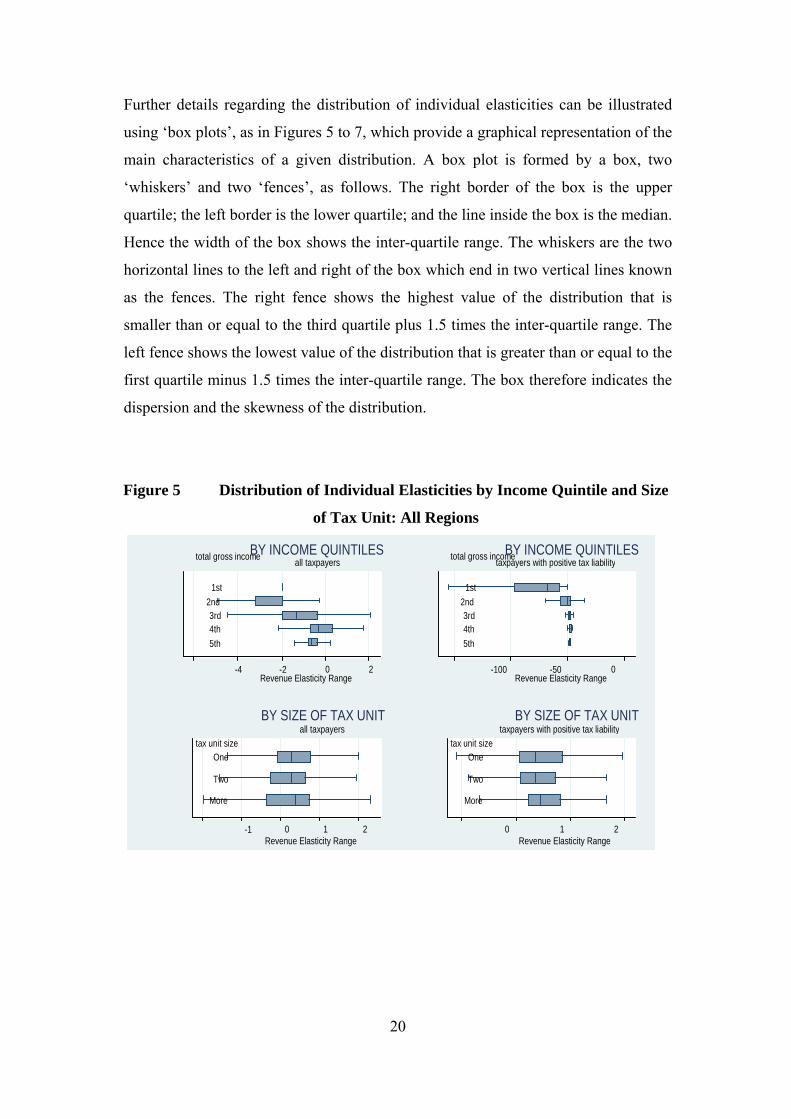
Further details regarding the distribution of individual elasticities can be illustrated
using ‘box plots’, as in Figures 5 to 7, which provide a graphical representation of the
main characteristics of a given distribution. A box plot is formed by a box, two
‘whiskers’ and two ‘fences’, as follows. The right border of the box is the upper
quartile; the left border is the lower quartile; and the line inside the box is the median.
Hence the width of the box shows the inter-quartile range. The whiskers are the two
horizontal lines to the left and right of the box which end in two vertical lines known
as the fences. The right fence shows the highest value of the distribution that is
smaller than or equal to the third quartile plus 1.5 times the inter-quartile range. The
left fence shows the lowest value of the distribution that is greater than or equal to the
first quartile minus 1.5 times the inter-quartile range. The box therefore indicates the
dispersion and the skewness of the distribution.
Figure 5 Distribution of Individual Elasticities by Income Quintile and Size
of Tax Unit: All Regions
-4 -2 0 2 4
5th
4th3rd
2nd 1st
total gross income
Revenue Elasticity Range
all taxpayersBY INCOME QUINTILES
-100 -50 0 5th
4th3rd
2nd
1st
total gross income
Revenue Elasticity Range
taxpayers with positive tax liabilityBY INCOME QUINTILES
-1 0 1 2 3
More
Two One
tax unit size
Revenue Elasticity Range
all taxpayersBY SIZE OF TAX UNIT
0 1 2
More
Two
One
tax unit size
Revenue Elasticity Range
taxpayers with positive tax liabilityBY SIZE OF TAX UNIT
21
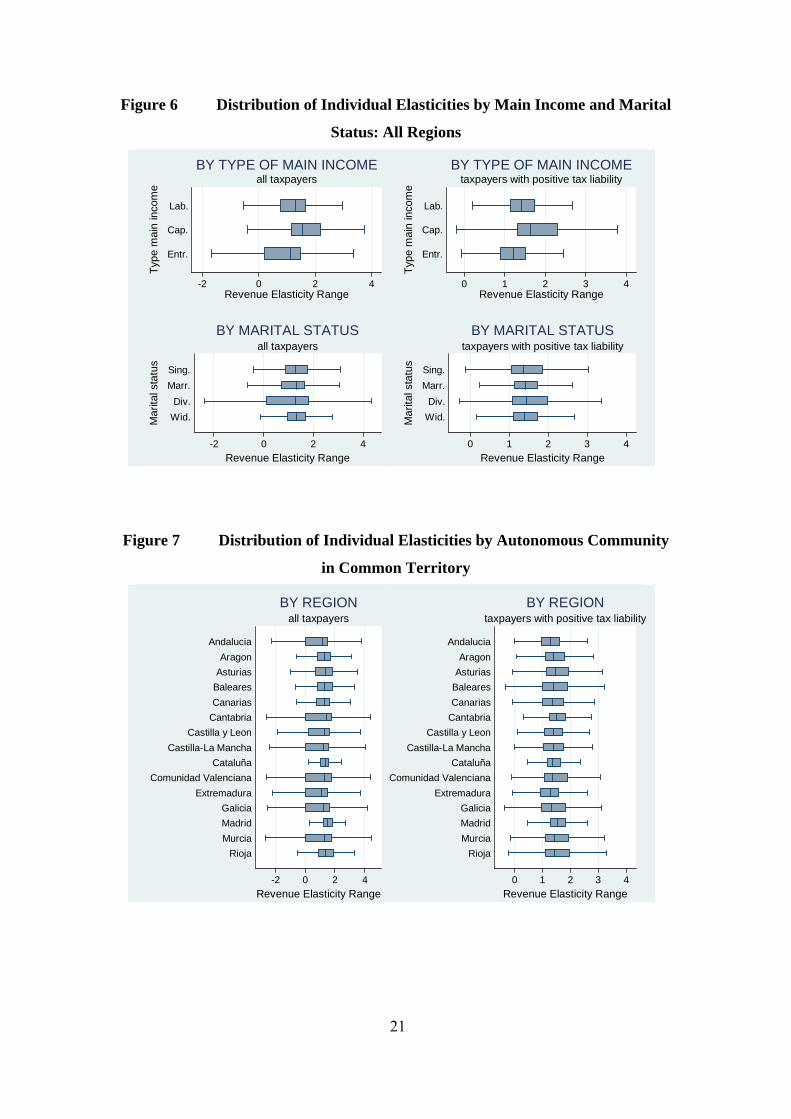
Figure 6 Distribution of Individual Elasticities by Main Income and Marital
Status: All Regions
-2 0 2 4
Entr.
Cap.
Lab.
Typ
e m
ain
inco
me
Revenue Elasticity Range
all taxpayersBY TYPE OF MAIN INCOME
0 1 2 3 4
Entr.
Cap.
Lab.
Typ
e m
ain
inco
me
Revenue Elasticity Range
taxpayers with positive tax liabilityBY TYPE OF MAIN INCOME
-2 0 2 4
Wid.
Div.
Marr.
Sing.
Ma
rita
l sta
tus
Revenue Elasticity Range
all taxpayersBY MARITAL STATUS
0 1 2 3 4
Wid.
Div.
Marr.
Sing.
Ma
rita
l sta
tus
Revenue Elasticity Range
taxpayers with positive tax liabilityBY MARITAL STATUS
Figure 7 Distribution of Individual Elasticities by Autonomous Community
in Common Territory
-2 0 2 4
Rioja
Murcia
Madrid
Galicia
Extremadura
Comunidad Valenciana
Cataluña
Castilla-La Mancha
Castilla y Leon
Cantabria
Canarias
Baleares
Asturias
Aragon
Andalucia
Revenue Elasticity Range
all taxpayersBY REGION
0 1 2 3 4
Rioja
Murcia
Madrid
Galicia
Extremadura
Comunidad Valenciana
Cataluña
Castilla-La Mancha
Castilla y Leon
Cantabria
Canarias
Baleares
Asturias
Aragon
Andalucia
Revenue Elasticity Range
taxpayers with positive tax liabilityBY REGION

22
The boxes on the left hand side of each figure refer to all tax units, and thus include
all those with a zero tax liability. When the elasticities are classified by income
quintiles, it can be seen that there are nurerous negative elasticities, many of which
are large in absolute terms. These negative elasticities are associated mainly with tax
units who pay small amounts of personal income tax but have low incomes and
ancillary elasticities which are greater than unity; thus (some of) the eligible
expenditures, allowances and tax credits increase by more than gross income. The
dispersion is substantially affected by whether all tax units are included, or whether
attention is restricted to those who pay positive amounts of personal income tax.
There is little variation in the dispersion of individual revenue elasticities, classified
by tax unit size. Those whose main source of income is entrepreneurial income have
a lower dispersion when only taxpayers are included, compared with the population
of all tax units. This result is affected by the great ability of such tax units to claim
substantial amounts of eligible expenditure and allowances.
4.1 The Aggregate Revenue Elasticity
Consider next the aggregate tax revenue elasticity, over H tax units. Define
1
H
hh
Y y
and 1
H
hh
T T
as aggregate income and tax revenue respectively. Then:
1
Hh h h h
h h h h
dT Y T y y Y T
dY T y T Y y T
(26)
and:
, , ,1
h h h
Hh
T Y T y y Yh
T
T
(27)
The elasticity of aggregate revenue with respect to aggregate income is thus a tax-
share weighted average of the product of individual revenue elasticities and the
elasticity of individual income with respect to total income. Hence it depends not
only the tax structure but on the extent to which individual incomes change when
aggregate income changes. And, as shown above, the individual revenue elasticities
depend on the extent to which the components of individuals’ incomes change as
each individual’s income changes.
23
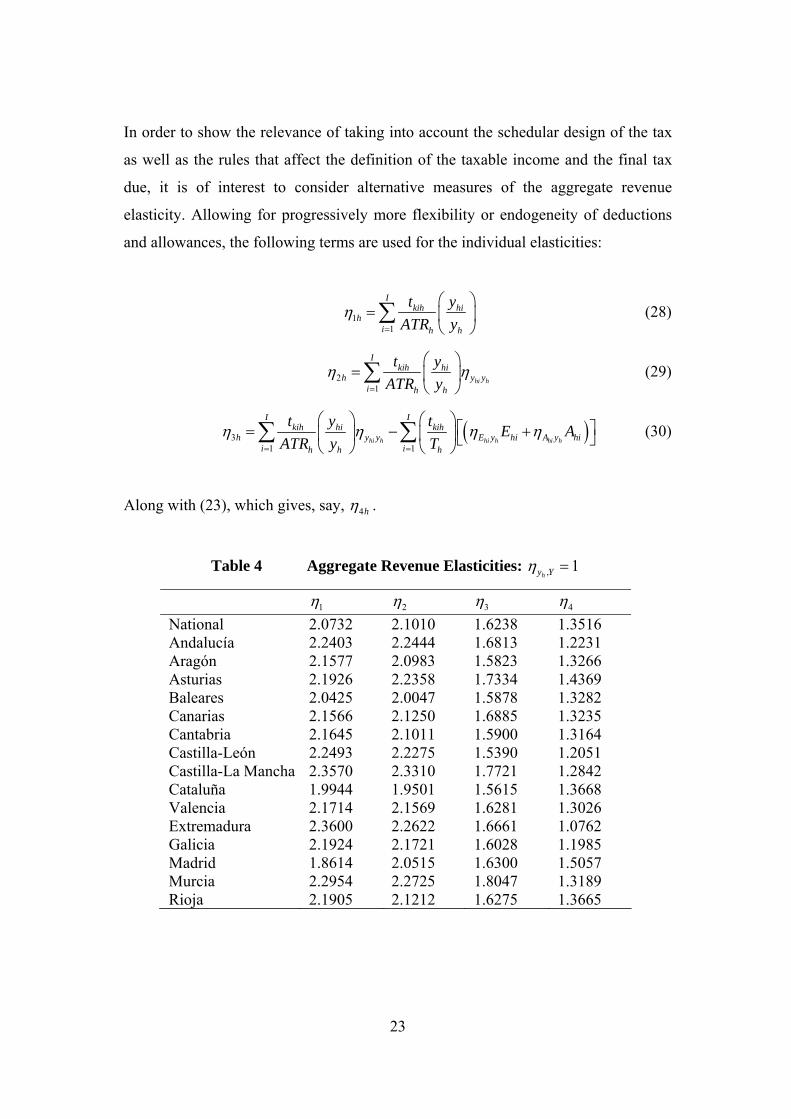
In order to show the relevance of taking into account the schedular design of the tax
as well as the rules that affect the definition of the taxable income and the final tax
due, it is of interest to consider alternative measures of the aggregate revenue
elasticity. Allowing for progressively more flexibility or endogeneity of deductions
and allowances, the following terms are used for the individual elasticities:
11
Ikih hi
hi h h
t y
ATR y
(28)
21
hi h
Ikih hi
h y yi h h
t y
ATR y
(29)
31 1
hi h hi h hi h
I Ikih hi kih
h y y E y hi A y hii ih h h
t y tE A
ATR y T
(30)
Along with (23), which gives, say, 4h .
Table 4 Aggregate Revenue Elasticities: , 1hy Y
1 2 3 4
National 2.0732 2.1010 1.6238 1.3516 Andalucía 2.2403 2.2444 1.6813 1.2231 Aragón 2.1577 2.0983 1.5823 1.3266 Asturias 2.1926 2.2358 1.7334 1.4369 Baleares 2.0425 2.0047 1.5878 1.3282 Canarias 2.1566 2.1250 1.6885 1.3235 Cantabria 2.1645 2.1011 1.5900 1.3164 Castilla-León 2.2493 2.2275 1.5390 1.2051 Castilla-La Mancha 2.3570 2.3310 1.7721 1.2842 Cataluña 1.9944 1.9501 1.5615 1.3668 Valencia 2.1714 2.1569 1.6281 1.3026 Extremadura 2.3600 2.2622 1.6661 1.0762 Galicia 2.1924 2.1721 1.6028 1.1985 Madrid 1.8614 2.0515 1.6300 1.5057 Murcia 2.2954 2.2725 1.8047 1.3189 Rioja 2.1905 2.1212 1.6275 1.3665

24
In obtaining results reported here, the assumption was made that ,hy Y is unity; that
is, all incomes move in the same proportion.The resulting aggregate elasticities are
shown in Table 4. The elasticity 1 assumes not only that all deductions and credits
are fixed irrespective of income, but that the two sources of income remain in fixed
proportions for all individuals. The second elasticity, 2 , uses information about the
(cross-sectional) variation in income proportions to attribute an elasticity ,hi hy y to
each tax unit’s income source. This has a relatively small effect on the revenue
elasticity estimates. Larger effects are observed where eligible expenditures and
deductions, and then tax credits, vary with tax unit income: in each case the
aggregate revenue elasticity falls when the ancillary elasticities are used.
The revenue elasticities in the final column of Table 4 vary from just over 1.0 to
about 1.5. The variation across regions arises from regional differences in gross
incomes, since all regions face similar tax structures.
In general, the aggregate values are similar to those reported for a number of other
countries. On the US, see Fries et al. (1982), Dye and McGuire (1991) and
Ram(1991). UK results are reported in Johnson and Lambert (1989) and Creedy and
Gemmell (2004a, 2006, pp. 113). Canadian estimates are given by King and
McMorran (2002)10, and for New Zealand see Creedy and Gemmell (2004b, 2006,
p.171). Lower elasticities of around 1, using time series methods, are given for
Turkey by Kuştepeli and Şapçi (2006).
In considering the revenue elasticities reported above, it should be remembered that
they relate to revenue changes associated with changes in gross incomes. Many
empirical studies actually begin not from gross income but from taxable income; that
is, measured income has already been adjusted for eligible expenditures and
allowances, so that the tax function can be applied directly as a function of taxable
income.
10 They found a large variation between 1994 and 1998 of between 1.8 and 2.9, but judged the
‘underlying’ value to be 1.4. For medium term revenue forecasting, they proposed values in the range
1 to 1.3.
25
In the case of a single income source, where x and y are, as above, taxable and gross
income, and tax paid is T x y , then the revenue elasticity is , , ,T y T x x y .
Furthermore, writing x y D , where D refers to all allowances and deductions, it
can be shown that:
1
, ,1 1x y D y
D D
y y
(31)
Where ,D y is the elasticity of deductions with respect to gross income. It is clear
from (33) that if , 1D y , then , 1x y and the revenue elasticity with respect to
gross income exceeds the revenue elasticity with respect to taxable income.
In the following Section, which turns to the modelling of aggregate tax revenue, it is
shown that a large simplification is possible when taking taxable income as the basis.
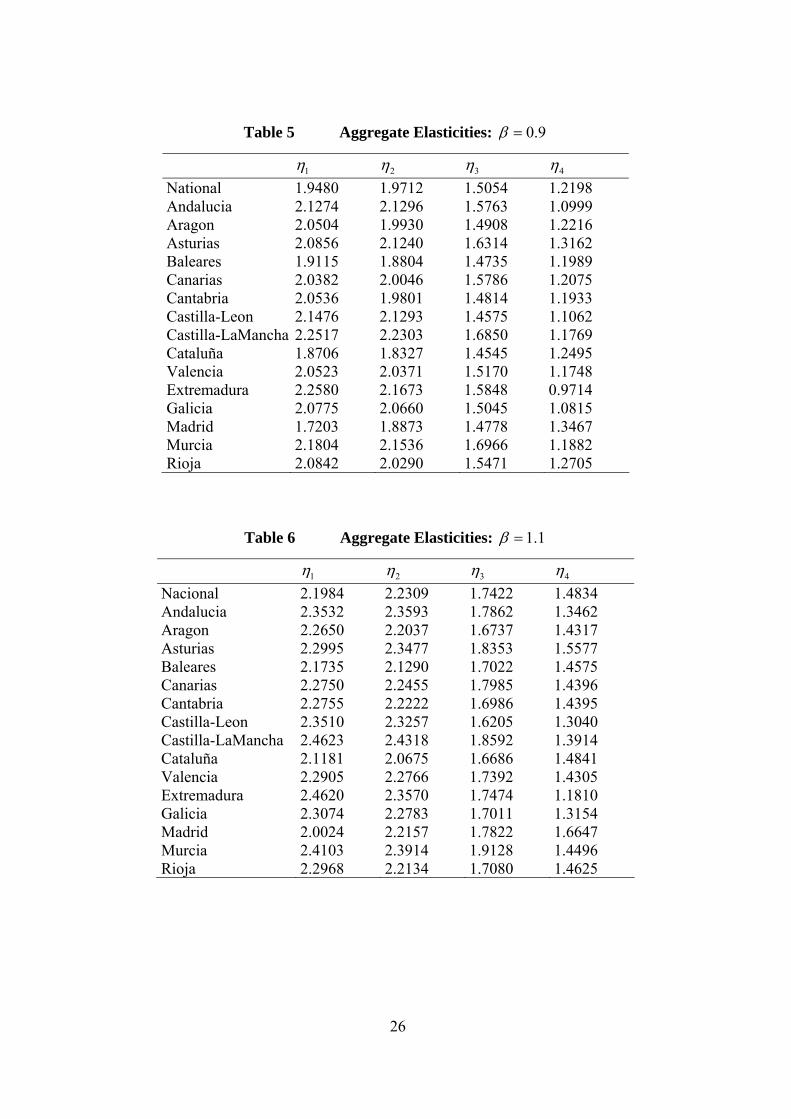
4.2 Income Dynamics
The above estimates, in common with most studies, are obtained on the assumption
that all incomes move together, so that ,hy Y is equal to unity. In the absence of direct
information on the dynamic process of relative income changes from year to year, it
is possible to consider the sensitivity of results to an assumed degree of regression
towards, or away from, the geometric mean. Following Creedy and Gemmell (2006),
suppose income dynamics can be described by the relationship:
, 1 1 log loghy Y hy E y (32)
where logE y is the mean log-income, or equivalently the logarithm of geometric
mean income. The coefficient, , therefore governs systematic movements within
the income distribution. If 1 there are systematic equalising relative movements
whereby those below the geometric mean income experience relative larger increases
than those above the geometric mean, when total income increases. A value of 1
implies systematic disequalising income movements.
The effects on aggregate revenue elasticities of differential income changes are
shown in Tables 5 and 6, which may be compared with Table 4.
26
Table 5 Aggregate Elasticities: 0.9
1 2 3 4
National 1.9480 1.9712 1.5054 1.2198 Andalucia 2.1274 2.1296 1.5763 1.0999 Aragon 2.0504 1.9930 1.4908 1.2216 Asturias 2.0856 2.1240 1.6314 1.3162 Baleares 1.9115 1.8804 1.4735 1.1989 Canarias 2.0382 2.0046 1.5786 1.2075 Cantabria 2.0536 1.9801 1.4814 1.1933 Castilla-Leon 2.1476 2.1293 1.4575 1.1062 Castilla-LaMancha 2.2517 2.2303 1.6850 1.1769 Cataluña 1.8706 1.8327 1.4545 1.2495 Valencia 2.0523 2.0371 1.5170 1.1748 Extremadura 2.2580 2.1673 1.5848 0.9714 Galicia 2.0775 2.0660 1.5045 1.0815 Madrid 1.7203 1.8873 1.4778 1.3467 Murcia 2.1804 2.1536 1.6966 1.1882 Rioja 2.0842 2.0290 1.5471 1.2705
Table 6 Aggregate Elasticities: 1.1
1 2 3 4
Nacional 2.1984 2.2309 1.7422 1.4834 Andalucia 2.3532 2.3593 1.7862 1.3462 Aragon 2.2650 2.2037 1.6737 1.4317 Asturias 2.2995 2.3477 1.8353 1.5577 Baleares 2.1735 2.1290 1.7022 1.4575 Canarias 2.2750 2.2455 1.7985 1.4396 Cantabria 2.2755 2.2222 1.6986 1.4395 Castilla-Leon 2.3510 2.3257 1.6205 1.3040 Castilla-LaMancha 2.4623 2.4318 1.8592 1.3914 Cataluña 2.1181 2.0675 1.6686 1.4841 Valencia 2.2905 2.2766 1.7392 1.4305 Extremadura 2.4620 2.3570 1.7474 1.1810 Galicia 2.3074 2.2783 1.7011 1.3154 Madrid 2.0024 2.2157 1.7822 1.6647 Murcia 2.4103 2.3914 1.9128 1.4496 Rioja 2.2968 2.2134 1.7080 1.4625
27
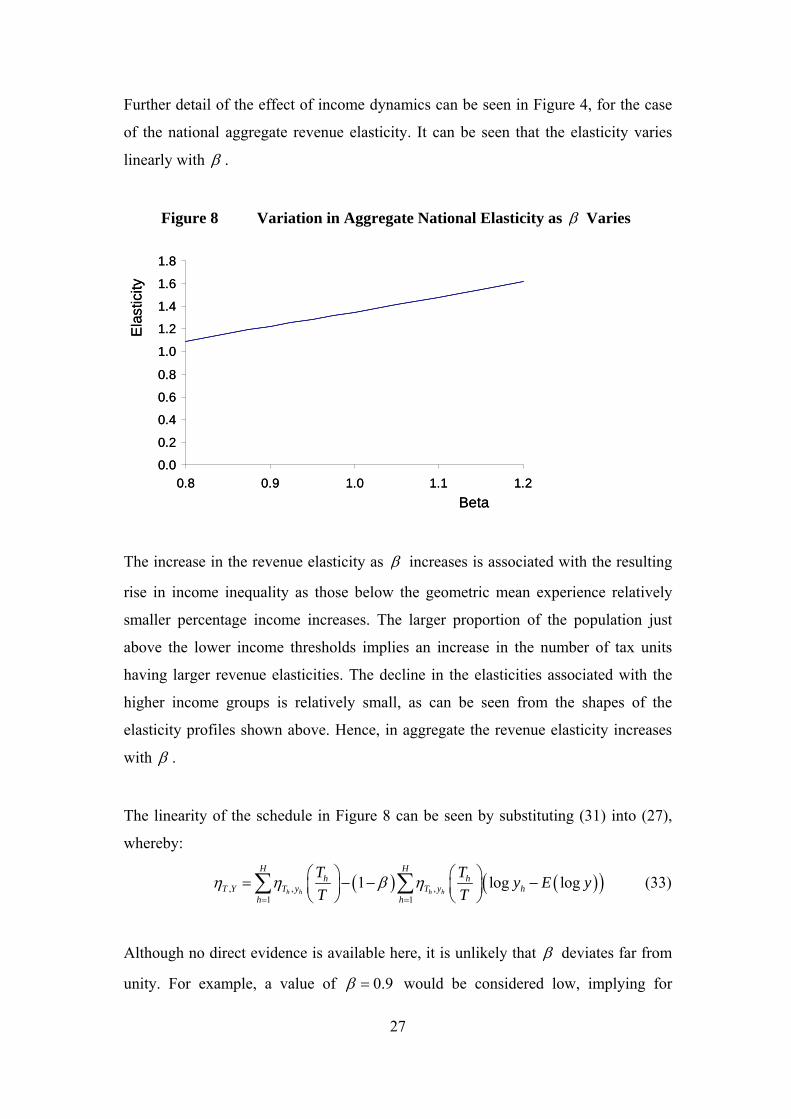
Further detail of the effect of income dynamics can be seen in Figure 4, for the case
of the national aggregate revenue elasticity. It can be seen that the elasticity varies
linearly with .
Figure 8 Variation in Aggregate National Elasticity as Varies
0.0
0.2
0.4
0.6
0.8
1.0
1.2
1.4
1.6
1.8
0.8 0.9 1.0 1.1 1.2
Beta
Ela
stic
ity
0.0
0.2
0.4
0.6
0.8
1.0
1.2
1.4
1.6
1.8
0.8 0.9 1.0 1.1 1.2
Beta
Ela
stic
ity
The increase in the revenue elasticity as increases is associated with the resulting
rise in income inequality as those below the geometric mean experience relatively
smaller percentage income increases. The larger proportion of the population just
above the lower income thresholds implies an increase in the number of tax units
having larger revenue elasticities. The decline in the elasticities associated with the
higher income groups is relatively small, as can be seen from the shapes of the
elasticity profiles shown above. Hence, in aggregate the revenue elasticity increases
with .
The linearity of the schedule in Figure 8 can be seen by substituting (31) into (27),
whereby:
, , ,1 1
1 log logh h h h
H Hh h
T Y T y T y hh h
T Ty E y
T T
(33)
Although no direct evidence is available here, it is unlikely that deviates far from
unity. For example, a value of 0.9 would be considered low, implying for
28
example that if total income were to increase by 10 per cent, the lower quartile would
increase by about 14 per cent whereas the upper quartile would increase by only
about 3 per cent. This implies considerable ‘regression towards the (geometric)
mean’.11
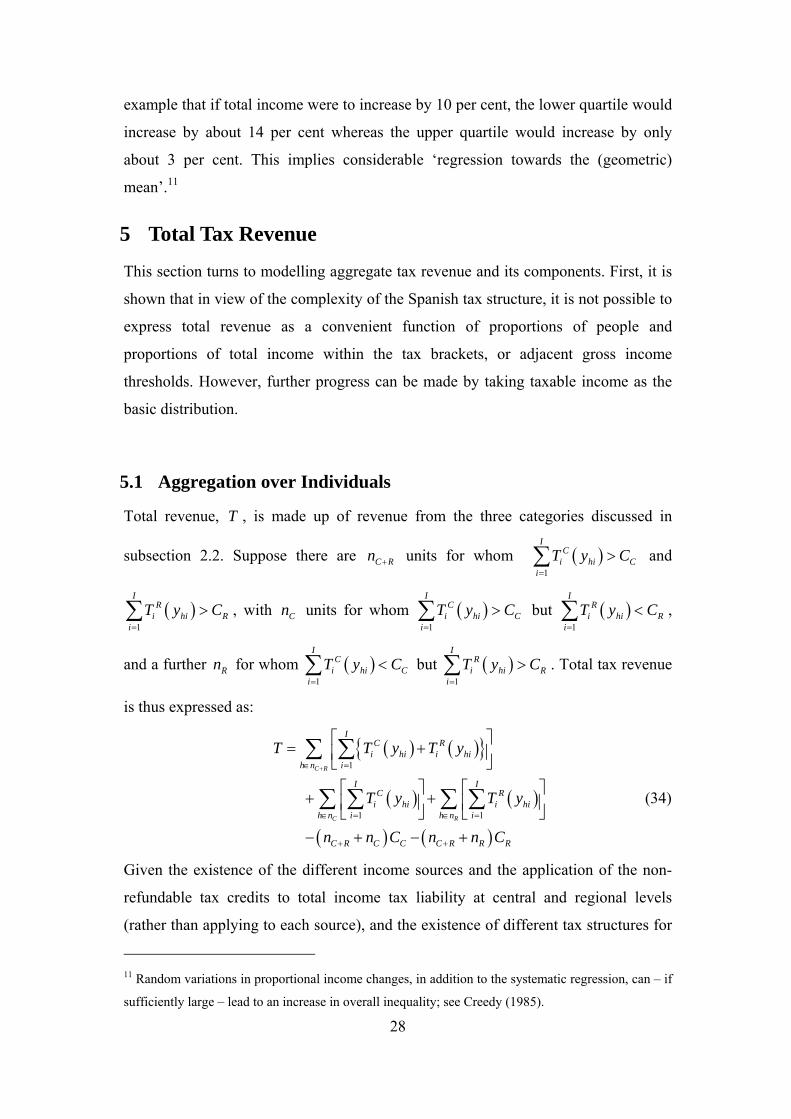
5 Total Tax Revenue
This section turns to modelling aggregate tax revenue and its components. First, it is
shown that in view of the complexity of the Spanish tax structure, it is not possible to
express total revenue as a convenient function of proportions of people and
proportions of total income within the tax brackets, or adjacent gross income
thresholds. However, further progress can be made by taking taxable income as the
basic distribution.
5.1 Aggregation over Individuals
Total revenue, T , is made up of revenue from the three categories discussed in
subsection 2.2. Suppose there are C Rn units for whom 1
IC
i hi Ci
T y C
and
1
IR
i hi Ri
T y C
, with Cn units for whom 1
IC
i hi Ci
T y C
but 1
IR
i hi Ri
T y C
,
and a further Rn for whom 1
IC
i hi Ci
T y C
but 1
IR
i hi Ri
T y C
. Total tax revenue
is thus expressed as:
1
1 1
C R
C R
IC R
i hi i hih n i
I IC R
i hi i hih n i h n i
C R C C C R R R
T T y T y
T y T y
n n C n n C
(34)
Given the existence of the different income sources and the application of the non-
refundable tax credits to total income tax liability at central and regional levels
(rather than applying to each source), and the existence of different tax structures for
11 Random variations in proportional income changes, in addition to the systematic regression, can – if
sufficiently large – lead to an increase in overall inequality; see Creedy (1985).

29
different income sources, the above expression for total revenue cannot be reduced to
a convenient expression in terms of characteristics of the distributions of component
gross income sources.
However, further progress can be made by considering as the starting point, instead
of the distribution of gross income, the distribution of taxable income, x. Indeed, as
discussed in subsection 4.1, many studies of revenue elasticities take this variable as
the ‘given’ distribution and define the elasticity of tax revenue with respect to
changes in taxable income rather than gross income. For the C Rn taxpayers whose
central and regional tax exceeds the relevant credits, equations (10) and (11) can be
used to write their tax as:
1,1 1 1
( ) ( ) ( ) ( )ihkI
hi kih hi hi hi ji ji j i R Ci i j
T y t y E A a t t C C
(35)
which becomes:
1
( ) ( )I
kih hi jih R Ci
T Y t x a C C
(36)
where 1,1
1( )
ihk
jih ji ji j ijkih
a a t tt
. If there are N taxpayers (that is, whose tax liability
is positive, so that C R R CN n n n ), the total revenue can be expressed as:
1 1
( ) ( ) ( )N I
kih hi jih R Ch i
T Y t x a N C C
(37)
Where, as above, hix is the taxable income for income source i for tax unit h (that is,
hihihihi AEyx ). The terms CC and RC denote the appropriate average value
defined over taxpayers, remembering the tax schedule asymmetry whereby tax must
be positive. The first term in (37) can be rewritten as:
1 1
( )I N
kih hi jihi h
t x a
(38)
In the case of a single source of income, with a multi-step function, the tax per person
can be expressed in terms of summary information about the distribution of taxable
income, which determines the proportion of tax units falling into the various marginal

30
tax rate groups.12 For example, suppose that F x denotes the distribution function
of taxable income, x>0. Tax per unit is thus:
1
1
'k
k
K a
k kak
t x a dF x
(39)
Define 1F x as the first-moment distribution function, that is the proportion of total
income of units below x, and introduce the general term kG a , defined as:
1 1 1 1
'kk k k k k
aG a F a F a F a F a
x (40)
The first term in curly brackets gives the proportion of total income between adjacent
thresholds, and the second term in curly brackets is the number of tax units between
those thresholds. The expression in (40) can also be written as:
1 1 11
1
'k k kk k k
k k
F a F a aG a F a F a
F a F a x
(41)
The first term inside the square brackets of (41) is the slope of the Lorenz curve of
the relevant distribution of income, between the two points associated with adjacent
income tax thresholds. The Lorenz curve has a slope of 45 degrees at the arithmetic
mean; that is,
1 1dF x
dF x . The second term in the square brackets is simply the
ratio of the ‘effective’ threshold to arithmetic mean income. And of course the term
in curly brackets in (41) is the proportion of people within the tax bracket.
Total revenue per person is thus:
1
K
k kk
x t G a (42)
Hence, for the case of several income sources, each with its own tax schedule, total
tax revenue over all individuals and sources becomes:
1 1
( ) ( )i
i i
i
KI
i k i k R Ci k
T Y N x t G a N C C
(43)
12 For further discussion, see Creedy and Gemmell (2006).

31
The first term in equation (43) can usefully be written in vector notation. Define the
column vectors:
1
2
.
i i
i ii
i Ki
G a
G aG
G a
(44)
and:
1
2
.
i
ii
Ki
t
tt
t
(45)
Then, if a prime indicates that the vector is written as a row vector:
1
'i
i i i
i
K
k k k i ik
t G a t G
(46)
These values may be placed in a column vector, denoted 't G . Then if x represents
a column vector whose ith element consists of the arithmetic mean, ix , then:
1 1
' 'i
i i i
i
KI
i k k ki k
N x t G a Nx t G
(47)
where, as before, a prime indicates transposition. This allows the effects of tax and
income distribution changes to be easily examined.
5.2 Empirical Application
This subsection reports the values of the various terms involved in obtaining total tax
revenue, derived in the previous subsection. First, Table 7 gives, for each region and
for all regions combined, the number of individuals who pay positive amounts of tax,
along with the arithmetic means of the two income sources. The final two columns of
Table 7 show the arithmetic means of the central and regional tax credits, which
together give the last term in equation (43). There are clearly substantial differences
in arithmetic mean incomes among regions.
32
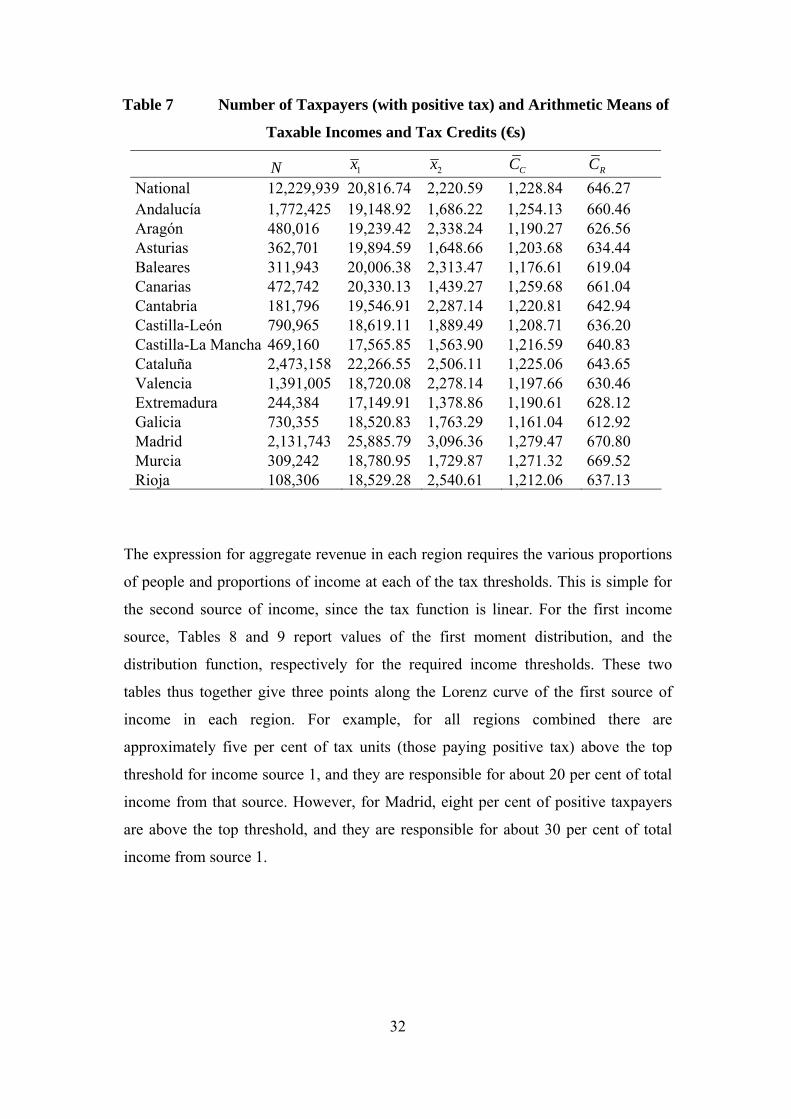
Table 7 Number of Taxpayers (with positive tax) and Arithmetic Means of
Taxable Incomes and Tax Credits (€s)
N 1x 2x CC RC
National 12,229,939 20,816.74 2,220.59 1,228.84 646.27 Andalucía 1,772,425 19,148.92 1,686.22 1,254.13 660.46 Aragón 480,016 19,239.42 2,338.24 1,190.27 626.56 Asturias 362,701 19,894.59 1,648.66 1,203.68 634.44 Baleares 311,943 20,006.38 2,313.47 1,176.61 619.04 Canarias 472,742 20,330.13 1,439.27 1,259.68 661.04 Cantabria 181,796 19,546.91 2,287.14 1,220.81 642.94 Castilla-León 790,965 18,619.11 1,889.49 1,208.71 636.20 Castilla-La Mancha 469,160 17,565.85 1,563.90 1,216.59 640.83 Cataluña 2,473,158 22,266.55 2,506.11 1,225.06 643.65 Valencia 1,391,005 18,720.08 2,278.14 1,197.66 630.46 Extremadura 244,384 17,149.91 1,378.86 1,190.61 628.12 Galicia 730,355 18,520.83 1,763.29 1,161.04 612.92 Madrid 2,131,743 25,885.79 3,096.36 1,279.47 670.80 Murcia 309,242 18,780.95 1,729.87 1,271.32 669.52 Rioja 108,306 18,529.28 2,540.61 1,212.06 637.13
The expression for aggregate revenue in each region requires the various proportions
of people and proportions of income at each of the tax thresholds. This is simple for
the second source of income, since the tax function is linear. For the first income
source, Tables 8 and 9 report values of the first moment distribution, and the
distribution function, respectively for the required income thresholds. These two
tables thus together give three points along the Lorenz curve of the first source of
income in each region. For example, for all regions combined there are
approximately five per cent of tax units (those paying positive tax) above the top
threshold for income source 1, and they are responsible for about 20 per cent of total
income from that source. However, for Madrid, eight per cent of positive taxpayers
are above the top threshold, and they are responsible for about 30 per cent of total
income from source 1.
33
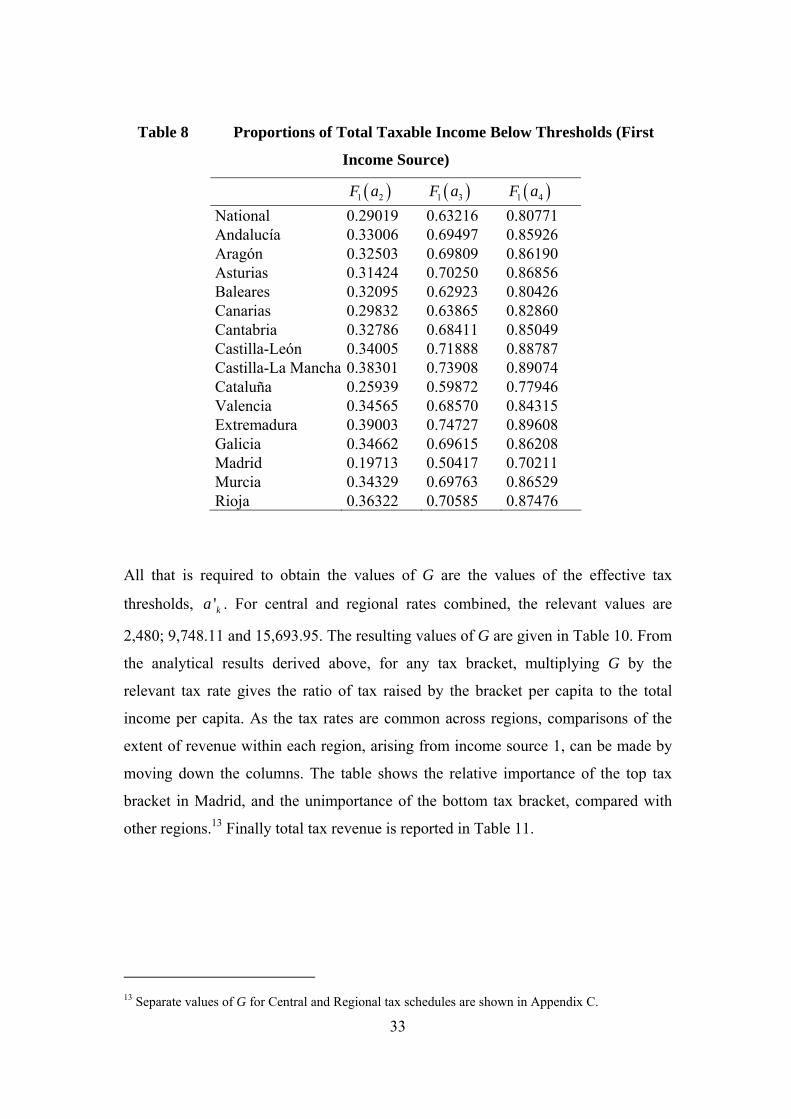
Table 8 Proportions of Total Taxable Income Below Thresholds (First
Income Source)
1 2F a 1 3F a 1 4F a
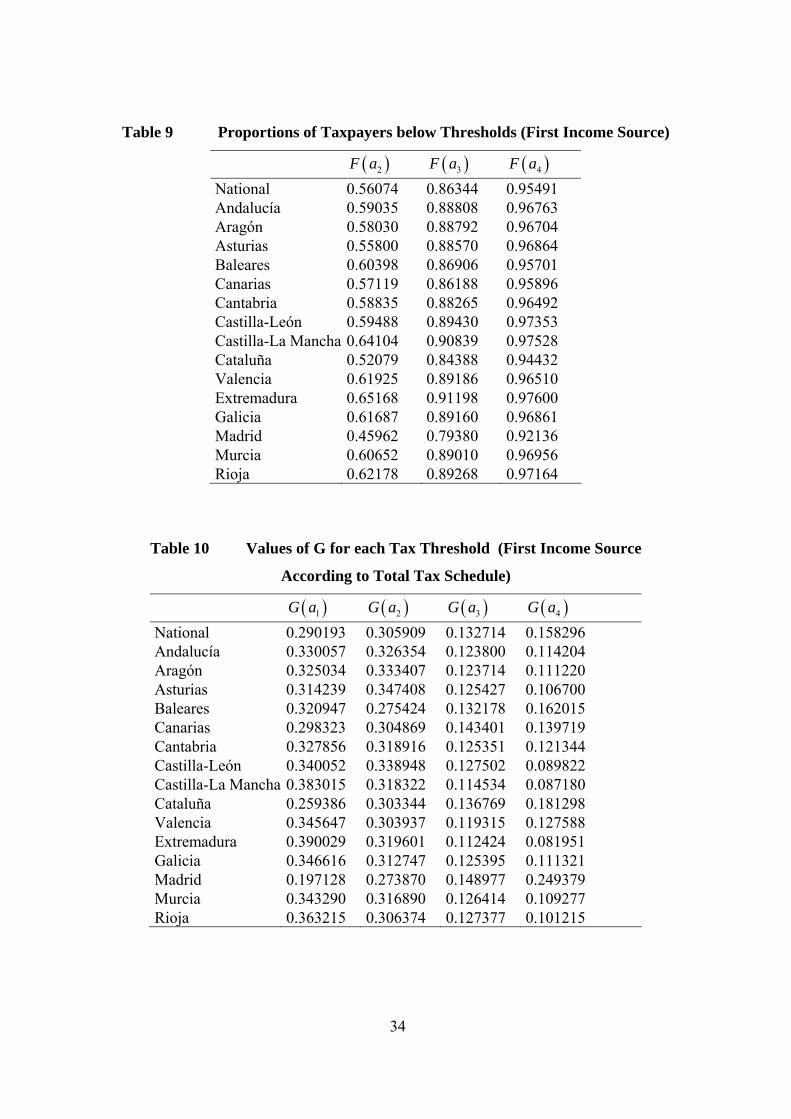
National 0.29019 0.63216 0.80771 Andalucía 0.33006 0.69497 0.85926 Aragón 0.32503 0.69809 0.86190 Asturias 0.31424 0.70250 0.86856 Baleares 0.32095 0.62923 0.80426 Canarias 0.29832 0.63865 0.82860 Cantabria 0.32786 0.68411 0.85049 Castilla-León 0.34005 0.71888 0.88787 Castilla-La Mancha 0.38301 0.73908 0.89074 Cataluña 0.25939 0.59872 0.77946 Valencia 0.34565 0.68570 0.84315 Extremadura 0.39003 0.74727 0.89608 Galicia 0.34662 0.69615 0.86208 Madrid 0.19713 0.50417 0.70211 Murcia 0.34329 0.69763 0.86529 Rioja 0.36322 0.70585 0.87476
All that is required to obtain the values of G are the values of the effective tax
thresholds, 'ka . For central and regional rates combined, the relevant values are
2,480; 9,748.11 and 15,693.95. The resulting values of G are given in Table 10. From
the analytical results derived above, for any tax bracket, multiplying G by the
relevant tax rate gives the ratio of tax raised by the bracket per capita to the total
income per capita. As the tax rates are common across regions, comparisons of the
extent of revenue within each region, arising from income source 1, can be made by
moving down the columns. The table shows the relative importance of the top tax
bracket in Madrid, and the unimportance of the bottom tax bracket, compared with
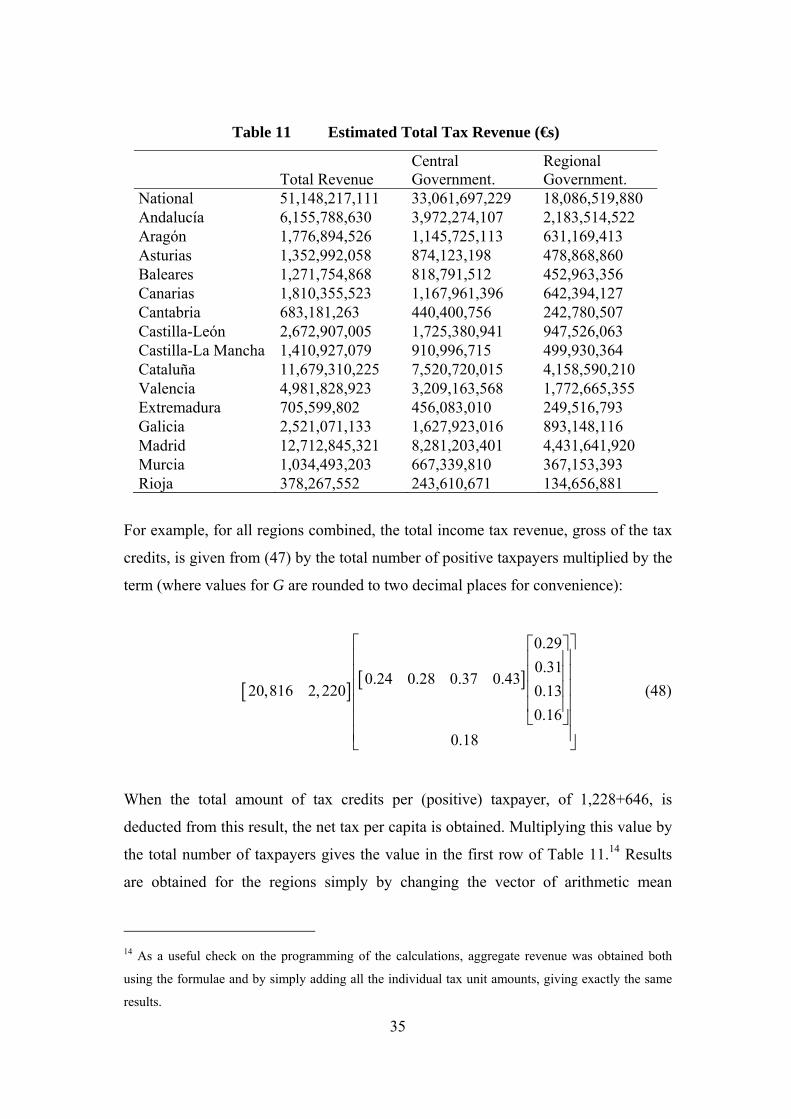
other regions.13 Finally total tax revenue is reported in Table 11.
13 Separate values of G for Central and Regional tax schedules are shown in Appendix C.
34
Table 9 Proportions of Taxpayers below Thresholds (First Income Source)
2F a 3F a 4F a
National 0.56074 0.86344 0.95491 Andalucía 0.59035 0.88808 0.96763 Aragón 0.58030 0.88792 0.96704 Asturias 0.55800 0.88570 0.96864 Baleares 0.60398 0.86906 0.95701 Canarias 0.57119 0.86188 0.95896 Cantabria 0.58835 0.88265 0.96492 Castilla-León 0.59488 0.89430 0.97353 Castilla-La Mancha 0.64104 0.90839 0.97528 Cataluña 0.52079 0.84388 0.94432 Valencia 0.61925 0.89186 0.96510 Extremadura 0.65168 0.91198 0.97600 Galicia 0.61687 0.89160 0.96861 Madrid 0.45962 0.79380 0.92136 Murcia 0.60652 0.89010 0.96956 Rioja 0.62178 0.89268 0.97164
Table 10 Values of G for each Tax Threshold (First Income Source
According to Total Tax Schedule)
1G a 2G a 3G a 4G a
National 0.290193 0.305909 0.132714 0.158296 Andalucía 0.330057 0.326354 0.123800 0.114204 Aragón 0.325034 0.333407 0.123714 0.111220 Asturias 0.314239 0.347408 0.125427 0.106700 Baleares 0.320947 0.275424 0.132178 0.162015 Canarias 0.298323 0.304869 0.143401 0.139719 Cantabria 0.327856 0.318916 0.125351 0.121344 Castilla-León 0.340052 0.338948 0.127502 0.089822 Castilla-La Mancha 0.383015 0.318322 0.114534 0.087180 Cataluña 0.259386 0.303344 0.136769 0.181298 Valencia 0.345647 0.303937 0.119315 0.127588 Extremadura 0.390029 0.319601 0.112424 0.081951 Galicia 0.346616 0.312747 0.125395 0.111321 Madrid 0.197128 0.273870 0.148977 0.249379 Murcia 0.343290 0.316890 0.126414 0.109277 Rioja 0.363215 0.306374 0.127377 0.101215
35
Table 11 Estimated Total Tax Revenue (€s)
Total Revenue Central Government.
Regional Government.
National 51,148,217,111 33,061,697,229 18,086,519,880 Andalucía 6,155,788,630 3,972,274,107 2,183,514,522 Aragón 1,776,894,526 1,145,725,113 631,169,413 Asturias 1,352,992,058 874,123,198 478,868,860 Baleares 1,271,754,868 818,791,512 452,963,356 Canarias 1,810,355,523 1,167,961,396 642,394,127 Cantabria 683,181,263 440,400,756 242,780,507 Castilla-León 2,672,907,005 1,725,380,941 947,526,063 Castilla-La Mancha 1,410,927,079 910,996,715 499,930,364 Cataluña 11,679,310,225 7,520,720,015 4,158,590,210 Valencia 4,981,828,923 3,209,163,568 1,772,665,355 Extremadura 705,599,802 456,083,010 249,516,793 Galicia 2,521,071,133 1,627,923,016 893,148,116 Madrid 12,712,845,321 8,281,203,401 4,431,641,920 Murcia 1,034,493,203 667,339,810 367,153,393 Rioja 378,267,552 243,610,671 134,656,881
For example, for all regions combined, the total income tax revenue, gross of the tax
credits, is given from (47) by the total number of positive taxpayers multiplied by the
term (where values for G are rounded to two decimal places for convenience):
0.29
0.310.24 0.28 0.37 0.43
20,816 2, 220 0.13
0.16
0.18
(48)
When the total amount of tax credits per (positive) taxpayer, of 1,228+646, is
deducted from this result, the net tax per capita is obtained. Multiplying this value by
the total number of taxpayers gives the value in the first row of Table 11.14 Results
are obtained for the regions simply by changing the vector of arithmetic mean
14 As a useful check on the programming of the calculations, aggregate revenue was obtained both
using the formulae and by simply adding all the individual tax unit amounts, giving exactly the same
results.

36
incomes and the vector of G values in (48), and then using the appropriate values of
N and the average tax credits.
The effects on gross tax revenue of changes in the average income from the second
source, or changes in the relative dispersion of income from the first source (which
changes the Lorenz curve and thus the G values), or changes in the marginal tax rate
structure, are thus easily examined using modifications to expressions of the form
shown in (48). For example, elimination of the top marginal income tax bracket
simply means that the row vector of tax rates has only three elements and the column
vector of G values is reduced to three elements with the third element replaced by
0.29.
Changes in the tax thresholds have the effect of changing the G values. Hence a
‘ready reckoner’ could be produced by replacing Tables 8 and 9 by larger tables
giving values of the distribution function and first moment distribution function for a
range of income levels. The introduction of additional tax brackets for the second
income source could be accommodated by producing similar tables for that source.
The effects of change in the distribution of income within a region can be examined
using the same kind of summary information. For example, if mean income
increases, whereby incomes in a region are assumed to increase by the same
proportion, this is equivalent to a reduction in the tax thresholds, so that information
about the Lorenz curve (the F and 1F values) can be used to obtain the appropriate G
value. A change in inequality can be accommodated by specifying the way in which
the Lorenz curve for the region changes.
The difficulty of dealing with the central and regional tax credits and thus aggregate
net income tax revenue remains, as an analytical expression for aggregate credits has
not been obtained.
As suggested above, the effects of changing only the tax rates are easily examined in
this framework, as only the vector of marginal rates needs to be altered in expressions
corresponding to (48). For example, the previous discussion has not allowed for the
37
small change in the tax rate structure in Madrid in 2007, making it unique among the
Spanish regions. The income thresholds for the first income source are the same as in
Table 1 above, and the central government rates are the same, but the marginal tax
rates for Madrid became 0.0794, 0.0943, 0.1266 and 0.1577 for the four income
brackets. This involves a slight reduction in all the rates, with the largest reductions
being for the first and second tax brackets. Given the nature of the distribution of
income in Madrid for the first source, it is anticipated that this would have relatively
little effect on total revenue. But in view of the differences among regions in their
income distributions, the same could not be said of the other regions.
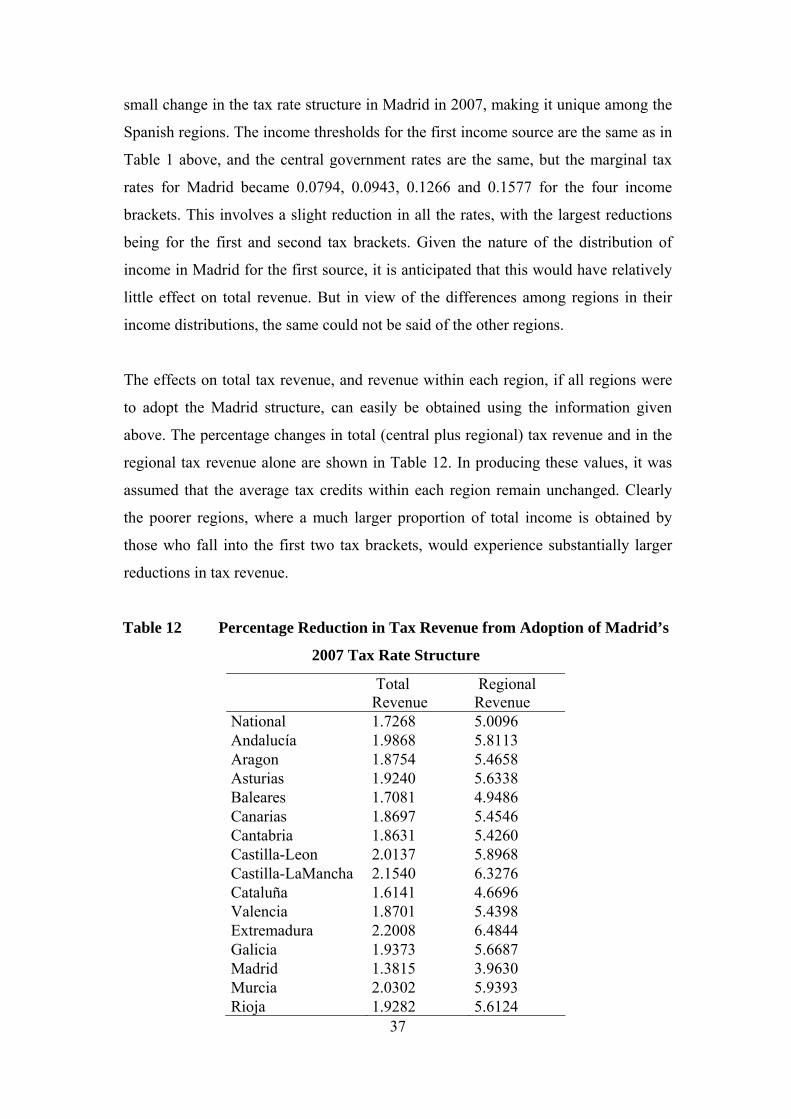
The effects on total tax revenue, and revenue within each region, if all regions were
to adopt the Madrid structure, can easily be obtained using the information given
above. The percentage changes in total (central plus regional) tax revenue and in the
regional tax revenue alone are shown in Table 12. In producing these values, it was
assumed that the average tax credits within each region remain unchanged. Clearly
the poorer regions, where a much larger proportion of total income is obtained by
those who fall into the first two tax brackets, would experience substantially larger
reductions in tax revenue.
Table 12 Percentage Reduction in Tax Revenue from Adoption of Madrid’s
2007 Tax Rate Structure
Total Revenue
Regional Revenue
National 1.7268 5.0096 Andalucía 1.9868 5.8113 Aragon 1.8754 5.4658 Asturias 1.9240 5.6338 Baleares 1.7081 4.9486 Canarias 1.8697 5.4546 Cantabria 1.8631 5.4260 Castilla-Leon 2.0137 5.8968 Castilla-LaMancha 2.1540 6.3276 Cataluña 1.6141 4.6696 Valencia 1.8701 5.4398 Extremadura 2.2008 6.4844 Galicia 1.9373 5.6687 Madrid 1.3815 3.9630 Murcia 2.0302 5.9393 Rioja 1.9282 5.6124

38
5.3 Regional Comparisons
The previous subsection considered the effects on all regions of adopting a different
regional structure of marginal income tax rates. As explained above, it is possible to
use the same basic approach to consider the effects of a range of changes in the
taxable income distributions of each region. This is particularly useful in the present
context where it is clear that different regions have different fiscal capacities. Such
disparities in regional revenue-raising abilities are especially evident when, as here,
progressive taxes are assigned partially to regional governments.
Central governments normally carry out some form of regional fiscal equalization.
Under these circumstances, sound design of these inter-regional transfers requires a
clear understanding of the precise sources of divergence of regional fiscal capacities.
The present approach can thus contribute to the debate on regional transfers by
clarifying precisely how regions differ with respect to the tax structure and the
distribution of taxpayers. This is because equation (43) makes it evident that
differences in revenue hinge on basically four factors: the number and distribution of
taxpayers, the distribution of taxable incomes and the specific tax parameters that
define the structure –marginal tax rates, tax bracket thresholds and average tax
credits.
The present approach makes it possible to construct a matrix in which each region’s
tax revenue can be computed under the assumption that it shares one or more of the
characteristics of other regions. Thus a ‘15 by 15’ matrix is obtained such that each
entry shows the revenue obtained by a row region, under the assumption that it has a
particular characteristic of the column region. The leading diagonal of such a square
matrix obviously shows the actual revenue obtained by the region. This matrix is
augmented by an additional row and column for the country as a whole. Similarly,
the information can be displayed in relative terms, showing the percentage
differences in revenue which could be raised by each region, given different assumed
characteristics (so that each corresponding leading diagonal element is zero).
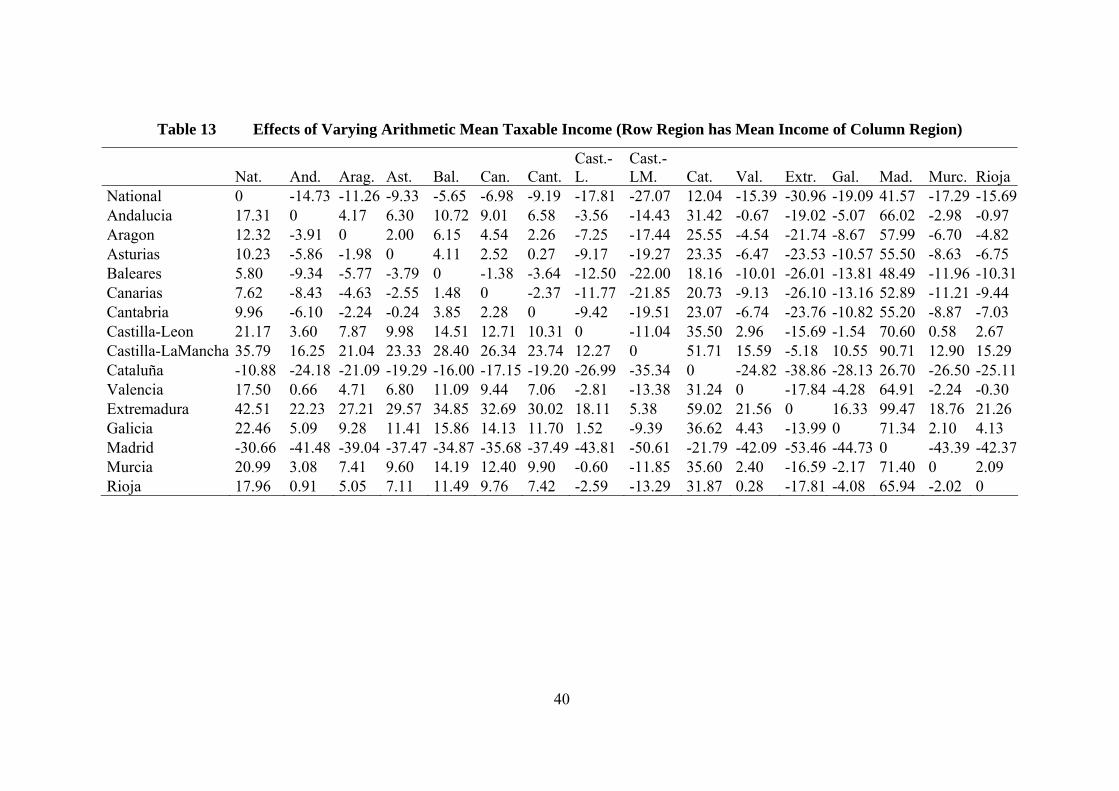
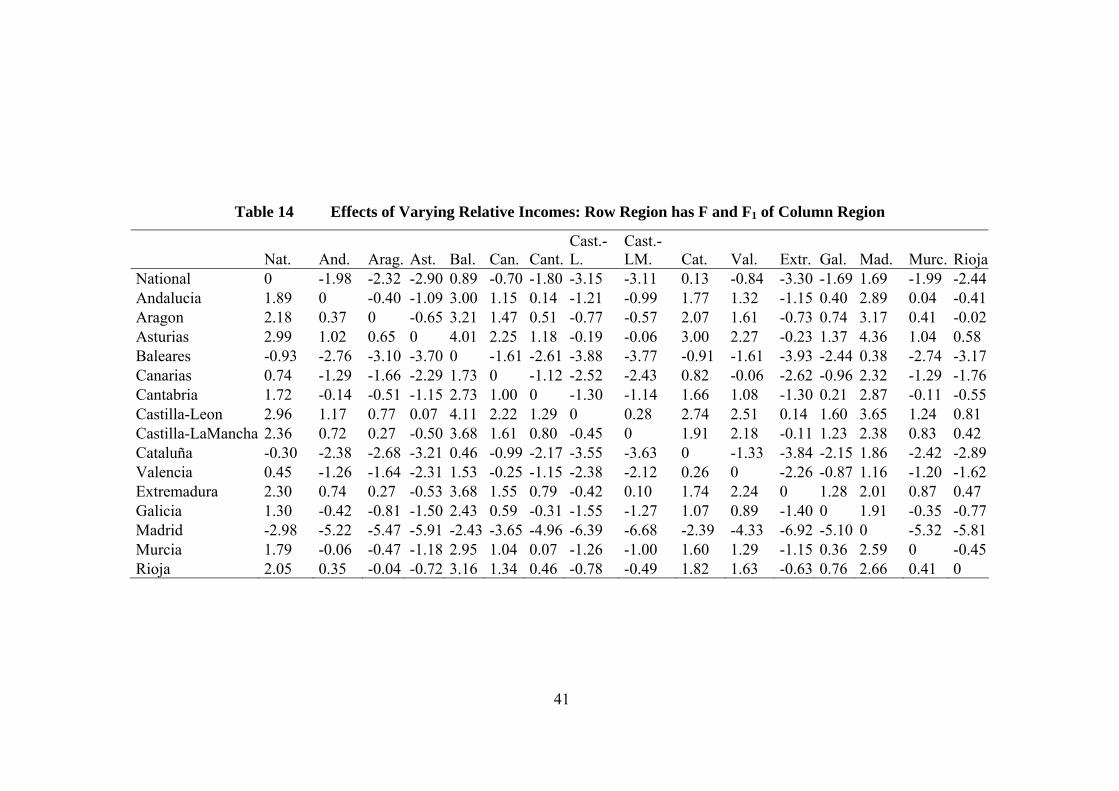
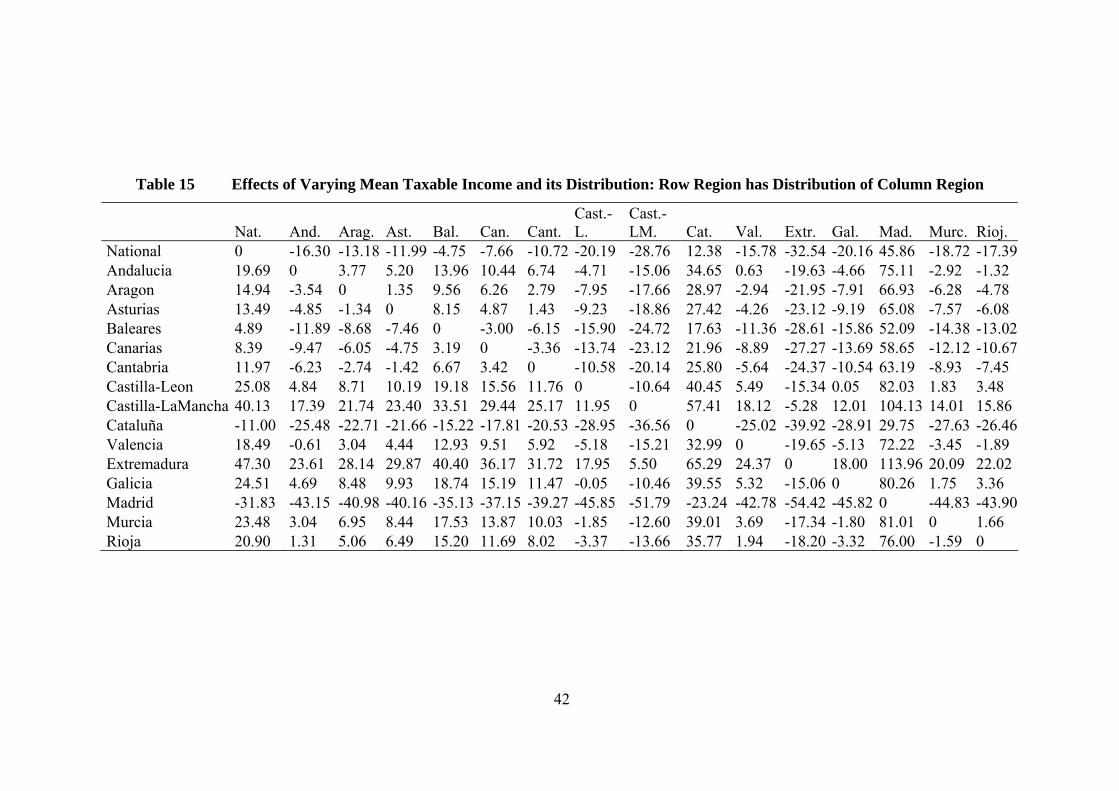
To illustrate the kind of information which can be produced along these lines, Tables
13 to 15 report three such hypothetical ‘16 by 16’ matrices for Spanish regions in the

39
2007 fiscal year. These were computed using the sample of tax-returns described in
section 4 and, as before, refer to the fifteen Autonomous Communities of the
Common Territory. Each matrix shows the relative impact on the revenue collection
of the row region if it were to replicate the specific characteristic of the column
region. Specifically, Table 13 presents the revenue impact of differences in arithmetic
mean taxable incomes. Table 14 depicts the effects of differences in the form of the
relative taxable income distributions; that is, the arithmetic means are unchanged but
the proportions of people in each tax bracket, and the corresponding proportions of
total taxable income within each bracket, are assumed to the those of the region in the
columns. Finally, Table 15 shows the revenue consequences of simultaneous changes
in both the arithmetic mean taxable income and the relative distributions of income.15
For example, Table 13 shows that if Andalucía were to have the same arithmetic
mean taxable income as Aragon (a given percentage change in all incomes), it would
have 4.17 per cent higher income tax revenue. However, from Table 14 if Andalucia
were to have its actual arithmetic mean, but the same relative form of income
distribution as Aragon, it would have slightly less revenue: there would be a
reduction of 0.40 per cent. Table 15 indicates that if the distribution of taxable
income in Andalucia were the precisely the same as in Aragon (in both absolute and
relative terms), its revenue would be 3.77 per cent higher. In fact these effects are
additive, so that the elements of Table 15 effectively equal the sum of the
corresponding elements in Tables 13 and 14.
15 In producing these results it has been assumed that average tax credits remain unchanged
40
Table 13 Effects of Varying Arithmetic Mean Taxable Income (Row Region has Mean Income of Column Region)
Nat. And. Arag. Ast. Bal. Can. Cant. Cast.-L.
Cast.-LM. Cat. Val. Extr. Gal. Mad. Murc. Rioja
National 0 -14.73 -11.26 -9.33 -5.65 -6.98 -9.19 -17.81 -27.07 12.04 -15.39 -30.96 -19.09 41.57 -17.29 -15.69 Andalucia 17.31 0 4.17 6.30 10.72 9.01 6.58 -3.56 -14.43 31.42 -0.67 -19.02 -5.07 66.02 -2.98 -0.97 Aragon 12.32 -3.91 0 2.00 6.15 4.54 2.26 -7.25 -17.44 25.55 -4.54 -21.74 -8.67 57.99 -6.70 -4.82 Asturias 10.23 -5.86 -1.98 0 4.11 2.52 0.27 -9.17 -19.27 23.35 -6.47 -23.53 -10.57 55.50 -8.63 -6.75 Baleares 5.80 -9.34 -5.77 -3.79 0 -1.38 -3.64 -12.50 -22.00 18.16 -10.01 -26.01 -13.81 48.49 -11.96 -10.31 Canarias 7.62 -8.43 -4.63 -2.55 1.48 0 -2.37 -11.77 -21.85 20.73 -9.13 -26.10 -13.16 52.89 -11.21 -9.44 Cantabria 9.96 -6.10 -2.24 -0.24 3.85 2.28 0 -9.42 -19.51 23.07 -6.74 -23.76 -10.82 55.20 -8.87 -7.03 Castilla-Leon 21.17 3.60 7.87 9.98 14.51 12.71 10.31 0 -11.04 35.50 2.96 -15.69 -1.54 70.60 0.58 2.67 Castilla-LaMancha 35.79 16.25 21.04 23.33 28.40 26.34 23.74 12.27 0 51.71 15.59 -5.18 10.55 90.71 12.90 15.29 Cataluña -10.88 -24.18 -21.09 -19.29 -16.00 -17.15 -19.20 -26.99 -35.34 0 -24.82 -38.86 -28.13 26.70 -26.50 -25.11 Valencia 17.50 0.66 4.71 6.80 11.09 9.44 7.06 -2.81 -13.38 31.24 0 -17.84 -4.28 64.91 -2.24 -0.30 Extremadura 42.51 22.23 27.21 29.57 34.85 32.69 30.02 18.11 5.38 59.02 21.56 0 16.33 99.47 18.76 21.26 Galicia 22.46 5.09 9.28 11.41 15.86 14.13 11.70 1.52 -9.39 36.62 4.43 -13.99 0 71.34 2.10 4.13 Madrid -30.66 -41.48 -39.04 -37.47 -34.87 -35.68 -37.49 -43.81 -50.61 -21.79 -42.09 -53.46 -44.73 0 -43.39 -42.37 Murcia 20.99 3.08 7.41 9.60 14.19 12.40 9.90 -0.60 -11.85 35.60 2.40 -16.59 -2.17 71.40 0 2.09 Rioja 17.96 0.91 5.05 7.11 11.49 9.76 7.42 -2.59 -13.29 31.87 0.28 -17.81 -4.08 65.94 -2.02 0
41
Table 14 Effects of Varying Relative Incomes: Row Region has F and F1 of Column Region
Nat. And. Arag. Ast. Bal. Can. Cant.Cast.-L.
Cast.-LM. Cat. Val. Extr. Gal. Mad. Murc. Rioja
National 0 -1.98 -2.32 -2.90 0.89 -0.70 -1.80 -3.15 -3.11 0.13 -0.84 -3.30 -1.69 1.69 -1.99 -2.44 Andalucia 1.89 0 -0.40 -1.09 3.00 1.15 0.14 -1.21 -0.99 1.77 1.32 -1.15 0.40 2.89 0.04 -0.41 Aragon 2.18 0.37 0 -0.65 3.21 1.47 0.51 -0.77 -0.57 2.07 1.61 -0.73 0.74 3.17 0.41 -0.02 Asturias 2.99 1.02 0.65 0 4.01 2.25 1.18 -0.19 -0.06 3.00 2.27 -0.23 1.37 4.36 1.04 0.58 Baleares -0.93 -2.76 -3.10 -3.70 0 -1.61 -2.61 -3.88 -3.77 -0.91 -1.61 -3.93 -2.44 0.38 -2.74 -3.17 Canarias 0.74 -1.29 -1.66 -2.29 1.73 0 -1.12 -2.52 -2.43 0.82 -0.06 -2.62 -0.96 2.32 -1.29 -1.76 Cantabria 1.72 -0.14 -0.51 -1.15 2.73 1.00 0 -1.30 -1.14 1.66 1.08 -1.30 0.21 2.87 -0.11 -0.55 Castilla-Leon 2.96 1.17 0.77 0.07 4.11 2.22 1.29 0 0.28 2.74 2.51 0.14 1.60 3.65 1.24 0.81 Castilla-LaMancha 2.36 0.72 0.27 -0.50 3.68 1.61 0.80 -0.45 0 1.91 2.18 -0.11 1.23 2.38 0.83 0.42 Cataluña -0.30 -2.38 -2.68 -3.21 0.46 -0.99 -2.17 -3.55 -3.63 0 -1.33 -3.84 -2.15 1.86 -2.42 -2.89 Valencia 0.45 -1.26 -1.64 -2.31 1.53 -0.25 -1.15 -2.38 -2.12 0.26 0 -2.26 -0.87 1.16 -1.20 -1.62 Extremadura 2.30 0.74 0.27 -0.53 3.68 1.55 0.79 -0.42 0.10 1.74 2.24 0 1.28 2.01 0.87 0.47 Galicia 1.30 -0.42 -0.81 -1.50 2.43 0.59 -0.31 -1.55 -1.27 1.07 0.89 -1.40 0 1.91 -0.35 -0.77 Madrid -2.98 -5.22 -5.47 -5.91 -2.43 -3.65 -4.96 -6.39 -6.68 -2.39 -4.33 -6.92 -5.10 0 -5.32 -5.81 Murcia 1.79 -0.06 -0.47 -1.18 2.95 1.04 0.07 -1.26 -1.00 1.60 1.29 -1.15 0.36 2.59 0 -0.45 Rioja 2.05 0.35 -0.04 -0.72 3.16 1.34 0.46 -0.78 -0.49 1.82 1.63 -0.63 0.76 2.66 0.41 0
42
Table 15 Effects of Varying Mean Taxable Income and its Distribution: Row Region has Distribution of Column Region
Nat. And. Arag. Ast. Bal. Can. Cant. Cast.-L.
Cast.-LM. Cat. Val. Extr. Gal. Mad. Murc. Rioj.
National 0 -16.30 -13.18 -11.99 -4.75 -7.66 -10.72 -20.19 -28.76 12.38 -15.78 -32.54 -20.16 45.86 -18.72 -17.39 Andalucia 19.69 0 3.77 5.20 13.96 10.44 6.74 -4.71 -15.06 34.65 0.63 -19.63 -4.66 75.11 -2.92 -1.32 Aragon 14.94 -3.54 0 1.35 9.56 6.26 2.79 -7.95 -17.66 28.97 -2.94 -21.95 -7.91 66.93 -6.28 -4.78 Asturias 13.49 -4.85 -1.34 0 8.15 4.87 1.43 -9.23 -18.86 27.42 -4.26 -23.12 -9.19 65.08 -7.57 -6.08 Baleares 4.89 -11.89 -8.68 -7.46 0 -3.00 -6.15 -15.90 -24.72 17.63 -11.36 -28.61 -15.86 52.09 -14.38 -13.02 Canarias 8.39 -9.47 -6.05 -4.75 3.19 0 -3.36 -13.74 -23.12 21.96 -8.89 -27.27 -13.69 58.65 -12.12 -10.67 Cantabria 11.97 -6.23 -2.74 -1.42 6.67 3.42 0 -10.58 -20.14 25.80 -5.64 -24.37 -10.54 63.19 -8.93 -7.45 Castilla-Leon 25.08 4.84 8.71 10.19 19.18 15.56 11.76 0 -10.64 40.45 5.49 -15.34 0.05 82.03 1.83 3.48 Castilla-LaMancha 40.13 17.39 21.74 23.40 33.51 29.44 25.17 11.95 0 57.41 18.12 -5.28 12.01 104.13 14.01 15.86 Cataluña -11.00 -25.48 -22.71 -21.66 -15.22 -17.81 -20.53 -28.95 -36.56 0 -25.02 -39.92 -28.91 29.75 -27.63 -26.46 Valencia 18.49 -0.61 3.04 4.44 12.93 9.51 5.92 -5.18 -15.21 32.99 0 -19.65 -5.13 72.22 -3.45 -1.89 Extremadura 47.30 23.61 28.14 29.87 40.40 36.17 31.72 17.95 5.50 65.29 24.37 0 18.00 113.96 20.09 22.02 Galicia 24.51 4.69 8.48 9.93 18.74 15.19 11.47 -0.05 -10.46 39.55 5.32 -15.06 0 80.26 1.75 3.36 Madrid -31.83 -43.15 -40.98 -40.16 -35.13 -37.15 -39.27 -45.85 -51.79 -23.24 -42.78 -54.42 -45.82 0 -44.83 -43.90 Murcia 23.48 3.04 6.95 8.44 17.53 13.87 10.03 -1.85 -12.60 39.01 3.69 -17.34 -1.80 81.01 0 1.66 Rioja 20.90 1.31 5.06 6.49 15.20 11.69 8.02 -3.37 -13.66 35.77 1.94 -18.20 -3.32 76.00 -1.59 0
6 Conclusions
The aim of this paper was to derive analytical expressions for aggregate revenue and
the revenue elasticity of the Spanish personal income tax system as applied to tax
units and in aggregate. This was considerably complicated by the schedular nature of
the system, the role of central and regional governments, along with the existence of
a range of tax credits and eligible expenditures and deductions.
Empirical estimates of revenue elasticities were obtained using a large cross-sectional
data set which enabled a number of important ancillary elasticities (relating to
allowances and tax credits, and different income sources) to be estimated. The
functional relationship between gross income and personal income taxation was
examined, rather than starting from a given distribution of taxable income.
It was found that there is considerable variation among tax units in the revenue
elasticity, with highly (positively) skewed distributions. Similarly, the aggregate
elasticities for each region were found to vary, associated with variations in the
income distributions. Variations were around a value of about 1.3.
Formal expressions for aggregate tax revenue were derived, in terms of the
distribution of taxable income. It was possible to separate total revenue into
components relating to the income tax structure and summary measures of the
distribution of taxable income, in particular the proportions of taxpayers, and of total
taxable income, in each tax bracket. It was thus possible to examine the sources of
differences among regions.
It is suggested that the approach developed here is of value not only in understanding
the fiscal drag and ‘automatic stabilisation’ properties of the personal tax structure,
but in considering the factors – particularly the nature of the distribution of taxable
income – affecting total tax revenue.

44
Appendix A. Losses as a Proportion of Income
Section 2 refers briefly to the role of losses in the Spanish personal tax system. The
first column of Table 16 reports negative (general) taxable income generated each tax
year, as a proportion of the tax year’s current taxable income. The second column
contains the proportion of the negative taxable income, carried forward from the last
four tax years, used to offset current (general) taxable income. It can be seen that the
amount of negative taxable income generated each tax year is well below 1 per cent.
Furthermore, the amount of carried-forward taxable income from the last four years
to offset against current taxable income is even less relevant in relative terms, being
well below 0.1 per cent. As with corporation losses, many losses are not used by the
taxpayers and becoming ‘stranded’. Hence, the loss asymmetry in the tax function is
of little relevance in determining the aggregate tax liability.
Table 16 Negative Taxable Income as a Proportion of Total Taxable Income
Tax Year % of generated negative taxable income
% of used negative taxable income (coming from previous four years)
1997 0.18 0.06 1998 0.22 0.05 1999* less than 0.35 0.06 2000* less than 0.39 0.06 2001* less than 0.74 0.06 2002 0.55 0.07 2003 0.54 0.06 2004 0.48 0.06 2005 0.5 0.05 2006 0.4 0.06 Source: Memorias de la Administracion Tributaria (Tax Office's Annual Tax Report),
several years.
(*) This figures includes not only negative taxable income but taxable income up to
3,000 €

45
Appendix B. The Treatment of Allowances
This appendix considers refundable and non-refundable tax allowances. Suppose
there is a simple tax structure with a marginal rate of t applied to income, y in excess
of a, and there is a ‘refundable tax credit’ of b. The term ‘refundable’ means that if
income tax is less than b, the individual receives a payment (pays negative tax). The
net tax paid is
T y t y a b (B1)
The total expenditure on the refundable tax credit b remains fixed, so long as the
population size is fixed. Those with incomes between a and /a b t pay some
income tax but face an overall negative average tax rate.
For taxpayers, net income is 1y t at b and the tax-free threshold can be
regarded as giving rise to a kind of tax credit worth at. This is a ‘non-refundable tax
credit’, such that those with y<a receive nothing.
The non-refundable credit is intimately connected with the income tax structure. It
determines who pays a zero marginal income tax rate, and the size of the ‘non-
refundable credit’ is determined by the tax rate as well as a. The total ‘tax
expenditure’ associated with the threshold a varies as the tax rate and the income
distribution changes: it increases as the number of people above the threshold
increases.
Consider only values of income for which tax, net of b, is positive. The average tax
rate is:
1a b
ATR ty y
(B2)
The individual revenue elasticity is given by MTR/ATR and is thus:
1
/1
MTR a b t
ATR y
(B3)
Hence for those with positive net average tax rates, the elasticity is higher when b is
included (essentially because it lowers their average tax rate). A higher value of the
refundable tax credit b has the effect of raising the revenue elasticity.

46
Alternatively, it is possible simply to think of the two components of the structure
separately. It could be said to combine an income tax with a tax-free threshold, and
an unconditional transfer payment that is unrelated to income. Indeed, the refundable
tax credit could be administered, without any change in net incomes, by an entirely
separate agency and could be given a name (such as a ‘basic income’, or ‘grant’) that
is unrelated to income taxation. In contrast, it would not be possible to separate the
non-refundable tax credit from the income tax system.
Considering only the income tax system, the individual revenue elasticity is then:
1
1 1a a
y y a
(B4)
as conventionally obtained.
If interest is in using the revenue elasticity at a given income level as an indication of
overall progressivity of taxes and transfers, then the refundable tax credit clearly
increases progressivity of the tax and transfer system as a whole. Perhaps it is then
desirable to include both components.16 But if concern is with the effect on tax
revenue of inflation – fiscal drag – then it can be argued that allowance should be
made only for non-refundable tax credits, and not refundable credits which, as
suggested above, can be entirely separated from the income tax system, both
conceptually and administratively.
16 However, measures of progressivity based on the Gini measure, such as Kakwani’s measure of
disproportionality, could not be produced because the Gini is not defined for negative values
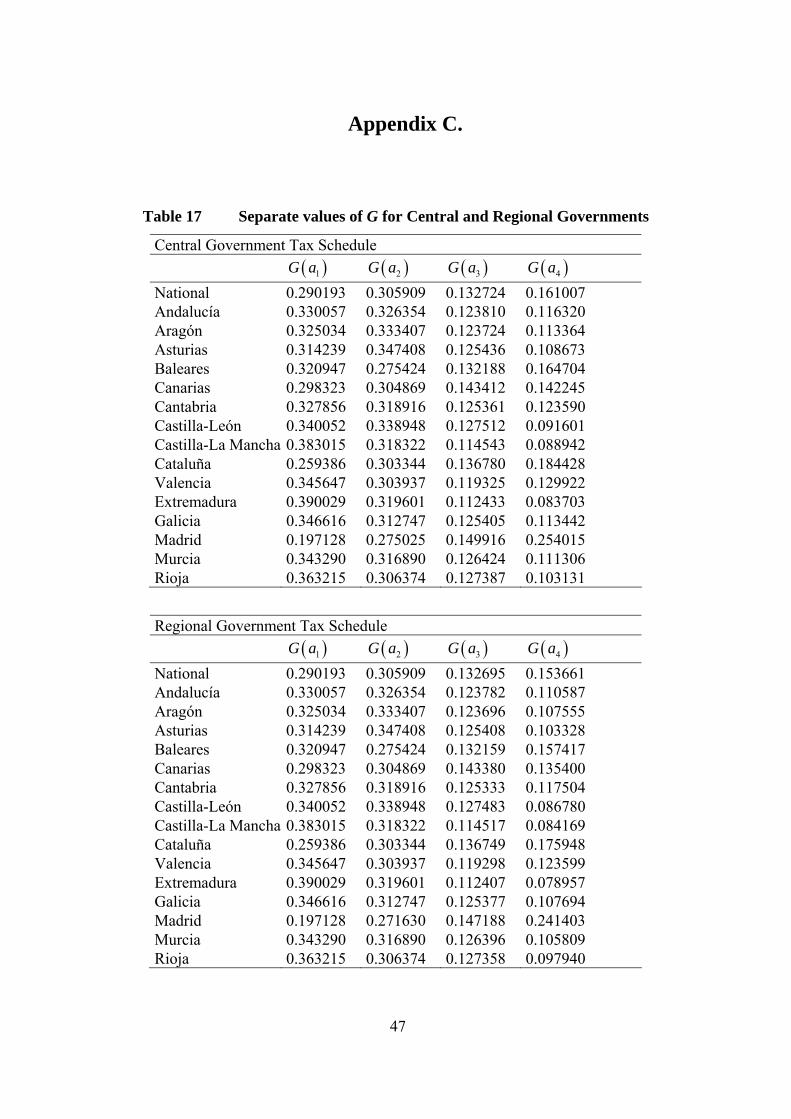
47
Appendix C.
Table 17 Separate values of G for Central and Regional Governments
Central Government Tax Schedule
1G a 2G a 3G a 4G a
National 0.290193 0.305909 0.132724 0.161007 Andalucía 0.330057 0.326354 0.123810 0.116320 Aragón 0.325034 0.333407 0.123724 0.113364 Asturias 0.314239 0.347408 0.125436 0.108673 Baleares 0.320947 0.275424 0.132188 0.164704 Canarias 0.298323 0.304869 0.143412 0.142245 Cantabria 0.327856 0.318916 0.125361 0.123590 Castilla-León 0.340052 0.338948 0.127512 0.091601 Castilla-La Mancha 0.383015 0.318322 0.114543 0.088942 Cataluña 0.259386 0.303344 0.136780 0.184428 Valencia 0.345647 0.303937 0.119325 0.129922 Extremadura 0.390029 0.319601 0.112433 0.083703 Galicia 0.346616 0.312747 0.125405 0.113442 Madrid 0.197128 0.275025 0.149916 0.254015 Murcia 0.343290 0.316890 0.126424 0.111306 Rioja 0.363215 0.306374 0.127387 0.103131
Regional Government Tax Schedule
1G a 2G a 3G a 4G a
National 0.290193 0.305909 0.132695 0.153661 Andalucía 0.330057 0.326354 0.123782 0.110587 Aragón 0.325034 0.333407 0.123696 0.107555 Asturias 0.314239 0.347408 0.125408 0.103328 Baleares 0.320947 0.275424 0.132159 0.157417 Canarias 0.298323 0.304869 0.143380 0.135400 Cantabria 0.327856 0.318916 0.125333 0.117504 Castilla-León 0.340052 0.338948 0.127483 0.086780 Castilla-La Mancha 0.383015 0.318322 0.114517 0.084169 Cataluña 0.259386 0.303344 0.136749 0.175948 Valencia 0.345647 0.303937 0.119298 0.123599 Extremadura 0.390029 0.319601 0.112407 0.078957 Galicia 0.346616 0.312747 0.125377 0.107694 Madrid 0.197128 0.271630 0.147188 0.241403 Murcia 0.343290 0.316890 0.126396 0.105809 Rioja 0.363215 0.306374 0.127358 0.097940

48
Appendix D. Detailed Tables
This appendix reports summary information regarding the calculation of individual
and aggregate elasticities reported above.
First, Tables 18 to 22 show ancillary elasticities estimated for a range of types of tax
unit .
Tables 23 and 24 then examine the relevance of allowance transfers from income
source 1 to source 2. The first column reports the total number of tax units within the
quintile in the region that enjoy the transfer whereas the second column exhibits the
percentage of total allowance transfer within the region that is absorbed by the
quintile of 1y . As shown, this allowance transfer seems to be quite regionally
symmetric, as nearly for every region around 10 per cent of the taxpayers within the
first quantile of 1y enjoy the transfer of allowances and around 98 per cent of the total
transferred allowance is enjoyed by tax units in the first quintile. This fact suggests
that in computing the ancillary elasticity 2 hA y attention must be focused on the
distribution of 1y and not of the total gross income hy .
Finally, Tables 26-28 present basic summary statistics.
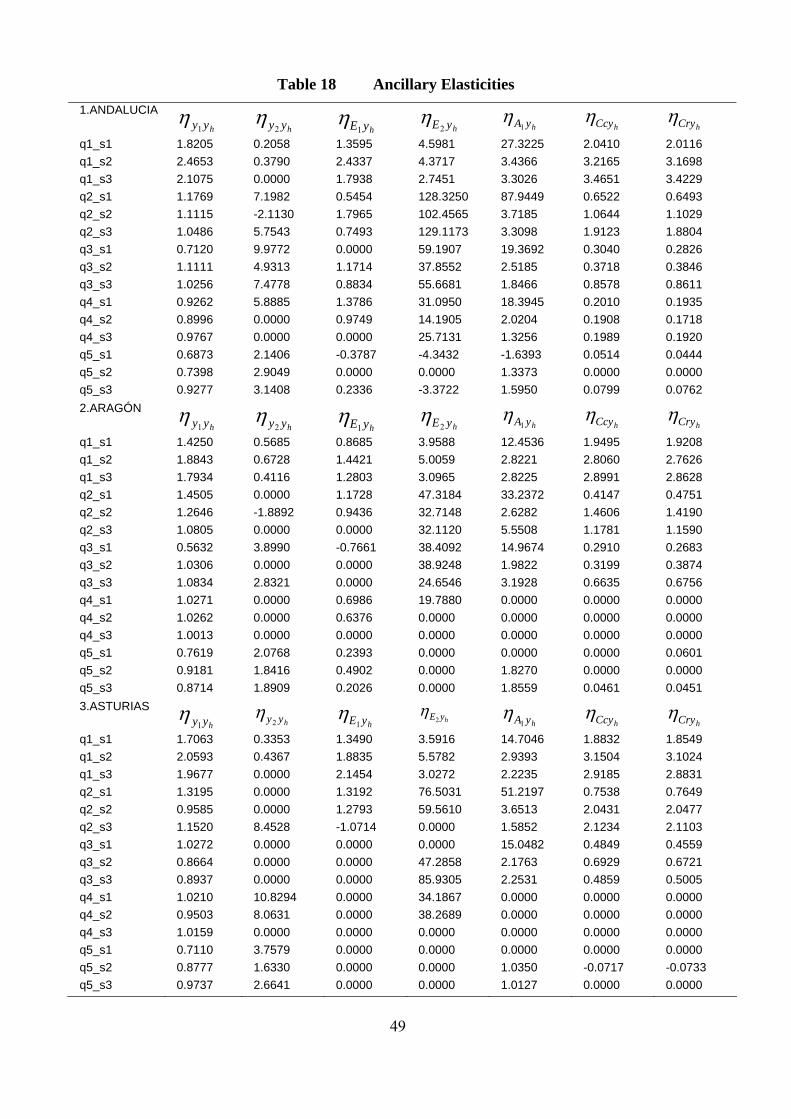
49
Table 18 Ancillary Elasticities
1.ANDALUCIA
hyy1
hyy2
hyE1 hyE2
hyA1
hCcy hCry
q1_s1 1.8205 0.2058 1.3595 4.5981 27.3225 2.0410 2.0116
q1_s2 2.4653 0.3790 2.4337 4.3717 3.4366 3.2165 3.1698
q1_s3 2.1075 0.0000 1.7938 2.7451 3.3026 3.4651 3.4229
q2_s1 1.1769 7.1982 0.5454 128.3250 87.9449 0.6522 0.6493
q2_s2 1.1115 -2.1130 1.7965 102.4565 3.7185 1.0644 1.1029
q2_s3 1.0486 5.7543 0.7493 129.1173 3.3098 1.9123 1.8804
q3_s1 0.7120 9.9772 0.0000 59.1907 19.3692 0.3040 0.2826
q3_s2 1.1111 4.9313 1.1714 37.8552 2.5185 0.3718 0.3846
q3_s3 1.0256 7.4778 0.8834 55.6681 1.8466 0.8578 0.8611
q4_s1 0.9262 5.8885 1.3786 31.0950 18.3945 0.2010 0.1935
q4_s2 0.8996 0.0000 0.9749 14.1905 2.0204 0.1908 0.1718
q4_s3 0.9767 0.0000 0.0000 25.7131 1.3256 0.1989 0.1920
q5_s1 0.6873 2.1406 -0.3787 -4.3432 -1.6393 0.0514 0.0444
q5_s2 0.7398 2.9049 0.0000 0.0000 1.3373 0.0000 0.0000
q5_s3 0.9277 3.1408 0.2336 -3.3722 1.5950 0.0799 0.0762
2.ARAGÓN
hyy1
hyy2
hyE1 hyE2
hyA1
hCcy hCry
q1_s1 1.4250 0.5685 0.8685 3.9588 12.4536 1.9495 1.9208
q1_s2 1.8843 0.6728 1.4421 5.0059 2.8221 2.8060 2.7626
q1_s3 1.7934 0.4116 1.2803 3.0965 2.8225 2.8991 2.8628
q2_s1 1.4505 0.0000 1.1728 47.3184 33.2372 0.4147 0.4751
q2_s2 1.2646 -1.8892 0.9436 32.7148 2.6282 1.4606 1.4190
q2_s3 1.0805 0.0000 0.0000 32.1120 5.5508 1.1781 1.1590
q3_s1 0.5632 3.8990 -0.7661 38.4092 14.9674 0.2910 0.2683
q3_s2 1.0306 0.0000 0.0000 38.9248 1.9822 0.3199 0.3874
q3_s3 1.0834 2.8321 0.0000 24.6546 3.1928 0.6635 0.6756
q4_s1 1.0271 0.0000 0.6986 19.7880 0.0000 0.0000 0.0000
q4_s2 1.0262 0.0000 0.6376 0.0000 0.0000 0.0000 0.0000
q4_s3 1.0013 0.0000 0.0000 0.0000 0.0000 0.0000 0.0000
q5_s1 0.7619 2.0768 0.2393 0.0000 0.0000 0.0000 0.0601
q5_s2 0.9181 1.8416 0.4902 0.0000 1.8270 0.0000 0.0000
q5_s3 0.8714 1.8909 0.2026 0.0000 1.8559 0.0461 0.0451
3.ASTURIAS
hyy1 hyy2
hyE1
hyE2
hyA1
hCcy hCry
q1_s1 1.7063 0.3353 1.3490 3.5916 14.7046 1.8832 1.8549
q1_s2 2.0593 0.4367 1.8835 5.5782 2.9393 3.1504 3.1024
q1_s3 1.9677 0.0000 2.1454 3.0272 2.2235 2.9185 2.8831
q2_s1 1.3195 0.0000 1.3192 76.5031 51.2197 0.7538 0.7649
q2_s2 0.9585 0.0000 1.2793 59.5610 3.6513 2.0431 2.0477
q2_s3 1.1520 8.4528 -1.0714 0.0000 1.5852 2.1234 2.1103
q3_s1 1.0272 0.0000 0.0000 0.0000 15.0482 0.4849 0.4559
q3_s2 0.8664 0.0000 0.0000 47.2858 2.1763 0.6929 0.6721
q3_s3 0.8937 0.0000 0.0000 85.9305 2.2531 0.4859 0.5005
q4_s1 1.0210 10.8294 0.0000 34.1867 0.0000 0.0000 0.0000
q4_s2 0.9503 8.0631 0.0000 38.2689 0.0000 0.0000 0.0000
q4_s3 1.0159 0.0000 0.0000 0.0000 0.0000 0.0000 0.0000
q5_s1 0.7110 3.7579 0.0000 0.0000 0.0000 0.0000 0.0000
q5_s2 0.8777 1.6330 0.0000 0.0000 1.0350 -0.0717 -0.0733
q5_s3 0.9737 2.6641 0.0000 0.0000 1.0127 0.0000 0.0000
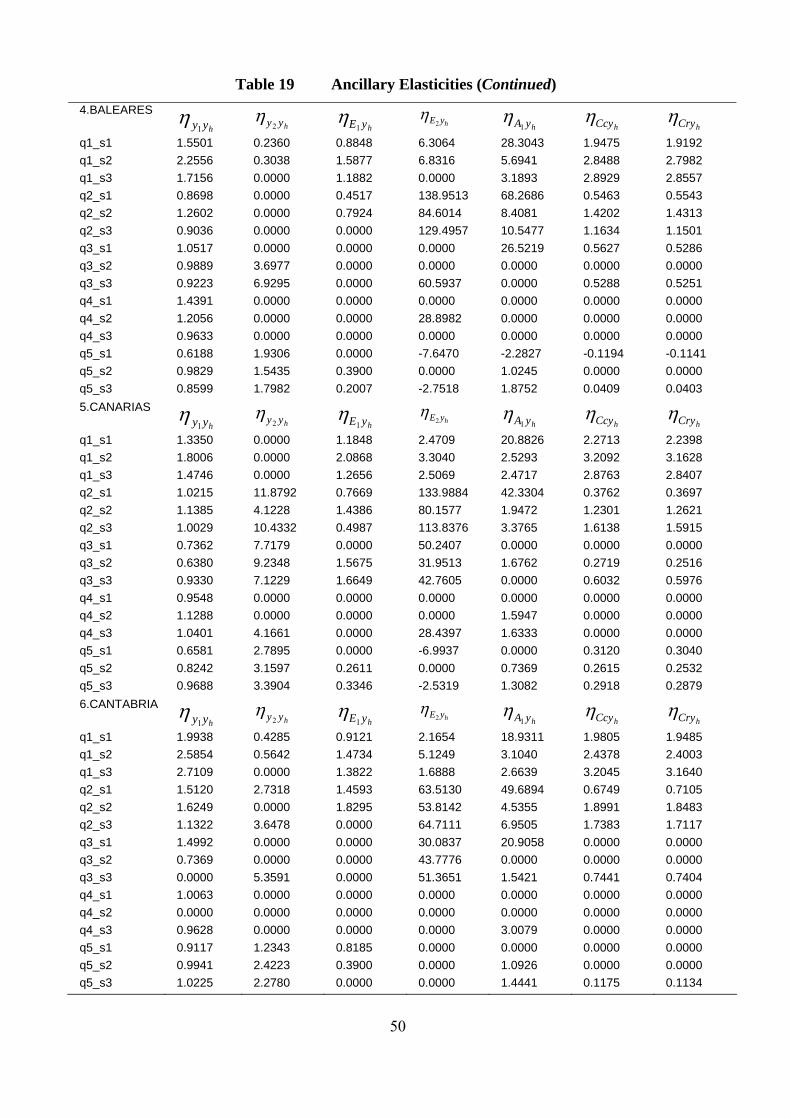
50
Table 19 Ancillary Elasticities (Continued)
4.BALEARES
hyy1 hyy2
hyE1
hyE2
hyA1
hCcy hCry
q1_s1 1.5501 0.2360 0.8848 6.3064 28.3043 1.9475 1.9192
q1_s2 2.2556 0.3038 1.5877 6.8316 5.6941 2.8488 2.7982
q1_s3 1.7156 0.0000 1.1882 0.0000 3.1893 2.8929 2.8557
q2_s1 0.8698 0.0000 0.4517 138.9513 68.2686 0.5463 0.5543
q2_s2 1.2602 0.0000 0.7924 84.6014 8.4081 1.4202 1.4313
q2_s3 0.9036 0.0000 0.0000 129.4957 10.5477 1.1634 1.1501
q3_s1 1.0517 0.0000 0.0000 0.0000 26.5219 0.5627 0.5286
q3_s2 0.9889 3.6977 0.0000 0.0000 0.0000 0.0000 0.0000
q3_s3 0.9223 6.9295 0.0000 60.5937 0.0000 0.5288 0.5251
q4_s1 1.4391 0.0000 0.0000 0.0000 0.0000 0.0000 0.0000
q4_s2 1.2056 0.0000 0.0000 28.8982 0.0000 0.0000 0.0000
q4_s3 0.9633 0.0000 0.0000 0.0000 0.0000 0.0000 0.0000
q5_s1 0.6188 1.9306 0.0000 -7.6470 -2.2827 -0.1194 -0.1141
q5_s2 0.9829 1.5435 0.3900 0.0000 1.0245 0.0000 0.0000
q5_s3 0.8599 1.7982 0.2007 -2.7518 1.8752 0.0409 0.0403
5.CANARIAS
hyy1 hyy2
hyE1
hyE2
hyA1
hCcy hCry
q1_s1 1.3350 0.0000 1.1848 2.4709 20.8826 2.2713 2.2398
q1_s2 1.8006 0.0000 2.0868 3.3040 2.5293 3.2092 3.1628
q1_s3 1.4746 0.0000 1.2656 2.5069 2.4717 2.8763 2.8407
q2_s1 1.0215 11.8792 0.7669 133.9884 42.3304 0.3762 0.3697
q2_s2 1.1385 4.1228 1.4386 80.1577 1.9472 1.2301 1.2621
q2_s3 1.0029 10.4332 0.4987 113.8376 3.3765 1.6138 1.5915
q3_s1 0.7362 7.7179 0.0000 50.2407 0.0000 0.0000 0.0000
q3_s2 0.6380 9.2348 1.5675 31.9513 1.6762 0.2719 0.2516
q3_s3 0.9330 7.1229 1.6649 42.7605 0.0000 0.6032 0.5976
q4_s1 0.9548 0.0000 0.0000 0.0000 0.0000 0.0000 0.0000
q4_s2 1.1288 0.0000 0.0000 0.0000 1.5947 0.0000 0.0000
q4_s3 1.0401 4.1661 0.0000 28.4397 1.6333 0.0000 0.0000
q5_s1 0.6581 2.7895 0.0000 -6.9937 0.0000 0.3120 0.3040
q5_s2 0.8242 3.1597 0.2611 0.0000 0.7369 0.2615 0.2532
q5_s3 0.9688 3.3904 0.3346 -2.5319 1.3082 0.2918 0.2879
6.CANTABRIA
hyy1 hyy2
hyE1
hyE2
hyA1
hCcy hCry
q1_s1 1.9938 0.4285 0.9121 2.1654 18.9311 1.9805 1.9485
q1_s2 2.5854 0.5642 1.4734 5.1249 3.1040 2.4378 2.4003
q1_s3 2.7109 0.0000 1.3822 1.6888 2.6639 3.2045 3.1640
q2_s1 1.5120 2.7318 1.4593 63.5130 49.6894 0.6749 0.7105
q2_s2 1.6249 0.0000 1.8295 53.8142 4.5355 1.8991 1.8483
q2_s3 1.1322 3.6478 0.0000 64.7111 6.9505 1.7383 1.7117
q3_s1 1.4992 0.0000 0.0000 30.0837 20.9058 0.0000 0.0000
q3_s2 0.7369 0.0000 0.0000 43.7776 0.0000 0.0000 0.0000
q3_s3 0.0000 5.3591 0.0000 51.3651 1.5421 0.7441 0.7404
q4_s1 1.0063 0.0000 0.0000 0.0000 0.0000 0.0000 0.0000
q4_s2 0.0000 0.0000 0.0000 0.0000 0.0000 0.0000 0.0000
q4_s3 0.9628 0.0000 0.0000 0.0000 3.0079 0.0000 0.0000
q5_s1 0.9117 1.2343 0.8185 0.0000 0.0000 0.0000 0.0000
q5_s2 0.9941 2.4223 0.3900 0.0000 1.0926 0.0000 0.0000
q5_s3 1.0225 2.2780 0.0000 0.0000 1.4441 0.1175 0.1134
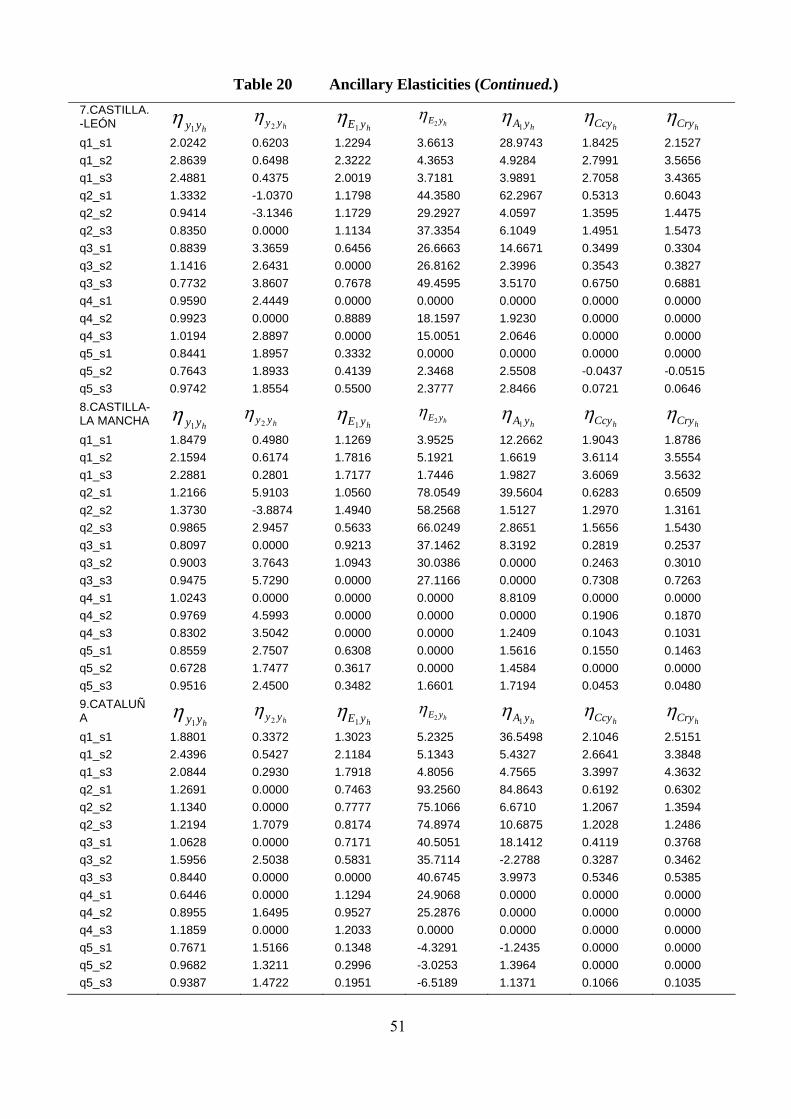
51
Table 20 Ancillary Elasticities (Continued.)
7.CASTILLA.-LEÓN hyy1
hyy2
hyE1 hyE2
hyA1
hCcy
hCry
q1_s1 2.0242 0.6203 1.2294 3.6613 28.9743 1.8425 2.1527
q1_s2 2.8639 0.6498 2.3222 4.3653 4.9284 2.7991 3.5656
q1_s3 2.4881 0.4375 2.0019 3.7181 3.9891 2.7058 3.4365
q2_s1 1.3332 -1.0370 1.1798 44.3580 62.2967 0.5313 0.6043
q2_s2 0.9414 -3.1346 1.1729 29.2927 4.0597 1.3595 1.4475
q2_s3 0.8350 0.0000 1.1134 37.3354 6.1049 1.4951 1.5473
q3_s1 0.8839 3.3659 0.6456 26.6663 14.6671 0.3499 0.3304
q3_s2 1.1416 2.6431 0.0000 26.8162 2.3996 0.3543 0.3827
q3_s3 0.7732 3.8607 0.7678 49.4595 3.5170 0.6750 0.6881
q4_s1 0.9590 2.4449 0.0000 0.0000 0.0000 0.0000 0.0000
q4_s2 0.9923 0.0000 0.8889 18.1597 1.9230 0.0000 0.0000
q4_s3 1.0194 2.8897 0.0000 15.0051 2.0646 0.0000 0.0000
q5_s1 0.8441 1.8957 0.3332 0.0000 0.0000 0.0000 0.0000
q5_s2 0.7643 1.8933 0.4139 2.3468 2.5508 -0.0437 -0.0515
q5_s3 0.9742 1.8554 0.5500 2.3777 2.8466 0.0721 0.0646
8.CASTILLA-LA MANCHA hyy1
hyy2
hyE1 hyE2
hyA1
hCcy
hCry
q1_s1 1.8479 0.4980 1.1269 3.9525 12.2662 1.9043 1.8786
q1_s2 2.1594 0.6174 1.7816 5.1921 1.6619 3.6114 3.5554
q1_s3 2.2881 0.2801 1.7177 1.7446 1.9827 3.6069 3.5632
q2_s1 1.2166 5.9103 1.0560 78.0549 39.5604 0.6283 0.6509
q2_s2 1.3730 -3.8874 1.4940 58.2568 1.5127 1.2970 1.3161
q2_s3 0.9865 2.9457 0.5633 66.0249 2.8651 1.5656 1.5430
q3_s1 0.8097 0.0000 0.9213 37.1462 8.3192 0.2819 0.2537
q3_s2 0.9003 3.7643 1.0943 30.0386 0.0000 0.2463 0.3010
q3_s3 0.9475 5.7290 0.0000 27.1166 0.0000 0.7308 0.7263
q4_s1 1.0243 0.0000 0.0000 0.0000 8.8109 0.0000 0.0000
q4_s2 0.9769 4.5993 0.0000 0.0000 0.0000 0.1906 0.1870
q4_s3 0.8302 3.5042 0.0000 0.0000 1.2409 0.1043 0.1031
q5_s1 0.8559 2.7507 0.6308 0.0000 1.5616 0.1550 0.1463
q5_s2 0.6728 1.7477 0.3617 0.0000 1.4584 0.0000 0.0000
q5_s3 0.9516 2.4500 0.3482 1.6601 1.7194 0.0453 0.0480
9.CATALUÑA hyy1
hyy2
hyE1 hyE2
hyA1
hCcy
hCry
q1_s1 1.8801 0.3372 1.3023 5.2325 36.5498 2.1046 2.5151
q1_s2 2.4396 0.5427 2.1184 5.1343 5.4327 2.6641 3.3848
q1_s3 2.0844 0.2930 1.7918 4.8056 4.7565 3.3997 4.3632
q2_s1 1.2691 0.0000 0.7463 93.2560 84.8643 0.6192 0.6302
q2_s2 1.1340 0.0000 0.7777 75.1066 6.6710 1.2067 1.3594
q2_s3 1.2194 1.7079 0.8174 74.8974 10.6875 1.2028 1.2486
q3_s1 1.0628 0.0000 0.7171 40.5051 18.1412 0.4119 0.3768
q3_s2 1.5956 2.5038 0.5831 35.7114 -2.2788 0.3287 0.3462
q3_s3 0.8440 0.0000 0.0000 40.6745 3.9973 0.5346 0.5385
q4_s1 0.6446 0.0000 1.1294 24.9068 0.0000 0.0000 0.0000
q4_s2 0.8955 1.6495 0.9527 25.2876 0.0000 0.0000 0.0000
q4_s3 1.1859 0.0000 1.2033 0.0000 0.0000 0.0000 0.0000
q5_s1 0.7671 1.5166 0.1348 -4.3291 -1.2435 0.0000 0.0000
q5_s2 0.9682 1.3211 0.2996 -3.0253 1.3964 0.0000 0.0000
q5_s3 0.9387 1.4722 0.1951 -6.5189 1.1371 0.1066 0.1035
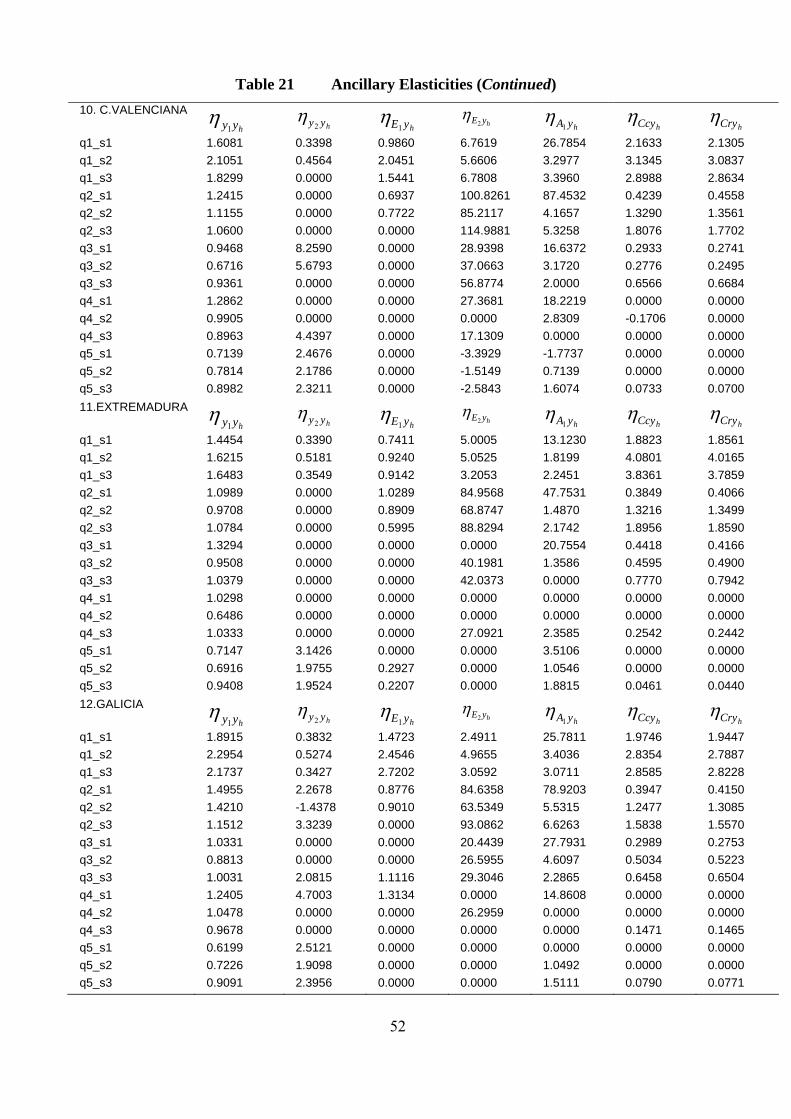
52
Table 21 Ancillary Elasticities (Continued)
10. C.VALENCIANA
hyy1 hyy2
hyE1
hyE2
hyA1
hCcy hCry
q1_s1 1.6081 0.3398 0.9860 6.7619 26.7854 2.1633 2.1305
q1_s2 2.1051 0.4564 2.0451 5.6606 3.2977 3.1345 3.0837
q1_s3 1.8299 0.0000 1.5441 6.7808 3.3960 2.8988 2.8634
q2_s1 1.2415 0.0000 0.6937 100.8261 87.4532 0.4239 0.4558
q2_s2 1.1155 0.0000 0.7722 85.2117 4.1657 1.3290 1.3561
q2_s3 1.0600 0.0000 0.0000 114.9881 5.3258 1.8076 1.7702
q3_s1 0.9468 8.2590 0.0000 28.9398 16.6372 0.2933 0.2741
q3_s2 0.6716 5.6793 0.0000 37.0663 3.1720 0.2776 0.2495
q3_s3 0.9361 0.0000 0.0000 56.8774 2.0000 0.6566 0.6684
q4_s1 1.2862 0.0000 0.0000 27.3681 18.2219 0.0000 0.0000
q4_s2 0.9905 0.0000 0.0000 0.0000 2.8309 -0.1706 0.0000
q4_s3 0.8963 4.4397 0.0000 17.1309 0.0000 0.0000 0.0000
q5_s1 0.7139 2.4676 0.0000 -3.3929 -1.7737 0.0000 0.0000
q5_s2 0.7814 2.1786 0.0000 -1.5149 0.7139 0.0000 0.0000
q5_s3 0.8982 2.3211 0.0000 -2.5843 1.6074 0.0733 0.0700
11.EXTREMADURA
hyy1 hyy2
hyE1
hyE2
hyA1
hCcy hCry
q1_s1 1.4454 0.3390 0.7411 5.0005 13.1230 1.8823 1.8561
q1_s2 1.6215 0.5181 0.9240 5.0525 1.8199 4.0801 4.0165
q1_s3 1.6483 0.3549 0.9142 3.2053 2.2451 3.8361 3.7859
q2_s1 1.0989 0.0000 1.0289 84.9568 47.7531 0.3849 0.4066
q2_s2 0.9708 0.0000 0.8909 68.8747 1.4870 1.3216 1.3499
q2_s3 1.0784 0.0000 0.5995 88.8294 2.1742 1.8956 1.8590
q3_s1 1.3294 0.0000 0.0000 0.0000 20.7554 0.4418 0.4166
q3_s2 0.9508 0.0000 0.0000 40.1981 1.3586 0.4595 0.4900
q3_s3 1.0379 0.0000 0.0000 42.0373 0.0000 0.7770 0.7942
q4_s1 1.0298 0.0000 0.0000 0.0000 0.0000 0.0000 0.0000
q4_s2 0.6486 0.0000 0.0000 0.0000 0.0000 0.0000 0.0000
q4_s3 1.0333 0.0000 0.0000 27.0921 2.3585 0.2542 0.2442
q5_s1 0.7147 3.1426 0.0000 0.0000 3.5106 0.0000 0.0000
q5_s2 0.6916 1.9755 0.2927 0.0000 1.0546 0.0000 0.0000
q5_s3 0.9408 1.9524 0.2207 0.0000 1.8815 0.0461 0.0440
12.GALICIA
hyy1 hyy2
hyE1
hyE2
hyA1
hCcy hCry
q1_s1 1.8915 0.3832 1.4723 2.4911 25.7811 1.9746 1.9447
q1_s2 2.2954 0.5274 2.4546 4.9655 3.4036 2.8354 2.7887
q1_s3 2.1737 0.3427 2.7202 3.0592 3.0711 2.8585 2.8228
q2_s1 1.4955 2.2678 0.8776 84.6358 78.9203 0.3947 0.4150
q2_s2 1.4210 -1.4378 0.9010 63.5349 5.5315 1.2477 1.3085
q2_s3 1.1512 3.3239 0.0000 93.0862 6.6263 1.5838 1.5570
q3_s1 1.0331 0.0000 0.0000 20.4439 27.7931 0.2989 0.2753
q3_s2 0.8813 0.0000 0.0000 26.5955 4.6097 0.5034 0.5223
q3_s3 1.0031 2.0815 1.1116 29.3046 2.2865 0.6458 0.6504
q4_s1 1.2405 4.7003 1.3134 0.0000 14.8608 0.0000 0.0000
q4_s2 1.0478 0.0000 0.0000 26.2959 0.0000 0.0000 0.0000
q4_s3 0.9678 0.0000 0.0000 0.0000 0.0000 0.1471 0.1465
q5_s1 0.6199 2.5121 0.0000 0.0000 0.0000 0.0000 0.0000
q5_s2 0.7226 1.9098 0.0000 0.0000 1.0492 0.0000 0.0000
q5_s3 0.9091 2.3956 0.0000 0.0000 1.5111 0.0790 0.0771
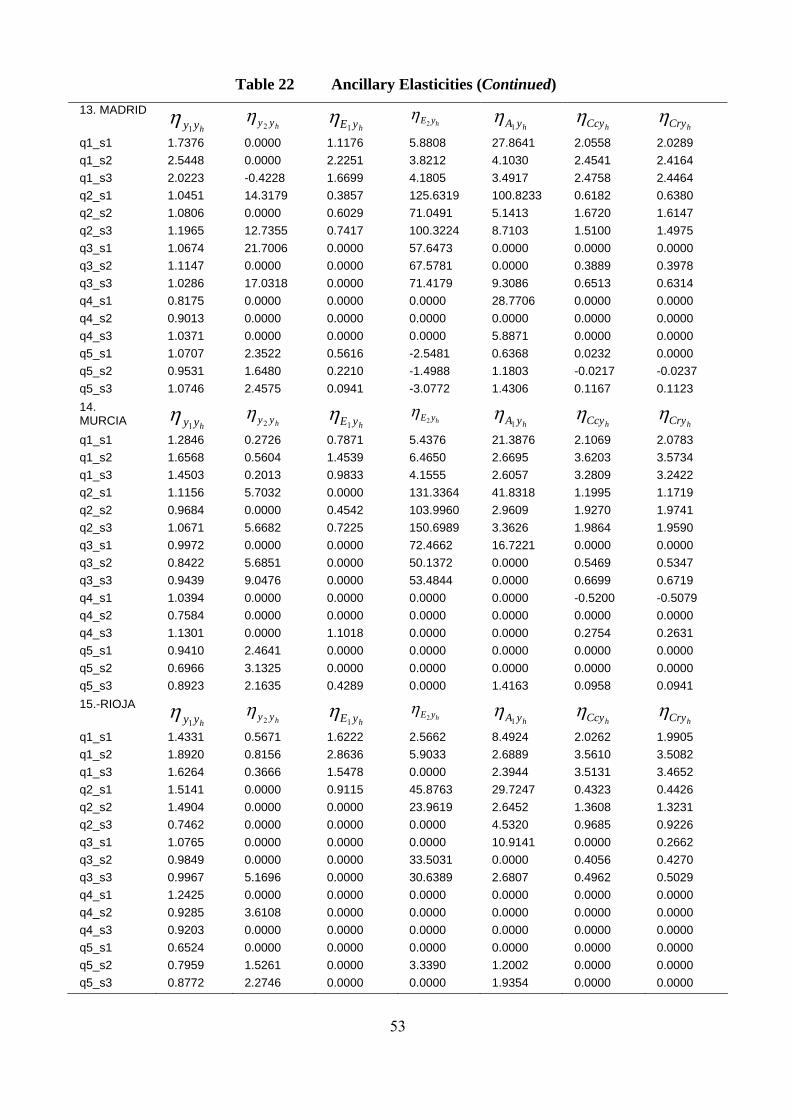
53
Table 22 Ancillary Elasticities (Continued)
13. MADRID
hyy1 hyy2
hyE1
hyE2
hyA1
hCcy hCry
q1_s1 1.7376 0.0000 1.1176 5.8808 27.8641 2.0558 2.0289
q1_s2 2.5448 0.0000 2.2251 3.8212 4.1030 2.4541 2.4164
q1_s3 2.0223 -0.4228 1.6699 4.1805 3.4917 2.4758 2.4464
q2_s1 1.0451 14.3179 0.3857 125.6319 100.8233 0.6182 0.6380
q2_s2 1.0806 0.0000 0.6029 71.0491 5.1413 1.6720 1.6147
q2_s3 1.1965 12.7355 0.7417 100.3224 8.7103 1.5100 1.4975
q3_s1 1.0674 21.7006 0.0000 57.6473 0.0000 0.0000 0.0000
q3_s2 1.1147 0.0000 0.0000 67.5781 0.0000 0.3889 0.3978
q3_s3 1.0286 17.0318 0.0000 71.4179 9.3086 0.6513 0.6314
q4_s1 0.8175 0.0000 0.0000 0.0000 28.7706 0.0000 0.0000
q4_s2 0.9013 0.0000 0.0000 0.0000 0.0000 0.0000 0.0000
q4_s3 1.0371 0.0000 0.0000 0.0000 5.8871 0.0000 0.0000
q5_s1 1.0707 2.3522 0.5616 -2.5481 0.6368 0.0232 0.0000
q5_s2 0.9531 1.6480 0.2210 -1.4988 1.1803 -0.0217 -0.0237
q5_s3 1.0746 2.4575 0.0941 -3.0772 1.4306 0.1167 0.1123
14. MURCIA hyy1
hyy2
hyE1 hyE2
hyA1
hCcy
hCry
q1_s1 1.2846 0.2726 0.7871 5.4376 21.3876 2.1069 2.0783
q1_s2 1.6568 0.5604 1.4539 6.4650 2.6695 3.6203 3.5734
q1_s3 1.4503 0.2013 0.9833 4.1555 2.6057 3.2809 3.2422
q2_s1 1.1156 5.7032 0.0000 131.3364 41.8318 1.1995 1.1719
q2_s2 0.9684 0.0000 0.4542 103.9960 2.9609 1.9270 1.9741
q2_s3 1.0671 5.6682 0.7225 150.6989 3.3626 1.9864 1.9590
q3_s1 0.9972 0.0000 0.0000 72.4662 16.7221 0.0000 0.0000
q3_s2 0.8422 5.6851 0.0000 50.1372 0.0000 0.5469 0.5347
q3_s3 0.9439 9.0476 0.0000 53.4844 0.0000 0.6699 0.6719
q4_s1 1.0394 0.0000 0.0000 0.0000 0.0000 -0.5200 -0.5079
q4_s2 0.7584 0.0000 0.0000 0.0000 0.0000 0.0000 0.0000
q4_s3 1.1301 0.0000 1.1018 0.0000 0.0000 0.2754 0.2631
q5_s1 0.9410 2.4641 0.0000 0.0000 0.0000 0.0000 0.0000
q5_s2 0.6966 3.1325 0.0000 0.0000 0.0000 0.0000 0.0000
q5_s3 0.8923 2.1635 0.4289 0.0000 1.4163 0.0958 0.0941
15.-RIOJA
hyy1 hyy2
hyE1
hyE2
hyA1
hCcy hCry
q1_s1 1.4331 0.5671 1.6222 2.5662 8.4924 2.0262 1.9905
q1_s2 1.8920 0.8156 2.8636 5.9033 2.6889 3.5610 3.5082
q1_s3 1.6264 0.3666 1.5478 0.0000 2.3944 3.5131 3.4652
q2_s1 1.5141 0.0000 0.9115 45.8763 29.7247 0.4323 0.4426
q2_s2 1.4904 0.0000 0.0000 23.9619 2.6452 1.3608 1.3231
q2_s3 0.7462 0.0000 0.0000 0.0000 4.5320 0.9685 0.9226
q3_s1 1.0765 0.0000 0.0000 0.0000 10.9141 0.0000 0.2662
q3_s2 0.9849 0.0000 0.0000 33.5031 0.0000 0.4056 0.4270
q3_s3 0.9967 5.1696 0.0000 30.6389 2.6807 0.4962 0.5029
q4_s1 1.2425 0.0000 0.0000 0.0000 0.0000 0.0000 0.0000
q4_s2 0.9285 3.6108 0.0000 0.0000 0.0000 0.0000 0.0000
q4_s3 0.9203 0.0000 0.0000 0.0000 0.0000 0.0000 0.0000
q5_s1 0.6524 0.0000 0.0000 0.0000 0.0000 0.0000 0.0000
q5_s2 0.7959 1.5261 0.0000 3.3390 1.2002 0.0000 0.0000
q5_s3 0.8772 2.2746 0.0000 0.0000 1.9354 0.0000 0.0000

54
Table 23 Ancillary Elasticities (Continued)
1. ANDALUCIA 2.ARAGÓN 3.ASTURIAS 4.BALEARES
hyA2
hyA2
hyA2
hyA2
q1y1_s1 -2.3045 -2.3926 -1.8299 -1.6309 q1y1_s2 -1.2318 -1.0804 -1.0348 -1.3616 q1y1_s3 -1.2811 -1.4364 -1.1986 -1.1720 q2y1 27.8889 0.0000 0.0000 0.0000 q3y1 0.0000 0.0000 0.0000 0.0000 q4y1 0.0000 0.0000 0.0000 0.0000 q5y1 0.0000 0.0000 0.0000 0.0000 5. CANARIAS 6.CANTABRIA 7.CASTILLA-LEÓN 8.CASTILLA-LAMANCHA
hyA2
hyA2
hyA2
hyA2
q1y1_s1 -2.4492 -2.9433 -3.0592 -3.1073 q1y1_s2 -1.5713 -1.2506 -1.5991 -1.7577 q1y1_s3 -1.1071 -1.3995 -1.4823 -1.4018 q2y1 0.0000 0.0000 11.7329 0.0000 q3y1 0.0000 0.0000 0.0000 0.0000 q4y1 0.0000 0.0000 0.0000 0.0000 q5y1 0.0000 0.0000 0.0000 0.0000 9.CATALUÑA 10. C. VALENCIANA 11.EXTREMADURA 12.GALICIA
hyA2
hyA2
hyA2
hyA2
q1y1_s1 -1.7060 -1.5217 0.0000 -2.9982 q1y1_s2 -1.2424 -1.3263 -1.8460 -2.2999 q1y1_s3 -1.4376 -1.1180 -1.7441 -2.0975 q2y1 19.5174 0.0000 0.0000 0.0000 q3y1 0.0000 0.0000 0.0000 0.0000 q4y1 0.0000 0.0000 0.0000 0.0000 q5y1 0.0000 0.0000 0.0000 0.0000 13.MADRID 14.MURCIA 15.RIOJA
hyA2
hyA2
hyA2
q1y1_s1 -0.8009 -1.8647 -3.0001 q1y1_s2 -0.7080 -1.4009 -1.2561 q1y1_s3 -0.6662 -1.3354 -2.0290 q2y1 0.0000 0.0000 0.0000 q3y1 0.0000 0.0000 0.0000 q4y1 0.0000 0.0000 0.0000 q5y1 0.0000 0.0000 0.0000
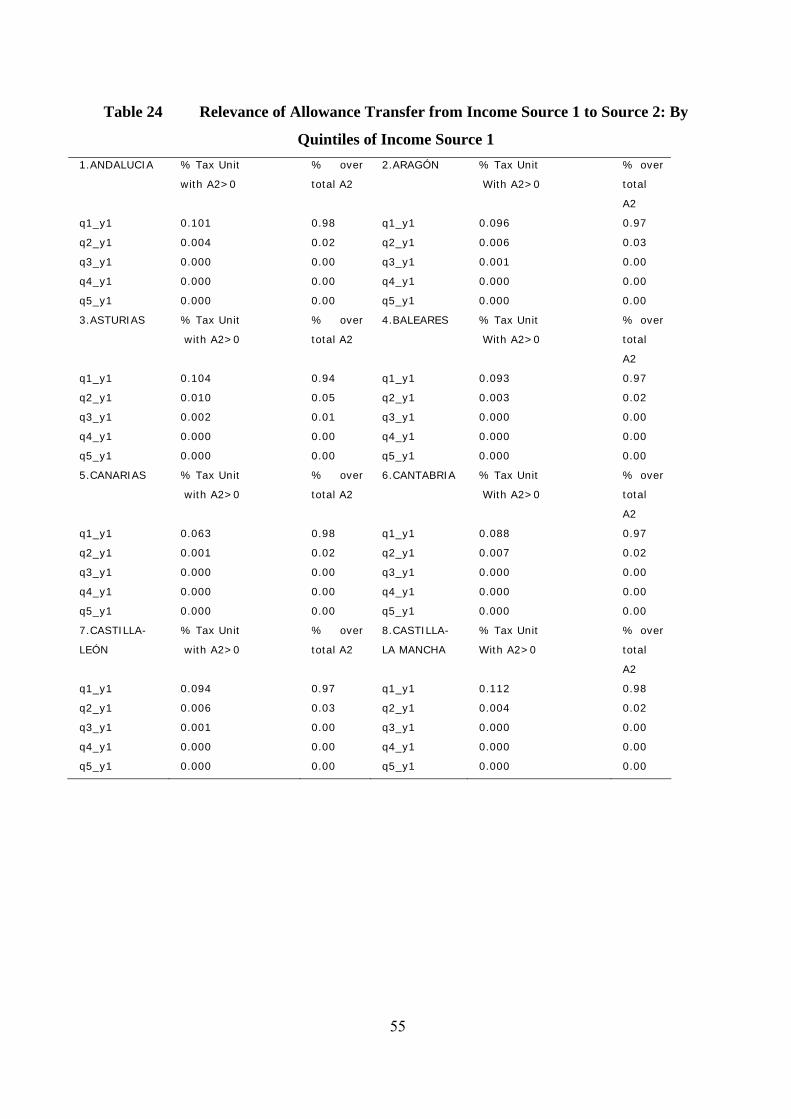
55
Table 24 Relevance of Allowance Transfer from Income Source 1 to Source 2: By
Quintiles of Income Source 1
1.ANDALUCIA % Tax Unit
with A2>0
% over
total A2
2.ARAGÓN % Tax Unit
With A2>0
% over
total
A2
q1_y1 0.101 0.98 q1_y1 0.096 0.97
q2_y1 0.004 0.02 q2_y1 0.006 0.03
q3_y1 0.000 0.00 q3_y1 0.001 0.00
q4_y1 0.000 0.00 q4_y1 0.000 0.00
q5_y1
3.ASTURIAS
0.000
% Tax Unit
with A2>0
0.00
% over
total A2
q5_y1
4.BALEARES
0.000
% Tax Unit
With A2>0
0.00
% over
total
A2
q1_y1 0.104 0.94 q1_y1 0.093 0.97
q2_y1 0.010 0.05 q2_y1 0.003 0.02
q3_y1 0.002 0.01 q3_y1 0.000 0.00
q4_y1 0.000 0.00 q4_y1 0.000 0.00
q5_y1
5.CANARIAS
0.000
% Tax Unit
with A2>0
0.00
% over
total A2
q5_y1
6.CANTABRIA
0.000
% Tax Unit
With A2>0
0.00
% over
total
A2
q1_y1 0.063 0.98 q1_y1 0.088 0.97
q2_y1 0.001 0.02 q2_y1 0.007 0.02
q3_y1 0.000 0.00 q3_y1 0.000 0.00
q4_y1 0.000 0.00 q4_y1 0.000 0.00
q5_y1
7.CASTILLA-
LEÓN
0.000
% Tax Unit
with A2>0
0.00
% over
total A2
q5_y1
8.CASTILLA-
LA MANCHA
0.000
% Tax Unit
With A2>0
0.00
% over
total
A2
q1_y1 0.094 0.97 q1_y1 0.112 0.98
q2_y1 0.006 0.03 q2_y1 0.004 0.02
q3_y1 0.001 0.00 q3_y1 0.000 0.00
q4_y1 0.000 0.00 q4_y1 0.000 0.00
q5_y1 0.000 0.00 q5_y1 0.000 0.00
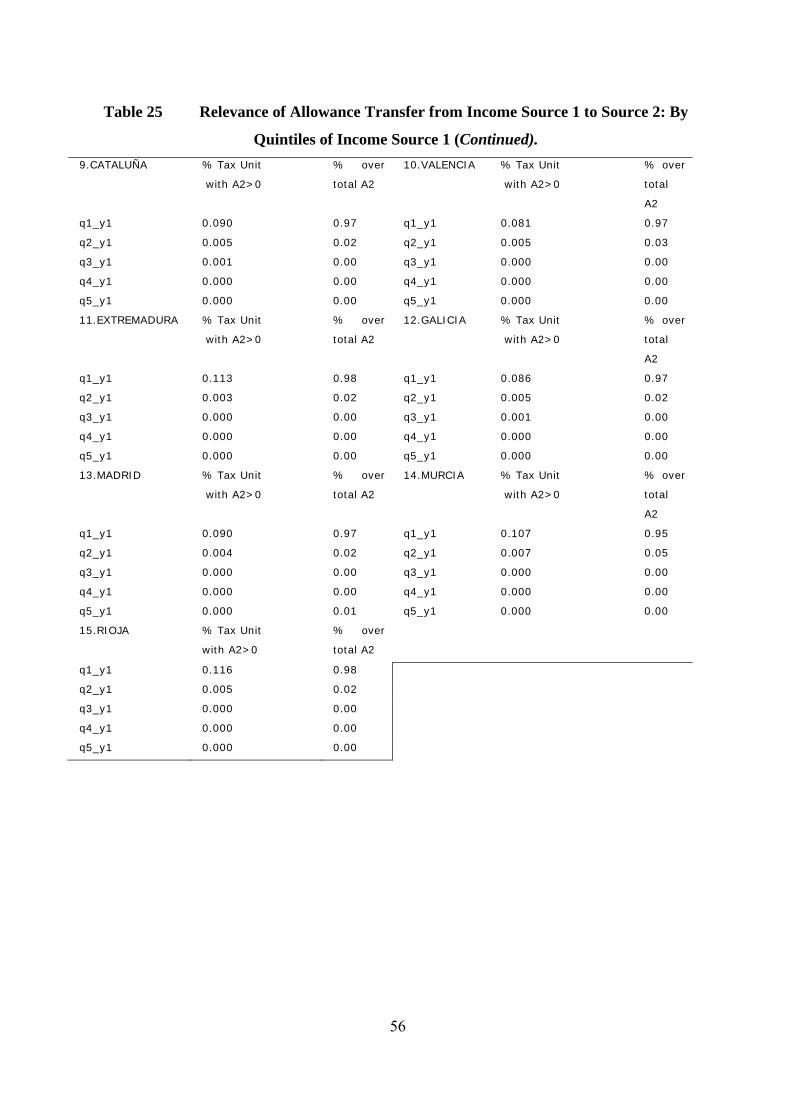
56
Table 25 Relevance of Allowance Transfer from Income Source 1 to Source 2: By
Quintiles of Income Source 1 (Continued).
9.CATALUÑA % Tax Unit
with A2>0
% over
total A2
10.VALENCIA % Tax Unit
with A2>0
% over
total
A2
q1_y1 0.090 0.97 q1_y1 0.081 0.97
q2_y1 0.005 0.02 q2_y1 0.005 0.03
q3_y1 0.001 0.00 q3_y1 0.000 0.00
q4_y1 0.000 0.00 q4_y1 0.000 0.00
q5_y1
11.EXTREMADURA
0.000
% Tax Unit
with A2>0
0.00
% over
total A2
q5_y1
12.GALICIA
0.000
% Tax Unit
with A2>0
0.00
% over
total
A2
q1_y1 0.113 0.98 q1_y1 0.086 0.97
q2_y1 0.003 0.02 q2_y1 0.005 0.02
q3_y1 0.000 0.00 q3_y1 0.001 0.00
q4_y1 0.000 0.00 q4_y1 0.000 0.00
q5_y1
13.MADRID
0.000
% Tax Unit
with A2>0
0.00
% over
total A2
q5_y1
14.MURCIA
0.000
% Tax Unit
with A2>0
0.00
% over
total
A2
q1_y1 0.090 0.97 q1_y1 0.107 0.95
q2_y1 0.004 0.02 q2_y1 0.007 0.05
q3_y1 0.000 0.00 q3_y1 0.000 0.00
q4_y1 0.000 0.00 q4_y1 0.000 0.00
q5_y1
15.RIOJA
0.000
% Tax Unit
with A2>0
0.01
% over
total A2
q5_y1 0.000 0.00
q1_y1 0.116 0.98
q2_y1 0.005 0.02
q3_y1 0.000 0.00
q4_y1 0.000 0.00
q5_y1 0.000 0.00
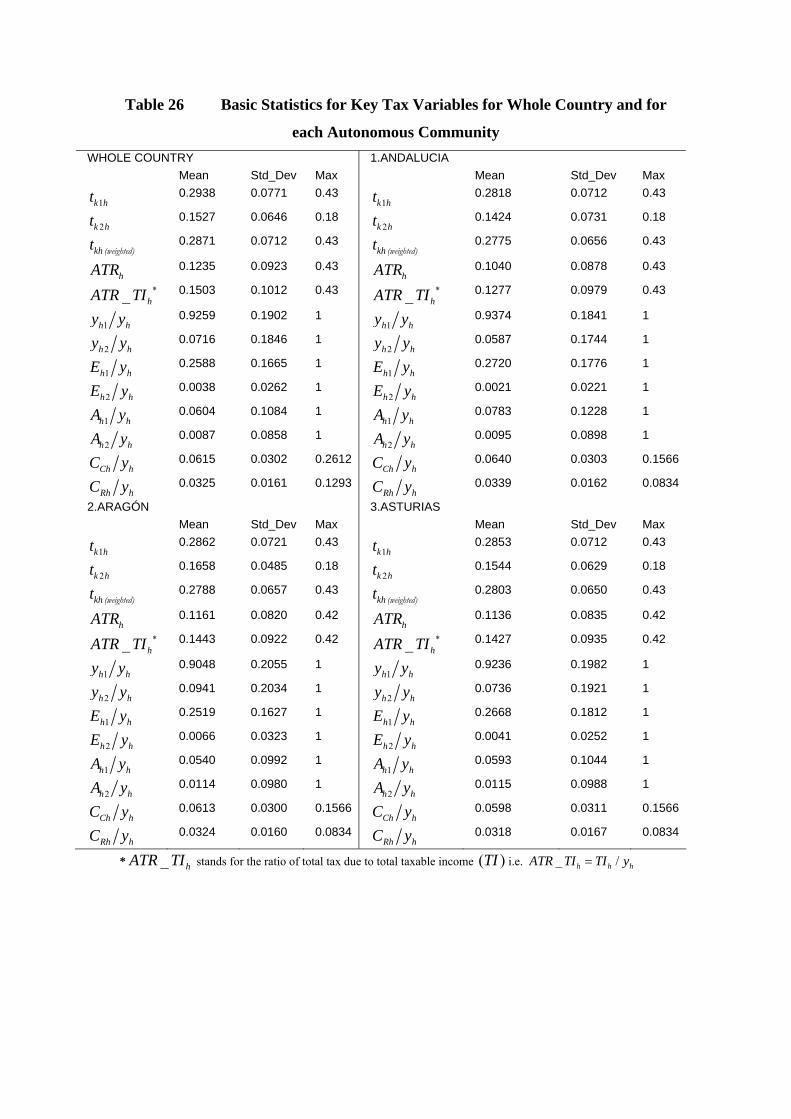
Table 26 Basic Statistics for Key Tax Variables for Whole Country and for
each Autonomous Community
WHOLE COUNTRY 1.ANDALUCIA
Mean Std_Dev Max Mean Std_Dev Max
1k ht 0.2938 0.0771 0.43 1k ht 0.2818 0.0712 0.43
2k ht 0.1527 0.0646 0.18 2k ht 0.1424 0.0731 0.18
(weighted)kht 0.2871 0.0712 0.43 (weighted)kht 0.2775 0.0656 0.43
hATR 0.1235 0.0923 0.43 hATR 0.1040 0.0878 0.43
*_ hATR TI 0.1503 0.1012 0.43 *_ hATR TI 0.1277 0.0979 0.43
1h hy y 0.9259 0.1902 1 1h hy y 0.9374 0.1841 1
2h hy y 0.0716 0.1846 1 2h hy y 0.0587 0.1744 1
1h hE y 0.2588 0.1665 1 1h hE y 0.2720 0.1776 1
2h hE y 0.0038 0.0262 1 2h hE y 0.0021 0.0221 1
1h hA y 0.0604 0.1084 1 1h hA y 0.0783 0.1228 1
2h hA y 0.0087 0.0858 1 2h hA y 0.0095 0.0898 1
Ch hC y 0.0615 0.0302 0.2612 Ch hC y 0.0640 0.0303 0.1566
Rh hC y 0.0325 0.0161 0.1293 Rh hC y 0.0339 0.0162 0.0834
2.ARAGÓN 3.ASTURIAS
Mean Std_Dev Max Mean Std_Dev Max
1k ht 0.2862 0.0721 0.43 1k ht 0.2853 0.0712 0.43
2k ht 0.1658 0.0485 0.18 2k ht 0.1544 0.0629 0.18
(weighted)kht 0.2788 0.0657 0.43 (weighted)kht 0.2803 0.0650 0.43
hATR 0.1161 0.0820 0.42 hATR 0.1136 0.0835 0.42
*_ hATR TI 0.1443 0.0922 0.42 *_ hATR TI 0.1427 0.0935 0.42
1h hy y 0.9048 0.2055 1 1h hy y 0.9236 0.1982 1
2h hy y 0.0941 0.2034 1 2h hy y 0.0736 0.1921 1
1h hE y 0.2519 0.1627 1 1h hE y 0.2668 0.1812 1
2h hE y 0.0066 0.0323 1 2h hE y 0.0041 0.0252 1
1h hA y 0.0540 0.0992 1 1h hA y 0.0593 0.1044 1
2h hA y 0.0114 0.0980 1 2h hA y 0.0115 0.0988 1
Ch hC y 0.0613 0.0300 0.1566 Ch hC y 0.0598 0.0311 0.1566
Rh hC y 0.0324 0.0160 0.0834 Rh hC y 0.0318 0.0167 0.0834
* _ hATR TI stands for the ratio of total tax due to total taxable income ( )TI i.e. _ /h h hATR TI TI y
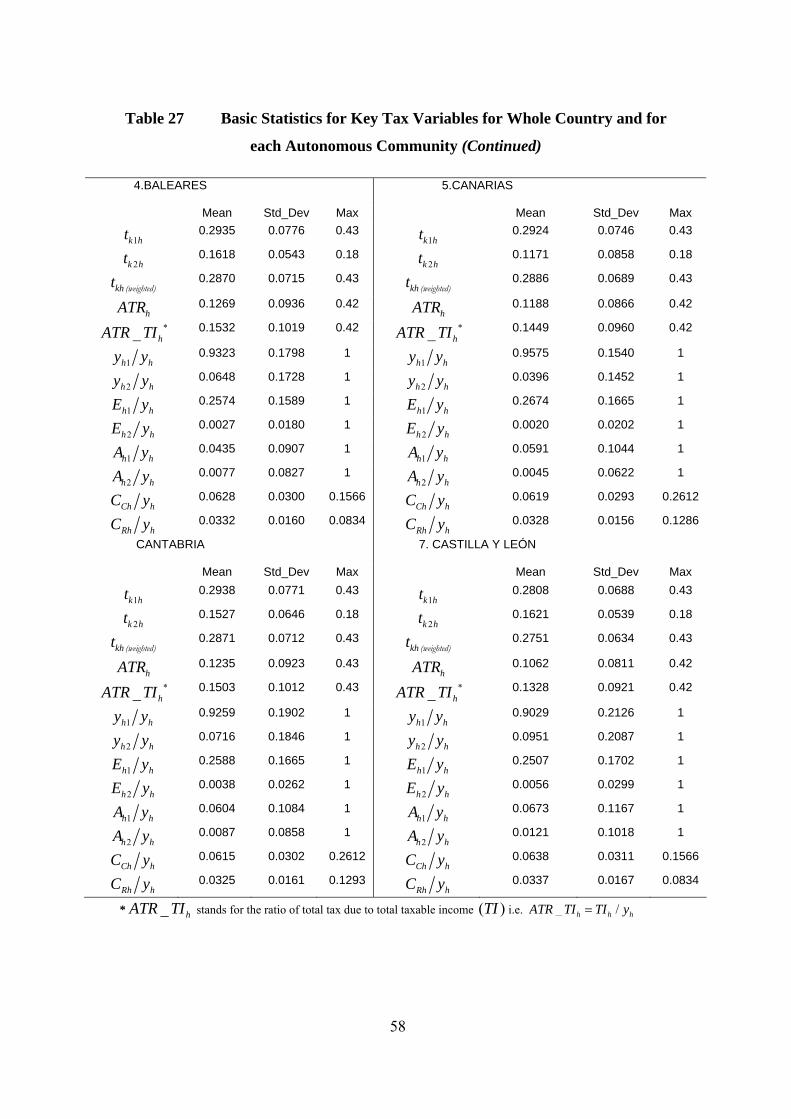
58
Table 27 Basic Statistics for Key Tax Variables for Whole Country and for
each Autonomous Community (Continued)
4.BALEARES
5.CANARIAS
Mean Std_Dev Max Mean Std_Dev Max
1k ht 0.2935 0.0776 0.43 1k ht 0.2924 0.0746 0.43
2k ht 0.1618 0.0543 0.18 2k ht 0.1171 0.0858 0.18
(weighted)kht 0.2870 0.0715 0.43 (weighted)kht 0.2886 0.0689 0.43
hATR 0.1269 0.0936 0.42 hATR 0.1188 0.0866 0.42
*_ hATR TI 0.1532 0.1019 0.42 *_ hATR TI 0.1449 0.0960 0.42
1h hy y 0.9323 0.1798 1 1h hy y 0.9575 0.1540 1
2h hy y 0.0648 0.1728 1 2h hy y 0.0396 0.1452 1
1h hE y 0.2574 0.1589 1 1h hE y 0.2674 0.1665 1
2h hE y 0.0027 0.0180 1 2h hE y 0.0020 0.0202 1
1h hA y 0.0435 0.0907 1 1h hA y 0.0591 0.1044 1
2h hA y 0.0077 0.0827 1 2h hA y 0.0045 0.0622 1
Ch hC y 0.0628 0.0300 0.1566 Ch hC y 0.0619 0.0293 0.2612
Rh hC y 0.0332 0.0160 0.0834 Rh hC y 0.0328 0.0156 0.1286
CANTABRIA
7. CASTILLA Y LEÓN
Mean Std_Dev Max Mean Std_Dev Max
1k ht 0.2938 0.0771 0.43 1k ht 0.2808 0.0688 0.43
2k ht 0.1527 0.0646 0.18 2k ht 0.1621 0.0539 0.18
(weighted)kht 0.2871 0.0712 0.43 (weighted)kht 0.2751 0.0634 0.43
hATR 0.1235 0.0923 0.43 hATR 0.1062 0.0811 0.42
*_ hATR TI 0.1503 0.1012 0.43 *_ hATR TI 0.1328 0.0921 0.42
1h hy y 0.9259 0.1902 1 1h hy y 0.9029 0.2126 1
2h hy y 0.0716 0.1846 1 2h hy y 0.0951 0.2087 1
1h hE y 0.2588 0.1665 1 1h hE y 0.2507 0.1702 1
2h hE y 0.0038 0.0262 1 2h hE y 0.0056 0.0299 1
1h hA y 0.0604 0.1084 1 1h hA y 0.0673 0.1167 1
2h hA y 0.0087 0.0858 1 2h hA y 0.0121 0.1018 1
Ch hC y 0.0615 0.0302 0.2612 Ch hC y 0.0638 0.0311 0.1566
Rh hC y 0.0325 0.0161 0.1293 Rh hC y 0.0337 0.0167 0.0834
* _ hATR TI stands for the ratio of total tax due to total taxable income ( )TI i.e. _ /h h hATR TI TI y
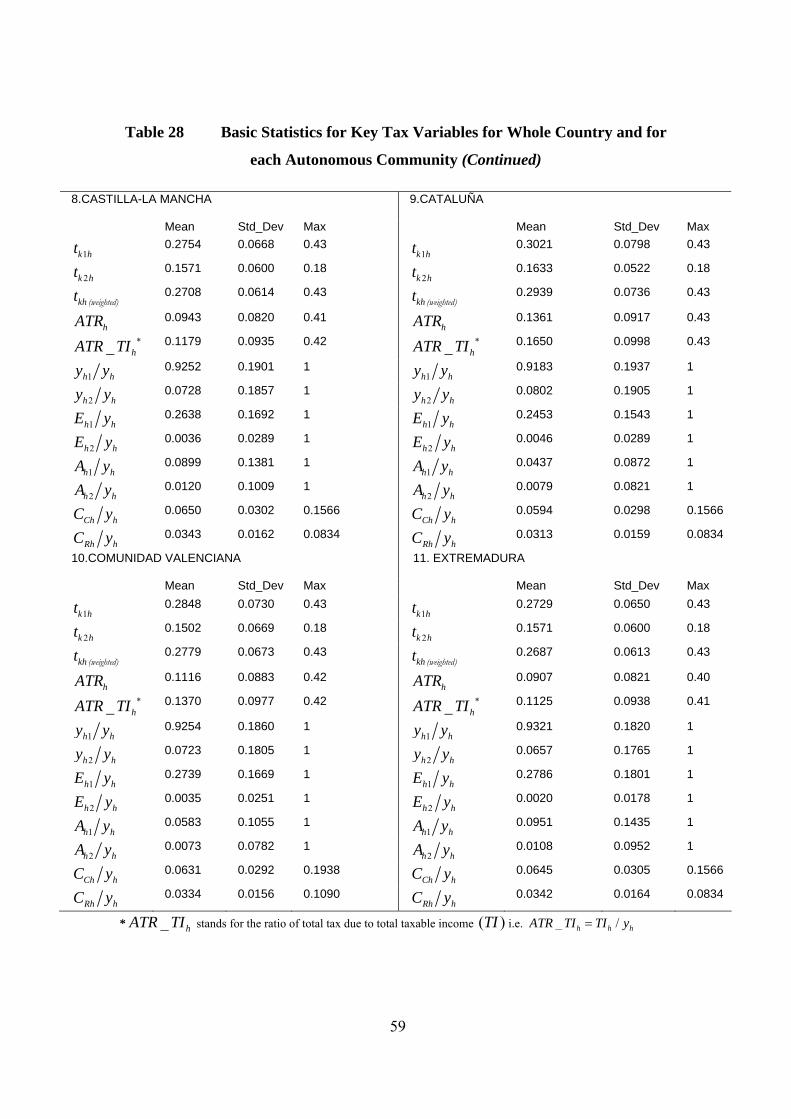
59
Table 28 Basic Statistics for Key Tax Variables for Whole Country and for
each Autonomous Community (Continued)
8.CASTILLA-LA MANCHA
9.CATALUÑA
Mean Std_Dev Max Mean Std_Dev Max
1k ht 0.2754 0.0668 0.43 1k ht 0.3021 0.0798 0.43
2k ht 0.1571 0.0600 0.18 2k ht 0.1633 0.0522 0.18
(weighted)kht 0.2708 0.0614 0.43 (weighted)kht 0.2939 0.0736 0.43
hATR 0.0943 0.0820 0.41 hATR 0.1361 0.0917 0.43
*_ hATR TI 0.1179 0.0935 0.42 *_ hATR TI 0.1650 0.0998 0.43
1h hy y 0.9252 0.1901 1 1h hy y 0.9183 0.1937 1
2h hy y 0.0728 0.1857 1 2h hy y 0.0802 0.1905 1
1h hE y 0.2638 0.1692 1 1h hE y 0.2453 0.1543 1
2h hE y 0.0036 0.0289 1 2h hE y 0.0046 0.0289 1
1h hA y 0.0899 0.1381 1 1h hA y 0.0437 0.0872 1
2h hA y 0.0120 0.1009 1 2h hA y 0.0079 0.0821 1
Ch hC y 0.0650 0.0302 0.1566 Ch hC y 0.0594 0.0298 0.1566
Rh hC y 0.0343 0.0162 0.0834 Rh hC y 0.0313 0.0159 0.0834
10.COMUNIDAD VALENCIANA
11. EXTREMADURA
Mean Std_Dev Max Mean Std_Dev Max
1k ht 0.2848 0.0730 0.43 1k ht 0.2729 0.0650 0.43
2k ht 0.1502 0.0669 0.18 2k ht 0.1571 0.0600 0.18
(weighted)kht 0.2779 0.0673 0.43 (weighted)kht 0.2687 0.0613 0.43
hATR 0.1116 0.0883 0.42 hATR 0.0907 0.0821 0.40
*_ hATR TI 0.1370 0.0977 0.42 *_ hATR TI 0.1125 0.0938 0.41
1h hy y 0.9254 0.1860 1 1h hy y 0.9321 0.1820 1
2h hy y 0.0723 0.1805 1 2h hy y 0.0657 0.1765 1
1h hE y 0.2739 0.1669 1 1h hE y 0.2786 0.1801 1
2h hE y 0.0035 0.0251 1 2h hE y 0.0020 0.0178 1
1h hA y 0.0583 0.1055 1 1h hA y 0.0951 0.1435 1
2h hA y 0.0073 0.0782 1 2h hA y 0.0108 0.0952 1
Ch hC y 0.0631 0.0292 0.1938 Ch hC y 0.0645 0.0305 0.1566
Rh hC y 0.0334 0.0156 0.1090 Rh hC y 0.0342 0.0164 0.0834
* _ hATR TI stands for the ratio of total tax due to total taxable income ( )TI i.e. _ /h h hATR TI TI y
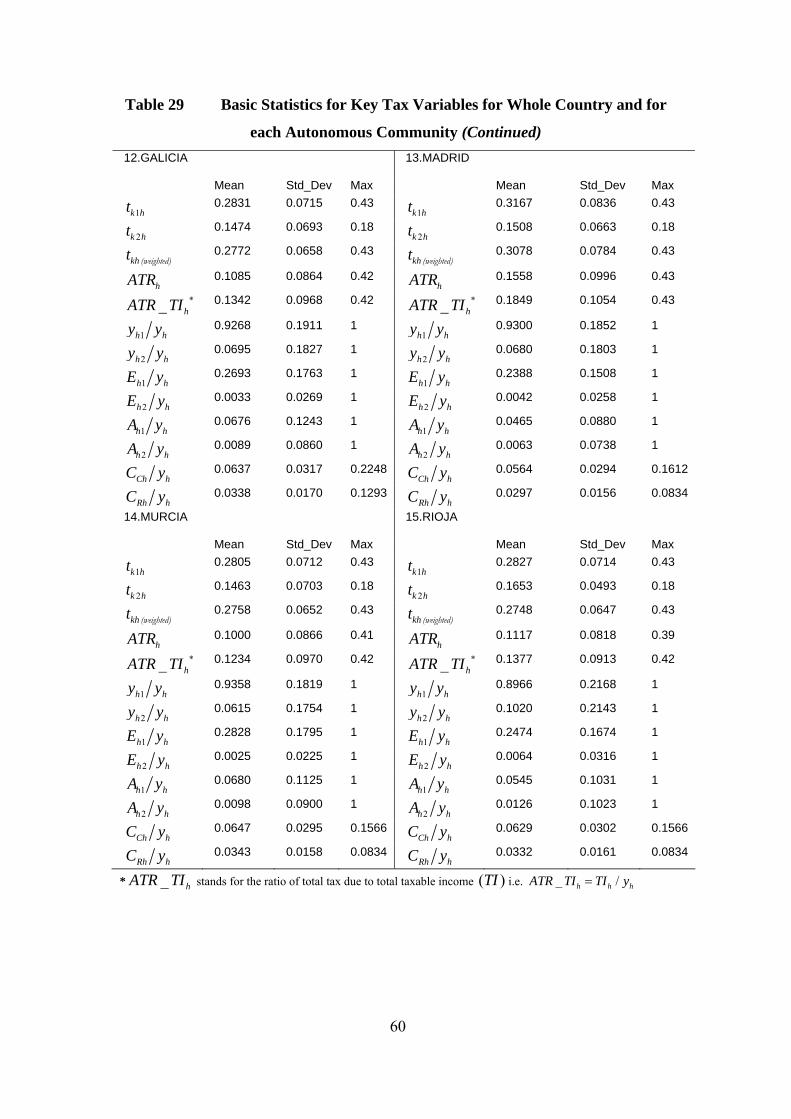
60
Table 29 Basic Statistics for Key Tax Variables for Whole Country and for
each Autonomous Community (Continued)
12.GALICIA
13.MADRID
Mean Std_Dev Max Mean Std_Dev Max
1k ht 0.2831 0.0715 0.43 1k ht 0.3167 0.0836 0.43
2k ht 0.1474 0.0693 0.18 2k ht 0.1508 0.0663 0.18
(weighted)kht 0.2772 0.0658 0.43 (weighted)kht 0.3078 0.0784 0.43
hATR 0.1085 0.0864 0.42 hATR 0.1558 0.0996 0.43
*_ hATR TI 0.1342 0.0968 0.42 *_ hATR TI 0.1849 0.1054 0.43
1h hy y 0.9268 0.1911 1 1h hy y 0.9300 0.1852 1
2h hy y 0.0695 0.1827 1 2h hy y 0.0680 0.1803 1
1h hE y 0.2693 0.1763 1 1h hE y 0.2388 0.1508 1
2h hE y 0.0033 0.0269 1 2h hE y 0.0042 0.0258 1
1h hA y 0.0676 0.1243 1 1h hA y 0.0465 0.0880 1
2h hA y 0.0089 0.0860 1 2h hA y 0.0063 0.0738 1
Ch hC y 0.0637 0.0317 0.2248 Ch hC y 0.0564 0.0294 0.1612
Rh hC y 0.0338 0.0170 0.1293 Rh hC y 0.0297 0.0156 0.0834
14.MURCIA
15.RIOJA
Mean Std_Dev Max Mean Std_Dev Max
1k ht 0.2805 0.0712 0.43 1k ht 0.2827 0.0714 0.43
2k ht 0.1463 0.0703 0.18 2k ht 0.1653 0.0493 0.18
(weighted)kht 0.2758 0.0652 0.43 (weighted)kht 0.2748 0.0647 0.43
hATR 0.1000 0.0866 0.41 hATR 0.1117 0.0818 0.39
*_ hATR TI 0.1234 0.0970 0.42 *_ hATR TI 0.1377 0.0913 0.42
1h hy y 0.9358 0.1819 1 1h hy y 0.8966 0.2168 1
2h hy y 0.0615 0.1754 1 2h hy y 0.1020 0.2143 1
1h hE y 0.2828 0.1795 1 1h hE y 0.2474 0.1674 1
2h hE y 0.0025 0.0225 1 2h hE y 0.0064 0.0316 1
1h hA y 0.0680 0.1125 1 1h hA y 0.0545 0.1031 1
2h hA y 0.0098 0.0900 1 2h hA y 0.0126 0.1023 1
Ch hC y 0.0647 0.0295 0.1566 Ch hC y 0.0629 0.0302 0.1566
Rh hC y 0.0343 0.0158 0.0834 Rh hC y 0.0332 0.0161 0.0834
* _ hATR TI stands for the ratio of total tax due to total taxable income ( )TI i.e. _ /h h hATR TI TI y
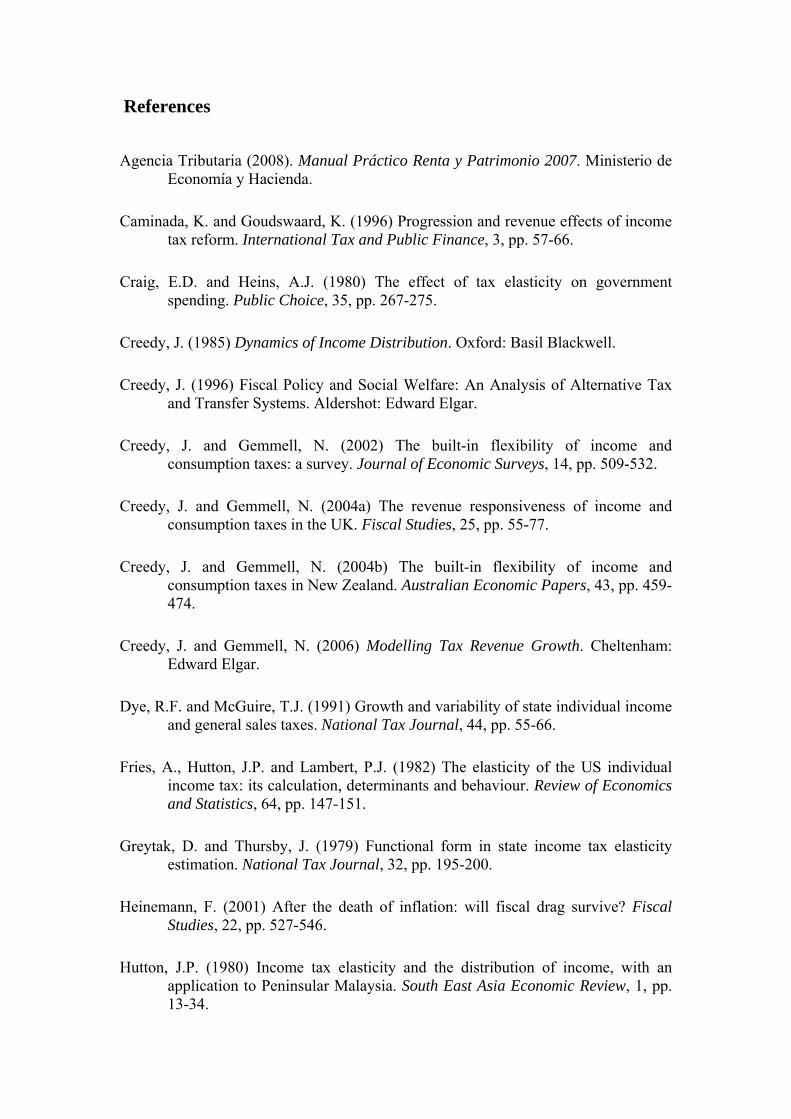
References
Agencia Tributaria (2008). Manual Práctico Renta y Patrimonio 2007. Ministerio de Economía y Hacienda.
Caminada, K. and Goudswaard, K. (1996) Progression and revenue effects of income tax reform. International Tax and Public Finance, 3, pp. 57-66.
Craig, E.D. and Heins, A.J. (1980) The effect of tax elasticity on government spending. Public Choice, 35, pp. 267-275.
Creedy, J. (1985) Dynamics of Income Distribution. Oxford: Basil Blackwell.
Creedy, J. (1996) Fiscal Policy and Social Welfare: An Analysis of Alternative Tax and Transfer Systems. Aldershot: Edward Elgar.
Creedy, J. and Gemmell, N. (2002) The built-in flexibility of income and consumption taxes: a survey. Journal of Economic Surveys, 14, pp. 509-532.
Creedy, J. and Gemmell, N. (2004a) The revenue responsiveness of income and consumption taxes in the UK. Fiscal Studies, 25, pp. 55-77.
Creedy, J. and Gemmell, N. (2004b) The built-in flexibility of income and consumption taxes in New Zealand. Australian Economic Papers, 43, pp. 459-474.
Creedy, J. and Gemmell, N. (2006) Modelling Tax Revenue Growth. Cheltenham: Edward Elgar.
Dye, R.F. and McGuire, T.J. (1991) Growth and variability of state individual income and general sales taxes. National Tax Journal, 44, pp. 55-66.
Fries, A., Hutton, J.P. and Lambert, P.J. (1982) The elasticity of the US individual income tax: its calculation, determinants and behaviour. Review of Economics and Statistics, 64, pp. 147-151.
Greytak, D. and Thursby, J. (1979) Functional form in state income tax elasticity estimation. National Tax Journal, 32, pp. 195-200.
Heinemann, F. (2001) After the death of inflation: will fiscal drag survive? Fiscal Studies, 22, pp. 527-546.
Hutton, J.P. (1980) Income tax elasticity and the distribution of income, with an application to Peninsular Malaysia. South East Asia Economic Review, 1, pp. 13-34.

62
Hutton, J.P. and Lambert, P.J. (1980) Evaluating income tax revenue elasticities. Economic Journal, 90, pp. 901-906.
Hutton, J.P. and Lambert, P.J. (1982a) Modelling the effects of income growth and discretionary change on the sensitivity of U.K. income tax revenue. Economic Journal, 92, pp. 145-155.
Hutton, J.P. and Lambert, P.J. (1982b) Simulating the revenue elasticity of an individual income tax. Economic Letters, 9, pp. 175-179.
Hutton, J.P. and Lambert, P.J. (1983) Inequality and revenue elasticity in tax reform. Scottish Journal of Political Economy, 30, pp. 221-234.
Johnson, P. and Lambert, P. (1989) Measuring the revenue responsiveness of income tax revenue to income growth: a review and some UK values. Fiscal Studies, 10, pp. 1-18.
King, P. and McMorran, R. (2002) Understanding personal income tax revenue fluctuations. Canadian Department of Finance Working Paper, 2002-07.
Kuştepeli, Y. and Şapçi, O. (2006) Personal income tax elasticity in Turkey 1975 -2005. Dokuz Eylul University Department of Economics Discussion Paper, 06/01.
Mabbett, D. (2004) Fiscal stabilisers in Europe: the macroeconomic impact of tax and benefit systems. Euromod Working Paper, no. EM7/04.
Misiolek, W.S. and Elder, H.W. (1988) Tax structure and the size of government: an empirical analysis of the fiscal illusion and fiscal stress arguments. Public Choice, 57, pp. 233-245.
Musgrave, R.A. and Thin, T. (1948) Income tax progression. Journal of Political Economy, 56, pp. 498-514.
OECD (2006) Fundamental Reform of Personal Income Tax. OECD Tax Policy Studies No.13.
Özmucur, S. (1979) More on built-in flexibility of taxation. Public Finance, 34, pp. 443-451.
Podder, N. (1997) Tax elasticity, income redistribution and the measurement of tax progressivity. In Research on Economic Inequality, Vol. 7. (ed. by S. Zandvakili), pp. 39-60. Greenwich: JAI Press.
Pohjola, M. (1985) Built-in flexibility of progressive taxation and the dynamics of income: stability, cycles, or chaos? Public Finance, 40, pp. 263-273.

63
Ram, R. (1991) Elasticity of individual income tax in the United States: Further evidence from cross-section data. National Tax Journal, 44, pp. 93-99.
Romero, D. and Sanz-Sanz, J.F. (2007). Personal income taxation: the cornerstone of the tax system in a democracy. In Fiscal Reform in Spain. Accomplishments and Challenges (ed. by J. Martínez-Vazquez and J.F. Sanz-Sanz), pp. 151-207. Studies in Fiscal Federalism and State-Local Finance. Cheltenham: Edward-Elgar.
van den Noord, P. (2000) The size and role of automatic fiscal stabilizers in the 1990s and beyond. OECD Economics Department

FUNDACIÓN DE LAS CAJAS DE AHORROS
DOCUMENTOS DE TRABAJO
Últimos números publicados
159/2000 Participación privada en la construcción y explotación de carreteras de peaje Ginés de Rus, Manuel Romero y Lourdes Trujillo
160/2000 Errores y posibles soluciones en la aplicación del Value at Risk Mariano González Sánchez
161/2000 Tax neutrality on saving assets. The spahish case before and after the tax reform Cristina Ruza y de Paz-Curbera
162/2000 Private rates of return to human capital in Spain: new evidence F. Barceinas, J. Oliver-Alonso, J.L. Raymond y J.L. Roig-Sabaté
163/2000 El control interno del riesgo. Una propuesta de sistema de límites riesgo neutral Mariano González Sánchez
164/2001 La evolución de las políticas de gasto de las Administraciones Públicas en los años 90 Alfonso Utrilla de la Hoz y Carmen Pérez Esparrells
165/2001 Bank cost efficiency and output specification Emili Tortosa-Ausina
166/2001 Recent trends in Spanish income distribution: A robust picture of falling income inequality Josep Oliver-Alonso, Xavier Ramos y José Luis Raymond-Bara
167/2001 Efectos redistributivos y sobre el bienestar social del tratamiento de las cargas familiares en el nuevo IRPF Nuria Badenes Plá, Julio López Laborda, Jorge Onrubia Fernández
168/2001 The Effects of Bank Debt on Financial Structure of Small and Medium Firms in some Euro-pean Countries Mónica Melle-Hernández
169/2001 La política de cohesión de la UE ampliada: la perspectiva de España Ismael Sanz Labrador
170/2002 Riesgo de liquidez de Mercado Mariano González Sánchez
171/2002 Los costes de administración para el afiliado en los sistemas de pensiones basados en cuentas de capitalización individual: medida y comparación internacional. José Enrique Devesa Carpio, Rosa Rodríguez Barrera, Carlos Vidal Meliá
172/2002 La encuesta continua de presupuestos familiares (1985-1996): descripción, representatividad y propuestas de metodología para la explotación de la información de los ingresos y el gasto. Llorenc Pou, Joaquín Alegre
173/2002 Modelos paramétricos y no paramétricos en problemas de concesión de tarjetas de credito. Rosa Puertas, María Bonilla, Ignacio Olmeda

174/2002 Mercado único, comercio intra-industrial y costes de ajuste en las manufacturas españolas. José Vicente Blanes Cristóbal
175/2003 La Administración tributaria en España. Un análisis de la gestión a través de los ingresos y de los gastos. Juan de Dios Jiménez Aguilera, Pedro Enrique Barrilao González
176/2003 The Falling Share of Cash Payments in Spain. Santiago Carbó Valverde, Rafael López del Paso, David B. Humphrey Publicado en “Moneda y Crédito” nº 217, pags. 167-189.
177/2003 Effects of ATMs and Electronic Payments on Banking Costs: The Spanish Case. Santiago Carbó Valverde, Rafael López del Paso, David B. Humphrey
178/2003 Factors explaining the interest margin in the banking sectors of the European Union. Joaquín Maudos y Juan Fernández Guevara
179/2003 Los planes de stock options para directivos y consejeros y su valoración por el mercado de valores en España. Mónica Melle Hernández
180/2003 Ownership and Performance in Europe and US Banking – A comparison of Commercial, Co-operative & Savings Banks. Yener Altunbas, Santiago Carbó y Phil Molyneux
181/2003 The Euro effect on the integration of the European stock markets. Mónica Melle Hernández
182/2004 In search of complementarity in the innovation strategy: international R&D and external knowledge acquisition. Bruno Cassiman, Reinhilde Veugelers
183/2004 Fijación de precios en el sector público: una aplicación para el servicio municipal de sumi-nistro de agua. Mª Ángeles García Valiñas
184/2004 Estimación de la economía sumergida es España: un modelo estructural de variables latentes. Ángel Alañón Pardo, Miguel Gómez de Antonio
185/2004 Causas políticas y consecuencias sociales de la corrupción. Joan Oriol Prats Cabrera
186/2004 Loan bankers’ decisions and sensitivity to the audit report using the belief revision model. Andrés Guiral Contreras and José A. Gonzalo Angulo
187/2004 El modelo de Black, Derman y Toy en la práctica. Aplicación al mercado español. Marta Tolentino García-Abadillo y Antonio Díaz Pérez
188/2004 Does market competition make banks perform well?. Mónica Melle
189/2004 Efficiency differences among banks: external, technical, internal, and managerial Santiago Carbó Valverde, David B. Humphrey y Rafael López del Paso
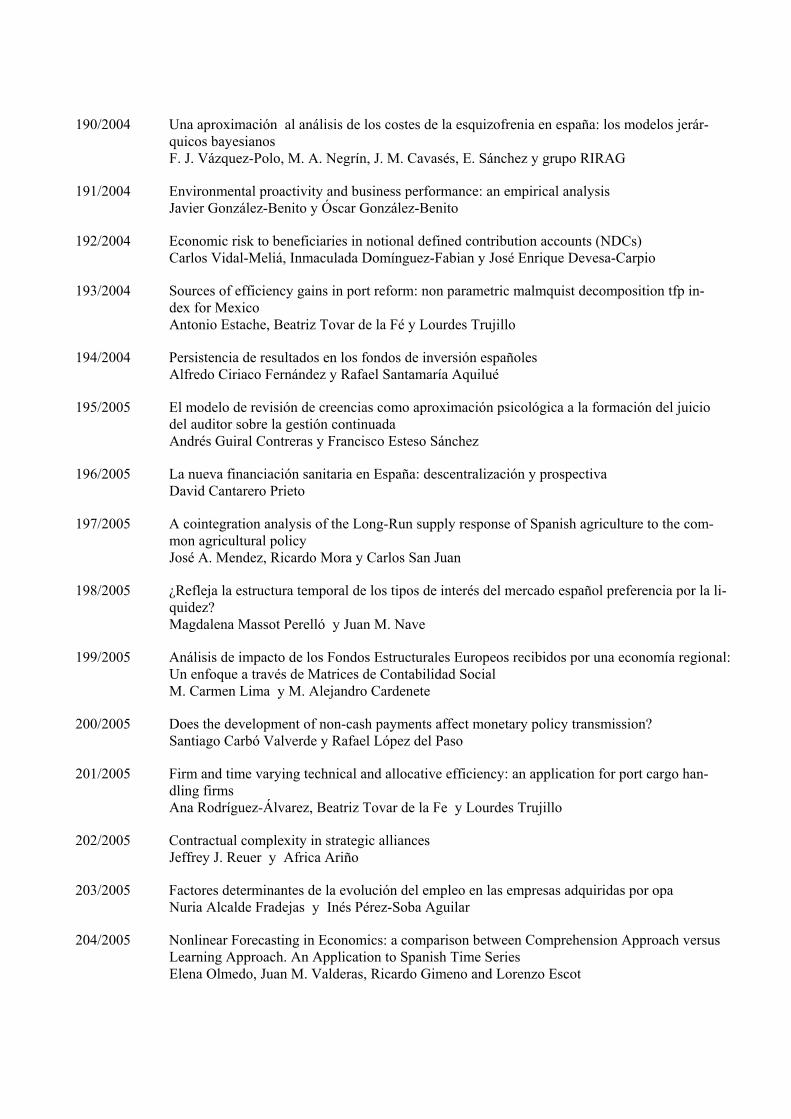
190/2004 Una aproximación al análisis de los costes de la esquizofrenia en españa: los modelos jerár-quicos bayesianos F. J. Vázquez-Polo, M. A. Negrín, J. M. Cavasés, E. Sánchez y grupo RIRAG
191/2004 Environmental proactivity and business performance: an empirical analysis Javier González-Benito y Óscar González-Benito
192/2004 Economic risk to beneficiaries in notional defined contribution accounts (NDCs) Carlos Vidal-Meliá, Inmaculada Domínguez-Fabian y José Enrique Devesa-Carpio
193/2004 Sources of efficiency gains in port reform: non parametric malmquist decomposition tfp in-dex for Mexico Antonio Estache, Beatriz Tovar de la Fé y Lourdes Trujillo
194/2004 Persistencia de resultados en los fondos de inversión españoles Alfredo Ciriaco Fernández y Rafael Santamaría Aquilué
195/2005 El modelo de revisión de creencias como aproximación psicológica a la formación del juicio del auditor sobre la gestión continuada Andrés Guiral Contreras y Francisco Esteso Sánchez
196/2005 La nueva financiación sanitaria en España: descentralización y prospectiva David Cantarero Prieto
197/2005 A cointegration analysis of the Long-Run supply response of Spanish agriculture to the com-mon agricultural policy José A. Mendez, Ricardo Mora y Carlos San Juan
198/2005 ¿Refleja la estructura temporal de los tipos de interés del mercado español preferencia por la li-quidez? Magdalena Massot Perelló y Juan M. Nave
199/2005 Análisis de impacto de los Fondos Estructurales Europeos recibidos por una economía regional: Un enfoque a través de Matrices de Contabilidad Social M. Carmen Lima y M. Alejandro Cardenete
200/2005 Does the development of non-cash payments affect monetary policy transmission? Santiago Carbó Valverde y Rafael López del Paso
201/2005 Firm and time varying technical and allocative efficiency: an application for port cargo han-dling firms Ana Rodríguez-Álvarez, Beatriz Tovar de la Fe y Lourdes Trujillo
202/2005 Contractual complexity in strategic alliances Jeffrey J. Reuer y Africa Ariño
203/2005 Factores determinantes de la evolución del empleo en las empresas adquiridas por opa Nuria Alcalde Fradejas y Inés Pérez-Soba Aguilar
204/2005 Nonlinear Forecasting in Economics: a comparison between Comprehension Approach versus Learning Approach. An Application to Spanish Time Series Elena Olmedo, Juan M. Valderas, Ricardo Gimeno and Lorenzo Escot
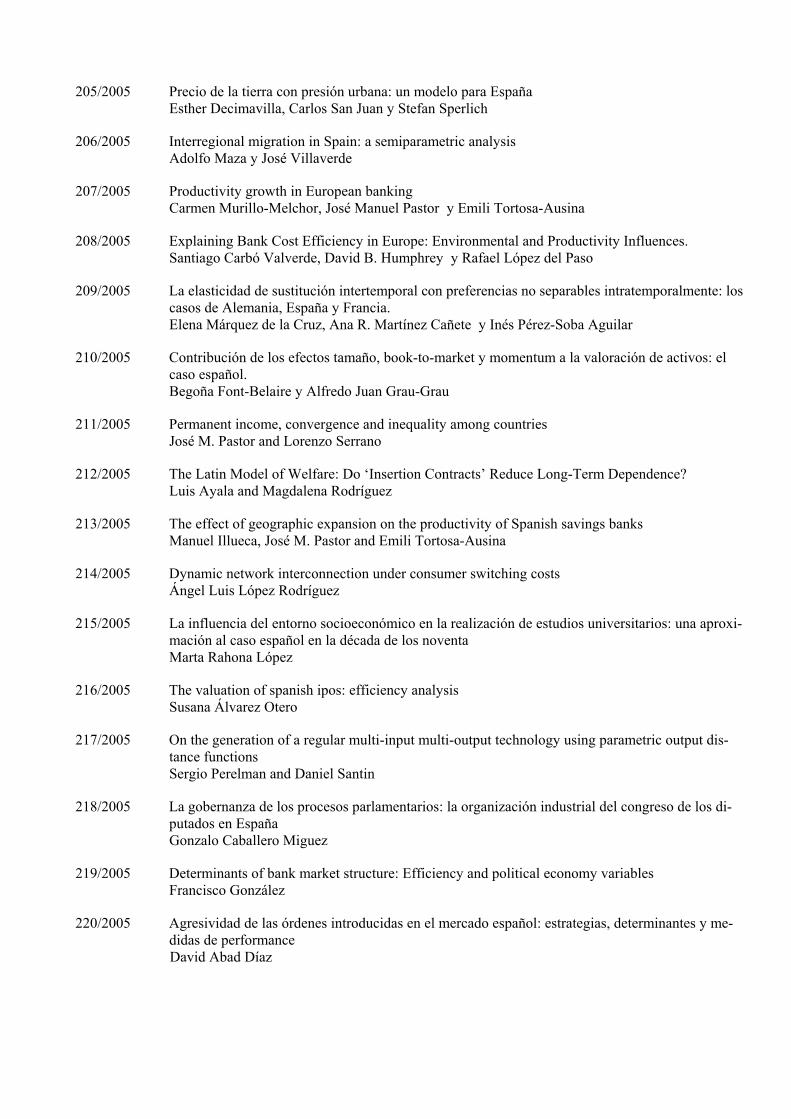
205/2005 Precio de la tierra con presión urbana: un modelo para España Esther Decimavilla, Carlos San Juan y Stefan Sperlich
206/2005 Interregional migration in Spain: a semiparametric analysis Adolfo Maza y José Villaverde
207/2005 Productivity growth in European banking Carmen Murillo-Melchor, José Manuel Pastor y Emili Tortosa-Ausina
208/2005 Explaining Bank Cost Efficiency in Europe: Environmental and Productivity Influences. Santiago Carbó Valverde, David B. Humphrey y Rafael López del Paso
209/2005 La elasticidad de sustitución intertemporal con preferencias no separables intratemporalmente: los casos de Alemania, España y Francia. Elena Márquez de la Cruz, Ana R. Martínez Cañete y Inés Pérez-Soba Aguilar
210/2005 Contribución de los efectos tamaño, book-to-market y momentum a la valoración de activos: el caso español. Begoña Font-Belaire y Alfredo Juan Grau-Grau
211/2005 Permanent income, convergence and inequality among countries José M. Pastor and Lorenzo Serrano
212/2005 The Latin Model of Welfare: Do ‘Insertion Contracts’ Reduce Long-Term Dependence? Luis Ayala and Magdalena Rodríguez
213/2005 The effect of geographic expansion on the productivity of Spanish savings banks Manuel Illueca, José M. Pastor and Emili Tortosa-Ausina
214/2005 Dynamic network interconnection under consumer switching costs Ángel Luis López Rodríguez
215/2005 La influencia del entorno socioeconómico en la realización de estudios universitarios: una aproxi-mación al caso español en la década de los noventa Marta Rahona López
216/2005 The valuation of spanish ipos: efficiency analysis Susana Álvarez Otero
217/2005 On the generation of a regular multi-input multi-output technology using parametric output dis-tance functions Sergio Perelman and Daniel Santin
218/2005 La gobernanza de los procesos parlamentarios: la organización industrial del congreso de los di-putados en España Gonzalo Caballero Miguez
219/2005 Determinants of bank market structure: Efficiency and political economy variables Francisco González
220/2005 Agresividad de las órdenes introducidas en el mercado español: estrategias, determinantes y me-didas de performance David Abad Díaz

221/2005 Tendencia post-anuncio de resultados contables: evidencia para el mercado español Carlos Forner Rodríguez, Joaquín Marhuenda Fructuoso y Sonia Sanabria García
222/2005 Human capital accumulation and geography: empirical evidence in the European Union Jesús López-Rodríguez, J. Andrés Faíña y Jose Lopez Rodríguez
223/2005 Auditors' Forecasting in Going Concern Decisions: Framing, Confidence and Information Proc-essing Waymond Rodgers and Andrés Guiral
224/2005 The effect of Structural Fund spending on the Galician region: an assessment of the 1994-1999 and 2000-2006 Galician CSFs José Ramón Cancelo de la Torre, J. Andrés Faíña and Jesús López-Rodríguez
225/2005 The effects of ownership structure and board composition on the audit committee activity: Span-ish evidence Carlos Fernández Méndez and Rubén Arrondo García
226/2005 Cross-country determinants of bank income smoothing by managing loan loss provisions Ana Rosa Fonseca and Francisco González
227/2005 Incumplimiento fiscal en el irpf (1993-2000): un análisis de sus factores determinantes Alejandro Estellér Moré
228/2005 Region versus Industry effects: volatility transmission Pilar Soriano Felipe and Francisco J. Climent Diranzo
229/2005 Concurrent Engineering: The Moderating Effect Of Uncertainty On New Product Development Success Daniel Vázquez-Bustelo and Sandra Valle
230/2005 On zero lower bound traps: a framework for the analysis of monetary policy in the ‘age’ of cen-tral banks Alfonso Palacio-Vera
231/2005 Reconciling Sustainability and Discounting in Cost Benefit Analysis: a methodological proposal M. Carmen Almansa Sáez and Javier Calatrava Requena
232/2005 Can The Excess Of Liquidity Affect The Effectiveness Of The European Monetary Policy? Santiago Carbó Valverde and Rafael López del Paso
233/2005 Inheritance Taxes In The Eu Fiscal Systems: The Present Situation And Future Perspectives. Miguel Angel Barberán Lahuerta
234/2006 Bank Ownership And Informativeness Of Earnings. Víctor M. González
235/2006 Developing A Predictive Method: A Comparative Study Of The Partial Least Squares Vs Maxi-mum Likelihood Techniques. Waymond Rodgers, Paul Pavlou and Andres Guiral.
236/2006 Using Compromise Programming for Macroeconomic Policy Making in a General Equilibrium Framework: Theory and Application to the Spanish Economy. Francisco J. André, M. Alejandro Cardenete y Carlos Romero.

237/2006 Bank Market Power And Sme Financing Constraints. Santiago Carbó-Valverde, Francisco Rodríguez-Fernández y Gregory F. Udell.
238/2006 Trade Effects Of Monetary Agreements: Evidence For Oecd Countries. Salvador Gil-Pareja, Rafael Llorca-Vivero y José Antonio Martínez-Serrano.
239/2006 The Quality Of Institutions: A Genetic Programming Approach. Marcos Álvarez-Díaz y Gonzalo Caballero Miguez.
240/2006 La interacción entre el éxito competitivo y las condiciones del mercado doméstico como deter-minantes de la decisión de exportación en las Pymes. Francisco García Pérez.
241/2006 Una estimación de la depreciación del capital humano por sectores, por ocupación y en el tiempo. Inés P. Murillo.
242/2006 Consumption And Leisure Externalities, Economic Growth And Equilibrium Efficiency. Manuel A. Gómez.
243/2006 Measuring efficiency in education: an analysis of different approaches for incorporating non-discretionary inputs. Jose Manuel Cordero-Ferrera, Francisco Pedraja-Chaparro y Javier Salinas-Jiménez
244/2006 Did The European Exchange-Rate Mechanism Contribute To The Integration Of Peripheral Countries?. Salvador Gil-Pareja, Rafael Llorca-Vivero y José Antonio Martínez-Serrano
245/2006 Intergenerational Health Mobility: An Empirical Approach Based On The Echp. Marta Pascual and David Cantarero
246/2006 Measurement and analysis of the Spanish Stock Exchange using the Lyapunov exponent with digital technology. Salvador Rojí Ferrari and Ana Gonzalez Marcos
247/2006 Testing For Structural Breaks In Variance Withadditive Outliers And Measurement Errors. Paulo M.M. Rodrigues and Antonio Rubia
248/2006 The Cost Of Market Power In Banking: Social Welfare Loss Vs. Cost Inefficiency. Joaquín Maudos and Juan Fernández de Guevara
249/2006 Elasticidades de largo plazo de la demanda de vivienda: evidencia para España (1885-2000). Desiderio Romero Jordán, José Félix Sanz Sanz y César Pérez López
250/2006 Regional Income Disparities in Europe: What role for location?. Jesús López-Rodríguez and J. Andrés Faíña
251/2006 Funciones abreviadas de bienestar social: Una forma sencilla de simultanear la medición de la eficiencia y la equidad de las políticas de gasto público. Nuria Badenes Plá y Daniel Santín González
252/2006 “The momentum effect in the Spanish stock market: Omitted risk factors or investor behaviour?”. Luis Muga and Rafael Santamaría
253/2006 Dinámica de precios en el mercado español de gasolina: un equilibrio de colusión tácita. Jordi Perdiguero García

254/2006 Desigualdad regional en España: renta permanente versus renta corriente. José M.Pastor, Empar Pons y Lorenzo Serrano
255/2006 Environmental implications of organic food preferences: an application of the impure public goods model. Ana Maria Aldanondo-Ochoa y Carmen Almansa-Sáez
256/2006 Family tax credits versus family allowances when labour supply matters: Evidence for Spain. José Felix Sanz-Sanz, Desiderio Romero-Jordán y Santiago Álvarez-García
257/2006 La internacionalización de la empresa manufacturera española: efectos del capital humano genérico y específico. José López Rodríguez
258/2006 Evaluación de las migraciones interregionales en España, 1996-2004. María Martínez Torres
259/2006 Efficiency and market power in Spanish banking. Rolf Färe, Shawna Grosskopf y Emili Tortosa-Ausina.
260/2006 Asimetrías en volatilidad, beta y contagios entre las empresas grandes y pequeñas cotizadas en la bolsa española. Helena Chuliá y Hipòlit Torró.
261/2006 Birth Replacement Ratios: New Measures of Period Population Replacement. José Antonio Ortega.
262/2006 Accidentes de tráfico, víctimas mortales y consumo de alcohol. José Mª Arranz y Ana I. Gil.
263/2006 Análisis de la Presencia de la Mujer en los Consejos de Administración de las Mil Mayores Em-presas Españolas. Ruth Mateos de Cabo, Lorenzo Escot Mangas y Ricardo Gimeno Nogués.
264/2006 Crisis y Reforma del Pacto de Estabilidad y Crecimiento. Las Limitaciones de la Política Econó-mica en Europa. Ignacio Álvarez Peralta.
265/2006 Have Child Tax Allowances Affected Family Size? A Microdata Study For Spain (1996-2000). Jaime Vallés-Giménez y Anabel Zárate-Marco.
266/2006 Health Human Capital And The Shift From Foraging To Farming. Paolo Rungo.
267/2006 Financiación Autonómica y Política de la Competencia: El Mercado de Gasolina en Canarias. Juan Luis Jiménez y Jordi Perdiguero.
268/2006 El cumplimiento del Protocolo de Kyoto para los hogares españoles: el papel de la imposición sobre la energía. Desiderio Romero-Jordán y José Félix Sanz-Sanz.
269/2006 Banking competition, financial dependence and economic growth Joaquín Maudos y Juan Fernández de Guevara
270/2006 Efficiency, subsidies and environmental adaptation of animal farming under CAP Werner Kleinhanß, Carmen Murillo, Carlos San Juan y Stefan Sperlich

271/2006 Interest Groups, Incentives to Cooperation and Decision-Making Process in the European Union A. Garcia-Lorenzo y Jesús López-Rodríguez
272/2006 Riesgo asimétrico y estrategias de momentum en el mercado de valores español Luis Muga y Rafael Santamaría
273/2006 Valoración de capital-riesgo en proyectos de base tecnológica e innovadora a través de la teoría de opciones reales Gracia Rubio Martín
274/2006 Capital stock and unemployment: searching for the missing link Ana Rosa Martínez-Cañete, Elena Márquez de la Cruz, Alfonso Palacio-Vera and Inés Pérez-Soba Aguilar
275/2006 Study of the influence of the voters’ political culture on vote decision through the simulation of a political competition problem in Spain Sagrario Lantarón, Isabel Lillo, Mª Dolores López and Javier Rodrigo
276/2006 Investment and growth in Europe during the Golden Age Antonio Cubel and Mª Teresa Sanchis
277/2006 Efectos de vincular la pensión pública a la inversión en cantidad y calidad de hijos en un modelo de equilibrio general Robert Meneu Gaya
278/2006 El consumo y la valoración de activos Elena Márquez y Belén Nieto
279/2006 Economic growth and currency crisis: A real exchange rate entropic approach David Matesanz Gómez y Guillermo J. Ortega
280/2006 Three measures of returns to education: An illustration for the case of Spain María Arrazola y José de Hevia
281/2006 Composition of Firms versus Composition of Jobs Antoni Cunyat
282/2006 La vocación internacional de un holding tranviario belga: la Compagnie Mutuelle de Tram-ways, 1895-1918 Alberte Martínez López
283/2006 Una visión panorámica de las entidades de crédito en España en la última década. Constantino García Ramos
284/2006 Foreign Capital and Business Strategies: a comparative analysis of urban transport in Madrid and Barcelona, 1871-1925 Alberte Martínez López
285/2006 Los intereses belgas en la red ferroviaria catalana, 1890-1936 Alberte Martínez López
286/2006 The Governance of Quality: The Case of the Agrifood Brand Names Marta Fernández Barcala, Manuel González-Díaz y Emmanuel Raynaud
287/2006 Modelling the role of health status in the transition out of malthusian equilibrium Paolo Rungo, Luis Currais and Berta Rivera
288/2006 Industrial Effects of Climate Change Policies through the EU Emissions Trading Scheme Xavier Labandeira and Miguel Rodríguez
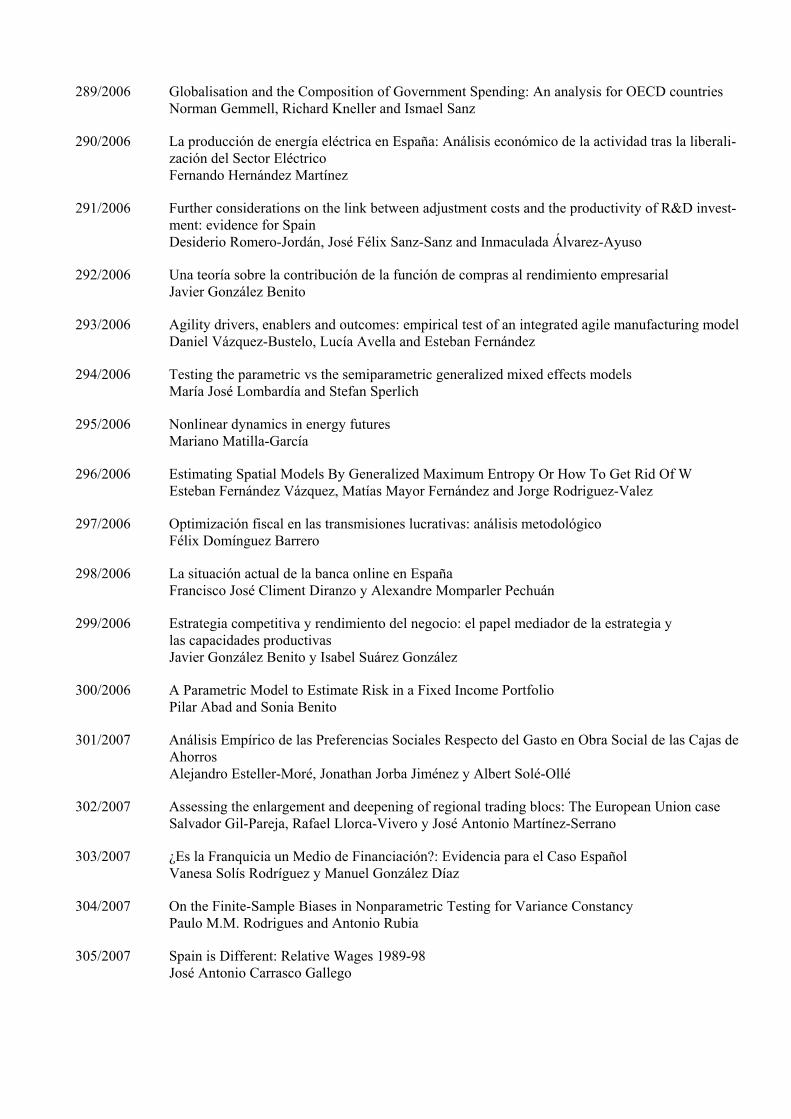
289/2006 Globalisation and the Composition of Government Spending: An analysis for OECD countries Norman Gemmell, Richard Kneller and Ismael Sanz
290/2006 La producción de energía eléctrica en España: Análisis económico de la actividad tras la liberali-zación del Sector Eléctrico Fernando Hernández Martínez
291/2006 Further considerations on the link between adjustment costs and the productivity of R&D invest-ment: evidence for Spain Desiderio Romero-Jordán, José Félix Sanz-Sanz and Inmaculada Álvarez-Ayuso
292/2006 Una teoría sobre la contribución de la función de compras al rendimiento empresarial Javier González Benito
293/2006 Agility drivers, enablers and outcomes: empirical test of an integrated agile manufacturing model Daniel Vázquez-Bustelo, Lucía Avella and Esteban Fernández
294/2006 Testing the parametric vs the semiparametric generalized mixed effects models María José Lombardía and Stefan Sperlich
295/2006 Nonlinear dynamics in energy futures Mariano Matilla-García
296/2006 Estimating Spatial Models By Generalized Maximum Entropy Or How To Get Rid Of W Esteban Fernández Vázquez, Matías Mayor Fernández and Jorge Rodriguez-Valez
297/2006 Optimización fiscal en las transmisiones lucrativas: análisis metodológico Félix Domínguez Barrero
298/2006 La situación actual de la banca online en España Francisco José Climent Diranzo y Alexandre Momparler Pechuán
299/2006 Estrategia competitiva y rendimiento del negocio: el papel mediador de la estrategia y las capacidades productivas Javier González Benito y Isabel Suárez González
300/2006 A Parametric Model to Estimate Risk in a Fixed Income Portfolio Pilar Abad and Sonia Benito
301/2007 Análisis Empírico de las Preferencias Sociales Respecto del Gasto en Obra Social de las Cajas de Ahorros Alejandro Esteller-Moré, Jonathan Jorba Jiménez y Albert Solé-Ollé
302/2007 Assessing the enlargement and deepening of regional trading blocs: The European Union case Salvador Gil-Pareja, Rafael Llorca-Vivero y José Antonio Martínez-Serrano
303/2007 ¿Es la Franquicia un Medio de Financiación?: Evidencia para el Caso Español Vanesa Solís Rodríguez y Manuel González Díaz
304/2007 On the Finite-Sample Biases in Nonparametric Testing for Variance Constancy Paulo M.M. Rodrigues and Antonio Rubia
305/2007 Spain is Different: Relative Wages 1989-98 José Antonio Carrasco Gallego

306/2007 Poverty reduction and SAM multipliers: An evaluation of public policies in a regional framework Francisco Javier De Miguel-Vélez y Jesús Pérez-Mayo
307/2007 La Eficiencia en la Gestión del Riesgo de Crédito en las Cajas de Ahorro Marcelino Martínez Cabrera
308/2007 Optimal environmental policy in transport: unintended effects on consumers' generalized price M. Pilar Socorro and Ofelia Betancor
309/2007 Agricultural Productivity in the European Regions: Trends and Explanatory Factors Roberto Ezcurra, Belen Iráizoz, Pedro Pascual and Manuel Rapún
310/2007 Long-run Regional Population Divergence and Modern Economic Growth in Europe: a Case Study of Spain María Isabel Ayuda, Fernando Collantes and Vicente Pinilla
311/2007 Financial Information effects on the measurement of Commercial Banks’ Efficiency Borja Amor, María T. Tascón and José L. Fanjul
312/2007 Neutralidad e incentivos de las inversiones financieras en el nuevo IRPF Félix Domínguez Barrero
313/2007 The Effects of Corporate Social Responsibility Perceptions on The Valuation of Common Stock Waymond Rodgers , Helen Choy and Andres Guiral-Contreras
314/2007 Country Creditor Rights, Information Sharing and Commercial Banks’ Profitability Persistence across the world Borja Amor, María T. Tascón and José L. Fanjul
315/2007 ¿Es Relevante el Déficit Corriente en una Unión Monetaria? El Caso Español Javier Blanco González y Ignacio del Rosal Fernández
316/2007 The Impact of Credit Rating Announcements on Spanish Corporate Fixed Income Performance: Returns, Yields and Liquidity Pilar Abad, Antonio Díaz and M. Dolores Robles
317/2007 Indicadores de Lealtad al Establecimiento y Formato Comercial Basados en la Distribución del Presupuesto Cesar Augusto Bustos Reyes y Óscar González Benito
318/2007 Migrants and Market Potential in Spain over The XXth Century: A Test Of The New Economic Geography Daniel A. Tirado, Jordi Pons, Elisenda Paluzie and Javier Silvestre
319/2007 El Impacto del Coste de Oportunidad de la Actividad Emprendedora en la Intención de los Ciu-dadanos Europeos de Crear Empresas Luis Miguel Zapico Aldeano
320/2007 Los belgas y los ferrocarriles de vía estrecha en España, 1887-1936 Alberte Martínez López
321/2007 Competición política bipartidista. Estudio geométrico del equilibrio en un caso ponderado Isabel Lillo, Mª Dolores López y Javier Rodrigo
322/2007 Human resource management and environment management systems: an empirical study Mª Concepción López Fernández, Ana Mª Serrano Bedia and Gema García Piqueres

323/2007 Wood and industrialization. evidence and hypotheses from the case of Spain, 1860-1935. Iñaki Iriarte-Goñi and María Isabel Ayuda Bosque
324/2007 New evidence on long-run monetary neutrality. J. Cunado, L.A. Gil-Alana and F. Perez de Gracia
325/2007 Monetary policy and structural changes in the volatility of us interest rates. Juncal Cuñado, Javier Gomez Biscarri and Fernando Perez de Gracia
326/2007 The productivity effects of intrafirm diffusion. Lucio Fuentelsaz, Jaime Gómez and Sergio Palomas
327/2007 Unemployment duration, layoffs and competing risks. J.M. Arranz, C. García-Serrano and L. Toharia
328/2007 El grado de cobertura del gasto público en España respecto a la UE-15 Nuria Rueda, Begoña Barruso, Carmen Calderón y Mª del Mar Herrador
329/2007 The Impact of Direct Subsidies in Spain before and after the CAP'92 Reform Carmen Murillo, Carlos San Juan and Stefan Sperlich
330/2007 Determinants of post-privatisation performance of Spanish divested firms Laura Cabeza García and Silvia Gómez Ansón
331/2007 ¿Por qué deciden diversificar las empresas españolas? Razones oportunistas versus razones económicas Almudena Martínez Campillo
332/2007 Dynamical Hierarchical Tree in Currency Markets Juan Gabriel Brida, David Matesanz Gómez and Wiston Adrián Risso
333/2007 Los determinantes sociodemográficos del gasto sanitario. Análisis con microdatos individuales Ana María Angulo, Ramón Barberán, Pilar Egea y Jesús Mur
334/2007 Why do companies go private? The Spanish case Inés Pérez-Soba Aguilar
335/2007 The use of gis to study transport for disabled people Verónica Cañal Fernández
336/2007 The long run consequences of M&A: An empirical application Cristina Bernad, Lucio Fuentelsaz and Jaime Gómez
337/2007 Las clasificaciones de materias en economía: principios para el desarrollo de una nueva clasificación Valentín Edo Hernández
338/2007 Reforming Taxes and Improving Health: A Revenue-Neutral Tax Reform to Eliminate Medical and Pharmaceutical VAT Santiago Álvarez-García, Carlos Pestana Barros y Juan Prieto-Rodriguez
339/2007 Impacts of an iron and steel plant on residential property values Celia Bilbao-Terol
340/2007 Firm size and capital structure: Evidence using dynamic panel data Víctor M. González and Francisco González

341/2007 ¿Cómo organizar una cadena hotelera? La elección de la forma de gobierno Marta Fernández Barcala y Manuel González Díaz
342/2007 Análisis de los efectos de la decisión de diversificar: un contraste del marco teórico “Agencia-Stewardship” Almudena Martínez Campillo y Roberto Fernández Gago
343/2007 Selecting portfolios given multiple eurostoxx-based uncertainty scenarios: a stochastic goal pro-gramming approach from fuzzy betas Enrique Ballestero, Blanca Pérez-Gladish, Mar Arenas-Parra and Amelia Bilbao-Terol
344/2007 “El bienestar de los inmigrantes y los factores implicados en la decisión de emigrar” Anastasia Hernández Alemán y Carmelo J. León
345/2007 Governance Decisions in the R&D Process: An Integrative Framework Based on TCT and Know-ledge View of The Firm. Andrea Martínez-Noya and Esteban García-Canal
346/2007 Diferencias salariales entre empresas públicas y privadas. El caso español Begoña Cueto y Nuria Sánchez- Sánchez
347/2007 Effects of Fiscal Treatments of Second Home Ownership on Renting Supply Celia Bilbao Terol and Juan Prieto Rodríguez
348/2007 Auditors’ ethical dilemmas in the going concern evaluation Andres Guiral, Waymond Rodgers, Emiliano Ruiz and Jose A. Gonzalo
349/2007 Convergencia en capital humano en España. Un análisis regional para el periodo 1970-2004 Susana Morales Sequera y Carmen Pérez Esparrells
350/2007 Socially responsible investment: mutual funds portfolio selection using fuzzy multiobjective pro-gramming Blanca Mª Pérez-Gladish, Mar Arenas-Parra , Amelia Bilbao-Terol and Mª Victoria Rodríguez-Uría
351/2007 Persistencia del resultado contable y sus componentes: implicaciones de la medida de ajustes por devengo Raúl Iñiguez Sánchez y Francisco Poveda Fuentes
352/2007 Wage Inequality and Globalisation: What can we Learn from the Past? A General Equilibrium Approach Concha Betrán, Javier Ferri and Maria A. Pons
353/2007 Eficacia de los incentivos fiscales a la inversión en I+D en España en los años noventa Desiderio Romero Jordán y José Félix Sanz Sanz
354/2007 Convergencia regional en renta y bienestar en España Robert Meneu Gaya
355/2007 Tributación ambiental: Estado de la Cuestión y Experiencia en España Ana Carrera Poncela
356/2007 Salient features of dependence in daily us stock market indices Luis A. Gil-Alana, Juncal Cuñado and Fernando Pérez de Gracia
357/2007 La educación superior: ¿un gasto o una inversión rentable para el sector público? Inés P. Murillo y Francisco Pedraja

358/2007 Effects of a reduction of working hours on a model with job creation and job destruction Emilio Domínguez, Miren Ullibarri y Idoya Zabaleta
359/2007 Stock split size, signaling and earnings management: Evidence from the Spanish market José Yagüe, J. Carlos Gómez-Sala and Francisco Poveda-Fuentes
360/2007 Modelización de las expectativas y estrategias de inversión en mercados de derivados Begoña Font-Belaire
361/2008 Trade in capital goods during the golden age, 1953-1973 Mª Teresa Sanchis and Antonio Cubel
362/2008 El capital económico por riesgo operacional: una aplicación del modelo de distribución de pérdidas Enrique José Jiménez Rodríguez y José Manuel Feria Domínguez
363/2008 The drivers of effectiveness in competition policy Joan-Ramon Borrell and Juan-Luis Jiménez
364/2008 Corporate governance structure and board of directors remuneration policies: evidence from Spain Carlos Fernández Méndez, Rubén Arrondo García and Enrique Fernández Rodríguez
365/2008 Beyond the disciplinary role of governance: how boards and donors add value to Spanish founda-tions Pablo De Andrés Alonso, Valentín Azofra Palenzuela y M. Elena Romero Merino
366/2008 Complejidad y perfeccionamiento contractual para la contención del oportunismo en los acuerdos de franquicia Vanesa Solís Rodríguez y Manuel González Díaz
367/2008 Inestabilidad y convergencia entre las regiones europeas Jesús Mur, Fernando López y Ana Angulo
368/2008 Análisis espacial del cierre de explotaciones agrarias Ana Aldanondo Ochoa, Carmen Almansa Sáez y Valero Casanovas Oliva
369/2008 Cross-Country Efficiency Comparison between Italian and Spanish Public Universities in the period 2000-2005 Tommaso Agasisti and Carmen Pérez Esparrells
370/2008 El desarrollo de la sociedad de la información en España: un análisis por comunidades autónomas María Concepción García Jiménez y José Luis Gómez Barroso
371/2008 El medioambiente y los objetivos de fabricación: un análisis de los modelos estratégicos para su consecución Lucía Avella Camarero, Esteban Fernández Sánchez y Daniel Vázquez-Bustelo
372/2008 Influence of bank concentration and institutions on capital structure: New international evidence Víctor M. González and Francisco González
373/2008 Generalización del concepto de equilibrio en juegos de competición política Mª Dolores López González y Javier Rodrigo Hitos
374/2008 Smooth Transition from Fixed Effects to Mixed Effects Models in Multi-level regression Models María José Lombardía and Stefan Sperlich
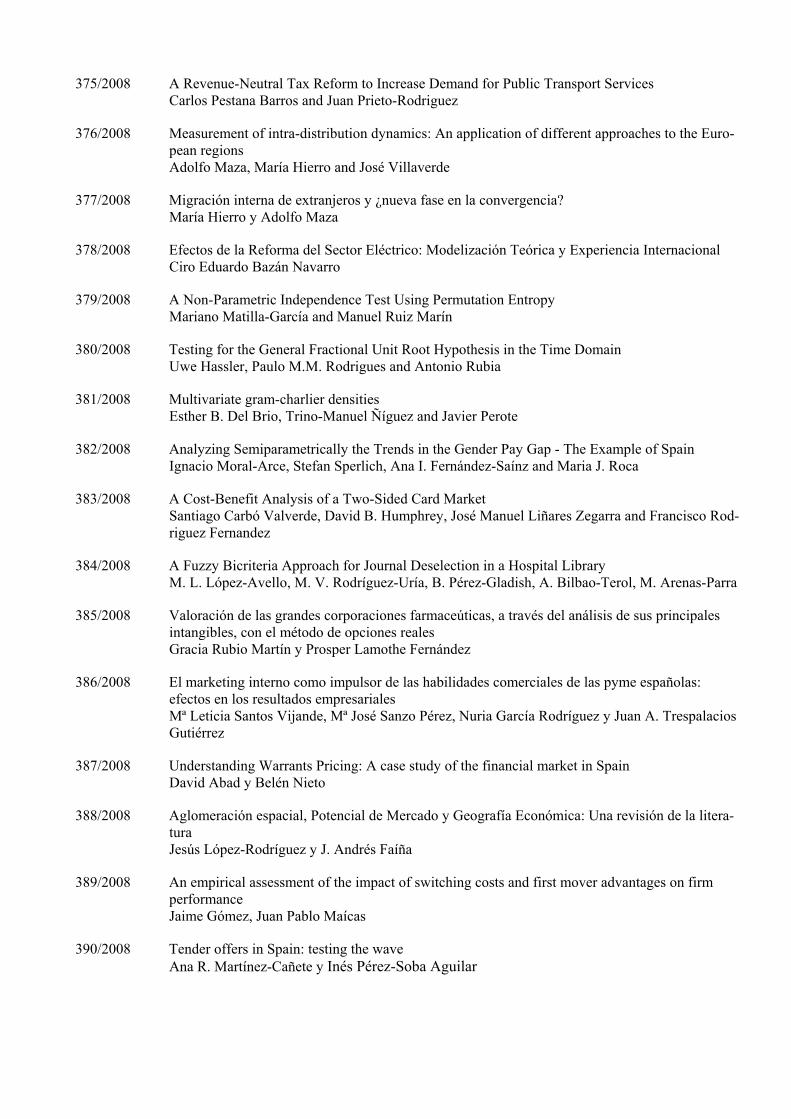
375/2008 A Revenue-Neutral Tax Reform to Increase Demand for Public Transport Services Carlos Pestana Barros and Juan Prieto-Rodriguez
376/2008 Measurement of intra-distribution dynamics: An application of different approaches to the Euro-pean regions Adolfo Maza, María Hierro and José Villaverde
377/2008 Migración interna de extranjeros y ¿nueva fase en la convergencia? María Hierro y Adolfo Maza
378/2008 Efectos de la Reforma del Sector Eléctrico: Modelización Teórica y Experiencia Internacional Ciro Eduardo Bazán Navarro
379/2008 A Non-Parametric Independence Test Using Permutation Entropy Mariano Matilla-García and Manuel Ruiz Marín
380/2008 Testing for the General Fractional Unit Root Hypothesis in the Time Domain Uwe Hassler, Paulo M.M. Rodrigues and Antonio Rubia
381/2008 Multivariate gram-charlier densities Esther B. Del Brio, Trino-Manuel Ñíguez and Javier Perote
382/2008 Analyzing Semiparametrically the Trends in the Gender Pay Gap - The Example of Spain Ignacio Moral-Arce, Stefan Sperlich, Ana I. Fernández-Saínz and Maria J. Roca
383/2008 A Cost-Benefit Analysis of a Two-Sided Card Market Santiago Carbó Valverde, David B. Humphrey, José Manuel Liñares Zegarra and Francisco Rod-riguez Fernandez
384/2008 A Fuzzy Bicriteria Approach for Journal Deselection in a Hospital Library M. L. López-Avello, M. V. Rodríguez-Uría, B. Pérez-Gladish, A. Bilbao-Terol, M. Arenas-Parra
385/2008 Valoración de las grandes corporaciones farmaceúticas, a través del análisis de sus principales intangibles, con el método de opciones reales Gracia Rubio Martín y Prosper Lamothe Fernández
386/2008 El marketing interno como impulsor de las habilidades comerciales de las pyme españolas: efectos en los resultados empresariales Mª Leticia Santos Vijande, Mª José Sanzo Pérez, Nuria García Rodríguez y Juan A. Trespalacios Gutiérrez
387/2008 Understanding Warrants Pricing: A case study of the financial market in Spain David Abad y Belén Nieto
388/2008 Aglomeración espacial, Potencial de Mercado y Geografía Económica: Una revisión de la litera-tura Jesús López-Rodríguez y J. Andrés Faíña
389/2008 An empirical assessment of the impact of switching costs and first mover advantages on firm performance Jaime Gómez, Juan Pablo Maícas
390/2008 Tender offers in Spain: testing the wave Ana R. Martínez-Cañete y Inés Pérez-Soba Aguilar
391/2008 La integración del mercado español a finales del siglo XIX: los precios del trigo entre 1891 y 1905 Mariano Matilla García, Pedro Pérez Pascual y Basilio Sanz Carnero
392/2008 Cuando el tamaño importa: estudio sobre la influencia de los sujetos políticos en la balanza de bienes y servicios Alfonso Echazarra de Gregorio
393/2008 Una visión cooperativa de las medidas ante el posible daño ambiental de la desalación Borja Montaño Sanz
394/2008 Efectos externos del endeudamiento sobre la calificación crediticia de las Comunidades Autóno-mas Andrés Leal Marcos y Julio López Laborda
395/2008 Technical efficiency and productivity changes in Spanish airports: A parametric distance func-tions approach Beatriz Tovar & Roberto Rendeiro Martín-Cejas
396/2008 Network analysis of exchange data: Interdependence drives crisis contagion David Matesanz Gómez & Guillermo J. Ortega
397/2008 Explaining the performance of Spanish privatised firms: a panel data approach Laura Cabeza Garcia and Silvia Gomez Anson
398/2008 Technological capabilities and the decision to outsource R&D services Andrea Martínez-Noya and Esteban García-Canal
399/2008 Hybrid Risk Adjustment for Pharmaceutical Benefits Manuel García-Goñi, Pere Ibern & José María Inoriza
400/2008 The Team Consensus–Performance Relationship and the Moderating Role of Team Diversity José Henrique Dieguez, Javier González-Benito and Jesús Galende
401/2008 The institutional determinants of CO2 emissions: A computational modelling approach using Arti-ficial Neural Networks and Genetic Programming Marcos Álvarez-Díaz , Gonzalo Caballero Miguez and Mario Soliño
402/2008 Alternative Approaches to Include Exogenous Variables in DEA Measures: A Comparison Using Monte Carlo José Manuel Cordero-Ferrera, Francisco Pedraja-Chaparro and Daniel Santín-González
403/2008 Efecto diferencial del capital humano en el crecimiento económico andaluz entre 1985 y 2004: comparación con el resto de España Mª del Pópulo Pablo-Romero Gil-Delgado y Mª de la Palma Gómez-Calero Valdés
404/2008 Análisis de fusiones, variaciones conjeturales y la falacia del estimador en diferencias Juan Luis Jiménez y Jordi Perdiguero
405/2008 Política fiscal en la uem: ¿basta con los estabilizadores automáticos? Jorge Uxó González y Mª Jesús Arroyo Fernández
406/2008 Papel de la orientación emprendedora y la orientación al mercado en el éxito de las empresas Óscar González-Benito, Javier González-Benito y Pablo A. Muñoz-Gallego
407/2008 La presión fiscal por impuesto sobre sociedades en la unión europea Elena Fernández Rodríguez, Antonio Martínez Arias y Santiago Álvarez García

408/2008 The environment as a determinant factor of the purchasing and supply strategy: an empirical ana-lysis Dr. Javier González-Benito y MS Duilio Reis da Rocha
409/2008 Cooperation for innovation: the impact on innovatory effort Gloria Sánchez González and Liliana Herrera
410/2008 Spanish post-earnings announcement drift and behavioral finance models Carlos Forner and Sonia Sanabria
411/2008 Decision taking with external pressure: evidence on football manager dismissals in argentina and their consequences Ramón Flores, David Forrest and Juan de Dios Tena
412/2008 Comercio agrario latinoamericano, 1963-2000: aplicación de la ecuación gravitacional para flujos desagregados de comercio Raúl Serrano y Vicente Pinilla
413/2008 Voter heuristics in Spain: a descriptive approach elector decision José Luís Sáez Lozano and Antonio M. Jaime Castillo
414/2008 Análisis del efecto área de salud de residencia sobre la utilización y acceso a los servicios sanita-rios en la Comunidad Autónoma Canaria Ignacio Abásolo Alessón, Lidia García Pérez, Raquel Aguiar Ibáñez y Asier Amador Robayna
415/2008 Impact on competitive balance from allowing foreign players in a sports league: an analytical model and an empirical test Ramón Flores, David Forrest & Juan de Dios Tena
416/2008 Organizational innovation and productivity growth: Assessing the impact of outsourcing on firm performance Alberto López
417/2008 Value Efficiency Analysis of Health Systems Eduardo González, Ana Cárcaba & Juan Ventura
418/2008 Equidad en la utilización de servicios sanitarios públicos por comunidades autónomas en España: un análisis multinivel Ignacio Abásolo, Jaime Pinilla, Miguel Negrín, Raquel Aguiar y Lidia García
419/2008 Piedras en el camino hacia Bolonia: efectos de la implantación del EEES sobre los resultados académicos Carmen Florido, Juan Luis Jiménez e Isabel Santana
420/2008 The welfare effects of the allocation of airlines to different terminals M. Pilar Socorro and Ofelia Betancor
421/2008 How bank capital buffers vary across countries. The influence of cost of deposits, market power and bank regulation Ana Rosa Fonseca and Francisco González
422/2008 Analysing health limitations in spain: an empirical approach based on the european community household panel Marta Pascual and David Cantarero

423/2008 Regional productivity variation and the impact of public capital stock: an analysis with spatial interaction, with reference to Spain Miguel Gómez-Antonio and Bernard Fingleton
424/2008 Average effect of training programs on the time needed to find a job. The case of the training schools program in the south of Spain (Seville, 1997-1999). José Manuel Cansino Muñoz-Repiso and Antonio Sánchez Braza
425/2008 Medición de la eficiencia y cambio en la productividad de las empresas distribuidoras de electri-cidad en Perú después de las reformas Raúl Pérez-Reyes y Beatriz Tovar
426/2008 Acercando posturas sobre el descuento ambiental: sondeo Delphi a expertos en el ámbito interna-cional Carmen Almansa Sáez y José Miguel Martínez Paz
427/2008 Determinants of abnormal liquidity after rating actions in the Corporate Debt Market Pilar Abad, Antonio Díaz and M. Dolores Robles
428/2008 Export led-growth and balance of payments constrained. New formalization applied to Cuban commercial regimes since 1960 David Matesanz Gómez, Guadalupe Fugarolas Álvarez-Ude and Isis Mañalich Gálvez
429/2008 La deuda implícita y el desequilibrio financiero-actuarial de un sistema de pensiones. El caso del régimen general de la seguridad social en España José Enrique Devesa Carpio y Mar Devesa Carpio
430/2008 Efectos de la descentralización fiscal sobre el precio de los carburantes en España Desiderio Romero Jordán, Marta Jorge García-Inés y Santiago Álvarez García
431/2008 Euro, firm size and export behavior Silviano Esteve-Pérez, Salvador Gil-Pareja, Rafael Llorca-Vivero and José Antonio Martínez-Serrano
432/2008 Does social spending increase support for free trade in advanced democracies? Ismael Sanz, Ferran Martínez i Coma and Federico Steinberg
433/2008 Potencial de Mercado y Estructura Espacial de Salarios: El Caso de Colombia Jesús López-Rodríguez y Maria Cecilia Acevedo
434/2008 Persistence in Some Energy Futures Markets Juncal Cunado, Luis A. Gil-Alana and Fernando Pérez de Gracia
435/2008 La inserción financiera externa de la economía francesa: inversores institucionales y nueva gestión empresarial Ignacio Álvarez Peralta
436/2008 ¿Flexibilidad o rigidez salarial en España?: un análisis a escala regional Ignacio Moral Arce y Adolfo Maza Fernández
437/2009 Intangible relationship-specific investments and the performance of r&d outsourcing agreements Andrea Martínez-Noya, Esteban García-Canal & Mauro F. Guillén
438/2009 Friendly or Controlling Boards? Pablo de Andrés Alonso & Juan Antonio Rodríguez Sanz
439/2009 La sociedad Trenor y Cía. (1838-1926): un modelo de negocio industrial en la España del siglo XIX Amparo Ruiz Llopis
440/2009 Continental bias in trade Salvador Gil-Pareja, Rafael Llorca-Vivero & José Antonio Martínez Serrano
441/2009 Determining operational capital at risk: an empirical application to the retail banking Enrique José Jiménez-Rodríguez, José Manuel Feria-Domínguez & José Luis Martín-Marín
442/2009 Costes de mitigación y escenarios post-kyoto en España: un análisis de equilibro general para España Mikel González Ruiz de Eguino
443/2009 Las revistas españolas de economía en las bibliotecas universitarias: ranking, valoración del indicador y del sistema Valentín Edo Hernández
444/2009 Convergencia económica en España y coordinación de políticas económicas. un estudio basado en la estructura productiva de las CC.AA. Ana Cristina Mingorance Arnáiz
445/2009 Instrumentos de mercado para reducir emisiones de co2: un análisis de equilibrio general para España Mikel González Ruiz de Eguino
446/2009 El comercio intra e inter-regional del sector Turismo en España Carlos Llano y Tamara de la Mata
447/2009 Efectos del incremento del precio del petróleo en la economía española: Análisis de cointegración y de la política monetaria mediante reglas de Taylor Fernando Hernández Martínez
448/2009 Bologna Process and Expenditure on Higher Education: A Convergence Analysis of the EU-15 T. Agasisti, C. Pérez Esparrells, G. Catalano & S. Morales
449/2009 Global Economy Dynamics? Panel Data Approach to Spillover Effects Gregory Daco, Fernando Hernández Martínez & Li-Wu Hsu
450/2009 Pricing levered warrants with dilution using observable variables Isabel Abínzano & Javier F. Navas
451/2009 Information technologies and financial prformance: The effect of technology diffusion among competitors Lucio Fuentelsaz, Jaime Gómez & Sergio Palomas
452/2009 A Detailed Comparison of Value at Risk in International Stock Exchanges Pilar Abad & Sonia Benito
453/2009 Understanding offshoring: has Spain been an offshoring location in the nineties? Belén González-Díaz & Rosario Gandoy
454/2009 Outsourcing decision, product innovation and the spatial dimension: Evidence from the Spanish footwear industry José Antonio Belso-Martínez

455/2009 Does playing several competitions influence a team’s league performance? Evidence from Spanish professional football Andrés J. Picazo-Tadeo & Francisco González-Gómez
456/2009 Does accessibility affect retail prices and competition? An empirical application Juan Luis Jiménez and Jordi Perdiguero
457/2009 Cash conversion cycle in smes Sonia Baños-Caballero, Pedro J. García-Teruel and Pedro Martínez-Solano
458/2009 Un estudio sobre el perfil de hogares endeudados y sobreendeudados: el caso de los hogares vascos Alazne Mujika Alberdi, Iñaki García Arrizabalaga y Juan José Gibaja Martíns
459/2009 Imposing monotonicity on outputs in parametric distance function estimations: with an application to the spanish educational production Sergio Perelman and Daniel Santin
460/2009 Key issues when using tax data for concentration analysis: an application to the Spanish wealth tax José Mª Durán-Cabré and Alejandro Esteller-Moré
461/2009 ¿Se está rompiendo el mercado español? Una aplicación del enfoque de feldstein –horioka Saúl De Vicente Queijeiro, José Luis Pérez Rivero y María Rosalía Vicente Cuervo
462/2009 Financial condition, cost efficiency and the quality of local public services Manuel A. Muñiz & José L. Zafra
463/2009 Including non-cognitive outputs in a multidimensional evaluation of education production: an international comparison Marián García Valiñas & Manuel Antonio Muñiz Pérez
464/2009 A political look into budget deficits.The role of minority governments and oppositions Albert Falcó-Gimeno & Ignacio Jurado
465/2009 La simulación del cuadro de mando integral. Una herramienta de aprendizaje en la materia de contabilidad de gestión Elena Urquía Grande, Clara Isabel Muñoz Colomina y Elisa Isabel Cano Montero
466/2009 Análisis histórico de la importancia de la industria de la desalinización en España Borja Montaño Sanz
467/2009 The dynamics of trade and innovation: a joint approach Silviano Esteve-Pérez & Diego Rodríguez
468/2009 Measuring international reference-cycles Sonia de Lucas Santos, Inmaculada Álvarez Ayuso & Mª Jesús Delgado Rodríguez
469/2009 Measuring quality of life in Spanish municipalities Eduardo González Fidalgo, Ana Cárcaba García, Juan Ventura Victoria & Jesús García García
470/2009 ¿Cómo se valoran las acciones españolas: en el mercado de capitales doméstico o en el europeo? Begoña Font Belaire y Alfredo Juan Grau Grau
471/2009 Patterns of e-commerce adoption and intensity. evidence for the european union-27 María Rosalía Vicente & Ana Jesús López
472/2009 On measuring the effect of demand uncertainty on costs: an application to port terminals Ana Rodríguez-Álvarez, Beatriz Tovar & Alan Wall
473/2009 Order of market entry, market and technological evolution and firm competitive performance Jaime Gomez, Gianvito Lanzolla & Juan Pablo Maicas
474/2009 La Unión Económica y Monetaria Europea en el proceso exportador de Castilla y León (1993-2007): un análisis de datos de panel Almudena Martínez Campillo y Mª del Pilar Sierra Fernández
475/2009 Do process innovations boost SMEs productivity growth? Juan A. Mañez, María E. Rochina Barrachina, Amparo Sanchis Llopis & Juan A. Sanchis Llopis
476/2009 Incertidumbre externa y elección del modo de entrada en el marco de la inversión directa en el exterior Cristina López Duarte y Marta Mª Vidal Suárez
477/2009 Testing for structural breaks in factor loadings: an application to international business cycle José Luis Cendejas Bueno, Sonia de Lucas Santos, Inmaculada Álvarez Ayuso & Mª Jesús Del-gado Rodríguez
478/2009 ¿Esconde la rigidez de precios la existencia de colusión? El caso del mercado de carburantes en las Islas Canarias Juan Luis Jiménez y Jordi Perdiguero
479/2009 The poni test with structural breaks Antonio Aznar & María-Isabel Ayuda
480/2009 Accuracy and reliability of Spanish regional accounts (CRE-95) Verónica Cañal Fernández
481/2009 Estimating regional variations of R&D effects on productivity growth by entropy econometrics Esteban Fernández-Vázquez y Fernando Rubiera-Morollón
482/2009 Why do local governments privatize the provision of water services? Empirical evidence from Spain Francisco González-Gómez, Andrés J. Picazo-Tadeo & Jorge Guardiola
483/2009 Assessing the regional digital divide across the European Union-27 María Rosalía Vicente & Ana Jesús López
484/2009 Measuring educational efficiency and its determinants in Spain with parametric distance functions José Manuel Cordero Ferrera, Eva Crespo Cebada & Daniel Santín González
485/2009 Spatial analysis of public employment services in the Spanish provinces Patricia Suárez Cano & Matías Mayor Fernández
486/2009 Trade effects of continental and intercontinental preferential trade agreements Salvador Gil-Pareja, Rafael Llorca-Vivero & José Antonio Martínez-Serrano
487/2009 Testing the accuracy of DEA for measuring efficiency in education under endogeneity Salvador Gil-Pareja, Rafael Llorca-Vivero & José Antonio Martínez-Serrano
488/2009 Measuring efficiency in primary health care: the effect of exogenous variables on results José Manuel Cordero Ferrera, Eva Crespo Cebada & Luis R. Murillo Zamorano

489/2009 Capital structure determinants in growth firms accessing venture funding Marina Balboa, José Martí & Álvaro Tresierra
490/2009 Determinants of debt maturity structure across firm size Víctor M. González
491/2009 Análisis del efecto de la aplicación de las NIIF en la valoración de las salidas a bolsa Susana Álvarez Otero y Eduardo Rodríguez Enríquez
492/2009 An analysis of urban size and territorial location effects on employment probabilities: the spanish case Ana Viñuela-Jiménez, Fernando Rubiera-Morollón & Begoña Cueto
493/2010 Determinantes de la estructura de los consejos de administración en España Isabel Acero Fraile y Nuria Alcalde Fradejas
494/2010 Performance and completeness in repeated inter-firm relationships: the case of franchising Vanesa Solis-Rodriguez & Manuel Gonzalez-Diaz
495/2010 A Revenue-Based Frontier Measure of Banking Competition Santiago Carbó, David Humphrey & Francisco Rodríguez
496/2010 Categorical segregation in social networks Antoni Rubí-Barceló
497/2010 Beneficios ambientales no comerciales de la directiva marco del agua en condiciones de escasez: análisis económico para el Guadalquivir Julia Martin-Ortega, Giacomo Giannoccaro y Julio Berbel Vecino
498/2010 Monetary integration and risk diversification in eu-15 sovereign debt markets Juncal Cuñado & Marta Gómez-Puig
499/2010 The Marshall Plan and the Spanish autarky: A welfare loss analysis José Antonio Carrasco Gallego
500/2010 The role of learning in firm R&D persistence Juan A. Mañez, María E. Rochina-Barrachina, Amparo Sanchis-Llopis & Juan A. Sanchis-Llopis
501/2010 Is venture capital more than just money? Marina Balboa, José Martí & Nina Zieling
502/2010 On the effects of supply strategy on business performance: do the relationships among generic competitive objectives matter? Javier González-Benito
503/2010 Corporate cash holding and firm value Cristina Martínez-Sola, Pedro J. García-Teruel & Pedro Martínez-Solano
504/2010 El impuesto de flujos de caja de sociedades: una propuesta de base imponible y su aproximación contable en España Lourdes Jerez Barroso y Joaquín Texeira Quirós
505/2010 The effect of technological, commercial and human resources on the use of new technology Jaime Gómez & Pilar Vargas

506/2010 ¿Cómo ha afectado la fiscalidad a la rentabilidad de la inversión en vivienda en España? Un análisis para el periodo 1996 y 2007 Jorge Onrubia Fernández y María del Carmen Rodado Ruiz
507/2010 Modelización de flujos en el análisis input-output a partir de la teoría de redes Ana Salomé García Muñiz
508/2010 Export-led-growth hypothesis revisited. a balance of payments approach for Argentina, Brazil, Chile and Mexico David Matesanz Gómez & Guadalupe Fugarolas Álvarez-Ude
509/2010 Realised hedge ratio properties, performance and implications for risk management: evidence from the spanish ibex 35 spot and futures markets David G McMillan & Raquel Quiroga García
510/2010 Do we sack the manager... or is it better not to? Evidence from Spanish professional football Francisco González-Gómez, Andrés J. Picazo-Tadeo & Miguel Á. García-Rubio
511/2010 Have Spanish port sector reforms during the last two decades been successful? A cost frontier approach Ana Rodríguez-Álvarez & Beatriz Tovar
512/2010 Size & Regional Distribution of Financial Behavior Patterns in Spain Juan Antonio Maroto Acín, Pablo García Estévez & Salvador Roji Ferrari
513/2010 The impact of public reforms on the productivity of the Spanish ports: a parametric distance function approach Ramón Núñez-Sánchez & Pablo Coto-Millán
514/2010 Trade policy versus institutional trade barriers: an application using “good old” ols Laura Márquez-Ramos, Inmaculada Martínez-Zarzoso & Celestino Suárez-Burguet
515/2010 The “Double Market” approach in venture capital and private equity activity: the case of Europe Marina Balboa & José Martí
516/2010 International accounting differences and earnings smoothing in the banking industry Marina Balboa, Germán López-Espinosa & Antonio Rubia
517/2010 Convergence in car prices among European countries Simón Sosvilla-Rivero & Salvador Gil-Pareja
518/2010 Effects of process and product-oriented innovations on employee downsizing José David Vicente-Lorente & José Ángel Zúñiga-Vicente
519/2010 Inequality, the politics of redistribution and the tax-mix Jenny De Freitas
520/2010 Efectos del desajuste educativo sobre el rendimiento privado de la educación: un análisis para el caso español (1995-2006) Inés P. Murillo, Marta Rahona y Mª del Mar Salinas
521/2010 Sructural breaks and real convergence in opec countries Juncal Cuñado
522/2010 Human Capital, Geographical location and Policy Implications: The case of Romania Jesús López-Rodríguez, Andres Faiña y Bolea Cosmin-Gabriel

523/2010 Organizational unlearning context fostering learning for customer capital through time: lessons from SMEs in the telecommunications industry Anthony K. P. Wensley, Antonio Leal-Millán, Gabriel Cepeda-Carrión & Juan Gabriel Cegarra-Navarro
524/2010 The governance threshold in international trade flows Marta Felis-Rota
525/2010 The intensive and extensive margins of trade decomposing exports growth differences across Spanish regions Asier Minondo Uribe-Etxeberria & Francisco Requena Silvente
526/2010 Why do firms locate r&d outsourcing agreeements offshore? the role of ownership, location, and externalization advantages Andrea Martínez-Noya, Esteban Gárcía-Canal & Mauro f. Guillén
527/2010 Corporate Taxation and the Productivity and Investment Performance of Heterogeneous Firms: Evidence from OECD Firm-Level Data Norman Gemmell, Richard Kneller, Ismael Sanz & José Félix Sanz-Sanz
528/2010 Modelling Personal Income Taxation in Spain: Revenue Elasticities and Regional Comparisons John Creedy & José Félix Sanz-Sanz