Taxation and Skills
240
OECD Tax Policy Studies Taxation and Skills No. 24
-
Upload
khangminh22 -
Category
Documents
-
view
2 -
download
0
Transcript of Taxation and Skills
OECD Tax Policy Studies
Taxation and Skills
OECD Tax Policy Studies
Taxation and SkillsThis series consists of studies analysing the effects of tax policies that have occurred in the past or might be considered for the future. Its primary purpose is to assist policy makers in designing tax policies that are suited to their objectives.
This Tax Policy Study on Taxation and Skills examines how tax policy can encourage skills development in OECD countries. This study also assesses the returns to tertiary and adult education and examines how these returns are shared between governments and students. The study builds indicators that examine incentives for individuals and governments to invest in education. These indicators take into account the various financial costs of skills investments for individuals such as foregone after-tax earnings and tuition fees, as well as whether investments are financed with savings or with student loans. Costs borne by governments such as grants, scholarships, lost taxes, and skills tax expenditures are also accounted for. The indicators also incorporate the returns to skills investments for individuals and governments through higher after-tax wages and higher tax revenues respectively.
For a complete list of titles that have been published in the OECD Tax Policy Studies series, please visit www.oecd-ilibrary.org/taxation/oecd-tax-policy-studies_19900538.
iSbn 978-92-64-26937-823 2017 01 1 P
Consult this publication on line at http://dx.doi.org/10.1787/9789264269385-en.
This work is published on the OECD iLibrary, which gathers all OECD books, periodicals and statistical databases. Visit www.oecd-ilibrary.org for more information.
9HSTCQE*cgjdhi+ No. 24
Taxation an
d S
killsO
EC
D Tax P
olicy S
tud
ies

Taxation and Skills
No. 24
OECD Tax Policy Studies
This work is published under the responsibility of the Secretary-General of the OECD. The opinions expressed and arguments employed herein do not necessarily reflect the official views of OECD member countries.
This document and any map included herein are without prejudice to the status of or sovereignty over any territory, to the delimitation of international frontiers and boundaries and to the name of any territory, city or area.
Please cite this publication as:OECD (2017), Taxation and Skills, OECD Tax Policy Studies, No. 24, OECD Publishing, Parishttp://dx.doi.org/10.1787/9789264269385-en
ISBN 978-92-64-26937-8 (print) ISBN 978-92-64-26938-5 (PDF) ISBN 978-92-64-26939-2 (ePub)
Series: OECD Tax Policy Studies ISSN 1990-0546 (print) ISSN 1990-0538 (online)
The statistical data for Israel are supplied by and under the responsibility of the relevant Israeli authorities. The use of such data by the OECD is without prejudice to the status of the Golan Heights, East Jerusalem and Israeli settlements in the West Bank under the terms of international law.
Photo credits: Cover © selensergen/Thinkstock.
Corrigenda to OECD publications may be found on line at: www.oecd.org/publishing/corrigenda.
© OECD 2017
You can copy, download or print OECD content for your own use, and you can include excerpts from OECD publications, databases
and multimedia products in your own documents, presentations, blogs, websites and teaching materials, provided that suitable
acknowledgment of the source and copyright owner is given. All requests for public or commercial use and translation rights should
be submitted to [email protected]. Requests for permission to photocopy portions of this material for public or commercial use shall be
addressed directly to the Copyright Clearance Center (CCC) at [email protected] or the Centre français d’exploitation du droit de copie
(CFC) at [email protected].
TAxATION AND SkIllS © OECD 2017 3
FOREWORD
Foreword
Higher skill levels lead to higher wages and better employment prospects for individuals, higher
productivity and profits for businesses, and higher growth rates and tax revenues for governments.
While there is broad consensus about the importance of skills for inclusive growth, sharing the costs
of skills investments equitably and efficiently between governments, individuals, and businesses is
a matter of continued debate. This report analyses how taxes impact the costs and returns of skills
investments. The tax system is a key means through which the returns and the costs of skills are
shared between governments and students.
Understanding the role of the tax system in the investment in human capital is important for
both tax and skills policy makers. The impact of the tax system on physical capital is extensively
studied and can be a significant factor in shaping tax policy reform. Similar consideration should be
given to the impact of taxes on human capital. This study provides insights into the influence of tax
systems on skills in 29 OECD countries: Australia, Austria, Belgium, Canada, Chile, the Czech Republic,
Denmark, Estonia, Finland, Greece, Hungary, Iceland, Ireland, Israel, Italy, Luxembourg, Mexico, the
Netherlands, New Zealand, Norway, Poland, Portugal, the Slovak Republic, Slovenia, Spain, Sweden,
Switzerland, Turkey, and the United Kingdom.
Taxation and Skills finds that for a typical 17-year-old individual in OECD countries, a tertiary
education is one of the best investments available. A tertiary degree more than pays for itself in terms
of future expected after-tax income even before accounting for additional employment, health and
well-being benefits. On average, a student’s earnings after education must rise by 15% to break even
on the costs of education. In fact, they rise by 48% on average. Governments generally recoup the
costs of their investment in tertiary education through higher income tax revenue. Estimates suggest
that, on average, the extra income tax revenue gained from educating a typical student at the tertiary
level amounts to 118% of government education costs across the OECD. This does not incorporate the
wide variety of other returns to skills investments for governments.
Tax expenditures that encourage skills investments exist in many OECD countries. However,
they may be poorly designed, regressive, and can have mixed impacts on education outcomes. Direct
support for skills and financing through student loans encourages skills investments by both targeting
support to those who need it most, while at the same time mitigating the risk of skills investments
by providing a form of insurance against such risk.
Creating incentives to invest in skills across society is a key component in lifting wage and
productivity levels across OECD economies, and in ensuring that growth in the coming years is
inclusive and sustainable. Taxation and Skills demonstrates that tax and spending policies need to
be designed in a coherent manner in order to encourage skills investments. The analysis contained in
this report can help policy makers to compare their countries with other OECD countries, to design
effective skills policies and to create inclusive growth across the OECD.
TAxATION AND SkIllS © OECD 20174
ACkNOWlEDGEmENTS
Acknowledgements
This study was prepared under the guidance of Working Party No. 2 of the OECD Committee
on Fiscal Affairs and was approved for publication by the OECD Committee on Fiscal Affairs.
Comments and information provided by Delegates to both the Working Party and the
Committee and by other national officials is gratefully acknowledged. Input provided by the
Delegates to Working Party No 2. of the Committee on Fiscal Affairs in response to the 2011
questionnaire on Tax and Skills and in verifying the models and results presented in this
study is particularly appreciated. The support of the Education Directorate and the OECD
Young Professionals Programme is also gratefully acknowledged.
The study was prepared by Pierce O’Reilly and Bert Brys of the OECD’s Centre for Tax
Policy and Administration (CTPA). Chapters 1, 2, 4 and 5 and Annexes B,C and D of the study
were prepared by Pierce O’Reilly and supervised by Bert Brys, while the methodological
Chapter 3 as well as Annex A was prepared by Pierce O’Reilly and Bert Brys. The methodology
has been developed by Bert Brys together with Pierce O’Reilly and Carolina Torres. Previous
versions of the methodology were presented in Brys & Torres (2013). The 2011 questionnaire
on Tax and Skills on which the models are based was carried out by Carolina Torres and
supervised by Bert Brys. Axelle magnier provided excellent research assistance. The project
was carried out under the guidance of David Bradbury. Early guidance on the project was
provided by Pierre leBlanc and Stephen matthews.
The project also benefitted from extensive collaboration with the OECD Education
Directorate, and in particular from the help of Deborah Roseveare, Joanne Caddy, Andrew
Bell, Soumaya maghnouj and Corinne Heckmann. Comments on various drafts and other
assistance were provided by David Bradbury, Pierre leBlanc, Anna milanez, and Alastair
Thomas, as well as by seminar participants at the Centre for Tax Policy and Administration’s
seminar series, and the OECD Skills Strategy Advisory Group. Dominique Paturot provided
helpful support regarding Taxing Wages. michael Sharratt provided helpful support on many
modelling and graphical issues, and prepared country notes for the project. Carrie Tyler
assisted with the production of the publication and associated brochure. Violet Sochay
provided invaluable administrative assistance.

5
TABlE OF CONTENTS
TAxATION AND SkIllS © OECD 2017
Table of contents
Abbreviations and acronyms . . . . . . . . . . . . . . . . . . . . . . . . . . . . . . . . . . . . . . . . . . . . . . . . . 15
Executive summary . . . . . . . . . . . . . . . . . . . . . . . . . . . . . . . . . . . . . . . . . . . . . . . . . . . . . . . . . 17
Chapter 1. Introduction: Tax, skills, and inclusive growth . . . . . . . . . . . . . . . . . . . . . . . 21
1.1 Skills, growth, and productivity . . . . . . . . . . . . . . . . . . . . . . . . . . . . . . . . . . . . . . . . 22
1.2 Skills, tax, and inclusive growth . . . . . . . . . . . . . . . . . . . . . . . . . . . . . . . . . . . . . . . . 24
1.3 The returns to skills . . . . . . . . . . . . . . . . . . . . . . . . . . . . . . . . . . . . . . . . . . . . . . . . . . 29
1.4 Public finance of education . . . . . . . . . . . . . . . . . . . . . . . . . . . . . . . . . . . . . . . . . . . . 32
1.5 Tax, skills, and financial incentives . . . . . . . . . . . . . . . . . . . . . . . . . . . . . . . . . . . . . 34
1.6 Plan of the study . . . . . . . . . . . . . . . . . . . . . . . . . . . . . . . . . . . . . . . . . . . . . . . . . . . . . 36
References . . . . . . . . . . . . . . . . . . . . . . . . . . . . . . . . . . . . . . . . . . . . . . . . . . . . . . . . . . . . . 37
Chapter 2. Tax and skills policies in OECD economies. . . . . . . . . . . . . . . . . . . . . . . . . . . 39
2.1 Introduction. . . . . . . . . . . . . . . . . . . . . . . . . . . . . . . . . . . . . . . . . . . . . . . . . . . . . . . . . 40
2.2 Tax treatment of educational spending . . . . . . . . . . . . . . . . . . . . . . . . . . . . . . . . . 41
2.3 Tax treatment of scholarship income and grants . . . . . . . . . . . . . . . . . . . . . . . . . 43
2.4 Tax treatment of student debt . . . . . . . . . . . . . . . . . . . . . . . . . . . . . . . . . . . . . . . . . 44
2.5 Tax treatment of student income. . . . . . . . . . . . . . . . . . . . . . . . . . . . . . . . . . . . . . . 44
Notes . . . . . . . . . . . . . . . . . . . . . . . . . . . . . . . . . . . . . . . . . . . . . . . . . . . . . . . . . . . . . . . . . . 45
References . . . . . . . . . . . . . . . . . . . . . . . . . . . . . . . . . . . . . . . . . . . . . . . . . . . . . . . . . . . . . 45
Chapter 3. Methodological approach to tax and skills statistics . . . . . . . . . . . . . . . . . . 47
3.1 Introduction. . . . . . . . . . . . . . . . . . . . . . . . . . . . . . . . . . . . . . . . . . . . . . . . . . . . . . . . . 48
3.2 The costs of education. . . . . . . . . . . . . . . . . . . . . . . . . . . . . . . . . . . . . . . . . . . . . . . . 48
3.3 The financing of the student’s education costs . . . . . . . . . . . . . . . . . . . . . . . . . . . 54
3.4 The returns to education and the breakeven earnings increment . . . . . . . . . . . 55
3.5 The marginal effective tax rate. . . . . . . . . . . . . . . . . . . . . . . . . . . . . . . . . . . . . . . . . 57
3.6 The average effective tax rate. . . . . . . . . . . . . . . . . . . . . . . . . . . . . . . . . . . . . . . . . . 58
3.7 Understanding the results. . . . . . . . . . . . . . . . . . . . . . . . . . . . . . . . . . . . . . . . . . . . . 59
3.8 The returns to costs ratio of investment in education . . . . . . . . . . . . . . . . . . . . . 63
Notes . . . . . . . . . . . . . . . . . . . . . . . . . . . . . . . . . . . . . . . . . . . . . . . . . . . . . . . . . . . . . . . . . . 68
References . . . . . . . . . . . . . . . . . . . . . . . . . . . . . . . . . . . . . . . . . . . . . . . . . . . . . . . . . . . . . 68
Chapter 4. Tax and skills statistics: Effective tax rates and returns to costs ratios . . . . . . . . . . . . . . . . . . . . . . . . . . . . . . . . . . . . . . . . . . . . . . . . . . . . 69
4.1 Introduction. . . . . . . . . . . . . . . . . . . . . . . . . . . . . . . . . . . . . . . . . . . . . . . . . . . . . . . . . 70
4.2 Tertiary education . . . . . . . . . . . . . . . . . . . . . . . . . . . . . . . . . . . . . . . . . . . . . . . . . . . 71
4.3 Financing tertiary education. . . . . . . . . . . . . . . . . . . . . . . . . . . . . . . . . . . . . . . . . . . 78
6
TABlE OF CONTENTS
TAxATION AND SkIllS © OECD 2017
4.4 Graduate education . . . . . . . . . . . . . . . . . . . . . . . . . . . . . . . . . . . . . . . . . . . . . . . . . . 82
4.5 Job-related training. . . . . . . . . . . . . . . . . . . . . . . . . . . . . . . . . . . . . . . . . . . . . . . . . . . 86
4.6 lifelong learning . . . . . . . . . . . . . . . . . . . . . . . . . . . . . . . . . . . . . . . . . . . . . . . . . . . . . 88
4.7 Gender differentials . . . . . . . . . . . . . . . . . . . . . . . . . . . . . . . . . . . . . . . . . . . . . . . . . . 93
Notes . . . . . . . . . . . . . . . . . . . . . . . . . . . . . . . . . . . . . . . . . . . . . . . . . . . . . . . . . . . . . . . . . . 95
References . . . . . . . . . . . . . . . . . . . . . . . . . . . . . . . . . . . . . . . . . . . . . . . . . . . . . . . . . . . . . 95
Chapter 5. Tax and non-tax financial incentives to support skills investments . . . . . 97
5.1 Introduction. . . . . . . . . . . . . . . . . . . . . . . . . . . . . . . . . . . . . . . . . . . . . . . . . . . . . . . . . 98
5.2 Tax incentives for tertiary education. . . . . . . . . . . . . . . . . . . . . . . . . . . . . . . . . . . . 100
5.3 Non-tax financial incentives for tertiary education . . . . . . . . . . . . . . . . . . . . . . . 116
5.4 Tax Incentives for mid-career training . . . . . . . . . . . . . . . . . . . . . . . . . . . . . . . . . . 124
5.5 Tax, skills and education finance . . . . . . . . . . . . . . . . . . . . . . . . . . . . . . . . . . . . . . . 131
Notes . . . . . . . . . . . . . . . . . . . . . . . . . . . . . . . . . . . . . . . . . . . . . . . . . . . . . . . . . . . . . . . . . . 135
References . . . . . . . . . . . . . . . . . . . . . . . . . . . . . . . . . . . . . . . . . . . . . . . . . . . . . . . . . . . . . 136
Annex A. Technical approach to calculating tax and skills indicators . . . . . . . . . . . . 139
A.1 Introduction . . . . . . . . . . . . . . . . . . . . . . . . . . . . . . . . . . . . . . . . . . . . . . . . . . . . . . . . 139
A.2 Private costs and benefits of education and their relationship to the tax
system: deriving the AETR, BEI, and mETR. . . . . . . . . . . . . . . . . . . . . . . . . . . . . . . 141
A.3 Public costs and benefits and the relationship to the tax system:
deriving the ARCR and mRCR. . . . . . . . . . . . . . . . . . . . . . . . . . . . . . . . . . . . . . . . . . 151
A.4 Including student debt and its effects on public and private costs
and benefits of education . . . . . . . . . . . . . . . . . . . . . . . . . . . . . . . . . . . . . . . . . . . . . 154
Notes . . . . . . . . . . . . . . . . . . . . . . . . . . . . . . . . . . . . . . . . . . . . . . . . . . . . . . . . . . . . . . . . . . 160
Annex B. Comparative Tables . . . . . . . . . . . . . . . . . . . . . . . . . . . . . . . . . . . . . . . . . . . . . . . 161
Annex C. Country Tables . . . . . . . . . . . . . . . . . . . . . . . . . . . . . . . . . . . . . . . . . . . . . . . . . . . 167
Australia . . . . . . . . . . . . . . . . . . . . . . . . . . . . . . . . . . . . . . . . . . . . . . . . . . . . . . . . . . . . . . . 168
Austria. . . . . . . . . . . . . . . . . . . . . . . . . . . . . . . . . . . . . . . . . . . . . . . . . . . . . . . . . . . . . . . . . 170
Belgium . . . . . . . . . . . . . . . . . . . . . . . . . . . . . . . . . . . . . . . . . . . . . . . . . . . . . . . . . . . . . . . . 172
Canada . . . . . . . . . . . . . . . . . . . . . . . . . . . . . . . . . . . . . . . . . . . . . . . . . . . . . . . . . . . . . . . . 174
Chile . . . . . . . . . . . . . . . . . . . . . . . . . . . . . . . . . . . . . . . . . . . . . . . . . . . . . . . . . . . . . . . . . . 176
Czech Republic. . . . . . . . . . . . . . . . . . . . . . . . . . . . . . . . . . . . . . . . . . . . . . . . . . . . . . . . . . 178
Denmark . . . . . . . . . . . . . . . . . . . . . . . . . . . . . . . . . . . . . . . . . . . . . . . . . . . . . . . . . . . . . . . 180
Estonia. . . . . . . . . . . . . . . . . . . . . . . . . . . . . . . . . . . . . . . . . . . . . . . . . . . . . . . . . . . . . . . . . 182
Finland . . . . . . . . . . . . . . . . . . . . . . . . . . . . . . . . . . . . . . . . . . . . . . . . . . . . . . . . . . . . . . . . 184
Greece . . . . . . . . . . . . . . . . . . . . . . . . . . . . . . . . . . . . . . . . . . . . . . . . . . . . . . . . . . . . . . . . . 186
Hungary . . . . . . . . . . . . . . . . . . . . . . . . . . . . . . . . . . . . . . . . . . . . . . . . . . . . . . . . . . . . . . . 188
Iceland. . . . . . . . . . . . . . . . . . . . . . . . . . . . . . . . . . . . . . . . . . . . . . . . . . . . . . . . . . . . . . . . . 190
Ireland . . . . . . . . . . . . . . . . . . . . . . . . . . . . . . . . . . . . . . . . . . . . . . . . . . . . . . . . . . . . . . . . . 192
Israel . . . . . . . . . . . . . . . . . . . . . . . . . . . . . . . . . . . . . . . . . . . . . . . . . . . . . . . . . . . . . . . . . . 194
Italy . . . . . . . . . . . . . . . . . . . . . . . . . . . . . . . . . . . . . . . . . . . . . . . . . . . . . . . . . . . . . . . . . . . 196
luxembourg . . . . . . . . . . . . . . . . . . . . . . . . . . . . . . . . . . . . . . . . . . . . . . . . . . . . . . . . . . . . 198
mexico . . . . . . . . . . . . . . . . . . . . . . . . . . . . . . . . . . . . . . . . . . . . . . . . . . . . . . . . . . . . . . . . . 200
Netherlands . . . . . . . . . . . . . . . . . . . . . . . . . . . . . . . . . . . . . . . . . . . . . . . . . . . . . . . . . . . . 202
7
TABlE OF CONTENTS
TAxATION AND SkIllS © OECD 2017
New Zealand . . . . . . . . . . . . . . . . . . . . . . . . . . . . . . . . . . . . . . . . . . . . . . . . . . . . . . . . . . . 204
Norway . . . . . . . . . . . . . . . . . . . . . . . . . . . . . . . . . . . . . . . . . . . . . . . . . . . . . . . . . . . . . . . . 206
Poland . . . . . . . . . . . . . . . . . . . . . . . . . . . . . . . . . . . . . . . . . . . . . . . . . . . . . . . . . . . . . . . . . 208
Portugal . . . . . . . . . . . . . . . . . . . . . . . . . . . . . . . . . . . . . . . . . . . . . . . . . . . . . . . . . . . . . . . . 210
Slovak Republic . . . . . . . . . . . . . . . . . . . . . . . . . . . . . . . . . . . . . . . . . . . . . . . . . . . . . . . . . 212
Slovenia. . . . . . . . . . . . . . . . . . . . . . . . . . . . . . . . . . . . . . . . . . . . . . . . . . . . . . . . . . . . . . . . 214
Spain . . . . . . . . . . . . . . . . . . . . . . . . . . . . . . . . . . . . . . . . . . . . . . . . . . . . . . . . . . . . . . . . . . 216
Sweden . . . . . . . . . . . . . . . . . . . . . . . . . . . . . . . . . . . . . . . . . . . . . . . . . . . . . . . . . . . . . . . . 218
Switzerland . . . . . . . . . . . . . . . . . . . . . . . . . . . . . . . . . . . . . . . . . . . . . . . . . . . . . . . . . . . . 220
Turkey . . . . . . . . . . . . . . . . . . . . . . . . . . . . . . . . . . . . . . . . . . . . . . . . . . . . . . . . . . . . . . . . . 222
United kingdom. . . . . . . . . . . . . . . . . . . . . . . . . . . . . . . . . . . . . . . . . . . . . . . . . . . . . . . . . 224
Notes . . . . . . . . . . . . . . . . . . . . . . . . . . . . . . . . . . . . . . . . . . . . . . . . . . . . . . . . . . . . . . . . . . 225
Annex D. Country Details . . . . . . . . . . . . . . . . . . . . . . . . . . . . . . . . . . . . . . . . . . . . . . . . . . . 227
Australia . . . . . . . . . . . . . . . . . . . . . . . . . . . . . . . . . . . . . . . . . . . . . . . . . . . . . . . . . . . . . . . 227
Austria. . . . . . . . . . . . . . . . . . . . . . . . . . . . . . . . . . . . . . . . . . . . . . . . . . . . . . . . . . . . . . . . . 227
Belgium . . . . . . . . . . . . . . . . . . . . . . . . . . . . . . . . . . . . . . . . . . . . . . . . . . . . . . . . . . . . . . . . 228
Canada . . . . . . . . . . . . . . . . . . . . . . . . . . . . . . . . . . . . . . . . . . . . . . . . . . . . . . . . . . . . . . . . 228
Chile . . . . . . . . . . . . . . . . . . . . . . . . . . . . . . . . . . . . . . . . . . . . . . . . . . . . . . . . . . . . . . . . . . 229
Czech Republic. . . . . . . . . . . . . . . . . . . . . . . . . . . . . . . . . . . . . . . . . . . . . . . . . . . . . . . . . . 229
Denmark . . . . . . . . . . . . . . . . . . . . . . . . . . . . . . . . . . . . . . . . . . . . . . . . . . . . . . . . . . . . . . . 229
Estonia. . . . . . . . . . . . . . . . . . . . . . . . . . . . . . . . . . . . . . . . . . . . . . . . . . . . . . . . . . . . . . . . . 229
Finland . . . . . . . . . . . . . . . . . . . . . . . . . . . . . . . . . . . . . . . . . . . . . . . . . . . . . . . . . . . . . . . . 229
Greece . . . . . . . . . . . . . . . . . . . . . . . . . . . . . . . . . . . . . . . . . . . . . . . . . . . . . . . . . . . . . . . . . 230
Hungary . . . . . . . . . . . . . . . . . . . . . . . . . . . . . . . . . . . . . . . . . . . . . . . . . . . . . . . . . . . . . . . 230
Iceland. . . . . . . . . . . . . . . . . . . . . . . . . . . . . . . . . . . . . . . . . . . . . . . . . . . . . . . . . . . . . . . . . 230
Ireland . . . . . . . . . . . . . . . . . . . . . . . . . . . . . . . . . . . . . . . . . . . . . . . . . . . . . . . . . . . . . . . . . 230
Israel . . . . . . . . . . . . . . . . . . . . . . . . . . . . . . . . . . . . . . . . . . . . . . . . . . . . . . . . . . . . . . . . . . 231
Italy . . . . . . . . . . . . . . . . . . . . . . . . . . . . . . . . . . . . . . . . . . . . . . . . . . . . . . . . . . . . . . . . . . . 231
luxembourg . . . . . . . . . . . . . . . . . . . . . . . . . . . . . . . . . . . . . . . . . . . . . . . . . . . . . . . . . . . . 231
mexico . . . . . . . . . . . . . . . . . . . . . . . . . . . . . . . . . . . . . . . . . . . . . . . . . . . . . . . . . . . . . . . . . 231
Netherlands . . . . . . . . . . . . . . . . . . . . . . . . . . . . . . . . . . . . . . . . . . . . . . . . . . . . . . . . . . . . 232
New Zealand . . . . . . . . . . . . . . . . . . . . . . . . . . . . . . . . . . . . . . . . . . . . . . . . . . . . . . . . . . . 232
Norway . . . . . . . . . . . . . . . . . . . . . . . . . . . . . . . . . . . . . . . . . . . . . . . . . . . . . . . . . . . . . . . . 232
Poland . . . . . . . . . . . . . . . . . . . . . . . . . . . . . . . . . . . . . . . . . . . . . . . . . . . . . . . . . . . . . . . . . 232
Portugal . . . . . . . . . . . . . . . . . . . . . . . . . . . . . . . . . . . . . . . . . . . . . . . . . . . . . . . . . . . . . . . . 233
Slovak Republic . . . . . . . . . . . . . . . . . . . . . . . . . . . . . . . . . . . . . . . . . . . . . . . . . . . . . . . . . 233
Slovenia. . . . . . . . . . . . . . . . . . . . . . . . . . . . . . . . . . . . . . . . . . . . . . . . . . . . . . . . . . . . . . . . 234
Spain . . . . . . . . . . . . . . . . . . . . . . . . . . . . . . . . . . . . . . . . . . . . . . . . . . . . . . . . . . . . . . . . . . 234
Sweden . . . . . . . . . . . . . . . . . . . . . . . . . . . . . . . . . . . . . . . . . . . . . . . . . . . . . . . . . . . . . . . . 234
Switzerland . . . . . . . . . . . . . . . . . . . . . . . . . . . . . . . . . . . . . . . . . . . . . . . . . . . . . . . . . . . . 234
Turkey . . . . . . . . . . . . . . . . . . . . . . . . . . . . . . . . . . . . . . . . . . . . . . . . . . . . . . . . . . . . . . . . . 235
United kingdom. . . . . . . . . . . . . . . . . . . . . . . . . . . . . . . . . . . . . . . . . . . . . . . . . . . . . . . . . 235
United States . . . . . . . . . . . . . . . . . . . . . . . . . . . . . . . . . . . . . . . . . . . . . . . . . . . . . . . . . . . 235
Notes . . . . . . . . . . . . . . . . . . . . . . . . . . . . . . . . . . . . . . . . . . . . . . . . . . . . . . . . . . . . . . . . . . 236
8
TABlE OF CONTENTS
TAxATION AND SkIllS © OECD 2017
Tables
2.1. Summary of Tax and Skills Expenditures. . . . . . . . . . . . . . . . . . . . . . . . . . . . . . . . . 41
3.1. Components of the mETR and AETR. . . . . . . . . . . . . . . . . . . . . . . . . . . . . . . . . . . . . 60
3.2. Components of the mRCR and ARCR . . . . . . . . . . . . . . . . . . . . . . . . . . . . . . . . . . . . 65
5.1. Regression results . . . . . . . . . . . . . . . . . . . . . . . . . . . . . . . . . . . . . . . . . . . . . . . . . . . . 107
5.2. Effects of income on the AETRs and mETRs on average in the tax systems of
30 OECD countries . . . . . . . . . . . . . . . . . . . . . . . . . . . . . . . . . . . . . . . . . . . . . . . . . . . . 110
5.3. Tax credits for university education in the OECD . . . . . . . . . . . . . . . . . . . . . . . . . . 114
5.4. Repayment schedules for HElP loans, 2016-2017 . . . . . . . . . . . . . . . . . . . . . . . . . . 123
B.1. Average Effective Tax Rate on Skills, as a % of the Earnings Increment . . . . . . . 162
B.2. Breakeven Earnings Increments on Skills Investments, %
of previous earnings . . . . . . . . . . . . . . . . . . . . . . . . . . . . . . . . . . . . . . . . . . . . . . . . . . 163
B.3. marginal Effective Tax Rate on Skills, % of Breakeven Earnings Increment . . . . 164
B.4. Average Returns to Costs Ratio of Government Investment in Education . . . . . 165
B.5. marginal Returns to Costs Ratio of Government Investment in Education . . . . 166
C.1. Comparing Financial Incentives for College Education with Different
Financing Scenarios - Australia . . . . . . . . . . . . . . . . . . . . . . . . . . . . . . . . . . . . . . . . . 168
C.2. Comparing Financial Incentives for Differing Savings-Financed Education
Scenarios - Australia . . . . . . . . . . . . . . . . . . . . . . . . . . . . . . . . . . . . . . . . . . . . . . . . . . 169
C.3. Comparing Financial Incentives for College Education with Different Financing
Scenarios - Austria. . . . . . . . . . . . . . . . . . . . . . . . . . . . . . . . . . . . . . . . . . . . . . . . . . . . 170
C.4. Comparing Financial Incentives for Differing Savings-Financed Education
Scenarios - Austria. . . . . . . . . . . . . . . . . . . . . . . . . . . . . . . . . . . . . . . . . . . . . . . . . . . . 171
C.5. Comparing Financial Incentives for College Education with Different Financing
Scenarios - Belgium. . . . . . . . . . . . . . . . . . . . . . . . . . . . . . . . . . . . . . . . . . . . . . . . . . . 172
C.6. Comparing Financial Incentives for Differing Savings-Financed
Education Scenarios - Belgium . . . . . . . . . . . . . . . . . . . . . . . . . . . . . . . . . . . . . . . . . 173
C.7. Comparing Financial Incentives for College Education with Different Financing
Scenarios - Canada . . . . . . . . . . . . . . . . . . . . . . . . . . . . . . . . . . . . . . . . . . . . . . . . . . . 174
C.8. Comparing Financial Incentives for Differing Savings-Financed Education
Scenarios - Canada . . . . . . . . . . . . . . . . . . . . . . . . . . . . . . . . . . . . . . . . . . . . . . . . . . . 175
C.9. Comparing Financial Incentives for College Education with Different Financing
Scenarios - Chile . . . . . . . . . . . . . . . . . . . . . . . . . . . . . . . . . . . . . . . . . . . . . . . . . . . . . 176
C.10. Comparing Financial Incentives for Differing Savings-Financed Education
Scenarios - Chile . . . . . . . . . . . . . . . . . . . . . . . . . . . . . . . . . . . . . . . . . . . . . . . . . . . . . 177
C.11. Comparing Financial Incentives for College Education with Different Financing
Scenarios - Czech Republic. . . . . . . . . . . . . . . . . . . . . . . . . . . . . . . . . . . . . . . . . . . . . 178
C.12. Comparing Financial Incentives for Differing Savings-Financed Education
Scenarios - Czech Republic. . . . . . . . . . . . . . . . . . . . . . . . . . . . . . . . . . . . . . . . . . . . . 179
C.13. Comparing Financial Incentives for College Education with Different Financing
Scenarios - Denmark. . . . . . . . . . . . . . . . . . . . . . . . . . . . . . . . . . . . . . . . . . . . . . . . . . 180
C.14. Comparing Financial Incentives for Differing Savings-Financed Education
Scenarios - Denmark. . . . . . . . . . . . . . . . . . . . . . . . . . . . . . . . . . . . . . . . . . . . . . . . . . 181
C.15. Comparing Financial Incentives for College Education with Different Financing
Scenarios - Estonia . . . . . . . . . . . . . . . . . . . . . . . . . . . . . . . . . . . . . . . . . . . . . . . . . . . 182
9
TABlE OF CONTENTS
TAxATION AND SkIllS © OECD 2017
C.16. Comparing Financial Incentives for Differing Savings-Financed Education
Scenarios - Estonia . . . . . . . . . . . . . . . . . . . . . . . . . . . . . . . . . . . . . . . . . . . . . . . . . . . 183
C.17. Comparing Financial Incentives for College Education with Different Financing
Scenarios - Finland . . . . . . . . . . . . . . . . . . . . . . . . . . . . . . . . . . . . . . . . . . . . . . . . . . . 184
C.18. Comparing Financial Incentives for Differing Savings-Financed Education
Scenarios - Finland . . . . . . . . . . . . . . . . . . . . . . . . . . . . . . . . . . . . . . . . . . . . . . . . . . . 185
C.19. Comparing Financial Incentives for College Education with Different Financing
Scenarios - Greece . . . . . . . . . . . . . . . . . . . . . . . . . . . . . . . . . . . . . . . . . . . . . . . . . . . . 186
C.20. Comparing Financial Incentives for Differing Savings-Financed Education
Scenarios - Greece . . . . . . . . . . . . . . . . . . . . . . . . . . . . . . . . . . . . . . . . . . . . . . . . . . . . 187
C.21. Comparing Financial Incentives for College Education with Different Financing
Scenarios - Hungary . . . . . . . . . . . . . . . . . . . . . . . . . . . . . . . . . . . . . . . . . . . . . . . . . . 188
C.22. Comparing Financial Incentives for Differing Savings-Financed Education
Scenarios - Hungary . . . . . . . . . . . . . . . . . . . . . . . . . . . . . . . . . . . . . . . . . . . . . . . . . . 189
C.23. Comparing Financial Incentives for College Education with Different Financing
Scenarios - Iceland . . . . . . . . . . . . . . . . . . . . . . . . . . . . . . . . . . . . . . . . . . . . . . . . . . . 190
C.24. Comparing Financial Incentives for Differing Savings-Financed Education
Scenarios - Iceland . . . . . . . . . . . . . . . . . . . . . . . . . . . . . . . . . . . . . . . . . . . . . . . . . . . 191
C.25. Comparing Financial Incentives for College Education with Different Financing
Scenarios - Ireland. . . . . . . . . . . . . . . . . . . . . . . . . . . . . . . . . . . . . . . . . . . . . . . . . . . . 192
C.26. Comparing Financial Incentives for Differing Savings-Financed Education
Scenarios - Ireland. . . . . . . . . . . . . . . . . . . . . . . . . . . . . . . . . . . . . . . . . . . . . . . . . . . . 193
C.27. Comparing Financial Incentives for College Education with Different Financing
Scenarios - Israel . . . . . . . . . . . . . . . . . . . . . . . . . . . . . . . . . . . . . . . . . . . . . . . . . . . . . 194
C.28. Comparing Financial Incentives for Differing Savings-Financed Education
Scenarios - Israel . . . . . . . . . . . . . . . . . . . . . . . . . . . . . . . . . . . . . . . . . . . . . . . . . . . . . 195
C.29. Comparing Financial Incentives for College Education with Different Financing
Scenarios - Italy . . . . . . . . . . . . . . . . . . . . . . . . . . . . . . . . . . . . . . . . . . . . . . . . . . . . . . 196
C.30. Comparing Financial Incentives for Differing Savings-Financed Education
Scenarios - Italy . . . . . . . . . . . . . . . . . . . . . . . . . . . . . . . . . . . . . . . . . . . . . . . . . . . . . . 197
C.31. Comparing Financial Incentives for College Education with Different Financing
Scenarios - luxembourg . . . . . . . . . . . . . . . . . . . . . . . . . . . . . . . . . . . . . . . . . . . . . . . 198
C.32. Comparing Financial Incentives for Differing Savings-Financed Education
Scenarios - luxembourg . . . . . . . . . . . . . . . . . . . . . . . . . . . . . . . . . . . . . . . . . . . . . . . 199
C.33. Comparing Financial Incentives for College Education with Different Financing
Scenarios - mexico. . . . . . . . . . . . . . . . . . . . . . . . . . . . . . . . . . . . . . . . . . . . . . . . . . . . 200
C.34. Comparing Financial Incentives for Differing Savings-Financed Education
Scenarios - mexico. . . . . . . . . . . . . . . . . . . . . . . . . . . . . . . . . . . . . . . . . . . . . . . . . . . . 201
C.35. Comparing Financial Incentives for College Education with Different Financing
Scenarios - Netherlands . . . . . . . . . . . . . . . . . . . . . . . . . . . . . . . . . . . . . . . . . . . . . . . 202
C.36. Comparing Financial Incentives for Differing Savings-Financed Education
Scenarios - Netherlands . . . . . . . . . . . . . . . . . . . . . . . . . . . . . . . . . . . . . . . . . . . . . . . 203
C.37. Comparing Financial Incentives for College Education with Different Financing
Scenarios - New Zealand . . . . . . . . . . . . . . . . . . . . . . . . . . . . . . . . . . . . . . . . . . . . . . 204
C.38. Comparing Financial Incentives for Differing Savings-Financed Education
Scenarios - New Zealand . . . . . . . . . . . . . . . . . . . . . . . . . . . . . . . . . . . . . . . . . . . . . . 205
10
TABlE OF CONTENTS
TAxATION AND SkIllS © OECD 2017
C.39. Comparing Financial Incentives for College Education with Different Financing
Scenarios - Norway . . . . . . . . . . . . . . . . . . . . . . . . . . . . . . . . . . . . . . . . . . . . . . . . . . . 206
C.40. Comparing Financial Incentives for Differing Savings-Financed Education
Scenarios - Norway . . . . . . . . . . . . . . . . . . . . . . . . . . . . . . . . . . . . . . . . . . . . . . . . . . . 207
C.41. Comparing Financial Incentives for College Education with Different Financing
Scenarios - Poland . . . . . . . . . . . . . . . . . . . . . . . . . . . . . . . . . . . . . . . . . . . . . . . . . . . . 208
C.42. Comparing Financial Incentives for Differing Savings-Financed Education
Scenarios - Poland . . . . . . . . . . . . . . . . . . . . . . . . . . . . . . . . . . . . . . . . . . . . . . . . . . . . 209
C.43. Comparing Financial Incentives for College Education with Different Financing
Scenarios - Portugal. . . . . . . . . . . . . . . . . . . . . . . . . . . . . . . . . . . . . . . . . . . . . . . . . . . 210
C.44. Comparing Financial Incentives for Differing Savings-Financed Education
Scenarios - Portugal. . . . . . . . . . . . . . . . . . . . . . . . . . . . . . . . . . . . . . . . . . . . . . . . . . . 211
C.45. Comparing Financial Incentives for College Education with Different Financing
Scenarios - Slovak Republic . . . . . . . . . . . . . . . . . . . . . . . . . . . . . . . . . . . . . . . . . . . . 212
C.46. Comparing Financial Incentives for Differing Savings-Financed Education
Scenarios - Slovak Republic . . . . . . . . . . . . . . . . . . . . . . . . . . . . . . . . . . . . . . . . . . . . 213
C.47. Comparing Financial Incentives for College Education with Different Financing
Scenarios - Slovenia . . . . . . . . . . . . . . . . . . . . . . . . . . . . . . . . . . . . . . . . . . . . . . . . . . 214
C.48. Comparing Financial Incentives for Differing Savings-Financed Education
Scenarios - Slovenia . . . . . . . . . . . . . . . . . . . . . . . . . . . . . . . . . . . . . . . . . . . . . . . . . . 215
C.49. Comparing Financial Incentives for College Education with Different Financing
Scenarios - Spain . . . . . . . . . . . . . . . . . . . . . . . . . . . . . . . . . . . . . . . . . . . . . . . . . . . . . 216
C.50. Comparing Financial Incentives for Differing Savings-Financed Education
Scenarios - Spain . . . . . . . . . . . . . . . . . . . . . . . . . . . . . . . . . . . . . . . . . . . . . . . . . . . . . 217
C.51. Comparing Financial Incentives for College Education with Different Financing
Scenarios - Sweden . . . . . . . . . . . . . . . . . . . . . . . . . . . . . . . . . . . . . . . . . . . . . . . . . . . 218
C.52. Comparing Financial Incentives for Differing Savings-Financed Education
Scenarios - Sweden . . . . . . . . . . . . . . . . . . . . . . . . . . . . . . . . . . . . . . . . . . . . . . . . . . . 219
C.53. Comparing Financial Incentives for College Education with Different Financing
Scenarios - Switzerland . . . . . . . . . . . . . . . . . . . . . . . . . . . . . . . . . . . . . . . . . . . . . . . 220
C.54. Comparing Financial Incentives for Differing Savings-Financed Education
Scenarios - Switzerland . . . . . . . . . . . . . . . . . . . . . . . . . . . . . . . . . . . . . . . . . . . . . . . 221
C.55. Comparing Financial Incentives for College Education with Different Financing
Scenarios - Turkey . . . . . . . . . . . . . . . . . . . . . . . . . . . . . . . . . . . . . . . . . . . . . . . . . . . . 222
C.56. Comparing Financial Incentives for Differing Savings-Financed Education
Scenarios - Turkey . . . . . . . . . . . . . . . . . . . . . . . . . . . . . . . . . . . . . . . . . . . . . . . . . . . . 223
C.57. Comparing Financial Incentives for College Education with Different Financing
Scenarios - United kingdom . . . . . . . . . . . . . . . . . . . . . . . . . . . . . . . . . . . . . . . . . . . 224
C.58. Comparing Financial Incentives for Differing Savings-Financed Education
Scenarios - United kingdom . . . . . . . . . . . . . . . . . . . . . . . . . . . . . . . . . . . . . . . . . . . 225
Figures
1.1. multifactor productivity in long run comparative perspective . . . . . . . . . . . . . . . 23
1.2. Income inequality increased in most OECD countries. . . . . . . . . . . . . . . . . . . . . . 24
1.3. Changes in household disposable income by income groups. . . . . . . . . . . . . . . . 25
1.4. The decline of the labour share in OECD countries, 1990 – 2009 . . . . . . . . . . . . . 26
1.5. Redistribution became weaker in most countries until the onset of the crisis . 27
11
TABlE OF CONTENTS
TAxATION AND SkIllS © OECD 2017
1.6. Trends in enrolment rates of 15-19 and 20-29 year-olds (2005-2013) . . . . . . . . . . 28
1.7. Intergenerational mobility in education (2012) . . . . . . . . . . . . . . . . . . . . . . . . . . . . 29
1.8. Distribution of wages, by literacy proficiency level. . . . . . . . . . . . . . . . . . . . . . . . . 30
1.9. Evolution of employment in occupational groups defined by level of education . . 31
1.10. Spending on primary-tertiary educational institutions as a share of GDP . . . . . 33
3.1. Direct private costs of skills investment for individuals . . . . . . . . . . . . . . . . . . . . 53
3.2. Average scholarship income for tertiary education students . . . . . . . . . . . . . . . . 53
3.3. The relationship between income after education and taxes paid after
education . . . . . . . . . . . . . . . . . . . . . . . . . . . . . . . . . . . . . . . . . . . . . . . . . . . . . . . . . . . 56
3.4. The costs and benefits of education . . . . . . . . . . . . . . . . . . . . . . . . . . . . . . . . . . . . . 57
3.5. The labour market premium for tertiary education . . . . . . . . . . . . . . . . . . . . . . . . 58
3.6. The tax rate on foregone earnings, the tax rate on the earnings increment and
the marginal effective tax rate on skills . . . . . . . . . . . . . . . . . . . . . . . . . . . . . . . . . . 61
3.7. The tax rate on foregone earnings, the tax rate on the earnings increment, and
the average effective tax rate on skills . . . . . . . . . . . . . . . . . . . . . . . . . . . . . . . . . . . 62
3.8. Direct costs of skills investment for governments . . . . . . . . . . . . . . . . . . . . . . . . . 64
3.9. Comparing average and marginal returns to costs ratios . . . . . . . . . . . . . . . . . . . 67
4.1. Breakeven earnings increments for tertiary education
(% of wage before education) . . . . . . . . . . . . . . . . . . . . . . . . . . . . . . . . . . . . . . . . . . . 72
4.2. Comparing the breakeven tertiary earnings increment
to the tertiary labour market premium . . . . . . . . . . . . . . . . . . . . . . . . . . . . . . . . . . 73
4.3. marginal effective tax rates on tertiary education . . . . . . . . . . . . . . . . . . . . . . . . . 74
4.4. Average effective tax rates on tertiary education . . . . . . . . . . . . . . . . . . . . . . . . . . 75
4.5. Average returns to costs ratio of government investment in tertiary education 75
4.6. marginal returns to costs ratio of government investment in tertiary education . . 76
4.7. Average effective tax rates on skills, marginal effective tax rates on skills
and breakeven earnings increments varied by income before education:
tertiary education student . . . . . . . . . . . . . . . . . . . . . . . . . . . . . . . . . . . . . . . . . . . . . 77
4.8. Breakeven earnings increments for a tertiary education student
at a 6% nominal interest rate . . . . . . . . . . . . . . . . . . . . . . . . . . . . . . . . . . . . . . . . . . . 79
4.9. Breakeven earnings increments for a tertiary education student
and a 0% nominal rate of interest . . . . . . . . . . . . . . . . . . . . . . . . . . . . . . . . . . . . . . . 81
4.10. Breakeven earnings increments for a tertiary education student
at various levels of student debt . . . . . . . . . . . . . . . . . . . . . . . . . . . . . . . . . . . . . . . . 82
4.11. Breakeven earnings increments for graduate education
(% of wage before education) . . . . . . . . . . . . . . . . . . . . . . . . . . . . . . . . . . . . . . . . . . . 83
4.12. marginal effective tax rates on graduate education . . . . . . . . . . . . . . . . . . . . . . . . 84
4.13. Average effective tax rates on graduate education. . . . . . . . . . . . . . . . . . . . . . . . . 84
4.14. Average effective tax rates on skills, marginal effective tax rates on skills
and breakeven earnings increments varied by income before education:
graduate student . . . . . . . . . . . . . . . . . . . . . . . . . . . . . . . . . . . . . . . . . . . . . . . . . . . . . 85
4.15. Breakeven earnings increments for job-related education
(% of wage before education) . . . . . . . . . . . . . . . . . . . . . . . . . . . . . . . . . . . . . . . . . . . 87
4.16. marginal effective tax rates for job-related education . . . . . . . . . . . . . . . . . . . . . . 88
4.17. Breakeven earnings increments for lifelong learning
(% of wage before education) . . . . . . . . . . . . . . . . . . . . . . . . . . . . . . . . . . . . . . . . . . . 89
12
TABlE OF CONTENTS
TAxATION AND SkIllS © OECD 2017
Look for the StatLinks2at the bottom of the tables or graphs in this book. To download the matching Excel® spreadsheet, just type the link into your Internet browser, starting with the http://dx.doi.org pre�x, or click on the link from the e-book edition.
Follow OECD Publications on:
This book has... StatLinks2A service that delivers Excel �les from the printed page! ®
http://twitter.com/OECD_Pubs
http://www.facebook.com/OECDPublications
http://www.linkedin.com/groups/OECD-Publications-4645871
http://www.youtube.com/oecdilibrary
http://www.oecd.org/oecddirect/ OECD
Alerts
4.18. Breakeven earnings increments by age and income
(% of wage before education) . . . . . . . . . . . . . . . . . . . . . . . . . . . . . . . . . . . . . . . . . . . 90
4.19. Average effective tax rates for lifelong learning . . . . . . . . . . . . . . . . . . . . . . . . . . . 91
4.20. Average effective tax rates by age and income . . . . . . . . . . . . . . . . . . . . . . . . . . . . 92
4.21. Earnings increment by gender. . . . . . . . . . . . . . . . . . . . . . . . . . . . . . . . . . . . . . . . . . 93
4.22. Average returns to costs ratio by gender . . . . . . . . . . . . . . . . . . . . . . . . . . . . . . . . . 94
5.1. Value of skills tax expenditures for tertiary students, in 2011 PPP USD,
incorporating personal income tax only . . . . . . . . . . . . . . . . . . . . . . . . . . . . . . . . . 101
5.2. Value of skills tax expenditures for tertiary students as a percentage
of the average wage, incorporating personal income tax only . . . . . . . . . . . . . . . 102
5.3. Value of skills tax expenditures for tertiary students incorporating
employee and employer social security contributions, in 2011 PPP USD . . . . . . 103
5.4. Breakeven earnings increments on skills with and without skills tax
expenditures, incorporating personal income tax only . . . . . . . . . . . . . . . . . . . . . 104
5.5. marginal effective tax rates on skills with and without skills
tax expenditures, incorporating personal income tax only. . . . . . . . . . . . . . . . . . 105
5.6. Average effective tax rates on skills with and without skills
tax expenditures, incorporating personal income tax only. . . . . . . . . . . . . . . . . . 105
5.7. Correlations between the breakeven earnings increment and marginal
effective tax rate on skills. . . . . . . . . . . . . . . . . . . . . . . . . . . . . . . . . . . . . . . . . . . . . . 108
5.8. Cross-country correlations between tax rates on foregone earnings, tax rates on
breakeven earnings increments, and the marginal effective tax rates on skills. . . . 109
5.9. Breakeven earnings increments on skills with and without skills tax
expenditures, incorporating employee and employer social security
contributions . . . . . . . . . . . . . . . . . . . . . . . . . . . . . . . . . . . . . . . . . . . . . . . . . . . . . . . . 113
5.10. Extra value accruing due to tax credit carry-forward, by annual cost of
education . . . . . . . . . . . . . . . . . . . . . . . . . . . . . . . . . . . . . . . . . . . . . . . . . . . . . . . . . . . 115
5.11. Components of government expenditures on skills, in 2011 PPP USD,
incorporating employee and employer social security contributions . . . . . . . . . 117
5.12. Breakeven earnings increments with and without scholarship income,
incorporating personal income tax only . . . . . . . . . . . . . . . . . . . . . . . . . . . . . . . . . 118
5.13. Breakeven earnings increments with and without scholarship income,
incorporating personal income tax only . . . . . . . . . . . . . . . . . . . . . . . . . . . . . . . . . 120
5.14. One-period cost components of skills investments for students, excluding
taxes on earnings increments, incorporating employee and employer social
security contributions . . . . . . . . . . . . . . . . . . . . . . . . . . . . . . . . . . . . . . . . . . . . . . . . . 121
5.15. Australian system of income contingent loans. . . . . . . . . . . . . . . . . . . . . . . . . . . . 123
5.16. Value of skills tax expenditures for mid-career training, as a percentage
of the direct costs of training, incorporating personal income tax only . . . . . . . 125
5.17. Value of skills tax expenditures for mid-career training, as a percentage of
direct costs of education across income levels, incorporating personal income
tax only . . . . . . . . . . . . . . . . . . . . . . . . . . . . . . . . . . . . . . . . . . . . . . . . . . . . . . . . . . . . . 128
5.18. Value of skills tax expenditures for job-related training versus
non-job-related training, incorporating personal income tax only . . . . . . . . . . . 129
5.19. Tax progressivity and education spending . . . . . . . . . . . . . . . . . . . . . . . . . . . . . . . 132
A.1. Interpreting the BEI: sample path of skills costs and returns . . . . . . . . . . . . . . . . 150

13
TABlE OF CONTENTS
TAxATION AND SkIllS © OECD 2017
Look for the StatLinks2at the bottom of the tables or graphs in this book. To download the matching Excel® spreadsheet, just type the link into your Internet browser, starting with the http://dx.doi.org pre�x, or click on the link from the e-book edition.
Follow OECD Publications on:
This book has... StatLinks2A service that delivers Excel �les from the printed page! ®
http://twitter.com/OECD_Pubs
http://www.facebook.com/OECDPublications
http://www.linkedin.com/groups/OECD-Publications-4645871
http://www.youtube.com/oecdilibrary
http://www.oecd.org/oecddirect/ OECD
Alerts

TAxATION AND SkIllS © OECD 2017 15
ABBREVIATIONS AND ACRONYmS
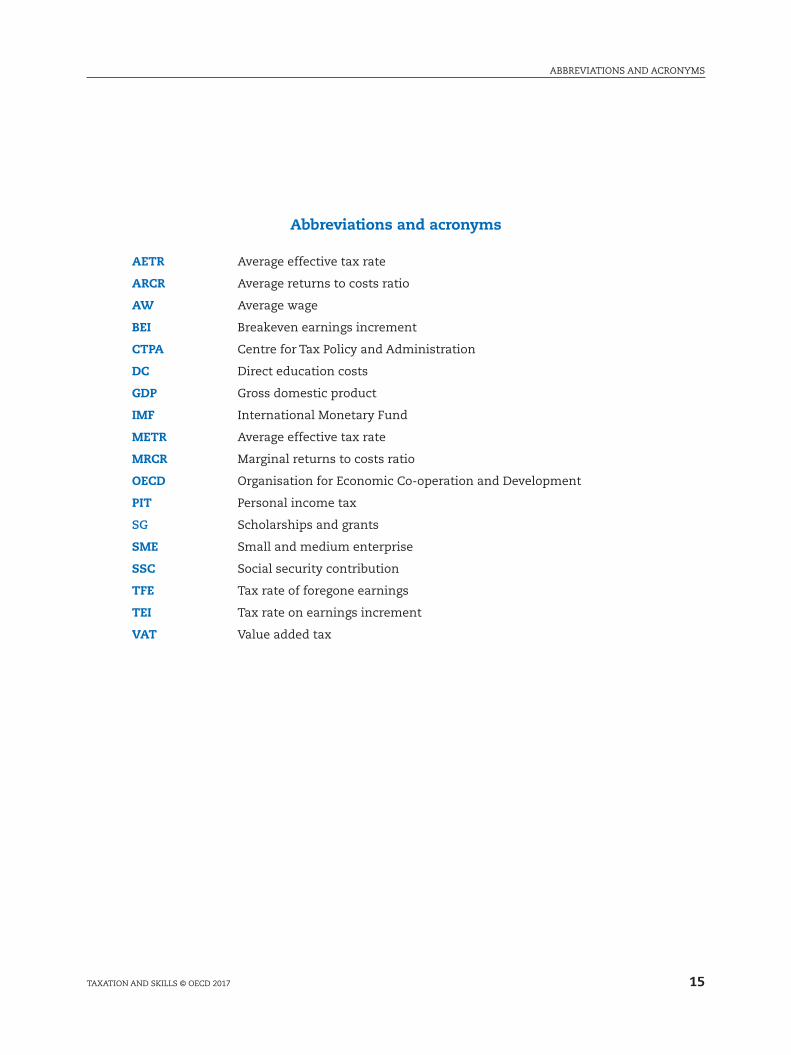
Abbreviations and acronyms
AETR Average effective tax rate
ARCR Average returns to costs ratio
AW Average wage
BEI Breakeven earnings increment
CTPA Centre for Tax Policy and Administration
DC Direct education costs
GDP Gross domestic product
IMF International monetary Fund
METR Average effective tax rate
MRCR marginal returns to costs ratio
OECD Organisation for Economic Co-operation and Development
PIT Personal income tax
SG Scholarships and grants
SME Small and medium enterprise
SSC Social security contribution
TFE Tax rate of foregone earnings
TEI Tax rate on earnings increment
VAT Value added tax

17TAxATION AND SkIllS © OECD 2017
Taxation and Skills
© OECD 2017
Executive summary
Ensuring that all individuals can develop the skills needed to productively participate in
the economy is necessary for inclusive economic growth. Investing in skills can expand the
productive capacity of the economy and at the same time reduce inequality by ensuring that
all members of society have the opportunity to fulfil their productive and creative potential.
Improving the level of skills across the economy has positive impacts for individuals and
society as a whole. For many individuals, human capital represents the most valuable asset
they will possess in their lifetime.
The tax system impacts the ability of individuals to develop skills in a variety of ways.
The revenues that taxes raise can be used to finance direct investments in skills. The tax
code can treat labour and capital income differently, which can create incentives to invest in
physical instead of human capital. Equally, the tax system can impact the financial incentives
of individuals to develop, activate and use their skills efficiently in the labour market.
Better skill levels lead to higher wages and stronger employment prospects for workers,
higher productivity and profits for businesses, and higher growth rates and tax revenues for
governments. However, financing this spending is challenging for many OECD countries,
especially in the context of high levels of public and private debt, and debate continues
about how the costs of skills investments should be equitably and efficiently shared between
governments, individuals, and businesses. A principal mechanism for this sharing of costs
and benefits is the tax system.
This study assesses the way that taxes and other policy levers impact skills investments.
While the effects of the tax system on investment in physical capital have been widely
studied, investment in human capital has received less attention. This study presents
indicators that measure the impact of tax and spending policy on individuals’ incentives to
invest in skills. These indicators take into account the financial costs of skills investments
for individuals such as lost after-tax earnings and tuition fees, as well as the costs borne
by governments such as grants, scholarships, lost taxes, and skills tax expenditures. The
indicators also incorporate the returns to skills investments for individuals and governments
through higher after-tax wages and higher tax revenues respectively.
The first indicator measures how much an individual’s earnings need to increase before
they recover the costs of a skills investment over their remaining years in the workforce.
The second indicator is an effective tax rate on skills, which measures how much taxes
raise or reduce the net returns to skills investments for an individual. The third indicator
measures the returns to skills investments for governments, comparing the government’s
costs of educating an individual to the government’s expected returns in the form of higher
tax revenues. These indicators are developed for individuals who will just break even on a
ExECUTIVE SUmmARY
18 TAxATION AND SkIllS © OECD 2017
skills investment, and for individuals who will earn a larger return. Investments financed
with both debt and savings are examined.
These indicators are modelled for a series of hypothetical skills investment scenarios,
including a young university student and a mid-career worker. Results are presented for
29 OECD countries. The results in the study do not incorporate the impact of social security
contributions; only personal income taxes are incorporated. Some of the key insights of
the study include:
●● Tertiary education is a financially attractive investment for individuals: Based on the
current tax, scholarship, and tuition policy mix, the results show that the wage premium
earned by a university student in the current labour market is above – often well above –
what is required to break even on the costs of tertiary education.
●● Governments recoup the costs of their investment in tertiary education on average through higher tax revenues on higher wages from more highly skilled workers: The extra income
taxes paid over the lifetime of an average student more than cover government costs of
educating that student. For some countries – though not all – the results suggest that
increasing tertiary education spending would be self-financing in terms of income tax
revenue alone.
●● For individuals whose returns to skills are lower, future expected income tax revenue may not cover governments’ costs of tertiary education: This is especially true where
government spending on tertiary education is currently high. For governments to break
even financially from increased skills spending, this spending should be targeted to
encourage those skills investments where returns will be highest.
●● The effective tax rate on skills depends on how much the individual’s wage rises after the skills investment: For a tertiary student who just breaks even on the costs of their
investment over their lifetime, tertiary education is comparatively lightly taxed; the tax
system accounts for about 4% of the amount of extra earnings needed to break even on a
skills investment. High-return skills investments are taxed more heavily than low-return
skills investments. For an average rate of return on a tertiary education in the OECD, the
tax system reduces the net returns by 19% on average.
●● Governments provide many tax expenditures to support investment in skills, such as tax deductions of skills expenses, or tax exemptions for scholarship income: The study argues
that a careful case-by-case analysis of these provisions is needed, and suggests that good
design is important in ensuring their effectiveness. Skills tax expenditures often provide
larger benefits to those with larger taxable incomes, and to those in secure employment
relative to those in casual employment. They may provide less assistance to those who are
credit constrained, who are more likely to be from lower income households. moreover,
evidence of their impact on wages and employment is mixed.
●● Some design aspects of skills tax provisions may reduce labour market flexibility, exacerbate skills mismatches and represent a drag on productivity: Existing skills
tax expenditures are often only available for training connected to a workers’ current
employment, and may be ineffective in assisting workers who need or want to change
careers.
●● Tax policies that encourage skills development and activation are complementary: Those
who are more likely to develop skills are more likely to use them in the labour market,
and those who work more and for longer have higher incentives to invest in skills. Tax

19
ExECUTIVE SUmmARY
TAxATION AND SkIllS © OECD 2017
policies that increase both skills investments and skills activation levels pay double
dividends, particularly for groups with lower labour market participation such as women
and older workers.
●● Ensuring access to skills for those who are credit constrained is crucial: Skills are unlike
physical capital because they cannot be used as collateral to finance an investment. This
may mean that skills investments with positive returns are not undertaken. Income-
contingent loans may be an efficient and equitable approach to addressing these issues.
The study provides a number of important messages for governments and policy makers.
First, the study demonstrates the importance of coherent policy mixes to encourage skills
investments. Where governments tax away the returns to skills through higher taxes, it is
important that public expenditure in support of skills is used to make skills investments
sufficiently attractive. Where spending on skills by governments is lower, it is important
that high taxes do not act as a large disincentive to invest. In all cases, the burden of the tax
system on human capital investment should be considered by both tax policy makers and
skills policy makers. Finally, the study presents a clear message to governments that the costs
of failing to invest in skills will have consequences in the years ahead. A failure to invest
in skills today will not only impede the economic participation of individuals and restrain
productivity growth, but will reduce future expected tax revenues, increase future expected
levels of social expenditure, and jeopardise future inclusive economic growth prospects.

21
Taxation and Skills
© OECD 2017
Chapter 1
Introduction: Tax, skills, and inclusive growth
This chapter places this study in the context of OECD work on productivity and inclusive growth, as well as the broader literature on the public finance of education. The importance of skills for growth and productivity, as well as for equality and inclusive growth are all discussed. The impact of the tax system on skills is briefly summarised, and an outline of the study is also provided.
The statistical data for Israel are supplied by and under the responsibility of the relevant Israeli authorities. The use of such data by the OECD is without prejudice to the status of the Golan Heights, East Jerusalem and Israeli settlements in the West Bank under the terms of international law.
22
1. INTRODUCTION: TAx, SkIllS, AND INClUSIVE GROWTH
TAxATION AND SkIllS © OECD 2017
1.1 Skills, growth, and productivitySkills are the cornerstone of building productive economies and inclusive societies. In a
world of increasing globalisation and rising inequality, increasing the quality of and access
to education has never been a higher priority for policy makers. This study considers how
the tax system can affect skills by building indicators that measure the impact of income
tax and spending policy on individuals’ incentives to invest in skills.
The nexus between tax, productivity, growth and equity has been the subject of significant
study at the OECD in recent years (OECD, 2015a, 2016). Recent work has investigated how
tax policy can be used to raise growth levels in the OECD, by shifting the tax mix towards
growth-friendly taxes (OECD, 2010b). Other research has also focused on how the tax system
can do more to encourage equity and inclusiveness, by examining the whole tax system
from a distributional perspective, by improving tax administration, and by removing tax
expenditures that mainly benefit those on higher incomes (Brys et. al. 2016; OECD, 2014b).
Often, however, tax policies that improve efficiency of the economy run counter to equity
considerations, and policies that increase the equity of the tax system may reduce growth.
Optimising the tax system for skills investments offers tax policy makers the opportunity
to increase both equity and efficiency, to foster growth that offers benefits for all.
Raising skill levels is crucial for increasing economic growth rates and building economies
that can provide employment and prosperity. Economic growth will increasingly depend on
improvements in productivity (OECD, 2015a). Scare resources, slow population growth, and
low levels of investment in physical capital have led to concerns about the future sources
of growth across the OECD. Increasing skill levels and boosting productivity is an important
response to these concerns: higher productivity means that even in the context of slowing
rates of growth of the capital or labour stock in the economy, growth can continue to improve
well-being and raise living standards in the OECD (OECD, 2016).
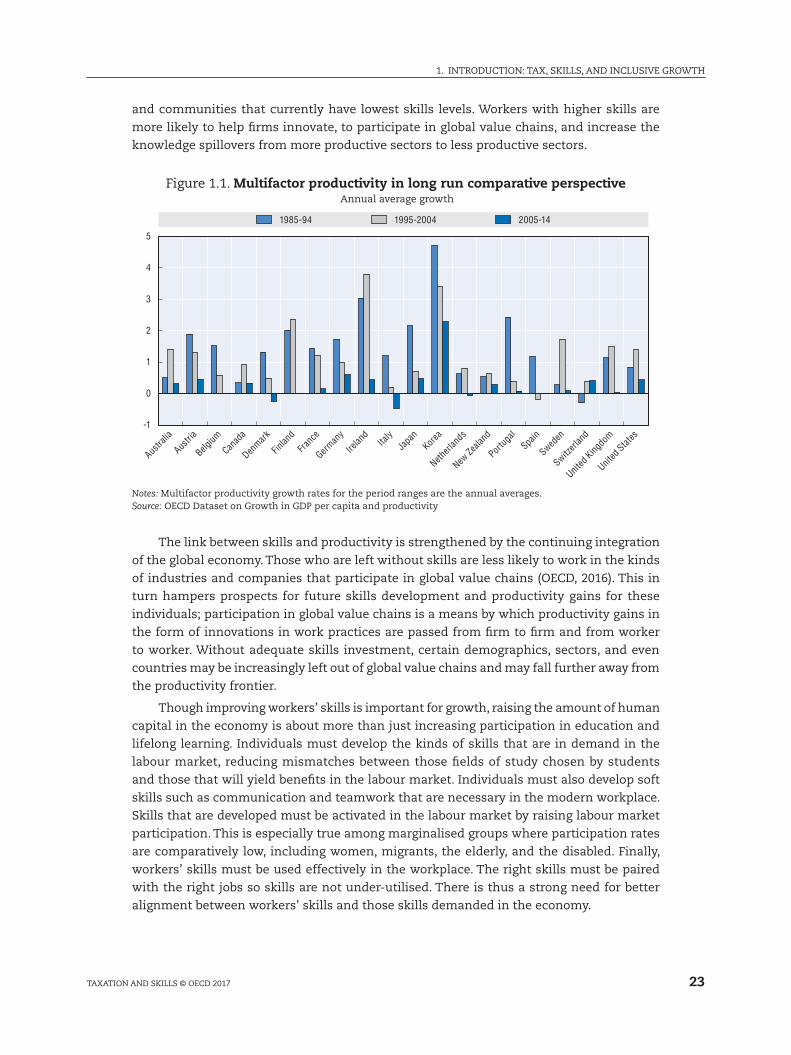
Over recent decades, productivity growth has been slowing. This is a key concern
given the importance of productivity growth for improving well-being. Figure 1.1 shows the
decline in factor productivity growth across selected OECD countries over the last decade
compared to previous decades. Ninety per cent of OECD countries experienced a decline in
the trend of labour productivity growth after the turn of the millennium (OECD, 2016). The
ability for technological developments to continue to provide strong productivity growth
across the OECD is increasingly being called into question, and concerns about a period of
secular stagnation across the developed world have been expressed by some policy makers
(Summers, 2014). The decline in the growth in productivity raises questions about whether
the countries can continue to raise living standards in years to come. There are also questions
as to whether future increases in living standards will accrue to a broad spectrum of workers
or whether only certain groups will benefit.
Raising skill levels can help policy makers meet these challenges. Adequate investment
in skills can ensure that all individuals can both contribute to and benefit from productivity
growth. While this is true for all workers it is especially vital among those demographics
23
1. INTRODUCTION: TAx, SkIllS, AND INClUSIVE GROWTH
TAxATION AND SkIllS © OECD 2017
and communities that currently have lowest skills levels. Workers with higher skills are
more likely to help firms innovate, to participate in global value chains, and increase the
knowledge spillovers from more productive sectors to less productive sectors.
Figure 1.1. Multifactor productivity in long run comparative perspective Annual average growth
-1
0
1
2
3
4
5
Austra
lia
Austri
a
Belgium
Canad
a
Denmark
Finlan
d
Franc
e
German
y
Irelan
dIta
lyJa
pan
Korea
Netherl
ands
New Ze
aland
Portug
alSpa
in
Sweden
Switzerl
and
United
Kingdo
m
United
States
1985-94 1995-2004 2005-14
Notes: multifactor productivity growth rates for the period ranges are the annual averages.Source: OECD Dataset on Growth in GDP per capita and productivity
The link between skills and productivity is strengthened by the continuing integration
of the global economy. Those who are left without skills are less likely to work in the kinds
of industries and companies that participate in global value chains (OECD, 2016). This in
turn hampers prospects for future skills development and productivity gains for these
individuals; participation in global value chains is a means by which productivity gains in
the form of innovations in work practices are passed from firm to firm and from worker
to worker. Without adequate skills investment, certain demographics, sectors, and even
countries may be increasingly left out of global value chains and may fall further away from
the productivity frontier.
Though improving workers’ skills is important for growth, raising the amount of human
capital in the economy is about more than just increasing participation in education and
lifelong learning. Individuals must develop the kinds of skills that are in demand in the
labour market, reducing mismatches between those fields of study chosen by students
and those that will yield benefits in the labour market. Individuals must also develop soft
skills such as communication and teamwork that are necessary in the modern workplace.
Skills that are developed must be activated in the labour market by raising labour market
participation. This is especially true among marginalised groups where participation rates
are comparatively low, including women, migrants, the elderly, and the disabled. Finally,
workers’ skills must be used effectively in the workplace. The right skills must be paired
with the right jobs so skills are not under-utilised. There is thus a strong need for better
alignment between workers’ skills and those skills demanded in the economy.
1. INTRODUCTION: TAx, SkIllS, AND INClUSIVE GROWTH
24 TAxATION AND SkIllS © OECD 2017
1.2 Skills, tax, and inclusive growthThe centrality of skills in the current policy environment does not just stem from
their important role in boosting productivity and growth; it also stems from the increasing
importance of reducing inequality for policy makers (OECD, 2015b). Raising skill levels can
make growth fairer, more inclusive, and more durable. Increasing skills across the workforce
allows more individuals to participate in the economy and to transition into higher-quality
jobs with higher wages.
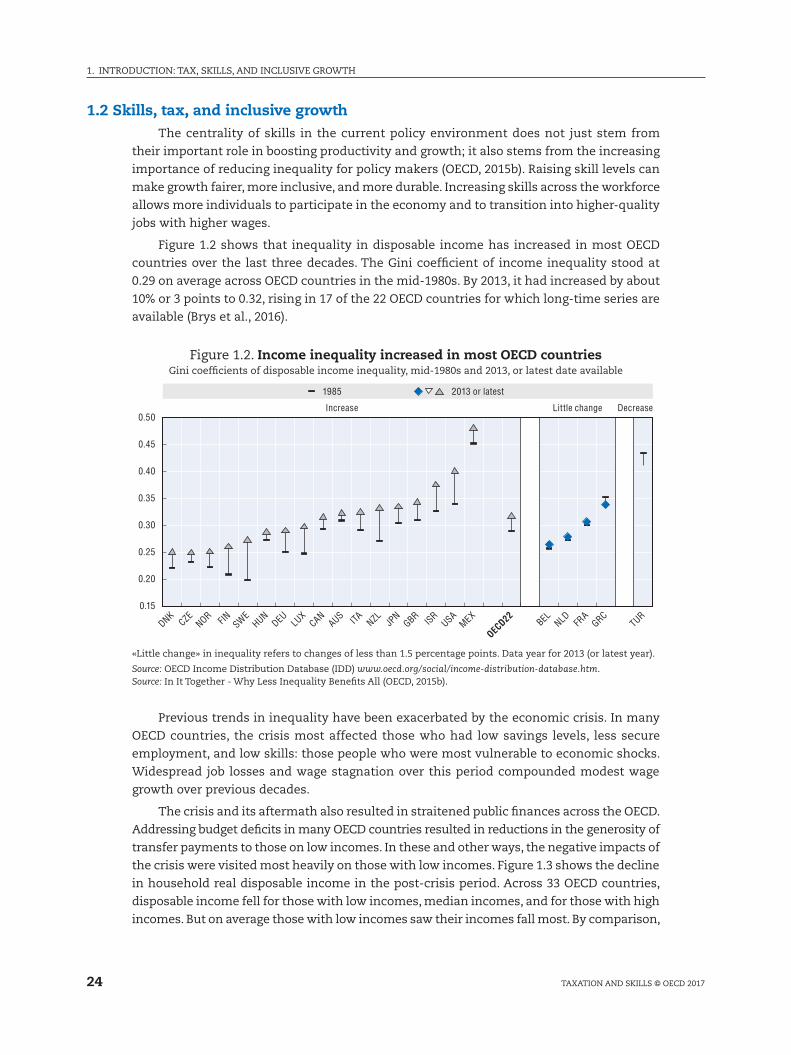
Figure 1.2 shows that inequality in disposable income has increased in most OECD
countries over the last three decades. The Gini coefficient of income inequality stood at
0.29 on average across OECD countries in the mid-1980s. By 2013, it had increased by about
10% or 3 points to 0.32, rising in 17 of the 22 OECD countries for which long-time series are
available (Brys et al., 2016).
Figure 1.2. Income inequality increased in most OECD countriesGini coefficients of disposable income inequality, mid-1980s and 2013, or latest date available
0.15
0.20
0.25
0.30
0.35
0.40
0.45
0.50
DNKCZE
NOR FIN SWEHUN
DEU LUX
CANAUS ITA NZL JP
NGBR ISR
USAMEX
OECD22
BEL NLD FRA
GRCTUR
1985 2013 or latest
Increase Little change Decrease
«little change» in inequality refers to changes of less than 1.5 percentage points. Data year for 2013 (or latest year).
Source: OECD Income Distribution Database (IDD) www.oecd.org/social/income-distribution-database.htm.Source: In It Together - Why less Inequality Benefits All (OECD, 2015b).
Previous trends in inequality have been exacerbated by the economic crisis. In many
OECD countries, the crisis most affected those who had low savings levels, less secure
employment, and low skills: those people who were most vulnerable to economic shocks.
Widespread job losses and wage stagnation over this period compounded modest wage
growth over previous decades.
The crisis and its aftermath also resulted in straitened public finances across the OECD.
Addressing budget deficits in many OECD countries resulted in reductions in the generosity of
transfer payments to those on low incomes. In these and other ways, the negative impacts of
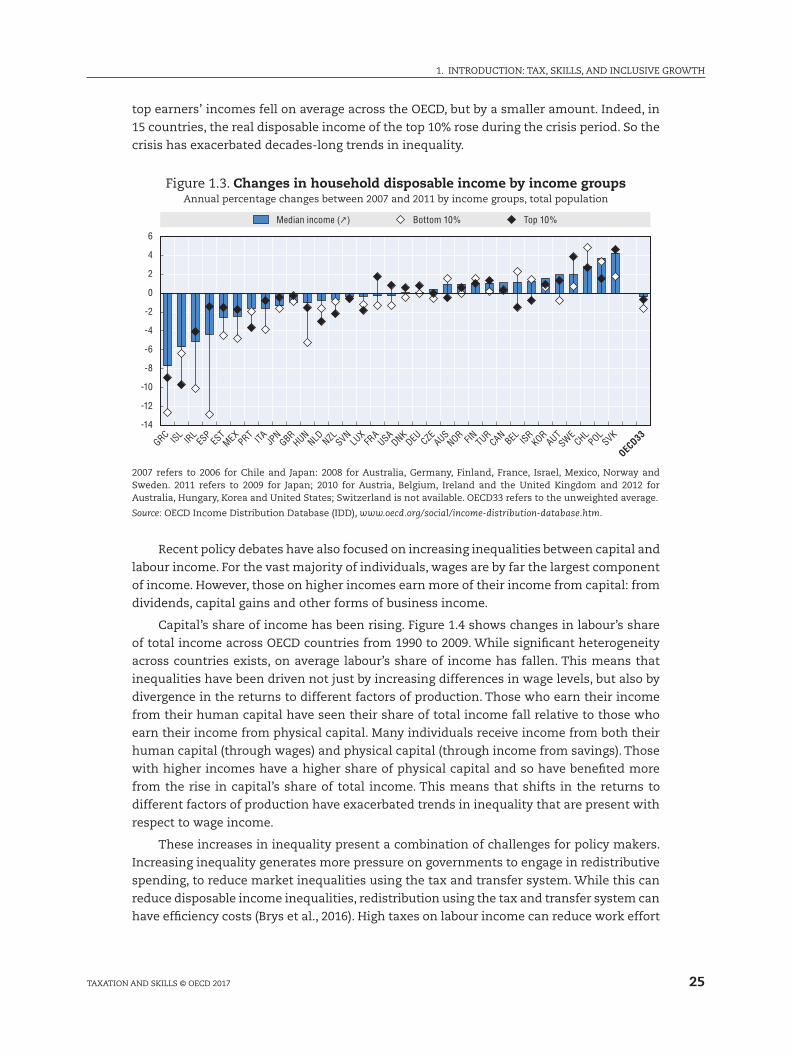
the crisis were visited most heavily on those with low incomes. Figure 1.3 shows the decline
in household real disposable income in the post-crisis period. Across 33 OECD countries,
disposable income fell for those with low incomes, median incomes, and for those with high
incomes. But on average those with low incomes saw their incomes fall most. By comparison,
25
1. INTRODUCTION: TAx, SkIllS, AND INClUSIVE GROWTH
TAxATION AND SkIllS © OECD 2017
top earners’ incomes fell on average across the OECD, but by a smaller amount. Indeed, in
15 countries, the real disposable income of the top 10% rose during the crisis period. So the
crisis has exacerbated decades-long trends in inequality.
Figure 1.3. Changes in household disposable income by income groupsAnnual percentage changes between 2007 and 2011 by income groups, total population
-14
-12
-10
-8
-6
-4
-2
0
2
4
6
GRC ISLIR
LES
PES
TMEX
PRT ITA JPN
GBRHUN
NLD NZL SVNLU
XFR
AUSA
DNKDEU CZE
AUSNOR FIN TUR
CANBEL ISR
KORAUT
SWECHL
POLSVK
OECD33
Median income ( ) Bottom 10% Top 10%
2007 refers to 2006 for Chile and Japan: 2008 for Australia, Germany, Finland, France, Israel, mexico, Norway and Sweden. 2011 refers to 2009 for Japan; 2010 for Austria, Belgium, Ireland and the United kingdom and 2012 for Australia, Hungary, korea and United States; Switzerland is not available. OECD33 refers to the unweighted average.
Source: OECD Income Distribution Database (IDD), www.oecd.org/social/income-distribution-database.htm.
Recent policy debates have also focused on increasing inequalities between capital and
labour income. For the vast majority of individuals, wages are by far the largest component
of income. However, those on higher incomes earn more of their income from capital: from
dividends, capital gains and other forms of business income.
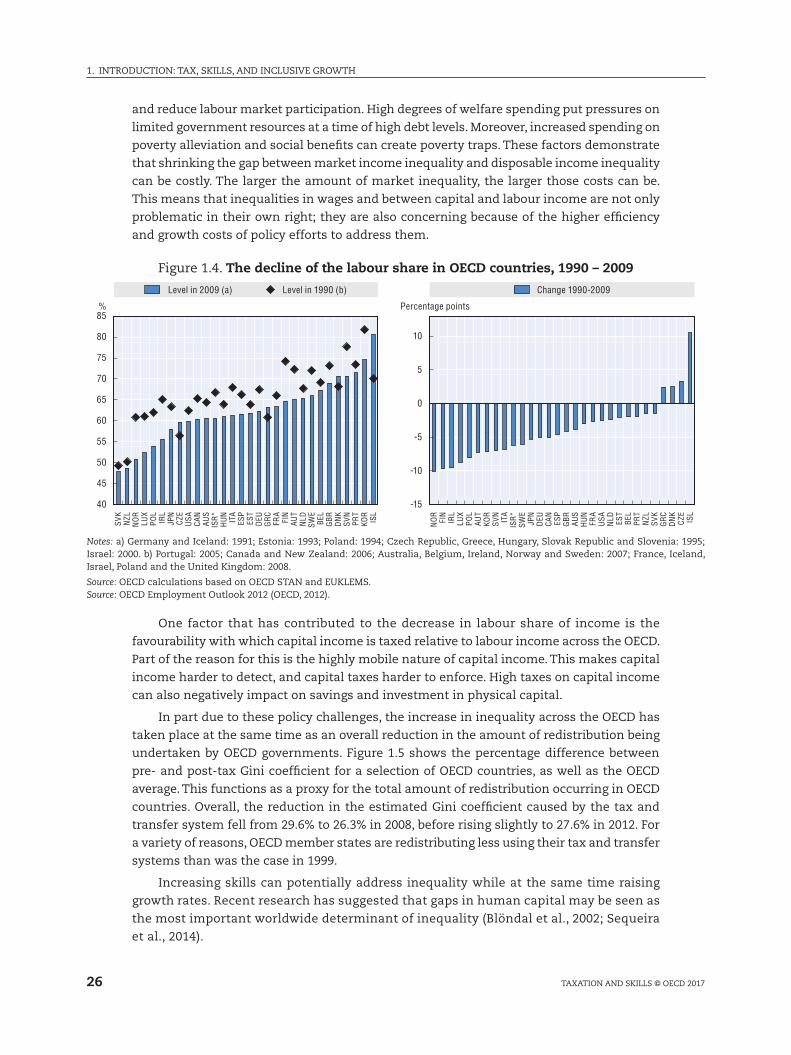
Capital’s share of income has been rising. Figure 1.4 shows changes in labour’s share
of total income across OECD countries from 1990 to 2009. While significant heterogeneity
across countries exists, on average labour’s share of income has fallen. This means that
inequalities have been driven not just by increasing differences in wage levels, but also by
divergence in the returns to different factors of production. Those who earn their income
from their human capital have seen their share of total income fall relative to those who
earn their income from physical capital. many individuals receive income from both their
human capital (through wages) and physical capital (through income from savings). Those
with higher incomes have a higher share of physical capital and so have benefited more
from the rise in capital’s share of total income. This means that shifts in the returns to
different factors of production have exacerbated trends in inequality that are present with
respect to wage income.
These increases in inequality present a combination of challenges for policy makers.
Increasing inequality generates more pressure on governments to engage in redistributive
spending, to reduce market inequalities using the tax and transfer system. While this can
reduce disposable income inequalities, redistribution using the tax and transfer system can
have efficiency costs (Brys et al., 2016). High taxes on labour income can reduce work effort
1. INTRODUCTION: TAx, SkIllS, AND INClUSIVE GROWTH
26 TAxATION AND SkIllS © OECD 2017
and reduce labour market participation. High degrees of welfare spending put pressures on
limited government resources at a time of high debt levels. moreover, increased spending on
poverty alleviation and social benefits can create poverty traps. These factors demonstrate
that shrinking the gap between market income inequality and disposable income inequality
can be costly. The larger the amount of market inequality, the larger those costs can be.
This means that inequalities in wages and between capital and labour income are not only
problematic in their own right; they are also concerning because of the higher efficiency
and growth costs of policy efforts to address them.
Figure 1.4. The decline of the labour share in OECD countries, 1990 – 2009
40
45
50
55
60
65
70
75
80
85
-10
-5
0
5
10
%
-15
Change 1990-2009
Percentage points
Level in 2009 (a) Level in 1990 (b)
SVK
NZL
NO
RLU
XPO
LIR
LJP
NCZ
EU
SACA
NAU
SIS
R*H
UN
ITA
ESP
EST
DEU
GR
CFR
AFI
NAU
TN
LDSW
EBE
LG
BRD
NK
SVN
PRT
KOR
ISL
NO
RFI
NIR
LLU
XPO
LAU
TKO
RSV
NIT
AIS
R*SW
EJP
ND
EUCA
NES
PG
BR AUS
HU
NFR
AU
SAN
LD EST
BEL
PRT
NZL
SVK
GR
CD
NK
CZE
ISL
Notes: a) Germany and Iceland: 1991; Estonia: 1993; Poland: 1994; Czech Republic, Greece, Hungary, Slovak Republic and Slovenia: 1995; Israel: 2000. b) Portugal: 2005; Canada and New Zealand: 2006; Australia, Belgium, Ireland, Norway and Sweden: 2007; France, Iceland, Israel, Poland and the United kingdom: 2008.
Source: OECD calculations based on OECD STAN and EUklEmS.Source: OECD Employment Outlook 2012 (OECD, 2012).
One factor that has contributed to the decrease in labour share of income is the
favourability with which capital income is taxed relative to labour income across the OECD.
Part of the reason for this is the highly mobile nature of capital income. This makes capital
income harder to detect, and capital taxes harder to enforce. High taxes on capital income
can also negatively impact on savings and investment in physical capital.
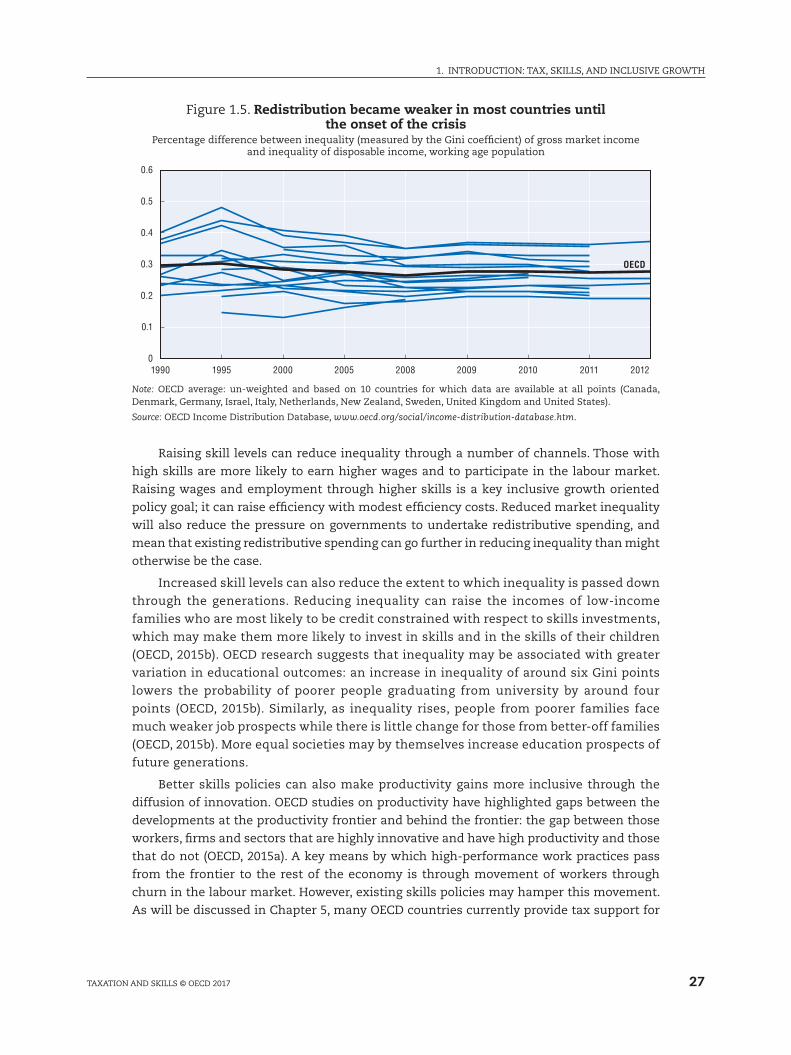
In part due to these policy challenges, the increase in inequality across the OECD has
taken place at the same time as an overall reduction in the amount of redistribution being
undertaken by OECD governments. Figure 1.5 shows the percentage difference between
pre- and post-tax Gini coefficient for a selection of OECD countries, as well as the OECD
average. This functions as a proxy for the total amount of redistribution occurring in OECD
countries. Overall, the reduction in the estimated Gini coefficient caused by the tax and
transfer system fell from 29.6% to 26.3% in 2008, before rising slightly to 27.6% in 2012. For
a variety of reasons, OECD member states are redistributing less using their tax and transfer
systems than was the case in 1999.
Increasing skills can potentially address inequality while at the same time raising
growth rates. Recent research has suggested that gaps in human capital may be seen as
the most important worldwide determinant of inequality (Blöndal et al., 2002; Sequeira
et al., 2014).
27
1. INTRODUCTION: TAx, SkIllS, AND INClUSIVE GROWTH
TAxATION AND SkIllS © OECD 2017
Figure 1.5. Redistribution became weaker in most countries until the onset of the crisis
Percentage difference between inequality (measured by the Gini coefficient) of gross market income and inequality of disposable income, working age population
0
0.1
0.2
0.3
0.4
0.5
0.6
1990 1995 2000 2005 2008 2009 2010 2011 2012
OECD
Note: OECD average: un-weighted and based on 10 countries for which data are available at all points (Canada, Denmark, Germany, Israel, Italy, Netherlands, New Zealand, Sweden, United kingdom and United States).
Source: OECD Income Distribution Database, www.oecd.org/social/income-distribution-database.htm.
Raising skill levels can reduce inequality through a number of channels. Those with
high skills are more likely to earn higher wages and to participate in the labour market.
Raising wages and employment through higher skills is a key inclusive growth oriented
policy goal; it can raise efficiency with modest efficiency costs. Reduced market inequality
will also reduce the pressure on governments to undertake redistributive spending, and
mean that existing redistributive spending can go further in reducing inequality than might
otherwise be the case.
Increased skill levels can also reduce the extent to which inequality is passed down
through the generations. Reducing inequality can raise the incomes of low-income
families who are most likely to be credit constrained with respect to skills investments,
which may make them more likely to invest in skills and in the skills of their children
(OECD, 2015b). OECD research suggests that inequality may be associated with greater
variation in educational outcomes: an increase in inequality of around six Gini points
lowers the probability of poorer people graduating from university by around four
points (OECD, 2015b). Similarly, as inequality rises, people from poorer families face
much weaker job prospects while there is little change for those from better-off families
(OECD, 2015b). more equal societies may by themselves increase education prospects of
future generations.
Better skills policies can also make productivity gains more inclusive through the
diffusion of innovation. OECD studies on productivity have highlighted gaps between the
developments at the productivity frontier and behind the frontier: the gap between those
workers, firms and sectors that are highly innovative and have high productivity and those
that do not (OECD, 2015a). A key means by which high-performance work practices pass
from the frontier to the rest of the economy is through movement of workers through
churn in the labour market. However, existing skills policies may hamper this movement.
As will be discussed in Chapter 5, many OECD countries currently provide tax support for
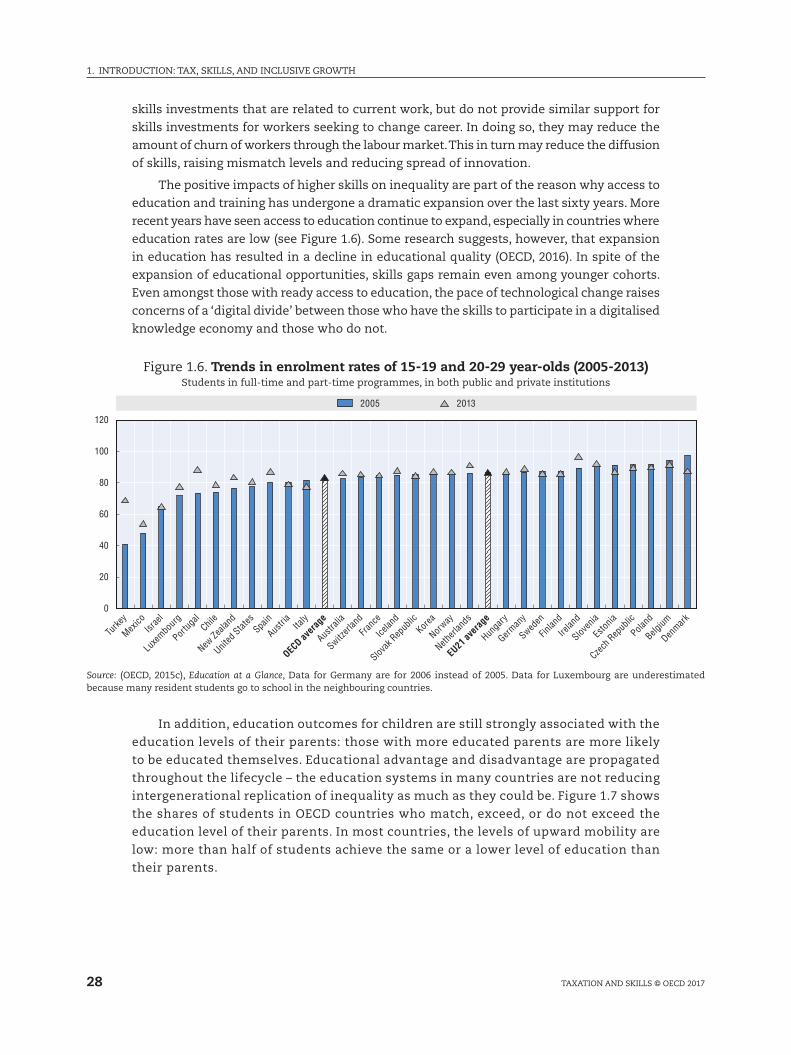
1. INTRODUCTION: TAx, SkIllS, AND INClUSIVE GROWTH
28 TAxATION AND SkIllS © OECD 2017
skills investments that are related to current work, but do not provide similar support for
skills investments for workers seeking to change career. In doing so, they may reduce the
amount of churn of workers through the labour market. This in turn may reduce the diffusion
of skills, raising mismatch levels and reducing spread of innovation.
The positive impacts of higher skills on inequality are part of the reason why access to
education and training has undergone a dramatic expansion over the last sixty years. more
recent years have seen access to education continue to expand, especially in countries where
education rates are low (see Figure 1.6). Some research suggests, however, that expansion
in education has resulted in a decline in educational quality (OECD, 2016). In spite of the
expansion of educational opportunities, skills gaps remain even among younger cohorts.
Even amongst those with ready access to education, the pace of technological change raises
concerns of a ‘digital divide’ between those who have the skills to participate in a digitalised
knowledge economy and those who do not.
Figure 1.6. Trends in enrolment rates of 15-19 and 20-29 year-olds (2005-2013)Students in full-time and part-time programmes, in both public and private institutions
0
20
40
60
80
100
120
2005 2013
Turke
y
Mexico
Israe
l
Luxe
mbour
g
Portug
alChil
e
New Ze
aland
United
States
Spain
Austri
aIta
ly
OECD av
erag
e
Austra
lia
Switzerl
and
Franc
e
Icelan
d
Slovak
Rep
ublic
Korea
Norway
Netherl
ands
EU21 ave
rage
Hunga
ry
German
y
Sweden
Finlan
d
Irelan
d
Sloven
ia
Eston
ia
Czech
Rep
ublic
Poland
Belgium
Denmark
Source: (OECD, 2015c), Education at a Glance, Data for Germany are for 2006 instead of 2005. Data for luxembourg are underestimated because many resident students go to school in the neighbouring countries.
In addition, education outcomes for children are still strongly associated with the
education levels of their parents: those with more educated parents are more likely
to be educated themselves. Educational advantage and disadvantage are propagated
throughout the lifecycle – the education systems in many countries are not reducing
intergenerational replication of inequality as much as they could be. Figure 1.7 shows
the shares of students in OECD countries who match, exceed, or do not exceed the
education level of their parents. In most countries, the levels of upward mobility are
low: more than half of students achieve the same or a lower level of education than
their parents.
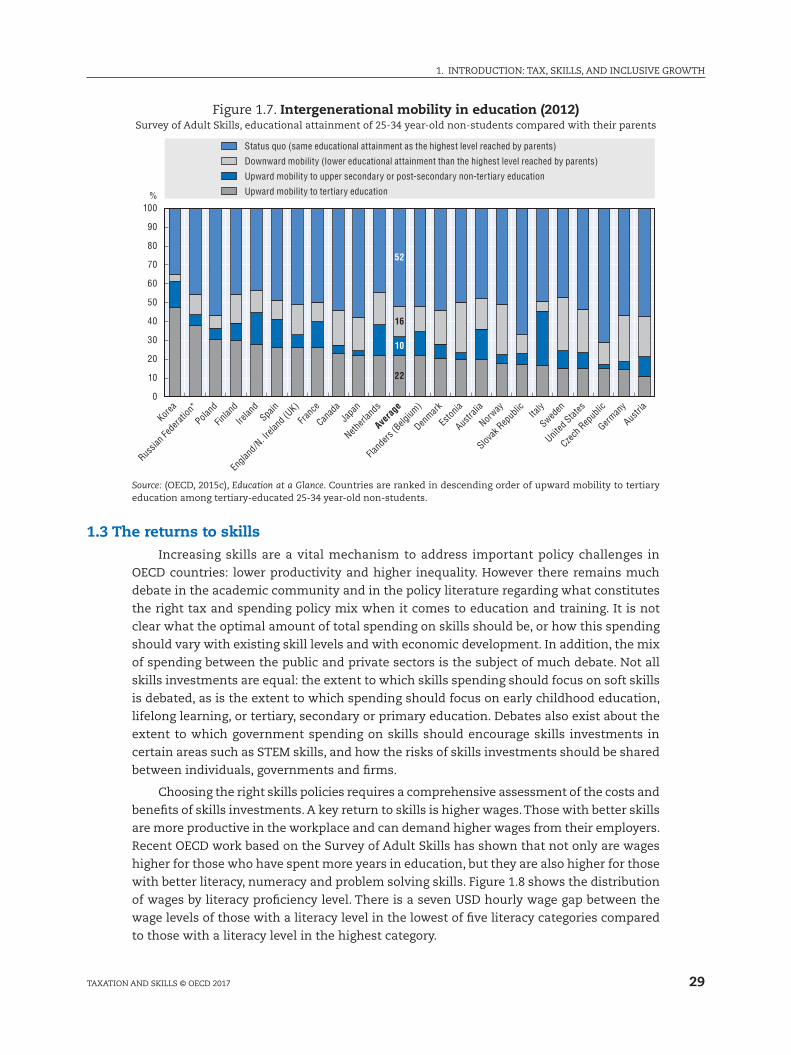
29
1. INTRODUCTION: TAx, SkIllS, AND INClUSIVE GROWTH
TAxATION AND SkIllS © OECD 2017
Figure 1.7. Intergenerational mobility in education (2012)Survey of Adult Skills, educational attainment of 25-34 year-old non-students compared with their parents
%
22
10
16
52
0
10
20
30
40
50
60
70
80
90
100
Status quo (same educational attainment as the highest level reached by parents)
Downward mobility (lower educational attainment than the highest level reached by parents)
Upward mobility to upper secondary or post-secondary non-tertiary education
Upward mobility to tertiary education
Korea
Russia
n Fed
eratio
n*
Poland
Finlan
d
Irelan
dSpa
in
Engla
nd/N
. Irela
nd (U
K)
Franc
e
Canad
aJa
pan
Netherl
ands
Avera
ge
Fland
ers (B
elgium
)
Denmark
Eston
ia
Austra
lia
Norway
Slovak
Rep
ublic Ita
ly
Sweden
United
States
Czech
Rep
ublic
German
y
Austri
a
Source: (OECD, 2015c), Education at a Glance. Countries are ranked in descending order of upward mobility to tertiary education among tertiary-educated 25-34 year-old non-students.
1.3 The returns to skillsIncreasing skills are a vital mechanism to address important policy challenges in
OECD countries: lower productivity and higher inequality. However there remains much
debate in the academic community and in the policy literature regarding what constitutes
the right tax and spending policy mix when it comes to education and training. It is not
clear what the optimal amount of total spending on skills should be, or how this spending
should vary with existing skill levels and with economic development. In addition, the mix
of spending between the public and private sectors is the subject of much debate. Not all
skills investments are equal: the extent to which skills spending should focus on soft skills
is debated, as is the extent to which spending should focus on early childhood education,
lifelong learning, or tertiary, secondary or primary education. Debates also exist about the
extent to which government spending on skills should encourage skills investments in
certain areas such as STEm skills, and how the risks of skills investments should be shared
between individuals, governments and firms.
Choosing the right skills policies requires a comprehensive assessment of the costs and
benefits of skills investments. A key return to skills is higher wages. Those with better skills
are more productive in the workplace and can demand higher wages from their employers.
Recent OECD work based on the Survey of Adult Skills has shown that not only are wages
higher for those who have spent more years in education, but they are also higher for those
with better literacy, numeracy and problem solving skills. Figure 1.8 shows the distribution
of wages by literacy proficiency level. There is a seven USD hourly wage gap between the
wage levels of those with a literacy level in the lowest of five literacy categories compared
to those with a literacy level in the highest category.
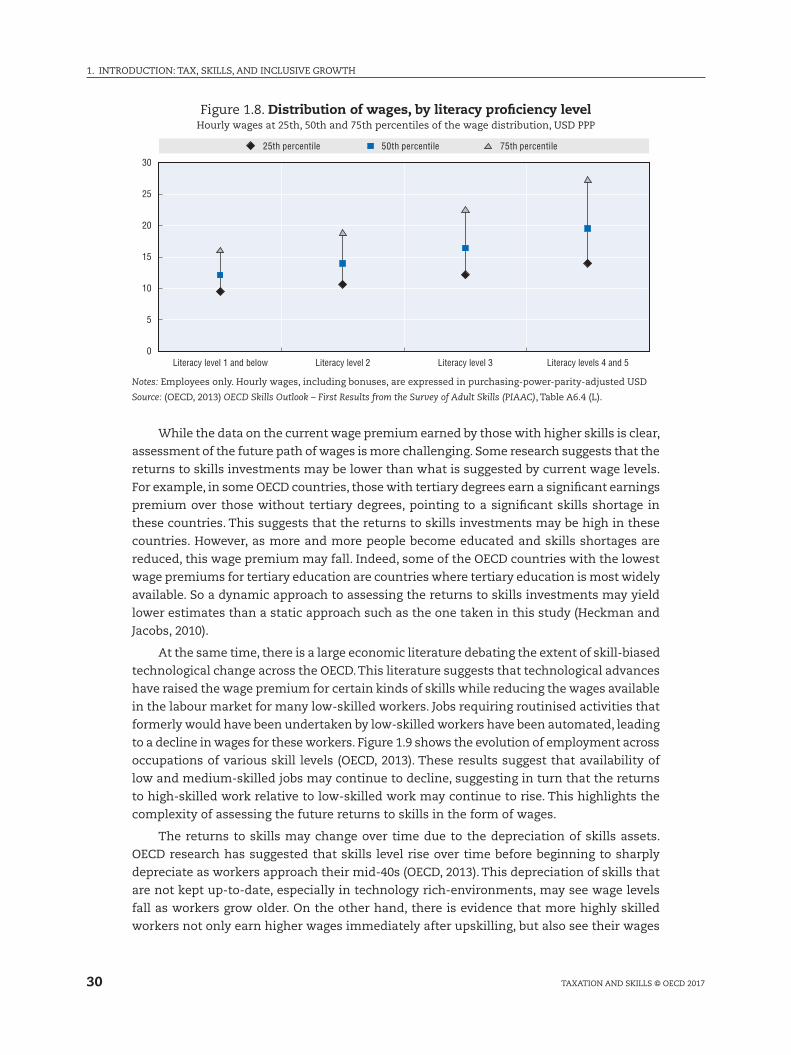
1. INTRODUCTION: TAx, SkIllS, AND INClUSIVE GROWTH
30 TAxATION AND SkIllS © OECD 2017
Figure 1.8. Distribution of wages, by literacy proficiency levelHourly wages at 25th, 50th and 75th percentiles of the wage distribution, USD PPP
0
5
10
15
20
25
30
25th percentile 50th percentile 75th percentile
Literacy level 1 and below Literacy level 2 Literacy level 3 Literacy levels 4 and 5
Notes: Employees only. Hourly wages, including bonuses, are expressed in purchasing-power-parity-adjusted USD
Source: (OECD, 2013) OECD Skills Outlook – First Results from the Survey of Adult Skills (PIAAC), Table A6.4 (l).
While the data on the current wage premium earned by those with higher skills is clear,
assessment of the future path of wages is more challenging. Some research suggests that the
returns to skills investments may be lower than what is suggested by current wage levels.
For example, in some OECD countries, those with tertiary degrees earn a significant earnings
premium over those without tertiary degrees, pointing to a significant skills shortage in
these countries. This suggests that the returns to skills investments may be high in these
countries. However, as more and more people become educated and skills shortages are
reduced, this wage premium may fall. Indeed, some of the OECD countries with the lowest
wage premiums for tertiary education are countries where tertiary education is most widely
available. So a dynamic approach to assessing the returns to skills investments may yield
lower estimates than a static approach such as the one taken in this study (Heckman and
Jacobs, 2010).
At the same time, there is a large economic literature debating the extent of skill-biased
technological change across the OECD. This literature suggests that technological advances
have raised the wage premium for certain kinds of skills while reducing the wages available
in the labour market for many low-skilled workers. Jobs requiring routinised activities that
formerly would have been undertaken by low-skilled workers have been automated, leading
to a decline in wages for these workers. Figure 1.9 shows the evolution of employment across
occupations of various skill levels (OECD, 2013). These results suggest that availability of
low and medium-skilled jobs may continue to decline, suggesting in turn that the returns
to high-skilled work relative to low-skilled work may continue to rise. This highlights the
complexity of assessing the future returns to skills in the form of wages.
The returns to skills may change over time due to the depreciation of skills assets.
OECD research has suggested that skills level rise over time before beginning to sharply
depreciate as workers approach their mid-40s (OECD, 2013). This depreciation of skills that
are not kept up-to-date, especially in technology rich-environments, may see wage levels
fall as workers grow older. On the other hand, there is evidence that more highly skilled
workers not only earn higher wages immediately after upskilling, but also see their wages
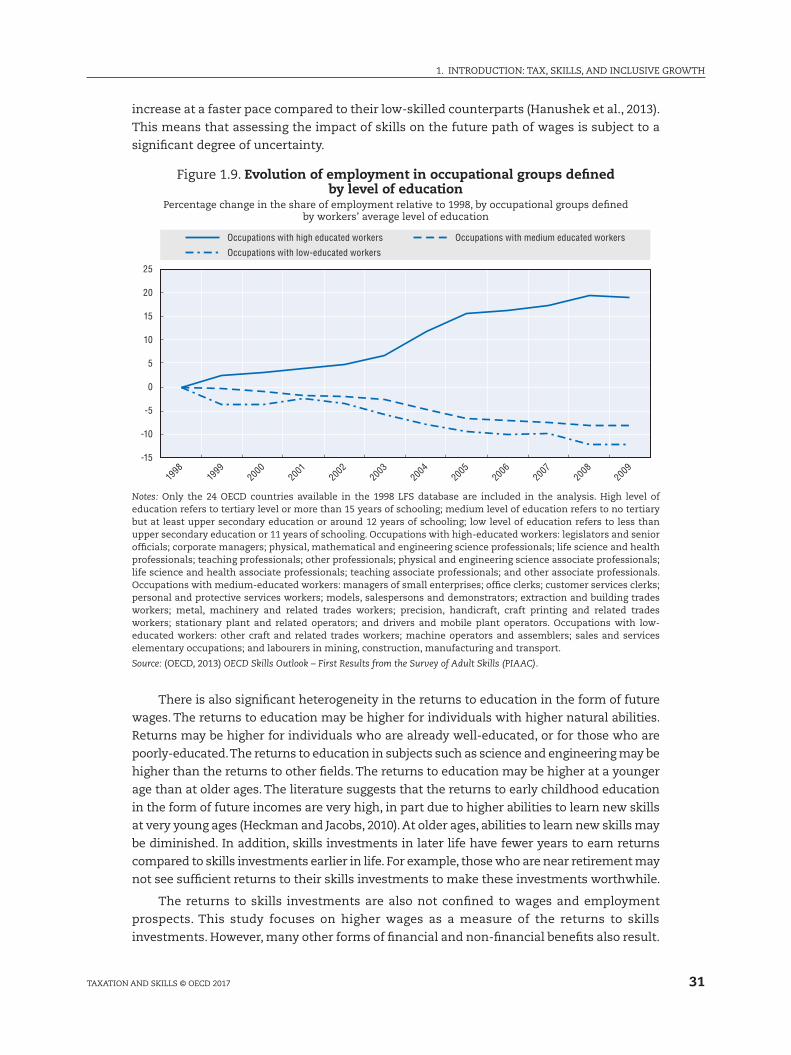
31
1. INTRODUCTION: TAx, SkIllS, AND INClUSIVE GROWTH
TAxATION AND SkIllS © OECD 2017
increase at a faster pace compared to their low-skilled counterparts (Hanushek et al., 2013).
This means that assessing the impact of skills on the future path of wages is subject to a
significant degree of uncertainty.
Figure 1.9. Evolution of employment in occupational groups defined by level of education
Percentage change in the share of employment relative to 1998, by occupational groups defined by workers’ average level of education
-15
-10
-5
0
5
10
15
20
25
1998
1999
2000
2001
2002
2003
2004
2005
2006
2007
2008
2009
Occupations with high educated workers Occupations with medium educated workers
Occupations with low-educated workers
Notes: Only the 24 OECD countries available in the 1998 lFS database are included in the analysis. High level of education refers to tertiary level or more than 15 years of schooling; medium level of education refers to no tertiary but at least upper secondary education or around 12 years of schooling; low level of education refers to less than upper secondary education or 11 years of schooling. Occupations with high-educated workers: legislators and senior officials; corporate managers; physical, mathematical and engineering science professionals; life science and health professionals; teaching professionals; other professionals; physical and engineering science associate professionals; life science and health associate professionals; teaching associate professionals; and other associate professionals. Occupations with medium-educated workers: managers of small enterprises; office clerks; customer services clerks; personal and protective services workers; models, salespersons and demonstrators; extraction and building trades workers; metal, machinery and related trades workers; precision, handicraft, craft printing and related trades workers; stationary plant and related operators; and drivers and mobile plant operators. Occupations with low-educated workers: other craft and related trades workers; machine operators and assemblers; sales and services elementary occupations; and labourers in mining, construction, manufacturing and transport.
Source: (OECD, 2013) OECD Skills Outlook – First Results from the Survey of Adult Skills (PIAAC).
There is also significant heterogeneity in the returns to education in the form of future
wages. The returns to education may be higher for individuals with higher natural abilities.
Returns may be higher for individuals who are already well-educated, or for those who are
poorly-educated. The returns to education in subjects such as science and engineering may be
higher than the returns to other fields. The returns to education may be higher at a younger
age than at older ages. The literature suggests that the returns to early childhood education
in the form of future incomes are very high, in part due to higher abilities to learn new skills
at very young ages (Heckman and Jacobs, 2010). At older ages, abilities to learn new skills may
be diminished. In addition, skills investments in later life have fewer years to earn returns
compared to skills investments earlier in life. For example, those who are near retirement may
not see sufficient returns to their skills investments to make these investments worthwhile.
The returns to skills investments are also not confined to wages and employment
prospects. This study focuses on higher wages as a measure of the returns to skills
investments. However, many other forms of financial and non-financial benefits also result.

1. INTRODUCTION: TAx, SkIllS, AND INClUSIVE GROWTH
32 TAxATION AND SkIllS © OECD 2017
Those with higher skills are likely to work longer, raising their lifetime income and reducing
the demographic pressures on pension systems. Those with higher skills are also less likely
to leave the labour market or become unemployed, further increasing the returns to skills
investments. There are also other non-financial benefits to investing in skills. Those with
higher skills are more likely to report being in good health, potentially reducing the pressure
on public health systems. Skills can have positive impacts on other aspects of well-being as
well (Hanushek et al., 2013; OECD, 2013).
The value of these various benefits from skills on government finances, on the economy,
and for individuals is challenging to quantify. Estimates of the positive impact of skills
investments that rely on wages alone such as those in this study likely underestimate the
true benefits of these investments (de la Fuente and Jimeno, 2008).This study takes a step
towards such an assessment by examining the financial costs and benefits of certain stylised
skills investments in the OECD. In assessing the returns to skills investments, the study
focuses on tertiary education and lifelong learning. The key return to tertiary education
considered is higher wages. Consideration of the impacts on employment and labour market
participation is not factored into the analysis, nor are the broader impacts on trust, health,
crime and well-being. From a government’s perspective, estimates of the future revenue
impacts are confined to increases in income tax revenue; other positive economic impacts
are not analysed. much more work in this area is needed, and so the results presented in
this study should be carefully interpreted.
1.4 Public finance of educationThe previous discussion has outlined that the returns to governments, firms and
individuals from skills investments are substantial. However, a cost-benefit analysis of skills
policies also requires a discussion of the costs of investment in skills, and who bears these
costs. Figure 1.10 outlines how the direct costs of education from primary to tertiary level
(i.e. costs excluding lost earnings) are apportioned between governments and individuals in
OECD countries. Education spending as a share of GDP varies substantially. So too does the
share of spending accounted for by governments and by private actors such as firms and
individuals. On average, direct education spending comprised 5.3% of GDP in the OECD in 2012.
On average spending comprising 4.6% of GDP was carried out by governments, and 0.7% by
private actors. The largest amount of private spending is in Chile, where 37% of all education
spending is carried out by private actors. In some European countries, however, very little
direct education spending at primary to tertiary level is undertaken by private actors.
Given the large private benefits from skills investments, government subsidies for skills
investments are substantial. There are two principal motivating factors behind government
intervention into the provision of public capital goods such as education. The first is the
presence of market externalities. As discussed in Section 1.3, the returns to skills investments
go far beyond the narrow returns to individuals in the form of wage increases or even broader
individual returns such as increased well-being and life expectancy. There are social returns
as well, in the form of increased growth, increased innovation, and reduced crime. Given that
these benefits are not internalised by individuals making skills investment decisions, they
may underinvest in skills relative to the socially optimal level. Extra government spending
resolves this externality raising the incentives to invest in skills through subsidies (Dur and
Teulings, 2003; Heckman and Jacobs, 2010).
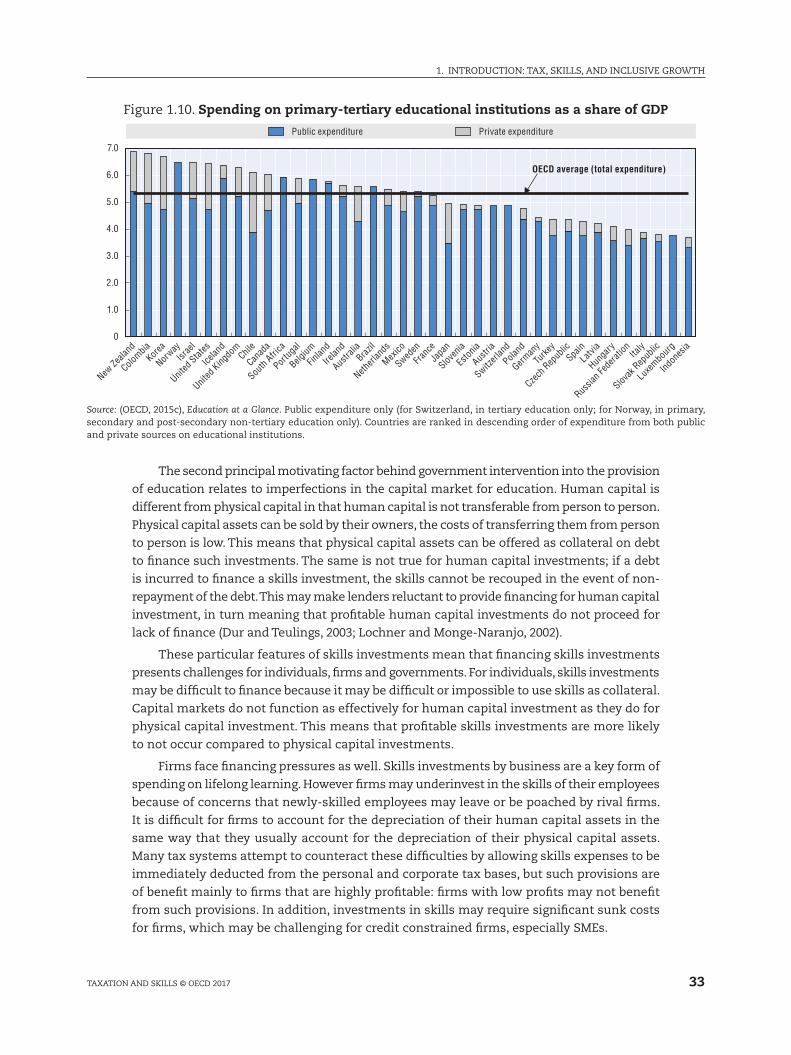
33
1. INTRODUCTION: TAx, SkIllS, AND INClUSIVE GROWTH
TAxATION AND SkIllS © OECD 2017
Figure 1.10. Spending on primary-tertiary educational institutions as a share of GDP
0
1.0
2.0
3.0
4.0
5.0
6.0
7.0
New Ze
aland
Colombia
Korea
Norway
Israe
l
United
States
Icelan
d
United
Kingdo
mChil
e
Canad
a
South
Africa
Portug
al
Belgium
Finlan
d
Irelan
d
Austra
liaBraz
il
Netherl
ands
Mexico
Sweden
Franc
eJa
pan
Sloven
ia
Eston
ia
Austri
a
Switzerl
and
Poland
German
y
Turke
y
Czech
Rep
ublic
SpainLatv
ia
Hunga
ry
Russia
n Fed
eratio
nIta
ly
Slovak
Rep
ublic
Luxe
mbour
g
Indon
esia
OECD average (total expenditure)
Public expenditure Private expenditure
Source: (OECD, 2015c), Education at a Glance. Public expenditure only (for Switzerland, in tertiary education only; for Norway, in primary, secondary and post-secondary non-tertiary education only). Countries are ranked in descending order of expenditure from both public and private sources on educational institutions.
The second principal motivating factor behind government intervention into the provision
of education relates to imperfections in the capital market for education. Human capital is
different from physical capital in that human capital is not transferable from person to person.
Physical capital assets can be sold by their owners, the costs of transferring them from person
to person is low. This means that physical capital assets can be offered as collateral on debt
to finance such investments. The same is not true for human capital investments; if a debt
is incurred to finance a skills investment, the skills cannot be recouped in the event of non-
repayment of the debt. This may make lenders reluctant to provide financing for human capital
investment, in turn meaning that profitable human capital investments do not proceed for
lack of finance (Dur and Teulings, 2003; lochner and monge-Naranjo, 2002).
These particular features of skills investments mean that financing skills investments
presents challenges for individuals, firms and governments. For individuals, skills investments
may be difficult to finance because it may be difficult or impossible to use skills as collateral.
Capital markets do not function as effectively for human capital investment as they do for
physical capital investment. This means that profitable skills investments are more likely
to not occur compared to physical capital investments.
Firms face financing pressures as well. Skills investments by business are a key form of
spending on lifelong learning. However firms may underinvest in the skills of their employees
because of concerns that newly-skilled employees may leave or be poached by rival firms.
It is difficult for firms to account for the depreciation of their human capital assets in the
same way that they usually account for the depreciation of their physical capital assets.
many tax systems attempt to counteract these difficulties by allowing skills expenses to be
immediately deducted from the personal and corporate tax bases, but such provisions are
of benefit mainly to firms that are highly profitable: firms with low profits may not benefit
from such provisions. In addition, investments in skills may require significant sunk costs
for firms, which may be challenging for credit constrained firms, especially SmEs.
1. INTRODUCTION: TAx, SkIllS, AND INClUSIVE GROWTH
34 TAxATION AND SkIllS © OECD 2017
In addition, governments face financing challenges in providing support for skills.
Demographic pressures, low growth rates, and increased difficulties in taxing mobile factors
of production including labour and capital all have increased the financial pressures facing
governments in recent years. many OECD countries have high debt and deficit levels. At
the same time, there are increasing pressures for governments to finance new forms of
educational investments in early childhood education and in lifelong learning.
Governments may also face challenges due to increased taxpayer mobility. Countries
that attempt to keep private education costs low through extensive government support
may try to recoup the costs of this support through higher taxes. However this may result
in well-educated workers emigrating to lower tax countries. Individuals may also immigrate
to countries where private education costs are low to take advantage of generous education
support. In such instances, governments can face similar poaching dilemmas, reducing skills
investments relative to a social optimum.
This study analyses the ways in which the costs and benefits of skills investments
are shared across society. A key conclusion in the study is that in many cases the market
for financing skills investments does not work. This may mean that risks and returns for
skills investments are not shared in proportion to costs. Risky skills investments may not
be undertaken due to lack of access to finance for skills, or lack of insurance against skills
outcomes. This in turn reduces the positive impacts that skills can have on inequality, on
productivity, and on growth.
1.5 Tax, skills, and financial incentives A key policy lever by which the government intervenes in skills financing decisions is
through the tax system. The tax system is widely regarded as a key lever in affecting many
important objectives of OECD governments: raising physical capital investment, reducing
inequality, raising employment, increasing R&D activity. However the impact of the tax
system on human capital investment has not been at the centre of tax policy making.
Tax and education spending policies need to be examined in a holistic way. Education
policy makers cannot rely on education spending levels alone to assess the skills-friendliness of
their system from a financial perspective. Nor can tax policy makers examine their tax system
solely from a revenue-raising perspective, or even simply from a combination of revenue-raising,
labour market activation, and redistribution perspectives. Instead, the efficiency and equity
consequences of tax policies from a skills perspective are a key aspect of tax policy and tax design.
Optimising the tax system from a skills perspective could positively affect economic and
social outcomes through a number of channels. It may reduce the need for redistribution
through the tax system by reducing the inequality of market income. In doing so, raising skill
levels can alleviate the distortions that come with trying to reduce inequality through the
tax and transfer system (Bovenberg and Jacobs, 2005). Better tax and skills policies can also
potentially reduce the need for costly education spending by governments. In addition, raising
the stock of human capital may increase the growth-friendliness of the tax system overall.
The impact of the tax system on skills investments is complex. The first and most obvious
impact is that progressive income taxation reduces the returns to skills investments from
the perspective of an individual because their wages – their returns to skills investments –
are taxed away. As taxpayers earn higher and higher returns from their skills investments,
progressive tax systems reduce the returns to skills investments at an increasing rate
(Cameron and Heckman, 1999).
35
1. INTRODUCTION: TAx, SkIllS, AND INClUSIVE GROWTH
TAxATION AND SkIllS © OECD 2017
The tax system also reduces the costs of skills investments for the individual. A key
input into a skills investment is the individual’s time: while studying individuals’ earning
capacity is diminished. Foregone earnings are for many individuals a larger cost component
of a skills investment than direct costs such as tuition fees. But as individuals earn less their
tax liability falls in progressive income tax systems. This reduction in tax liability offsets
lost earnings: in this way the tax system reduces the cost of skills investments. The tax
system can also reduce the costs of skills investments through tax expenditures that reduce
an individual’s tax liability in proportion to the direct costs of education, as is discussed
further below. Taxes also impact the financial incentives to invest in skills by influencing
the costs of the financing of skills investments. many OECD countries allow financing costs
to be deducted from the tax base, and so the tax system can provide added support to skills
investments financed with debt. All of these channels through which the tax system impacts
the costs of skills investments are modelled in this study.
This study focuses on the ways in which the tax system affects the financial decision to
invest in skills through the personal income tax (PIT) and social security contribution (SSC)
system. But other parts of the tax system may matter for skills investments as well. For
example, countries may provide VAT relief to education providers or educational institutions.
Skills expenditures by firms are generally deductible from the corporate income tax base.
Taxes on savings can reduce the opportunity costs of skills investments by making physical
capital investment less attractive (D’Andria and mastromatteo, 2012; Jacobs and Bovenberg,
2010). These and other non-PIT and SSC provisions to encourage skills investments are
discussed further in Torres (2012).
Taxes also affect the supply of skills through their impact on work effort and labour
market participation and the demand for skills, which will impact the level of unemployment.
The impact of the PIT and SSC systems modelled in this study focuses on the ways in which
increased taxation can reduce incentives to invest in skills by taxing away higher wages.
But high taxes on labour may result in reduced labour market participation. This in turn
reduces the incentives to invest in skills and may reduce skills investment.
All taxes distort economic activity. The challenge for tax policy makers is to design the
tax system in a way that minimises these distortions as much as possible. The literature on
optimal taxation has argued that reduced taxation of physical capital encourages investment
and raises growth (Chamley, 1986; Judd, 1985). The effective tax rates discussed in this tax
policy study are based on the effective tax rate methodology for physical capital developed
by Devereux and Griffith (2003). Concerns about the negative impacts of physical capital
investment have seen statutory tax rates on physical capital fall over recent decades
(Brys et al., 2016).
In recent years however, attention in the theoretical literature on optimal taxation
has increasingly turned to how optimal taxes should be considered in light of investment
in human capital (Brys and Torres, 2013; Gottardi et al., 2014; krueger and ludwig, 2013;
Stantcheva, 2015; Torres, 2012). This literature has argued that the taxation of physical and
human capital should be more closely aligned. many of these recent studies recognise the
differences between physical and human capital; including that human capital cannot be
offered as collateral, and that it may be difficult to design efficient contracts that insure
against the risks of human capital investment. Given the centrality of skills for policy
outcomes such as productivity and inclusive growth, it is important that the impact of taxes
on skills is taken into account by policy makers.
1. INTRODUCTION: TAx, SkIllS, AND INClUSIVE GROWTH
36 TAxATION AND SkIllS © OECD 2017
This study provides empirical grounding for many of the theoretical insights from this
literature, and highlights how the details of tax systems in different countries can result in
variation in the incentives to invest in skills depending on the taxpayers’ age, income, and
family status, as well as on the duration, nature and costs of a skills investment. In doing
so, the study aims to nuance the discussion of the impact of taxes and skills relative to the
theoretical academic literature, and place consideration of skills investments at the centre
of the design of tax systems for policy makers.
1.6 Plan of the studyThe study proceeds as follows. Chapter 2 outlines tax expenditures used to support
skills investment (skills tax expenditures, or STEs) in the 29 countries examined in this study.
The year of analysis is 2011. Incorporating these STEs into a broader analysis of the overall
impact of the tax and spending system on skills is a key innovation of this study. There is
a substantial body of research on the impact of education spending on skills outcomes.
However, government spending on skills that occurs through the tax system has not been
studied in a comparative way.
There are several kinds of STEs. Some countries provide tax credits and tax allowances
that allow tax liability to be reduced in proportion to skills expenditures. Some countries
reduce the amount of labour taxation levied on student wage income, or on student
scholarship income. Student wage income or scholarship income can also be subject to
relief regarding social security contributions. Some tax systems can also offer tax relief in
proportion to the amount of debt individuals incur as part of their skills investment. These
tax expenditures are all discussed in Chapter 2.
Chapter 3 outlines the core methodology for designing the tax and skills statistics
developed in this study. Three main indicators are developed:
●● A Breakeven Earnings Increment (BEI); which measures how much earnings need to
increase for an individual after their skills investment so that they earn back the costs of
that investment over their remaining years in the workforce.
●● An Effective Tax Rate on Skills, which measures how much taxes increase or reduce the
net returns to skills investments for an individual. Effective tax rates are developed for
different estimates of the returns to education. The marginal Effective Tax Rate on Skills
(mETR) examines the case of an individual just breaking even on a skills investment.
It measures the extent to which the BEI is increased by the tax system: how much it
rises compared to a world without taxes. The Average Effective Tax Rate on Skills (AETR)
examines the case of an individual who earns a higher-than-breakeven return. This
indicator measures the difference in the net present value of education between a world
with and without taxes.
●● The third indicator measures the returns to skills investments for governments, comparing
the government’s costs of educating an individual to the government’s expected returns
in the form of higher future tax revenues. This indicator is referred to as a Returns to
Costs Ratio (RCR). As with the Effective Tax Rates on Skills, break-even and higher-return
scenarios are considered, so a marginal Returns to Costs Ratio (mRCR) and Average Returns
to Costs Ratio (ARCR) are both developed.
The chapter also describes how to interpret the indicators, how they relate to each other,
and how they change in response to changes in educational spending, student income, and
tax rates before education, during education and after education.
37
1. INTRODUCTION: TAx, SkIllS, AND INClUSIVE GROWTH
TAxATION AND SkIllS © OECD 2017
Chapter 4 outlines the main results for the BEI, mETR, AETR, mRCR, and ARCR for four
stylised skills investment scenarios: a 17-year-old student undertaking a four-year degree, a
27 year-old undertaking a one-year degree, a 32-year old undertaking a short course of job-
related training, and a 50-year old undertaking a one-year degree. These examples are chosen
to be representative of the different kinds of post-secondary skills investments commonly
undertaken in the OECD. This chapter also discusses how these different indicators depend
on the returns to education, on the countries concerned, on the individual’s income level,
on the individual’s age, and on how the skills investment is financed.
Chapter 5 features an analysis of the specific STEs outlined in Chapter 2. The overall
value of these STEs in some of the example cases in Chapter 4 is considered. Chapter 5
also examines the impact of these STEs on the results presented in Chapter 4. The chapter
also discusses the relative impacts of tax-based means of encouraging skills investment
compared to non-tax means of encouraging skills investment such as reducing tuition fees,
expanding loan support to students, and increasing scholarships and grants. The chapter
concludes with a discussion of the overall impact of the tax system on skills investment.
Four annexes are provided. Annex A outlines in greater detail the methodology behind
the indicators: a formalised version of Chapter 3. Previous work by Brys & Torres (2013)
outlined a formal methodology for defining the BEI and the mETR on Skills. This Annex
expands on their work, extending the discussion of the mETR and also showing how the
same approach can be used to define the AETR on Skills as well as the mRCR and ARCR.
The Annex also outlines how the Brys and Torres methodology can be expanded to include
consideration of student debt.
The remaining three annexes provide country-specific tables and information. Annex B
provides cross-country comparisons of the key indicators, the BEI, the mETR, the AETR
and the mRCR for the stylised skills investment examples outlined in Chapter 4. Annex C
outlines key details of the STEs modelled for each country. This section is based on the
discussion in Torres (2012). Annex D provides tables of the key tax and skills results for the
stylised education scenarios in Chapter 4, as well as selected other results on a country-by-
country basis. Extensive details of the various factors making up the indicators are provided,
corresponding to the equations outlined in Chapter 3 and Annex A.
ReferencesBlöndal, S., S.Field, and N. Girouard, (2002), “Investment in human capital through upper-secondary
and tertiary education”, OECD Economic Studies, Vol. 2002/1, OECD Publishing, Paris, http://dx.doi.org/10.1787/eco_studies-v2002-art3-en.
Bovenberg, A.l. and B. Jacobs, (2005), “Redistribution and education subsidies are Siamese twins”, Journal of Public Economics, Vol. 89, pp. 2005–2035.
Brys, B., S. Perret, A. Thomas, and P. O’Reilly, (2016), “Tax Design for Inclusive Economic Growth”, OECD Tax Policy Working Papers, No. 26, OECD Publishing, Paris, http://dx.doi.org/10.1787/5jlv74ggk0g7-en.
Brys, B. and C.Torres, (2013), “Effective Personal Tax Rates on marginal Skills Investments in OECD Countries: A New methodology”, OECD Taxation Working Papers, No. 16, OECD Publishing, Paris, https://doi.org/10.1787/22235558.
Cameron, S. V. and J.J. Heckman, (1999), “Can Tuition Policy Combat Rising Wage Inequality”, in kosters, m.H. (Ed.), Financing College Tuition: Government Policies and Educational Priorities, The AEI Press, Washington, D.C.
Chamley, C. (1986), “Optimal taxation of capital income in general equilibrium with infinite lives.”, Econometrica, Vol. 54, pp. 607–622.
1. INTRODUCTION: TAx, SkIllS, AND INClUSIVE GROWTH
38 TAxATION AND SkIllS © OECD 2017
D’Andria, D. and G. mastromatteo, (2012), “Fiscal Policy Impacts on Growth: an OECD Cross-Country Study with an Emphasis on Human Capital Accumulation”, CEIS Tor Vergata Research Paper, Vol. 10 No. 217.
Devereux, m.P. and R. Griffith, (2003), “Evaluating Tax Policy Decisions for location Decisions”, International Tax and Public Finance, Vol. 10, pp. 107–126.
Dur, R.A.J. and C.N. Teulings, (2003), “Are Education Subsidies an Efficient Redistributive Device?”, in Agell, J., keen, m. and Weichenrieder, A. (Eds.), Labor Market, Institutions and Public Regulation, m.I.T. Press, Cambridge (mA).
Gottardi, P., A. kajii, and T. Nakajima, (2014), “Optimal Taxation and Debt with Uninsurable Risks to Human Capital Accumulation”, Federal Reserve Bank of Atlanta Working Paper Series, No. 2014–24.
Hanushek, E.A., G. Schwerdt, S. Wiederhold, and l. Woessmann, (2013), “Returns to Skills around the World - Evidence from PIAAC”, NBER Working Paper, No. 19762.
Heckman, J.J. and B. Jacobs, (2010), “Policies to Create and Destroy Human Capital in Europe”, NBER Working Paper, No. 15742.
Jacobs, B. and A.l. Bovenberg, (2010), “Human capital and optimal positive taxation of capital income”, International Tax and Public Finance, Vol. 17, pp. 451–478.
Judd, k. (1985), “Redistributive taxation in a simple perfect foresight model”, Journal of Public Economics, Vol. 29, pp. 59–83.
krueger, D. and A. ludwig, (2013), “Optimal Progressive labor Income Taxation and Education Subsidies When Education Decisions and Intergenerational Transfers are Endogenous”, American Economic Review: Papers & Proceedings, Vol. 103 No. 3, pp. 496–501.
de la Fuente, A. and J.F. Jimeno, (2008), “The Private and Fiscal Returns to Schooling and the Effect of Public Policies on Private Incentives to Invest in Education: a General Framework and Some Results for the EU”, Barcelona Graduate School of Economics Working Paper, No. 342.
lochner, l. and A. monge-Naranjo, (2002), “Human Capital Formation with Endogenous Credit Constraints”, NBER Working Paper, No. 8815.
OECD (2010), “Tax Policy Reform and Economic Growth”, OECD Tax Policy Studies, No. 20, OECD Publishing, Paris, http://dx.doi.org/10.1787/9789264091085-en.
OECD (2012), Employment Outlook 2012, OECD Publishing, Paris, http://dx.doi.org/10.1787/empl_outlook-2012-en.
OECD (2013), OECD Skills Outlook 2013 - First Results from the Survey of Adult Skills, OECD Publishing, Paris, https://doi.org/10.1787/9789264204256-en.
OECD (2014), The Distributional Effects of Consumption Taxes in OECD Countries, OECD Tax Policy Studies, No. 22, OECD Publishing, Paris, http://dx.doi.org/10.1787/9789264224520-en.
OECD (2015a), The Future of Productivity, OECD Publishing, Paris, http://dx.doi.org/10.1787/9789264248533-en.
OECD (2015b), In It Together: Why Less Inequality Benefits All, OECD Publishing, OECD Publishing, Paris, https://doi.org/10.1787/9789264235120-en.
OECD (2015c), Education at a Glance 2015: OECD Indicators, OECD Publishing, Paris, http://dx.doi.org/10.1787/eag-2015-en.
OECD (2016), The Productivity-Inclusiveness Nexus, OECD Publishing, Paris, http://dx.doi.org/ 10.1787/9789264258303-en.
Sequeira, T., m. Santos, and A. Ferreira-lopes, (2014), “Income Inequality, TFP, and Human Capital”, Unpublished Working Paper.
Stantcheva, S. (2015), “Optimal Taxation and Human Capital Policies over the life Cycle”, NBER Working Paper, No. 21207.
Summers, l.H. (2014), “U.S. Economic Prospects: Secular Stagnation, Hysteresis, and the Zero lower Bound”, Business Economics, Nature Publishing Group, Vol. 49 No. 2, pp. 65–73.
Torres, C. (2012), “Taxes and Investment in Skills”, OECD Taxation Working Papers, No. 13, OECD Publishing, Paris, http://dx.doi.org/10.1787/5k92sn0qv5mp-en.
39
Taxation and Skills
© OECD 2016
Chapter 2
Tax and skills policies in OECD economies
This chapter outlines the specific tax expenditures aimed at encouraging skills investment in OECD countries. Four main kinds of skills tax expenditures are considered, tax allowances and credits to reduce tax liability based on skills expenditure, reduced tax rates for scholarship income, interest deduction of student debt, and reduced tax or social contribution rates on student income.
The statistical data for Israel are supplied by and under the responsibility of the relevant Israeli authorities. The use of such data by the OECD is without prejudice to the status of the Golan Heights, East Jerusalem and Israeli settlements in the West Bank under the terms of international law.
40
2. Tax anD SkIllS pOlICIES In OECD ECOnOmIES
TaxaTIOn anD SkIllS © OECD 2016
2.1 IntroductionThis chapter outlines skills tax expenditures (STEs) designed to increase investment
in skills modelled in this Tax policy Study. The chapter is based on the information in
Torres (2012) which is in turn based on a survey of OECD delegates carried out in 2011.
Individuals’ decisions to invest in skills are based on a wide variety of financial incentives
and other factors. Factors impacting skills investment decisions include the direct costs of
education, the lost earnings in the labour market while studying, the cost of financing, and
the available returns in the labour market for those with high skill levels. The tax system
has an impact on all of these factors either through the general personal income tax (pIT)
and social security contribution (SSC) system or because of specific STEs in the tax system.
This chapter reviews the specific STEs designed to encourage skills investments that can
be found in 30 OECD countries.
In addition to specific STEs, the impact of the tax system on incentives to invest in
skills also depends on the overall level, general characteristics and progressivity of the pIT
and SSC systems. The overall tax system governs the extent to which the returns to skills
are taxed away, a key component of the indicators developed in this study. In addition, the
tax system reduces the cost of making a skills investment by reducing pre-tax foregone
earnings. Information on the general pIT and SSC systems is not included here but can be
found in the OECD Taxing Wages report (OECD, 2016).
The tax system also impacts incentives to invest in skills through a wide variety of other
measures outside of the pIT and SSC systems, which are not included in the calculations
underlying this Tax policy Study. Investments by firms in the skills of their employees are
often deductible from the corporate income tax base and some countries implement R&D
tax provisions linked to the researchers wage bill, for example. Some countries implement
special STEs to stimulate savings for future skills investments. General tax rules on savings,
which have an impact on the after-tax opportunity return for an investment in skills, are
not covered. Skills investments are often exempt from VaT, and sometimes are zero-rated.
Universities and other educational institutions may also benefit from reduced property
taxation.
For the purposes of this study, specific ‘tax and skills’ policies that are modelled are only
those policies in the pIT and SSC systems that partially or fully offset the costs of investing in
skills. OECD countries do not implement specific tax rules beyond the standard progressive
pIT rate schedule, such as graduate taxes, that increase the tax burden on the return on skills.
as mentioned previously, a wide variety of other drivers beyond the tax system impact
individuals and firms decisions to investment in skills, as well as influencing the decisions
of firms and other organisations to supply training and education, and the decisions of
banks and other institutions to aid in financing skills investments. The other impacts of
the tax system on financial incentives to invest in skills are treated as beyond the scope of
this study; which confines itself to the individual’s financial incentives.
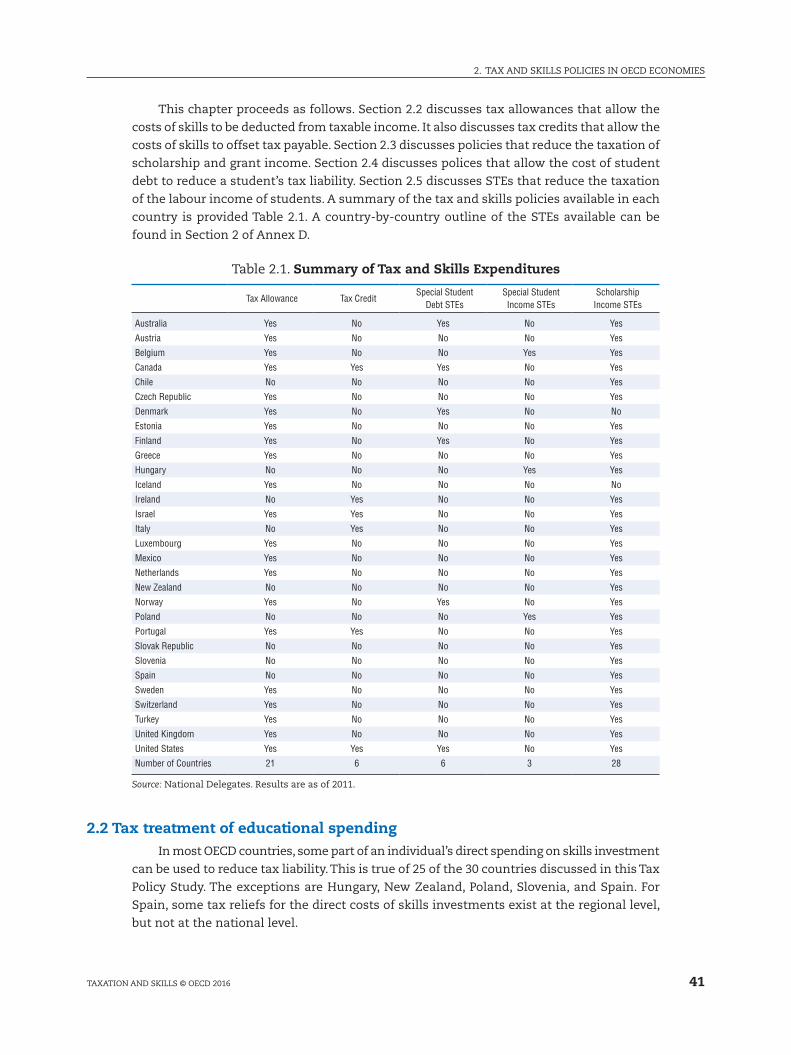
41
2. Tax anD SkIllS pOlICIES In OECD ECOnOmIES
TaxaTIOn anD SkIllS © OECD 2016
This chapter proceeds as follows. Section 2.2 discusses tax allowances that allow the
costs of skills to be deducted from taxable income. It also discusses tax credits that allow the
costs of skills to offset tax payable. Section 2.3 discusses policies that reduce the taxation of
scholarship and grant income. Section 2.4 discusses polices that allow the cost of student
debt to reduce a student’s tax liability. Section 2.5 discusses STEs that reduce the taxation
of the labour income of students. a summary of the tax and skills policies available in each
country is provided Table 2.1. a country-by-country outline of the STEs available can be
found in Section 2 of annex D.
Table 2.1. Summary of Tax and Skills Expenditures
Tax Allowance Tax CreditSpecial Student
Debt STEsSpecial Student Income STEs
Scholarship Income STEs
Australia Yes No Yes No Yes
Austria Yes No No No Yes
Belgium Yes No No Yes Yes
Canada Yes Yes Yes No Yes
Chile No No No No Yes
Czech Republic Yes No No No Yes
Denmark Yes No Yes No No
Estonia Yes No No No Yes
Finland Yes No Yes No Yes
Greece Yes No No No Yes
Hungary No No No Yes Yes
Iceland Yes No No No No
Ireland No Yes No No Yes
Israel Yes Yes No No Yes
Italy No Yes No No Yes
Luxembourg Yes No No No Yes
Mexico Yes No No No Yes
Netherlands Yes No No No Yes
New Zealand No No No No Yes
Norway Yes No Yes No Yes
Poland No No No Yes Yes
Portugal Yes Yes No No Yes
Slovak Republic No No No No Yes
Slovenia No No No No Yes
Spain No No No No Yes
Sweden Yes No No No Yes
Switzerland Yes No No No Yes
Turkey Yes No No No Yes
United Kingdom Yes No No No Yes
United States Yes Yes Yes No Yes
Number of Countries 21 6 6 3 28
Source: national Delegates. Results are as of 2011.
2.2 Tax treatment of educational spendingIn most OECD countries, some part of an individual’s direct spending on skills investment
can be used to reduce tax liability. This is true of 25 of the 30 countries discussed in this Tax
policy Study. The exceptions are Hungary, new Zealand, poland, Slovenia, and Spain. For
Spain, some tax reliefs for the direct costs of skills investments exist at the regional level,
but not at the national level.
2. Tax anD SkIllS pOlICIES In OECD ECOnOmIES
42 TaxaTIOn anD SkIllS © OECD 2016
Tax allowances
For most of the countries that do provide tax relief for the direct costs of skills investments,
the relief comes in the form of tax allowances (i.e. deductions from taxable income) for skills
spending.1 21 of the 30 countries in this study have such provisions, including australia,
austria, Belgium, Canada, the Czech Republic, Denmark, Estonia, Finland, Greece, Iceland,
Israel, luxembourg, mexico, the netherlands, norway, portugal, Sweden, Switzerland, Turkey,
the United kingdom, and the United States.2 In most of these countries, the deduction is only
available where the training concerned is related to, or even necessary for a worker’s current
employment; this is the case for 19 of the 21 countries listed. The exceptions are the Czech
Republic and the netherlands. The stringency of these provisions differs; in some countries
training need only be ‘related’ to current employment to be eligible for a tax deduction, in
some countries such as the United kingdom the training must be necessary for the worker’s
current employment for the worker to be eligible for a tax allowance.
In 7 of the 21 countries with tax allowances for skills expenditures, caps exist which
limit the amount of skills expenditure that can be deducted from taxable income. In Estonia,
the cap is set at EUR 1 920 (USD 2 670). In Greece, the deductibility is limited to EUR 100
(USD 72). In mexico, this cap depends on the kind of training the worker is engaged in. In this
study, the cap used is that for technical professional education, which is set at mxn 17 100
(USD 2 229). In the netherlands, deduction of skills expenses cannot exceed EUR 15 000
(USD 18 036). In portugal, the cap is set at 3% of 12 times the SBI (an indexed minimum wage).
For 2011, this value was equal to EUR 171 (USD 272).3 In Turkey, the maximum deductible
amount is 10% of declared income of the taxpayer. While in Turkey the cap is defined with
respect to the income of the taxpayer, other OECD countries implement a deduction which
is a lump-sum amount or a fraction of the costs of a skills investment. Finally, for the United
States, the maximum eligible amount of the deduction is the lesser of qualifying expenses
less related scholarships and a fixed threshold. This threshold is USD 4 000 when taxpayers
have incomes of USD 65 000 or less (USD 130 000 for married filing jointly). The threshold
is USD 2 000 if income does not exceed USD 80 000 (USD 160 000 if married filing jointly).
In 2 of the 21 countries with tax allowances for skills expenditures, thresholds also exist
below which skills expenditures cannot be deducted from taxable income. In Denmark, a
minimum threshold of DkR 5 500 (USD 931) is required. In the netherlands, this threshold
is EUR 500 (USD 695).
Certain other restrictions on the use of skills deductibility also exist in some OECD
countries. In both the Czech Republic and in Estonia, the deduction is only available for
taxpayers 26 years old or younger.4 In Sweden a taxpayer is required to be receiving full
or close-to-full payment from their employer during periods of education to be eligible for
deductibility of training costs.
Tax credits
The second way in which expenditure on skills can be used to reduce tax liability is
through tax credits. Seven countries in the sample examined in this study have such credits.
These countries are Canada, Ireland, Israel, Italy, portugal, and the United States.5 These
STEs vary in their targeting, and tend to be used to offset the costs of university or basic
education more than they are used to reduce the costs of career-related education.
43
2. Tax anD SkIllS pOlICIES In OECD ECOnOmIES
TaxaTIOn anD SkIllS © OECD 2016
In Canada, 15% of the cost of tuition is creditable against tax payable. In Ireland, a tax
credit is offered at the lower marginal tax rate of 20%. In Israel the credit is limited to a fixed
value of IlS 2 508 (USD 700). In Italy, a 19% credit is offered for the costs of education. In
portugal a credit is offered for 30% for education and training expenses. In the Slovak Republic
the credit has a fixed value of EUR 243.18.
as with tax allowances, a variety of thresholds and caps apply to the available tax credits.
a limit on the value of education tax credits is set in Ireland and portugal. In 2011, this limit
was set at EUR 7 000 (USD 9 736) in Ireland; in portugal it was EUR 475 (USD 661) in 2011.
Thresholds also apply. In Canada, claims must be higher than CaD 100 (USD 101). In Ireland,
claimed relief is only available for fees above a threshold. In 2011, this threshold was EUR
2 000 (USD 2 782) for full-time students and EUR 1 000 for part-time students (USD 1 391).6
In the United States, the eligibility for tax credits depends on a taxpayer’s income; above
a certain threshold, the size of the available credit begins to shrink; high income taxpayers
become ineligible (see annex D for further details). These thresholds vary depending on the
credit and family status of the taxpayer concerned.
a key difference between tax credits and tax allowances is that tax credits can be
more readily made non-wastable, so that taxpayers who do not have sufficient tax liability
to exhaust the full value of a tax provision can receive a refund. This can help increase the
value of these STEs to taxpayers on low incomes. Skills tax credits are non-wastable in full
or in part only in the United States; they are wastable in Ireland, Israel, Italy, and portugal;
Canada allows the value of credits to be transferred (up to a dollar limit) to a supporting
individual such as a parent, and/or carried forward for use in subsequent years. Taxpayers
in these latter countries who do not have sufficient tax liability to exhaust the value of the
credit will pay no tax, but will not receive a refund. This is discussed further in Chapter 5
of this study. key differences between tax credits and tax allowances are also discussed
further in OECD (2011).
2.3 Tax treatment of scholarship income and grantsIn most OECD countries, scholarship income and grants are subject to some form of tax
relief. Of the 30 countries discussed in this study, tax relief is available in 28 of them. The
exceptions are Denmark and Iceland, where this income is treated as ordinary income. In
general, the tax relief in these countries comes in the form of a straightforward exemption
from taxation, subject to various restrictions.
There are exceptions to this. In Italy, scholarship income is exempt from pIT but not
from SSCs; it is subject to a reduced SSC schedule but not exempted entirely. In Finland,
scholarship income is exempted (up to a cap) from pIT and from some SSCs, but a health
insurance contribution is still payable.
In most OECD countries an unlimited amount of scholarship income can be exempted
from taxation if the income qualifies for exemption. However in some countries a cap on
the amount of income that can be exempted exists. In Canada, the amount is limited to
the value of tuition and other programme costs if the student follows part-time education.
In Finland, a tax allowance is granted for student grant income, but this allowance is
capped at EUR 2 600 (USD 3 616). In Israel, the cap is IlS 92 000 (USD 25 713). In mexico
a ceiling of mxn 148 344 (USD 11 941) exists on the amount of scholarship income that
is exempt from taxation. In Slovenia, scholarship income is tax exempt up to EUR 8 977
(USD 12 485), the level of the minimum wage. In Spain, the cap is EUR 3 000 (USD 4 172),
2. Tax anD SkIllS pOlICIES In OECD ECOnOmIES
44 TaxaTIOn anD SkIllS © OECD 2016
for undergraduate education, and EUR 15 000 (USD 20 833) for graduate education. In the
remaining 20 countries, no caps exist. These countries include australia, austria, Belgium,
Chile, the Czech Republic, Estonia, Greece, Hungary, Ireland, luxembourg, the netherlands,
new Zealand, norway, poland, portugal, the Slovak Republic, Sweden, Switzerland and
Turkey. In the United kingdom, no caps exist except where the scholarship is paid by an
employer to an employee.7
Other restrictions are placed on the tax exempt status of scholarship income besides
caps on the amount that can be exempted. In general, scholarship income eligible for an
exemption from taxation must not be related to a student’s current job (if the student has
one). In australia, the exemption does not apply to payments received by a student on
condition that the student will become or continue to be an employee of the payer.
Other restrictions also exist. In the Czech Republic, the exemption applies only to
the scholarships received from the state budget. In the netherlands, scholarships are
given as loans conditional on timely completion of university education. They are tax
exempt if a course of study is completed on time. In the Slovak Republic, only public
scholarships are exempt. In Turkey, scholarship income is exempt except where this
income is earned by apprentices. In the United States, scholarship income that is not
a payment for research or teaching is normally taxed as ordinary income, with two
exceptions for degree candidates, including where the income is used to support studies
abroad, and where it is spent on documented educational expenses such as tuition fees
and books and materials.
2.4 Tax treatment of student debtThe most common provision in the tax systems with respect to student debt is the tax
deductibility of interest payments on student debt. This is similar to the tax deductibility
of business interest income, and is particularly important where debt-financed education
is widespread. Interest deductibility on student loans is available in five OECD countries:
Belgium, Denmark, Finland, norway, and the United States.
In the United States there is a cap on this interest deductibility of USD 2 500 per year. as
with the tax credits to offset direct costs of education, there are also phase-out provisions;
the interest deduction are not available when a taxpayer’s annual income passes over a
certain threshold. This is discussed in more detail in annex D.
Two countries offer relief for student debt that does not come in the form of interest
deductibility. In Canada, interest paid on student loans approved under the Canada Student
loans program and similar provincial or territorial programs is eligible for a 15% non-
refundable tax credit. australia has a system of income contingent loans. Students can
borrow to finance the cost of their education. Students below a specific threshold (USD 51 309
in 2011) do not have to repay the balance of their loan, or pay any interest, though their loan
is indexed by CpI each year. Students above this threshold begin to repay.
2.5 Tax treatment of student incomeFinally, some countries allow students to reduce their foregone earnings during
educational periods by reducing the tax burden on student income. Three countries provide
these STEs. In Belgium, students who work less than 23 days per year are subject to reduced
SSC rates. In Hungary, employers SSC rates are reduced when a worker is below 25 years
of age. In poland, income from contracts of mandate – commonly used by students – are
exempt from social contributions where the student’s age is less than 26.

45
2. Tax anD SkIllS pOlICIES In OECD ECOnOmIES
TaxaTIOn anD SkIllS © OECD 2016
Notes1. The provisions by which the tax system offsets the costs of skills investments are also discussed
elsewhere in this study. They are briefly discussed as a component of the overall costs of a skills investment in Chapter 3. Chapter 5 discusses STEs from efficiency and equity perspectives. In annex a, these policies are summarised as the parameter χ. In annex B, the tables of country results, these effects are summarised as the “Value of Education Tax Credits % of Direct Costs”.
2. Canada predominantly provides tax assistance for expenses related to post-secondary education and skills training through tax credits. Where a deduction is available, it is generally with respect to financial assistance provided to the unemployed for the purpose of skills training. as discussed in the annex, this deduction is not modelled for Canada.
3. In 2013 onwards, this deduction was abolished from the pIT system.
4. In the Czech Republic, this threshold is 28 in the case of phD students.
5. Certain other countries, such as the Slovak Republic, have tax credits that reduce parent’s tax liability for their children’s education, but these are not modelled in this study. Further discussion of these provisions can be found in Torres (2012).
6. This threshold has been increased steadily: in 2016 it was available for EUR 3 000 (USD 4 173) for full-time students and EUR 1 500 for part-time students (USD 2 086.5).
7. Where a scholarship is paid by an employer to an employee, and certain conditions are met, a cap of GBp 15 480 applies in the United kingdom.
ReferencesOECD (2011), Taxation and Employment, OECD Tax Policy Study, no. 21, OECD publishing, paris, http://dx.doi.
org/10.1787/9789264120808-en.
OECD (2016), Taxing Wages 2016, OECD publishing, paris, http://dx.doi.org/10.1787/tax_wages-2016-en.

47
Taxation and Skills
© OECD 2016
Chapter 3
Methodological approach to tax and skills statistics
This chapter outlines an approach to estimating the financial incentives for individuals and governments to invest in individuals’ skills, and the effect of the tax system on these incentives. Specifically, it outlines the key indicators developed to examine the impact of the tax system on skills. These indicators include Marginal Effective Tax Rates (METRs) and Average Effective Tax Rates (AETRs) on Human Capital Investment, as well as Marginal Returns to Costs Ratios (MRCRs) and Average Returns to Costs Ratios (ARCRs) of Government Investment in Human Capital. The chapter cites the data sources used to develop results for these indicators, and explains how the results presented in Chapters 4 and 5 of the study should be interpreted.
The statistical data for Israel are supplied by and under the responsibility of the relevant Israeli authorities. The use of such data by the OECD is without prejudice to the status of the Golan Heights, East Jerusalem and Israeli settlements in the West Bank under the terms of international law.
48
3. METHODOlOGICal apprOaCH TO Tax anD SkIllS STaTISTICS
TaxaTIOn anD SkIllS © OECD 2016
3.1 IntroductionThis chapter outlines the methodology used in this study to estimate the key indicators of
the financial incentives surrounding skills investments. Specifically, it outlines the approach
used to estimate the earnings necessary to breakeven on a skills investment (the Breakeven
Earnings Increment or BEI). It also outlines the effects of the tax system on the incentives
individuals face to invest in skills, both for a marginal student (the marginal effective tax
rate or METr on skills), and for an average student (the average effective tax rate or aETr
on skills).
The chapter also discusses the indicators developed that analyse the government’s net
financial returns from investing in skills of students. Two indicators are developed from the
government’s perspective, analogous to those for individuals. Specifically, an indicator is
developed for a marginal student (the marginal returns to costs ratio or MrCr) and another
for an average student (the average returns to costs ratio arCr).
The study draws on the approaches used in the literature on the taxation of physical
capital, in particular the succession of models by king and Fullerton (1984), Devereux and
Griffith (1998), Devereux (2003) and klemm (2008), which outline effective tax rates on
physical capital investments in a net present value (npV) framework. Marginal Tax rates
similar to those derived in Devereux and Griffith (1998) are provided, and equivalent aETrs
as derived in klemm (2008), but for human instead of physical capital.
all of these indicators have been built within the OECD’s Taxing Wages country models
(OECD, 2016). This chapter, and the accompanying annex a to this study, outline the
methodology behind these additions to the Taxing Wages models. The chapter also discusses
the data sources used, some of the assumptions made in the analysis, as well as some
important caveats that need to be considered when interpreting the results.
The chapter proceeds as follows. Section 3.2 outlines the various cost components of
education, and the data sources used to derive them. Section 3.3 discusses the costs that
may be incurred when students must borrow to finance their skills investment. Section 3.4
outlines the various components of the necessary breakeven earnings level, and how it differs
from the BEI. Section 3.5 outlines how the BEI differs in the presence and absence of taxes,
and how it is used to calculate the METr on skills within the country models. Section 3.6
outlines how assumed post-education earnings levels are used to calculate the aETr on
skills. Section 3.7 outlines some differences between the METr and aETr, and how they are
both a function of two key tax rates: the tax rate on foregone earnings and the tax rate on
the earnings increment. Finally, Section 3.8 outlines the average and marginal returns to
costs ratio of government investment in education.
3.2 The costs of educationThe main financial costs of a skills investment considered in this study for a student are:
●● Direct costs: tuition fees, books, computers, materials and other similar costs for students.
●● Foregone earnings: the reduction in earnings that takes place while a student is studying.
49
3. METHODOlOGICal apprOaCH TO Tax anD SkIllS STaTISTICS
TaxaTIOn anD SkIllS © OECD 2016
These costs are offset by:
●● Scholarship and grant income provided to the student by the government. The study
abstracts from scholarship and grant income provided to students by other non-
governmental entities.
●● reduced taxes: as the students’ earnings decrease, they will pay less in tax. This offsets the
cost of their skills investment, compared to a world without taxes where their foregone
earnings would be larger.
●● Skills Tax Expenditures (STEs): special tax provisions that may offset the direct costs of
skills, such as tax allowances and credits for tuition.
These separate factors are combined to calculate the overall cost of an education
investment. In addition, it may be that a student is unable to finance their education with
savings and so may have to incur debt to finance their education. These extra costs related
to debt financing of education are discussed in Section 3.3. For the remainder of this section,
it is assumed that a skills investment is financed with savings for ease of exposition.
Foregone earnings
Education is time-intensive. With many courses of study, full-time work and even part-
time work cannot be continued. These lost earnings constitute a major barrier to education,
especially for adults. In this study, a variety of assumptions about lost earnings during
education are examined. Generally it is assumed that a student can earn 25% of their previous
wage while they are in full-time education. In this way, the model captures the situations of
older workers who may be able to continue to work part-time during education. In the case
of 17-year-old university students, it is assumed that they can earn 25% of the average wage
in their country during schooling, which is taken as an estimate of the earnings available
from part-time low-skilled work.
Foregone earnings are affected by the tax system. The way in which this occurs
depends on the tax system concerned. In a proportional tax system, foregone earnings will
be reduced at the student’s statutory tax rate. In a progressive tax system a taxpayer may
drop to lower tax brackets as they earn less during education. This will reduce the taxpayers’
foregone earnings even more. This means that while progressive tax systems discourage
skills investments by taxing away the returns they also encourage investments in skills by
reducing foregone earnings.
This is a key issue for the design of tax systems. Highly progressive tax systems are
generally thought to discourage skills investment, but this progressivity can also encourage
skills development if tax progressivity moderates the amount of foregone earnings during
education. If taxes are progressive, income net of taxes will fall at a lower rate than income
gross of taxes, reducing the cost of skills investments.
The fact that many countries provide benefit support for those on low incomes may mean
that those investing in skills may not see their incomes fall when they invest in skills – their
incomes may be subsidised by social benefits of different kinds. In such countries income during
a skills investment does not fall as much as it would in the absence of the tax-benefit system.
If after-tax income does not fall much over the range over which pre-tax income falls during
the skills investment, then the tax system raises the incentives to invest in skills.
The importance of reducing lost earnings as a form of support for skills is even more
important when social benefits are considered. In some countries, students on low incomes
can avail of a variety of social benefits such as housing benefits, medical benefits, or other social
3. METHODOlOGICal apprOaCH TO Tax anD SkIllS STaTISTICS
50 TaxaTIOn anD SkIllS © OECD 2016
transfers. These benefits can further reduce forgone earnings and thus provide a significant extra
incentive to invest in skills by reducing lost earnings. These social benefits are not, however,
captured in the results presented in this study which focuses mainly on the tax system.
Direct private costs
Direct costs include costs directly paid by the student to acquire skills such as tuition
fees, books and materials, computers, registration fees, transportation costs of attending
school, and so on. In this model, estimates of the costs of education are taken from the OECD’s
Education at a Glance data (OECD, 2014).1 Further details are provided in Box 3.1. Figure 3.1
shows the estimates of direct costs for OECD countries of tertiary education. Due to data
limitations, the calculations in this study use tertiary education costs as a proxy for costs
of lifelong learning, workplace training, and so on.
Box 3.1. Calculating BEI and ETR inputs from Education at a Glance
To calculate the Effective Tax rates (ETr) on Skills and other skills indicators discussed in this study, three key data points are required regarding education spending in each country examined. These are:
The direct spending by each student on their education (DCW).
The direct spending by the government on the education of each student (DCG).
The scholarship and grant income received by each student (SG).
Detailed data at an individual level are not currently available. The approach taken in this study is to estimate average levels of spending on DCW, DCG, and SG, as proxies for spending by individuals.
It is also important to note that estimates of DCW, DCG, and SG are based on OECD Education at a Glance (EaG) figures for third-level education. These spending estimates are used as proxies for educational costs for graduate education, for continuing mid-career education, and for spending on life-long learning. an exception to this is in-work training, where the assumption is that no scholarship and grant income is received from the state, and so set SG = 0. Future editions of EaG should contain more detailed data on costs of these different types of education, in which case these figures could be revised. In this study, the latest data available is from EaG 2014 which contains data for 2011. This data is combined with the Taxing Wages 2011 models, to ensure conformity between estimates of education spending and the tax system.
Direct spending by each student on their education (DCW)
The formula used is as follows
DCW C ur Total Spending private Fraction
●● Total spending is total spending on third level education, expressed in equivalent ppp USD. It is taken from EaG Table B1.1a, “annual expenditure per student by educational institutions for all services”. The column used is Column 9, “all tertiary education”.
●● Private Fraction is the fraction of total spending that is undertaken by households. It is taken from EaG Table B3.1, “relative proportions of public and private expenditure on educational institutions, by level of education”. The column used is Column 12, “household expenditure”. This omits non-household non-government private education spending, such as spending by firms or nGOs.
●● Cur is a currency adjustment factor, converting the amount spent by each student in ppp USD to 2011 national currency units.
These data sources are used for australia, austria, Belgium, Canada, Chile, the Czech republic, Estonia, France, Iceland, Ireland, Israel, Italy, Japan, korea, Mexico, the netherlands, new Zealand, norway, poland, portugal, the Slovak republic, Slovenia, Spain, Sweden, and the United kingdom. For some countries in the analysis, data omissions from EaG require other data sources to be used.
51
3. METHODOlOGICal apprOaCH TO Tax anD SkIllS STaTISTICS
TaxaTIOn anD SkIllS © OECD 2016
●● For Denmark, separate data on household spending as distinct from private spending are not available. Data on all private spending is used. This means that total costs to the individual of educational spending are possibly inflated compared to other OECD countries.
●● For France, separate data on household spending as distinct from private spending are not available. Data on all private spending is used. This means that total costs to the individual of educational spending are possibly inflated compared to other OECD countries.
●● For Germany, separate data on household spending as distinct from private spending are not available. Data on all private spending is used. This means that total costs to the individual of educational spending are possibly inflated compared to other OECD countries.
●● For Greece, 2011 data on the share of public and private investment in total educational spending are unavailable. The shares of public and private spending used are from 2008.
●● For Hungary, 2011 data on the share of public and private investment in total educational spending are unavailable. The shares of public and private spending used are from 2000.
●● For Luxembourg, data on both the share of private spending in total spending, as well as on the total educational spending per student are unavailable for the entire EaG time series. Data for Belgium are used to proxy for educational costs in luxembourg.
●● For Switzerland, 2011 data on the share of public and private investment in total educational spending are unavailable. The shares of public and private spending used are from 2000.
●● For Turkey, 2011 data on the share of public and private investment in total educational spending are unavailable. The shares of public and private spending used are from 2006.
Direct spending by the government on the education of each student (DCG)
The formula used is as follows
DC Cur TotalSpending PublicFractionG = ∗ ∗
●● Total spending is total spending on third level education, expressed in equivalent ppp USD. It is taken from EaG Table B1.1a, “annual expenditure per student by educational institutions for all services”. The column used is Column 9, “all tertiary education”.
●● Public Fraction is the fraction of total spending that is undertaken by governments. It is taken from EaG Table B3.1, “relative proportions of public and private expenditure on educational institutions, by level of education”. The column used is Column 11, “public sources”.
●● Cur is a currency adjustment factor, converting the amount spent by each student in ppp USD to 2011 national currency units.
These data sources are used for australia, austria, Belgium, Canada, Chile, the Czech republic, Denmark, Estonia, Finland, France, Germany, Iceland, Ireland, Israel, Italy, Japan, korea, Mexico, the netherlands, new Zealand, norway, poland, portugal, the Slovak republic, Slovenia, Spain, Sweden, Switzerland, and the United kingdom. as with DCW, for some countries in the analysis, data omissions from EaG require other data sources to be used.
●● For Greece, 2011 data on the share of public and private investment in total educational spending are unavailable. The shares of public and private spending used are from 2008.
●● For Hungary, 2011 data on the share of public and private investment in total educational spending are unavailable. The shares of public and private spending used are from 2000.
●● For Luxembourg, data on both the share of public spending in total spending, as well as on the total educational spending per student are unavailable for the entire EaG time series. Data for Belgium are used to proxy for educational costs in luxembourg.
Box 3.1. Calculating BEI and ETR inputs from Education at a Glance (cont.)

3. METHODOlOGICal apprOaCH TO Tax anD SkIllS STaTISTICS
52 TaxaTIOn anD SkIllS © OECD 2016
Scholarship income
Scholarship and grant income reduces the cost of education, and so is a key component
of the net costs of investment in skills. Data on scholarship income is also taken from
Education at a Glance (OECD, 2014).2 Details of scholarship income calculations are discussed
in Box 3.1. It is assumed that scholarship income is available to university students, graduate
students and to those engaged in lifelong learning. It is assumed that it is not available to
those mid-career training. The amounts of scholarship income used for each country are
shown in Figure 3.2.
●● For Switzerland, 2011 data on the share of public and private investment in total educational spending are unavailable. The shares of public and private spending used are from 2000.
●● For Turkey, 2011 data on the share of public and private investment in total educational spending are unavailable. The shares of public and private spending used are from 2006.
Scholarship and grant income received by each student (SG)
The formula used is as follows
SG CurSchSpending Total TotalSpending GDP GDP
o% %
#= ∗
∗ ∗ff Students
●● Sch % Total is total spending on scholarships and grants, expressed as a % of total spending on third level education, expressed in equivalent ppp USD. It is taken from EaG Table B5.4, “public support for households and other private entities for tertiary education”. The column used is Column 2, “Scholarships and other grants to households”.
●● Total Spending % GDP is total spending on tertiary education, expressed as a % of GDp. It is taken from EaG Table B4.1, “Total public expenditure on education”. The column used is Column 7, “Tertiary education”.
●● GDP is simply a measure of GDp in ppp USD, taken from the OECD national accounts.
●● # of Students is a measure of the total number of full-time students in a given year. It is calculated by dividing total education spending at third level by total spending per student at third level. The measure of total education spending is taken from EaG Table B4.1, “Total public expenditure on education”. The column used is Column 7. The figure for total spending per student is taken from EaG Table B1.1a, “annual expenditure per student by educational institutions for all services”. The column used is Column 9, “all tertiary education”. Dividing these two figures yields an estimate of the number of students in third-level education.
●● Cur is a currency adjustment factor, converting the amount spent by each student in ppp USD to 2011 national currency units.
These data sources are used for australia, austria, Belgium, Canada, Chile, the Czech republic, Denmark, Estonia, Finland, France, Germany, Iceland, Ireland, Israel, Italy, Japan, korea, Mexico, the netherlands, new Zealand, norway, poland, portugal, the Slovak republic, Slovenia, Spain, Sweden, Switzerland, and the United kingdom. as with DCW, for some countries in the analysis, data omissions from EaG require other data sources to be used.
●● For the Greece, 2011 data on scholarship levels are unavailable. The shares of public and private spending used are from 2008.
●● For the Luxembourg, data on scholarship levels are unavailable for the entire EaG time series. Data for Belgium are used to proxy for educational costs in luxembourg.
●● For the Turkey, 2003 data on scholarship levels are unavailable. The shares of public and private spending used are from 2008.
Box 3.1. Calculating BEI and ETR inputs from Education at a Glance (cont.)
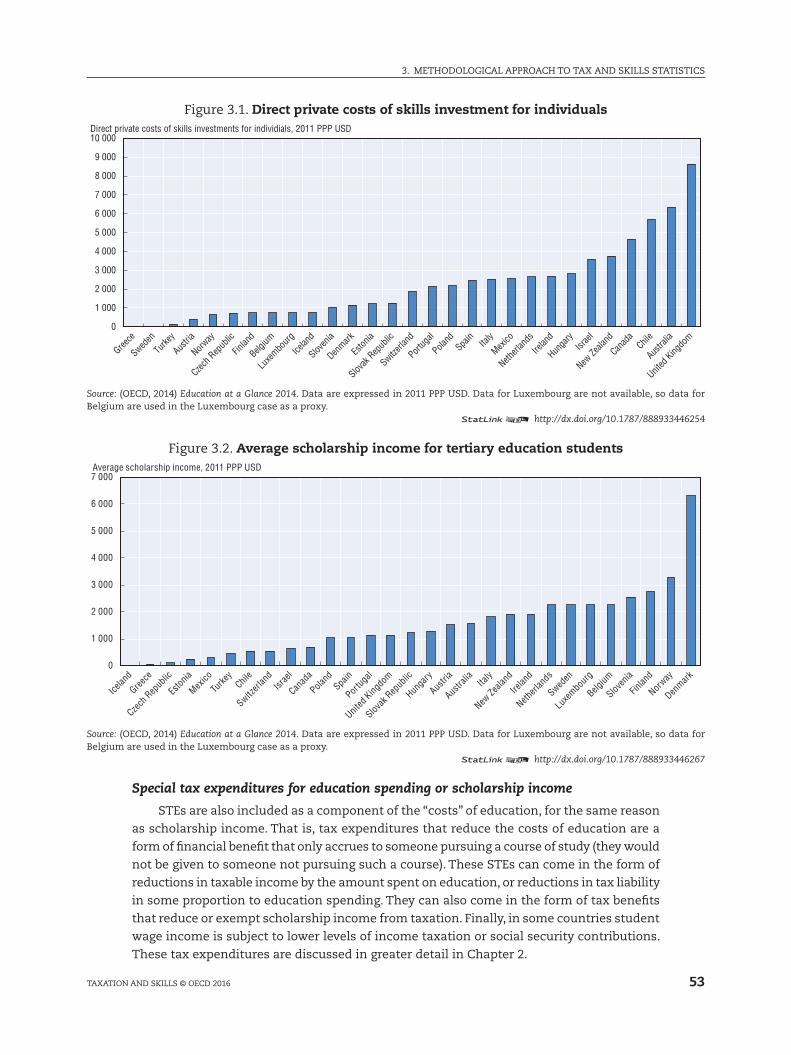
53
3. METHODOlOGICal apprOaCH TO Tax anD SkIllS STaTISTICS
TaxaTIOn anD SkIllS © OECD 2016
Figure 3.1. Direct private costs of skills investment for individuals
0
1 000
2 000
3 000
4 000
5 000
6 000
7 000
8 000
9 000
10 000Direct private costs of skills investments for individials, 2011 PPP USD
Greece
Sweden
Turke
y
Austria
Norway
Czech R
epub
lic
Finlan
d
Belgium
Luxe
mbourg
Icelan
d
Sloven
ia
Denmark
Eston
ia
Slovak
Repub
lic
Switzerl
and
Portug
al
Poland
Spain
Italy
Mexico
Netherl
ands
Irelan
d
Hunga
ryIsr
ael
New Ze
aland
Canad
aChil
e
Austra
lia
United
Kingdo
m
Source: (OECD, 2014) Education at a Glance 2014. Data are expressed in 2011 ppp USD. Data for luxembourg are not available, so data for Belgium are used in the luxembourg case as a proxy.
12 http://dx.doi.org/10.1787/888933446254
Figure 3.2. Average scholarship income for tertiary education students
0
1 000
2 000
3 000
4 000
5 000
6 000
7 000
Icelan
d
Greece
Czech
Rep
ublic
Eston
ia
Mexico
Turke
yChil
e
Switzerl
and
Israe
l
Canad
a
Poland
Spain
Portug
al
United
Kingdo
m
Slovak
Rep
ublic
Hunga
ry
Austri
a
Austra
lia Italy
New Ze
aland
Irelan
d
Netherl
ands
Sweden
Luxe
mbour
g
Belgium
Sloven
ia
Finlan
d
Norway
Denmark
Average scholarship income, 2011 PPP USD
Source: (OECD, 2014) Education at a Glance 2014. Data are expressed in 2011 ppp USD. Data for luxembourg are not available, so data for Belgium are used in the luxembourg case as a proxy.
12 http://dx.doi.org/10.1787/888933446267
Special tax expenditures for education spending or scholarship income
STEs are also included as a component of the “costs” of education, for the same reason
as scholarship income. That is, tax expenditures that reduce the costs of education are a
form of financial benefit that only accrues to someone pursuing a course of study (they would
not be given to someone not pursuing such a course). These STEs can come in the form of
reductions in taxable income by the amount spent on education, or reductions in tax liability
in some proportion to education spending. They can also come in the form of tax benefits
that reduce or exempt scholarship income from taxation. Finally, in some countries student
wage income is subject to lower levels of income taxation or social security contributions.
These tax expenditures are discussed in greater detail in Chapter 2.

3. METHODOlOGICal apprOaCH TO Tax anD SkIllS STaTISTICS
54 TaxaTIOn anD SkIllS © OECD 2016
The total costs of education
The previous sections have outlined the key cost components of education. key
private costs of education are foregone earnings, direct costs such as tuition fees, and
extra taxes that may need to be paid on scholarship income. These costs are offset by
reduced taxes on earnings, scholarship and grant support, and STEs. Foregone earnings
are often the most significant cost component of education. In sum, the total costs of
education consist of:
Costs Tax on Foregone Earnings Foregone Earnings FE= −( ) ( ) +1 ∗ DDirect Costs DC
Scholarship Income
( )− − Skills Tax Expenditurres
In the model, the shorthand used is: TC T FE DC SGFE= −( ) + −( ) −( )1 1 χ
DC SG−( ) represents Direct Costs minus Scholarships and Grants. χ represents the net
impact of STEs. This equation is discussed in more detail in annex a of this study. The value
and impact of STEs is discussed in more detail in Chapter 5.
3.3 The financing of the student’s education costsThe student’s education can be financed in different ways. This study considers just
two options: that the student finances a skills investment either with retained savings or
with a loan from the government.
Loan features
Several features of the student loans modelled in this study are important to point out.
●● There is a fixed interest rate in place for the duration of the loan, which can be higher or
lower than the risk-free interest rate that an alternative investment might earn.
●● The duration of the loan may vary, it may last the duration of the students remaining
career in the workforce, or it may last for a shorter period. repayments on the loan only
begin once the student has left education (so interest or principal repayments may not
be payable while the student is still upskilling).
●● The loan is structured as a bond. This means that if the term of the loan is β years, then
the student pays interest on the loan for the first β −1 periods. In the final period an
amount of interest is paid, and the principal is repaid.
●● Both the amount of the interest payable in each period as well as the principal to be repaid
at the end of the loan term are fixed in nominal terms.
●● Debt write-offs may exist; that is, some fraction of the principal to be repaid can be written
off by the government in the final period. The effects of increases in income from loan
write-offs on tax liability are not modelled.
●● The interest paid on the loan in each period after education may be set against tax liability (depending on the provisions in a given country’s tax system). This may take the
form of deductibility of interest from taxable income. Other similar provisions can also
be incorporated.
●● Loan repayments can be made dependent on income after education. This means that
if a taxpayers’ income does not pass a certain income level, their repayments may be
smaller, or they may not have to make any repayments at all.
55
3. METHODOlOGICal apprOaCH TO Tax anD SkIllS STaTISTICS
TaxaTIOn anD SkIllS © OECD 2016
Modelling loans
To model the impact of these loans on the incentives to invest in skills, the costs
of education are weighted upward or downward depending on the specifics of the loan
concerned. For example, if the interest rate on a loan is higher than the risk free rate which a
student could earn on savings, then debt financing increases the costs of education compared
to financing education with savings. By contrast, if loans are subsidised such that the interest
rate is below the risk-free rate, then debt financing reduces the cost of education. The total
costs of education incorporating these financing costs are referred to as Total Financing
Costs, or TFC. If a fraction TFC of the total costs of education TC are borrowed, then TFC is
expressed as follows:TFC TC a a F= −( ) + −( ) 1 1
Where the term F is a composite term of the different ways that
●● The value of the loan write-offs spread over the duration of the loan.
●● The value of the differential between the real interest rate at which the student can borrow r*,
and the risk free interest rate which he can earn interest on savings r. In the absence of
capital taxes, this value is simply r r− ∗ , where r* is the rate at which the student borrows.3
●● The value of any tax deductibility of interest payments.
The overall value of F is
F Valueof LoanWriteoffs Valueof InterestSubsidy Value= + + oof Interest Deductibility
F is then multiplied by the total costs of education, the fraction of these costs that are
borrowed, and appropriate discount factors, to arrive at the correct weighting of the true
costs of education. This is discussed further in annex a to this study. all in all the TFC
measures the total cost of education accounting for how the education is financed. as outlined,
government policies can reduce these costs to the individual directly, by reducing tuition
fees or increasing scholarship income, or by reducing financing costs, by subsidising loans
or expanding loan write-off provisions.
3.4 The returns to education and the breakeven earnings incrementIn order to recoup the costs of education, the student expects to earn higher wages after
education. The returns to education for the individual come in the form of higher after-tax
wages. Increases in the probability of employment after education, increases in the pace of
wage gains, and other benefits to education are not modelled. In this study, it is assumed that
wages rise once post-education, and then continue to rise linearly with inflation thereafter.
The term “breakeven earnings level” is used to describe the level of pre-tax earnings that
must be earned after education in order to make the skills investment worthwhile. The
previously-discussed BEI is the difference between the breakeven earnings level and income
before the skills investment. It is helpful to think about the breakeven earnings level as being
made up of several components. This is another way of asking what must a student earn
to make a skills investment worthwhile?
First, earnings after education must be at least as much as earnings before education.
The methodology assumes that wages rise naturally with inflation, but do not rise otherwise
unless a skills investment is made. In the absence of education, a worker’s real wage will
stay constant until retirement. For a skills investment to break even, workers must earn at
least this level of income after education.
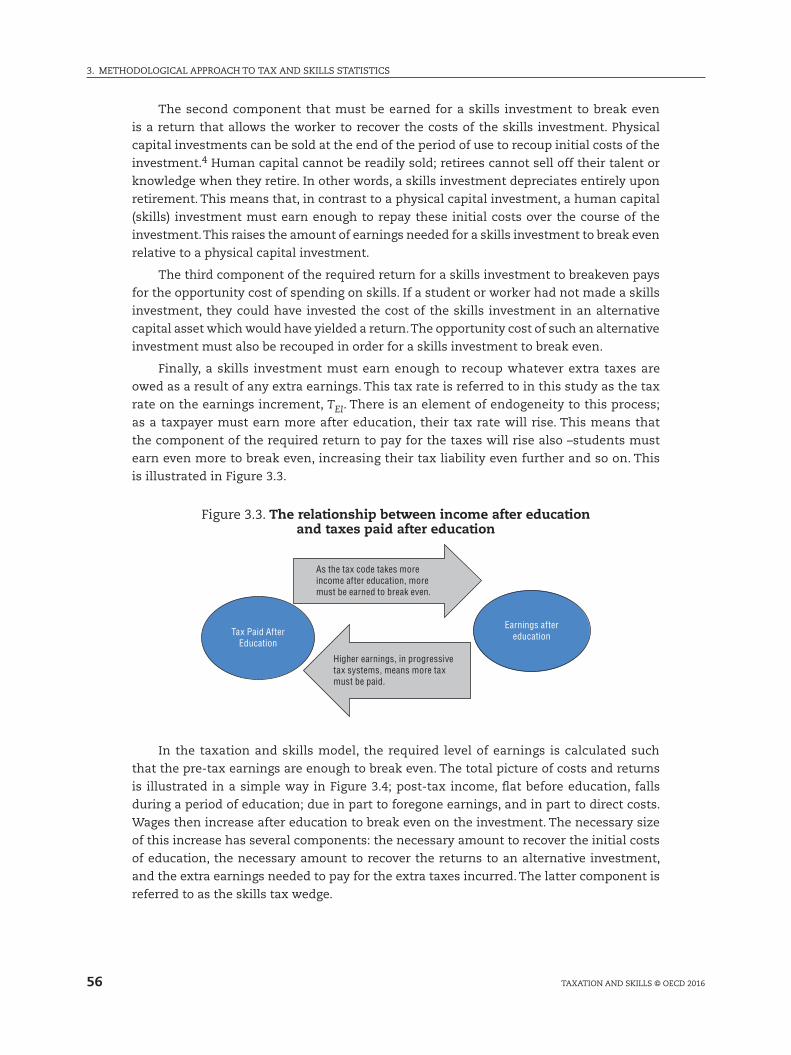
3. METHODOlOGICal apprOaCH TO Tax anD SkIllS STaTISTICS
56 TaxaTIOn anD SkIllS © OECD 2016
The second component that must be earned for a skills investment to break even
is a return that allows the worker to recover the costs of the skills investment. physical
capital investments can be sold at the end of the period of use to recoup initial costs of the
investment.4 Human capital cannot be readily sold; retirees cannot sell off their talent or
knowledge when they retire. In other words, a skills investment depreciates entirely upon
retirement. This means that, in contrast to a physical capital investment, a human capital
(skills) investment must earn enough to repay these initial costs over the course of the
investment. This raises the amount of earnings needed for a skills investment to break even
relative to a physical capital investment.
The third component of the required return for a skills investment to breakeven pays
for the opportunity cost of spending on skills. If a student or worker had not made a skills
investment, they could have invested the cost of the skills investment in an alternative
capital asset which would have yielded a return. The opportunity cost of such an alternative
investment must also be recouped in order for a skills investment to break even.
Finally, a skills investment must earn enough to recoup whatever extra taxes are
owed as a result of any extra earnings. This tax rate is referred to in this study as the tax
rate on the earnings increment, TEI. There is an element of endogeneity to this process;
as a taxpayer must earn more after education, their tax rate will rise. This means that
the component of the required return to pay for the taxes will rise also –students must
earn even more to break even, increasing their tax liability even further and so on. This
is illustrated in Figure 3.3.
Figure 3.3. The relationship between income after education and taxes paid after education
Tax Paid AfterEducation
As the tax code takes moreincome after education, moremust be earned to break even.
Earnings aftereducation
Higher earnings, in progressivetax systems, means more taxmust be paid.
In the taxation and skills model, the required level of earnings is calculated such
that the pre-tax earnings are enough to break even. The total picture of costs and returns
is illustrated in a simple way in Figure 3.4; post-tax income, flat before education, falls
during a period of education; due in part to foregone earnings, and in part to direct costs.
Wages then increase after education to break even on the investment. The necessary size
of this increase has several components: the necessary amount to recover the initial costs
of education, the necessary amount to recover the returns to an alternative investment,
and the extra earnings needed to pay for the extra taxes incurred. The latter component is
referred to as the skills tax wedge.
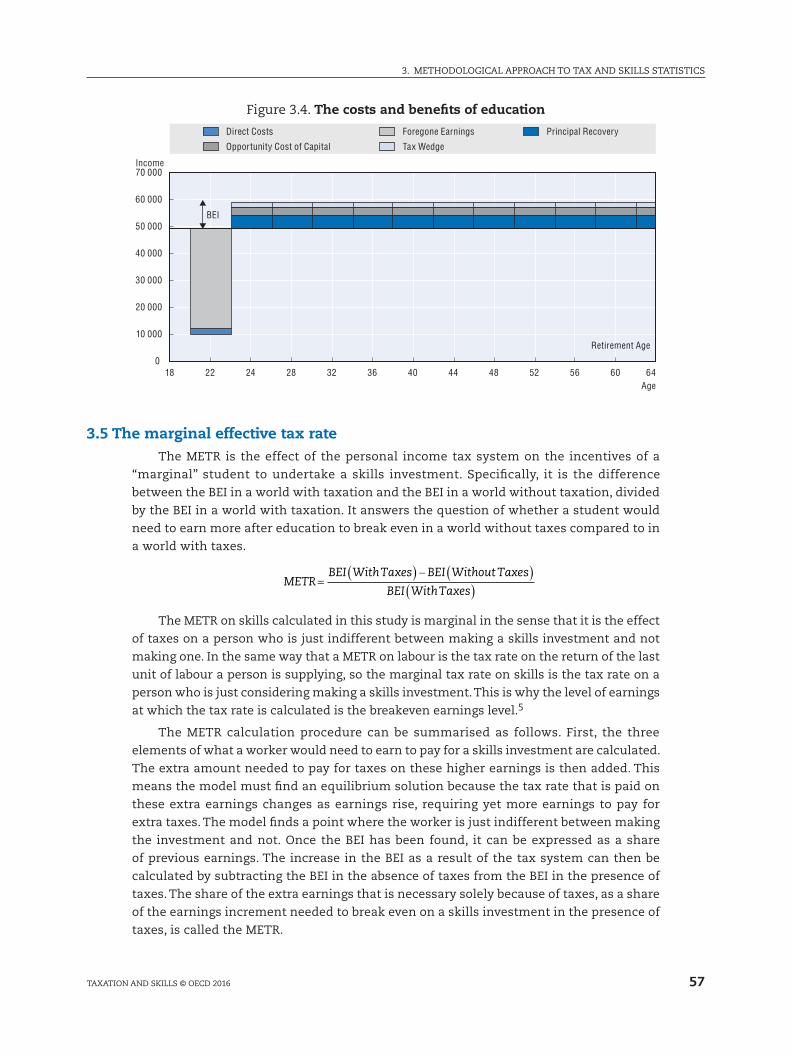
57
3. METHODOlOGICal apprOaCH TO Tax anD SkIllS STaTISTICS
TaxaTIOn anD SkIllS © OECD 2016
Figure 3.4. The costs and benefits of education
70 000
0
10 000
20 000
30 000
40 000
50 000
60 000
18 22 24 28 32 36 40 44 48 52 56 60 64
Direct Costs
Opportunity Cost of Capital
Foregone Earnings
Tax Wedge
Principal Recovery
Income
BEI
Age
Retirement Age
3.5 The marginal effective tax rateThe METr is the effect of the personal income tax system on the incentives of a
“marginal” student to undertake a skills investment. Specifically, it is the difference
between the BEI in a world with taxation and the BEI in a world without taxation, divided
by the BEI in a world with taxation. It answers the question of whether a student would
need to earn more after education to break even in a world without taxes compared to in
a world with taxes.
METRBEI WithTaxes BEI Without Taxes
BEI WithTaxes=
( ) − ( )( )
The METr on skills calculated in this study is marginal in the sense that it is the effect
of taxes on a person who is just indifferent between making a skills investment and not
making one. In the same way that a METr on labour is the tax rate on the return of the last
unit of labour a person is supplying, so the marginal tax rate on skills is the tax rate on a
person who is just considering making a skills investment. This is why the level of earnings
at which the tax rate is calculated is the breakeven earnings level.5
The METr calculation procedure can be summarised as follows. First, the three
elements of what a worker would need to earn to pay for a skills investment are calculated.
The extra amount needed to pay for taxes on these higher earnings is then added. This
means the model must find an equilibrium solution because the tax rate that is paid on
these extra earnings changes as earnings rise, requiring yet more earnings to pay for
extra taxes. The model finds a point where the worker is just indifferent between making
the investment and not. Once the BEI has been found, it can be expressed as a share
of previous earnings. The increase in the BEI as a result of the tax system can then be
calculated by subtracting the BEI in the absence of taxes from the BEI in the presence of
taxes. The share of the extra earnings that is necessary solely because of taxes, as a share
of the earnings increment needed to break even on a skills investment in the presence of
taxes, is called the METr.
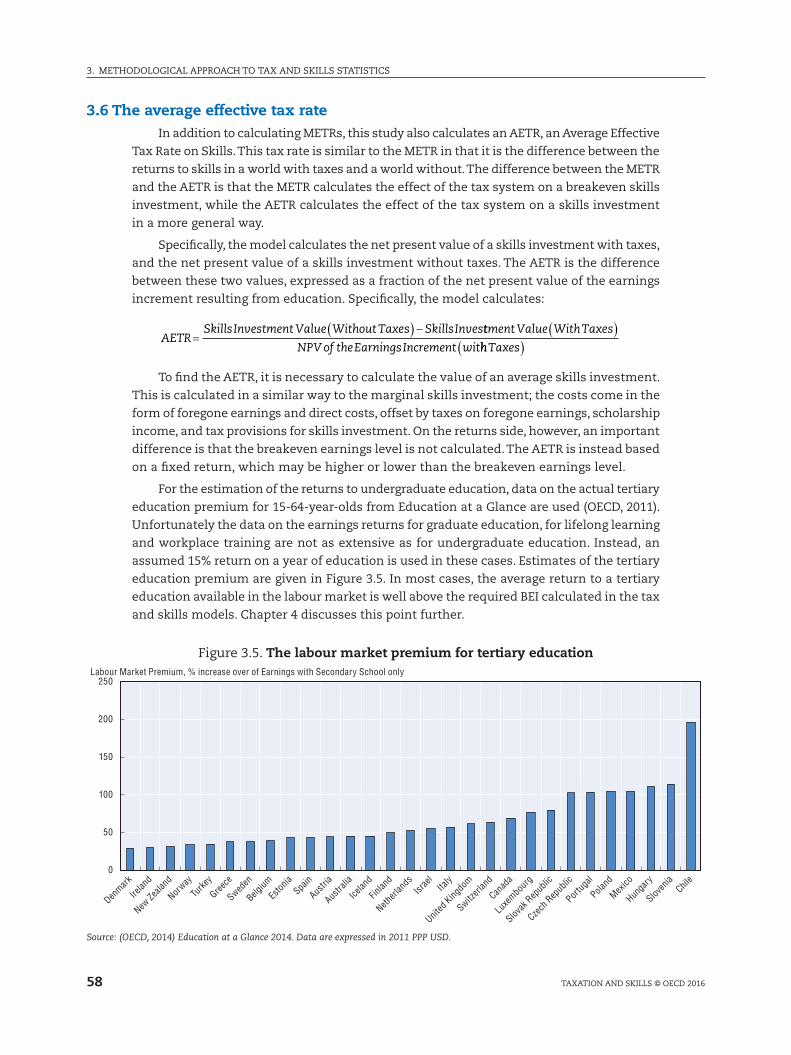
3. METHODOlOGICal apprOaCH TO Tax anD SkIllS STaTISTICS
58 TaxaTIOn anD SkIllS © OECD 2016
3.6 The average effective tax rateIn addition to calculating METrs, this study also calculates an aETr, an average Effective
Tax rate on Skills. This tax rate is similar to the METr in that it is the difference between the
returns to skills in a world with taxes and a world without. The difference between the METr
and the aETr is that the METr calculates the effect of the tax system on a breakeven skills
investment, while the aETr calculates the effect of the tax system on a skills investment
in a more general way.
Specifically, the model calculates the net present value of a skills investment with taxes,
and the net present value of a skills investment without taxes. The aETr is the difference
between these two values, expressed as a fraction of the net present value of the earnings
increment resulting from education. Specifically, the model calculates:
AETRSkillsInvestment Value Without Taxes SkillsInves
=( ) − ttment Value WithTaxes
NPV of theEarningsIncrement wit( )
hhTaxes( )
To find the aETr, it is necessary to calculate the value of an average skills investment.
This is calculated in a similar way to the marginal skills investment; the costs come in the
form of foregone earnings and direct costs, offset by taxes on foregone earnings, scholarship
income, and tax provisions for skills investment. On the returns side, however, an important
difference is that the breakeven earnings level is not calculated. The aETr is instead based
on a fixed return, which may be higher or lower than the breakeven earnings level.
For the estimation of the returns to undergraduate education, data on the actual tertiary
education premium for 15-64-year-olds from Education at a Glance are used (OECD, 2011).
Unfortunately the data on the earnings returns for graduate education, for lifelong learning
and workplace training are not as extensive as for undergraduate education. Instead, an
assumed 15% return on a year of education is used in these cases. Estimates of the tertiary
education premium are given in Figure 3.5. In most cases, the average return to a tertiary
education available in the labour market is well above the required BEI calculated in the tax
and skills models. Chapter 4 discusses this point further.
Figure 3.5. The labour market premium for tertiary education
0
50
100
150
200
250
Denmark
Irelan
d
New Ze
aland
Norway
Turke
y
Greece
Sweden
Belgium
Eston
iaSpa
in
Austri
a
Austra
lia
Icelan
d
Finlan
d
Netherl
ands
Israe
lIta
ly
United
Kingdo
m
Switzerl
and
Canad
a
Luxe
mbour
g
Slovak
Rep
ublic
Czech
Rep
ublic
Portug
al
Poland
Mexico
Hunga
ry
Sloven
iaChil
e
Labour Market Premium, % increase over of Earnings with Secondary School only
Source: (OECD, 2014) Education at a Glance 2014. Data are expressed in 2011 PPP USD.
59
3. METHODOlOGICal apprOaCH TO Tax anD SkIllS STaTISTICS
TaxaTIOn anD SkIllS © OECD 2016
Using these returns, the model calculates the net present value of a skills investment
with and without taxes. The difference between these two values, expressed as a fraction
of the net present value of the returns to education with taxes, is the aETr.
3.7 Understanding the resultsThe effect of the tax system on a skills investment, as discussed, is the difference
between the returns to skills without and with taxes. In the METr case, this difference is
measured at a breakeven earnings level; in the aETr case, this difference is measured at
some other (usually higher) earnings level, or at the earnings level based on labour market
data where available.
In practice, the two tax rates are a function of how the tax system reduces the cost of
an investment in skills, and taxes away the returns to skills. as mentioned, the pIT system
reduces the cost of upskilling by reducing foregone earnings; the amount of income foregone
during education is offset by the fact that a student also foregoes the taxes which would have
been paid on these earnings. In addition, tax liability can be reduced in some proportion to
the direct costs of education. The tax system reduces the cost of skills in these two ways.
as these two subsidies (the tax rate on foregone earnings and the subsidies for skills costs
and scholarship and grant income) increase, the METr and aETr will fall.
On the returns side, the tax system reduces the returns to skills by taxing them away;
as a worker earns more after education, tax progressivity often means that they pay taxes at
a steadily higher rate. Higher taxes, and tax progressivity, tax away the earnings increment
after a skills investment. Increasing this tax rate on the earnings increment will increase
the METr and aETr.
The tax system affects the financial incentives to invest in skills both positively and
negatively. It reduces the costs of skills but also reduces the returns; the former through the
Tax rate on Foregone Earnings and the Tax Expenditures for Direct Costs and Scholarship
Income, and the latter through the Tax rate on the Earnings Increment.
The relative size of the TFE and the TEI is a function of the pIT and SSC tax schedules. In
a proportional tax system, the marginal tax rate is the same regardless of the income level.
This means that necessarily the TFE and the TEI will be the same. If direct costs are fully
tax deductible, then the tax system should be neutral with respect to skills: the METr on
skills will be zero. This is because the costs of a skills investment are being subsidised by the
tax system at the same rate at which the returns to skills are being taxed away. Moreover,
this will be the case whether the tax rate is low or high. at a high tax rate, the TEI and TFE
will both be high. at a low tax rate, the TEI and the TFE will both be low. In both cases, where
the rate at which the tax system reduces costs is the same as the rate at which it taxes away
returns, the tax system is neutral with regard to the skills investment. In such instances
skills investments that would be profitable from the individual’s perspective in the absence
of taxes will be profitable in the presence of taxes (Brys and Torres, 2013).
In progressive tax systems, the tax rate rises with income. as wages after a skills
investment will typically be higher than wages during a skills investment, the TFE will be less
than the TEI in progressive tax systems: the tax system will tax away the returns to skills at
a higher rate than it subsidises the cost. In these cases the METr will be positive. In this way
progressive taxation can act as a disincentive to invest in skills, holding other factors equal.
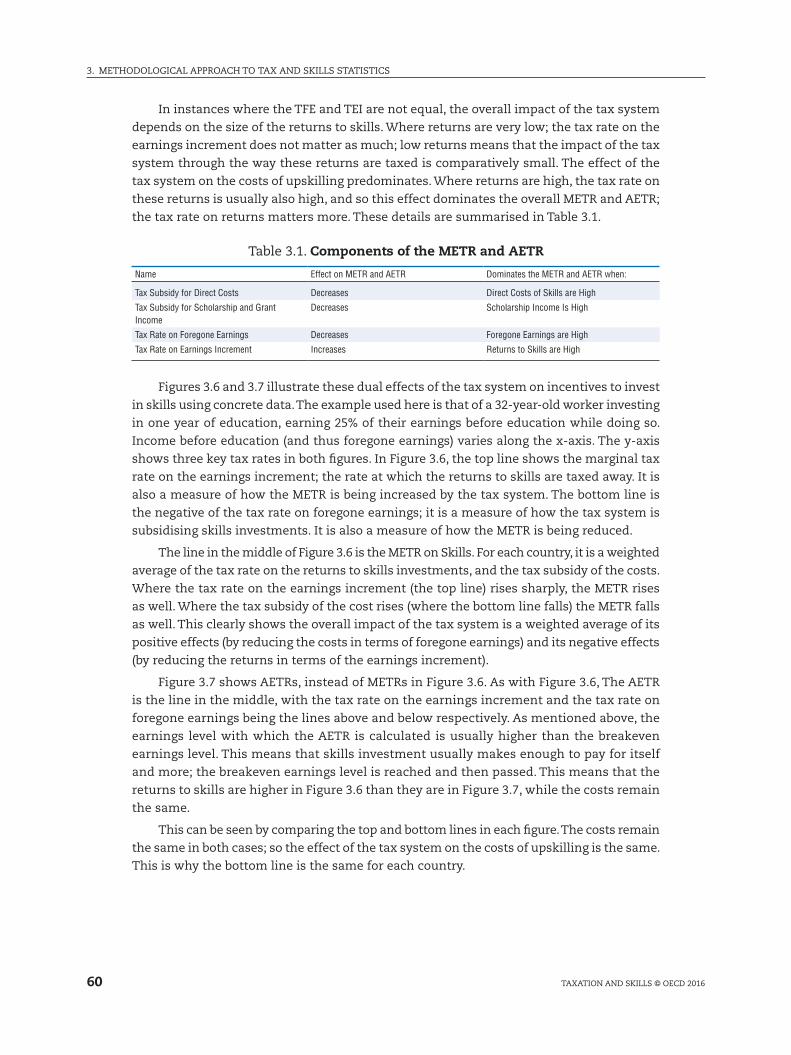
3. METHODOlOGICal apprOaCH TO Tax anD SkIllS STaTISTICS
60 TaxaTIOn anD SkIllS © OECD 2016
In instances where the TFE and TEI are not equal, the overall impact of the tax system
depends on the size of the returns to skills. Where returns are very low; the tax rate on the
earnings increment does not matter as much; low returns means that the impact of the tax
system through the way these returns are taxed is comparatively small. The effect of the
tax system on the costs of upskilling predominates. Where returns are high, the tax rate on
these returns is usually also high, and so this effect dominates the overall METr and aETr;
the tax rate on returns matters more. These details are summarised in Table 3.1.
Table 3.1. Components of the METR and AETR
Name Effect on METR and AETR Dominates the METR and AETR when:
Tax Subsidy for Direct Costs Decreases Direct Costs of Skills are High
Tax Subsidy for Scholarship and Grant Income
Decreases Scholarship Income Is High
Tax Rate on Foregone Earnings Decreases Foregone Earnings are High
Tax Rate on Earnings Increment Increases Returns to Skills are High
Figures 3.6 and 3.7 illustrate these dual effects of the tax system on incentives to invest
in skills using concrete data. The example used here is that of a 32-year-old worker investing
in one year of education, earning 25% of their earnings before education while doing so.
Income before education (and thus foregone earnings) varies along the x-axis. The y-axis
shows three key tax rates in both figures. In Figure 3.6, the top line shows the marginal tax
rate on the earnings increment; the rate at which the returns to skills are taxed away. It is
also a measure of how the METr is being increased by the tax system. The bottom line is
the negative of the tax rate on foregone earnings; it is a measure of how the tax system is
subsidising skills investments. It is also a measure of how the METr is being reduced.
The line in the middle of Figure 3.6 is the METr on Skills. For each country, it is a weighted
average of the tax rate on the returns to skills investments, and the tax subsidy of the costs.
Where the tax rate on the earnings increment (the top line) rises sharply, the METr rises
as well. Where the tax subsidy of the cost rises (where the bottom line falls) the METr falls
as well. This clearly shows the overall impact of the tax system is a weighted average of its
positive effects (by reducing the costs in terms of foregone earnings) and its negative effects
(by reducing the returns in terms of the earnings increment).
Figure 3.7 shows aETrs, instead of METrs in Figure 3.6. as with Figure 3.6, The aETr
is the line in the middle, with the tax rate on the earnings increment and the tax rate on
foregone earnings being the lines above and below respectively. as mentioned above, the
earnings level with which the aETr is calculated is usually higher than the breakeven
earnings level. This means that skills investment usually makes enough to pay for itself
and more; the breakeven earnings level is reached and then passed. This means that the
returns to skills are higher in Figure 3.6 than they are in Figure 3.7, while the costs remain
the same.
This can be seen by comparing the top and bottom lines in each figure. The costs remain
the same in both cases; so the effect of the tax system on the costs of upskilling is the same.
This is why the bottom line is the same for each country.
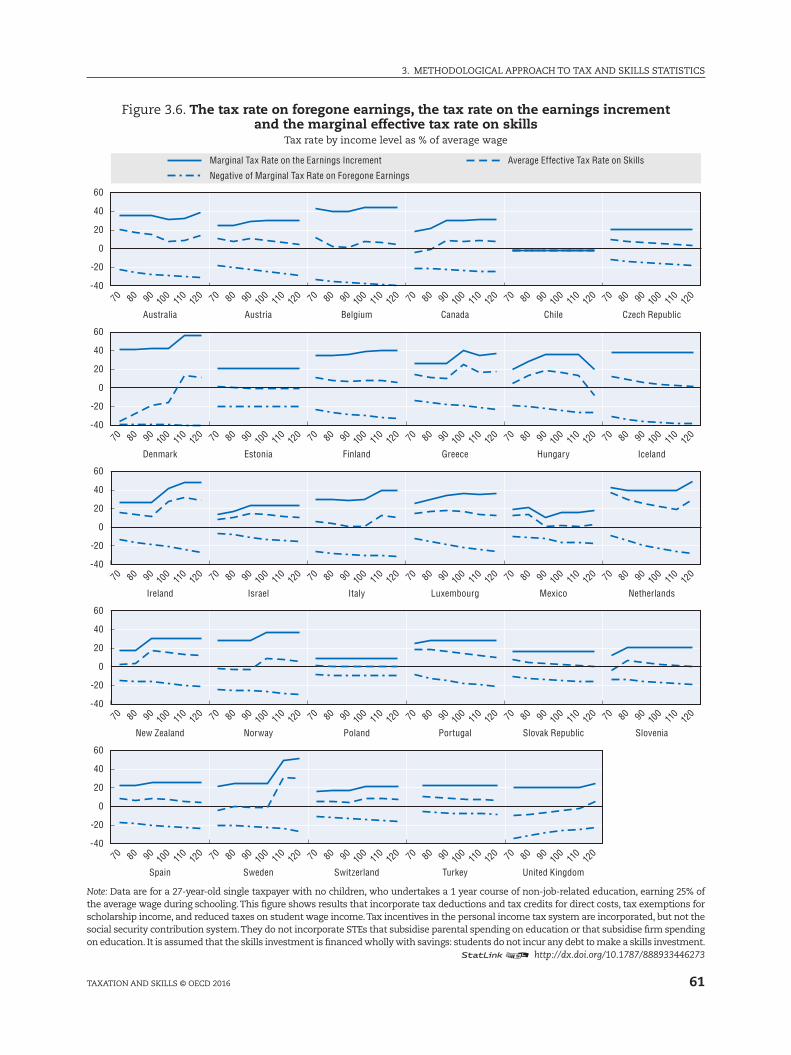
61
3. METHODOlOGICal apprOaCH TO Tax anD SkIllS STaTISTICS
TaxaTIOn anD SkIllS © OECD 2016
Figure 3.6. The tax rate on foregone earnings, the tax rate on the earnings increment and the marginal effective tax rate on skills
Tax rate by income level as % of average wage
70 80 9010
012
011
0
60
40
20
0
-20
-40
60
40
20
0
-20
-40
60
40
20
0
-20
-40
60
40
20
0
-20
-40
60
40
20
0
-20
-40
70 80 9010
012
011
0 70 80 9010
012
011
0 70 80 9010
012
011
0 70 80 9010
012
011
0 70 80 9010
012
011
0
70 80 9010
012
011
0 70 80 9010
012
011
0 70 80 9010
012
011
0 70 80 9010
012
011
0 70 80 9010
012
011
0 70 80 9010
012
011
0
70 80 9010
012
011
0 70 80 9010
012
011
0 70 80 9010
012
011
0 70 80 9010
012
011
0 70 80 9010
012
011
0 70 80 9010
012
011
0
70 80 9010
012
011
0 70 80 9010
012
011
0 70 80 9010
012
011
0 70 80 9010
012
011
0 70 80 9010
012
011
0 70 80 9010
012
011
0
70 80 9010
012
011
0 70 80 9010
012
011
0 70 80 9010
012
011
0 70 80 9010
012
011
0 70 80 9010
012
011
0
Australia Austria Belgium Canada Chile Czech Republic
Estonia Finland Greece Hungary Iceland
Italy Luxembourg Mexico Netherlands
Portugal
United Kingdom
Slovak Republic Slovenia
Denmark
Ireland Israel
New Zealand Norway Poland
Spain Sweden Switzerland Turkey
Marginal Tax Rate on the Earnings Increment
Negative of Marginal Tax Rate on Foregone Earnings
Average Effective Tax Rate on Skills
Note: Data are for a 27-year-old single taxpayer with no children, who undertakes a 1 year course of non-job-related education, earning 25% of the average wage during schooling. This figure shows results that incorporate tax deductions and tax credits for direct costs, tax exemptions for scholarship income, and reduced taxes on student wage income. Tax incentives in the personal income tax system are incorporated, but not the social security contribution system. They do not incorporate STEs that subsidise parental spending on education or that subsidise firm spending on education. It is assumed that the skills investment is financed wholly with savings: students do not incur any debt to make a skills investment.
12 http://dx.doi.org/10.1787/888933446273
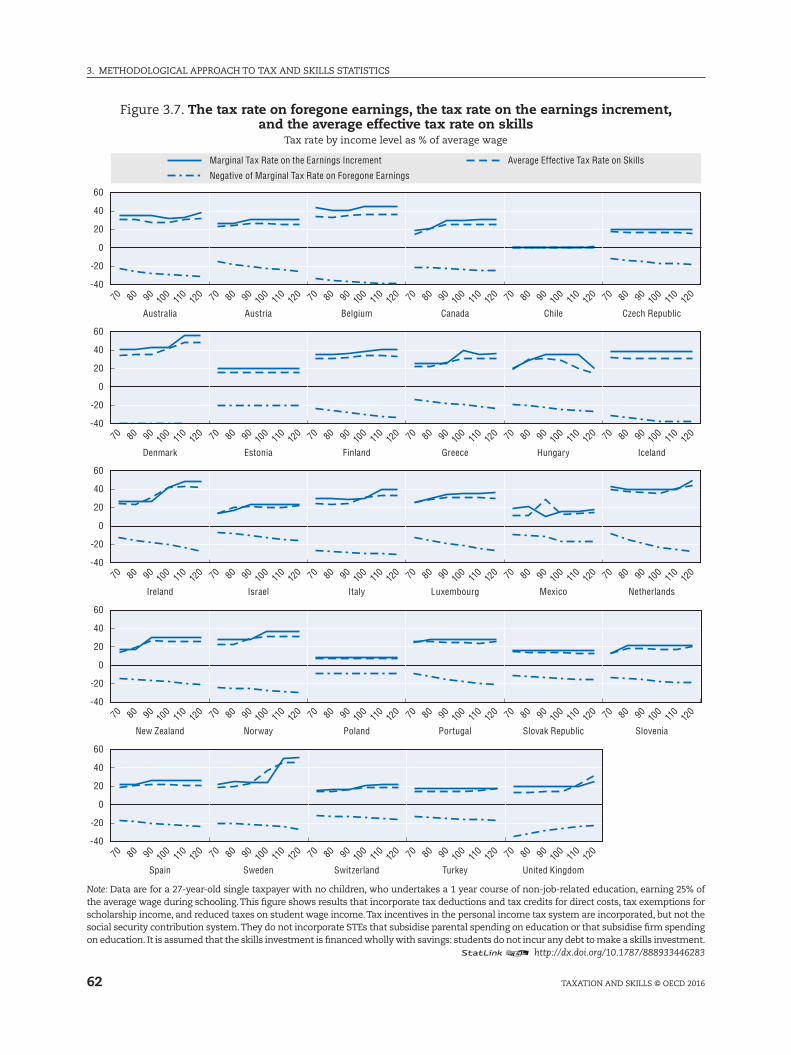
3. METHODOlOGICal apprOaCH TO Tax anD SkIllS STaTISTICS
62 TaxaTIOn anD SkIllS © OECD 2016
Figure 3.7. The tax rate on foregone earnings, the tax rate on the earnings increment, and the average effective tax rate on skills
Tax rate by income level as % of average wage
70 80 9010
012
011
0
60
40
20
0
-20
-40
60
40
20
0
-20
-40
60
40
20
0
-20
-40
60
40
20
0
-20
-40
60
40
20
0
-20
-40
70 80 9010
012
011
0 70 80 9010
012
011
0 70 80 9010
012
011
0 70 80 9010
012
011
0 70 80 9010
012
011
0
70 80 9010
012
011
0 70 80 9010
012
011
0 70 80 9010
012
011
0 70 80 9010
012
011
0 70 80 9010
012
011
0 70 80 9010
012
011
0
70 80 9010
012
011
0 70 80 9010
012
011
0 70 80 9010
012
011
0 70 80 9010
012
011
0 70 80 9010
012
011
0 70 80 9010
012
011
0
70 80 9010
012
011
0 70 80 9010
012
011
0 70 80 9010
012
011
0 70 80 9010
012
011
0 70 80 9010
012
011
0 70 80 9010
012
011
0
70 80 9010
012
011
0 70 80 9010
012
011
0 70 80 9010
012
011
0 70 80 9010
012
011
0 70 80 9010
012
011
0
Australia Austria Belgium Canada Chile Czech Republic
Estonia Finland Greece Hungary Iceland
Italy Luxembourg Mexico Netherlands
Portugal
United Kingdom
Slovak Republic Slovenia
Denmark
Ireland Israel
New Zealand Norway Poland
Spain Sweden Switzerland Turkey
Marginal Tax Rate on the Earnings Increment
Negative of Marginal Tax Rate on Foregone Earnings
Average Effective Tax Rate on Skills
Note: Data are for a 27-year-old single taxpayer with no children, who undertakes a 1 year course of non-job-related education, earning 25% of the average wage during schooling. This figure shows results that incorporate tax deductions and tax credits for direct costs, tax exemptions for scholarship income, and reduced taxes on student wage income. Tax incentives in the personal income tax system are incorporated, but not the social security contribution system. They do not incorporate STEs that subsidise parental spending on education or that subsidise firm spending on education. It is assumed that the skills investment is financed wholly with savings: students do not incur any debt to make a skills investment.
12 http://dx.doi.org/10.1787/888933446283
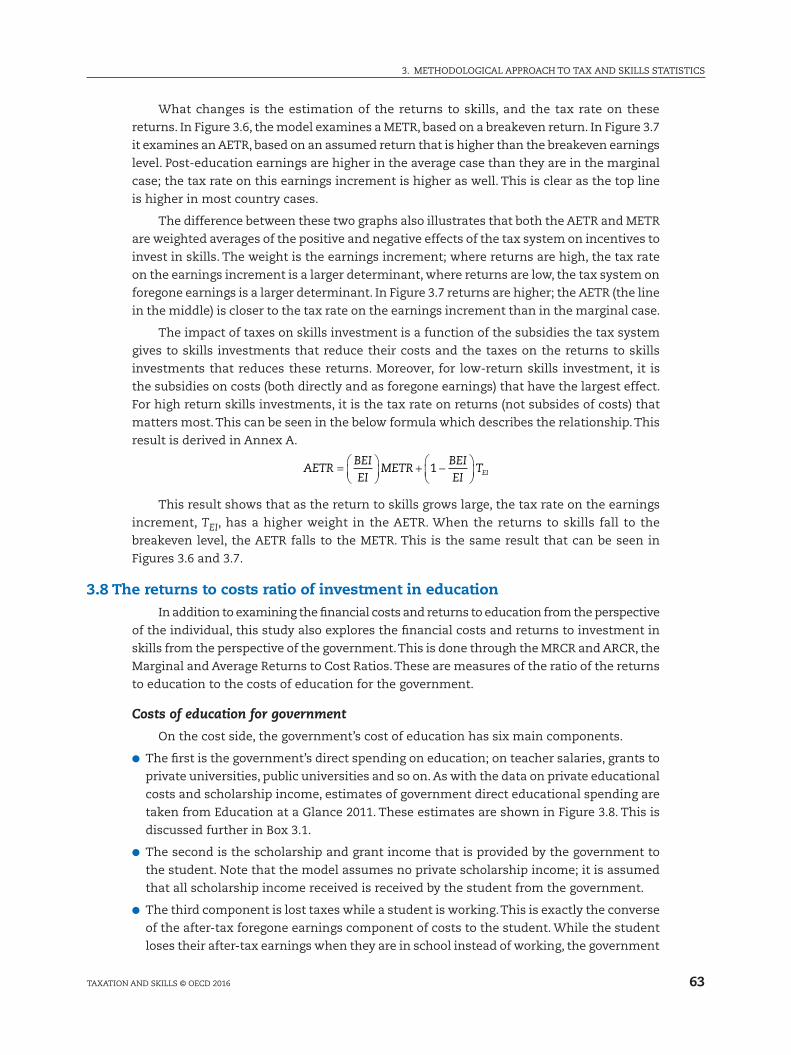
63
3. METHODOlOGICal apprOaCH TO Tax anD SkIllS STaTISTICS
TaxaTIOn anD SkIllS © OECD 2016
What changes is the estimation of the returns to skills, and the tax rate on these
returns. In Figure 3.6, the model examines a METr, based on a breakeven return. In Figure 3.7
it examines an aETr, based on an assumed return that is higher than the breakeven earnings
level. post-education earnings are higher in the average case than they are in the marginal
case; the tax rate on this earnings increment is higher as well. This is clear as the top line
is higher in most country cases.
The difference between these two graphs also illustrates that both the aETr and METr
are weighted averages of the positive and negative effects of the tax system on incentives to
invest in skills. The weight is the earnings increment; where returns are high, the tax rate
on the earnings increment is a larger determinant, where returns are low, the tax system on
foregone earnings is a larger determinant. In Figure 3.7 returns are higher; the aETr (the line
in the middle) is closer to the tax rate on the earnings increment than in the marginal case.
The impact of taxes on skills investment is a function of the subsidies the tax system
gives to skills investments that reduce their costs and the taxes on the returns to skills
investments that reduces these returns. Moreover, for low-return skills investment, it is
the subsidies on costs (both directly and as foregone earnings) that have the largest effect.
For high return skills investments, it is the tax rate on returns (not subsides of costs) that
matters most. This can be seen in the below formula which describes the relationship. This
result is derived in annex a.
AETRBEIEI
METRBEIEI
TEI=
+ −
1
This result shows that as the return to skills grows large, the tax rate on the earnings
increment, TEI, has a higher weight in the aETr. When the returns to skills fall to the
breakeven level, the aETr falls to the METr. This is the same result that can be seen in
Figures 3.6 and 3.7.
3.8 The returns to costs ratio of investment in educationIn addition to examining the financial costs and returns to education from the perspective
of the individual, this study also explores the financial costs and returns to investment in
skills from the perspective of the government. This is done through the MrCr and arCr, the
Marginal and average returns to Cost ratios. These are measures of the ratio of the returns
to education to the costs of education for the government.
Costs of education for government
On the cost side, the government’s cost of education has six main components.
●● The first is the government’s direct spending on education; on teacher salaries, grants to
private universities, public universities and so on. as with the data on private educational
costs and scholarship income, estimates of government direct educational spending are
taken from Education at a Glance 2011. These estimates are shown in Figure 3.8. This is
discussed further in Box 3.1.
●● The second is the scholarship and grant income that is provided by the government to
the student. note that the model assumes no private scholarship income; it is assumed
that all scholarship income received is received by the student from the government.
●● The third component is lost taxes while a student is working. This is exactly the converse
of the after-tax foregone earnings component of costs to the student. While the student
loses their after-tax earnings when they are in school instead of working, the government
3. METHODOlOGICal apprOaCH TO Tax anD SkIllS STaTISTICS
64 TaxaTIOn anD SkIllS © OECD 2016
loses the tax revenue it would have earned had the student continued working instead
of educating themselves.
●● The fourth component is the lost tax revenue that results from STEs. The government
may lose tax revenue if STEs exist that defray the costs of education for the student of
the kind outlined in Section 3.1.4.
●● The fifth component is lost taxes that may result from deductibility of interest payments
from workers as they repay student debts.
●● The sixth component is fiscal costs that may accrue to the government if it lends to students
to finance education at rates lower than it can borrow, or from the government writing
off student loans, including in systems when repayment of these loans is contingent on
a worker’s income. By contrast, if the government is able to earn real returns on student
loan provision, these returns may offset government costs elsewhere.
Figure 3.8. Direct costs of skills investment for governments
0
5 000
10 000
15 000
20 000
25 000Direct government costs of skills investments for individials, 2011 PPP USD
Chile
United
Kingdo
mMex
icoIsr
ael
Greece
Slovak
Rep
ublic
Eston
ia
Portug
alIta
ly
New Ze
aland
Poland
Austra
lia
Czech
Rep
ublic
Icelan
d
Turke
y
Sloven
ia
Hunga
ry
United
States
Spain
Netherl
ands
Austri
a
Irelan
d
Canad
a
Belgium
Luxe
mbour
g
Finlan
d
Norway
Sweden
Denmark
Switzerl
and
Source: (OECD, 2014) Education at a Glance 2014. Data are expressed in 2011 PPP USD. 12 http://dx.doi.org/10.1787/888933446290
In terms of returns, the model considers only returns to government in the form of
increased tax revenue from the higher wages that workers earn after education. In doing
so, it abstracts from the many other positive benefits that increased education will bring to
the government, such as increased indirect taxation when the extra income earned is spent,
reduced spending on employment and social benefits due to a more productive population,
higher growth, lower probability of unemployment, and potentially greater social cohesion.
The true returns to governments from education are likely to be considerably higher than
those estimated in the model.
Average returns to cost ratio
a very simplified formula of the arCr can be expressed as follows:
ARCRIncreasedTaxesafterEducation
Lost Taxes Direct Ed=
+ uucationalSpending GrantSpending LoanCosts+ + .
In the model, this formula is appropriately time-discounted. a more technical expression
of the arCr can be found in annex a of this study.
65
3. METHODOlOGICal apprOaCH TO Tax anD SkIllS STaTISTICS
TaxaTIOn anD SkIllS © OECD 2016
This formula is, like the METr, aETr and BEI, incorporated into the Taxing Wages models
to calculate future tax revenue based on earnings assumptions. as with the aETr, labour
market estimates of the lifetime tertiary education premium are used to estimate the
increased tax revenues from upskilling for the government.
From a technical perspective, the arCr functions as a ‘Tobin’s q’ in economic investment
theory. Values of the arCr below one suggest that the returns to education (in tax revenue
alone) are insufficient to recoup the costs of education for the government. Values of the
arCr above one suggest that the returns to education in the form of tax revenue more than
cover the government’s costs.
This in turn has implications for government spending on education, and for the
government’s taxation of the returns to skills. In investment theory, a Tobin’s q above
one suggests that the investment should be continued. In similar terms, arCrs that
far surpass one suggest that governments could increase tax revenue by increasing
skills investments. By contrast, very low arCr values could suggest that the returns to
government in income tax revenue do not cover its costs from investments in upskilling
at current spending levels.
It is important to realise that the arCr does not provide information about the overall
ratio of costs and benefits of education for society. It merely does so for the government. For
example, it is possible for the arCr to be far below one for the government, but for the skills
investment to be profitable from an overall social perspective. It could simply be that the tax
rate is too low for the government to recoup its spending on education; meaning that returns
to a skills investment for the student are very high. Similarly, a high arCr could mean that
the government is spending little on education; that a large fraction of education spending is
being financed privately by students, but the returns are being taxed away by the government.
Essentially, then, the arCr is a measure not of the total ratio of costs to returns of
education, but of the way these costs and returns are being shared between the government
and the student. low arCrs suggest that the government is receiving a lower share of the
returns to education than it is bearing in costs. This may not mean that education is not
profitable or worthwhile overall, but simply that large shares of the returns are being captured
by the student. Higher arCrs suggest that the government is receiving a higher share of the
returns to skills investments than it is bearing in costs. In such cases, the financial incentives
to invest in education on the part of the student may be lower than they should be. This is
illustrated in a very simple way in Table 3.2.
The results also suggest that raising the employment rate provides significant returns
to the government by increasing the returns to its skills investment. For existing members of
the labour force the formula suggests that unemployment can be very costly for governments
who pay a large fraction of the costs of skills investments; a high unemployment rate means
that sunk costs of skills investment are not being recouped by the government in the form
of tax revenue.
Table 3.2. Components of the MRCR and ARCR
High Taxes on Earnings Increments Low Taxes on Earnings Increments
Low Government Spending/Low Taxes on Lost Earnings
High ARCR – Government receives a higher share of the returns than its share of the costs
ARCR near 1 – low share of the returns, but a low share of costs as well
High Government Spending/High Taxes on Lost Earnings
ARCR near 1 – high share of the returns, but a high share of the costs as well
Low ARCR – Government receives a smaller share of the returns than its share of the costs
3. METHODOlOGICal apprOaCH TO Tax anD SkIllS STaTISTICS
66 TaxaTIOn anD SkIllS © OECD 2016
It is important to note that many simplifying assumptions are made in the model. as
mentioned, the model does not account for a wide variety of the financial and social benefits
to education. These other benefits may occur in terms of tax revenue from taxes other than
income tax, reducing social and other expenditure, and other social benefits. In addition,
the model is static in its approach; the tax system is assumed to remain the same over
years to come, as are the responses of wages to increased skills. present taxes and present
tertiary education premiums proxy for taxes and tertiary education premiums in years to
come. as such, it is likely that the model underestimates the returns to education for both
the student and government. The returns to skills are likely to rise steadily over the years
to come, and comprise much more than just income tax revenue. The arCr indicator is
more useful as a guide of the relative position of countries with respect to how the costs
and returns to education are distributed between governments and students, as opposed
to an overall measure of the benefits of skills investment itself.
Marginal returns to cost ratio
Sections 3.4 and 3.5 discussed two tax rates on individual’s investment in skills, the
METr and the aETr. as discussed, the aETr measures the effect of the tax system on the
financial incentives to invest in skills for a student earning the average return to skills in
the labour market. By contrast, the METr on skills measures the effect of the tax system
on the financial incentives to invest in skills for a student earning a breakeven return on a
skills investment.
In addition to the average returns to Cost ratio, the model allows for the calculation of
a Marginal returns to Cost ratio. as outlined, the arCr measures the ratio of returns to costs
from the government’s perspective where a student earns an average amount of returns on
their skills investment. This means that from the government’s perspective, returns in the
form of tax revenue will be average as well. By contrast, the MrCr measures the ratio of
returns to costs for the government when the student earns just a breakeven return. This
indicator measures the incentives of the government to educate a student who will just
break even on a skills investment. as with the arCr, values of the MrCr above one suggest
that the government will more than recoup their costs from skills investments.
as will be discussed in Chapter 4, breakeven earnings levels in the OECD are usually well
below the average tertiary education premium: students more than recoup the costs of their
education. This means that a hypothetical “breakeven” student will earn much less in this
analysis than the average student. This in turn means that the tax revenue the government
receives from a breakeven student will usually be significantly lower than that of the average
student. This is true regardless of the other components of the arCr and MrCr.
This in turn means that MrCrs are usually much lower than arCrs in OECD countries.
This is illustrated for a sample case in Figure 3.9. It can be seen here that arCrs are larger
than one for most countries at most income levels. However for most countries and for
most income levels – though not all – MrCrs are not above one. This illustrates that for
the government, the returns from educating a student who is just breaking even on a skills
investment are lower than the returns to educating an average student.
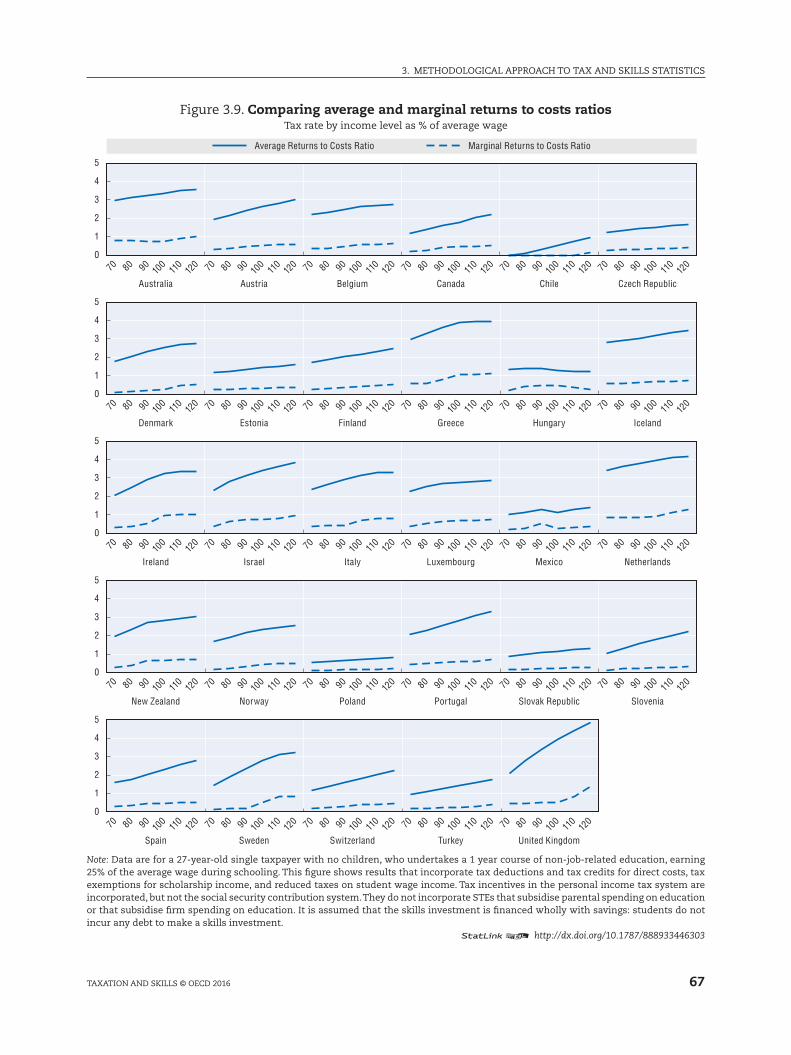
67
3. METHODOlOGICal apprOaCH TO Tax anD SkIllS STaTISTICS
TaxaTIOn anD SkIllS © OECD 2016
Figure 3.9. Comparing average and marginal returns to costs ratiosTax rate by income level as % of average wage
70 80 9010
012
011
0
5
4
3
2
1
0
5
4
3
2
1
0
5
4
3
2
1
0
5
4
3
2
1
0
5
4
3
2
1
0
70 80 9010
012
011
0 70 80 9010
012
011
0 70 80 9010
012
011
0 70 80 9010
012
011
0 70 80 9010
012
011
0
70 80 9010
012
011
0 70 80 9010
012
011
0 70 80 9010
012
011
0 70 80 9010
012
011
0 70 80 9010
012
011
0 70 80 9010
012
011
0
70 80 9010
012
011
0 70 80 9010
012
011
0 70 80 9010
012
011
0 70 80 9010
012
011
0 70 80 9010
012
011
0 70 80 9010
012
011
0
70 80 9010
012
011
0 70 80 9010
012
011
0 70 80 9010
012
011
0 70 80 9010
012
011
0 70 80 9010
012
011
0 70 80 9010
012
011
0
70 80 9010
012
011
0 70 80 9010
012
011
0 70 80 9010
012
011
0 70 80 9010
012
011
0 70 80 9010
012
011
0
Australia Austria Belgium Canada Chile Czech Republic
Estonia Finland Greece Hungary Iceland
Italy Luxembourg Mexico Netherlands
Portugal
United Kingdom
Slovak Republic Slovenia
Denmark
Ireland Israel
New Zealand Norway Poland
Spain Sweden Switzerland Turkey
Average Returns to Costs Ratio Marginal Returns to Costs Ratio
Note: Data are for a 27-year-old single taxpayer with no children, who undertakes a 1 year course of non-job-related education, earning 25% of the average wage during schooling. This figure shows results that incorporate tax deductions and tax credits for direct costs, tax exemptions for scholarship income, and reduced taxes on student wage income. Tax incentives in the personal income tax system are incorporated, but not the social security contribution system. They do not incorporate STEs that subsidise parental spending on education or that subsidise firm spending on education. It is assumed that the skills investment is financed wholly with savings: students do not incur any debt to make a skills investment.
12 http://dx.doi.org/10.1787/888933446303
3. METHODOlOGICal apprOaCH TO Tax anD SkIllS STaTISTICS
68 TaxaTIOn anD SkIllS © OECD 2016
Notes1. Data for direct costs of education in luxembourg are not available in Education at a Glance; data
for Belgium are used as a proxy.
2. Data on scholarship and grant income in luxembourg are not available in Education at a Glance; data for Belgium are used as a proxy. More details are provided in Box 3.1.
3. In the presence of capital taxes, the capital tax inserts a further wedge between what the student can earn on a risk-free investment and the rate at which he can borrow. This is because capital taxes must be paid on the nominal return on any investment opportunity. In this case, instead of
r r− ∗ , the difference would be 1 −( ) +( ) − +T r rc π π∗ .
4. This is true in a setting without uncertainty, as is the case in the framework presented here.
5. The mechanics of the METr and BEI are discussed in detail in Brys and Torres (2013).
ReferencesBrys, B. and C. Torres (2013), “Effective personal Tax rates on Marginal Skills Investments in OECD Countries:
a new Methodology”, OECD Taxation Working Papers, no. 16, http://dx.doi.org/10.1787/5k425747xbr6-en.
klemm, a. (2008) “Effective average Tax rates for permanent Investment”, IMF Working paper, no Wp/08/56
OECD (2014), Education at a Glance 2014: OECD Indicators, OECD publishing, paris, https://doi.org/10.1787/eag-2013-en.
OECD (2016), Taxing Wages 2016, OECD publishing, paris, http://dx.doi.org/10.1787/tax_wages-2016-en.
69
Taxation and Skills
© OECD 2016
Chapter 4
Tax and skills statistics: Effective tax rates and returns to costs ratios
This chapter presents the main results for the indicators surrounding the financial incentives to invest in skills discussed in this tax policy study. The key indicators are the Breakeven Earnings Increment (BEI), the Marginal Effective Tax Rate on Skills (METR), the Average Effective Tax Rate on Skills (AETR), the Marginal Returns to Costs Ratio for Governments (MRCR), and the Average Returns to Costs Ratio for Governments (ARCR). The chapter presents results for four stylised education, scenarios: a 17-year-old student undertaking a four-year degree, a 27 year-old undertaking a one-year degree, a 32-year old undertaking a short course of job-related training, and a 50-year old undertaking a one-year degree. The chapter also examines the impact of the form of financing of education on indicator outcomes, as well as the way the results vary by gender.
The statistical data for Israel are supplied by and under the responsibility of the relevant Israeli authorities. The use of such data by the OECD is without prejudice to the status of the Golan Heights, East Jerusalem and Israeli settlements in the West Bank under the terms of international law.
70
4. Tax anD SkIllS STaTISTICS: EffECTIvE Tax raTES anD rETurnS TO COSTS raTIOS
TaxaTIOn anD SkIllS © OECD 2016
4.1 IntroductionThis chapter presents the main results for the indicators surrounding the financial
incentives to invest in skills discussed in this tax policy study. The key indicators are the
Breakeven Earnings Increment (BEI), the Marginal Effective Tax rate on Skills (METr),
the average Effective Tax rate on Skills (aETr), the Marginal returns to Costs ratio for
Governments (MrCr), and the average returns to Costs ratio for Governments (arCr). The
methodology outlined in Chapter 3 is flexible; it allows for these indicators to be developed
using a wide variety of assumptions about the length, nature, and cost of a given skills
investment. It also allows for considerable variation with respect to the student; the income,
family status, age, lost earnings, and future earnings potential of a student can all be varied.
finally, the model allows for flexibility with respect to the extent of education subsidies
available; the government can pay for more or less of the direct costs of education, and it
can subsidise the student with scholarship income, by writing down loan principals, by
allowing students to borrow at reduced interest rates, and by using skills tax expenditures
(STEs) to offset educational costs.
In this chapter results are presented for four stylised “types” of person engaged in
upskilling, though the chapter also shows how these results vary by income, age, and taxes
considered. The stylised cases are:
●● Tertiary Education: a 17-year-old student, single and childless, who could earn 70% of the
average wage in the labour market, but instead undertakes a four-year basic undergraduate
degree. During this time, the student earns 25% of the average Wage in part-time work.
This is discussed in Sections 4.2 and 4.3.
●● Graduate Education: a 27-year-old worker, single and childless, who could earn the
average Wage in the labour market, but instead undertakes a one-year graduate degree.
During education the student earns 25% of their previous wage in part-time work. This
is discussed in Section 4.4.
●● Job-Related In-Work Training: a 32-year-old worker, single and childless, who earns 100% of
the average Wage, and undertakes a short course of job-related training. During education
the worker’s earnings fall to 95% of their previous wage, though they earn their previous
wage for the rest of the year. This is discussed in Section 4.5.
●● Life-long Learning: a 50-year-old worker, single and childless, who could earn 100% of the
average Wage, but instead undertakes a one-year retraining program unrelated to their
current job. During education the worker earns 25% of their previous wage in part-time
work. This is discussed in Section 4.6.
for university students, the manner in which education is financed is allowed to
vary. In some countries, tertiary is financed primarily by governments, while in some
countries the student finances most of their tertiary education. a student can finance
their education with retained earnings, debt, or a combination of the two. This is discussed
in Section 4.3.
71
4. Tax anD SkIllS STaTISTICS: EffECTIvE Tax raTES anD rETurnS TO COSTS raTIOS
TaxaTIOn anD SkIllS © OECD 2016
In addition, Section 4.7 examines the way in which differing expected wages for men
and women in the labour market in OECD countries can affect incentives to invest in skills
for individual men and women. The discussion will also examine how the gender wage gap
affects expected returns for governments.
The results in this study incorporate personal income taxes (PIT) only, not social security
contributions (SSCs). This means that in countries where SSCs form a large part of the labour
tax wedge, the results presented in this study may differ from those that would result from
incorporating both PIT and SSCs. SSCs may raise the tax rate on foregone earnings, increasing
the extent to which the tax system subsidises skills investment and reducing the tax burden
on skills, while at the same time raising the tax rate on earnings increments, thus raising
the tax burden on skills. Thus adding SSCs to the analysis may raise or reduce the overall
burden on skills investments.
The results in some countries may be particularly sensitive to the inclusion of SSCs due
to the fact that in some instances there are ceilings above which an extra dollar of income
may not be liable for future SSCs. This may mean that SSCs may be a component of the tax
rate on foregone earnings, but not of the tax rate on the earnings increment. In these cases,
accounting for SSCs may reduce the tax burden on skills substantially.
In other cases however, the SSC burden may rise with income; SSC schedules may
be progressive. In these cases, accounting for SSCs will raise the tax rate on the earnings
increment by more than the tax rate on foregone earnings is reduced. In these cases, the
overall tax rate on skills may be higher where SSCs are taken into account.
It is also important to account for the ways in which the SSC system interacts with the
PIT system. In many countries, SSCs are deductible from the PIT base. In this study the results
presented factor in the impact of these deductions from the PIT system. Thus while SSCs are
not taken into account in the results presented here, the study does account for their impact
on the PIT system. This approach follows that taken in Taxing Wages (OECD, 2016).
finally, it is important to account for certain skills tax expenditures that may be provided
through the SSC system. for example, in certain cases student income may be subject to a
reduced SSC burden relative to other forms of income. These kinds of skills tax expenditures
through the SSC system are discussed further in Chapter 5.
4.2 Tertiary educationThe tertiary education case examines a 17-year old person undertaking a four-year course
of study. Tertiary education students receive an average level of government scholarship
income and pay an average amount of direct costs.1 Their earnings during education are
set at 25% of the average Wage in any given country: that is, students are assumed to earn
some part-time employment income, but at a comparatively low level.
Importantly, it is assumed that the student receives no financial support from parents
towards their education costs, nor do the parents receive subsidies through the tax system
for supporting their child through university. This strong assumption is made on tractability
grounds. aside from government support, the student is assumed to be independent from
their parents when it comes to financing the course of study.
as discussed in Chapter 3, a variety of assumptions about how the students finance their
education are examined. In this section it is assumed that students finance their education
with savings. In Section 4.3, it is assumed that the student finances their education with
a student loan. The amounts borrowed by the student as well as the interest rate at which
they can borrow are both varied in the analysis.
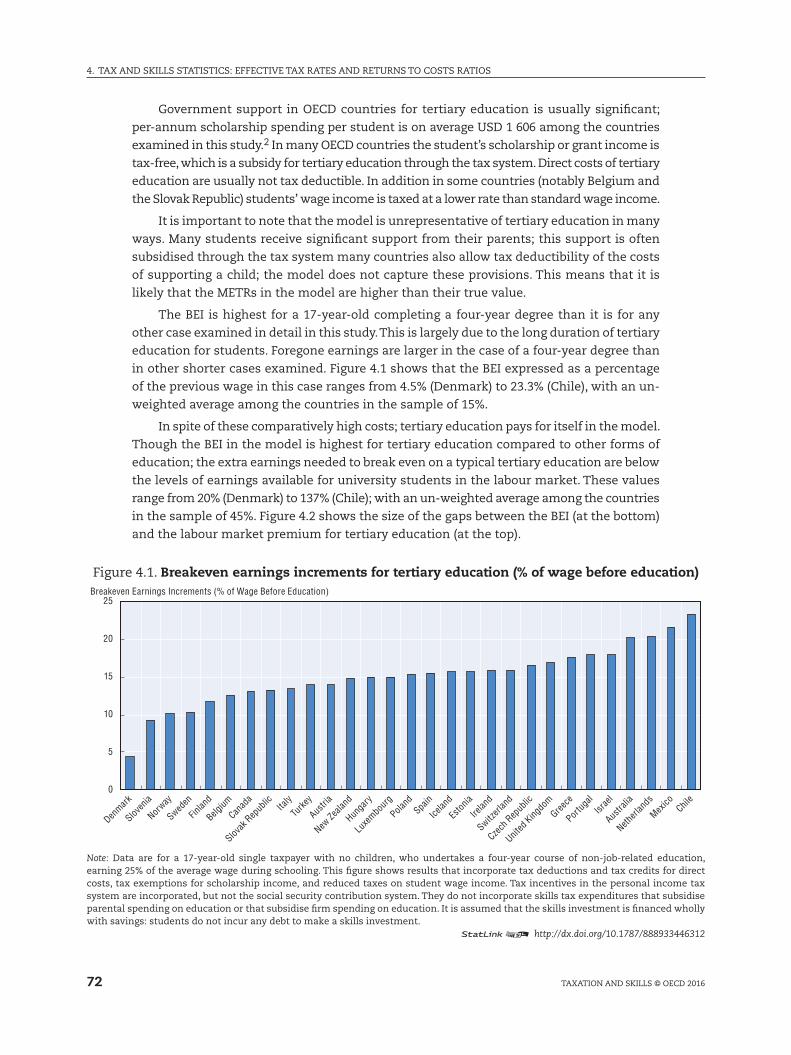
4. Tax anD SkIllS STaTISTICS: EffECTIvE Tax raTES anD rETurnS TO COSTS raTIOS
72 TaxaTIOn anD SkIllS © OECD 2016
Government support in OECD countries for tertiary education is usually significant;
per-annum scholarship spending per student is on average uSD 1 606 among the countries
examined in this study.2 In many OECD countries the student’s scholarship or grant income is
tax-free, which is a subsidy for tertiary education through the tax system. Direct costs of tertiary
education are usually not tax deductible. In addition in some countries (notably Belgium and
the Slovak republic) students’ wage income is taxed at a lower rate than standard wage income.
It is important to note that the model is unrepresentative of tertiary education in many
ways. Many students receive significant support from their parents; this support is often
subsidised through the tax system many countries also allow tax deductibility of the costs
of supporting a child; the model does not capture these provisions. This means that it is
likely that the METrs in the model are higher than their true value.
The BEI is highest for a 17-year-old completing a four-year degree than it is for any
other case examined in detail in this study. This is largely due to the long duration of tertiary
education for students. foregone earnings are larger in the case of a four-year degree than
in other shorter cases examined. figure 4.1 shows that the BEI expressed as a percentage
of the previous wage in this case ranges from 4.5% (Denmark) to 23.3% (Chile), with an un-
weighted average among the countries in the sample of 15%.
In spite of these comparatively high costs; tertiary education pays for itself in the model.
Though the BEI in the model is highest for tertiary education compared to other forms of
education; the extra earnings needed to break even on a typical tertiary education are below
the levels of earnings available for university students in the labour market. These values
range from 20% (Denmark) to 137% (Chile); with an un-weighted average among the countries
in the sample of 45%. figure 4.2 shows the size of the gaps between the BEI (at the bottom)
and the labour market premium for tertiary education (at the top).
figure 4.1. Breakeven earnings increments for tertiary education (% of wage before education)
0
5
10
15
20
25Breakeven Earnings Increments (% of Wage Before Education)
Denmark
Sloven
ia
Norway
Sweden
Finlan
d
Belgium
Canad
a
Slovak
Rep
ublic Ita
ly
Turke
y
Austri
a
New Ze
aland
Hunga
ry
Luxe
mbour
g
Poland
Spain
Icelan
d
Eston
ia
Irelan
d
Switzerl
and
Czech
Rep
ublic
United
Kingdo
mGree
ce
Portug
alIsr
ael
Austra
lia
Netherl
ands
Mexico Chil
e
Note: Data are for a 17-year-old single taxpayer with no children, who undertakes a four-year course of non-job-related education, earning 25% of the average wage during schooling. This figure shows results that incorporate tax deductions and tax credits for direct costs, tax exemptions for scholarship income, and reduced taxes on student wage income. Tax incentives in the personal income tax system are incorporated, but not the social security contribution system. They do not incorporate skills tax expenditures that subsidise parental spending on education or that subsidise firm spending on education. It is assumed that the skills investment is financed wholly with savings: students do not incur any debt to make a skills investment.
12 http://dx.doi.org/10.1787/888933446312
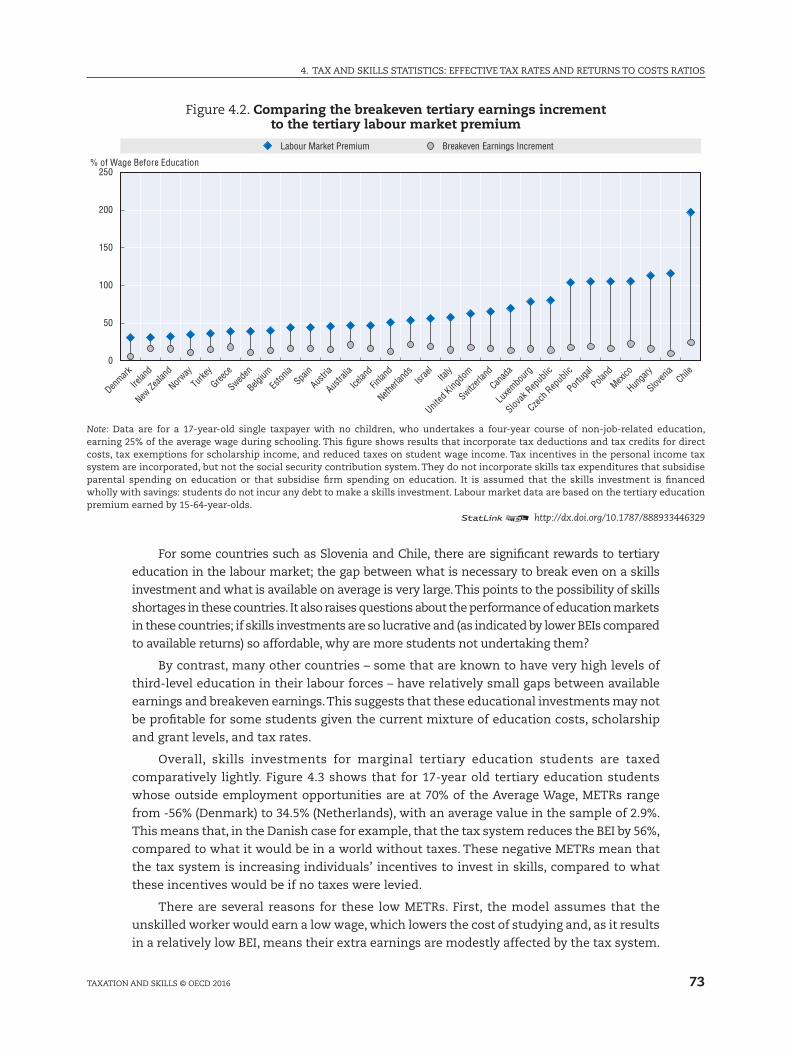
73
4. Tax anD SkIllS STaTISTICS: EffECTIvE Tax raTES anD rETurnS TO COSTS raTIOS
TaxaTIOn anD SkIllS © OECD 2016
figure 4.2. Comparing the breakeven tertiary earnings increment to the tertiary labour market premium
0
50
100
150
200
250% of Wage Before Education
Denmark
Irelan
d
New Ze
aland
Norway
Turke
y
Greece
Sweden
Belgium
Eston
iaSpa
in
Austria
Austra
lia
Icelan
d
Finlan
d
Netherl
ands
Israe
lIta
ly
United
Kingdo
m
Switzerl
and
Canad
a
Luxe
mbourg
Slovak
Rep
ublic
Czech
Rep
ublic
Portug
al
Poland
Mexico
Hunga
ry
Sloven
iaChil
e
Labour Market Premium Breakeven Earnings Increment
Note: Data are for a 17-year-old single taxpayer with no children, who undertakes a four-year course of non-job-related education, earning 25% of the average wage during schooling. This figure shows results that incorporate tax deductions and tax credits for direct costs, tax exemptions for scholarship income, and reduced taxes on student wage income. Tax incentives in the personal income tax system are incorporated, but not the social security contribution system. They do not incorporate skills tax expenditures that subsidise parental spending on education or that subsidise firm spending on education. It is assumed that the skills investment is financed wholly with savings: students do not incur any debt to make a skills investment. labour market data are based on the tertiary education premium earned by 15-64-year-olds.
12 http://dx.doi.org/10.1787/888933446329
for some countries such as Slovenia and Chile, there are significant rewards to tertiary
education in the labour market; the gap between what is necessary to break even on a skills
investment and what is available on average is very large. This points to the possibility of skills
shortages in these countries. It also raises questions about the performance of education markets
in these countries; if skills investments are so lucrative and (as indicated by lower BEIs compared
to available returns) so affordable, why are more students not undertaking them?
By contrast, many other countries – some that are known to have very high levels of
third-level education in their labour forces – have relatively small gaps between available
earnings and breakeven earnings. This suggests that these educational investments may not
be profitable for some students given the current mixture of education costs, scholarship
and grant levels, and tax rates.
Overall, skills investments for marginal tertiary education students are taxed
comparatively lightly. figure 4.3 shows that for 17-year old tertiary education students
whose outside employment opportunities are at 70% of the average Wage, METrs range
from -56% (Denmark) to 34.5% (netherlands), with an average value in the sample of 2.9%.
This means that, in the Danish case for example, that the tax system reduces the BEI by 56%,
compared to what it would be in a world without taxes. These negative METrs mean that
the tax system is increasing individuals’ incentives to invest in skills, compared to what
these incentives would be if no taxes were levied.
There are several reasons for these low METrs. first, the model assumes that the
unskilled worker would earn a low wage, which lowers the cost of studying and, as it results
in a relatively low BEI, means their extra earnings are modestly affected by the tax system.
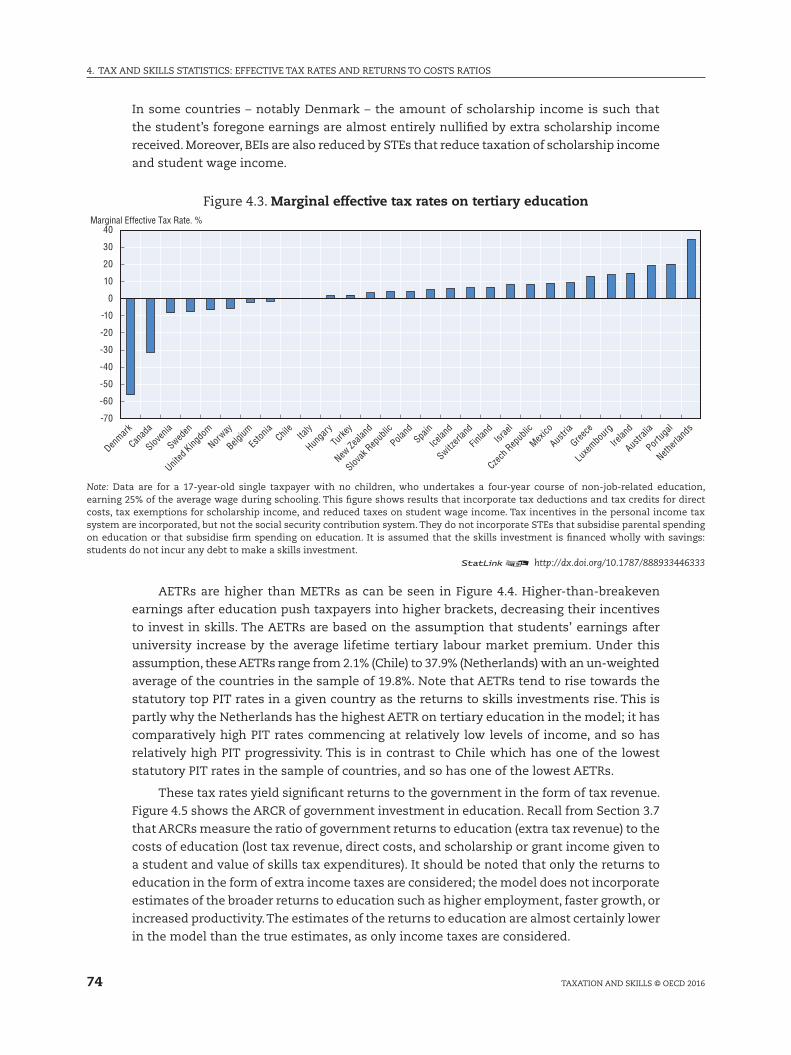
4. Tax anD SkIllS STaTISTICS: EffECTIvE Tax raTES anD rETurnS TO COSTS raTIOS
74 TaxaTIOn anD SkIllS © OECD 2016
In some countries – notably Denmark – the amount of scholarship income is such that
the student’s foregone earnings are almost entirely nullified by extra scholarship income
received. Moreover, BEIs are also reduced by STEs that reduce taxation of scholarship income
and student wage income.
figure 4.3. Marginal effective tax rates on tertiary educationMarginal Effective Tax Rate. %
Denmark
Canad
a
Sloven
ia
Sweden
United
Kingdo
m
Norway
Belgium
Eston
iaChil
eIta
ly
Hunga
ry
Turke
y
New Ze
aland
Slovak
Rep
ublic
Poland
Spain
Icelan
d
Switzerl
and
Finlan
dIsr
ael
Czech
Rep
ublic
Mexico
Austri
a
Greece
Luxe
mbour
g
Irelan
d
Austra
lia
Portug
al
Netherl
ands
-70
-60
-50
-40
-30
-20
-10
0
10
20
30
40
Note: Data are for a 17-year-old single taxpayer with no children, who undertakes a four-year course of non-job-related education, earning 25% of the average wage during schooling. This figure shows results that incorporate tax deductions and tax credits for direct costs, tax exemptions for scholarship income, and reduced taxes on student wage income. Tax incentives in the personal income tax system are incorporated, but not the social security contribution system. They do not incorporate STEs that subsidise parental spending on education or that subsidise firm spending on education. It is assumed that the skills investment is financed wholly with savings: students do not incur any debt to make a skills investment.
12 http://dx.doi.org/10.1787/888933446333
aETrs are higher than METrs as can be seen in figure 4.4. Higher-than-breakeven
earnings after education push taxpayers into higher brackets, decreasing their incentives
to invest in skills. The aETrs are based on the assumption that students’ earnings after
university increase by the average lifetime tertiary labour market premium. under this
assumption, these aETrs range from 2.1% (Chile) to 37.9% (netherlands) with an un-weighted
average of the countries in the sample of 19.8%. note that aETrs tend to rise towards the
statutory top PIT rates in a given country as the returns to skills investments rise. This is
partly why the netherlands has the highest aETr on tertiary education in the model; it has
comparatively high PIT rates commencing at relatively low levels of income, and so has
relatively high PIT progressivity. This is in contrast to Chile which has one of the lowest
statutory PIT rates in the sample of countries, and so has one of the lowest aETrs.
These tax rates yield significant returns to the government in the form of tax revenue.
figure 4.5 shows the arCr of government investment in education. recall from Section 3.7
that arCrs measure the ratio of government returns to education (extra tax revenue) to the
costs of education (lost tax revenue, direct costs, and scholarship or grant income given to
a student and value of skills tax expenditures). It should be noted that only the returns to
education in the form of extra income taxes are considered; the model does not incorporate
estimates of the broader returns to education such as higher employment, faster growth, or
increased productivity. The estimates of the returns to education are almost certainly lower
in the model than the true estimates, as only income taxes are considered.
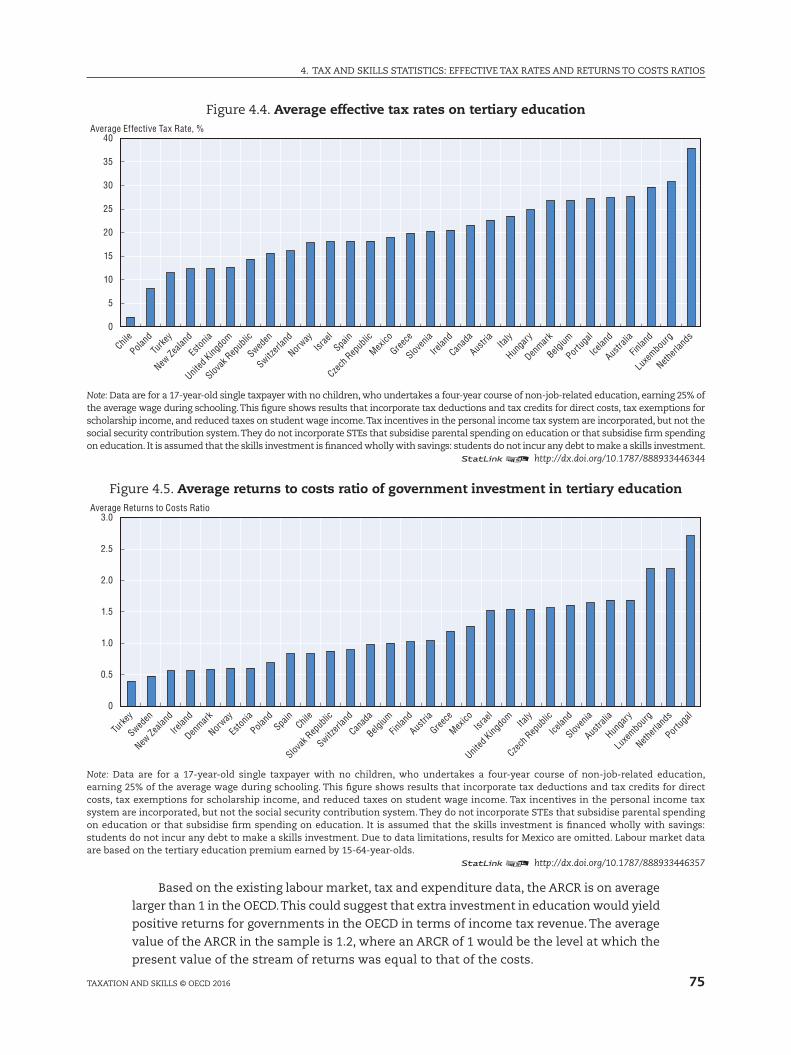
75
4. Tax anD SkIllS STaTISTICS: EffECTIvE Tax raTES anD rETurnS TO COSTS raTIOS
TaxaTIOn anD SkIllS © OECD 2016
figure 4.4. Average effective tax rates on tertiary education
0
5
10
15
20
25
30
35
40Average Effective Tax Rate, %
Chile
Poland
Turke
y
New Ze
aland
Eston
ia
United
Kingdo
m
Slovak
Rep
ublic
Sweden
Switzerl
and
Norway
Israe
lSpa
in
Czech
Rep
ublic
Mexico
Greece
Sloven
ia
Irelan
d
Canad
a
Austri
aIta
ly
Hunga
ry
Denmark
Belgium
Portug
al
Icelan
d
Austra
lia
Finlan
d
Luxe
mbour
g
Netherl
ands
Note: Data are for a 17-year-old single taxpayer with no children, who undertakes a four-year course of non-job-related education, earning 25% of the average wage during schooling. This figure shows results that incorporate tax deductions and tax credits for direct costs, tax exemptions for scholarship income, and reduced taxes on student wage income. Tax incentives in the personal income tax system are incorporated, but not the social security contribution system. They do not incorporate STEs that subsidise parental spending on education or that subsidise firm spending on education. It is assumed that the skills investment is financed wholly with savings: students do not incur any debt to make a skills investment.
12 http://dx.doi.org/10.1787/888933446344
figure 4.5. Average returns to costs ratio of government investment in tertiary education
0
0.5
1.0
1.5
2.0
2.5
3.0Average Returns to Costs Ratio
Turke
y
Sweden
New Ze
aland
Irelan
d
Denmark
Norway
Eston
ia
Poland
Spain
Chile
Slovak
Rep
ublic
Switzerl
and
Canad
a
Belgium
Finlan
d
Austri
a
Greece
Mexico
Israe
l
United
Kingdo
mIta
ly
Czech
Rep
ublic
Icelan
d
Sloven
ia
Austra
lia
Hunga
ry
Luxe
mbour
g
Netherl
ands
Portug
al
Note: Data are for a 17-year-old single taxpayer with no children, who undertakes a four-year course of non-job-related education, earning 25% of the average wage during schooling. This figure shows results that incorporate tax deductions and tax credits for direct costs, tax exemptions for scholarship income, and reduced taxes on student wage income. Tax incentives in the personal income tax system are incorporated, but not the social security contribution system. They do not incorporate STEs that subsidise parental spending on education or that subsidise firm spending on education. It is assumed that the skills investment is financed wholly with savings: students do not incur any debt to make a skills investment. Due to data limitations, results for Mexico are omitted. labour market data are based on the tertiary education premium earned by 15-64-year-olds.
12 http://dx.doi.org/10.1787/888933446357
Based on the existing labour market, tax and expenditure data, the arCr is on average
larger than 1 in the OECD. This could suggest that extra investment in education would yield
positive returns for governments in the OECD in terms of income tax revenue. The average
value of the arCr in the sample is 1.2, where an arCr of 1 would be the level at which the
present value of the stream of returns was equal to that of the costs.
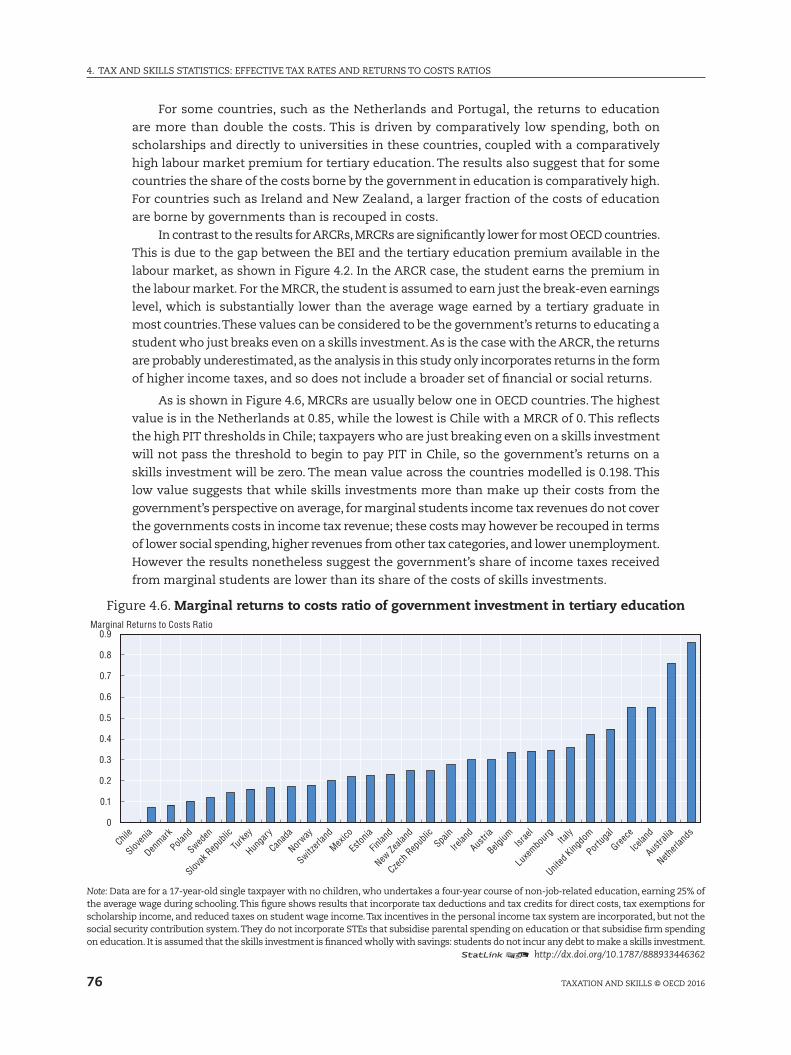
4. Tax anD SkIllS STaTISTICS: EffECTIvE Tax raTES anD rETurnS TO COSTS raTIOS
76 TaxaTIOn anD SkIllS © OECD 2016
for some countries, such as the netherlands and Portugal, the returns to education
are more than double the costs. This is driven by comparatively low spending, both on
scholarships and directly to universities in these countries, coupled with a comparatively
high labour market premium for tertiary education. The results also suggest that for some
countries the share of the costs borne by the government in education is comparatively high.
for countries such as Ireland and new Zealand, a larger fraction of the costs of education
are borne by governments than is recouped in costs.
In contrast to the results for arCrs, MrCrs are significantly lower for most OECD countries.
This is due to the gap between the BEI and the tertiary education premium available in the
labour market, as shown in figure 4.2. In the arCr case, the student earns the premium in
the labour market. for the MrCr, the student is assumed to earn just the break-even earnings
level, which is substantially lower than the average wage earned by a tertiary graduate in
most countries. These values can be considered to be the government’s returns to educating a
student who just breaks even on a skills investment. as is the case with the arCr, the returns
are probably underestimated, as the analysis in this study only incorporates returns in the form
of higher income taxes, and so does not include a broader set of financial or social returns.
as is shown in figure 4.6, MrCrs are usually below one in OECD countries. The highest
value is in the netherlands at 0.85, while the lowest is Chile with a MrCr of 0. This reflects
the high PIT thresholds in Chile; taxpayers who are just breaking even on a skills investment
will not pass the threshold to begin to pay PIT in Chile, so the government’s returns on a
skills investment will be zero. The mean value across the countries modelled is 0.198. This
low value suggests that while skills investments more than make up their costs from the
government’s perspective on average, for marginal students income tax revenues do not cover
the governments costs in income tax revenue; these costs may however be recouped in terms
of lower social spending, higher revenues from other tax categories, and lower unemployment.
However the results nonetheless suggest the government’s share of income taxes received
from marginal students are lower than its share of the costs of skills investments.
figure 4.6. Marginal returns to costs ratio of government investment in tertiary education
0
0.1
0.2
0.3
0.4
0.5
0.6
0.7
0.8
0.9Marginal Returns to Costs Ratio
Chile
Sloven
ia
Denmark
Poland
Sweden
Slovak
Rep
ublic
Turke
y
Hunga
ry
Canad
a
Norway
Switzerl
and
Mexico
Eston
ia
Finlan
d
New Ze
aland
Czech
Rep
ublic
Spain
Irelan
d
Austri
a
Belgium Isr
ael
Luxe
mbour
gIta
ly
United
Kingdo
m
Portug
al
Greece
Icelan
d
Austra
lia
Netherl
ands
Note: Data are for a 17-year-old single taxpayer with no children, who undertakes a four-year course of non-job-related education, earning 25% of the average wage during schooling. This figure shows results that incorporate tax deductions and tax credits for direct costs, tax exemptions for scholarship income, and reduced taxes on student wage income. Tax incentives in the personal income tax system are incorporated, but not the social security contribution system. They do not incorporate STEs that subsidise parental spending on education or that subsidise firm spending on education. It is assumed that the skills investment is financed wholly with savings: students do not incur any debt to make a skills investment.
12 http://dx.doi.org/10.1787/888933446362
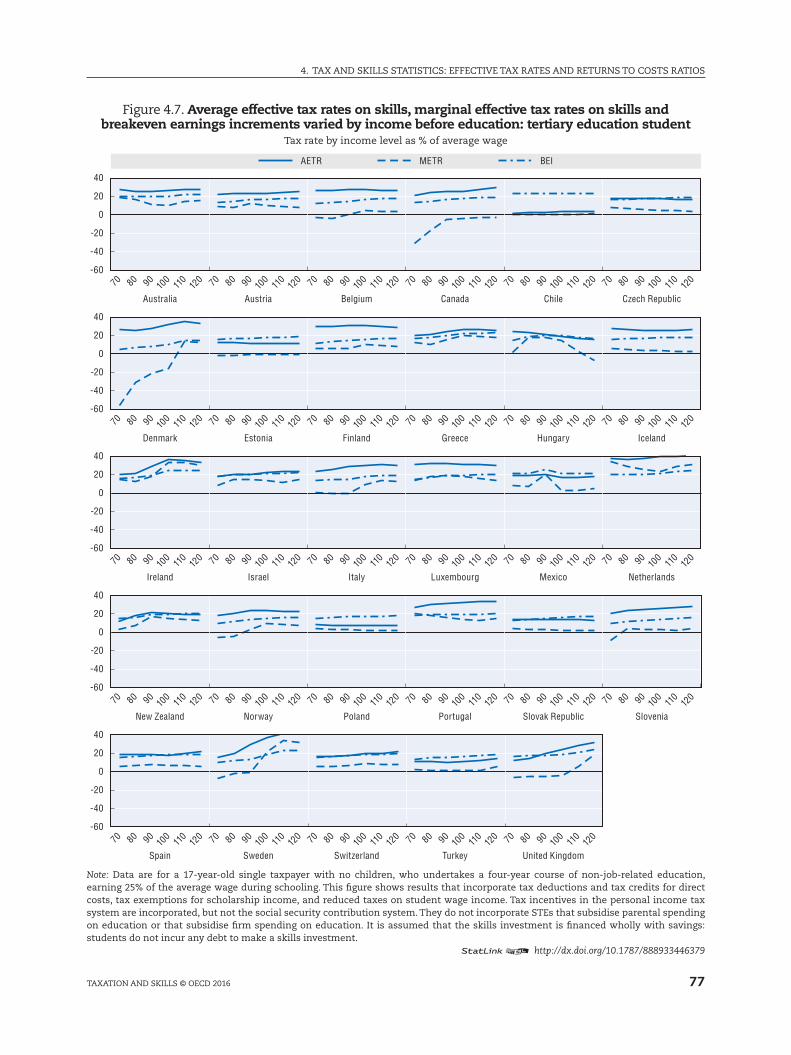
77
4. Tax anD SkIllS STaTISTICS: EffECTIvE Tax raTES anD rETurnS TO COSTS raTIOS
TaxaTIOn anD SkIllS © OECD 2016
figure 4.7. Average effective tax rates on skills, marginal effective tax rates on skills and breakeven earnings increments varied by income before education: tertiary education student
Tax rate by income level as % of average wage
70 80 9010
012
011
0
40
20
0
-20
-40
-60
40
20
0
-20
-40
-60
40
20
0
-20
-40
-60
40
20
0
-20
-40
-60
40
20
0
-20
-40
-60
70 80 9010
012
011
0 70 80 9010
012
011
0 70 80 9010
012
011
0 70 80 9010
012
011
0 70 80 9010
012
011
0
70 80 9010
012
011
0 70 80 9010
012
011
0 70 80 9010
012
011
0 70 80 9010
012
011
0 70 80 9010
012
011
0 70 80 9010
012
011
0
70 80 9010
012
011
0 70 80 9010
012
011
0 70 80 9010
012
011
0 70 80 9010
012
011
0 70 80 9010
012
011
0 70 80 9010
012
011
0
70 80 9010
012
011
0 70 80 9010
012
011
0 70 80 9010
012
011
0 70 80 9010
012
011
0 70 80 9010
012
011
0 70 80 9010
012
011
0
70 80 9010
012
011
0 70 80 9010
012
011
0 70 80 9010
012
011
0 70 80 9010
012
011
0 70 80 9010
012
011
0
Australia Austria Belgium Canada Chile Czech Republic
Estonia Finland Greece Hungary Iceland
Italy Luxembourg Mexico Netherlands
Portugal
United Kingdom
Slovak Republic Slovenia
Denmark
Ireland Israel
New Zealand Norway Poland
Spain Sweden Switzerland Turkey
AETR METR BEI
Note: Data are for a 17-year-old single taxpayer with no children, who undertakes a four-year course of non-job-related education, earning 25% of the average wage during schooling. This figure shows results that incorporate tax deductions and tax credits for direct costs, tax exemptions for scholarship income, and reduced taxes on student wage income. Tax incentives in the personal income tax system are incorporated, but not the social security contribution system. They do not incorporate STEs that subsidise parental spending on education or that subsidise firm spending on education. It is assumed that the skills investment is financed wholly with savings: students do not incur any debt to make a skills investment.
12 http://dx.doi.org/10.1787/888933446379
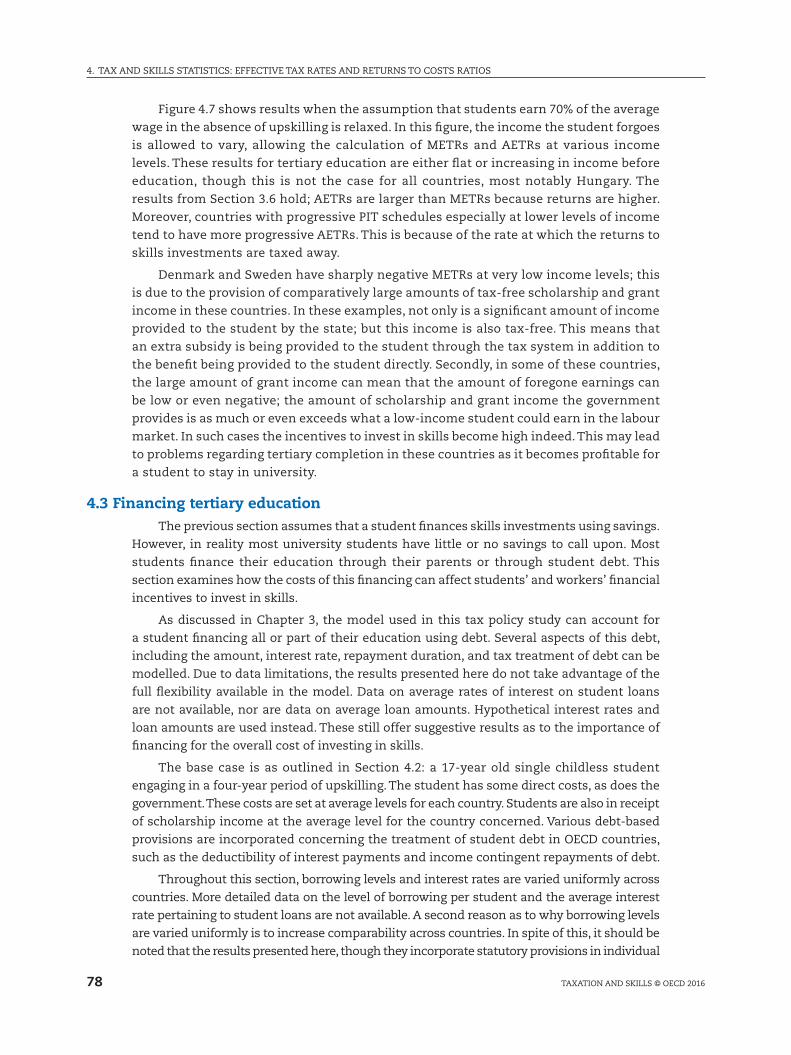
4. Tax anD SkIllS STaTISTICS: EffECTIvE Tax raTES anD rETurnS TO COSTS raTIOS
78 TaxaTIOn anD SkIllS © OECD 2016
figure 4.7 shows results when the assumption that students earn 70% of the average
wage in the absence of upskilling is relaxed. In this figure, the income the student forgoes
is allowed to vary, allowing the calculation of METrs and aETrs at various income
levels. These results for tertiary education are either flat or increasing in income before
education, though this is not the case for all countries, most notably Hungary. The
results from Section 3.6 hold; aETrs are larger than METrs because returns are higher.
Moreover, countries with progressive PIT schedules especially at lower levels of income
tend to have more progressive aETrs. This is because of the rate at which the returns to
skills investments are taxed away.
Denmark and Sweden have sharply negative METrs at very low income levels; this
is due to the provision of comparatively large amounts of tax-free scholarship and grant
income in these countries. In these examples, not only is a significant amount of income
provided to the student by the state; but this income is also tax-free. This means that
an extra subsidy is being provided to the student through the tax system in addition to
the benefit being provided to the student directly. Secondly, in some of these countries,
the large amount of grant income can mean that the amount of foregone earnings can
be low or even negative; the amount of scholarship and grant income the government
provides is as much or even exceeds what a low-income student could earn in the labour
market. In such cases the incentives to invest in skills become high indeed. This may lead
to problems regarding tertiary completion in these countries as it becomes profitable for
a student to stay in university.
4.3 Financing tertiary educationThe previous section assumes that a student finances skills investments using savings.
However, in reality most university students have little or no savings to call upon. Most
students finance their education through their parents or through student debt. This
section examines how the costs of this financing can affect students’ and workers’ financial
incentives to invest in skills.
as discussed in Chapter 3, the model used in this tax policy study can account for
a student financing all or part of their education using debt. Several aspects of this debt,
including the amount, interest rate, repayment duration, and tax treatment of debt can be
modelled. Due to data limitations, the results presented here do not take advantage of the
full flexibility available in the model. Data on average rates of interest on student loans
are not available, nor are data on average loan amounts. Hypothetical interest rates and
loan amounts are used instead. These still offer suggestive results as to the importance of
financing for the overall cost of investing in skills.
The base case is as outlined in Section 4.2: a 17-year old single childless student
engaging in a four-year period of upskilling. The student has some direct costs, as does the
government. These costs are set at average levels for each country. Students are also in receipt
of scholarship income at the average level for the country concerned. various debt-based
provisions are incorporated concerning the treatment of student debt in OECD countries,
such as the deductibility of interest payments and income contingent repayments of debt.
Throughout this section, borrowing levels and interest rates are varied uniformly across
countries. More detailed data on the level of borrowing per student and the average interest
rate pertaining to student loans are not available. a second reason as to why borrowing levels
are varied uniformly is to increase comparability across countries. In spite of this, it should be
noted that the results presented here, though they incorporate statutory provisions in individual
79
4. Tax anD SkIllS STaTISTICS: EffECTIvE Tax raTES anD rETurnS TO COSTS raTIOS
TaxaTIOn anD SkIllS © OECD 2016
countries concerning the tax treatment of student debt and the structure of repayments, are
not representative of any particular country in terms of average debt levels or interest rates.
figure 4.8 shows how these financing costs impact the overall costs of skills investments.
In this figure it is assumed that the student can borrow at a nominal interest rate of 6%, which
in the model corresponds to a real rate of 4%. Having to borrow to finance the cost of education
raises the BEI substantially; the student must earn more to pay interest on student debt in
addition to whatever other costs they must earn to break even on their skills investment.
The black squares show the BEIs with no borrowing; these are the same BEIs as outlined
in figures 4.1 and 4.2. The blue triangles show BEIs when the student borrows just the direct
costs of a skills investment. These costs are taken from Education at Glance (OECD, 2014):
details are given in Box 3.1 in Chapter 3. These costs are roughly analogous to the student
borrowing tuition fees to finance their education. BEIs rise most in these circumstances where
private direct costs are high for students. This means that countries such as Chile have large
gaps between black squares (BEIs with no borrowing) and blue triangles (BEIs where direct
costs are borrowed). By contrast, in countries where direct costs for the individual student
are modest, the amount of borrowing is modest too. In these cases the BEI does not rise
much as the amount of debt incurred is low.
The circles in figure 4.8 show the BEIs when students borrow not just these direct costs
of their education, but rather the entirety of the costs: they borrow their after-tax foregone
earnings as well. This can be thought of as analogous to a situation in which a student
borrows not just to pay tuition fees but also to maintain their standard of living at a level
that they would have had if they had worked instead of entering the workforce. The circles
are substantially higher than the black squares in figure 4.8, sometimes double in size. These
BEIs can rise to up to 33% (Chile).
figure 4.8. Breakeven earnings increments for a tertiary education student at a 6% nominal interest rate
-3
2
7
12
17
22
27
32
Denmark
Sloven
ia
Norway
Sweden
Finlan
d
Belgium
Canad
a
Slovak
Repub
lic Italy
Turke
y
Austria
New Ze
aland
Hunga
ry
Luxe
mbourg
Poland
Spain
Icelan
d
Eston
ia
Irelan
d
Switzerl
and
Czech R
epub
lic
United
Kingdo
mGree
ce
Portug
alIsr
ael
Austra
lia
Netherl
ands
Mexico Chil
e
No Borrowing Direct Costs Borrowed All Costs Borrowed
Breakeven Earnings Increments (% of Wage Before Education)
Note: Data are for a 17-year-old single taxpayer with no children, who undertakes a four-year course of non-job-related education, earning 25% of the average wage during schooling. This figure shows results that incorporate tax deductions and tax credits for direct costs, tax exemptions for scholarship income, and reduced taxes on student wage income. Tax incentives in the personal income tax system are incorporated, but not the social security contribution system. They do not incorporate STEs that subsidise parental spending on education or that subsidise firm spending on education. This figure does not incorporate interest deductibility of student loans in finland.
12 http://dx.doi.org/10.1787/888933446387
4. Tax anD SkIllS STaTISTICS: EffECTIvE Tax raTES anD rETurnS TO COSTS raTIOS
80 TaxaTIOn anD SkIllS © OECD 2016
an exception to this pattern is the circle for australia, which illustrates the effect
of the australian income contingent loan scheme.3 In the australian case, students do
not repay any part of their loan unless their earnings pass a certain threshold. In this
modelling, a marginal student who earns 70% of the average wage in australia will not
pass the threshold to begin repaying their loans, and will so not need to pay back their
loans. This is because an amount that is 70% of the average wage plus the BEI does not add
up to enough to pass the threshold for repayment. This means that the costs of a skills
investment is essentially zero, though these costs will rise if they move up the income
distribution. It is important to note that in the case where australian students borrow
a lower fraction of the total cost of their education, they may still benefit as their loan
principal will be written down, but as their borrowing will be low, they will not benefit
as much they would if they had borrowed all of their costs. It should be noted that this
modelling pertains to 2011; average wages, thresholds and other features of the policy
may have changed in australia.
These results illustrate several points. first, student debt, when the interest rate is
sufficiently high, can act as a significant barrier to upskilling, in some cases nearly doubling
the required earnings level at which a student can breakeven. Without knowing details on
interest rates that students face in OECD countries it is not possible to determine the exact
size of this barrier, however it is worth noting that the BEIs in this model are very sensitive
to the amount borrowed.
a second point worth noting is that the impact of borrowing on the BEI is much larger
when lost earnings are borrowed than when just direct costs are borrowed. This highlights the
importance of the mix of education costs in determining the financial barriers to investing
in skills. Some students receive support in kind for day-to-day living expenses from parents.
This means that they do not have to borrow to finance their living expenses during periods
of upskilling. In such cases the barriers to educational investment in terms of the returns
that must be earned post-education are reduced substantially. The results highlight that
the implications of these in-kind benefits should not be underestimated.
figure 4.9 shows the impact of differing levels of borrowing on BEIs for university
students. The difference in this figure compared to figure 4.8 is the real interest rate
faced by students. Many countries, such as australia and the united kingdom offer
students low-interest rate loans. This example examines these kinds of provisions. In
the results shown in figure 4.9 the student can borrow at a 0% real interest rate. The
results are instructive; where a student can borrow cheaply the BEIs falls by a significant
margin. again the difference is apparent with varying borrowing levels. Where direct
costs for students are large, reduced interest rates even on direct costs alone reduce BEIs
substantially. However, for most countries, having students borrow just the direct costs
of their education at a reduced rate does not affect their costs of education to a large
extent. It nonetheless does lower the BEI below the level of the BEI for a skills investment
financed with savings.
Where the full costs of education are borrowed, figure 4.9 shows that BEIs can fall
dramatically. It is important to realise the impact of reduced borrowing rates on BEIs
in the model. In the model developed in this study, a key component of the BEI is the
opportunity cost of the funds directed towards a skills investment.4 Students who choose
to spend savings on a skills investment must not only recoup back those savings, but
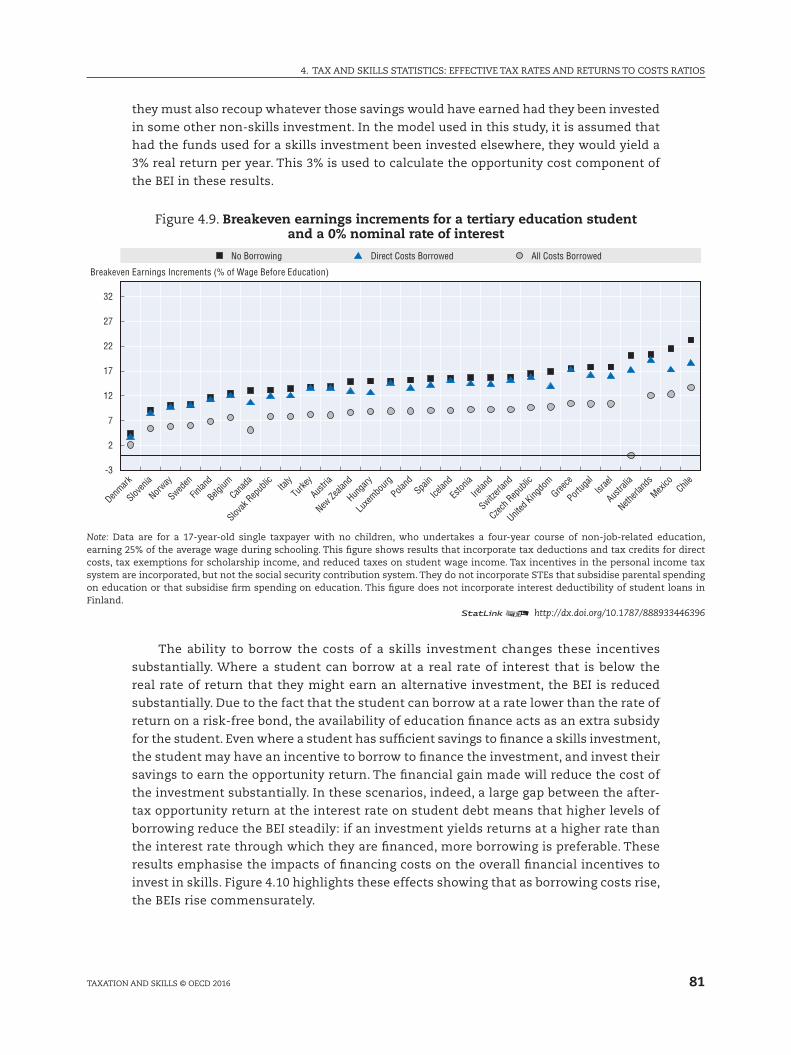
81
4. Tax anD SkIllS STaTISTICS: EffECTIvE Tax raTES anD rETurnS TO COSTS raTIOS
TaxaTIOn anD SkIllS © OECD 2016
they must also recoup whatever those savings would have earned had they been invested
in some other non-skills investment. In the model used in this study, it is assumed that
had the funds used for a skills investment been invested elsewhere, they would yield a
3% real return per year. This 3% is used to calculate the opportunity cost component of
the BEI in these results.
figure 4.9. Breakeven earnings increments for a tertiary education student and a 0% nominal rate of interest
-3
2
7
12
17
22
27
32
No Borrowing Direct Costs Borrowed All Costs Borrowed
Breakeven Earnings Increments (% of Wage Before Education)
Denmark
Sloven
ia
Norway
Sweden
Finlan
d
Belgium
Canad
a
Slovak
Repub
lic Italy
Turke
y
Austria
New Ze
aland
Hunga
ry
Luxe
mbourg
Poland
Spain
Icelan
d
Eston
ia
Irelan
d
Switzerl
and
Czech R
epub
lic
United
Kingdo
mGree
ce
Portug
alIsr
ael
Austra
lia
Netherl
ands
Mexico Chil
e
Note: Data are for a 17-year-old single taxpayer with no children, who undertakes a four-year course of non-job-related education, earning 25% of the average wage during schooling. This figure shows results that incorporate tax deductions and tax credits for direct costs, tax exemptions for scholarship income, and reduced taxes on student wage income. Tax incentives in the personal income tax system are incorporated, but not the social security contribution system. They do not incorporate STEs that subsidise parental spending on education or that subsidise firm spending on education. This figure does not incorporate interest deductibility of student loans in finland.
12 http://dx.doi.org/10.1787/888933446396
The ability to borrow the costs of a skills investment changes these incentives
substantially. Where a student can borrow at a real rate of interest that is below the
real rate of return that they might earn an alternative investment, the BEI is reduced
substantially. Due to the fact that the student can borrow at a rate lower than the rate of
return on a risk-free bond, the availability of education finance acts as an extra subsidy
for the student. Even where a student has sufficient savings to finance a skills investment,
the student may have an incentive to borrow to finance the investment, and invest their
savings to earn the opportunity return. The financial gain made will reduce the cost of
the investment substantially. In these scenarios, indeed, a large gap between the after-
tax opportunity return at the interest rate on student debt means that higher levels of
borrowing reduce the BEI steadily: if an investment yields returns at a higher rate than
the interest rate through which they are financed, more borrowing is preferable. These
results emphasise the impacts of financing costs on the overall financial incentives to
invest in skills. figure 4.10 highlights these effects showing that as borrowing costs rise,
the BEIs rise commensurately.
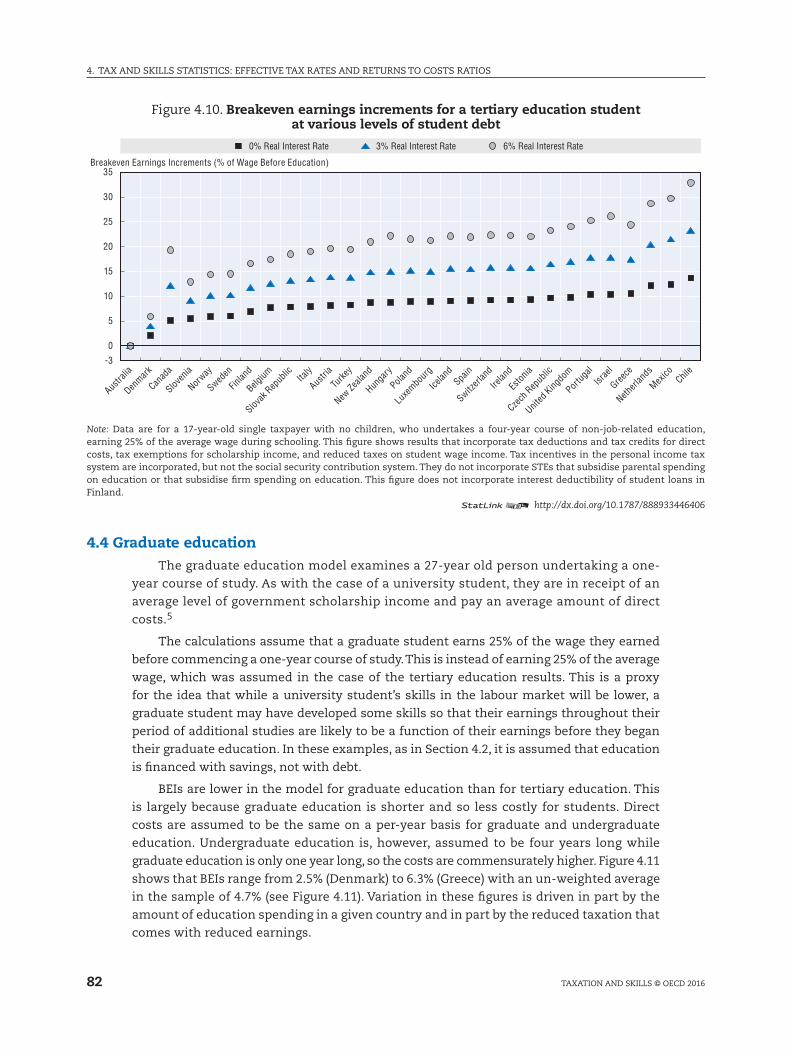
4. Tax anD SkIllS STaTISTICS: EffECTIvE Tax raTES anD rETurnS TO COSTS raTIOS
82 TaxaTIOn anD SkIllS © OECD 2016
figure 4.10. Breakeven earnings increments for a tertiary education student at various levels of student debt
-3
0
5
10
15
20
25
30
35Breakeven Earnings Increments (% of Wage Before Education)
0% Real Interest Rate 3% Real Interest Rate 6% Real Interest Rate
Austra
lia
Denmark
Canad
a
Sloven
ia
Norway
Sweden
Finlan
d
Belgium
Slovak
Rep
ublic Ita
ly
Austri
a
Turke
y
New Ze
aland
Hunga
ry
Poland
Luxe
mbour
g
Icelan
dSpa
in
Switzerl
and
Irelan
d
Eston
ia
Czech
Rep
ublic
United
Kingdo
m
Portug
alIsr
ael
Greece
Netherl
ands
Mexico Chil
e
Note: Data are for a 17-year-old single taxpayer with no children, who undertakes a four-year course of non-job-related education, earning 25% of the average wage during schooling. This figure shows results that incorporate tax deductions and tax credits for direct costs, tax exemptions for scholarship income, and reduced taxes on student wage income. Tax incentives in the personal income tax system are incorporated, but not the social security contribution system. They do not incorporate STEs that subsidise parental spending on education or that subsidise firm spending on education. This figure does not incorporate interest deductibility of student loans in finland.
12 http://dx.doi.org/10.1787/888933446406
4.4 Graduate educationThe graduate education model examines a 27-year old person undertaking a one-
year course of study. as with the case of a university student, they are in receipt of an
average level of government scholarship income and pay an average amount of direct
costs.5
The calculations assume that a graduate student earns 25% of the wage they earned
before commencing a one-year course of study. This is instead of earning 25% of the average
wage, which was assumed in the case of the tertiary education results. This is a proxy
for the idea that while a university student’s skills in the labour market will be lower, a
graduate student may have developed some skills so that their earnings throughout their
period of additional studies are likely to be a function of their earnings before they began
their graduate education. In these examples, as in Section 4.2, it is assumed that education
is financed with savings, not with debt.
BEIs are lower in the model for graduate education than for tertiary education. This
is largely because graduate education is shorter and so less costly for students. Direct
costs are assumed to be the same on a per-year basis for graduate and undergraduate
education. undergraduate education is, however, assumed to be four years long while
graduate education is only one year long, so the costs are commensurately higher. figure 4.11
shows that BEIs range from 2.5% (Denmark) to 6.3% (Greece) with an un-weighted average
in the sample of 4.7% (see figure 4.11). variation in these figures is driven in part by the
amount of education spending in a given country and in part by the reduced taxation that
comes with reduced earnings.
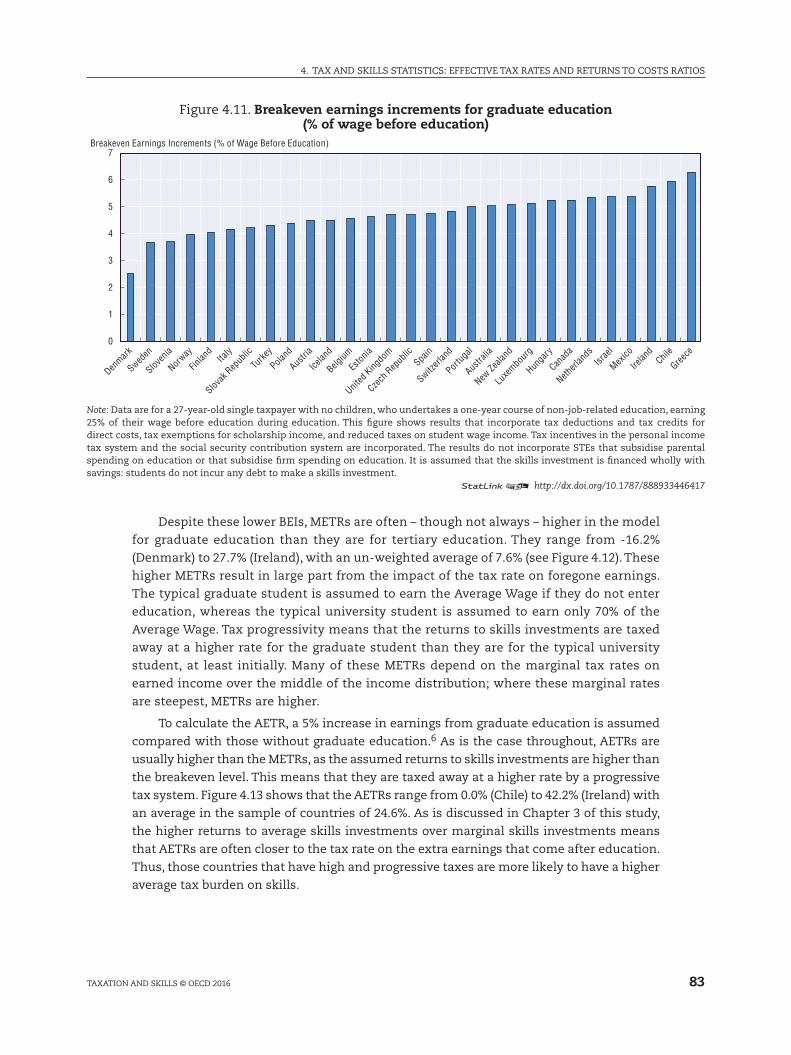
83
4. Tax anD SkIllS STaTISTICS: EffECTIvE Tax raTES anD rETurnS TO COSTS raTIOS
TaxaTIOn anD SkIllS © OECD 2016
figure 4.11. Breakeven earnings increments for graduate education (% of wage before education)
0
1
2
3
4
5
6
7Breakeven Earnings Increments (% of Wage Before Education)
Denmark
Sweden
Sloven
ia
Norway
Finlan
dIta
ly
Slovak
Rep
ublic
Turke
y
Poland
Austri
a
Icelan
d
Belgium
Eston
ia
United
Kingdo
m
Czech
Rep
ublic
Spain
Switzerl
and
Portug
al
Austra
lia
New Ze
aland
Luxe
mbour
g
Hunga
ry
Canad
a
Netherl
ands
Israe
l
Mexico
Irelan
dChil
e
Greece
Note: Data are for a 27-year-old single taxpayer with no children, who undertakes a one-year course of non-job-related education, earning 25% of their wage before education during education. This figure shows results that incorporate tax deductions and tax credits for direct costs, tax exemptions for scholarship income, and reduced taxes on student wage income. Tax incentives in the personal income tax system and the social security contribution system are incorporated. The results do not incorporate STEs that subsidise parental spending on education or that subsidise firm spending on education. It is assumed that the skills investment is financed wholly with savings: students do not incur any debt to make a skills investment.
12 http://dx.doi.org/10.1787/888933446417
Despite these lower BEIs, METrs are often – though not always – higher in the model
for graduate education than they are for tertiary education. They range from -16.2%
(Denmark) to 27.7% (Ireland), with an un-weighted average of 7.6% (see figure 4.12). These
higher METrs result in large part from the impact of the tax rate on foregone earnings.
The typical graduate student is assumed to earn the average Wage if they do not enter
education, whereas the typical university student is assumed to earn only 70% of the
average Wage. Tax progressivity means that the returns to skills investments are taxed
away at a higher rate for the graduate student than they are for the typical university
student, at least initially. Many of these METrs depend on the marginal tax rates on
earned income over the middle of the income distribution; where these marginal rates
are steepest, METrs are higher.
To calculate the aETr, a 5% increase in earnings from graduate education is assumed
compared with those without graduate education.6 as is the case throughout, aETrs are
usually higher than the METrs, as the assumed returns to skills investments are higher than
the breakeven level. This means that they are taxed away at a higher rate by a progressive
tax system. figure 4.13 shows that the aETrs range from 0.0% (Chile) to 42.2% (Ireland) with
an average in the sample of countries of 24.6%. as is discussed in Chapter 3 of this study,
the higher returns to average skills investments over marginal skills investments means
that aETrs are often closer to the tax rate on the extra earnings that come after education.
Thus, those countries that have high and progressive taxes are more likely to have a higher
average tax burden on skills.
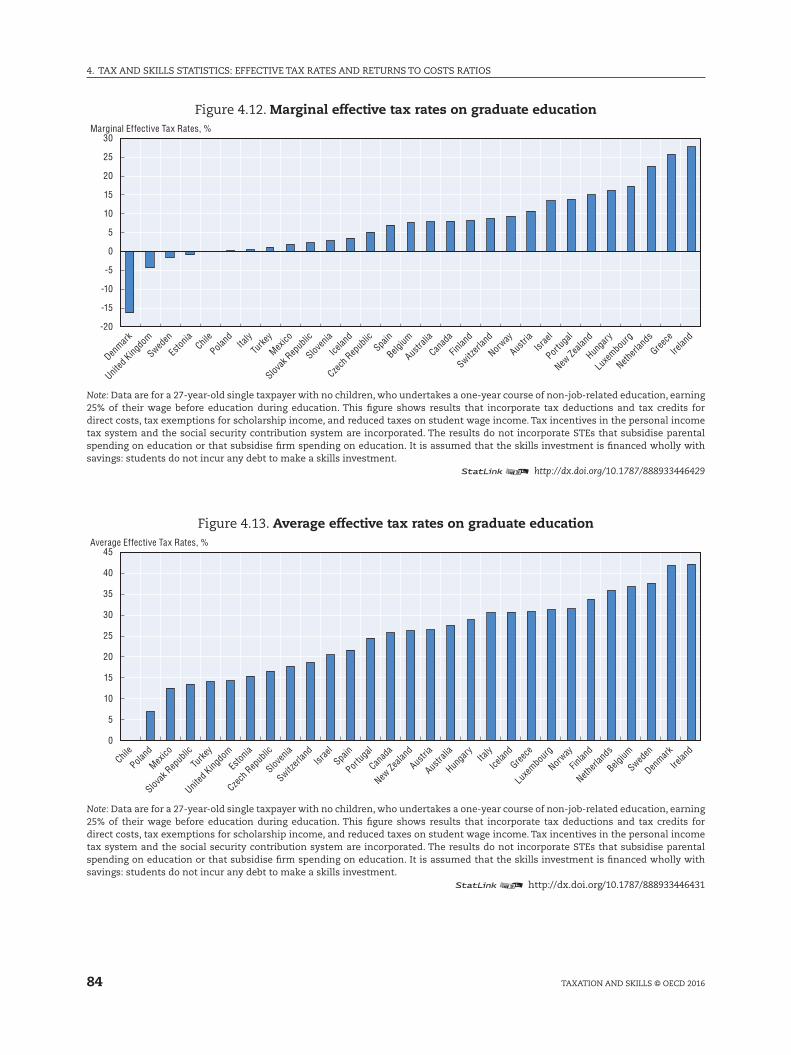
4. Tax anD SkIllS STaTISTICS: EffECTIvE Tax raTES anD rETurnS TO COSTS raTIOS
84 TaxaTIOn anD SkIllS © OECD 2016
figure 4.12. Marginal effective tax rates on graduate education
-20
-15
-10
-5
0
5
10
15
20
25
30Marginal Effective Tax Rates, %
Denmark
United
Kingdo
m
Sweden
Eston
iaChil
e
Poland Ita
ly
Turke
y
Mexico
Slovak
Rep
ublic
Sloven
ia
Icelan
d
Czech
Rep
ublic
Spain
Belgium
Austra
lia
Canad
a
Finlan
d
Switzerl
and
Norway
Austri
aIsr
ael
Portug
al
New Ze
aland
Hunga
ry
Luxe
mbour
g
Netherl
ands
Greece
Irelan
d
Note: Data are for a 27-year-old single taxpayer with no children, who undertakes a one-year course of non-job-related education, earning 25% of their wage before education during education. This figure shows results that incorporate tax deductions and tax credits for direct costs, tax exemptions for scholarship income, and reduced taxes on student wage income. Tax incentives in the personal income tax system and the social security contribution system are incorporated. The results do not incorporate STEs that subsidise parental spending on education or that subsidise firm spending on education. It is assumed that the skills investment is financed wholly with savings: students do not incur any debt to make a skills investment.
12 http://dx.doi.org/10.1787/888933446429
figure 4.13. Average effective tax rates on graduate education
0
5
10
15
20
25
30
35
40
45Average Effective Tax Rates, %
Chile
Poland
Mexico
Slovak
Rep
ublic
Turke
y
United
Kingdo
m
Eston
ia
Czech
Rep
ublic
Sloven
ia
Switzerl
and
Israe
lSpa
in
Portug
al
Canad
a
New Ze
aland
Austri
a
Austra
lia
Hunga
ryIta
ly
Icelan
d
Greece
Luxe
mbour
g
Norway
Finlan
d
Netherl
ands
Belgium
Sweden
Denmark
Irelan
d
Note: Data are for a 27-year-old single taxpayer with no children, who undertakes a one-year course of non-job-related education, earning 25% of their wage before education during education. This figure shows results that incorporate tax deductions and tax credits for direct costs, tax exemptions for scholarship income, and reduced taxes on student wage income. Tax incentives in the personal income tax system and the social security contribution system are incorporated. The results do not incorporate STEs that subsidise parental spending on education or that subsidise firm spending on education. It is assumed that the skills investment is financed wholly with savings: students do not incur any debt to make a skills investment.
12 http://dx.doi.org/10.1787/888933446431

85
4. Tax anD SkIllS STaTISTICS: EffECTIvE Tax raTES anD rETurnS TO COSTS raTIOS
TaxaTIOn anD SkIllS © OECD 2016
figure 4.14. Average effective tax rates on skills, marginal effective tax rates on skills and breakeven earnings increments varied by income before education: graduate student
Tax rate by income level as % of average wage
70 80 9010
012
011
0
40
20
0
-20
-40
-60
40
20
0
-20
-40
-60
40
20
0
-20
-40
-60
40
20
0
-20
-40
-60
40
20
0
-20
-40
-60
70 80 9010
012
011
0 70 80 9010
012
011
0 70 80 9010
012
011
0 70 80 9010
012
011
0 70 80 9010
012
011
0
70 80 9010
012
011
0 70 80 9010
012
011
0 70 80 9010
012
011
0 70 80 9010
012
011
0 70 80 9010
012
011
0 70 80 9010
012
011
0
70 80 9010
012
011
0 70 80 9010
012
011
0 70 80 9010
012
011
0 70 80 9010
012
011
0 70 80 9010
012
011
0 70 80 9010
012
011
0
70 80 9010
012
011
0 70 80 9010
012
011
0 70 80 9010
012
011
0 70 80 9010
012
011
0 70 80 9010
012
011
0 70 80 9010
012
011
0
70 80 9010
012
011
0 70 80 9010
012
011
0 70 80 9010
012
011
0 70 80 9010
012
011
0 70 80 9010
012
011
0
Australia Austria Belgium Canada Chile Czech Republic
Estonia Finland Greece Hungary Iceland
Italy Luxembourg Mexico Netherlands
Portugal
United Kingdom
Slovak Republic Slovenia
Denmark
Ireland Israel
New Zealand Norway Poland
Spain Sweden Switzerland Turkey
AETR METR BEI
Note: Data are for a 27-year-old single taxpayer with no children, who undertakes a one-year course of non-job-related education, earning 25% of their wage before education during education. This figure shows results that incorporate tax deductions and tax credits for direct costs, tax exemptions for scholarship income, and reduced taxes on student wage income. Tax incentives in the personal income tax system and the social security contribution system are incorporated. The results do not incorporate STEs that subsidise parental spending on education or that subsidise firm spending on education. It is assumed that the skills investment is financed wholly with savings: students do not incur any debt to make a skills investment.
12 http://dx.doi.org/10.1787/888933446446
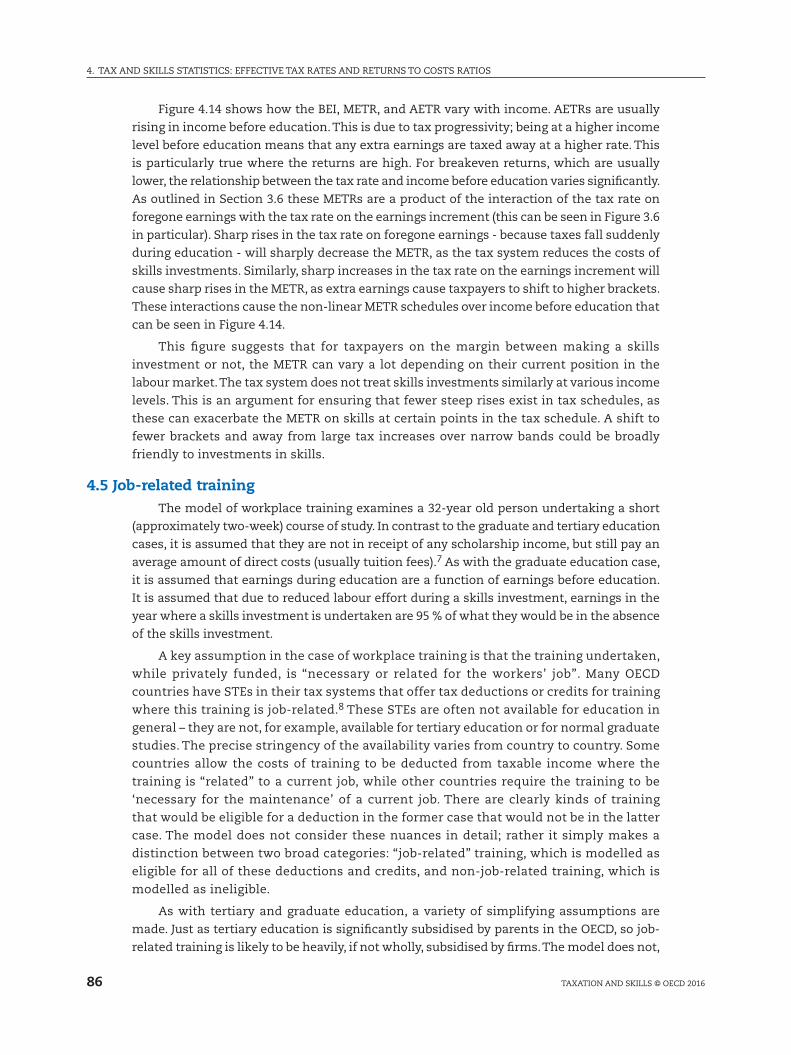
4. Tax anD SkIllS STaTISTICS: EffECTIvE Tax raTES anD rETurnS TO COSTS raTIOS
86 TaxaTIOn anD SkIllS © OECD 2016
figure 4.14 shows how the BEI, METr, and aETr vary with income. aETrs are usually
rising in income before education. This is due to tax progressivity; being at a higher income
level before education means that any extra earnings are taxed away at a higher rate. This
is particularly true where the returns are high. for breakeven returns, which are usually
lower, the relationship between the tax rate and income before education varies significantly.
as outlined in Section 3.6 these METrs are a product of the interaction of the tax rate on
foregone earnings with the tax rate on the earnings increment (this can be seen in figure 3.6
in particular). Sharp rises in the tax rate on foregone earnings - because taxes fall suddenly
during education - will sharply decrease the METr, as the tax system reduces the costs of
skills investments. Similarly, sharp increases in the tax rate on the earnings increment will
cause sharp rises in the METr, as extra earnings cause taxpayers to shift to higher brackets.
These interactions cause the non-linear METr schedules over income before education that
can be seen in figure 4.14.
This figure suggests that for taxpayers on the margin between making a skills
investment or not, the METr can vary a lot depending on their current position in the
labour market. The tax system does not treat skills investments similarly at various income
levels. This is an argument for ensuring that fewer steep rises exist in tax schedules, as
these can exacerbate the METr on skills at certain points in the tax schedule. a shift to
fewer brackets and away from large tax increases over narrow bands could be broadly
friendly to investments in skills.
4.5 Job-related trainingThe model of workplace training examines a 32-year old person undertaking a short
(approximately two-week) course of study. In contrast to the graduate and tertiary education
cases, it is assumed that they are not in receipt of any scholarship income, but still pay an
average amount of direct costs (usually tuition fees).7 as with the graduate education case,
it is assumed that earnings during education are a function of earnings before education.
It is assumed that due to reduced labour effort during a skills investment, earnings in the
year where a skills investment is undertaken are 95 % of what they would be in the absence
of the skills investment.
a key assumption in the case of workplace training is that the training undertaken,
while privately funded, is “necessary or related for the workers’ job”. Many OECD
countries have STEs in their tax systems that offer tax deductions or credits for training
where this training is job-related.8 These STEs are often not available for education in
general – they are not, for example, available for tertiary education or for normal graduate
studies. The precise stringency of the availability varies from country to country. Some
countries allow the costs of training to be deducted from taxable income where the
training is “related” to a current job, while other countries require the training to be
‘necessary for the maintenance’ of a current job. There are clearly kinds of training
that would be eligible for a deduction in the former case that would not be in the latter
case. The model does not consider these nuances in detail; rather it simply makes a
distinction between two broad categories: “job-related” training, which is modelled as
eligible for all of these deductions and credits, and non-job-related training, which is
modelled as ineligible.
as with tertiary and graduate education, a variety of simplifying assumptions are
made. Just as tertiary education is significantly subsidised by parents in the OECD, so job-
related training is likely to be heavily, if not wholly, subsidised by firms. The model does not,
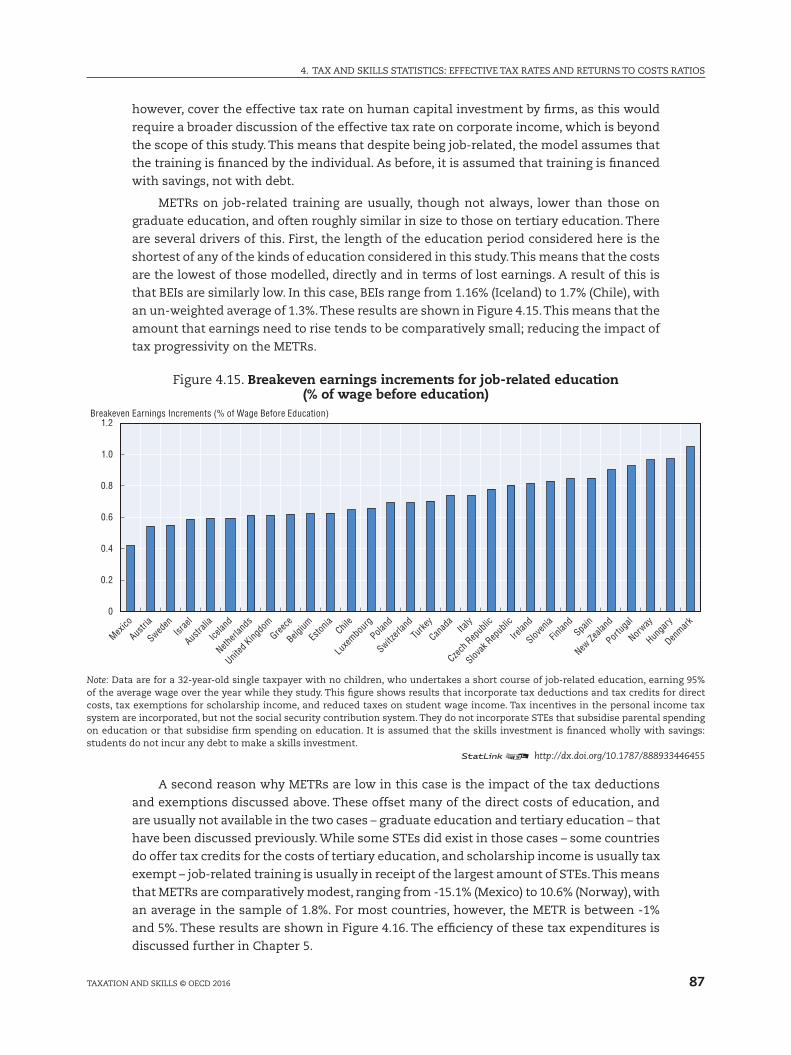
87
4. Tax anD SkIllS STaTISTICS: EffECTIvE Tax raTES anD rETurnS TO COSTS raTIOS
TaxaTIOn anD SkIllS © OECD 2016
however, cover the effective tax rate on human capital investment by firms, as this would
require a broader discussion of the effective tax rate on corporate income, which is beyond
the scope of this study. This means that despite being job-related, the model assumes that
the training is financed by the individual. as before, it is assumed that training is financed
with savings, not with debt.
METrs on job-related training are usually, though not always, lower than those on
graduate education, and often roughly similar in size to those on tertiary education. There
are several drivers of this. first, the length of the education period considered here is the
shortest of any of the kinds of education considered in this study. This means that the costs
are the lowest of those modelled, directly and in terms of lost earnings. a result of this is
that BEIs are similarly low. In this case, BEIs range from 1.16% (Iceland) to 1.7% (Chile), with
an un-weighted average of 1.3%. These results are shown in figure 4.15. This means that the
amount that earnings need to rise tends to be comparatively small; reducing the impact of
tax progressivity on the METrs.
figure 4.15. Breakeven earnings increments for job-related education (% of wage before education)
0
0.2
0.4
0.6
0.8
1.0
1.2Breakeven Earnings Increments (% of Wage Before Education)
Mexico
Austri
a
Sweden
Israe
l
Austra
lia
Icelan
d
Netherl
ands
United
Kingdo
mGree
ce
Belgium
Eston
iaChil
e
Luxe
mbour
g
Poland
Switzerl
and
Turke
y
Canad
aIta
ly
Czech
Rep
ublic
Slovak
Rep
ublic
Irelan
d
Sloven
ia
Finlan
dSpa
in
New Ze
aland
Portug
al
Norway
Hunga
ry
Denmark
Note: Data are for a 32-year-old single taxpayer with no children, who undertakes a short course of job-related education, earning 95% of the average wage over the year while they study. This figure shows results that incorporate tax deductions and tax credits for direct costs, tax exemptions for scholarship income, and reduced taxes on student wage income. Tax incentives in the personal income tax system are incorporated, but not the social security contribution system. They do not incorporate STEs that subsidise parental spending on education or that subsidise firm spending on education. It is assumed that the skills investment is financed wholly with savings: students do not incur any debt to make a skills investment.
12 http://dx.doi.org/10.1787/888933446455
a second reason why METrs are low in this case is the impact of the tax deductions
and exemptions discussed above. These offset many of the direct costs of education, and
are usually not available in the two cases – graduate education and tertiary education – that
have been discussed previously. While some STEs did exist in those cases – some countries
do offer tax credits for the costs of tertiary education, and scholarship income is usually tax
exempt – job-related training is usually in receipt of the largest amount of STEs. This means
that METrs are comparatively modest, ranging from -15.1% (Mexico) to 10.6% (norway), with
an average in the sample of 1.8%. for most countries, however, the METr is between -1%
and 5%. These results are shown in figure 4.16. The efficiency of these tax expenditures is
discussed further in Chapter 5.
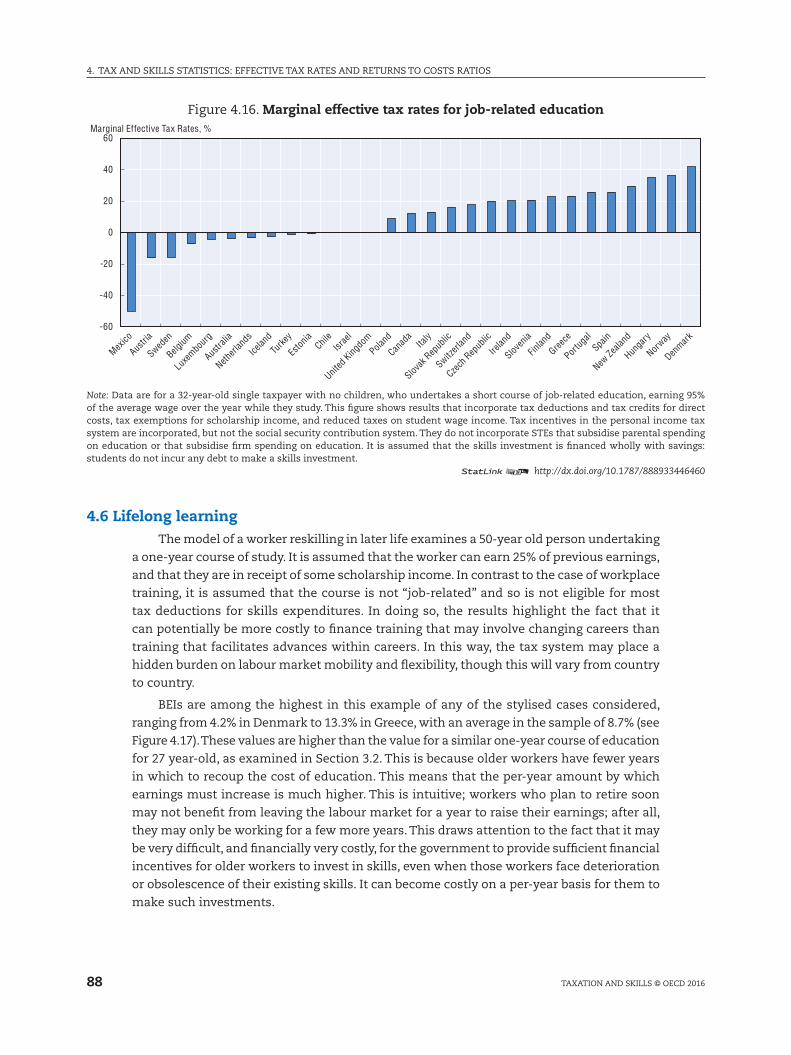
4. Tax anD SkIllS STaTISTICS: EffECTIvE Tax raTES anD rETurnS TO COSTS raTIOS
88 TaxaTIOn anD SkIllS © OECD 2016
figure 4.16. Marginal effective tax rates for job-related education
-60
-40
-20
0
20
40
60Marginal Effective Tax Rates, %
Mexico
Austri
a
Sweden
Belgium
Luxe
mbour
g
Austra
lia
Netherl
ands
Icelan
d
Turke
y
Eston
iaChil
eIsr
ael
United
Kingdo
mPola
nd
Canad
aIta
ly
Slovak
Rep
ublic
Switzerl
and
Czech
Rep
ublic
Irelan
d
Sloven
ia
Finlan
d
Greece
Portug
alSpa
in
New Ze
aland
Hunga
ry
Norway
Denmark
Note: Data are for a 32-year-old single taxpayer with no children, who undertakes a short course of job-related education, earning 95% of the average wage over the year while they study. This figure shows results that incorporate tax deductions and tax credits for direct costs, tax exemptions for scholarship income, and reduced taxes on student wage income. Tax incentives in the personal income tax system are incorporated, but not the social security contribution system. They do not incorporate STEs that subsidise parental spending on education or that subsidise firm spending on education. It is assumed that the skills investment is financed wholly with savings: students do not incur any debt to make a skills investment.
12 http://dx.doi.org/10.1787/888933446460
4.6 Lifelong learningThe model of a worker reskilling in later life examines a 50-year old person undertaking
a one-year course of study. It is assumed that the worker can earn 25% of previous earnings,
and that they are in receipt of some scholarship income. In contrast to the case of workplace
training, it is assumed that the course is not “job-related” and so is not eligible for most
tax deductions for skills expenditures. In doing so, the results highlight the fact that it
can potentially be more costly to finance training that may involve changing careers than
training that facilitates advances within careers. In this way, the tax system may place a
hidden burden on labour market mobility and flexibility, though this will vary from country
to country.
BEIs are among the highest in this example of any of the stylised cases considered,
ranging from 4.2% in Denmark to 13.3% in Greece, with an average in the sample of 8.7% (see
figure 4.17). These values are higher than the value for a similar one-year course of education
for 27 year-old, as examined in Section 3.2. This is because older workers have fewer years
in which to recoup the cost of education. This means that the per-year amount by which
earnings must increase is much higher. This is intuitive; workers who plan to retire soon
may not benefit from leaving the labour market for a year to raise their earnings; after all,
they may only be working for a few more years. This draws attention to the fact that it may
be very difficult, and financially very costly, for the government to provide sufficient financial
incentives for older workers to invest in skills, even when those workers face deterioration
or obsolescence of their existing skills. It can become costly on a per-year basis for them to
make such investments.
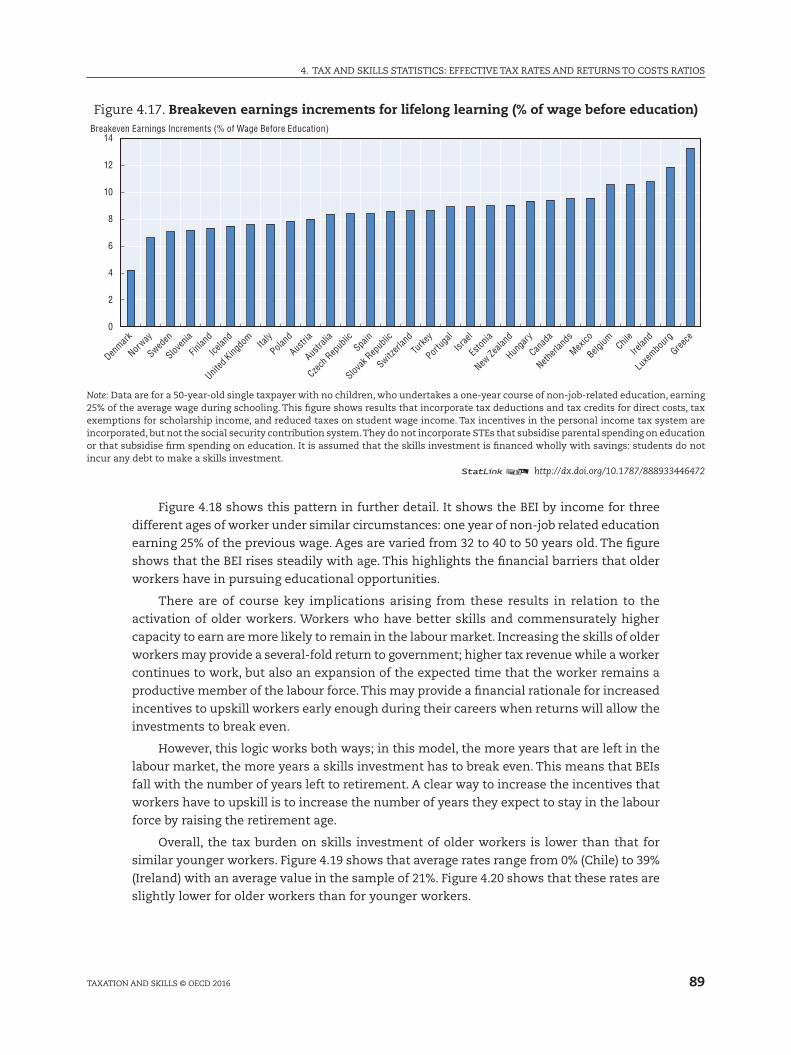
89
4. Tax anD SkIllS STaTISTICS: EffECTIvE Tax raTES anD rETurnS TO COSTS raTIOS
TaxaTIOn anD SkIllS © OECD 2016
figure 4.17. Breakeven earnings increments for lifelong learning (% of wage before education)
0
2
4
6
8
10
12
14Breakeven Earnings Increments (% of Wage Before Education)
Denmark
Norway
Sweden
Sloven
ia
Finlan
d
Icelan
d
United
Kingdo
mIta
ly
Poland
Austri
a
Austra
lia
Czech
Rep
ublic
Spain
Slovak
Rep
ublic
Switzerl
and
Turke
y
Portug
alIsr
ael
Eston
ia
New Ze
aland
Hunga
ry
Canad
a
Netherl
ands
Mexico
Belgium Chil
e
Irelan
d
Luxe
mbour
g
Greece
Note: Data are for a 50-year-old single taxpayer with no children, who undertakes a one-year course of non-job-related education, earning 25% of the average wage during schooling. This figure shows results that incorporate tax deductions and tax credits for direct costs, tax exemptions for scholarship income, and reduced taxes on student wage income. Tax incentives in the personal income tax system are incorporated, but not the social security contribution system. They do not incorporate STEs that subsidise parental spending on education or that subsidise firm spending on education. It is assumed that the skills investment is financed wholly with savings: students do not incur any debt to make a skills investment.
12 http://dx.doi.org/10.1787/888933446472
figure 4.18 shows this pattern in further detail. It shows the BEI by income for three
different ages of worker under similar circumstances: one year of non-job related education
earning 25% of the previous wage. ages are varied from 32 to 40 to 50 years old. The figure
shows that the BEI rises steadily with age. This highlights the financial barriers that older
workers have in pursuing educational opportunities.
There are of course key implications arising from these results in relation to the
activation of older workers. Workers who have better skills and commensurately higher
capacity to earn are more likely to remain in the labour market. Increasing the skills of older
workers may provide a several-fold return to government; higher tax revenue while a worker
continues to work, but also an expansion of the expected time that the worker remains a
productive member of the labour force. This may provide a financial rationale for increased
incentives to upskill workers early enough during their careers when returns will allow the
investments to break even.
However, this logic works both ways; in this model, the more years that are left in the
labour market, the more years a skills investment has to break even. This means that BEIs
fall with the number of years left to retirement. a clear way to increase the incentives that
workers have to upskill is to increase the number of years they expect to stay in the labour
force by raising the retirement age.
Overall, the tax burden on skills investment of older workers is lower than that for
similar younger workers. figure 4.19 shows that average rates range from 0% (Chile) to 39%
(Ireland) with an average value in the sample of 21%. figure 4.20 shows that these rates are
slightly lower for older workers than for younger workers.
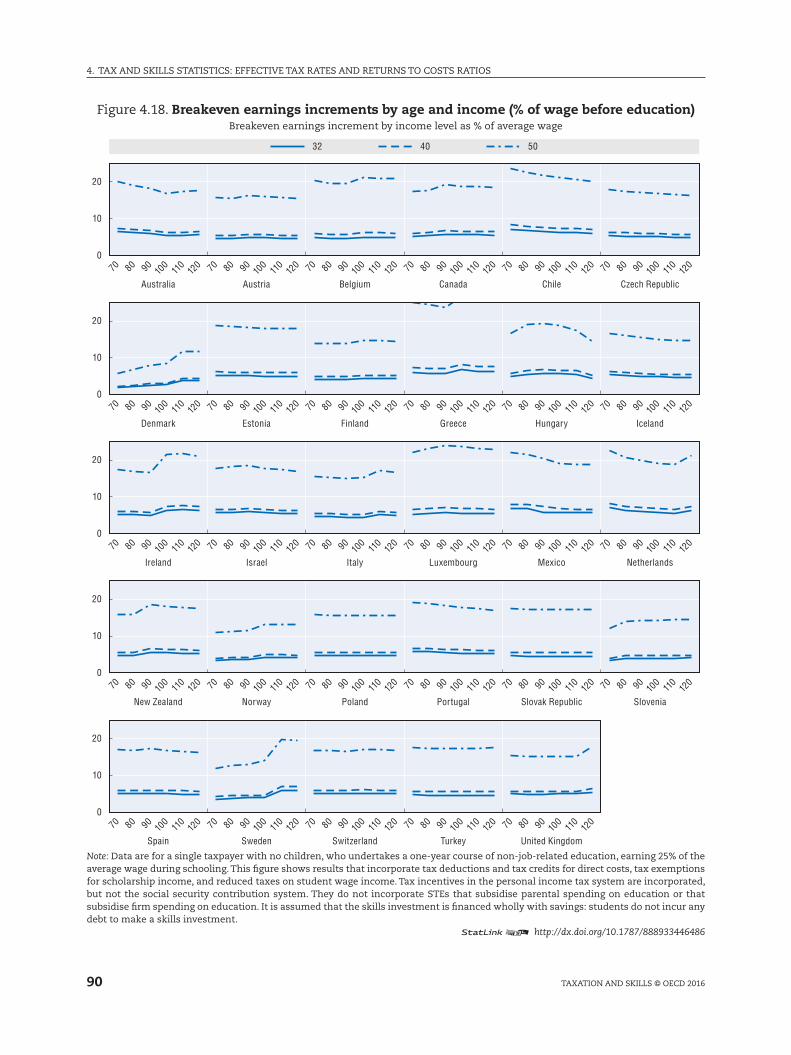
4. Tax anD SkIllS STaTISTICS: EffECTIvE Tax raTES anD rETurnS TO COSTS raTIOS
90 TaxaTIOn anD SkIllS © OECD 2016
figure 4.18. Breakeven earnings increments by age and income (% of wage before education)Breakeven earnings increment by income level as % of average wage
70 80 9010
012
011
0
20
10
0
20
10
0
20
10
0
20
10
0
20
10
0
70 80 9010
012
011
0 70 80 9010
012
011
0 70 80 9010
012
011
0 70 80 9010
012
011
0 70 80 9010
012
011
0
70 80 9010
012
011
0 70 80 9010
012
011
0 70 80 9010
012
011
0 70 80 9010
012
011
0 70 80 9010
012
011
0 70 80 9010
012
011
0
70 80 9010
012
011
0 70 80 9010
012
011
0 70 80 9010
012
011
0 70 80 9010
012
011
0 70 80 9010
012
011
0 70 80 9010
012
011
0
70 80 9010
012
011
0 70 80 9010
012
011
0 70 80 9010
012
011
0 70 80 9010
012
011
0 70 80 9010
012
011
0 70 80 9010
012
011
0
70 80 9010
012
011
0 70 80 9010
012
011
0 70 80 9010
012
011
0 70 80 9010
012
011
0 70 80 9010
012
011
0
Australia Austria Belgium Canada Chile Czech Republic
Estonia Finland Greece Hungary Iceland
Italy Luxembourg Mexico Netherlands
Portugal
United Kingdom
Slovak Republic Slovenia
Denmark
Ireland Israel
New Zealand Norway Poland
Spain Sweden Switzerland Turkey
32 40 50
Note: Data are for a single taxpayer with no children, who undertakes a one-year course of non-job-related education, earning 25% of the average wage during schooling. This figure shows results that incorporate tax deductions and tax credits for direct costs, tax exemptions for scholarship income, and reduced taxes on student wage income. Tax incentives in the personal income tax system are incorporated, but not the social security contribution system. They do not incorporate STEs that subsidise parental spending on education or that subsidise firm spending on education. It is assumed that the skills investment is financed wholly with savings: students do not incur any debt to make a skills investment.
12 http://dx.doi.org/10.1787/888933446486
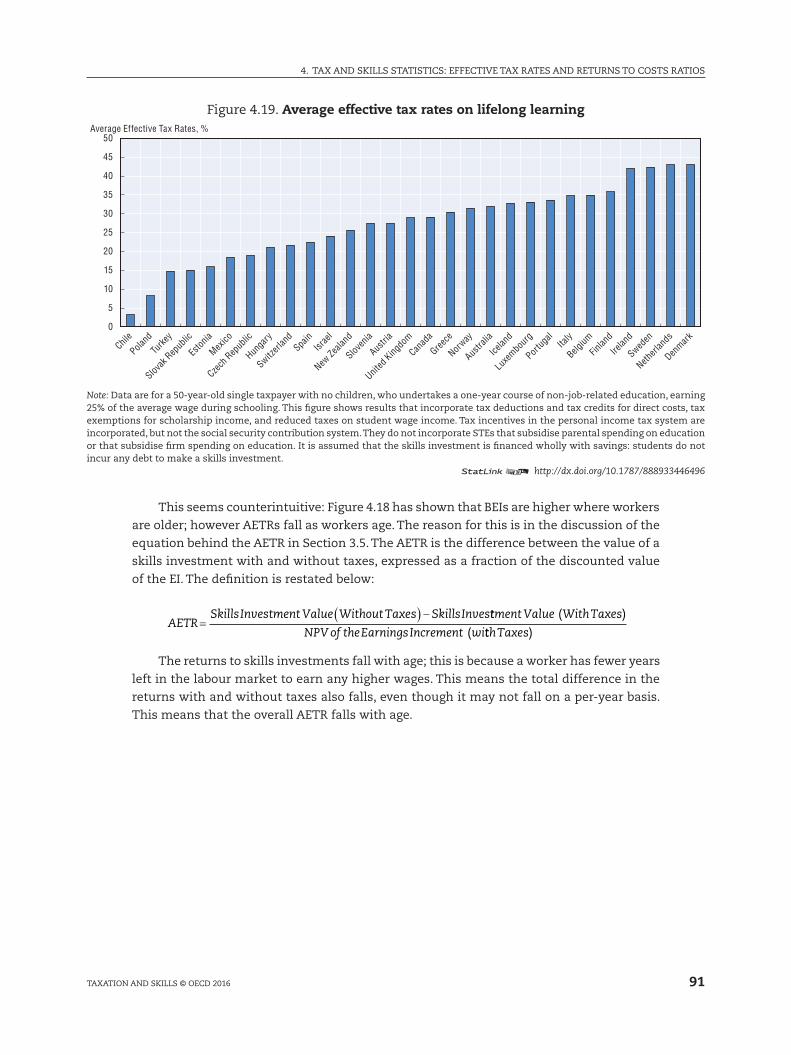
91
4. Tax anD SkIllS STaTISTICS: EffECTIvE Tax raTES anD rETurnS TO COSTS raTIOS
TaxaTIOn anD SkIllS © OECD 2016
figure 4.19. Average effective tax rates on lifelong learning
0
5
10
15
20
25
30
35
40
45
50Average Effective Tax Rates, %
Chile
Poland
Turke
y
Slovak
Rep
ublic
Eston
ia
Mexico
Czech
Rep
ublic
Hunga
ry
Switzerl
and
Spain
Israe
l
New Ze
aland
Sloven
ia
Austri
a
United
Kingdo
m
Canad
a
Greece
Norway
Austra
lia
Icelan
d
Luxe
mbour
g
Portug
alIta
ly
Belgium
Finlan
d
Irelan
d
Sweden
Netherl
ands
Denmark
Note: Data are for a 50-year-old single taxpayer with no children, who undertakes a one-year course of non-job-related education, earning 25% of the average wage during schooling. This figure shows results that incorporate tax deductions and tax credits for direct costs, tax exemptions for scholarship income, and reduced taxes on student wage income. Tax incentives in the personal income tax system are incorporated, but not the social security contribution system. They do not incorporate STEs that subsidise parental spending on education or that subsidise firm spending on education. It is assumed that the skills investment is financed wholly with savings: students do not incur any debt to make a skills investment.
12 http://dx.doi.org/10.1787/888933446496
This seems counterintuitive: figure 4.18 has shown that BEIs are higher where workers
are older; however aETrs fall as workers age. The reason for this is in the discussion of the
equation behind the aETr in Section 3.5. The aETr is the difference between the value of a
skills investment with and without taxes, expressed as a fraction of the discounted value
of the EI. The definition is restated below:
AETR
SkillsInvestment Value Without Taxes SkillsInves=
( ) − ttment Value WithTaxes
NPV of theEarningsIncrement wi
( )
( tthTaxes)
The returns to skills investments fall with age; this is because a worker has fewer years
left in the labour market to earn any higher wages. This means the total difference in the
returns with and without taxes also falls, even though it may not fall on a per-year basis.
This means that the overall aETr falls with age.
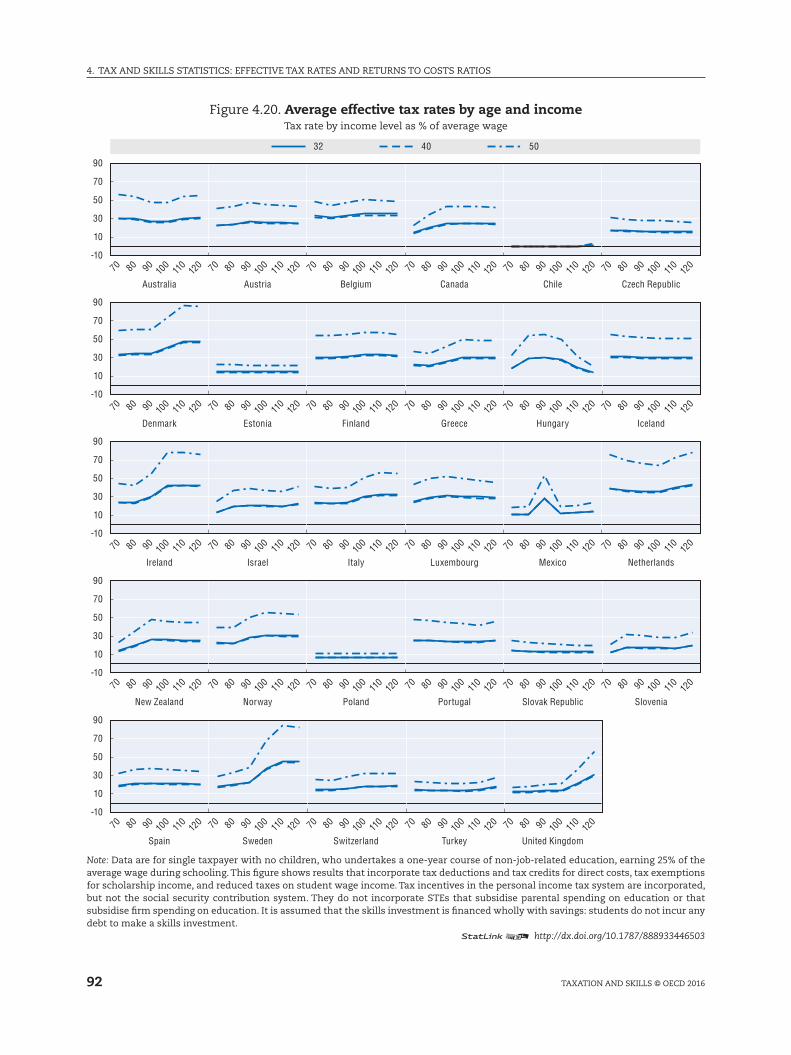
4. Tax anD SkIllS STaTISTICS: EffECTIvE Tax raTES anD rETurnS TO COSTS raTIOS
92 TaxaTIOn anD SkIllS © OECD 2016
figure 4.20. Average effective tax rates by age and incomeTax rate by income level as % of average wage
70 80 9010
012
011
0
90
70
50
30
10
-10
90
70
50
30
10
-10
90
70
50
30
10
-10
90
70
50
30
10
-10
90
70
50
30
10
-10
70 80 9010
012
011
0 70 80 9010
012
011
0 70 80 9010
012
011
0 70 80 9010
012
011
0 70 80 9010
012
011
0
70 80 9010
012
011
0 70 80 9010
012
011
0 70 80 9010
012
011
0 70 80 9010
012
011
0 70 80 9010
012
011
0 70 80 9010
012
011
0
70 80 9010
012
011
0 70 80 9010
012
011
0 70 80 9010
012
011
0 70 80 9010
012
011
0 70 80 9010
012
011
0 70 80 9010
012
011
0
70 80 9010
012
011
0 70 80 9010
012
011
0 70 80 9010
012
011
0 70 80 9010
012
011
0 70 80 9010
012
011
0 70 80 9010
012
011
0
70 80 9010
012
011
0 70 80 9010
012
011
0 70 80 9010
012
011
0 70 80 9010
012
011
0 70 80 9010
012
011
0
Australia Austria Belgium Canada Chile Czech Republic
Estonia Finland Greece Hungary Iceland
Italy Luxembourg Mexico Netherlands
Portugal
United Kingdom
Slovak Republic Slovenia
Denmark
Ireland Israel
New Zealand Norway Poland
Spain Sweden Switzerland Turkey
32 40 50
Note: Data are for single taxpayer with no children, who undertakes a one-year course of non-job-related education, earning 25% of the average wage during schooling. This figure shows results that incorporate tax deductions and tax credits for direct costs, tax exemptions for scholarship income, and reduced taxes on student wage income. Tax incentives in the personal income tax system are incorporated, but not the social security contribution system. They do not incorporate STEs that subsidise parental spending on education or that subsidise firm spending on education. It is assumed that the skills investment is financed wholly with savings: students do not incur any debt to make a skills investment.
12 http://dx.doi.org/10.1787/888933446503
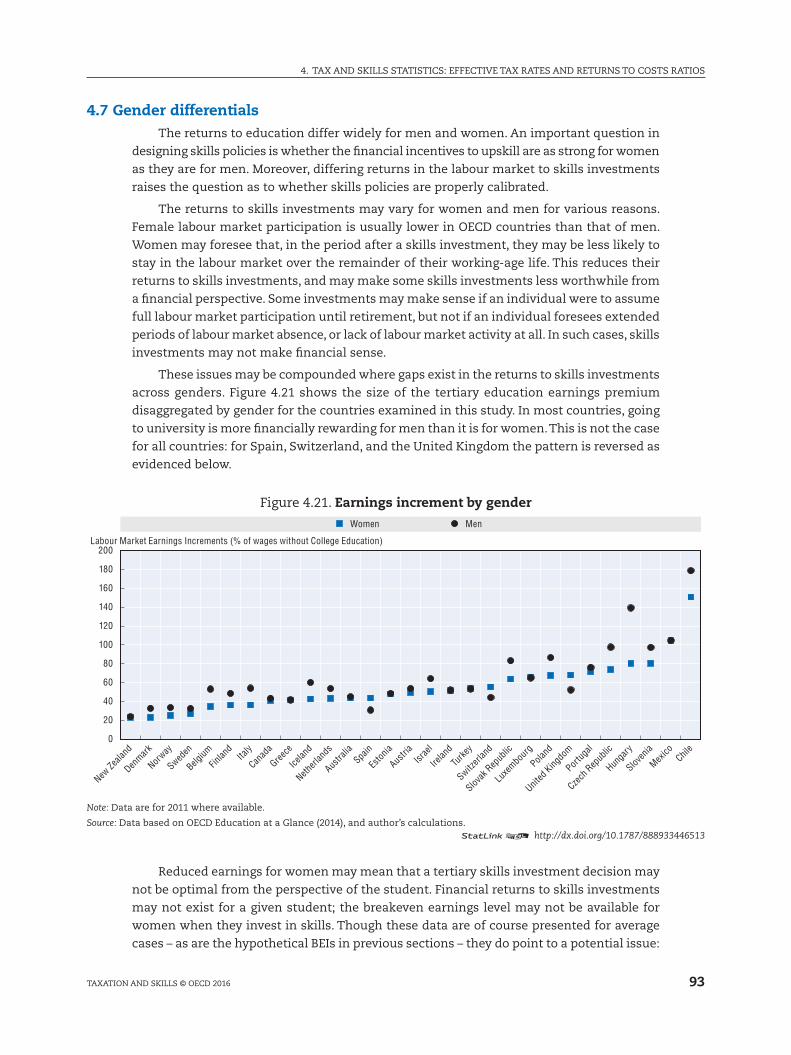
93
4. Tax anD SkIllS STaTISTICS: EffECTIvE Tax raTES anD rETurnS TO COSTS raTIOS
TaxaTIOn anD SkIllS © OECD 2016
4.7 Gender differentialsThe returns to education differ widely for men and women. an important question in
designing skills policies is whether the financial incentives to upskill are as strong for women
as they are for men. Moreover, differing returns in the labour market to skills investments
raises the question as to whether skills policies are properly calibrated.
The returns to skills investments may vary for women and men for various reasons.
female labour market participation is usually lower in OECD countries than that of men.
Women may foresee that, in the period after a skills investment, they may be less likely to
stay in the labour market over the remainder of their working-age life. This reduces their
returns to skills investments, and may make some skills investments less worthwhile from
a financial perspective. Some investments may make sense if an individual were to assume
full labour market participation until retirement, but not if an individual foresees extended
periods of labour market absence, or lack of labour market activity at all. In such cases, skills
investments may not make financial sense.
These issues may be compounded where gaps exist in the returns to skills investments
across genders. figure 4.21 shows the size of the tertiary education earnings premium
disaggregated by gender for the countries examined in this study. In most countries, going
to university is more financially rewarding for men than it is for women. This is not the case
for all countries: for Spain, Switzerland, and the united kingdom the pattern is reversed as
evidenced below.
figure 4.21. Earnings increment by gender
0
20
40
60
80
100
120
140
160
180
200Labour Market Earnings Increments (% of wages without College Education)
Women Men
New Ze
aland
Denmark
Norway
Sweden
Belgium
Finlan
dIta
ly
Canad
a
Greece
Icelan
d
Netherl
ands
Austra
liaSpa
in
Eston
ia
Austri
aIsr
ael
Irelan
d
Turke
y
Switzerl
and
Slovak
Rep
ublic
Luxe
mbour
g
Poland
United
Kingdo
m
Portug
al
Czech
Rep
ublic
Hunga
ry
Sloven
ia
Mexico Chil
e
Note: Data are for 2011 where available.
Source: Data based on OECD Education at a Glance (2014), and author’s calculations.12 http://dx.doi.org/10.1787/888933446513
reduced earnings for women may mean that a tertiary skills investment decision may
not be optimal from the perspective of the student. financial returns to skills investments
may not exist for a given student; the breakeven earnings level may not be available for
women when they invest in skills. Though these data are of course presented for average
cases – as are the hypothetical BEIs in previous sections – they do point to a potential issue:
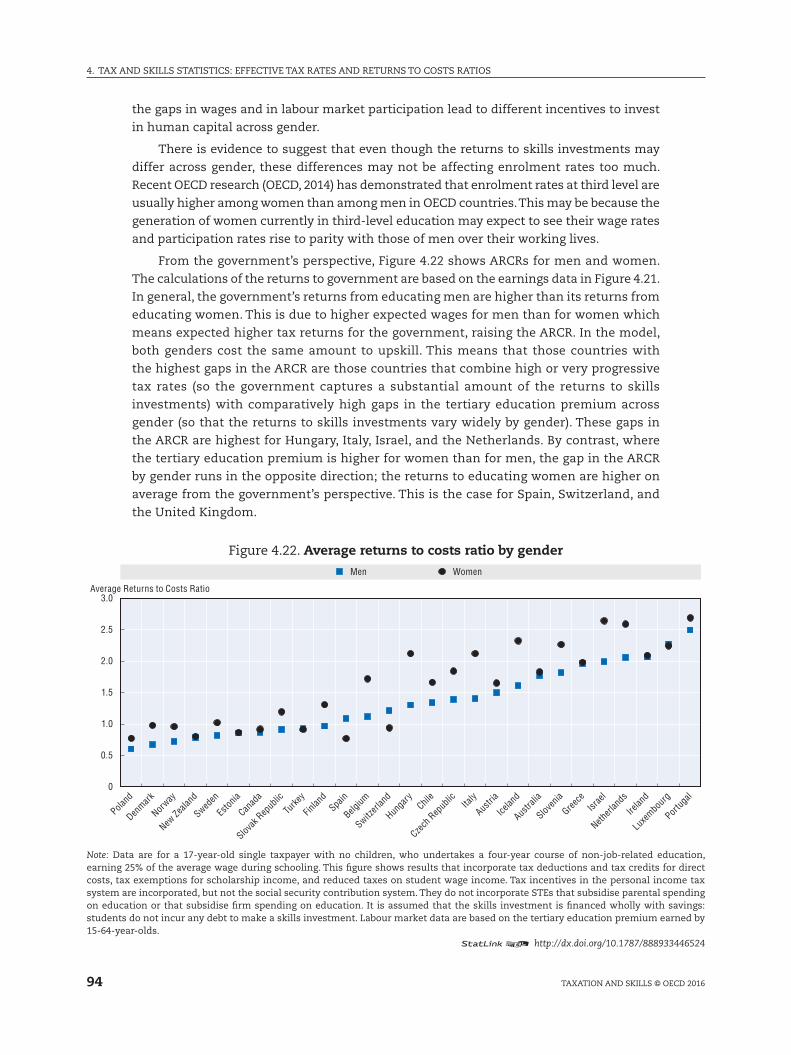
4. Tax anD SkIllS STaTISTICS: EffECTIvE Tax raTES anD rETurnS TO COSTS raTIOS
94 TaxaTIOn anD SkIllS © OECD 2016
the gaps in wages and in labour market participation lead to different incentives to invest
in human capital across gender.
There is evidence to suggest that even though the returns to skills investments may
differ across gender, these differences may not be affecting enrolment rates too much.
recent OECD research (OECD, 2014) has demonstrated that enrolment rates at third level are
usually higher among women than among men in OECD countries. This may be because the
generation of women currently in third-level education may expect to see their wage rates
and participation rates rise to parity with those of men over their working lives.
from the government’s perspective, figure 4.22 shows arCrs for men and women.
The calculations of the returns to government are based on the earnings data in figure 4.21.
In general, the government’s returns from educating men are higher than its returns from
educating women. This is due to higher expected wages for men than for women which
means expected higher tax returns for the government, raising the arCr. In the model,
both genders cost the same amount to upskill. This means that those countries with
the highest gaps in the arCr are those countries that combine high or very progressive
tax rates (so the government captures a substantial amount of the returns to skills
investments) with comparatively high gaps in the tertiary education premium across
gender (so that the returns to skills investments vary widely by gender). These gaps in
the arCr are highest for Hungary, Italy, Israel, and the netherlands. By contrast, where
the tertiary education premium is higher for women than for men, the gap in the arCr
by gender runs in the opposite direction; the returns to educating women are higher on
average from the government’s perspective. This is the case for Spain, Switzerland, and
the united kingdom.
figure 4.22. Average returns to costs ratio by gender
0
0.5
1.0
1.5
2.0
2.5
3.0Average Returns to Costs Ratio
Men Women
Poland
Denmark
Norway
New Ze
aland
Sweden
Eston
ia
Canad
a
Slovak
Rep
ublic
Turke
y
Finlan
dSpa
in
Belgium
Switzerl
and
Hunga
ryChil
e
Czech
Rep
ublic Ita
ly
Austri
a
Icelan
d
Austra
lia
Sloven
ia
Greece
Israe
l
Netherl
ands
Irelan
d
Luxe
mbour
g
Portug
al
Note: Data are for a 17-year-old single taxpayer with no children, who undertakes a four-year course of non-job-related education, earning 25% of the average wage during schooling. This figure shows results that incorporate tax deductions and tax credits for direct costs, tax exemptions for scholarship income, and reduced taxes on student wage income. Tax incentives in the personal income tax system are incorporated, but not the social security contribution system. They do not incorporate STEs that subsidise parental spending on education or that subsidise firm spending on education. It is assumed that the skills investment is financed wholly with savings: students do not incur any debt to make a skills investment. labour market data are based on the tertiary education premium earned by 15-64-year-olds.
12 http://dx.doi.org/10.1787/888933446524
95
4. Tax anD SkIllS STaTISTICS: EffECTIvE Tax raTES anD rETurnS TO COSTS raTIOS
TaxaTIOn anD SkIllS © OECD 2016
These results present important challenges and opportunities for governments. The
analysis suggests that for some governments the returns to education for women may be
low due to the wage gap. Though this analysis does not account for gaps in labour market
participation, accounting for these differences would likely increase the gap between the
genders with respect to the returns to skills investments from the government’s perspective.
This means that reducing the wage gap by raising female labour market participation and
raising female wage rates could see the government recoup a greater degree of its spending
on skills investments for women.
Notes1. These costs are discussed in Chapter 3.
2. Throughout, the results refer to 2011 uSD.
3. This would also be the case in selected other countries with income contingent loan schemes that have not been modelled in this study. for example, this would also be the case in Canada for students with Canada Student loans through the repayment assistance Plan, and other provincial/territorial government loans through their respective repayment assistance plans.
4. This is discussed further in Section 3.3.
5. note that the estimations of the costs of graduate education are the same as those for tertiary education. This is due to data limitations. These costs are discussed more in Chapter 3.
6. This is due to data limitations. There are good data on the premium earned in the labour market by tertiary-educated workers over non-tertiary-educated workers, but the data on the premium earned by graduate-educated workers over tertiary-educated workers is less comprehensive. a broad assumption of a 5% per annum return on the skills investment is made, while recognising that this misses a lot of between-country variation.
7. note that the estimations of the direct costs of in-work training are the same as those for tertiary education. as with graduate education, this is due to data limitations.
8. See Chapters 2 and 5, and annex B, for more details on STEs.
ReferencesOECD (2014), Education at a Glance 2014: OECD Indicators, OECD Publishing, Paris, https://doi.org/10.1787/
eag-2013-en.
OECD (2016), Taxing Wages 2016, OECD Publishing, Paris, http://dx.doi.org/10.1787/tax_wages-2016-en.

97
Taxation and Skills
© OECD 2016
Chapter 5
Tax and non-tax financial incentives to support skills
investments
This chapter analyses the costs and impact of specific tax expenditures aimed at encouraging skills investment. The chapter discusses tax expenditures targeted at tertiary education and lifelong earnings separately. The impacts on skills development are discussed, as well as the equity implications of the tax expenditures. Tax and non-tax approaches to encouraging skills investment are compared and analysed. The chapter concludes with a discussion of optimal policy mixes from a skills perspective.
The statistical data for Israel are supplied by and under the responsibility of the relevant Israeli authorities. The use of such data by the OECD is without prejudice to the status of the Golan Heights, East Jerusalem and Israeli settlements in the West Bank under the terms of international law.
98
5. Tax anD nOn-Tax fInanCIal InCEnTIvES TO SuppOrT SkIllS InvESTmEnTS
TaxaTIOn anD SkIllS © OECD 2016
5.1 IntroductionThe support provided by the tax system to improve individuals’ financial incentives to
invest in skills varies widely. Chapter 4 of this study has provided estimates of the overall
impact of the tax system on different kinds of skills investment decisions. The incentives to
invest in skills depend on the overall personal income tax (pIT) system, but also on specific
skills tax expenditures (STEs) countries have in their tax systems.1 Some countries allow
students to deduct the private costs of education from their taxable income or credit this
expenditure against their tax liability; some countries exempt scholarship income from
taxation; some countries exempt student income from social security contributions. Since
all of these measures are designed to increase investment in skills, assessing their impact
and comparing their impact to those of other skills policies is crucial in assessing the overall
impact of the tax system on skills.
This chapter approaches these issues in several ways. It analyses the value of these
financial incentives to different kinds of students at various income levels and for different
kinds of skills investment scenarios. It also assesses the distributional impact of STEs,
discusses students’ responses to these incentives and presents estimates of the effects of
these expenditures, by drawing upon analysis from the economic literature. The analysis
in the chapter makes several key points.
●● The value of STEs in the countries modelled is modest. Though dependent on the costs of
skills investment and other assumptions, the results suggest that for university students,
scholarship income and direct government support are much larger channels through
which governments financially support skills investments.
●● STEs are progressive. This means that the estimated value of these STEs is larger for those
on lower incomes in most countries. STEs are more progressive for university students
than they are for workers job-related training. This is particularly the case where the STEs
are reduced social security contributions (SSCs) on student income.
●● Direct support for university students in the form of direct grants and scholarships is more
progressive than STEs, in part because direct support does not depend on an individual’s
taxable income, which is often the case for STEs.
●● While the model notes that STEs can benefit those students on low incomes more than
students on higher incomes, empirical research has suggested that the impact of these
STEs on student outcomes such as enrolment and time-to-completion is modest or even
zero.
●● In order to be effective, STEs must be very carefully designed. Existing STE policies are
often designed in ways that make it difficult for students to access them, in ways that do
not encourage completion of courses of study in a timely manner, and in ways that do
not encourage the completion of the kinds of education that might be most effective in
raising wages and employment prospects.
99
5. Tax anD nOn-Tax fInanCIal InCEnTIvES TO SuppOrT SkIllS InvESTmEnTS
TaxaTIOn anD SkIllS © OECD 2016
●● The impact of STEs on financial incentives to invest in skills is higher for those skills
investments that yield low returns than for those skills investments that yield high
returns. for high-return skills investments, the way the returns to skills are taxed away
(i.e. tax progressivity) has a much larger impact than the way the costs of skills are offset
(including STEs). for low-return skills investments, the support the financial system
provides by reducing the costs of skills investments has a larger impact than the way
these returns are taxed away.
●● as policy levers to encourage investments in skills, STEs may be less effective in comparison
to direct spending on educational institutions or direct support to students in the form
of scholarships and grants.
●● Existing skills tax expenditures are often only available where training pertains to a
workers’ current employment, and may not facilitate workers who need or want to
change careers. These tax provisions may therefore reduce labour market flexibility and
exacerbate skills mismatch.
These key points lead to important conclusions that clarify choices for policy makers
when it comes to tax and skills. a uniquely “best” set of tax and skills policies does not
exist. The ways in which tax and skills policies and indeed financial support for skills in
general should be designed depends on the goals of the policy maker with respect to skills
outcomes in a given country. as discussed in Chapter 4, the tax system apportions the
costs and returns of skills investments between the student, firm and government. Where
governments want a very progressive income tax system, a large amount of government
support for skills investment will be required to maintain and expand the level of human
capital in the economy. Where the tax burden on human capital is low, government support
for skills investments can be more modest without excessively impacting students’ and
individuals’ incentives to invest in skills – provided adequate support is provided to credit-
constrained and otherwise disadvantaged students.
Other considerations must also be borne in mind when considering the impact of
the tax system on skills. Tax expenditures are often more complex for governments to
administer and for taxpayers to understand than direct spending on skills investment.
many tax expenditures are only of value to those students who earn taxable income. This
means that they may be a costly way of investing in human capital for governments, and
may have low take-up rates, especially among those with low incomes and low skills.
Tax expenditures may not be as effective an approach to supporting skills investments
as direct spending. Tax expenditures may also involve significant deadweight losses,
providing subsidies to skills investments that would occur even in the absence of
government support (though this may be true of direct spending on skills as well). To
raise the overall level of skills in the economy, a combination of reduced labour income
taxation and increased government support for those on low incomes or those who are
credit constrained may be appropriate.
The chapter proceeds as follows. Section 5.2 reviews the size and impact of STEs. Section
5.3 reviews other non-tax approaches to improving students’ financial incentives to invest
in tertiary education, such as loans, scholarships and grants, and reducing tuition fees by
providing more government support to educational institutions. Section 5.4 considers tax
and non-tax issues targeted at lifelong learning and worker training. Section 5.5 concludes
with an overall consideration of the role of the tax system in education finance and the
system of incentives surrounding skills investment.
5. Tax anD nOn-Tax fInanCIal InCEnTIvES TO SuppOrT SkIllS InvESTmEnTS
100 TaxaTIOn anD SkIllS © OECD 2016
5.2 Tax incentives for tertiary educationThis section analyses STEs for tertiary education. as has been outlined in Chapter 1,
the returns to tertiary education are significant (OECD, 2015a). In most OECD countries,
the government provides significant direct support for tertiary education (see Chapter 3,
Section 3.1). By contrast, the support provided to tertiary education through the tax system is
more modest. STEs supporting tertiary education come in several different forms, including:
●● Exemption of scholarship income from personal income taxes or employee and employer
SSCs,
●● Exemption of student earnings from personal income taxes or employee and employer
SSCs,
●● Deductibility of tuition costs and other educational expenses from the personal income
tax base,
●● Tax credits by which skills expenditure can be credited against tax liability,
●● Deductibility of interest on student loans from the personal income tax base,
●● Income contingent loans.
This section will outline the approximate size of the value of these STEs for the
stylised tertiary student outlined in Section 4.2, and will then discuss the impact of these
expenditures on educational outcomes and income distribution. The section will conclude
with a discussion of design considerations with regard to tax expenditures for tertiary
education.
Size of tax incentives for tertiary education
This section provides estimates of the value of STEs in the sample of countries for
tertiary education on a per-person basis. In assessing the value of these expenditures, the
‘skills spending’ that happens through the tax system can be assessed for stylised cases.
This allows spending on skills that happens through the tax system to be compared with
spending on skills that is provided directly, for example through direct grants to universities
or students.
assessing the overall value of STEs is challenging. These STEs may vary in value
depending on the income of the taxpayer, the kind of education undertaken, the amount
of tuition fees, the amount of scholarship income and other factors. moreover, different
STEs may exist in the same system, and may interact with each other. for example, student
income may be exempt from social contributions, but increased student income may reduce
eligibility for a tax-free scholarship. The model outlined in Chapter 3 of this study allows
all STEs to be analysed together, to arrive at a general estimate of the value of these STEs
for a stylised student.
In terms of the model as outlined in Chapter 3 of this study, the key parameter that will
be analysed is the difference between the tax rates applied to earnings during education
with and without STEs. This can also be expressed as:
T T EEd Ed d−( )* ,
where TEd is the rate of tax paid on in-education earnings Ed without STEs, and T*
Ed
is the rate paid on these earnings with STEs. Estimations of the value of STEs depend on a
variety of factors and assumptions of the model, which are also discussed in Chapter 3 and
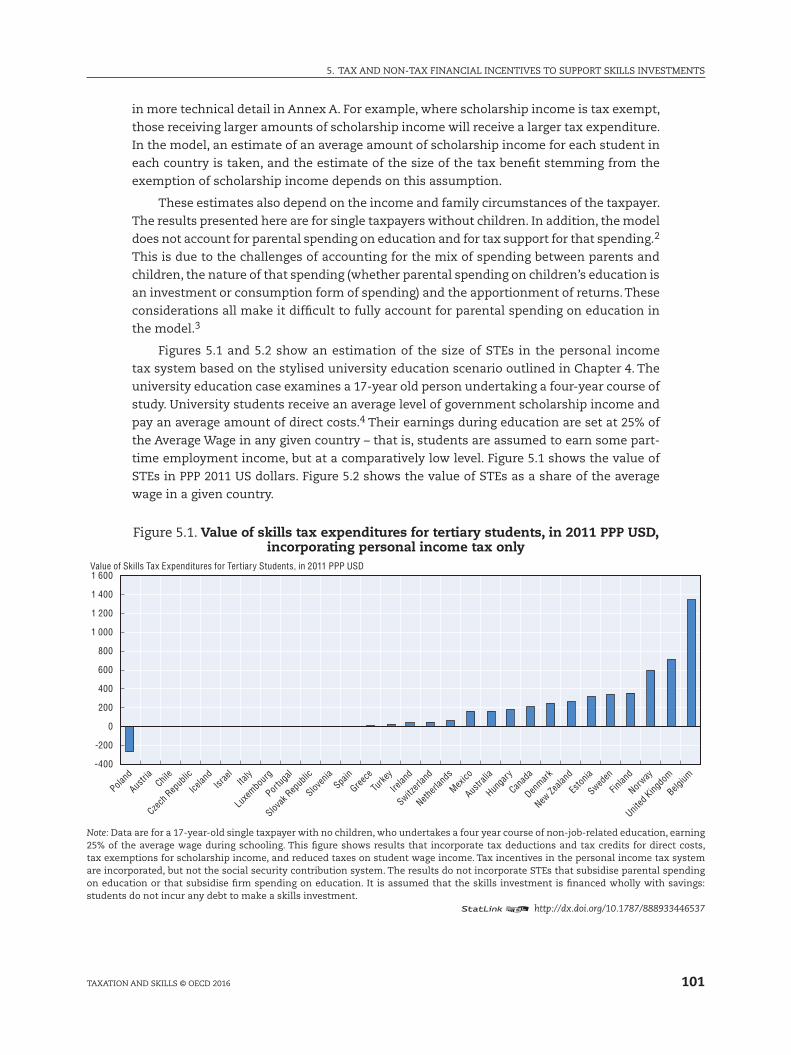
101
5. Tax anD nOn-Tax fInanCIal InCEnTIvES TO SuppOrT SkIllS InvESTmEnTS
TaxaTIOn anD SkIllS © OECD 2016
in more technical detail in annex a. for example, where scholarship income is tax exempt,
those receiving larger amounts of scholarship income will receive a larger tax expenditure.
In the model, an estimate of an average amount of scholarship income for each student in
each country is taken, and the estimate of the size of the tax benefit stemming from the
exemption of scholarship income depends on this assumption.
These estimates also depend on the income and family circumstances of the taxpayer.
The results presented here are for single taxpayers without children. In addition, the model
does not account for parental spending on education and for tax support for that spending.2
This is due to the challenges of accounting for the mix of spending between parents and
children, the nature of that spending (whether parental spending on children’s education is
an investment or consumption form of spending) and the apportionment of returns. These
considerations all make it difficult to fully account for parental spending on education in
the model.3
figures 5.1 and 5.2 show an estimation of the size of STEs in the personal income
tax system based on the stylised university education scenario outlined in Chapter 4. The
university education case examines a 17-year old person undertaking a four-year course of
study. university students receive an average level of government scholarship income and
pay an average amount of direct costs.4 Their earnings during education are set at 25% of
the average Wage in any given country – that is, students are assumed to earn some part-
time employment income, but at a comparatively low level. figure 5.1 shows the value of
STEs in ppp 2011 uS dollars. figure 5.2 shows the value of STEs as a share of the average
wage in a given country.
figure 5.1. Value of skills tax expenditures for tertiary students, in 2011 PPP USD, incorporating personal income tax only
-400
-200
0
200
400
600
800
1 000
1 200
1 400
1 600Value of Skills Tax Expenditures for Tertiary Students, in 2011 PPP USD
Poland
Austri
aChil
e
Czech
Rep
ublic
Icelan
dIsr
ael
Italy
Luxe
mbour
g
Portug
al
Slovak
Rep
ublic
Sloven
iaSpa
in
Greece
Turke
y
Irelan
d
Switzerl
and
Netherl
ands
Mexico
Austra
lia
Hunga
ry
Canad
a
Denmark
New Ze
aland
Eston
ia
Sweden
Finlan
d
Norway
United
Kingdo
m
Belgium
Note: Data are for a 17-year-old single taxpayer with no children, who undertakes a four year course of non-job-related education, earning 25% of the average wage during schooling. This figure shows results that incorporate tax deductions and tax credits for direct costs, tax exemptions for scholarship income, and reduced taxes on student wage income. Tax incentives in the personal income tax system are incorporated, but not the social security contribution system. The results do not incorporate STEs that subsidise parental spending on education or that subsidise firm spending on education. It is assumed that the skills investment is financed wholly with savings: students do not incur any debt to make a skills investment.
12 http://dx.doi.org/10.1787/888933446537
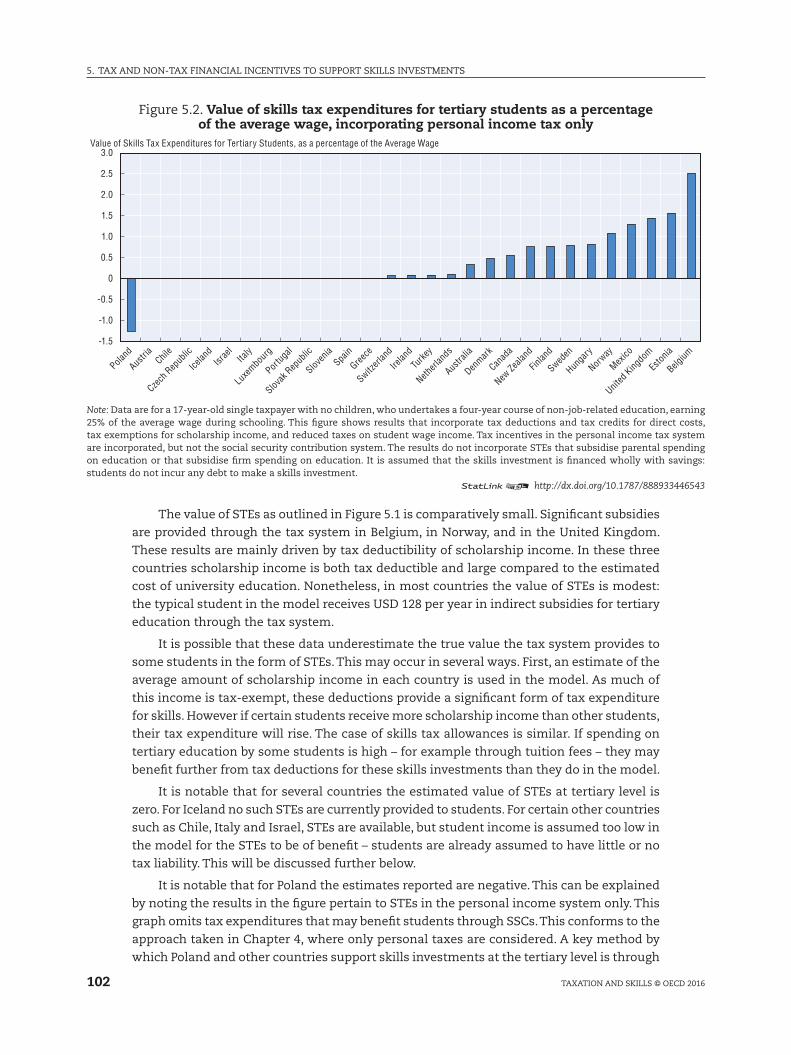
5. Tax anD nOn-Tax fInanCIal InCEnTIvES TO SuppOrT SkIllS InvESTmEnTS
102 TaxaTIOn anD SkIllS © OECD 2016
figure 5.2. Value of skills tax expenditures for tertiary students as a percentage of the average wage, incorporating personal income tax only
-1.5
-1.0
-0.5
0
0.5
1.0
1.5
2.0
2.5
3.0Value of Skills Tax Expenditures for Tertiary Students, as a percentage of the Average Wage
Poland
Austri
aChil
e
Czech
Rep
ublic
Icelan
dIsr
ael
Italy
Luxe
mbour
g
Portug
al
Slovak
Rep
ublic
Sloven
iaSpa
in
Greece
Switzerl
and
Irelan
d
Turke
y
Netherl
ands
Austra
lia
Denmark
Canad
a
New Ze
aland
Finlan
d
Sweden
Hunga
ry
Norway
Mexico
United
Kingdo
m
Eston
ia
Belgium
Note: Data are for a 17-year-old single taxpayer with no children, who undertakes a four-year course of non-job-related education, earning 25% of the average wage during schooling. This figure shows results that incorporate tax deductions and tax credits for direct costs, tax exemptions for scholarship income, and reduced taxes on student wage income. Tax incentives in the personal income tax system are incorporated, but not the social security contribution system. The results do not incorporate STEs that subsidise parental spending on education or that subsidise firm spending on education. It is assumed that the skills investment is financed wholly with savings: students do not incur any debt to make a skills investment.
12 http://dx.doi.org/10.1787/888933446543
The value of STEs as outlined in figure 5.1 is comparatively small. Significant subsidies
are provided through the tax system in Belgium, in norway, and in the united kingdom.
These results are mainly driven by tax deductibility of scholarship income. In these three
countries scholarship income is both tax deductible and large compared to the estimated
cost of university education. nonetheless, in most countries the value of STEs is modest:
the typical student in the model receives uSD 128 per year in indirect subsidies for tertiary
education through the tax system.
It is possible that these data underestimate the true value the tax system provides to
some students in the form of STEs. This may occur in several ways. first, an estimate of the
average amount of scholarship income in each country is used in the model. as much of
this income is tax-exempt, these deductions provide a significant form of tax expenditure
for skills. However if certain students receive more scholarship income than other students,
their tax expenditure will rise. The case of skills tax allowances is similar. If spending on
tertiary education by some students is high – for example through tuition fees – they may
benefit further from tax deductions for these skills investments than they do in the model.
It is notable that for several countries the estimated value of STEs at tertiary level is
zero. for Iceland no such STEs are currently provided to students. for certain other countries
such as Chile, Italy and Israel, STEs are available, but student income is assumed too low in
the model for the STEs to be of benefit – students are already assumed to have little or no
tax liability. This will be discussed further below.
It is notable that for poland the estimates reported are negative. This can be explained
by noting the results in the figure pertain to STEs in the personal income system only. This
graph omits tax expenditures that may benefit students through SSCs. This conforms to the
approach taken in Chapter 4, where only personal taxes are considered. a key method by
which poland and other countries support skills investments at the tertiary level is through
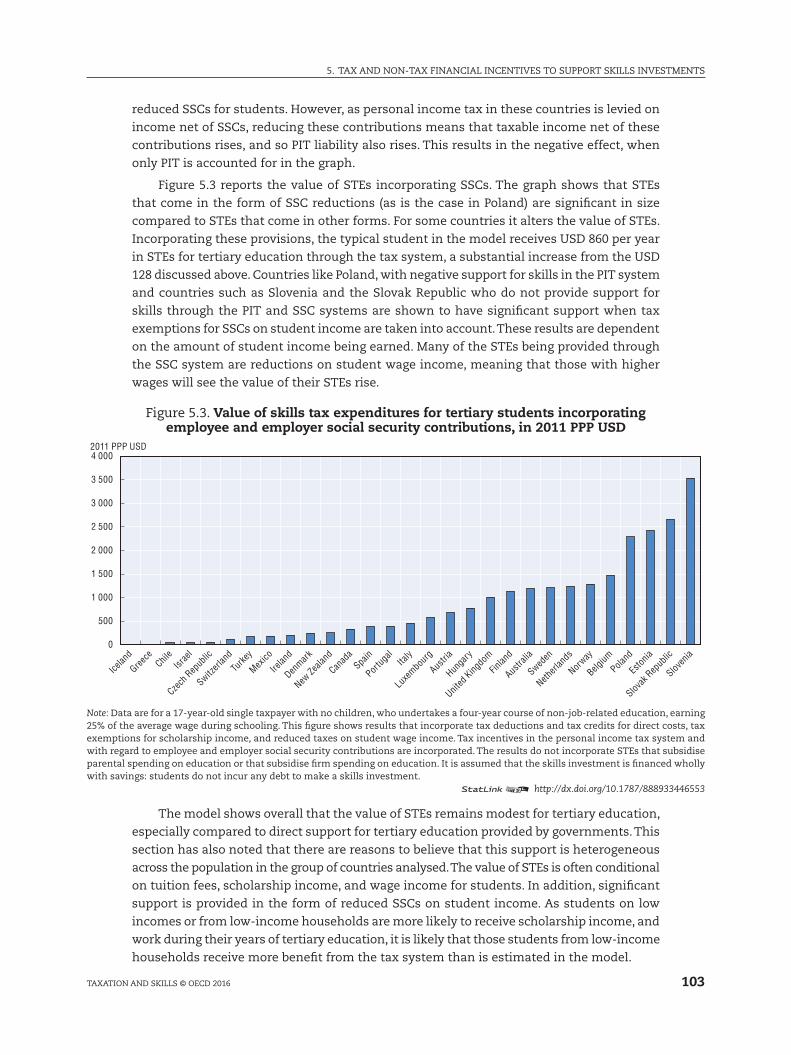
103
5. Tax anD nOn-Tax fInanCIal InCEnTIvES TO SuppOrT SkIllS InvESTmEnTS
TaxaTIOn anD SkIllS © OECD 2016
reduced SSCs for students. However, as personal income tax in these countries is levied on
income net of SSCs, reducing these contributions means that taxable income net of these
contributions rises, and so pIT liability also rises. This results in the negative effect, when
only pIT is accounted for in the graph.
figure 5.3 reports the value of STEs incorporating SSCs. The graph shows that STEs
that come in the form of SSC reductions (as is the case in poland) are significant in size
compared to STEs that come in other forms. for some countries it alters the value of STEs.
Incorporating these provisions, the typical student in the model receives uSD 860 per year
in STEs for tertiary education through the tax system, a substantial increase from the uSD
128 discussed above. Countries like poland, with negative support for skills in the pIT system
and countries such as Slovenia and the Slovak republic who do not provide support for
skills through the pIT and SSC systems are shown to have significant support when tax
exemptions for SSCs on student income are taken into account. These results are dependent
on the amount of student income being earned. many of the STEs being provided through
the SSC system are reductions on student wage income, meaning that those with higher
wages will see the value of their STEs rise.
figure 5.3. Value of skills tax expenditures for tertiary students incorporating employee and employer social security contributions, in 2011 PPP USD
0
500
1 000
1 500
2 000
2 500
3 000
3 500
4 0002011 PPP USD
Icelan
d
Greece
Chile
Israe
l
Czech
Rep
ublic
Switzerl
and
Turke
y
Mexico
Irelan
d
Denmark
New Ze
aland
Canad
aSpa
in
Portug
alIta
ly
Luxe
mbour
g
Austri
a
Hunga
ry
United
Kingdo
m
Finlan
d
Austra
lia
Sweden
Netherl
ands
Norway
Belgium
Poland
Eston
ia
Slovak
Rep
ublic
Sloven
ia
Note: Data are for a 17-year-old single taxpayer with no children, who undertakes a four-year course of non-job-related education, earning 25% of the average wage during schooling. This figure shows results that incorporate tax deductions and tax credits for direct costs, tax exemptions for scholarship income, and reduced taxes on student wage income. Tax incentives in the personal income tax system and with regard to employee and employer social security contributions are incorporated. The results do not incorporate STEs that subsidise parental spending on education or that subsidise firm spending on education. It is assumed that the skills investment is financed wholly with savings: students do not incur any debt to make a skills investment.
12 http://dx.doi.org/10.1787/888933446553
The model shows overall that the value of STEs remains modest for tertiary education,
especially compared to direct support for tertiary education provided by governments. This
section has also noted that there are reasons to believe that this support is heterogeneous
across the population in the group of countries analysed. The value of STEs is often conditional
on tuition fees, scholarship income, and wage income for students. In addition, significant
support is provided in the form of reduced SSCs on student income. as students on low
incomes or from low-income households are more likely to receive scholarship income, and
work during their years of tertiary education, it is likely that those students from low-income
households receive more benefit from the tax system than is estimated in the model.

5. Tax anD nOn-Tax fInanCIal InCEnTIvES TO SuppOrT SkIllS InvESTmEnTS
104 TaxaTIOn anD SkIllS © OECD 2016
Impact of tax incentives for tertiary education
This section assesses the impact of STEs on financial incentives to invest in skills. Specifically,
this section considers the extent to which the presence or absence of these STEs impact the
Breakeven Earnings Increment (BEI), the overall indicator of incentives to invest in skills in the
model. It also assesses the extent to which the presence or absence of STEs affects the overall
indicators of the impact of the tax system on financial incentives to invest in skills, the marginal
Effective Tax rate on Skills (mETr) and the average Effective Tax rate on Skills (aETr).
figure 5.4 shows the BEI for the typical stylised tertiary education student. With STEs,
the data are the same as those presented in Chapter 4. also shown are values of the BEI in
the absence of STEs. In most OECD countries the BEI is higher in a world without STEs than
in a world with STEs. This suggests that in the OECD countries considered, STEs reduce the
amount of earnings needed to break even on a skills investment over time for a hypothetical
student. This is only for a specific educational context (the 17-year old university student
as discussed above) and for a specific set of assumptions about educational costs and
scholarship income levels. as the value of STEs is closely associated with the values of these
educational costs and scholarship income levels, these results reflect these assumptions.
figure 5.4. Breakeven earnings increments on skills with and without skills tax expenditures, incorporating personal income tax only
0
5
10
15
20
25Breakeven Earnings Increments (% of Wage Before Education)
With Skills Tax Expenditures Without Skills Tax Expenditures
Denmark
Sloven
ia
Norway
Sweden
Finlan
d
Belgium
Canad
a
Slovak
Rep
ublic Ita
ly
Turke
y
Austri
a
New Ze
aland
Hunga
ry
Luxe
mbour
g
Poland
Spain
Icelan
d
Eston
ia
Irelan
d
Switzerl
and
Czech
Rep
ublic
United
Kingdo
mGree
ce
Portug
alIsr
ael
Austra
lia
Netherl
ands
Mexico Chil
e
Note: Data are for a 17-year-old single taxpayer with no children, who undertakes a four-year course of non-job-related education, earning 25% of the average wage during schooling. This figure shows results that incorporate tax deductions and tax credits for direct costs, tax exemptions for scholarship income, and reduced taxes on student wage income. Tax incentives in the personal income tax system but not the social security contribution system are incorporated. The results do not incorporate STEs that subsidise parental spending on education or that subsidise firm spending on education. It is assumed that the skills investment is financed wholly with savings: students do not incur any debt to make a skills investment.
12 http://dx.doi.org/10.1787/888933446568
figures 5.5 and 5.6 analyse the changes in the mETr and aETr when STEs are not taken
into account. While figure 5.4 showed the impact of STEs on overall incentives to invest in
education or not, figures 5.5 and 5.6 show whether mETrs and aETrs are impacted by STEs.
The extent to which mETrs and aETrs are impacts by STEs measures whether the impact of
the tax system on financial incentives to invest in skills occurs mainly through the impact
of STEs or it occurs through other tax factors such as the taxation of returns to education.
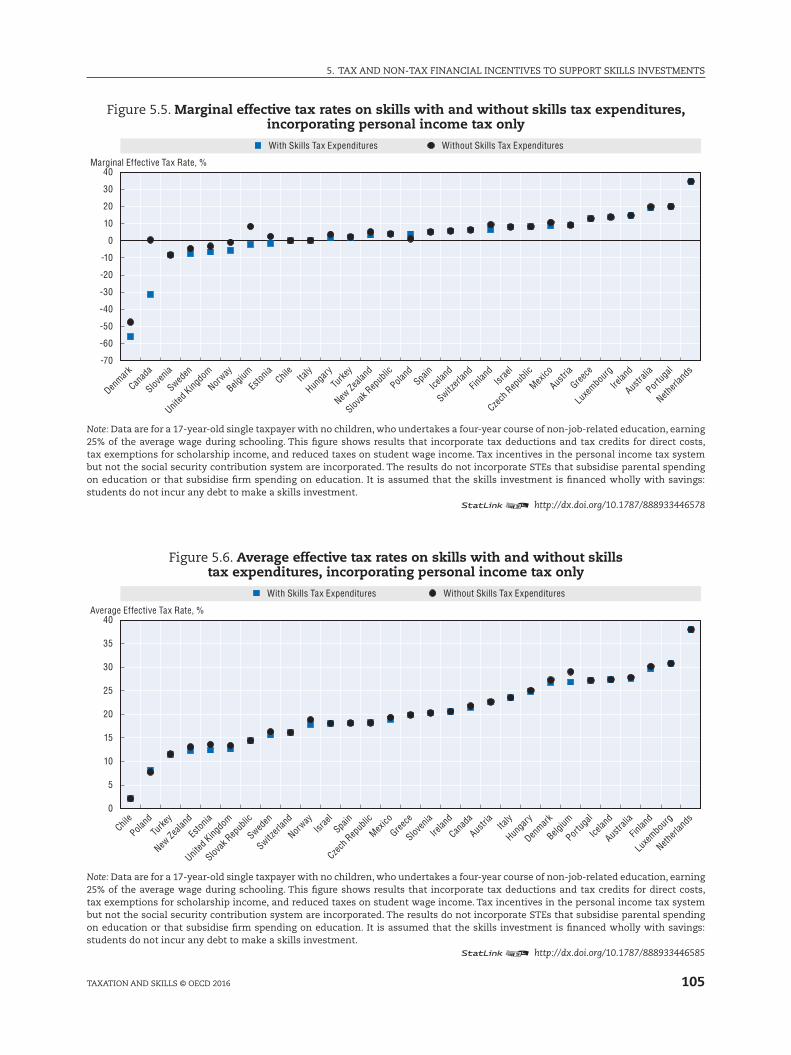
105
5. Tax anD nOn-Tax fInanCIal InCEnTIvES TO SuppOrT SkIllS InvESTmEnTS
TaxaTIOn anD SkIllS © OECD 2016
figure 5.5. Marginal effective tax rates on skills with and without skills tax expenditures, incorporating personal income tax only
-70
-60
-50
-40
-30
-20
-10
0
10
20
30
40Marginal Effective Tax Rate, %
With Skills Tax Expenditures Without Skills Tax Expenditures
Denmark
Canad
a
Sloven
ia
Sweden
United
Kingdo
m
Norway
Belgium
Eston
iaChil
eIta
ly
Hunga
ry
Turke
y
New Ze
aland
Slovak
Rep
ublic
Poland
Spain
Icelan
d
Switzerl
and
Finlan
dIsr
ael
Czech
Rep
ublic
Mexico
Austri
a
Greece
Luxe
mbour
g
Irelan
d
Austra
lia
Portug
al
Netherl
ands
Note: Data are for a 17-year-old single taxpayer with no children, who undertakes a four-year course of non-job-related education, earning 25% of the average wage during schooling. This figure shows results that incorporate tax deductions and tax credits for direct costs, tax exemptions for scholarship income, and reduced taxes on student wage income. Tax incentives in the personal income tax system but not the social security contribution system are incorporated. The results do not incorporate STEs that subsidise parental spending on education or that subsidise firm spending on education. It is assumed that the skills investment is financed wholly with savings: students do not incur any debt to make a skills investment.
12 http://dx.doi.org/10.1787/888933446578
figure 5.6. Average effective tax rates on skills with and without skills tax expenditures, incorporating personal income tax only
0
5
10
15
20
25
30
35
40Average Effective Tax Rate, %
With Skills Tax Expenditures Without Skills Tax Expenditures
Chile
Poland
Turke
y
New Ze
aland
Eston
ia
United
Kingdo
m
Slovak
Rep
ublic
Sweden
Switzerl
and
Norway
Israe
lSpa
in
Czech
Rep
ublic
Mexico
Greece
Sloven
ia
Irelan
d
Canad
a
Austri
aIta
ly
Hunga
ry
Denmark
Belgium
Portug
al
Icelan
d
Austra
lia
Finlan
d
Luxe
mbour
g
Netherl
ands
Note: Data are for a 17-year-old single taxpayer with no children, who undertakes a four-year course of non-job-related education, earning 25% of the average wage during schooling. This figure shows results that incorporate tax deductions and tax credits for direct costs, tax exemptions for scholarship income, and reduced taxes on student wage income. Tax incentives in the personal income tax system but not the social security contribution system are incorporated. The results do not incorporate STEs that subsidise parental spending on education or that subsidise firm spending on education. It is assumed that the skills investment is financed wholly with savings: students do not incur any debt to make a skills investment.
12 http://dx.doi.org/10.1787/888933446585
5. Tax anD nOn-Tax fInanCIal InCEnTIvES TO SuppOrT SkIllS InvESTmEnTS
106 TaxaTIOn anD SkIllS © OECD 2016
figure 5.5 shows that the STEs do reduce the mETr on skills for most of the countries
considered, although modestly in most countries. for example, removing norway’s tax
exemption for scholarship income raises the mETr on skills from -5.6% to -.85%. Similarly
removing Belgium’s tax deduction for student income and tax exemption for scholarship
income raises the mETr on skills from 3.2% to 8.3%. By contrast, the absence of STEs (and
income taxes at 70% of the average wage) in Chile means that the mETr on skills is 0% in
both cases. On average in the sample of countries considered, mETrs for tertiary education
students who would earn 70% of the average wage in the absence of training are 2.9% with
STEs (as was discussed in Chapter 4) and 5.1% without STEs.
figure 5.6 shows that the impact of STEs on aETrs is even more modest. The average
aETr in the sample of countries considered for tertiary education students who would earn
70% of the average wage in the absence of training is 19.1% with STEs (as was discussed
in Chapter 4) and 20.5% without STEs. as discussed in Chapters 3 and 4, the tax rate on an
average skill investment is larger than on a marginal skill investment, as the larger-than-
marginal return on an average skill investment is usually taxed away by progressive taxation.
a regression analysis of the STEs on these three key dependent variables suggests that
the impact of STEs on incentives to invest in skills is indeed modest (see Box 5.1). However,
this does not mean that the tax system overall has no impact on incentives to invest in skills.
Specifically, the extent to which the tax system offsets foregone earnings, or taxes away
the returns to skills was shown to have a larger impact on the overall financial incentives
to invest in skills (as measured by the BEI) than STEs.
Box 5.1. The Drivers of the Tax and Skills Statistics
This box examines the drivers of the key indicators of the tax and skills system outlined in Chapter 4, the mETr on Skills, the aETr on Skills, and the BEI on Skills. as discussed in Chapters 3 and 4, incentives to invest in skills depend on a wide variety of factors; lost earnings, the potential returns to skills, the amount of scholarship income available, tuition fees and non-pecuniary costs. The tax system impacts financial incentives to invest in skills in a variety of ways; reduced earnings during study lead to reduced taxation; increased earnings after study may lead to increased taxation; the costs of a skills investment can be set against tax liability. This box analyses how these various factors impact the key indicators developed in this study.
Approach
The approach taken is to regress key dependent variables on the three outcomes of interest: the mETr, the aETr and the BEI. While regression techniques are used to analyse the results presented in this study in more detail, the data used in the analysis is not the observational data that is typically analysed using these techniques. Because the data is not observational data, but rather manufactured data as part of the indicator-building process, the results serve to illustrate the key moving parts of each indicator, but do not make claims about the deeper relationships between financial incentives to invest in skills and individuals’ responses to these incentives.
The key variables used are the tax rate on foregone earnings (TfE) and the tax rate on the earnings increment that individuals earn after education (TEI). a variable for STEs is also included (STE). This variable is expressed as the difference between the take-home income of a student who works while studying with and without STEs (normalised to thousands of 2011 ppp uSD for all countries). Student income before education is also included to measure the opportunity costs of education (InCb). The number of years of education is also included (Years). a sample regression equation is presented below:
Y T FE T EI STE INCb Yearsij o ij ij ij ij ij ij= + + + + +β β β β β β ε1 2 3 4 5_ _
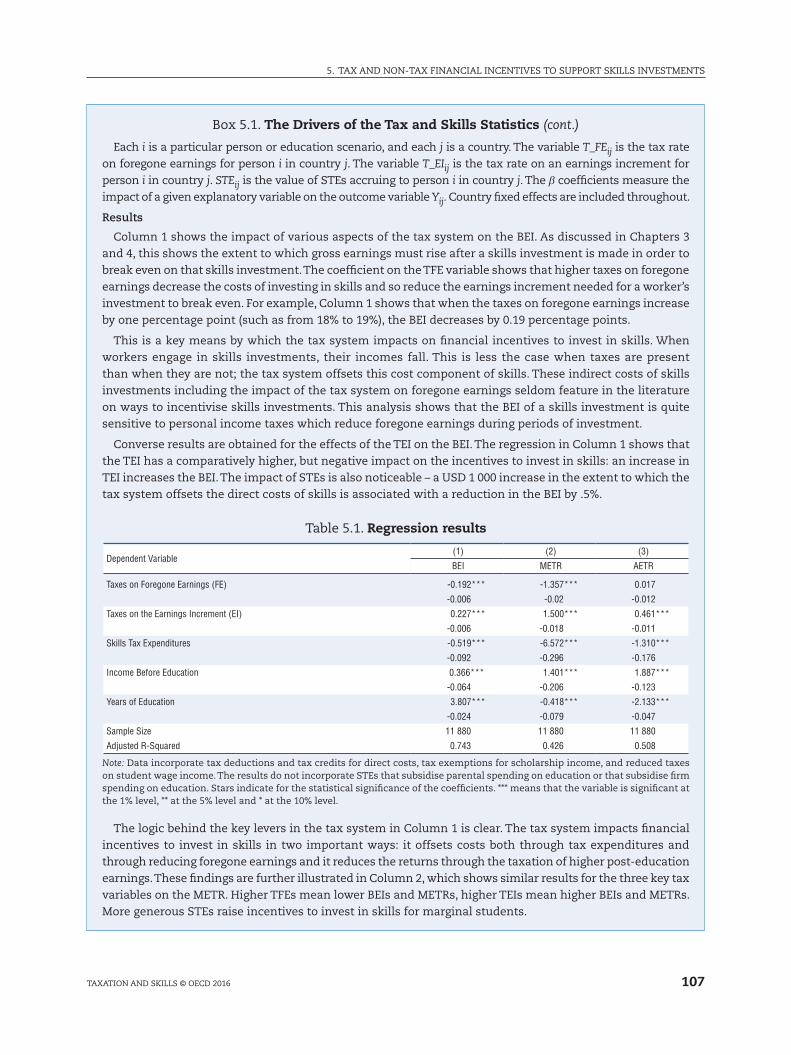
107
5. Tax anD nOn-Tax fInanCIal InCEnTIvES TO SuppOrT SkIllS InvESTmEnTS
TaxaTIOn anD SkIllS © OECD 2016
Each i is a particular person or education scenario, and each j is a country. The variable T_FEij is the tax rate on foregone earnings for person i in country j. The variable T_EIij is the tax rate on an earnings increment for person i in country j. STEij is the value of STEs accruing to person i in country j. The β coefficients measure the impact of a given explanatory variable on the outcome variable Yij. Country fixed effects are included throughout.
Results
Column 1 shows the impact of various aspects of the tax system on the BEI. as discussed in Chapters 3 and 4, this shows the extent to which gross earnings must rise after a skills investment is made in order to break even on that skills investment. The coefficient on the TfE variable shows that higher taxes on foregone earnings decrease the costs of investing in skills and so reduce the earnings increment needed for a worker’s investment to break even. for example, Column 1 shows that when the taxes on foregone earnings increase by one percentage point (such as from 18% to 19%), the BEI decreases by 0.19 percentage points.
This is a key means by which the tax system impacts on financial incentives to invest in skills. When workers engage in skills investments, their incomes fall. This is less the case when taxes are present than when they are not; the tax system offsets this cost component of skills. These indirect costs of skills investments including the impact of the tax system on foregone earnings seldom feature in the literature on ways to incentivise skills investments. This analysis shows that the BEI of a skills investment is quite sensitive to personal income taxes which reduce foregone earnings during periods of investment.
Converse results are obtained for the effects of the TEI on the BEI. The regression in Column 1 shows that the TEI has a comparatively higher, but negative impact on the incentives to invest in skills: an increase in TEI increases the BEI. The impact of STEs is also noticeable – a uSD 1 000 increase in the extent to which the tax system offsets the direct costs of skills is associated with a reduction in the BEI by .5%.
Table 5.1. Regression results
Dependent Variable(1) (2) (3)
BEI METR AETR
Taxes on Foregone Earnings (FE) -0.192*** -1.357*** 0.017
-0.006 -0.02 -0.012
Taxes on the Earnings Increment (EI) 0.227*** 1.500*** 0.461***
-0.006 -0.018 -0.011
Skills Tax Expenditures -0.519*** -6.572*** -1.310***
-0.092 -0.296 -0.176
Income Before Education 0.366*** 1.401*** 1.887***
-0.064 -0.206 -0.123
Years of Education 3.807*** -0.418*** -2.133***
-0.024 -0.079 -0.047
Sample Size 11 880 11 880 11 880
Adjusted R-Squared 0.743 0.426 0.508
Note: Data incorporate tax deductions and tax credits for direct costs, tax exemptions for scholarship income, and reduced taxes on student wage income. The results do not incorporate STEs that subsidise parental spending on education or that subsidise firm spending on education. Stars indicate for the statistical significance of the coefficients. *** means that the variable is significant at the 1% level, ** at the 5% level and * at the 10% level.
The logic behind the key levers in the tax system in Column 1 is clear. The tax system impacts financial incentives to invest in skills in two important ways: it offsets costs both through tax expenditures and through reducing foregone earnings and it reduces the returns through the taxation of higher post-education earnings. These findings are further illustrated in Column 2, which shows similar results for the three key tax variables on the mETr. Higher TfEs mean lower BEIs and mETrs, higher TEIs mean higher BEIs and mETrs. more generous STEs raise incentives to invest in skills for marginal students.
Box 5.1. The Drivers of the Tax and Skills Statistics (cont.)
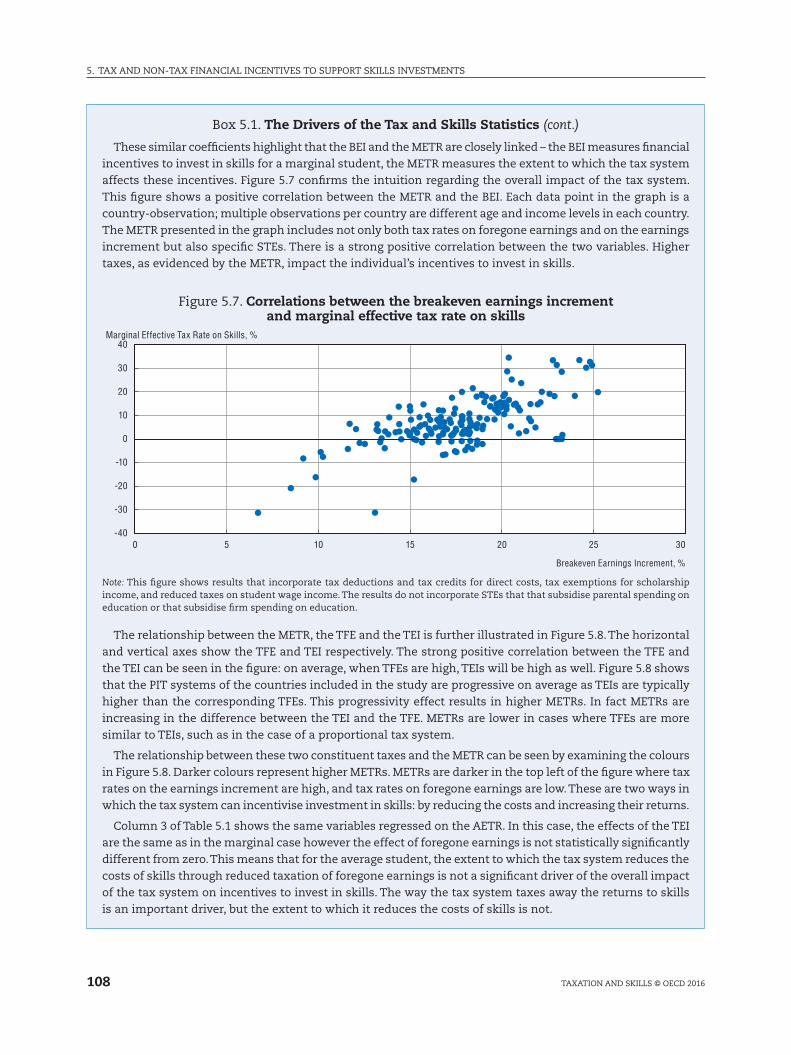
5. Tax anD nOn-Tax fInanCIal InCEnTIvES TO SuppOrT SkIllS InvESTmEnTS
108 TaxaTIOn anD SkIllS © OECD 2016
These similar coefficients highlight that the BEI and the mETr are closely linked – the BEI measures financial incentives to invest in skills for a marginal student, the mETr measures the extent to which the tax system affects these incentives. figure 5.7 confirms the intuition regarding the overall impact of the tax system. This figure shows a positive correlation between the mETr and the BEI. Each data point in the graph is a country-observation; multiple observations per country are different age and income levels in each country. The mETr presented in the graph includes not only both tax rates on foregone earnings and on the earnings increment but also specific STEs. There is a strong positive correlation between the two variables. Higher taxes, as evidenced by the mETr, impact the individual’s incentives to invest in skills.
figure 5.7. Correlations between the breakeven earnings increment and marginal effective tax rate on skills
-40
-30
-20
-10
0
10
20
30
40
0 5 10 15 20 25 30
Marginal Effective Tax Rate on Skills, %
Breakeven Earnings Increment, %
Note: This figure shows results that incorporate tax deductions and tax credits for direct costs, tax exemptions for scholarship income, and reduced taxes on student wage income. The results do not incorporate STEs that that subsidise parental spending on education or that subsidise firm spending on education.
The relationship between the mETr, the TfE and the TEI is further illustrated in figure 5.8. The horizontal and vertical axes show the TfE and TEI respectively. The strong positive correlation between the TfE and the TEI can be seen in the figure: on average, when TfEs are high, TEIs will be high as well. figure 5.8 shows that the pIT systems of the countries included in the study are progressive on average as TEIs are typically higher than the corresponding TfEs. This progressivity effect results in higher mETrs. In fact mETrs are increasing in the difference between the TEI and the TfE. mETrs are lower in cases where TfEs are more similar to TEIs, such as in the case of a proportional tax system.
The relationship between these two constituent taxes and the mETr can be seen by examining the colours in figure 5.8. Darker colours represent higher mETrs. mETrs are darker in the top left of the figure where tax rates on the earnings increment are high, and tax rates on foregone earnings are low. These are two ways in which the tax system can incentivise investment in skills: by reducing the costs and increasing their returns.
Column 3 of Table 5.1 shows the same variables regressed on the aETr. In this case, the effects of the TEI are the same as in the marginal case however the effect of foregone earnings is not statistically significantly different from zero. This means that for the average student, the extent to which the tax system reduces the costs of skills through reduced taxation of foregone earnings is not a significant driver of the overall impact of the tax system on incentives to invest in skills. The way the tax system taxes away the returns to skills is an important driver, but the extent to which it reduces the costs of skills is not.
Box 5.1. The Drivers of the Tax and Skills Statistics (cont.)
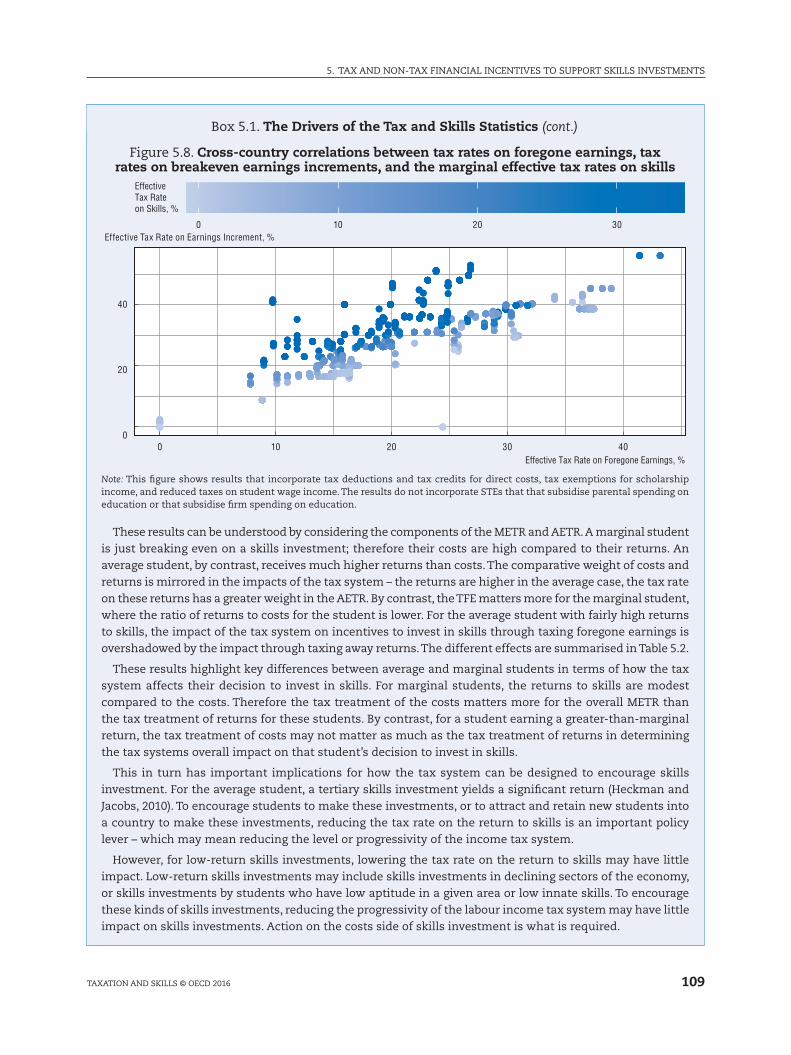
109
5. Tax anD nOn-Tax fInanCIal InCEnTIvES TO SuppOrT SkIllS InvESTmEnTS
TaxaTIOn anD SkIllS © OECD 2016
figure 5.8. Cross-country correlations between tax rates on foregone earnings, tax rates on breakeven earnings increments, and the marginal effective tax rates on skills
00 10 20 30 40
20
40
0 10 20 30Effective Tax Rate on Earnings Increment, %
EffectiveTax Rate on Skills, %
Effective Tax Rate on Foregone Earnings, %
Note: This figure shows results that incorporate tax deductions and tax credits for direct costs, tax exemptions for scholarship income, and reduced taxes on student wage income. The results do not incorporate STEs that that subsidise parental spending on education or that subsidise firm spending on education.
These results can be understood by considering the components of the mETr and aETr. a marginal student is just breaking even on a skills investment; therefore their costs are high compared to their returns. an average student, by contrast, receives much higher returns than costs. The comparative weight of costs and returns is mirrored in the impacts of the tax system – the returns are higher in the average case, the tax rate on these returns has a greater weight in the aETr. By contrast, the TfE matters more for the marginal student, where the ratio of returns to costs for the student is lower. for the average student with fairly high returns to skills, the impact of the tax system on incentives to invest in skills through taxing foregone earnings is overshadowed by the impact through taxing away returns. The different effects are summarised in Table 5.2.
These results highlight key differences between average and marginal students in terms of how the tax system affects their decision to invest in skills. for marginal students, the returns to skills are modest compared to the costs. Therefore the tax treatment of the costs matters more for the overall mETr than the tax treatment of returns for these students. By contrast, for a student earning a greater-than-marginal return, the tax treatment of costs may not matter as much as the tax treatment of returns in determining the tax systems overall impact on that student’s decision to invest in skills.
This in turn has important implications for how the tax system can be designed to encourage skills investment. for the average student, a tertiary skills investment yields a significant return (Heckman and Jacobs, 2010). To encourage students to make these investments, or to attract and retain new students into a country to make these investments, reducing the tax rate on the return to skills is an important policy lever – which may mean reducing the level or progressivity of the income tax system.
However, for low-return skills investments, lowering the tax rate on the return to skills may have little impact. low-return skills investments may include skills investments in declining sectors of the economy, or skills investments by students who have low aptitude in a given area or low innate skills. To encourage these kinds of skills investments, reducing the progressivity of the labour income tax system may have little impact on skills investments. action on the costs side of skills investment is what is required.
Box 5.1. The Drivers of the Tax and Skills Statistics (cont.)

5. Tax anD nOn-Tax fInanCIal InCEnTIvES TO SuppOrT SkIllS InvESTmEnTS
110 TaxaTIOn anD SkIllS © OECD 2016
regression analysis in Box 5.1 also suggests that STEs also had very little impact on the
aETr. average skills investments are usually profitable: the returns are much larger than the
costs. This means that the fact that the tax system taxes away the returns to skills matters
much more overall than the impact of the tax system on the costs of skills investments.
STEs are more impactful for marginal and low-return skills investments. The impact
of the tax system on the costs of STEs is a much larger part of the overall skills investment
calculus for skills investments where the costs are higher than the returns. In the modelled
cases of a marginal skills investment where the student is just breaking even, the costs are
the same as the returns. In these cases, the impact of STEs on the overall skills investment
calculus is more significant.
Empirical analyses of impact of tax incentives for tertiary education
The above analysis has sought to quantify the overall size of STEs in the sample of
countries considered, as well as to assess their impact on the key indicators developed
in this study. The overall impact of STEs is modest for a typical student, though it may be
larger for students in receipt of larger amounts of scholarship income, with larger amounts
of tuition expenses, or with larger amounts of student earned income. This section provides
some evidence of the impact of STEs on the tertiary enrolment and completion outcomes
for students.
The country that uses the tax system to encourage skills investment most is the united
States. Details of the STEs in the united States are discussed in more detail in annex D of
this study. Turner (2011) finds the introduction of tax-based student aid increases full-time
enrolment in the first two years of tertiary education. However, recent empirical studies
suggest that expansion of the key tax credits for education expenses used in the united
States – the expansion of the american Opportunity Tax Credit over its predecessor, the
Hope Tax Credit has no statistically significant effect on the tertiary enrolment decisions of
students. Bulman and Hoxby (2015) find, using two separate identification strategies including
regression kink and simulated instruments, that the credit does not increase enrolment.
This is not to say that the credit provides no financial benefit to certain students who receive
them. rather, the results suggest that near the phase-out portion of the schedule that the
reduction in credit amount does not impact enrolment, and also that the expansion of the
credits does not induce students to enroll. Similar effects are found in other research for
the tax deduction for post-secondary education (Hoxby and Bulman, 2015). Though only
based on one country with comparatively high tuition fees, these results suggest that two
Table 5.2. Effects of income on the AETRs and METRs on average in the tax systems of 30 OECD countries
Average Student Marginal Student
Impact of Tax System
Ratio of Earnings to Costs Higher Lower
Weight of Taxes on Costs Lower Higher
Weight of Taxes on Returns Higher Lower
Impact of TEI Strong Strong
Impact of TFE Weaker Strong
Box 5.1. The Drivers of the Tax and Skills Statistics (cont.)
111
5. Tax anD nOn-Tax fInanCIal InCEnTIvES TO SuppOrT SkIllS InvESTmEnTS
TaxaTIOn anD SkIllS © OECD 2016
key kinds of STEs used in the OECD – tax credits for education expenses and tax deductions
for education expenses – may be limited in their impacts on student outcomes.
In a further uS study based on the enactment of the tax credit programs in 1998, and
from the increase in the value of the lifetime learning Tax Credit and introduction of the
Tuition Deduction between the 1999-2000 and 2003-04 school years, Turner (2012) finds that
for a subset of four-year institutions, that the schools reduced aid to students in response to
the tax subsidies. By examining tertiary tuition prices, he finds that much of the increases
in financial resources provided to students through the tax cut were captured by tertiary
institutions by decreases in school grant aid. It may be that these extra resources increased the
quality of education available to those students who did attend university, but this is difficult
to demonstrate. These results suggest crowding out of student aid provided by tertiary
institutions in the united States: credits targeted at reducing student costs may in fact be
a form of subsidy to educational institutions through the tax system. Though this research
raises questions as to the efficacy of tax credits as a means to raise skills investments, it is
possible that tuition fee responsiveness will be lower in non-uS OECD countries, which have
more heavily regulated tertiary sectors. This means that other countries may have more
success in using these kinds of credits to reduce the costs for students.
Some modest effects for tax credits are found by other authors. Guzman (2013) finds
that in the uS tax credits for education caused more students to attend private for-profit
colleges, which may suggest that the credits allow students to attend more expensive
for-profit schools, though effects at the intensive margin may not exist. In a subsample of
30 and 40 year-olds, lalumia (2012), finds that while the lifetime learning Tax Credit had
no statistically significant effect on average, eligibility for an education tax subsidy was
associated with an increase in the probability of tertiary attendance among “men whose 1998
educational attainment falls short of early-life educational expectations”. This conclusion
supports the OECD data analysis presented above. While STEs targeted at average students
may not have significant impacts as a means of increasing skills investments, STEs may
have an impact among students with low potential returns to skills investments. positive
impacts of STEs on enrolment are also found by Bednar and Gicheva (2013), but with respect
to graduate education instead of tertiary education.
The evidence on reducing taxes on student labour income also suggests that this policy
lever may not be ideal for governments. reduced social contributions on student wage
income are a significant source of government support for students. However, there is also
need for caution – increasing the amount of student part-time work may reduce credit
constraints for students from low-income families, but may negatively impact educational
outcomes for these students. using data from a Swedish reform, avdic and Gartell (2015)
find that when financial aid policies changed to give students an incentive to work longer
hours, some students worked more. This in turn negatively impacted the amount of time
required to complete a degree for some students. While reducing the tax burden on student
work may provide students with increased resources with which to invest in education, it
may do so while depleting their ability to study and complete their degrees.
There are different reasons why STEs may be of limited use in encouraging skills
investments at tertiary level. Cameron and Heckman (1999) argue that a wider variety of
factors are behind the decision not to attend university in addition to financial factors.
for low-income families, the non-pecuniary costs of attending a tertiary institution (lack
of motivation, lack of success in secondary education, lack of family role models, lack of
information) may constitute an additional burden to tertiary attendance. This means that
5. Tax anD nOn-Tax fInanCIal InCEnTIvES TO SuppOrT SkIllS InvESTmEnTS
112 TaxaTIOn anD SkIllS © OECD 2016
attempting to increase tertiary enrolment by using STEs without addressing other obstacles
may prove ineffective. Similar conclusions are discussed in Cunha et al. (2006) and in
Heckman and Jacobs (2010). They find that the overall education decision comes with both
pecuniary costs (tuition fees, lost earnings) and non-pecuniary costs (study effort, lost leisure
time). In such situations where pecuniary costs are heavily subsidised, they may crowd out
non-pecuniary costs such as study effort. In such situations, they argue “high subsidies on
education may then go hand in hand with long study durations, high drop-out rates and
low student performance” (Heckman and Jacobs, 2010).
The evidence suggests that the existing STEs are of limited effectiveness in increasing
the amount of skills investments at tertiary level. In addition, these policies may have
unintended consequences such as increased tuition fees by universities in response to tax
credits, or reduced student effort or longer student working hours which can increase time-
to-completion of degrees. Dynarski et. al. (2015) point to many design flaws with the system
of STEs in the united States, which limit their effectiveness.
Distributional impact of tax incentives for tertiary education
a key component in the discussion of tax and skills policy is the distributional impacts of
STEs. as discussed in Chapter 1 of this study, skills policies are a key inclusive growth policy
measure. Increasing the human capital for those whose existing levels are low has many
beneficial effects; it raises wages, productivity and labour market attachment. By decreasing
wage inequality, it reduces the need to implement distortionary taxes and pay benefits to
reduce disposable income disparities. assessing tax and skills policies from the perspective
of those with low skills and low incomes is crucial for assessing these policies’ effectiveness.
The distributional aspects of tax and skills policies have two related but distinct
dimensions. Tax and skills policies can be addressed towards those with low incomes but
for whom skills investments will be very profitable; those with low incomes but strong innate
skills. Skills investments yielding high returns are very beneficial from the perspective of
addressing income inequality. But another distributional margin is also important: that
between low-return skills investments and high-return skills investments. Box 5.1 has
described how STEs have larger effects on a marginal skills investment than on an average
skills investment. policies that reduce skills costs may benefit low-return skills investments
more than policies that reduce the taxation of those returns.
These policies – that may benefit a marginal skills investment more than an average
skills investment – may also yield positive distributional outcomes. In providing benefits to
skills investments with low returns, policies targeted at reducing skills costs are beneficial in
that they may provide larger benefits to those with low innate skills, who may receive lower
benefits from further skills investments than those with higher skills. In providing benefits
to those making these investments, these policies may simply offer a form of insurance
against the unlucky: those who have made a skills investment yielding positive expected
net returns to investment but negative actual returns. This means that these policies are
a potential targeted measure towards those whose lifetime income is expected to be low.
figure 5.9 assesses STEs in the sample of countries by income before a skills investment. It
shows the impact of removing all STEs including SSCs on the BEI – the same data as figure 5.4 –
but varies the results over the income distribution. It shows, in part, whether these STEs raise
financial incentives to invest in skills more for those on lower incomes or those on higher
incomes. In other words, analysing BEIs with and without STEs over the income level is the
same as analysing whether these STEs are progressive with respect to income before education.
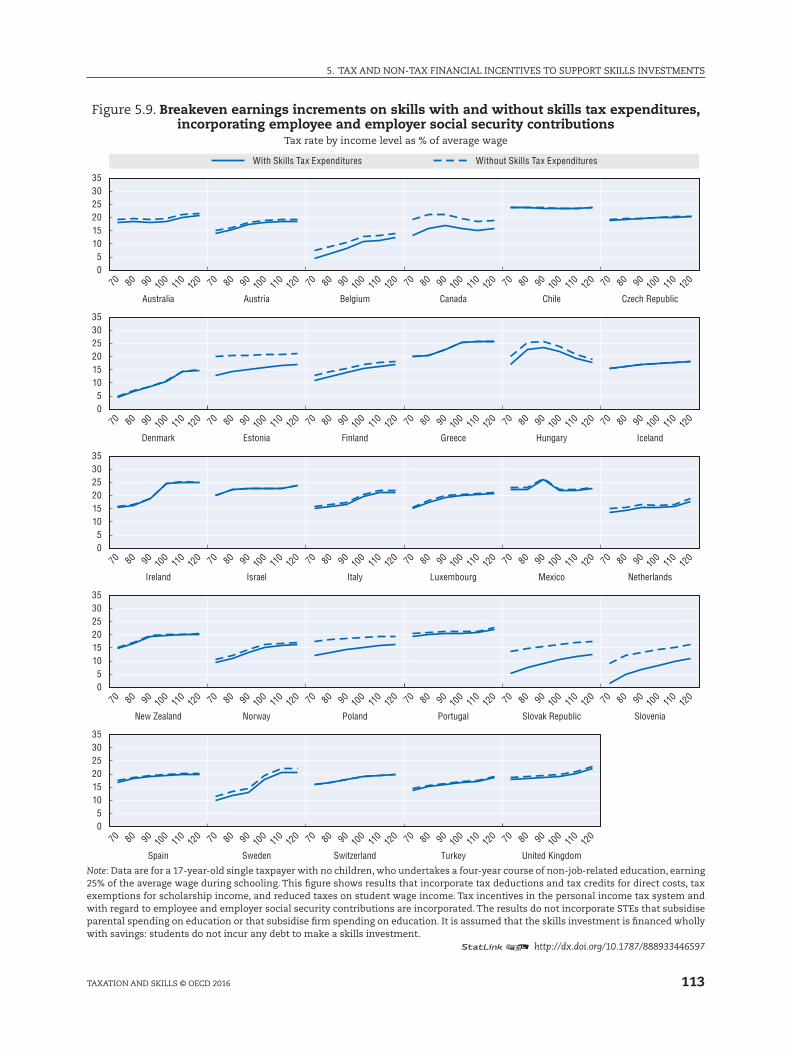
113
5. Tax anD nOn-Tax fInanCIal InCEnTIvES TO SuppOrT SkIllS InvESTmEnTS
TaxaTIOn anD SkIllS © OECD 2016
figure 5.9. Breakeven earnings increments on skills with and without skills tax expenditures, incorporating employee and employer social security contributions
Tax rate by income level as % of average wage
05
101520253035
05
101520253035
05
101520253035
05
101520253035
05
101520253035
70 80 9010
011
012
0 70 80 9010
011
012
0 70 80 9010
011
012
0 70 80 9010
011
012
0 70 80 9010
011
012
0 70 80 9010
011
012
0
70 80 9010
011
012
0 70 80 9010
011
012
0 70 80 9010
011
012
0 70 80 9010
011
012
0 70 80 9010
011
012
0 70 80 9010
011
012
0
70 80 9010
011
012
0 70 80 9010
011
012
0 70 80 9010
011
012
0 70 80 9010
011
012
0 70 80 9010
011
012
0 70 80 9010
011
012
0
70 80 9010
011
012
0 70 80 9010
011
012
0 70 80 9010
011
012
0 70 80 9010
011
012
0 70 80 9010
011
012
0 70 80 9010
011
012
0
70 80 9010
011
012
0 70 80 9010
011
012
0 70 80 9010
011
012
0 70 80 9010
011
012
0 70 80 9010
011
012
0
With Skills Tax Expenditures Without Skills Tax Expenditures
Australia Austria
Estonia
Belgium
Finland
Italy
Canada Chile Czech Republic
Greece Hungary Iceland
Luxembourg Mexico Netherlands
Portugal Slovak Republic Slovenia
United Kingdom
Denmark
Ireland Israel
New Zealand Norway Poland
Sweden Switzerland TurkeySpain
Note: Data are for a 17-year-old single taxpayer with no children, who undertakes a four-year course of non-job-related education, earning 25% of the average wage during schooling. This figure shows results that incorporate tax deductions and tax credits for direct costs, tax exemptions for scholarship income, and reduced taxes on student wage income. Tax incentives in the personal income tax system and with regard to employee and employer social security contributions are incorporated. The results do not incorporate STEs that subsidise parental spending on education or that subsidise firm spending on education. It is assumed that the skills investment is financed wholly with savings: students do not incur any debt to make a skills investment.
12 http://dx.doi.org/10.1787/888933446597
5. Tax anD nOn-Tax fInanCIal InCEnTIvES TO SuppOrT SkIllS InvESTmEnTS
114 TaxaTIOn anD SkIllS © OECD 2016
figure 5.9 shows that in the OECD these STEs are usually progressive; though not always.
for some countries, STEs are modest in size (for example, in Greece, Turkey, and Switzerland).
In these countries, their impact is not particularly large for university students, either at
the higher or lower end of the income distribution. However, in other countries, STEs exist
that provide proportionally larger reductions in the necessary breakeven returns to skills to
those on low incomes than to those on higher incomes. These BEI gaps are likely a result of
provisions that exempt some student wage income from taxes or SSCs (e.g. Belgium). There
are also some countries for which the proportional reduction in the BEI remains broadly
constant across the income levels considered (e.g. for norway and Sweden).
a key factor in the degree of progressivity of STEs is that many of them come in the form
of allowances or credits, so that resources spent on skills investments can be claimed against
taxable income or tax payable. However this means that the credits provide value when a
taxpayer is making a skills investment and has some taxable income. Students with no taxable
income will in general receive less benefit from tax allowances and credits than other students,
unless the credit is fully refundable. This may make STEs in the form of deductions and credits
less progressive than other forms of STEs. This is discussed further in Box 5.2.
Box 5.2. Carry-forwards of Tax Credits in the OECD
Six countries in the sample considered in this study provide tax credits for tertiary education. a drawback of tax credits for education is that they may not benefit students from low-income families, who may not have sufficient tax liabilities to benefit fully from the credit. This is also the case with respect to tax allowances. Details of the credits as they existed in 2011 are provided in Table 5.3. Different countries deal with this issue in different ways. Some countries (such as the united States) make the credit partially refundable, to ensure that low-income households benefit from the credit. Other countries such as Canada allow the value of the credit to be transferred to other members of the household, though this may not be effective if other household members also have low incomes. finally, some countries including Canada and Israel allow a student to carry forward the value of the credit to future years. a full carry forward of STEs is further analysed by Stantcheva (2015).
Table 5.3. Tax credits for university education in the OECD
Amount (for single households) Minimum Value Maximum Value Refundable Carry Forward
Canada 15% of eligible expenses None None No Yes
Israel ILS 2 508 NA (fixed amount) NA (fixed amount) No Yes
Ireland 20% of eligible expenses EUR 2 0001 EUR 7 000 No No
Italy 19% of eligible expenses None None No No
Portugal 30% of eligible expenses None EUR 475 No No
United States 100% of first USD 2 000 of expenses less related scholarships and 25% of next USD 2 000 of expenses less related scholarships.
None USD 2 500 Yes No
1. In Ireland, this value was Eur 3 000 in 2016.
Canada’s Tuition Tax Credit provided a 15% non-refundable tax credit of the costs of tuition in 2011 (the year estimated in the model underlying this study). There was no limit on the amount of tuition that could be claimed, but claims must have been higher than CaD 100. In addition, the credit could be carried forward against future tax liability for students who do not exhaust the value of the credit in the first year, or transferred to a supporting individual. In addition to the aOTC (american Opportunity Tax Credit) presented in Table 5.3, the united States has the lifetime learning Tax Credit that is not refundable. The aOTC also phases out at uSD 80 000 (see annex D).
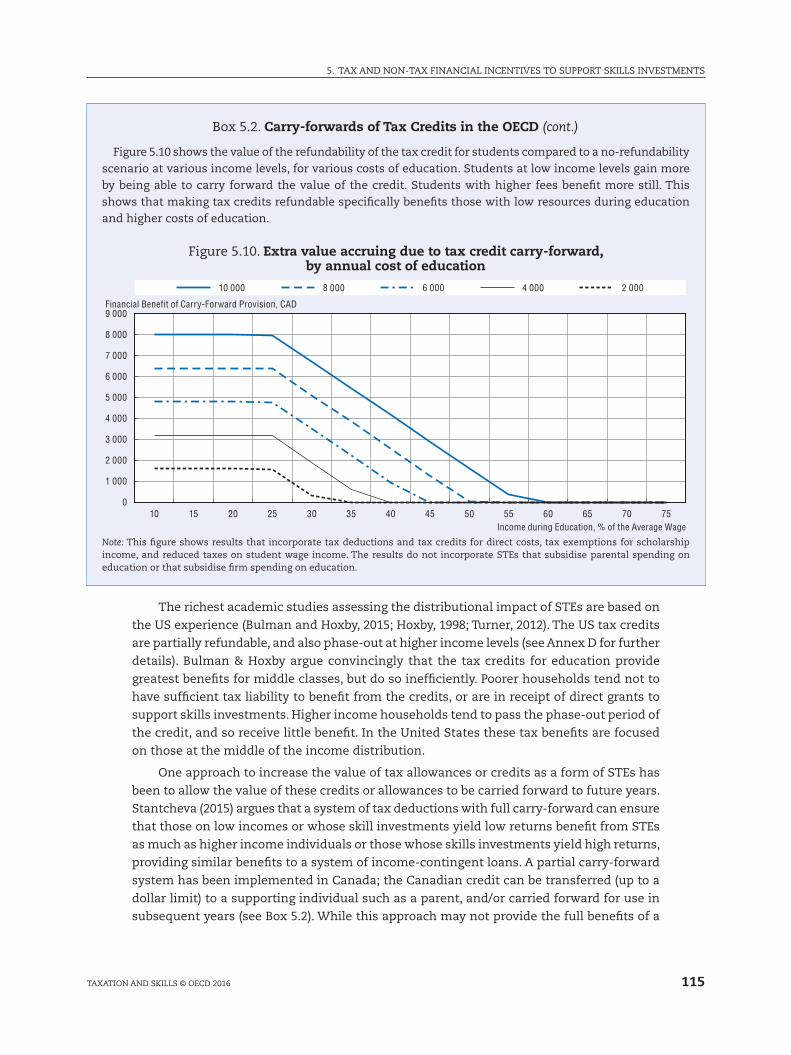
115
5. Tax anD nOn-Tax fInanCIal InCEnTIvES TO SuppOrT SkIllS InvESTmEnTS
TaxaTIOn anD SkIllS © OECD 2016
The richest academic studies assessing the distributional impact of STEs are based on
the uS experience (Bulman and Hoxby, 2015; Hoxby, 1998; Turner, 2012). The uS tax credits
are partially refundable, and also phase-out at higher income levels (see annex D for further
details). Bulman & Hoxby argue convincingly that the tax credits for education provide
greatest benefits for middle classes, but do so inefficiently. poorer households tend not to
have sufficient tax liability to benefit from the credits, or are in receipt of direct grants to
support skills investments. Higher income households tend to pass the phase-out period of
the credit, and so receive little benefit. In the united States these tax benefits are focused
on those at the middle of the income distribution.
One approach to increase the value of tax allowances or credits as a form of STEs has
been to allow the value of these credits or allowances to be carried forward to future years.
Stantcheva (2015) argues that a system of tax deductions with full carry-forward can ensure
that those on low incomes or whose skill investments yield low returns benefit from STEs
as much as higher income individuals or those whose skills investments yield high returns,
providing similar benefits to a system of income-contingent loans. a partial carry-forward
system has been implemented in Canada; the Canadian credit can be transferred (up to a
dollar limit) to a supporting individual such as a parent, and/or carried forward for use in
subsequent years (see Box 5.2). While this approach may not provide the full benefits of a
figure 5.10 shows the value of the refundability of the tax credit for students compared to a no-refundability scenario at various income levels, for various costs of education. Students at low income levels gain more by being able to carry forward the value of the credit. Students with higher fees benefit more still. This shows that making tax credits refundable specifically benefits those with low resources during education and higher costs of education.
figure 5.10. Extra value accruing due to tax credit carry-forward, by annual cost of education
0
1 000
2 000
3 000
4 000
5 000
6 000
7 000
8 000
9 000Financial Benefit of Carry-Forward Provision, CAD
Income during Education, % of the Average Wage
10 000 8 000 6 000 4 000 2 000
10 15 20 25 30 35 40 45 50 55 60 65 70 75
Note: This figure shows results that incorporate tax deductions and tax credits for direct costs, tax exemptions for scholarship income, and reduced taxes on student wage income. The results do not incorporate STEs that subsidise parental spending on education or that subsidise firm spending on education.
Box 5.2. Carry-forwards of Tax Credits in the OECD (cont.)

5. Tax anD nOn-Tax fInanCIal InCEnTIvES TO SuppOrT SkIllS InvESTmEnTS
116 TaxaTIOn anD SkIllS © OECD 2016
credit to low-income households in net present value terms, it improves the equity of such
credits relative to a non-refundable credit without a carry-forward provision.
Design considerations of tax incentives for tertiary education
The above discussion has highlighted potential issues with STEs as a means of
increasing the level of skills investments. These instruments may be biased against
individuals with low skills and households with low incomes. There is mixed evidence
about the extent to which STEs achieve their goals when it comes to tertiary education.
nonetheless, these tools remain an important part of the policy mix in many OECD
countries. With this in mind, this section discusses several key recommendations that
should be considered when tax policy makers are designing STEs for tertiary education
so that their impact can be maximised.
The literature in the area of tertiary-based STEs has highlighted that the complexity of
STEs can reduce their effectiveness. OECD countries provide scholarships, grants, student
loans, tax deductions and tax credits to students and parents, as well as tax or SSC reductions
for student work. many STEs interact with each other; in some countries it is not possible
to benefit from some provisions with some others. Eligibility criteria for loans, deductions,
credits and student grants can be designed in an uncoordinated way. Interactions between
different aspects of the tax and student support system must be designed in a holistic way,
especially where these provisions are administered and designed by different ministries
or agencies. Where eligibility for one program removes eligibility for another, the effective
marginal rates of support can be very far from policy makers’ original intentions.
a second consideration stemming from overlapping programs is that these programs
are complex and difficult to understand for taxpayers. This can lead taxpayers to make poor
choices as to which programs are best for them. This complexity has been argued to be a key
component as to why some of these policy measures are not effective (Davis, 2002; Dynarski
and Scott-Clayton, 2015). In one uS-based study, one in four taxpayers were found to mis-claim
credits or deductions or not to choose the method of support that would be most beneficial
for them (Turner, 2011). This study also found that low-income taxpayers are also more likely
to mis-claim tax support for skills investments. Simplicity of tax and other forms of support
is a key means of both ensuring the effectiveness and the equity of this form of support.
a third issue that can be important in designing the tax benefits for skills is that many
low-income families may be credit constrained with respect to human capital investments
(Carneiro and Heckman, 2002). Grants, scholarships, and tax benefits may provide an
important means of reducing these constraints. However, for many households, the costs
of human capital investments are incurred up-front, while the tax benefits can only be
realised later in the tax year. for some families, this may nullify the usefulness of STEs
(Dynarski and Scott-Clayton, 2015). This is another reason why direct support in the form
of grants made available to individuals and families when skills investments are made may
be a superior policy tool when compared to STEs which are available later in the tax year.
5.3 Non-tax financial incentives for tertiary educationSection 5.2 of this chapter discussed the ways in which the STEs can impact incentives
to invest in skills for tertiary education. This section focuses on non-tax provisions that
can provide financial incentives for students to invest in skills, such as reduced tuition
fees, scholarships, grants and subsidised loans. The model developed in this study also
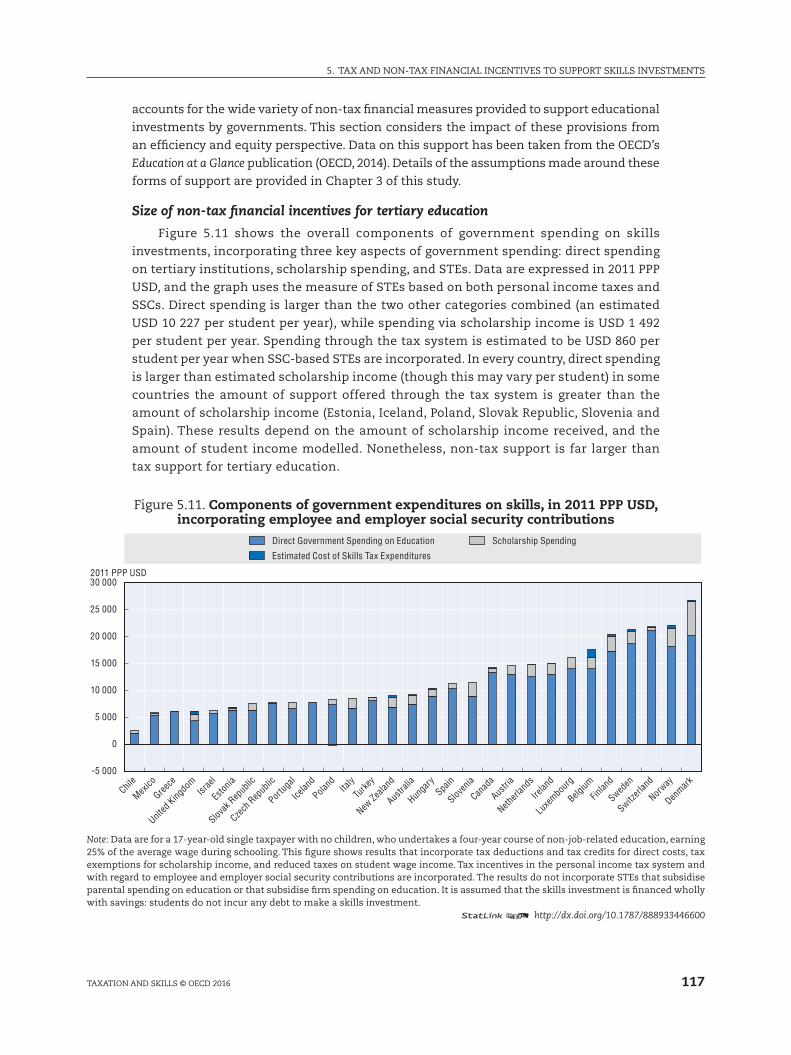
117
5. Tax anD nOn-Tax fInanCIal InCEnTIvES TO SuppOrT SkIllS InvESTmEnTS
TaxaTIOn anD SkIllS © OECD 2016
accounts for the wide variety of non-tax financial measures provided to support educational
investments by governments. This section considers the impact of these provisions from
an efficiency and equity perspective. Data on this support has been taken from the OECD’s
Education at a Glance publication (OECD, 2014). Details of the assumptions made around these
forms of support are provided in Chapter 3 of this study.
Size of non-tax financial incentives for tertiary education
figure 5.11 shows the overall components of government spending on skills
investments, incorporating three key aspects of government spending: direct spending
on tertiary institutions, scholarship spending, and STEs. Data are expressed in 2011 ppp
uSD, and the graph uses the measure of STEs based on both personal income taxes and
SSCs. Direct spending is larger than the two other categories combined (an estimated
uSD 10 227 per student per year), while spending via scholarship income is uSD 1 492
per student per year. Spending through the tax system is estimated to be uSD 860 per
student per year when SSC-based STEs are incorporated. In every country, direct spending
is larger than estimated scholarship income (though this may vary per student) in some
countries the amount of support offered through the tax system is greater than the
amount of scholarship income (Estonia, Iceland, poland, Slovak republic, Slovenia and
Spain). These results depend on the amount of scholarship income received, and the
amount of student income modelled. nonetheless, non-tax support is far larger than
tax support for tertiary education.
figure 5.11. Components of government expenditures on skills, in 2011 PPP USD, incorporating employee and employer social security contributions
-5 000
0
5 000
10 000
15 000
20 000
25 000
30 0002011 PPP USD
Scholarship Spending
Estimated Cost of Skills Tax Expenditures
Direct Government Spending on Education
Chile
Mexico
Greece
United
Kingdo
mIsr
ael
Eston
ia
Slovak
Rep
ublic
Czech
Rep
ublic
Portug
al
Icelan
d
Poland Ita
ly
Turke
y
New Ze
aland
Austra
lia
Hunga
rySpa
in
Sloven
ia
Canad
a
Austri
a
Netherl
ands
Irelan
d
Luxe
mbour
g
Belgium
Finlan
d
Sweden
Switzerl
and
Norway
Denmark
Note: Data are for a 17-year-old single taxpayer with no children, who undertakes a four-year course of non-job-related education, earning 25% of the average wage during schooling. This figure shows results that incorporate tax deductions and tax credits for direct costs, tax exemptions for scholarship income, and reduced taxes on student wage income. Tax incentives in the personal income tax system and with regard to employee and employer social security contributions are incorporated. The results do not incorporate STEs that subsidise parental spending on education or that subsidise firm spending on education. It is assumed that the skills investment is financed wholly with savings: students do not incur any debt to make a skills investment.
12 http://dx.doi.org/10.1787/888933446600
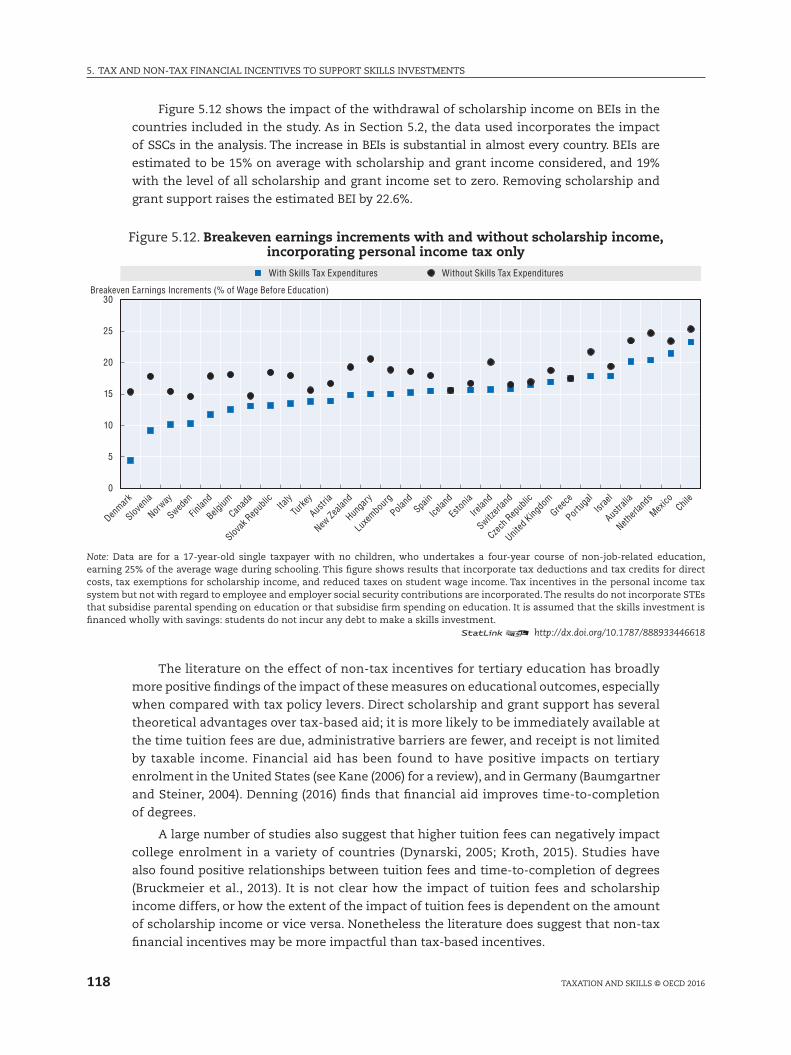
5. Tax anD nOn-Tax fInanCIal InCEnTIvES TO SuppOrT SkIllS InvESTmEnTS
118 TaxaTIOn anD SkIllS © OECD 2016
figure 5.12 shows the impact of the withdrawal of scholarship income on BEIs in the
countries included in the study. as in Section 5.2, the data used incorporates the impact
of SSCs in the analysis. The increase in BEIs is substantial in almost every country. BEIs are
estimated to be 15% on average with scholarship and grant income considered, and 19%
with the level of all scholarship and grant income set to zero. removing scholarship and
grant support raises the estimated BEI by 22.6%.
figure 5.12. Breakeven earnings increments with and without scholarship income, incorporating personal income tax only
0
5
10
15
20
25
30Breakeven Earnings Increments (% of Wage Before Education)
With Skills Tax Expenditures Without Skills Tax Expenditures
Denmark
Sloven
ia
Norway
Sweden
Finlan
d
Belgium
Canad
a
Slovak
Rep
ublic Ita
ly
Turke
y
Austri
a
New Ze
aland
Hunga
ry
Luxe
mbour
g
Poland
Spain
Icelan
d
Eston
ia
Irelan
d
Switzerl
and
Czech
Rep
ublic
United
Kingdo
mGree
ce
Portug
alIsr
ael
Austra
lia
Netherl
ands
Mexico Chil
e
Note: Data are for a 17-year-old single taxpayer with no children, who undertakes a four-year course of non-job-related education, earning 25% of the average wage during schooling. This figure shows results that incorporate tax deductions and tax credits for direct costs, tax exemptions for scholarship income, and reduced taxes on student wage income. Tax incentives in the personal income tax system but not with regard to employee and employer social security contributions are incorporated. The results do not incorporate STEs that subsidise parental spending on education or that subsidise firm spending on education. It is assumed that the skills investment is financed wholly with savings: students do not incur any debt to make a skills investment.
12 http://dx.doi.org/10.1787/888933446618
The literature on the effect of non-tax incentives for tertiary education has broadly
more positive findings of the impact of these measures on educational outcomes, especially
when compared with tax policy levers. Direct scholarship and grant support has several
theoretical advantages over tax-based aid; it is more likely to be immediately available at
the time tuition fees are due, administrative barriers are fewer, and receipt is not limited
by taxable income. financial aid has been found to have positive impacts on tertiary
enrolment in the united States (see kane (2006) for a review), and in Germany (Baumgartner
and Steiner, 2004). Denning (2016) finds that financial aid improves time-to-completion
of degrees.
a large number of studies also suggest that higher tuition fees can negatively impact
college enrolment in a variety of countries (Dynarski, 2005; kroth, 2015). Studies have
also found positive relationships between tuition fees and time-to-completion of degrees
(Bruckmeier et al., 2013). It is not clear how the impact of tuition fees and scholarship
income differs, or how the extent of the impact of tuition fees is dependent on the amount
of scholarship income or vice versa. nonetheless the literature does suggest that non-tax
financial incentives may be more impactful than tax-based incentives.
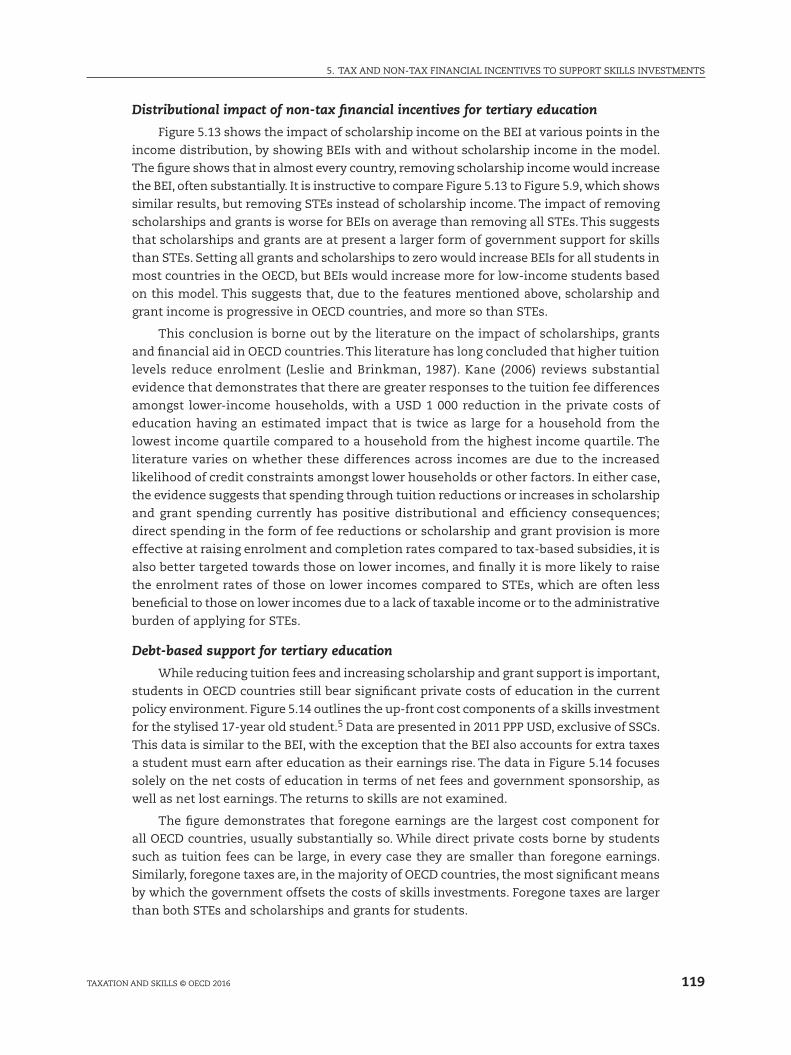
119
5. Tax anD nOn-Tax fInanCIal InCEnTIvES TO SuppOrT SkIllS InvESTmEnTS
TaxaTIOn anD SkIllS © OECD 2016
Distributional impact of non-tax financial incentives for tertiary education
figure 5.13 shows the impact of scholarship income on the BEI at various points in the
income distribution, by showing BEIs with and without scholarship income in the model.
The figure shows that in almost every country, removing scholarship income would increase
the BEI, often substantially. It is instructive to compare figure 5.13 to figure 5.9, which shows
similar results, but removing STEs instead of scholarship income. The impact of removing
scholarships and grants is worse for BEIs on average than removing all STEs. This suggests
that scholarships and grants are at present a larger form of government support for skills
than STEs. Setting all grants and scholarships to zero would increase BEIs for all students in
most countries in the OECD, but BEIs would increase more for low-income students based
on this model. This suggests that, due to the features mentioned above, scholarship and
grant income is progressive in OECD countries, and more so than STEs.
This conclusion is borne out by the literature on the impact of scholarships, grants
and financial aid in OECD countries. This literature has long concluded that higher tuition
levels reduce enrolment (leslie and Brinkman, 1987). kane (2006) reviews substantial
evidence that demonstrates that there are greater responses to the tuition fee differences
amongst lower-income households, with a uSD 1 000 reduction in the private costs of
education having an estimated impact that is twice as large for a household from the
lowest income quartile compared to a household from the highest income quartile. The
literature varies on whether these differences across incomes are due to the increased
likelihood of credit constraints amongst lower households or other factors. In either case,
the evidence suggests that spending through tuition reductions or increases in scholarship
and grant spending currently has positive distributional and efficiency consequences;
direct spending in the form of fee reductions or scholarship and grant provision is more
effective at raising enrolment and completion rates compared to tax-based subsidies, it is
also better targeted towards those on lower incomes, and finally it is more likely to raise
the enrolment rates of those on lower incomes compared to STEs, which are often less
beneficial to those on lower incomes due to a lack of taxable income or to the administrative
burden of applying for STEs.
Debt-based support for tertiary education
While reducing tuition fees and increasing scholarship and grant support is important,
students in OECD countries still bear significant private costs of education in the current
policy environment. figure 5.14 outlines the up-front cost components of a skills investment
for the stylised 17-year old student.5 Data are presented in 2011 ppp uSD, exclusive of SSCs.
This data is similar to the BEI, with the exception that the BEI also accounts for extra taxes
a student must earn after education as their earnings rise. The data in figure 5.14 focuses
solely on the net costs of education in terms of net fees and government sponsorship, as
well as net lost earnings. The returns to skills are not examined.
The figure demonstrates that foregone earnings are the largest cost component for
all OECD countries, usually substantially so. While direct private costs borne by students
such as tuition fees can be large, in every case they are smaller than foregone earnings.
Similarly, foregone taxes are, in the majority of OECD countries, the most significant means
by which the government offsets the costs of skills investments. foregone taxes are larger
than both STEs and scholarships and grants for students.
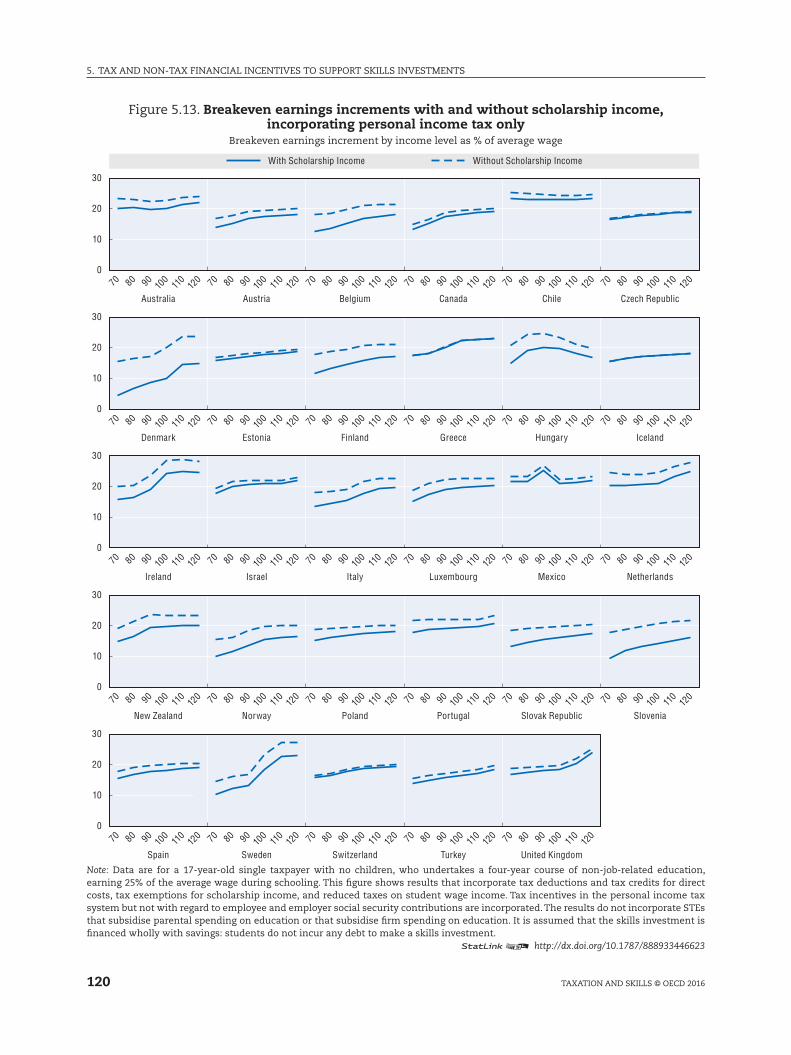
5. Tax anD nOn-Tax fInanCIal InCEnTIvES TO SuppOrT SkIllS InvESTmEnTS
120 TaxaTIOn anD SkIllS © OECD 2016
figure 5.13. Breakeven earnings increments with and without scholarship income, incorporating personal income tax only
Breakeven earnings increment by income level as % of average wage
0
10
20
30
0
10
20
30
0
10
20
30
0
10
20
30
0
10
20
30
70 80 9010
011
012
0 70 80 9010
011
012
0 70 80 9010
011
012
0 70 80 9010
011
012
0 70 80 9010
011
012
0 70 80 9010
011
012
0
70 80 9010
011
012
0 70 80 9010
011
012
0 70 80 9010
011
012
0 70 80 9010
011
012
0 70 80 9010
011
012
0 70 80 9010
011
012
0
70 80 9010
011
012
0 70 80 9010
011
012
0 70 80 9010
011
012
0 70 80 9010
011
012
0 70 80 9010
011
012
0 70 80 9010
011
012
0
70 80 9010
011
012
0 70 80 9010
011
012
0 70 80 9010
011
012
0 70 80 9010
011
012
0 70 80 9010
011
012
0 70 80 9010
011
012
0
70 80 9010
011
012
0 70 80 9010
011
012
0 70 80 9010
011
012
0 70 80 9010
011
012
0 70 80 9010
011
012
0
With Scholarship Income Without Scholarship Income
Australia Austria
Estonia
Belgium
Finland
Italy
Canada Chile Czech Republic
Greece Hungary Iceland
Luxembourg Mexico Netherlands
Portugal Slovak Republic Slovenia
United Kingdom
Denmark
Ireland Israel
New Zealand Norway Poland
Sweden Switzerland TurkeySpain
Note: Data are for a 17-year-old single taxpayer with no children, who undertakes a four-year course of non-job-related education, earning 25% of the average wage during schooling. This figure shows results that incorporate tax deductions and tax credits for direct costs, tax exemptions for scholarship income, and reduced taxes on student wage income. Tax incentives in the personal income tax system but not with regard to employee and employer social security contributions are incorporated. The results do not incorporate STEs that subsidise parental spending on education or that subsidise firm spending on education. It is assumed that the skills investment is financed wholly with savings: students do not incur any debt to make a skills investment.
12 http://dx.doi.org/10.1787/888933446623
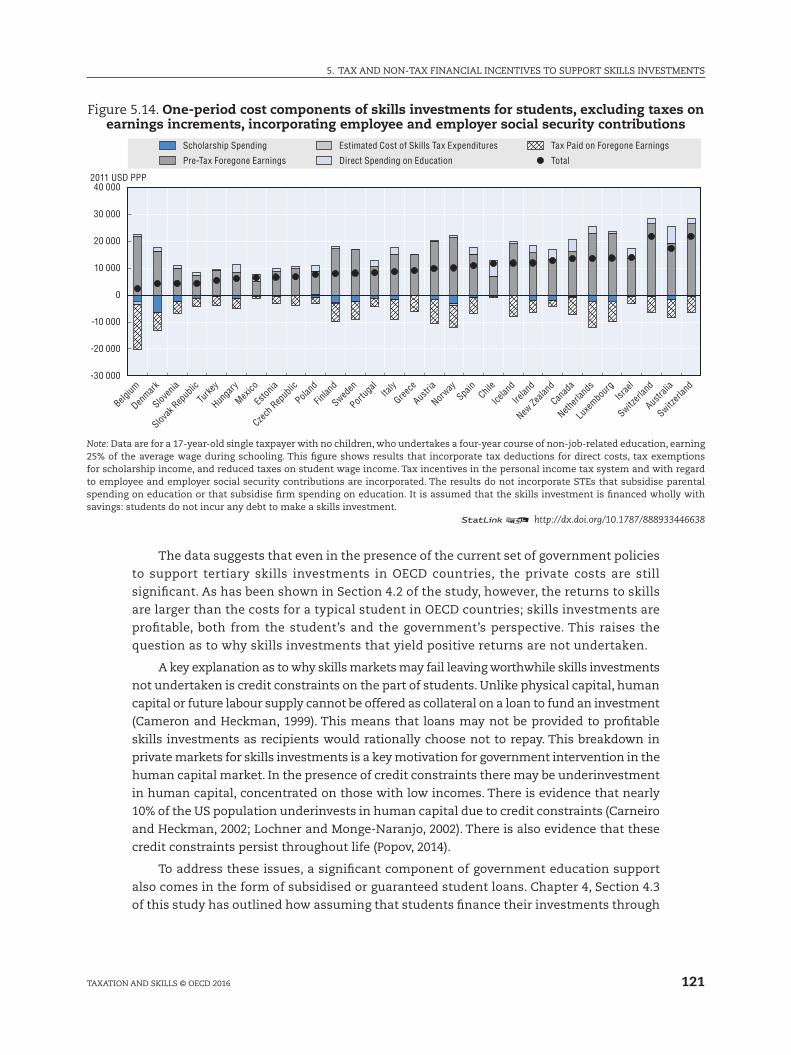
121
5. Tax anD nOn-Tax fInanCIal InCEnTIvES TO SuppOrT SkIllS InvESTmEnTS
TaxaTIOn anD SkIllS © OECD 2016
figure 5.14. One-period cost components of skills investments for students, excluding taxes on earnings increments, incorporating employee and employer social security contributions
-30 000
-20 000
-10 000
0
10 000
20 000
30 000
40 0002011 USD PPP
Belgium
Denmark
Sloven
ia
Slovak
Rep
ublic
Turke
y
Hunga
ry
Mexico
Eston
ia
Czech
Rep
ublic
Poland
Finlan
d
Sweden
Portug
alIta
ly
Greece
Austri
a
Norway
Spain
Chile
Icelan
d
Irelan
d
New Ze
aland
Canad
a
Netherl
ands
Luxe
mbour
gIsr
ael
Switzerl
and
Austra
lia
Switzerl
and
Scholarship Spending Estimated Cost of Skills Tax Expenditures Tax Paid on Foregone Earnings
Pre-Tax Foregone Earnings Direct Spending on Education Total
Note: Data are for a 17-year-old single taxpayer with no children, who undertakes a four-year course of non-job-related education, earning 25% of the average wage during schooling. This figure shows results that incorporate tax deductions for direct costs, tax exemptions for scholarship income, and reduced taxes on student wage income. Tax incentives in the personal income tax system and with regard to employee and employer social security contributions are incorporated. The results do not incorporate STEs that subsidise parental spending on education or that subsidise firm spending on education. It is assumed that the skills investment is financed wholly with savings: students do not incur any debt to make a skills investment.
12 http://dx.doi.org/10.1787/888933446638
The data suggests that even in the presence of the current set of government policies
to support tertiary skills investments in OECD countries, the private costs are still
significant. as has been shown in Section 4.2 of the study, however, the returns to skills
are larger than the costs for a typical student in OECD countries; skills investments are
profitable, both from the student’s and the government’s perspective. This raises the
question as to why skills investments that yield positive returns are not undertaken.
a key explanation as to why skills markets may fail leaving worthwhile skills investments
not undertaken is credit constraints on the part of students. unlike physical capital, human
capital or future labour supply cannot be offered as collateral on a loan to fund an investment
(Cameron and Heckman, 1999). This means that loans may not be provided to profitable
skills investments as recipients would rationally choose not to repay. This breakdown in
private markets for skills investments is a key motivation for government intervention in the
human capital market. In the presence of credit constraints there may be underinvestment
in human capital, concentrated on those with low incomes. There is evidence that nearly
10% of the uS population underinvests in human capital due to credit constraints (Carneiro
and Heckman, 2002; lochner and monge-naranjo, 2002). There is also evidence that these
credit constraints persist throughout life (popov, 2014).
To address these issues, a significant component of government education support
also comes in the form of subsidised or guaranteed student loans. Chapter 4, Section 4.3
of this study has outlined how assuming that students finance their investments through
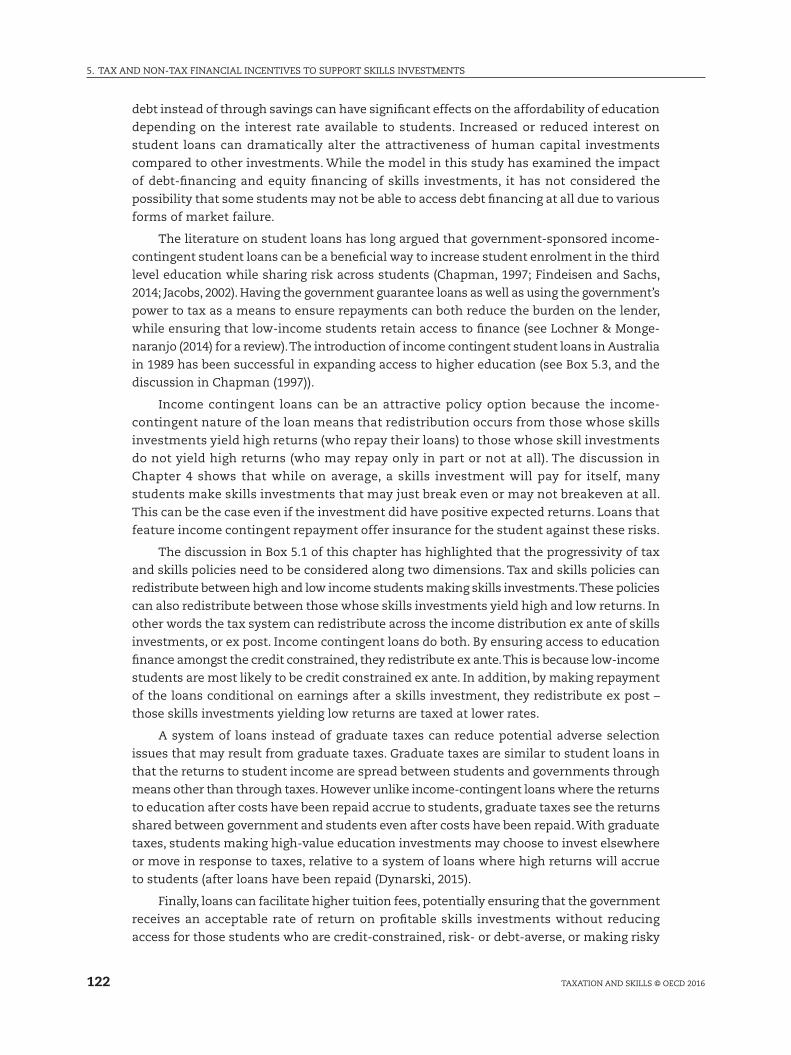
5. Tax anD nOn-Tax fInanCIal InCEnTIvES TO SuppOrT SkIllS InvESTmEnTS
122 TaxaTIOn anD SkIllS © OECD 2016
debt instead of through savings can have significant effects on the affordability of education
depending on the interest rate available to students. Increased or reduced interest on
student loans can dramatically alter the attractiveness of human capital investments
compared to other investments. While the model in this study has examined the impact
of debt-financing and equity financing of skills investments, it has not considered the
possibility that some students may not be able to access debt financing at all due to various
forms of market failure.
The literature on student loans has long argued that government-sponsored income-
contingent student loans can be a beneficial way to increase student enrolment in the third
level education while sharing risk across students (Chapman, 1997; findeisen and Sachs,
2014; Jacobs, 2002). Having the government guarantee loans as well as using the government’s
power to tax as a means to ensure repayments can both reduce the burden on the lender,
while ensuring that low-income students retain access to finance (see lochner & monge-
naranjo (2014) for a review). The introduction of income contingent student loans in australia
in 1989 has been successful in expanding access to higher education (see Box 5.3, and the
discussion in Chapman (1997)).
Income contingent loans can be an attractive policy option because the income-
contingent nature of the loan means that redistribution occurs from those whose skills
investments yield high returns (who repay their loans) to those whose skill investments
do not yield high returns (who may repay only in part or not at all). The discussion in
Chapter 4 shows that while on average, a skills investment will pay for itself, many
students make skills investments that may just break even or may not breakeven at all.
This can be the case even if the investment did have positive expected returns. loans that
feature income contingent repayment offer insurance for the student against these risks.
The discussion in Box 5.1 of this chapter has highlighted that the progressivity of tax
and skills policies need to be considered along two dimensions. Tax and skills policies can
redistribute between high and low income students making skills investments. These policies
can also redistribute between those whose skills investments yield high and low returns. In
other words the tax system can redistribute across the income distribution ex ante of skills
investments, or ex post. Income contingent loans do both. By ensuring access to education
finance amongst the credit constrained, they redistribute ex ante. This is because low-income
students are most likely to be credit constrained ex ante. In addition, by making repayment
of the loans conditional on earnings after a skills investment, they redistribute ex post –
those skills investments yielding low returns are taxed at lower rates.
a system of loans instead of graduate taxes can reduce potential adverse selection
issues that may result from graduate taxes. Graduate taxes are similar to student loans in
that the returns to student income are spread between students and governments through
means other than through taxes. However unlike income-contingent loans where the returns
to education after costs have been repaid accrue to students, graduate taxes see the returns
shared between government and students even after costs have been repaid. With graduate
taxes, students making high-value education investments may choose to invest elsewhere
or move in response to taxes, relative to a system of loans where high returns will accrue
to students (after loans have been repaid (Dynarski, 2015).
finally, loans can facilitate higher tuition fees, potentially ensuring that the government
receives an acceptable rate of return on profitable skills investments without reducing
access for those students who are credit-constrained, risk- or debt-averse, or making risky
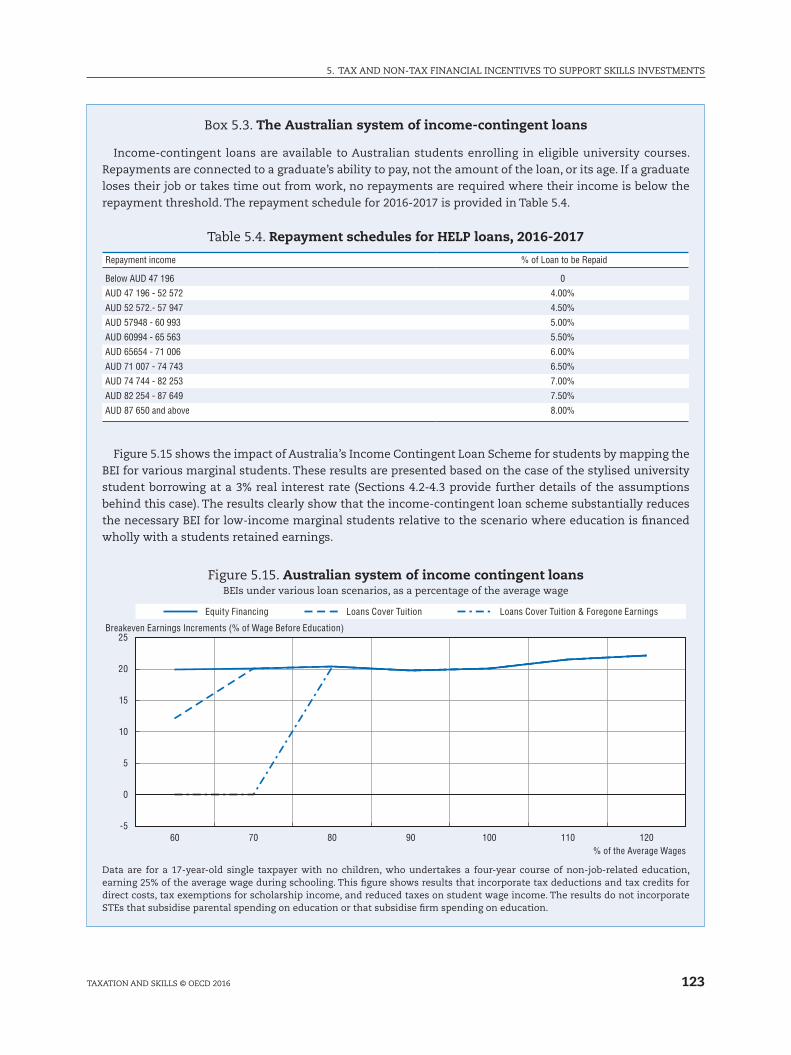
123
5. Tax anD nOn-Tax fInanCIal InCEnTIvES TO SuppOrT SkIllS InvESTmEnTS
TaxaTIOn anD SkIllS © OECD 2016
Box 5.3. The Australian system of income-contingent loans
Income-contingent loans are available to australian students enrolling in eligible university courses. repayments are connected to a graduate’s ability to pay, not the amount of the loan, or its age. If a graduate loses their job or takes time out from work, no repayments are required where their income is below the repayment threshold. The repayment schedule for 2016-2017 is provided in Table 5.4.
Table 5.4. Repayment schedules for HELP loans, 2016-2017
Repayment income % of Loan to be Repaid
Below AUD 47 196 0
AUD 47 196 - 52 572 4.00%
AUD 52 572.- 57 947 4.50%
AUD 57948 - 60 993 5.00%
AUD 60994 - 65 563 5.50%
AUD 65654 - 71 006 6.00%
AUD 71 007 - 74 743 6.50%
AUD 74 744 - 82 253 7.00%
AUD 82 254 - 87 649 7.50%
AUD 87 650 and above 8.00%
figure 5.15 shows the impact of australia’s Income Contingent loan Scheme for students by mapping the BEI for various marginal students. These results are presented based on the case of the stylised university student borrowing at a 3% real interest rate (Sections 4.2-4.3 provide further details of the assumptions behind this case). The results clearly show that the income-contingent loan scheme substantially reduces the necessary BEI for low-income marginal students relative to the scenario where education is financed wholly with a students retained earnings.
figure 5.15. Australian system of income contingent loansBEIs under various loan scenarios, as a percentage of the average wage
-5
0
5
10
15
20
25
60 70 80 90 100 110 120% of the Average Wages
Breakeven Earnings Increments (% of Wage Before Education)
Equity Financing Loans Cover Tuition Loans Cover Tuition & Foregone Earnings
Data are for a 17-year-old single taxpayer with no children, who undertakes a four-year course of non-job-related education, earning 25% of the average wage during schooling. This figure shows results that incorporate tax deductions and tax credits for direct costs, tax exemptions for scholarship income, and reduced taxes on student wage income. The results do not incorporate STEs that subsidise parental spending on education or that subsidise firm spending on education.

5. Tax anD nOn-Tax fInanCIal InCEnTIvES TO SuppOrT SkIllS InvESTmEnTS
124 TaxaTIOn anD SkIllS © OECD 2016
investments. By raising tuition fees, and at the same time expanding access to income
contingent loans, the governments returns to education can be maintained, access for
low-income students can be maintained, and risky-yet-worthwhile investment can be
maintained (Blöndal et al., 2002).
5.4 Tax Incentives for mid-career trainingImportance of lifelong learning has been long acknowledged by policy makers. Due to
rapid technological change, globalisation, and increased longevity, increasing numbers of
older workers face challenges in keeping their skills up-to-date in the face of changing work
practices. This means that maintaining human capital levels throughout workers’ careers
is an important part of skills policy.
maintaining and increasing human capital can be challenging, particularly for older workers.
Employers may be less likely to train workers who may soon leave the labour market; workers’
propensity to undertake new training declines with age; research suggests that workers’ ability
to learn new skills also declines with age (OECD, 2013). for many, making significant skills
investments in later life requires time out of the labour market. This often means very high levels
of foregone earnings for older workers, dis-incentivising lifelong learning. These comparatively
higher costs of training older workers have led some scholars to argue that investments in human
capital are best focused on younger workers (Heckman and Jacobs, 2010). However addressing
challenges such as increased market inequality, stagnant wages, and demographic challenges will
require improved human capital of older workers as well as younger workers, and so providing
effective training for older workers remains a significant policy objective (mcCall et al., 2016).
This section provides an assessment of the existing policies, particularly STEs, designed
to encourage worker training. Based on the model detailed in Chapters 3 and 4 of this study,
the section first outlines the value of these provisions for the hypothetical example of job-
related mid-career training discussed in Chapter 4. These provisions are then discussed
from the perspective of their effectiveness in encouraging skills investment, as well as from
a distributional perspective. The section will discuss non-tax approaches to encouraging
lifelong learning, and will end by briefly discussing some issues policy makers may need to
consider when designing STEs for worker training.
Size of tax incentives for mid-career training
figure 5.16 shows the value of STEs for the in-work training example outlined in
Chapter 4, expressed as a percentage of the costs of training. This example is for a worker
at the average wage who undertakes a short period of job-related training. In this instance,
incentives through the SSC system are not incorporated. Eleven of the countries modelled
have no STEs for mid-career training, and so the value of STEs is zero in the model. The
remainder of the countries modelled have STEs, mainly in the form of tax deductions in the
personal income tax system. The model for in-work training assumes that this training is
“job-related” in the sense that the training is necessary for a workers’ job and thus becomes
a tax deductible expense in many OECD countries. as will be discussed below, many OECD
countries offer a tax deduction for training costs only where this training is related to a
worker’s current employment.
125
5. Tax anD nOn-Tax fInanCIal InCEnTIvES TO SuppOrT SkIllS InvESTmEnTS
TaxaTIOn anD SkIllS © OECD 2016
figure 5.16. Value of skills tax expenditures for mid-career training, as a percentage of the direct costs of training, incorporating personal income tax only
0
10
20
30
40
50
60Value of Skills Tax Expenditures, % of Direct Costs
Chile
Czech
Rep
ublic
Denmark
Hunga
ry
New Ze
aland
Norway
Poland
Slovak
Rep
ublic
Sloven
iaSpa
in
Greece
Portug
al
Switzerl
and
Irelan
d
Finlan
d
Turke
yIta
ly
United
Kingdo
m
Canad
a
Eston
iaIsr
ael
Sweden
Austra
lia
Luxe
mbour
g
Icelan
d
Austri
a
Netherl
ands
Mexico
Belgium
Note: Data are for a 32-year-old single taxpayer with no children, who undertakes a short course of job-related education, earning 95% of the average wage during schooling. This figure shows results that incorporate tax deductions and tax credits for direct costs, tax exemptions for scholarship income, and reduced taxes on student wage income. Tax incentives in the personal income tax system, but not the social security contribution system are incorporated. The results do not incorporate STEs that subsidise parental spending on education or that subsidise firm spending on education. It is assumed that the skills investment is financed wholly with savings: students do not incur any debt to make a skills investment.
12 http://dx.doi.org/10.1787/888933446648
across the modelled countries, the average value of the costs of training that are offset
through STEs for a worker at the average wage is 15.3% of the costs of training. amongst the
countries that do have STEs for worker training, the average value is 24.7% of the costs of
training. Because the STEs for worker training tend to come in the form of tax allowances,
the value of these tax allowances depends on the marginal rate of income tax in the country
concerned. So countries such as Belgium with high tax rates on the average worker also see
comparatively more valuable STEs in the model.
many of the countries that have large STEs to encourage college education do not have
similarly large STEs aimed at worker training. This is in part due to that fact that 28 of the
30 countries examined in this study have tax exemptions for scholarship income. It is assumed
that those workers undertaking a period of in-work training do not receive any scholarship
income, and so do not receive any tax benefit through STEs that come in the form of tax
exemptions for scholarships. This reduces the size of STEs measured in several countries, notably
finland and norway where scholarship income is tax-exempt and comparatively generous.
In addition to the support provided by the tax system to training through the personal
income tax system as modelled in this study, significant support is also provided through the
corporate income tax system. Details of the support provided to firms through the corporate
income tax are outlined in Torres (2012). These provisions are not modelled in this study,
but a study by (Bassanini et. al., 2007) suggested that three-quarters of all worker training
was provided by employers in the Eu. The costs of this firm-provided training are usually
deductible from corporate taxable income. STEs in the personal and corporate income tax
system should be designed in a coherent way. In the absence of STEs for job-related training
in the personal income tax system, the tax system will induce businesses to pay for the
job-related training for workers. Workers will request that their training be paid for by
5. Tax anD nOn-Tax fInanCIal InCEnTIvES TO SuppOrT SkIllS InvESTmEnTS
126 TaxaTIOn anD SkIllS © OECD 2016
employers, as this will be deductible from the corporate income tax base. moreover, these
payments will not be included as a fringe benefit from the taxable personal income of the
worker. Such a system will however add a distortion between the levels of tax support
provided to workers in larger firms versus workers in smaller firms, the self-employed, and
those not in employment.
a key issue highlighted by this literature is that, just as the government shares in the
returns to human capital investment by workers, so too do firms share in the returns to
human capital investment, by having more productive employees.6 However, as firms may
not fully internalise the returns to training to the government and to broader society they
may under-invest in training. This positive externality affects firms in the same manner as
individuals who do not fully internalise the broader positive effects of skills investments.
This under-investment can be exacerbated by fear of highly skilled employees being poached
by other firms. These externalities provide a rationale for government intervention into the
market for worker training.
Impact of tax incentives for mid-career training
Though STEs for mid-career training exist in many OECD countries, the evidence on
their effectiveness in terms of encouraging worker training is limited.7 There are several
reasons for this comparative lack of evidence. a large part of mid-career training is provided
by employers, who may select high-performance employees into training programmes: this
means that the causal effect of training (as opposed to simply being a high-performance
employee) cannot be identified. Similar problems exist with studies examining training
financed by individuals: talented individuals may be more likely to self-select into training,
so comparing wages across individuals who do and do not invest in training will pick up
effects that are partially driven by training, and partially by talent. In addition, on-the-job
learning is difficult to measure, and many employers do not keep records of the amount
of training their staff receive. These effects make it difficult to examine the returns to
work-related training; and the impact and value-for-money of tax subsidies in this area.
Despite these difficulties, some studies evaluating the impact of STEs for mid-career
training on training participation do exist. an early study by Holzer et. al. (1993) based on a
grant program for firms in the united States, found that the receipt of training grants was
associated with a significant, though “one-off”, increase in training hours. another recent
study used a regression discontinuity approach based on a Dutch provision that granted a
training deduction for workers over 40 years of age. This study found an increase in training
rates for workers over 40, however, this was driven by workers postponing training, not by
an increase in training overall (leuven and Oosterbeek, 2004). a further study by the same
authors using kinks in the income tax schedule to identify the impacts of tax incentives on
training participation found positive effects: a 10% increase in the tax deductibility increases
the training rate by between 10% and 25%. (leuven and Oosterbeek, 2006). a study based on
Italian data also found positive effects of tax incentives on training participation (Brunello
et al., 2012). So the evidence suggests that STEs for training do have an impact – in contrast
to those at third level. However, more research is needed in this area to properly assess
the size of the impact of different provisions, and to assess how the impact varies across
countries, demographics, and kinds of training.
The existing evidence on the financial returns to worker training is also mixed.
Observational studies tend to find positive impacts of worker training on productivity and
on wages. for example, Brunello (2004), using survey data for Italian large enterprises finds
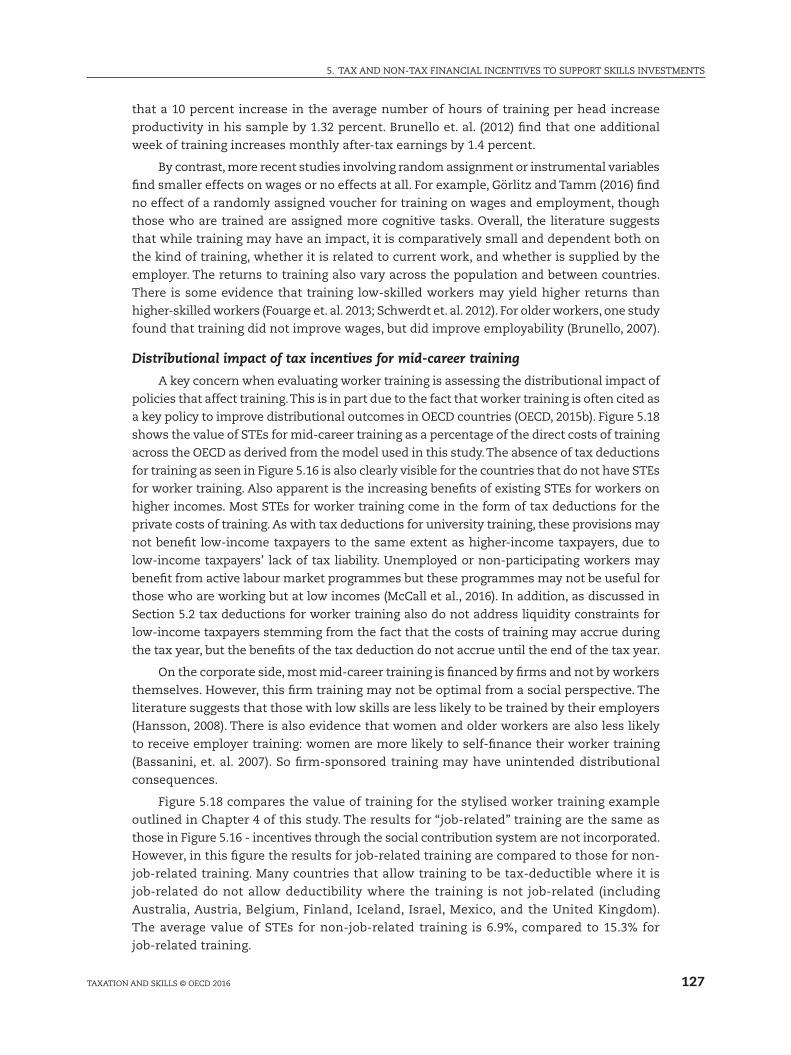
127
5. Tax anD nOn-Tax fInanCIal InCEnTIvES TO SuppOrT SkIllS InvESTmEnTS
TaxaTIOn anD SkIllS © OECD 2016
that a 10 percent increase in the average number of hours of training per head increase
productivity in his sample by 1.32 percent. Brunello et. al. (2012) find that one additional
week of training increases monthly after-tax earnings by 1.4 percent.
By contrast, more recent studies involving random assignment or instrumental variables
find smaller effects on wages or no effects at all. for example, Görlitz and Tamm (2016) find
no effect of a randomly assigned voucher for training on wages and employment, though
those who are trained are assigned more cognitive tasks. Overall, the literature suggests
that while training may have an impact, it is comparatively small and dependent both on
the kind of training, whether it is related to current work, and whether is supplied by the
employer. The returns to training also vary across the population and between countries.
There is some evidence that training low-skilled workers may yield higher returns than
higher-skilled workers (fouarge et. al. 2013; Schwerdt et. al. 2012). for older workers, one study
found that training did not improve wages, but did improve employability (Brunello, 2007).
Distributional impact of tax incentives for mid-career training
a key concern when evaluating worker training is assessing the distributional impact of
policies that affect training. This is in part due to the fact that worker training is often cited as
a key policy to improve distributional outcomes in OECD countries (OECD, 2015b). figure 5.18
shows the value of STEs for mid-career training as a percentage of the direct costs of training
across the OECD as derived from the model used in this study. The absence of tax deductions
for training as seen in figure 5.16 is also clearly visible for the countries that do not have STEs
for worker training. also apparent is the increasing benefits of existing STEs for workers on
higher incomes. most STEs for worker training come in the form of tax deductions for the
private costs of training. as with tax deductions for university training, these provisions may
not benefit low-income taxpayers to the same extent as higher-income taxpayers, due to
low-income taxpayers’ lack of tax liability. unemployed or non-participating workers may
benefit from active labour market programmes but these programmes may not be useful for
those who are working but at low incomes (mcCall et al., 2016). In addition, as discussed in
Section 5.2 tax deductions for worker training also do not address liquidity constraints for
low-income taxpayers stemming from the fact that the costs of training may accrue during
the tax year, but the benefits of the tax deduction do not accrue until the end of the tax year.
On the corporate side, most mid-career training is financed by firms and not by workers
themselves. However, this firm training may not be optimal from a social perspective. The
literature suggests that those with low skills are less likely to be trained by their employers
(Hansson, 2008). There is also evidence that women and older workers are also less likely
to receive employer training: women are more likely to self-finance their worker training
(Bassanini, et. al. 2007). So firm-sponsored training may have unintended distributional
consequences.
figure 5.18 compares the value of training for the stylised worker training example
outlined in Chapter 4 of this study. The results for “job-related” training are the same as
those in figure 5.16 - incentives through the social contribution system are not incorporated.
However, in this figure the results for job-related training are compared to those for non-
job-related training. many countries that allow training to be tax-deductible where it is
job-related do not allow deductibility where the training is not job-related (including
australia, austria, Belgium, finland, Iceland, Israel, mexico, and the united kingdom).
The average value of STEs for non-job-related training is 6.9%, compared to 15.3% for
job-related training.
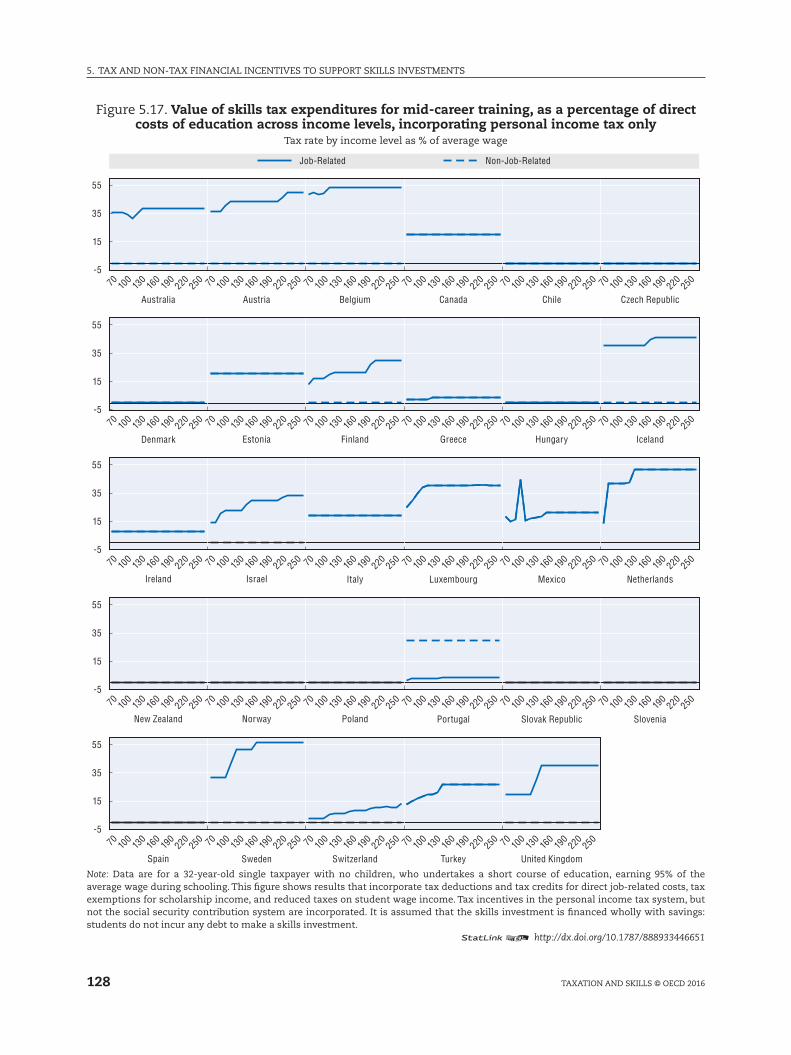
5. Tax anD nOn-Tax fInanCIal InCEnTIvES TO SuppOrT SkIllS InvESTmEnTS
128 TaxaTIOn anD SkIllS © OECD 2016
figure 5.17. Value of skills tax expenditures for mid-career training, as a percentage of direct costs of education across income levels, incorporating personal income tax only
Tax rate by income level as % of average wage
-5
15
35
55
-5
15
35
55
-5
15
35
55
-5
15
35
55
-5
15
35
55
70 100
130
160
190
220 250 70 10
013
016
019
0220 25
0 70 100
130
160
190
220 250 70 10
013
016
019
0220 25
0 70 100
130
160
190
220 250 70 10
013
016
019
0220 25
0
70 100
130
160
190
220 250 70 10
013
016
019
0220 25
0 70 100
130
160
190
220 250 70 10
013
016
019
0220 25
0 70 100
130
160
190
220 250 70 10
013
016
019
0220 25
0
70 100
130
160
190
220 250 70 10
013
016
019
0220 25
0 70 100
130
160
190
220 250 70 10
013
016
019
0220 25
0 70 100
130
160
190
220 250 70 10
013
016
019
0220 25
0
70 100
130
160
190
220 250 70 10
013
016
019
0220 25
0 70 100
130
160
190
220 250 70 10
013
016
019
0220 25
0 70 100
130
160
190
220 250 70 10
013
016
019
0220 25
0
70 100
130
160
190
220 250 70 10
013
016
019
0220 25
0 70 100
130
160
190
220 250 70 10
013
016
019
0220 25
0 70 100
130
160
190
220 250
Job-Related Non-Job-Related
Australia Austria
Estonia
Belgium
Finland
Italy
Canada Chile Czech Republic
Greece Hungary Iceland
Luxembourg Mexico Netherlands
Portugal Slovak Republic Slovenia
United Kingdom
Denmark
Ireland Israel
New Zealand Norway Poland
Sweden Switzerland TurkeySpain
Note: Data are for a 32-year-old single taxpayer with no children, who undertakes a short course of education, earning 95% of the average wage during schooling. This figure shows results that incorporate tax deductions and tax credits for direct job-related costs, tax exemptions for scholarship income, and reduced taxes on student wage income. Tax incentives in the personal income tax system, but not the social security contribution system are incorporated. It is assumed that the skills investment is financed wholly with savings: students do not incur any debt to make a skills investment.
12 http://dx.doi.org/10.1787/888933446651
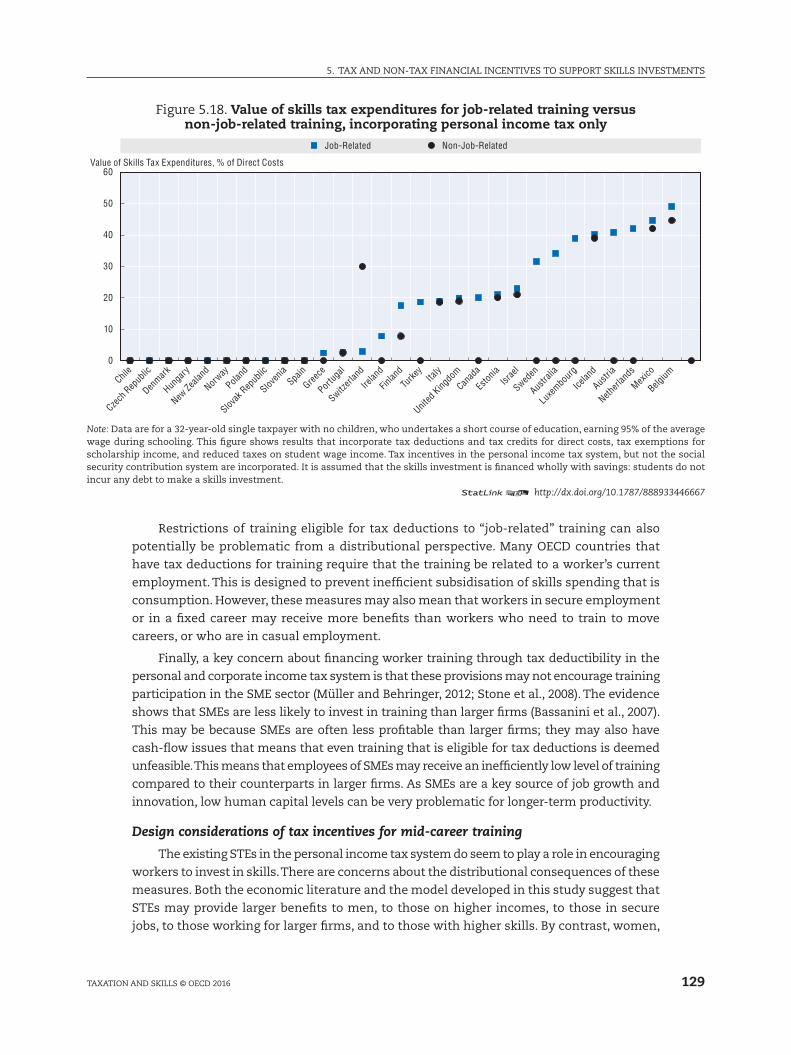
129
5. Tax anD nOn-Tax fInanCIal InCEnTIvES TO SuppOrT SkIllS InvESTmEnTS
TaxaTIOn anD SkIllS © OECD 2016
figure 5.18. Value of skills tax expenditures for job-related training versus non-job-related training, incorporating personal income tax only
0
10
20
30
40
50
60Value of Skills Tax Expenditures, % of Direct Costs
Job-Related Non-Job-Related
Chile
Czech
Rep
ublic
Denmark
Hunga
ry
New Ze
aland
Norway
Poland
Slovak
Rep
ublic
Sloven
iaSpa
in
Greece
Portug
al
Switzerl
and
Irelan
d
Finlan
d
Turke
yIta
ly
United
Kingdo
m
Canad
a
Eston
iaIsr
ael
Sweden
Austra
lia
Luxe
mbour
g
Icelan
d
Austri
a
Netherl
ands
Mexico
Belgium
Note: Data are for a 32-year-old single taxpayer with no children, who undertakes a short course of education, earning 95% of the average wage during schooling. This figure shows results that incorporate tax deductions and tax credits for direct costs, tax exemptions for scholarship income, and reduced taxes on student wage income. Tax incentives in the personal income tax system, but not the social security contribution system are incorporated. It is assumed that the skills investment is financed wholly with savings: students do not incur any debt to make a skills investment.
12 http://dx.doi.org/10.1787/888933446667
restrictions of training eligible for tax deductions to “job-related” training can also
potentially be problematic from a distributional perspective. many OECD countries that
have tax deductions for training require that the training be related to a worker’s current
employment. This is designed to prevent inefficient subsidisation of skills spending that is
consumption. However, these measures may also mean that workers in secure employment
or in a fixed career may receive more benefits than workers who need to train to move
careers, or who are in casual employment.
finally, a key concern about financing worker training through tax deductibility in the
personal and corporate income tax system is that these provisions may not encourage training
participation in the SmE sector (müller and Behringer, 2012; Stone et al., 2008). The evidence
shows that SmEs are less likely to invest in training than larger firms (Bassanini et al., 2007).
This may be because SmEs are often less profitable than larger firms; they may also have
cash-flow issues that means that even training that is eligible for tax deductions is deemed
unfeasible. This means that employees of SmEs may receive an inefficiently low level of training
compared to their counterparts in larger firms. as SmEs are a key source of job growth and
innovation, low human capital levels can be very problematic for longer-term productivity.
Design considerations of tax incentives for mid-career training
The existing STEs in the personal income tax system do seem to play a role in encouraging
workers to invest in skills. There are concerns about the distributional consequences of these
measures. Both the economic literature and the model developed in this study suggest that
STEs may provide larger benefits to men, to those on higher incomes, to those in secure
jobs, to those working for larger firms, and to those with higher skills. By contrast, women,
5. Tax anD nOn-Tax fInanCIal InCEnTIvES TO SuppOrT SkIllS InvESTmEnTS
130 TaxaTIOn anD SkIllS © OECD 2016
older workers, those with lower incomes, those in insecure employment, those working for
SmEs, and those with lower skills may not receive the same benefits from STEs designed to
encourage worker training.
In implementing STEs, design considerations are important in ensuring that STEs
are effective in increasing skills investments. many of the same considerations discussed
with respect to STEs for tertiary education also apply to worker training throughout life.
Complexity of STEs, as well as their interaction with other similar provisions, raises the
burden on taxpayers who might want to receive certain STEs. low-skill, low-income
taxpayers are more likely to be negatively affected, either by not claiming or mis-claiming
STEs to which they are entitled. Similar effects pertain with respect to the corporate
tax system and SmEs. Smaller firms are less likely to take part in complex training
programs, even if these programs are tax-deductible and are beneficial to a firm (müller
and Behringer, 2012).
Design of STEs should also consider deadweight losses. as with all tax expenditures,
a key concern is the additionality of the effect of the tax expenditure: how much extra
training STEs actually generate (OECD, 2010a). poorly-designed tax expenditures may result in
deadweight losses of up to 60% (European Centre for the Development of vocational Training,
2009). Thresholds, for example, can lead to unintended effects. One study of a Dutch scheme
gave an extra tax deduction to older workers (workers above 40), which had the effect of
causing workers in their late 30s to postpone training in order to avail themselves of the
tax incentive later. The overall effect of the measure on training was found to be minimal
(leuven and Oosterbeek, 2004).
Non-tax incentives for mid-career training
In addition to providing tax incentives for training, governments across the OECD use a
wide variety of non-tax policy approaches to encourage worker training and lifelong learning.
a detailed discussion of these policies is beyond the scope of this study, but these policies
include active labour market programmes targeted towards the unemployed, vouchers to
workers to choose their own training, and employment funds financed by firms that provide
training. Detailed discussion of these policies is available elsewhere for Europe (European
Centre for the Development of vocational Training, 2009; European Commission, 2015) and
more broadly (Bassanini et al., 2007; mcCall et al., 2016).
vouchers have been argued to be less administratively costly than STEs at the
personal level (messer and Wolter, 2009; müller and Behringer, 2012). However, many of the
distributional biases that occur with respect to STEs also obtain with respect to vouchers:
those low-skilled workers most likely to benefit from them are also least likely to use them
(Schwerdt et al., 2012). Deadweight losses also arise with respect to vouchers: increased
government provision of vouchers may crowd out firm spending on skills, in part because
firms do not fully internalise the benefits of investing in their workers (their workers may not
remain with the firm) (European Centre for the Development of vocational Training, 2009).
another non-tax policy approach to worker training is communal training funds.
These are funds that can be organised at the local, sectoral, or national level. Employers
pay mandatory fees into these funds – either as a share of sales, payrolls, or profits – and
then have access to the training programmes provided by these funds. Stone & Braidford
(2008) argue that these funds may be more effective in encouraging worker training than
tax deductions for training as firms, once having paid into a fund, will be more likely to
131
5. Tax anD nOn-Tax fInanCIal InCEnTIvES TO SuppOrT SkIllS InvESTmEnTS
TaxaTIOn anD SkIllS © OECD 2016
use it. moreover, as payments into these funds are usually compulsory, SmEs are also
more likely to use them, addressing the issue of reduced SmE participation in worker
training (Stone et al., 2008). a potential issue with sectoral level funds is that firms – and
their employees – in small or low-growth sectors in an economy may lose out through
having access to a smaller fund compared to larger or high-growth areas of the economy.
Similar effects could arise between wealthier regions and poorer regions if funds are set
up on a regional basis. maintaining a multiplicity of funds can result in political economy
challenges if different funds are in states of varying levels of financial security.
5.5 Tax, skills and education finance
How does the tax system impact skills investments?
The preceding sections have discussed the effects of tax expenditures designed to
encourage skills investments. The model developed in this study illustrates several key
issues concerning STEs:
●● In most OECD countries STEs are modest in size, though they can be larger when social
contributions are taken into account.
●● as a result, their impact on the overall financial incentive to invest in skills is also modest,
particularly at tertiary level.
●● In the hypothetical cases outlined, STEs benefit workers on higher incomes more than
workers on lower incomes.
●● In spite of this, STEs are a larger factor in the skills investment decisions of those making
low-return skills investments than those who may see higher returns from their skills
investments. This is because the costs of skills investments are a larger component of
the overall financial decision to invest in skills than the returns for marginal students,
so the way the tax system impacts those costs has a large impact on the overall effects
of the tax system.
These arguments are supported by the findings from the academic literature. Though
this literature is limited in many ways, some key conclusions are as follows:
●● Tax expenditures have limited effects on students’ decisions to enrol in tertiary education.
●● Tax expenditures for mid-career training do encourage training, but can come with
significant deadweight losses.
●● Those on low incomes are less likely to benefit from themselves of STEs, both for college
education and for worker training. STEs for training are often poorly designed: credits
accrue to students at the wrong time of the tax year and provisions are overly complex.
Training provided by employers can disadvantage certain workers due to employer bias.
●● The literature is broadly supportive of non-tax approaches to providing support for skills
investments in the form of tertiary education, including scholarships, reduced tuition,
and income-contingent loans. These approaches may be more beneficial for low-income
students.
●● Support to students through income-contingent loans has been found to be particularly
effective, in terms of ensuring access to education for low-income students, sharing the
financial burden between government and students, distributing the risk of human capital
investments, and balancing equity and efficiency considerations.
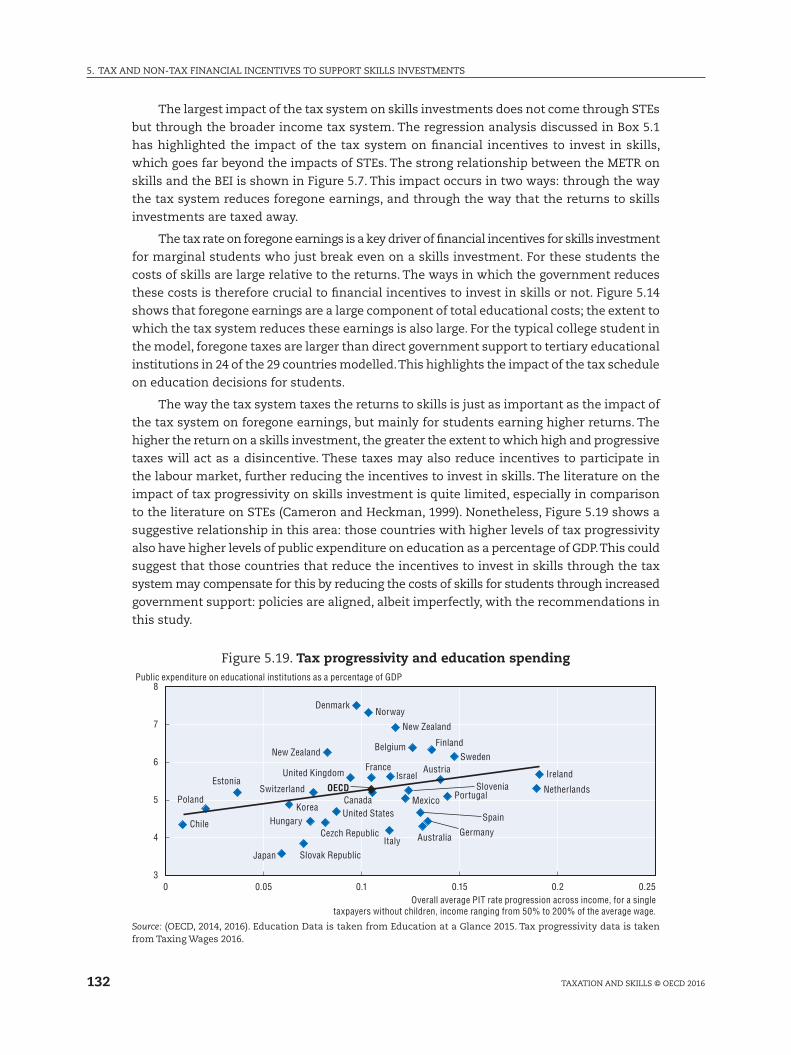
5. Tax anD nOn-Tax fInanCIal InCEnTIvES TO SuppOrT SkIllS InvESTmEnTS
132 TaxaTIOn anD SkIllS © OECD 2016
The largest impact of the tax system on skills investments does not come through STEs
but through the broader income tax system. The regression analysis discussed in Box 5.1
has highlighted the impact of the tax system on financial incentives to invest in skills,
which goes far beyond the impacts of STEs. The strong relationship between the mETr on
skills and the BEI is shown in figure 5.7. This impact occurs in two ways: through the way
the tax system reduces foregone earnings, and through the way that the returns to skills
investments are taxed away.
The tax rate on foregone earnings is a key driver of financial incentives for skills investment
for marginal students who just break even on a skills investment. for these students the
costs of skills are large relative to the returns. The ways in which the government reduces
these costs is therefore crucial to financial incentives to invest in skills or not. figure 5.14
shows that foregone earnings are a large component of total educational costs; the extent to
which the tax system reduces these earnings is also large. for the typical college student in
the model, foregone taxes are larger than direct government support to tertiary educational
institutions in 24 of the 29 countries modelled. This highlights the impact of the tax schedule
on education decisions for students.
The way the tax system taxes the returns to skills is just as important as the impact of
the tax system on foregone earnings, but mainly for students earning higher returns. The
higher the return on a skills investment, the greater the extent to which high and progressive
taxes will act as a disincentive. These taxes may also reduce incentives to participate in
the labour market, further reducing the incentives to invest in skills. The literature on the
impact of tax progressivity on skills investment is quite limited, especially in comparison
to the literature on STEs (Cameron and Heckman, 1999). nonetheless, figure 5.19 shows a
suggestive relationship in this area: those countries with higher levels of tax progressivity
also have higher levels of public expenditure on education as a percentage of GDp. This could
suggest that those countries that reduce the incentives to invest in skills through the tax
system may compensate for this by reducing the costs of skills for students through increased
government support: policies are aligned, albeit imperfectly, with the recommendations in
this study.
figure 5.19. Tax progressivity and education spending
3
4
5
6
7
8
0 0.05 0.1 0.15 0.2 0.25Overall average PIT rate progression across income, for a single
taxpayers without children, income ranging from 50% to 200% of the average wage.
Public expenditure on educational institutions as a percentage of GDP
Ireland
Netherlands
Sweden
Portugal
Austria
Finland
GermanyAustralia
Spain
Belgium
SloveniaMexico
New Zealand
Israel
Italy
Canada
France
OECD
NorwayDenmark
United Kingdom
United States
New Zealand
Cezch Republic
Switzerland
Hungary
Slovak Republic
Korea
Japan
Estonia
Poland
Chile
Source: (OECD, 2014, 2016). Education Data is taken from Education at a Glance 2015. Tax progressivity data is taken from Taxing Wages 2016.
133
5. Tax anD nOn-Tax fInanCIal InCEnTIvES TO SuppOrT SkIllS InvESTmEnTS
TaxaTIOn anD SkIllS © OECD 2016
Policy mixes for skills: taxes, spending, and debt support
many academic studies have highlighted the potential problems that high and
progressive taxes can have on incentives to invest in skills. Tax progressivity can raise the
tax rate on the earnings increment thus raising tax rates on skills. However, tax progressivity
can also raise the tax rate on foregone earnings, thus reducing tax rates on skills. The impact
of progressivity on skills investments may thus be smaller than has been argued previously.
for each individual skills investment, this impact will depend on where in the tax schedule
a potential student currently sits: local progressivity matters.
Holding other factors constant, the negative impact of tax progressivity on incentives
to invest in skills will be strongest when the gap between the tax rate on the earnings
increment on skills and the tax rate on foregone earnings is large. This typically occurs when
the returns to skills are highest. This means that while tax progressivity can negatively
impact skills investments, it does so at its highest rate for those skills investments that
are most profitable: those skills investments that are most likely to be undertaken even
in the presence of taxes. Therefore, incentives to invest in skills could be thus increased
by reducing income taxes, and these effects would be strongest for high-return skills
investments.
The discussion in this chapter has also highlighted the importance of direct spending
as a means to improve incentives to invest in skills, particularly for those who are credit
constrained. reducing income taxes and increasing spending are imperfect substitutes from
a skills perspective: reduced income taxes may provide larger incentives for high-return
skills investments compared to low-return skills investments. reduced income taxes may
also not assist affect credit-constrained students to the same extent as additional education
spending.
additional education spending or reduced income taxation may be complemented by
income-contingent loans for students. Income contingent loans address credit constraints
that may be present for positive-return skills investments. In addition, they may also
provide a way to increase skills investments without placing a severe burden against short-
term fiscally constrained governments. a further benefit of income contingent loans is
that they can potentially provide a level of insurance for risky investments: the risk of
skills investments are shared not just between governments and students, but across the
population of students. Those human capital investments that yield high returns subsidise
those skills investments that yield low returns. Complementing the loans with government
support for education can further allow the costs and returns to be shared between the
government and students (Gottardi et al., 2014; krueger and ludwig, 2013).
Skills investments are crucial for productivity, for growth, for wages, employment
and for well-being in OECD economies (see Heckman & Jacobs, 2010, and Chapter 1 of this
study). While government spending on skills is substantial, continued high returns to skills
investments, as well as the high returns to costs ratios developed in this study, suggest
that further government support for skills investments can yield positive returns for many
countries. These findings echo on the returns to education elsewhere in the literature (de la
fuente and Jimeno, 2008). Though this study has focused on skills investments from college
to later in life, the literature suggests that by far the highest returns to further skills spending
come early in life, particularly through increased spending on early childhood education
(Bulman and Hoxby, 2015; Cameron and Heckman, 1999).8
5. Tax anD nOn-Tax fInanCIal InCEnTIvES TO SuppOrT SkIllS InvESTmEnTS
134 TaxaTIOn anD SkIllS © OECD 2016
a key insight of this study has been that the tax system apportions both the returns
and costs of skills between the government and the individual. Where governments have
both high income taxes and low levels of skills spending, the incentives for individuals
to invest in skills will be low compared to those countries that have low income taxes
and high levels of skills spending. In these latter cases, countries’ incentives to invest in
skills will be high.
There is significant heterogeneity both within and between countries in terms of the
distribution of returns and costs between governments and students. for some countries,
the current policy mix of below-average education spending and an above-average labour
income tax and social security contribution burden suggests that more needs to be done
to incentivise skills investments. This is particularly the case where high labour market
premiums for tertiary education suggest a lack of highly-educated workers in the workforce.
In such countries, the policy mix is discouraging education: extra education spending
could result in governments recouping the cost of their investment in higher income tax
revenues, with further returns accruing from other forms of social and economic benefits.
The average returns to Costs ratio (arCr) indicator suggests that altering the tax and
spending mix to increase incentives to invest in education could be particularly beneficial
and even self-financing, in Hungary, Slovenia and portugal. These countries have both high
arCrs and high college premiums; suggesting that skills investments will yield positive
returns for governments.
However, it is not the case that more government educational spending is always
optimal. for other countries such as norway and Denmark, the current policy mix features
a high level of education spending, often combined with very low college premiums due
to high levels of education in the population. In some countries the analysis suggests that
while on average skills investments provide positive returns for governments, the costs of
low-return skills investments may not be recouped in their entirety, at least through income
tax.9 There are two potential reasons for this. The first is that extensive government funding
of education could be resulting in poor educational choices by students: students who may
be better off working may be choosing to invest in skills that will not yield sufficiently high
returns. Students may also choose to make skills investments that do not have high financial
returns but have high non-pecuniary benefits (e.g. students may prefer certain subjects
because they enjoy them). High or poorly-designed educational subsidies may distort student
choices in ways that lower the returns to education.
a second reason why arCrs may be low is that the returns to education may be high,
but may be captured by students and not by government. Where the costs of education are
heavily subsidised by governments relative to the extent to which the returns are taxed
away, then the educational decision may be very profitable for students, at a cost to the
government, and thus, to the taxpayer. Whether governments want to allow these private
returns to accrue to students or not is a normative policy decision, but in such instances
it may be possible to reduce, or better target education expenditures without negatively
affecting investment in human capital in an economy.
The optimal mix of tax and spending policies with regard to skills will depend on a
variety of factors. This study has sought to highlight the ways in which loans, spending, and
taxes can be complements and substitutes for governments seeking to both finance skills
investments themselves, and provide incentives for individuals to finance their own skills
investments. Different countries may successfully choose different policy mixes. Countries
that prefer high or progressive income taxes may need to provide extra education financing
135
5. Tax anD nOn-Tax fInanCIal InCEnTIvES TO SuppOrT SkIllS InvESTmEnTS
TaxaTIOn anD SkIllS © OECD 2016
to students. Countries that have high levels of private education or high tuition fees may
want to provide direct support or income contingent loans to students. Countries wishing
to raise the overall level of skills investment in their workforce may want to reduce the
aETr on skills by reducing income taxes. Countries that want to increase the skills of low-
skilled, marginalised or disadvantaged groups may want to focus on the mETr on skills;
they could lower the mETr by providing extra income support through scholarships and
grants to certain students. Countries where credit constraints or risk-aversion is reducing
skills investment may want to implement an income-contingent loan program. Different
policy objectives will require different policy levers.
The issues addressed in this tax policy study only begin to address the policy questions
concerning the impact of the tax system on skills investment. While this study has calculated
measures of the impact of the tax system on financial incentives to invest in skills, the overall
incentive to invest in skills, and the returns to government from skills investments, more
needs to be done. Detailed work on how the returns to skills investments varies by field of
study, by type of education, and by demographic would inform policy analysis on government
spending in these areas. While the literature on the responses of tertiary education decisions
to financial incentives is growing, further research is needed to separate out the effects of
financial incentives, credit constraints, and variation in the value of education on skills
investment decisions, especially for those on lower incomes. for lifelong learning, there
remains a lack of detailed evidence of both the impact of training on wages and other
economic outcomes and of the impact of financial incentives on training participation.
finally, this study has not considered in detail the impact of migration on skills policies.
In a globalised world, countries with high skills spending and high taxes may attract more
foreign students, but lose workers after education. The extent to which education and work
decisions across borders are impacted by financial incentives will be increasingly important
for policy makers as economies become increasingly more integrated. These issues are left
for future research.
Notes1. Tax expenditures are defined as ‘Tax reliefs in the form of exemptions from tax, reductions of the
tax liability (deductions and credits) or tax rates that are lower than the standard rate’. They can be seen as “equivalent to public expenditure implemented through the tax system” (OECD, 2010b).
2. for example, portugal allows employers to provide education vouchers for children, tax-free. Such subsidies are not modelled in this version of the analysis.
3. To estimate the value of STEs in the hands of parents it would be necessary to estimate a value of parental transfers to students for education, and then assess the joint impact of the overall impact of STEs and the rest of the tax system on parent and student income, and on parental transfers to dependents. The value of STEs would likely depend on both the income of the student and the parent. The impact of these factors on the student skills investment decision would then have to be assessed. This process would be further complicated if the skills investment decision was made at the household level (i.e. by the student and parent jointly) as the returns and costs in both scenarios would need to be hypothetically divided between student and parent.
4. These costs are discussed further in Chapter 3.
5. These estimates do not incorporate the costs of increased taxes on necessary future income. nor do they incorporate the opportunity return on alternative investments.
6. The model presented in this study would be extended to examine the ratio of returns to costs for firms, governments and individuals, but this would require a fully specified corporate income tax model, which is left for future research.
7. Existing evidence is reviewed in Bassanini et. al. (2007) and mcCall et. al. (2016).
5. Tax anD nOn-Tax fInanCIal InCEnTIvES TO SuppOrT SkIllS InvESTmEnTS
136 TaxaTIOn anD SkIllS © OECD 2016
8. an analysis tax support for this kind of skills investment is left for further research.
9. The broader social returns may still outweigh the costs, but these broader social returns are not calculated in this study.
Referencesavdic, D. and m. Gartell (2015), “Working while studying? Student aid design and socioeconomic
achievement disparities in higher education”, Labour Economics, vol. 33, pp. 26–40.
Bassanini, a., a. Booth, G. Brunello, m. De paola, and E. leuven (2007), “Workplace Training in Europe”, in Brunello, G., Garibaldi, p., Wasmer, E. (Eds.), Education and Training in Europe, Oxford university press, Oxford.
Baumgartner, H.J. and v. Steiner (2004), “Student aid, repayment Obligations and Enrolment into Higher Education in Germany: Evidence from a natural Experiment”, DIW Discussion Paper, no. 444.
Bednar, S. and D. Gicheva (2013), “Tax Benefits for Graduate Education: Incentives for whom?”, Economics of Education Review, vol. 36, pp. 181–197.
Blöndal, S., S. field, and n. Girouard (2002), “Investment in human capital through upper-secondary and tertiary education”, OECD Economic Studies, vol. 2002/1, http://dx.doi.org/10.1787/eco_studies-v2002-art3-en.
Bruckmeier, k., G.-B. fischer, and B.u. Wigger (2013), “Does Distance matter? Tuition fees and Enrollment of first-Year Students at German public universities”, CESIFO Working Paper, no. 4258.
Brunello, G. (2007), “The effects of training on employment, wages and productivity: a European perspective”, Thematic Review Seminar of the European Employment Strategy, http://www.voced.edu.au/content/ngv%3A28646.
Brunello, G., S.l. Comi, and D. Sonedda (2012), “Training subsidies and the wage returns to continuing vocational training: Evidence from Italian regions”, Labour Economics, vol. 19, pp. 361–372.
Bulman, G.B. and C.m. Hoxby (2015), “The returns to the federal Tax Credits for Higher Education”, NBER Working Paper, no. 20833.
Cameron, S. v. and J.J. Heckman (1999), “Can Tuition policy Combat rising Wage Inequality”, in kosters, m.H. (Ed.), Financing College Tuition: Government Policies and Educational Priorities, The aEI press, Washington, D.C.
Carneiro, p. and J.J. Heckman (2002), “The Evidence on Credit Constraints in post-Secondary schooling”, The Economic Journal, vol. 112, pp. 989–1018.
Chapman, B. (1997), “Conceptional Issues and the australian Experience with income-contingent charges for higher education”, The Economic Journal, vol. 107 no. 442, pp. 738–751.
Cunha, f., J.J. Heckman, l. lochner, and D. v. masterov (2006), “Interpreting the Evidence on life Cycle Skill formation”, in Hanushek, E.a. and Welch, f. (Eds.), Handbook of the Economics of Education, Elsevier, https://doi.org/10.1016/S1574-0692(06)01012-9.
Davis, a.J. (2002), “Choice Complexity in Tax Benefits for Higher Education”, National Tax Journal, vol. 55 no. 3, pp. 509–538.
Denning, J.T. (2016), “Born under a lucky Star: financial aid, College Completion, labor Supply, and Credit Constraints”, Unpublished Working Paper, https://aefpweb.org/sites/default/files/webform/41/BornUnderALuckyStar.pdf.
Dynarski, S. (2005), “Building the Stock of College-Educated labor”, NBER Working Paper, no. 11604.
Dynarski, S. (2015), “an Economist’s perspective on Student loans in the united States”, CESifo Working Paper, no. 5579.
Dynarski, S. and J. Scott-Clayton (2015), “Tax Benefits for Education: History and prospects for reform”, https://doi.org/10.1017/CBO9781107415324.004.
European Centre for the Development of vocational Training (2009), Using Tax Incentives to Promote Education and Training, https://www.cedefop.europa.eu/files/5180_en.pdf.
European Commission (2015), An in-Depth Analysis of Adult Learning Policies and Their Effectiveness in Europe, https://doi.org/10.2767/076649.
137
5. Tax anD nOn-Tax fInanCIal InCEnTIvES TO SuppOrT SkIllS InvESTmEnTS
TaxaTIOn anD SkIllS © OECD 2016
findeisen, S. and D. Sachs (2014), “Education policies and Taxation without Commitment”, University of Mannheim Department of Economics Working Paper Series, no. 14–16.
fouarge, D., T. Schils, and a. de Grip, (2013), “Why do low-educated workers invest less in further training?”, Applied Economics, vol. 45 no. 18, pp. 2587–2601.
Görlitz, k. and m. Tamm (2016), “The returns to voucher-financed training on wages, employment and job tasks”, Economics of Education Review, vol. 52, pp. 51–62.
Gottardi, p., a. kajii, and T. nakajima (2014), “Optimal Taxation and Debt with uninsurable risks to Human Capital accumulation”, Federal Reserve Bank of Atlanta Working Paper Series, no. 2014–24.
Guzman, T. (2013), “To Choose or not to Choose: federal Income Tax Credits and Deductions and College Choice Decisions”, Indiana University School of Public and Environmental Affairs Research Paper, no. 2013-01–01.
Hansson, B. (2008), “Job-related Training and Benefits for Individuals: a review of Evidence and Explanations”, OECD Education Working Papers, no. 19.
Heckman, J.J. and B. Jacobs (2010), “policies to Create and Destroy Human Capital in Europe”, NBER Working Paper, no. 15742.
Holzer, H.J., r.n. Block, m. Cheatham, and J.H. knott (1993), “are Training Subsidies for firms Effective? The michigan Experience”, Industrial and Labor Relations Review, vol. 46 no. 4, pp. 625–636.
Hoxby, C.m. (1998), “Tax Incentives for Higher Education”, in poterba, J.m. (Ed.), Tax Policy and the Economy, vol. 12, mIT press, Cambridge, ma, pp. 49–82.
Hoxby, C.m. and G.B. Bulman (2015), “The Effects of the Tax Deduction for postsecondary Tuition: Implications for Structuring Tax-Based aid”, Economics of Education Review, vol. 51, pp. 23–60.
Jacobs, B. (2002), “an investigation of education finance reform - graduate taxes and income contingent loans in the netherlands”, CPB Discussion Paper, no. 9.
kane, T.J. (2006), “public Intervention in post-Secondary Education”, in Hanushek, E.a. and Welch, f. (Eds.), Handbook of the Economics of Education, vol. 2, Elsevier, https://doi.org/10.1016/S1574-0692(06)02023-X.
kroth, a.J. (2015), “The Effects of the Introduction of Tuition on College Enrollment in Germany: results from a natural Experiment With Special reference to Students from low parental Education Backgrounds”, university of michigan, https://deepblue.lib.umich.edu/handle/2027.42/111597.
krueger, D. and a. ludwig (2013), “Optimal progressive labor Income Taxation and Education Subsidies When Education Decisions and Intergenerational Transfers are Endogenous”, American Economic Review: Papers & Proceedings, vol. 103 no. 3, pp. 496–501.
de la fuente, a. and J.f. Jimeno (2008), “The private and fiscal returns to Schooling and the Effect of public policies on private Incentives to Invest in Education: a General framework and Some results for the Eu”, Barcelona Graduate School of Economics Working Paper, no. 342, http://www.barcelonagse.eu/research/working-papers/private-and-fiscal-returns-schooling-and-effect-public-policies-private.
lalumia, S. (2012), “Tax preferences for Higher Education and adult College Enrollment”, National Tax Journal, vol. 65 no. 1, pp. 59–90.
leslie, l.l. and p.T. Brinkman (1987), “Student price response in Higher Education: The Student Demand”, The Journal of Higher Education Studies, vol. 58 no. 2, pp. 181–204.
leuven, E. and H. Oosterbeek (2004), “Evaluating the Effect of Tax Deductions on Training”, Journal of Labor Economics, vol. 22 no. 2, pp. 461–488.
leuven, E. and H. Oosterbeek (2006), “The responsiveness of training participation to tax deductability”, Unpublished Working Paper.
lochner, l. and a. monge-naranjo (2014), “Student loans and repayment: Theory , Evidence and policy”, in Hanushek, E.a., machin, S.J. and Woessmann, l. (Eds.), Handbook of the Economics of Education, 1st ed., vol. 5, Elsevier B.v., pp. 397–498.
lochner, l. and a. monge-naranjo (2002), “Human Capital formation with Endogenous Credit Constraints”, NBER Working Paper, no. 8815.
mcCall, B., J. Smith, and C. Wunsch (2016), “Government-Sponsored vocational Education for adults”, Handbook of the Economics of Education, Elsevier B.v., vol. 5, pp. 479–652.
messer, D. and S.C. Wolter (2009), “money matters – Evidence from a large-Scale randomized field Experiment with vouchers for adult Training”, CESifo Working Paper, no. 2548.

5. Tax anD nOn-Tax fInanCIal InCEnTIvES TO SuppOrT SkIllS InvESTmEnTS
138 TaxaTIOn anD SkIllS © OECD 2016
müller, n. and f. Behringer (2012), “Subsidies and levies as policy Instruments to Encourage Employer-provided Training”, OECD Education Working Papers, no. 80, OECD publishing, paris, http://dx.doi.org/10.1787/5k97b083v1vb-en.
OECD (2010a), “Tax policy reform and Economic Growth”, OECD Tax Policy Studies, no. 20, OECD publishing, paris, http://dx.doi.org/10.1787/9789264091085-en.
OECD (2010b), “Choosing a Broad Base – low rate approach to Taxation”, OECD Tax Policy Studies, no. 19, OECD publishing, paris, http://dx.doi.org/10.1787/9789264091320-en.
OECD (2013), OECD Skills Outlook 2013 - First Results from the Survey of Adult Skills, OECD publishing, paris, https://doi.org/10.1787/9789264204256-en.
OECD (2014), Education at a Glance 2014: OECD Indicators, OECD publishing, paris, https://doi.org/10.1787/eag-2013-en.
OECD (2015a), Education at a Glance 2015: OECD Indicators, OECD publishing, paris, http://dx.doi.org/10.1787/eag-2015-en.
OECD (2015b), In It Together: Why Less Inequality Benefits All, OECD Publishing, OECD publishing, paris, https://doi.org/10.1787/9789264235120-en.
OECD (2016), Taxing Wages 2016, OECD publishing, paris, http://dx.doi.org/10.1787/tax_wages-2016-en.
popov, a. (2014), “Credit constraints and investment in human capital: Training evidence from transition economies”, Journal of Financial Intermediation, vol. 23, pp. 76–100.
Schwerdt, G., D. messer, l. Woessmann, and S.C. Wolter (2012), “The impact of an adult education voucher program: Evidence from a randomized field experiment”, Journal of Public Economics, vol. 96 no 7-8, https://doi.org/10.1016/j.jpubeco.2012.03.001.
Stantcheva, S. (2015), “Optimal Taxation and Human Capital policies over the life Cycle”, NBER Working Paper, no. 21207.
Stone, I., p. Braidford, and SSDa (2008), Engaging Small Employers in Continuing Training: An International Review of Policies and Initiatives, Sector Skills Development agency, http://dera.ioe.ac.uk/9571/1/report_30_3.pdf.
Torres, C. (2012), “Taxes and Investment in Skills”, OECD Taxation Working Papers, no. 13, OECD publishing, paris, http://dx.doi.org/10.1787/5k92sn0qv5mp-en.
Turner, n. (2011), “Why Don’t Taxpayers maximize their Tax-Based Student aid? Salience and Inertia in program Selection”, The B.E. Journal of Economic Analysis & Policy, vol. 11 no. 1.
Turner, n. (2012), “Who benefits from student aid? The economic incidence of tax-based federal student aid”, Economics of Education Review, vol. 31, pp. 463– 481.
139
Taxation and Skills
© OECD 2016
ANNEX A
Technical approach to calculating tax and skills indicators
A.1 IntroductionThis annex outlines an approach to estimating the financial incentives for individuals
and governments to invest in individuals’ skills, and the effect of the tax system on these
incentives. Specifically, the annex derives Marginal Effective Tax Rates (METRs) and Average
Effective Tax Rates (AETRs) on Human Capital Investment, as well as Marginal Returns to
Costs Ratios (MRCRs) and Average Returns to Costs Ratios (ARCRs) of Government Investment
in Human Capital. The annex also explains how these measures relate to each other, and
outlines the effect of government taxes and spending on incentives to invest in skills.
The annex revises and significantly extends the Effective Tax Rates on Skills Methodology
outlined in Brys and Torres (2013). This annex clarifies some of their notation and incorporates
more explicitly the tax treatment of scholarship income into their definition of the METR.
The approach in this study relaxes their assumption that students finance their education
using savings by allowing the student to borrow some fraction of the cost of their education.
Their calculation of the METR and the Breakeven Earnings Increment (BEI) is extended by
also calculating an AETR, for cases where an individual may earn economic rents on a skills
investment. In addition to examining the financial returns to education from an individual’s
perspective, the returns for governments are also examined. A Returns to Costs Ratio (RCR)
of Government Investment in Education (a Tobin’s q of the government investment decision)
is also calculated. This figure provides a summary statistic of the government’s financial
incentives (in terms of tax revenue) to invest in the education of students. This is calculated
for two cases; where an individual breaks even on a skills investment (the “marginal” case),
and where an individual earns economic rents (the “average” case). Combining the RCR with
the BEI for the individual highlights how the personal income tax (PIT) system apportions
the returns and costs of skills investments between the government and the individual.
The formulae throughout this annex are designed to explicate the interaction with
the OECD’s Taxing Wages models (OECD, 2014). Throughout, certain formulae are exactly
the equations modelled in the calculations. These formulae are Equation 16 for the AETR,
Equation 21 for breakeven income after education, Equation 22 for the BEI, Equation 28 for
the METR, Equation 44 for the ARCR, and Equation 48 for the MRCR.
The approach for the individual taken is as follows.1 Section A.2 begins by outlining
the key benefits of education – the extra earnings earned in the labour market – and how
they are impacted by the tax system. The key individual costs of education are outlined:

ANNEX A
140 TAXATION AND SkIllS © OECD 2016
lost earnings, direct costs of education, and the offsetting benefits of scholarship income.
The way in which the tax system can interact with these different factors is outlined. These
costs and benefits, appropriately discounted, together form the NPV of the Educational
Investment.2 This NPV is calculated with and without taxes; this is then used to calculate
the AETR on Skills.
The focus then turns to calculating the BEI, which is the value of the earnings increment
necessary to just breakeven on an educational investment (i.e. when the NPV of the
investment is equal to zero). This is referred to as the BEI. This value is calculated with and
without taxes; the difference forms the core of the METR. The relationship between the
AETR and the METR is calculated, noting that as the amount of extra earnings from a skills
investment converges towards the BEI, the AETR converges towards the METR. Conversely,
as the earnings from a skills investment grow larger and move away from the BEI the AETR
moves away from the METR and converges towards the marginal effective tax rate on the
earnings increment. This result is analogous to the results in Devereux and Griffith (1998)
for physical capital, where the AETR converges to the statutory corporate income tax rate.
Section A.3 moves to the perspective of the government.3 As discussed, two RCRs
are calculated; a “Tobin’s q” of the government’s investment in skills. This is simply the
NPV of the returns to education for the government over the replacement cost of the
educational investment for the government. Two RCRs are calculated, an ARCR, where the
earnings increment obtained by the individual is held fixed; and a MRCR, where the earnings
increment is set to the BEI.
The consideration of the returns to the government is narrow; it is limited to returns
in the form of tax revenue from higher wages. There is no accounting for the higher
tax revenue that may result from the skills investment in the form of higher economic
growth, increased productivity or increased employment. Nor is there any accounting for
non-tax benefits such as reduced spending on unemployment, greater well-being among
the population and so on. This means that an ARCR value of less than one in the model
does not mean that educational investments do not pay for themselves at all; it merely
reflects that they do not pay for themselves solely in the form of recouped tax revenue
from higher wages.
Section A.4 expands the analysis by relaxing the assumption that students finance
their education with retained earnings. In this section, students are assumed to borrow
some fraction of the cost of their investments in skills. It is assumed this borrowing
occurs in the form of an interest-only bond. Interest is paid in each year of the duration
of the loan, and the principal is repaid in the final year of the loan. The interest rate of
the loan as well as its length is allowed to vary. The tax treatment of interest on the loan
is considered, as well as the possibility that some fraction of the principal can be written
off by the government.
In this section, the definitions of the key statistics, the BEI, METR, AETR, ARCR and
MRCR are defined to account for the possibility of financing skills investments from debt
as well as savings. It is assumed in the consideration of the returns to government that the
government is the creditor of the student. Hence, reduced interest rates for the student
constitute a cost for the government, as are parts of the loan principal that are written off.
Finally, tax deductibility or exemptions of interest on the student loan are also a cost from
the perspective of the government.
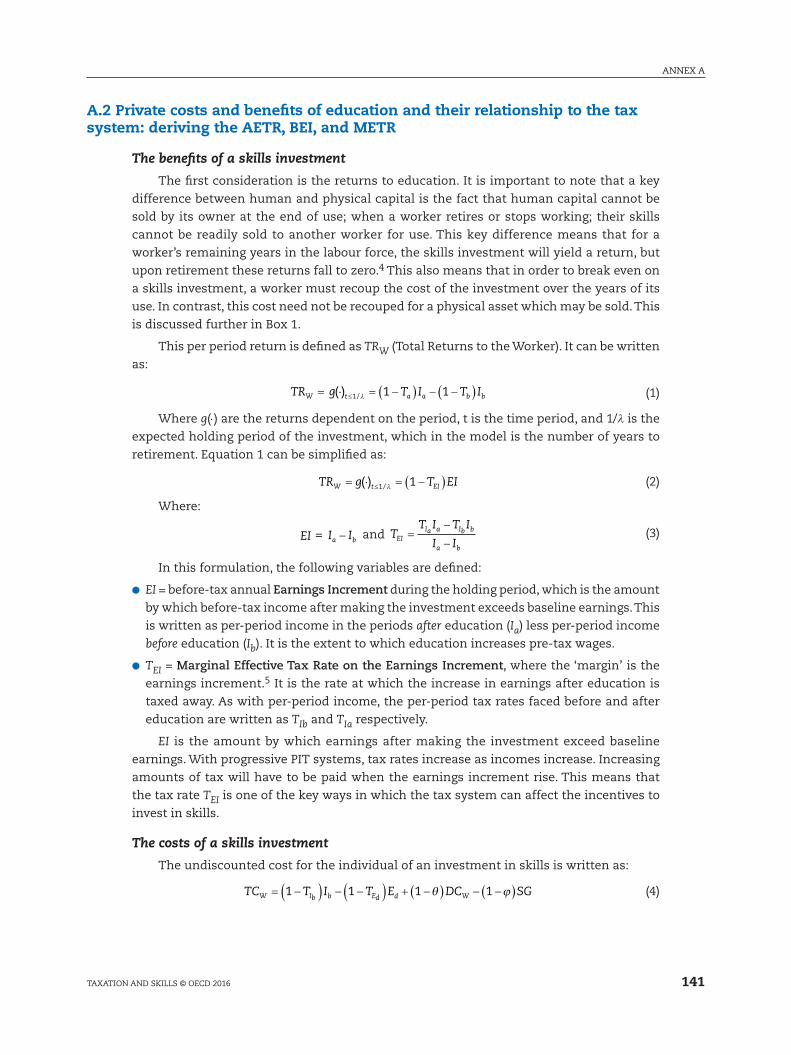
141
ANNEX A
TAXATION AND SkIllS © OECD 2016
A.2 Private costs and benefits of education and their relationship to the tax system: deriving the AETR, BEI, and METR
The benefits of a skills investment
The first consideration is the returns to education. It is important to note that a key
difference between human and physical capital is the fact that human capital cannot be
sold by its owner at the end of use; when a worker retires or stops working; their skills
cannot be readily sold to another worker for use. This key difference means that for a
worker’s remaining years in the labour force, the skills investment will yield a return, but
upon retirement these returns fall to zero.4 This also means that in order to break even on
a skills investment, a worker must recoup the cost of the investment over the years of its
use. In contrast, this cost need not be recouped for a physical asset which may be sold. This
is discussed further in Box 1.
This per period return is defined as TRW (Total Returns to the Worker). It can be written
as:
TR g T I T IW t a a b b= ⋅ = −( ) − −( )≤( ) /1 1 1λ (1)
Where g(⋅) are the returns dependent on the period, t is the time period, and 1/λ is the
expected holding period of the investment, which in the model is the number of years to
retirement. Equation 1 can be simplified as:
TR g T EIW t EI= ⋅ = −( )≤( ) /1 1λ (2)
Where:
EI = I Ia b− and TT I T I
I IEIIa a Ib b
a b
=−
− (3)
In this formulation, the following variables are defined:
●● EI = before-tax annual Earnings Increment during the holding period, which is the amount
by which before-tax income after making the investment exceeds baseline earnings. This
is written as per-period income in the periods after education (Ia) less per-period income
before education (Ib). It is the extent to which education increases pre-tax wages.
●● TEI = Marginal Effective Tax Rate on the Earnings Increment, where the ‘margin’ is the
earnings increment.5 It is the rate at which the increase in earnings after education is
taxed away. As with per-period income, the per-period tax rates faced before and after
education are written as TIb and TIa respectively.
EI is the amount by which earnings after making the investment exceed baseline
earnings. With progressive PIT systems, tax rates increase as incomes increase. Increasing
amounts of tax will have to be paid when the earnings increment rise. This means that
the tax rate TEI is one of the key ways in which the tax system can affect the incentives to
invest in skills.
The costs of a skills investment
The undiscounted cost for the individual of an investment in skills is written as:
TC T I T E DC SGW Ib b Ed d W= −( ) − −( ) + −( ) − −( )1 1 1 1θ ϕ
(4)
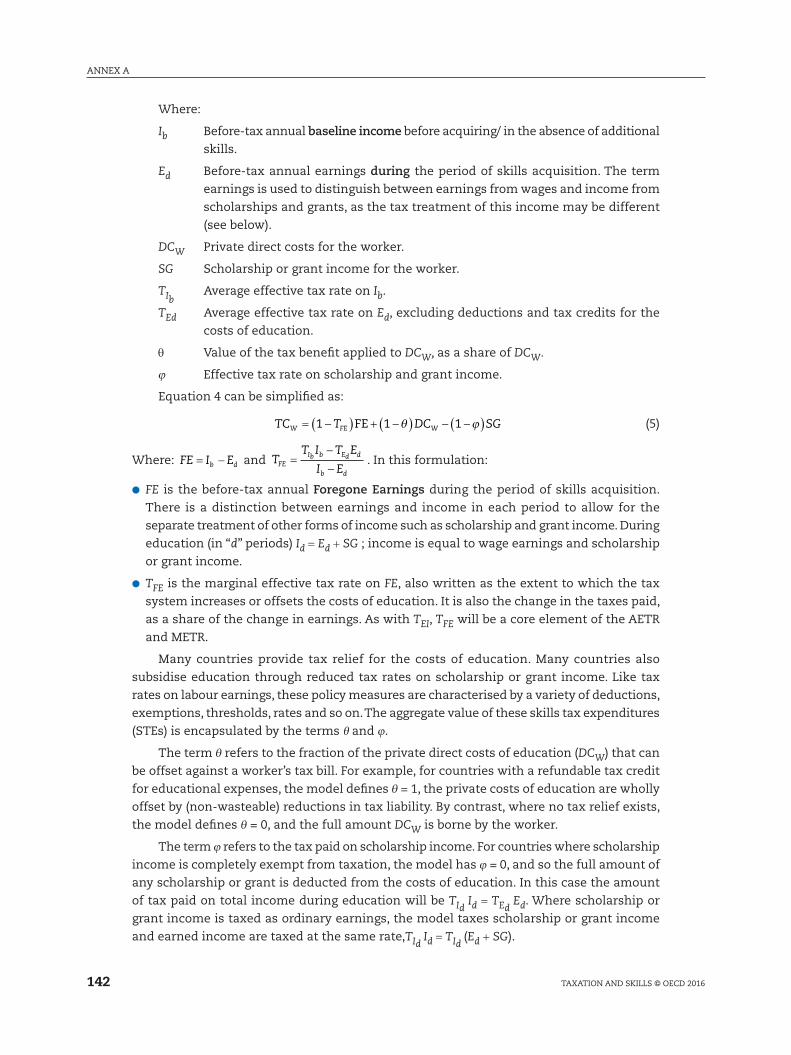
ANNEX A
142 TAXATION AND SkIllS © OECD 2016
Where:
Ib Before-tax annual baseline income before acquiring/ in the absence of additional
skills.
Ed Before-tax annual earnings during the period of skills acquisition. The term
earnings is used to distinguish between earnings from wages and income from
scholarships and grants, as the tax treatment of this income may be different
(see below).
DCW Private direct costs for the worker.
SG Scholarship or grant income for the worker.
TIb Average effective tax rate on Ib.
TEd Average effective tax rate on Ed, excluding deductions and tax credits for the
costs of education.
θ Value of the tax benefit applied to DCW, as a share of DCW.
ϕ Effective tax rate on scholarship and grant income.
Equation 4 can be simplified as:
TC T DC SGW FE W= −( ) + −( ) − −( )1 1 1FE θ ϕ
(5)
Where: FE I Eb d= − and TT I T E
I EFEIb b Ed d
b d
=−
−. In this formulation:
●● FE is the before-tax annual Foregone Earnings during the period of skills acquisition.
There is a distinction between earnings and income in each period to allow for the
separate treatment of other forms of income such as scholarship and grant income. During
education (in “d” periods) Id = Ed + SG ; income is equal to wage earnings and scholarship
or grant income.
●● TFE is the marginal effective tax rate on FE, also written as the extent to which the tax
system increases or offsets the costs of education. It is also the change in the taxes paid,
as a share of the change in earnings. As with TEI, TFE will be a core element of the AETR
and METR.
Many countries provide tax relief for the costs of education. Many countries also
subsidise education through reduced tax rates on scholarship or grant income. like tax
rates on labour earnings, these policy measures are characterised by a variety of deductions,
exemptions, thresholds, rates and so on. The aggregate value of these skills tax expenditures
(STEs) is encapsulated by the terms θ and ϕ.
The term θ refers to the fraction of the private direct costs of education (DCW) that can
be offset against a worker’s tax bill. For example, for countries with a refundable tax credit
for educational expenses, the model defines θ = 1, the private costs of education are wholly
offset by (non-wasteable) reductions in tax liability. By contrast, where no tax relief exists,
the model defines θ = 0, and the full amount DCW is borne by the worker.
The term ϕ refers to the tax paid on scholarship income. For countries where scholarship
income is completely exempt from taxation, the model has ϕ = 0, and so the full amount of
any scholarship or grant is deducted from the costs of education. In this case the amount
of tax paid on total income during education will be TId Id = TEd Ed. Where scholarship or
grant income is taxed as ordinary earnings, the model taxes scholarship or grant income
and earned income are taxed at the same rate,TId Id = TId (Ed + SG).
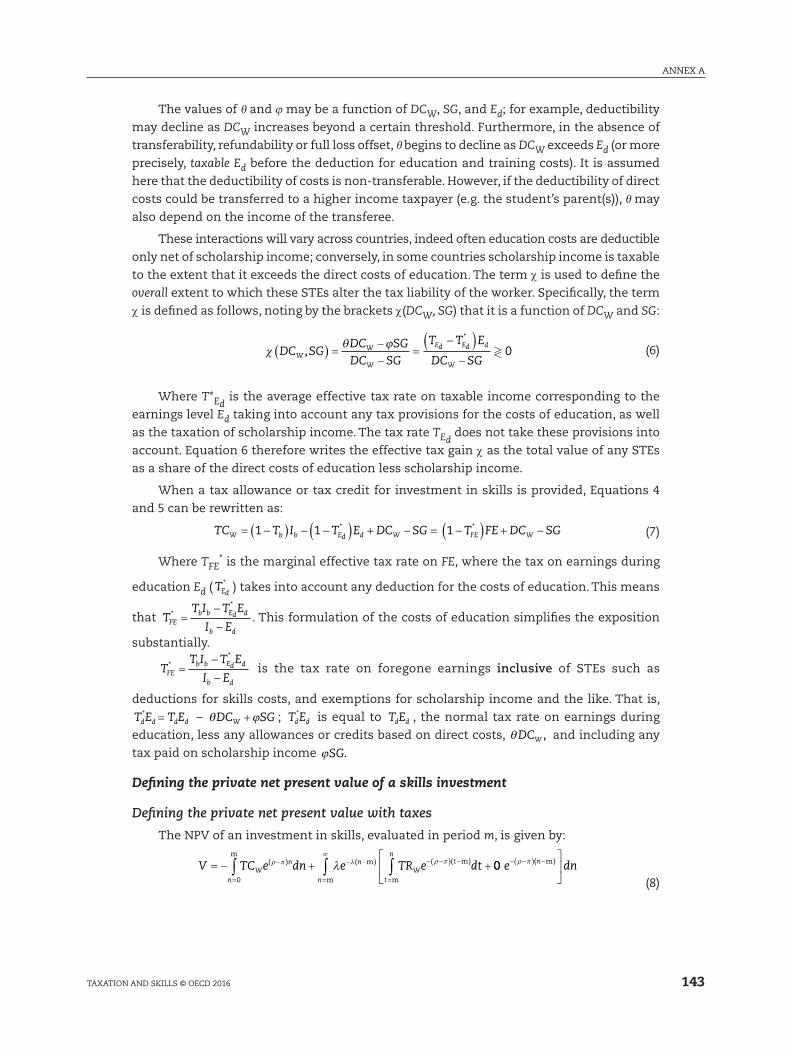
143
ANNEX A
TAXATION AND SkIllS © OECD 2016
The values of θ and ϕ may be a function of DCW, SG, and Ed; for example, deductibility
may decline as DCW increases beyond a certain threshold. Furthermore, in the absence of
transferability, refundability or full loss offset, θ begins to decline as DCW exceeds Ed (or more
precisely, taxable Ed before the deduction for education and training costs). It is assumed
here that the deductibility of costs is non-transferable. However, if the deductibility of direct
costs could be transferred to a higher income taxpayer (e.g. the student’s parent(s)), θ may
also depend on the income of the transferee.
These interactions will vary across countries, indeed often education costs are deductible
only net of scholarship income; conversely, in some countries scholarship income is taxable
to the extent that it exceeds the direct costs of education. The term χ is used to define the
overall extent to which these STEs alter the tax liability of the worker. Specifically, the term
χ is defined as follows, noting by the brackets χ(DCW, SG) that it is a function of DCW and SG:
χ
θ ϕDC SG
DC SGDC SG
T T E
DC SGWW
W
Ed Ed d
W
,*
( ) = −−
=−( )−
0
(6)
Where T*Ed
is the average effective tax rate on taxable income corresponding to the
earnings level Ed taking into account any tax provisions for the costs of education, as well
as the taxation of scholarship income. The tax rate TEd does not take these provisions into
account. Equation 6 therefore writes the effective tax gain χ as the total value of any STEs
as a share of the direct costs of education less scholarship income.
When a tax allowance or tax credit for investment in skills is provided, Equations 4
and 5 can be rewritten as:
TC T I T E DC SG T FE DC SGW b b Ed d W FE W= −( ) − −( ) + − = −( ) + −1 1 1* *
(7)
Where TFE* is the marginal effective tax rate on FE, where the tax on earnings during
education Ed ( TEd* ) takes into account any deduction for the costs of education. This means
that **
TT I T E
I EFEb b Ed d
b d
=−
−. This formulation of the costs of education simplifies the exposition
substantially.
TT I T E
I EFEb b Ed d
b d
**
=−
− is the tax rate on foregone earnings inclusive of STEs such as
deductions for skills costs, and exemptions for scholarship income and the like. That is,
T E T Ed d d d* = – θ ϕDC SGW + ; T Ed d
* is equal to T Ed d , the normal tax rate on earnings during
education, less any allowances or credits based on direct costs, θDCW , and including any
tax paid on scholarship income ϕSG.
Defining the private net present value of a skills investment
Defining the private net present value with taxes
The NPV of an investment in skills, evaluated in period m, is given by:
V TC e dn e TR e dt
nW
n
n
n
t
n
Wt= − + +
=
−
=
− −
=
− −( ) −∫ ∫ ∫0
m
m
m
m
m( ) ( ) ( )ρ π∞
λ ρ πλ 00 me dnn− −( ) −
ρ π ( )
(8)
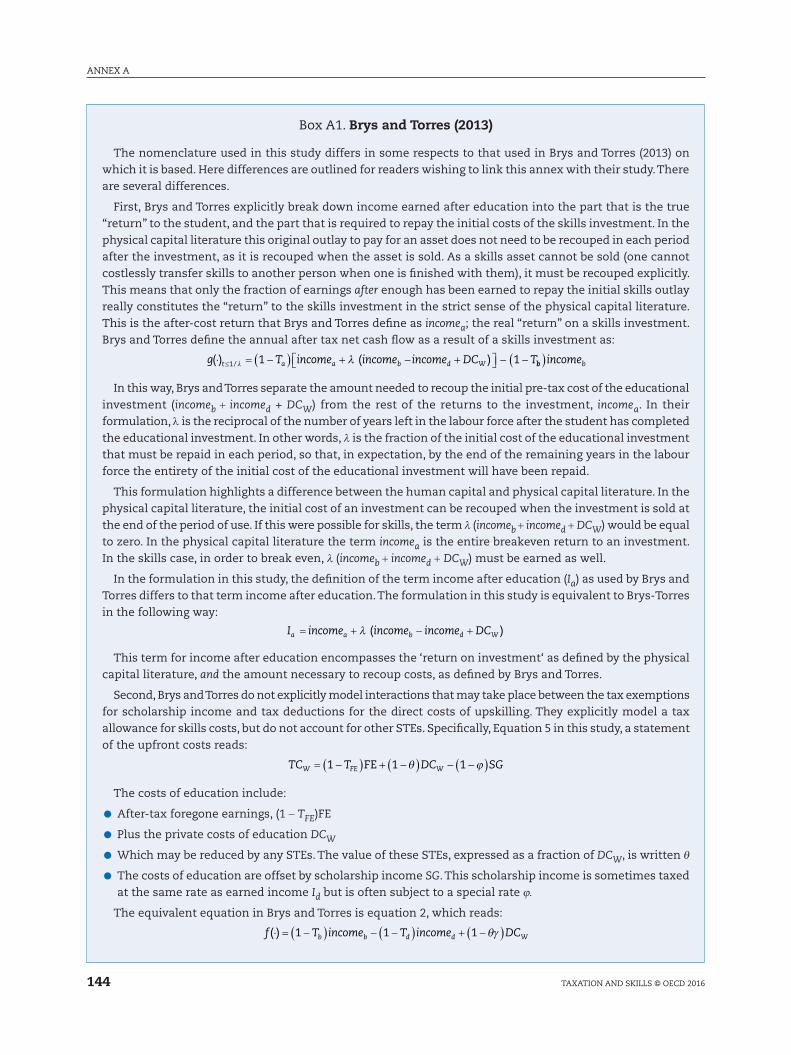
ANNEX A
144 TAXATION AND SkIllS © OECD 2016
Box A1. Brys and Torres (2013)
The nomenclature used in this study differs in some respects to that used in Brys and Torres (2013) on which it is based. Here differences are outlined for readers wishing to link this annex with their study. There are several differences.
First, Brys and Torres explicitly break down income earned after education into the part that is the true “return” to the student, and the part that is required to repay the initial costs of the skills investment. In the physical capital literature this original outlay to pay for an asset does not need to be recouped in each period after the investment, as it is recouped when the asset is sold. As a skills asset cannot be sold (one cannot costlessly transfer skills to another person when one is finished with them), it must be recouped explicitly. This means that only the fraction of earnings after enough has been earned to repay the initial skills outlay really constitutes the “return” to the skills investment in the strict sense of the physical capital literature. This is the after-cost return that Brys and Torres define as incomea; the real “return” on a skills investment. Brys and Torres define the annual after tax net cash flow as a result of a skills investment as:
( ) ( )/g T income income income DC Tt a a b d W⋅ = −( ) + − + − −≤1 1 1λ λ bb bincome( )
In this way, Brys and Torres separate the amount needed to recoup the initial pre-tax cost of the educational investment (incomeb + incomed + DCW) from the rest of the returns to the investment, incomea. In their formulation, λ is the reciprocal of the number of years left in the labour force after the student has completed the educational investment. In other words, λ is the fraction of the initial cost of the educational investment that must be repaid in each period, so that, in expectation, by the end of the remaining years in the labour force the entirety of the initial cost of the educational investment will have been repaid.
This formulation highlights a difference between the human capital and physical capital literature. In the physical capital literature, the initial cost of an investment can be recouped when the investment is sold at the end of the period of use. If this were possible for skills, the term λ (incomeb + incomed + DCW) would be equal to zero. In the physical capital literature the term incomea is the entire breakeven return to an investment. In the skills case, in order to break even, λ (incomeb + incomed + DCW) must be earned as well.
In the formulation in this study, the definition of the term income after education (Ia) as used by Brys and Torres differs to that term income after education. The formulation in this study is equivalent to Brys-Torres in the following way:
I income income income DCa a b d W= + − +( )λ
This term for income after education encompasses the ‘return on investment‘ as defined by the physical capital literature, and the amount necessary to recoup costs, as defined by Brys and Torres.
Second, Brys and Torres do not explicitly model interactions that may take place between the tax exemptions for scholarship income and tax deductions for the direct costs of upskilling. They explicitly model a tax allowance for skills costs, but do not account for other STEs. Specifically, Equation 5 in this study, a statement of the upfront costs reads:
TC T DC SGW FE W= −( ) + −( ) − −( )1 1 1FE θ ϕ
The costs of education include:
●● After-tax foregone earnings, (1 − TFE)FE
●● Plus the private costs of education DCW
●● Which may be reduced by any STEs. The value of these STEs, expressed as a fraction of DCW, is written θ
●● The costs of education are offset by scholarship income SG. This scholarship income is sometimes taxed at the same rate as earned income Id but is often subject to a special rate ϕ.
The equivalent equation in Brys and Torres is equation 2, which reads:
f T income T income DCb b d d W( )⋅ = −( ) − −( ) + −( )1 1 1 θγ
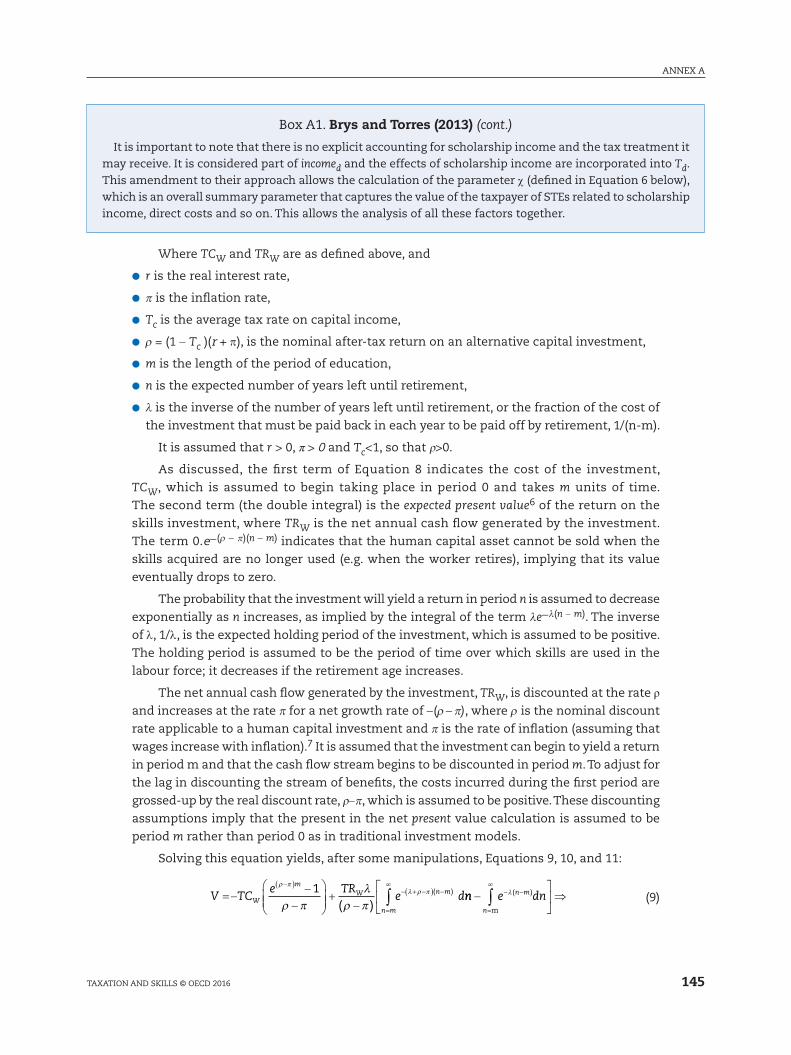
145
ANNEX A
TAXATION AND SkIllS © OECD 2016
Where TCW and TRW are as defined above, and
●● r is the real interest rate,
●● π is the inflation rate,
●● Tc is the average tax rate on capital income,
●● ρ = (1 − Tc )(r + π), is the nominal after-tax return on an alternative capital investment,
●● m is the length of the period of education,
●● n is the expected number of years left until retirement,
●● λ is the inverse of the number of years left until retirement, or the fraction of the cost of
the investment that must be paid back in each year to be paid off by retirement, 1/(n-m).
It is assumed that r > 0, π > 0 and Tc<1, so that ρ>0.
As discussed, the first term of Equation 8 indicates the cost of the investment,
TCW, which is assumed to begin taking place in period 0 and takes m units of time.
The second term (the double integral) is the expected present value6 of the return on the
skills investment, where TRW is the net annual cash flow generated by the investment.
The term 0.e−(ρ − π)(n − m) indicates that the human capital asset cannot be sold when the
skills acquired are no longer used (e.g. when the worker retires), implying that its value
eventually drops to zero.
The probability that the investment will yield a return in period n is assumed to decrease
exponentially as n increases, as implied by the integral of the term λe−λ(n − m). The inverse
of λ, 1/λ, is the expected holding period of the investment, which is assumed to be positive.
The holding period is assumed to be the period of time over which skills are used in the
labour force; it decreases if the retirement age increases.
The net annual cash flow generated by the investment, TRW, is discounted at the rate ρ
and increases at the rate π for a net growth rate of −(ρ − π), where ρ is the nominal discount
rate applicable to a human capital investment and π is the rate of inflation (assuming that
wages increase with inflation).7 It is assumed that the investment can begin to yield a return
in period m and that the cash flow stream begins to be discounted in period m. To adjust for
the lag in discounting the stream of benefits, the costs incurred during the first period are
grossed-up by the real discount rate, ρ−π, which is assumed to be positive. These discounting
assumptions imply that the present in the net present value calculation is assumed to be
period m rather than period 0 as in traditional investment models.
Solving this equation yields, after some manipulations, Equations 9, 10, and 11:
V TCe TR
e dW
mW
n m
n m=−−
−
+ −
−( )
=
− + −( ) −∫( )( )
ρ π ∞λ ρ π
ρ πλ
ρ π1
nn e dnn
n m−
⇒
=
− −∫m
∞λ( )
(9)
It is important to note that there is no explicit accounting for scholarship income and the tax treatment it may receive. It is considered part of incomed and the effects of scholarship income are incorporated into Td. This amendment to their approach allows the calculation of the parameter χ (defined in Equation 6 below), which is an overall summary parameter that captures the value of the taxpayer of STEs related to scholarship income, direct costs and so on. This allows the analysis of all these factors together.
Box A1. Brys and Torres (2013) (cont.)
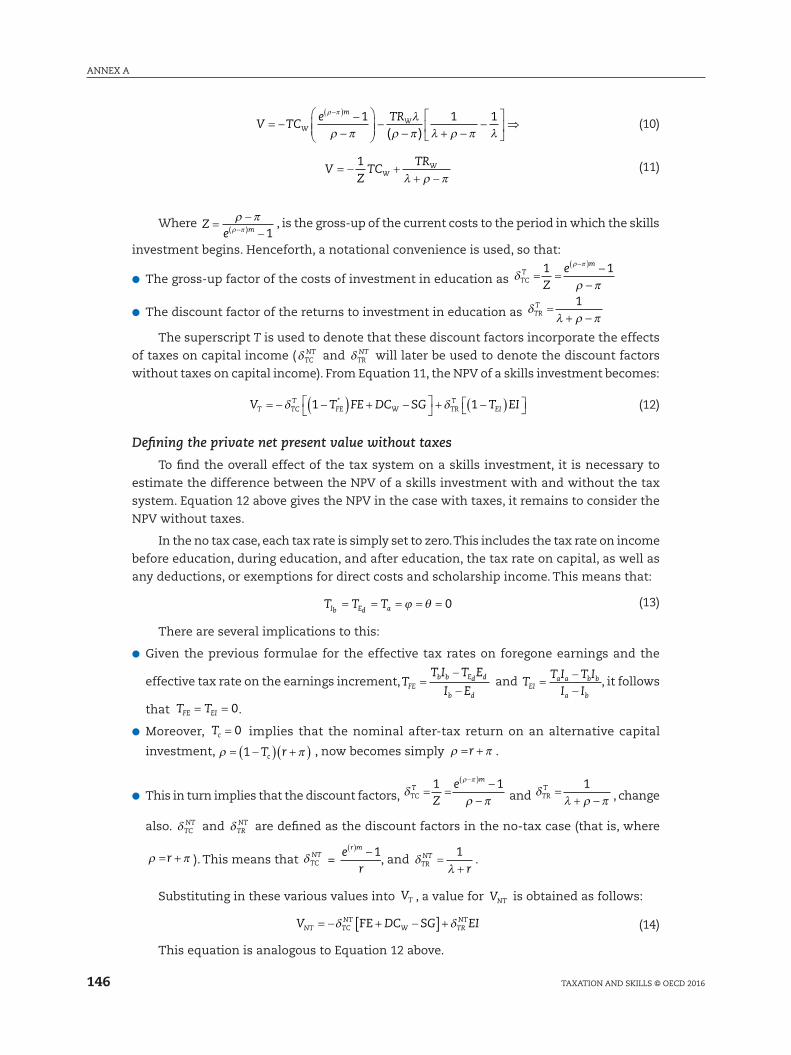
ANNEX A
146 TAXATION AND SkIllS © OECD 2016
V TCe TR
W
mW= −
−−
− − + −
−
⇒
−( )
( )
ρ π
ρ πλ
ρ π λ ρ π λ1 1 1
(10)
VZ
TCTR
WW= − +
+ −1
λ ρ π (11)
Where Ze m=
−−−
ρ πρ π( ) 1
, is the gross-up of the current costs to the period in which the skills
investment begins. Henceforth, a notational convenience is used, so that:
●● The gross-up factor of the costs of investment in education as δ ρ π
ρ π
TCT
m
Ze
= =−
−
−( )1 1
●● The discount factor of the returns to investment in education as δ λ ρ πTRT =
+ −1
The superscript T is used to denote that these discount factors incorporate the effects
of taxes on capital income ( δTCNT and δTR
NT will later be used to denote the discount factors
without taxes on capital income). From Equation 11, the NPV of a skills investment becomes:
V T FE DC SG T EIT TCT
FE W TRT
EI= − −( ) + −
+ −( )
*δ δ1 1 (12)
Defining the private net present value without taxes
To find the overall effect of the tax system on a skills investment, it is necessary to
estimate the difference between the NPV of a skills investment with and without the tax
system. Equation 12 above gives the NPV in the case with taxes, it remains to consider the
NPV without taxes.
In the no tax case, each tax rate is simply set to zero. This includes the tax rate on income
before education, during education, and after education, the tax rate on capital, as well as
any deductions, or exemptions for direct costs and scholarship income. This means that:
T T TIb Ed a= = = = =ϕ θ 0 (13)
There are several implications to this:
●● Given the previous formulae for the effective tax rates on foregone earnings and the
effective tax rate on the earnings increment, TT I T E
I EFEb b Ed d
b d
=−
− and T
T I T II IEI
a a b b
a b
=−−
, it follows
that TFE = TEI = 0.
●● Moreover, Tc = 0 implies that the nominal after-tax return on an alternative capital
investment, ρ π= −( ) +( )1 T rc , now becomes simply ρ π= +r .
●● This in turn implies that the discount factors, δ ρ π
ρ π
TCT
m
Ze
= =−
−
−( )1 1 and δ λ ρ πTR
T =+ −
1, change
also. δTCNT and δTR
NT are defined as the discount factors in the no-tax case (that is, where
ρ π= +r ). This means that δTCNT =
er
r m( ) −1, and δ
λTRNT
r=
+1
.
Substituting in these various values into VT , a value for VNT is obtained as follows:
V DC SG EINT TCNT
W TRNT= − + −[ ] +δ δFE (14)
This equation is analogous to Equation 12 above.
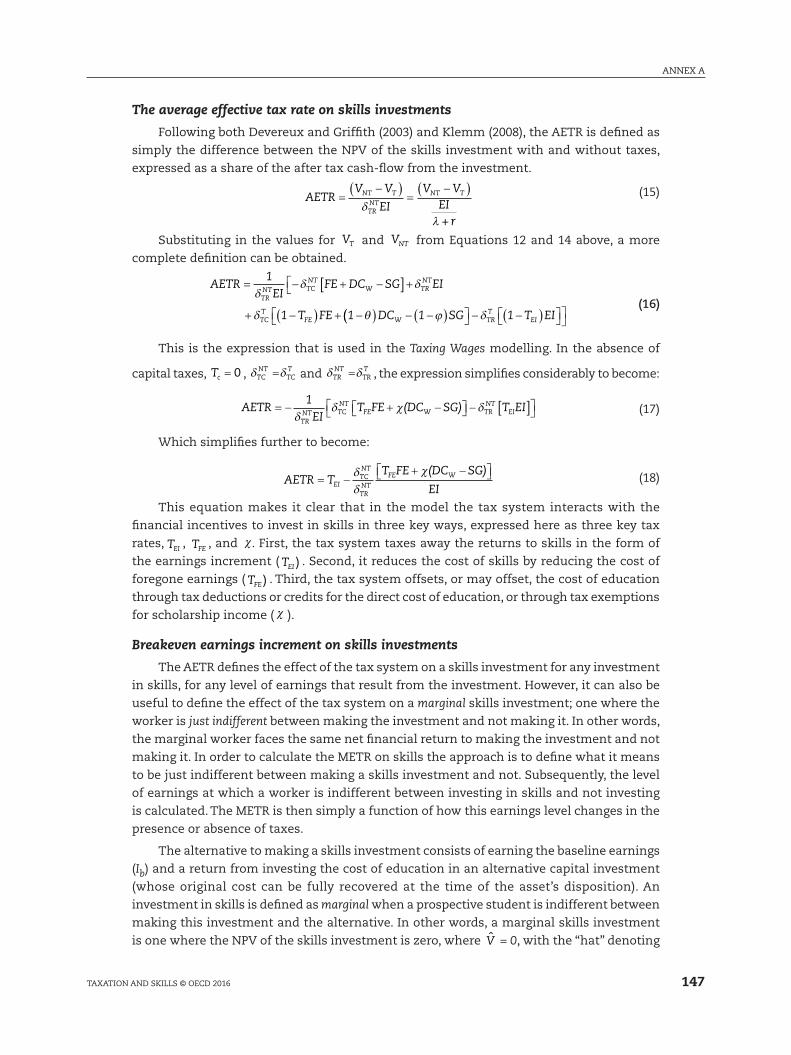
147
ANNEX A
TAXATION AND SkIllS © OECD 2016
The average effective tax rate on skills investments
Following both Devereux and Griffith (2003) and klemm (2008), the AETR is defined as
simply the difference between the NPV of the skills investment with and without taxes,
expressed as a share of the after tax cash-flow from the investment.
AETRV V
EI
V VEI+ r
NT T
TRNT
NT T=( )
=( )− −
δλ
(15)
Substituting in the values for VT and VNT from Equations 12 and 14 above, a more
complete definition can be obtained.
AETR1
EIFE DC SG EI
1 T FE 1
TRNT TC
NTW TR
NT
TCT
FE
= +[ ] +
+ ( ) +
δδ δ
δ θ
− −
− −(( ) ( ) ( ) DC 1 SG 1 TW TRT
EI− − − −ϕ δ EI (16)
This is the expression that is used in the Taxing Wages modelling. In the absence of
capital taxes, Tc = 0 , δ δTCNT
TCT= and δ δTR
NTTRT= , the expression simplifies considerably to become:
AETR1
EIT FE (DC SG) T EI
TRNT TC
NTFE W TR
NTEI= − − −
δδ χ δ+ [ ] (17)
Which simplifies further to become:
AETR TT FE (DC SG)
EIEITCNT
TRNT
FE W=+ −
−δδ
χ (18)
This equation makes it clear that in the model the tax system interacts with the
financial incentives to invest in skills in three key ways, expressed here as three key tax
rates, TEI , TFE , and χ. First, the tax system taxes away the returns to skills in the form of
the earnings increment ( TEI ) . Second, it reduces the cost of skills by reducing the cost of
foregone earnings ( TFE ) . Third, the tax system offsets, or may offset, the cost of education
through tax deductions or credits for the direct cost of education, or through tax exemptions
for scholarship income ( χ ).
Breakeven earnings increment on skills investments
The AETR defines the effect of the tax system on a skills investment for any investment
in skills, for any level of earnings that result from the investment. However, it can also be
useful to define the effect of the tax system on a marginal skills investment; one where the
worker is just indifferent between making the investment and not making it. In other words,
the marginal worker faces the same net financial return to making the investment and not
making it. In order to calculate the METR on skills the approach is to define what it means
to be just indifferent between making a skills investment and not. Subsequently, the level
of earnings at which a worker is indifferent between investing in skills and not investing
is calculated. The METR is then simply a function of how this earnings level changes in the
presence or absence of taxes.
The alternative to making a skills investment consists of earning the baseline earnings
(Ib) and a return from investing the cost of education in an alternative capital investment
(whose original cost can be fully recovered at the time of the asset’s disposition). An
investment in skills is defined as marginal when a prospective student is indifferent between
making this investment and the alternative. In other words, a marginal skills investment
is one where the NPV of the skills investment is zero, where V̂ = 0, with the “hat” denoting
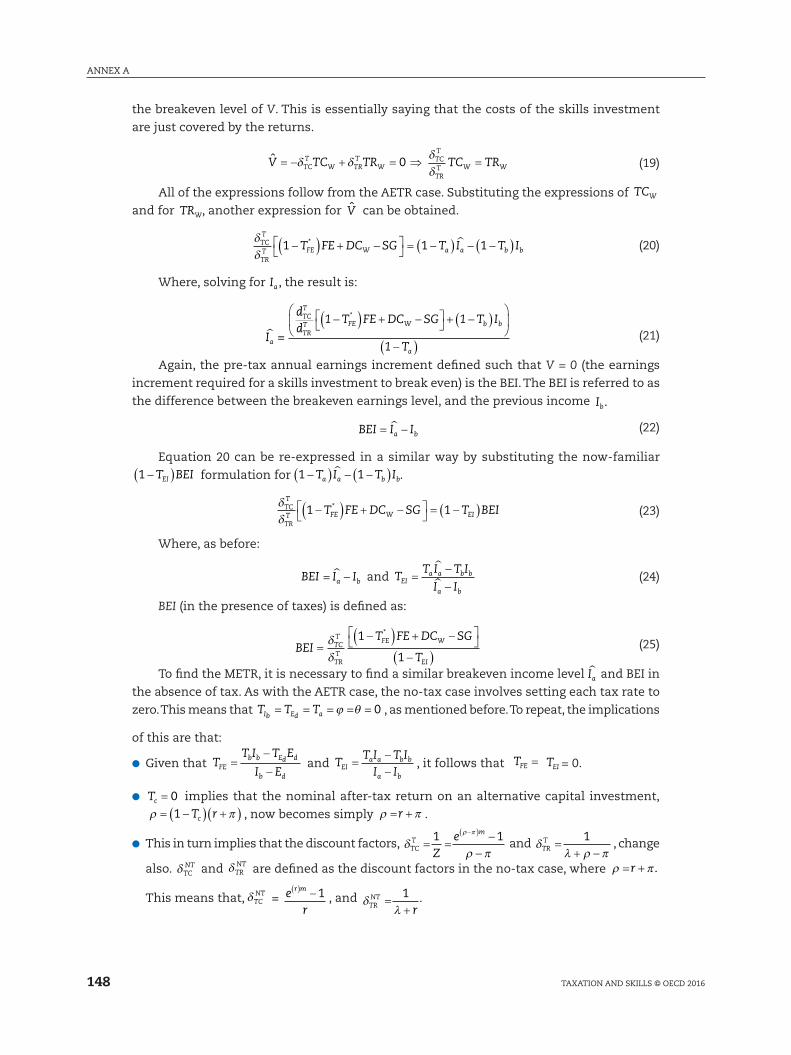
ANNEX A
148 TAXATION AND SkIllS © OECD 2016
the breakeven level of V. This is essentially saying that the costs of the skills investment
are just covered by the returns.
V̂ TC TR TC TRTCT
W TRT
WTCT
TRT W W= − + = ⇒ =δ δ
δδ
0 (19)
All of the expressions follow from the AETR case. Substituting the expressions of TCW
and for TRW, another expression for V̂ can be obtained.
δδ
TCT
TRT FE W a a b bT FE DC SG T I T I1 1 1−( ) + −
= −( ) − −( )*
(20)
Where, solving for Ia, the result is:
I =
dd
1 T FE DC SG 1 T I
1 Ta
TCT
TRT FE
*W b b
a
− − −
−
( ) +
+ ( )
( ) (21)
Again, the pre-tax annual earnings increment defined such that V = 0 (the earnings
increment required for a skills investment to break even) is the BEI. The BEI is referred to as
the difference between the breakeven earnings level, and the previous income Ib.
BEI I Ia b= − (22)
Equation 20 can be re-expressed in a similar way by substituting the now-familiar 1 −( )T BEIEI formulation for 1 1−( ) − −( )T I T Ia a b b
.
δδ
TCT
TRT FE W EIT FE DC SG T BEI1 1−( ) + −
= −( )* (23)
Where, as before:
BEI = I Ia b − and T
T I T I
I IEI
a a b b
a b
=−−
(24)
BEI (in the presence of taxes) is defined as:
BEIT FE DC SG
TTCT
TRT
FE W
EI
=−( ) + −
−( )δδ
1
1
*
(25)
To find the METR, it is necessary to find a similar breakeven income level Ia and BEI in
the absence of tax. As with the AETR case, the no-tax case involves setting each tax rate to
zero. This means that T T TIb Ed a= = = = =ϕ θ 0 , as mentioned before. To repeat, the implications
of this are that:
●● Given that TT I T E
I EFEb b Ed d
b d
=−
− and T
T I T II IEI
a a b b
a b
=−−
, it follows that TFE = TEI = 0.
●● Tc = 0 implies that the nominal after-tax return on an alternative capital investment,ρ π= −( ) +( )1 T rc , now becomes simply ρ π= +r .
●● This in turn implies that the discount factors, δρ π
ρ π
TCT
m
Ze
= =−
−
−( )1 1 and δλ ρ πTR
T =+ −
1 , change
also. δTCNT and δTR
NT are defined as the discount factors in the no-tax case, where ρ π= + .r
This means that, δTCNT = e
r
r m( ) −1 , and δλTR
NT
r=
+1 .
149
ANNEX A
TAXATION AND SkIllS © OECD 2016
IaNT can be expressed as:
I FE DC SG IaNT TC
NT
TRNT W b
= + −[ ] +δδ
(26)
The no-tax BEI can similarly be expressed as:
BEI FE DC SGNTTCNT
TRNT W= + −[ ]δ
δ (27)
The marginal effective tax rate on skills investments
The METR on skills is the difference between the Earnings Increment needed to make
the investment in the presence and absence of taxes expressed as a share of the minimum
earnings increment required to make the investment in the presence of taxes. Essentially
it answers the question: for a marginal skills investor, what fraction of the required return
is attributable to tax? This equation is expressed concisely below:
METR =BEI BEI
BEIT NT
T
− (28)
Substituting in the expressions for BEIT and BEINT from Equations 25 and 27 the
definition of the METR in Equation 28 can be written as:
METRT FE DC SG T FE DCFE W
TCNT
TCT
TRT
TRNT EI W
=−( ) + −
− −( ) +1 1* δ
δδδ
−−[ ]
−( ) + −
SG
T FE DC SGFE W*1
(29)
If it is assumed that Tc = 0 , then this expression simplifies to:
METRT FE T FE DC SG
T FE DC SGFE EI W
FE W
=− + + −( )
−( ) + −
*
*1 (30)
Which, by adding and subtracting T T FEEI FE* to the numerator, becomes:
METR TT FE T
T FE DC SGEI
FE EI
FE W
= −−
−( ) + −
*
*
( )1
1 (31)
like Equation 18, this equation demonstrates that the METR is a function of differing
tax effects: the tax rate on the earnings increment, as well as the tax rate on the costs of
education, incorporating both the tax rate on foregone earnings, as well as the tax rate on
the costs of education χ, both of which are incorporated into the rate *TFE.
Upper and lower bounds of the average effective tax rate
In a result similar to those found in the literature on the tax treatment of physical capital,
it can be seen that the AETR is a weighted average of the METR and the statutory tax rate on
human capital. The AETR on skills is equal to the METR when the earnings increment falls
such that it is just equal to the amount needed to breakeven. Where the earnings increment
from the skills investment is higher, the average tax rate is a mix between this marginal rate
and the top tax rate on skills. In this case, the latter tax rate is the tax rate on the earnings
increment. This can be expressed in Equation 32:
AETRBEIEI
METRBEIEI
TEI=
+ −
1 (32)
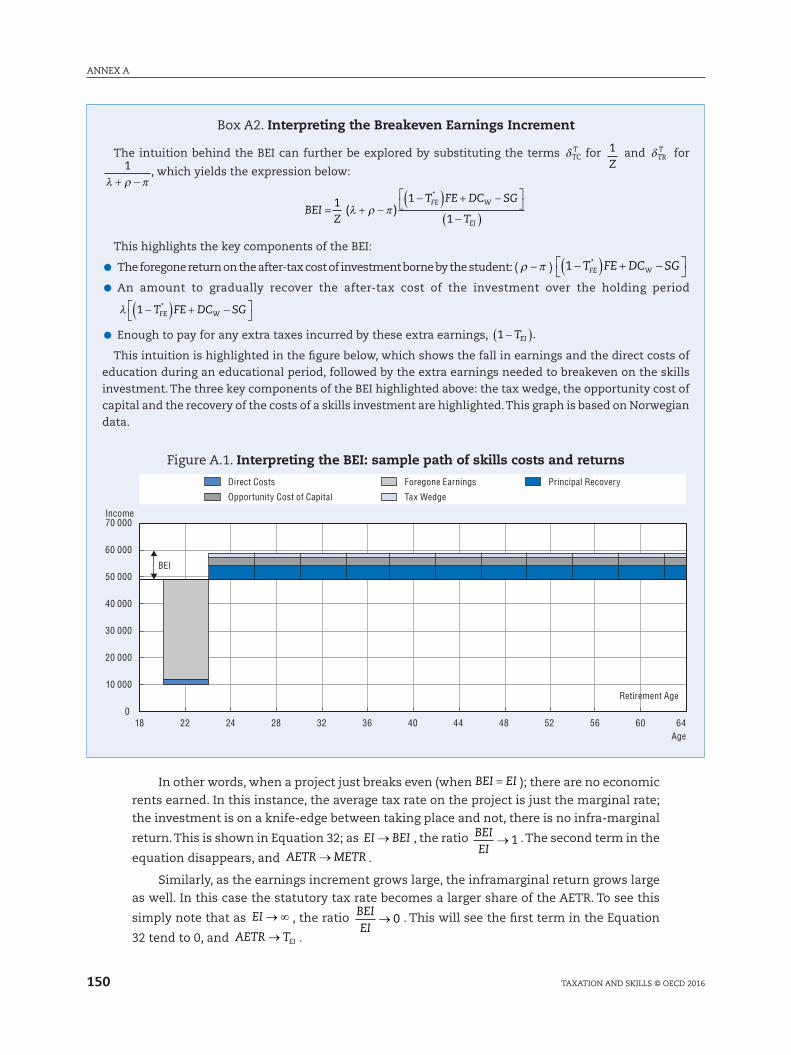
ANNEX A
150 TAXATION AND SkIllS © OECD 2016
In other words, when a project just breaks even (when BEI EI= ); there are no economic
rents earned. In this instance, the average tax rate on the project is just the marginal rate;
the investment is on a knife-edge between taking place and not, there is no infra-marginal
return. This is shown in Equation 32; as EI BEI→ , the ratio BEIEI
→ 1 . The second term in the
equation disappears, and AETR METR→ .
Similarly, as the earnings increment grows large, the inframarginal return grows large
as well. In this case the statutory tax rate becomes a larger share of the AETR. To see this
simply note that as EI →∞ , the ratio BEIEI
→ 0 . This will see the first term in the Equation
32 tend to 0, and AETR TEI→ .
Box A2. Interpreting the Breakeven Earnings Increment
The intuition behind the BEI can further be explored by substituting the terms δTCT for 1
Z and δTR
T for 1
λ ρ π+ −, which yields the expression below:
BEI
Z
T FE DC SG
T
FE W
EI
= + −−( ) + −
−( )( )
*1 1
1λ ρ π
This highlights the key components of the BEI:
●● The foregone return on the after-tax cost of investment borne by the student: ( ρ π− ) *1 −( ) + −
T FE DC SGFE W
●● An amount to gradually recover the after-tax cost of the investment over the holding period
λ 1 −( ) + −
T FE DC SGFE W
*
●● Enough to pay for any extra taxes incurred by these extra earnings, 1 −( )TEI .
This intuition is highlighted in the figure below, which shows the fall in earnings and the direct costs of education during an educational period, followed by the extra earnings needed to breakeven on the skills investment. The three key components of the BEI highlighted above: the tax wedge, the opportunity cost of capital and the recovery of the costs of a skills investment are highlighted. This graph is based on Norwegian data.
Figure A.1. Interpreting the BEI: sample path of skills costs and returns
70 000
0
10 000
20 000
30 000
40 000
50 000
60 000
18 22 24 28 32 36 40 44 48 52 56 60 64
BEI
Direct Costs
Opportunity Cost of Capital
Foregone Earnings
Tax Wedge
Principal Recovery
Income
Age
Retirement Age
151
ANNEX A
TAXATION AND SkIllS © OECD 2016
To demonstrate the veracity of Equation 32, recall the definitions of METR, BEI and AETR.
These are taken from Equations 31, 25, and 18, respectively.
METR TT FE(1 T )
1 T FE DC SGEI
FE*
EI
FE*
W
=( ) +
−−
− − (33)
BEI1 T FE DC SG
1 TTCT
TRT
FE*
W
EI
=( ) +
( )δδ
− −
− (34)
AETR TT FE (DC SG)
EIEITCT
TRT
FE W=+ −
−δδ
χ (35)
Substituting Equation 33 into Equation 32 above, the following result is obtained:
AETRBEIEI
TBEIEI
T FE T
T FE DCEI
FE EI
FE
=
−
−( )−( ) +
* 1
1 *WW
EI EISG
TBEIEI
T−
+ −
(36)
Cancelling the first and last terms and adding in the definition of the BEI from Equation
34 above yields:
AETR TT FE DC SG
EIT FE
EITCT
TRT
FE WFE= −
−( ) + −
−( )δδ
(*1
11
TEI
* −−
−( ) + −
T
T FE DC SGEI
FE W
)*1
(37)
Simplifying, and noting that T FE T FE DC SGFE FE W* = + −( )χ , yields Equation 35 above,
demonstrating the result.
A.3 Public costs and benefits and the relationship to the tax system: deriving the ARCR and MRCR
The discussion so far has considered the costs and benefits, and the effect of the tax
system on them, from the perspective of the worker or individual. Throughout, the other
party to the educational investment has been the government.8 The second key set of
indicators in this study examines the costs and benefits of skills investments from the
perspective of the government. It is important to note that unlike in the individual case, no
optimisation is assumed; there is no breakeven action on the part of the government. This
section describes a ‘Tobin’s q’ for the investment in human capital from the perspective of
the government; a ratio of the NPV of the earnings streams from education to the NPV of the
costs of education. Two of these indicators are presented. The first is for a pre-specified level
of student earnings after-education. This is the ARCR for the government. The second RCR
assumes that the earnings stream for the individual worker is such that the individual just
breaks even. This indicator calculates the RCR for the government for this marginal student;
this is the MRCR. These two indicators are analogous to the AETR and METR developed
previously.
The key insight from these RCR indicators, as discussed in the main text, is that the
tax system helps to divide the costs and benefits of the educational investment between
the government and the individual worker. On the cost side, it does so partially; the tax
rate on foregone earnings and the tax breaks given for scholarship income and direct costs
perform this function. However, the ratio of individual direct spending to government direct
spending matters too. On the benefits side, however, the tax system performs the entirety
of the division of benefits between the government and the individual worker. This insight
has been discussed in the main text, and will be outlined mathematically below.
ANNEX A
152 TAXATION AND SkIllS © OECD 2016
The approach is as follows: first the overall costs of upskilling are modelled: lost
earnings, direct spending by students, direct spending by the government. The benefits of
the educational investment are then examined. The model then discusses how these benefits
are apportioned, and calculates the costs and benefits for the government. Having done this,
the model calculates the ARCR and the MRCR. The difference between these two indicators is
simply that the ARCR calculates the government’s RCR for the average individual making an
educational investment; the average student is assumed to receive a more-than-breakeven
return to the investment. The MRCR calculates the RCR for the marginal individual, who just
breaks even on the investment. In other words, the MRCR is simply the ARCR where the
EI = BEI. Throughout this section, the assumption that Tc = 0 is maintained for simplicity.
The total cost of upskilling
The total cost of upskilling is defined as follows:
TC I E DC DCb d W G= − + + (38)
Where Ib, Ed, and DCW are as before, and DCG is the direct costs of education borne by
the government. Note that an assumption of this approach is that all scholarship and grant
income is supplied by the government; this scholarship income is not a “cost” of education
per se, but rather a transfer from the government to the individual worker; this means that
it nets out of Equation 38.
The fraction of TC borne by the government ( TCG ) is TC TCW− , where TCW are the costs
borne by the worker. Substituting the expression of TCW from Equation 4, yields:
TC T I T E DC SG DCG Ib b Ed d W G= − + + −( ) +θ ϕ1 (39)
This can be divided into several parts:
●● The lost tax revenue from the worker’s reduced earnings, T I T EIb b Ed d− ,
●● The revenue losses result from the tax treatment of direct costs θDCW ,
●● The lost scholarship income SG (offset by any tax received on this scholarship income)ϕSG .
●● Plus the direct government spending on education, DCG.
Similarly, the total per period returns to upskilling are simply characterised by the
earnings increment:
TR EI I Ia b= = − (40)
as defined in Equation 3. Recall that the fraction of TR borne by the government, TRG is TR TRW− , where TRW are the part of the return received by the worker. Substituting the
expression for TRW from Equation 2 yields TR T EIG EI= . Here, TT I T I
I IEIa a b b
a b
=−−
as before.
This means that the tax system apportions the returns between the student and the
government; more progressive taxes will mean a higher TEI, which will mean a higher share
of returns from upskilling for the government.
The average returns to costs ratio of government spending
A Tobin’s q – a returns to costs ratio for a government investment in skills – can be
defined. This is the ratio of the present value of the returns to the skills investment to the
replacement cost of the skills investment. As with the second term in Equation 8, the NPV
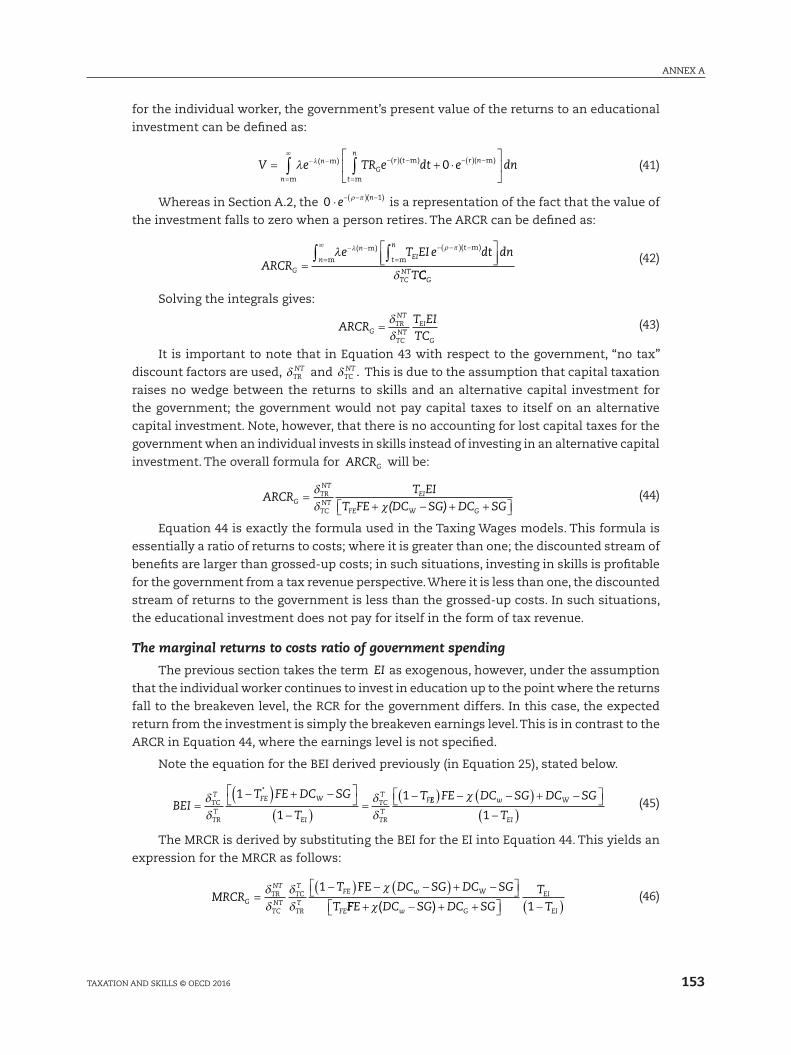
153
ANNEX A
TAXATION AND SkIllS © OECD 2016
for the individual worker, the government’s present value of the returns to an educational
investment can be defined as:
V e TR e dt e dnn
n
t
n
Gr t r n= + ⋅
=
− −
=
−( ) − −( ) −∫ ∫m
m
m
m m∞
λλ ( ) ( ) ( )0 (41)
Whereas in Section A.2, the 0 1⋅ − −( ) −e nρ π ( ) is a representation of the fact that the value of
the investment falls to zero when a person retires. The ARCR can be defined as:
ARCR
e T EI e dt dn
TG
n
n
t
n
EIt
TCNT=
=
− −
=
− −( ) −∫ ∫m
m
m
m∞ λ ρ πλ
δ
( ) ( )
CCG
(42)
Solving the integrals gives:
ARCRT EITCG
TRNT
TCNT
EI
G
=δδ
� (43)
It is important to note that in Equation 43 with respect to the government, “no tax”
discount factors are used, δTRNT and δTC
NT . This is due to the assumption that capital taxation
raises no wedge between the returns to skills and an alternative capital investment for
the government; the government would not pay capital taxes to itself on an alternative
capital investment. Note, however, that there is no accounting for lost capital taxes for the
government when an individual invests in skills instead of investing in an alternative capital
investment. The overall formula for ARCRG will be:
ARCRT EI
T FE (DC SG) DC SGGTRNT
TCNT
EI
FE W G
=+ + +
δδ χ −
(44)
Equation 44 is exactly the formula used in the Taxing Wages models. This formula is
essentially a ratio of returns to costs; where it is greater than one; the discounted stream of
benefits are larger than grossed-up costs; in such situations, investing in skills is profitable
for the government from a tax revenue perspective. Where it is less than one, the discounted
stream of returns to the government is less than the grossed-up costs. In such situations,
the educational investment does not pay for itself in the form of tax revenue.
The marginal returns to costs ratio of government spending
The previous section takes the term EI as exogenous, however, under the assumption
that the individual worker continues to invest in education up to the point where the returns
fall to the breakeven level, the RCR for the government differs. In this case, the expected
return from the investment is simply the breakeven earnings level. This is in contrast to the
ARCR in Equation 44, where the earnings level is not specified.
Note the equation for the BEI derived previously (in Equation 25), stated below.
*
BEIT FE DC SG
T
TTCT
TRT
FE W
EI
TCT
TRT
F=−( ) + −
−( )=
−δδ
δδ
� 1
1
1 EE w W
EI
FE DC SG DC SG
T
( ) − −( ) + − −( )
χ
1 (45)
The MRCR is derived by substituting the BEI for the EI into Equation 44. This yields an
expression for the MRCR as follows:
MRCRT DC SG DC SG
TGTRNT
TCNT
TCT
TRT
FE w W
FE
=−( ) − −( ) + − δ
δδδ
χ� 1 FE
FFE DC SG DC SGT
Tw G
EI
EI+ − + + −( )( )χ 1 (46)
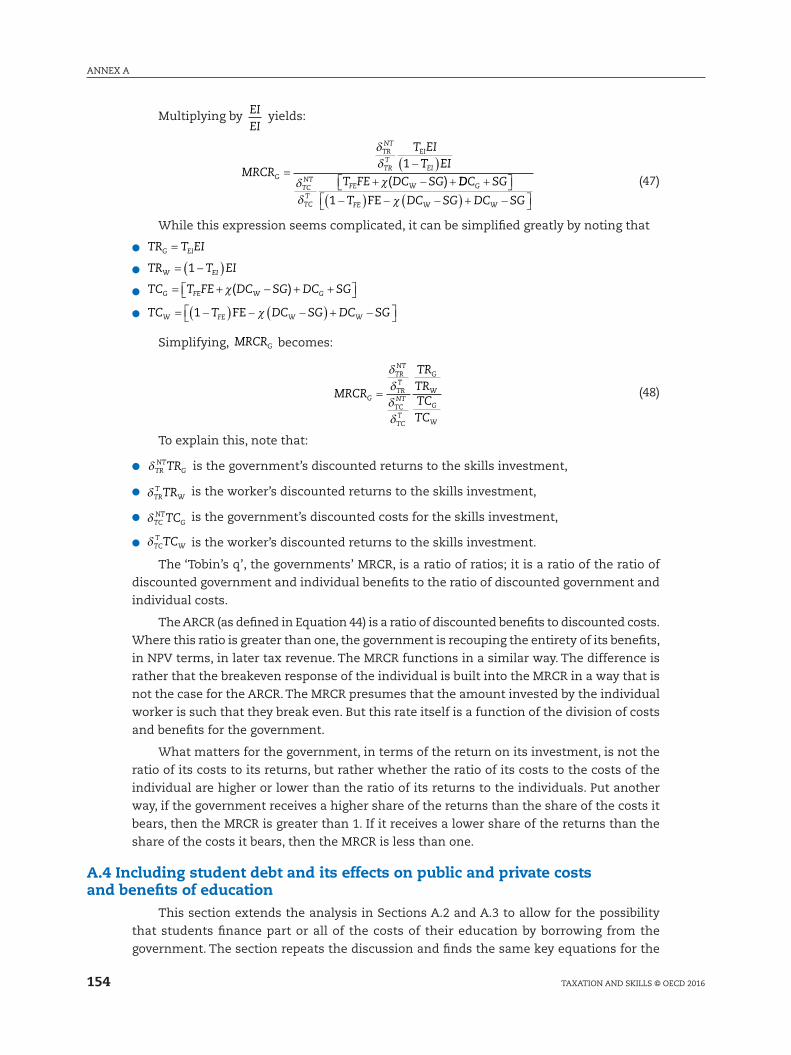
ANNEX A
154 TAXATION AND SkIllS © OECD 2016
Multiplying by EIEI
yields:
MRCR
T EIT EI
T FE DC SGG
TRNT
TRT
EI
EI
TCNT
TCT
FE W
=−( )
+ − +
δδ
δδ
χ( )1
DDC SG
T DC SG DC SGG
FE W W
+ −( ) − −( ) + − 1 FE χ
(47)
While this expression seems complicated, it can be simplified greatly by noting that
●● TR T EIG EI=
●● TR T EIW EI= −( )1
●● TC T FE DC SG DC SGG FE W G= + − + + ( )χ
●● TC T DC SG DC SGW FE W W= −( ) − −( ) + − 1 FE χ
Simplifying, MRCRG becomes:
MRCR
TRTRTCTC
G
TRNT
TRT
TCNT
TCT
G
W
G
W
=
δδδδ
(48)
To explain this, note that:
●● δTRNT
GTR is the government’s discounted returns to the skills investment,
●● δTRT
WTR is the worker’s discounted returns to the skills investment,
●● δTCNT
GTC is the government’s discounted costs for the skills investment,
●● δTCT
WTC is the worker’s discounted returns to the skills investment.
The ‘Tobin’s q’, the governments’ MRCR, is a ratio of ratios; it is a ratio of the ratio of
discounted government and individual benefits to the ratio of discounted government and
individual costs.
The ARCR (as defined in Equation 44) is a ratio of discounted benefits to discounted costs.
Where this ratio is greater than one, the government is recouping the entirety of its benefits,
in NPV terms, in later tax revenue. The MRCR functions in a similar way. The difference is
rather that the breakeven response of the individual is built into the MRCR in a way that is
not the case for the ARCR. The MRCR presumes that the amount invested by the individual
worker is such that they break even. But this rate itself is a function of the division of costs
and benefits for the government.
What matters for the government, in terms of the return on its investment, is not the
ratio of its costs to its returns, but rather whether the ratio of its costs to the costs of the
individual are higher or lower than the ratio of its returns to the individuals. Put another
way, if the government receives a higher share of the returns than the share of the costs it
bears, then the MRCR is greater than 1. If it receives a lower share of the returns than the
share of the costs it bears, then the MRCR is less than one.
A.4 Including student debt and its effects on public and private costs and benefits of education
This section extends the analysis in Sections A.2 and A.3 to allow for the possibility
that students finance part or all of the costs of their education by borrowing from the
government. The section repeats the discussion and finds the same key equations for the
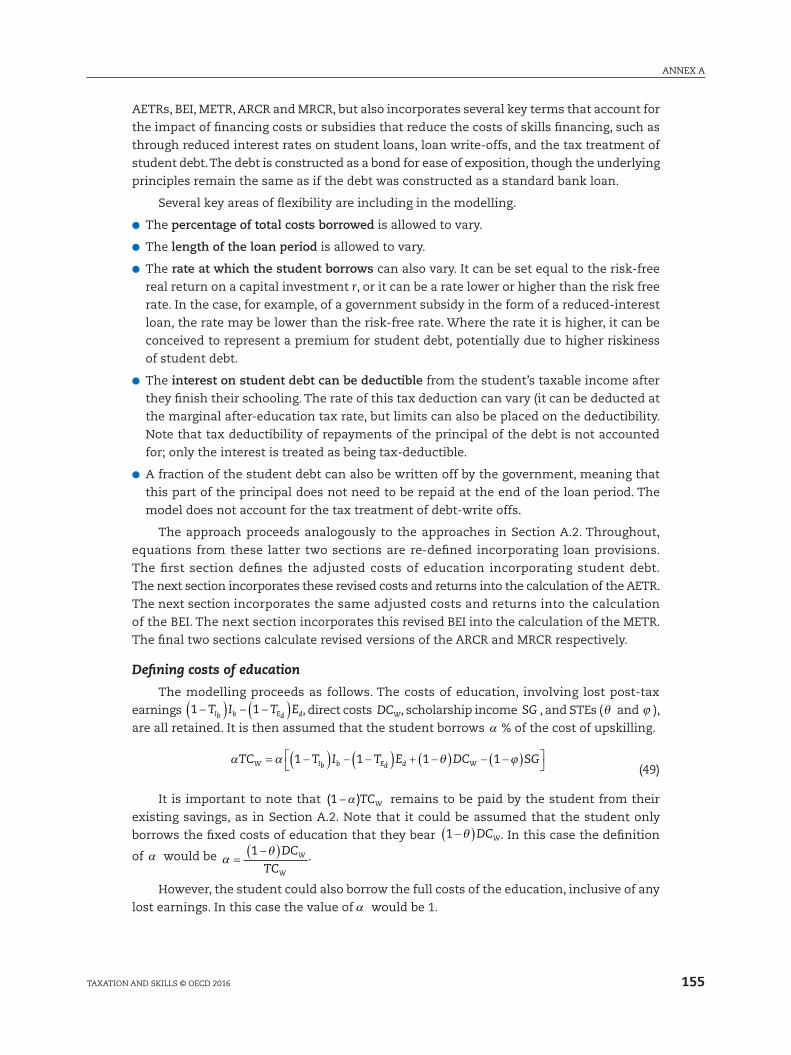
155
ANNEX A
TAXATION AND SkIllS © OECD 2016
AETRs, BEI, METR, ARCR and MRCR, but also incorporates several key terms that account for
the impact of financing costs or subsidies that reduce the costs of skills financing, such as
through reduced interest rates on student loans, loan write-offs, and the tax treatment of
student debt. The debt is constructed as a bond for ease of exposition, though the underlying
principles remain the same as if the debt was constructed as a standard bank loan.
Several key areas of flexibility are including in the modelling.
●● The percentage of total costs borrowed is allowed to vary.
●● The length of the loan period is allowed to vary.
●● The rate at which the student borrows can also vary. It can be set equal to the risk-free
real return on a capital investment r, or it can be a rate lower or higher than the risk free
rate. In the case, for example, of a government subsidy in the form of a reduced-interest
loan, the rate may be lower than the risk-free rate. Where the rate it is higher, it can be
conceived to represent a premium for student debt, potentially due to higher riskiness
of student debt.
●● The interest on student debt can be deductible from the student’s taxable income after
they finish their schooling. The rate of this tax deduction can vary (it can be deducted at
the marginal after-education tax rate, but limits can also be placed on the deductibility.
Note that tax deductibility of repayments of the principal of the debt is not accounted
for; only the interest is treated as being tax-deductible.
●● A fraction of the student debt can also be written off by the government, meaning that
this part of the principal does not need to be repaid at the end of the loan period. The
model does not account for the tax treatment of debt-write offs.
The approach proceeds analogously to the approaches in Section A.2. Throughout,
equations from these latter two sections are re-defined incorporating loan provisions.
The first section defines the adjusted costs of education incorporating student debt.
The next section incorporates these revised costs and returns into the calculation of the AETR.
The next section incorporates the same adjusted costs and returns into the calculation
of the BEI. The next section incorporates this revised BEI into the calculation of the METR.
The final two sections calculate revised versions of the ARCR and MRCR respectively.
Defining costs of education
The modelling proceeds as follows. The costs of education, involving lost post-tax
earnings 1 1−( ) − −( )T I T EIb b Ed d, direct costs DCW, scholarship income SG , and STEs (θ and ϕ ),
are all retained. It is then assumed that the student borrows α % of the cost of upskilling.
α α θ ϕTC T I T E DC SGW Ib b Ed d W= −( ) − −( ) + −( ) − −( )
1 1 1 1
(49)
It is important to note that ( )1 −α TCW remains to be paid by the student from their
existing savings, as in Section A.2. Note that it could be assumed that the student only
borrows the fixed costs of education that they bear 1 −( )θ DCW. In this case the definition
of α would be αθ
=−( )1 DC
TCW
W
.
However, the student could also borrow the full costs of the education, inclusive of any
lost earnings. In this case the value of α would be 1.
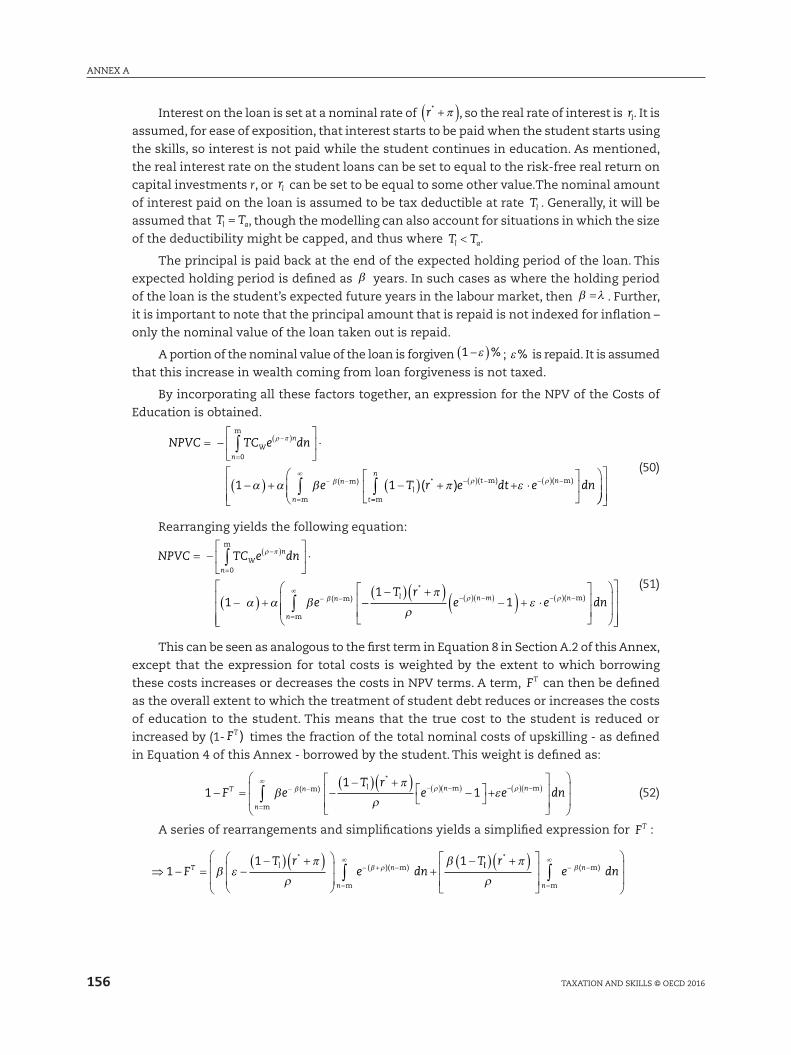
ANNEX A
156 TAXATION AND SkIllS © OECD 2016
Interest on the loan is set at a nominal rate of r* +( )π , so the real rate of interest is rl. It is
assumed, for ease of exposition, that interest starts to be paid when the student starts using
the skills, so interest is not paid while the student continues in education. As mentioned,
the real interest rate on the student loans can be set to equal to the risk-free real return on
capital investments r, or rl can be set to be equal to some other value.The nominal amount
of interest paid on the loan is assumed to be tax deductible at rate Tl . Generally, it will be
assumed that T Tl a= , though the modelling can also account for situations in which the size
of the deductibility might be capped, and thus where T Tl a< .
The principal is paid back at the end of the expected holding period of the loan. This
expected holding period is defined as β years. In such cases as where the holding period
of the loan is the student’s expected future years in the labour market, then β λ= . Further,
it is important to note that the principal amount that is repaid is not indexed for inflation –
only the nominal value of the loan taken out is repaid.
A portion of the nominal value of the loan is forgiven %1 −( )ε ; ε % is repaid. It is assumed
that this increase in wealth coming from loan forgiveness is not taxed.
By incorporating all these factors together, an expression for the NPV of the Costs of
Education is obtained.
NPVC TC e dn
e
nW
n
n
n
t
= −
⋅
−( ) +
=
−( )
=
− −
∫
∫
m
m
m
0
1
ρ π
∞βα α β ( )
==
−( ) − −( ) −∫ −( ) + + ⋅
m
m mn
lt nT r e dt e dn1 ( )* ( ) ( )π ερ ρ
(50)
Rearranging yields the following equation:
NPVC TC e dn
e
nW
n
n
n
= −
⋅
−( ) +
=
−( )
=
− −
∫
∫
m
m
m
0
1
ρ π
∞βα α β ( ) −−
−( ) +( )−( ) + ⋅
−( ) −( ) −( ) −*
( )1
1T r
e e dnl n m n
π
ρερ ρ m
(51)
This can be seen as analogous to the first term in Equation 8 in Section A.2 of this Annex,
except that the expression for total costs is weighted by the extent to which borrowing
these costs increases or decreases the costs in NPV terms. A term, FT can then be defined
as the overall extent to which the treatment of student debt reduces or increases the costs
of education to the student. This means that the true cost to the student is reduced or
increased by (1- FT ) times the fraction of the total nominal costs of upskilling - as defined
in Equation 4 of this Annex - borrowed by the student. This weight is defined as:
11
1− = −−( ) +( )
−
+
=
− − −( ) −( )∫F eT r
e eT
n
n l n
m
m m∞
β ρβπ
ρε( )
*−−( ) −( )
ρ n dnm (52)
A series of rearrangements and simplifications yields a simplified expression for FT :
⇒ 11 1
− = −−( ) +( )
+−
=
− + −∫FT r
e dnT
T l
n
nβ επ
ρ
β∞β ρ
*
( )( )
m
m ll
n
nr
e dn( ) +( )
=
− −∫*
( )π
ρ
∞β
m
m
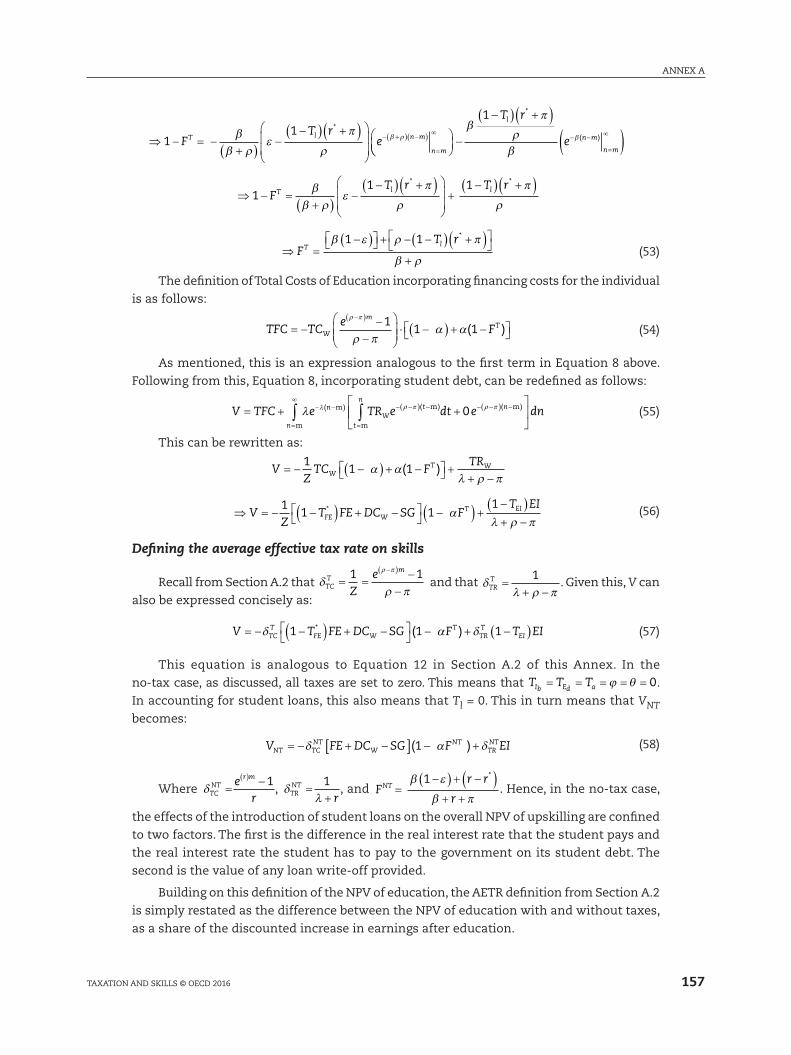
157
ANNEX A
TAXATION AND SkIllS © OECD 2016
⇒ 11
− = −+( )
−−( ) +( )
− +( ) −( )
=
∞F
T reT l n m
n m
*β
β ρε
π
ρβ ρ
−
−( ) +( )( )− −
=
∞β
π
ρβ
β
*
( )
1 T r
e
l
n m
n m
⇒ 11 1
− =+( )
−−( ) +( )
+
−( ) +( )F
T r T rT l l
* *β
β ρε
π
ρ
π
ρ
⇒ FT r
T l=
−( ) + − −( ) +( )
+
*β ε ρ π
β ρ
1 1 (53)
The definition of Total Costs of Education incorporating financing costs for the individual
is as follows:
TFC TCe
FW
mT= −
−−
⋅ −( ) + −
−( )ρ π
ρ πα α
11 1( ) (54)
As mentioned, this is an expression analogous to the first term in Equation 8 above.
Following from this, Equation 8, incorporating student debt, can be redefined as follows:
V TFC e TR e dt en
n
t
n
Wt n= + +
=
− −
=
− −( ) − − −( ) −∫ ∫m
m
m
m m∞
λ ρ π ρ πλ ( ) ( ) ( )0
dn (55)
This can be rewritten as:
V
ZTC F
TRW
T W= − −( ) + − + + −( )
11 1α α
λ ρ π
⇒ VZ
T FE DC SG FT EI
FE WT EI= − −( ) + −
−( ) + −( )
+ −*1
1 11
αλ ρ π
(56)
Defining the average effective tax rate on skills
Recall from Section A.2 that δρ π
ρ π
TCT
m
Ze
= =−
−
−( )1 1 and that δ
λ ρ πTRT =
+ −1
. Given this, V can
also be expressed concisely as:
V T FE DC SG F T EITCT
FE WT
TRT
EI= − −( ) + −
− + −( )( )*δ α δ1 1 1 (57)
This equation is analogous to Equation 12 in Section A.2 of this Annex. In the
no- tax case, as discussed, all taxes are set to zero. This means that T T TIb Ed a= = = = =ϕ θ 0.
In accounting for student loans, this also means that Tl = 0. This in turn means that VNT
becomes:
V FE DC SG F EINT TCNT
WNT
TRNT= − + −[ ] − +( )δ α δ1 (58)
Where δTCNT
r mer
=−( ) 1
, δλTR
NT
r=
+1
, and Fr r
rNT
*
=−( ) + −( )+ +
β ε
β π
1. Hence, in the no-tax case,
the effects of the introduction of student loans on the overall NPV of upskilling are confined
to two factors. The first is the difference in the real interest rate that the student pays and
the real interest rate the student has to pay to the government on its student debt. The
second is the value of any loan write-off provided.
Building on this definition of the NPV of education, the AETR definition from Section A.2
is simply restated as the difference between the NPV of education with and without taxes,
as a share of the discounted increase in earnings after education.
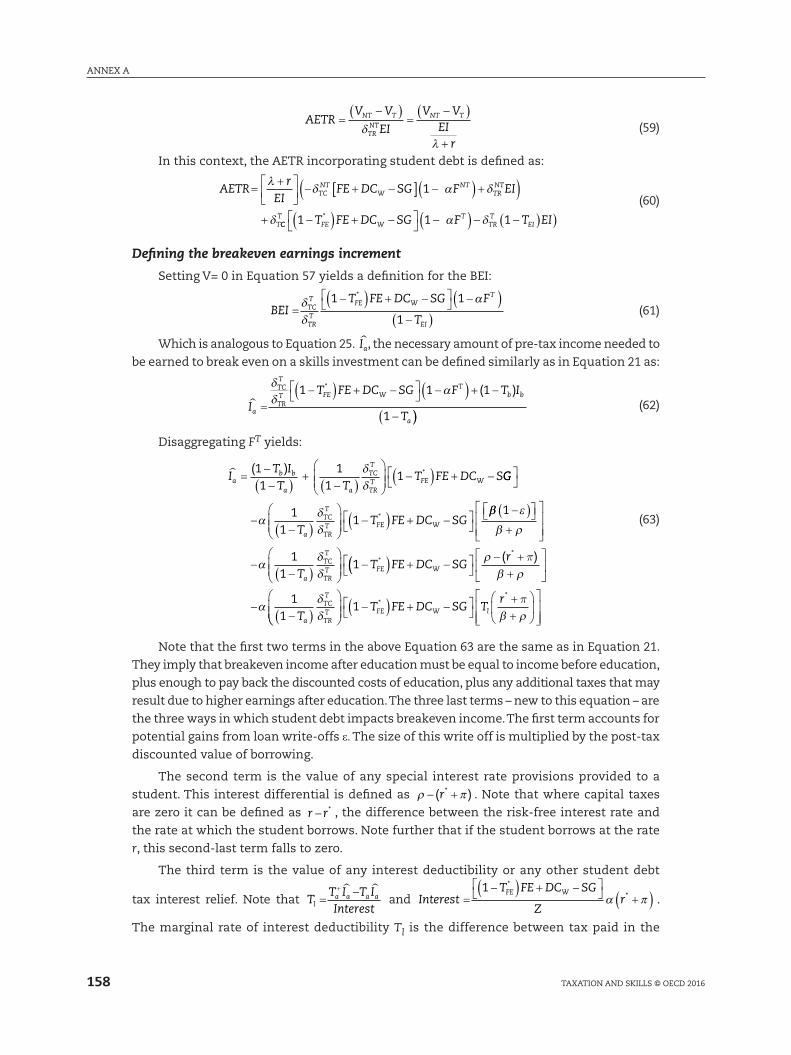
ANNEX A
158 TAXATION AND SkIllS © OECD 2016
AETR
V V
EI
V VEI
r
NT T
TRNT
NT T=−( )
=−( )
+δ
λ (59)
In this context, the AETR incorporating student debt is defined as:
AETR
rEI
FE DC SG F EITCNT
WNT
TRNT
T
=+
− + −[ ] −( ) +( )
+
λδ α δ
δ
1
CCT
FE WT
TRT
EIT FE DC SG F T EI1 1 1−( ) + −
−( ) − −( ) )* α δ
(60)
Defining the breakeven earnings increment
Setting V= 0 in Equation 57 yields a definition for the BEI:
BEIT FE DC SG F
TTCT
TRT
FE WT
EI
=−( ) + −
−( )
−( )
*δδ
α1 1
1 (61)
Which is analogous to Equation 25. Ia, the necessary amount of pre-tax income needed to
be earned to break even on a skills investment can be defined similarly as in Equation 21 as:
IT FE DC SG F T I
Ta
TCT
TRT FE W
Tb b
a
=−( ) + −
−( ) + −
−(
( )*δδ
α1 1 1
1 )) (62)
Disaggregating FT yields:
IT IT T
T FE DC Sab b
a a
TCT
TRT FE W
=−−( )
+−( )
−( ) + −
( ) *11
11
1δδ
GG
TT FE DC SG
a
TCT
TRT FE W
−−( )
−( ) + −
*αδδ
11
1ββ ε
β ρ
αδδ
1
11
1
−( ) +
−−( )
− *
TT
a
TCT
TRT FE(( ) + −
− ++
−−( )
FE DC SGr
T
W
a
TCT
TRT
( )*ρβ ρ
αδδ
p
11
−( ) + −
++
1 T FE DC SG Tr
FE W l*
* pβ ρ
(63)
Note that the first two terms in the above Equation 63 are the same as in Equation 21.
They imply that breakeven income after education must be equal to income before education,
plus enough to pay back the discounted costs of education, plus any additional taxes that may
result due to higher earnings after education. The three last terms – new to this equation – are
the three ways in which student debt impacts breakeven income. The first term accounts for
potential gains from loan write-offs ε. The size of this write off is multiplied by the post-tax
discounted value of borrowing.
The second term is the value of any special interest rate provisions provided to a
student. This interest differential is defined as ρ π− +( )*r . Note that where capital taxes
are zero it can be defined as r r− * , the difference between the risk-free interest rate and
the rate at which the student borrows. Note further that if the student borrows at the rate
r, this second-last term falls to zero.
The third term is the value of any interest deductibility or any other student debt
tax interest relief. Note that TT I T IInterestla a a a=
−+
and InterestT FE DC SG
Zr
FE W=
−( ) + −
+( )
*
*1
α π .
The marginal rate of interest deductibility Tl is the difference between tax paid in the
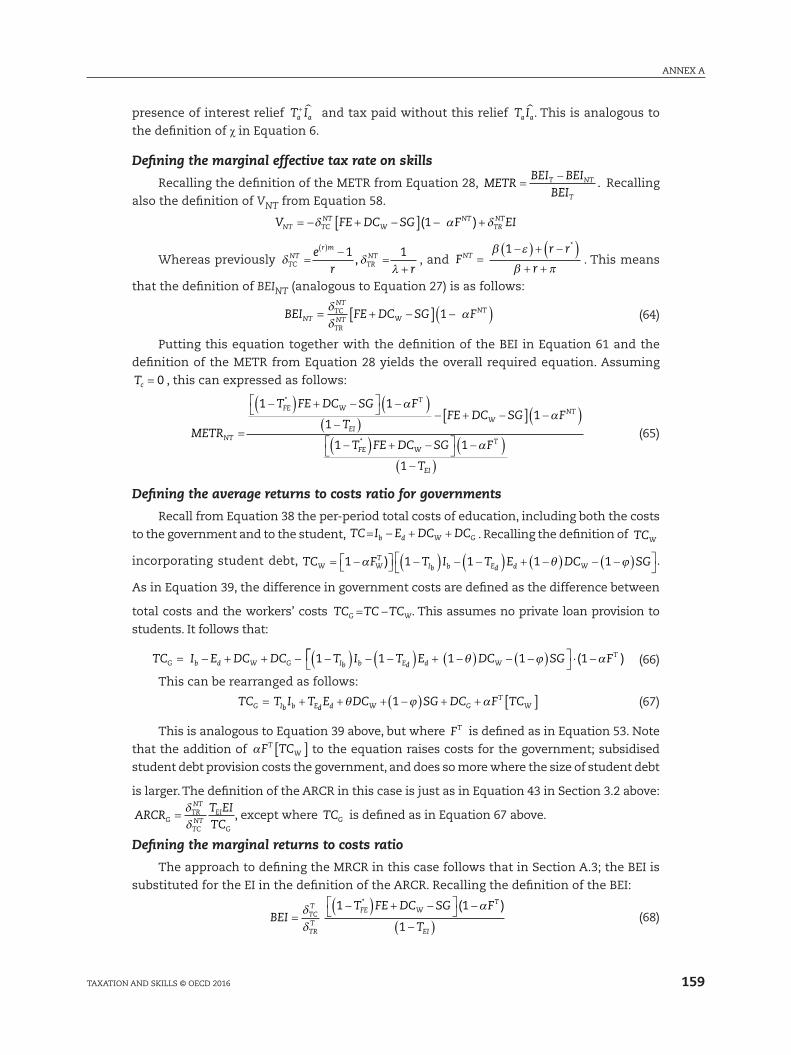
159
ANNEX A
TAXATION AND SkIllS © OECD 2016
presence of interest relief T Ia a+ and tax paid without this relief T Ia a
. This is analogous to
the definition of χ in Equation 6.
Defining the marginal effective tax rate on skills
Recalling the definition of the METR from Equation 28, METRBEI BEI
BEIT NT
T
=−
. Recalling
also the definition of VNT from Equation 58.
V FE DC SG F EINT TCNT
WNT
TRNT= − + −[ ] − +( )δ α δ1
Whereas previously δ δλTC
NTr m
TRNTe
r r=
−=
+
( ),
1 1, and F
r r
rNT =
−( ) + −( )+ +
*β ε
β π
1. This means
that the definition of BEINT (analogous to Equation 27) is as follows:
BEI FE DC SG FNTTCNT
TRNT W
NT= + −[ ] −( )δδ
α1 (64)
Putting this equation together with the definition of the BEI in Equation 61 and the
definition of the METR from Equation 28 yields the overall required equation. Assuming
Tc = 0 , this can expressed as follows:
METR
T FE DC SG F
TFE DC SG
NT
FE WT
EIW
=
−( ) + −
−( )
−( )− + −
*1 1
1
α[ ] −( )
−( ) + −
−( )
−( )
1
1 1
1
α
α
F
T FE DC SG F
T
NT
FE WT
EI
* (65)
Defining the average returns to costs ratio for governments
Recall from Equation 38 the per-period total costs of education, including both the costs
to the government and to the student, TC I E DC DCb d W G= − + + . Recalling the definition of TCW
incorporating student debt, TC F T I T E DC SGW WT
Ib b Ed d W= − −( ) − −( ) + −( ) − −( )
1 1 1 1 1α θ ϕ) .
As in Equation 39, the difference in government costs are defined as the difference between
total costs and the workers’ costs TC TC TCG W= − . This assumes no private loan provision to
students. It follows that:
TC I E DC DC T I T E DC SGG b d W G Ib b Ed d W= − + + − −( ) − −( ) + −( ) − −( )1 1 1 1θ ϕ
⋅ −( )1 αFT (66)
This can be rearranged as follows:
TC T I T E DC SG DC F TCG Ib b Ed d W GT
W= + + + −( ) + + [ ]θ ϕ α1 (67)
This is analogous to Equation 39 above, but where FT is defined as in Equation 53. Note
that the addition of αF TCTW[ ] to the equation raises costs for the government; subsidised
student debt provision costs the government, and does so more where the size of student debt
is larger. The definition of the ARCR in this case is just as in Equation 43 in Section 3.2 above:
ARCRT EITCG
TRNT
TCNT
EI
G
=δδ
�, except where TCG is defined as in Equation 67 above.
Defining the marginal returns to costs ratio
The approach to defining the MRCR in this case follows that in Section A.3; the BEI is
substituted for the EI in the definition of the ARCR. Recalling the definition of the BEI:
BEI
T FE DC SG F
TTCT
TRT
FE WT
EI
=−( ) + −
−
−( )δδ
α* ( )1 1
1
(68)
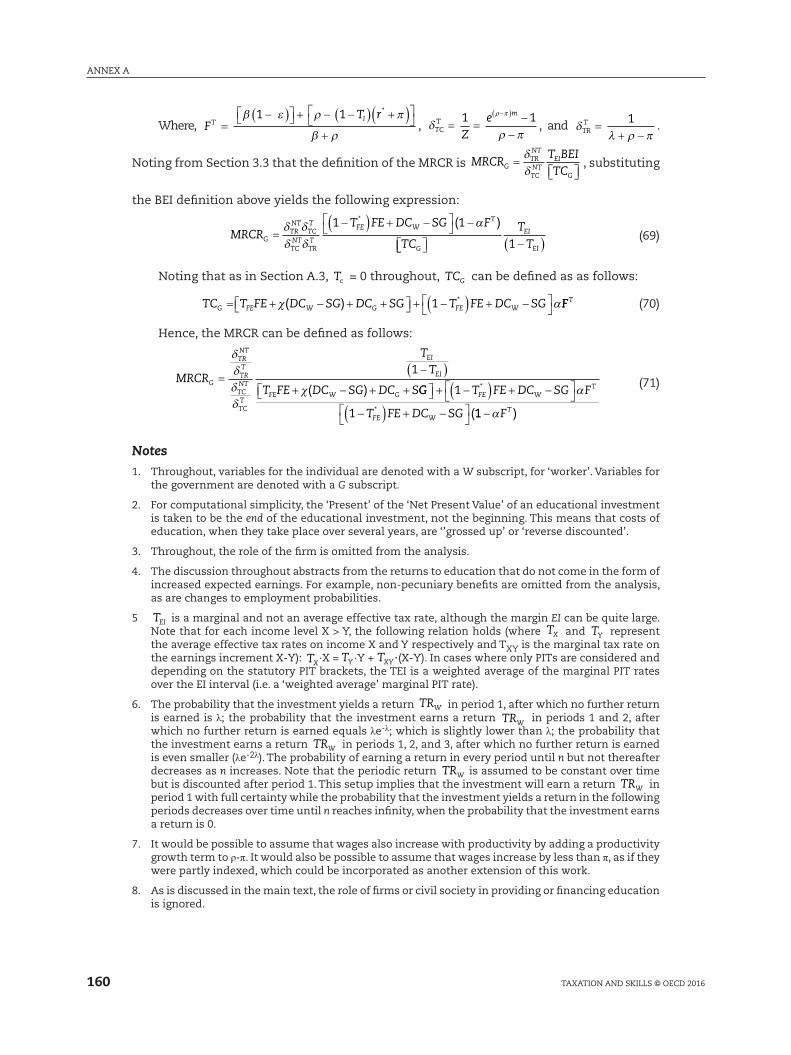
ANNEX A
160 TAXATION AND SkIllS © OECD 2016
Where, FT r
T l*
=−( ) + − −( ) +( )
+
β ε ρ π
β ρ
1 1, δ
ρ π
ρ π
TCT
m
Ze
= =−
−
−( )1 1, and δ
λ ρ πTRT =
+ −1 .
Noting from Section 3.3 that the definition of the MRCR is MRCRT BEITCG
TRNT
TCNT
EI
G
=
δδ
, substituting
the BEI definition above yields the following expression:
MRCRT FE DC SG F
TCGTRNT
TCT
TCNT
TRT
FE WT
G
=−( ) + −
−
δ δδ δ
α( )1 1*
−( )T
TEI
EI1 (69)
Noting that as in Section A.3, Tc = 0 throughout, TCG can be defined as as follows:
TC T FE DC SG DC SG T FE DC SGG FE W G FE W= + − + + + −( ) + −
( )χ α1 * FFT (70)
Hence, the MRCR can be defined as follows:
MRCR
TT
T FE DC SG DC SG
TRNT
TRT
TCNT
TCT
EI
EI
FE W G
=−( )
+ − + +( )
δδδδ
χ
1
GG T FE DC SG F
T FE DC SG
FE WT
FE W (
+ −( ) + −
−( ) + −
1
1
*
*
α
11 −αFT )
(71)
Notes1. Throughout, variables for the individual are denoted with a W subscript, for ‘worker’. Variables for
the government are denoted with a G subscript.
2. For computational simplicity, the ‘Present’ of the ‘Net Present Value’ of an educational investment is taken to be the end of the educational investment, not the beginning. This means that costs of education, when they take place over several years, are ‘’grossed up’ or ‘reverse discounted’.
3. Throughout, the role of the firm is omitted from the analysis.
4. The discussion throughout abstracts from the returns to education that do not come in the form of increased expected earnings. For example, non-pecuniary benefits are omitted from the analysis, as are changes to employment probabilities.
5 TEI is a marginal and not an average effective tax rate, although the margin EI can be quite large. Note that for each income level X > Y, the following relation holds (where TX and TY represent the average effective tax rates on income X and Y respectively and TXY is the marginal tax rate on the earnings increment X-Y): TX ·X = TY ·Y + TXY ·(X-Y). In cases where only PITs are considered and depending on the statutory PIT brackets, the TEI is a weighted average of the marginal PIT rates over the EI interval (i.e. a ‘weighted average’ marginal PIT rate).
6. The probability that the investment yields a return TRW in period 1, after which no further return is earned is λ; the probability that the investment earns a return TRW in periods 1 and 2, after which no further return is earned equals λe-λ; which is slightly lower than λ; the probability that the investment earns a return TRW in periods 1, 2, and 3, after which no further return is earned is even smaller (λe-2λ). The probability of earning a return in every period until n but not thereafter decreases as n increases. Note that the periodic return TRW is assumed to be constant over time but is discounted after period 1. This setup implies that the investment will earn a return TRW in period 1 with full certainty while the probability that the investment yields a return in the following periods decreases over time until n reaches infinity, when the probability that the investment earns a return is 0.
7. It would be possible to assume that wages also increase with productivity by adding a productivity growth term to ρ-π. It would also be possible to assume that wages increase by less than π, as if they were partly indexed, which could be incorporated as another extension of this work.
8. As is discussed in the main text, the role of firms or civil society in providing or financing education is ignored.
161
Taxation and Skills
© OECD 2016
ANNEX B
Comparative Tables
This annex provides the country details that lie behind the comparative analysis.
As outlined in the main text, the data provided are for 2011. The annex is structured in
three sections. Section 1 provides comparative tables for each of the five main indicators
presented in this Tax Policy Study. The indicators are the Breakeven Earnings Increment
(BEI), the Marginal Effective Tax Rate on Skills (METR), the Average Effective Tax Rate on
Skills (AETR), the Marginal Effective Tax Rate on Skills (METR), the Average Effective Tax
Rate on Skills (AETR), the Marginal Returns to Costs Ratio, and the Average Returns to Costs
Ratio. The calculations behind these variables are discussed in more detail in Chapter 3 and
in Annex A of this study.
The statistical data for Israel are supplied by and under the responsibility of the relevant Israeli authorities. The use of such data by the OECD is without prejudice to the status of the Golan Heights, East Jerusalem and Israeli settlements in the West Bank under the terms of international law.
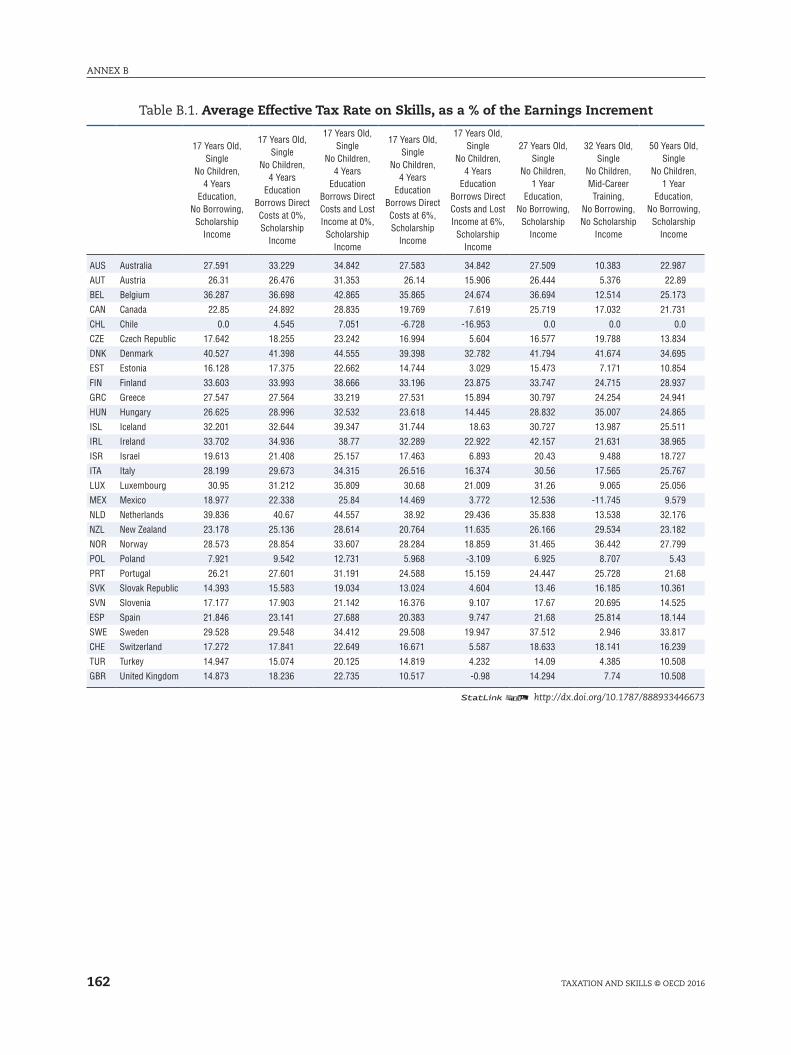
ANNEX B
162 TAXATION AND SkIllS © OECD 2016
Table B.1. Average Effective Tax Rate on Skills, as a % of the Earnings Increment
17 Years Old, Single
No Children, 4 Years
Education, No Borrowing,
Scholarship Income
17 Years Old, Single
No Children, 4 Years
Education Borrows Direct Costs at 0%, Scholarship
Income
17 Years Old, Single
No Children, 4 Years
Education Borrows Direct Costs and Lost Income at 0%,
Scholarship Income
17 Years Old, Single
No Children, 4 Years
Education Borrows Direct Costs at 6%, Scholarship
Income
17 Years Old, Single
No Children, 4 Years
Education Borrows Direct Costs and Lost Income at 6%,
Scholarship Income
27 Years Old, Single
No Children, 1 Year
Education, No Borrowing,
Scholarship Income
32 Years Old, Single
No Children, Mid-Career Training,
No Borrowing, No Scholarship
Income
50 Years Old, Single
No Children, 1 Year
Education, No Borrowing,
Scholarship Income
AUS Australia 27.591 33.229 34.842 27.583 34.842 27.509 10.383 22.987
AUT Austria 26.31 26.476 31.353 26.14 15.906 26.444 5.376 22.89
BEL Belgium 36.287 36.698 42.865 35.865 24.674 36.694 12.514 25.173
CAN Canada 22.85 24.892 28.835 19.769 7.619 25.719 17.032 21.731
CHL Chile 0.0 4.545 7.051 -6.728 -16.953 0.0 0.0 0.0
CZE Czech Republic 17.642 18.255 23.242 16.994 5.604 16.577 19.788 13.834
DNK Denmark 40.527 41.398 44.555 39.398 32.782 41.794 41.674 34.695
EST Estonia 16.128 17.375 22.662 14.744 3.029 15.473 7.171 10.854
FIN Finland 33.603 33.993 38.666 33.196 23.875 33.747 24.715 28.937
GRC Greece 27.547 27.564 33.219 27.531 15.894 30.797 24.254 24.941
HUN Hungary 26.625 28.996 32.532 23.618 14.445 28.832 35.007 24.865
ISL Iceland 32.201 32.644 39.347 31.744 18.63 30.727 13.987 25.511
IRL Ireland 33.702 34.936 38.77 32.289 22.922 42.157 21.631 38.965
ISR Israel 19.613 21.408 25.157 17.463 6.893 20.43 9.488 18.727
ITA Italy 28.199 29.673 34.315 26.516 16.374 30.56 17.565 25.767
LUX Luxembourg 30.95 31.212 35.809 30.68 21.009 31.26 9.065 25.056
MEX Mexico 18.977 22.338 25.84 14.469 3.772 12.536 -11.745 9.579
NLD Netherlands 39.836 40.67 44.557 38.92 29.436 35.838 13.538 32.176
NZL New Zealand 23.178 25.136 28.614 20.764 11.635 26.166 29.534 23.182
NOR Norway 28.573 28.854 33.607 28.284 18.859 31.465 36.442 27.799
POL Poland 7.921 9.542 12.731 5.968 -3.109 6.925 8.707 5.43
PRT Portugal 26.21 27.601 31.191 24.588 15.159 24.447 25.728 21.68
SVK Slovak Republic 14.393 15.583 19.034 13.024 4.604 13.46 16.185 10.361
SVN Slovenia 17.177 17.903 21.142 16.376 9.107 17.67 20.695 14.525
ESP Spain 21.846 23.141 27.688 20.383 9.747 21.68 25.814 18.144
SWE Sweden 29.528 29.548 34.412 29.508 19.947 37.512 2.946 33.817
CHE Switzerland 17.272 17.841 22.649 16.671 5.587 18.633 18.141 16.239
TUR Turkey 14.947 15.074 20.125 14.819 4.232 14.09 4.385 10.508
GBR United Kingdom 14.873 18.236 22.735 10.517 -0.98 14.294 7.74 10.508
12 http://dx.doi.org/10.1787/888933446673
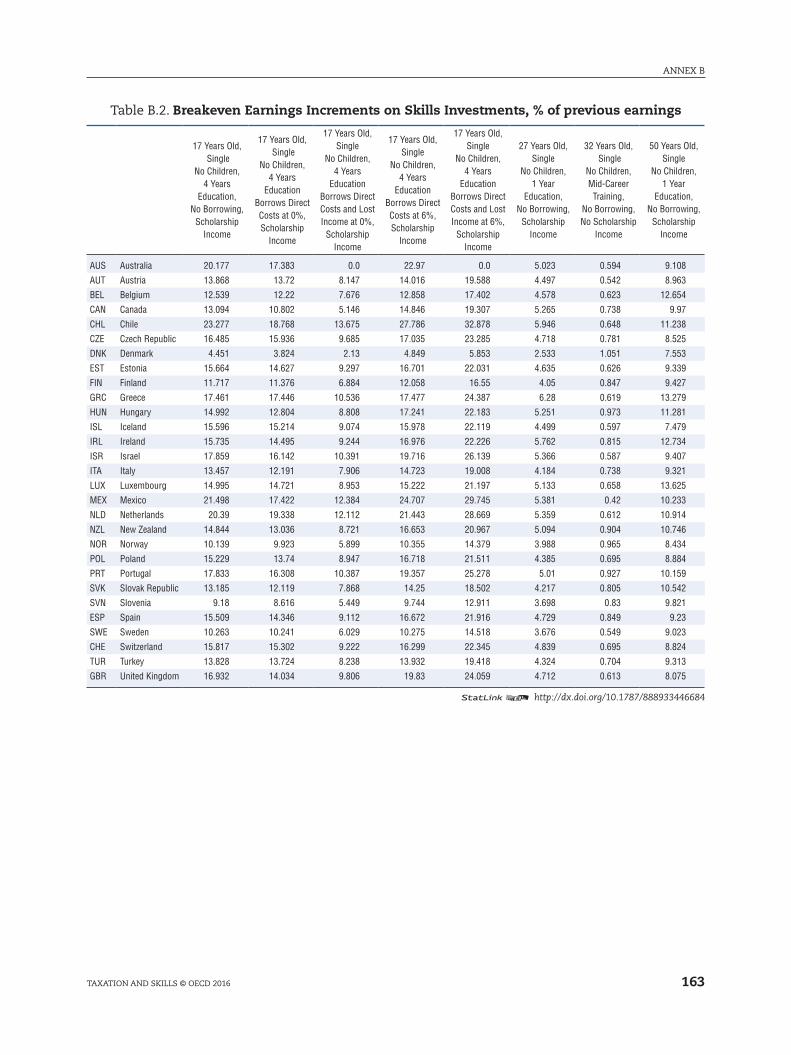
163
ANNEX B
TAXATION AND SkIllS © OECD 2016
Table B.2. Breakeven Earnings Increments on Skills Investments, % of previous earnings
17 Years Old, Single
No Children, 4 Years
Education, No Borrowing,
Scholarship Income
17 Years Old, Single
No Children, 4 Years
Education Borrows Direct Costs at 0%, Scholarship
Income
17 Years Old, Single
No Children, 4 Years
Education Borrows Direct Costs and Lost Income at 0%,
Scholarship Income
17 Years Old, Single
No Children, 4 Years
Education Borrows Direct Costs at 6%, Scholarship
Income
17 Years Old, Single
No Children, 4 Years
Education Borrows Direct Costs and Lost Income at 6%,
Scholarship Income
27 Years Old, Single
No Children, 1 Year
Education, No Borrowing,
Scholarship Income
32 Years Old, Single
No Children, Mid-Career Training,
No Borrowing, No Scholarship
Income
50 Years Old, Single
No Children, 1 Year
Education, No Borrowing,
Scholarship Income
AUS Australia 20.177 17.383 0.0 22.97 0.0 5.023 0.594 9.108
AUT Austria 13.868 13.72 8.147 14.016 19.588 4.497 0.542 8.963
BEL Belgium 12.539 12.22 7.676 12.858 17.402 4.578 0.623 12.654
CAN Canada 13.094 10.802 5.146 14.846 19.307 5.265 0.738 9.97
CHL Chile 23.277 18.768 13.675 27.786 32.878 5.946 0.648 11.238
CZE Czech Republic 16.485 15.936 9.685 17.035 23.285 4.718 0.781 8.525
DNK Denmark 4.451 3.824 2.13 4.849 5.853 2.533 1.051 7.553
EST Estonia 15.664 14.627 9.297 16.701 22.031 4.635 0.626 9.339
FIN Finland 11.717 11.376 6.884 12.058 16.55 4.05 0.847 9.427
GRC Greece 17.461 17.446 10.536 17.477 24.387 6.28 0.619 13.279
HUN Hungary 14.992 12.804 8.808 17.241 22.183 5.251 0.973 11.281
ISL Iceland 15.596 15.214 9.074 15.978 22.119 4.499 0.597 7.479
IRL Ireland 15.735 14.495 9.244 16.976 22.226 5.762 0.815 12.734
ISR Israel 17.859 16.142 10.391 19.716 26.139 5.366 0.587 9.407
ITA Italy 13.457 12.191 7.906 14.723 19.008 4.184 0.738 9.321
LUX Luxembourg 14.995 14.721 8.953 15.222 21.197 5.133 0.658 13.625
MEX Mexico 21.498 17.422 12.384 24.707 29.745 5.381 0.42 10.233
NLD Netherlands 20.39 19.338 12.112 21.443 28.669 5.359 0.612 10.914
NZL New Zealand 14.844 13.036 8.721 16.653 20.967 5.094 0.904 10.746
NOR Norway 10.139 9.923 5.899 10.355 14.379 3.988 0.965 8.434
POL Poland 15.229 13.74 8.947 16.718 21.511 4.385 0.695 8.884
PRT Portugal 17.833 16.308 10.387 19.357 25.278 5.01 0.927 10.159
SVK Slovak Republic 13.185 12.119 7.868 14.25 18.502 4.217 0.805 10.542
SVN Slovenia 9.18 8.616 5.449 9.744 12.911 3.698 0.83 9.821
ESP Spain 15.509 14.346 9.112 16.672 21.916 4.729 0.849 9.23
SWE Sweden 10.263 10.241 6.029 10.275 14.518 3.676 0.549 9.023
CHE Switzerland 15.817 15.302 9.222 16.299 22.345 4.839 0.695 8.824
TUR Turkey 13.828 13.724 8.238 13.932 19.418 4.324 0.704 9.313
GBR United Kingdom 16.932 14.034 9.806 19.83 24.059 4.712 0.613 8.075
12 http://dx.doi.org/10.1787/888933446684
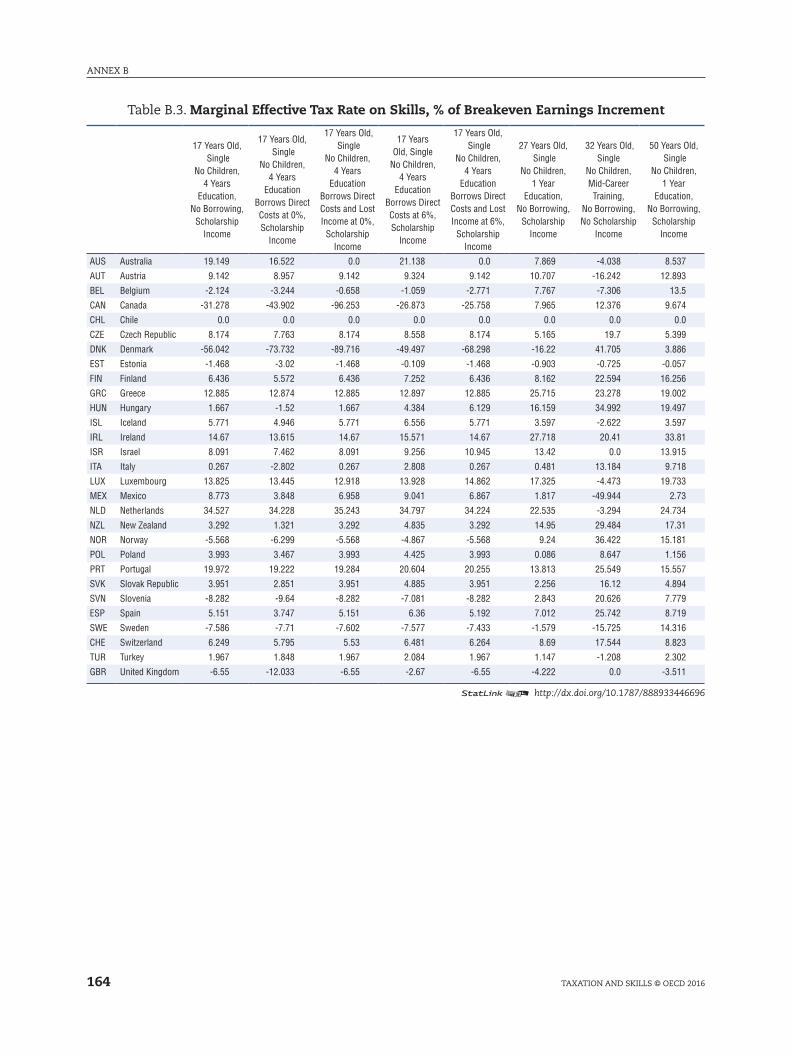
ANNEX B
164 TAXATION AND SkIllS © OECD 2016
Table B.3. Marginal Effective Tax Rate on Skills, % of Breakeven Earnings Increment
17 Years Old, Single
No Children, 4 Years
Education, No Borrowing,
Scholarship Income
17 Years Old, Single
No Children, 4 Years
Education Borrows Direct Costs at 0%, Scholarship
Income
17 Years Old, Single
No Children, 4 Years
Education Borrows Direct Costs and Lost Income at 0%,
Scholarship Income
17 Years Old, Single
No Children, 4 Years
Education Borrows Direct Costs at 6%, Scholarship
Income
17 Years Old, Single
No Children, 4 Years
Education Borrows Direct Costs and Lost Income at 6%,
Scholarship Income
27 Years Old, Single
No Children, 1 Year
Education, No Borrowing,
Scholarship Income
32 Years Old, Single
No Children, Mid-Career Training,
No Borrowing, No Scholarship
Income
50 Years Old, Single
No Children, 1 Year
Education, No Borrowing,
Scholarship Income
AUS Australia 19.149 16.522 0.0 21.138 0.0 7.869 -4.038 8.537
AUT Austria 9.142 8.957 9.142 9.324 9.142 10.707 -16.242 12.893
BEL Belgium -2.124 -3.244 -0.658 -1.059 -2.771 7.767 -7.306 13.5
CAN Canada -31.278 -43.902 -96.253 -26.873 -25.758 7.965 12.376 9.674
CHL Chile 0.0 0.0 0.0 0.0 0.0 0.0 0.0 0.0
CZE Czech Republic 8.174 7.763 8.174 8.558 8.174 5.165 19.7 5.399
DNK Denmark -56.042 -73.732 -89.716 -49.497 -68.298 -16.22 41.705 3.886
EST Estonia -1.468 -3.02 -1.468 -0.109 -1.468 -0.903 -0.725 -0.057
FIN Finland 6.436 5.572 6.436 7.252 6.436 8.162 22.594 16.256
GRC Greece 12.885 12.874 12.885 12.897 12.885 25.715 23.278 19.002
HUN Hungary 1.667 -1.52 1.667 4.384 6.129 16.159 34.992 19.497
ISL Iceland 5.771 4.946 5.771 6.556 5.771 3.597 -2.622 3.597
IRL Ireland 14.67 13.615 14.67 15.571 14.67 27.718 20.41 33.81
ISR Israel 8.091 7.462 8.091 9.256 10.945 13.42 0.0 13.915
ITA Italy 0.267 -2.802 0.267 2.808 0.267 0.481 13.184 9.718
LUX Luxembourg 13.825 13.445 12.918 13.928 14.862 17.325 -4.473 19.733
MEX Mexico 8.773 3.848 6.958 9.041 6.867 1.817 -49.944 2.73
NLD Netherlands 34.527 34.228 35.243 34.797 34.224 22.535 -3.294 24.734
NZL New Zealand 3.292 1.321 3.292 4.835 3.292 14.95 29.484 17.31
NOR Norway -5.568 -6.299 -5.568 -4.867 -5.568 9.24 36.422 15.181
POL Poland 3.993 3.467 3.993 4.425 3.993 0.086 8.647 1.156
PRT Portugal 19.972 19.222 19.284 20.604 20.255 13.813 25.549 15.557
SVK Slovak Republic 3.951 2.851 3.951 4.885 3.951 2.256 16.12 4.894
SVN Slovenia -8.282 -9.64 -8.282 -7.081 -8.282 2.843 20.626 7.779
ESP Spain 5.151 3.747 5.151 6.36 5.192 7.012 25.742 8.719
SWE Sweden -7.586 -7.71 -7.602 -7.577 -7.433 -1.579 -15.725 14.316
CHE Switzerland 6.249 5.795 5.53 6.481 6.264 8.69 17.544 8.823
TUR Turkey 1.967 1.848 1.967 2.084 1.967 1.147 -1.208 2.302
GBR United Kingdom -6.55 -12.033 -6.55 -2.67 -6.55 -4.222 0.0 -3.511
12 http://dx.doi.org/10.1787/888933446696
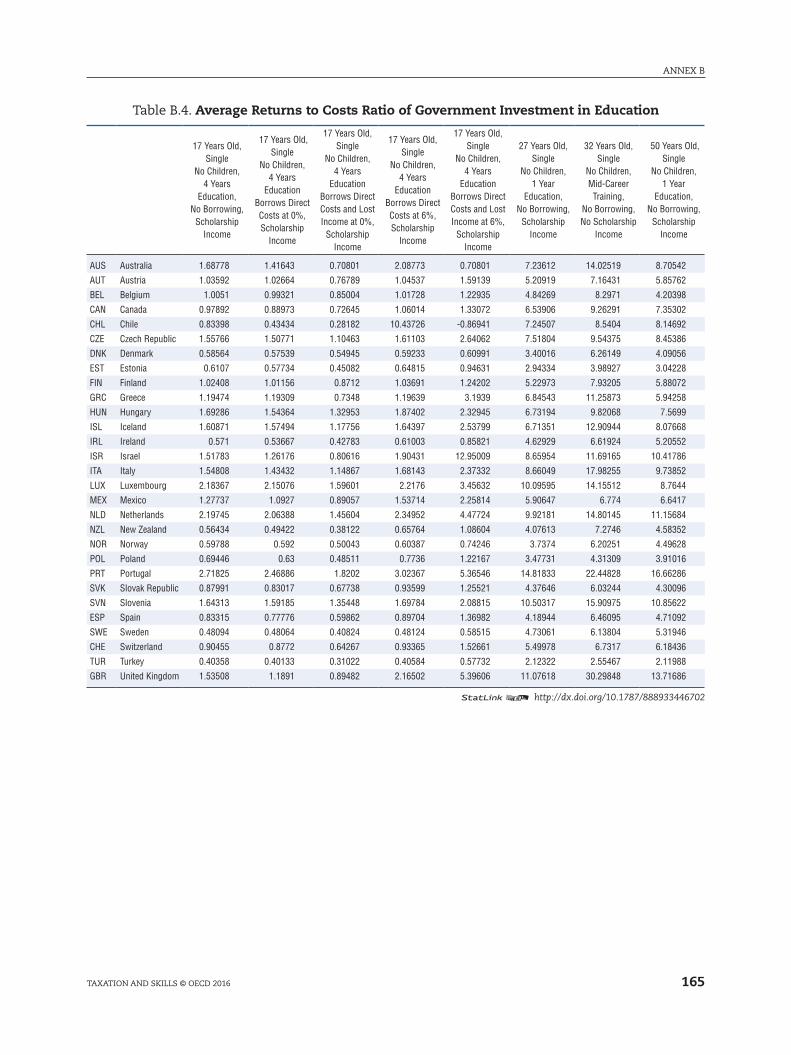
165
ANNEX B
TAXATION AND SkIllS © OECD 2016
Table B.4. Average Returns to Costs Ratio of Government Investment in Education
17 Years Old, Single
No Children, 4 Years
Education, No Borrowing,
Scholarship Income
17 Years Old, Single
No Children, 4 Years
Education Borrows Direct Costs at 0%, Scholarship
Income
17 Years Old, Single
No Children, 4 Years
Education Borrows Direct Costs and Lost Income at 0%,
Scholarship Income
17 Years Old, Single
No Children, 4 Years
Education Borrows Direct Costs at 6%, Scholarship
Income
17 Years Old, Single
No Children, 4 Years
Education Borrows Direct Costs and Lost Income at 6%,
Scholarship Income
27 Years Old, Single
No Children, 1 Year
Education, No Borrowing,
Scholarship Income
32 Years Old, Single
No Children, Mid-Career Training,
No Borrowing, No Scholarship
Income
50 Years Old, Single
No Children, 1 Year
Education, No Borrowing,
Scholarship Income
AUS Australia 1.68778 1.41643 0.70801 2.08773 0.70801 7.23612 14.02519 8.70542
AUT Austria 1.03592 1.02664 0.76789 1.04537 1.59139 5.20919 7.16431 5.85762
BEL Belgium 1.0051 0.99321 0.85004 1.01728 1.22935 4.84269 8.2971 4.20398
CAN Canada 0.97892 0.88973 0.72645 1.06014 1.33072 6.53906 9.26291 7.35302
CHL Chile 0.83398 0.43434 0.28182 10.43726 -0.86941 7.24507 8.5404 8.14692
CZE Czech Republic 1.55766 1.50771 1.10463 1.61103 2.64062 7.51804 9.54375 8.45386
DNK Denmark 0.58564 0.57539 0.54945 0.59233 0.60991 3.40016 6.26149 4.09056
EST Estonia 0.6107 0.57734 0.45082 0.64815 0.94631 2.94334 3.98927 3.04228
FIN Finland 1.02408 1.01156 0.8712 1.03691 1.24202 5.22973 7.93205 5.88072
GRC Greece 1.19474 1.19309 0.7348 1.19639 3.1939 6.84543 11.25873 5.94258
HUN Hungary 1.69286 1.54364 1.32953 1.87402 2.32945 6.73194 9.82068 7.5699
ISL Iceland 1.60871 1.57494 1.17756 1.64397 2.53799 6.71351 12.90944 8.07668
IRL Ireland 0.571 0.53667 0.42783 0.61003 0.85821 4.62929 6.61924 5.20552
ISR Israel 1.51783 1.26176 0.80616 1.90431 12.95009 8.65954 11.69165 10.41786
ITA Italy 1.54808 1.43432 1.14867 1.68143 2.37332 8.66049 17.98255 9.73852
LUX Luxembourg 2.18367 2.15076 1.59601 2.2176 3.45632 10.09595 14.15512 8.7644
MEX Mexico 1.27737 1.0927 0.89057 1.53714 2.25814 5.90647 6.774 6.6417
NLD Netherlands 2.19745 2.06388 1.45604 2.34952 4.47724 9.92181 14.80145 11.15684
NZL New Zealand 0.56434 0.49422 0.38122 0.65764 1.08604 4.07613 7.2746 4.58352
NOR Norway 0.59788 0.592 0.50043 0.60387 0.74246 3.7374 6.20251 4.49628
POL Poland 0.69446 0.63 0.48511 0.7736 1.22167 3.47731 4.31309 3.91016
PRT Portugal 2.71825 2.46886 1.8202 3.02367 5.36546 14.81833 22.44828 16.66286
SVK Slovak Republic 0.87991 0.83017 0.67738 0.93599 1.25521 4.37646 6.03244 4.30096
SVN Slovenia 1.64313 1.59185 1.35448 1.69784 2.08815 10.50317 15.90975 10.85622
ESP Spain 0.83315 0.77776 0.59862 0.89704 1.36982 4.18944 6.46095 4.71092
SWE Sweden 0.48094 0.48064 0.40824 0.48124 0.58515 4.73061 6.13804 5.31946
CHE Switzerland 0.90455 0.8772 0.64267 0.93365 1.52661 5.49978 6.7317 6.18436
TUR Turkey 0.40358 0.40133 0.31022 0.40584 0.57732 2.12322 2.55467 2.11988
GBR United Kingdom 1.53508 1.1891 0.89482 2.16502 5.39606 11.07618 30.29848 13.71686
12 http://dx.doi.org/10.1787/888933446702
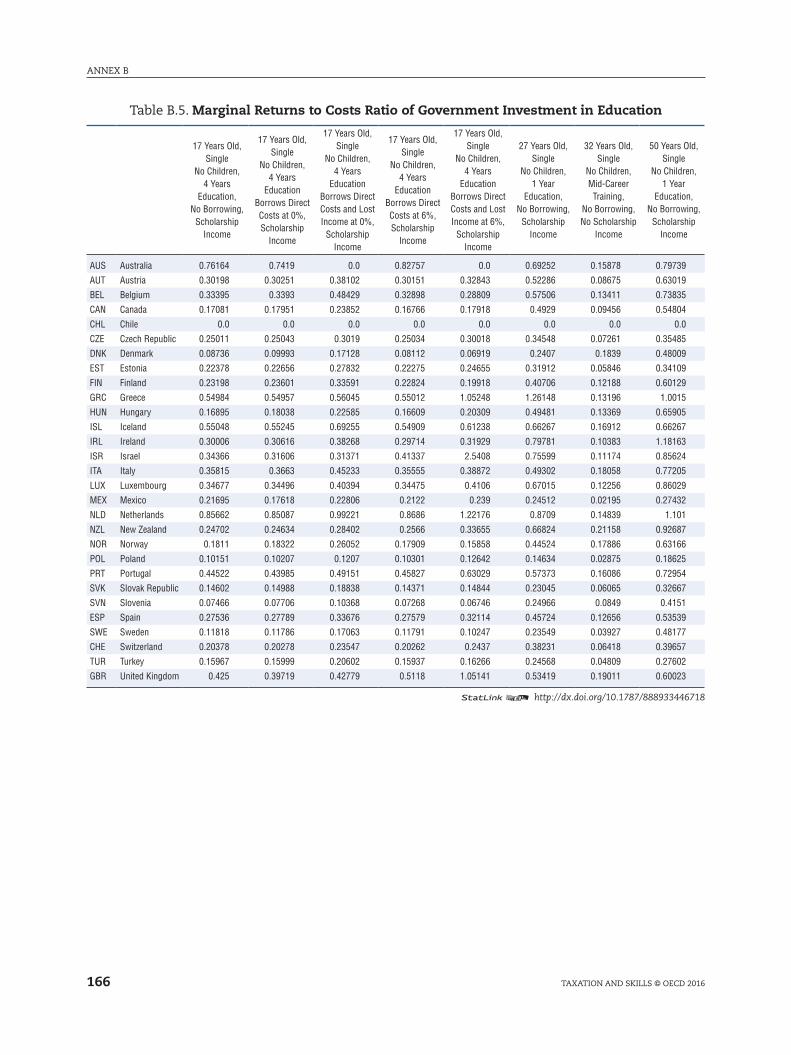
ANNEX B
166 TAXATION AND SkIllS © OECD 2016
Table B.5. Marginal Returns to Costs Ratio of Government Investment in Education
17 Years Old, Single
No Children, 4 Years
Education, No Borrowing,
Scholarship Income
17 Years Old, Single
No Children, 4 Years
Education Borrows Direct Costs at 0%, Scholarship
Income
17 Years Old, Single
No Children, 4 Years
Education Borrows Direct Costs and Lost Income at 0%,
Scholarship Income
17 Years Old, Single
No Children, 4 Years
Education Borrows Direct Costs at 6%, Scholarship
Income
17 Years Old, Single
No Children, 4 Years
Education Borrows Direct Costs and Lost Income at 6%,
Scholarship Income
27 Years Old, Single
No Children, 1 Year
Education, No Borrowing,
Scholarship Income
32 Years Old, Single
No Children, Mid-Career Training,
No Borrowing, No Scholarship
Income
50 Years Old, Single
No Children, 1 Year
Education, No Borrowing,
Scholarship Income
AUS Australia 0.76164 0.7419 0.0 0.82757 0.0 0.69252 0.15878 0.79739
AUT Austria 0.30198 0.30251 0.38102 0.30151 0.32843 0.52286 0.08675 0.63019
BEL Belgium 0.33395 0.3393 0.48429 0.32898 0.28809 0.57506 0.13411 0.73835
CAN Canada 0.17081 0.17951 0.23852 0.16766 0.17918 0.4929 0.09456 0.54804
CHL Chile 0.0 0.0 0.0 0.0 0.0 0.0 0.0 0.0
CZE Czech Republic 0.25011 0.25043 0.3019 0.25034 0.30018 0.34548 0.07261 0.35485
DNK Denmark 0.08736 0.09993 0.17128 0.08112 0.06919 0.2407 0.1839 0.48009
EST Estonia 0.22378 0.22656 0.27832 0.22275 0.24655 0.31912 0.05846 0.34109
FIN Finland 0.23198 0.23601 0.33591 0.22824 0.19918 0.40706 0.12188 0.60129
GRC Greece 0.54984 0.54957 0.56045 0.55012 1.05248 1.26148 0.13196 1.0015
HUN Hungary 0.16895 0.18038 0.22585 0.16609 0.20309 0.49481 0.13369 0.65905
ISL Iceland 0.55048 0.55245 0.69255 0.54909 0.61238 0.66267 0.16912 0.66267
IRL Ireland 0.30006 0.30616 0.38268 0.29714 0.31929 0.79781 0.10383 1.18163
ISR Israel 0.34366 0.31606 0.31371 0.41337 2.5408 0.75599 0.11174 0.85624
ITA Italy 0.35815 0.3663 0.45233 0.35555 0.38872 0.49302 0.18058 0.77205
LUX Luxembourg 0.34677 0.34496 0.40394 0.34475 0.4106 0.67015 0.12256 0.86029
MEX Mexico 0.21695 0.17618 0.22806 0.2122 0.239 0.24512 0.02195 0.27432
NLD Netherlands 0.85662 0.85087 0.99221 0.8686 1.22176 0.8709 0.14839 1.101
NZL New Zealand 0.24702 0.24634 0.28402 0.2566 0.33655 0.66824 0.21158 0.92687
NOR Norway 0.1811 0.18322 0.26052 0.17909 0.15858 0.44524 0.17886 0.63166
POL Poland 0.10151 0.10207 0.1207 0.10301 0.12642 0.14634 0.02875 0.18625
PRT Portugal 0.44522 0.43985 0.49151 0.45827 0.63029 0.57373 0.16086 0.72954
SVK Slovak Republic 0.14602 0.14988 0.18838 0.14371 0.14844 0.23045 0.06065 0.32667
SVN Slovenia 0.07466 0.07706 0.10368 0.07268 0.06746 0.24966 0.0849 0.4151
ESP Spain 0.27536 0.27789 0.33676 0.27579 0.32114 0.45724 0.12656 0.53539
SWE Sweden 0.11818 0.11786 0.17063 0.11791 0.10247 0.23549 0.03927 0.48177
CHE Switzerland 0.20378 0.20278 0.23547 0.20262 0.2437 0.38231 0.06418 0.39657
TUR Turkey 0.15967 0.15999 0.20602 0.15937 0.16266 0.24568 0.04809 0.27602
GBR United Kingdom 0.425 0.39719 0.42779 0.5118 1.05141 0.53419 0.19011 0.60023
12 http://dx.doi.org/10.1787/888933446718
167
Taxation and Skills
© OECD 2017
ANNEX C
Country Tables
This annex provides country tables which detail the main results from Annex B as well
as the variables that lie behind these results. As with Annex B results are given for a variety
of different assumptions about age, income, student debt levels, and length of education.
The results correspond to the different stylised education scenarios discussed in Chapter 4
of this study.
For each country, two tables are presented.1 The first table for each country focuses
on the education scenario of a 17-year college student engaging in a four-year period of
education, corresponding to an undergraduate degree. In this table, differing assumptions
surrounding the financing of the student’s education are examined. In the second table for
each country, it is assumed that all education spending is financed with retained earnings,
but a variety of assumptions are examined regarding the students age and income, the length
of the educational period, and whether the education is job-related or not.
In each table, the cost components of education are outlined, as discussed in Chapter 3 of
this study and in Annex A. These costs include the direct costs of education less scholarship
and grant income, as well as lost earnings. As discussed in Annex A and Chapter 3, these costs
are offset by the tax system through the tax rate on foregone earnings, and the rate at which
the tax system offsets direct costs. These two measures are also included. These components
together comprise the total post-tax cost of education, which is what needs to be recouped
in order to break even on a skills investment. Where a student borrows to finance the skills
investment, the cost of this borrowing must also be recouped. A debt finance multiplier is
included to account for the extent to which education finance increases or decreases the
amount that needs to be recouped. This term corresponds to the F term in Annex A.
These costs must be recouped in the period after education after taxes. The tax rate on
earnings after education is included in each table, as is the BEI in national currency units and
as a percentage of earnings before education. The table then provides the five key measures
outlined in this study, as are outlined in the cross-country tables in Annex B.

ANNEX C
168 TAXATION AND SkIllS © OECD 2017
Australia
Table C.1. Comparing Financial Incentives for College Education with Different Financing Scenarios - Australia
Single, No Children, 17 Year-Old, Four Years of Education, 70% of the Average Wage Currency: AUD
ScenarioNo
Borrowing
Direct Costs Borrowed,
Low Interest Rate
All Costs Borrowed,
Low Interest Rate
Direct Costs Borrowed,
High Interest Rate
All Costs Borrowed,
High Interest Rate
Non-Financing Education Costs
Direct Costs of Education 9587 9587 9587 9587 9587
Pre-Tax Scholarship Income 2371 2371 2371 2371 2371
Income Before Education 48932 48932 48932 48932 48932
Income During Education 19847 19847 19847 19847 19847
Pre-Tax Foregone Earnings 29086 29086 29086 29086 29086
AETR Before Education (%) 16.8 16.8 16.8 16.8 16.8
AETR During Education (Exclusive of Tax Expenditures) (%)
5.6 5.6 5.6 5.6 5.6
Value of Education Tax Credits % of Direct Costs
3.3 3.3 3.3 3.3 3.3
AETR During Education (Inclusive of Tax Expenditures) (%)
4.4 4.4 4.4 4.4 4.4
METR on Foregone Earnings (%) 24.4 24.4 24.4 24.4 24.4
Total Annual Non-Financing Costs of Education (Direct Costs & Foregone Earnings)
28960 28960 28960 28960 28960
Education Financing Costs
Fraction of Costs Borrowed None Direct Costs All Costs Direct Costs All Costs
Total Amount Borrowed 0 9587 28960 9587 28960
Interest Rate (%) NA 0.0 0.0 6.0 6.0
Annual Repayments 0 815 0 3260 0
Debt Finance Multiplier 1.00 0.58 0.00 1.42 0.00
Returns to Education
Breakeven Earnings Level 58805 57438 48932 60172 48932
AETR After Education (%) 19.9 19.6 16.8 20.3 16.8
Breakeven Earnings Increment 9873 8506 0 11240 0
Breakeven Earnings Increment % of Previous Wage
20.2 17.4 0.0 23.0 0.0
METR Breakeven Earnings Increment (%) 35.5 35.5 0.0 35.5 0.0
Marginal Effective Tax Rate on Skills (%) 19.1 16.5 0.0 21.1 0.0
Average Effective Tax Rate on Skills (Assumed 15% Return, %)
30.7 33.2 34.8 27.6 34.8
Average Effective Tax Rate on Skills (Return based on Labour Market Premium, %)
27.6 32.0 34.8 22.1 34.8
Government Costs and Returns
Government Educational Costs 20928 24937 49888 16918 49888
Marginal Returns to Costs Ratio 0.76 0.74 0.00 0.83 0.00
Average Returns to Costs Ratio (Return based on Labour Market Premium)
1.69 1.42 0.71 2.09 0.71
12 http://dx.doi.org/10.1787/888933446720
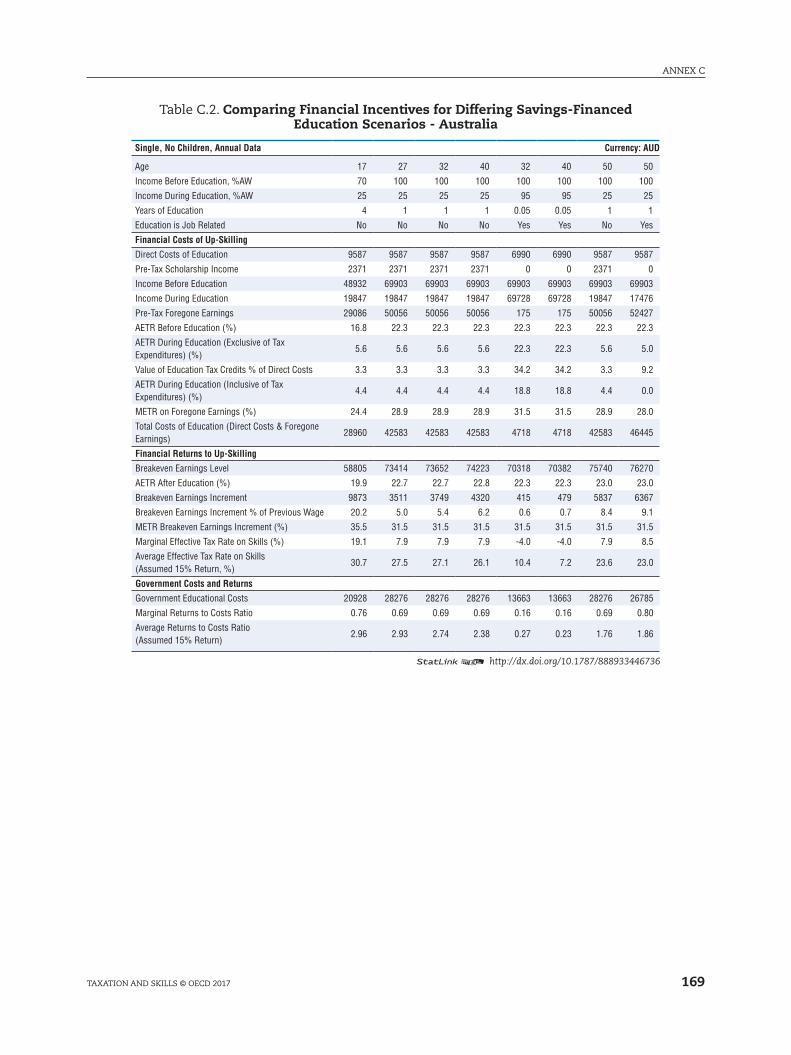
169
ANNEX C
TAXATION AND SkIllS © OECD 2017
Table C.2. Comparing Financial Incentives for Differing Savings-Financed Education Scenarios - Australia
Single, No Children, Annual Data Currency: AUD
Age 17 27 32 40 32 40 50 50
Income Before Education, %AW 70 100 100 100 100 100 100 100
Income During Education, %AW 25 25 25 25 95 95 25 25
Years of Education 4 1 1 1 0.05 0.05 1 1
Education is Job Related No No No No Yes Yes No Yes
Financial Costs of Up-Skilling
Direct Costs of Education 9587 9587 9587 9587 6990 6990 9587 9587
Pre-Tax Scholarship Income 2371 2371 2371 2371 0 0 2371 0
Income Before Education 48932 69903 69903 69903 69903 69903 69903 69903
Income During Education 19847 19847 19847 19847 69728 69728 19847 17476
Pre-Tax Foregone Earnings 29086 50056 50056 50056 175 175 50056 52427
AETR Before Education (%) 16.8 22.3 22.3 22.3 22.3 22.3 22.3 22.3
AETR During Education (Exclusive of Tax Expenditures) (%)
5.6 5.6 5.6 5.6 22.3 22.3 5.6 5.0
Value of Education Tax Credits % of Direct Costs 3.3 3.3 3.3 3.3 34.2 34.2 3.3 9.2
AETR During Education (Inclusive of Tax Expenditures) (%)
4.4 4.4 4.4 4.4 18.8 18.8 4.4 0.0
METR on Foregone Earnings (%) 24.4 28.9 28.9 28.9 31.5 31.5 28.9 28.0
Total Costs of Education (Direct Costs & Foregone Earnings)
28960 42583 42583 42583 4718 4718 42583 46445
Financial Returns to Up-Skilling
Breakeven Earnings Level 58805 73414 73652 74223 70318 70382 75740 76270
AETR After Education (%) 19.9 22.7 22.7 22.8 22.3 22.3 23.0 23.0
Breakeven Earnings Increment 9873 3511 3749 4320 415 479 5837 6367
Breakeven Earnings Increment % of Previous Wage 20.2 5.0 5.4 6.2 0.6 0.7 8.4 9.1
METR Breakeven Earnings Increment (%) 35.5 31.5 31.5 31.5 31.5 31.5 31.5 31.5
Marginal Effective Tax Rate on Skills (%) 19.1 7.9 7.9 7.9 -4.0 -4.0 7.9 8.5
Average Effective Tax Rate on Skills (Assumed 15% Return, %)
30.7 27.5 27.1 26.1 10.4 7.2 23.6 23.0
Government Costs and Returns
Government Educational Costs 20928 28276 28276 28276 13663 13663 28276 26785
Marginal Returns to Costs Ratio 0.76 0.69 0.69 0.69 0.16 0.16 0.69 0.80
Average Returns to Costs Ratio (Assumed 15% Return)
2.96 2.93 2.74 2.38 0.27 0.23 1.76 1.86
12 http://dx.doi.org/10.1787/888933446736

ANNEX C
170 TAXATION AND SkIllS © OECD 2017
Austria
Table C.3. Comparing Financial Incentives for College Education with Different Financing Scenarios - Austria
Single, No Children, 17 Year-Old, Four Years of Education, 70% of the Average Wage Currency: EUR
ScenarioNo
Borrowing
Direct Costs Borrowed,
Low Interest Rate
All Costs Borrowed,
Low Interest Rate
Direct Costs Borrowed,
High Interest Rate
All Costs Borrowed,
High Interest Rate
Non-Financing Education Costs
Direct Costs of Education 328 328 328 328 328
Pre-Tax Scholarship Income 1283 1283 1283 1283 1283
Income Before Education 27785 27785 27785 27785 27785
Income During Education 11207 11207 11207 11207 11207
Pre-Tax Foregone Earnings 16578 16578 16578 16578 16578
AETR Before Education (%) 10.2 10.2 10.2 10.2 10.2
AETR During Education (Exclusive of Tax Expenditures) (%)
-1.0 -1.0 -1.0 -1.0 -1.0
Value of Education Tax Credits % of Direct Costs
0.0 0.0 0.0 0.0 0.0
AETR During Education (Inclusive of Tax Expenditures) (%)
-1.0 -1.0 -1.0 -1.0 -1.0
METR on Foregone Earnings (%) 17.8 17.8 17.8 17.8 17.8
Total Annual Non-Financing Costs of Education (Direct Costs & Foregone Earnings)
12672 12672 12672 12672 12672
Education Financing Costs
Fraction of Costs Borrowed None Direct Costs All Costs Direct Costs All Costs
Total Amount Borrowed 0 328 12672 328 12672
Interest Rate (%) NA 0.0 0.0 6.0 6.0
Annual Repayments 0 28 1077 112 4309
Debt Finance Multiplier 1.00 0.59 0.59 1.41 1.41
Returns to Education
Breakeven Earnings Level 31638 31597 30049 31679 33227
AETR After Education (%) 12.2 12.2 11.4 12.2 12.9
Breakeven Earnings Increment 3853 3812 2264 3894 5443
Breakeven Earnings Increment % of Previous Wage
13.9 13.7 8.1 14.0 19.6
METR Breakeven Earnings Increment (%) 26.3 26.3 26.3 26.3 26.3
Marginal Effective Tax Rate on Skills (%) 9.1 9.0 9.1 9.3 9.1
Average Effective Tax Rate on Skills (Assumed 15% Return, %)
26.3 26.5 31.4 26.1 15.9
Average Effective Tax Rate on Skills (Return based on Labour Market Premium, %)
22.6 22.9 31.6 22.3 4.0
Government Costs and Returns
Government Educational Costs 14976 15112 20204 14841 9749
Marginal Returns to Costs Ratio 0.30 0.30 0.38 0.30 0.33
Average Returns to Costs Ratio (Return based on Labour Market Premium)
1.04 1.03 0.77 1.05 1.59
12 http://dx.doi.org/10.1787/888933446746

171
ANNEX C
TAXATION AND SkIllS © OECD 2017
Table C.4. Comparing Financial Incentives for Differing Savings-Financed Education Scenarios - Austria
Single, No Children, Annual Data Currency: EUR
Age 17 27 32 40 32 40 50 50
Income Before Education, %AW 70 100 100 100 100 100 100 100
Income During Education, %AW 25 25 25 25 95 95 25 25
Years of Education 4 1 1 1 0.05 0.05 1 1
Education is Job Related No No No No Yes Yes No Yes
Financial Costs of Up-Skilling
Direct Costs of Education 328 328 328 328 3926 3926 328 328
Pre-Tax Scholarship Income 1283 1283 1283 1283 0 0 1283 0
Income Before Education 27785 39693 39693 39693 39693 39693 39693 39693
Income During Education 11207 11207 11207 11207 39593 39593 11207 9923
Pre-Tax Foregone Earnings 16578 28486 28486 28486 99 99 28486 29769
AETR Before Education (%) 10.2 15.5 15.5 15.5 15.5 15.5 15.5 15.5
AETR During Education (Exclusive of Tax Expenditures) (%)
-1.0 -1.0 -1.0 -1.0 15.5 15.5 -1.0 -1.1
Value of Education Tax Credits % of Direct Costs 0.0 0.0 0.0 0.0 40.9 40.9 0.0 0.0
AETR During Education (Inclusive of Tax Expenditures) (%)
-1.0 -1.0 -1.0 -1.0 11.4 11.4 -1.0 -1.1
METR on Foregone Earnings (%) 17.8 22.0 22.0 22.0 31.0 31.0 22.0 21.0
Total Costs of Education (Direct Costs & Foregone Earnings)
12672 21271 21271 21271 2389 2389 21271 23838
Financial Returns to Up-Skilling
Breakeven Earnings Level 31638 41477 41610 41936 39908 39945 42867 43250
AETR After Education (%) 12.2 16.2 16.2 16.3 15.6 15.6 16.6 16.8
Breakeven Earnings Increment 3853 1785 1917 2243 215 252 3175 3558
Breakeven Earnings Increment % of Previous Wage 13.9 4.5 4.8 5.7 0.5 0.6 8.0 9.0
METR Breakeven Earnings Increment (%) 26.3 31.0 31.0 31.0 31.0 31.0 31.0 31.0
Marginal Effective Tax Rate on Skills (%) 9.1 10.7 10.7 10.7 -16.2 -16.2 10.7 12.9
Average Effective Tax Rate on Skills (Assumed 15% Return, %)
26.3 26.4 26.1 25.3 5.4 1.0 22.9 22.9
Government Costs and Returns
Government Educational Costs 14976 18285 18285 18285 12379 12379 18285 17002
Marginal Returns to Costs Ratio 0.30 0.52 0.52 0.52 0.09 0.09 0.52 0.63
Average Returns to Costs Ratio (Assumed 15% Return)
1.94 2.33 2.17 1.85 0.16 0.14 1.31 1.41
12 http://dx.doi.org/10.1787/888933446754
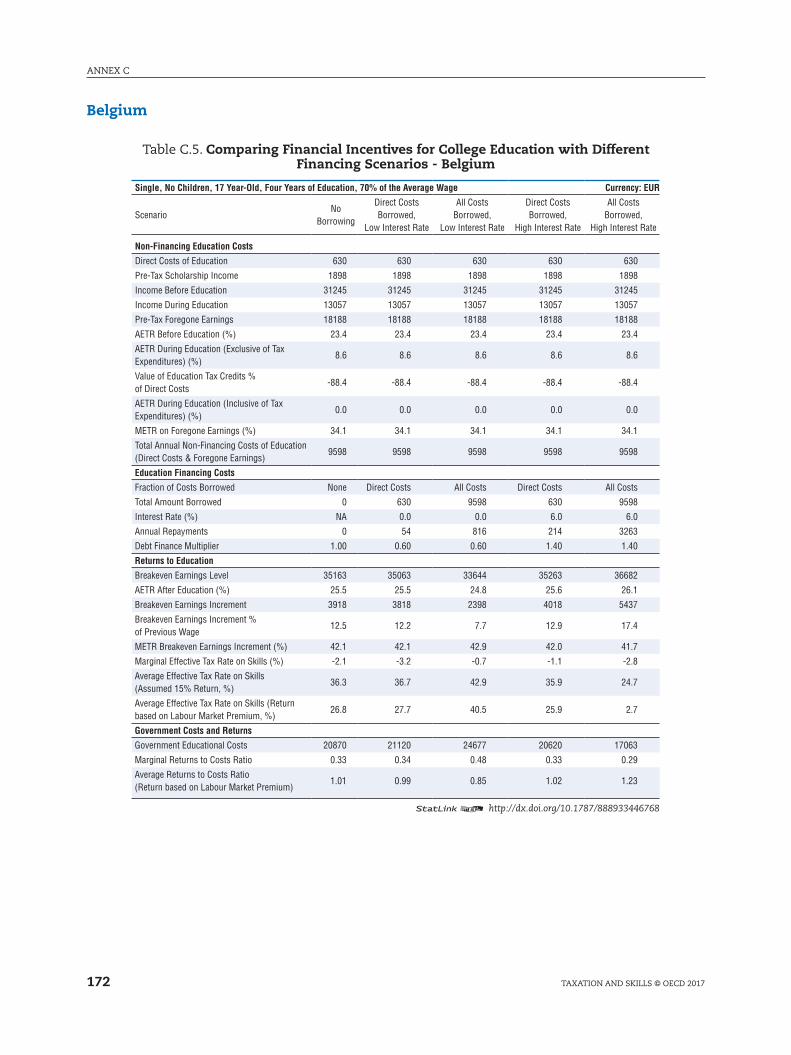
ANNEX C
172 TAXATION AND SkIllS © OECD 2017
Belgium
Table C.5. Comparing Financial Incentives for College Education with Different Financing Scenarios - Belgium
Single, No Children, 17 Year-Old, Four Years of Education, 70% of the Average Wage Currency: EUR
ScenarioNo
Borrowing
Direct Costs Borrowed,
Low Interest Rate
All Costs Borrowed,
Low Interest Rate
Direct Costs Borrowed,
High Interest Rate
All Costs Borrowed,
High Interest Rate
Non-Financing Education Costs
Direct Costs of Education 630 630 630 630 630
Pre-Tax Scholarship Income 1898 1898 1898 1898 1898
Income Before Education 31245 31245 31245 31245 31245
Income During Education 13057 13057 13057 13057 13057
Pre-Tax Foregone Earnings 18188 18188 18188 18188 18188
AETR Before Education (%) 23.4 23.4 23.4 23.4 23.4
AETR During Education (Exclusive of Tax Expenditures) (%)
8.6 8.6 8.6 8.6 8.6
Value of Education Tax Credits % of Direct Costs
-88.4 -88.4 -88.4 -88.4 -88.4
AETR During Education (Inclusive of Tax Expenditures) (%)
0.0 0.0 0.0 0.0 0.0
METR on Foregone Earnings (%) 34.1 34.1 34.1 34.1 34.1
Total Annual Non-Financing Costs of Education (Direct Costs & Foregone Earnings)
9598 9598 9598 9598 9598
Education Financing Costs
Fraction of Costs Borrowed None Direct Costs All Costs Direct Costs All Costs
Total Amount Borrowed 0 630 9598 630 9598
Interest Rate (%) NA 0.0 0.0 6.0 6.0
Annual Repayments 0 54 816 214 3263
Debt Finance Multiplier 1.00 0.60 0.60 1.40 1.40
Returns to Education
Breakeven Earnings Level 35163 35063 33644 35263 36682
AETR After Education (%) 25.5 25.5 24.8 25.6 26.1
Breakeven Earnings Increment 3918 3818 2398 4018 5437
Breakeven Earnings Increment % of Previous Wage
12.5 12.2 7.7 12.9 17.4
METR Breakeven Earnings Increment (%) 42.1 42.1 42.9 42.0 41.7
Marginal Effective Tax Rate on Skills (%) -2.1 -3.2 -0.7 -1.1 -2.8
Average Effective Tax Rate on Skills (Assumed 15% Return, %)
36.3 36.7 42.9 35.9 24.7
Average Effective Tax Rate on Skills (Return based on Labour Market Premium, %)
26.8 27.7 40.5 25.9 2.7
Government Costs and Returns
Government Educational Costs 20870 21120 24677 20620 17063
Marginal Returns to Costs Ratio 0.33 0.34 0.48 0.33 0.29
Average Returns to Costs Ratio (Return based on Labour Market Premium)
1.01 0.99 0.85 1.02 1.23
12 http://dx.doi.org/10.1787/888933446768

173
ANNEX C
TAXATION AND SkIllS © OECD 2017
Table C.6. Comparing Financial Incentives for Differing Savings-Financed Education Scenarios - Belgium
Single, No Children, Annual Data Currency: EUR
Age 17 27 32 40 32 40 50 50
Income Before Education, %AW 70 100 100 100 100 100 100 100
Income During Education, %AW 25 25 25 25 95 95 25 25
Years of Education 4 1 1 1 0.05 0.05 1 1
Education is Job Related No No No No Yes Yes No Yes
Financial Costs of Up-Skilling
Direct Costs of Education 630 630 630 630 4274 4274 630 630
Pre-Tax Scholarship Income 1898 1898 1898 1898 0 0 1898 0
Income Before Education 31245 44636 44636 44636 44636 44636 44636 44636
Income During Education 13057 13057 13057 13057 44524 44524 13057 11159
Pre-Tax Foregone Earnings 18188 31579 31579 31579 112 112 31579 33477
AETR Before Education (%) 23.4 28.8 28.8 28.8 28.8 28.8 28.8 28.8
AETR During Education (Exclusive of Tax Expenditures) (%)
8.6 8.6 8.6 8.6 28.8 28.8 8.6 4.8
Value of Education Tax Credits % of Direct Costs -88.4 -45.8 -45.8 -45.8 49.1 49.1 -45.8 32.2
AETR During Education (Inclusive of Tax Expenditures) (%)
0.0 4.1 4.1 4.1 24.1 24.1 4.1 3.0
METR on Foregone Earnings (%) 34.1 37.2 37.2 37.2 45.3 45.3 37.2 36.8
Total Costs of Education (Direct Costs & Foregone Earnings)
9598 17982 17982 17982 2236 2236 17982 21576
Financial Returns to Up-Skilling
Breakeven Earnings Level 35163 46679 46872 47393 44914 44979 49344 50284
AETR After Education (%) 25.5 29.5 29.6 29.8 28.9 29.0 30.4 30.7
Breakeven Earnings Increment 3918 2043 2236 2757 278 343 4708 5648
Breakeven Earnings Increment % of Previous Wage 12.5 4.6 5.0 6.2 0.6 0.8 10.5 12.7
METR Breakeven Earnings Increment (%) 42.1 45.3 45.3 45.3 45.3 45.3 45.3 45.3
Marginal Effective Tax Rate on Skills (%) -2.1 7.8 7.8 7.8 -7.3 -7.3 7.8 13.5
Average Effective Tax Rate on Skills (Assumed 15% Return, %)
36.3 36.7 35.9 33.7 12.5 4.9 25.5 25.2
Government Costs and Returns
Government Educational Costs 20870 25877 25877 25877 13799 13799 25877 24181
Marginal Returns to Costs Ratio 0.33 0.58 0.58 0.58 0.13 0.13 0.58 0.74
Average Returns to Costs Ratio (Assumed 15% Return)
2.19 2.51 2.30 1.86 0.22 0.17 1.09 1.17
12 http://dx.doi.org/10.1787/888933446777
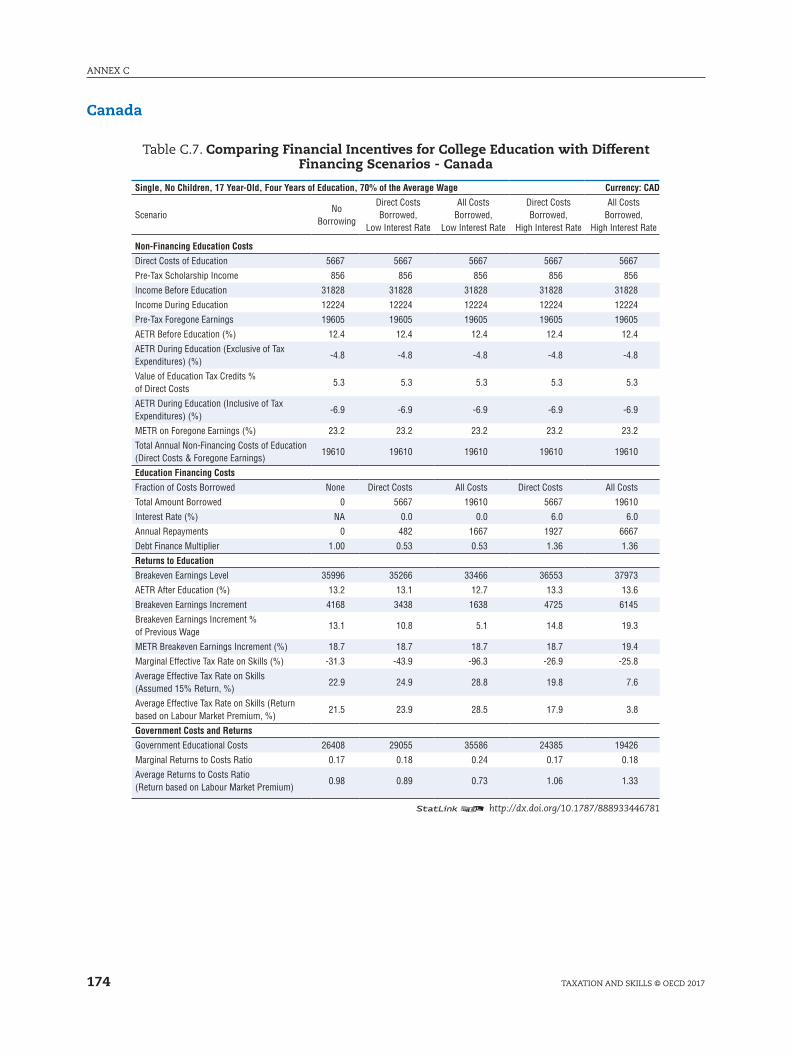
ANNEX C
174 TAXATION AND SkIllS © OECD 2017
Canada
Table C.7. Comparing Financial Incentives for College Education with Different Financing Scenarios - Canada
Single, No Children, 17 Year-Old, Four Years of Education, 70% of the Average Wage Currency: CAD
ScenarioNo
Borrowing
Direct Costs Borrowed,
Low Interest Rate
All Costs Borrowed,
Low Interest Rate
Direct Costs Borrowed,
High Interest Rate
All Costs Borrowed,
High Interest Rate
Non-Financing Education Costs
Direct Costs of Education 5667 5667 5667 5667 5667
Pre-Tax Scholarship Income 856 856 856 856 856
Income Before Education 31828 31828 31828 31828 31828
Income During Education 12224 12224 12224 12224 12224
Pre-Tax Foregone Earnings 19605 19605 19605 19605 19605
AETR Before Education (%) 12.4 12.4 12.4 12.4 12.4
AETR During Education (Exclusive of Tax Expenditures) (%)
-4.8 -4.8 -4.8 -4.8 -4.8
Value of Education Tax Credits % of Direct Costs
5.3 5.3 5.3 5.3 5.3
AETR During Education (Inclusive of Tax Expenditures) (%)
-6.9 -6.9 -6.9 -6.9 -6.9
METR on Foregone Earnings (%) 23.2 23.2 23.2 23.2 23.2
Total Annual Non-Financing Costs of Education (Direct Costs & Foregone Earnings)
19610 19610 19610 19610 19610
Education Financing Costs
Fraction of Costs Borrowed None Direct Costs All Costs Direct Costs All Costs
Total Amount Borrowed 0 5667 19610 5667 19610
Interest Rate (%) NA 0.0 0.0 6.0 6.0
Annual Repayments 0 482 1667 1927 6667
Debt Finance Multiplier 1.00 0.53 0.53 1.36 1.36
Returns to Education
Breakeven Earnings Level 35996 35266 33466 36553 37973
AETR After Education (%) 13.2 13.1 12.7 13.3 13.6
Breakeven Earnings Increment 4168 3438 1638 4725 6145
Breakeven Earnings Increment % of Previous Wage
13.1 10.8 5.1 14.8 19.3
METR Breakeven Earnings Increment (%) 18.7 18.7 18.7 18.7 19.4
Marginal Effective Tax Rate on Skills (%) -31.3 -43.9 -96.3 -26.9 -25.8
Average Effective Tax Rate on Skills (Assumed 15% Return, %)
22.9 24.9 28.8 19.8 7.6
Average Effective Tax Rate on Skills (Return based on Labour Market Premium, %)
21.5 23.9 28.5 17.9 3.8
Government Costs and Returns
Government Educational Costs 26408 29055 35586 24385 19426
Marginal Returns to Costs Ratio 0.17 0.18 0.24 0.17 0.18
Average Returns to Costs Ratio (Return based on Labour Market Premium)
0.98 0.89 0.73 1.06 1.33
12 http://dx.doi.org/10.1787/888933446781

175
ANNEX C
TAXATION AND SkIllS © OECD 2017
Table C.8. Comparing Financial Incentives for Differing Savings-Financed Education Scenarios - Canada
Single, No Children, Annual Data Currency: CAD
Age 17 27 32 40 32 40 50 50
Income Before Education, %AW 70 100 100 100 100 100 100 100
Income During Education, %AW 25 25 25 25 95 95 25 25
Years of Education 4 1 1 1 0.05 0.05 1 1
Education is Job Related No No No No Yes Yes No Yes
Financial Costs of Up-Skilling
Direct Costs of Education 5667 5667 5667 5667 4616 4616 5667 5667
Pre-Tax Scholarship Income 856 856 856 856 0 0 856 0
Income Before Education 31828 45469 45469 45469 45469 45469 45469 45469
Income During Education 12224 12224 12224 12224 45355 45355 12224 11367
Pre-Tax Foregone Earnings 19605 33245 33245 33245 114 114 33245 34102
AETR Before Education (%) 12.4 15.8 15.8 15.8 15.3 15.3 15.8 15.8
AETR During Education (Exclusive of Tax Expenditures) (%)
-4.8 -4.8 -4.8 -4.8 15.2 15.2 -4.8 -7.4
Value of Education Tax Credits % of Direct Costs 5.3 5.3 5.3 5.3 20.1 20.1 5.3 0.1
AETR During Education (Inclusive of Tax Expenditures) (%)
-6.9 -6.9 -6.9 -6.9 13.2 13.2 -6.9 -7.4
METR on Foregone Earnings (%) 23.2 23.4 23.4 23.4 30.2 30.2 23.4 23.6
Total Costs of Education (Direct Costs & Foregone Earnings)
19610 30010 30010 30010 3770 3770 30010 31723
Financial Returns to Up-Skilling
Breakeven Earnings Level 35996 47863 48040 48480 45805 45862 49747 50002
AETR After Education (%) 13.2 16.6 16.6 16.7 15.4 15.4 17.1 17.2
Breakeven Earnings Increment 4168 2394 2571 3011 336 393 4278 4533
Breakeven Earnings Increment % of Previous Wage 13.1 5.3 5.7 6.6 0.7 0.9 9.4 10.0
METR Breakeven Earnings Increment (%) 18.7 30.2 30.2 30.2 30.2 30.2 30.5 30.5
Marginal Effective Tax Rate on Skills (%) -31.3 8.0 8.0 8.0 12.4 12.4 8.4 9.7
Average Effective Tax Rate on Skills (Assumed 15% Return, %)
22.9 25.7 25.3 24.4 17.0 14.8 21.7 21.7
Government Costs and Returns
Government Educational Costs 26408 26289 26289 26289 17216 17216 26289 25439
Marginal Returns to Costs Ratio 0.17 0.49 0.49 0.49 0.09 0.09 0.50 0.55
Average Returns to Costs Ratio (Assumed 15% Return)
1.17 1.84 1.72 1.47 0.13 0.11 1.04 1.07
12 http://dx.doi.org/10.1787/888933446795
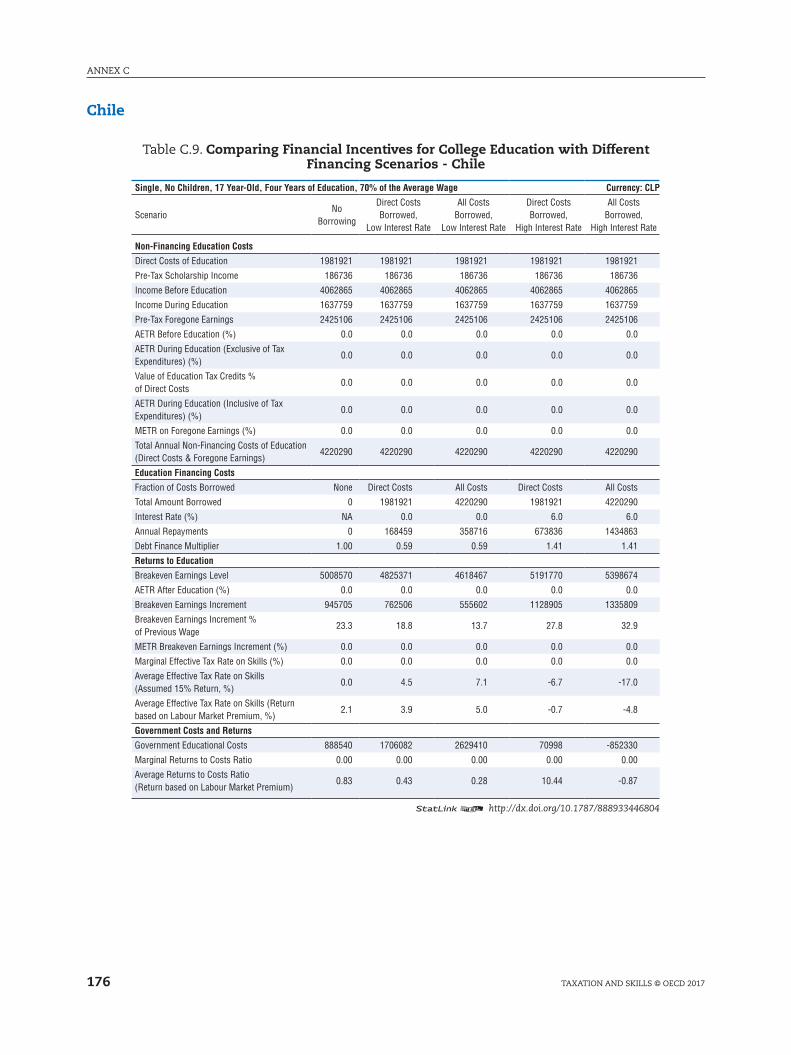
ANNEX C
176 TAXATION AND SkIllS © OECD 2017
Chile
Table C.9. Comparing Financial Incentives for College Education with Different Financing Scenarios - Chile
Single, No Children, 17 Year-Old, Four Years of Education, 70% of the Average Wage Currency: CLP
ScenarioNo
Borrowing
Direct Costs Borrowed,
Low Interest Rate
All Costs Borrowed,
Low Interest Rate
Direct Costs Borrowed,
High Interest Rate
All Costs Borrowed,
High Interest Rate
Non-Financing Education Costs
Direct Costs of Education 1981921 1981921 1981921 1981921 1981921
Pre-Tax Scholarship Income 186736 186736 186736 186736 186736
Income Before Education 4062865 4062865 4062865 4062865 4062865
Income During Education 1637759 1637759 1637759 1637759 1637759
Pre-Tax Foregone Earnings 2425106 2425106 2425106 2425106 2425106
AETR Before Education (%) 0.0 0.0 0.0 0.0 0.0
AETR During Education (Exclusive of Tax Expenditures) (%)
0.0 0.0 0.0 0.0 0.0
Value of Education Tax Credits % of Direct Costs
0.0 0.0 0.0 0.0 0.0
AETR During Education (Inclusive of Tax Expenditures) (%)
0.0 0.0 0.0 0.0 0.0
METR on Foregone Earnings (%) 0.0 0.0 0.0 0.0 0.0
Total Annual Non-Financing Costs of Education (Direct Costs & Foregone Earnings)
4220290 4220290 4220290 4220290 4220290
Education Financing Costs
Fraction of Costs Borrowed None Direct Costs All Costs Direct Costs All Costs
Total Amount Borrowed 0 1981921 4220290 1981921 4220290
Interest Rate (%) NA 0.0 0.0 6.0 6.0
Annual Repayments 0 168459 358716 673836 1434863
Debt Finance Multiplier 1.00 0.59 0.59 1.41 1.41
Returns to Education
Breakeven Earnings Level 5008570 4825371 4618467 5191770 5398674
AETR After Education (%) 0.0 0.0 0.0 0.0 0.0
Breakeven Earnings Increment 945705 762506 555602 1128905 1335809
Breakeven Earnings Increment % of Previous Wage
23.3 18.8 13.7 27.8 32.9
METR Breakeven Earnings Increment (%) 0.0 0.0 0.0 0.0 0.0
Marginal Effective Tax Rate on Skills (%) 0.0 0.0 0.0 0.0 0.0
Average Effective Tax Rate on Skills (Assumed 15% Return, %)
0.0 4.5 7.1 -6.7 -17.0
Average Effective Tax Rate on Skills (Return based on Labour Market Premium, %)
2.1 3.9 5.0 -0.7 -4.8
Government Costs and Returns
Government Educational Costs 888540 1706082 2629410 70998 -852330
Marginal Returns to Costs Ratio 0.00 0.00 0.00 0.00 0.00
Average Returns to Costs Ratio (Return based on Labour Market Premium)
0.83 0.43 0.28 10.44 -0.87
12 http://dx.doi.org/10.1787/888933446804
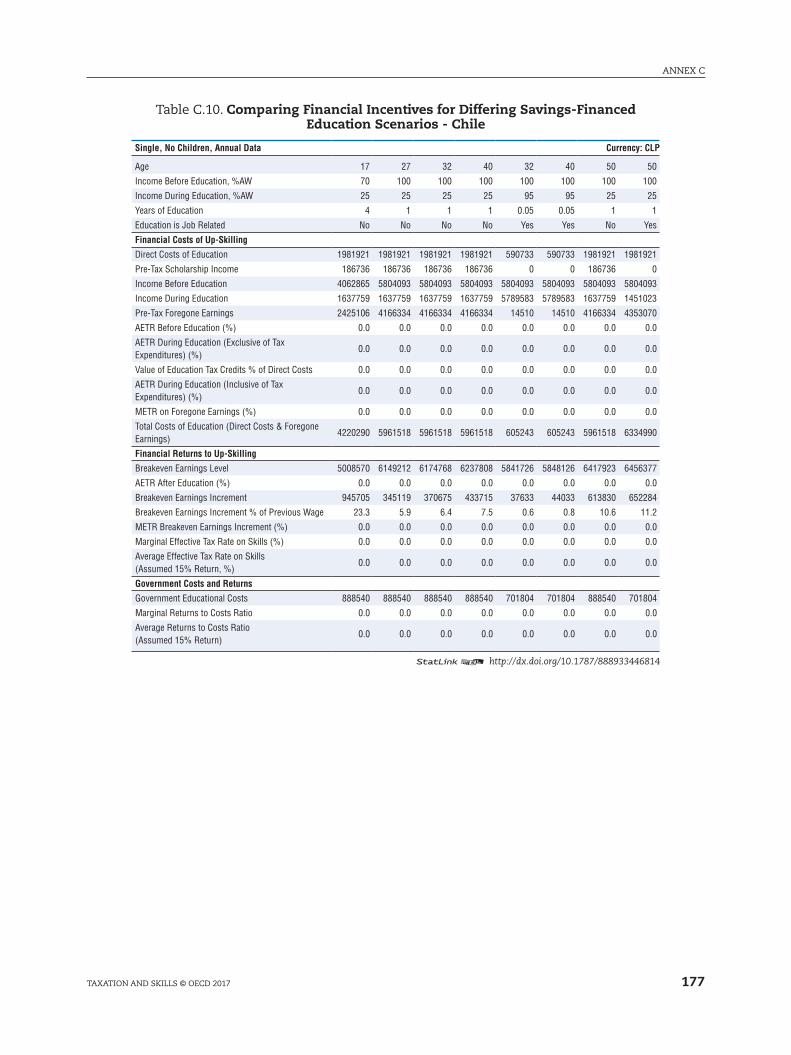
177
ANNEX C
TAXATION AND SkIllS © OECD 2017
Table C.10. Comparing Financial Incentives for Differing Savings-Financed Education Scenarios - Chile
Single, No Children, Annual Data Currency: CLP
Age 17 27 32 40 32 40 50 50
Income Before Education, %AW 70 100 100 100 100 100 100 100
Income During Education, %AW 25 25 25 25 95 95 25 25
Years of Education 4 1 1 1 0.05 0.05 1 1
Education is Job Related No No No No Yes Yes No Yes
Financial Costs of Up-Skilling
Direct Costs of Education 1981921 1981921 1981921 1981921 590733 590733 1981921 1981921
Pre-Tax Scholarship Income 186736 186736 186736 186736 0 0 186736 0
Income Before Education 4062865 5804093 5804093 5804093 5804093 5804093 5804093 5804093
Income During Education 1637759 1637759 1637759 1637759 5789583 5789583 1637759 1451023
Pre-Tax Foregone Earnings 2425106 4166334 4166334 4166334 14510 14510 4166334 4353070
AETR Before Education (%) 0.0 0.0 0.0 0.0 0.0 0.0 0.0 0.0
AETR During Education (Exclusive of Tax Expenditures) (%)
0.0 0.0 0.0 0.0 0.0 0.0 0.0 0.0
Value of Education Tax Credits % of Direct Costs 0.0 0.0 0.0 0.0 0.0 0.0 0.0 0.0
AETR During Education (Inclusive of Tax Expenditures) (%)
0.0 0.0 0.0 0.0 0.0 0.0 0.0 0.0
METR on Foregone Earnings (%) 0.0 0.0 0.0 0.0 0.0 0.0 0.0 0.0
Total Costs of Education (Direct Costs & Foregone Earnings)
4220290 5961518 5961518 5961518 605243 605243 5961518 6334990
Financial Returns to Up-Skilling
Breakeven Earnings Level 5008570 6149212 6174768 6237808 5841726 5848126 6417923 6456377
AETR After Education (%) 0.0 0.0 0.0 0.0 0.0 0.0 0.0 0.0
Breakeven Earnings Increment 945705 345119 370675 433715 37633 44033 613830 652284
Breakeven Earnings Increment % of Previous Wage 23.3 5.9 6.4 7.5 0.6 0.8 10.6 11.2
METR Breakeven Earnings Increment (%) 0.0 0.0 0.0 0.0 0.0 0.0 0.0 0.0
Marginal Effective Tax Rate on Skills (%) 0.0 0.0 0.0 0.0 0.0 0.0 0.0 0.0
Average Effective Tax Rate on Skills (Assumed 15% Return, %)
0.0 0.0 0.0 0.0 0.0 0.0 0.0 0.0
Government Costs and Returns
Government Educational Costs 888540 888540 888540 888540 701804 701804 888540 701804
Marginal Returns to Costs Ratio 0.0 0.0 0.0 0.0 0.0 0.0 0.0 0.0
Average Returns to Costs Ratio (Assumed 15% Return)
0.0 0.0 0.0 0.0 0.0 0.0 0.0 0.0
12 http://dx.doi.org/10.1787/888933446814
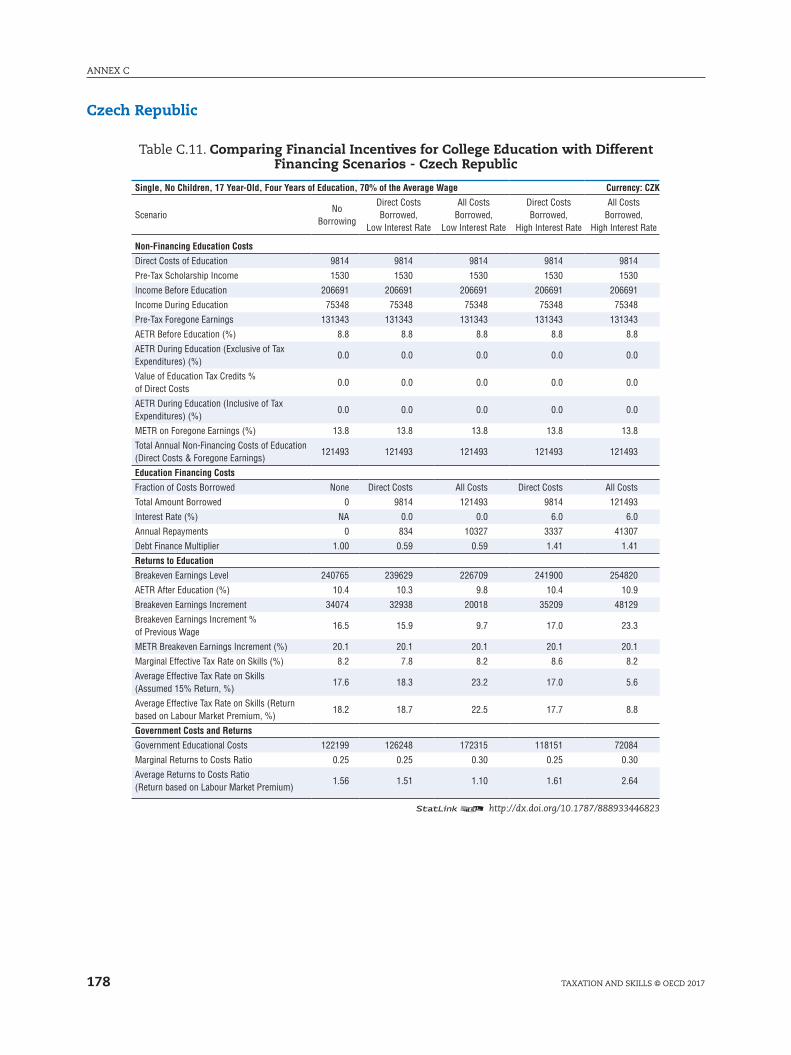
ANNEX C
178 TAXATION AND SkIllS © OECD 2017
Czech Republic
Table C.11. Comparing Financial Incentives for College Education with Different Financing Scenarios - Czech Republic
Single, No Children, 17 Year-Old, Four Years of Education, 70% of the Average Wage Currency: CZK
ScenarioNo
Borrowing
Direct Costs Borrowed,
Low Interest Rate
All Costs Borrowed,
Low Interest Rate
Direct Costs Borrowed,
High Interest Rate
All Costs Borrowed,
High Interest Rate
Non-Financing Education Costs
Direct Costs of Education 9814 9814 9814 9814 9814
Pre-Tax Scholarship Income 1530 1530 1530 1530 1530
Income Before Education 206691 206691 206691 206691 206691
Income During Education 75348 75348 75348 75348 75348
Pre-Tax Foregone Earnings 131343 131343 131343 131343 131343
AETR Before Education (%) 8.8 8.8 8.8 8.8 8.8
AETR During Education (Exclusive of Tax Expenditures) (%)
0.0 0.0 0.0 0.0 0.0
Value of Education Tax Credits % of Direct Costs
0.0 0.0 0.0 0.0 0.0
AETR During Education (Inclusive of Tax Expenditures) (%)
0.0 0.0 0.0 0.0 0.0
METR on Foregone Earnings (%) 13.8 13.8 13.8 13.8 13.8
Total Annual Non-Financing Costs of Education (Direct Costs & Foregone Earnings)
121493 121493 121493 121493 121493
Education Financing Costs
Fraction of Costs Borrowed None Direct Costs All Costs Direct Costs All Costs
Total Amount Borrowed 0 9814 121493 9814 121493
Interest Rate (%) NA 0.0 0.0 6.0 6.0
Annual Repayments 0 834 10327 3337 41307
Debt Finance Multiplier 1.00 0.59 0.59 1.41 1.41
Returns to Education
Breakeven Earnings Level 240765 239629 226709 241900 254820
AETR After Education (%) 10.4 10.3 9.8 10.4 10.9
Breakeven Earnings Increment 34074 32938 20018 35209 48129
Breakeven Earnings Increment % of Previous Wage
16.5 15.9 9.7 17.0 23.3
METR Breakeven Earnings Increment (%) 20.1 20.1 20.1 20.1 20.1
Marginal Effective Tax Rate on Skills (%) 8.2 7.8 8.2 8.6 8.2
Average Effective Tax Rate on Skills (Assumed 15% Return, %)
17.6 18.3 23.2 17.0 5.6
Average Effective Tax Rate on Skills (Return based on Labour Market Premium, %)
18.2 18.7 22.5 17.7 8.8
Government Costs and Returns
Government Educational Costs 122199 126248 172315 118151 72084
Marginal Returns to Costs Ratio 0.25 0.25 0.30 0.25 0.30
Average Returns to Costs Ratio (Return based on Labour Market Premium)
1.56 1.51 1.10 1.61 2.64
12 http://dx.doi.org/10.1787/888933446823
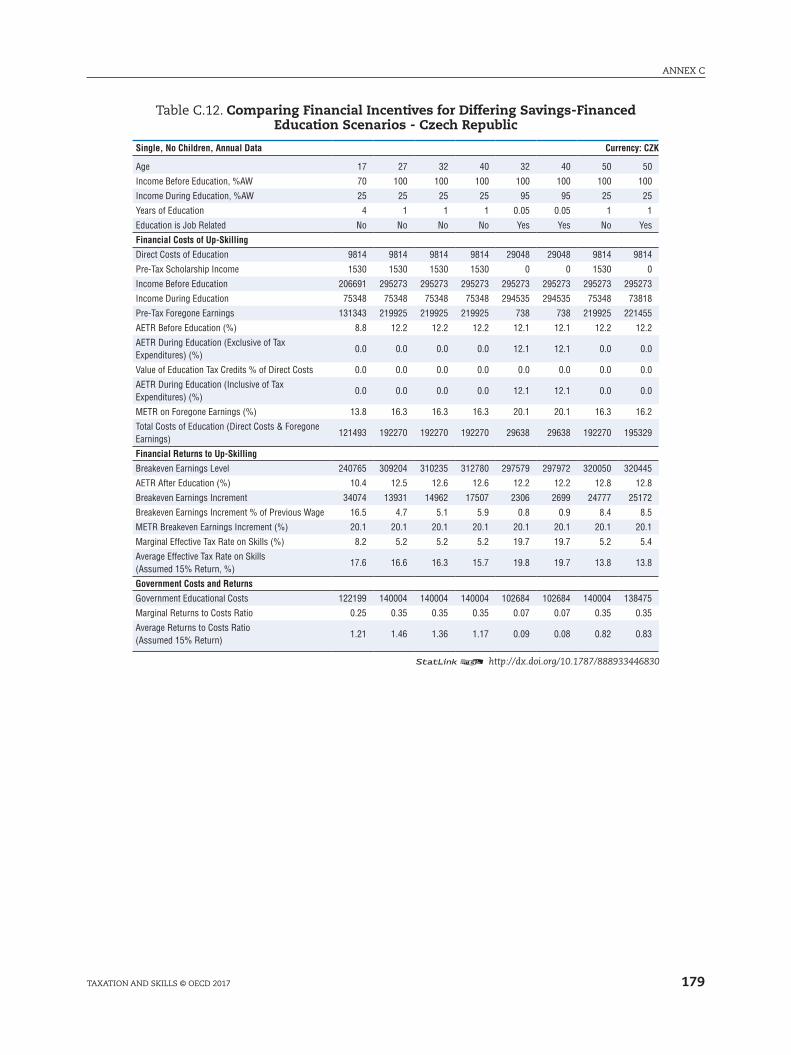
179
ANNEX C
TAXATION AND SkIllS © OECD 2017
Table C.12. Comparing Financial Incentives for Differing Savings-Financed Education Scenarios - Czech Republic
Single, No Children, Annual Data Currency: CZK
Age 17 27 32 40 32 40 50 50
Income Before Education, %AW 70 100 100 100 100 100 100 100
Income During Education, %AW 25 25 25 25 95 95 25 25
Years of Education 4 1 1 1 0.05 0.05 1 1
Education is Job Related No No No No Yes Yes No Yes
Financial Costs of Up-Skilling
Direct Costs of Education 9814 9814 9814 9814 29048 29048 9814 9814
Pre-Tax Scholarship Income 1530 1530 1530 1530 0 0 1530 0
Income Before Education 206691 295273 295273 295273 295273 295273 295273 295273
Income During Education 75348 75348 75348 75348 294535 294535 75348 73818
Pre-Tax Foregone Earnings 131343 219925 219925 219925 738 738 219925 221455
AETR Before Education (%) 8.8 12.2 12.2 12.2 12.1 12.1 12.2 12.2
AETR During Education (Exclusive of Tax Expenditures) (%)
0.0 0.0 0.0 0.0 12.1 12.1 0.0 0.0
Value of Education Tax Credits % of Direct Costs 0.0 0.0 0.0 0.0 0.0 0.0 0.0 0.0
AETR During Education (Inclusive of Tax Expenditures) (%)
0.0 0.0 0.0 0.0 12.1 12.1 0.0 0.0
METR on Foregone Earnings (%) 13.8 16.3 16.3 16.3 20.1 20.1 16.3 16.2
Total Costs of Education (Direct Costs & Foregone Earnings)
121493 192270 192270 192270 29638 29638 192270 195329
Financial Returns to Up-Skilling
Breakeven Earnings Level 240765 309204 310235 312780 297579 297972 320050 320445
AETR After Education (%) 10.4 12.5 12.6 12.6 12.2 12.2 12.8 12.8
Breakeven Earnings Increment 34074 13931 14962 17507 2306 2699 24777 25172
Breakeven Earnings Increment % of Previous Wage 16.5 4.7 5.1 5.9 0.8 0.9 8.4 8.5
METR Breakeven Earnings Increment (%) 20.1 20.1 20.1 20.1 20.1 20.1 20.1 20.1
Marginal Effective Tax Rate on Skills (%) 8.2 5.2 5.2 5.2 19.7 19.7 5.2 5.4
Average Effective Tax Rate on Skills (Assumed 15% Return, %)
17.6 16.6 16.3 15.7 19.8 19.7 13.8 13.8
Government Costs and Returns
Government Educational Costs 122199 140004 140004 140004 102684 102684 140004 138475
Marginal Returns to Costs Ratio 0.25 0.35 0.35 0.35 0.07 0.07 0.35 0.35
Average Returns to Costs Ratio (Assumed 15% Return)
1.21 1.46 1.36 1.17 0.09 0.08 0.82 0.83
12 http://dx.doi.org/10.1787/888933446830

ANNEX C
180 TAXATION AND SkIllS © OECD 2017
Denmark
Table C.13. Comparing Financial Incentives for College Education with Different Financing Scenarios - Denmark
Single, No Children, 17 Year-Old, Four Years of Education, 70% of the Average Wage Currency: DKK
ScenarioNo
Borrowing
Direct Costs Borrowed,
Low Interest Rate
All Costs Borrowed,
Low Interest Rate
Direct Costs Borrowed,
High Interest Rate
All Costs Borrowed,
High Interest Rate
Non-Financing Education Costs
Direct Costs of Education 8917 8917 8917 8917 8917
Pre-Tax Scholarship Income 48682 48682 48682 48682 48682
Income Before Education 270520 270520 270520 270520 270520
Income During Education 145296 145296 145296 145296 145296
Pre-Tax Foregone Earnings 125223 125223 125223 125223 125223
AETR Before Education (%) 33.7 33.7 33.7 33.7 34.0
AETR During Education (Exclusive of Tax Expenditures) (%)
27.4 27.4 27.4 27.4 27.4
Value of Education Tax Credits % of Direct Costs
-4.7 -4.7 -4.7 -4.7 -4.7
AETR During Education (Inclusive of Tax Expenditures) (%)
26.1 26.1 26.1 26.1 26.1
METR on Foregone Earnings (%) 40.9 40.9 40.9 40.9 40.9
Total Annual Non-Financing Costs of Education (Direct Costs & Foregone Earnings)
32376 32376 32376 32376 32376
Education Financing Costs
Fraction of Costs Borrowed None Direct Costs All Costs Direct Costs All Costs
Total Amount Borrowed 0 8917 32376 8917 32376
Interest Rate (%) NA 0.0 0.0 6.0 6.0
Annual Repayments 0 758 2752 3032 11008
Debt Finance Multiplier 1.00 0.49 0.48 1.32 1.31
Returns to Education
Breakeven Earnings Level 282562 280864 276282 283637 286354
AETR After Education (%) 34.0 33.9 33.8 34.0 34.1
Breakeven Earnings Increment 12042 10344 5763 13118 15834
Breakeven Earnings Increment % of Previous Wage
4.5 3.8 2.1 4.8 5.9
METR Breakeven Earnings Increment (%) 40.9 40.9 40.9 40.9 40.9
Marginal Effective Tax Rate on Skills (%) -56.0 -73.7 -89.7 -49.5 -68.3
Average Effective Tax Rate on Skills (Assumed 15% Return, %)
40.5 41.4 44.6 39.4 32.8
Average Effective Tax Rate on Skills (Return based on Labour Market Premium, %)
26.8 29.1 37.7 23.7 5.7
Government Costs and Returns
Government Educational Costs 256274 260839 273156 253381 246078
Marginal Returns to Costs Ratio 0.09 0.10 0.17 0.08 0.07
Average Returns to Costs Ratio (Return based on Labour Market Premium)
0.59 0.58 0.55 0.59 0.61
12 http://dx.doi.org/10.1787/888933446846
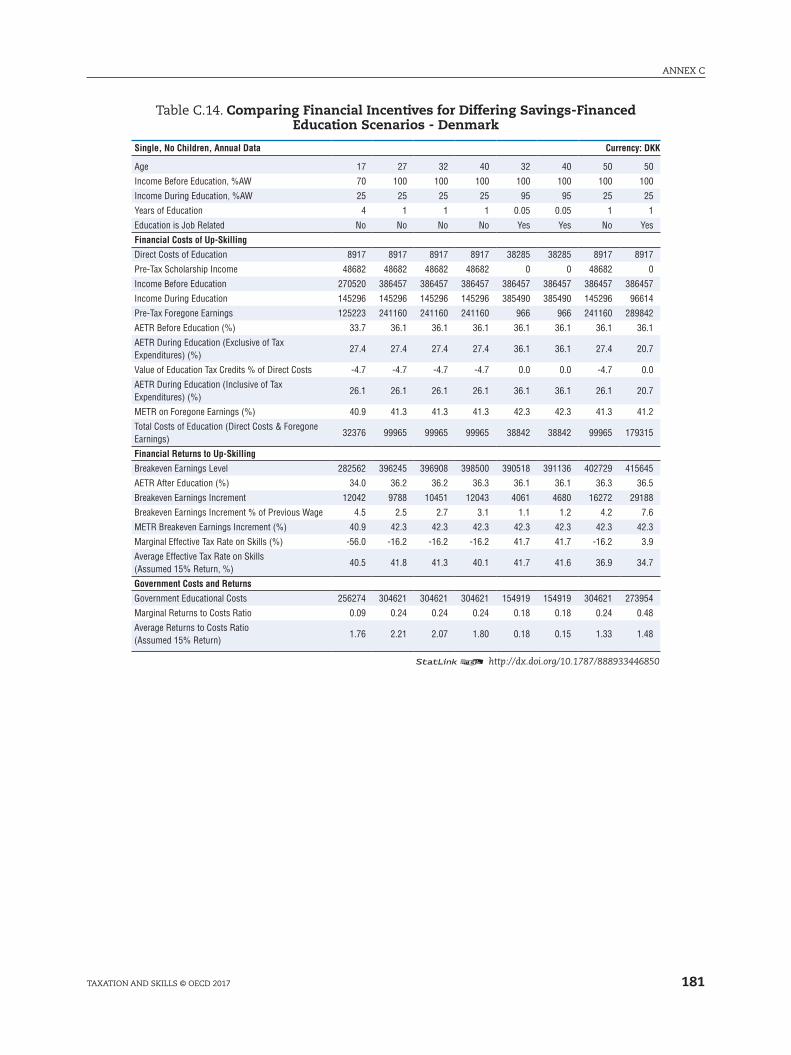
181
ANNEX C
TAXATION AND SkIllS © OECD 2017
Table C.14. Comparing Financial Incentives for Differing Savings-Financed Education Scenarios - Denmark
Single, No Children, Annual Data Currency: DKK
Age 17 27 32 40 32 40 50 50
Income Before Education, %AW 70 100 100 100 100 100 100 100
Income During Education, %AW 25 25 25 25 95 95 25 25
Years of Education 4 1 1 1 0.05 0.05 1 1
Education is Job Related No No No No Yes Yes No Yes
Financial Costs of Up-Skilling
Direct Costs of Education 8917 8917 8917 8917 38285 38285 8917 8917
Pre-Tax Scholarship Income 48682 48682 48682 48682 0 0 48682 0
Income Before Education 270520 386457 386457 386457 386457 386457 386457 386457
Income During Education 145296 145296 145296 145296 385490 385490 145296 96614
Pre-Tax Foregone Earnings 125223 241160 241160 241160 966 966 241160 289842
AETR Before Education (%) 33.7 36.1 36.1 36.1 36.1 36.1 36.1 36.1
AETR During Education (Exclusive of Tax Expenditures) (%)
27.4 27.4 27.4 27.4 36.1 36.1 27.4 20.7
Value of Education Tax Credits % of Direct Costs -4.7 -4.7 -4.7 -4.7 0.0 0.0 -4.7 0.0
AETR During Education (Inclusive of Tax Expenditures) (%)
26.1 26.1 26.1 26.1 36.1 36.1 26.1 20.7
METR on Foregone Earnings (%) 40.9 41.3 41.3 41.3 42.3 42.3 41.3 41.2
Total Costs of Education (Direct Costs & Foregone Earnings)
32376 99965 99965 99965 38842 38842 99965 179315
Financial Returns to Up-Skilling
Breakeven Earnings Level 282562 396245 396908 398500 390518 391136 402729 415645
AETR After Education (%) 34.0 36.2 36.2 36.3 36.1 36.1 36.3 36.5
Breakeven Earnings Increment 12042 9788 10451 12043 4061 4680 16272 29188
Breakeven Earnings Increment % of Previous Wage 4.5 2.5 2.7 3.1 1.1 1.2 4.2 7.6
METR Breakeven Earnings Increment (%) 40.9 42.3 42.3 42.3 42.3 42.3 42.3 42.3
Marginal Effective Tax Rate on Skills (%) -56.0 -16.2 -16.2 -16.2 41.7 41.7 -16.2 3.9
Average Effective Tax Rate on Skills (Assumed 15% Return, %)
40.5 41.8 41.3 40.1 41.7 41.6 36.9 34.7
Government Costs and Returns
Government Educational Costs 256274 304621 304621 304621 154919 154919 304621 273954
Marginal Returns to Costs Ratio 0.09 0.24 0.24 0.24 0.18 0.18 0.24 0.48
Average Returns to Costs Ratio (Assumed 15% Return)
1.76 2.21 2.07 1.80 0.18 0.15 1.33 1.48
12 http://dx.doi.org/10.1787/888933446850
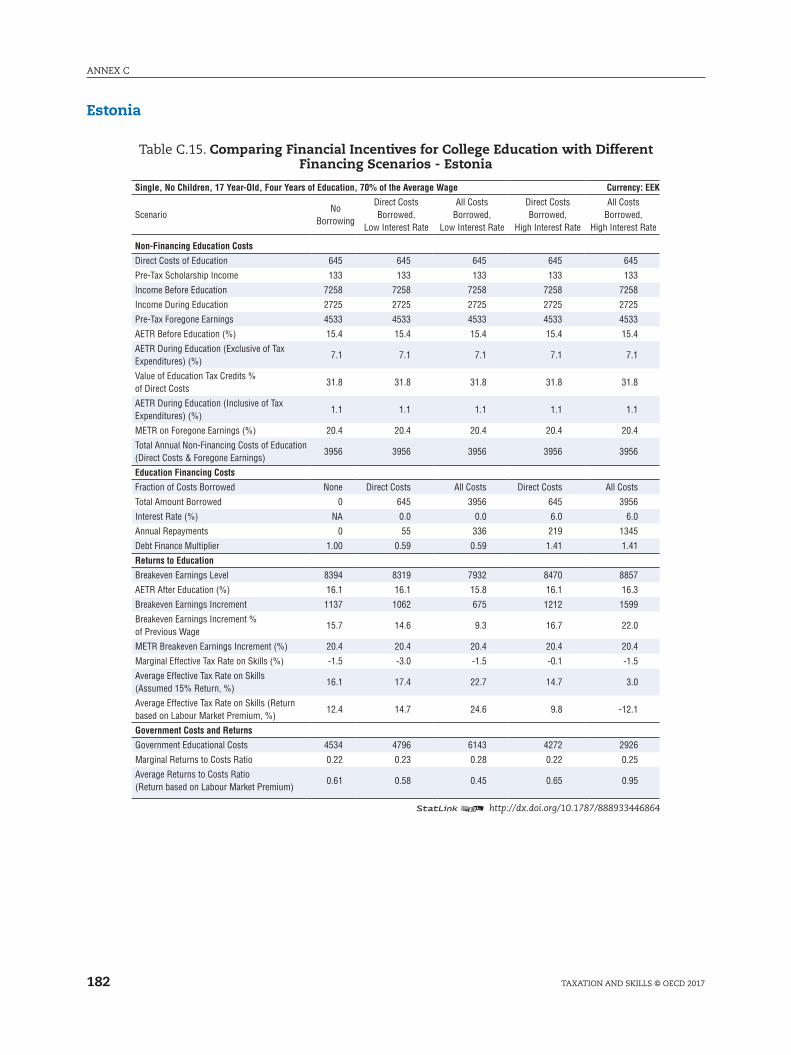
ANNEX C
182 TAXATION AND SkIllS © OECD 2017
Estonia
Table C.15. Comparing Financial Incentives for College Education with Different Financing Scenarios - Estonia
Single, No Children, 17 Year-Old, Four Years of Education, 70% of the Average Wage Currency: EEK
ScenarioNo
Borrowing
Direct Costs Borrowed,
Low Interest Rate
All Costs Borrowed,
Low Interest Rate
Direct Costs Borrowed,
High Interest Rate
All Costs Borrowed,
High Interest Rate
Non-Financing Education Costs
Direct Costs of Education 645 645 645 645 645
Pre-Tax Scholarship Income 133 133 133 133 133
Income Before Education 7258 7258 7258 7258 7258
Income During Education 2725 2725 2725 2725 2725
Pre-Tax Foregone Earnings 4533 4533 4533 4533 4533
AETR Before Education (%) 15.4 15.4 15.4 15.4 15.4
AETR During Education (Exclusive of Tax Expenditures) (%)
7.1 7.1 7.1 7.1 7.1
Value of Education Tax Credits % of Direct Costs
31.8 31.8 31.8 31.8 31.8
AETR During Education (Inclusive of Tax Expenditures) (%)
1.1 1.1 1.1 1.1 1.1
METR on Foregone Earnings (%) 20.4 20.4 20.4 20.4 20.4
Total Annual Non-Financing Costs of Education (Direct Costs & Foregone Earnings)
3956 3956 3956 3956 3956
Education Financing Costs
Fraction of Costs Borrowed None Direct Costs All Costs Direct Costs All Costs
Total Amount Borrowed 0 645 3956 645 3956
Interest Rate (%) NA 0.0 0.0 6.0 6.0
Annual Repayments 0 55 336 219 1345
Debt Finance Multiplier 1.00 0.59 0.59 1.41 1.41
Returns to Education
Breakeven Earnings Level 8394 8319 7932 8470 8857
AETR After Education (%) 16.1 16.1 15.8 16.1 16.3
Breakeven Earnings Increment 1137 1062 675 1212 1599
Breakeven Earnings Increment % of Previous Wage
15.7 14.6 9.3 16.7 22.0
METR Breakeven Earnings Increment (%) 20.4 20.4 20.4 20.4 20.4
Marginal Effective Tax Rate on Skills (%) -1.5 -3.0 -1.5 -0.1 -1.5
Average Effective Tax Rate on Skills (Assumed 15% Return, %)
16.1 17.4 22.7 14.7 3.0
Average Effective Tax Rate on Skills (Return based on Labour Market Premium, %)
12.4 14.7 24.6 9.8 -12.1
Government Costs and Returns
Government Educational Costs 4534 4796 6143 4272 2926
Marginal Returns to Costs Ratio 0.22 0.23 0.28 0.22 0.25
Average Returns to Costs Ratio (Return based on Labour Market Premium)
0.61 0.58 0.45 0.65 0.95
12 http://dx.doi.org/10.1787/888933446864
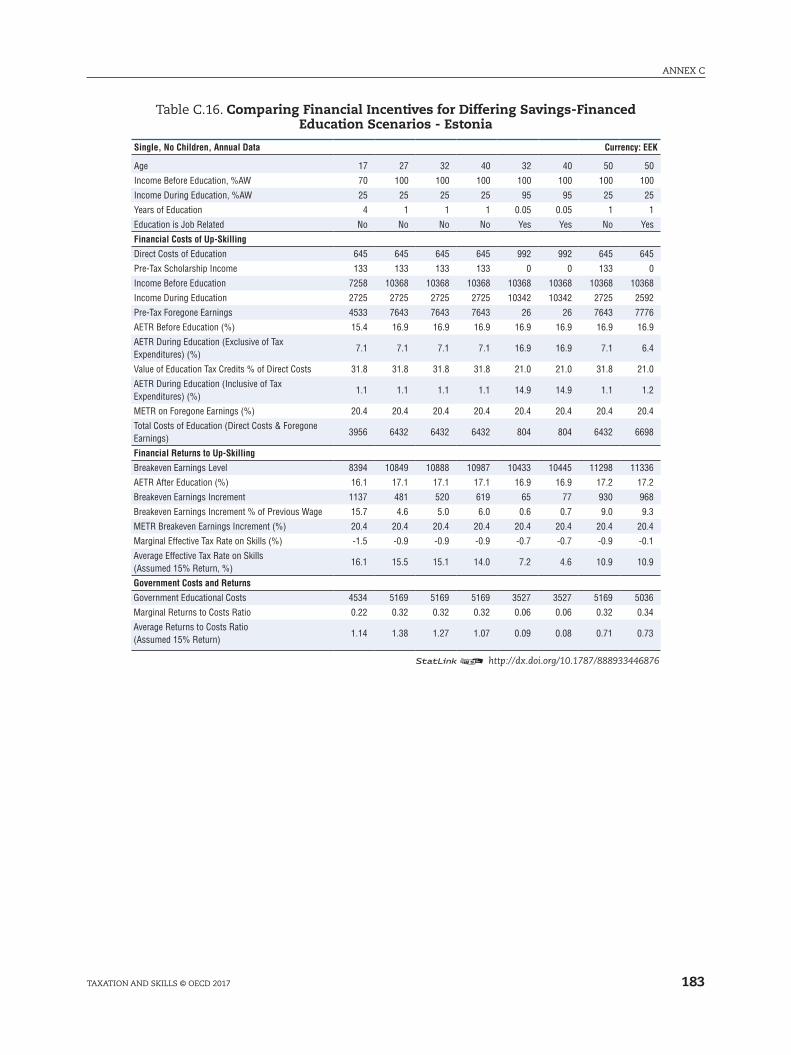
183
ANNEX C
TAXATION AND SkIllS © OECD 2017
Table C.16. Comparing Financial Incentives for Differing Savings-Financed Education Scenarios - Estonia
Single, No Children, Annual Data Currency: EEK
Age 17 27 32 40 32 40 50 50
Income Before Education, %AW 70 100 100 100 100 100 100 100
Income During Education, %AW 25 25 25 25 95 95 25 25
Years of Education 4 1 1 1 0.05 0.05 1 1
Education is Job Related No No No No Yes Yes No Yes
Financial Costs of Up-Skilling
Direct Costs of Education 645 645 645 645 992 992 645 645
Pre-Tax Scholarship Income 133 133 133 133 0 0 133 0
Income Before Education 7258 10368 10368 10368 10368 10368 10368 10368
Income During Education 2725 2725 2725 2725 10342 10342 2725 2592
Pre-Tax Foregone Earnings 4533 7643 7643 7643 26 26 7643 7776
AETR Before Education (%) 15.4 16.9 16.9 16.9 16.9 16.9 16.9 16.9
AETR During Education (Exclusive of Tax Expenditures) (%)
7.1 7.1 7.1 7.1 16.9 16.9 7.1 6.4
Value of Education Tax Credits % of Direct Costs 31.8 31.8 31.8 31.8 21.0 21.0 31.8 21.0
AETR During Education (Inclusive of Tax Expenditures) (%)
1.1 1.1 1.1 1.1 14.9 14.9 1.1 1.2
METR on Foregone Earnings (%) 20.4 20.4 20.4 20.4 20.4 20.4 20.4 20.4
Total Costs of Education (Direct Costs & Foregone Earnings)
3956 6432 6432 6432 804 804 6432 6698
Financial Returns to Up-Skilling
Breakeven Earnings Level 8394 10849 10888 10987 10433 10445 11298 11336
AETR After Education (%) 16.1 17.1 17.1 17.1 16.9 16.9 17.2 17.2
Breakeven Earnings Increment 1137 481 520 619 65 77 930 968
Breakeven Earnings Increment % of Previous Wage 15.7 4.6 5.0 6.0 0.6 0.7 9.0 9.3
METR Breakeven Earnings Increment (%) 20.4 20.4 20.4 20.4 20.4 20.4 20.4 20.4
Marginal Effective Tax Rate on Skills (%) -1.5 -0.9 -0.9 -0.9 -0.7 -0.7 -0.9 -0.1
Average Effective Tax Rate on Skills (Assumed 15% Return, %)
16.1 15.5 15.1 14.0 7.2 4.6 10.9 10.9
Government Costs and Returns
Government Educational Costs 4534 5169 5169 5169 3527 3527 5169 5036
Marginal Returns to Costs Ratio 0.22 0.32 0.32 0.32 0.06 0.06 0.32 0.34
Average Returns to Costs Ratio (Assumed 15% Return)
1.14 1.38 1.27 1.07 0.09 0.08 0.71 0.73
12 http://dx.doi.org/10.1787/888933446876
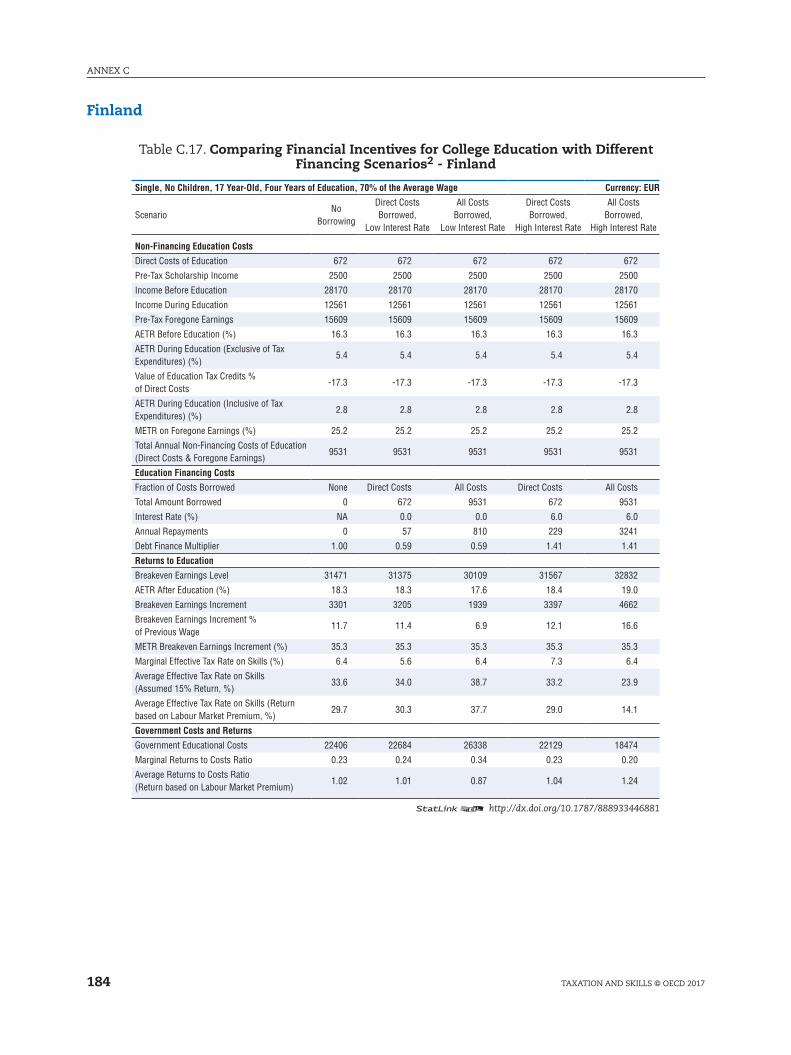
ANNEX C
184 TAXATION AND SkIllS © OECD 2017
Finland
Table C.17. Comparing Financial Incentives for College Education with Different Financing Scenarios2 - Finland
Single, No Children, 17 Year-Old, Four Years of Education, 70% of the Average Wage Currency: EUR
ScenarioNo
Borrowing
Direct Costs Borrowed,
Low Interest Rate
All Costs Borrowed,
Low Interest Rate
Direct Costs Borrowed,
High Interest Rate
All Costs Borrowed,
High Interest Rate
Non-Financing Education Costs
Direct Costs of Education 672 672 672 672 672
Pre-Tax Scholarship Income 2500 2500 2500 2500 2500
Income Before Education 28170 28170 28170 28170 28170
Income During Education 12561 12561 12561 12561 12561
Pre-Tax Foregone Earnings 15609 15609 15609 15609 15609
AETR Before Education (%) 16.3 16.3 16.3 16.3 16.3
AETR During Education (Exclusive of Tax Expenditures) (%)
5.4 5.4 5.4 5.4 5.4
Value of Education Tax Credits % of Direct Costs
-17.3 -17.3 -17.3 -17.3 -17.3
AETR During Education (Inclusive of Tax Expenditures) (%)
2.8 2.8 2.8 2.8 2.8
METR on Foregone Earnings (%) 25.2 25.2 25.2 25.2 25.2
Total Annual Non-Financing Costs of Education (Direct Costs & Foregone Earnings)
9531 9531 9531 9531 9531
Education Financing Costs
Fraction of Costs Borrowed None Direct Costs All Costs Direct Costs All Costs
Total Amount Borrowed 0 672 9531 672 9531
Interest Rate (%) NA 0.0 0.0 6.0 6.0
Annual Repayments 0 57 810 229 3241
Debt Finance Multiplier 1.00 0.59 0.59 1.41 1.41
Returns to Education
Breakeven Earnings Level 31471 31375 30109 31567 32832
AETR After Education (%) 18.3 18.3 17.6 18.4 19.0
Breakeven Earnings Increment 3301 3205 1939 3397 4662
Breakeven Earnings Increment % of Previous Wage
11.7 11.4 6.9 12.1 16.6
METR Breakeven Earnings Increment (%) 35.3 35.3 35.3 35.3 35.3
Marginal Effective Tax Rate on Skills (%) 6.4 5.6 6.4 7.3 6.4
Average Effective Tax Rate on Skills (Assumed 15% Return, %)
33.6 34.0 38.7 33.2 23.9
Average Effective Tax Rate on Skills (Return based on Labour Market Premium, %)
29.7 30.3 37.7 29.0 14.1
Government Costs and Returns
Government Educational Costs 22406 22684 26338 22129 18474
Marginal Returns to Costs Ratio 0.23 0.24 0.34 0.23 0.20
Average Returns to Costs Ratio (Return based on Labour Market Premium)
1.02 1.01 0.87 1.04 1.24
12 http://dx.doi.org/10.1787/888933446881

185
ANNEX C
TAXATION AND SkIllS © OECD 2017
Table C.18. Comparing Financial Incentives for Differing Savings-Financed Education Scenarios - Finland
Single, No Children, Annual Data Currency: EUR
Age 17 27 32 40 32 40 50 50
Income Before Education, %AW 70 100 100 100 100 100 100 100
Income During Education, %AW 25 25 25 25 95 95 25 25
Years of Education 4 1 1 1 0.05 0.05 1 1
Education is Job Related No No No No Yes Yes No Yes
Financial Costs of Up-Skilling
Direct Costs of Education 672 672 672 672 4144 4144 672 672
Pre-Tax Scholarship Income 2500 2500 2500 2500 0 0 2500 0
Income Before Education 28170 40243 40243 40243 40243 40243 40243 40243
Income During Education 12561 12561 12561 12561 40142 40142 12561 10061
Pre-Tax Foregone Earnings 15609 27682 27682 27682 101 101 27682 30182
AETR Before Education (%) 16.3 22.2 22.2 22.2 22.2 22.2 22.2 22.2
AETR During Education (Exclusive of Tax Expenditures) (%)
5.4 5.4 5.4 5.4 22.2 22.2 5.4 3.5
Value of Education Tax Credits % of Direct Costs -17.3 -17.3 -17.3 -17.3 17.5 17.5 -17.3 0.0
AETR During Education (Inclusive of Tax Expenditures) (%)
2.8 2.8 2.8 2.8 20.4 20.4 2.8 3.5
METR on Foregone Earnings (%) 25.2 29.9 29.9 29.9 36.5 36.5 29.9 28.5
Total Costs of Education (Direct Costs & Foregone Earnings)
9531 17265 17265 17265 3483 3483 17265 22265
Financial Returns to Up-Skilling
Breakeven Earnings Level 31471 41873 41997 42302 40584 40642 43175 44037
AETR After Education (%) 18.3 22.9 22.9 23.0 22.3 22.4 23.4 23.7
Breakeven Earnings Increment 3301 1630 1754 2059 341 399 2932 3794
Breakeven Earnings Increment % of Previous Wage 11.7 4.1 4.4 5.1 0.8 1.0 7.3 9.4
METR Breakeven Earnings Increment (%) 35.3 38.7 38.8 39.0 36.5 36.5 39.4 39.6
Marginal Effective Tax Rate on Skills (%) 6.4 8.2 8.3 8.7 22.6 22.6 9.2 16.3
Average Effective Tax Rate on Skills (Assumed 15% Return, %)
33.6 33.7 33.3 32.2 24.7 22.7 28.9 28.9
Government Costs and Returns
Government Educational Costs 22406 26746 26746 26746 16418 16418 26746 24246
Marginal Returns to Costs Ratio 0.23 0.41 0.41 0.41 0.12 0.12 0.42 0.60
Average Returns to Costs Ratio (Assumed 15% Return)
1.70 2.08 1.93 1.65 0.14 0.12 1.17 1.29
12 http://dx.doi.org/10.1787/888933446893

ANNEX C
186 TAXATION AND SkIllS © OECD 2017
Greece
Table C.19. Comparing Financial Incentives for College Education with Different Financing Scenarios - Greece
Single, No Children, 17 Year-Old, Four Years of Education, 70% of the Average Wage Currency: EUR
ScenarioNo
Borrowing
Direct Costs Borrowed,
Low Interest Rate
All Costs Borrowed,
Low Interest Rate
Direct Costs Borrowed,
High Interest Rate
All Costs Borrowed,
High Interest Rate
Non-Financing Education Costs
Direct Costs of Education 20 20 20 20 20
Pre-Tax Scholarship Income 6 6 6 6 6
Income Before Education 16374 16374 16374 16374 16374
Income During Education 5854 5854 5854 5854 5854
Pre-Tax Foregone Earnings 10519 10519 10519 10519 10519
AETR Before Education (%) 10.1 10.1 10.1 10.1 10.1
AETR During Education (Exclusive of Tax Expenditures) (%)
1.5 1.5 1.5 1.5 1.5
Value of Education Tax Credits % of Direct Costs
6.4 6.4 6.4 6.4 6.4
AETR During Education (Inclusive of Tax Expenditures) (%)
1.4 1.4 1.4 1.4 1.4
METR on Foregone Earnings (%) 14.9 14.9 14.9 14.9 14.9
Total Annual Non-Financing Costs of Education (Direct Costs & Foregone Earnings)
8967 8967 8967 8967 8967
Education Financing Costs
Fraction of Costs Borrowed None Direct Costs All Costs Direct Costs All Costs
Total Amount Borrowed 0 20 8967 20 8967
Interest Rate (%) NA 0.0 0.0 6.0 6.0
Annual Repayments 0 2 762 7 3049
Debt Finance Multiplier 1.00 0.60 0.60 1.40 1.40
Returns to Education
Breakeven Earnings Level 19233 19230 18099 19235 20367
AETR After Education (%) 12.4 12.4 11.6 12.4 13.2
Breakeven Earnings Increment 2859 2857 1725 2862 3993
Breakeven Earnings Increment % of Previous Wage
17.5 17.4 10.5 17.5 24.4
METR Breakeven Earnings Increment (%) 25.8 25.8 25.8 25.8 25.8
Marginal Effective Tax Rate on Skills (%) 12.9 12.9 12.9 12.9 12.9
Average Effective Tax Rate on Skills (Assumed 15% Return, %)
27.5 27.6 33.2 27.5 15.9
Average Effective Tax Rate on Skills (Return based on Labour Market Premium, %)
19.9 19.9 31.8 19.8 -4.7
Government Costs and Returns
Government Educational Costs 5682 5689 9238 5674 2125
Marginal Returns to Costs Ratio 0.55 0.55 0.56 0.55 1.05
Average Returns to Costs Ratio (Return based on Labour Market Premium)
1.19 1.19 0.73 1.20 3.19
12 http://dx.doi.org/10.1787/888933446900
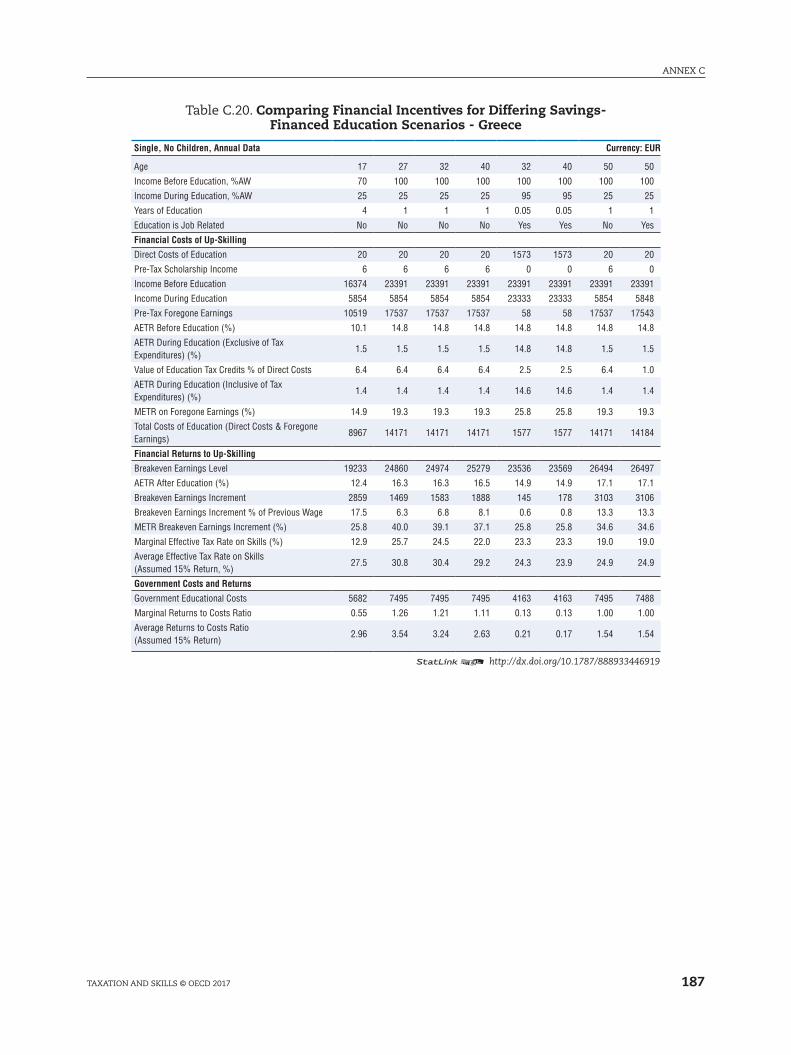
187
ANNEX C
TAXATION AND SkIllS © OECD 2017
Table C.20. Comparing Financial Incentives for Differing Savings-Financed Education Scenarios - Greece
Single, No Children, Annual Data Currency: EUR
Age 17 27 32 40 32 40 50 50
Income Before Education, %AW 70 100 100 100 100 100 100 100
Income During Education, %AW 25 25 25 25 95 95 25 25
Years of Education 4 1 1 1 0.05 0.05 1 1
Education is Job Related No No No No Yes Yes No Yes
Financial Costs of Up-Skilling
Direct Costs of Education 20 20 20 20 1573 1573 20 20
Pre-Tax Scholarship Income 6 6 6 6 0 0 6 0
Income Before Education 16374 23391 23391 23391 23391 23391 23391 23391
Income During Education 5854 5854 5854 5854 23333 23333 5854 5848
Pre-Tax Foregone Earnings 10519 17537 17537 17537 58 58 17537 17543
AETR Before Education (%) 10.1 14.8 14.8 14.8 14.8 14.8 14.8 14.8
AETR During Education (Exclusive of Tax Expenditures) (%)
1.5 1.5 1.5 1.5 14.8 14.8 1.5 1.5
Value of Education Tax Credits % of Direct Costs 6.4 6.4 6.4 6.4 2.5 2.5 6.4 1.0
AETR During Education (Inclusive of Tax Expenditures) (%)
1.4 1.4 1.4 1.4 14.6 14.6 1.4 1.4
METR on Foregone Earnings (%) 14.9 19.3 19.3 19.3 25.8 25.8 19.3 19.3
Total Costs of Education (Direct Costs & Foregone Earnings)
8967 14171 14171 14171 1577 1577 14171 14184
Financial Returns to Up-Skilling
Breakeven Earnings Level 19233 24860 24974 25279 23536 23569 26494 26497
AETR After Education (%) 12.4 16.3 16.3 16.5 14.9 14.9 17.1 17.1
Breakeven Earnings Increment 2859 1469 1583 1888 145 178 3103 3106
Breakeven Earnings Increment % of Previous Wage 17.5 6.3 6.8 8.1 0.6 0.8 13.3 13.3
METR Breakeven Earnings Increment (%) 25.8 40.0 39.1 37.1 25.8 25.8 34.6 34.6
Marginal Effective Tax Rate on Skills (%) 12.9 25.7 24.5 22.0 23.3 23.3 19.0 19.0
Average Effective Tax Rate on Skills (Assumed 15% Return, %)
27.5 30.8 30.4 29.2 24.3 23.9 24.9 24.9
Government Costs and Returns
Government Educational Costs 5682 7495 7495 7495 4163 4163 7495 7488
Marginal Returns to Costs Ratio 0.55 1.26 1.21 1.11 0.13 0.13 1.00 1.00
Average Returns to Costs Ratio (Assumed 15% Return)
2.96 3.54 3.24 2.63 0.21 0.17 1.54 1.54
12 http://dx.doi.org/10.1787/888933446919
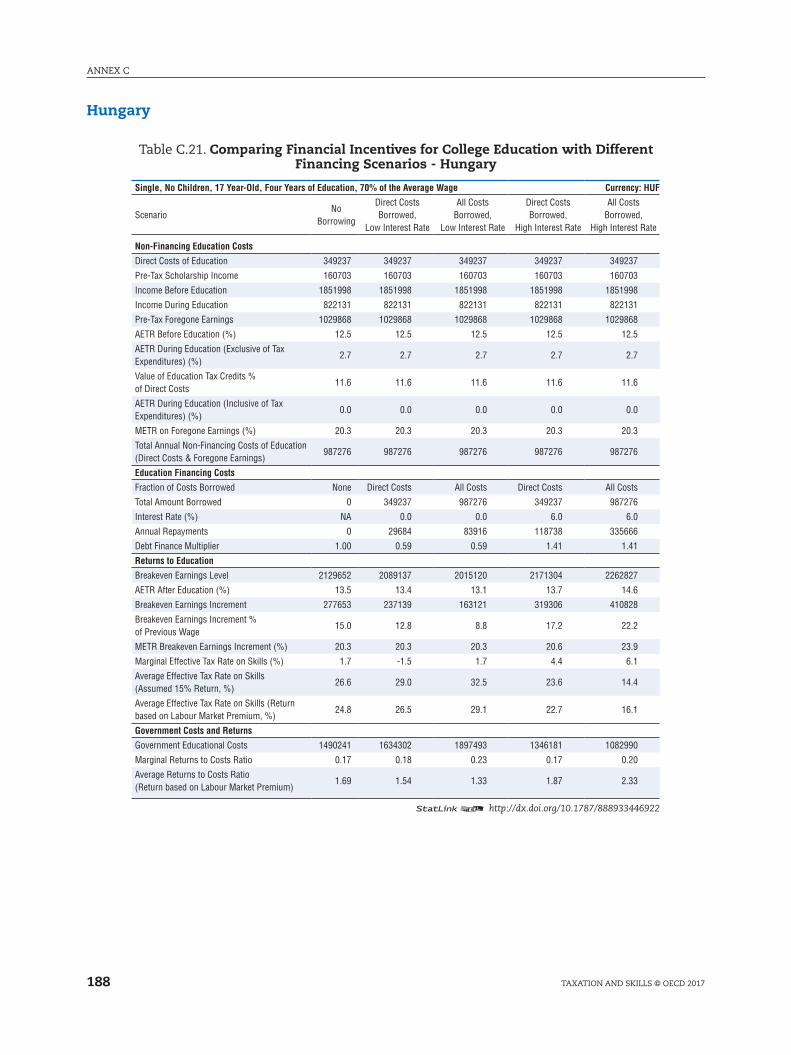
ANNEX C
188 TAXATION AND SkIllS © OECD 2017
Hungary
Table C.21. Comparing Financial Incentives for College Education with Different Financing Scenarios - Hungary
Single, No Children, 17 Year-Old, Four Years of Education, 70% of the Average Wage Currency: HUF
ScenarioNo
Borrowing
Direct Costs Borrowed,
Low Interest Rate
All Costs Borrowed,
Low Interest Rate
Direct Costs Borrowed,
High Interest Rate
All Costs Borrowed,
High Interest Rate
Non-Financing Education Costs
Direct Costs of Education 349237 349237 349237 349237 349237
Pre-Tax Scholarship Income 160703 160703 160703 160703 160703
Income Before Education 1851998 1851998 1851998 1851998 1851998
Income During Education 822131 822131 822131 822131 822131
Pre-Tax Foregone Earnings 1029868 1029868 1029868 1029868 1029868
AETR Before Education (%) 12.5 12.5 12.5 12.5 12.5
AETR During Education (Exclusive of Tax Expenditures) (%)
2.7 2.7 2.7 2.7 2.7
Value of Education Tax Credits % of Direct Costs
11.6 11.6 11.6 11.6 11.6
AETR During Education (Inclusive of Tax Expenditures) (%)
0.0 0.0 0.0 0.0 0.0
METR on Foregone Earnings (%) 20.3 20.3 20.3 20.3 20.3
Total Annual Non-Financing Costs of Education (Direct Costs & Foregone Earnings)
987276 987276 987276 987276 987276
Education Financing Costs
Fraction of Costs Borrowed None Direct Costs All Costs Direct Costs All Costs
Total Amount Borrowed 0 349237 987276 349237 987276
Interest Rate (%) NA 0.0 0.0 6.0 6.0
Annual Repayments 0 29684 83916 118738 335666
Debt Finance Multiplier 1.00 0.59 0.59 1.41 1.41
Returns to Education
Breakeven Earnings Level 2129652 2089137 2015120 2171304 2262827
AETR After Education (%) 13.5 13.4 13.1 13.7 14.6
Breakeven Earnings Increment 277653 237139 163121 319306 410828
Breakeven Earnings Increment % of Previous Wage
15.0 12.8 8.8 17.2 22.2
METR Breakeven Earnings Increment (%) 20.3 20.3 20.3 20.6 23.9
Marginal Effective Tax Rate on Skills (%) 1.7 -1.5 1.7 4.4 6.1
Average Effective Tax Rate on Skills (Assumed 15% Return, %)
26.6 29.0 32.5 23.6 14.4
Average Effective Tax Rate on Skills (Return based on Labour Market Premium, %)
24.8 26.5 29.1 22.7 16.1
Government Costs and Returns
Government Educational Costs 1490241 1634302 1897493 1346181 1082990
Marginal Returns to Costs Ratio 0.17 0.18 0.23 0.17 0.20
Average Returns to Costs Ratio (Return based on Labour Market Premium)
1.69 1.54 1.33 1.87 2.33
12 http://dx.doi.org/10.1787/888933446922
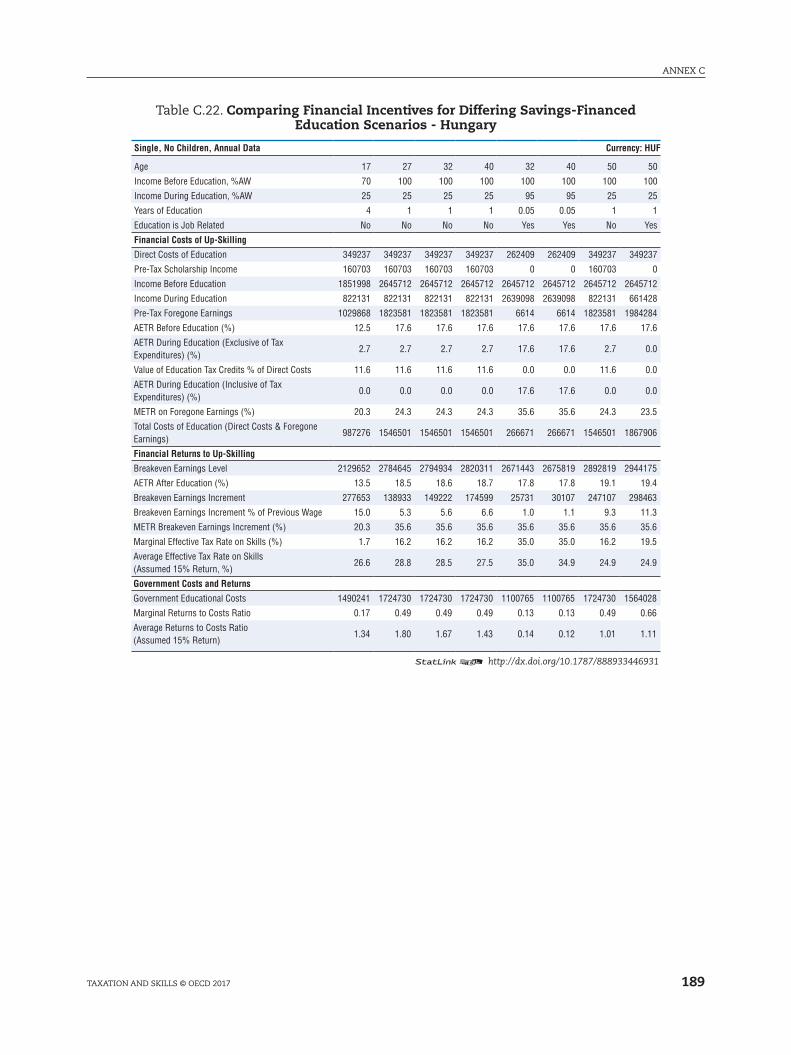
189
ANNEX C
TAXATION AND SkIllS © OECD 2017
Table C.22. Comparing Financial Incentives for Differing Savings-Financed Education Scenarios - Hungary
Single, No Children, Annual Data Currency: HUF
Age 17 27 32 40 32 40 50 50
Income Before Education, %AW 70 100 100 100 100 100 100 100
Income During Education, %AW 25 25 25 25 95 95 25 25
Years of Education 4 1 1 1 0.05 0.05 1 1
Education is Job Related No No No No Yes Yes No Yes
Financial Costs of Up-Skilling
Direct Costs of Education 349237 349237 349237 349237 262409 262409 349237 349237
Pre-Tax Scholarship Income 160703 160703 160703 160703 0 0 160703 0
Income Before Education 1851998 2645712 2645712 2645712 2645712 2645712 2645712 2645712
Income During Education 822131 822131 822131 822131 2639098 2639098 822131 661428
Pre-Tax Foregone Earnings 1029868 1823581 1823581 1823581 6614 6614 1823581 1984284
AETR Before Education (%) 12.5 17.6 17.6 17.6 17.6 17.6 17.6 17.6
AETR During Education (Exclusive of Tax Expenditures) (%)
2.7 2.7 2.7 2.7 17.6 17.6 2.7 0.0
Value of Education Tax Credits % of Direct Costs 11.6 11.6 11.6 11.6 0.0 0.0 11.6 0.0
AETR During Education (Inclusive of Tax Expenditures) (%)
0.0 0.0 0.0 0.0 17.6 17.6 0.0 0.0
METR on Foregone Earnings (%) 20.3 24.3 24.3 24.3 35.6 35.6 24.3 23.5
Total Costs of Education (Direct Costs & Foregone Earnings)
987276 1546501 1546501 1546501 266671 266671 1546501 1867906
Financial Returns to Up-Skilling
Breakeven Earnings Level 2129652 2784645 2794934 2820311 2671443 2675819 2892819 2944175
AETR After Education (%) 13.5 18.5 18.6 18.7 17.8 17.8 19.1 19.4
Breakeven Earnings Increment 277653 138933 149222 174599 25731 30107 247107 298463
Breakeven Earnings Increment % of Previous Wage 15.0 5.3 5.6 6.6 1.0 1.1 9.3 11.3
METR Breakeven Earnings Increment (%) 20.3 35.6 35.6 35.6 35.6 35.6 35.6 35.6
Marginal Effective Tax Rate on Skills (%) 1.7 16.2 16.2 16.2 35.0 35.0 16.2 19.5
Average Effective Tax Rate on Skills (Assumed 15% Return, %)
26.6 28.8 28.5 27.5 35.0 34.9 24.9 24.9
Government Costs and Returns
Government Educational Costs 1490241 1724730 1724730 1724730 1100765 1100765 1724730 1564028
Marginal Returns to Costs Ratio 0.17 0.49 0.49 0.49 0.13 0.13 0.49 0.66
Average Returns to Costs Ratio (Assumed 15% Return)
1.34 1.80 1.67 1.43 0.14 0.12 1.01 1.11
12 http://dx.doi.org/10.1787/888933446931

ANNEX C
190 TAXATION AND SkIllS © OECD 2017
Iceland
Table C.23. Comparing Financial Incentives for College Education with Different Financing Scenarios - Iceland
Single, No Children, 17 Year-Old, Four Years of Education, 70% of the Average Wage Currency: ISJ
ScenarioNo
Borrowing
Direct Costs Borrowed,
Low Interest Rate
All Costs Borrowed,
Low Interest Rate
Direct Costs Borrowed,
High Interest Rate
All Costs Borrowed,
High Interest Rate
Non-Financing Education Costs
Direct Costs of Education 100495 100495 100495 100495 100495
Pre-Tax Scholarship Income 0 0 0 0 0
Income Before Education 3939600 3939600 3939600 3939600 3939600
Income During Education 1407000 1407000 1407000 1407000 1407000
Pre-Tax Foregone Earnings 2532600 2532600 2532600 2532600 2532600
AETR Before Education (%) 23.3 23.3 23.3 23.3 23.3
AETR During Education (Exclusive of Tax Expenditures) (%)
0.0 0.0 0.0 0.0 0.0
Value of Education Tax Credits % of Direct Costs
0.0 0.0 0.0 0.0 0.0
AETR During Education (Inclusive of Tax Expenditures) (%)
0.0 0.0 0.0 0.0 0.0
METR on Foregone Earnings (%) 36.2 36.2 36.2 36.2 36.2
Total Annual Non-Financing Costs of Education (Direct Costs & Foregone Earnings)
1715684 1715684 1715684 1715684 1715684
Education Financing Costs
Fraction of Costs Borrowed None Direct Costs All Costs Direct Costs All Costs
Total Amount Borrowed 0 100495 1715684 100495 1715684
Interest Rate (%) NA 0.0 0.0 6.0 6.0
Annual Repayments 0 8542 145830 34167 583318
Debt Finance Multiplier 1.00 0.58 0.58 1.42 1.42
Returns to Education
Breakeven Earnings Level 4554037 4538987 4297091 4569088 4810984
AETR After Education (%) 25.4 25.3 24.6 25.4 26.1
Breakeven Earnings Increment 614437 599387 357491 629488 871384
Breakeven Earnings Increment % of Previous Wage
15.6 15.2 9.1 16.0 22.1
METR Breakeven Earnings Increment (%) 38.6 38.6 38.6 38.6 38.6
Marginal Effective Tax Rate on Skills (%) 5.8 4.9 5.8 6.6 5.8
Average Effective Tax Rate on Skills (Assumed 15% Return, %)
32.2 32.6 39.3 31.7 18.6
Average Effective Tax Rate on Skills (Return based on Labour Market Premium, %)
27.4 28.1 39.9 26.6 3.5
Government Costs and Returns
Government Educational Costs 1959509 2001534 2676976 1917484 1242041
Marginal Returns to Costs Ratio 0.55 0.55 0.69 0.55 0.61
Average Returns to Costs Ratio (Return based on Labour Market Premium)
1.61 1.57 1.18 1.64 2.54
12 http://dx.doi.org/10.1787/888933446943
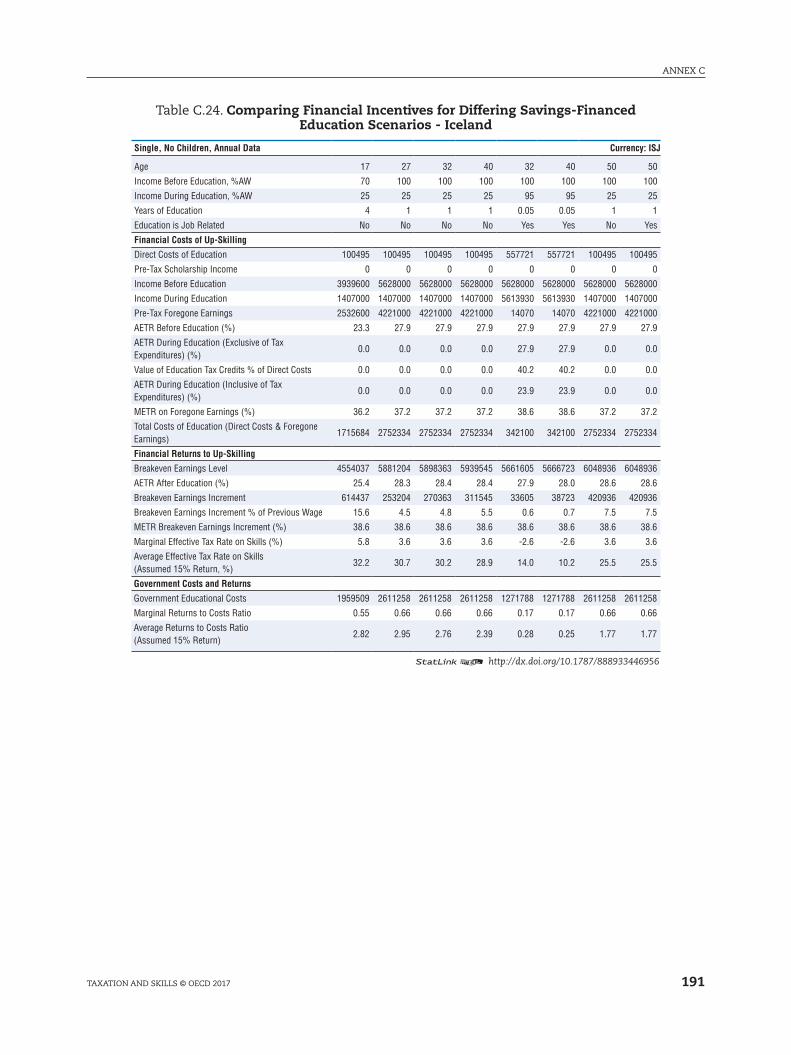
191
ANNEX C
TAXATION AND SkIllS © OECD 2017
Table C.24. Comparing Financial Incentives for Differing Savings-Financed Education Scenarios - Iceland
Single, No Children, Annual Data Currency: ISJ
Age 17 27 32 40 32 40 50 50
Income Before Education, %AW 70 100 100 100 100 100 100 100
Income During Education, %AW 25 25 25 25 95 95 25 25
Years of Education 4 1 1 1 0.05 0.05 1 1
Education is Job Related No No No No Yes Yes No Yes
Financial Costs of Up-Skilling
Direct Costs of Education 100495 100495 100495 100495 557721 557721 100495 100495
Pre-Tax Scholarship Income 0 0 0 0 0 0 0 0
Income Before Education 3939600 5628000 5628000 5628000 5628000 5628000 5628000 5628000
Income During Education 1407000 1407000 1407000 1407000 5613930 5613930 1407000 1407000
Pre-Tax Foregone Earnings 2532600 4221000 4221000 4221000 14070 14070 4221000 4221000
AETR Before Education (%) 23.3 27.9 27.9 27.9 27.9 27.9 27.9 27.9
AETR During Education (Exclusive of Tax Expenditures) (%)
0.0 0.0 0.0 0.0 27.9 27.9 0.0 0.0
Value of Education Tax Credits % of Direct Costs 0.0 0.0 0.0 0.0 40.2 40.2 0.0 0.0
AETR During Education (Inclusive of Tax Expenditures) (%)
0.0 0.0 0.0 0.0 23.9 23.9 0.0 0.0
METR on Foregone Earnings (%) 36.2 37.2 37.2 37.2 38.6 38.6 37.2 37.2
Total Costs of Education (Direct Costs & Foregone Earnings)
1715684 2752334 2752334 2752334 342100 342100 2752334 2752334
Financial Returns to Up-Skilling
Breakeven Earnings Level 4554037 5881204 5898363 5939545 5661605 5666723 6048936 6048936
AETR After Education (%) 25.4 28.3 28.4 28.4 27.9 28.0 28.6 28.6
Breakeven Earnings Increment 614437 253204 270363 311545 33605 38723 420936 420936
Breakeven Earnings Increment % of Previous Wage 15.6 4.5 4.8 5.5 0.6 0.7 7.5 7.5
METR Breakeven Earnings Increment (%) 38.6 38.6 38.6 38.6 38.6 38.6 38.6 38.6
Marginal Effective Tax Rate on Skills (%) 5.8 3.6 3.6 3.6 -2.6 -2.6 3.6 3.6
Average Effective Tax Rate on Skills (Assumed 15% Return, %)
32.2 30.7 30.2 28.9 14.0 10.2 25.5 25.5
Government Costs and Returns
Government Educational Costs 1959509 2611258 2611258 2611258 1271788 1271788 2611258 2611258
Marginal Returns to Costs Ratio 0.55 0.66 0.66 0.66 0.17 0.17 0.66 0.66
Average Returns to Costs Ratio (Assumed 15% Return)
2.82 2.95 2.76 2.39 0.28 0.25 1.77 1.77
12 http://dx.doi.org/10.1787/888933446956
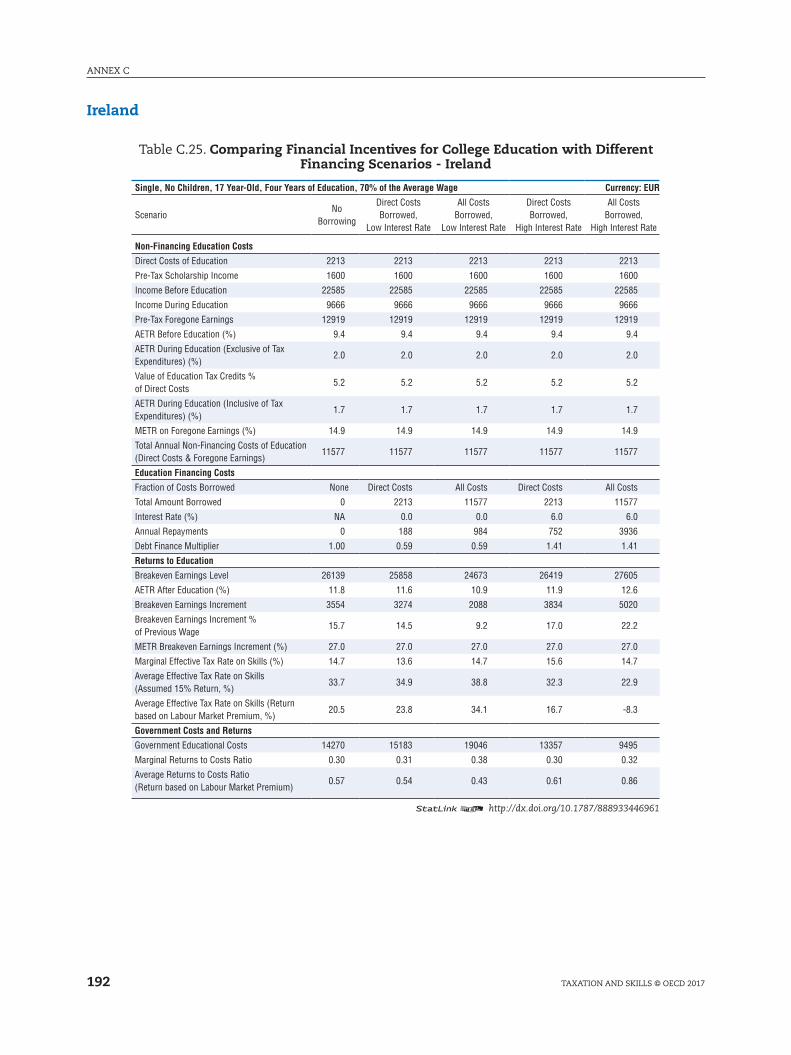
ANNEX C
192 TAXATION AND SkIllS © OECD 2017
Ireland
Table C.25. Comparing Financial Incentives for College Education with Different Financing Scenarios - Ireland
Single, No Children, 17 Year-Old, Four Years of Education, 70% of the Average Wage Currency: EUR
ScenarioNo
Borrowing
Direct Costs Borrowed,
Low Interest Rate
All Costs Borrowed,
Low Interest Rate
Direct Costs Borrowed,
High Interest Rate
All Costs Borrowed,
High Interest Rate
Non-Financing Education Costs
Direct Costs of Education 2213 2213 2213 2213 2213
Pre-Tax Scholarship Income 1600 1600 1600 1600 1600
Income Before Education 22585 22585 22585 22585 22585
Income During Education 9666 9666 9666 9666 9666
Pre-Tax Foregone Earnings 12919 12919 12919 12919 12919
AETR Before Education (%) 9.4 9.4 9.4 9.4 9.4
AETR During Education (Exclusive of Tax Expenditures) (%)
2.0 2.0 2.0 2.0 2.0
Value of Education Tax Credits % of Direct Costs
5.2 5.2 5.2 5.2 5.2
AETR During Education (Inclusive of Tax Expenditures) (%)
1.7 1.7 1.7 1.7 1.7
METR on Foregone Earnings (%) 14.9 14.9 14.9 14.9 14.9
Total Annual Non-Financing Costs of Education (Direct Costs & Foregone Earnings)
11577 11577 11577 11577 11577
Education Financing Costs
Fraction of Costs Borrowed None Direct Costs All Costs Direct Costs All Costs
Total Amount Borrowed 0 2213 11577 2213 11577
Interest Rate (%) NA 0.0 0.0 6.0 6.0
Annual Repayments 0 188 984 752 3936
Debt Finance Multiplier 1.00 0.59 0.59 1.41 1.41
Returns to Education
Breakeven Earnings Level 26139 25858 24673 26419 27605
AETR After Education (%) 11.8 11.6 10.9 11.9 12.6
Breakeven Earnings Increment 3554 3274 2088 3834 5020
Breakeven Earnings Increment % of Previous Wage
15.7 14.5 9.2 17.0 22.2
METR Breakeven Earnings Increment (%) 27.0 27.0 27.0 27.0 27.0
Marginal Effective Tax Rate on Skills (%) 14.7 13.6 14.7 15.6 14.7
Average Effective Tax Rate on Skills (Assumed 15% Return, %)
33.7 34.9 38.8 32.3 22.9
Average Effective Tax Rate on Skills (Return based on Labour Market Premium, %)
20.5 23.8 34.1 16.7 -8.3
Government Costs and Returns
Government Educational Costs 14270 15183 19046 13357 9495
Marginal Returns to Costs Ratio 0.30 0.31 0.38 0.30 0.32
Average Returns to Costs Ratio (Return based on Labour Market Premium)
0.57 0.54 0.43 0.61 0.86
12 http://dx.doi.org/10.1787/888933446961
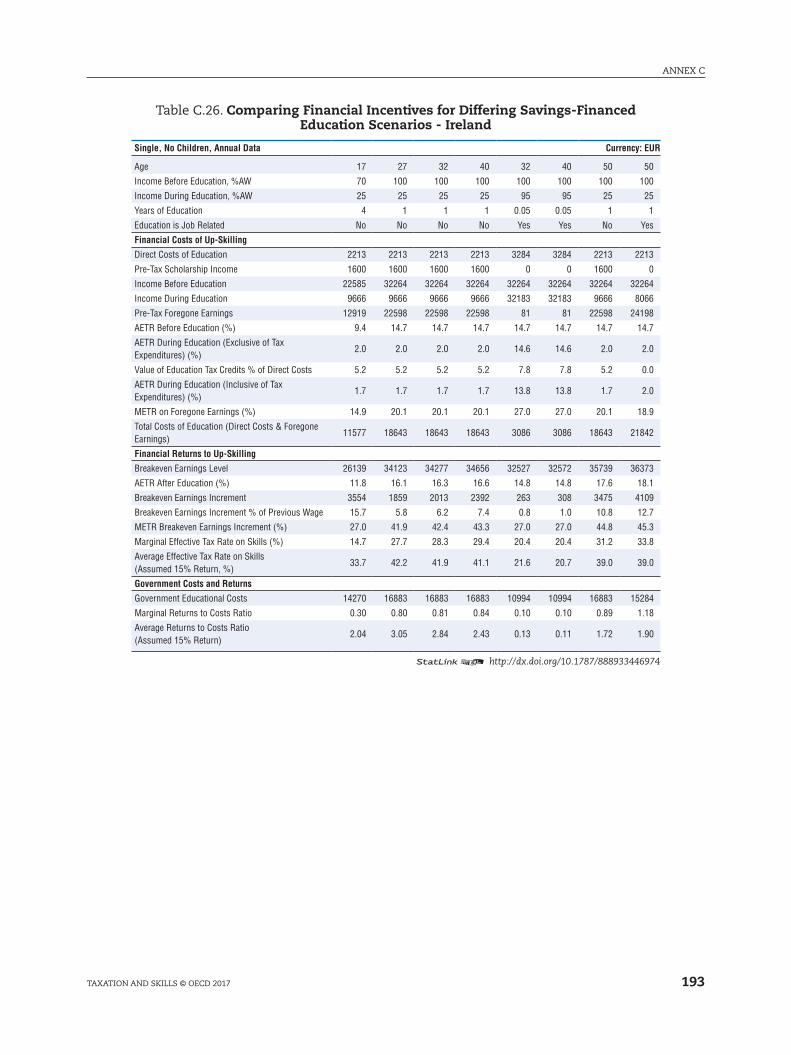
193
ANNEX C
TAXATION AND SkIllS © OECD 2017
Table C.26. Comparing Financial Incentives for Differing Savings-Financed Education Scenarios - Ireland
Single, No Children, Annual Data Currency: EUR
Age 17 27 32 40 32 40 50 50
Income Before Education, %AW 70 100 100 100 100 100 100 100
Income During Education, %AW 25 25 25 25 95 95 25 25
Years of Education 4 1 1 1 0.05 0.05 1 1
Education is Job Related No No No No Yes Yes No Yes
Financial Costs of Up-Skilling
Direct Costs of Education 2213 2213 2213 2213 3284 3284 2213 2213
Pre-Tax Scholarship Income 1600 1600 1600 1600 0 0 1600 0
Income Before Education 22585 32264 32264 32264 32264 32264 32264 32264
Income During Education 9666 9666 9666 9666 32183 32183 9666 8066
Pre-Tax Foregone Earnings 12919 22598 22598 22598 81 81 22598 24198
AETR Before Education (%) 9.4 14.7 14.7 14.7 14.7 14.7 14.7 14.7
AETR During Education (Exclusive of Tax Expenditures) (%)
2.0 2.0 2.0 2.0 14.6 14.6 2.0 2.0
Value of Education Tax Credits % of Direct Costs 5.2 5.2 5.2 5.2 7.8 7.8 5.2 0.0
AETR During Education (Inclusive of Tax Expenditures) (%)
1.7 1.7 1.7 1.7 13.8 13.8 1.7 2.0
METR on Foregone Earnings (%) 14.9 20.1 20.1 20.1 27.0 27.0 20.1 18.9
Total Costs of Education (Direct Costs & Foregone Earnings)
11577 18643 18643 18643 3086 3086 18643 21842
Financial Returns to Up-Skilling
Breakeven Earnings Level 26139 34123 34277 34656 32527 32572 35739 36373
AETR After Education (%) 11.8 16.1 16.3 16.6 14.8 14.8 17.6 18.1
Breakeven Earnings Increment 3554 1859 2013 2392 263 308 3475 4109
Breakeven Earnings Increment % of Previous Wage 15.7 5.8 6.2 7.4 0.8 1.0 10.8 12.7
METR Breakeven Earnings Increment (%) 27.0 41.9 42.4 43.3 27.0 27.0 44.8 45.3
Marginal Effective Tax Rate on Skills (%) 14.7 27.7 28.3 29.4 20.4 20.4 31.2 33.8
Average Effective Tax Rate on Skills (Assumed 15% Return, %)
33.7 42.2 41.9 41.1 21.6 20.7 39.0 39.0
Government Costs and Returns
Government Educational Costs 14270 16883 16883 16883 10994 10994 16883 15284
Marginal Returns to Costs Ratio 0.30 0.80 0.81 0.84 0.10 0.10 0.89 1.18
Average Returns to Costs Ratio (Assumed 15% Return)
2.04 3.05 2.84 2.43 0.13 0.11 1.72 1.90
12 http://dx.doi.org/10.1787/888933446974

ANNEX C
194 TAXATION AND SkIllS © OECD 2017
Israel
Table C.27. Comparing Financial Incentives for College Education with Different Financing Scenarios - Israel
Single, No Children, 17 Year-Old, Four Years of Education, 70% of the Average Wage Currency: ILS
ScenarioNo
Borrowing
Direct Costs Borrowed,
Low Interest Rate
All Costs Borrowed,
Low Interest Rate
Direct Costs Borrowed,
High Interest Rate
All Costs Borrowed,
High Interest Rate
Non-Financing Education Costs
Direct Costs of Education 14096 14096 14096 14096 14096
Pre-Tax Scholarship Income 2500 2500 2500 2500 2500
Income Before Education 87784 87784 87784 87784 87784
Income During Education 33851 33851 33851 33851 33851
Pre-Tax Foregone Earnings 53933 53933 53933 53933 53933
AETR Before Education (%) 4.8 4.8 4.8 4.8 4.8
AETR During Education (Exclusive of Tax Expenditures) (%)
0.0 0.0 0.0 0.0 0.0
Value of Education Tax Credits % of Direct Costs
0.0 0.0 0.0 0.0 0.0
AETR During Education (Inclusive of Tax Expenditures) (%)
0.0 0.0 0.0 0.0 0.0
METR on Foregone Earnings (%) 7.8 7.8 7.8 7.8 7.8
Total Annual Non-Financing Costs of Education (Direct Costs & Foregone Earnings)
61316 61316 61316 61316 61316
Education Financing Costs
Fraction of Costs Borrowed None Direct Costs All Costs Direct Costs All Costs
Total Amount Borrowed 0 14096 61316 14096 61316
Interest Rate (%) NA 0.0 0.0 6.0 6.0
Annual Repayments 0 1198 5212 4793 20847
Debt Finance Multiplier 1.00 0.58 0.58 1.42 1.42
Returns to Education
Breakeven Earnings Level 103461 101954 96905 105090 110729
AETR After Education (%) 6.2 6.1 5.7 6.4 7.3
Breakeven Earnings Increment 15677 14170 9121 17307 22946
Breakeven Earnings Increment % of Previous Wage
17.9 16.1 10.4 19.7 26.1
METR Breakeven Earnings Increment (%) 14.0 14.0 14.0 14.6 16.7
Marginal Effective Tax Rate on Skills (%) 8.1 7.5 8.1 9.3 10.9
Average Effective Tax Rate on Skills (Assumed 15% Return, %)
19.6 21.4 25.2 17.5 6.9
Average Effective Tax Rate on Skills (Return based on Labour Market Premium, %)
18.1 20.7 26.1 15.0 -0.3
Government Costs and Returns
Government Educational Costs 29046 34940 54687 23151 3404
Marginal Returns to Costs Ratio 0.34 0.32 0.31 0.41 2.54
Average Returns to Costs Ratio (Return based on Labour Market Premium)
1.52 1.26 0.81 1.90 12.95
Note: The statistical data for Israel are supplied by and under the responsibility of the relevant Israeli authorities. The use of such data by the OECD is without prejudice to the status of the Golan Heights, East Jerusalem and Israeli settlements in the West Bank under the terms of international law.
12 http://dx.doi.org/10.1787/888933446988
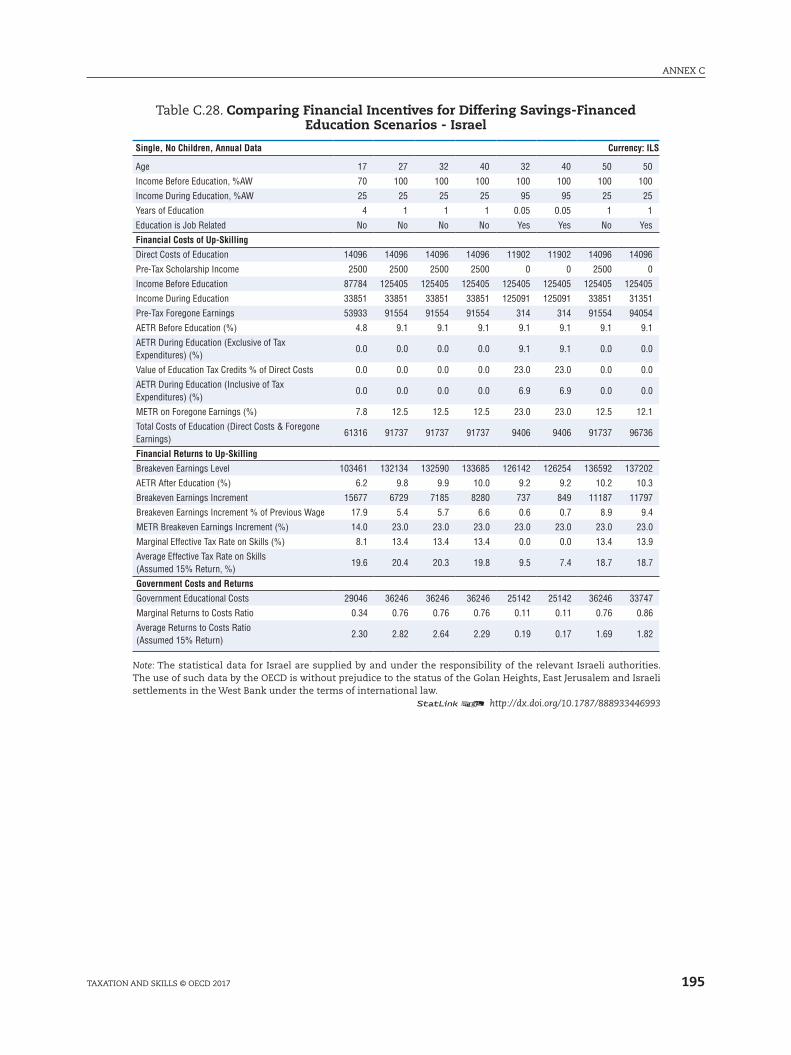
195
ANNEX C
TAXATION AND SkIllS © OECD 2017
Table C.28. Comparing Financial Incentives for Differing Savings-Financed Education Scenarios - Israel
Single, No Children, Annual Data Currency: ILS
Age 17 27 32 40 32 40 50 50
Income Before Education, %AW 70 100 100 100 100 100 100 100
Income During Education, %AW 25 25 25 25 95 95 25 25
Years of Education 4 1 1 1 0.05 0.05 1 1
Education is Job Related No No No No Yes Yes No Yes
Financial Costs of Up-Skilling
Direct Costs of Education 14096 14096 14096 14096 11902 11902 14096 14096
Pre-Tax Scholarship Income 2500 2500 2500 2500 0 0 2500 0
Income Before Education 87784 125405 125405 125405 125405 125405 125405 125405
Income During Education 33851 33851 33851 33851 125091 125091 33851 31351
Pre-Tax Foregone Earnings 53933 91554 91554 91554 314 314 91554 94054
AETR Before Education (%) 4.8 9.1 9.1 9.1 9.1 9.1 9.1 9.1
AETR During Education (Exclusive of Tax Expenditures) (%)
0.0 0.0 0.0 0.0 9.1 9.1 0.0 0.0
Value of Education Tax Credits % of Direct Costs 0.0 0.0 0.0 0.0 23.0 23.0 0.0 0.0
AETR During Education (Inclusive of Tax Expenditures) (%)
0.0 0.0 0.0 0.0 6.9 6.9 0.0 0.0
METR on Foregone Earnings (%) 7.8 12.5 12.5 12.5 23.0 23.0 12.5 12.1
Total Costs of Education (Direct Costs & Foregone Earnings)
61316 91737 91737 91737 9406 9406 91737 96736
Financial Returns to Up-Skilling
Breakeven Earnings Level 103461 132134 132590 133685 126142 126254 136592 137202
AETR After Education (%) 6.2 9.8 9.9 10.0 9.2 9.2 10.2 10.3
Breakeven Earnings Increment 15677 6729 7185 8280 737 849 11187 11797
Breakeven Earnings Increment % of Previous Wage 17.9 5.4 5.7 6.6 0.6 0.7 8.9 9.4
METR Breakeven Earnings Increment (%) 14.0 23.0 23.0 23.0 23.0 23.0 23.0 23.0
Marginal Effective Tax Rate on Skills (%) 8.1 13.4 13.4 13.4 0.0 0.0 13.4 13.9
Average Effective Tax Rate on Skills (Assumed 15% Return, %)
19.6 20.4 20.3 19.8 9.5 7.4 18.7 18.7
Government Costs and Returns
Government Educational Costs 29046 36246 36246 36246 25142 25142 36246 33747
Marginal Returns to Costs Ratio 0.34 0.76 0.76 0.76 0.11 0.11 0.76 0.86
Average Returns to Costs Ratio (Assumed 15% Return)
2.30 2.82 2.64 2.29 0.19 0.17 1.69 1.82
Note: The statistical data for Israel are supplied by and under the responsibility of the relevant Israeli authorities. The use of such data by the OECD is without prejudice to the status of the Golan Heights, East Jerusalem and Israeli settlements in the West Bank under the terms of international law.
12 http://dx.doi.org/10.1787/888933446993
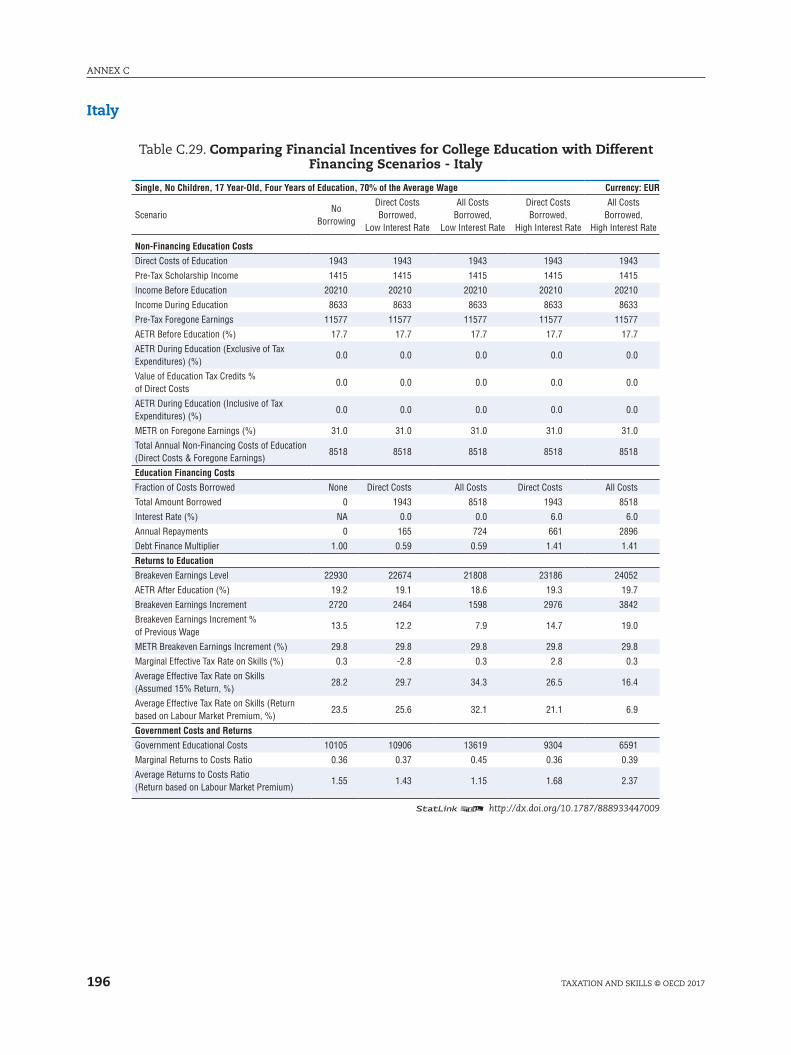
ANNEX C
196 TAXATION AND SkIllS © OECD 2017
Italy
Table C.29. Comparing Financial Incentives for College Education with Different Financing Scenarios - Italy
Single, No Children, 17 Year-Old, Four Years of Education, 70% of the Average Wage Currency: EUR
ScenarioNo
Borrowing
Direct Costs Borrowed,
Low Interest Rate
All Costs Borrowed,
Low Interest Rate
Direct Costs Borrowed,
High Interest Rate
All Costs Borrowed,
High Interest Rate
Non-Financing Education Costs
Direct Costs of Education 1943 1943 1943 1943 1943
Pre-Tax Scholarship Income 1415 1415 1415 1415 1415
Income Before Education 20210 20210 20210 20210 20210
Income During Education 8633 8633 8633 8633 8633
Pre-Tax Foregone Earnings 11577 11577 11577 11577 11577
AETR Before Education (%) 17.7 17.7 17.7 17.7 17.7
AETR During Education (Exclusive of Tax Expenditures) (%)
0.0 0.0 0.0 0.0 0.0
Value of Education Tax Credits % of Direct Costs
0.0 0.0 0.0 0.0 0.0
AETR During Education (Inclusive of Tax Expenditures) (%)
0.0 0.0 0.0 0.0 0.0
METR on Foregone Earnings (%) 31.0 31.0 31.0 31.0 31.0
Total Annual Non-Financing Costs of Education (Direct Costs & Foregone Earnings)
8518 8518 8518 8518 8518
Education Financing Costs
Fraction of Costs Borrowed None Direct Costs All Costs Direct Costs All Costs
Total Amount Borrowed 0 1943 8518 1943 8518
Interest Rate (%) NA 0.0 0.0 6.0 6.0
Annual Repayments 0 165 724 661 2896
Debt Finance Multiplier 1.00 0.59 0.59 1.41 1.41
Returns to Education
Breakeven Earnings Level 22930 22674 21808 23186 24052
AETR After Education (%) 19.2 19.1 18.6 19.3 19.7
Breakeven Earnings Increment 2720 2464 1598 2976 3842
Breakeven Earnings Increment % of Previous Wage
13.5 12.2 7.9 14.7 19.0
METR Breakeven Earnings Increment (%) 29.8 29.8 29.8 29.8 29.8
Marginal Effective Tax Rate on Skills (%) 0.3 -2.8 0.3 2.8 0.3
Average Effective Tax Rate on Skills (Assumed 15% Return, %)
28.2 29.7 34.3 26.5 16.4
Average Effective Tax Rate on Skills (Return based on Labour Market Premium, %)
23.5 25.6 32.1 21.1 6.9
Government Costs and Returns
Government Educational Costs 10105 10906 13619 9304 6591
Marginal Returns to Costs Ratio 0.36 0.37 0.45 0.36 0.39
Average Returns to Costs Ratio (Return based on Labour Market Premium)
1.55 1.43 1.15 1.68 2.37
12 http://dx.doi.org/10.1787/888933447009
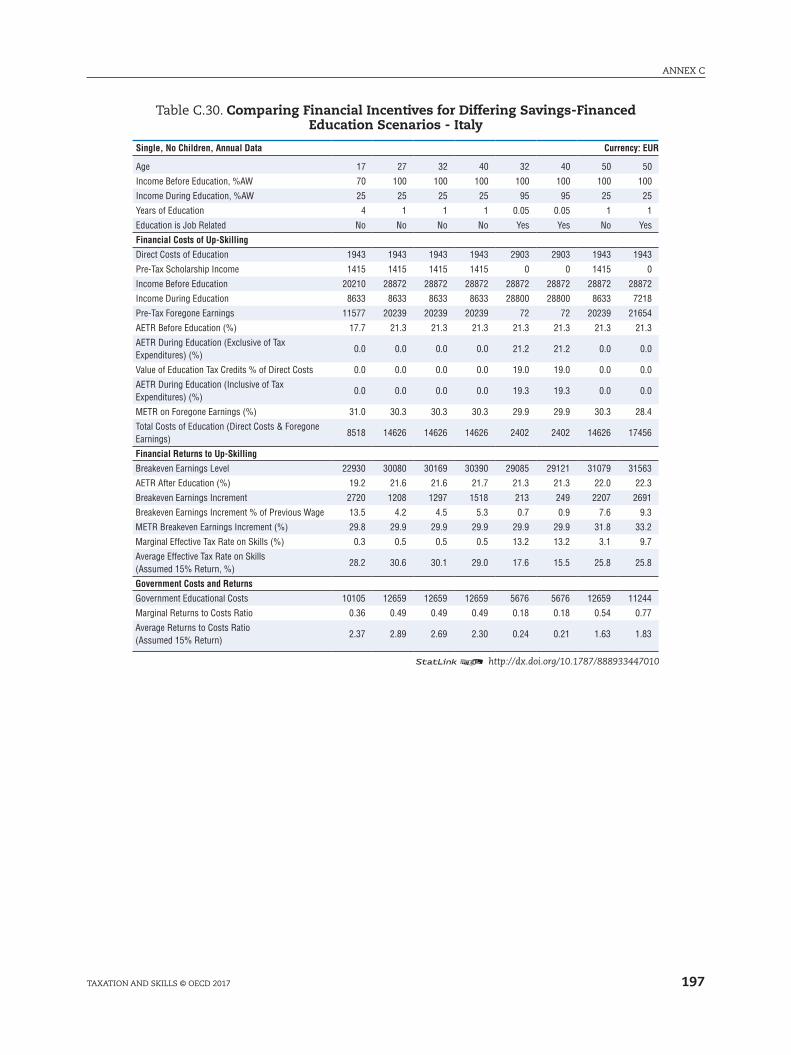
197
ANNEX C
TAXATION AND SkIllS © OECD 2017
Table C.30. Comparing Financial Incentives for Differing Savings-Financed Education Scenarios - Italy
Single, No Children, Annual Data Currency: EUR
Age 17 27 32 40 32 40 50 50
Income Before Education, %AW 70 100 100 100 100 100 100 100
Income During Education, %AW 25 25 25 25 95 95 25 25
Years of Education 4 1 1 1 0.05 0.05 1 1
Education is Job Related No No No No Yes Yes No Yes
Financial Costs of Up-Skilling
Direct Costs of Education 1943 1943 1943 1943 2903 2903 1943 1943
Pre-Tax Scholarship Income 1415 1415 1415 1415 0 0 1415 0
Income Before Education 20210 28872 28872 28872 28872 28872 28872 28872
Income During Education 8633 8633 8633 8633 28800 28800 8633 7218
Pre-Tax Foregone Earnings 11577 20239 20239 20239 72 72 20239 21654
AETR Before Education (%) 17.7 21.3 21.3 21.3 21.3 21.3 21.3 21.3
AETR During Education (Exclusive of Tax Expenditures) (%)
0.0 0.0 0.0 0.0 21.2 21.2 0.0 0.0
Value of Education Tax Credits % of Direct Costs 0.0 0.0 0.0 0.0 19.0 19.0 0.0 0.0
AETR During Education (Inclusive of Tax Expenditures) (%)
0.0 0.0 0.0 0.0 19.3 19.3 0.0 0.0
METR on Foregone Earnings (%) 31.0 30.3 30.3 30.3 29.9 29.9 30.3 28.4
Total Costs of Education (Direct Costs & Foregone Earnings)
8518 14626 14626 14626 2402 2402 14626 17456
Financial Returns to Up-Skilling
Breakeven Earnings Level 22930 30080 30169 30390 29085 29121 31079 31563
AETR After Education (%) 19.2 21.6 21.6 21.7 21.3 21.3 22.0 22.3
Breakeven Earnings Increment 2720 1208 1297 1518 213 249 2207 2691
Breakeven Earnings Increment % of Previous Wage 13.5 4.2 4.5 5.3 0.7 0.9 7.6 9.3
METR Breakeven Earnings Increment (%) 29.8 29.9 29.9 29.9 29.9 29.9 31.8 33.2
Marginal Effective Tax Rate on Skills (%) 0.3 0.5 0.5 0.5 13.2 13.2 3.1 9.7
Average Effective Tax Rate on Skills (Assumed 15% Return, %)
28.2 30.6 30.1 29.0 17.6 15.5 25.8 25.8
Government Costs and Returns
Government Educational Costs 10105 12659 12659 12659 5676 5676 12659 11244
Marginal Returns to Costs Ratio 0.36 0.49 0.49 0.49 0.18 0.18 0.54 0.77
Average Returns to Costs Ratio (Assumed 15% Return)
2.37 2.89 2.69 2.30 0.24 0.21 1.63 1.83
12 http://dx.doi.org/10.1787/888933447010
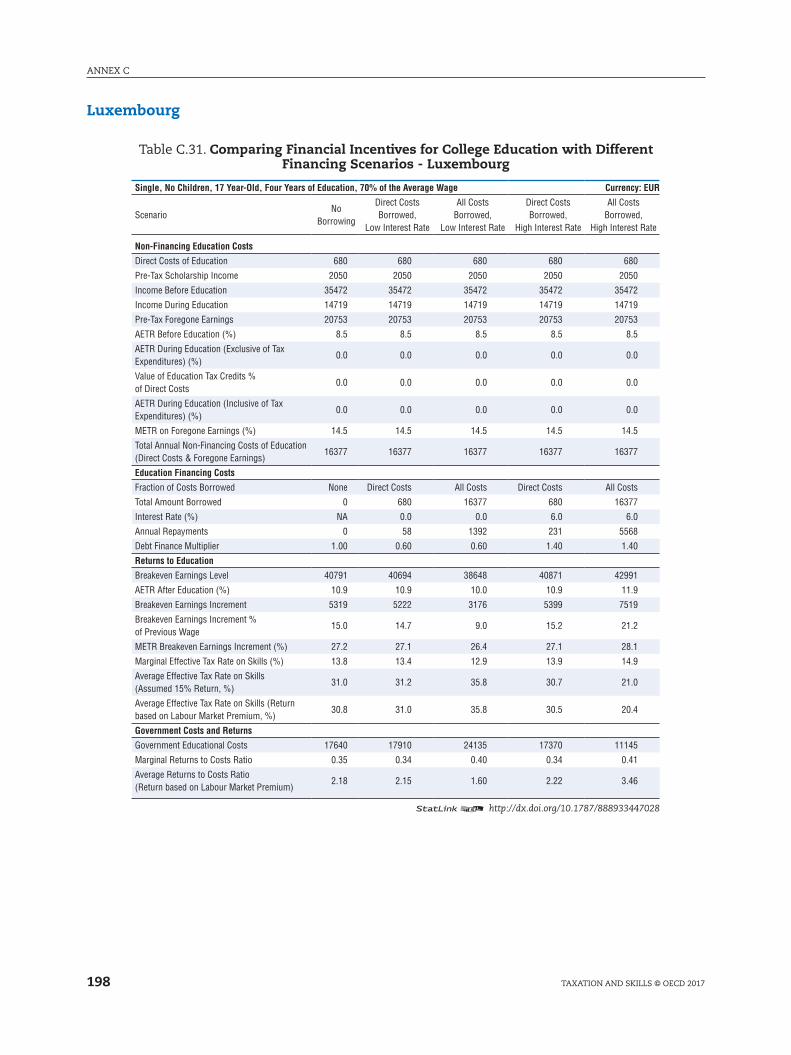
ANNEX C
198 TAXATION AND SkIllS © OECD 2017
Luxembourg
Table C.31. Comparing Financial Incentives for College Education with Different Financing Scenarios - Luxembourg
Single, No Children, 17 Year-Old, Four Years of Education, 70% of the Average Wage Currency: EUR
ScenarioNo
Borrowing
Direct Costs Borrowed,
Low Interest Rate
All Costs Borrowed,
Low Interest Rate
Direct Costs Borrowed,
High Interest Rate
All Costs Borrowed,
High Interest Rate
Non-Financing Education Costs
Direct Costs of Education 680 680 680 680 680
Pre-Tax Scholarship Income 2050 2050 2050 2050 2050
Income Before Education 35472 35472 35472 35472 35472
Income During Education 14719 14719 14719 14719 14719
Pre-Tax Foregone Earnings 20753 20753 20753 20753 20753
AETR Before Education (%) 8.5 8.5 8.5 8.5 8.5
AETR During Education (Exclusive of Tax Expenditures) (%)
0.0 0.0 0.0 0.0 0.0
Value of Education Tax Credits % of Direct Costs
0.0 0.0 0.0 0.0 0.0
AETR During Education (Inclusive of Tax Expenditures) (%)
0.0 0.0 0.0 0.0 0.0
METR on Foregone Earnings (%) 14.5 14.5 14.5 14.5 14.5
Total Annual Non-Financing Costs of Education (Direct Costs & Foregone Earnings)
16377 16377 16377 16377 16377
Education Financing Costs
Fraction of Costs Borrowed None Direct Costs All Costs Direct Costs All Costs
Total Amount Borrowed 0 680 16377 680 16377
Interest Rate (%) NA 0.0 0.0 6.0 6.0
Annual Repayments 0 58 1392 231 5568
Debt Finance Multiplier 1.00 0.60 0.60 1.40 1.40
Returns to Education
Breakeven Earnings Level 40791 40694 38648 40871 42991
AETR After Education (%) 10.9 10.9 10.0 10.9 11.9
Breakeven Earnings Increment 5319 5222 3176 5399 7519
Breakeven Earnings Increment % of Previous Wage
15.0 14.7 9.0 15.2 21.2
METR Breakeven Earnings Increment (%) 27.2 27.1 26.4 27.1 28.1
Marginal Effective Tax Rate on Skills (%) 13.8 13.4 12.9 13.9 14.9
Average Effective Tax Rate on Skills (Assumed 15% Return, %)
31.0 31.2 35.8 30.7 21.0
Average Effective Tax Rate on Skills (Return based on Labour Market Premium, %)
30.8 31.0 35.8 30.5 20.4
Government Costs and Returns
Government Educational Costs 17640 17910 24135 17370 11145
Marginal Returns to Costs Ratio 0.35 0.34 0.40 0.34 0.41
Average Returns to Costs Ratio (Return based on Labour Market Premium)
2.18 2.15 1.60 2.22 3.46
12 http://dx.doi.org/10.1787/888933447028

199
ANNEX C
TAXATION AND SkIllS © OECD 2017
Table C.32. Comparing Financial Incentives for Differing Savings-Financed Education Scenarios - Luxembourg
Single, No Children, Annual Data Currency: EUR
Age 17 27 32 40 32 40 50 50
Income Before Education, %AW 70 100 100 100 100 100 100 100
Income During Education, %AW 25 25 25 25 95 95 25 25
Years of Education 4 1 1 1 0.05 0.05 1 1
Education is Job Related No No No No Yes Yes No Yes
Financial Costs of Up-Skilling
Direct Costs of Education 680 680 680 680 4989 4989 680 680
Pre-Tax Scholarship Income 2050 2050 2050 2050 0 0 2050 0
Income Before Education 35472 50674 50674 50674 50674 50674 50674 50674
Income During Education 14719 14719 14719 14719 50548 50548 14719 12669
Pre-Tax Foregone Earnings 20753 35956 35956 35956 127 127 35956 38006
AETR Before Education (%) 8.5 15.3 15.3 15.3 15.3 15.3 15.3 15.3
AETR During Education (Exclusive of Tax Expenditures) (%)
0.0 0.0 0.0 0.0 15.2 15.2 0.0 0.0
Value of Education Tax Credits % of Direct Costs 0.0 0.0 0.0 0.0 39.0 39.0 0.0 0.0
AETR During Education (Inclusive of Tax Expenditures) (%)
0.0 0.0 0.0 0.0 11.4 11.4 0.0 0.0
METR on Foregone Earnings (%) 14.5 21.6 21.6 21.6 48.0 48.0 21.6 20.4
Total Costs of Education (Direct Costs & Foregone Earnings)
16377 26830 26830 26830 3109 3109 26830 30931
Financial Returns to Up-Skilling
Breakeven Earnings Level 40791 53275 53514 54182 51008 51077 56688 57578
AETR After Education (%) 10.9 16.3 16.4 16.6 15.4 15.5 17.5 17.8
Breakeven Earnings Increment 5319 2601 2840 3508 333 403 6013 6904
Breakeven Earnings Increment % of Previous Wage 15.0 5.1 5.6 6.9 0.7 0.8 11.9 13.6
METR Breakeven Earnings Increment (%) 27.2 35.9 35.7 35.8 36.5 35.3 36.1 36.1
Marginal Effective Tax Rate on Skills (%) 13.8 17.3 17.1 17.3 -4.5 -6.6 17.6 19.7
Average Effective Tax Rate on Skills (Assumed 15% Return, %)
31.0 31.3 30.8 29.6 9.1 2.8 25.1 25.1
Government Costs and Returns
Government Educational Costs 17640 22388 22388 22388 14590 14590 22388 20338
Marginal Returns to Costs Ratio 0.35 0.67 0.67 0.67 0.12 0.12 0.68 0.86
Average Returns to Costs Ratio (Assumed 15% Return)
2.28 2.62 2.40 1.94 0.18 0.15 1.14 1.25
12 http://dx.doi.org/10.1787/888933447038

ANNEX C
200 TAXATION AND SkIllS © OECD 2017
Mexico
Table C.33. Comparing Financial Incentives for College Education with Different Financing Scenarios - Mexico
Single, No Children, 17 Year-Old, Four Years of Education, 70% of the Average Wage Currency: MXN
ScenarioNo
Borrowing
Direct Costs Borrowed,
Low Interest Rate
All Costs Borrowed,
Low Interest Rate
Direct Costs Borrowed,
High Interest Rate
All Costs Borrowed,
High Interest Rate
Non-Financing Education Costs
Direct Costs of Education 19719 19719 19719 19719 19719
Pre-Tax Scholarship Income 2458 2458 2458 2458 2458
Income Before Education 63710 63710 63710 63710 63710
Income During Education 25211 25211 25211 25211 25211
Pre-Tax Foregone Earnings 38499 38499 38499 38499 38499
AETR Before Education (%) 0.4 0.4 0.4 0.4 0.4
AETR During Education (Exclusive of Tax Expenditures) (%)
-14.3 -14.3 -14.3 -14.3 -14.3
Value of Education Tax Credits % of Direct Costs
6.9 6.9 6.9 6.9 6.9
AETR During Education (Inclusive of Tax Expenditures) (%)
-19.0 -19.0 -19.0 -19.0 -19.0
METR on Foregone Earnings (%) 10.1 10.1 10.1 10.1 10.1
Total Annual Non-Financing Costs of Education (Direct Costs & Foregone Earnings)
50680 50680 50680 50680 50680
Education Financing Costs
Fraction of Costs Borrowed None Direct Costs All Costs Direct Costs All Costs
Total Amount Borrowed 0 19719 50680 19719 50680
Interest Rate (%) NA 0.0 0.0 6.0 6.0
Annual Repayments 0 1676 4308 6704 17231
Debt Finance Multiplier 1.00 0.59 0.59 1.41 1.41
Returns to Education
Breakeven Earnings Level 77407 74809 71600 79451 82661
AETR After Education (%) 3.4 2.5 2.1 3.6 3.9
Breakeven Earnings Increment 13697 11099 7890 15741 18951
Breakeven Earnings Increment % of Previous Wage
21.5 17.4 12.4 24.7 29.7
METR Breakeven Earnings Increment (%) 17.1 14.1 15.4 16.3 15.4
Marginal Effective Tax Rate on Skills (%) 8.8 3.8 7.0 9.0 6.9
Average Effective Tax Rate on Skills (Assumed 15% Return, %)
19.0 22.3 25.8 14.5 3.8
Average Effective Tax Rate on Skills (Return based on Labour Market Premium, %)
18.9 21.5 24.2 15.5 7.3
Government Costs and Returns
Government Educational Costs 48133 56267 69039 39999 27227
Marginal Returns to Costs Ratio 0.22 0.18 0.23 0.21 0.24
Average Returns to Costs Ratio (Return based on Labour Market Premium)
1.28 1.09 0.89 1.54 2.26
12 http://dx.doi.org/10.1787/888933447044

201
ANNEX C
TAXATION AND SkIllS © OECD 2017
Table C.34. Comparing Financial Incentives for Differing Savings-Financed Education Scenarios - Mexico
Single, No Children, Annual Data Currency: MXN
Age 17 27 32 40 32 40 50 50
Income Before Education, %AW 70 100 100 100 100 100 100 100
Income During Education, %AW 25 25 25 25 95 95 25 25
Years of Education 4 1 1 1 0.05 0.05 1 1
Education is Job Related No No No No Yes Yes No Yes
Financial Costs of Up-Skilling
Direct Costs of Education 19719 19719 19719 19719 8994 8994 19719 19719
Pre-Tax Scholarship Income 2458 2458 2458 2458 0 0 2458 0
Income Before Education 63710 91014 91014 91014 91014 91014 91014 91014
Income During Education 25211 25211 25211 25211 90787 90787 25211 22754
Pre-Tax Foregone Earnings 38499 65803 65803 65803 228 228 65803 68261
AETR Before Education (%) 0.4 7.9 7.9 7.9 7.9 7.9 7.9 7.9
AETR During Education (Exclusive of Tax Expenditures) (%)
-14.3 -14.3 -14.3 -14.3 7.8 7.8 -14.3 -16.5
Value of Education Tax Credits % of Direct Costs 6.9 6.9 6.9 6.9 44.7 44.7 6.9 5.3
AETR During Education (Inclusive of Tax Expenditures) (%)
-19.0 -19.0 -19.0 -19.0 3.4 3.4 -19.0 -21.1
METR on Foregone Earnings (%) 10.1 16.3 16.3 16.3 13.5 13.5 16.3 16.0
Total Costs of Education (Direct Costs & Foregone Earnings)
50680 71122 71122 71122 5170 5170 71122 76037
Financial Returns to Up-Skilling
Breakeven Earnings Level 77407 95912 96275 97169 91397 91462 99725 100328
AETR After Education (%) 3.4 8.3 8.3 8.4 7.9 7.9 8.6 8.6
Breakeven Earnings Increment 13697 4898 5260 6155 382 447 8711 9313
Breakeven Earnings Increment % of Previous Wage 21.5 5.4 5.8 6.8 0.4 0.5 9.6 10.2
METR Breakeven Earnings Increment (%) 17.1 15.9 15.9 15.9 15.9 15.9 15.9 15.9
Marginal Effective Tax Rate on Skills (%) 8.8 1.8 1.8 1.8 -49.9 -49.9 1.8 2.7
Average Effective Tax Rate on Skills (Assumed 15% Return, %)
19.0 12.5 12.3 11.6 -11.7 -16.5 9.6 9.6
Government Costs and Returns
Government Educational Costs 48133 54996 54996 54996 44647 44647 54996 52538
Marginal Returns to Costs Ratio 0.22 0.25 0.25 0.25 0.02 0.02 0.25 0.27
Average Returns to Costs Ratio (Assumed 15% Return)
1.00 0.93 0.87 0.74 0.05 0.04 0.53 0.55
12 http://dx.doi.org/10.1787/888933447057
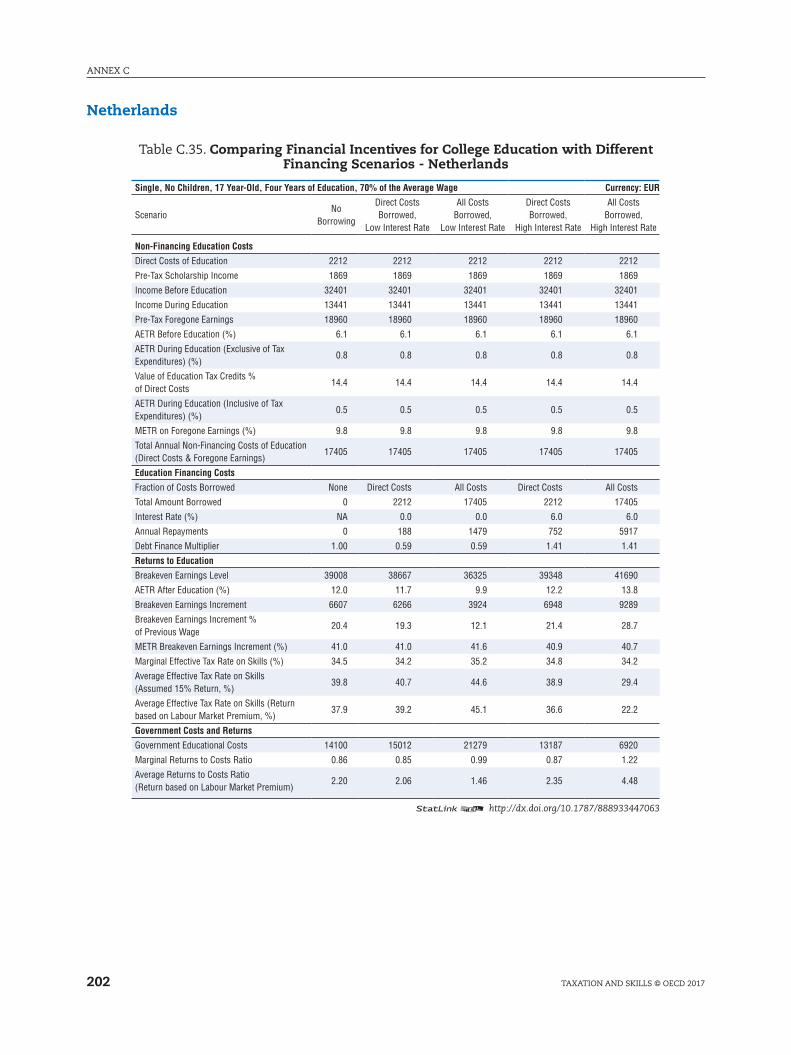
ANNEX C
202 TAXATION AND SkIllS © OECD 2017
Netherlands
Table C.35. Comparing Financial Incentives for College Education with Different Financing Scenarios - Netherlands
Single, No Children, 17 Year-Old, Four Years of Education, 70% of the Average Wage Currency: EUR
ScenarioNo
Borrowing
Direct Costs Borrowed,
Low Interest Rate
All Costs Borrowed,
Low Interest Rate
Direct Costs Borrowed,
High Interest Rate
All Costs Borrowed,
High Interest Rate
Non-Financing Education Costs
Direct Costs of Education 2212 2212 2212 2212 2212
Pre-Tax Scholarship Income 1869 1869 1869 1869 1869
Income Before Education 32401 32401 32401 32401 32401
Income During Education 13441 13441 13441 13441 13441
Pre-Tax Foregone Earnings 18960 18960 18960 18960 18960
AETR Before Education (%) 6.1 6.1 6.1 6.1 6.1
AETR During Education (Exclusive of Tax Expenditures) (%)
0.8 0.8 0.8 0.8 0.8
Value of Education Tax Credits % of Direct Costs
14.4 14.4 14.4 14.4 14.4
AETR During Education (Inclusive of Tax Expenditures) (%)
0.5 0.5 0.5 0.5 0.5
METR on Foregone Earnings (%) 9.8 9.8 9.8 9.8 9.8
Total Annual Non-Financing Costs of Education (Direct Costs & Foregone Earnings)
17405 17405 17405 17405 17405
Education Financing Costs
Fraction of Costs Borrowed None Direct Costs All Costs Direct Costs All Costs
Total Amount Borrowed 0 2212 17405 2212 17405
Interest Rate (%) NA 0.0 0.0 6.0 6.0
Annual Repayments 0 188 1479 752 5917
Debt Finance Multiplier 1.00 0.59 0.59 1.41 1.41
Returns to Education
Breakeven Earnings Level 39008 38667 36325 39348 41690
AETR After Education (%) 12.0 11.7 9.9 12.2 13.8
Breakeven Earnings Increment 6607 6266 3924 6948 9289
Breakeven Earnings Increment % of Previous Wage
20.4 19.3 12.1 21.4 28.7
METR Breakeven Earnings Increment (%) 41.0 41.0 41.6 40.9 40.7
Marginal Effective Tax Rate on Skills (%) 34.5 34.2 35.2 34.8 34.2
Average Effective Tax Rate on Skills (Assumed 15% Return, %)
39.8 40.7 44.6 38.9 29.4
Average Effective Tax Rate on Skills (Return based on Labour Market Premium, %)
37.9 39.2 45.1 36.6 22.2
Government Costs and Returns
Government Educational Costs 14100 15012 21279 13187 6920
Marginal Returns to Costs Ratio 0.86 0.85 0.99 0.87 1.22
Average Returns to Costs Ratio (Return based on Labour Market Premium)
2.20 2.06 1.46 2.35 4.48
12 http://dx.doi.org/10.1787/888933447063
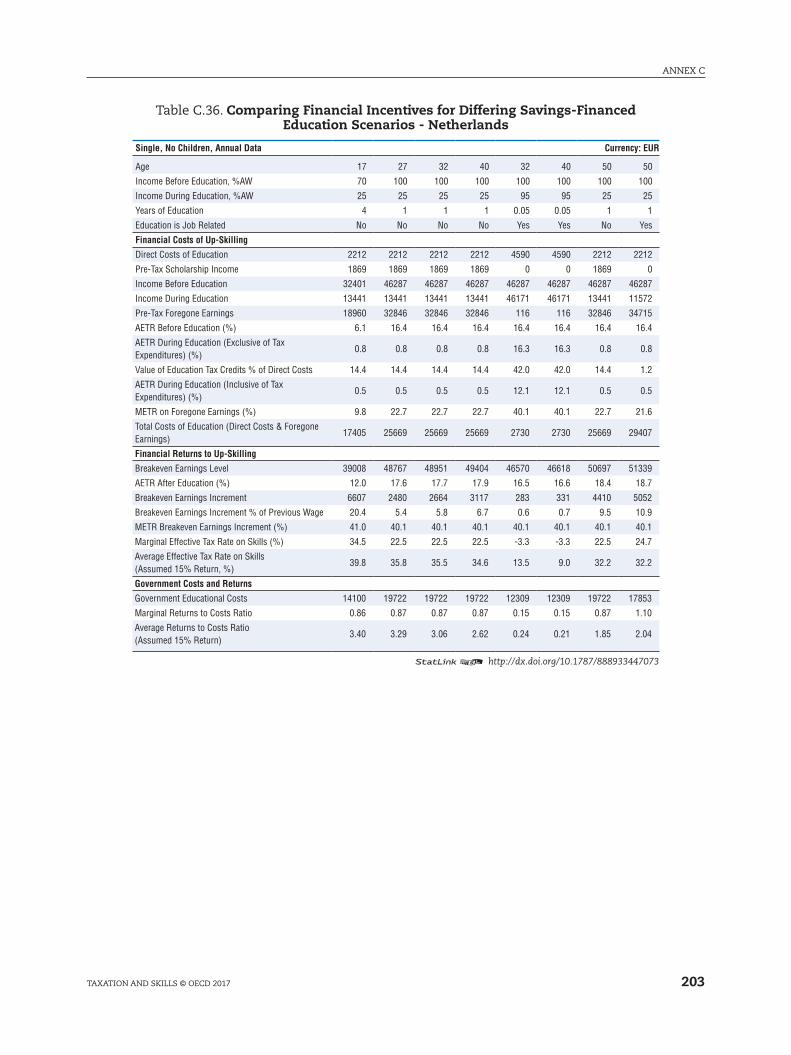
203
ANNEX C
TAXATION AND SkIllS © OECD 2017
Table C.36. Comparing Financial Incentives for Differing Savings-Financed Education Scenarios - Netherlands
Single, No Children, Annual Data Currency: EUR
Age 17 27 32 40 32 40 50 50
Income Before Education, %AW 70 100 100 100 100 100 100 100
Income During Education, %AW 25 25 25 25 95 95 25 25
Years of Education 4 1 1 1 0.05 0.05 1 1
Education is Job Related No No No No Yes Yes No Yes
Financial Costs of Up-Skilling
Direct Costs of Education 2212 2212 2212 2212 4590 4590 2212 2212
Pre-Tax Scholarship Income 1869 1869 1869 1869 0 0 1869 0
Income Before Education 32401 46287 46287 46287 46287 46287 46287 46287
Income During Education 13441 13441 13441 13441 46171 46171 13441 11572
Pre-Tax Foregone Earnings 18960 32846 32846 32846 116 116 32846 34715
AETR Before Education (%) 6.1 16.4 16.4 16.4 16.4 16.4 16.4 16.4
AETR During Education (Exclusive of Tax Expenditures) (%)
0.8 0.8 0.8 0.8 16.3 16.3 0.8 0.8
Value of Education Tax Credits % of Direct Costs 14.4 14.4 14.4 14.4 42.0 42.0 14.4 1.2
AETR During Education (Inclusive of Tax Expenditures) (%)
0.5 0.5 0.5 0.5 12.1 12.1 0.5 0.5
METR on Foregone Earnings (%) 9.8 22.7 22.7 22.7 40.1 40.1 22.7 21.6
Total Costs of Education (Direct Costs & Foregone Earnings)
17405 25669 25669 25669 2730 2730 25669 29407
Financial Returns to Up-Skilling
Breakeven Earnings Level 39008 48767 48951 49404 46570 46618 50697 51339
AETR After Education (%) 12.0 17.6 17.7 17.9 16.5 16.6 18.4 18.7
Breakeven Earnings Increment 6607 2480 2664 3117 283 331 4410 5052
Breakeven Earnings Increment % of Previous Wage 20.4 5.4 5.8 6.7 0.6 0.7 9.5 10.9
METR Breakeven Earnings Increment (%) 41.0 40.1 40.1 40.1 40.1 40.1 40.1 40.1
Marginal Effective Tax Rate on Skills (%) 34.5 22.5 22.5 22.5 -3.3 -3.3 22.5 24.7
Average Effective Tax Rate on Skills (Assumed 15% Return, %)
39.8 35.8 35.5 34.6 13.5 9.0 32.2 32.2
Government Costs and Returns
Government Educational Costs 14100 19722 19722 19722 12309 12309 19722 17853
Marginal Returns to Costs Ratio 0.86 0.87 0.87 0.87 0.15 0.15 0.87 1.10
Average Returns to Costs Ratio (Assumed 15% Return)
3.40 3.29 3.06 2.62 0.24 0.21 1.85 2.04
12 http://dx.doi.org/10.1787/888933447073
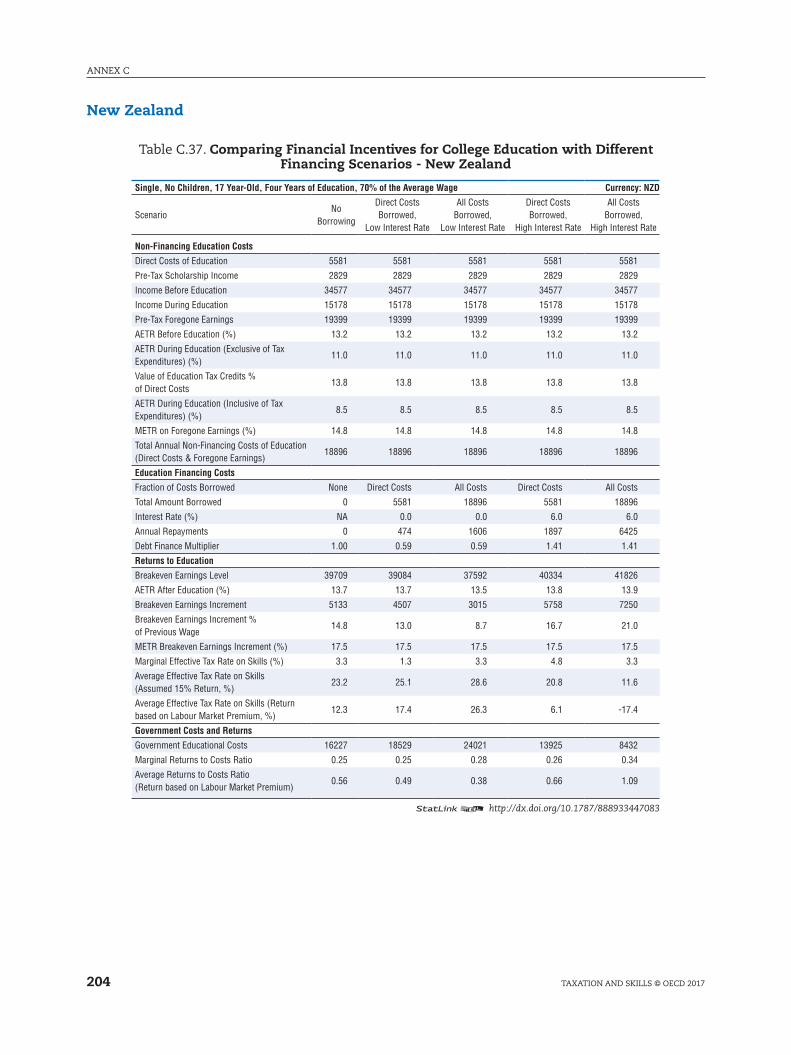
ANNEX C
204 TAXATION AND SkIllS © OECD 2017
New Zealand
Table C.37. Comparing Financial Incentives for College Education with Different Financing Scenarios - New Zealand
Single, No Children, 17 Year-Old, Four Years of Education, 70% of the Average Wage Currency: NZD
ScenarioNo
Borrowing
Direct Costs Borrowed,
Low Interest Rate
All Costs Borrowed,
Low Interest Rate
Direct Costs Borrowed,
High Interest Rate
All Costs Borrowed,
High Interest Rate
Non-Financing Education Costs
Direct Costs of Education 5581 5581 5581 5581 5581
Pre-Tax Scholarship Income 2829 2829 2829 2829 2829
Income Before Education 34577 34577 34577 34577 34577
Income During Education 15178 15178 15178 15178 15178
Pre-Tax Foregone Earnings 19399 19399 19399 19399 19399
AETR Before Education (%) 13.2 13.2 13.2 13.2 13.2
AETR During Education (Exclusive of Tax Expenditures) (%)
11.0 11.0 11.0 11.0 11.0
Value of Education Tax Credits % of Direct Costs
13.8 13.8 13.8 13.8 13.8
AETR During Education (Inclusive of Tax Expenditures) (%)
8.5 8.5 8.5 8.5 8.5
METR on Foregone Earnings (%) 14.8 14.8 14.8 14.8 14.8
Total Annual Non-Financing Costs of Education (Direct Costs & Foregone Earnings)
18896 18896 18896 18896 18896
Education Financing Costs
Fraction of Costs Borrowed None Direct Costs All Costs Direct Costs All Costs
Total Amount Borrowed 0 5581 18896 5581 18896
Interest Rate (%) NA 0.0 0.0 6.0 6.0
Annual Repayments 0 474 1606 1897 6425
Debt Finance Multiplier 1.00 0.59 0.59 1.41 1.41
Returns to Education
Breakeven Earnings Level 39709 39084 37592 40334 41826
AETR After Education (%) 13.7 13.7 13.5 13.8 13.9
Breakeven Earnings Increment 5133 4507 3015 5758 7250
Breakeven Earnings Increment % of Previous Wage
14.8 13.0 8.7 16.7 21.0
METR Breakeven Earnings Increment (%) 17.5 17.5 17.5 17.5 17.5
Marginal Effective Tax Rate on Skills (%) 3.3 1.3 3.3 4.8 3.3
Average Effective Tax Rate on Skills (Assumed 15% Return, %)
23.2 25.1 28.6 20.8 11.6
Average Effective Tax Rate on Skills (Return based on Labour Market Premium, %)
12.3 17.4 26.3 6.1 -17.4
Government Costs and Returns
Government Educational Costs 16227 18529 24021 13925 8432
Marginal Returns to Costs Ratio 0.25 0.25 0.28 0.26 0.34
Average Returns to Costs Ratio (Return based on Labour Market Premium)
0.56 0.49 0.38 0.66 1.09
12 http://dx.doi.org/10.1787/888933447083
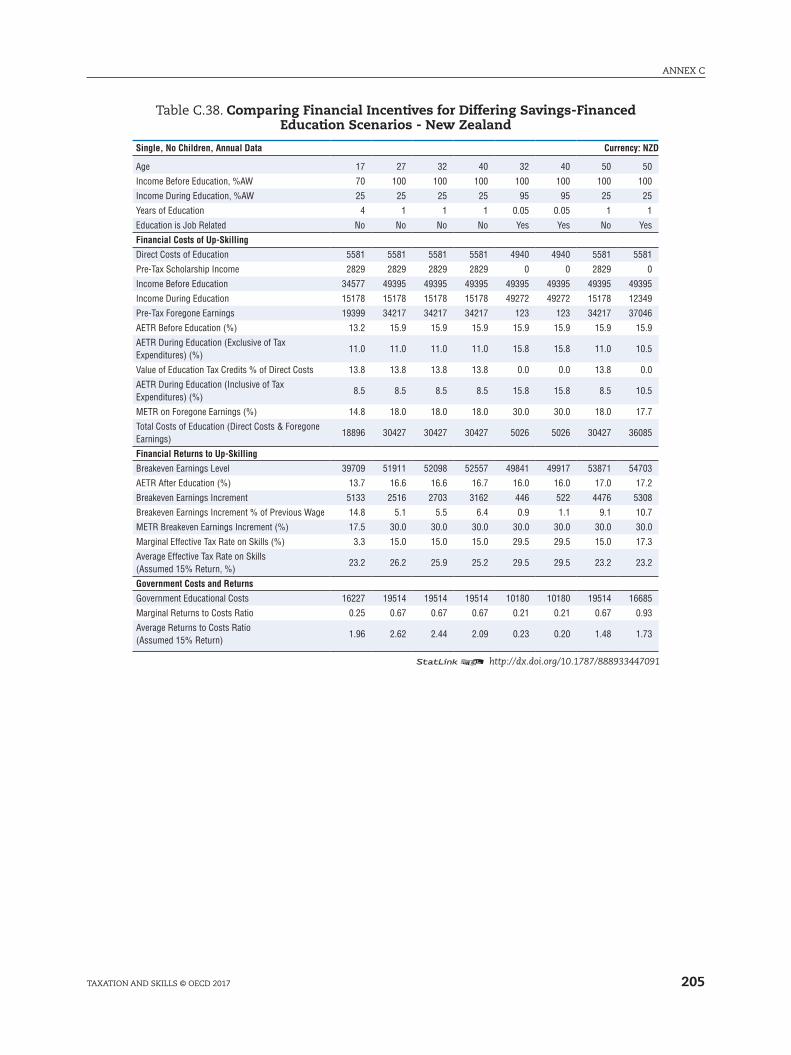
205
ANNEX C
TAXATION AND SkIllS © OECD 2017
Table C.38. Comparing Financial Incentives for Differing Savings-Financed Education Scenarios - New Zealand
Single, No Children, Annual Data Currency: NZD
Age 17 27 32 40 32 40 50 50
Income Before Education, %AW 70 100 100 100 100 100 100 100
Income During Education, %AW 25 25 25 25 95 95 25 25
Years of Education 4 1 1 1 0.05 0.05 1 1
Education is Job Related No No No No Yes Yes No Yes
Financial Costs of Up-Skilling
Direct Costs of Education 5581 5581 5581 5581 4940 4940 5581 5581
Pre-Tax Scholarship Income 2829 2829 2829 2829 0 0 2829 0
Income Before Education 34577 49395 49395 49395 49395 49395 49395 49395
Income During Education 15178 15178 15178 15178 49272 49272 15178 12349
Pre-Tax Foregone Earnings 19399 34217 34217 34217 123 123 34217 37046
AETR Before Education (%) 13.2 15.9 15.9 15.9 15.9 15.9 15.9 15.9
AETR During Education (Exclusive of Tax Expenditures) (%)
11.0 11.0 11.0 11.0 15.8 15.8 11.0 10.5
Value of Education Tax Credits % of Direct Costs 13.8 13.8 13.8 13.8 0.0 0.0 13.8 0.0
AETR During Education (Inclusive of Tax Expenditures) (%)
8.5 8.5 8.5 8.5 15.8 15.8 8.5 10.5
METR on Foregone Earnings (%) 14.8 18.0 18.0 18.0 30.0 30.0 18.0 17.7
Total Costs of Education (Direct Costs & Foregone Earnings)
18896 30427 30427 30427 5026 5026 30427 36085
Financial Returns to Up-Skilling
Breakeven Earnings Level 39709 51911 52098 52557 49841 49917 53871 54703
AETR After Education (%) 13.7 16.6 16.6 16.7 16.0 16.0 17.0 17.2
Breakeven Earnings Increment 5133 2516 2703 3162 446 522 4476 5308
Breakeven Earnings Increment % of Previous Wage 14.8 5.1 5.5 6.4 0.9 1.1 9.1 10.7
METR Breakeven Earnings Increment (%) 17.5 30.0 30.0 30.0 30.0 30.0 30.0 30.0
Marginal Effective Tax Rate on Skills (%) 3.3 15.0 15.0 15.0 29.5 29.5 15.0 17.3
Average Effective Tax Rate on Skills (Assumed 15% Return, %)
23.2 26.2 25.9 25.2 29.5 29.5 23.2 23.2
Government Costs and Returns
Government Educational Costs 16227 19514 19514 19514 10180 10180 19514 16685
Marginal Returns to Costs Ratio 0.25 0.67 0.67 0.67 0.21 0.21 0.67 0.93
Average Returns to Costs Ratio (Assumed 15% Return)
1.96 2.62 2.44 2.09 0.23 0.20 1.48 1.73
12 http://dx.doi.org/10.1787/888933447091
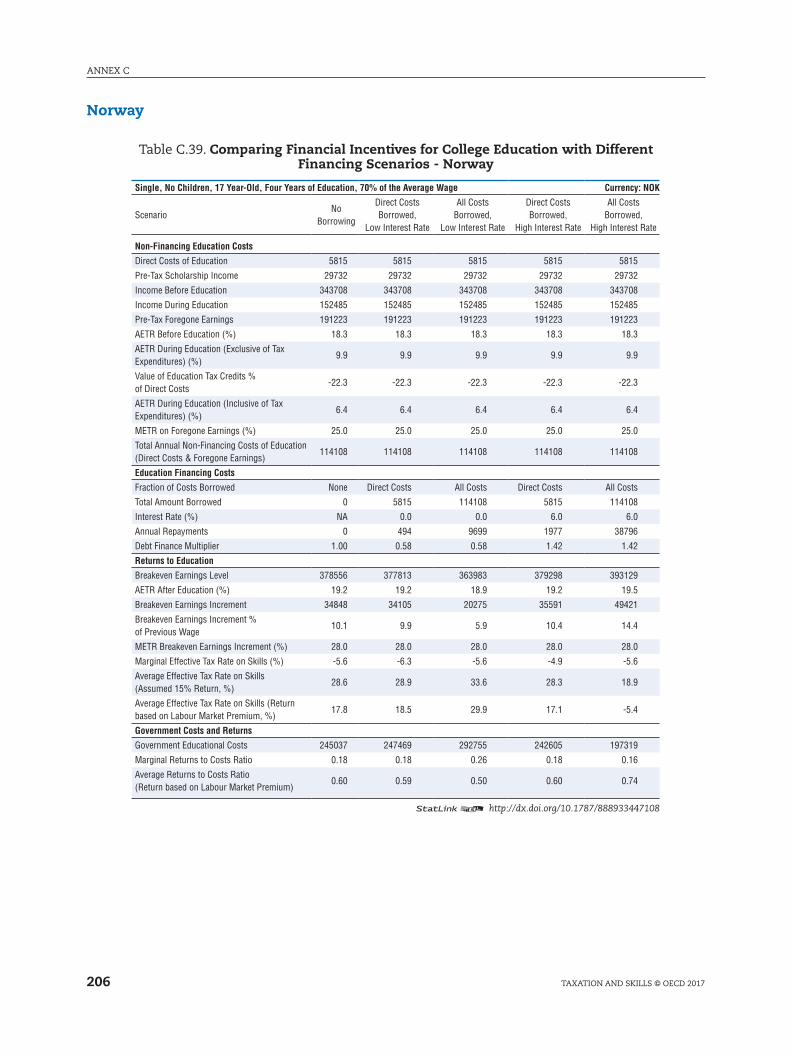
ANNEX C
206 TAXATION AND SkIllS © OECD 2017
Norway
Table C.39. Comparing Financial Incentives for College Education with Different Financing Scenarios - Norway
Single, No Children, 17 Year-Old, Four Years of Education, 70% of the Average Wage Currency: NOK
ScenarioNo
Borrowing
Direct Costs Borrowed,
Low Interest Rate
All Costs Borrowed,
Low Interest Rate
Direct Costs Borrowed,
High Interest Rate
All Costs Borrowed,
High Interest Rate
Non-Financing Education Costs
Direct Costs of Education 5815 5815 5815 5815 5815
Pre-Tax Scholarship Income 29732 29732 29732 29732 29732
Income Before Education 343708 343708 343708 343708 343708
Income During Education 152485 152485 152485 152485 152485
Pre-Tax Foregone Earnings 191223 191223 191223 191223 191223
AETR Before Education (%) 18.3 18.3 18.3 18.3 18.3
AETR During Education (Exclusive of Tax Expenditures) (%)
9.9 9.9 9.9 9.9 9.9
Value of Education Tax Credits % of Direct Costs
-22.3 -22.3 -22.3 -22.3 -22.3
AETR During Education (Inclusive of Tax Expenditures) (%)
6.4 6.4 6.4 6.4 6.4
METR on Foregone Earnings (%) 25.0 25.0 25.0 25.0 25.0
Total Annual Non-Financing Costs of Education (Direct Costs & Foregone Earnings)
114108 114108 114108 114108 114108
Education Financing Costs
Fraction of Costs Borrowed None Direct Costs All Costs Direct Costs All Costs
Total Amount Borrowed 0 5815 114108 5815 114108
Interest Rate (%) NA 0.0 0.0 6.0 6.0
Annual Repayments 0 494 9699 1977 38796
Debt Finance Multiplier 1.00 0.58 0.58 1.42 1.42
Returns to Education
Breakeven Earnings Level 378556 377813 363983 379298 393129
AETR After Education (%) 19.2 19.2 18.9 19.2 19.5
Breakeven Earnings Increment 34848 34105 20275 35591 49421
Breakeven Earnings Increment % of Previous Wage
10.1 9.9 5.9 10.4 14.4
METR Breakeven Earnings Increment (%) 28.0 28.0 28.0 28.0 28.0
Marginal Effective Tax Rate on Skills (%) -5.6 -6.3 -5.6 -4.9 -5.6
Average Effective Tax Rate on Skills (Assumed 15% Return, %)
28.6 28.9 33.6 28.3 18.9
Average Effective Tax Rate on Skills (Return based on Labour Market Premium, %)
17.8 18.5 29.9 17.1 -5.4
Government Costs and Returns
Government Educational Costs 245037 247469 292755 242605 197319
Marginal Returns to Costs Ratio 0.18 0.18 0.26 0.18 0.16
Average Returns to Costs Ratio (Return based on Labour Market Premium)
0.60 0.59 0.50 0.60 0.74
12 http://dx.doi.org/10.1787/888933447108
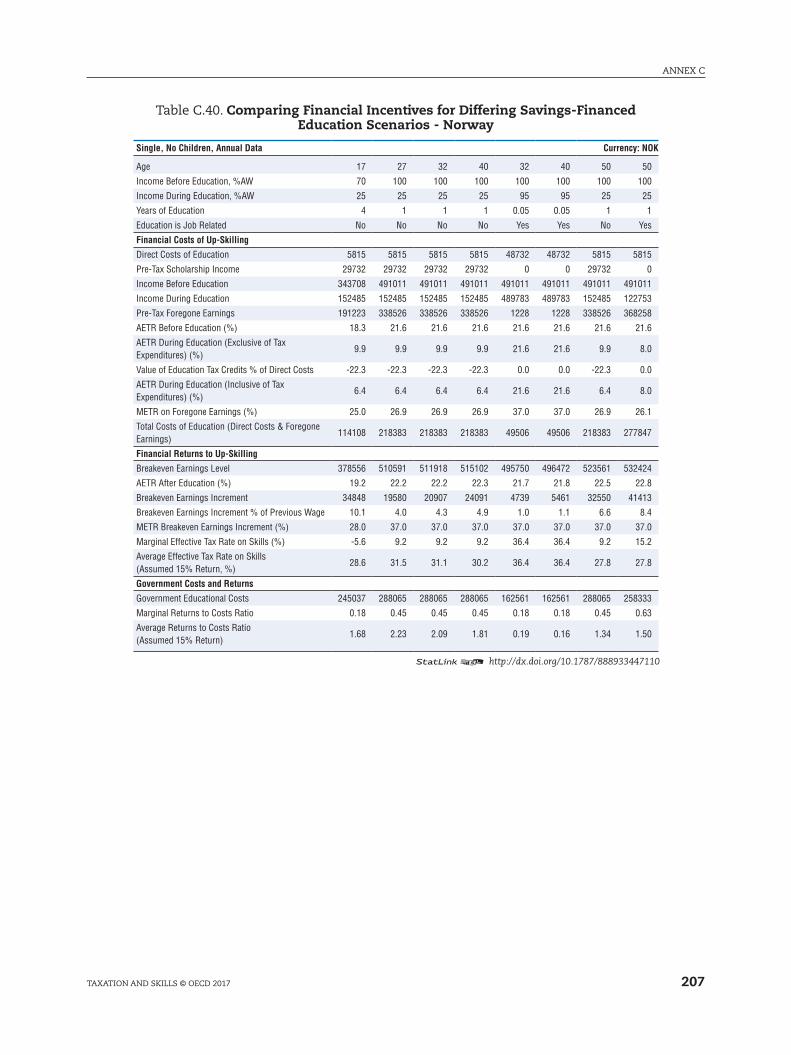
207
ANNEX C
TAXATION AND SkIllS © OECD 2017
Table C.40. Comparing Financial Incentives for Differing Savings-Financed Education Scenarios - Norway
Single, No Children, Annual Data Currency: NOK
Age 17 27 32 40 32 40 50 50
Income Before Education, %AW 70 100 100 100 100 100 100 100
Income During Education, %AW 25 25 25 25 95 95 25 25
Years of Education 4 1 1 1 0.05 0.05 1 1
Education is Job Related No No No No Yes Yes No Yes
Financial Costs of Up-Skilling
Direct Costs of Education 5815 5815 5815 5815 48732 48732 5815 5815
Pre-Tax Scholarship Income 29732 29732 29732 29732 0 0 29732 0
Income Before Education 343708 491011 491011 491011 491011 491011 491011 491011
Income During Education 152485 152485 152485 152485 489783 489783 152485 122753
Pre-Tax Foregone Earnings 191223 338526 338526 338526 1228 1228 338526 368258
AETR Before Education (%) 18.3 21.6 21.6 21.6 21.6 21.6 21.6 21.6
AETR During Education (Exclusive of Tax Expenditures) (%)
9.9 9.9 9.9 9.9 21.6 21.6 9.9 8.0
Value of Education Tax Credits % of Direct Costs -22.3 -22.3 -22.3 -22.3 0.0 0.0 -22.3 0.0
AETR During Education (Inclusive of Tax Expenditures) (%)
6.4 6.4 6.4 6.4 21.6 21.6 6.4 8.0
METR on Foregone Earnings (%) 25.0 26.9 26.9 26.9 37.0 37.0 26.9 26.1
Total Costs of Education (Direct Costs & Foregone Earnings)
114108 218383 218383 218383 49506 49506 218383 277847
Financial Returns to Up-Skilling
Breakeven Earnings Level 378556 510591 511918 515102 495750 496472 523561 532424
AETR After Education (%) 19.2 22.2 22.2 22.3 21.7 21.8 22.5 22.8
Breakeven Earnings Increment 34848 19580 20907 24091 4739 5461 32550 41413
Breakeven Earnings Increment % of Previous Wage 10.1 4.0 4.3 4.9 1.0 1.1 6.6 8.4
METR Breakeven Earnings Increment (%) 28.0 37.0 37.0 37.0 37.0 37.0 37.0 37.0
Marginal Effective Tax Rate on Skills (%) -5.6 9.2 9.2 9.2 36.4 36.4 9.2 15.2
Average Effective Tax Rate on Skills (Assumed 15% Return, %)
28.6 31.5 31.1 30.2 36.4 36.4 27.8 27.8
Government Costs and Returns
Government Educational Costs 245037 288065 288065 288065 162561 162561 288065 258333
Marginal Returns to Costs Ratio 0.18 0.45 0.45 0.45 0.18 0.18 0.45 0.63
Average Returns to Costs Ratio (Assumed 15% Return)
1.68 2.23 2.09 1.81 0.19 0.16 1.34 1.50
12 http://dx.doi.org/10.1787/888933447110
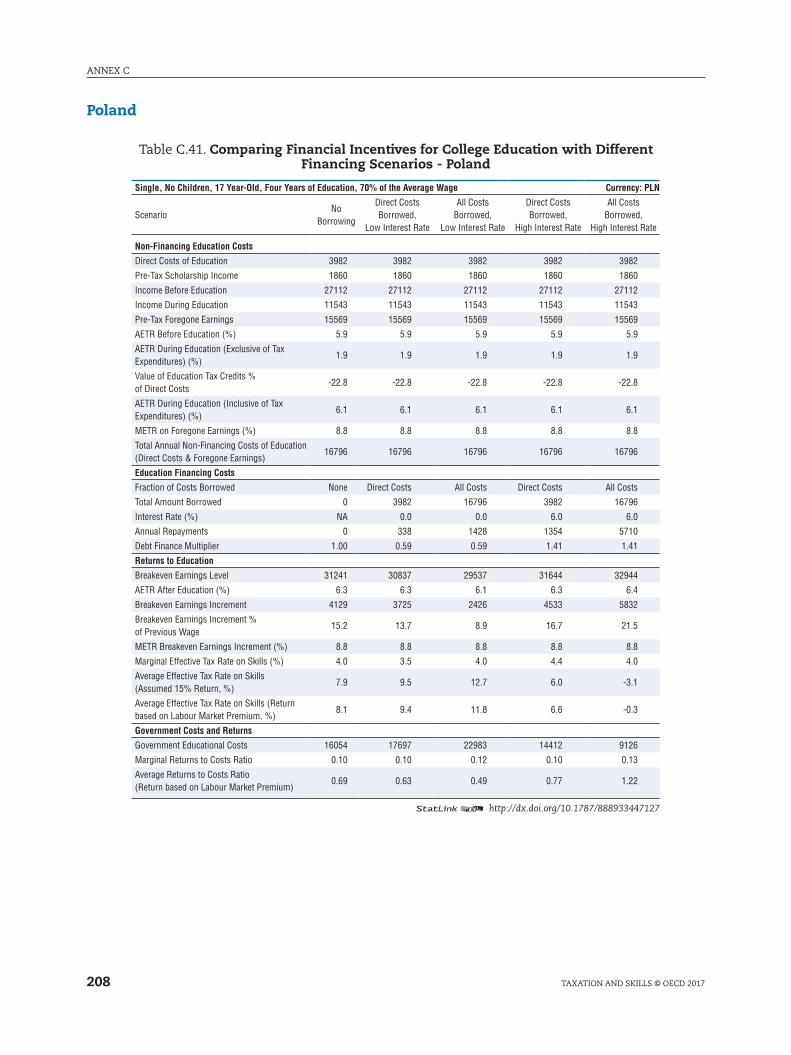
ANNEX C
208 TAXATION AND SkIllS © OECD 2017
Poland
Table C.41. Comparing Financial Incentives for College Education with Different Financing Scenarios - Poland
Single, No Children, 17 Year-Old, Four Years of Education, 70% of the Average Wage Currency: PLN
ScenarioNo
Borrowing
Direct Costs Borrowed,
Low Interest Rate
All Costs Borrowed,
Low Interest Rate
Direct Costs Borrowed,
High Interest Rate
All Costs Borrowed,
High Interest Rate
Non-Financing Education Costs
Direct Costs of Education 3982 3982 3982 3982 3982
Pre-Tax Scholarship Income 1860 1860 1860 1860 1860
Income Before Education 27112 27112 27112 27112 27112
Income During Education 11543 11543 11543 11543 11543
Pre-Tax Foregone Earnings 15569 15569 15569 15569 15569
AETR Before Education (%) 5.9 5.9 5.9 5.9 5.9
AETR During Education (Exclusive of Tax Expenditures) (%)
1.9 1.9 1.9 1.9 1.9
Value of Education Tax Credits % of Direct Costs
-22.8 -22.8 -22.8 -22.8 -22.8
AETR During Education (Inclusive of Tax Expenditures) (%)
6.1 6.1 6.1 6.1 6.1
METR on Foregone Earnings (%) 8.8 8.8 8.8 8.8 8.8
Total Annual Non-Financing Costs of Education (Direct Costs & Foregone Earnings)
16796 16796 16796 16796 16796
Education Financing Costs
Fraction of Costs Borrowed None Direct Costs All Costs Direct Costs All Costs
Total Amount Borrowed 0 3982 16796 3982 16796
Interest Rate (%) NA 0.0 0.0 6.0 6.0
Annual Repayments 0 338 1428 1354 5710
Debt Finance Multiplier 1.00 0.59 0.59 1.41 1.41
Returns to Education
Breakeven Earnings Level 31241 30837 29537 31644 32944
AETR After Education (%) 6.3 6.3 6.1 6.3 6.4
Breakeven Earnings Increment 4129 3725 2426 4533 5832
Breakeven Earnings Increment % of Previous Wage
15.2 13.7 8.9 16.7 21.5
METR Breakeven Earnings Increment (%) 8.8 8.8 8.8 8.8 8.8
Marginal Effective Tax Rate on Skills (%) 4.0 3.5 4.0 4.4 4.0
Average Effective Tax Rate on Skills (Assumed 15% Return, %)
7.9 9.5 12.7 6.0 -3.1
Average Effective Tax Rate on Skills (Return based on Labour Market Premium, %)
8.1 9.4 11.8 6.6 -0.3
Government Costs and Returns
Government Educational Costs 16054 17697 22983 14412 9126
Marginal Returns to Costs Ratio 0.10 0.10 0.12 0.10 0.13
Average Returns to Costs Ratio (Return based on Labour Market Premium)
0.69 0.63 0.49 0.77 1.22
12 http://dx.doi.org/10.1787/888933447127
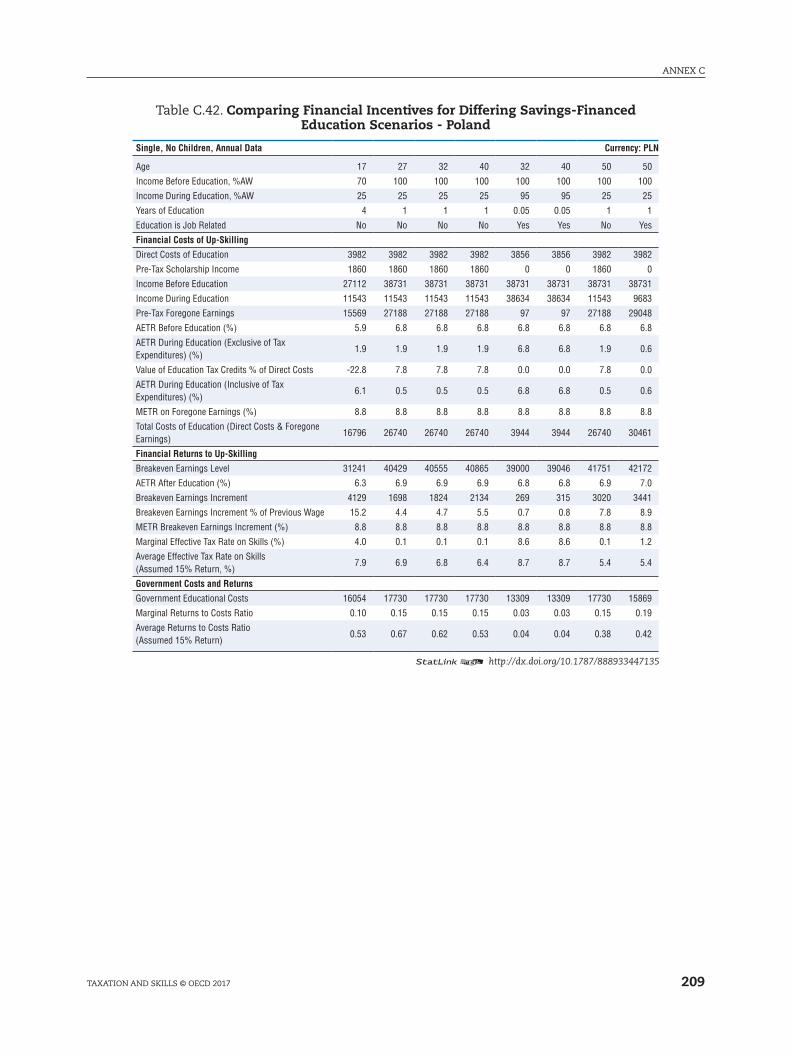
209
ANNEX C
TAXATION AND SkIllS © OECD 2017
Table C.42. Comparing Financial Incentives for Differing Savings-Financed Education Scenarios - Poland
Single, No Children, Annual Data Currency: PLN
Age 17 27 32 40 32 40 50 50
Income Before Education, %AW 70 100 100 100 100 100 100 100
Income During Education, %AW 25 25 25 25 95 95 25 25
Years of Education 4 1 1 1 0.05 0.05 1 1
Education is Job Related No No No No Yes Yes No Yes
Financial Costs of Up-Skilling
Direct Costs of Education 3982 3982 3982 3982 3856 3856 3982 3982
Pre-Tax Scholarship Income 1860 1860 1860 1860 0 0 1860 0
Income Before Education 27112 38731 38731 38731 38731 38731 38731 38731
Income During Education 11543 11543 11543 11543 38634 38634 11543 9683
Pre-Tax Foregone Earnings 15569 27188 27188 27188 97 97 27188 29048
AETR Before Education (%) 5.9 6.8 6.8 6.8 6.8 6.8 6.8 6.8
AETR During Education (Exclusive of Tax Expenditures) (%)
1.9 1.9 1.9 1.9 6.8 6.8 1.9 0.6
Value of Education Tax Credits % of Direct Costs -22.8 7.8 7.8 7.8 0.0 0.0 7.8 0.0
AETR During Education (Inclusive of Tax Expenditures) (%)
6.1 0.5 0.5 0.5 6.8 6.8 0.5 0.6
METR on Foregone Earnings (%) 8.8 8.8 8.8 8.8 8.8 8.8 8.8 8.8
Total Costs of Education (Direct Costs & Foregone Earnings)
16796 26740 26740 26740 3944 3944 26740 30461
Financial Returns to Up-Skilling
Breakeven Earnings Level 31241 40429 40555 40865 39000 39046 41751 42172
AETR After Education (%) 6.3 6.9 6.9 6.9 6.8 6.8 6.9 7.0
Breakeven Earnings Increment 4129 1698 1824 2134 269 315 3020 3441
Breakeven Earnings Increment % of Previous Wage 15.2 4.4 4.7 5.5 0.7 0.8 7.8 8.9
METR Breakeven Earnings Increment (%) 8.8 8.8 8.8 8.8 8.8 8.8 8.8 8.8
Marginal Effective Tax Rate on Skills (%) 4.0 0.1 0.1 0.1 8.6 8.6 0.1 1.2
Average Effective Tax Rate on Skills (Assumed 15% Return, %)
7.9 6.9 6.8 6.4 8.7 8.7 5.4 5.4
Government Costs and Returns
Government Educational Costs 16054 17730 17730 17730 13309 13309 17730 15869
Marginal Returns to Costs Ratio 0.10 0.15 0.15 0.15 0.03 0.03 0.15 0.19
Average Returns to Costs Ratio (Assumed 15% Return)
0.53 0.67 0.62 0.53 0.04 0.04 0.38 0.42
12 http://dx.doi.org/10.1787/888933447135
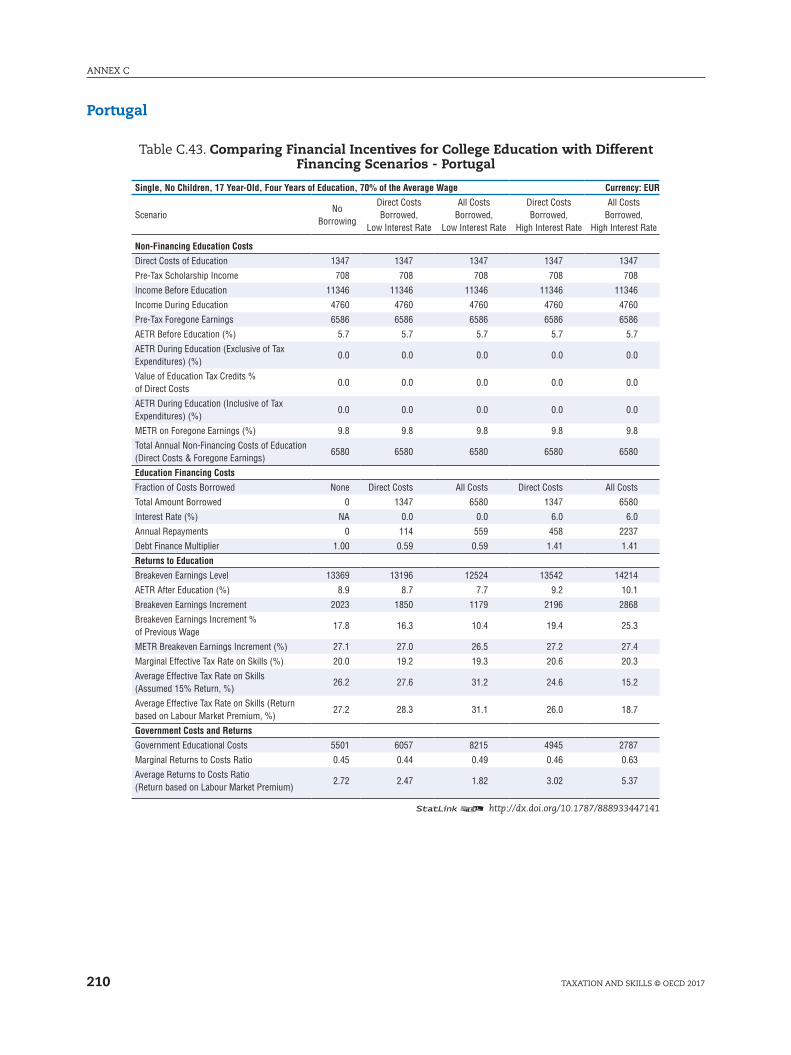
ANNEX C
210 TAXATION AND SkIllS © OECD 2017
Portugal
Table C.43. Comparing Financial Incentives for College Education with Different Financing Scenarios - Portugal
Single, No Children, 17 Year-Old, Four Years of Education, 70% of the Average Wage Currency: EUR
ScenarioNo
Borrowing
Direct Costs Borrowed,
Low Interest Rate
All Costs Borrowed,
Low Interest Rate
Direct Costs Borrowed,
High Interest Rate
All Costs Borrowed,
High Interest Rate
Non-Financing Education Costs
Direct Costs of Education 1347 1347 1347 1347 1347
Pre-Tax Scholarship Income 708 708 708 708 708
Income Before Education 11346 11346 11346 11346 11346
Income During Education 4760 4760 4760 4760 4760
Pre-Tax Foregone Earnings 6586 6586 6586 6586 6586
AETR Before Education (%) 5.7 5.7 5.7 5.7 5.7
AETR During Education (Exclusive of Tax Expenditures) (%)
0.0 0.0 0.0 0.0 0.0
Value of Education Tax Credits % of Direct Costs
0.0 0.0 0.0 0.0 0.0
AETR During Education (Inclusive of Tax Expenditures) (%)
0.0 0.0 0.0 0.0 0.0
METR on Foregone Earnings (%) 9.8 9.8 9.8 9.8 9.8
Total Annual Non-Financing Costs of Education (Direct Costs & Foregone Earnings)
6580 6580 6580 6580 6580
Education Financing Costs
Fraction of Costs Borrowed None Direct Costs All Costs Direct Costs All Costs
Total Amount Borrowed 0 1347 6580 1347 6580
Interest Rate (%) NA 0.0 0.0 6.0 6.0
Annual Repayments 0 114 559 458 2237
Debt Finance Multiplier 1.00 0.59 0.59 1.41 1.41
Returns to Education
Breakeven Earnings Level 13369 13196 12524 13542 14214
AETR After Education (%) 8.9 8.7 7.7 9.2 10.1
Breakeven Earnings Increment 2023 1850 1179 2196 2868
Breakeven Earnings Increment % of Previous Wage
17.8 16.3 10.4 19.4 25.3
METR Breakeven Earnings Increment (%) 27.1 27.0 26.5 27.2 27.4
Marginal Effective Tax Rate on Skills (%) 20.0 19.2 19.3 20.6 20.3
Average Effective Tax Rate on Skills (Assumed 15% Return, %)
26.2 27.6 31.2 24.6 15.2
Average Effective Tax Rate on Skills (Return based on Labour Market Premium, %)
27.2 28.3 31.1 26.0 18.7
Government Costs and Returns
Government Educational Costs 5501 6057 8215 4945 2787
Marginal Returns to Costs Ratio 0.45 0.44 0.49 0.46 0.63
Average Returns to Costs Ratio (Return based on Labour Market Premium)
2.72 2.47 1.82 3.02 5.37
12 http://dx.doi.org/10.1787/888933447141
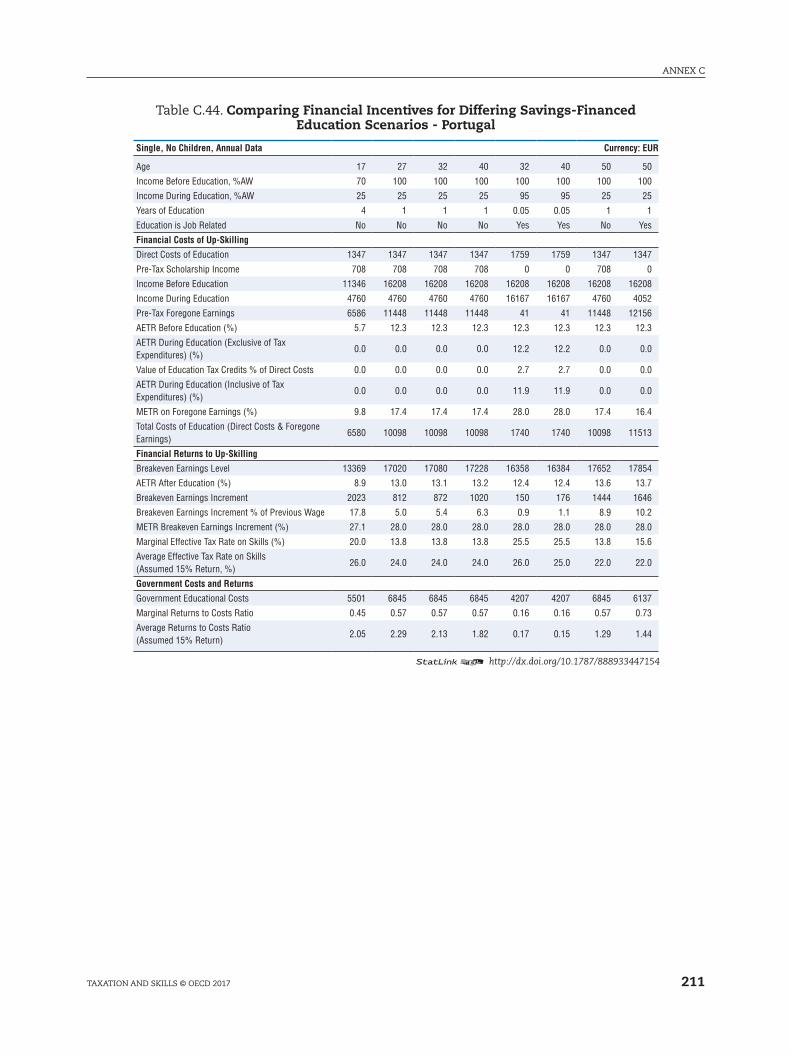
211
ANNEX C
TAXATION AND SkIllS © OECD 2017
Table C.44. Comparing Financial Incentives for Differing Savings-Financed Education Scenarios - Portugal
Single, No Children, Annual Data Currency: EUR
Age 17 27 32 40 32 40 50 50
Income Before Education, %AW 70 100 100 100 100 100 100 100
Income During Education, %AW 25 25 25 25 95 95 25 25
Years of Education 4 1 1 1 0.05 0.05 1 1
Education is Job Related No No No No Yes Yes No Yes
Financial Costs of Up-Skilling
Direct Costs of Education 1347 1347 1347 1347 1759 1759 1347 1347
Pre-Tax Scholarship Income 708 708 708 708 0 0 708 0
Income Before Education 11346 16208 16208 16208 16208 16208 16208 16208
Income During Education 4760 4760 4760 4760 16167 16167 4760 4052
Pre-Tax Foregone Earnings 6586 11448 11448 11448 41 41 11448 12156
AETR Before Education (%) 5.7 12.3 12.3 12.3 12.3 12.3 12.3 12.3
AETR During Education (Exclusive of Tax Expenditures) (%)
0.0 0.0 0.0 0.0 12.2 12.2 0.0 0.0
Value of Education Tax Credits % of Direct Costs 0.0 0.0 0.0 0.0 2.7 2.7 0.0 0.0
AETR During Education (Inclusive of Tax Expenditures) (%)
0.0 0.0 0.0 0.0 11.9 11.9 0.0 0.0
METR on Foregone Earnings (%) 9.8 17.4 17.4 17.4 28.0 28.0 17.4 16.4
Total Costs of Education (Direct Costs & Foregone Earnings)
6580 10098 10098 10098 1740 1740 10098 11513
Financial Returns to Up-Skilling
Breakeven Earnings Level 13369 17020 17080 17228 16358 16384 17652 17854
AETR After Education (%) 8.9 13.0 13.1 13.2 12.4 12.4 13.6 13.7
Breakeven Earnings Increment 2023 812 872 1020 150 176 1444 1646
Breakeven Earnings Increment % of Previous Wage 17.8 5.0 5.4 6.3 0.9 1.1 8.9 10.2
METR Breakeven Earnings Increment (%) 27.1 28.0 28.0 28.0 28.0 28.0 28.0 28.0
Marginal Effective Tax Rate on Skills (%) 20.0 13.8 13.8 13.8 25.5 25.5 13.8 15.6
Average Effective Tax Rate on Skills (Assumed 15% Return, %)
26.0 24.0 24.0 24.0 26.0 25.0 22.0 22.0
Government Costs and Returns
Government Educational Costs 5501 6845 6845 6845 4207 4207 6845 6137
Marginal Returns to Costs Ratio 0.45 0.57 0.57 0.57 0.16 0.16 0.57 0.73
Average Returns to Costs Ratio (Assumed 15% Return)
2.05 2.29 2.13 1.82 0.17 0.15 1.29 1.44
12 http://dx.doi.org/10.1787/888933447154
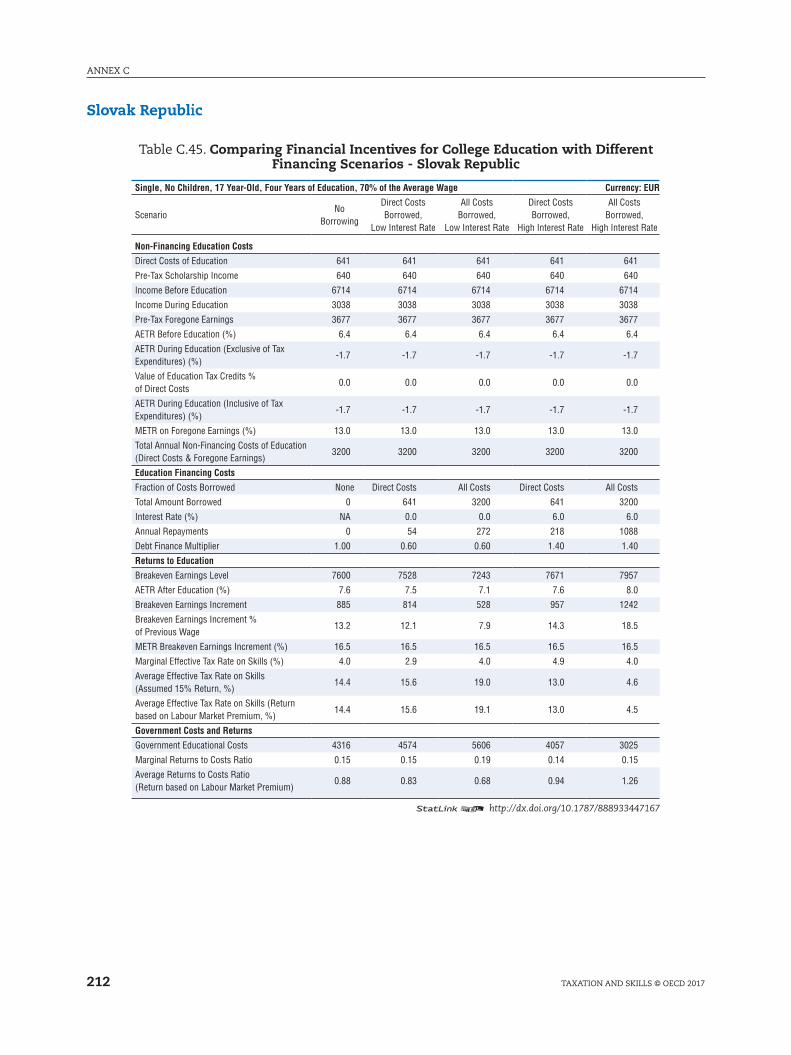
ANNEX C
212 TAXATION AND SkIllS © OECD 2017
Slovak Republic
Table C.45. Comparing Financial Incentives for College Education with Different Financing Scenarios - Slovak Republic
Single, No Children, 17 Year-Old, Four Years of Education, 70% of the Average Wage Currency: EUR
ScenarioNo
Borrowing
Direct Costs Borrowed,
Low Interest Rate
All Costs Borrowed,
Low Interest Rate
Direct Costs Borrowed,
High Interest Rate
All Costs Borrowed,
High Interest Rate
Non-Financing Education Costs
Direct Costs of Education 641 641 641 641 641
Pre-Tax Scholarship Income 640 640 640 640 640
Income Before Education 6714 6714 6714 6714 6714
Income During Education 3038 3038 3038 3038 3038
Pre-Tax Foregone Earnings 3677 3677 3677 3677 3677
AETR Before Education (%) 6.4 6.4 6.4 6.4 6.4
AETR During Education (Exclusive of Tax Expenditures) (%)
-1.7 -1.7 -1.7 -1.7 -1.7
Value of Education Tax Credits % of Direct Costs
0.0 0.0 0.0 0.0 0.0
AETR During Education (Inclusive of Tax Expenditures) (%)
-1.7 -1.7 -1.7 -1.7 -1.7
METR on Foregone Earnings (%) 13.0 13.0 13.0 13.0 13.0
Total Annual Non-Financing Costs of Education (Direct Costs & Foregone Earnings)
3200 3200 3200 3200 3200
Education Financing Costs
Fraction of Costs Borrowed None Direct Costs All Costs Direct Costs All Costs
Total Amount Borrowed 0 641 3200 641 3200
Interest Rate (%) NA 0.0 0.0 6.0 6.0
Annual Repayments 0 54 272 218 1088
Debt Finance Multiplier 1.00 0.60 0.60 1.40 1.40
Returns to Education
Breakeven Earnings Level 7600 7528 7243 7671 7957
AETR After Education (%) 7.6 7.5 7.1 7.6 8.0
Breakeven Earnings Increment 885 814 528 957 1242
Breakeven Earnings Increment % of Previous Wage
13.2 12.1 7.9 14.3 18.5
METR Breakeven Earnings Increment (%) 16.5 16.5 16.5 16.5 16.5
Marginal Effective Tax Rate on Skills (%) 4.0 2.9 4.0 4.9 4.0
Average Effective Tax Rate on Skills (Assumed 15% Return, %)
14.4 15.6 19.0 13.0 4.6
Average Effective Tax Rate on Skills (Return based on Labour Market Premium, %)
14.4 15.6 19.1 13.0 4.5
Government Costs and Returns
Government Educational Costs 4316 4574 5606 4057 3025
Marginal Returns to Costs Ratio 0.15 0.15 0.19 0.14 0.15
Average Returns to Costs Ratio (Return based on Labour Market Premium)
0.88 0.83 0.68 0.94 1.26
12 http://dx.doi.org/10.1787/888933447167

213
ANNEX C
TAXATION AND SkIllS © OECD 2017
Table C.46. Comparing Financial Incentives for Differing Savings-Financed Education Scenarios - Slovak Republic
Single, No Children, Annual Data Currency: EUR
Age 17 27 32 40 32 40 50 50
Income Before Education, %AW 70 100 100 100 100 100 100 100
Income During Education, %AW 25 25 25 25 95 95 25 25
Years of Education 4 1 1 1 0.05 0.05 1 1
Education is Job Related No No No No Yes Yes No Yes
Financial Costs of Up-Skilling
Direct Costs of Education 641 641 641 641 966 966 641 641
Pre-Tax Scholarship Income 640 640 640 640 0 0 640 0
Income Before Education 6714 9592 9592 9592 9592 9592 9592 9592
Income During Education 3038 3038 3038 3038 9568 9568 3038 2398
Pre-Tax Foregone Earnings 3677 6554 6554 6554 24 24 6554 7194
AETR Before Education (%) 6.4 9.4 9.4 9.4 9.4 9.4 9.4 9.4
AETR During Education (Exclusive of Tax Expenditures) (%)
-1.7 -1.7 -1.7 -1.7 9.4 9.4 -1.7 -2.1
Value of Education Tax Credits % of Direct Costs 0.0 0.0 0.0 0.0 0.0 0.0 0.0 0.0
AETR During Education (Inclusive of Tax Expenditures) (%)
-1.7 -1.7 -1.7 -1.7 9.4 9.4 -1.7 -2.1
METR on Foregone Earnings (%) 13.0 14.5 14.5 14.5 16.5 16.5 14.5 13.2
Total Costs of Education (Direct Costs & Foregone Earnings)
3200 5604 5604 5604 986 986 5604 6883
Financial Returns to Up-Skilling
Breakeven Earnings Level 7600 9997 10031 10121 9669 9685 10415 10603
AETR After Education (%) 7.6 9.7 9.7 9.8 9.5 9.5 10.0 10.1
Breakeven Earnings Increment 885 405 439 529 77 93 823 1011
Breakeven Earnings Increment % of Previous Wage 13.2 4.2 4.6 5.5 0.8 1.0 8.6 10.5
METR Breakeven Earnings Increment (%) 16.5 16.5 16.5 16.5 16.5 16.5 16.5 16.5
Marginal Effective Tax Rate on Skills (%) 4.0 2.3 2.3 2.3 16.1 16.1 2.3 4.9
Average Effective Tax Rate on Skills (Assumed 15% Return, %)
14.4 13.5 13.2 12.5 16.2 16.1 10.4 10.4
Government Costs and Returns
Government Educational Costs 4316 4789 4789 4789 3201 3201 4789 4150
Marginal Returns to Costs Ratio 0.15 0.23 0.23 0.23 0.06 0.06 0.23 0.33
Average Returns to Costs Ratio (Assumed 15% Return)
0.89 1.09 1.01 0.84 0.08 0.06 0.54 0.62
12 http://dx.doi.org/10.1787/888933447177
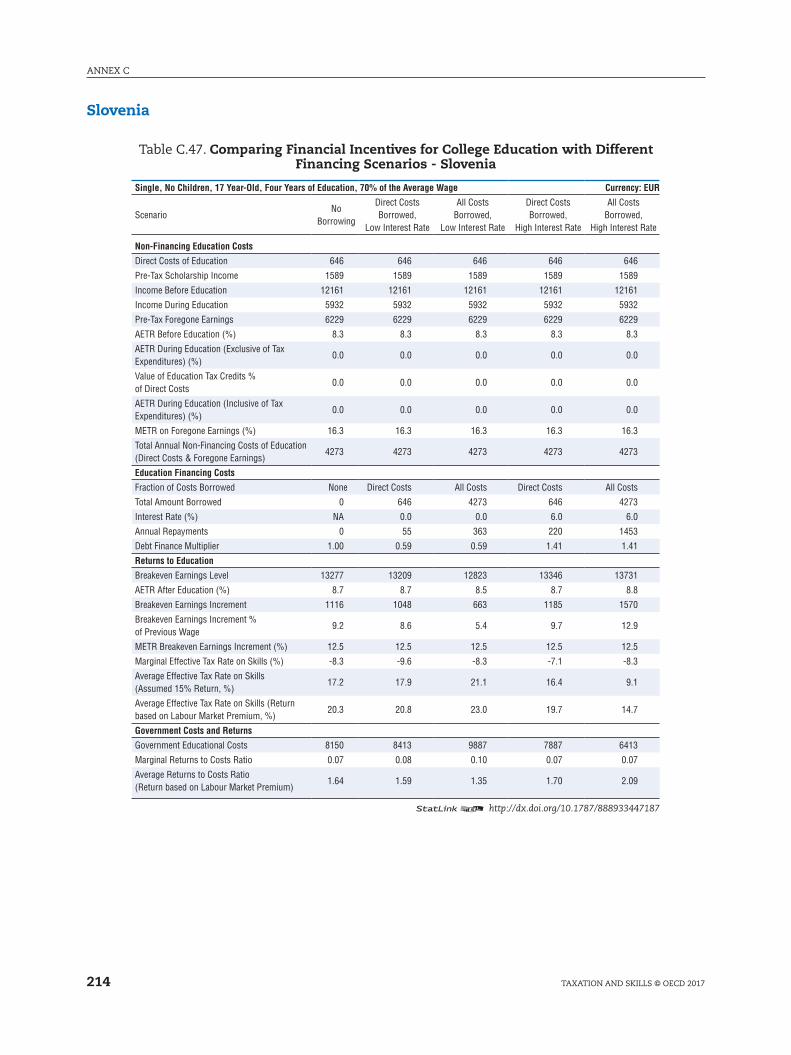
ANNEX C
214 TAXATION AND SkIllS © OECD 2017
Slovenia
Table C.47. Comparing Financial Incentives for College Education with Different Financing Scenarios - Slovenia
Single, No Children, 17 Year-Old, Four Years of Education, 70% of the Average Wage Currency: EUR
ScenarioNo
Borrowing
Direct Costs Borrowed,
Low Interest Rate
All Costs Borrowed,
Low Interest Rate
Direct Costs Borrowed,
High Interest Rate
All Costs Borrowed,
High Interest Rate
Non-Financing Education Costs
Direct Costs of Education 646 646 646 646 646
Pre-Tax Scholarship Income 1589 1589 1589 1589 1589
Income Before Education 12161 12161 12161 12161 12161
Income During Education 5932 5932 5932 5932 5932
Pre-Tax Foregone Earnings 6229 6229 6229 6229 6229
AETR Before Education (%) 8.3 8.3 8.3 8.3 8.3
AETR During Education (Exclusive of Tax Expenditures) (%)
0.0 0.0 0.0 0.0 0.0
Value of Education Tax Credits % of Direct Costs
0.0 0.0 0.0 0.0 0.0
AETR During Education (Inclusive of Tax Expenditures) (%)
0.0 0.0 0.0 0.0 0.0
METR on Foregone Earnings (%) 16.3 16.3 16.3 16.3 16.3
Total Annual Non-Financing Costs of Education (Direct Costs & Foregone Earnings)
4273 4273 4273 4273 4273
Education Financing Costs
Fraction of Costs Borrowed None Direct Costs All Costs Direct Costs All Costs
Total Amount Borrowed 0 646 4273 646 4273
Interest Rate (%) NA 0.0 0.0 6.0 6.0
Annual Repayments 0 55 363 220 1453
Debt Finance Multiplier 1.00 0.59 0.59 1.41 1.41
Returns to Education
Breakeven Earnings Level 13277 13209 12823 13346 13731
AETR After Education (%) 8.7 8.7 8.5 8.7 8.8
Breakeven Earnings Increment 1116 1048 663 1185 1570
Breakeven Earnings Increment % of Previous Wage
9.2 8.6 5.4 9.7 12.9
METR Breakeven Earnings Increment (%) 12.5 12.5 12.5 12.5 12.5
Marginal Effective Tax Rate on Skills (%) -8.3 -9.6 -8.3 -7.1 -8.3
Average Effective Tax Rate on Skills (Assumed 15% Return, %)
17.2 17.9 21.1 16.4 9.1
Average Effective Tax Rate on Skills (Return based on Labour Market Premium, %)
20.3 20.8 23.0 19.7 14.7
Government Costs and Returns
Government Educational Costs 8150 8413 9887 7887 6413
Marginal Returns to Costs Ratio 0.07 0.08 0.10 0.07 0.07
Average Returns to Costs Ratio (Return based on Labour Market Premium)
1.64 1.59 1.35 1.70 2.09
12 http://dx.doi.org/10.1787/888933447187
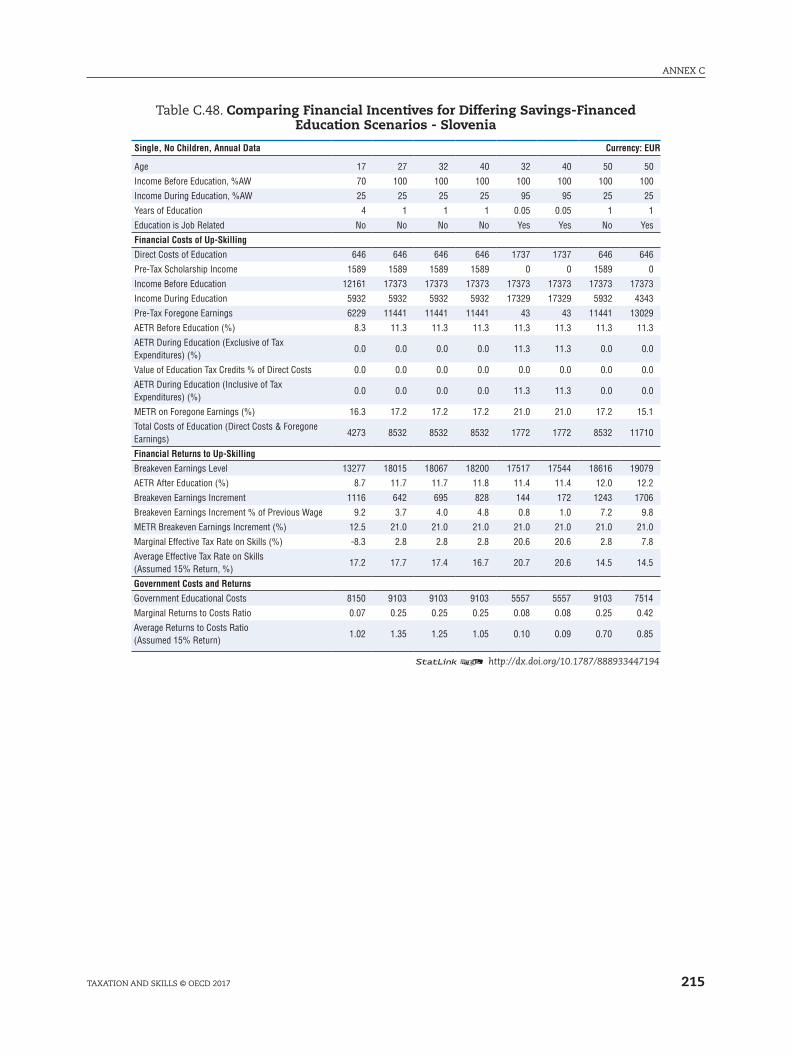
215
ANNEX C
TAXATION AND SkIllS © OECD 2017
Table C.48. Comparing Financial Incentives for Differing Savings-Financed Education Scenarios - Slovenia
Single, No Children, Annual Data Currency: EUR
Age 17 27 32 40 32 40 50 50
Income Before Education, %AW 70 100 100 100 100 100 100 100
Income During Education, %AW 25 25 25 25 95 95 25 25
Years of Education 4 1 1 1 0.05 0.05 1 1
Education is Job Related No No No No Yes Yes No Yes
Financial Costs of Up-Skilling
Direct Costs of Education 646 646 646 646 1737 1737 646 646
Pre-Tax Scholarship Income 1589 1589 1589 1589 0 0 1589 0
Income Before Education 12161 17373 17373 17373 17373 17373 17373 17373
Income During Education 5932 5932 5932 5932 17329 17329 5932 4343
Pre-Tax Foregone Earnings 6229 11441 11441 11441 43 43 11441 13029
AETR Before Education (%) 8.3 11.3 11.3 11.3 11.3 11.3 11.3 11.3
AETR During Education (Exclusive of Tax Expenditures) (%)
0.0 0.0 0.0 0.0 11.3 11.3 0.0 0.0
Value of Education Tax Credits % of Direct Costs 0.0 0.0 0.0 0.0 0.0 0.0 0.0 0.0
AETR During Education (Inclusive of Tax Expenditures) (%)
0.0 0.0 0.0 0.0 11.3 11.3 0.0 0.0
METR on Foregone Earnings (%) 16.3 17.2 17.2 17.2 21.0 21.0 17.2 15.1
Total Costs of Education (Direct Costs & Foregone Earnings)
4273 8532 8532 8532 1772 1772 8532 11710
Financial Returns to Up-Skilling
Breakeven Earnings Level 13277 18015 18067 18200 17517 17544 18616 19079
AETR After Education (%) 8.7 11.7 11.7 11.8 11.4 11.4 12.0 12.2
Breakeven Earnings Increment 1116 642 695 828 144 172 1243 1706
Breakeven Earnings Increment % of Previous Wage 9.2 3.7 4.0 4.8 0.8 1.0 7.2 9.8
METR Breakeven Earnings Increment (%) 12.5 21.0 21.0 21.0 21.0 21.0 21.0 21.0
Marginal Effective Tax Rate on Skills (%) -8.3 2.8 2.8 2.8 20.6 20.6 2.8 7.8
Average Effective Tax Rate on Skills (Assumed 15% Return, %)
17.2 17.7 17.4 16.7 20.7 20.6 14.5 14.5
Government Costs and Returns
Government Educational Costs 8150 9103 9103 9103 5557 5557 9103 7514
Marginal Returns to Costs Ratio 0.07 0.25 0.25 0.25 0.08 0.08 0.25 0.42
Average Returns to Costs Ratio (Assumed 15% Return)
1.02 1.35 1.25 1.05 0.10 0.09 0.70 0.85
12 http://dx.doi.org/10.1787/888933447194
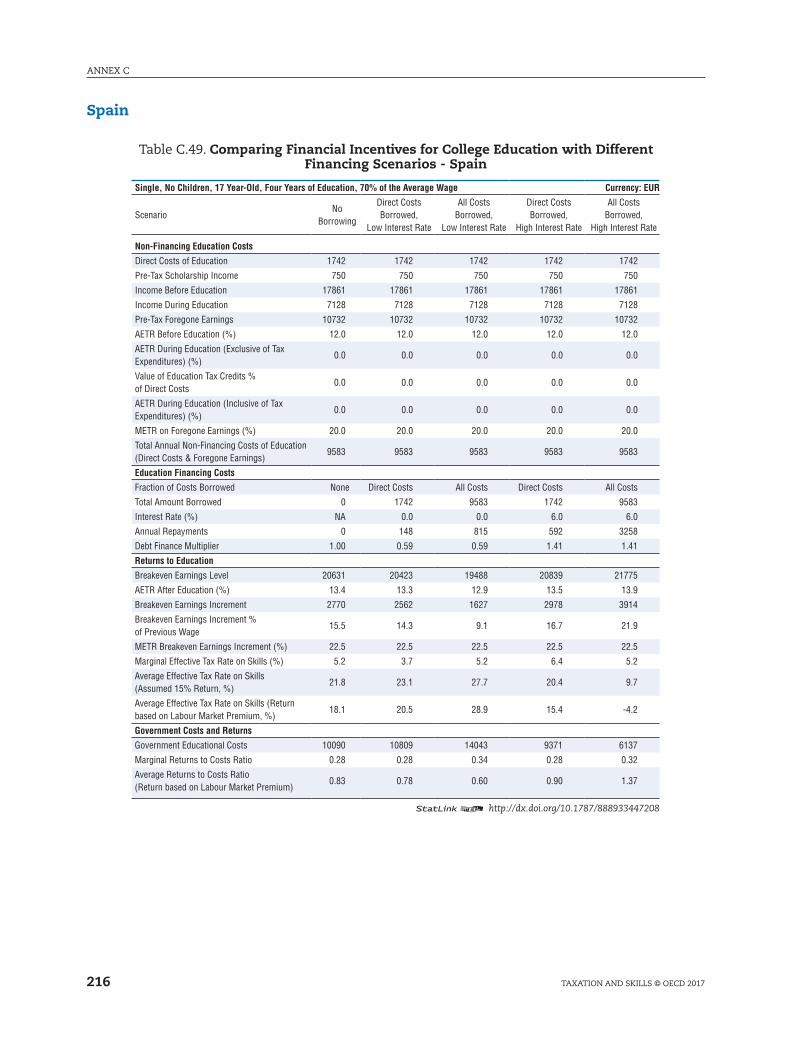
ANNEX C
216 TAXATION AND SkIllS © OECD 2017
Spain
Table C.49. Comparing Financial Incentives for College Education with Different Financing Scenarios - Spain
Single, No Children, 17 Year-Old, Four Years of Education, 70% of the Average Wage Currency: EUR
ScenarioNo
Borrowing
Direct Costs Borrowed,
Low Interest Rate
All Costs Borrowed,
Low Interest Rate
Direct Costs Borrowed,
High Interest Rate
All Costs Borrowed,
High Interest Rate
Non-Financing Education Costs
Direct Costs of Education 1742 1742 1742 1742 1742
Pre-Tax Scholarship Income 750 750 750 750 750
Income Before Education 17861 17861 17861 17861 17861
Income During Education 7128 7128 7128 7128 7128
Pre-Tax Foregone Earnings 10732 10732 10732 10732 10732
AETR Before Education (%) 12.0 12.0 12.0 12.0 12.0
AETR During Education (Exclusive of Tax Expenditures) (%)
0.0 0.0 0.0 0.0 0.0
Value of Education Tax Credits % of Direct Costs
0.0 0.0 0.0 0.0 0.0
AETR During Education (Inclusive of Tax Expenditures) (%)
0.0 0.0 0.0 0.0 0.0
METR on Foregone Earnings (%) 20.0 20.0 20.0 20.0 20.0
Total Annual Non-Financing Costs of Education (Direct Costs & Foregone Earnings)
9583 9583 9583 9583 9583
Education Financing Costs
Fraction of Costs Borrowed None Direct Costs All Costs Direct Costs All Costs
Total Amount Borrowed 0 1742 9583 1742 9583
Interest Rate (%) NA 0.0 0.0 6.0 6.0
Annual Repayments 0 148 815 592 3258
Debt Finance Multiplier 1.00 0.59 0.59 1.41 1.41
Returns to Education
Breakeven Earnings Level 20631 20423 19488 20839 21775
AETR After Education (%) 13.4 13.3 12.9 13.5 13.9
Breakeven Earnings Increment 2770 2562 1627 2978 3914
Breakeven Earnings Increment % of Previous Wage
15.5 14.3 9.1 16.7 21.9
METR Breakeven Earnings Increment (%) 22.5 22.5 22.5 22.5 22.5
Marginal Effective Tax Rate on Skills (%) 5.2 3.7 5.2 6.4 5.2
Average Effective Tax Rate on Skills (Assumed 15% Return, %)
21.8 23.1 27.7 20.4 9.7
Average Effective Tax Rate on Skills (Return based on Labour Market Premium, %)
18.1 20.5 28.9 15.4 -4.2
Government Costs and Returns
Government Educational Costs 10090 10809 14043 9371 6137
Marginal Returns to Costs Ratio 0.28 0.28 0.34 0.28 0.32
Average Returns to Costs Ratio (Return based on Labour Market Premium)
0.83 0.78 0.60 0.90 1.37
12 http://dx.doi.org/10.1787/888933447208

217
ANNEX C
TAXATION AND SkIllS © OECD 2017
Table C.50. Comparing Financial Incentives for Differing Savings-Financed Education Scenarios - Spain
Single, No Children, Annual Data Currency: EUR
Age 17 27 32 40 32 40 50 50
Income Before Education, %AW 70 100 100 100 100 100 100 100
Income During Education, %AW 25 25 25 25 95 95 25 25
Years of Education 4 1 1 1 0.05 0.05 1 1
Education is Job Related No No No No Yes Yes No Yes
Financial Costs of Up-Skilling
Direct Costs of Education 1742 1742 1742 1742 2522 2522 1742 1742
Pre-Tax Scholarship Income 750 750 750 750 0 0 750 0
Income Before Education 17861 25515 25515 25515 25515 25515 25515 25515
Income During Education 7128 7128 7128 7128 25452 25452 7128 6379
Pre-Tax Foregone Earnings 10732 18387 18387 18387 64 64 18387 19136
AETR Before Education (%) 12.0 15.7 15.7 15.7 15.7 15.7 15.7 15.7
AETR During Education (Exclusive of Tax Expenditures) (%)
0.0 0.0 0.0 0.0 15.7 15.7 0.0 0.0
Value of Education Tax Credits % of Direct Costs 0.0 0.0 0.0 0.0 0.0 0.0 0.0 0.0
AETR During Education (Inclusive of Tax Expenditures) (%)
0.0 0.0 0.0 0.0 15.7 15.7 0.0 0.0
METR on Foregone Earnings (%) 20.0 21.8 21.8 21.8 26.2 26.2 21.8 20.9
Total Costs of Education (Direct Costs & Foregone Earnings)
9583 15376 15376 15376 2569 2569 15376 16875
Financial Returns to Up-Skilling
Breakeven Earnings Level 20631 26722 26811 27032 25732 25769 27661 27870
AETR After Education (%) 13.4 16.2 16.2 16.3 15.8 15.8 16.5 16.6
Breakeven Earnings Increment 2770 1207 1296 1516 217 253 2146 2355
Breakeven Earnings Increment % of Previous Wage 15.5 4.7 5.1 5.9 0.8 1.0 8.4 9.2
METR Breakeven Earnings Increment (%) 22.5 26.2 26.2 26.2 26.2 26.2 26.2 26.2
Marginal Effective Tax Rate on Skills (%) 5.2 7.0 7.0 7.0 25.7 25.7 7.0 8.7
Average Effective Tax Rate on Skills (Assumed 15% Return, %)
21.8 21.7 21.3 20.5 25.8 25.7 18.1 18.1
Government Costs and Returns
Government Educational Costs 10090 11952 11952 11952 7216 7216 11952 11202
Marginal Returns to Costs Ratio 0.28 0.46 0.46 0.46 0.13 0.13 0.46 0.54
Average Returns to Costs Ratio (Assumed 15% Return)
1.59 1.93 1.80 1.54 0.15 0.13 1.09 1.16
12 http://dx.doi.org/10.1787/888933447214
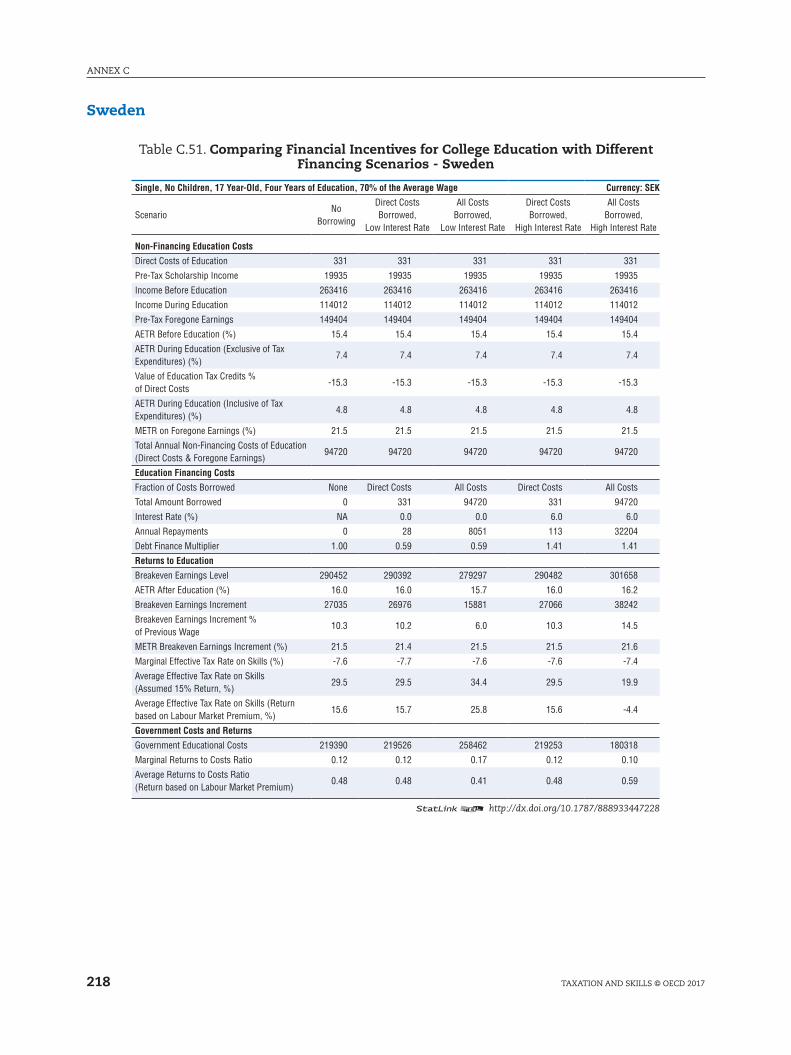
ANNEX C
218 TAXATION AND SkIllS © OECD 2017
Sweden
Table C.51. Comparing Financial Incentives for College Education with Different Financing Scenarios - Sweden
Single, No Children, 17 Year-Old, Four Years of Education, 70% of the Average Wage Currency: SEK
ScenarioNo
Borrowing
Direct Costs Borrowed,
Low Interest Rate
All Costs Borrowed,
Low Interest Rate
Direct Costs Borrowed,
High Interest Rate
All Costs Borrowed,
High Interest Rate
Non-Financing Education Costs
Direct Costs of Education 331 331 331 331 331
Pre-Tax Scholarship Income 19935 19935 19935 19935 19935
Income Before Education 263416 263416 263416 263416 263416
Income During Education 114012 114012 114012 114012 114012
Pre-Tax Foregone Earnings 149404 149404 149404 149404 149404
AETR Before Education (%) 15.4 15.4 15.4 15.4 15.4
AETR During Education (Exclusive of Tax Expenditures) (%)
7.4 7.4 7.4 7.4 7.4
Value of Education Tax Credits % of Direct Costs
-15.3 -15.3 -15.3 -15.3 -15.3
AETR During Education (Inclusive of Tax Expenditures) (%)
4.8 4.8 4.8 4.8 4.8
METR on Foregone Earnings (%) 21.5 21.5 21.5 21.5 21.5
Total Annual Non-Financing Costs of Education (Direct Costs & Foregone Earnings)
94720 94720 94720 94720 94720
Education Financing Costs
Fraction of Costs Borrowed None Direct Costs All Costs Direct Costs All Costs
Total Amount Borrowed 0 331 94720 331 94720
Interest Rate (%) NA 0.0 0.0 6.0 6.0
Annual Repayments 0 28 8051 113 32204
Debt Finance Multiplier 1.00 0.59 0.59 1.41 1.41
Returns to Education
Breakeven Earnings Level 290452 290392 279297 290482 301658
AETR After Education (%) 16.0 16.0 15.7 16.0 16.2
Breakeven Earnings Increment 27035 26976 15881 27066 38242
Breakeven Earnings Increment % of Previous Wage
10.3 10.2 6.0 10.3 14.5
METR Breakeven Earnings Increment (%) 21.5 21.4 21.5 21.5 21.6
Marginal Effective Tax Rate on Skills (%) -7.6 -7.7 -7.6 -7.6 -7.4
Average Effective Tax Rate on Skills (Assumed 15% Return, %)
29.5 29.5 34.4 29.5 19.9
Average Effective Tax Rate on Skills (Return based on Labour Market Premium, %)
15.6 15.7 25.8 15.6 -4.4
Government Costs and Returns
Government Educational Costs 219390 219526 258462 219253 180318
Marginal Returns to Costs Ratio 0.12 0.12 0.17 0.12 0.10
Average Returns to Costs Ratio (Return based on Labour Market Premium)
0.48 0.48 0.41 0.48 0.59
12 http://dx.doi.org/10.1787/888933447228
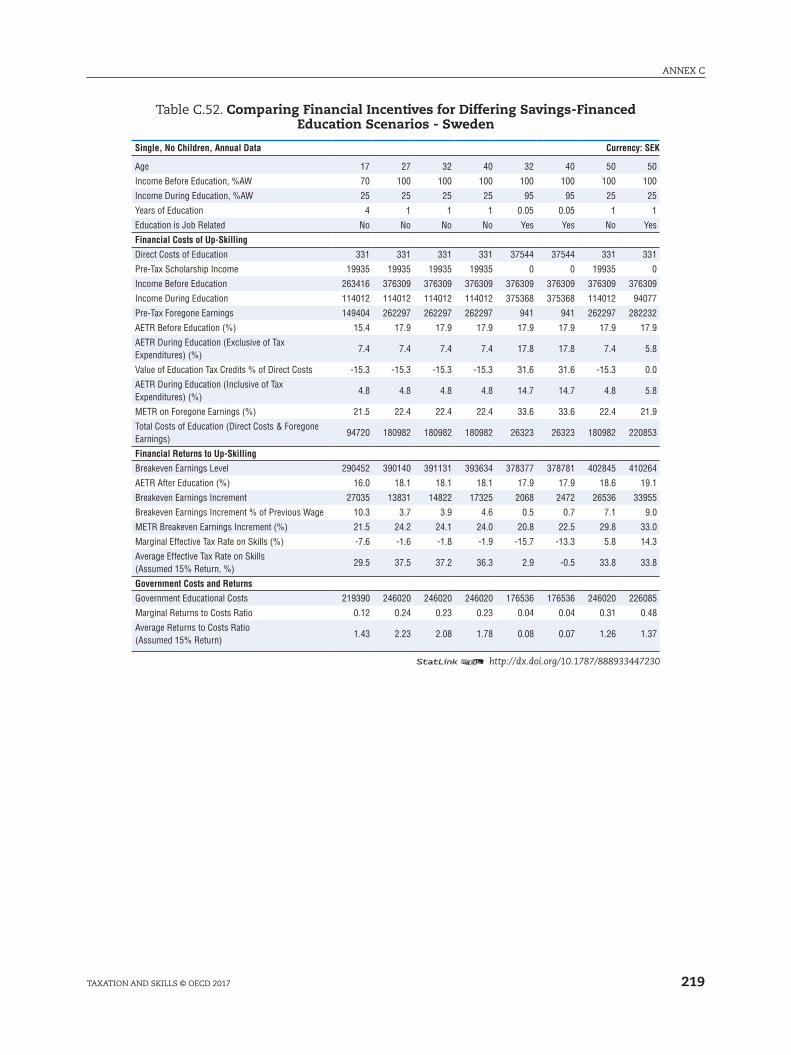
219
ANNEX C
TAXATION AND SkIllS © OECD 2017
Table C.52. Comparing Financial Incentives for Differing Savings-Financed Education Scenarios - Sweden
Single, No Children, Annual Data Currency: SEK
Age 17 27 32 40 32 40 50 50
Income Before Education, %AW 70 100 100 100 100 100 100 100
Income During Education, %AW 25 25 25 25 95 95 25 25
Years of Education 4 1 1 1 0.05 0.05 1 1
Education is Job Related No No No No Yes Yes No Yes
Financial Costs of Up-Skilling
Direct Costs of Education 331 331 331 331 37544 37544 331 331
Pre-Tax Scholarship Income 19935 19935 19935 19935 0 0 19935 0
Income Before Education 263416 376309 376309 376309 376309 376309 376309 376309
Income During Education 114012 114012 114012 114012 375368 375368 114012 94077
Pre-Tax Foregone Earnings 149404 262297 262297 262297 941 941 262297 282232
AETR Before Education (%) 15.4 17.9 17.9 17.9 17.9 17.9 17.9 17.9
AETR During Education (Exclusive of Tax Expenditures) (%)
7.4 7.4 7.4 7.4 17.8 17.8 7.4 5.8
Value of Education Tax Credits % of Direct Costs -15.3 -15.3 -15.3 -15.3 31.6 31.6 -15.3 0.0
AETR During Education (Inclusive of Tax Expenditures) (%)
4.8 4.8 4.8 4.8 14.7 14.7 4.8 5.8
METR on Foregone Earnings (%) 21.5 22.4 22.4 22.4 33.6 33.6 22.4 21.9
Total Costs of Education (Direct Costs & Foregone Earnings)
94720 180982 180982 180982 26323 26323 180982 220853
Financial Returns to Up-Skilling
Breakeven Earnings Level 290452 390140 391131 393634 378377 378781 402845 410264
AETR After Education (%) 16.0 18.1 18.1 18.1 17.9 17.9 18.6 19.1
Breakeven Earnings Increment 27035 13831 14822 17325 2068 2472 26536 33955
Breakeven Earnings Increment % of Previous Wage 10.3 3.7 3.9 4.6 0.5 0.7 7.1 9.0
METR Breakeven Earnings Increment (%) 21.5 24.2 24.1 24.0 20.8 22.5 29.8 33.0
Marginal Effective Tax Rate on Skills (%) -7.6 -1.6 -1.8 -1.9 -15.7 -13.3 5.8 14.3
Average Effective Tax Rate on Skills (Assumed 15% Return, %)
29.5 37.5 37.2 36.3 2.9 -0.5 33.8 33.8
Government Costs and Returns
Government Educational Costs 219390 246020 246020 246020 176536 176536 246020 226085
Marginal Returns to Costs Ratio 0.12 0.24 0.23 0.23 0.04 0.04 0.31 0.48
Average Returns to Costs Ratio (Assumed 15% Return)
1.43 2.23 2.08 1.78 0.08 0.07 1.26 1.37
12 http://dx.doi.org/10.1787/888933447230
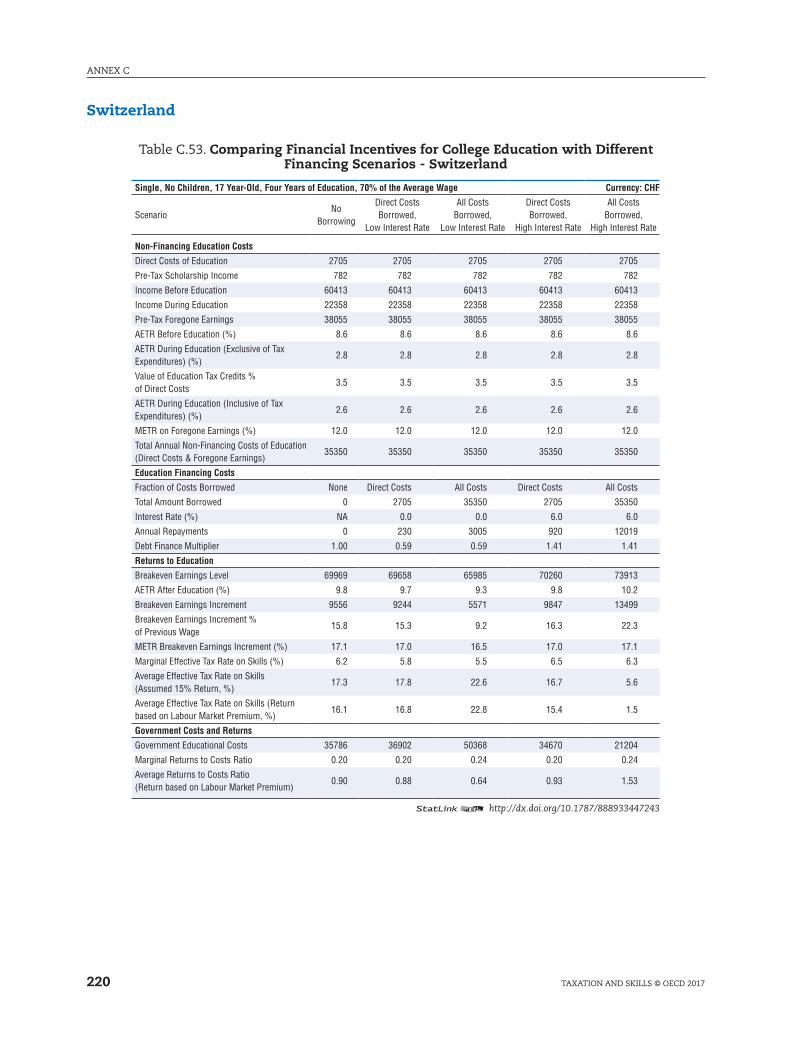
ANNEX C
220 TAXATION AND SkIllS © OECD 2017
Switzerland
Table C.53. Comparing Financial Incentives for College Education with Different Financing Scenarios - Switzerland
Single, No Children, 17 Year-Old, Four Years of Education, 70% of the Average Wage Currency: CHF
ScenarioNo
Borrowing
Direct Costs Borrowed,
Low Interest Rate
All Costs Borrowed,
Low Interest Rate
Direct Costs Borrowed,
High Interest Rate
All Costs Borrowed,
High Interest Rate
Non-Financing Education Costs
Direct Costs of Education 2705 2705 2705 2705 2705
Pre-Tax Scholarship Income 782 782 782 782 782
Income Before Education 60413 60413 60413 60413 60413
Income During Education 22358 22358 22358 22358 22358
Pre-Tax Foregone Earnings 38055 38055 38055 38055 38055
AETR Before Education (%) 8.6 8.6 8.6 8.6 8.6
AETR During Education (Exclusive of Tax Expenditures) (%)
2.8 2.8 2.8 2.8 2.8
Value of Education Tax Credits % of Direct Costs
3.5 3.5 3.5 3.5 3.5
AETR During Education (Inclusive of Tax Expenditures) (%)
2.6 2.6 2.6 2.6 2.6
METR on Foregone Earnings (%) 12.0 12.0 12.0 12.0 12.0
Total Annual Non-Financing Costs of Education (Direct Costs & Foregone Earnings)
35350 35350 35350 35350 35350
Education Financing Costs
Fraction of Costs Borrowed None Direct Costs All Costs Direct Costs All Costs
Total Amount Borrowed 0 2705 35350 2705 35350
Interest Rate (%) NA 0.0 0.0 6.0 6.0
Annual Repayments 0 230 3005 920 12019
Debt Finance Multiplier 1.00 0.59 0.59 1.41 1.41
Returns to Education
Breakeven Earnings Level 69969 69658 65985 70260 73913
AETR After Education (%) 9.8 9.7 9.3 9.8 10.2
Breakeven Earnings Increment 9556 9244 5571 9847 13499
Breakeven Earnings Increment % of Previous Wage
15.8 15.3 9.2 16.3 22.3
METR Breakeven Earnings Increment (%) 17.1 17.0 16.5 17.0 17.1
Marginal Effective Tax Rate on Skills (%) 6.2 5.8 5.5 6.5 6.3
Average Effective Tax Rate on Skills (Assumed 15% Return, %)
17.3 17.8 22.6 16.7 5.6
Average Effective Tax Rate on Skills (Return based on Labour Market Premium, %)
16.1 16.8 22.8 15.4 1.5
Government Costs and Returns
Government Educational Costs 35786 36902 50368 34670 21204
Marginal Returns to Costs Ratio 0.20 0.20 0.24 0.20 0.24
Average Returns to Costs Ratio (Return based on Labour Market Premium)
0.90 0.88 0.64 0.93 1.53
12 http://dx.doi.org/10.1787/888933447243

221
ANNEX C
TAXATION AND SkIllS © OECD 2017
Table C.54. Comparing Financial Incentives for Differing Savings-Financed Education Scenarios - Switzerland
Single, No Children, Annual Data Currency: CHF
Age 17 27 32 40 32 40 50 50
Income Before Education, %AW 70 100 100 100 100 100 100 100
Income During Education, %AW 25 25 25 25 95 95 25 25
Years of Education 4 1 1 1 0.05 0.05 1 1
Education is Job Related No No No No Yes Yes No Yes
Financial Costs of Up-Skilling
Direct Costs of Education 2705 2705 2705 2705 7741 7741 2705 2705
Pre-Tax Scholarship Income 782 782 782 782 0 0 782 0
Income Before Education 60413 86305 86305 86305 86305 86305 86305 86305
Income During Education 22358 22358 22358 22358 86089 86089 22358 21576
Pre-Tax Foregone Earnings 38055 63947 63947 63947 216 216 63947 64729
AETR Before Education (%) 8.6 11.2 11.2 11.2 11.2 11.2 11.2 11.2
AETR During Education (Exclusive of Tax Expenditures) (%)
2.8 2.8 2.8 2.8 11.2 11.2 2.8 2.6
Value of Education Tax Credits % of Direct Costs 3.5 3.5 3.5 3.5 3.0 3.0 3.5 0.5
AETR During Education (Inclusive of Tax Expenditures) (%)
2.6 2.6 2.6 2.6 11.0 11.0 2.6 2.6
METR on Foregone Earnings (%) 12.0 14.2 14.2 14.2 21.0 21.0 14.2 14.1
Total Costs of Education (Direct Costs & Foregone Earnings)
35350 56734 56734 56734 7683 7683 56734 58283
Financial Returns to Up-Skilling
Breakeven Earnings Level 69969 90481 90776 91555 86905 87012 93734 93920
AETR After Education (%) 9.8 11.7 11.7 11.8 11.3 11.3 12.0 12.1
Breakeven Earnings Increment 9556 4176 4471 5250 600 707 7429 7615
Breakeven Earnings Increment % of Previous Wage 15.8 4.8 5.2 6.1 0.7 0.8 8.6 8.8
METR Breakeven Earnings Increment (%) 17.1 21.4 21.1 21.4 20.4 20.9 21.4 21.2
Marginal Effective Tax Rate on Skills (%) 6.2 8.7 8.4 8.7 17.5 18.1 8.7 8.8
Average Effective Tax Rate on Skills (Assumed 15% Return, %)
17.3 18.6 18.4 17.8 18.1 17.8 16.2 16.2
Government Costs and Returns
Government Educational Costs 35786 40294 40294 40294 30651 30651 40294 39526
Marginal Returns to Costs Ratio 0.20 0.38 0.38 0.38 0.06 0.07 0.38 0.40
Average Returns to Costs Ratio (Assumed 15% Return)
1.17 1.61 1.49 1.28 0.09 0.08 0.90 0.92
12 http://dx.doi.org/10.1787/888933447259
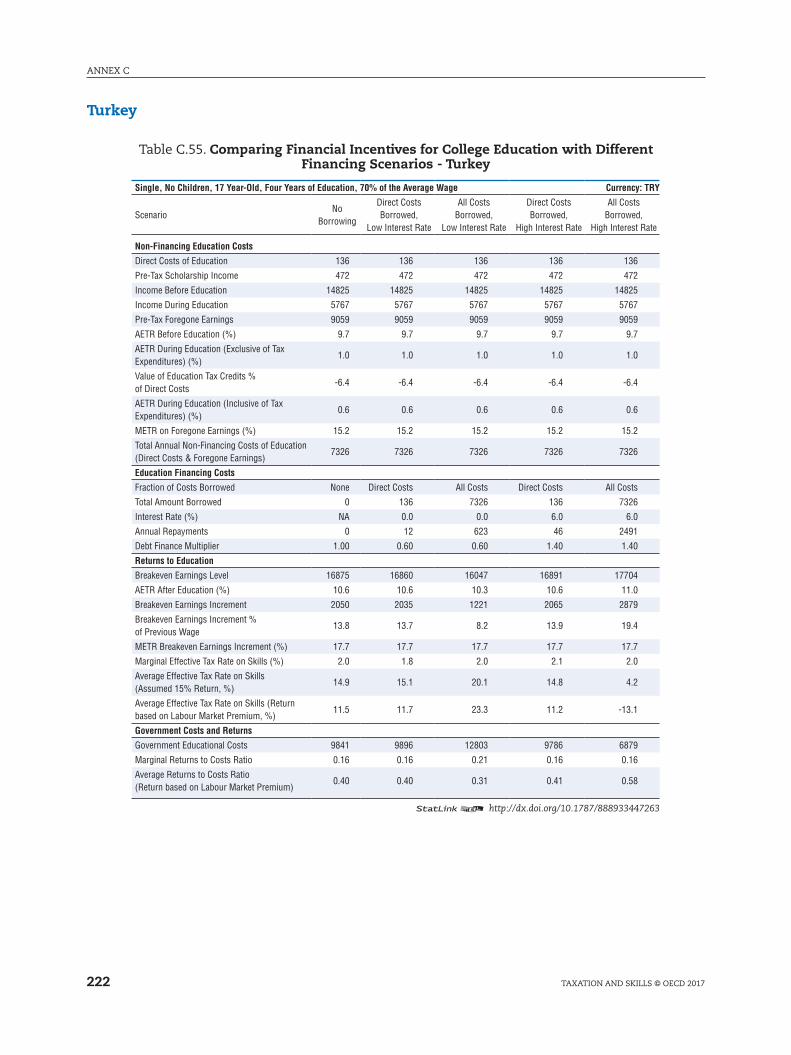
ANNEX C
222 TAXATION AND SkIllS © OECD 2017
Turkey
Table C.55. Comparing Financial Incentives for College Education with Different Financing Scenarios - Turkey
Single, No Children, 17 Year-Old, Four Years of Education, 70% of the Average Wage Currency: TRY
ScenarioNo
Borrowing
Direct Costs Borrowed,
Low Interest Rate
All Costs Borrowed,
Low Interest Rate
Direct Costs Borrowed,
High Interest Rate
All Costs Borrowed,
High Interest Rate
Non-Financing Education Costs
Direct Costs of Education 136 136 136 136 136
Pre-Tax Scholarship Income 472 472 472 472 472
Income Before Education 14825 14825 14825 14825 14825
Income During Education 5767 5767 5767 5767 5767
Pre-Tax Foregone Earnings 9059 9059 9059 9059 9059
AETR Before Education (%) 9.7 9.7 9.7 9.7 9.7
AETR During Education (Exclusive of Tax Expenditures) (%)
1.0 1.0 1.0 1.0 1.0
Value of Education Tax Credits % of Direct Costs
-6.4 -6.4 -6.4 -6.4 -6.4
AETR During Education (Inclusive of Tax Expenditures) (%)
0.6 0.6 0.6 0.6 0.6
METR on Foregone Earnings (%) 15.2 15.2 15.2 15.2 15.2
Total Annual Non-Financing Costs of Education (Direct Costs & Foregone Earnings)
7326 7326 7326 7326 7326
Education Financing Costs
Fraction of Costs Borrowed None Direct Costs All Costs Direct Costs All Costs
Total Amount Borrowed 0 136 7326 136 7326
Interest Rate (%) NA 0.0 0.0 6.0 6.0
Annual Repayments 0 12 623 46 2491
Debt Finance Multiplier 1.00 0.60 0.60 1.40 1.40
Returns to Education
Breakeven Earnings Level 16875 16860 16047 16891 17704
AETR After Education (%) 10.6 10.6 10.3 10.6 11.0
Breakeven Earnings Increment 2050 2035 1221 2065 2879
Breakeven Earnings Increment % of Previous Wage
13.8 13.7 8.2 13.9 19.4
METR Breakeven Earnings Increment (%) 17.7 17.7 17.7 17.7 17.7
Marginal Effective Tax Rate on Skills (%) 2.0 1.8 2.0 2.1 2.0
Average Effective Tax Rate on Skills (Assumed 15% Return, %)
14.9 15.1 20.1 14.8 4.2
Average Effective Tax Rate on Skills (Return based on Labour Market Premium, %)
11.5 11.7 23.3 11.2 -13.1
Government Costs and Returns
Government Educational Costs 9841 9896 12803 9786 6879
Marginal Returns to Costs Ratio 0.16 0.16 0.21 0.16 0.16
Average Returns to Costs Ratio (Return based on Labour Market Premium)
0.40 0.40 0.31 0.41 0.58
12 http://dx.doi.org/10.1787/888933447263

223
ANNEX C
TAXATION AND SkIllS © OECD 2017
Table C.56. Comparing Financial Incentives for Differing Savings-Financed Education Scenarios - Turkey
Single, No Children, Annual Data Currency: TRY
Age 17 27 32 40 32 40 50 50
Income Before Education, %AW 70 100 100 100 100 100 100 100
Income During Education, %AW 25 25 25 25 95 95 25 25
Years of Education 4 1 1 1 0.05 0.05 1 1
Education is Job Related No No No No Yes Yes No Yes
Financial Costs of Up-Skilling
Direct Costs of Education 136 136 136 136 2264 2264 136 136
Pre-Tax Scholarship Income 472 472 472 472 0 0 472 0
Income Before Education 14825 21179 21179 21179 21179 21179 21179 21179
Income During Education 5767 5767 5767 5767 21126 21126 5767 5295
Pre-Tax Foregone Earnings 9059 15412 15412 15412 53 53 15412 15884
AETR Before Education (%) 9.7 12.1 12.1 12.1 12.1 12.1 12.1 12.1
AETR During Education (Exclusive of Tax Expenditures) (%)
1.0 1.0 1.0 1.0 12.0 12.0 1.0 0.7
Value of Education Tax Credits % of Direct Costs -6.4 -6.4 -6.4 -6.4 18.7 18.7 -6.4 0.0
AETR During Education (Inclusive of Tax Expenditures) (%)
0.6 0.6 0.6 0.6 10.0 10.0 0.6 0.7
METR on Foregone Earnings (%) 15.2 16.2 16.2 16.2 17.7 17.7 16.2 15.9
Total Costs of Education (Direct Costs & Foregone Earnings)
7326 12558 12558 12558 1885 1885 12558 13502
Financial Returns to Up-Skilling
Breakeven Earnings Level 16875 22095 22172 22370 21328 21358 23014 23151
AETR After Education (%) 10.6 12.3 12.3 12.4 12.1 12.1 12.5 12.5
Breakeven Earnings Increment 2050 916 993 1191 149 179 1835 1972
Breakeven Earnings Increment % of Previous Wage 13.8 4.3 4.7 5.6 0.7 0.8 8.7 9.3
METR Breakeven Earnings Increment (%) 17.7 17.7 17.7 17.7 17.7 17.7 17.7 17.7
Marginal Effective Tax Rate on Skills (%) 2.0 1.1 1.1 1.1 -1.2 -1.2 1.1 2.3
Average Effective Tax Rate on Skills (Assumed 15% Return, %)
14.9 14.1 13.8 13.0 4.4 1.7 10.5 10.5
Government Costs and Returns
Government Educational Costs 9841 10963 10963 10963 8405 8405 10963 10491
Marginal Returns to Costs Ratio 0.16 0.25 0.25 0.25 0.05 0.05 0.25 0.28
Average Returns to Costs Ratio (Assumed 15% Return)
0.92 1.14 1.05 0.87 0.07 0.06 0.57 0.59
12 http://dx.doi.org/10.1787/888933447277

ANNEX C
224 TAXATION AND SkIllS © OECD 2017
United Kingdom
Table C.57. Comparing Financial Incentives for College Education with Different Financing Scenarios - United Kingdom
Single, No Children, 17 Year-Old, Four Years of Education, 70% of the Average Wage Currency: GBP
ScenarioNo
Borrowing
Direct Costs Borrowed,
Low Interest Rate
All Costs Borrowed,
Low Interest Rate
Direct Costs Borrowed,
High Interest Rate
All Costs Borrowed,
High Interest Rate
Non-Financing Education Costs
Direct Costs of Education 6031 6031 6031 6031 6031
Pre-Tax Scholarship Income 808 808 808 808 808
Income Before Education 23858 23858 23858 23858 23858
Income During Education 9329 9329 9329 9329 9329
Pre-Tax Foregone Earnings 14529 14529 14529 14529 14529
AETR Before Education (%) 13.7 13.7 13.7 13.7 13.7
AETR During Education (Exclusive of Tax Expenditures) (%)
-12.4 -12.4 -12.4 -12.4 -12.4
Value of Education Tax Credits % of Direct Costs
9.4 9.4 9.4 9.4 9.4
AETR During Education (Inclusive of Tax Expenditures) (%)
-17.6 -17.6 -17.6 -17.6 -17.6
METR on Foregone Earnings (%) 30.5 30.5 30.5 30.5 30.5
Total Annual Non-Financing Costs of Education (Direct Costs & Foregone Earnings)
14830 14830 14830 14830 14830
Education Financing Costs
Fraction of Costs Borrowed None Direct Costs All Costs Direct Costs All Costs
Total Amount Borrowed 0 6031 14830 6031 14830
Interest Rate (%) NA 0.0 0.0 6.0 6.0
Annual Repayments 0 513 1261 2050 5042
Debt Finance Multiplier 1.00 0.58 0.58 1.42 1.42
Returns to Education
Breakeven Earnings Level 27898 27206 26198 28589 29598
AETR After Education (%) 14.6 14.5 14.3 14.8 14.9
Breakeven Earnings Increment 4040 3348 2339 4731 5740
Breakeven Earnings Increment % of Previous Wage
16.9 14.0 9.8 19.8 24.1
METR Breakeven Earnings Increment (%) 20.0 20.0 20.0 20.0 20.0
Marginal Effective Tax Rate on Skills (%) -6.6 -12.0 -6.6 -2.7 -6.6
Average Effective Tax Rate on Skills (Assumed 15% Return, %)
14.9 18.2 22.7 10.5 -1.0
Average Effective Tax Rate on Skills (Return based on Labour Market Premium, %)
12.6 17.1 22.9 7.0 -8.1
Government Costs and Returns
Government Educational Costs 8724 11262 14966 6185 2482
Marginal Returns to Costs Ratio 0.43 0.40 0.43 0.51 1.05
Average Returns to Costs Ratio (Return based on Labour Market Premium)
1.54 1.19 0.89 2.17 5.40
12 http://dx.doi.org/10.1787/888933447285
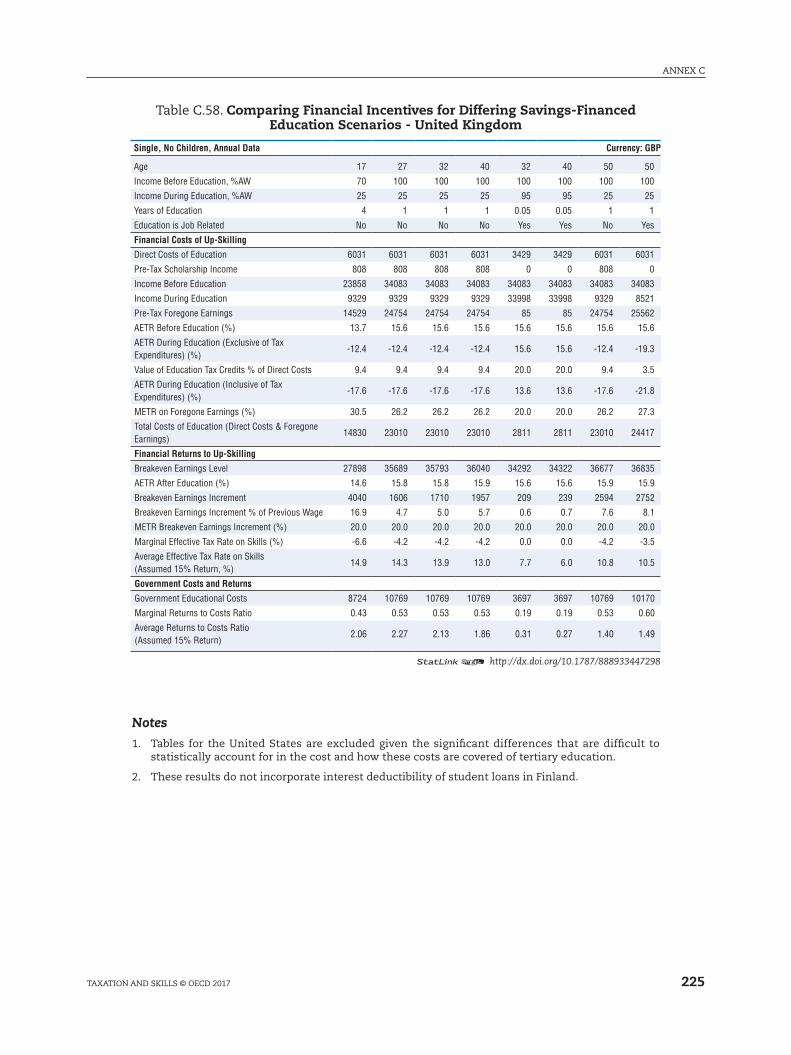
225
ANNEX C
TAXATION AND SkIllS © OECD 2017
Table C.58. Comparing Financial Incentives for Differing Savings-Financed Education Scenarios - United Kingdom
Single, No Children, Annual Data Currency: GBP
Age 17 27 32 40 32 40 50 50
Income Before Education, %AW 70 100 100 100 100 100 100 100
Income During Education, %AW 25 25 25 25 95 95 25 25
Years of Education 4 1 1 1 0.05 0.05 1 1
Education is Job Related No No No No Yes Yes No Yes
Financial Costs of Up-Skilling
Direct Costs of Education 6031 6031 6031 6031 3429 3429 6031 6031
Pre-Tax Scholarship Income 808 808 808 808 0 0 808 0
Income Before Education 23858 34083 34083 34083 34083 34083 34083 34083
Income During Education 9329 9329 9329 9329 33998 33998 9329 8521
Pre-Tax Foregone Earnings 14529 24754 24754 24754 85 85 24754 25562
AETR Before Education (%) 13.7 15.6 15.6 15.6 15.6 15.6 15.6 15.6
AETR During Education (Exclusive of Tax Expenditures) (%)
-12.4 -12.4 -12.4 -12.4 15.6 15.6 -12.4 -19.3
Value of Education Tax Credits % of Direct Costs 9.4 9.4 9.4 9.4 20.0 20.0 9.4 3.5
AETR During Education (Inclusive of Tax Expenditures) (%)
-17.6 -17.6 -17.6 -17.6 13.6 13.6 -17.6 -21.8
METR on Foregone Earnings (%) 30.5 26.2 26.2 26.2 20.0 20.0 26.2 27.3
Total Costs of Education (Direct Costs & Foregone Earnings)
14830 23010 23010 23010 2811 2811 23010 24417
Financial Returns to Up-Skilling
Breakeven Earnings Level 27898 35689 35793 36040 34292 34322 36677 36835
AETR After Education (%) 14.6 15.8 15.8 15.9 15.6 15.6 15.9 15.9
Breakeven Earnings Increment 4040 1606 1710 1957 209 239 2594 2752
Breakeven Earnings Increment % of Previous Wage 16.9 4.7 5.0 5.7 0.6 0.7 7.6 8.1
METR Breakeven Earnings Increment (%) 20.0 20.0 20.0 20.0 20.0 20.0 20.0 20.0
Marginal Effective Tax Rate on Skills (%) -6.6 -4.2 -4.2 -4.2 0.0 0.0 -4.2 -3.5
Average Effective Tax Rate on Skills (Assumed 15% Return, %)
14.9 14.3 13.9 13.0 7.7 6.0 10.8 10.5
Government Costs and Returns
Government Educational Costs 8724 10769 10769 10769 3697 3697 10769 10170
Marginal Returns to Costs Ratio 0.43 0.53 0.53 0.53 0.19 0.19 0.53 0.60
Average Returns to Costs Ratio (Assumed 15% Return)
2.06 2.27 2.13 1.86 0.31 0.27 1.40 1.49
12 http://dx.doi.org/10.1787/888933447298
Notes1. Tables for the United States are excluded given the significant differences that are difficult to
statistically account for in the cost and how these costs are covered of tertiary education.
2. These results do not incorporate interest deductibility of student loans in Finland.

227
Taxation and Skills
© OECD 2017
ANNEX D
Country Details
This discussion outlines specific skills tax expenditures (STEs) that have been added
to the personal income tax (PIT) and Social Security Contribution (SSC) systems of each
country’s Taxing Wages model for 2011. Details of these models can be found in OECD Taxing
Wages (OECD, 2014). These STEs largely offset the costs of skills investments through the PIT
system. A more detailed discussion of the STEs affecting skills investments are contained
in Torres (2012).
AustraliaFor Australia, three features of the tax system pertaining to skills have been modelled.
●● The first is the tax treatment of scholarship income. Scholarships, bursaries or other
educational allowances derived by a student receiving full-time education are generally
exempt from taxation. However this exemption does not apply to payments received by a
student on condition that the student will become or continue to be an employee of the payer.
●● The second provision modelled is the deductibility of training costs. These are tax-
deductible where the expenses are connected with a taxpayers’ current professional
activity. It is assumed that this deduction is available for ‘job-related education’, as
discussed in Section 4.5, but not otherwise.
●● The third feature is Australia’s system of income-contingent loans. As discussed in Section 3.2
and 4.3, a variety of interest rates and loan amounts have been modelled in the analysis.
In the Australian case, the key feature modelled is income-contingency of the repayment
of student debt. If a taxpayer does not earn more than AUS 51 309, no interest or loan
principal need be repaid.
AustriaFor Austria, two features of the tax system pertaining to skills have been modelled.
●● The first is the tax treatment of scholarship income. In Austria, scholarship income is tax
exempt where it is not related to employment. Where income is related to employment,
the tax exemption for scholarship income is not available. It is assumed in this study that
this deduction is not available for ‘job-related education’, as discussed in Section 4.5, but
is available otherwise.
●● The second provision modelled is the deductibility of training costs. These are
tax-deductible where the expenses are connected with a taxpayers’ current professional
activity. This provision is modelled in the opposite way to the scholarship income provision;
it is assumed that it is available for ‘job-related education’, but not otherwise.
ANNEX D
228 TAXATION AND SkIllS © OECD 2017
BelgiumFor Belgium, four features of the tax system pertaining to skills have been modelled.
●● The first provision modelled is the deductibility of training costs. These are tax-deductible
where these expenses are connected with a taxpayers’ current professional activity. It
is assumed that this deduction is available for ‘job-related education’, as discussed in
Section 4.5, but not otherwise.
●● The second provision is the tax treatment for students who work less than 23 days per
year. In these cases normal SSC rates do not apply; rather a reduced employees’ SSC rate
of 2.71% applies, as does a reduced employers’ SSC rate of 5.42%. This is assumed to only
be available to college students, as discussed in Sections 4.2 and 4.3.
●● The third provision is the tax exemption of scholarship income. This is assumed to be
available to all kinds of scholarship income.
●● The fourth provision is the tax treatment of student debt. As discussed in Section 3.2
and 4.3, a variety of interest rates and loan amounts have been modelled in the analysis.
In Belgium interest on student debt is assumed to be tax-deductible.
CanadaFor Canada, three features of the tax system pertaining to skills have been modelled.
●● The first is the exemption of scholarship income from taxation. Scholarships in respect of
non-research degrees that lead to a diploma or degree are exempted. Where the scholarship
received is pertaining to education that is part-time, the scholarship exemption is limited
to the value of tuition costs plus the costs of program-related materials. In this study,
it is assumed that scholarship income is exempt from taxation where education is full-
time. Otherwise, the amount of the deduction is limited to the value of the direct costs
of education (which in the model, are assumed to be tuition fees).
●● The second provision modelled is the Tuition Tax Credit. At federal level, this credit
provides a 15% non-refundable tax credit of the costs of tuition. There is also a 5.05%
credit applied at the provincial level for the province of Ontario. These credits together
comprised a 20.05% total credit for the costs of tuition. There is no limit on the amount of
tuition that can be claimed, but claims must exceed CAD 100. In the model it is assumed
that all direct educational costs paid by the student are tuition fees. The value of the credit
can be carried forward until it is exhausted. It is assumed that this credit is available
whether training is job-related or not.
●● The third provision is the tax treatment of student debt. As discussed in Section 3.2 and
4.3, a variety of interest rates and loan amounts have been modelled in the analysis. In
Canada, interest paid on student loans approved under the Canada Student loans Program
and similar provincial or territorial programs is eligible for a 15-percent non-refundable
tax credit. The value of the credits can be carried forward for up to five years after interest
payment have been made. It is assumed that this applies to student loans in the model.
The Education and Textbook Tax Credits are not modelled, as all the costs of education
in the model are assumed to be tuition fees. Finally, the deductibility of tuition assistance
received for programs that do not qualify for the Tuition Tax Credit is not modelled; it is
assumed that all education is eligible for the credit.
229
ANNEX D
TAXATION AND SkIllS © OECD 2017
ChileFor Chile, only the tax exemption of scholarship income is modelled. It is assumed that
this tax exemption is available whether the training is job-related or not.
Czech RepublicFor the Czech Republic, two features of the tax system pertaining to skills have been
modelled.
●● The first is the exemption of scholarship income from taxation. This exemption is available
to scholarships awarded from the state budget. It is assumed that scholarship income
received in this study is tax exempt. It is also assumed that this tax exemption is available
whether the training is job-related or not.
●● The second provision modelled is the deductibility of training expenses. It is assumed that
this deductibility is available whether the training is job-related or not. This tax deduction
is only available for taxpayers who are less than 26 years of age, or have dependents aged
less than 26. Deductibility for dependents is not modelled, so a taxpayer must be less than
26 years of age to avail of the deduction in the model.
DenmarkFor Denmark, three features of the tax system pertaining to skills have been modelled.
●● The first is the tax treatment of scholarship income. In Denmark, scholarship income is
normally treated as general income, and is modelled here as taxable.
●● The second provision is the tax treatment of student debt. As discussed in Section 3.2
and 4.3, a variety of interest rates and loan amounts have been modelled in the analysis.
In Denmark interest on student debt is assumed to be tax-deductible.
EstoniaFor Estonia, three features of the tax system pertaining to skills have been modelled.
●● The first is taxation of scholarship income from taxation. Scholarship income is normally
treated as general income if it is received in connection with employment. However
scholarships paid by public authorities are exempt from taxation.
●● The second provision modelled is the deductibility of training costs when these costs
relate to current professional activity. In Estonia these costs are deductible up to EUR
1 920 or 50% of the taxpayers’ income. It is assumed that this deductibility is available
whether the training is job-related or not. Deductibility for dependents is not modelled.
●● The third provision modelled is the exemption of working students from the lump-sum
social contribution of EUR 91.75 per month known as the Social Tax Minimum Obligation.
FinlandFor Finland three features of the tax system pertaining to skills have been modelled.
●● The first is the tax deductibility of skills spending from taxation. In Finland, work-related
skills expenditure is in certain cases deductible from taxable income. It is assumed that
this deduction is available for ‘job-related education’, as discussed in Section 4.5, but is
not available otherwise.
●● In addition, student grant income is generally subject to taxation, though with certain
special provisions applied. An allowance is provided with respect to municipal taxation
ANNEX D
230 TAXATION AND SkIllS © OECD 2017
for the value of grant income. The allowance is capped at EUR 2 600, and is also reduced
by 50% of earned income less the deduction for work-related expenses.
●● SSCs paid on wage income and other income from work are not paid on student grant
income. On student grant income only the health insurance contribution is paid.
●● Finland also allows interest on student debt to be deducted from the income tax base.
This feature is not modelled in the results presented in this study.
GreeceFor Greece, two features of the tax system pertaining to skills have been modelled.
●● The first is the tax treatment of scholarship income. In Greece, scholarship income awarded
by the Greek State is exempt from taxation. It is assumed in the model that scholarship
income received is state scholarship income; it is modelled as exempt from taxation. It
is assumed that this tax exemption is available whether the training is job-related or not.
●● The second provision modelled is the deductibility of training costs. This deductibility is
available for 10% of training costs up to a maximum of EUR 1 000.
Tax deductions available for education expenses for children are not modelled.
HungaryFor Hungary, two features of the tax system pertaining to skills have been modelled.
●● The first is the tax exemption of scholarship income. In Hungary, most scholarship income
is not taxable. In this study, it is assumed that scholarship income received by a student is
not taxable. It is assumed that this is the case whether the training is job-related or not.
●● The second is the reduced rates of employers’ SSCs when a worker is below 25 or above
55 years of age. In these instances income up to HUF 1 200 000 is charged at a rate of
12.5% (lower than the standard employers’ SSC rate of 27%). Income above HUF 1 200 000
is taxed at a rate of 27%.
IcelandFor Iceland, only the tax deductibility of educational expenses is modelled. It is assumed
that this deduction is available for ‘job-related education’, as discussed in Section 4.5, but
not otherwise.
IrelandFor Ireland, two features of the tax system pertaining to skills have been modelled.
●● The first is the tax treatment of scholarship income. In Ireland, scholarship income is
exempt from taxation. It is assumed that this tax exemption is available whether the
training is job-related or not.
●● The second provision modelled is tax relief available for tuition fees. This tax relief is
assumed to be available for direct costs of education; however the deductible amount is
net of any scholarship income received. This relief is only available for fees above EUR
2 000 for full-time students and EUR 1 000 for part-time students. The maximum amount
of fees on which tax relief can be claimed is EUR 7 000 at the standard rate of 20%.1
231
ANNEX D
TAXATION AND SkIllS © OECD 2017
IsraelFor Israel2, three features of the tax system pertaining to skills have been modelled.
●● The first is the tax treatment of scholarship income. In Israel, scholarship income is
exempt from taxation up to a ceiling of IlS 92 000. It is assumed that this tax exemption
is available whether the training is job-related or not.
●● The second provision modelled is the deductibility of training costs. These are tax-
deductible where these expenses are connected with a taxpayers’ current professional
activity. It is assumed that this deduction is available for ‘job-related education’, as
discussed in Section 4.5, but is not available otherwise.
●● The third feature is the tax credit for education expenses. This is modelled as being
available for student’s basic education (being related to a profession is not required). It is
assumed that it is not available for job-related training (so that taxpayers cannot claim
both the credit and the allowance). The value of the credit is IlS 2 508.
ItalyFor Italy, two features of the tax system pertaining to skills have been modelled.
●● The first is the tax treatment of scholarship income. In Italy, scholarship income is exempt
from PIT, and is subject to a special schedule for SSCs. These contributions are levied on
scholarship income at a rate of 17% where the employee is paying contributions on some
other income, and 26.72% where the employee is paying no other SSCs. Two-thirds of the
contribution is paid by the employer, one-third by the worker. It is assumed that this PIT
exemption and special SSC schedule is available whether the training is job-related or not.
●● The second provision modelled is the tax credit for educational expenses. This credit
provides a 19% non-refundable tax credit for the costs of education. There is no limit on
the expenses that can be claimed.
The 19% tax credit related to rental expenses for students who travel to study is not
modelled. This is due to data limitations on student rental income.
LuxembourgFor luxembourg, two features of the tax system pertaining to skills have been modelled.
●● The first is the tax treatment of scholarship income. In luxembourg, scholarship income
is exempt from PIT and SSCs. It is assumed that this tax exemption is available whether
the training is job-related or not.
●● The second provision modelled is the deductibility of training costs. It is assumed that
this deductibility is available whether the training is job-related or not.
Tax deductions available for education expenses for children are not modelled; nor are
exemptions for certain other forms of student income.
MexicoFor Mexico, two features of the tax system pertaining to skills have been modelled.
●● The first is the tax treatment of scholarship income. In Mexico, scholarship income is
partially exempt from taxation. This exemption is granted up to a limit. The sum of
exempt scholarship income and other taxable work-related income (wages) should not
be higher than 7 times the minimum wage (MXN 148 344). When this sum is higher,
the exempt income is limited to 1 annual minimum wage. However, the sum of wage
ANNEX D
232 TAXATION AND SkIllS © OECD 2017
income and exempt scholarship income cannot be lower than 7 minimum wages as
a result of this limit.
●● The second provision modelled is the deductibility of education costs. The maximum
deductible varies by type of education; it is assumed that the amount for the highest
qualification (professional technical education: MXN 17 100) is available for each taxpayer.
Tax deductions available for education expenses for children are not modelled.
NetherlandsFor the Netherlands, two features of the tax system pertaining to skills have been
modelled.
●● The first is the tax treatment of scholarship income. In the Netherlands, scholarships
are given as conditional loans: conditional on a student completing a degree in a given
time period. It is assumed that all scholarships for university education are not repaid
and are therefore tax exempt. For the purposes of the models in this study, it is assumed
that the scholarship income received by the student is exempt from taxation if the training
is not job-related (such as university education). If the training is job-related, then the
scholarship income is taxable.
●● The second is the deductibility of training costs. In the Netherlands this tax exemption is
available whether the training is job-related or not. Deductible costs should exceed EUR
500 per year, but cannot exceed EUR 15 000 per year.
New ZealandFor New Zealand, only the tax exemption of scholarship income is modelled. Specifically,
the Course Participation Allowance is exempt from taxation, as are scholarships made
under the Education Act 1989. It is assumed that scholarship income received by students
completing four-year degrees is exempt from taxation. It is assumed that scholarship income
received by students undertaking job-related training is not tax-exempt.
NorwayFor Norway, three features of the tax system pertaining to skills have been modelled.
●● The first is the exemption of scholarship income from taxation where this income is not
related to employment. In Norway, where scholarship income is related to employment, the
tax exemption is not available. Other forms of scholarship income are exempt from taxation.
●● The second provision modelled is the deductibility of training costs. These are tax-
deductible where these expenses are connected with a taxpayers’ current professional
activity. It is assumed that this deduction is available for ‘job-related education’, as
discussed in Section 4.5, but is not available otherwise.
●● The third provision is the tax treatment of student debt. As discussed in Section 3.2 and 4.3,
a variety of interest rates and loan amounts have been modelled in the analysis. In Norway
interest on student debt is assumed to be tax-deductible.
PolandFor Poland, two features of the tax system pertaining to skills have been modelled.
●● In Poland, normal income earned by students is subject to taxation, but scholarship income
is modelled as tax-exempt. It is assumed that this tax exemption is available whether the
training is job-related or not.
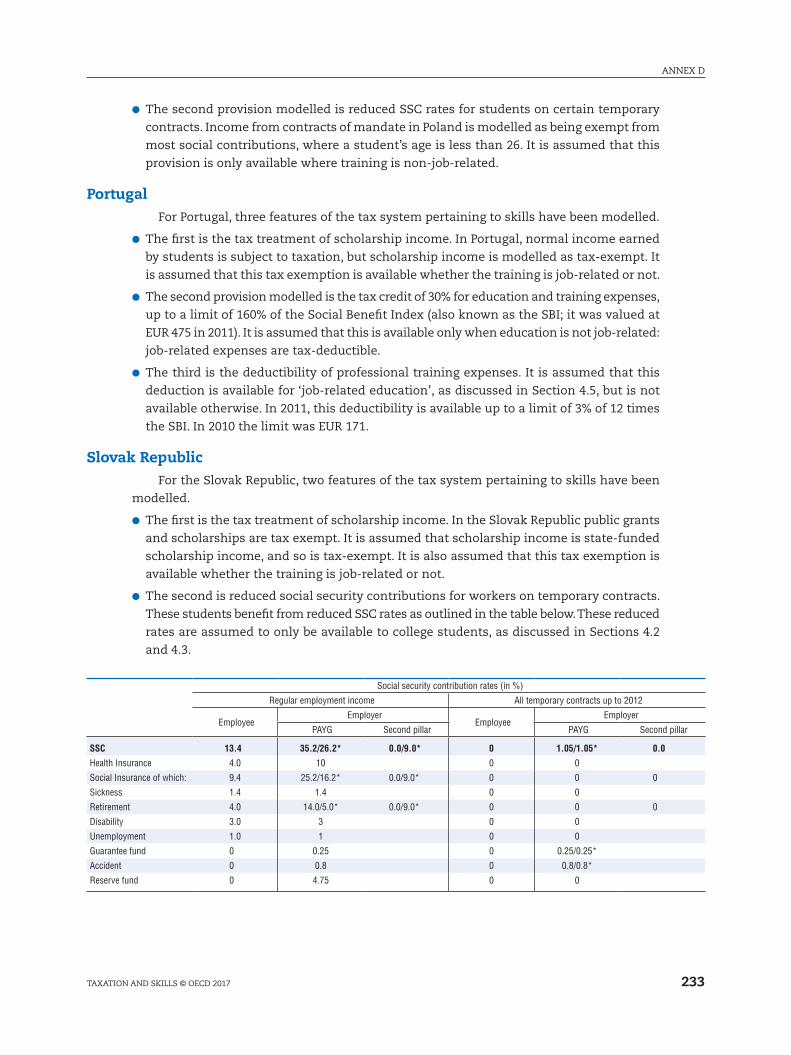
233
ANNEX D
TAXATION AND SkIllS © OECD 2017
●● The second provision modelled is reduced SSC rates for students on certain temporary
contracts. Income from contracts of mandate in Poland is modelled as being exempt from
most social contributions, where a student’s age is less than 26. It is assumed that this
provision is only available where training is non-job-related.
PortugalFor Portugal, three features of the tax system pertaining to skills have been modelled.
●● The first is the tax treatment of scholarship income. In Portugal, normal income earned
by students is subject to taxation, but scholarship income is modelled as tax-exempt. It
is assumed that this tax exemption is available whether the training is job-related or not.
●● The second provision modelled is the tax credit of 30% for education and training expenses,
up to a limit of 160% of the Social Benefit Index (also known as the SBI; it was valued at
EUR 475 in 2011). It is assumed that this is available only when education is not job-related:
job-related expenses are tax-deductible.
●● The third is the deductibility of professional training expenses. It is assumed that this
deduction is available for ‘job-related education’, as discussed in Section 4.5, but is not
available otherwise. In 2011, this deductibility is available up to a limit of 3% of 12 times
the SBI. In 2010 the limit was EUR 171.
Slovak RepublicFor the Slovak Republic, two features of the tax system pertaining to skills have been
modelled.
●● The first is the tax treatment of scholarship income. In the Slovak Republic public grants
and scholarships are tax exempt. It is assumed that scholarship income is state-funded
scholarship income, and so is tax-exempt. It is also assumed that this tax exemption is
available whether the training is job-related or not.
●● The second is reduced social security contributions for workers on temporary contracts.
These students benefit from reduced SSC rates as outlined in the table below. These reduced
rates are assumed to only be available to college students, as discussed in Sections 4.2
and 4.3.
Social security contribution rates (in %)
Regular employment income All temporary contracts up to 2012
EmployeeEmployer
EmployeeEmployer
PAYG Second pillar PAYG Second pillar
SSC 13.4 35.2/26.2* 0.0/9.0* 0 1.05/1.05* 0.0
Health Insurance 4.0 10 0 0
Social Insurance of which: 9.4 25.2/16.2* 0.0/9.0* 0 0 0
Sickness 1.4 1.4 0 0
Retirement 4.0 14.0/5.0* 0.0/9.0* 0 0 0
Disability 3.0 3 0 0
Unemployment 1.0 1 0 0
Guarantee fund 0 0.25 0 0.25/0.25*
Accident 0 0.8 0 0.8/0.8*
Reserve fund 0 4.75 0 0
ANNEX D
234 TAXATION AND SkIllS © OECD 2017
SloveniaFor Slovenia, three features of the tax system pertaining to skills have been modelled.
●● The first is the tax treatment of scholarship income. Scholarship income is tax-exempt
up to the level of the minimum wage (EUR 8 977). It is assumed that this tax exemption
is available whether the training is job-related or not.
●● The second provision modelled is reduced SSC rates for student income is not subject
to the to the social security contributions levied on wage income; instead a student’s
employer pays a flat rate of EUR 53.52 annually.
●● The third provision is modelled is a fixed tax deduction for student income. This provision
was worth EUR 3 143.57 in 2011.
SpainFor Spain, only the limited tax exemption of scholarship income is modelled. In
Spain, most scholarship income is treated as normal income, except for public grants and
scholarships which are exempt. This exemption is capped at EUR 3 000 per year, rising
to EUR 15 000 for four-year university degrees. Scholarship income is modelled as being
exempt up to a value of 3 000, except for four-year long educational investments, where
the exemption exists up to EUR 15 000. It is assumed that this tax exemption is available
whether the training is job-related or not.
SwedenFor Sweden, two features of the tax system pertaining to skills have been modelled.
●● The first is the tax treatment of scholarship income. In Sweden, normal income earned
by students is subject to taxation, but scholarship income, as long as it is not paid as
remuneration, is modelled as tax-exempt. It is assumed that this tax exemption is available
whether the training is job-related or not.
●● The second provision modelled is the deductibility of training costs. These are tax-deductible
where these expenses are connected with a taxpayers’ current professional activity. It is
assumed that this deduction is available for ‘job-related education’, as discussed in Section 4.5,
but is not available otherwise. As Swedish law requires a taxpayer to be receiving full
or close to full payment from their employer during periods of education, it is assumed
that this allowance is not available during periods of education lasting one year or more.
SwitzerlandFor Switzerland, two features of the tax system pertaining to skills have been modelled.
●● The first is the tax treatment of scholarship income. In Switzerland, normal income earned
by students is subject to taxation, but scholarship income is modelled as tax-exempt. It
is assumed that this tax exemption is available whether the training is job-related or not.
●● The second provision modelled is the deductibility of training costs. These are tax-
deductible where these expenses are connected with a taxpayers’ current professional
activity. It is assumed that this deduction is available for ‘job-related education’, as
discussed in Section 4.5, but is not available otherwise.
235
ANNEX D
TAXATION AND SkIllS © OECD 2017
TurkeyFor Turkey, two features of the tax system pertaining to skills have been modelled.
●● The first is the tax treatment of scholarship income. In Turkey, scholarship income is
exempt from taxation, except where this income is earned by apprentices. It is assumed
that the training undertaken in the model is not apprenticeship training, and that the
scholarship income is exempt from taxation. It is assumed that this tax exemption is
available whether the training is job-related or not (it is assumed that job-related training
is not specifically apprenticeship training).
●● The second provision modelled is the deductibility of educational costs provided that they
do not exceed 10% of the declared income. It is assumed that this is available whether
the training is job-related or not.
Tax deductions available for education expenses for children are not modelled.
United KingdomFor the United kingdom, two features of the tax system pertaining to skills have been
modelled.
●● The first is the tax treatment of scholarship income. To qualify for the exemption from tax
and SSCs the scholarship income must be associated with training that is unrelated to any
work or employment. It is assumed that this exemption is not available for ‘job-related
education’, as discussed in Section 4.5, but is available otherwise. Where a scholarship is
paid by an employer to an employee, and certain conditions are met, a cap of GBP 15 480
applies in the United kingdom. In this study, it is assumed that scholarships are paid by
the government, and this provision is not modelled.
●● The second provision modelled is the deductibility of training costs. These are tax-
deductible where these expenses are integral/wholly necessary to the job with a taxpayers’
current professional activity. It is assumed that this deduction is available for ‘job-related
education’, as discussed in Section 4.5, but is not available otherwise.
United StatesFor the United States, five features of the tax system pertaining to skills exist.3
●● The first is the tax treatment of scholarship income. In the United States, this income
is treated as normal income. There are two exceptions. The first is where the income is
used to study abroad. Here it is assumed that all education is undertaken in the country,
so scholarship income remains taxable. The second is where the scholarship income is
conditional on documented expenses including tuition and fees required for attendance,
books, supplies, and required equipment. To account for this, it is assumed that scholarship
income in excess the direct costs of education is taxable, but that scholarship income below
this amount is not taxable. It is assumed that this tax exemption is available whether the
training is job-related or not.
●● The second provision modelled is the American Opportunity Tax Credit. This partially
refundable tax credit is available for only four years per student and only for expenses
associated with the first four years of post-secondary education. The student must be
enrolled at least half-time in a degree program and cannot have a drug conviction. This
credit is calculated as 100% of first USD 2 000 of expenses less related scholarships4 and
25% of next USD 2 000 of expenses less related scholarships; 40% of credit (up to USD 1 000)
may be refundable. For example, the maximum credit is USD 2 500 but only USD 1 000 is
ANNEX D
236 TAXATION AND SkIllS © OECD 2017
refundable. There is a limit on the value of the credit; USD 180 000 if married filing jointly,
which linearly phases out starting at USD 160 000. The limit begins at USD 80,000 for
single, head of household or qualifying widowers, linearly phasing out at USD 90 000. For a
specific student, education expenses cannot be claimed simultaneously with the lifetime
learning Tax Credit, or with the deduction for Qualified Higher Education expenses. In
addition, eligible expenses include tuition, required enrolment fees and course-related
books, supplies, and equipment after deducting scholarship income used to pay the
eligible expenses.
●● The third provision modelled is lifetime learning Tax Credit. This credit is not refundable.
This credit is available at a value of USD 2 000 per return, calculated as 20% of first
USD 10 000 of expenses less related scholarships. There is a limit on the value of the credit;
USD 122 000 if married filing jointly, which linearly phases out starting at USD 102 000. The
limit begins at USD 61 000 for single, head of household or qualifying widowers, linearly
phasing out at USD 51 000. The credit is available for undergraduate and graduate education
as well as courses to acquire or improve job skills. Eligible education expenses include
tuition, books and fees that must be paid to the educational institution after deducting
scholarship income used to pay the eligible expenses. For a specific student, education
expenses cannot be claimed simultaneously with the American Opportunity Tax Credit,
or with the deduction for tuition and fees.
●● The fourth provision modelled is the deduction for tuition and fees, an alternative to the
American Opportunity Tax Credit and the lifetime learning Tax Credit. The maximum
deductible qualified expenses are the lesser of qualifying expenses less related scholarships
and USD 4 000 for taxpayers with incomes of USD 65 000 or less (USD 130 000 for married
filing jointly), and the lesser of qualifying expenses less related scholarships and USD 2 000
if income does not exceed USD 80 000 (USD 160 000 if married filing jointly).
●● The fifth provision is the deductibility of interest paid on student debt. This deductibility
is capped at USD 2 500 per year. Where the students income does not exceed USD 75 000
(USD 150 000 if married filing jointly) for joint returns, linearly phased out starting at
USD 60 000 (USD 150 000 if married filing jointly).
Notes1. This threshold has been increased steadily: in 2016 it was available for EUR 3 000 (USD 4 173) for
full-time students and EUR 1 500 for part-time students (USD 2 086.5).
2. The statistical data for Israel are supplied by and under the responsibility of the relevant Israeli authorities. The use of such data by the OECD is without prejudice to the status of the Golan Heights, East Jerusalem and Israeli settlements in the West Bank under the terms of international law.
3. There are additional tax benefits including: up to USD 5 250 of employer provided educational assistance may be excluded from income, a deduction for non-reimbursed work-related education expenses, and tax preferred education savings.
4. Scholarships can cover tuition, fees, books, supplies as well as living expenses. The portion covering living expenses would not be deducted from the expenses eligible for the credit.
ORGANISATION FOR ECONOMIC CO-OPERATION AND DEVELOPMENT
The OECD is a unique forum where governments work together to address the economic, social and
environmental challenges of globalisation. The OECD is also at the forefront of efforts to understand and
to help governments respond to new developments and concerns, such as corporate governance, the
information economy and the challenges of an ageing population. The Organisation provides a setting
where governments can compare policy experiences, seek answers to common problems, identify good
practice and work to co-ordinate domestic and international policies.
The OECD member countries are: Australia, Austria, Belgium, Canada, Chile, the Czech Republic,
Denmark, Estonia, Finland, France, Germany, Greece, Hungary, Iceland, Ireland, Israel, Italy, Japan, korea,
latvia, luxembourg, Mexico, the Netherlands, New Zealand, Norway, Poland, Portugal, the Slovak Republic,
Slovenia, Spain, Sweden, Switzerland, Turkey, the United kingdom and the United States. The European
Union takes part in the work of the OECD.
OECD Publishing disseminates widely the results of the Organisation’s statistics gathering and research
on economic, social and environmental issues, as well as the conventions, guidelines and standards agreed
by its members.
OECD PUBlISHING, 2, rue André-Pascal, 75775 PARIS CEDEX 16
(23 2017 01 1 P1) ISBN 978-92-64-26937-8 – 2017

OECD Tax Policy Studies
Taxation and Skills
OECD Tax Policy Studies
Taxation and SkillsThis series consists of studies analysing the effects of tax policies that have occurred in the past or might be considered for the future. Its primary purpose is to assist policy makers in designing tax policies that are suited to their objectives.
This Tax Policy Study on Taxation and Skills examines how tax policy can encourage skills development in OECD countries. This study also assesses the returns to tertiary and adult education and examines how these returns are shared between governments and students. The study builds indicators that examine incentives for individuals and governments to invest in education. These indicators take into account the various financial costs of skills investments for individuals such as foregone after-tax earnings and tuition fees, as well as whether investments are financed with savings or with student loans. Costs borne by governments such as grants, scholarships, lost taxes, and skills tax expenditures are also accounted for. The indicators also incorporate the returns to skills investments for individuals and governments through higher after-tax wages and higher tax revenues respectively.
For a complete list of titles that have been published in the OECD Tax Policy Studies series, please visit www.oecd-ilibrary.org/taxation/oecd-tax-policy-studies_19900538.
iSbn 978-92-64-26937-823 2017 01 1 P
Consult this publication on line at http://dx.doi.org/10.1787/9789264269385-en.
This work is published on the OECD iLibrary, which gathers all OECD books, periodicals and statistical databases. Visit www.oecd-ilibrary.org for more information.
9HSTCQE*cgjdhi+ No. 24
Taxation an
d S
killsO
EC
D Tax P
olicy S
tud
ies