Taxation of dividend income and economic growth - EconStor
32
Dackehag, Margareta; Hansson, Åsa Working Paper Taxation of dividend income and economic growth: The case of Europe IFN Working Paper, No. 1081 Provided in Cooperation with: Research Institute of Industrial Economics (IFN), Stockholm Suggested Citation: Dackehag, Margareta; Hansson, Åsa (2015) : Taxation of dividend income and economic growth: The case of Europe, IFN Working Paper, No. 1081, Research Institute of Industrial Economics (IFN), Stockholm This Version is available at: http://hdl.handle.net/10419/129642 Standard-Nutzungsbedingungen: Die Dokumente auf EconStor dürfen zu eigenen wissenschaftlichen Zwecken und zum Privatgebrauch gespeichert und kopiert werden. Sie dürfen die Dokumente nicht für öffentliche oder kommerzielle Zwecke vervielfältigen, öffentlich ausstellen, öffentlich zugänglich machen, vertreiben oder anderweitig nutzen. Sofern die Verfasser die Dokumente unter Open-Content-Lizenzen (insbesondere CC-Lizenzen) zur Verfügung gestellt haben sollten, gelten abweichend von diesen Nutzungsbedingungen die in der dort genannten Lizenz gewährten Nutzungsrechte. Terms of use: Documents in EconStor may be saved and copied for your personal and scholarly purposes. You are not to copy documents for public or commercial purposes, to exhibit the documents publicly, to make them publicly available on the internet, or to distribute or otherwise use the documents in public. If the documents have been made available under an Open Content Licence (especially Creative Commons Licences), you may exercise further usage rights as specified in the indicated licence.
-
Upload
khangminh22 -
Category
Documents
-
view
0 -
download
0
Transcript of Taxation of dividend income and economic growth - EconStor

Dackehag, Margareta; Hansson, Åsa
Working Paper
Taxation of dividend income and economic growth:The case of Europe
IFN Working Paper, No. 1081
Provided in Cooperation with:Research Institute of Industrial Economics (IFN), Stockholm
Suggested Citation: Dackehag, Margareta; Hansson, Åsa (2015) : Taxation of dividend incomeand economic growth: The case of Europe, IFN Working Paper, No. 1081, Research Institute ofIndustrial Economics (IFN), Stockholm
This Version is available at:http://hdl.handle.net/10419/129642
Standard-Nutzungsbedingungen:
Die Dokumente auf EconStor dürfen zu eigenen wissenschaftlichenZwecken und zum Privatgebrauch gespeichert und kopiert werden.
Sie dürfen die Dokumente nicht für öffentliche oder kommerzielleZwecke vervielfältigen, öffentlich ausstellen, öffentlich zugänglichmachen, vertreiben oder anderweitig nutzen.
Sofern die Verfasser die Dokumente unter Open-Content-Lizenzen(insbesondere CC-Lizenzen) zur Verfügung gestellt haben sollten,gelten abweichend von diesen Nutzungsbedingungen die in der dortgenannten Lizenz gewährten Nutzungsrechte.
Terms of use:
Documents in EconStor may be saved and copied for yourpersonal and scholarly purposes.
You are not to copy documents for public or commercialpurposes, to exhibit the documents publicly, to make thempublicly available on the internet, or to distribute or otherwiseuse the documents in public.
If the documents have been made available under an OpenContent Licence (especially Creative Commons Licences), youmay exercise further usage rights as specified in the indicatedlicence.

Research Institute of Industrial Economics
P.O. Box 55665
SE-102 15 Stockholm, Sweden
www.ifn.se
IFN Working Paper No. 1081, 2015
Taxation of Dividend Income and Economic Growth: The Case of Europe Margareta Dackehag and Åsa Hansson

Taxation of Dividend Income and Economic Growth: The Case of Europe
Margareta Dackehag & Åsa Hansson* Department of Economics
Lund University
Abstract
More recently researchers have turned to analyze how the tax structure, rather than the overall tax level, affects economic performance. For instance, several papers have investigated how taxation on corporate and individual (labor) income influences growth. Taxation of dividend income may also influence growth via its impact on investments and firm behavior. Within the academic community there is conflicting views about the impact taxation of dividends has on firm behavior and, hence, on economic performance. According to the “traditional view”, taxation of dividends is distortionary and increases the cost of equity. According to the “new view”, taxation of dividends does not influence the marginal cost of capital and consequently has no impact on investment decisions. To our knowledge, this paper is the first study to explore how tax rates on dividends affect economic growth, by using panel data from 1990 till 2008 for 18 European countries. We find that taxation of dividend income negatively influences economic growth, a result that corroborates the old view of dividends taxation as distortionary and also has some policy implication for the European countries in question.
JEL classification: H21 ; H24 ; H25 ; O40
Keywords: Economic growth, taxation of corporate income, taxation of personal income
_________________________________________________________________________ ∗Corresponding author, Department of Economics, Lund University, PO Box 7082, S-22007, Lund, Sweden and Research Institute of International Economics, e-mail address: [email protected]. The authors thank participants at the 17th annual conference on European integration, SNEE, and particularly Lawrence Kryzanowski for valuable comments on an earlier draft.
1

1. Introduction
As the globalization process and international mobility of resources have intensified so has tax
competition and the pressure under which domestic tax systems are put. As a consequence
research has turned its focus to more and more study how different taxes, rather than the overall
tax level, affect economic behavior. For instance, it is by now pretty well established that the
corporate tax rate negatively affects investments, influences where profits are reported, and
negatively affects economic growth. Consequently, corporate tax rates have declined worldwide.
The average rates in the EU members and OECD were 41.6 and 41.0 percent, respectively in
1990, in 2014 these rates had declined to 24.3 and 25.3 percent, respectively (OECD, Tax
database, 2015). At the same time the less mobile tax bases have seen increased tax burdens. For
instance, the share of property taxation over total tax revenues has almost doubled from 0.8 (EU)
and 0.6 (OECD), respectively to 1.3 (EU and OECD) percent of total tax revenues in 2013
(OECD, Tax Revenue Statistics).
A tax that has received considerable attention in the academic community for decades is
the dividend taxation. The controversy about the potentially detrimental effects of the dividend
tax on investments and firm behavior has been debated since the 1970s, and is still far from
resolved. Whether the “new view” - which claims that dividend taxation is irrelevant for firms’
investment decisions and hence to be considered a lump sum tax - or the “traditional view” -
which claims that the dividend taxation affects capital costs and thereby investment decisions -
more accurately describes reality is still debated. As a result numerous studies have been
undertaken in order to test the two views. Commonly the effect a change in dividend taxation has
on amounts of dividends distributed has been tested. Even though the empirical results are
somewhat mixed most studies tend to support the “traditional view” (Zodrow 1991). Despite this
finding, the direct effect of the dividend tax on overall economic performance is basically
unstudied. Recent studies on the structure of taxation and economic growth tend to treat personal
income in aggregate (Arnold 2008, OECD 2010). Personal income is heterogeneous, both as it
often groups labor and capital income together and is taxed at progressive rates, and therefore is
likely to have different distortionary effects and, hence, different effects on economic
performance.
Despite the lack of research on the dividends tax effect on economic growth the Bush
administration implemented a dividend tax cut in 2003 in order to boost the US economic
2

performance (“Jobs and Growth Tax Relief Reconciliation Act”). The effect of this cut has been
studied and generally found to have increased dividends distributed and induced a more efficient
distribution of investments across firms (Chetty & Saez 2006).
This paper examines the correlation between income taxation, in general, and taxation of
dividends in particular and economic growth. This is done by studying how taxation of corporate,
top labor income as well as dividend income impact economic growth in 18 European countries
during the period 1990 to 2008.1 We follow standard growth estimation techniques with country
and year fixed effects to determine the effect of income tax rates on GDP per capita growth.
The paper is organized as follow. The next section gives a brief summary of the literature
on taxation and economic growth. Section 3 provides a more detailed review of the different
views of dividend taxation and the effects on investment and firm behavior. Section 4 describes
the method and section 5 the data. Section 6 presents the results, section 7 provides some
sensitivity analysis, and finally section 8 concludes the paper.
2. Literature on taxation and economic growth
There is a vast literature on how taxation distorts individuals’ and firms’ decisions concerning for
example how much labor individuals supply, how hard they work, how and where investments
are made, and where firms choose to locate production and profit. Numerous studies have
investigated how corporate and labor taxation, and not least the taxation of dividends affect
individuals’ and firms’ behavior.
There is also a sizable literature documenting the overall effect of government size on
economic growth. Though the results are scattered, recent literature tends to find that government
size, typically measured as total government expenditures as a fraction of GDP, is negatively
correlated with economic growth in rich economies (see e.g., Fölster & Henrekson 2001,
Romero-Avila & Strauch 2008, and Bergh & Karlsson 2010).
The reason government expenditures are thought to influence economic growth
negatively is the distortionary effect of taxation. Studies analyzing the correlation between
overall government expenditures and economic growth are, hence, using an indirect way to study
how taxation affects economic growth. It is likely that not only the aggregated total tax burden
1 The countries included are Austria, Belgium, Denmark, Finland, France, Germany; Greece, Iceland, Ireland, Italy, Luxembourg, Netherlands, Norway, Portugal, Spain, Sweden, Switzerland, and UK.
3

but also the disaggregated structure of taxation matters for economic growth. Some taxes are
thought to be more distortionary than others as different taxes have more or less mobile tax bases.
For instance, high corporate tax rates are often assumed to be more harmful for economic
activities than taxation of property. Hence, various taxes have different effects on the level of
economic activity. Whether these effects carries over to impact also the growth rate is less clear,
however.2 A study by Easterly (1993) provides empirical evidence that distortions are negatively
correlated with growth rates. Several studies have analyzed the direct link between taxation of
typically personal income and economic growth (see e.g., Koester & Kormendi 1989, Plosser
1992, Slemrod 1995, Padovano & Galli 2001 and 2002, Leibfritz, Thornton & Bibbee 1997,
Dowrick 1993). The results from this literature are equally scattered, however.3
Recent research has turned to investigate economic growth and the structure of taxation,
primarily using tax measures from tax revenues, and economic growth. The results from these
studies are mixed and, hence, hard to draw policy implications from. For example, Dowrick
(1993) finds personal income taxes to have a negative impact on economic growth while his
results indicate no such relationship for corporate tax rates and economic growth. This is
consistent with Widmalm’s study (2001) that investigates the GDP growth effect of the tax
structure, defined as the proportion of tax revenues stemming from taxes on personal income,
corporate income, property taxes, taxes on goods and services, and taxes on wages, and a
measure for tax progressivity. Her results reveal a negative correlation between the proportion of
tax revenues from personal income taxes and economic growth, while no such correlation is
found for the proportion of corporate tax revenues. This may seem surprising as the corporate tax
rate is commonly thought to be more distortionary than taxation of personal income. Arnold
(2008) use annual panel data for 21 OECD countries to study the link between tax structure and
2 This relates to the difference between neoclassical growth models developed by Robert Solow in the 1950s and the endogenous growth models developed by Paul Romer and Robert Lucas in the 1980s. In the neoclassical growth models taxes have no permanent effects on per capita GDP growth, regardless of the distortionary effects of the taxes. In the endogenous growth models they do, however. 3 Plosser (1992) finds tax burdens measured as the share of revenues from income and profit taxes to GDP to be negatively correlated with GDP growth while Koester & Kormendi (1989) detect no statistically significant relationship between taxes and economic growth. Contrary, Padovano & Galli (2001) observe tax rates to negatively and statistically significantly impact growth. In a later paper, Padovano & Galli (2002), confirm the negative correlation between marginal tax rates and economic growth but find average taxes to have an insignificant impact. Contrary to these findings Leibfritz, Thornton & Bibbee (1997) obtain a negative correlation between both average and marginal tax rates and economic growth. Dowrick (1993) finds personal income taxes to have a negative effect on growth.
4

economic growth. His tax measures are also based on tax revenues obtained from different taxes.
Unlike previous studies Arnold uses annual data and the estimations are based on a standard
empirical model and a government budget constraint enabling evaluation of revenue-neutral
changes in the tax structure. The results indicate that a stronger reliance on income taxes imply
significantly lower levels of GDP per capita than the use of taxes on consumption and property.
Among the income taxes, he finds corporate income taxes to be associated with lower levels of
GDP per capita than personal income taxes (cf. OECD 2010). Xing (2012), however, shows that
Arnold’s result is not robust under different assumptions about heterogeneity across countries and
the underlying econometric model and finds no robust ranking among corporate income taxes,
personal income taxes and consumption taxes.
Kneller et al. (1999), also control for the government budget constraint and study not only
the tax structure by dividing taxes into distortionary and non-distortionary taxes (measured as tax
revenue as a share of GDP) but also the expenditure structure by dividing expenditures into
productive and non-productive. Their results lend support to distortionary taxes reducing growth
and productive spending enhancing growth. A later study by Gemmell et al. (2007) confirms this
result.
Alfonso & Alegre (2011) estimate the impact of fiscal policies (measured as shares of
GDP and with a focus on government expenditures) on long term economic growth in 15 EU
countries using a dynamic GMM model. They find a negative impact of public consumption and
social security contributions on economic growth, while a positive impact of public investment
on economic growth.
A shortcoming of these studies is that they tend to use backward looking average tax
measures based on tax revenues. As distortions from taxation to a large degree are influenced by
forward looking marginal tax rates it may be more fruitful to analyze the link between marginal
tax rates and economic growth. An exception to this is the study by Lee & Gordon (2005). They
estimate the impact of statutory corporate and personal income tax rates and the value added tax
rate on GDP per capita growth using panel data from 70 countries during the time period 1970 to
1997. Results show a significant negative correlation between statutory corporate tax rates and
growth but no significant correlation between top statutory personal income tax rates and growth.
When they restrict the sample, by including an OECD-dummy, the corporate tax rate effect on
5

growth for the OECD countries becomes nearly zero, suggesting that the corporate taxation is
less harmful to growth in more developed countries than in less developed countries.
Another shortcoming with existing studies analyzing the structure of taxation is that they
tend to aggregate personal income, grouping labor and capital income together. As income from
labor and capital may have very different incentive effects and, thus, affect economic growth
differently this may be problematic as will be discussed in greater detail below.
3. Taxation of income, firm behavior and economic growth
There are several reasons to expect both corporate and personal taxation of labor and dividend
income to impact economic growth. Starting with the dividend taxation, the main focus of this
paper and the tax of which the effects are perhaps the most controversial, there are several
reasons to expect this tax to influence growth via its impact on investment and firm behavior.
Indeed, Bush’s aim with the “Jobs and Growth Tax Relief Reconciliation Act” of 2003, that
reduced double taxation of dividends, was to boost economic growth. However, within the
academic community the logic behind this act can be debated as there is no consensus about the
impact taxation of dividends has on firm behavior and, hence, on economic performance. The
two competing views have quite different implications about the abolishment of double taxation.4
According to the “new view” taxation of dividends does not influence the marginal cost
of capital and consequently has no impact on firms’ investment decisions (Auerbach 1979,
Bradford 1981). Dividend taxation can be regarded as a lump-sum tax. The argument behind this
result is that firms finance their activities through retained earnings and thus avoid double
taxation. Instead of issuing new equity existing profits are reinvested rather than distributed to
shareholders, and no dividend tax is therefore triggered. According to this view future dividend
taxes are already capitalized in share prices implying that a reduction in dividend taxation would
result in windfall gains to existing shareholders who would benefit from increasing stock prices.
Abolishing double taxation would, hence, be undesirable and result in large revenue losses to the
government and leave capital costs of investments unchanged but provide large windfall gains to
existing shareholders. Moreover, even though taxation of dividends may lower domestic savings
4 In many countries business profits are subject to double taxation. Profits are first taxed at the corporate level and then again when the remaining profits are made available to the owner by either dividend or capital gains taxation.
6

it is thought not to impact the amount of investments made as domestic capital is replaced by
foreign. In small open economies foreign capital is assumed to be a perfect substitute for
domestic capital, making taxation of dividends irrelevant for firms’ investment costs.5 According
to the new view, we would not expect a negative relationship between dividend taxation and
economic growth; on the contrary, if assumed to be a lump sum tax it is an efficient tax to use.
Empirical support for the new view of equity is found by e.g., Lindhe (2002) for Sweden, and
Auerbach & Hassett (2002, 2006) for the US; the latter also observing that firm equity behavior
depends on firm-specific characteristics.
Contrary to the “new view” the “traditional view” or “old” view assumes that taxation of
dividend is distortionary as it reduces available amount of equity capital for firms and
investments (Feldstein 1970, Poterba & Summers 1985). An increase in the dividend tax rate will
raise the effective tax rate on investment income and discourage investment. In addition, an
increased tax rate will discourage the amount of payouts and reduce the amount of capital
available for new investments. There is empirical evidence supporting this hypothesis. For
instance, Becker et al. (2013), Poterba (2004), Nam et al. (2010) and Chetty & Saez (2005, 2006)
find that higher dividend tax rates are associated with lower distributed dividends and thereby
available capital for financing investments in other and new firms.6 As the dividend tax locks in
capital in mature firms, it reduces the allocative efficiency and harm new and small firms with
potentially better returns. Chetty & Saez (2010) have demonstrated that this effect of dividend
taxation gives rise to high social costs.
The “new view” is based on assumptions whose practical relevance can be questioned. Or
as Zodrow (1991, p. 507) puts it: “The theoretical models underlying the new view are simple
and elegant, but are problematic because they generally are based on the increasingly
questionable assumptions that share repurchases are precluded”. Above that, it is presumed that
the firm already exists and is mature enough to make sufficient profit to finance a marginal
5Research shows that in reality there is a home bias which means that foreign capital does not constitute a satisfactory substitute for domestic saving as investors are not indifferent to where they invest (see e.g. the review of Karolyi & Stulz (2003), French & Poterba (1991), Dahlqvist et al. (2003), Sendi & Bellalah (2010)). 6 Illustrating the incentive effect of the dividend tax, Hanlon & Hoopes (2014) find that firms responded to the expected increase in the dividend tax rate in January 2011 and January 2013 by paying out special dividends in the period prior to the tax increase and by shifting the timing of regular dividends to the low-tax period.
7

investment. For firms lacking profits, or for entrepreneurs with unrealized business concepts, the
tax on dividends affects the cost of finance and, hence, the investment decision. The different
views may be relevant for different evolutionary steps in a firm’s life cycle. For new firms there
are no existing profits that can be reinvested and these firms are exposed to double taxation. For
established firms with growth potentials the profits can be reinvested and generate new returns;
these firms then avoids double taxation. For mature firms the dividend tax provides a tax wedge
and may make reinvestment of profit profitable for the firm even though the capital may generate
a better return elsewhere (in a world without double taxation).
The “new view” also ignores issues with asymmetric information. There are several
aspects of asymmetric information that are relevant for taxation of dividends. First, as already
mentioned the dividend tax tends to lock in capital and due to the principal-agent problems
between management and owners the capital kept in the firm may not be used where it
maximizes the wealth of the owners but rather the utility of the management (Chetty & Saez
2010, Gordon & Dietz 2006). Second, due to asymmetric information external financing is higher
than for internal financing. An entrepreneur looking to finance an investment has, in many cases,
better information about the investment's expected return than an external financier (however in
other cases it can be the reverse); the external financier then requires a premium for providing
capital. A business with internal capital does not need to acquire external capital and can thereby
avoid the extra premium associated with asymmetric information as well as costs associated with
issuing equity.
Additional effects of personal capital taxation has been pointed out by Keuschnigg &
Nielsen (2004) who show how both dividend and capital gains taxes inhibit entrepreneurs' efforts
and lead to social welfare losses. They model entrepreneurs’ and venture capitalists’ effort and
show that since profit is shared effort is reduced, and introducing a tax on capital income further
reduces effort of both the entrepreneur and the venture capitalist and lead to social welfare losses.
Moreover, Poterba (1989) shows that high levels of personal capital taxation negatively impact
not only the supply but also the demand for risk-willing capital; by reducing individuals'
incentives to become entrepreneurs. Dividend taxation also distorts the type of investments that
are made. Investments which generate continuous returns, such as dividends and interest, are
disadvantaged in relation to investments that generate increases in value. Capital gains tax also
leads to investors retaining their investments in order to avoid paying tax, a behavior that
8

prevents optimal composition of the investment portfolio. A further consequence of high double
taxation, as studied by Huizinga & Vogel (2009), is the organizational corporate structure
following a purchase. Countries with high levels of international double taxation are, according
to Huizinga and Vogel, less inclined to win over the parent company's location.
In summary, there are many arguments for dividend taxation influencing firm behavior,
primarily small firms and new business creations. Dividend taxation and limited access to
international capital markets (relative to large established businesses) put small and new firms at
a disadvantage. Small and new start-up businesses are largely dependent on their own capital or
access to domestic risk capital markets. A report from the OECD (2010) confirms this statement
as it finds that larger companies that have access to foreign capital markets are less affected by
dividend taxation than smaller businesses lacking access to foreign capital. Further support for
capital taxes having an impact on firm behavior is found by Henrekson and Sanandaji (2015).
They review recent literature and conclude that capital taxes are found to impact firm behavior,
particular entrepreneurship, when more complex and realistic models are used.
Turning to taxation of personal labor income, it may influence economic growth by
affecting human capital investments, supply of labor, and work effort. Proportional income taxes
do not influence education decisions as the government shares equally in the forgone earnings
and the future return from education (Trostel 1993). Progressive income taxes discourage
education, however, as taxes saved while in school are less than taxes paid on future returns to
education (Heckman et al., 1998). An extensive literature on incentives and work effort finds a
positive relationship between the two (see e.g., Ehrenberg 1990 and Prendergast 1996), for
reviews), suggesting that higher taxes, i.e. lower net return, increase production costs and lower
efficiency. Similar results have been found in the tax response literature, with several studies
revealing that especially high-income earners respond to lower net-returns by reducing effort
rather than reducing hours worked (see e.g., Gruber & Saez 2002).
With regard to taxation of corporate income, it reduces the net return to investments and
could lower the return on innovations and reduce the amount spent on research and development,
thereby impacting growth negatively. In addition, corporate taxation discourages investments
both domestically and internationally by reducing foreign direct investment, and hence hampers
9

economic growth.7 Other studies suggest the corporate taxation reduces productivity. Schwellnus
& Arnold (2008) and Vartia (2008), for example, analyze the impact of corporate income
taxation on firm productivity using a large data set of firms and industries across OECD countries.
Both papers find a negative effect of corporate income taxes on productivity, and hence indirect
evidence of corporate taxes harming growth.
Furthermore, both corporate and labor income taxation may affect entrepreneurial activity
(see e.g., Johansson 2008), which enhances economic growth by creating new ideas and
promoting technological change. There are several ways through which taxes can affect the
amount of entrepreneurial risk-taking. Obviously, the impact of the two income taxes depends on
how entrepreneurial income is taxed in individual countries. In countries where entrepreneurial
income is taxed at lower rates than personal income, high personal income tax rates encourage
individuals to become entrepreneurs in order to avoid highly taxed personal income. 8 The
treatment of losses may also influence entrepreneurial activity. The classical Domar & Musgrave
(1944) result suggests that higher taxes encourage risk-taking as the government, by allowing
loss offsetting, shares the risk with the entrepreneur (cf. Myles 2009). Progressive taxation,
however, discourages risk-taking as losses push entrepreneurs into low tax brackets reducing the
value of the loss offset, while profits push entrepreneurs into high marginal tax brackets reducing
the net profit for the entrepreneurs (see e.g., Gentry & Hubbard 2000). In addition, tax avoidance
and evasion are much easier for entrepreneurs (self-employed) to undertake than for employees
supporting a positive relationship between personal income taxes and entrepreneurship. There
also seems to be a link between labor taxation and FDI.9 Labor taxation has also been found to
influence factor productivity and entrepreneurship. Industry-level evidence from OECD countries
(OECD 2010) suggests a negative relationship between top marginal tax rates on personal
income and long-run levels of total factor productivity, especially in countries with high entry
level rates, suggesting that high top statutory personal income tax rates hurt firm entry. This is
7 There is a sizable literature documenting a negative relationship between corporate tax rates and FDI (see e.g., De Mooij & Ederveen (2006) and Feld & Heckemeyer (2011)). 8 It is important to note that the definition of entrepreneurship is vague, even though most scholars agree that it is important to differentiate between entrepreneurship and self-employment. 9 Several papers have established a negative link between labor taxes and FDI (Hajkova et al. 2006, Hansson & Olofsdotter 2011). Hajkova et al. (2006) even find the impact of labor taxes on FDI to be substantially larger than that of cross-border effective average and marginal corporate tax rates
10

also consistent with results from Sweden, showing that high marginal tax rates on personal
income retard firm start-ups (see Hansson 2010).
***
After reviewing the literature, it seems fair to conclude that the empirical evidence of a
relationship between both the level of taxation and the structure, respectively, and economic
growth is weak, and that there is a need for further research to clarify this relationship.
Our study analyzes how taxation of corporate and personal income impact economic
growth. Like Lee & Gordon (2005), we also use marginal tax rates on corporate and personal
income as our tax measures rather than measures based on tax revenues.10 Economic theory
predicts marginal tax rates to matter for the distortions introduced to individuals’ and firms’
choices. According to theory they influence decisions concerning the amount of investments to
undertake, additional income to earn, and entrepreneurial effort, and are, hence, the relevant tax
rates for economic growth. Average tax rates, on the other hand, influence the discrete decisions
whether to invest or work at all. Additionally, average rates are more correlated with government
expenditures than marginal rates, and may hence effect economic growth positively, while
marginal tax rates should, according to theory, be negatively correlated with growth. The
difficulty lies in determining what marginal tax rate to use as different rates apply to different
levels of income (due to various rates but also due to exemptions, credits, and depreciation
allowances). To avoid some of these issues we choose to use the top marginal tax rate on both
personal and corporate income.
Unlike Lee & Gordon we also analyze the impact taxation of dividends has on economic
growth. Even though there is a sizable literature documenting the impact of dividend taxation on
investment costs and the allocation of investment, the direct link between the dividend tax and
economic growth has to our knowledge been unstudied. We also focus on European countries as
the effect of taxation on economic growth likely varies greatly between rich and developing
countries.
In addition, our analysis takes into account that the tax structure may have both
distortionary as well as non-distortionary components and that government expenditure structure
10 Even though we use tax rates based on tax revenues as a sensitivity test.
11
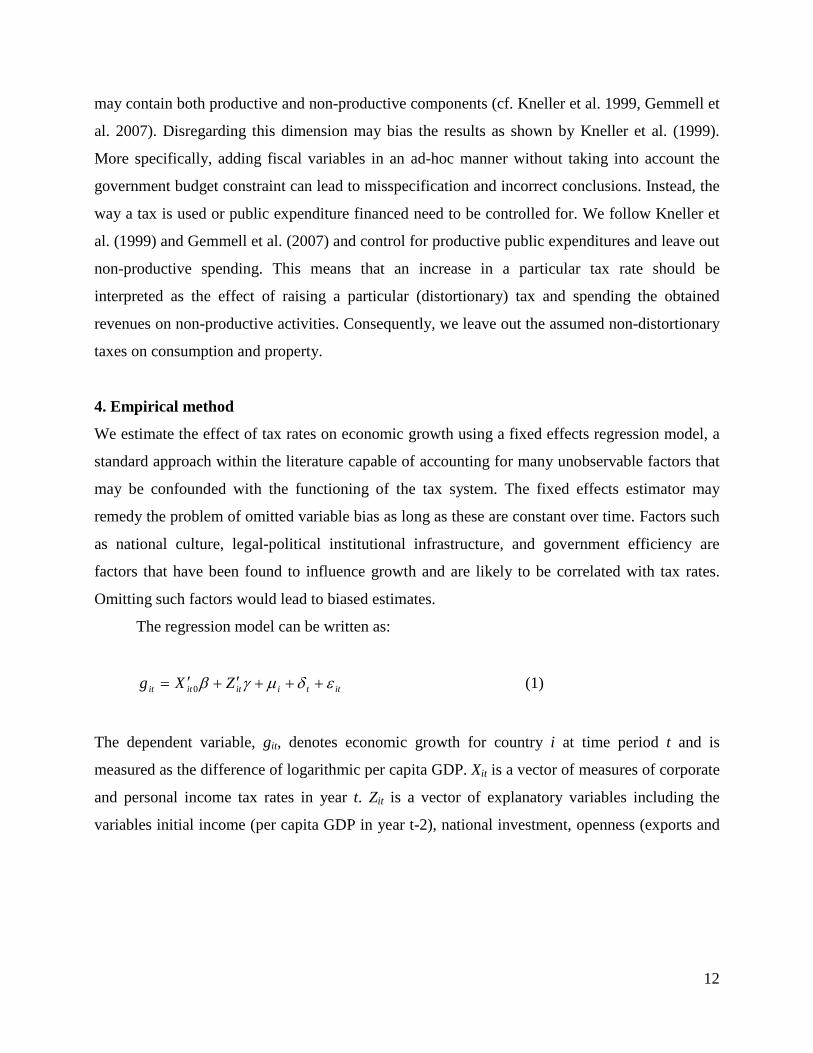
may contain both productive and non-productive components (cf. Kneller et al. 1999, Gemmell et
al. 2007). Disregarding this dimension may bias the results as shown by Kneller et al. (1999).
More specifically, adding fiscal variables in an ad-hoc manner without taking into account the
government budget constraint can lead to misspecification and incorrect conclusions. Instead, the
way a tax is used or public expenditure financed need to be controlled for. We follow Kneller et
al. (1999) and Gemmell et al. (2007) and control for productive public expenditures and leave out
non-productive spending. This means that an increase in a particular tax rate should be
interpreted as the effect of raising a particular (distortionary) tax and spending the obtained
revenues on non-productive activities. Consequently, we leave out the assumed non-distortionary
taxes on consumption and property.
4. Empirical method
We estimate the effect of tax rates on economic growth using a fixed effects regression model, a
standard approach within the literature capable of accounting for many unobservable factors that
may be confounded with the functioning of the tax system. The fixed effects estimator may
remedy the problem of omitted variable bias as long as these are constant over time. Factors such
as national culture, legal-political institutional infrastructure, and government efficiency are
factors that have been found to influence growth and are likely to be correlated with tax rates.
Omitting such factors would lead to biased estimates.
The regression model can be written as:
ittiititit ZXg εδµgβ +++′+′= 0 (1)
The dependent variable, git, denotes economic growth for country i at time period t and is
measured as the difference of logarithmic per capita GDP. Xit is a vector of measures of corporate
and personal income tax rates in year t. Zit is a vector of explanatory variables including the
variables initial income (per capita GDP in year t-2), national investment, openness (exports and
12

imports as a share of GDP), growth rate of the labor force, together with government productive
spending11 and government surplus.
The µi terms are fixed country effects (i.e., unmeasured shocks). These terms account for
time-invariant determinants of economic growth that vary among the countries in our sample. If
µi were correlated with Xit0 in equation (1), then estimators that failed to include the country-
specific fixed effects would yield inconsistent estimates of the effect of taxation on economic
growth.
The δt terms are sample-wide period effects. These terms account for trends that affect the
economic growth in each of the countries similarly, such as business cycles. Tax rates are likely
affected by these events and a model failing to account for such trends would confound those
trends with the effects of changing tax rates. The terms β and g are parameters to be estimated.
The εit terms are idiosyncratic disturbance terms that vary by country and time period, and are
assumed to be independently and identically distributed with mean zero and variance σε2.
Studies on taxes and growth may suffer from several statistical problems. One of them is
the endogeneity problem. Tax rates may both influence economic growth and be influenced by
economic growth. High taxes may cause lower growth rates, but periods of low growth rates may
require raised tax rates in order to finance increased expenses on, for example, higher
unemployment rates. To investigate this potential problem, we complement the analysis with
regressions using 1-year lags on all explanatory variables.
To remove business cycle effects it has been common in the literature to use 5-year
averages. The persistency of tax rates over time also motivates averaging over time instead of
using annual data. In order to take this into consideration, we also run regressions based on
averaging, but in order to obtain sufficient observations we use 4-year averages for per capita
GDP growth and the other explanatory variables.12 However, the variable for initial income per
capita has a 4-year lag, taking on the first value in the previous 4-year period, whereas the tax
rate variables take on the initial values in each (current) 4-year period.
11 Table A1 in the Appendix shows the functional classification of expenditures and revenues into distortionary and non-distortionary, productive and non-productive categories, respectively, in accordance with Kneller et al. (1999). 12 Kneller et al. (1998) have shown that the results are somewhat sensitive to how the 5-year averages are constructed.
13

As argued earlier, the analysis of the effect of taxes on economic growth may produce
more accurate results if it uses forward looking marginal tax rates, our explanatory variables of
interest, rather than backward looking average tax measures based on tax revenues. However, as
a robustness test we regress GDP growth per capita on the latter type of tax measure as well,
more specifically, the share of tax revenues from individual capital income, individual labor
income and corporate income.
5. Data
We focus on institutionally fairly similar countries and our dataset is a panel of 18 European
countries covering the period from 1990 to 2008. The dataset contains OECD data on GDP per
capita and its growth rate, national investment as a share of GDP, exports and imports as a share
of GDP (openness), the growth of the labor force and the government budget surplus. Data from
IMF Government Finance Statistics Yearbook (GFSY) are used to construct the variable
measuring government productive spending as share of GDP. Data on the various statutory tax
rates come from the European Tax Handbook of the International Bureau of Fiscal
Documentation (IBFD), the World Tax Database from the Office of Tax Policy Research (OTPR)
at the University of Michigan, and OECD Tax Database (top marginal statutory tax rate in
dividend income at shareholder level).13 Table 1 shows a summary description of the variables
and their sources. Due to data limitations on government productive spending as a share of GDP
our data end in 2008. Apart from this limitation, the financial crises starting in 2008 motivates
our choice of time period.
Figure 1 illustrates the development for corporate income tax rates and the top marginal
tax rates on personal income and shareholders’ top tax rate on distributed dividends (annual
averages). The corporate tax rate (blue line in Figure 1) and top marginal tax rate on labor income
(red line in Figure 1) have both experienced considerable reductions in the decade preceding the
starting year of our period of study. The decline has continued from 1990 and onwards,
particularly with regards to the corporate income tax which has gone from a rate above 35
percent to roughly 25 percent. The average top marginal tax rate on labor income has decreased
from over 50 percent to nearly 45 percent. The average top tax rate on dividends (green line in
13 Data on the corporate tax rate range from 1970 to 2010, while data on the top marginal tax rate on personal income cover the period from 1975 to 2010. The top tax rate shareholders face on distributed profits range from 1990 to 2011.
14

Figure 1) has also declined during the 90s and 00s, but on a smaller scale, from a mean rate at
nearly 25 percent to 20 percent. The variation over time and across countries is substantial when
it comes to all taxes, but in particular for the dividend taxation. In the beginning of the time
period Greece had a dividend taxation of 50 percent, this rate was then reduced to zero and then
rose to 10 percent 2009. Across countries the rate varies from over 30 percent in Italy to zero
rates in e.g., Greece and United Kingdom.
6. Results
Table 2 reports the results from the fixed-effect regression of the dividend income tax rates, and
the other two income taxes and GDP per capita growth. The first four columns refer to model
specifications where only the dividend tax is included. Columns 1 and 2 contrast the regression
results when we include and exclude initial income, respectively. We make this comparison
based on the argument that the control for initial income may capture too much of the effect of
other explanatory variables, considering that we are studying countries that are quite similar in
terms of GDP. Columns 3 and 4 show the results from our investigation of the temporal aspect of
how taxes affect growth. Considering that it may require some time for individuals and
corporations to adjust to changes in tax rates, it may not be the tax rate for this year but rather the
previous year that impacts on current growth.
The coefficient for the dividend tax is negatively and statistically significant in columns 1
and 2. The coefficient is somewhat larger in size when excluding initial income but by and large
is not that affected by the inclusion of initial income. Specifically, the coefficient corresponds to
a semi-elasticity of almost 0.001, meaning that a one percentage point increase in taxation of
dividends corresponds to 0.001 percent lower GDP per capita growth. Surprisingly, national
investments are negatively correlated with GDP per capita growth. Openness positively and
statistically significantly (only at 10 percent in column 2) correlates to per capita GDP growth,
while government surplus, government productive spending, and labor force growth are all
insignificantly correlated with the growth rate. Using 1-year lags of explanatory variables (note
that initial income continues to have a two-year lag), we observe that the dividend tax loses
significance when we also account for initial income. The dividend tax estimate is weakly
significant in column 4 and slightly smaller compared to the estimate in column 2, where we
15

consider “current” effects. The effects of other variables which were significant in t are now
larger and estimates more significant.
Columns 5 to 8 present the results of models specifications corresponding to those in
columns 1-4 but with the addition of corporate income tax and top marginal tax rates on labor
income. The results show the same pattern as in columns 1-4. Interestingly the other income
taxes are insignificant in all specifications.14 That the corporate income tax rate is insignificantly
correlated to growth is somewhat surprising. To test whether that is due to studying a relatively
recent time period when corporate tax rates have in general been low, we exclude the dividend
tax rate from the specification in order to maximize the time periods for the corporate tax rate and
the top marginal tax rate on labor income. However, this does not change the results, possible due
to small differences between countries when it comes to corporate taxation. This is also
consistent with results from Lee & Gordon (2005), who find the effect of the corporate tax rate to
be of less importance for growth in OECD countries compared to developing countries. The only
income tax that achieves statistical significance is the dividend tax rate.
Table 3 shows results of using 4-year averages instead of annual measures in order to
control for business cycle effects. Basically the same pattern appears here as before. The dividend
tax rate estimates are significant, although only weakly in specifications including initial income.
As a robustness test we also consider tax rates based on tax revenues. Table 4 presents
estimates from regressions using income taxes as shares of tax revenues on GDP growth, based
on annual data. Again, the findings are similar compared to Table 2. The dividend tax rate is
significantly correlated with per capita GDP growth in the lagged specifications (columns 3, 4, 7,
and 8). Compared to Table 2, the estimates are similar in magnitude but more significant.
Interestingly, the corporate income tax measure is positively and statistically significant in three
of four specifications. This could reflect that countries with competitive corporate tax rates are
able to attract business activities and increase their tax base. Indeed, the correlation between
corporate tax rates and tax revenues obtained is negative with a correlation coefficient of -
0.214. 15 This suggests that tax rates measures based on tax revenues poorly represent the
14 We have also tested specifications including only one tax at the time following Myles’ (2009) result that tax regressions deliver better results when each form of tax is included separately. The corporate and labor tax rates are insignificant when included separately as well, however. 15 Corresponding correlation coefficients for top labor tax rates and tax revenues from labor taxation as share of total tax revenues is -0.024, and between dividend tax rates and tax revenues from private capital income taxation as share of total tax revenues is -0.090.
16

distortionary effect of taxation. Lastly, Table 5 reports results from regressions on income taxes
as share of tax revenues and GDP growth, using 4-year averages. Again, the dividend tax is the
only tax rate that indicates a negative correlation between tax rates and economic growth.
7. Sensitivity analysis
Recently researchers in the field of economic growth have turned to the use of pooled mean
group (PMG) estimators to allow for heterogeneous short term effects (Ojede & Yamarik 2012).
Unfortunately, our data is not long enough in time to allow us to perform a PGM estimation. In
order to deal with the time effect and to find long term effects of dividend taxation on economic
growth we instead re-run the fixed effects model but lag the tax rate variables with up to 6 time
lags.16 The top part of Table 6 reports the result for the dividend tax in isolation, corresponding to
rows 1-4 in Table 2, while the bottom part reports the results for all three tax rates, corresponding
to rows 5-8 in Table 2. In addition, the table reports the results when the specification includes
and excludes initial income, respectively. The results strengthen the hypothesis that the dividend
tax hurts economic growth in the long run. For the corporate and labor tax rate the results provide
no support of a negative correlation between these taxes and economic growth.
In order to deal with potential endogeneity we also estimate the correlation using the
GMM estimator developed by Arellano & Bond (1991) that controls for endogeneity by using
lagged values of the levels of the endogenous and of the predetermined variables as instruments.
More specifically, we run a two-step system GMM for dynamic panel data (as developed by
Arellano & Bover 1995) treating all variables as endogenous and using robust standard errors.
The negative correlation between economic growth and the dividend tax remains though the
significance level is reduced.17
Our data end in 2008 but by excluding government productive spending the data period
can be extended to 2010. Expanding the time period to 2010 does not change the results in any
major way. The fit of the model is slightly reduced as well as the magnitude of the coefficient of
the dividend tax.
16 Gemmell et al. (2007) argue that up to 8 annual time lags are required. Due to data limitations we use 6 annual time lags. 17 The coefficient for the dividend taxation is -0.037 with a t-statistic of -1.56.The other two tax rates are insignificant. Results are not presented but can be obtained from the authors.
17

The corporate tax rate has previously often been found to be negatively correlated with
economic growth. We do not find that to be the case in our sample. To further investigate
whether this is due to the sample of countries (supporting Gordon & Lee’s (2005) result that the
corporate tax rate is less harmful in OECD countries) or to the tax measure used, we alternatively
use effective forward looking corporate tax rates instead of statutory and rates based on tax
revenues. More specifically, we use the forward looking marginal and average effective tax rates
developed by Devereux et al. (2002). The correlation between these tax measures and economic
growth is also insignificant, however.
Additionally, we investigate whether membership in EU/EMU affects the correlation
between taxes and economic growth or not. We do so by including a dummy for EU- and EMU-
membership, respectively. While EU-membership seems to have a positive impact on economic
growth, the inclusion of the EU-dummy does not change the correlation between tax rates and
economic growth. Including the EMU-dummy has no bearing on the results what so ever.
8. Conclusions
Intensified competition between countries and increasing demand for publicly financed services
pressure individual countries’ tax systems to be designed in efficient ways. In order to design
efficient tax systems it is crucial to know how distortive and harmful different taxes are to
economic growth. This paper provides some insights into the relationship between taxation of
income, in particular dividend income, and economic growth. We do so by studying the
correlation between statutory tax rates on corporate and personal income and economic growth in
18 European countries during the period 1990 to 2008.
Our results suggest that the dividend tax rate may be distortionary, and more harmful to
economic growth than corporate and labor income taxes; thus supporting the traditional view of
dividend taxation. Results are robust over several different specifications and tax measures.
However, results may be country-group specific as we study countries with similar characteristics
and not applicable to other regions. Adjustments of corporate and labor income taxes may be
more well-tuned in Europe than in developing countries. However, our results suggest that the
dividend tax rate can be adjusted in order to boost economic growth.
18

Table 1. Variable description. All variables are annual averages, unless stated otherwise
Variable Obs Mean Std. Dev. Min Max Description
ln GDP growth per capita 342 0.05 0.03 −0.06 0.19 Logarithmic average annual growth rate of GDP per capita
Initial income 342 24817.70 9198.63 9159.50 78523.30 GDP per capita with two-year lag, current prices millions US $
Investment 342 21.40 3.06 14.89 35.18 National investment as share of GDP
Openness 342 87.47 50.27 35.39 324.36 Exports and imports of goods and services as percent of GDP
Government budget surplus 341 −1.53 4.52 −14.03 18.77
Central government budget deficit as percent of GDP
Government productive spending 243 20.83 4.04 8.56 29.22
Central government productive spending as percent of GPD
Labor force growth 333 0.39 1.05 −4.08 5.06 Average annual growth rate of labor force, percent
Dividends tax 334 21.16 10.19 0.00 50.00 Statutory tax rate in individual dividend income
Corporate tax 339 32.16 6.46 12.50 53.00 Statutory tax rate on corporate income
Top marginal tax on pers labor income 329 48.62 8.41 23.20 71.00
Top marginal statutory tax rate on individual labor income
Ind. capital income tax 294 0.00 0.01 0.00 0.06
Revenue from individual capital income tax, as percent of total tax revenues
Corporate income tax 342 0.08 0.04 0.01 0.29 Revenue from corporate income tax, as percent of total tax revenues
Ind. labor income tax 315 0.25 0.11 −0.01 0.54
Revenue from individual labor income, as percent of total tax revenues
19
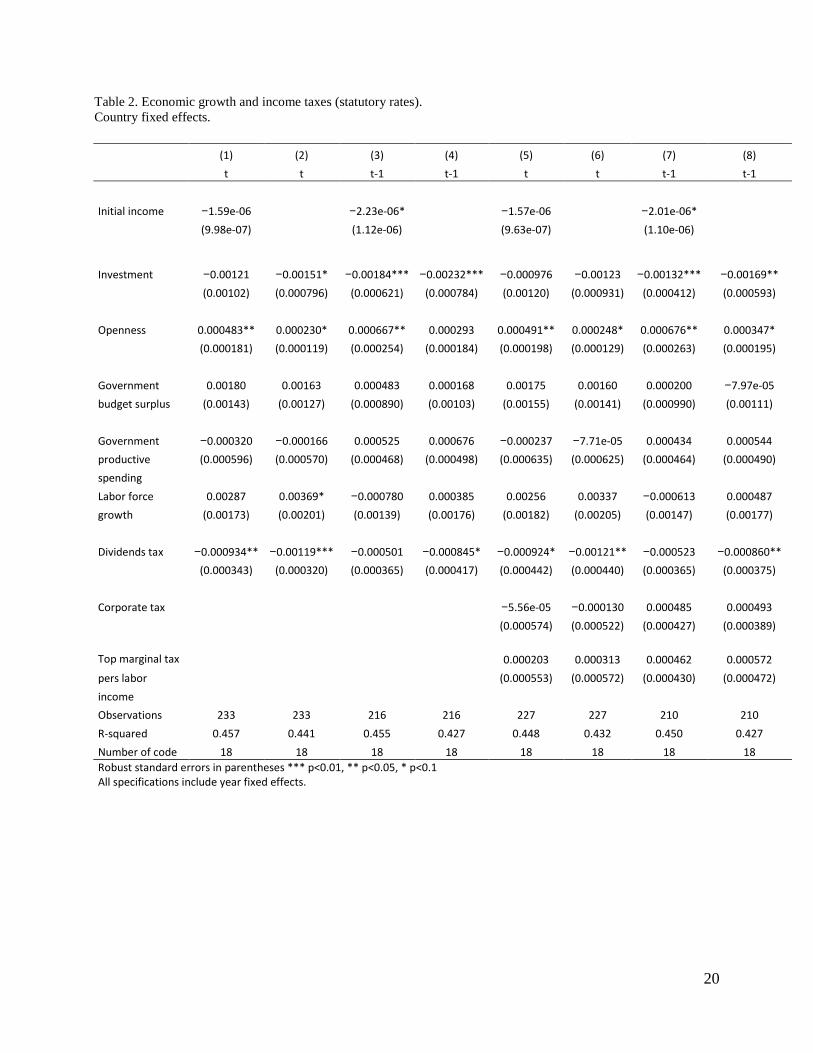
Table 2. Economic growth and income taxes (statutory rates). Country fixed effects.
(1) (2) (3) (4) (5) (6) (7) (8)
t t t-1 t-1 t t t-1 t-1
Initial income −1.59e-06
−2.23e-06*
−1.57e-06
−2.01e-06*
(9.98e-07)
(1.12e-06)
(9.63e-07)
(1.10e-06)
Investment −0.00121 −0.00151* −0.00184*** −0.00232*** −0.000976 −0.00123 −0.00132*** −0.00169**
(0.00102) (0.000796) (0.000621) (0.000784) (0.00120) (0.000931) (0.000412) (0.000593)
Openness 0.000483** 0.000230* 0.000667** 0.000293 0.000491** 0.000248* 0.000676** 0.000347*
(0.000181) (0.000119) (0.000254) (0.000184) (0.000198) (0.000129) (0.000263) (0.000195)
Government 0.00180 0.00163 0.000483 0.000168 0.00175 0.00160 0.000200 −7.97e-05 budget surplus (0.00143) (0.00127) (0.000890) (0.00103) (0.00155) (0.00141) (0.000990) (0.00111)
Government −0.000320 −0.000166 0.000525 0.000676 −0.000237 −7.71e-05 0.000434 0.000544 productive (0.000596) (0.000570) (0.000468) (0.000498) (0.000635) (0.000625) (0.000464) (0.000490) spending
Labor force 0.00287 0.00369* −0.000780 0.000385 0.00256 0.00337 −0.000613 0.000487 growth (0.00173) (0.00201) (0.00139) (0.00176) (0.00182) (0.00205) (0.00147) (0.00177)
Dividends tax −0.000934** −0.00119*** −0.000501 −0.000845* −0.000924* −0.00121** −0.000523 −0.000860**
(0.000343) (0.000320) (0.000365) (0.000417) (0.000442) (0.000440) (0.000365) (0.000375)
Corporate tax
−5.56e-05 −0.000130 0.000485 0.000493
(0.000574) (0.000522) (0.000427) (0.000389)
Top marginal tax
0.000203 0.000313 0.000462 0.000572 pers labor
(0.000553) (0.000572) (0.000430) (0.000472)
income Observations 233 233 216 216 227 227 210 210
R-squared 0.457 0.441 0.455 0.427 0.448 0.432 0.450 0.427 Number of code 18 18 18 18 18 18 18 18 Robust standard errors in parentheses *** p<0.01, ** p<0.05, * p<0.1 All specifications include year fixed effects.
20

Table 3. Economic growth and income taxes (statutory rates), 4-year averages. Country fixed effects
(1) (2) (3) (4)
Initial income −3.82e-06***
−3.34e-06***
(8.37e-07)
(7.72e-07)
Investment −0.00131* −0.00172** −0.000729 −0.000997*
(0.000682) (0.000599) (0.000533) (0.000527)
Openness −3.86e-05 0.000202 −0.000251 −1.40e-05
(0.000457) (0.000608) (0.000504) (0.000612)
Government budget surplus 0.00170* 0.00119 0.00123 0.000852
(0.000828) (0.00127) (0.000897) (0.00123)
Government productive spending 0.000823*** 0.000226 0.000820*** 0.000313**
(0.000170) (0.000134) (0.000153) (0.000142)
Labor force growth 0.00554 0.0115*** 0.00565* 0.0110***
(0.00331) (0.00358) (0.00319) (0.00329)
Dividends tax −0.000435* −0.000824** −0.000537* −0.000988**
(0.000232) (0.000355) (0.000296) (0.000345)
Corporate tax
0.000413 0.000217
(0.000276) (0.000302)
Top marginal tax on pers labor income
0.000548 0.000749
(0.000529) (0.000640)
Observations 74 74 72 72 R-squared 0.686 0.541 0.734 0.628 Number of code 18 18 18 18 Robust standard errors in parentheses *** p<0.01, ** p<0.05, * p<0.1 All specifications include controls for 4-year time periods.
21

Table 4. Economic growth and income taxes (share of tax revenue). Country fixed effects.
(1) (2) (3) (4) (5) (6) (7) (8) t t t-1 t-1 t t t-1 t-1
Initial income −1.90e-06*
−1.87e-06*
−2.55e-06**
−2.23e-06**
(9.86e-07)
(9.95e-07)
(9.54e-07)
(7.78e-07)
Investment −0.00182 −0.00198* −0.00134* −0.00158 −0.00166 −0.00190** −0.00112 −0.00146
(0.00135) (0.00110) (0.000753) (0.000908) (0.00102) (0.000859) (0.000695) (0.000883)
Openness 0.000515** 0.000204* 0.000568** 0.000244 0.000703*** 0.000262** 0.000623** 0.000226
(0.000177) (9.93e-05) (0.000251) (0.000195) (0.000174) (0.000107) (0.000214) (0.000193)
Government budget 0.00210 0.00184 0.000107 −0.000205 0.000779 0.000853 −0.000800 −0.000811 Surplus (0.00150) (0.00131) (0.000741) (0.000884) (0.00102) (0.00130) (0.000880) (0.00108)
Government −0.000153 3.82e-05 0.000232 0.000382 −0.000353 −5.86e-05 0.000248 0.000434 productive spending (0.000661) (0.000676) (0.000478) (0.000536) (0.000584) (0.000648) (0.000452) (0.000551)
Labor force growth 0.00350* 0.00472** 0.000127 0.00123 0.00369* 0.00516** 0.000305 0.00140
(0.00190) (0.00215) (0.00123) (0.00150) (0.00196) (0.00219) (0.00126) (0.00158)
Ind capital income tax −0.00141 −0.00402 −0.00779*** −0.0102*** −0.000347 −0.00384 −0.00863*** −0.0114***
(0.00277) (0.00261) (0.00212) (0.00195) (0.00298) (0.00303) (0.00183) (0.00198)
Corporate income tax
0.00329** 0.00233** 0.00157* 0.000789
(0.00121) (0.000841) (0.000793) (0.000693)
Ind labor income tax
0.000534 0.000429 −0.000624 −0.000741
(0.000679) (0.000800) (0.000468) (0.000496)
Observations 215 215 205 205 215 215 205 205 R-squared 0.462 0.439 0.488 0.468 0.497 0.457 0.499 0.474
Number of code 16 16 16 16 16 16 16 16 Robust standard errors in parentheses *** p<0.01, ** p<0.05, * p<0.1 All specifications include year fixed effects.
22

Table 5. Economic growth and income taxes (share of tax revenue), 4-year averages. Country fixed effects.
(1) (2) (3) (4)
Initial income −3.56e-06***
−3.78e-06***
(7.78e-07)
(8.75e-07)
Investment −0.000873 −0.000903 −0.000971 −0.000783
(0.000804) (0.000642) (0.000872) (0.000685)
Openness −0.000190 0.000110 −0.000222 0.000103
(0.000459) (0.000625) (0.000509) (0.000633)
Government budget surplus 0.00127* 0.000663 0.00116 0.00121
(0.000707) (0.00107) (0.00104) (0.00149)
Government productive spending 0.000724*** 0.000167 0.000798*** 0.000193
(0.000134) (0.000117) (0.000144) (0.000127)
Labor force growth 0.00657* 0.0126*** 0.00682* 0.0126***
(0.00361) (0.00375) (0.00352) (0.00418)
Ind capital income tax −0.00514*** −0.00782** −0.00361* −0.00674**
(0.00128) (0.00305) (0.00180) (0.00298)
Corporate income tax
0.000656 −0.000248
(0.000645) (0.000803)
Ind labor income tax
0.00104* 0.000674
(0.000573) (0.000601)
Observations 70 70 70 70 R-squared 0.709 0.589 0.723 0.597 Number of code 16 16 16 16
Robust standard errors in parentheses *** p<0.01, ** p<0.05, * p<0.1 All specifications include controls for 4-year time periods
23

Table 6. Estimation results for different lags GDP growth per capita
(1) t
(2) t-1
(3) t-2
(4) t-3
(5) t-4
(6) t-5
(7) t-6
Incl. initial income Dividends tax −0.00093** −0.00040 −0.00020 −0.00033* −0.00039** −0.00055** −0.00082*
(0.00034) (0.00033) (0.00045) (0.00018) (0.00016) (0.00023) (0.00042)
Excl. initial income Dividends tax −0.0012*** −0.00070* −0.00046 −0.00048* −0.00047** −0.00062** −0.00089* (0.00032) (0.00036) (0.00049) (0.00026) (0.00022) (0.00026) (0.00046)
Incl. initial income Dividends tax −0.00092* −0.00033 −0.00046 −0.00031* −0.00041** −0.00063*** −0.00095***
(0.00044) (0.00033) (0.00028) (0.00016) (0.00016) (0.00018) (0.00029)
Corporate tax −5.56e-05 0.00066** 0.00058* 0.00032 0.00039 0.00124** 0.0022***
(0.00057) (0.00031) (0.00029) (0.00038) (0.00041) (0.00049) (0.00039)
Top marginal tax 0.00020 0.00038 0.00016 0.00028 0.00019 −7.79e-05 0.00017 on pers labor inc (0.00055) (0.00050) (0.00052) (0.00056) (0.00048) (0.00047) (0.00053)
Excl. initial income Dividends tax −0.0012** −0.00059** −0.00064** −0.00044* −0.00049** −0.00068*** −0.00099***
(0.00044) (0.00028) (0.00028) (0.00023) (0.00020) (0.00019) (0.00029)
Corporate tax −0.00013 0.00066** 0.00060* 0.00033 0.00043 0.00128** 0.00222***
(0.00052) (0.00027) (0.00033) (0.00043) (0.00044) (0.00050) (0.00040)
Top marginal tax 0.00031 0.00050 0.00020 0.00031 0.00016 −8.20e-05 0.00015 on pers labor inc (0.00057) (0.00052) (0.00053) (0.00054) (0.00044) (0.00046) (0.00051)
Robust standard errors in parentheses *** p<0.01, ** p<0.05, * p<0.1 All specifications include year fixed effects.
24

Figure 1. Corporate tax rates, top marginal tax rates on personal dividend and labor income. Annual means.
25

Appendix Table A1.
Source: Kneller et al. (1999), Table 1, p. 177.
26

References
Afonso, A. and J. G. Alegre. 2011. Economic growth and budgetary components: a panel assessment for the EU. Empirical Economics 41(3), 703–723.
Agell, J., H. Ohlsson and P. Thoursie. 2006. Growth effects of government expenditure and taxation in rich countries: a comment. European Economic Review 50(1), 211–218.
Arellano, M. and S. Bond. 1991. Some tests of specification for panel data Monto Carlo evidence and an application to employment equations. Review of Economic Studies 58(2), 277–297.
Arellano, M. and O. Bover. 1995. Another look at the instrumental variable estimation of error-components models. Journal of Econometrics 68(1), 29–51.
Arnold, J. 2008. Do tax structure affect aggregate economic growth? Empirical evidence from a panel of OECD countries. OECD Economic Working Paper No. 643. Paris: OECD.
Auerbach, A. J. 1979. Share valuation and corporate equity policy. Journal of Public Economics 11(3), 291–305.
Auerbach, A. J. and K. A. Hassett. 2003. On the marginal source of investment funds. Journal of Public Economics 87(1), 205–232.
Auerbach, A. J. and K. A. Hassett. 2006. Dividend taxes and firm valuation: new evidence. American Economic Review 96(2), 119–123.
Barro, R. 1991. Economic growth in a cross-section of countries. Quarterly Journal of Economics 106(2), 407–443.
Bergh, A. and M. Karlsson. 2010. Government size and growth: accounting for economic freedom and globalization. Public Choice 142(1), 195–213.
Bradford, D. F. 1981. The incidence and allocation effects of a tax on corporate distributions. Journal of Public Economics 15(1), 1–22.
Dahlquist, M., L. Pinkowitz, R. M. Stulz and R. Williamson. 2003. Corporate governance and the home bias. Journal of Financial and Quantitative Analysis 38(1), 87–110.
Devaranjan, S., V. Swaroop and H. Zou. 1996. The composition of public expenditures and economic growth. Journal of Monetary Economics 37(2), 313–344.
Devereux, M. P., R. Griffith and A. Klemm. 2002. Corporate income tax reforms and international tax competition. Economic Policy 17(35), 497–534.
Domar, E. D. and R. A. Musgrave. 1944. Proportional income taxation and risk-taking. Quarterly Journal Economics 58(3), 388–422.
Dowrick, S. 1993. Government consumption: its effects on productivity growth and investment. In N. Gemmel (ed), The growth of the public sector. Theories and evidence. Aldershot, UK and Brookfield, VT: Edward Elgar.
Ehrenberg, R. 1990. Introduction: do compensation policies matter? Industrial and Labor Relations Review 43(3), 3S–12S.
Easterly, W. 1993. How much do distortions affect growth? Journal of Monetary Economics 32(2), 187–212.
Easterly, W. and S. Rebelo. 1993. Marginal income tax rates and economic growth in developing countries. European Economic Review 37(3), 409–417.
27

Engen, E. M. and J. Skinner. 1996. Taxation and economic growth. National Tax Journal 49(4), 617–642.
Feld, L. and J. Heckemeyer. 2011. FDI and taxation: a meta study. Journal of Economic Surveys 25(2), 233–272.
Feldstein, M. 1970. Corporate taxation and dividend behavior. Review of Economic Studies 37(1), 57–72.
French, K. R. and J. M. Poterba. 1991. Investor diversification and international equity markets. American Economic Review 81(2), 222–226.
Fölster, S. and M. Henrekson. 2001. Growth effects of government expenditure and taxation in rich countries. European Economic Review 45(8), 1501–1520.
Fölster, S. and M. Henrekson. 2006. Growth effects of government expenditure and taxation in rich countries: a reply. European Economic Review 50(1), 219–221.
Gemmell, N., R. Kneller and I. Sanz. 2007. Fiscal policy impacts on growth in the OECD: are they long- or short-term? Mimeo, University of Nottingham.
Gentry, W. M. 1994. Taxes, financial decisions and organizational form: evidence from publicly traded partnerships. Journal of Public Economics 53(2), 223–244.
Gentry, W. M. and R. G. Hubbard. 2000. Tax policy and entrepreneurial entry. American Economic Review 90(2), 283–287.
Gerardi, R., M. J. Graetz and H. S. Rosen. 1990. Corporate integration puzzles. National Tax Journal 43(2), 307–314.
Gordon, R. and M. Dietz. 2006. Dividends and taxes. NBER Working Paper No. 12292. Cambridge, MA: National Bureau of Economic Research.
Gruber, J. and E. Saez. 2002. The elasticity of taxable income: evidence and implications. Journal of Public Economics 84(1), 1–32.
Hajkova, D., G. Nicoletti, L. Vartia and K. Y. Yoo. 2006. Taxation and business environment as drivers of foreign direct investment in OECD countries. OECD Economic Studies, No. 43/2.
Hanlon, M. and J. L. Hoopes. 2014. What do firms do when dividend tax rates change? An examination of alternative payout responses. Journal of Financial Economics 114(1), 105–124.
Hansson, Å.2012. Tax policy and entrepreneurship: empirical evidence from Sweden. Small Business Economics 38(4), 495–513.
Hansson, Å. and K. Olofsdotter. 2011. Labor taxation and FDI decisions in the European Union. Lund University Working Paper No. 2011:11, Department of Economics, Lund Unversity.
Heckman, J., L. Lochner and C. Taber. 1998. Tax policy and human capital formation. American Economic Review 88(2), 293–297.
Henrekson, M. and T. Sanandaji. 2015. Owner-level taxes and business activity. Foundations and Trends in Entrepreneurship, forthcoming.
International Bureau of Fiscal Documentation, (IBDF), European Tax Handbook, various editions. Amsterdam: IBDF.
Johansson, Å., C. Heady, J. Arnold, B. Brys and L. Vartia. 2008. Tax and economic growth. OECD Economic Working Paper No. 620. Paris: OECD.
28
Karolyi, G. A. and R. M. Stulz. 2003. Are financial assets priced locally or globally? In: G. M. Constantinides, M. Harris and R. M. Stulz (eds.), Handbook of the Economics of Finance. Amsterdam, North-Holland.
Koester, R. B. and R. C. Kormendi. 1989. Taxation aggregate activity and economic growth: cross-country evidence. Journal of Monetary Economics 27(3), 367–386.
Kormendi, R. C. and P. Meguire. 1985. Macroeconomic determinants of growth: cross-country evidence. Journal of Monetary Economics 16(2), 141–163.
Kneller, R., M. Bleaney and N. Gemmell. 1998. Growth, public policy and the government budget constraint: evidence from OECD countries. School of Economics Discussion Paper No. 98/14, University of Nottingham.
Kneller, R., M. Bleaney and N. Gemmell. 1999. Fiscal policy and growth: evidence from OECD countries. Journal of Public Economics 74(2), 171–190.
Lee, Y. and R. Gordon. 2005. Tax structure and economic growth. Journal of Public Economics 89(5–6), 1027–1043.
Levine, R. and D. Renelt. 1992. A sensitivity analysis of cross-country growth models. American Economic Review 82(4), 942–963.
Leibfritz, W., J. Thornton and A. Bibbee. 1997. Taxation and economic performance. OECD Economic Working Paper No. 176. Paris: OECD.
Lindhe, T. 2002. The marginal source of finance. Working Paper No. 2002:9, Department of Economics, Uppsala University.
McKenzie, K. J. and A. J. Thompson. 1996. The economic effects of dividend taxation. Technical Committee on Business Taxation Working Paper 96-7, Department of Finance, Government of Canada, Ottawa.
Mendoza, E., G.M. Miles-Ferretti and P. Asea. 1997. On the ineffectiveness of tax policy in altering long-run growth: Harberger’s superneutrality conjecture. Journal of Public Economics, 66(1), 99–126.
Mooij, R. de and S. Ederveen. 2006. What a difference does it make? Understanding the empirical literature on taxation and international capital flows. European Economy Economic Papers No. 261.European Commission.
Myles, G. 2009. Economic growth and the role of taxation. OECD Economics Department Working Papers No. 713–715.
OECD. 2010. Tax policy reform and economic growth. OECD Tax Policy Studies No. 20. Paris: OECD.
OECD. 2011. Tax database. www.oecd.org/ctp/taxdatabase. Paris: OECD. Office of Tax Policy Research, OTPR, World Tax Database. Ann Arbor, MI: University of Michigan. Ojede, A. and S. Yamarik. 2012. Tax policy and state economic growth: the long-run and short-
run of it. Economic Letters 116(2), 161–165. Padovano, F. and E. Galli. 2001. Tax rates and economic growth on the OECD countries (1950–
1990). Economic Inquiry 39(1), 44–57.
29

Padovano, F. and E. Galli. 2002. Comparing the growth effects of marginal vs average tax rates and progressivity. European Journal of Political Economy 18(3), 529–544.
Plosser, C. I. 1992. The search for growth. In: Policies for long-run growth. Kansas City, MO: Federal Reserve Bank of Kansas City.
Poterba, J. M. 2004. Taxation and corporate payout policy. American Economic Review 94(2), 171–175.
Poterba, J. M. and L. H. Summers. 1985. The economic effect of dividend taxation. In: E. I. Altman and M. G. Subrahmanyam (eds.), Recent Advances in Corporate Finance. Homewood, IL: Irwin Professional Publishing.
Prendergast, C. 1996. What happens within firms? Survey of empirical evidence on compensation policies. NBER Working Paper No. 5802. Cambridge, MA: National Bureau of Economic Research.
Ram, R. 1986. Government spending and economic growth: a new framework and some evidence from cross-sectional and time-series data. American Economic Review 87(2), 184–188.
Romero-Ávila, D. and R. Strauch. 2008. Public finance and long-term growth in Europe: evidence from a panel data analysis. European Journal of Political Economy 24(1), 172–191.
Sendi, I. and M. Bellalah. 2010. The equity home bias: explanations and financial anomalies. International Journal of Economics and Finance 2(2), 78–96.
Slemrod, J. 1995 What do cross-country studies teach about government involvement, prosperity, and economic growth? Brookings Paper on Economic Activity 26(2), 373–431.
Schwellnus, C. and J. Arnold. 2008. Do corporate taxes reduce productivity and investment at the firm-level? Cross-country evidence from the Amadeus dataset. OECD Economics Department Working Paper No. 641. Paris: OECD.
Trostel, P. 1993. The effect of taxation on human capital. Journal of Political Economy 101(2), 327–350.
Vartia, L. 2008. How do taxes affect investment and productivity? – Industry level analysis of OECD countries. OECD Economics Department Working Paper No. 656. Paris: OECD.
Widmalm, F. 2001. Tax structure and growth: are some taxes better than others? Public Choice 107(3/4), 199–219.
Xing, J. 2012. Tax structure and growth: how robust is the empirical evidence? Economics Letters 117(1), 379–382.
Zodrow, G. 1991. On the traditional and new views of taxation. National Tax Journal 44(1), 497–509.
30