cesifo_wp1011.pdf - econstor
38
econstor Make Your Publications Visible. A Service of zbw Leibniz-Informationszentrum Wirtschaft Leibniz Information Centre for Economics Pethig, Rüdiger; Wagener, Andreas Working Paper Profit Tax Competition and Formula Apportionment CESifo Working Paper, No. 1011 Provided in Cooperation with: Ifo Institute – Leibniz Institute for Economic Research at the University of Munich Suggested Citation: Pethig, Rüdiger; Wagener, Andreas (2003) : Profit Tax Competition and Formula Apportionment, CESifo Working Paper, No. 1011, Center for Economic Studies and ifo Institute (CESifo), Munich This Version is available at: http://hdl.handle.net/10419/76531 Standard-Nutzungsbedingungen: Die Dokumente auf EconStor dürfen zu eigenen wissenschaftlichen Zwecken und zum Privatgebrauch gespeichert und kopiert werden. Sie dürfen die Dokumente nicht für öffentliche oder kommerzielle Zwecke vervielfältigen, öffentlich ausstellen, öffentlich zugänglich machen, vertreiben oder anderweitig nutzen. Sofern die Verfasser die Dokumente unter Open-Content-Lizenzen (insbesondere CC-Lizenzen) zur Verfügung gestellt haben sollten, gelten abweichend von diesen Nutzungsbedingungen die in der dort genannten Lizenz gewährten Nutzungsrechte. Terms of use: Documents in EconStor may be saved and copied for your personal and scholarly purposes. You are not to copy documents for public or commercial purposes, to exhibit the documents publicly, to make them publicly available on the internet, or to distribute or otherwise use the documents in public. If the documents have been made available under an Open Content Licence (especially Creative Commons Licences), you may exercise further usage rights as specified in the indicated licence. www.econstor.eu
-
Upload
khangminh22 -
Category
Documents
-
view
2 -
download
0
Transcript of cesifo_wp1011.pdf - econstor

econstorMake Your Publications Visible.
A Service of
zbwLeibniz-InformationszentrumWirtschaftLeibniz Information Centrefor Economics
Pethig, Rüdiger; Wagener, Andreas
Working Paper
Profit Tax Competition and Formula Apportionment
CESifo Working Paper, No. 1011
Provided in Cooperation with:Ifo Institute – Leibniz Institute for Economic Research at the University of Munich
Suggested Citation: Pethig, Rüdiger; Wagener, Andreas (2003) : Profit Tax Competition andFormula Apportionment, CESifo Working Paper, No. 1011, Center for Economic Studies and ifoInstitute (CESifo), Munich
This Version is available at:http://hdl.handle.net/10419/76531
Standard-Nutzungsbedingungen:
Die Dokumente auf EconStor dürfen zu eigenen wissenschaftlichenZwecken und zum Privatgebrauch gespeichert und kopiert werden.
Sie dürfen die Dokumente nicht für öffentliche oder kommerzielleZwecke vervielfältigen, öffentlich ausstellen, öffentlich zugänglichmachen, vertreiben oder anderweitig nutzen.
Sofern die Verfasser die Dokumente unter Open-Content-Lizenzen(insbesondere CC-Lizenzen) zur Verfügung gestellt haben sollten,gelten abweichend von diesen Nutzungsbedingungen die in der dortgenannten Lizenz gewährten Nutzungsrechte.
Terms of use:
Documents in EconStor may be saved and copied for yourpersonal and scholarly purposes.
You are not to copy documents for public or commercialpurposes, to exhibit the documents publicly, to make thempublicly available on the internet, or to distribute or otherwiseuse the documents in public.
If the documents have been made available under an OpenContent Licence (especially Creative Commons Licences), youmay exercise further usage rights as specified in the indicatedlicence.
www.econstor.eu

PROFIT TAX COMPETITION AND FORMULAAPPORTIONMENT
RÜDIGER PETHIGANDREAS WAGENER
CESIFO WORKING PAPER NO. 1011CATEGORY 1: PUBLIC FINANCE
AUGUST 2003
PRESENTED AT 3RD NORWEGIAN-GERMAN SEMINAR ON PUBLIC ECONOMICS, JUNE 2003
An electronic version of the paper may be downloaded• from the SSRN website: www.SSRN.com• from the CESifo website: www.CESifo.de

CESifo Working Paper No. 1011
PROFIT TAX COMPETITION AND FORMULAAPPORTIONMENT
Abstract
We analyse tax competition with corporate income taxes in a common market where taxrevenues are allocated according to an apportionment formula. Generally, tax competition issharper (i.e., equilibrium tax rates are lower) the more tax-elastic is the apportionmentformula. This depends on the properties of production technologies. In particular: (i) Withfixed labour input, tax competition is sharpest if apportionment is based on property-shares,followed by the sales- and payroll-shares. (ii) If capital and labour are endogenous andtechnologies are Cobb-Douglas, tax competition under the property- and the payroll-sharerule is sharper than under the sales-share formula. Factor elasticities determine whetherpayroll- or property-share apportionment generates sharper tax competition.
JEL Code: D81, D21.
Keywords: tax competition, formula apportionment.
Rüdiger PethigVWL IV, FB 5
University of SiegenHölderlinstr. 357068 Siegen
Andreas WagenerDepartment of Economics
University of ViennaHohenstaufengasse 9
1010 ViennaAustria

1 Introduction
It is widely acknowledged that the current system of corporate taxation in the European Union
(EU) hampers cross-border economic activities and impedes the creation and operations of multi-
national business structures in Europe (Cnossen, 2002). Dierences in national tax rates and
capital income tax systems imply that investment and location decisions are, to a measurable
degree, driven by tax considerations rather than by gross (social) returns on investment (Devereux
and Grith, 2001). Moreover, since due to the EU member states' uncoordinated tax schemes
double taxation cannot be excluded, investment projects extending over several countries are
often taxed more heavily than purely national projects.
In response to these problems the European Commission recently launched another report on
company taxation in the EU (European Commission, 2001, Bolkestein Report). This report
examines a number of remedies to remove obstacles to EU cross-border investment and suggests
several comprehensive alternative taxation methods, deemed workable and politically feasible,
to replace the current disarray of 15 (or, in the future, 25) corporate tax systems. Under each of
these methods, rms face a single tax base for all their EU-wide activities such that corporate
prots can be determined on the basis of the company's consolidated accounts rather than by
separate accounting in each member state, as it is the case today.1 Obviously, any such method
must determine how tax revenues emerging from this uniform tax base are allocated to EU
member states (and possibly to the EU budget). Following the example of the U.S. and Canada
for the prot taxation of multi-state or multi-province rms, the Bolkestein report suggests the
sharing of taxes levied on consolidated prots on the basis of what is called formula apportionment
(FA).
Under a FA method, a corporation's tax liability to each country where it operates is determined
1The proposals comprise Common Base Taxation (CBT), a European Corporate Income Tax (EUCIT), Home
State Taxation (HST), and the compulsory harmonization of all national corprate tax codes. Under CBT, the
member states would harmonize their rules for computing the taxable prots of rms with cross-border operations,
possibly maintaining national rules for purely domestic businesses. This would be similar with a EUCIT where,
however, tax revenues would (at least partly) to the EU budget. Under HST, member states keep their own rules
for prot determination, but companies with cross-border operations would be taxed according to the rules of the
member state where their headquarters are located. For a survey on these concepts (and other proposals in the
EU report) see Weiner (2002a).
1

as the product of its consolidated (total) international prots times that country's tax rate times
the fraction of the corporation's activities in that country. This fraction is calculated by an
apportionment formula made up of one or more indicators for business activities enter. Most
common in North America is a three-part apportionment formula that calculates, for each state, a
weighted average of the shares of a rm's total sales, payroll, and property that can be attributed
to that state.2
By contrast, with the current EU scheme of taxation via separate accounting (SA) a rm's
tax payment in a country is calculated as the product of the country's tax rate and the rm's
prots earned in that country, the latter being determined according to national tax rules. A
multinational rm, thus, has to establish separate accounts for its activities in each country
where it operates. This creates strong incentives for rms to shift prots to low-tax countries.3
Moreover, SA incurs high administrative costs for EU companies since they have to deal with
15 tax systems in the EU, and high monitoring costs for the tax authorities of the EU member
states.
Under FA, no internal transfer prices are needed any more and, thus, the scope for tax evasion
and tax exportation may be expected to be limited, as compared to the SA method. It is hoped
that narrowing possibilities of tax shifting for rms translates, on the side of governments, into a
weakening of the incentives for strategic tinkering with the tax code. A tax regime with smaller
spillover eects might, thus, alleviate the problems of allocative ineciencies and of harmful tax
competition in the EU, both problems being induced by the current methods of taxation in the
EU member states.2For a survey see Wildasin (2000). Suppose that a rm operates in I states (or provinces) and earns total gross
prots Π. Let, respectively, Fi, Wi, and Ki represent sales (output), payroll, and property (capital) of a rm
in state or province i = 1, . . . , I; F , W , and K denote total sales, payroll, and property in all states/provinces,
respectively. Then the tax base for taxation in state i is given by(mF · Fi
F+ mw · Wi
W+ mK · Ki
K
)·Π.
The bracketed expression is the apportionment formula and the mj (mj ≥ 0 and∑
j mj = 1) are the weights
given to factors j = F, W, K in the formula, and are gross total prots of the rm.3Usually, prot shifting is achieved via transfer pricing (arm's length pricing) of intra-rm activities which
has, in turn, become a key instrument in rms' strive to evade taxes. See Bartelsman and Beetsma (2000) for
empirical evidence.
2

While intuition points to this appealing prospect, it is not at all clear whether, compared to the
traditional SA method, FA taxation does indeed go along with smaller cross-border externalities
and weaker goads for strategic taxation. Several authors have analysed and discussed spillover
eects and distortions generated by FA methods (see, e.g., Gordon and Wilson, 1986; Goolsbee
and Maydew, 2000; Anand and Sansing, 2000; Mintz, 2002).4 Two recent papers by Nielsen et al.
(2002a,b) formally compare tax spillovers and their implications for tax competition under SA
and under the FA method that uses property (capital) shares to apportion prots. They conclude
that no clear-cut ranking of SA and FA taxation is possible with respect to externalities and tax
competition.
While Nielsen et al. (2002a,b) focus on a single apportionment formula, the property-shares
formula, and compare its performance relative to SA, the present paper will compare various
methods of formula apportionment with respect to their allocative features and strategic incen-
tives. Our analysis will be carried out in a fairly standard setting of international tax competition:
In an economy with more than one taxing jurisdiction (called countries) and a common market,
multinational corporations locate and operate in more than one country. Within the common
market, a single and common tax base is used for prot taxation, and a FA method is used to
allocate tax revenues to the individual countries. We will not specify a concrete formula from
the outset, but rather derive general results for a reasonably restricted class of formulas that
we call uniform. This class encompasses the most widely discussed FA methods, namely ap-
portionment according to property shares, payroll shares, and output shares and their convex
combinations. The general approach allows us to plug in and compare specic formulas at later
stages of the analysis. We distinguish two scenarios:
a) In the rst setting, largely following Nielsen et al. (2002a), prot-maximizing multinational
rms decide on capital investments in a domestic and a foreign plant and on the input of
an overhead factor (managerial services) that is shared by both plants.
4These studies and the present one deal with externalities and distortions that arise among the jurisdictions that
participate in the FA method. Spillovers to non-participating jursidictions are not discussd. It is a controversial
issue associated with FA methods whether they should be applied only to corporate income earned within the
group of participating countries in the FA method (water's edge taxation) or to worldwide income; see Weiner
(2002b) for a discussion in the European context. A theoretical analysis of this question is, to our knowledge,
still missing.
3

b) In the second setting multinationals decide on both capital and labour input in their plants
while overhead services are kept constant.
For either scenario we assume that governments aim at maximizing their prot tax revenues.
Since taxation has cross-border eects, governments are strategically interlinked and caught in
a tax competition game. The outcome of this game depends on the apportionment method
implemented in the common market. Our general result in both scenarios is that tax competition
is sharper (i.e., equilibrium tax rates are lower) the more elastically the apportionment formula
reacts upon tax changes. To substantiate this observation, we identify the factors determining the
tax elasticity of the apportionment formulas and show that they consist of curvature properties of
the underlying production technologies. As an application of this general result, we show for the
rst scenario that tax competition is for all strictly concave technologies sharpest under the
property-share rule, followed by the sales-share rule and the payroll-share rule. For the second
scenario we show that tax competition under the property- or the payroll-apportionment method
is sharper than under the output-share formula. Whether the payroll- or the property-share
formula generates tougher tax competition, depends on partial factor elasticities of production.
The remainder of this paper is organized in six sections. Section 2 sets out the model. Sections 3
and 4 are devoted to the rst scenario: Section 3 analyses the comparative statics of domestic and
foreign factor demands with respect to tax changes under various FA regimes. Section 4 utilizes
these results and derives our central results on tax competition for the rst scenario. Section 5
goes roughly through the same series of excercises for the second, more complex scenario; the
main ndings are reported in Section 5.5. Section 6 concludes.
2 A Model
2.1 Countries and Firms
Following Nielsen et al. (2002a), we consider a common market with two countries, A and B.
There is a single multinational rm that operates in both countries. In each of its two entities,
the rm produces a single numéraire output, using the same technology F that requires capital
K, labour L, and management services S as inputs.
Capital can be invested in either of the two countries and will be denoted by KA and KB. Capital
4
is in perfectly elastic supply and can be rented on world capital markets at an exogenous rate
ρ > 0 (for a leveraged rm) or must yield that rate of return ρ if it is equity capital.5 Labour is a
local factor of production whose input in country i is denoted by Li. Until Section 6 we assume
that labour input cannot be adjusted in the short run (e.g., due to labour protection or other
market inexibilities). Management services comprise inputs jointly consumed in both entities
of a rm. Under SA, the pricing of the use of S in its foreign aliate is a key instrument for
shifting prots across business units. With FA, such prot shifting has no eect on the rm's
overall tax burden. Nonetheless, S will be treated as an endogenous factor of production in our
analysis until Section 6 because dierent FA methods might impact on the demand for S and,
via cross-partial eects, indirectly on the location-specic factors capital and labour. We choose
units of S and s such that their factor price is unity.
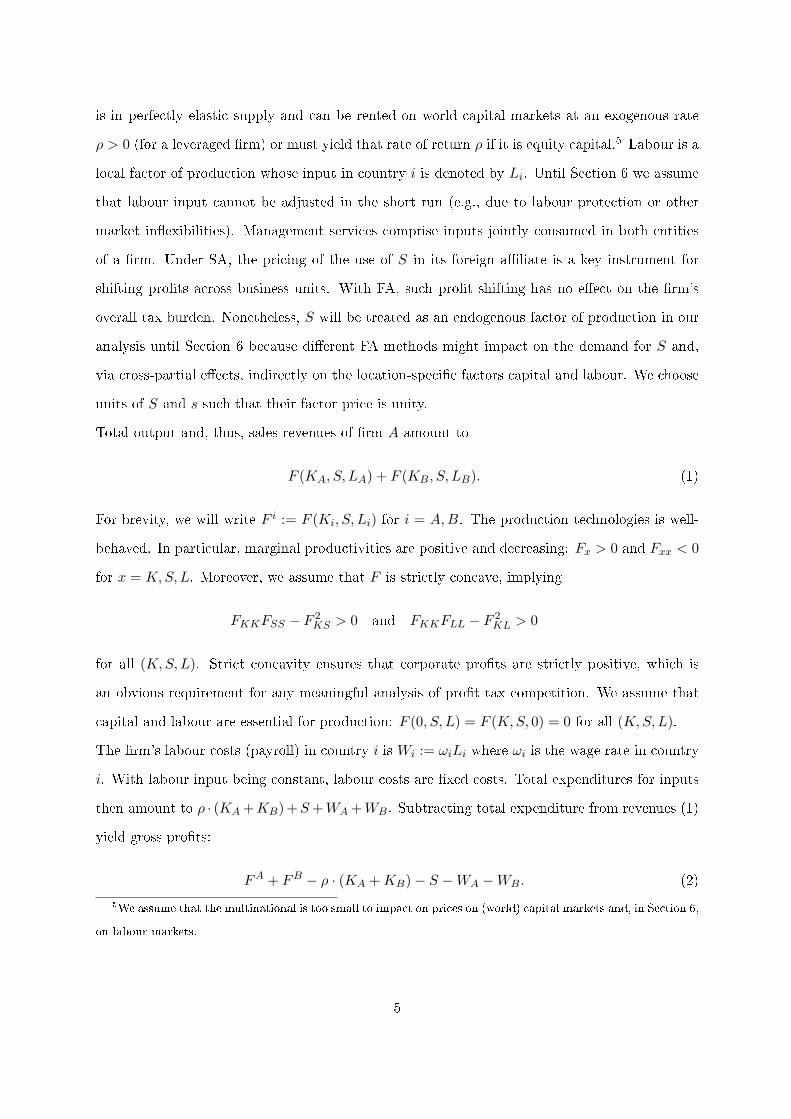
Total output and, thus, sales revenues of rm A amount to
F (KA, S, LA) + F (KB, S, LB). (1)
For brevity, we will write F i := F (Ki, S, Li) for i = A,B. The production technologies is well-
behaved. In particular, marginal productivities are positive and decreasing: Fx > 0 and Fxx < 0
for x = K, S,L. Moreover, we assume that F is strictly concave, implying
FKKFSS − F 2KS > 0 and FKKFLL − F 2
KL > 0
for all (K, S,L). Strict concavity ensures that corporate prots are strictly positive, which is
an obvious requirement for any meaningful analysis of prot tax competition. We assume that
capital and labour are essential for production: F (0, S, L) = F (K, S, 0) = 0 for all (K, S,L).
The rm's labour costs (payroll) in country i is Wi := ωiLi where ωi is the wage rate in country
i. With labour input being constant, labour costs are xed costs. Total expenditures for inputs
then amount to ρ · (KA +KB)+S +WA +WB. Subtracting total expenditure from revenues (1)
yield gross prots:
FA + FB − ρ · (KA + KB)− S −WA −WB. (2)
5We assume that the multinational is too small to impact on prices on (world) capital markets and, in Section 6,
on labour markets.
5
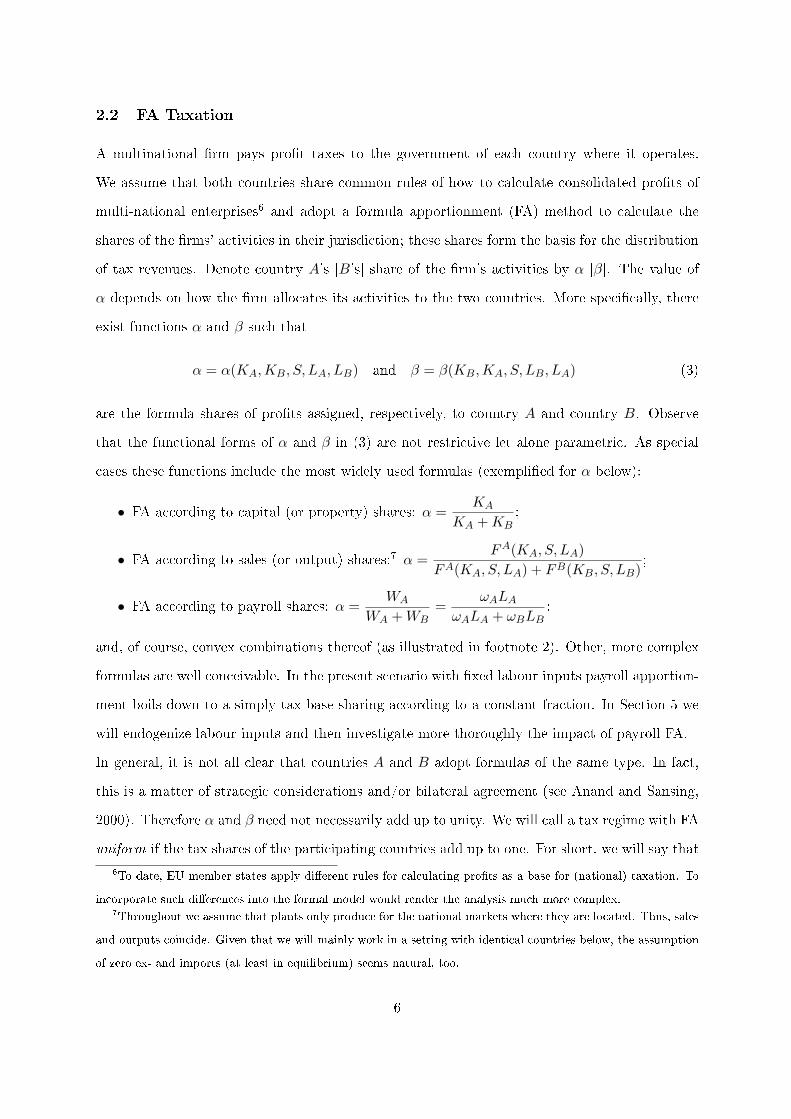
2.2 FA Taxation
A multinational rm pays prot taxes to the government of each country where it operates.
We assume that both countries share common rules of how to calculate consolidated prots of
multi-national enterprises6 and adopt a formula apportionment (FA) method to calculate the
shares of the rms' activities in their jurisdiction; these shares form the basis for the distribution
of tax revenues. Denote country A's [B's] share of the rm's activities by α [β]. The value of
α depends on how the rm allocates its activities to the two countries. More specically, there
exist functions α and β such that
α = α(KA,KB, S, LA, LB) and β = β(KB,KA, S, LB, LA) (3)
are the formula shares of prots assigned, respectively, to country A and country B. Observe
that the functional forms of α and β in (3) are not restrictive let alone parametric. As special
cases these functions include the most widely used formulas (exemplied for α below):
• FA according to capital (or property) shares: α =KA
KA + KB;
• FA according to sales (or output) shares:7 α =FA(KA, S, LA)
FA(KA, S, LA) + FB(KB, S, LB);
• FA according to payroll shares: α =WA
WA + WB=
ωALA
ωALA + ωBLB;
and, of course, convex combinations thereof (as illustrated in footnote 2). Other, more complex
formulas are well conceivable. In the present scenario with xed labour inputs payroll apportion-
ment boils down to a simply tax-base sharing according to a constant fraction. In Section 5 we
will endogenize labour inputs and then investigate more thoroughly the impact of payroll FA.
In general, it is not all clear that countries A and B adopt formulas of the same type. In fact,
this is a matter of strategic considerations and/or bilateral agreement (see Anand and Sansing,
2000). Therefore α and β need not necessarily add up to unity. We will call a tax regime with FA
uniform if the tax shares of the participating countries add up to one. For short, we will say that
6To date, EU member states apply dierent rules for calculating prots as a base for (national) taxation. To
incorporate such dierences into the formal model would render the analysis much more complex.7Throughout we assume that plants only produce for the national markets where they are located. Thus, sales
and outputs coincide. Given that we will mainly work in a setting with identical countries below, the assumption
of zero ex- and imports (at least in equilibrium) seems natural, too.
6

a system of uniform formulas is applied in our two-country world if, for all (KA,KB, S, LA, LB),
α(KA,KB, S, LA, LB) + β(KA,KB, S, LA, LB) = 1 (4)
Obviously, if both countries adopt one and the same of the three simple formulas listed above or
one and the same convex combination thereof, then their formulas are uniform. With uniform
formulas, we can dispense with the symbol β henceforth.
Capital costs are assumed to be non-deductible in the corporate tax base. For our analysis
this assumption is innocuous since no substantial changes will occur if capital costs are fully or
partially tax-deductible (also see Section 5.3 below). The prot tax only hits on
Φ := FA + FB − S −WA −WB > 0, (5)
which are the domestic rm's earnings before interest and taxes (EBIT). Denoting by ti country
i's statutory tax rate for corporate prots, the rm's total tax burden under FA is
(α · tA + β · tB) · Φ. (6)
The bracketed expression denotes the eective average tax rate on the rm's operations in the
common market; we will refer to it by τ . Observe that the eective tax rate is, via α and β, a
function of the rm's activities:
τ = τ(KA,KB, S, LA, LB) = α(KA,KB, S, LA, LB) · tA + β(KA,KB, S, LA, LB) · tB
Net prots Π are then given by
Π = (1− τ(KA,KB, S, LA, LB)) · Φ(KA,KB, S)− ρ(KA + KB). (7)
2.3 Prot Maximization
The multinational rm chooses KA, KB, and S as to maximize (7). The FOCs for an interior
solution of this program are given by (subscripts to functions denote partial derivatives):
− ∂τ
∂KA· Φ + (1− τ) · FA
K − ρ = 0 (8a)
− ∂τ
∂KB· Φ + (1− τ) · FB
K − ρ = 0 (8b)
− ∂τ
∂S· Φ + (1− τ) ·
(FA
S + FBS − 1
)= 0. (8c)
7

Here,
∂τ
∂x= tA · αx + tB · βx (9)
(x = KA,KB, S) can be quite complicated expressions, depending on the formula applied. Ob-
serve that for uniform formulas (α + β ≡ 1), we have
∂τ
∂x= (tA − tB) · αx (10)
for x = KA,KB, S. Under FA methods, taxation does not only aect the factor allocation
through its direct eects on net marginal factor returns (the second terms on the LHS in (8a)
to (8c)), but also indirectly: Firms inuence their apportionment-determined, eective tax rates
τ i through input choices (the rst terms on the LHS of (8a) through (8c)). ∂τ/∂x 6= 0 for
x = KA,KB or S indicates that to maximize its prots the rm needs to account for the
dependence of its eective tax rate on its choice variables. In fact, the rm would unnecessarily
increase its overall tax load by disregarding this relationship. It is not a priori clear whether this
indirect eect is positive or negative.8
Observe that without taxation, rms' decisions lead to equalisation of the marginal productivities
of capital across locations,
FAK = FB
K = ρ (11a)
and to a demand for managerial services according to the Samuelson-type condition
FAS + FB
S = 1. (11b)
3 Tax Rate Eects
How will rms respond to changes in tax rates? This question is not only relevant from an
allocative point of view, but also for policy-makers since tax changes translate into changes in
tax revenues, GDP, and social welfare. Responses to tax changes under a FA method are more
8Weiner (2002a,b) refers to positive and negative eects as an additional tax or a subsidy in the FA method.
This is, strictly speaking, only appropriate when rms would not change their production plans upon a switch to
a FA tax rule. See Weiner (2002b) for more on corporate tax planning under FA tax regimes.
8

dicult to determine than under spearate accounting (with linear tax schedules) since in the
former case rms do not only inuence the tax base, but also their eective tax rate.
In this section we derive, discuss, and compare the rm's reactions to an increase in country A's
statutory tax rate tA. All other comparative statics can be obtained by similar tokens. Moreover,
to facilitate the analysis we will impose further restrictions:
• Full symmetry: Both countries are identical. More specically, technolgies are the same
across rms, labour input and wage rates are the same (LA = LB, WA = WB), and
governments have set equal tax rates in the initial situation: tA = tB = t.
• Uniform formulas: Condition (4) holds.
As a consequence of these assumptions, the inituial situation will be characterized, rst, by
(11a) and (11b), second, by identical amounts of investment (KA = KB), third, by τx = 0 for
x = KA,KB, S; cf. (10), and fourth, by τ = t.
A further implication of symmetry will turn out to be helpful for comparative statics: We can
conne our analysis to changes of tA. Variations in tB follow one-by-one according to the pattern:
∂KB
∂tB=
∂KA
∂tA,
∂KA
∂tB=
∂KB
∂tA,
∂S
∂tB=
∂S
∂tA.
3.1 Comparative Statics
Under the simplifying conditions of symmetry and uniform formulas, it can be shown (after some
term shuing) that the comparative statics of (8a) through (8c) with respect to a tax change in
A can be described by the following set of equations:
M ·
∂KA/∂tA
∂KB/∂tA
∂S/∂tA
= γ (12)
where
M := (1− t) ·
FA
KK 0 FAKS
0 FBKK FB
KS
FAKS FB
KS FASS + FB
SS
and γ :=
αFA
K + αKAΦ
αFBK + αKB
Φ
αSΦ
.
9

Note that, due to symmetry, FAK = FB
K , FAKK = FB
KK , FAKS = FB
KS , FASS = FB
SS , and KA = KB.
Hence, we can dispense with the country index. Note that
detM = 2 · (1− t)3 · FKK ·(FKKFSS − F 2
KS
)(13)
is negative with F being strictly concave. From Cramer's Rule, the signs of the comparative
statics of KA, KB, and S with respect to tA are then given by the opposites of the signs of the
determinants of M1, M2, and M3, respectively, where Mi is the matrix obtained from M by
replacing its i-th column by γ. I.e.,
sgn
∂KA
∂tA
= −sgn detM1
= −sgn 2αFKFKKFSS+ (14a)
+Φ ·[αKA
· (2FKKFSS − F 2KS) + αKB
F 2KS − αSFKSFKK
];
sgn
∂KB
∂tA
= −sgn detM2
= −sgn 2αFKFKKFSS+ (14b)
+ Φ ·[αKA
F 2KS + αKB
· (2FKKFSS − F 2KS) + αSFKSFKK
];
sgn
∂S
∂tA
= −sgn detM3 (14c)
= −sgn2αFKFKKFKS − Φ ·
[FKKFKS(αKA
+ αKB)− αSF 2
KK
].
It is worth noticing that eqs. (14a) through (14c) would be considerably more complicated with-
out the assumptions of uniform formulas and symmetry. But even in the simple cases we are
considering here the eects of tax rate changes on input choices turn out to depend, in quite
complex ways, on the properties of technologies and apportionment formulas. Unfortunately,
eqs. (14a) through (14c) are too general to yield informative results. Yet with more specic
functional forms a number of interesting implications can be elicited.
Separable production functions. In the rather special case of FKS = 0, comparative statics
(14a) to (14c) become quite simple. First, we observe from (14a) that
sgn
∂KA
∂tA
= −sgn
αFK + αA
KAΦ
.
Hence, higher taxes in A drive capital out of that country (∂KA/∂tA < 0) whenever as one
should reasonably assume higher investments in A do not reduce that country's tax share in
the formula: αKA≥ 0.
10

Second, from (14b),
sgn
∂KB
∂tA
= −sgn αFK + αKB
Φ .
If one plausibly assumes that higher investments abroad reduce the domestic country's tax share
in the apportionment formula, αKB< 0, this expression is ambiguous in sign. It is easy to show
that a tax raise in A reduces capital investments in B if and only if, in absolute terms, the
elasticity of country A's tax share α with respect to KB is larger than the elasticity of EBIT
with respect to KB:
∂KB
∂tA> 0 ⇐⇒
∣∣∣∣∣αAKB
KB
α
∣∣∣∣∣ >FKKB
Φ. (15)
E.g., under FA with sales shares, α = FA/(FA + F b), this condition can be shown to always
hold in symmetric settings. However, that does not extend to other formulas, leaving the eects
of tax increases on foreign investment unclear.
Finally, from (14c),
sgn
∂S
∂tA
= −sgn αS ,
i.e., the input of managerial services decreases when the home country's tax rate is raised if the
domestic tax share increases with that input. For most formulas, αAS = 0 in a symmetric alloca-
tion. For these cases, the input choice for S will not be aected by the tax rate in a symmetric
setting: ∂S/∂tA = 0.
Next we introduce functional specications other than separability of technologies (i.e., FKS 6= 0
is admitted).
FA with property shares. Assume that α = KA/(KA + KB). Clearly, αS ≡ 0. For the
symmetric case, we further get α = 1/2 and αKA= −αKB
= 1/(4K). Inserting this specication
into (14a) through (14c), we replicate the expressions obtained by Nielsen et al. (2002a, eq. (15)):
sgn
∂KA
∂tA
= −sgn
FKFKKFSS +
Φ2K
·[FKKFSS − F 2
KS
]< 0; (16a)
sgn
∂KB
∂tA
= −sgn
FKFKKFSS −
Φ2K
·[FKKFSS − F 2
KS
]; (16b)
sgn
∂S
∂tA
= sgnFKS . (16c)
11

FA with output/sales shares. Let α = FA/(FA + FB). Again, α = 1/2 for the symmetric
case. Furthermore, αKA= −αKB
= FK/(4F ). Verify that
αS =FBFA
S − FAFBS
(FA + FB)2= 0
in the symmetric case. Hence, eqs. (14a) to (14c) are turned into
sgn
∂KA
∂tA
= −sgn
FKFKKFSS +
FKΦ2F
·[FKKFSS − F 2
KS
]< 0; (17a)
sgn
∂KB
∂tA
= −sgn
FKFKKFSS −
FKΦ2F
·[FKKFSS − F 2
KS
]; (17b)
sgn
∂S
∂tA
= sgn FKS . (17c)
FA with payroll shares. In this case, α = WA/(WA+WB). Trivially, αKA= αKB
= αS ≡ 0
and α = 1/2 for symmetry. Obviously, then,
∂KA
∂tA< 0,
∂KB
∂tA< 0, and sgn
∂S
∂tA
= sgnFKS . (18)
The main observations from this series of examples are now summarized as follows:
Proposition 1 Suppose that either the technology is separable (FKS = 0) or that the apportion-
ment formula uses property shares, output shares, or payroll shares.
a) An increase in a country's prot tax rate leads to reduced investment in this country:
∂KA
∂tA< 0 and, analogously,
∂KB
∂tB< 0.
b) With the exception of a formula with payroll shares, it is unclear whether an increase in
a country's prot tax rate induces the rm to increase or to reduce its investment in the
other country.
c) If FKS = 0, the rm reacts to an increase in a country's prot tax rate by reducing its
overhead if αS > 0. No reaction is necessary when αS = 0. Without separability (i.e., if
FKS 6= 0), the sign of FKS determines under the most widely used formulas whether an
increase in a country's prot tax makes the rm reduce or increase its overhead.
Proposition 1 shows that increases in a country's tax rate tends to drive the mobile factor capital
out of that country; this is a standard feature of prot taxation. However, Proposition 1 also
12

demonstrates that rms do not necessarily react on an increase in one country's tax rate by
increasing the employment of capital in the other country.
Since the cross-border eects of tax hikes on investment are ambiguous, it is interesting to know
whether a unilateral tax increase can lead to a surge in overall (worldwide) investment. Due to
symmetry we only need to consider the eects of tA on the domestic rm's total capital demand.
We invoke (14a) and (14b) to calculate:
sgn
∂(KA + KB)∂tA
= −sgn FKKFSS · (2αFK + Φ · (αKA
+ αKB)) . (19)
Many apportionment formulas and, in particular, the three formulas just discussed possess the
property that αKA= −αKB
in a symmetric allocation (but of course not necessarily elsewhere).
Under this condition we obtain from (19)
Proposition 2 If αKA= −αKB
in a symmetric allocation, a tax increase will always reduce
total investments.
3.2 Comparing Formulas
We now compare the comparative static eects of tax changes across three specic apportionment
formulas: property shares (indexed K), sales/output shares (indexed F ), and payroll shares
(indexed W ). Starting from a symmetric equilibrium, such a comparison across formulas is
indeed admissable since in the initial situation all these three formulas lead to the same factor
allocation characterized by (11a) and (11b). We then nd:
Proposition 3 Starting from a symmetric equilibrium with uniform formulas,
a) the impact of a tax increase on the demand of managerial services is the same under the
three apportionment formulas;
b) the negative impact of a tax increase on domestic investment is, in absolute terms, largest
under the property-share formula, followed by the output-share and the payroll share for-
mula:
∂KA
∂tA
∣∣∣∣K
<∂KA
∂tA
∣∣∣∣F
<∂KA
∂tA
∣∣∣∣W
< 0; (20)
13

c) the (generally ambiguous) impact of a tax increase in one country on investment aborad
is, in absolute terms, largest under a property-shares formula, followed by the output-share
and the payroll-share formula:
∂KB
∂tA
∣∣∣∣W
<∂KB
∂tA
∣∣∣∣F
<∂KB
∂tA
∣∣∣∣K
; (21)
d) the negative impact of a tax increase on the rm's total investment is the same for all three
formulas:
∂(KA + KB)∂tA
∣∣∣∣W
=∂(KA + KB)
∂tA
∣∣∣∣F
=∂(KA + KB)
∂tA
∣∣∣∣K
. (22)
Proof: Since the initial allocations under all three formulas are identical, detM in (13) is
identical in all cases too. Thus, the marginal eects of tA on KA, KB, or S can be ranked
by comparing the values of the determinants of, respectively, M1, M2, and M3 for the three
formulas. As M3 is the same for all formulas, item a) of the proposition follows immediately. The
eects of tA on KA are inversely ranked by the values of detM1 in (14a), evaluated for the three
formulas. For the payroll formula, we obtain detM1|W = FKFKKFSS , while the corresponding
expressions for the two other formulas appear in (16a) and (17a). Obviously, detM1|W is the
smallest of these three. Comparing the remaining two, we obtain
detM1|K>
<detM1|F ⇐⇒ FKK
F
<
>1.
Since F (0, S, L) = 0 and F is strictly concave in K, the partial production elasticity of capital
is less than unity (marginal productivity always falls short of average productivity), and hence
we get detM1|K > detM1|F . This proves item b) of the proposition.
Item c) follows by a similar token. Item d) can be readily seen from (19) recalling that
αKA+ αKB
= 0 for all three formulas.
Proposition 3 states for the FA rules under consideration that the eects of an increase in
tA on domestic investment are (among the three rules considered) strongest for property-share
apportionment and weakest for the payroll-share formula. This ranking reverses in case of foreign
investment. The aggregate, i.e., the sum of domestic and foreign, investment eect is the same
for all rules.
14

While domestic investment will be reduced in response to a tax increase in the home country
under either tax rule, foreign investment might react quite dierently under dierent formulas. It
is conceivable that a tax increase leads to an increase in foreign investment when a property-share
formula is applied while the same tax increase would lead to a decrease of foreign investment
under sales-based apportionment. In their comparison of the eects of tax increases under
separate accounting and FA with a property-share formula, Nielsen et al. (2002a) nd that the
eects on domestic [foreign] investment are stronger [weaker] under FA than under SA. Our
results suggest that the formula scrutinized by Nielsen et al. (2002a) is the most favorable for
such a comparison and that it is not clear whether their nding also holds for other apportionment
methods. Extending Nielsen et al.'s analysis to other apportionment formulas is, however, beyond
the scope of the present paper.
4 Tax Competition among Leviathan Governments
4.1 Comparing Equilibria
Government A's tax revenues are given by
TA(tA, tB) = α · tA · Φ.
Suppose that governments strive for maximizing tax revenues. With some simple re-arranging
of terms we calculate that
∂TA
∂tA=
︷ ︸︸ ︷αΦ + tA(αSΦ− α)
∂S
∂tA+ tAα(FA
K + FBK )
(∂KA
∂tA+
∂KB
∂tA
)+tAΦ
[αKA
∂KA
∂tA+ αKB
∂KB
∂tA
]. (23)
Obviously, a zero tax rate can never be optimal as ∂TA/∂tA|tA=0 > 0. Since the setting is
perfectly symmetric, so will be equilibria. Verify that, by Proposition 3, items a) and d), the
overbraced terms in (23) are identical for property, payroll, and sales apportionment methods.
Further recall that in a symmetric situation αKA= −αKB
> 0 holds for all rules. Hence, the
only dierence in the marginal revenue eects of tA under the various rules is in the dierences
(∂KA/∂tA)− (∂KB/∂tA). Now use Proposition 3, items b) and c), to obtain
∂TA
∂tA
∣∣∣∣K
<∂TA
∂tA
∣∣∣∣F
<∂TA
∂tA
∣∣∣∣W
(24)
15

at all symmetric pairs of tax rates (tA, tB) = (t, t). The same pattern holds for country B. Hence,
tax rates in a Nash equilibrium, i.e., the tax level t for which ∂TA(t, t)/∂tA = ∂TB(t, t)/∂tB = 0
is higher for payroll apportionment than that for sales apportionment which in turn lies above
that for property apportionment. Therefore, we obtain
Proposition 4 In a symmetric Nash-equilibrium of the Leviathan tax competition game with
FA, the level of taxation will be highest with a payroll formula, followed by sales- and property
formulas:
(tA, tB)W > (tA, tB)F > (tA, tB)K . (25)
According to Proposition 4, tax competition is sharpest with a FA method that uses capital
shares, followed by output shares, and nally payroll shares. This ranking is in full accordance
with a general principle that emerges from many models on (Leviathan-type) tax competition:
Tax competition is sharper the more elastic is the tax base with respect to tax changes. To see
that this rule also applies here, recall from (23) that, starting from a symmetric allocation, the
change in the tax base is entirely determined by the reaction of the formula share α on changes
in tA. Using our previous ndings, it is straightforward to calculate:
∂α
∂tA
∣∣∣∣K
=1
K2·Φ(FKKFSS − F 2
KS)4N
< 0;
∂α
∂tA
∣∣∣∣F
=F 2
K
F 2·Φ(FKKFSS − F 2
KS)4N
< 0;
∂α
∂tA
∣∣∣∣W
= 0.
Here, N is a negative term, a multiple of detM used above. The elasticity of α is, in absolute
terms, lowest (precisely: zero) for the payroll formula, which is a trivial result since labor inputs
are constant by assumption. Furthermore, ∂α/∂tA|K < ∂α/∂tA|F i F > FKK, which holds
for all concave technologies. Hence, under a property-share formula, the tax share of country A
reacts most elastically upon tax changes (in absolute terms). As this also holds for country B,
mutatis mutandis, tax competition between A and B turns out to be sharpest.
4.2 Assessing Equilibria
We now briey compare the Nash equilibrium to the cooperative solution of joint revenue maxi-
mization. First observe that the (symmetric) cooperative solution (t∗, t∗) (i.e., the maximizer of
16

the problem maxTA + TB) is common to all three formulas we are discussing here. Whether
tax rates in the cooperative solution lie below [above] those in the non-cooperative solution de-
pends on whether the revenue externality ∂TA/∂tB is negative [positive], if evaluated at the Nash
equilibrium. Unfortunately, the sign of ∂TA/∂tB is generally unclear. All we are able to show is
that for payroll apportionment (which, in the present setting, is a constant-share apportionment)
∂TA/∂tB is negative, implying that the Nash equilibrium is characterized by too high tax rates:
(tA, tB)W > (t∗, t∗). For sales- or property-apportionment (where tax shares vary with factor
choices), such a ranking is not possible.
Note that this observation also disables us to generally rank Nash equilibria under the three
standard formulas in terms of tax revenues: Given that tax rates under payroll apportionment
are on the decreasing part of the Laer curve, it is not clear whether the lower equilibrium tax
rates under property and sales apportionment yield higher or lower tax revenues.
5 The Model with Endogenous Capital and Labour Choices
5.1 The Setting
In the previous sections we assumed labour to be a xed factor. Owing to this assumption the
formula apportionment with payroll shares boils down to a constant rule. Although the assump-
tion of constant labour inputs might be warranted in a short-run perspective by inexibilities in
the labour market, it ought certainly to be dropped if we wish to assess the full and long-run
eects of various FA methods.
Therefore we now assume that the multinational enterprise chooses both labour and capital inputs
for its plants in countries A and B. To keep the analysis tractable we now hold managerial input
S constant. As before, our analysis will start from an initial equilibrium with perfect symmetry.
The rm chooses KA, KB, LA, and LB to maximize net prots
Π = (1− τ(KA,KB, S)) · Φ(KA,KB, LA, LB)− ρ(KA + KB).
where τ = tB + (tA − tB)α is the eective tax rate and
Φ(KA,KB, LA, LB) := FA(KA, S, LA) + FB(KB, S, LB)− S − ω · (LA + LB) > 0
again denotes earnings before interest and taxes. Here we assume that the wage rate is the
17

same in both countries (ωA = ωB = ω) and that labour markets are perfectly competitive.
Unlike capital costs, labour costs are assumed to be deductible from the prot tax base. We will
comment on this provision below. With a uniform formula, the set of FOCs is:
− (tA − tB)αKAΦ + (1− τ)FA
K − ρ = 0; (26a)
−(tA − tB)αKBΦ + (1− τ)FB
K − ρ = 0; (26b)
−(tA − tB)αLAΦ + (1− τ)[FA
L − ω] = 0; (26c)
−(tA − tB)αLBΦ + (1− τ)[FB
L − ω] = 0. (26d)
In a symmetric situation with tA = tB and under a uniform formula (26a) to (26d) yields
FAK = FB
K and FAL = FB
L = ω. Consequently, KA = KB = K and LA = LB = L.
5.2 Comparative Statics
With tA = tB in the initial situation the comparative statics of (26a) through (26d) with respect
to a tax change in A are described by the following system of equations:
(1− τ) ·
FAKK 0 FA
KL 0
0 FBKK 0 FB
KL
FAKL 0 FA
LL 0
0 FBKL 0 FB
LL
·
∂KA/∂tA
∂KB/∂tA
∂LA/∂tA
∂LB/∂tA
=
γ1
γ2
γ3
γ4
(27)
where
γ1 := αKAΦ + FA
Kα
γ2 := αKBΦ + FB
K α
γ3 := αLAΦ + [FA
L − ω]α = αLAΦ
γ4 := αLBΦ + [FB
L − ω]α = αLBΦ,
where γ3 and γ4 presuppose a symmetric setting. Due to symmetry we can dispense with country
indexes again. It is straightforward to show that
detM =(FKKFLL − F 2
KL
)2> 0,
18

where M is the matrix on the LHS of (27) Denote by Mi the matrix that emerges from replacing
the i-th column in M by the γ-vector. From Cramer's Rule,
∂KA
∂tA=
detM1
(1− t) detM=
(FKKFLL − F 2
KL
)· [γ1FLL − γ3FKL]
(1− t)(FKKFLL − F 2
KL
)2
=γ1FLL − γ3FKL
(1− t)(FKKFLL − F 2
KL
) (28a)
∂KB
∂tA=
γ2FLL − γ4FKL
(1− t)(FKKFLL − F 2
KL
) (28b)
∂LA
∂tA=
γ3FKK − γ1FKL
(1− t)(FKKFLL − F 2
KL
) (28c)
∂LB
∂tA=
γ4FKK − γ2FKL
(1− t)(FKKFLL − F 2
KL
) . (28d)
It is reasonable to assume that higher investment or labour input in country A [B] do not decrease
[do not increase] country A's tax share:
αKA, αLA
≥ 0 ≥ αKB, αLB
. (29)
This provided, we obtain
Proposition 5 Suppose that (29) holds.
• If FKL ≥ 0, then a tax increase in country A leads to reduced investment KA, lower
employment LA, and a lower output FA in country A.
A tax increase in A will increase employment in B, while the eects on investment and
output in that country are ambiguous.
If furthermore αxA = −αxB (with x = K, L) in a symmetric allocation, then a tax increase
will lead to a decrease in total investments KA +KB, total employment LA +LB and, thus,
total output FA + FB.
• For FKL < 0 the eects of an increase in tA on KA, KB, LA, and LB are ambiguous.
Proof: If (29) holds, γ1, γ3 > 0 while the signs of γ2 and γ4 are unclear. Combined with FKL ≥ 0,
this leads to unambiguously negative comparative static eects for KA and LA. Otherwise the
eects are unclear.
To get the eects on KA +KB and LA +LB verify that, if αKA= −αKB
, γ1 + γ2 = 2αFK = FK
and γ3 + γ4 = 0. Use this when summing up the single eects.
19

Proposition 5 covers the three most widely used formula methods: FA according to capital shares,
payroll shares, and output or sales shares. The assumption that the marginal productivity of
either factor increases with an increase in the input of the other (FKL > 0) is satised by most
commonly used production functions. In particular, it holds for Cobb-Douglas technologies.
Proposition 5 is the analogue of Proposition 1 and both propositions yield about the same
message: If a government raises its prot tax rate, it will under fairly mild restrictions on the
FA method and on production technologies drive economic activities out of its jurisdiction.
The cross-border eects of tax increases remain ambiguous, however.
5.3 Digression: Tax-Deductible Cost of Capital
So far, we assumed that the costs of capital are not deductible from the prot tax base, while
labour expenditures are. Let us now briey discuss the implications of allowing for tax-deductible
interest payments. As a rst consequence, the FOCs (26a) and (26b) for prot maximization
with respect to investments are modied to
−(tA − tB)αKAΦ + (1− τ)[FA
K − ρ] = 0;
−(tA − tB)αKBΦ + (1− τ)[FB
K − ρ] = 0.
In a symmetric initial situation we have FAK = FB
K = ρ. The rst two components in the vector γ
in (27) will then read γ1 = αKAΦ > 0 and γ2 = αKB
Φ < 0. As a consequence, a tax increase in
A will unambiguously lead to additional investments of capital in B when FKL > 0. Hence, we
can tighten the corresponding result of Proposition 5. Moreover, if αKB= −αKA
in a symmetric
allocation, a tax increase in A does neither aect total investment nor total employment (since
γ1 +γ2 = γ3 +γ4 = 0 in this case). Yet, total output FA +FB will decrease: The initial situation
is characterized by international production eciency. Shifting factors from A to B will then
lead to a decline in worldwide production. We sum this up in
Proposition 6 Assume that interest costs are deductible from the prot tax base. Suppose that
(29) holds and that FKL ≥ 0. Then a tax increase in country A leads to smaller investment KA,
lower employment LA, and lower output FA. It increases investment KB, employment LB and
output FB.
20

If furthermore αxA = −αxB for x = K, L in a symmetric allocation, then a tax increase in A will
leave total investment and total employment unchanged. Total output FA + FB will, however,
decrease:
∂KA
∂tA= −∂KB
∂tA,
∂LA
∂tA= −∂LB
∂tA, and
∂(FA + FB)∂tA
< 0.
The results on comparative statics and on equilibria in tax competition games to be presented
below do not depend on the asymmetry in the tax treatment of capital and labour costs. We
can therefore proceed under the assumption of an asymmetric tax treatment without loss of
generality.
5.4 Comparing Formulas
We now compare the comparative statics of tax changes for the three formulas already analysed
in Section 5.2. First observe that a payroll-share in our setting is equivalent to a labour share
formula:
α =WA
WA + WB=
ωLA
ωLA + ωLB=
LA
LA + LB.
Table 1 (see page 22) summarizes the numerators of (28a) to (28d) for the three formulas.9 Com-
paring the numerators suces for a comparison since in a symmetric setting the denominators
are identical for all three formulas. The following result is immediate from Table 1:
Proposition 7 In a symmetric situation with tA = tB the following holds:
a) Comparison between property-share and payroll-share formulas:
∂KA
∂tA
∣∣∣∣K
>
<
∂KA
∂tA
∣∣∣∣W
⇐⇒ ∂KB
∂tA
∣∣∣∣K
<
>
∂KB
∂tA
∣∣∣∣W
⇐⇒ FLL
K
>
<− FKL
L
∂LA
∂tA
∣∣∣∣K
>
<
∂LA
∂tA
∣∣∣∣W
⇐⇒ ∂LB
∂tA
∣∣∣∣K
<
>
∂LB
∂tA
∣∣∣∣W
⇐⇒ −FKL
K
>
<
FKK
L.
b) Comparison between property-share and output-share formulas:
∂KA
∂tA
∣∣∣∣K
>
<
∂KA
∂tA
∣∣∣∣F
⇐⇒ ∂KB
∂tA
∣∣∣∣K
<
>
∂KB
∂tA
∣∣∣∣F
⇐⇒ FLL
K
>
<
FKFLL − FLFKL
F
∂LA
∂tA
∣∣∣∣K
>
<
∂LA
∂tA
∣∣∣∣F
⇐⇒ ∂LB
∂tA
∣∣∣∣K
<
>
∂LB
∂tA
∣∣∣∣F
⇐⇒ FKL
K
<
>
FLFKK − FKFKL
F.
9In case we allowed for interest cost deductibility we would get Q1 = Q2 = 0 in Table 1. It is easy to see that
this would not aect any of the comparisons across formulas presented in the following propositions.
21

∂K
A/∂
tA∂K
B/∂tA
∂L
A/∂tA
∂L
B/∂tA
Form
ula
(28a)
(28b)
(28c)
(28d)
KF
LL
4KΦ
+Q
1−
FL
L
4KΦ
+Q
1−
FK
L
4KΦ
+Q
2F
KL
4KΦ
+Q
2
FF
KF
LL−
FLF
KL
4FΦ
+Q
1−
FK
FL
L−
FLF
KL
4FΦ
+Q
1F
LF
KK−
FK
FK
L
4FΦ
+Q
2−
FLF
KK−
FK
FK
L
4FΦ
+Q
2
W−
FK
L
4LΦ
+Q
1F
KL
4LΦ
+Q
1F
KK
4LΦ
+Q
2−
FK
K
4LΦ
+Q
2
with
Q1
:=1 2·(
FK
FL
L−
(FL−
w)F
KL)
=F
KF
LL/2
and
Q2
:=1 2·(
(FL−
w)F
KK−
FK
FK
L)
=−
FK
FK
L/2.
Allcomparativestaticeects
shareacommon
positivedenom
inator
that
issuppressed
inthistable.
Table1:
Com
paringcomparativestaticsacross
form
ulas
22

c) Comparison between payroll-share and output-share formulas:
∂KA
∂tA
∣∣∣∣W
>
<
∂KA
∂tA
∣∣∣∣F
⇐⇒ ∂KB
∂tA
∣∣∣∣W
<
>
∂KB
∂tA
∣∣∣∣F
⇐⇒ −FKL
L
>
<
FKFLL − FLFKL
F
∂LA
∂tA
∣∣∣∣W
>
<
∂LA
∂tA
∣∣∣∣F
⇐⇒ ∂LB
∂tA
∣∣∣∣W
<
>
∂LB
∂tA
∣∣∣∣F
⇐⇒ FKK
L
>
<− FLFKK − FKFKL
F.
d) Comparison of total eects:10
The eects of a tax increase on total investment KA+KB and on total employment LA+LB
are identical across all three formulas.
Although the results of Proposition 7 look quite complicated, they are, in essence, very similar to
those reported in Proposition 3. First, Proposition 7 shows that the comparative statics under
dierent formulas can be neatly ranked by simple terms involving production and the properties
of technology. We will further comment on this below. Second, Proposition 7 shows that the
ranking of the three formulas with respect to the strength of domestic tax eects is exactly
inverse to the ranking with respect to cross-border eects.
More specic results can be obtained from Proposition 7 by assuming that technologies are
homogeneous of degree r < 1:
Corollary 7.1 Assume that technologies are homogeneous of degree r < 1. In a symmetric
situation, the following holds:
∂KA
∂tA
∣∣∣∣K
<∂KA
∂tA
∣∣∣∣W
< 0 and∂KB
∂tA
∣∣∣∣K
>∂KB
∂tA
∣∣∣∣W
0 >∂LA
∂tA
∣∣∣∣K
>∂LA
∂tA
∣∣∣∣W
and∂LB
∂tA
∣∣∣∣K
<∂LA
∂tA
∣∣∣∣W
.
Proof: Homogeneity of degree lower than one (i.e., KFK + LFL = r · F with r < 1) implies, by
dierentiation with respect to L, that KFKL + LFLL = (r − 1)FL < 0, and, by dierentiation
with respect to K, that LFKL + KFKK = (r − 1)FK < 0. The corollary follows from invoking
10From (28a) to (28d) it is easy to verify that equality of total eects holds for all uniform formulas that satisfy
αKA = −αKB and αLA = −αLB under symmetry.
23

these inequalities in the rst item of Proposition 7.
The ranking derived in Corollary 7.1 makes intuitive sense: If a formula targets directly at one
factor (as with payroll and property shares), then prot tax changes have a greater impact on
that factor than under a formula that does not target this factor. Corollary 7.1 does not allow
for a ranking of the output-share formula. Further restricting technologies to Cobb-Douglas
functions enables us to explicitly calculate the expressions on the far RHS in Proposition 7. This
straightforwardly leads to
Corollary 7.2 Assume that technologies are Cobb-Douglas: F (K, S, L) = g(S) · Kβ · Lδ with
β, δ ∈ (0, 1) and β + δ < 1. In a symmetric situation the following is true:
∂KA
∂tA
∣∣∣∣K
<∂KA
∂tA
∣∣∣∣F
<∂KA
∂tA
∣∣∣∣W
< 0
0 >∂LA
∂tA
∣∣∣∣K
>∂LA
∂tA
∣∣∣∣F
>∂LA
∂tA
∣∣∣∣W
.
The reverse ranking holds regarding the eects of tA on KB and LB.
This corollary conrms the intuiton we already provided for Corollary 7.1: Output-share appor-
tionment targets both factors; the tax impacts under that regime therefore lie in between those
of the direct payroll- and property-share formulas.
It is worth emphasizing that Corollaries 7.1 and 7.2 were established for special cases of technolo-
gies only. As Proposition 7 reveals, the ranking of eects across formulas depends, in a non-trivial
way, on the concavity properties of the production function. It is well conceivable that under
some technologies the tax eect on capital is larger with a formula that is only indirectly targeted
at capital than with an explicit property-shares rule.
5.5 Leviathan-Type Tax Competition
Let us now turn to a comparison of governments' incentives in a Leviathan-type tax competition
game. As before, the tax revenues that government A aims to maximize are given by TA =
α · tA · Φ; similar for government B. In a symmetric setting, Nash equilibria are symmetric too.
24

Proposition 8 • Tax competition under a property-share rule leads to lower tax rates in the
Nash equilibrium than tax competition under a output-share rule, (tA, tB)|K < (tA, tB)|F ,
if and only if
FLL
K2<
F 2KFLL − 2FLFKFKL + F 2
LFKK
F 2. (30a)
• Tax competition under a payroll-share rule leads to lower tax rates in the Nash equilibrium
than tax competition under an output-share rule, (tA, tB)|L < (tA, tB)|F , if and only if
FLL
K2<
FKK
L2. (30b)
• Tax competition under a property-share rule leads to lower tax rates in the Nash equilibrium
than tax competition under an output-share rule, (tA, tB)|K < (tA, tB)|F , if and only if
FKK
L2<
F 2KFLL − 2FLFKFKL + F 2
LFKK
F 2. (30c)
Proof: Taking the partial derivative of TA with respect to tA yields:
∂TA
∂tA=
︷ ︸︸ ︷αΦ + tAα
(ΦKA
∂KA
∂tA+ ΦKB
∂KB
∂tA+ ΦLA
∂LA
∂tA+ ΦLB
∂LB
∂tA
)+αtAΩ, (31)
where
Ω :=∂α
∂tA= αKA
∂KA
∂tA+ αKB
∂KB
∂tA+ αLA
∂LA
∂tA+ αLB
∂LB
∂tA
= αKA
(∂KA
∂tA− ∂KB
∂tA
)+ αLA
(∂LA
∂tA− ∂LB
∂tA
)(32)
Verify that, by the last item of Proposition 7, the overbraced terms in (31) are identical for
property, payroll, and sales apportionment methods when tax rates are identical (recall that
ΦLA= ΦLB
= 0 , ΦKA= ΦKB
= FK ,11 and αKA= −αKB
). Hence, the partial eects only dier
by the term labelled Ω. From (32) (where we also employed the equality αKA= −αKB
) and
Table 1 we calculate:
ΩK = N · FLL
K2(33a)
ΩF = N ·F 2
KFLL − 2FLFKFKL + F 2LFKK
F 2(33b)
ΩW = N · FKK
L2(33c)
11In case that interest costs were deductible from the prot tax base we would obtain ΦKA = ΦKB = FK − ρ,
which obviously would not aect the argument.
25

where subscripts to Ω indicate the formula under consideration and where N := Φ/(8(1 −
tA)(FKKFLL − F 2KL)) is a common positive multiplier. Thus,
∂TA
∂tA
∣∣∣∣K
<
>
∂TA
∂tA
∣∣∣∣F
⇐⇒ FLL
K2
<
>
F 2KFLL − 2FLFKFKL + F 2
LFKK
F 2(34a)
∂TA
∂tA
∣∣∣∣K
<
>
∂TA
∂tA
∣∣∣∣W
⇐⇒ FLL
K2
<
>
FKK
L2(34b)
∂TA
∂tA
∣∣∣∣W
<
>
∂TA
∂tA
∣∣∣∣F
⇐⇒ FKK
L2
<
>
F 2KFLL − 2FLFKFKL + F 2
LFKK
F 2. (34c)
Due to symmetry, country B's revenue functions possess corresponding properties. The sym-
metric Nash equilibrium under FA method x = K, F,W is dened through ∂TA(t, t)/∂tA|x =
∂TB(t, t)/∂tB|x = 0. Hence, conditions (34a) to (34c) allow us to compare Nash equilibria. E.g.,
from (34a) it follows that reaction functions under property apportionment intersect at a higher
point along the 45-degrees-line than under sales apportionment. Going through this argument
for all cases yields the claim.
Proposition 8 relates the tax rates that emerge in the equilibrium of a Leviathan-type tax com-
petition game to concavity features of the production technology. In principle, conditions (30a)
to (30c) are easy to check. It should be noted, however, that these conditions will not be satised
globally in general.12
The proof of Proposition 8 reveals that for alternative formulas dierences in the strategic in-
centives for taxation only arise from the term
Ω =∂α
∂tA,
dened in (32). This observation suggests an elasticity interpretation of Proposition 8 analogous
to Proposition 4: Tax competition is sharper the greater the elasticity of the tax formula with
respect to tax changes. Further insights into this general result can be obtained by restricting
technologies to Cobb-Douglas functions:
Proposition 9 Suppose that technologies are Cobb-Douglas: F (K, S, L) = g(S) · Kβ · Lδ with
δ + β < 1.12Proposition 8 is imprecise in so far as conditions (30a) to (30c) have to hold in the initial symmetric situation
from which we suppose the tax competition game to start.
26
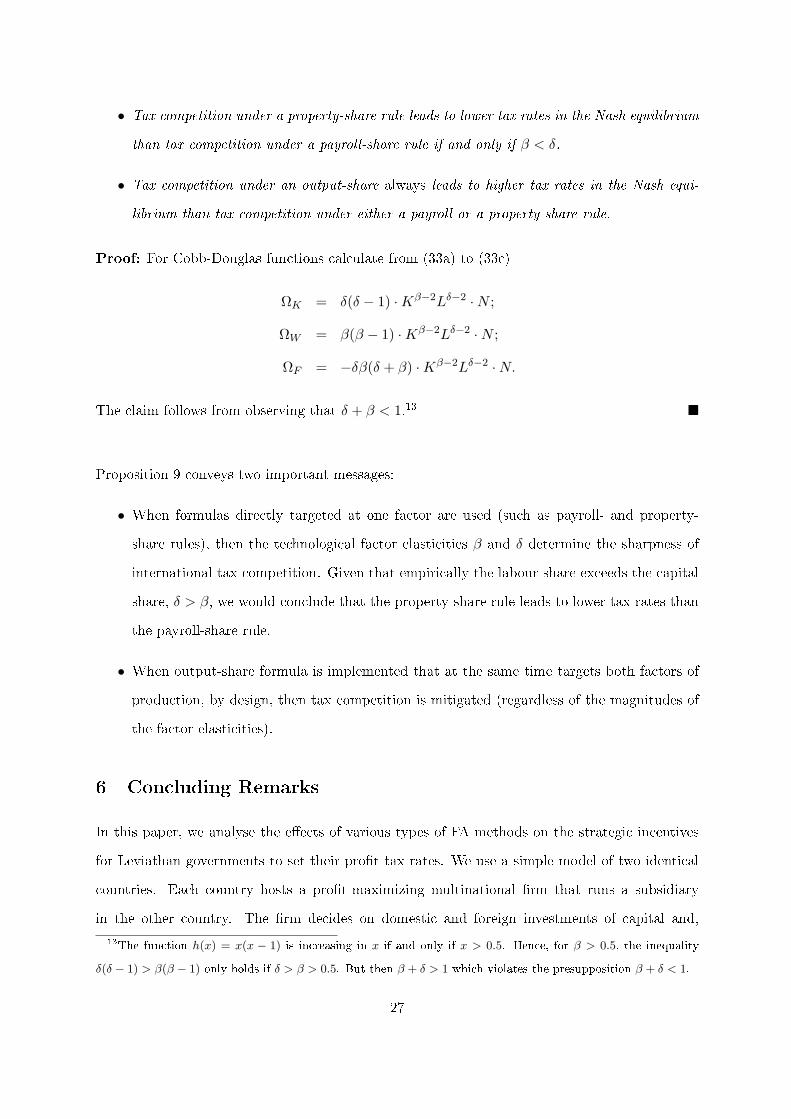
• Tax competition under a property-share rule leads to lower tax rates in the Nash equilibrium
than tax competition under a payroll-share rule if and only if β < δ.
• Tax competition under an output-share always leads to higher tax rates in the Nash equi-
librium than tax competition under either a payroll or a property share rule.
Proof: For Cobb-Douglas functions calculate from (33a) to (33c)
ΩK = δ(δ − 1) ·Kβ−2Lδ−2 ·N ;
ΩW = β(β − 1) ·Kβ−2Lδ−2 ·N ;
ΩF = −δβ(δ + β) ·Kβ−2Lδ−2 ·N.
The claim follows from observing that δ + β < 1.13
Proposition 9 conveys two important messages:
• When formulas directly targeted at one factor are used (such as payroll- and property-
share rules), then the technological factor elasticities β and δ determine the sharpness of
international tax competition. Given that empirically the labour share exceeds the capital
share, δ > β, we would conclude that the property-share rule leads to lower tax rates than
the payroll-share rule.
• When output-share formula is implemented that at the same time targets both factors of
production, by design, then tax competition is mitigated (regardless of the magnitudes of
the factor elasticities).
6 Concluding Remarks
In this paper, we analyse the eects of various types of FA methods on the strategic incentives
for Leviathan governments to set their prot tax rates. We use a simple model of two identical
countries. Each country hosts a prot-maximizing multinational rm that runs a subsidiary
in the other country. The rm decides on domestic and foreign investments of capital and,
13The function h(x) = x(x − 1) is increasing in x if and only if x > 0.5. Hence, for β > 0.5, the inequality
δ(δ − 1) > β(β − 1) only holds if δ > β > 0.5. But then β + δ > 1 which violates the presupposition β + δ < 1.
27

depending on the scenario, on the demands for managerial services (a factor that all of its plants
share) or for labour in each of its locations. Input choices depend, in quite complex ways, on
prot tax rates and on the FA method that is applied.
For the strategic interaction among governments operating under a FA method, our model yields
a general insight: Tax competition is sharper (i.e., equilibrium tax rates are lower) the more
elastically the apportionment formula reacts upon tax changes.
While the thrust of this nding is well-known from many other studies on tax competition, the
challenge in our setting is to identify the conditions determining the magnitudes of the elasticities
of the apportionment formulas. We trace back these conditions to properties of production
technologies and provide some general, yet simple-to-verify, qualiers. Apportionment formulas
can be based on one or more indicators for business activities. The present paper oers results
for quite general formulas but also provides informative insights for more specic, parametric
formulas. Conning this summary to the three most prominent (parametric) apportionment
methods, namely property-, payroll-, and output-share formulas, we nd:
• If labour input is xed, tax competition is for all strictly concave technologies sharpest
under the property-share rule, followed by the sales-share rule and the payroll-share rule.
• If both capital and labour input choices are endogenous and technologies are Cobb-Douglas,
then tax competition under the property- and the payroll-apportionment method (which
both target only one of the production factors) is sharper than under the output-share
formula (which targets both inputs). Whether the payroll- or the property-share formula
gives rise to ercer tax competition, depends on the relative magnitudes of the labour and
capital shares in production.
Our simple model can be extended in various directions:
• Tinkering with the formulas: What are the strategic incentives when governments use
weighted formulas such as:
α = mK · KA
KA + KB+ mF · FA
FA + FB+ mW · LA
LA + LB
with mK +mF +mW = 1? How do strategic governments choose the weights in their appor-
tionment formula? Investigating these questions could relate our approach to Anand and
28

Sansing (2000) who show that governments have an incentive to employ dierent formulas
while a uniform formula would be the preferred choice from a co-operative perspective.
• Asymmetric formulas and countries: Since governments are unlikely to agree on a uniform
formula it is important to know the impact on tax competition among governments that
use dierent formulas. Likewise, tax competition among countries of dierent size is a
further step towards realism. Both extensions introduce asymmetries into the model. In
view of the complexities we already encountered in the symmetric settings studied here,
these extensions can be expected to pose substantial analytical challenges.
• Government objectives other than revenue maximization: Nielsen et al. (2002a) show that
the criteria to compare tax competition under SA and under FA with property-shares basi-
cally apply to governments that are either tax revenue maximizers or welfare maximizers.
One may want to check whether this is also true for comparing tax competition equilibria
under various methods of FA.
• Comparison between FA and separate accounting: Nielsen et al. (2002a) nd that, under
property-share, FA tax increases have a stronger [weaker] impact on domestic [foreign]
investment than under SA. From our analysis, it is doubtful whether this observation
carries over to other FA methods as well. This issue calls for clarication.
Nielsen et al. (2002a) have a central policy message for the European Union striving to reform
its current, messy system of corporate prot taxation in favour of a (hopefully better structured)
method: If that reform involves formula apportionment to allocate tax revenues to EU member
states, then it is not necessarily clear whether tax competition will be mitigated within Europe.
The principal message from our analysis is that incentives for strategic taxation under FA depend
on the attributes of the apportionment formula to be implemented. Tax competition in the
EU can be mitigated by choosing a tax-inelastic apportionment formula. However, whether one
formula is less elastic than another typically depends on properties of the production technologies
and therefore is an empirical issue.
29

Acknowledgements
The authors thank Volker Grossmann, Søren Bo Nielsen, David Wildasin and seminar partici-
pants in Mannheim and Munich for their helpful comments and discussion. The usual disclaimer
applies.
References
Anand, Bharat, and Richard Sansing, 2000. The Weighting Game: Formula Apportionment as
an Instrument of Public Policy. National Tax Journal 53, 183199.
Bartelsman, Eric J., and Roel M.W.J. Beetsma, 2000, Why Pay More? Corporate Tax Avoidance
through Transfer Pricing in OECD Countries. CESifo Working Paper No. 324, Munich.
Cnossen, Sijbren, 2002, Tax Policy in the European Union: A Review of Issues and Options.
CESifo Working Paper No. 758, Munich.
Devereux, Michael P., and Rachel Grith, 2001, Summary of the Devereux and Grith Eco-
nomic Model and Measures of Eective Tax Rates. Annex A of European Commission (2001).
European Commission, 2001, Company Taxation in the Internal Market. COM(2001), 582nal:
Brussels.
Goolsbee, Arthur, and E. Maydew, 2000, Coveting Thy Neighbor's Manufacturing: The Dilemma
of State Income Apportionment. Journal of Public Economics 75, 125143.
Gordon, Roger, and John D. Wilson, 1986, An Examination of Multijurisdictional Corporate
Income Taxation under Formula Apportionment. Econometrica 54, 13571373.
Mintz, Jack M., 2002, Company Taxation and the Internal Market. CESifo Forum 1/2002, 39
(Munich).
Nielsen, Søren Bo, Pascalis Raimondos-Møller, and Guttorm Schjelderup, 2002a, Tax Spillovers
under Separate Accounting and Formula Apportionment. EPRU Discussion Paper, Copen-
hagen.
30

Nielsen, Søren Bo, Pascalis Raimondos-Møller, and Guttorm Schjelderup, 2002b, Formula Ap-
portionment and Transfer Pricing under Oligopolistic Competition. Forthcoming, Journal of
Public Economic Theory.
Weiner, Joann Martens, 2002a, Formula Apportionment and the Future of Company Taxation
in the European Union. CESifo Forum 1/2002, 1020 (Munich).
Weiner, Joann Martens, 2002b, Formula Apportionment in the EU: A Dream Come True or the
EU's Worst Nightmare? CESifo Working Paper No. 667, Munich.
Wildasin, David, 2000, State and Provincial Corporate Income Taxation. Current Practice and
Policy Issues for the United States and Canada. Canadian Tax Journal 48, 424441.
31

CESifo Working Paper Series(for full list see www.cesifo.de)
________________________________________________________________________
947 Erkki Koskela and Mikko Puhakka, Stabilizing Competitive Cycles with DistortionaryTaxation, May 2003
948 Steffen Huck and Kai A. Konrad, Strategic Trade Policy and Merger Profitability, May2003
949 Frederick van der Ploeg, Beyond the Dogma of the Fixed Book Price Agreement, May2003
950 Thomas Eichner and Rüdiger Pethig, A Microfoundation of Predator-Prey Dynamics,May 2003
951 Burkhard Heer and Bernd Süssmuth, Cold Progression and its Effects on IncomeDistribution, May 2003
952 Yu-Fu Chen and Michael Funke, Labour Demand in Germany: An Assessment of Non-Wage Labour Costs, May 2003
953 Hans Gersbach and Hans Haller, Competitive Markets, Collective Decisions and GroupFormation, May 2003
954 Armin Falk, Urs Fischbacher, and Simon Gächter, Living in Two Neighborhoods –Social Interactions in the LAB, May 2003
955 Margarita Katsimi, Training, Job Security and Incentive Wages, May 2003
956 Clemens Fuest, Bernd Huber, and Jack Mintz, Capital Mobility and Tax Competition: ASurvey, May 2003
957 Edward Castronova, The Price of ‘Man’ and ‘Woman’: A Hedonic Pricing Model ofAvatar Attributes in a Synthetic World, June 2003
958 Laura Bottazzi and Marco Da Rin, Financing Entrepreneurial Firms in Europe: Facts,Issues, and Research Agenda, June 2003
959 Bruno S. Frey and Matthias Benz, Being Independent is a Great Thing: SubjectiveEvaluations of Self-Employment and Hierarchy, June 2003
960 Aaron Tornell and Frank Westermann, Credit Market Imperfections in Middle IncomeCountries, June 2003
961 Hans-Werner Sinn and Wolfgang Ochel, Social Union, Convergence and Migration,June 2003

962 Michael P. Devereux, Measuring Taxes on Income from Capital, June 2003
963 Jakob de Haan, Jan-Egbert Sturm and Bjørn Volkerink, How to Measure the TaxBurden on Labour at the Macro-Level?, June 2003
964 Harry Grubert, The Tax Burden on Cross-Border Investment: Company Strategies andCountry Responses, June 2003
965 Kirk A. Collins and James B. Davies, Measuring Effective Tax Rates on HumanCapital: Methodology and an Application to Canada, June 2003
966 W. Steven Clark, Using Micro-Data to Assess Average Tax Rates, June 2003
967 Christopher Heady, The ‘Taxing Wages’ Approach to Measuring the Tax Burden onLabour, June 2003
968 Michael P. Devereux and Alexander Klemm, Measuring Taxes on Income from Capital:Evidence from the UK, June 2003
969 Bernhard Eckwert and Itzhak Zilcha, The Effect of Better Information on IncomeInequality, June 2003
970 Hartmut Egger and Josef Falkinger, The Role of Public Infrastructure for Firm Locationand International Outsourcing, June 2003
971 Dag Morten Dalen and Trond E. Olsen, Regulatory Competition and Multi-nationalBanking, June 2003
972 Matthias Wrede, Tax Deductibility of Commuting Expenses and Residential Land Usewith more than one Center, June 2003
973 Alessandro Cigno and Annalisa Luporini, Scholarships or Student Loans? SubsidizingHigher Education in the Presence of Moral Hazard, June 2003
974 Chang Woon Nam, Andrea Gebauer and Rüdiger Parsche, Is the Completion of EUSingle Market Hindered by VAT Evasion?, June 2003
975 Michael Braulke and Giacomo Corneo, Capital Taxation May Survive in OpenEconomies, July 2003
976 Assar Lindbeck, An Essay on Welfare State Dynamics, July 2003
977 Henrik Jordahl and Luca Micheletto, Optimal Utilitarian Taxation and HorizontalEquity, July 2003
978 Martin D. D. Evans and Richard K. Lyons, Are Different-Currency Assets ImperfectSubstitutes?, July 2003
979 Thorsten Bayindir-Upmann and Frank Stähler, Market Entry Regulation andInternational Competition, July 2003

980 Vivek Ghosal, Firm and Establishment Volatility: The Role of Sunk Costs, ProfitUncertainty and Technological Change, July 2003
981 Christopher A. Pissarides, Unemployment in Britain: A European Success Story, July2003
982 Wolfgang Buchholz, Richard Cornes, and Wolfgang Peters, On the Frequency ofInterior Cournot-Nash Equilibria in a Public Good Economy, July 2003
983 Syed M. Ahsan and Panagiotis Tsigaris, Choice of Tax Base Revisited: Cash Flow vs.Prepayment Approaches to Consumption Taxation, July 2003
984 Campbell Leith and Jim Malley, A Sectoral Analysis of Price-Setting Behavior in USManufacturing Industries, July 2003
985 Hyun Park and Apostolis Philippopoulos, Choosing Club Membership under TaxCompetition and Free Riding, July 2003
986 Federico Etro, Globalization and Political Geography, July 2003
987 Dan Ariely, Axel Ockenfels and Alvin E. Roth, An Experimental Analysis of EndingRules in Internet Auctions, July 2003
988 Paola Conconi and Carlo Perroni, Self-Enforcing International Agreements andDomestic Policy Credibility, July 2003
989 Charles B. Blankart and Christian Kirchner, The Deadlock of the EU Budget: AnEconomic Analysis of Ways In and Ways Out, July 2003
990 M. Hasham Pesaran and Allan Timmermann, Small Sample Properties of Forecastsfrom Autoregressive Models under Structural Breaks, July 2003
991 Hyun Park, Apostolis Philippopoulos and Vangelis Vassilatos, On the Optimal Size ofPublic Sector under Rent-Seeking competition from State Coffers, July 2003
992 Axel Ockenfels and Alvin E. Roth, Late and Multiple Bidding in Second Price InternetAuctions: Theory and Evidence Concerning Different Rules for Ending an Auction, July2003
993 Pierre Salmon, The Assignment of Powers in an Open-ended European Union, July2003
994 Louis N. Christofides and Chen Peng, Contract Duration and Indexation in a Period ofReal and Nominal Uncertainty, July 2003
995 M. Hashem Pesaran, Til Schuermann, Björn-Jakob Treutler, and Scott M. Weiner,Macroeconomic Dynamics and Credit Risk: A Global Perspective, July 2003
996 Massimo Bordignon and Sandro Brusco, On Enhanced Cooperation, July 2003

997 David F. Bradford, Addressing the Transfer-Pricing Problem in an Origin-Basis X Tax,July 2003
998 Daniel Gros, Who Needs Foreign Banks?, July 2003
999 Wolfram Merzyn and Heinrich W. Ursprung, Voter Support for Privatizing Education:Evidence on Self-Interest and Ideology, July 2003
1000 Jo Thori Lind, Fractionalization and the Size of Government, July 2003
1001 Daniel Friedman and Donald Wittman, Litigation with Symmetric Bargaining and Two-Sided Incomplete Information, July 2003
1002 Matthew Clarke and Sardar M. N. Islam, Health Adjusted GDP (HAGDP) Measures ofthe Relationship Between Economic Growth, Health Outcomes and Social Welfare, July2003
1003 Volker Grossmann, Contest for Attention in a Quality-Ladder Model of EndogenousGrowth, August 2003
1004 Marcel Gérard and Joan Martens Weiner, Cross-Border Loss Offset and FormularyApportionment: How do they affect multijurisdictional firm investment spending andinterjurisdictional tax competition ?, August 2003
1005 Burkhard Heer, Nonsuperneutrality of Money in the Sidrauski Model with HeterogeousAgents, August 2003
1006 V. Anton Muscatelli, Piergiovanna Natale, and Patrizio Tirelli, A Simple and FlexibleAlternative to the Stability and Growth Pact Deficit Ceilings. Is it at hand?, August2003
1007 Reto Foellmi and Josef Zweimüller, Inequality and Economic Growth: European VersusU.S. Experiences, August 2003
1008 James S. Costain and Michael Reiter, Business Cycles, Unemployment Insurance, andthe Calibration of Matching Models, August 2003
1009 Marco Runkel, Optimal Contest Design when the Designer’s Payoff Depends onCompetitive Balance, August 2003
1010 Donald O. Parsons, Torben Tranaes and Helene Bie Lilleør, Voluntary PublicUnemployment Insurance, August 2003
1011 Rüdiger Pethig and Andreas Wagener, Profit Tax Competition and FormulaApportionment, August 2003