
soep-wave-report_2011.pdf - econstor
98
econstor Make Your Publications Visible. A Service of zbw Leibniz-Informationszentrum Wirtschaft Leibniz Information Centre for Economics Gerstorf, Sandra (Ed.); Schupp, Jürgen (Ed.) Article SOEP Wave Report 2011 SOEP Wave Report, No. 2011 Provided in Cooperation with: German Institute for Economic Research (DIW Berlin) Suggested Citation: Gerstorf, Sandra (Ed.); Schupp, Jürgen (Ed.) (2012) : SOEP Wave Report 2011, SOEP Wave Report, No. 2011, Deutsches Institut für Wirtschaftsforschung (DIW), Berlin This Version is available at: http://hdl.handle.net/10419/148017 Standard-Nutzungsbedingungen: Die Dokumente auf EconStor dürfen zu eigenen wissenschaftlichen Zwecken und zum Privatgebrauch gespeichert und kopiert werden. Sie dürfen die Dokumente nicht für öffentliche oder kommerzielle Zwecke vervielfältigen, öffentlich ausstellen, öffentlich zugänglich machen, vertreiben oder anderweitig nutzen. Sofern die Verfasser die Dokumente unter Open-Content-Lizenzen (insbesondere CC-Lizenzen) zur Verfügung gestellt haben sollten, gelten abweichend von diesen Nutzungsbedingungen die in der dort genannten Lizenz gewährten Nutzungsrechte. Terms of use: Documents in EconStor may be saved and copied for your personal and scholarly purposes. You are not to copy documents for public or commercial purposes, to exhibit the documents publicly, to make them publicly available on the internet, or to distribute or otherwise use the documents in public. If the documents have been made available under an Open Content Licence (especially Creative Commons Licences), you may exercise further usage rights as specified in the indicated licence. www.econstor.eu
-
Upload
khangminh22 -
Category
Documents
-
view
3 -
download
0
Transcript of soep-wave-report_2011.pdf - econstor

econstorMake Your Publications Visible.
A Service of
zbwLeibniz-InformationszentrumWirtschaftLeibniz Information Centrefor Economics
Gerstorf, Sandra (Ed.); Schupp, Jürgen (Ed.)
Article
SOEP Wave Report 2011
SOEP Wave Report, No. 2011
Provided in Cooperation with:German Institute for Economic Research (DIW Berlin)
Suggested Citation: Gerstorf, Sandra (Ed.); Schupp, Jürgen (Ed.) (2012) : SOEP Wave Report2011, SOEP Wave Report, No. 2011, Deutsches Institut für Wirtschaftsforschung (DIW), Berlin
This Version is available at:http://hdl.handle.net/10419/148017
Standard-Nutzungsbedingungen:
Die Dokumente auf EconStor dürfen zu eigenen wissenschaftlichenZwecken und zum Privatgebrauch gespeichert und kopiert werden.
Sie dürfen die Dokumente nicht für öffentliche oder kommerzielleZwecke vervielfältigen, öffentlich ausstellen, öffentlich zugänglichmachen, vertreiben oder anderweitig nutzen.
Sofern die Verfasser die Dokumente unter Open-Content-Lizenzen(insbesondere CC-Lizenzen) zur Verfügung gestellt haben sollten,gelten abweichend von diesen Nutzungsbedingungen die in der dortgenannten Lizenz gewährten Nutzungsrechte.
Terms of use:
Documents in EconStor may be saved and copied for yourpersonal and scholarly purposes.
You are not to copy documents for public or commercialpurposes, to exhibit the documents publicly, to make thempublicly available on the internet, or to distribute or otherwiseuse the documents in public.
If the documents have been made available under an OpenContent Licence (especially Creative Commons Licences), youmay exercise further usage rights as specified in the indicatedlicence.
www.econstor.eu

Sandra Gerstorf, Jürgen Schupp (Editors)
SOEPThe German Socio-EconomicPanel Study at DIW Berlin
DIW Berlin — Deutsches Institut für Wirtschaftsforschung e. V.Mohrenstraße 58, 10117 Berlinwww.diw.de
SOEP Wave Report2011SOEP — The German Socio-Economic Panel Study at DIW Berlin
The Socio-Economic Panel (SOEP) is the largest and longest
running multidisciplinary longitudinal study in Germany. The
SOEP is an integral part of Germany's scientific research infra-
structure and is funded by the federal and state governments
under the framework of the Leibniz Association (WGL). The
SOEP is based at DIW Berlin.

Impressum
German Socio-Economic Panel Study | SOEPDIW BerlinMohrenstr. 58 10117 BerlinGermany
Phone +49-30-897 89-238Fax +49-30-897 89-109
DirectorJürgen Schupp
EditorsSandra Gerstorf, Jürgen Schupp
Technical Office Michaela Engelmann, Alfred Gutzler
Berlin, June 2012

this wave report is dedicated to our friend and colleague
Joachim R. Frick (1962–2011)
in memoriam


3SOEP Wave Report 2011
Contents
Introduction ............................................................................................................................................................................. 5
Part I: The Basics of SOEP ......................................................................................................................................................7
SOEP Mission .........................................................................................................................................................................7
Background and Overview ......................................................................................................................................................8
Results of the 2011 User Survey ............................................................................................................................................11
SOEP Personnel ..................................................................................................................................................................... 13
Part II: A Selection of 2011 Publications by the SOEP team............................................................................................... 17
Child Care Choices in Western Germany Also Correlated with Mother’s Personality .....................................................19
Social and Economic Characteristics of Financial and Blood Donors in Germany ..........................................................27
Alliance ‘90/The Greens at the crossroads: On their way to becoming a mainstream party? ......................................... 35
Success Despite Starting Out at a Disadvantage: What Helps Second-Generation Migrants in France and Germany? 43
Extent and Effects of Employees in Germany Forgoing Vacation Time ............................................................................52
Part III: Summary Report SOEP Fieldwork in 2011 ............................................................................................................59
Part IV: Publications ............................................................................................................................................................. 79
Society of Friends of DIW Berlin (VdF) Award Winners for Best Publications ............................................................... 79
SSCI-Publications 2011 ........................................................................................................................................................ 82
SOEPpapers 2011 ...................................................................................................................................................................83
SOEP Survey Papers 2011 .....................................................................................................................................................87
In Memoriam Joachim R. Frick ........................................................................................................................................... 92


5SOEP Wave Report 2011
Introduction Jürgen Schupp Head of the Research Infrastructure SOEP Professor of Sociology at Freie Universität BerlinPh
oto:
Ste
phan
Röh
l
This is the second of an annual series of Wave Reports on the German Socio-Economic Panel Study (SOEP). SOEP has now been running for over a quarter of century (1984-2011). Twenty-eight waves of data have been collected. So some respondents, about 2,500 middle aged and older people, have kind-ly agreed to be interviewed twenty-eight times. The central theme of SOEP is ‘subjective and economic well-being over the life course’. In practice, this means interviewing about four main topics: family life; wealth, incomes and standard of living; employment and unemployment/joblessness; health and life sa-tisfaction. This report contains short articles with statistical tables covering the diversity of these topics and providing the reader with some insight on applied SOEP research. Our target readers are policy ma-kers and the informed public.
The ambitious aim of SOEP, and of the Wave Reports, is to provide on an annual basis a new type of so-cial statistics for Germany; longitudinal panel statistics describing the ways in which people’s lives are changing. In addition—and equally important—the Wave Reports will give a technical summary of the development of the survey and its fieldwork.
A significant structural change within the DIW is the fact that SOEP’s long standing director Gert G. Wagner was appointed Chairman of the Executive Board of the entire DIW Berlin in January 2011 due to the unexpected resignation of DIW’s president Klaus F. Zimmermann. Gert G. Wagner will remain his new Chairman position through the end of 2012. Joachim R. Frick and I were appointed interim di-rectors of the SOEP. Sadly, Joachim was faced with a substantial health threat by the end of 2010 and passed away in December 2011. He will be in our hearts forever and we dedicate this Wave Report to him.
Berlin, April 2012
Jürgen Schupp


7SOEP Wave Report 2011
Part I: The Basics of SOEPSOEP Mission
The German Socio-Economic Panel Study (SOEP) is a research-driven infrastructure unit which serves an international scientific community by providing nationally representative longitudinal data from a multi-disciplinary perspective covering the entire life span (from conception to memories) in the context of private households (household panel).
The data enables not only policy oriented research (“social moni-toring”) but mainly cutting-edge research to improve understan-ding of human behavior in general, economic decisions in detail, and mechanisms of social change embedded in the household context, the neighborhood, and different institutional settings and policy regimes.
The SOEP group’s academic excellence and cutting-edge research serve as the foundation for all of its data provision and service activities aimed at fulfilling this mission.
and political science. A selection of research questions cooperate life sciences (in particular genetics) and me-dical science as well.
The SOEP unit is constantly implementing new areas of measurement (including biomarkers and physical mea-sures as well as geo-referenced context data) to impro-ve and strengthen survey methodology, thereby provi-ding advanced assessments of the determinants of hu-man behavior.
The SOEP unit focuses its own research on selected fields and demonstrates expertise in applying substan-tive and methodologically sound research in economics, psychology, and selected social sciences, including ba-sic research an applied (policy-oriented) research tar-geted to both: the academic community and the soci-ety as a whole.
The SOEP unit cooperates and collaborates with scho-lars on a national (e.g., colleagues from a variety of re-search institutions in Berlin) as well as international level, thereby complementing competences from other disciplines that add to the depth of the SOEP research.
The SOEP unit improves scientific foundations for po-litical advice beyond descriptive research (social moni-toring).
The SOEP unit provides high-quality training and teaching that enables and fosters knowledge transfer to the next generation of scholars.
The SOEP unit is striving to make the research conduc-ted with the survey data accessible and understandab-le to a broad audience through the German and inter-national media.
Goals
One of the SOEP s key goals is to provide panel data that allow users to conduct longitudinal and cross-sectional analyses with state-of-the-art scientific methodologies to better understand mechanisms underlying human be-havior and social change, embedded in the household context, the neighborhood, and different institutional settings and policy regimes.
Outcomes
The SOEP unit provides user-friendly high quality pa-nel data for multidisciplinary research primarily in the social and behavioral sciences and economics, inclu-ding sociology, demography, psychology, public health,

Part I: the BasIcs of soeP
SOEP Wave Report 20118
Background and Overview
soeP team
SOEP is planned and designed by the SOEP research team at DIW Berlin. Funding comes from the Federal Government (BMBF) and the German State Governments via the Leibniz Association (WGL). Annual interviews have been conducted from the outset by TNS Infratest Sozialforschung, the widely respected social research com-pany based in Munich. In October 2010 a new long term contract of ten years with TNS Infratest Munich was signed. So two professional teams are running SOEP: a Berlin team and a Munich team.
The scope of SOEP keeps being extended as it takes in new topics of interest to a range of scientists. The Survey has also established international connections, including links with other panel studies (Burkhauser and Lillard, 2005). The Cross-National Equivalent File (CNEF) is a eight-country data set, updated each year, comprising national panel surveys from the U.S., Britain, Canada, Australia, South Korea, Russia and Switzerland as well as SOEP (Frick et al., 2007). SOEP is also one of the surveys included in the Consortium of Household Panels for European Socio-Economic Research (CHER) and was also the German contribution to the European Communi-ty Household Panel (ECHP), which ran from 1994-2001. SOEP data are included in two well-known and widely used cross-sectional data bases, the Luxembourg Income Study (LIS) and the Luxembourg Wealth Study (LWS).
The underlying idea of a national panel sample is to follow represen-tative respondents through all stages of life—through birth, marriage and death, then on to the next generations as well. Original sample members are interviewed every year.
Panel data are quite different and add a new dimension to social statistics. A panel survey is longitudinal rather than cross-sectional. It follows people’s lives over time; the same individuals and family members are intervie-wed every year. So we can see how individual lives are changing. We can see whether the same people remain married, income poor or unemployed every year. As rea-ders of this volume will see, the panel method opens up new understandings. Cross-sectional statistics only change slowly and usually record only small changes from year to year. So it seems ‘natural’ or obvious to in-fer that the same people remain married, poor or unem-ployed year after year. Panel data in Germany and many other Western countries show that, while the first in-ference happens to be correct, the second and third are more wrong than right. That is, it is true that more or less the same people stay married year after year (only about 2% of marriages end each year, even though even-tually over 30% will end in separation), but it is false to believe that the same people stay income poor and/or unemployed year after year. On the contrary, most poor people cease to be poor within a year or two, and most unemployed people get jobs within six months, although long-term unemployment has increased in recent deca-des. On the other hand, panel data also show that peo-ple who have been poor or unemployed in the past are at greater risk of returning to poverty and unemploy-ment than others.
So panel data offer something like video evidence rather than the photographic evidence of cross-sectional sur-veys. In social science jargon, panel data tell us about dy-namics—family, income, labour, well-being and health dynamics—rather than statics. They tell us about dura-tion/persistence, about how long people remain poor or unemployed, and about the correlates of entry into and exit from poverty and unemployment. For these reasons panel data are crucial for Government and public poli-cy analysis. The aims of policy include trying to reduce poverty and unemployment, so it is vital for policy ma-kers to distinguish between short, medium and long
9SOEP Wave Report 2011
termers—quite different policy interventions may be needed to assist these different groups—and to gain an understanding of reasons for entry and exit from these states. In summary, national panel surveys are vital to policy makers and the social science community. They should be viewed as social science infrastructure.
SOEP started in West Germany in 1984 with two sub-samples. Sample A covered the national population living in private households and Sample B was an over-sample of the five main immigrant groups in West Germany at that time: Greeks, Italians, Spanish, Turks and Yugos-lavs. In the two samples combined there were just over 12,000 respondents in just under 6,000 households.
Interviewing continued in 1984-89 and then the Wall came down. In that unique situation SOEP had a spe-cial opportunity and challenge. The opportunity was to measure conditions in the GDR before it ceased to exist, and then in subsequent years trace social and economic changes and the integration of the two socie-ties. A new sample of East Germans was added in mid-1990 before reunification, when the GDR’s occupatio-nal and wage structure were still in place. The samp-le comprised approximately 4,400 individuals in over 2,000 households. These respondents are followed in exactly the same way as the original sample members, and this of course includes following people who move from the Eastern to the Western states, and vice-versa.
By 1994-1995 about 5% of Germany’s population con-sisted of immigrants who had not been in the country when SOEP started. So it was essential to have a new immigrant sample. This was done but it was expensive. About 20,000 households had to be screened to identify about 600 which included new immigrants.
Even though the SOEP sample was already large, a pro-blem faced in some analyses was insufficient numbers in key ‘policy groups’; for example, single parents and recipients of specific welfare payments. Rather than att-empt to sample these groups specially, it was preferable to substantially increase the total sample. In 2000 ad-ditional funds were raised and the sample was almost doubled to over 10,000 households.
A special group who were still inadequately sampled were ‘the rich’—very high income-households who in some cases also have a high level of wealth. In 2002 SOEP drew a special sample of households in the top 2.5% of the income distribution. In that year, not coin-cidentally, we did our first individual level survey of wealth holdings (assets and debts).
The latest boost to the sample came in 2011 at which time there were 12.281 households. An aim for the future is to add refresher samples when necessary in order to sta-bilize and to increase the sample size at about this level.
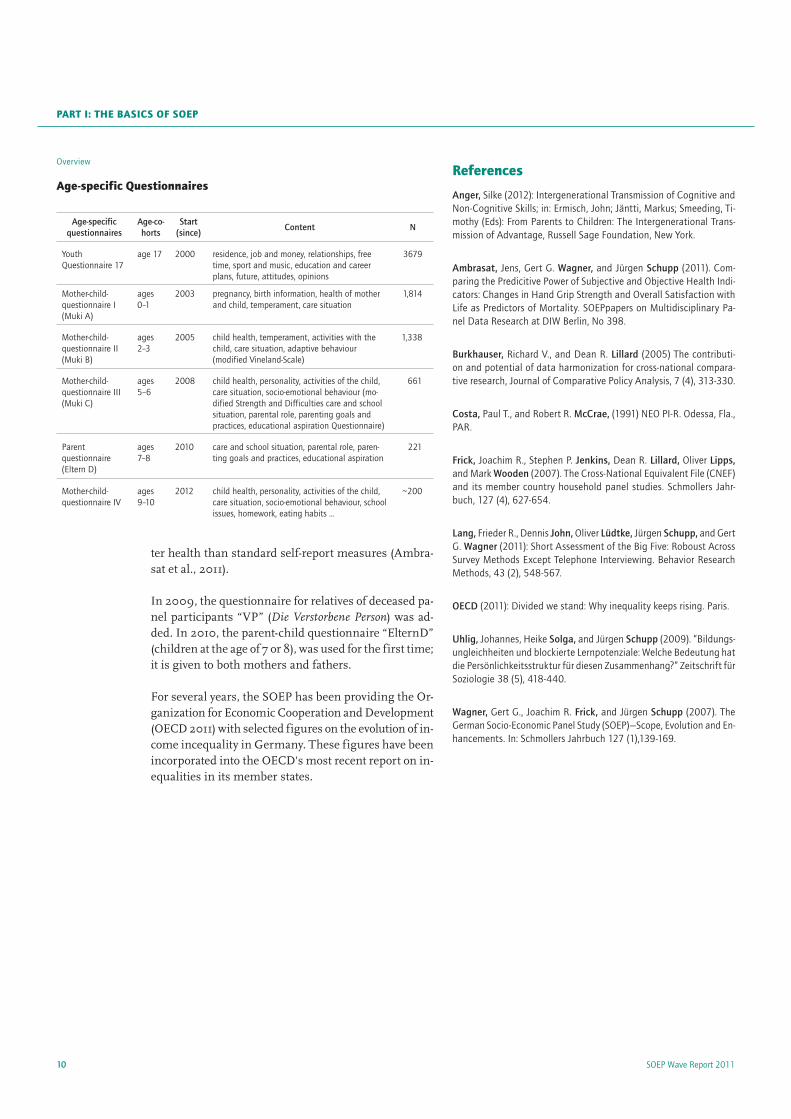
When SOEP began it was run by and was primarily of interest to economists and sociologists. But other bran-ches of science also have much to contribute to analysis of the life course, and their interests are now more fully ref lected in the questionnaire. Developmental psycholo-gists and family sociologists are interested in issues re-lating to child-rearing and nature-nurture debates. For them SOEP has long offered large samples of siblings, step-children, adopted children and now grandchild-ren. Then in 2001 an age-triggered questionnaire was introduced. 2001 was the year in which the first child-ren who, so to speak, were born into SOEP joined as full 17 year old respondents. A “Youth Questionnaire”, fo-cusing on issues of interest to teenagers was included. In 2003, a “Mother and Child” questionnaire came in for the first time, to be completed by mothers who had given birth in the last year. Two years later these mo-thers completed an “Infant Questionnaire”, reporting on their baby’s early development. In 2008, the mother-child questionnaire “Muki C” (children at the age of 5 or 6) was introduced.
Psychologists, experimental economists and the gro-wing army of social scientists interested in life satis-faction and ‘subjective well-being’ were keen for SOEP to include measures of personal traits which affect, or may affect, economic decision-making and subjective well-being. So in 2004 measures of trust and risk aver-sion were included. And then in 2005 SOEP included a short version of the so-called Big Five Personality Do-mains (Costa and McCrae, 1991). The personality traits or domains measured are neuroticism, extroversion, openness to experience, agreeableness and conscien-tiousness (Lang et al., 2011). In 2006 measures of cog-nitive ability, given only to small groups of respondents, were included for the first time. New teenage respon-dents completed a 30 minute test of verbal, numerical and figural ability (Uhlig et al. 2009), and a sub-sam-ple of adult respondents did a very short cognitive test which will be replicated in 2012 (Anger, 2012).
An increasing number of health and medical resear-chers have begun to take an interest in SOEP. The Sur-vey has always collected measures of self-reported health and use of medical services. In 2002 and subsequent ye-ars we added measures of height and weight (hence bo-dy-mass index; BMI), and of smoking and alcohol con-sumption. In 2006, dynamometers were used to mea-sure grip strength (a sub-sample only) because changes in grip strength are known to be a better predictor of la-
SOEP Wave Report 201110
Part I: the BasIcs of soeP
ter health than standard self-report measures (Ambra-sat et al., 2011).
In 2009, the questionnaire for relatives of deceased pa-nel participants “VP” (Die Verstorbene Person) was ad-ded. In 2010, the parent-child questionnaire “ElternD” (children at the age of 7 or 8), was used for the first time; it is given to both mothers and fathers.
For several years, the SOEP has been providing the Or-ganization for Economic Cooperation and Development (OECD 2011) with selected figures on the evolution of in-come incequality in Germany. These figures have been incorporated into the OECD's most recent report on in-equalities in its member states.
references
Anger, Silke (2012): Intergenerational Transmission of Cognitive and Non-Cognitive Skills; in: Ermisch, John; Jäntti, Markus; Smeeding, Ti-mothy (Eds): From Parents to Children: The Intergenerational Trans-mission of Advantage, Russell Sage Foundation, New York.
Ambrasat, Jens, Gert G. Wagner, and Jürgen Schupp (2011). Com-paring the Predicitive Power of Subjective and Objective Health Indi-cators: Changes in Hand Grip Strength and Overall Satisfaction with Life as Predictors of Mortality. SOEPpapers on Multidisciplinary Pa-nel Data Research at DIW Berlin, No 398.
Burkhauser, Richard V., and Dean R. Lillard (2005) The contributi-on and potential of data harmonization for cross-national compara-tive research, Journal of Comparative Policy Analysis, 7 (4), 313-330.
Costa, Paul T., and Robert R. McCrae, (1991) NEO PI-R. Odessa, Fla., PAR.
Frick, Joachim R., Stephen P. Jenkins, Dean R. Lillard, Oliver Lipps, and Mark Wooden (2007). The Cross-National Equivalent File (CNEF) and its member country household panel studies. Schmollers Jahr-buch, 127 (4), 627-654.
Lang, Frieder R., Dennis John, Oliver Lüdtke, Jürgen Schupp, and Gert G. Wagner (2011): Short Assessment of the Big Five: Roboust Across Survey Methods Except Telephone Interviewing. Behavior Research Methods, 43 (2), 548-567.
OECD (2011): Divided we stand: Why inequality keeps rising. Paris.
Uhlig, Johannes, Heike Solga, and Jürgen Schupp (2009). “Bildungs-ungleichheiten und blockierte Lernpotenziale: Welche Bedeutung hat die Persönlichkeitsstruktur für diesen Zusammenhang?” Zeitschrift für Soziologie 38 (5), 418-440.
Wagner, Gert G., Joachim R. Frick, and Jürgen Schupp (2007). The German Socio-Economic Panel Study (SOEP)—Scope, Evolution and En-hancements. In: Schmollers Jahrbuch 127 (1),139-169.
Overview
age-specific Questionnaires
Age-specific questionnaires
Age-co-horts
Start (since)
Content N
Youth Questionnaire 17
age 17 2000 residence, job and money, relationships, free time, sport and music, education and career plans, future, attitudes, opinions
3679
Mother-child-questionnaire I (Muki A)
ages 0–1
2003 pregnancy, birth information, health of mother and child, temperament, care situation
1,814
Mother-child-questionnaire II (Muki B)
ages 2–3
2005 child health, temperament, activities with the child, care situation, adaptive behaviour (modified Vineland-Scale)
1,338
Mother-child-questionnaire III (Muki C)
ages 5–6
2008 child health, personality, activities of the child, care situation, socio-emotional behaviour (mo-dified Strength and Difficulties care and school situation, parental role, parenting goals and practices, educational aspiration Questionnaire)
661
Parent questionnaire (Eltern D)
ages 7–8
2010 care and school situation, parental role, paren-ting goals and practices, educational aspiration
221
Mother-child-questionnaire IV
ages 9–10
2012 child health, personality, activities of the child, care situation, socio-emotional behaviour, school issues, homework, eating habits …
~200

11SOEP Wave Report 2011
Results of the 2011 User Survey
nent of the data. This is good news for us, since it con-firms that we are on the right track with our new data format, SOEPlong, which promises to make work with the SOEP data easier for many users. SOEPlong sig-nificantly reduces the number of datasets by consoli-dating all those that are similar, and solves the prob-lem of variable names differing from one wave to the next. Despite the fact that it is still in the beta stage, SOEPlong is already being used by 20 percent of user survey respondents. In this year’s data release, we are already providing the second, improved beta version of SOEPlong. As ever, we would be grateful for your feed-back and suggestions.
Plans to publicize the teaching version of SOEP data
The survey results on the use of SOEP data in teaching also proved very interesting. Although 68 percent of re-spondents teach at the university level, only 17 percent of them are using the special teaching version of the SOEP data. In fact, only 42 percent of respondents ac-tive in teaching were aware of the existence of the spe-cial teaching data set. In the future, we plan to provide users with more information about the possibilities of using this special SOEP dataset in teaching.
Plans to improve the visibility of SOEPinfo
The User Survey provided useful feedback on SOEPinfo as well: 13 percent of respondents were un-familiar with SOEPinfo. To rectify this, we plan to give SOEPinfo a more prominent place on our homepage and to further improve the possibilities it offers. One goal is to incorporate metadata information on the SOEP-long data format into a web-based metadata informa-tion system.
To get a better picture of how SOEP users feel about the various ser-vices we provide, including data quality, data access, and documen-tation, we carry out regular surveys of users in Germany and abroad. Our main objective in the 2011 User Survey, was to obtain feedback and suggestions for further improvements.
We sent out 1,996 e-mails to SOEP contract and sub-contract hol-ders, and received answers from 443 users (22.2 percent). This figu-re corresponds fairly precisely to the number of “active” SOEP users who requested and received a data DVD in 2010 (N = 420).
Concentration of SOEP users in economics and sociology
As in previous years, the majority of this year’s respon-dents came from the fields of economics (50 percent) and sociology (33 percent), followed by psychology (6 per-cent), statistics (4 percent), and political science (2 per-cent). The remaining 6 percent work in medicine, edu-cation, and geography. Most respondents work in Ger-many (70 percent) and the European Union (20 percent). 6 percent of respondents work in North America and 4 percent in other parts of the world.
Overall, users reported a high level of satisfaction with SOEP service: the reported overall mean satisfaction was 8.3 percent, satisfaction with data access was 8.6 percent, and satisfaction with documentation was 7.9 percent (possible values ranging from 0 to 10). Only five respon-dents reported dissatisfaction (values between 0 and 4).
Four-fifths of respondents use the longitudinal component of the data, one-fifth already use SOEPlong
The results on data use show that more than 80 per-cent of respondents are using the longitudinal compo-
SOEP Wave Report 201112
Part I: the BasIcs of soeP
Around two-thirds of SOEP users currently working with Stata
The 2011 User Survey showed a significant change in the software used with the SOEP data since the last user survey in 2004. Most respondents are now using Sta-ta, which has taken the lead over SPSS. The open-sour-ce software R is used by 8 percent of respondents. Rela-tively few users are working with Mplus (3 percent), SAS (3 percent), or TDA (2 percent).
soeP services
Accessing SOEP Data
Each year, SOEP data file DVDs are made available to the scientific community. All data are provided in SAS, SPSS, Stata as well as ASCII format. In addition, the DVD includes codebooks and other relevant docu-mentation. To request a DVD please contact Michaela Engelmann, who is the manager of the SOEPhotline, at <[email protected]>.
SOEP Website www.soep.de
The SOEP website provides links to a vast array of use-ful information, including SOEPinfo, SOEPnewsletter, SOEPmonitor, SOEPdataFAQ, Service and Documenta-tion, SOEPremote, SOEPlit, and SOEPcampus.
For more information, please contact the manager of our website, Uta Rahmann <[email protected]>.

13SOEP Wave Report 2011
SOEP Personnel

SOEP Wave Report 201114
sUrVeY MethoDoLoGY aND MaNaGeMeNt
MaNaGeMeNt aND aDMINIstratIoN
Survey ManagementDr. Elisabeth Liebau Phone: -259, [email protected]
Survey MethodologyProf. Dr. Martin Kroh Phone: -678, [email protected]
Innovation Sample (SOEP-IS)Dr. David Richter Phone: -413, [email protected]
SOEP-Related Studies (SOEP-RS)Prof. Dr. C. Katharina Spieß Phone: -254, [email protected]
Prof. Thomas Siedler, Ph. D. Phone:-464, [email protected]
Knowledge TransferDr. Marco Giesselmann Phone: -503, [email protected]
Documentation, SOEPnewsletter,
TranslationJanina Britzke (Documentation) Phone: -418, [email protected]
Deborah Anne Bowen (German-English Translation) Phone: -332, [email protected]
PD Dr. Elke Holst (Labor and Gender Economics, Editor of the SOEPnewsletter) Phone: -281, [email protected]
Uta Rahmann (Documentation) Phone: -287, [email protected]
heaDResearch Management & BudgetingDr. Sandra Gerstorf Phone: -228, [email protected]
Guests and EventsChristine Kurka Phone: -283, [email protected]
Science Press RelationsMonika Wimmer Phone : -179 [email protected]
Sabine Kallwitz (on leave) Phone: -179, [email protected]
Head
Prof. Dr. Jürgen Schupp Phone: -238, [email protected]
Deputy Head Survey Methodology
Prof. Dr. Martin Kroh Phone: -678, [email protected]
Head of the Research Data Center of the SOEP
Dr. Jan Goebel Phone: -377, [email protected]
Team AssistanceChristiane Nitsche Phone: -671, [email protected]
Birgit Pollin Phone: 490, [email protected]
Patricia Axt Phone: -363, [email protected]
Part I: the BasIcs of soeP
15SOEP Wave Report 2011
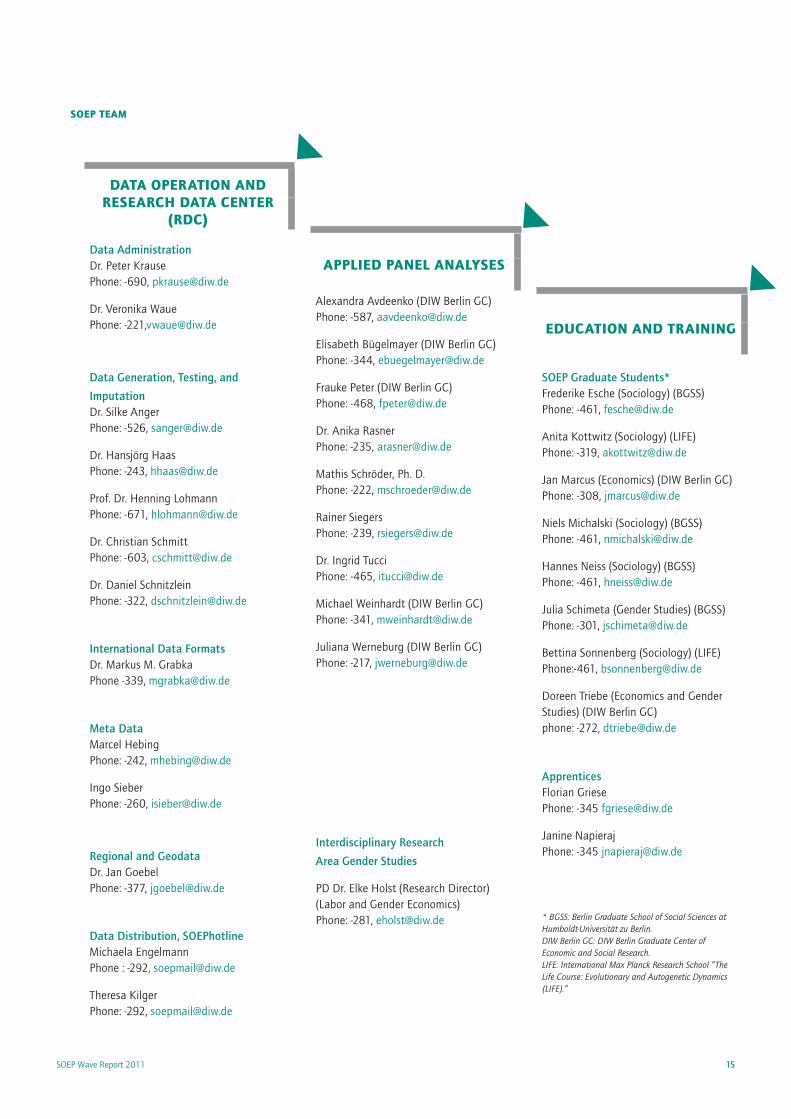
Data oPeratIoN aND research Data ceNter
(rDc)
Data AdministrationDr. Peter Krause Phone: -690, [email protected]
Dr. Veronika Waue Phone: -221,[email protected]
Data Generation, Testing, and
ImputationDr. Silke Anger Phone: -526, [email protected]
Dr. Hansjörg Haas Phone: -243, [email protected]
Prof. Dr. Henning Lohmann Phone: -671, [email protected]
Dr. Christian Schmitt Phone: -603, [email protected]
Dr. Daniel Schnitzlein Phone: -322, [email protected]
International Data FormatsDr. Markus M. Grabka Phone -339, [email protected]
Meta DataMarcel Hebing Phone: -242, [email protected]
Ingo Sieber Phone: -260, [email protected]
Regional and GeodataDr. Jan Goebel Phone: -377, [email protected]
Data Distribution, SOEPhotlineMichaela Engelmann Phone : -292, [email protected]
Theresa Kilger Phone: -292, [email protected]
aPPLIeD PaNeL aNaLYses
Alexandra Avdeenko (DIW Berlin GC) Phone: -587, [email protected]
Elisabeth Bügelmayer (DIW Berlin GC) Phone: -344, [email protected]
Frauke Peter (DIW Berlin GC) Phone: -468, [email protected]
Dr. Anika Rasner Phone: -235, [email protected]
Mathis Schröder, Ph. D. Phone: -222, [email protected]
Rainer Siegers Phone: -239, [email protected]
Dr. Ingrid Tucci Phone: -465, [email protected]
Michael Weinhardt (DIW Berlin GC) Phone: -341, [email protected]
Juliana Werneburg (DIW Berlin GC) Phone: -217, [email protected]
Interdisciplinary Research
Area Gender Studies
PD Dr. Elke Holst (Research Director) (Labor and Gender Economics) Phone: -281, [email protected]
eDUcatIoN aND traINING
SOEP Graduate Students*Frederike Esche (Sociology) (BGSS) Phone: -461, [email protected]
Anita Kottwitz (Sociology) (LIFE) Phone: -319, [email protected]
Jan Marcus (Economics) (DIW Berlin GC) Phone: -308, [email protected]
Niels Michalski (Sociology) (BGSS) Phone: -461, [email protected]
Hannes Neiss (Sociology) (BGSS) Phone: -461, [email protected]
Julia Schimeta (Gender Studies) (BGSS) Phone: -301, [email protected]
Bettina Sonnenberg (Sociology) (LIFE) Phone:-461, [email protected]
Doreen Triebe (Economics and Gender Studies) (DIW Berlin GC) phone: -272, [email protected]
ApprenticesFlorian Griese Phone: -345 [email protected]
Janine Napieraj Phone: -345 [email protected]
* BGSS: Berlin Graduate School of Social Sciences at Humboldt-Universität zu Berlin.DIW Berlin GC: DIW Berlin Graduate Center of Economic and Social Research. LIFE: International Max Planck Research School “The Life Course: Evolutionary and Autogenetic Dynamics (LIFE).”
soeP teaM

SOEP Wave Report 201116
17SOEP Wave Report 2011
Part II: A Selection of 2011 Publications by the SOEP team
Child Care Choices in Western Germany Also Correlated with Mother’s Personality by Liv Bjerre, Frauke Peter, and C. Katharina Spieß
Social and Economic Characteristics of Financial and Blood Donors in Germany by Eckhard Priller and Jürgen Schupp
Alliance ‘90/The Greens at the Crossroads: On Their Way to Becoming a Mainstream Party? by Martin Kroh and Jürgen Schupp
Success Despite Starting Out at a Disadvantage: What Helps Second-Generation Migrants in France and Germany? by Ingrid Tucci, Ariane Jossin, Carsten Keller, and Olaf Groh-Samberg
Extent and Effects of Employees in Germany Forgoing Vacation Time by Daniel D. Schnitzlein

SOEP Wave Report 201118
Part II: a seLectIoN of 2011 PUBLIcatIoNs BY the soeP teaM
19SOEP Wave Report 2011
Child Care Choices in Western Germany Also Correlated with Mother’s Personalityby Liv Bjerre, frauke Peter, and c. Katharina spieß
The expansion of formal child care, particularly for children under the age of three, has resulted in more and more children from this age group attending day care facilities. This formal child care set-ting is frequently combined with care provided by grandparents or other individuals. The combination and number of child care set-tings made use of is influenced by a variety of socio-economic factors and the range of options available. Maternal personality can also explain differences in child care choices, if only to a relatively limited extent and predominantly in families residing in Western Germany. Analyses based on the German Socio-Economic Panel Study (SOEP) show that mothers in Western Germany who are very open to new experiences are more likely to combine the use of formal with infor-mal child care. Mothers, who classify themselves as conscientious, in line with personality research, are less likely to use this setting as the sole additional type of child care alongside parental care. The ana-lyses emphasize just how different parental preferences are. A policy that is focused on freedom of choice and on creating the conditions for this by expanding the child care infrastructure should take these differences into account.
In recent years, the use of child day care facilities in Germany has dramatically increased, particularly for younger children. In 2010, 15 percent of all children un-der the age of three in Western Germany attended a day care facility. For children in their third year, the percen-tage was 35.1 Since 1996, older children who do not yet go to school have been legally entitled to at least a half-day kindergarten place. However, not all three and four-year-old children attend a day care facility. Only in the last year before school enrolment almost all children at-tend such a facility.
Reasons for using a day care facility are closely connec-ted to parental employment behavior, particularly that of mothers. This is supported by various empirical stu-dies.2 As the child gets older, families with only one em-ployed parent also use day care. Here, educational con-siderations are at the fore: children attend a child day care facility for social or other reasons which may bene-fit the development of the child.3
Attendance at a day care facility is not, however, the only child care option available to parents. Alongside other formal types of child care, such as family day care, pa-rents also make use of informal child care. Informal care can be provided by relatives, predominantly grand-parents, or by other paid or unpaid caregivers (such as a privately paid nanny, friends or neighbors). The role of grandparents is of crucial importance here: in 2008, 55 percent of all two to three-year-olds and 48 percent of all five to six-year-olds in Western Germany were looked after by their grandparents for at least one hour
1 See Federal Statistical Office (Statistisches Bundesamt): Statistiken der Kinder- und Jugendhilfe. Kinder und tätige Personen in Tageseinrichtungen und Kindertagespflege 2006-2010; Berechnungen der Dortmunder Arbeitsstelle Kinder- und Jugendhilfestatistik.
2 For a summary, see: Spieß, C. K., “Vereinbarkeit von Familie und Beruf—wie wirksam sind deutsche “Care Policies”?,” Perspektiven der Wirtschaftspolitik. Special Issue 2011, (12): 4-27.
3 These considerations are, of course, also significant in cases where both parents are employed.
SOEP Wave Report 201120
per week. In Eastern Germany, these figures were 60 and 62 percent, respectively. 1
employed and Not employed Mothers Use Different child care arrangements
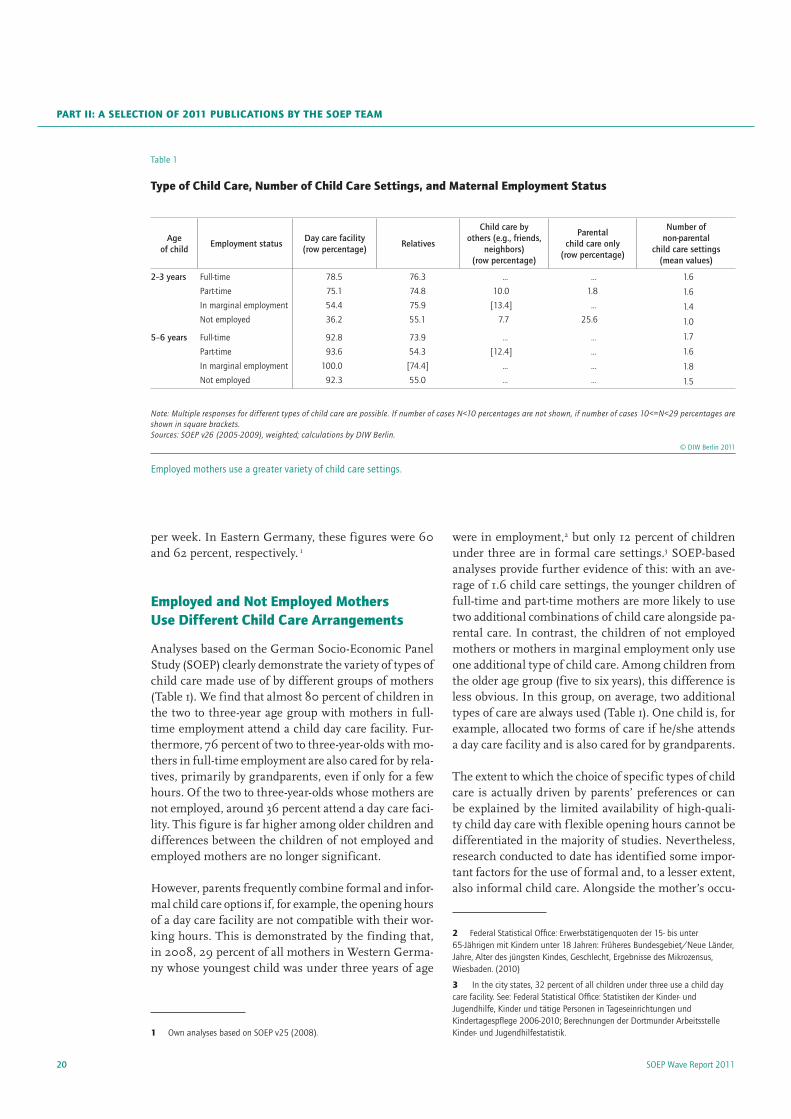
Analyses based on the German Socio-Economic Panel Study (SOEP) clearly demonstrate the variety of types of child care made use of by different groups of mothers (Table 1). We find that almost 80 percent of children in the two to three-year age group with mothers in full-time employment attend a child day care facility. Fur-thermore, 76 percent of two to three-year-olds with mo-thers in full-time employment are also cared for by rela-tives, primarily by grandparents, even if only for a few hours. Of the two to three-year-olds whose mothers are not employed, around 36 percent attend a day care faci-lity. This figure is far higher among older children and differences between the children of not employed and employed mothers are no longer significant.
However, parents frequently combine formal and infor-mal child care options if, for example, the opening hours of a day care facility are not compatible with their wor-king hours. This is demonstrated by the finding that, in 2008, 29 percent of all mothers in Western Germa-ny whose youngest child was under three years of age
1 Own analyses based on SOEP v25 (2008).
Table 1
type of child care, Number of child care settings, and Maternal employment status
Age of child
Employment statusDay care facility (row percentage)
Relatives
Child care by others (e.g., friends,
neighbors) (row percentage)
Parental child care only
(row percentage)
Number of non-parental
child care settings (mean values)
2–3 years Full-time 78.5 76.3 ... ... 1.6
1.6
1.4
1.0
1.7
1.6
1.8
1.5
Part-time 75.1 74.8 10.0 1.8
In marginal employment 54.4 75.9 [13.4] ...
Not employed 36.2 55.1 7.7 25.6
5–6 years Full-time 92.8 73.9 ... ...
Part-time 93.6 54.3 [12.4] ...
In marginal employment 100.0 [74.4] ... ...
Not employed 92.3 55.0 ... ...
Note: Multiple responses for different types of child care are possible. If number of cases N<10 percentages are not shown, if number of cases 10<=N<29 percentages are shown in square brackets.Sources: SOEP v26 (2005-2009), weighted; calculations by DIW Berlin.
© DIW Berlin 2011
Employed mothers use a greater variety of child care settings.
were in employment,2 but only 12 percent of children under three are in formal care settings.3 SOEP-based analyses provide further evidence of this: with an ave-rage of 1.6 child care settings, the younger children of full-time and part-time mothers are more likely to use two additional combinations of child care alongside pa-rental care. In contrast, the children of not employed mothers or mothers in marginal employment only use one additional type of child care. Among children from the older age group (five to six years), this difference is less obvious. In this group, on average, two additional types of care are always used (Table 1). One child is, for example, allocated two forms of care if he/she attends a day care facility and is also cared for by grandparents.
The extent to which the choice of specific types of child care is actually driven by parents’ preferences or can be explained by the limited availability of high-quali-ty child day care with f lexible opening hours cannot be differentiated in the majority of studies. Nevertheless, research conducted to date has identified some impor-tant factors for the use of formal and, to a lesser extent, also informal child care. Alongside the mother’s occu-
2 Federal Statistical Office: Erwerbstätigenquoten der 15- bis unter 65-Jährigen mit Kindern unter 18 Jahren: Früheres Bundesgebiet/Neue Länder, Jahre, Alter des jüngsten Kindes, Geschlecht, Ergebnisse des Mikrozensus, Wiesbaden. (2010)
3 In the city states, 32 percent of all children under three use a child day care facility. See: Federal Statistical Office: Statistiken der Kinder- und Jugendhilfe, Kinder und tätige Personen in Tageseinrichtungen und Kindertagespflege 2006-2010; Berechnungen der Dortmunder Arbeitsstelle Kinder- und Jugendhilfestatistik.
Part II: a seLectIoN of 2011 PUBLIcatIoNs BY the soeP teaM

21SOEP Wave Report 2011
chILD care choIces IN WesterN GerMaNY aLso correLateD WIth Mother’s PersoNaLItY
zed, for example, to what extent the mother’s persona-lity, alongside other psychological factors, may explain the combinations of child care settings used. This US study found a significant positive correlation between mothers’ extraversion and agreeableness and the selec-tion of certain types of child care. Here, the connection with extraversion was the strongest: the more a mother was classified as extroverted, the greater the probabili-ty that her child would attend non-parental care for at least ten hours per week.
Our analyses are based on a German representative stu-dy of private households and persons, the German So-cio-Economic Panel Study (SOEP). We analyze the SOEP waves 2005 to 2009. In 2005, the SOEP survey, conduc-ted by the DIW Berlin in cooperation with the fieldwork organization TNS Infratest Sozialforschung, collected information on personality for the first time.5 These were collected according to the so-called “Big Five” concept. Thereafter, the following five personality dimensions can be measured: extraversion, agreeableness, consci-entiousness, neuroticism and openness (see box). Using
5 On this, see: Dehne, M. and J. Schupp, “Persönlichkeitsmerkmale im Sozio-oekonomischen Panel (SOEP): Konzept, Umsetzung und empirische Eigenschaften. DIW Research Notes no. 26, Berlin (2007). http://www.diw.de/documents/publikationen/73/diw_01.c.76533.de/rn26.pdf
pation and her volume of work, household income, pa-rental education, and migration background are all im-portant factors.1 These socio-economic variables go a long way towards explaining the heterogeneity among types of child care used, but do not account for eve-rything. There must, therefore, be other factors, that have not yet been captured in these models. Here, at-titudes towards education or parental educational aspi-rations might be important. International research in this field indicates, however, that psychological factors are significant as well.
Personality traits are correlated with type and Number of child care types
Research on education and family economics in Ger-many to date has rarely questioned the extent to which psychological factors, which could be perceived as ele-ments of parental preference structure, are correlated with the choice of child care types used. This is even more striking since research in the field of early child-hood conducted in the US, which has gained in promi-nence due to the work of the Nobel laureate in Econo-mics, James Heckman, has provided substantial evi-dence regarding the significance of parental personality in the development of children and their skills.2
Against this research backdrop, we consider the extent to which the choice of specific types of day care and also the number of care settings selected are inf luenced by the mother’s personality. We restrict our analyses to mater-nal personality traits as mothers continue to be the main caregiver. We also draw on some international studies from psychology which have already analyzed the corre-lation between psychological variables and the choice of child care.3 These studies capture both mothers’ perso-nal attitudes and assessments and their psychological well-being. An early study by Applebaum (1997)4 analy-
1 For a summary, see, for example: Spieß, C. K. “Early Childhood Education and Care in Germany: The Status Quo and Reform Proposals,” Zeitschrift für Betriebswirtschaftslehre 67 (2008): 1-20.
2 See Heckman J., “The economics, technology, and neuroscience of human capability formation,” Proceedings of the National Academy of Sciences of the United States of America,104(33); 2007, and also Heckman “Integrating Personality Psychology into Economics,” IZA Discussion Paper 5950, (Bonn: 2011).
3 See, for example, Barnes, J., “Infant care in England: Mothers’ aspirations, experiences, satisfaction, and caregiver relationships.” Early Child Development and Care 176 (5) (2006): 553-573; Network, N. E. C. C. R., “Child-care effect sizes for the NICHD Study of Early Child Care and Youth Development” American Psychology 61(2) (2006): 99-116; or Sylva, K., et al.. “Family and child factors related to the use of non-maternal infant care: An English study.” Early Childhood Research Quarterly 22(1) (2007): 118-136
4 See: Appelbaum, M. et al. “Familial factors associated with the characteristics of nonmaternal care for infants,” Journal of Marriage and the Family 59 (2) (1997): 389-408.
Box
Personality traits—the Big-five Extraversion refers to personality dispositions such as sociableness, activeness, drive, assertiveness, and enthusiasm.
Agreeableness includes the different facets of flexibility, openness, humi-lity, cooperation, trust, and altruism.
Conscientiousness means that an individual is achievement-oriented, level-headed, thorough, well-organized, responsible, and self-disciplined.
Neuroticism refers to the different facets of anxiety, sadness, insecurity, irritability, impulsiveness, and vulnerability.
The openness dimension encompasses imagination, fantasy, an open-ness to new ideas, sensitivity to beauty, feelings, and openness to change as well as a flexible system of norms and values.
Source: Lang, F. R. and O. Lüdtke: “Der Big Five-Ansatz der Persön-lichkeitsforschung: Instrumente und Vorgehen,” in Persönlichkeit: eine vergessene Größe der empirischen Sozialforschung, ed. S. Schumann (Wiesbaden: VS Verlag, 2005), 32.

SOEP Wave Report 201122
these dimensions, we are able to describe the persona-lity of mothers of young children.
We distinguish between different age groups of child-ren as the factors correlated with the use of specific forms of child care are different for younger than for older children. This enables us to analyze, on the one hand, an age group (two to three years) where 52 per-cent attend formal care and, on the other hand, a group (five to six years) where the majority (94 percent) attend formal care. Information on combinations of child care settings is drawn from the SOEP mother-child questi-ons. Since 2003, these specific questionnaires have cap-tured child care in greater detail than in the household questionnaire.1
1 On this, see: Schupp, J., C. K. Spiess, and G. G. Wagner, “Die verhaltenswis-senschaftliche Weiterentwicklung des Erhebungsprogramms des SOEP,” Vierteljahrshefte zur Wirtschaftsforschung 77, 3: (2008): 63-76.
extroverted Mothers More Likely to Use child Day care facilities
An initial bivariate analysis demonstrates the correlation between the five personality dimensions of the mother and the number of specific child care types (Table 2).
We then analyze all types of child care individually, irre-spective of whether or not they are combined.2 We find evidence that extraverted mothers (characterized by grea-ter enthusiasm and drive) of children in the two to three-year age group are more likely to use a child day care fa-cility than those who are less extroverted. The use of fa-mily day care, in contrast, is correlated with the mother’s neuroticism. Presumably, insecure and nervous women are more likely to choose family day care because this type of child care is closer to family care. Mothers cha-racterized by greater openness are inherently more like-ly to use relatives for child care than the corresponding
2 This means that the types of care are not mutually exclusive.
Table 2
correlation Between type of child care, Number of child care settings and Maternal PersonalityMarginal effects
Age of child
Maternal personality
Logit model OLS model
Daycare facility Family Day Care RelativesCare by others (e.g., friends, neighbors)
Parental care onlyNumber of child
care settings
2–3 years Openness 0.018 0.004 0.022** 0.013 –0.016 0.053**
Extraversion 0.035** 0.000 0.006 0.019 –0.017 0.059**
Conscientiousness 0.006 –0.009 –0.002 0.021 –0.005 0.026
Neuroticism 0.015 0.016** –0.014 0.022 –0.004 0.022
Agreeableness –0.022 –0.003 –0.005 0.002 0.010 –0.024
N 838 838 838 838 838 838pseudo R2/adj.R2 0.006 0.022 0.012 0.005 0.008 0.015
5–6 years1 Openness –0.021** –0.000 0.037** –0.035 ... –0.023
Extraversion 0.004 –0.001 0.029* 0.025 ... 0.059*
Conscientiousness –0.016* –0.001 –0.029* 0.062** ... 0.011
Neuroticism –0.010 0.001 –0.039*** –0.005 ... –0.065*
Agreeableness –0.006 0.000 –0.012 –0.027 ... –0.046
N 334 334 334 334 ... 334
pseudo R2/adj.R2 0.087 0.253 0.072 0.023 ... 0.026
1 No results in Column 5, as very few children in this age group are cared for exclusively by their parents. The different forms of child care are not mutually exclusive.
* p < 0,10, ** p < 0,05, *** p < 0,01Sources: SOEP v26 (2005-2009), weighted; calculations by DIW Berlin.
© DIW Berlin 2011
Mothers who are open and more extroverted use a wider variety of child care settings.
Part II: a seLectIoN of 2011 PUBLIcatIoNs BY the soeP teaM

23SOEP Wave Report 2011
chILD care choIces IN WesterN GerMaNY aLso correLateD WIth Mother’s PersoNaLItY
reference group of mothers, either in combination with a child day care facility or on its own.
The situation regarding mothers of five to six-year-olds looks somewhat different: the initial similarity is that the children of mothers who are characterized as being more open are, on average, more likely to make use of child care provided by relatives but less likely to use child day care facilities. The more neurotic the mother, i.e., the more nervous and insecure she is, the less likely she will use relatives as additional carers for her child—on the whole, almost all children in this age group attend a child day care facility. The more conscientious the mo-ther, the more likely it is that the pre-school child will be cared for by friends or neighbors.
The number of child care settings used can also be cor-related with the mother’s personality traits: the more open and extroverted the mother of a two to three-year-old, the greater the number of types of child care she is likely to use. With regard to extraversion—this also ap-plies to children in the five to six-year age group. The more neurotic the mother, the fewer types of child care she is likely to use.
a Mother’s conscientiousness correlates with Use of Day care facilities, But only in Western Germany
In a multivariate analysis we consider other factors alongside personality, such as the mother’s occupati-on, child’s age, etc., which are associated with the use of different types of child care. We focus here on the use of a child day care facility or family day care as formal care. In our first model, we do not distinguish between whether or not formal care is combined with informal forms of care. In our second model, however, we draw a distinction between whether the formal child care is the only type, alongside parental care, or whether it is combined with informal child care.
First, the analyses confirm the findings of previous stu-dies: use of a child day care facility and family day care depends particularly on the child’s age, the mother’s oc-cupation, her education, household income, the num-ber of children, family migration background, and re-gion. This particularly applies to children in the two to three-year age group, whereas in the case of pre-school children, the number of children and household income are significant.
With regards to the personality traits that are of interest to us here, it appears that two to three-year-old children of mothers who are characterized by a higher level of
conscientiousness, i.e., those who consider themselves to be dutiful and orderly, are less likely to use formal care exclusively, without any additional types of child care. The correlation is insignificant if formal care is combined with informal care. The correlation between the openness of mothers and the combined usage of for-mal and informal child care has a weak positive signi-ficance (Table 3).
A comparison of East and West provides no evidence, in the Eastern German sample, of significant correlations between the type of child care and mother’s personali-ty. For Western Germany, the comparison demonstra-tes the relationship between the mother’s openness and the use of child care combinations even more clearly. It is shown that the mother’s agreeableness is also signifi-cant. Mothers who can be considered agreeable are less likely to combine different types of child care.
When we look at pre-school children, a different picture emerges: here, mothers who are more open to experi-ence and more conscientious are less likely to use a child day care facility if other combinations are not further differentiated. If we do differentiate, only the correlati-on with conscientiousness remains statistically signifi-cant. Other associations are weakly significant such as the positive correlation between extraversion and the use of combinations of other child care forms. This re-lationship is weakly negative if we examine the use of formal child care exclusively (Table 3). A comparison of East and West demonstrates here, too, that the measu-red effects apply, almost exclusively, to mothers from Western Germany (no table).
Mother’s openness correlates with Number of Different types of child care
In further multivariate analyses, we associate the num-ber of different forms of child care with maternal per-sonality traits and other socio-economic variables (Ta-ble 4). In this case, we restrict our analysis to children who are not only cared for by their parents. The bivaria-te findings (Table 1) confirm that employed mothers in particular combine different forms of child care. Fur-thermore, this also depends on the child’s age, the pre-sence of a partner in the household, household income, migration background, and the region in which the fa-mily resides.1 This applies in particular to two to three-year-olds, whereas the correlation for five to six-year-
1 This “regional indicator” also reflects the significant differences between Eastern and Western Germany in terms of availability of child day care facilities for children under the age of three.

SOEP Wave Report 201124
olds is only statistically significant with regard to the mother’s full-time employment and household income.
When we consider the mother’s personality, it appears that mothers who are more open are more likely to use more types of child care for their two to three-year-old children. The correlation with the extraversion perso-nality trait is only weakly significant. The latter is also only weakly significant for pre-school children which means that the more a mother describes herself as as-sertive and enthusiastic, the more likely she is to use a variety of forms of care for her children.
conclusion
The use of formal child care, its combination with other forms of informal child care, and the number of child care settings used are correlated with the mothers’ per-sonality, alongside regional and socio-economic factors. However, statistically speaking, personality traits cannot explain much of the variance in child care settings and can only be proven, almost exclusively, for mothers who reside in Western Germany: the more conscientious the-se mothers consider themselves to be, assuming other factors remain constant, the less likely they are to use a child day care facility without additional forms of child care such as care provided by grandparents. This fin-
ding may conceal personal attitudes and assessments of formal care that cannot be directly measured. It is notable that the correlation between personality and types of day care is almost completely insignificant for Eastern German mothers—here, particularly with re-gard to younger children, employment-related factors are decisive. Furthermore, it appears that mothers who are more open are more likely to use a wider variety of different types of child care.
A family and education policy should take these correla-tions into account, alongside other objective factors, and should ensure that parents are free to make the decisi-ons that suit their personal preferences. Parents need to be given a range of options in order to be able to do so. A further expansion of day care facilities on offer would provide parents with a wider choice.
From a research perspective, it would be interesting to analyze, using a cross-country comparison, whether the differences between Eastern and Western Germany can also be applied to a comparison between different countries. A comparison could be drawn between coun-tries, where for many years, similarly to Eastern Germa-ny, the majority of children have used formal day care and these forms of child care are widely accepted (e.g, France and the Scandinavian countries) with countries which, similar to Western Germany, have only experi-
Table 3
Models Describing the Probability of Using formal child care Marginal effects
2–3 years 5–6 years
Model I, Logit Model II, Multinominal logit Model Il, Logit Model II, Multinominal logit
Formal child careOnly formal child
care
Formal child care and other combinations of
child care Formal child care
Only formal child care
Formal child care and other combinations of
child care
Openness 0.023 –0.013 0.036* –0.013** 0.037 –0.050*
Extraversion 0.033 0.007 0.026 0.002 –0.046* 0.048*
Conscientiousness –0.008 –0.033** 0.027 –0.013** –0.052** 0.039
Neuroticism 0.031 –0.005 0.036* –0.003 0.015 –0.019
Agreeableness –0.015 0.004 –0.018 –0.004 0.014 –0.018
N 786 786 317 317Pseudo R2 0.230 0.168 0.251 0.123
The following socio-economic factors were included in all models besides the variables measuring maternal personality: maternal employment status, partner in household, age of mother, maternal education, age of child (in months), gender of child, migration background of child, number of children in household <16 years, logarithmized household income, and region (Eastern or Western Germany).
* p < 0,10, ** p < 0,05, *** p < 0,01Sources: SOEP v26 (2005-2009); calculations by DIW Berlin.
© DIW Berlin 2011
Conscientious mothers are less likely to use formal child care facilities exclusively.
Part II: a seLectIoN of 2011 PUBLIcatIoNs BY the soeP teaM

25SOEP Wave Report 2011
chILD care choIces IN WesterN GerMaNY aLso correLateD WIth Mother’s PersoNaLItY
enced an increase in the use of such child care in recent years, particularly for younger children (e.g., Austria). It is likely that in countries with a widely established child care system fewer correlations between persona-lity traits and the types of child care used will be found than in other countries.
Liv Bjerre is a doctoral candidate at WZB | [email protected].
Frauke Peter is Research Associate and doctoral candidate at the Socio-Eco-nomic Panel Study (SOEP) at DIW Berlin | [email protected].
Prof. Dr. C. Katharina Spieß is acting head of the Educational Policy Depart-ment at DIW Berlin and Professor at FU Berlin | [email protected].
JEL: J13, J22
Keywords: Child care, personality factors, maternal employment
Article first published as “Wahl der Kinderbetreuung hängt in Westdeutschland auch mit der Persönlichkeit der Mütter zusammen”, in: DIW Wochenbericht Nr. 41/2011.
Table 4
Model Describing the Number of child care OLS estimates, regression coefficients
2–3 years 5–6 years
Number of child care settings
Number of child care settings
Openness 0.049** –0.044
Extraversion 0.045* 0.058*
Conscientiousness 0.021 0.001
Neuroticism 0.032 –0.043
Agreeableness –0.012 –0.036
N 786 317Adj. R2 0.152 0.078
The following socio-economic factors were included in all models besides the va-riables measuring maternal personality: maternal employment status, partner in household, age of mother, maternal education, age of child (in months), gender of child, migration background of child, number of children in household <16 ye-ars, logarithmized household income, and region (Eastern or Western Germany).
* p < 0,10, ** p < 0,05, *** p < 0,01Sources: SOEP v26 (2005-2009); calculations by DIW Berlin.
© DIW Berlin 2011
Correlation between openness and number of child care settings is significant.

SOEP Wave Report 201126
Part II: a seLectIoN of 2011 PUBLIcatIoNs BY the soeP teaM

27SOEP Wave Report 2011
Social and Economic Characteristics of Financial and Blood Donors in Germanyby eckhard Priller and Jürgen schupp
Donating as a form of Prosocial action
A donation is a voluntary and unremunerated transfer of money, services or other things for charitable purposes. Since the donor does not receive anything equivalent in return for this action, donating is normally referred to in the social sciences as a specific form of prosocial action as opposed to purely selfish actions.1 In economic theo-ry, the prevalent belief for many years was that human beings are only interested in their own well-being and always behave selfishly. In this simple economic text-book model, prosocial behavior seems to be irrational.2
Several surveys, studies and experiments3 have now pro-ven, however, that the majority of the population is pre-pared to take colleagues and other people into considera-tion, to offer them support and to help them. A growing number of studies also show that prosocial behavior has greater benefits not only for the individual4 but also for general social development.5
1 For an overview, see Jörg Rössel, “Spenden und prosoziales Handel,” Adloff, Frank et al., eds., Prosoziales Verhalten—Spenden in interdisziplinärer Perspektive. (Stuttgart: Lucius & Lucius, 2010), 213-224.
2 However, economists have also been dealing increasingly systematically with the “economy of giving” and the “market of donations” for some time now. See James Andreoni, “Philanthropy,” Serge-Christophe Kolm and Jean Mercier Ythier, eds., Handbook of the Economics of Giving, Altruism and Reciprocity, Vol. 2, (Amsterdam: Elsevier, 2006), 1202-1269 and John A. List,: “The Market for Charitable Giving,” Journal of Economic Perspectives, 25(2), (2011): 157-180.
3 See Ernst Fehr and Urs Fischbacher “The Nature of Human Altruism,” Nature, Vol. 425, (2003): 785-791.
4 Psychologists in particular focus on the question whether helping and donating ultimately frequently results from selfish motives; for an overview, see Kai J. Jonas, “Psychologische Determinanten des Spendenverhaltens,” Adloff, Frank et al., eds., Prosoziales Verhalten—Spenden in interdisziplinärer Perspektive (Stuttgart: Lucius & Lucius, 2010), 193-212.
5 See Martin A. Nowak, “Five Rules for the Evolution of Cooperation,” Science, Vol. 314, (2006): 1560-1563.
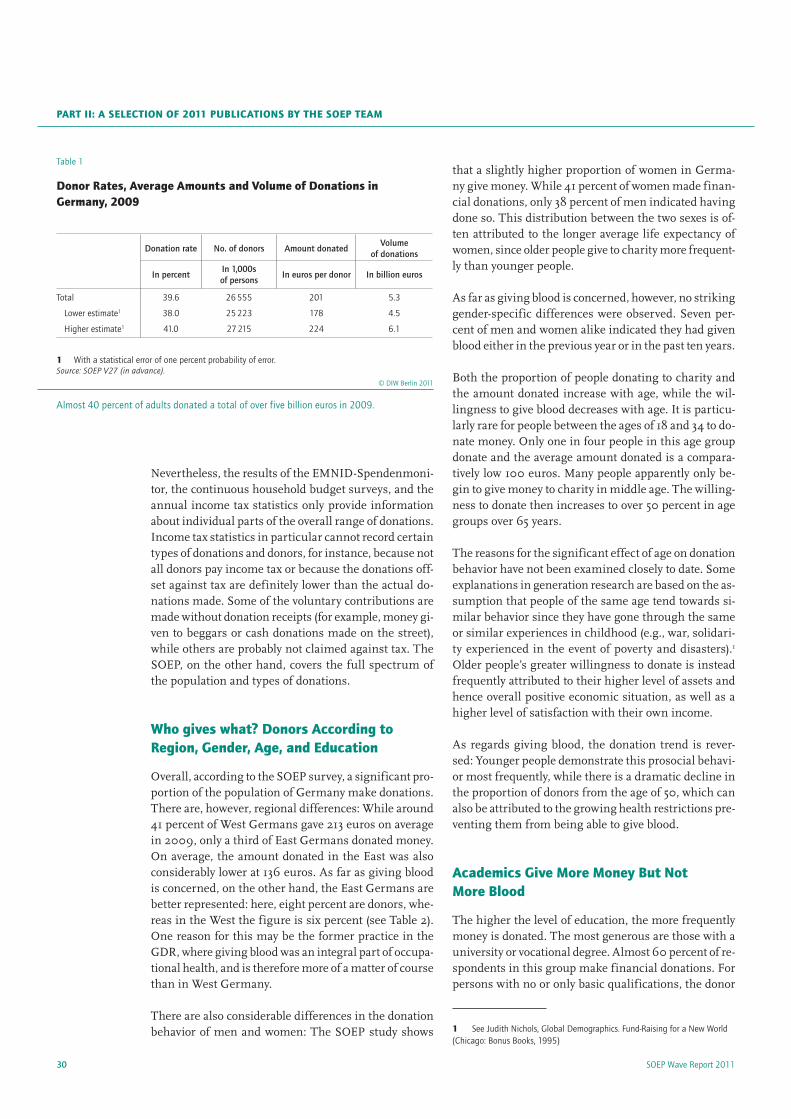
Surveys of the German Socio-Economic Panel Study (SOEP) have shown that Germans donated around 5.3 billion euros in 2009—right in the middle of the financial and economic crisis. The type and amount of donations made is well documented in Germany. However, until recently, there was very little information available on the identity of Germans who share their income with people in need. A new survey in the long-term SOEP study has now made it possible to collect this information systematically for the first time and to investigate questions such as: Which social groups do people who make donations belong to? Does a high income increase the willingness to donate money? Do education and age play a role? Do people who are happy donate more? Do the same motives ap-ply for giving money as, for example, giving blood? In order to find answers to these questions, existing data sources on the Germans’ willingness to give were analyzed, verified and matched with SOEP data for the first time. The results are conclusive: Women donate more than men, older people more than younger people. This only applies to donating money, however. As regards giving blood, social and financial differences are of much less importance. Here almost all social groups and classes donate as much—albeit much less fre-quently. While almost 40 percent of all Germans donated money in 2009, only seven percent gave blood.

SOEP Wave Report 201128
nated to recognized organizations bearing the institute’s label, it is virtually impossible to draw any conclusions about the donors and their social structure on this basis.
Donation survey in the soeP
In the long-term SOEP study, with data collected by DIW Berlin in cooperation with the social research institute TNS Infratest Sozialforschung, 40 percent of German citizens stated that they had donated money in 2009. This is almost identical to the donation monitor Em-nid-Spendenmonitor5 recording the average of the past 15 years6 (see Fig. 1). Exceptions in the Emnid-Moni-tor are the years 2002/2003 and 2005/2006, when the willingness among the population to donate was high-er because of the Elbe f looding and the tsunami catas-trophe, respectively.
Taking the per capita donations of 200 euros per year observed in the SOEP as a basis for a realistic average value for an extrapolation, the total population gave a total volume of donations of around 5.3 billion euros7 for 2009 (see Table 1). Hence, the SOEP results show that the amount donated and national volumes of do-nations are considerably higher than the figures given by the Emnid-Spendenmonitor. The latter indicates an average value of 115 euros for 2009, and a total volume of donations for Germany of 2.6 billion euros.
On the basis of the continuous household budget sur-veys of the official statistics, however, a national total volume of donations of between 3.3 and 4.5 billion eu-ros8 was established for the years from 1999 to 2007.
The data from the income tax statistics summarize all assessed donations and tax deductible membership fees in Germany. For the period 2001–2007, an average va-lue of 155 euros per year and tax-paying donor was recor-ded.9 The volume of donations and contributions offset against tax in the same period amounted to 3.4 to 4.5 billion euros. Therefore, the estimate of the overall vo-lume of donations on the basis of the SOEP is compara-tively close to the figure from the tax statistics.
5 See http://www.tns-infratest.com/branchen_und_maerkte/socialmarketing.asp for information on the donation monitor.
6 See Priller and Schupp, “Empirische Sondierung.”
7 The lower estimate is 4.5 billion euros due to statistical random errors in the SOEP sample and the upper estimated value 6.1 billion euros.
8 For the continuous household budget surveys, see Federal Statistical Office 2011: Series 15, (Issue) No. 1.
9 For details on the different data sources, see Jana Sommerfeld und Rolf Sommerfeld “Spendenanalysen,” German Central Institute for Social Issues, ed., Spendenbericht Deutschland 2010. Daten und Analysen zum Spendenverhal-ten in Deutschland. (Berlin: DZI, 2010), 23–92.
Donations in Germany—Data availability
Various surveys on the subject of donating have been carried out in Germany. They vary with respect to avai-lability, significance and reliability, as well as quality of data.1 Due to the different types of surveys and classifi-cations, however, many data sets from survey research are only comparable to a very limited extent.2
What most surveys have in common is that they concen-trate on recording financial donations for charitable or-ganizations, taking into consideration individual dona-tion activities and amount donated but very few social characteristics of the donor. Sometimes, in addition to financial donations, material and other types of dona-tions are also surveyed.3 Although the databases of the German Central Institute for Social Issues (DZI)4 allow us to carry out a variety of analyses on the amounts do-
1 See Eckhard Priller and Jana Sommerfeld “Spenden und ihre Erfassung in Deutschland,” Eckhard Priller and Jana Sommerfeld, eds., Spenden in Deutschland. Analysen, Konzepte, Perspektiven. (Berlin: LIT Verlag, 2010), 5-74.
2 For more details, see Eckhard Priller and Jürgen Schupp: “Empirische Sondierung,” Frank Adloff et al., eds., Prosoziales Verhalten—Spenden in interdisziplinärer Perspektive. (Stuttgart: Lucius & Lucius, 2010), 41-63.
3 Such as the subject of organ donation, which it was not possible to consider in the main 2010 SOEP survey due to time constraints; see also Mohn, Carel und Jürgen Schupp “Organspenden—ökonomisch betrachtet,” Der Tagesspiegel, August 29, 2010.
4 This organization also publishes information on around 250 organizations that bear the DZI label.
Figure 1
change in the Donor rate and the amount Donated in Germany
0
20
40
60
80
100
0
24
48
72
96
120
1995 1997 1999 2001 2003 2005 2007 2009
Average amount donated (right-hand scale)
Donor rate
Percentage Euros
Database: Emnid-Spendenmonitor 1995 to 2010.© DIW Berlin 2011
Willingness to donate is consistently high in Germany.
Part II: a seLectIoN of 2011 PUBLIcatIoNs BY the soeP teaM

29SOEP Wave Report 2011
socIaL aND ecoNoMIc characterIstIcs of fINaNcIaL aND BLooD DoNors IN GerMaNY
Within the framework of the long-term German Socio-Economic Panel Study (SOEP), data on the social and economic situation of private households in Germany have been collected since 1984 for West Germany and since 1990 for the former East Germany. The survey is conducted annually by the survey institute TNS Infratest Sozialforschung in Munich on behalf of DIW Berlin.1
In the survey year 2010, following extensive prelimina-ry studies,2 a focus on consumer and saving behavior was introduced. This module also includes questions about donating money and giving blood in the SOEP for the first time.3
This allows us, inter alia, to make differentiated observations according to earnings and demographic factors, which has only been possible to a certain extent with other studies on the subject of donating.4 Including data on blood donation behavior means the evaluation is not only restricted to financial donations. It makes it possible to investigate whether there is a general distinction between donation behavior in an area other than that of monetary donations. The contribution focuses on the indicators willingness to donate, financial amount donated per donor and their correlation to socio-structural characteristics of the donors. The analyses included data on 16,963 adults from 9,600 households, surveyed in spring 2010.5
1 The SOEP is part of the research infrastructure in Germany and is funded at national and regional level under the auspices of the Leibniz Association (WGL). See Gert G. Wagner, Joachim R. Frick, and Jürgen Schupp, “The German Socio-Economic Panel Study (SOEP) – Scope, Evolution and Enhancement,” Schmollers Jahrbuch, Vol. 127(1), (2007), 139-169.
2 See also Simon Huber, Nico A. Siegel and Andreas Stocker, SOEP Testerhebung 2009: Methodenbericht (Munich: 2010). TNS Infratest Sozialforschung. 2012. SOEP2009 – Pretestbericht zum Befragungsjahr 2009 (Welle 26) des Sozio-oekonomischen Panels - Haushaltsbilanz "Konsum", "Krebsszenarien" und sonstige Innovationsmodule. SOEP Survey Papers 74: Series B. Berlin: DIW (SOEP).
3 See questions 120 and 121 in the individual questionnaire: www.diw.de/documents/dokumentenarchiv/17/diw_01.c.369781.de/soepfrabo_personen_2010.pdf.
4 For more details, see Eckhard Priller and Jürgen Schupp, “Empirische Sondierung,” Frank Adloff et al. eds., Prosoziales Verhalten – Spenden in interdisziplinärer Perspektive (Stuttgart: 2010), 41–63.
5 For details about the field work, see Simon Huber, Agnes Jänsch, and Nico A. Siegel, SOEP 2010. Methodenbericht zum Befragungsjahr 2010 (Munich: 2011). TNS Infratest Sozialforschung. 2012. SOEP2010 – Metho-denbericht zum Befragungsjahr 2010 (Welle 27) des Sozio-oekonomischen Panels. SOEP Survey Papers 75: Series B. Berlin: DIW (SOEP).
They were asked: And now a question about your donations. We understand donations here as giving money for social, church, cultural, community, and charitable aims, without receiving any direct compen-sation in return. These donations can be large sums of money but also smaller sums, for example, the change one puts into a collection box. We also count church offerings. Did you donate money last year, in 2009 – not counting membership fees?
The possible responses are Yes or No. Those who responded Yes were asked a supplementary question: How high was the total sum of money that you donated last year?
Then, two questions about giving blood were asked: There are also donations of a non-financial nature, for example, blood donations. Have you donated blood in the last 10 years?
The possible responses are Yes or No. Those who responded Yes were asked a supplementary question: Did you donate blood at least once last year, that is, in 2009?
As regards the multivariate analyses, the simultaneous estimation of various factors impacting on donation behavior was carried out using logistic regression models. Robust standard error estimates were calcu-lated (according to Huber-White) with households as clusters. The influence of the explanatory variables is reflected in the coefficients presented as margi-nal effects.6 These can be interpreted as changes in percentage points. For example, the gender effect of –0.025 indicates that, controlling for all other influ-ences, willingness to donate among men is around two percentage points lower than for women (the relevant reference group is in brackets). However, the age effect of 0.006 is to be interpreted as meaning that willingness to donate increases by 0.6 percentage points with each additional (marginal) year.
6 For the statistical basis of marginal probability effects, see Scott J. Long and Jeremy Freese, Regression Model for Categorial Dependent Variables Using Stata (Texas: 2006).
Box
on Measuring Donations in the soeP
SOEP Wave Report 201130
Nevertheless, the results of the EMNID-Spendenmoni-tor, the continuous household budget surveys, and the annual income tax statistics only provide information about individual parts of the overall range of donations. Income tax statistics in particular cannot record certain types of donations and donors, for instance, because not all donors pay income tax or because the donations off-set against tax are definitely lower than the actual do-nations made. Some of the voluntary contributions are made without donation receipts (for example, money gi-ven to beggars or cash donations made on the street), while others are probably not claimed against tax. The SOEP, on the other hand, covers the full spectrum of the population and types of donations.
Who gives what? Donors according to region, Gender, age, and education
Overall, according to the SOEP survey, a significant pro-portion of the population of Germany make donations. There are, however, regional differences: While around 41 percent of West Germans gave 213 euros on average in 2009, only a third of East Germans donated money. On average, the amount donated in the East was also considerably lower at 136 euros. As far as giving blood is concerned, on the other hand, the East Germans are better represented: here, eight percent are donors, whe-reas in the West the figure is six percent (see Table 2). One reason for this may be the former practice in the GDR, where giving blood was an integral part of occupa-tional health, and is therefore more of a matter of course than in West Germany.
There are also considerable differences in the donation behavior of men and women: The SOEP study shows
that a slightly higher proportion of women in Germa-ny give money. While 41 percent of women made finan-cial donations, only 38 percent of men indicated having done so. This distribution between the two sexes is of-ten attributed to the longer average life expectancy of women, since older people give to charity more frequent-ly than younger people.
As far as giving blood is concerned, however, no striking gender-specific differences were observed. Seven per-cent of men and women alike indicated they had given blood either in the previous year or in the past ten years.
Both the proportion of people donating to charity and the amount donated increase with age, while the wil-lingness to give blood decreases with age. It is particu-larly rare for people between the ages of 18 and 34 to do-nate money. Only one in four people in this age group donate and the average amount donated is a compara-tively low 100 euros. Many people apparently only be-gin to give money to charity in middle age. The willing-ness to donate then increases to over 50 percent in age groups over 65 years.
The reasons for the significant effect of age on donation behavior have not been examined closely to date. Some explanations in generation research are based on the as-sumption that people of the same age tend towards si-milar behavior since they have gone through the same or similar experiences in childhood (e.g., war, solidari-ty experienced in the event of poverty and disasters).1 Older people’s greater willingness to donate is instead frequently attributed to their higher level of assets and hence overall positive economic situation, as well as a higher level of satisfaction with their own income.
As regards giving blood, the donation trend is rever-sed: Younger people demonstrate this prosocial behavi-or most frequently, while there is a dramatic decline in the proportion of donors from the age of 50, which can also be attributed to the growing health restrictions pre-venting them from being able to give blood.
academics Give More Money But Not More Blood
The higher the level of education, the more frequently money is donated. The most generous are those with a university or vocational degree. Almost 60 percent of re-spondents in this group make financial donations. For persons with no or only basic qualifications, the donor
1 See Judith Nichols, Global Demographics. Fund-Raising for a New World (Chicago: Bonus Books, 1995)
Table 1
Donor rates, average amounts and Volume of Donations in Germany, 2009
Donation rate No. of donors Amount donatedVolume
of donations
In percentIn 1,000s of persons
In euros per donor In billion euros
Total 39.6 26 555 201 5.3
Lower estimate1 38.0 25 223 178 4.5
Higher estimate1 41.0 27 215 224 6.1
1 With a statistical error of one percent probability of error.Source: SOEP V27 (in advance).
© DIW Berlin 2011
Almost 40 percent of adults donated a total of over five billion euros in 2009.
Part II: a seLectIoN of 2011 PUBLIcatIoNs BY the soeP teaM

31SOEP Wave Report 2011
socIaL aND ecoNoMIc characterIstIcs of fINaNcIaL aND BLooD DoNors IN GerMaNY
rate is much lower: At around a third, the proportion of donors is only almost half as high. As regards giving blood, however, there is no academic effect. Here, acade-mics only account for the average donor rate of 7 percent.
Unemployed People Give Blood, But Less Money
Whether or not people have a job is another factor that influences their willingness to donate. Unemployed peo-ple donate money less frequently than persons in em-ployment. There is no evidence to date that the result is affected by the amount of unemployment benefit recei-ved: Overall, only 16 percent of unemployed people do-nate money. The donor rate for this group is therefore significantly lower than for the total population, which is at around 40 percent.
Conversely, other people who are not gainfully emplo-yed, including in particular those who have reached re-tirement age, not only have the highest donor rate at 43 percent, but with average donations of 219 euros, they also donate the highest amounts.
As regards giving blood, the unemployed showed no si-gnificantly different behavior: With an average donor rate of six percent (both for 2009 and for the past ten years), they donated approximately as frequently as the total population.
a third of the Volume of Money Given to charity in 2009 is Donated by the top ten Percent of Income earners
As expected, income has a long-term impact on donati-on behavior. A higher level of prosperity should make it possible for someone to give a greater share of his or her income and assets to other people or projects, wit-hout having to go without or having financial difficul-ties. Consequently, it is easier for those with a high in-come to provide financial support to charity, and, ac-cordingly, the level of generosity increases in line with a stronger economic position.1 Furthermore, progressi-ve taxation means higher incentives for donation activi-ties for those with a higher income. All available empi-rical surveys confirm that, as expected, the proportion of donors rises with increasing income2 and the SOEP
1 See also Christopher Jencks, “Who Gives What?” Walter W. Powell, ed., The Nonprofit Sector—A Research Handbook (New Haven: Yale University Press, 1987), 321–339.
2 See, for example, Willy Schneider, Die Akquisition von Spenden als eine Herausforderung für das Marketing. (Berlin: Duncker & Humblot, 1996), 109ff.
data also support this finding. Thus, data from the SOEP confirm the statement already made elsewhere3 that lo-wer income groups donate a lower percentage of their income than those in upper income groups.
Empirical studies in the US have found that there is a U-shaped curve showing the correlation between income and amount contributed:4 With increasing income, the
3 See Helmut K. Anheier, “Ehrenamtlichkeit und Spendenverhalten in Deutschland, Frankreich und den USA,” Helmut K. Anheier et al., eds., Der Dritte Sektor in Deutschland. Organisationen zwischen Staat und Markt im gesellschaftlichen Wandel (Berlin: Edition Sigma, 1997), 197-209.
4 See Anheier “Ehrenamtlichkeit und Spendenverhalten,” 207.
Table 2
Money and Blood Donations in Germany in 2009 according to socio-economic characteristics
Donor rate Donor rate Gave blood Gave blood in the few years before 2009
In percent In euros per donor
In percent
Total 39,6 201 6,7 6,7
Western Germany 41,3 213 6,3 6,3
Eastern Germany 32,4 136 8,4 8,2
Men 38,2 245 7,0 6,8
Women 40,9 162 6,4 6,5
German nationality 40,1 202 6,9 6,7
Non-German nationality 28,1 179 2,3 6,1
Aged 18 to 34 25,0 98 11,7 10,3
Aged 35 to 49 39,0 197 7,8 8,8
Aged 50 to 64 42,4 194 6,0 4,7
Aged 65 to 79 51,5 255 1,6 3,2
Aged 80 or over 50,5 266 0,0 0,6
No school-leaving certificate 33,8 144 4,4 4,6
Other qualification 35,8 146 7,3 6,9
Abitur 42,4 161 14,7 12,0
Degree 57,6 347 6,5 8,0
In full-time employment 38,2 215 9,3 8,8
Employed part-time, low level of pay
43,3 144 8,2 7,6
Not in employment 43,1 219 3,4 4,1
Registered unemployed 16,0 85 5,5 5,6
Donated blood in 2009 46,2 134 100 –
Donated blood in the last ten years
42,5 143 – 100
Donated money in 2009 100 201 7,8 7,2
Source: SOEP V27 (in advance).© DIW Berlin 2011
Willingness of pensioners or graduates to donate money is over 50 percent. Willingness to give blood is much lower.
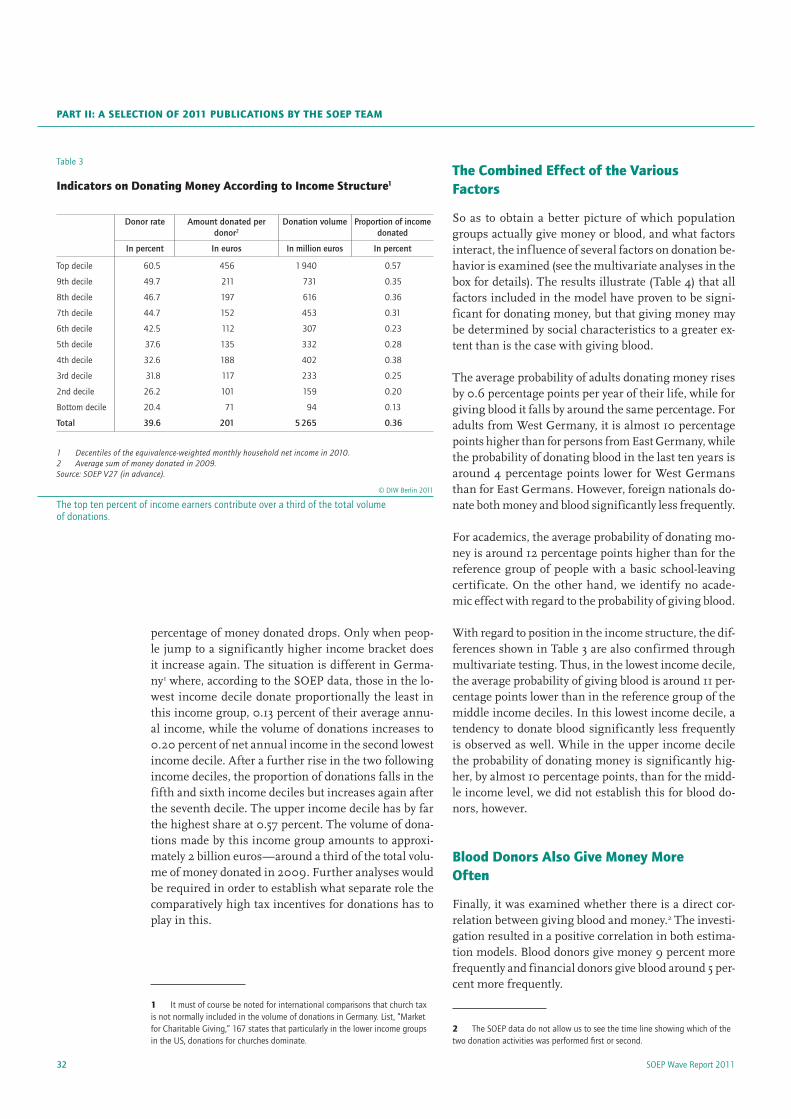
SOEP Wave Report 201132
percentage of money donated drops. Only when peop-le jump to a significantly higher income bracket does it increase again. The situation is different in Germa-ny1 where, according to the SOEP data, those in the lo-west income decile donate proportionally the least in this income group, 0.13 percent of their average annu-al income, while the volume of donations increases to 0.20 percent of net annual income in the second lowest income decile. After a further rise in the two following income deciles, the proportion of donations falls in the fifth and sixth income deciles but increases again after the seventh decile. The upper income decile has by far the highest share at 0.57 percent. The volume of dona-tions made by this income group amounts to approxi-mately 2 billion euros—around a third of the total volu-me of money donated in 2009. Further analyses would be required in order to establish what separate role the comparatively high tax incentives for donations has to play in this.
1 It must of course be noted for international comparisons that church tax is not normally included in the volume of donations in Germany. List, “Market for Charitable Giving,” 167 states that particularly in the lower income groups in the US, donations for churches dominate.
Table 3
Indicators on Donating Money according to Income structure1
Donor rate Amount donated per donor2
Donation volume Proportion of income donated
In percent In euros In million euros In percent
Top decile 60.5 456 1 940 0.57
9th decile 49.7 211 731 0.35
8th decile 46.7 197 616 0.36
7th decile 44.7 152 453 0.31
6th decile 42.5 112 307 0.23
5th decile 37.6 135 332 0.28
4th decile 32.6 188 402 0.38
3rd decile 31.8 117 233 0.25
2nd decile 26.2 101 159 0.20
Bottom decile 20.4 71 94 0.13
Total 39.6 201 5 265 0.36
1 Decentiles of the equivalence-weighted monthly household net income in 2010.2 Average sum of money donated in 2009.Source: SOEP V27 (in advance).
© DIW Berlin 2011
The top ten percent of income earners contribute over a third of the total volume of donations.
the combined effect of the Various factors
So as to obtain a better picture of which population groups actually give money or blood, and what factors interact, the inf luence of several factors on donation be-havior is examined (see the multivariate analyses in the box for details). The results illustrate (Table 4) that all factors included in the model have proven to be signi-ficant for donating money, but that giving money may be determined by social characteristics to a greater ex-tent than is the case with giving blood.
The average probability of adults donating money rises by 0.6 percentage points per year of their life, while for giving blood it falls by around the same percentage. For adults from West Germany, it is almost 10 percentage points higher than for persons from East Germany, while the probability of donating blood in the last ten years is around 4 percentage points lower for West Germans than for East Germans. However, foreign nationals do-nate both money and blood significantly less frequently.
For academics, the average probability of donating mo-ney is around 12 percentage points higher than for the reference group of people with a basic school-leaving certificate. On the other hand, we identify no acade-mic effect with regard to the probability of giving blood.
With regard to position in the income structure, the dif-ferences shown in Table 3 are also confirmed through multivariate testing. Thus, in the lowest income decile, the average probability of giving blood is around 11 per-centage points lower than in the reference group of the middle income deciles. In this lowest income decile, a tendency to donate blood significantly less frequently is observed as well. While in the upper income decile the probability of donating money is significantly hig-her, by almost 10 percentage points, than for the midd-le income level, we did not establish this for blood do-nors, however.
Blood Donors also Give Money More often
Finally, it was examined whether there is a direct cor-relation between giving blood and money.2 The investi-gation resulted in a positive correlation in both estima-tion models. Blood donors give money 9 percent more frequently and financial donors give blood around 5 per-cent more frequently.
2 The SOEP data do not allow us to see the time line showing which of the two donation activities was performed first or second.
Part II: a seLectIoN of 2011 PUBLIcatIoNs BY the soeP teaM

33SOEP Wave Report 2011
socIaL aND ecoNoMIc characterIstIcs of fINaNcIaL aND BLooD DoNors IN GerMaNY
Table 4
Determinants of Donation Behavior
Donated money1 in 2009
Gave blood2 in the past ten years
Sex (women) –0.025*** 0.006
Age (in years) 0.006*** –0.004***
Nationality (German) –0.092*** –0.066***
Region (Eastern Germany) 0.084*** –0.039***
Education (other school)
Junior high school –0.073*** –0.003
Abitur 0.051*** 0.057***
Degree 0.121*** 0.008
Employment status (not employed)
Employed full-time 0.005 0.047***
Employed part-time, low level of pay 0.058*** 0.057***
Registered unemployed –0.058*** 0.045**
Position in income structure (5th and 6th deciles)
Bottom decile –0.114*** –0.034**
2nd decile –0.062*** –0.013
3rd decile –0.036** –0.005
4th decile –0.024* –0.028*
7th decile 0.042** –0.005
8th decile 0.042*** 0.010
9th decile 0.042*** 0.001
Top decile 0.090*** –0.003
Gave blood (did not give blood in the past ten years) 0.086*** –
Donated money (did not donate any money) – 0.051***
Negative reciprocity –0.043*** 0.004
Positive reciprocity 0.032*** 0.009***
Satisfaction with personal income 0.017*** 0.001
Frequency of “feeling happy” in the last four weeks 0.013*** 0.017***
Observations 16 225 16 225
Log pseudolikelihood –9 741 –6 068
Wald chi2 1 951 854
Pseudo R2 0.119 0.074
Marginal probability effects with robust standard errors (Households 2010). Results of a logit estimation with 0/1 dummies. * p<0.05; ** p<0.01; *** p<0.001.1 Dependent variable: donated money in 2009 (yes/no)2 Dependent variable: donated blood in the last ten years (yes/no).Source: SOEP V27 (in advance)..
© DIW Berlin 2011
A degree and high income increase the probability of donating money to the largest extent. Income has virtually no influence on giving blood.
Personality traits and happiness also correlate with Donations
Finally, it was also investigated in the SOEP whether people donate in order to pass on their own experien-ces. Here, positive reciprocity denotes a tendency to re-ciprocate enjoyable experiences in a positive way. Nega-tive reciprocity, on the other hand, indicates a tendency to reciprocate negative experiences.1 The multivariate estimation results show that willingness to donate falls with increasing negative reciprocity. The higher the po-sitive reciprocity, however, the higher the willingness to donate money.
Positive reciprocity also increases willingness to give blood by a few percentage points, whereas, surprisingly, no significant correlation between negative reciprocity and donating blood is observed. Apparently, the tendency to retaliate against negative experiences is not expressed through a deliberate refusal to give blood.
As demonstrated above, income has an important effect on donation behavior. The decisive factor here is not only absolute income but personal satisfaction with it. If in-come satisfaction increases by one unit, the tendency to give money also increases by two percentage points.
As a final indicator, the perception of happiness was also included in the model:2 People who “felt happy” in the past four weeks gave both money and blood bet-ween one and two percentage points more frequently.
This proves impressively that donations are by no means solely motivated by material concerns but are also shaped by various value decisions and subjective dispositions.3
1 On this concept, see Jürgen Schupp and Gert G. Wagner, “Ein Vierteljahrhundert Sozio-oekonomisches Panel (SOEP): Die Bedeutung der Verhaltenswissenschaften für eine sozial- und wirtschaftswissen schaftliche Längsschnittstudie,” B. Mayer and H.-J. Kornadt, eds., Soziokulturelle und inter disziplinäre Perspektiven der Psychologie (Wies baden: VS Verlag für Sozialwissenschaften, 2010), 239-272 and on use in economic models, Thomas Dohmen, Armin Falk, David Huffman, and Uwe Sunde. “Homo Reciprocans: Sur-vey Evidence on Behavioural Outcomes,” The Economic Journal, Vol. 119 (2009) (536), 592-612.
2 A global survey (Gallup World Poll) showed that a positive correlation between donating money to charity and general satisfaction was identified in 122 of 136 countries; see Lara B. Aknin, Gillian M. Sandstrom, Elizabeth W. Dunn, and Michael I. Norton, “Investing in Others: Prosocial Spending for (Pro) Social Change,” Robert Biswas-Diener, ed., Positive Psychology as Social Change (Dordrecht: Springer, 2011), 222.
3 Further in-depth analyses would be required to establish whether, for example, indicators on frequency of going to church and religion used in earlier survey waves but not included in this report also provide a significant explanation.
SOEP Wave Report 201134
conclusion
The inclusion of donation-related issues as part of the to-pic “Consumption and Saving” in the 2010 SOEP study means that there is now, for the first time, a broad po-tential for analysis to investigate donation behavior in Germany. Data on multi-layered social and economic characteristics in particular, collected at the individual and household levels, provide the opportunity to fun-damentally expand the potential to analyze the subject of donations and gain valuable insights into social me-chanisms at work on donation behavior, also from the perspective of non-profit organizations.
The initial results impressively confirm that available income determines both willingness to give money and the amount donated. Income does not play any role as far as giving blood is concerned, however.
For the first time, there is documentary evidence to show that personality traits and positive emotions (hap-piness) are also significant in terms of willingness to do-nate money. As regards giving blood, on the other hand, no striking income or education effects were proven.
Eckhard Priller is Project Manager at the Social Science Research Center Berlin | [email protected] Jürgen Schupp is Head of the SOEP at DIW Berlin | [email protected]
JEL: D31, D64, Z13 Keywords: donations, income, altruistic, SOEP
Article first published as “Soziale und ökonomische Merkmale von Geld- und Blutspendern in Deutschland”, in: DIW Wochenbericht Nr. 29/2011
Part II: a seLectIoN of 2011 PUBLIcatIoNs BY the soeP teaM
35SOEP Wave Report 2011
The Greens have been riding high in the polls for months now. In Baden-Württemberg, a stronghold of the Christian-Democratic Party (CDU), Winfried Kretschmann became the first Green party candida-te to be elected Minister-President of any German state. This artic-le looks beyond the current political climate to analyze longer-term trends in Green party support. The data used come from the Socio-Economic Panel (SOEP) Study, carried out by DIW Berlin in cooperati-on with TNS Infratest, Munich. The data are especially well suited to the in-depth analysis of party identification for two reasons: First, the SOEP has interviewed the same individuals on their party support for 27 consecutive years. Second, the SOEP provides a uniquely rich set of data on the question of who these Green partisans are—how much they earn, what educational qualifications they possess and what their occupational status is.
Our results show that the successes of Alliance ‘90/The Greens in recent elections are the product of long-term changes in the party’s electorate. From the 1980s until today, the Greens have enjoyed the over-proportional and uninterrupted support of younger voters. The party has also been successful in maintaining voter loyalty even as their supporters grow older. Furthermore, the results show that a large proportion of individuals who supported the Greens in their youth are now high-income earners, civil servants, salaried emplo-yees and self-employed. Because of this, Alliance ‘90/The Greens are now competing with the Christian Democratic Union (CDU) and Free Democratic Party (FDP) to represent the interests of affluent middle-class voters.1
1 The Greens’ official name has changed over the course of time. In their founding phase, the terms “Green List” or “Alternative List” were frequently used at the local and state levels, and correspondingly, the Association of Greens in Hamburg still go by the name “Green-Alternative List.” When the Greens and Alliance 90 merged in 1993, they changed their name to Alliance 90/The Greens. For economy of language, we primarily use “the Greens” throughout this article in addition to the full official name.
the shifting electoral fortunes of the Green Party from 1980 to the present
Alliance ‘90/The Greens have experienced a surge in popularity over the last few months: Some pollsters even suggest that they lie head to head with the SPD. At the federal level, top Green politicians have claimed lea-dership of the opposition. At the state level, the Greens are experiencing sustained success as well. And for the first time since their founding in 1980, the party saw the first Green Minister-President at the states level in Baden-Württemberg and has a chance of seeing a Green Governing Mayor elected in the upcoming states elec-tions of Berlin, respectively.
A number of political analysts have attributed this phe-nomenon entirely to temporary shifts in the political climate. They argue that the current weakness of other parties, particularly the Social Democratic Party (SPD), the ongoing public discussions of nuclear phase-out and climate change and the increased levels of citizen parti-cipation in such initiatives as the “Stuttgart 21” protests have bolstered support for the Greens. However, this is only a temporary development, the current political cli-mate does not, in their view, ref lect longer-term trends.
In recent discussions, an opposing view has been gai-ning ground: the idea that Alliance 90/The Greens is becoming one of Germany’s major broad-based main-stream parties.2 According to this view, Green party support has increased and remained so resilient over the last thirty years that this (former) anti-party move-ment can now be described as a truly broad-based main-stream party—which in its early days would have been considered very mixed praise given their anti-party his-tory. This development cannot remain without conse-quences for the party system as a whole. For one, for-merly “small” parties such as the Greens now no longer
2 See Oliver Hoischen, “Wie grün ist das denn?” Frankfurter Allgemeine Sonntagszeitung, November 14, 2010, 6.
Alliance ‘90/The Greens at the crossroads: On their way to becoming a mainstream party?by Martin Kroh and Jürgen schupp

SOEP Wave Report 201136
serve to ensure parliamentary majorities for the CDU and SPD; rather, in Germany’s five-party system, these parties are claiming a role as equal partners in a range of different government coalitions.1 As the Greens con-tinue expanding their support base, they will also have to pay more attention to the diverse interests of their growing base of supporters while avoiding the risk of renewed infighting.
As Figure 1 shows, the party’s current spike in popula-rity is not the result of a constant upward trend over the last thirty years.2 As early as the 1980s, political com-mentators were already sounding the death knell for the newly founded Green party. Their argument was that the Greens were merely the expression of growing fears of unemployment among recent college graduates—fears
1 See also M. Kroh and T. Siedler, “Die Anhänger der ‘Linken’: Rückhalt quer durch alle Einkommensschichten.” DIW Wochenbericht 41, 2008.
2 For an overview of the evolution of the Greens and their support base, see W. Hulsberg, The German Greens: A social and political profile (London: Verso, 1988); J. Raschke, Die Grünen. Wie sie wurden was sie sind (Cologne: Bund Verlag, 1993); J. Raschke, Die Zukunft der Grünen. So kann man nicht regieren (Frankfurt/New York: Campus Verlag, 2001); J. W. Falter, M. Klein, Der lange Weg der Grünen. Eine Partei zwischen Protest und Regierung (Munich: C. H. Beck, 2003).
that would dissipate as soon as the labor market situa-tion improved.3 Others claimed that the Greens were a passing phenomenon in a generation shaped by debates on Chernobyl, acid rain and the nuclear arms race. Fu-ture generations, it was claimed, would have different priorities and the Greens would disappear as quickly as they had emerged on the scene.
As the figures show, the Greens have frequently found themselves teetering on the edge of political ruin. Af-ter their first elections to the Bundestag in 1983 and 1987, the Greens missed the five percent threshold in 19904 and were mired in bitter infighting between the fundamentalist (“Fundi”) and realist (“Realo”) factions of the party. This dispute over the party’s direction was also marked by the departure of numerous high-profi-le founding members, who either resigned or switched to other parties.
3 W. Bürklin, “Governing left parties frustrating the radical non-established left: The rise and inevitable decline of the Greens,” European Sociological Review 4, 1987, 161–166.
4 The 5 percent of second votes in 1990 reported in Figure 1 is the total of second votes for the Greens and Alliance 90, which at that time were running separately.
Figure 1
support for alliance ‘90/the Greens Share (in percent)
0
5
10
15
20
Percentage of second votes (Bundestag elections)
Party identification (SOEP)
Voting intention (Politbarometer)
Jan. 80 Feb. 83 Feb. 87 Feb. 91 Feb. 95 Feb. 99 Feb. 03 Feb. 07 Feb. 11
Election ‘80: 1.5%
Election ‘83: 5.6%
Election ‘87: 8.3%
Election ‘90: 5.0%
Election ‘94: 7.3%Election ‘98: 6.7%
Election ‘02: 8.6%
Election ‘05: 8.1%
Election ‘09: 10.7%
Fundi-Realo Crisis
Fusion of Alliance ’90/The Greens
Decision to phase out nuclear power
German military participation in NATO mission in Kosovo
German military deployment in Afghanistan
Chernobyl
Sources: Federal Election Commissioner, Forschungsgruppe Wahlen: Politbarometer; SOEP. DIW Berlin 2011
Over the last three decades, there has not been a linear increase in support for the Greens.
Part II: a seLectIoN of 2011 PUBLIcatIoNs BY the soeP teaM

37SOEP Wave Report 2011
aLLIaNce ‘90/the GreeNs at the crossroaDs: oN theIr WaY to BecoMING a MaINstreaM PartY?
The Greens experienced massive declines in popula-rity during their first term in the federal government under the Schröder administration (1998–2002). They had succeeded in pushing through a decision to phase out the use of nuclear energy—a central principle of the Green platform—but had also turned away from their pacifist doctrines to support German military engage-ment in Kosovo and Afghanistan after then-Foreign Mi-nister Joschka Fischer had committed the party to this line. The result was not just fierce ideological debate within the party, but also a dramatic loss in support for the Greens among the broader population. In 1999, For-schungsgruppe Wahlen, one of the major public opini-on research groups in Germany, reported the lowest le-
vels of voting intention for the Greens since 1981—just one year after the Greens first joined the ruling coali-tion at the federal level (see Politbarometer, Figure 1).
A longer-term examination of the f luctuations in Green party support confirms the temporary nature of the cur-rent spike in popularity, as ref lected in the approximate-ly 20 percent of the population reporting the intention to vote for the Greens if elections were held next Sun-day (see text box above). Support for the Greens was also relatively high, at 15 percent, in the mid-1990s. Never-theless, it is not impossible that these monthly f luctua-tions in responses to the voting intention question con-ceal a longer-term trend that would justify the Greens’
Three indicators have been used here to measure support for the Greens in the German population (Figure 1): first, the percentage of (second) votes1 for the Greens in Bundestag elections between 1980 and 2009 (gray dots). Second, the percentage of intended votes for the Greens (gray line) sur-veyed on a monthly basis by Politbarometer, a major pollster in Germany. Third, the percentage of party identifications for the Greens (green line) surveyed on an annual basis by the Socio-Economic Panel (SOEP) study.
Long-term party identification (political affiliation) is mea-sured in the German electoral research with the question: “Many people in Germany lean towards one party in the long term, even if they occasionally vote for another party. Do you lean towards a particular party?” If respondents answer yes, they are asked to state which party.2 In contrast to voting intention, which gives indications about the current political climate, party identification reveals longer-term trends in political affiliations.
A common finding in many Western countries is the decreasing importance of traditional political affiliations.3 At present,
1 The German voter has two votes: the first is for a direct candidate and the second is for a party list. The proportion of second votes (Zweitstimmen) determines the distribution of seats in the Bundestag to the parties, which then fill the seats from their electoral lists.
2 J. Falter, H. Schoen, and C. Caballero, “Dreißig Jahre danach. Zur Validierung des Konzepts ‘Parteiidentifikation’ in der Bundesrepublik,” 50 Jahre Empirische Wahlforschung in Deutschland. Entwicklungen, Befunde, Perspektive, Daten, eds. M. Klein, W. Jagodzinski, E. Mochmann, and D. Ohr (Wiesbaden: Westdeutscher Verlag, 2003), 1-34.
3 Dalton, R. J., and Wattenberg, M. (eds). Parties without partisans. Oxford, UK: Oxford University Press, 2000.
around 50 percent of respondents to the annual SOEP survey state that they have a long-term identification with a parti-cular party. In the 1980s, this percentage was five to ten percentage points higher. This does not mean, however, that the other 50 percent of respondents have no party loyalties. Many respondents vacillate between political independence and stated party preference from one survey to the next. Loo-king at the SOEP survey results from a longer-term perspective (2006–2010), nearly 70 percent of all respondents stated party identification at least once. In the period 1984–1988, 80 percent of all respondents did so.
A unique feature distinguishing the Socio-Economic Panel from many other political surveys is that not only registered voters are surveyed—that is, individuals above the age of 18 with German citizenship—but also individuals without German citizenship and all household members aged 17 and older. All of the results presented in this Weekly Report cover this broad group of individuals aged 17 and older in Germany. The probability of answering “yes” to the question of whether one leans toward a particular party “in the long term” is initially lower among young people and immigrants but rises steadily with increasing experience with the German political system.4
4 On the time up to first mention of party preferences in young people, see M. Kroh and H. Schoen, “Politisches Engagement,” in Leben in Ost- und Westdeutschland: Eine sozialwissenschaftliche Bilanz der deutschen Einheit 1990-2010, eds. P. Krause and I. Ostner (Frankfurt/New York. Campus Verlag 2010). On the time up to first mention of party preferences in first-generation immigrants, see M. Kroh and I. Tucci, “Parteienbindungen von Migranten: Parteien brauchen erleichterte Einbürgerung nicht zu fürchten,” DIW Wochenbericht 47, 2009.
Box 1
the Vote choice, Voting Intention and Party Identification

SOEP Wave Report 201138
future designation as a broad-based mainstream par-ty. In the following, we explore these long-term trends based on data from the Socio-Economic Panel (SOEP) Study: Here, the focus is not on current political atti-tudes but on longer-term party identifications and on the socio-demographic changes affecting party support.
Little movement between the parties
SOEP respondents are asked to state whether and to what extent they tend to lean toward a particular party con-sistently from a long-term perspective. This more las-ting party identification should therefore be clearly di-stinguished from the current preference for a political party as measured with the “Sunday Question” (Sonn-tagsfrage, see box).
Most respondents who report lasting party identifica-tion remain faithful to that party over subsequent sur-veys (Table 1). Of the estimated 3.2 million supporters of Alliance ’90 /The Greens in 2009, around 2.3 million supported the same party in the following year. Appro-ximately 440,000 Greens supporters in 2009 reported not (or no longer) to lean toward any particular party in 2010. The remaining 430,000 supporters of the Greens in 2009 had switched to another party by 2010—the lar-ge majority to the SPD (262,000). The departures of for-mer Green supporters to other parties were countered by more than one million new supporters who had formerly reported no political leanings. Further additions to the Greens’ supporters between 2009 and 2010 came from
former supporters of other parties (500,000), the relati-ve majority of whom were former SPD voters (320,000). Overall, Alliance ’90 /The Greens increased their base of support between 2009 and 2010 from 3.2 to 4 milli-on. Shifts in membership between parties and particu-larly between left and right are rare: 84 percent of the Green supporters from 2009 who reported political par-ty leanings in 2010 still supported the Greens. For com-parison: The figure was 95 percent for the CDU/CSU, 90 percent for the SPD, 89 percent for the Left Party and 61 percent for the FDP (Table 1).
Since people who report party identification usually remain loyal to that party in the longer term and only change loyalties for limited periods of time,1 only a small portion of the gradual increase in Green party identifi-cation to currently 13 percent among all those who re-ported party identifications can be attributed to f luctu-ating party loyalties (see Figure 1). Figure 2 presents the total changes in party identification among respondents who switched affiliations between parties from one year to the next since 1985. Although the figure does show a strong overall shift in party identification from the SPD to the Greens, it also reveals that the Greens have not gained steadily from the SPD, but have lost many supporters to the SPD, particularly in times of politi-cal crisis (e.g., during the Fundi-Realo conflict and the debates on military deployment in the late 1990s). The movements of members between the Greens and the traditionally middle-class, center-right parties (CDU/CSU, FDP) and the PDS/Left Party are of significantly lower importance in absolute terms (Figure 2). In 2010, the Greens gained supporters from the ranks of the SPD and FDP, but lost supporters to the Left Party (approxi-mately 60,000 each, see Table 1).
Demographic change favors growth in Greens support
If the increase in support for the Greens cannot be ex-plained primarily by defections from other parties, a plausible alternative explanation is that a steady stream of new members from new birth cohorts is providing the Greens the stable base of support that characteri-zes the traditional mainstream parties. It is a well es-
1 The high stability in party identification has also been noted in other Western countries; see, e.g., D.P. Green and B. Palmquist, “How stable is party identification?” Political Behavior 16, 1994, 437–466; D.P. Green, B. Palmquist, and E. Schickler, Partisan hearts and minds. Political parties and the social identities of voters (New Haven/London: Yale University Press, 2002); A.S. Zuckerman, The social logic of partisanship. (Philadelphia: Temple), 2005; A.S. Zuckerman, J. Dasovic, and J. Fitzgerald, Partisan families: the social logic of bounded partisanship in Germany and Britain (New York: Cambridge University Press), 2007.
Table 1
changes in Party Identification 2009-2010 In thousands
2010
Independent SPDCDU/CSU
FDP The Greens The Left Other Total
2009
Independent 31 754 2 992 2 624 654 1 146 777 473 40 420
SPD 1 532 6 668 117 46 320 176 95 8 954
CDU/CSU 1 397 171 8 827 115 34 32 114 10 690
FDP 566 47 356 906 71 14 83 2 043
The Greens 436 262 14 8 2 322 80 65 3 187
The Left 242 94 9 0 25 1 418 48 1 836
Other 216 125 177 50 58 9 535 1 170
Total 36 143 10 359 12 124 1 779 3 976 2 506 1 413 68 300
Example: Of the 68.3 million people in Germany over the age of 17, 2.322 million identified with Alliance ‘90/The Greens in both 2009 and 2010. Of those who stated that they supported the Greens in 2010, 1.146 million had described themselves as independents in the previous year.
Sources: SOEP V27; authors’ calculations.DIW Berlin 2011
Of the three smaller parties, the Greens currently have by far the most loyal constituency.
Part II: a seLectIoN of 2011 PUBLIcatIoNs BY the soeP teaM

39SOEP Wave Report 2011
aLLIaNce ‘90/the GreeNs at the crossroaDs: oN theIr WaY to BecoMING a MaINstreaM PartY?
tablished empirical finding that large percentages of Greens supporters can be found among teenagers and young adults. A frequently discussed result in electoral research is that the median age of Greens supporters has increased gradually since the 1990s: Whereas the Greens supporters in the Socio-Economic Panel were 28 years old on average (median) between 1984 and 1989, today they are 42.1
1 On the debate over the “graying” of the Greens, see W. Bürklin and R.J. Dalton, “Das Ergrauen der Grünen,” in Wahlen und Wähler: Analysen aus Anlass der Bundestagswahl 1990. eds. H.D. Klingemann and M. Kaase (Opladen: Westdeutscher Verlag, 1994), 264–302; M. Klein and K. Arzheimer, “Grau in Grau. Die Grünen und ihre Wähler nach eineinhalb Jahrzehnten,” Kölner Zeitschrift für Soziologie und Sozialpsychologie 49, 1997, 650–673; U. Kohler, “Zur Attraktivität der Grünen bei älteren Wählern,”. Kölner Zeitschrift für Soziologie und Sozialpsychologie 50, 1998, 536–559; M. Klein, “Die Entwicklung der grünen Wählerschaft im Laufe dreier Jahrzehnte- eine empirische APK-Analyse,” in Politik—Wissenschaft - Medien. Festschrift für Jürgen W. Falter zum 65. Geburtstag. Verlag für Sozialwissenschaften, eds. H. Kaspar, H. Schoen, S. Schumann, and J. W. Winkler (Opaden, 1999); M. Spiess and M. Kroh, “A selection model for panel data: the prospects of Green party support.” Political Analysis 18, 2010, 172-188.
According to a common argument, which also corres-ponds to the present data from the Socio-Economic Pa-nel (SOEP), the first generations of young Greens sup-porters from the 1980s (the 1950/59 and particularly the 1960/69 age cohorts) were still faithful to the party by and large thirty years after its founding (Table 2). In the 1960/69 cohort, the percentage of Greens suppor-ters was 19 percent when these individuals were aged 20; when they had reached the age of 40 or older, the percentage of Greens was still 16 percent. The figures do show a slight decline in party support for the Greens over the life course, but the difference between cohorts is substantially stronger: Older birth cohorts born up to approximately 1950 show a significantly below-ave-rage level of support for the Greens, whereas support in younger birth cohorts (born after 1950) is between 10 and 19 percent.
If we adjust for the aforementioned negative life-cycle effect in the percentage of Greens supporters among all
Figure 2
shifts in support between the Greens and other Parties In ten thousands
–30
–20
–10
0
10
20
30
1985 1990 1995 2000 2005 2010
CDU/CSU
–30
–20
–10
0
10
20
30
1985 1990 1995 2000 2005 2010
FDP
–30
–20
–10
0
10
20
30
1985 1990 1995 2000 2005 2010
The Left
–30
–20
–10
0
10
20
30
1985 1990 1995 2000 2005 2010
SPD
Source: SOEP. DIW Berlin 2011
For the Greens, the largest gains and losses in party affiliation have occurred with the SPD.

SOEP Wave Report 201140
those reporting party identification, we find a constant high level of Greens support, at 18 percent, in the birth cohorts of the 1960s, 1970s and 1980s. To the same ex-tent as the importance of the pre-1950 birth cohorts re-lative to the post-1950 cohorts has declined over time, the percentage of Greens supporters in the population has increased. Demographic change therefore acts as a structural advantage for the Greens and has been cru-cial in enabling the party to approach the 20 percent mark in upcoming elections.
from the radical left to the Green establishment
Since the majority of young Greens supporters from the 1980s have remained faithful to the party as they have gotten older, not only the median age of Green party sup-porters but also their socio-structural status has chan-ged dramatically over the last three decades.
The affluent Greens
The Green party’s support base is comprised almost ex-clusively of individuals who completed academic-track Gymasium (obtaining the Abitur university entrance qualification), with approximately 18 percent of all such individuals since 1984 reporting identification with the Green party. Among those who completed lower secon-dary school forms (Volksschule / Hauptschule), sup-port for the Greens is low at approximately 3 percent. This relation has not changed since the 1980s (Table 3).
Although many Green party supporters completed their education in the 1980s, they still had not started wor-
king at that time: From 1984 to 1989, 26 percent of stu-dents in post-secondary education or training and only 5-8 percent of self-employed or employed people and ci-vil servants supported the Greens. Since then, support for the Greens in the latter three occupational groups has grown steadily, or to be more precise: Supporters of the Greens have grown into these occupational groups.
Today, 20 percent of civil servants and as many as 18 per-cent of self-employed and employed people are Green supporters. Among retired people, other non-employed people and blue-collar workers, however, the Greens have never had a substantial base of support. The share of Green party supporters among the unemployed has in-deed been declining over the last few decades.
The occupational evolution of Green party supporters is also expressed in their income. Between 1984 and 1989, the Greens experienced their highest relative le-vel of support in the lowest disposable income quinti-le—at around 10 percent—and an only average level of support—at 6 percent—in the highest quintile. This pic-ture was reversed in the years that followed. In the peri-od from 2008 to 2010, the share of Green party suppor-ters in the lowest quintile of the income distribution was average (9 percent). The highest share of support was in the highest income quintile (16 percent).
With regard to the socio-structural status of their sup-porters, the Greens today enjoy their highest level of sup-port among the aff luent, educated middle-class. Their success with self-employed people and among indivi-duals with above-average incomes has undermined the prior dominance of the CDU and FDP as sole represen-tatives of this electorate. The lack of Green party sup-port among blue-collar workers, the less educated and the unemployed suggests that the Greens—despite their self-perception as “leftist”—are not competing with the SPD or the Left Party for members from the traditional working class.
Green party supporters typically live in cities
The traditional base of support for Alliance ’90/The Greens is concentrated in cities. Furthermore, the per-centage of Green party support in the population is in-creasing much more strongly in urban than in rural areas. The Greens’ efforts to promote conservation and ecologically oriented agriculture thus appear not to have paid off in terms of party identification, at least not in the rural electorate.
In the “new” German states of the former GDR, sup-port for the Greens is also below-average. This East-
Table 2
Percentage of Green Party supporters by cohort and age Group
Age
Birth Cohort
Up to 1909
1910–1919
1920–1929
1930–1939
1940–1949
1950–1959
1960–1969
1970–1979
1980–1993
17–20 19 19 17
21–30 16 17 15 18
31–40 7 12 15 19
41–50 2 5 12 16
51–60 1 2 4 9
61–70 1 1 2 4
71+ 0 1 1 3
Total1 4 4 5 6 7 14 18 18 18
1 Estimated median support for the Greens in cohorts controlling for age effects.
Sources: SOEP V27; authors’ calculations.DIW Berlin 2011
The Greens have been able to rely on a loyal base of voters from the post-war generation.
Part II: a seLectIoN of 2011 PUBLIcatIoNs BY the soeP teaM
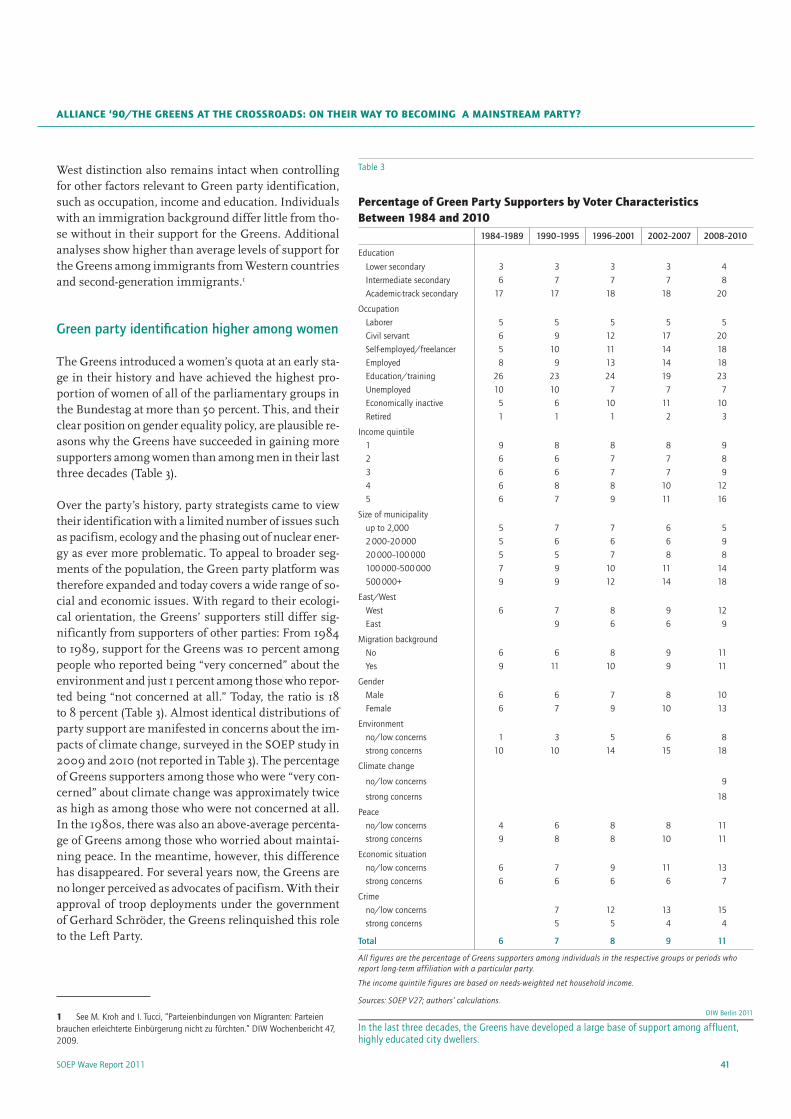
41SOEP Wave Report 2011
aLLIaNce ‘90/the GreeNs at the crossroaDs: oN theIr WaY to BecoMING a MaINstreaM PartY?
West distinction also remains intact when controlling for other factors relevant to Green party identification, such as occupation, income and education. Individuals with an immigration background differ little from tho-se without in their support for the Greens. Additional analyses show higher than average levels of support for the Greens among immigrants from Western countries and second-generation immigrants.1
Green party identification higher among women
The Greens introduced a women’s quota at an early sta-ge in their history and have achieved the highest pro-portion of women of all of the parliamentary groups in the Bundestag at more than 50 percent. This, and their clear position on gender equality policy, are plausible re-asons why the Greens have succeeded in gaining more supporters among women than among men in their last three decades (Table 3).
Over the party’s history, party strategists came to view their identification with a limited number of issues such as pacifism, ecology and the phasing out of nuclear ener-gy as ever more problematic. To appeal to broader seg-ments of the population, the Green party platform was therefore expanded and today covers a wide range of so-cial and economic issues. With regard to their ecologi-cal orientation, the Greens’ supporters still differ sig-nificantly from supporters of other parties: From 1984 to 1989, support for the Greens was 10 percent among people who reported being “very concerned” about the environment and just 1 percent among those who repor-ted being “not concerned at all.” Today, the ratio is 18 to 8 percent (Table 3). Almost identical distributions of party support are manifested in concerns about the im-pacts of climate change, surveyed in the SOEP study in 2009 and 2010 (not reported in Table 3). The percentage of Greens supporters among those who were “very con-cerned” about climate change was approximately twice as high as among those who were not concerned at all. In the 1980s, there was also an above-average percenta-ge of Greens among those who worried about maintai-ning peace. In the meantime, however, this difference has disappeared. For several years now, the Greens are no longer perceived as advocates of pacifism. With their approval of troop deployments under the government of Gerhard Schröder, the Greens relinquished this role to the Left Party.
1 See M. Kroh and I. Tucci, “Parteienbindungen von Migranten: Parteien brauchen erleichterte Einbürgerung nicht zu fürchten.” DIW Wochenbericht 47, 2009.
Table 3
Percentage of Green Party supporters by Voter characteristics Between 1984 and 2010
1984–1989 1990–1995 1996–2001 2002–2007 2008–2010
Education
Lower secondary 3 3 3 3 4Intermediate secondary 6 7 7 7 8Academic-track secondary 17 17 18 18 20
OccupationLaborer 5 5 5 5 5Civil servant 6 9 12 17 20Self-employed/freelancer 5 10 11 14 18Employed 8 9 13 14 18Education/training 26 23 24 19 23Unemployed 10 10 7 7 7Economically inactive 5 6 10 11 10Retired 1 1 1 2 3
Income quintile1 9 8 8 8 92 6 6 7 7 83 6 6 7 7 94 6 8 8 10 125 6 7 9 11 16
Size of municipalityup to 2,000 5 7 7 6 52 000–20 000 5 6 6 6 920 000–100 000 5 5 7 8 8100 000–500 000 7 9 10 11 14500 000+ 9 9 12 14 18
East/WestWest 6 7 8 9 12East 9 6 6 9
Migration backgroundNo 6 6 8 9 11Yes 9 11 10 9 11
GenderMale 6 6 7 8 10Female 6 7 9 10 13
Environmentno/low concerns 1 3 5 6 8strong concerns 10 10 14 15 18
Climate change
no/low concerns 9
strong concerns 18
Peaceno/low concerns 4 6 8 8 11strong concerns 9 8 8 10 11
Economic situation no/low concerns 6 7 9 11 13strong concerns 6 6 6 6 7
Crimeno/low concerns 7 12 13 15strong concerns 5 5 4 4
Total 6 7 8 9 11
All figures are the percentage of Greens supporters among individuals in the respective groups or periods who report long-term affiliation with a particular party.
The income quintile figures are based on needs-weighted net household income.
Sources: SOEP V27; authors’ calculations.DIW Berlin 2011
In the last three decades, the Greens have developed a large base of support among affluent, highly educated city dwellers.
SOEP Wave Report 201142
Since 1984, the SOEP has surveyed respondents regar-ding their concerns about the overall economic situati-on, and since 1992 about crime—questions that corre-spond to “classic” middle-class policy fields of growth and security. Individuals who express serious concerns in these two areas are found increasingly rarely among Green party supporters, despite their broader party plat-form. Green supporters made up only 4 percent of tho-se who reported concerns about crime and 7 percent of those who reported concerns about the economy (Table 3). Green party supporters therefore tend to be uncon-cerned about either of these two policy areas. Or to put it differently: Individuals who see a need for action in these two policy areas seldom seek answers from Alli-ance ‘90/The Greens.
conclusion
The Greens used to represent a party of well-educated and ecologically oriented but rather poorly paid young people. In recent years, however, they have succeeded in maintaining a base of support among their early sup-porters and in achieving above-average levels of support among first-time and young voters. Today, the Greens are the party of middle-aged, environmentally conscious, educated and aff luent civil servants and self-employed people living in urban areas. An almost negligible per-centage of less-educated, lower-paid and unemployed people support the Greens. One can therefore conclu-de that Greens do not need to give these voters primary consideration in designing their labor market and eco-nomic policies. The rise of the Greens is, according to the data from the SOEP longitudinal study, anything but a short-term phenomenon; rather, the Greens ap-pear to have a solid and enduring base among educa-ted middle-class voters.
A long-term examination of the SOEP data reveals, along with socio-structural changes in the ranks of Green sup-porters, a decline in the importance of peace as a policy issue. There has not been an above-average percentage of individuals with strong concerns about peace among Green supporters since the late 1990s. The substantial increase in support for the Greens among women, on the other hand, may indicate a positive response to the Greens’ focus on gender equality as a policy priority.
Whereas the Greens focused on a limited number of is-sues in their founding years, creating an image of them-selves as a one-issue party, developing a broader base of support requires more nuanced political responses. At present, the Greens have achieved broader support base, but still, their supporters remain relatively ho-mogeneous with regard to their socio-structural status
and the issues that matter to them. Direct competition for leadership on specific policy issues comes from the SPD and Left Party—but only the SPD actually compe-tes with the Greens for supporters. Interestingly, the results show that the Greens are now competing with the traditional middle-class, center-right parties to re-present the interests of higher-income individuals. The aim of gaining recognition across all social classes will be a litmus test for the Greens: To earn the designati-on as a broad-based mainstream party, they will have to learn to effectively defend unpopular decisions made in government to a broader electorate and thus to prevent a gradual decline in support.
Prof. Dr. Martin Kroh is a researcher in the Research Infrastructure Socio Economic Panel (SOEP) | [email protected] Prof. Dr. Jürgen Schupp is the head of the Research Infrastructure Socio Economic Panel (SOEP) | [email protected]
JEL Classification: D72, Z13 Keywords: Party identification, B90/Die Grünen, SOEP
Article first published as “Bündnis 90/Die Grünen auf dem Weg zur Volks-partei?”, in: DIW Wochenbericht Nr. 12/2011.
Part II: a seLectIoN of 2011 PUBLIcatIoNs BY the soeP teaM
43SOEP Wave Report 2011
The educational and employment trajectories of migrant children in France and Germany are extremely diverse. The few successful ones dominate the public eye. Yet successful biographies of young adults with a migration background are in no way a negligible exception. However, the picture is different in the two countries: while in France more migrants’ descendants manage to reach their (secondary?) general qualification for university entrance, in Germany they are overrepresented particularly at the Hauptschule (general secondary school). It is, however, considerably more difficult for these young people in France to gain a long-term foothold in the labor market, while in Germany they often take the chance to acquire a vocational qualification and have better job opportunities.
As part of a three-year research project, the question examined was which social and institutional factors can stabilize educational at-tainment and professional orientation. On the basis of qualitative interviews, which were conducted with young adults with a migrati-on background in four disadvantaged areas of Berlin and Paris, it is possible to name three factors that play an important role in the suc-cess and/or the stabilization of early educational and employment trajectories: the support provided by significant third parties, entry into milieus which are more socially and culturally diverse, and the prospect of a “second chance.”
As countries with a high number of migrants, Germa-ny and France are both faced with the task of integra-ting migrants and their children as well as possible. The civil unrest of November 2005 in the French sub-urbs showed how seriously the experience of social in-equalities, discrimination, and segregation can jeopar-dize social cohesion. Now, it is essential on both sides of the Rhine to prevent ethnic and cultural differences from being reinforced.
Different education systems …
Research conducted to date already shows that, on ave-rage, migrant children in both countries have lower qualifications than their peers without a migrant back-ground.1 At the same time, international comparative studies have proven that institutional frameworks have an impact on the opportunities for participation of the second-generation.2 This can also be backed up by a com-parison of the German and French education systems. In Germany, children do not normally go to school un-til the age of six and are placed in different school tracks relatively early—after the primary level. This institutio-nal separation is frequently cited as a reason for the par-ticularly pronounced educational inequalities between children with different social and ethnic backgrounds.3
1 For an overview of the results of research for Germany, see Clauss, S. and B. Nauck, “The Situation Among Children of Migrant Origin in Germany,” Innocenti Working Papers 14 (2009). For France, see Kirszbaum, T., Y. Brinbaum, and P. Simon, “The Children of Immigrants in France: The Emergence of a Second Generation”. Innocenti Working Papers 13 (2009).
2 See, for example, Crul, M. and H.Vermeulen, “The second generation in Europe,” International Migration Review, 37 (4), (2003): 965–986; Heckmann, F., H.W. Lederer, and S. Worbs: Effectiveness of national integration strategies towards second generation migrant youth in a comparative perspective (EFFNATIS). Final Report to the European Commission. Bamberg (2001).
3 See Tillmann, K.J., “Viel Selektion—wenig Leistung: Der PISA-Blick auf Erfolg und Scheitern in deutschen Schulen”. K. Böllert. (ed.): Von der Delegation zur Kooperation. Bildung in Familie, Schule, Kinder- und Jugendhilfe. (Wiesbaden: 2008): 47–66.
Success Despite Starting Out at a Disadvantage: What Helps Second-Generation Migrants in France and Germany?by Ingrid tucci, ariane Jossin, carsten Keller, and olaf Groh-samberg
SOEP Wave Report 201144
In France, on the other hand, children normally start attending pre-school at a considerably younger age—at three at the latest—and not only go through elementary school together but also the subsequent collège right up until the age of 15. At the end of collège, an “orientation” takes place in France as well, and thus separation into different educational pathways. Some of the students follow the general educational trajectory and others the vocational one. After their first year at grammar school, those who follow the general trajectory will prepare eit-her for the general higher education entrance qualifica-tion or the technical high-school diploma.1 In the voca-tional trajectory, short practical training courses are pro-vided, as well as a vocational school-leaving certificate.
1 When studying for the technical high-school diploma, the grammar school students acquire practical knowledge as well as theoretical knowledge. The baccalauréat technologique is comparable to the German Fachabitur (technical high-school diploma which serves as a qualification for entrance to universities of applied sciences) but this baccalauréat theoretically opens all doors to university education. However, graduates often have difficulty advancing, (see Blöss, T. and V. Erlich, “Les nouveaux acteurs de la sélection universitaire: Les bacheliers technologiques en question.” Revue française de sociologie, 41 (4) (2000): 747–775.
In contrast to the vocational training in Germany, the short professional training courses in France are how-ever considered to be for “dropouts” and seen as inferi-or. This debasement was further reinforced through the political objective that 80 percent of all students should obtain the baccalauréat (secondary-school leaving certi-ficate), which has led to different forms of the French baccalauréat, ranging from the general one (bac général) to the technical one (bac technologique) and the vocatio-nal one (bac professionnel).
Despite the above-mentioned differences in the edu-cation systems, in both countries there is a similarly sized share of less than 15 percent of young adults who have obtained no school or vocational qualifications at all.2 Young people in Germany can obtain some of the qualifications they did not manage to acquire at school within the framework of the “transition system” or trai-ning schemes run by the employment office. Numerous
2 See Autorengruppe Bildungsberichterstattung: Bildung in Deutschland 2010. Bertelsmann Verlag. 2010.
The research project entitled “A Franco-German Compa-rison of Professional Strategies and Status Passages of Young Adults with a Migration Background”1 explores what helps young people with a migration background to have successful educational and professional careers. What are the prerequisites for successful trajectories?2
In an attempt to answer these questions, studies were carried out on the life courses of young men and women of Turkish and Arab origin in Germany and of North African and Sub-Saharan origin in France. To date, this biographical perspective has been rare in the approaches and empirical work of migration and
1 The research project entitled “A Franco-German Comparison of Professional Strategies and Status Passages of Young Adults with a Migration Background” is jointly funded by the German Research Foundation (DFG) and the French National Research Agency (ANR). Many thanks to Lisa Crinon, Florian Mönks, Wenke Niehues, Tim Sawert, Agnieszka Sommer, and Deniz Yildirim for their hard work on the analyses.
2 Trajectories are considered to be successful if the respondents themselves are satisfied with their life course, also in retrospect, because they have achieved a certain social stability (obtaining a qualification, entering gainful employment, etc.).
integration research.3 The project is divided into two major parts: on the one hand, quantitative data from longitudinal studies on educational and employment trajectories were analyzed statistically. On the other hand, as part of a qualitative study in 2009 and 2010, a total of 175 young adults with a migration back-ground in two disadvantaged areas in Berlin and two in Paris were interviewed—young men and women with successful as well as difficult life courses.
While the quantitative results presented here give an overview of typical patterns of educational and working careers of young people with a migration background, qualitative analyses can be used to determine major factors that have brought about a turning point in their lives, or had a positive impact on their life course.
3 See Wingens, M., H. de Valk, M. Windzio, and C. Aybek, “The sociological life course approach and research on migration and integration,” ibid. (eds.): A life-course perspective on migration and integration, (Dordrecht: 2011): 1-26.
Box 1
a franco-German research Project
Part II: a seLectIoN of 2011 PUBLIcatIoNs BY the soeP teaM

45SOEP Wave Report 2011
sUccess DesPIte startING oUt at a DIsaDVaNtaGe: What heLPs secoND-GeNeratIoN MIGraNts IN fraNce aND GerMaNY?
Germany: a high Number at General secondary schools, few Gaining University entrance Qualifications
As far as educational trajectories in Germany are con-cerned, what stands out is the strong overrepresentati-on of children of Turkish migrants in the general secon-dary school tracks with subsequent problems entering
schemes and programs are targeted at young people with a migration background in particular.
This opportunity does not exist in France, or only to a very limited extent, partly because the egalitarian prin-ciple of the French Republic precludes special schemes to support migrants and qualification schemes provi-ded by what are known as missions locales1 have a more limited range.
… Unequal educational opportunities
The education systems and social policy frameworks are different in both countries. Indeed, they also lead to dif-ferent educational trajectories. Using longitudinal data and pattern recognition processes, it is possible to stu-dy and group educational trajectories and initial career paths with regard to typical patterns. Tables 1 and 2 show how the groups from the different countries of origin studied are distributed along the different trajectories.2
france: Many children of Immigrants heading towards their school-Leaving certificate
As can be seen from Table 1, children of North African and Sub-Saharan migrants in France are overrepresen-ted in the less prestigious vocational trajectories of the education system (Trajectory 5). They themselves often perceive this career path as frustrating or forced upon them.3 They are just as frequently represented in the technological trajectory of the general educational tra-jectory (Trajectory 3), which gives some of them access to university. In the more prestigious trajectory, which leads directly to university via the baccalauréat général, however, they are somewhat underrepresented (Trajec-tory 1): while one-fifth of them follow this educational trajectory, almost 40 percent of young people without a migration background achieve the baccalauréat général.
1 Missions locales are state-run centers that promote the social and professional integration of young people.
2 The results given in this report are descriptive. For multivariate analyses that take social background into account, see the following article: Groh-Samberg, O., A. Jossin, C. Keller, and I. Tucci, “Biografische Drift und zweite Chance. Zur institutionellen Strukturierung der Bildungs- und Berufsverläufe von Migrantennachkommen in Deutschland und Frankreich”. (submitted manuscript, 2011). For Germany, we do not have any longitudinal data about young adults of Arab origin.
3 See Caille, J.-P., “Perception du système éducatif et projets d’avenir des enfants d’immigrés”. Éducation et formations 74 (2007): 117-142 and Silberman, R. and I. Fournier, (1999): “Les enfants d’immigrés sur le marché du travail: les mécanismes d’une discrimination sélective” Formation emploi, 65, 31–55.
Table 1
educational trajectories between the ages of 11 and 18—france
France Maghreb Sub-Sahara
Trajectory no. Brief description of the trajectory N = 12911 N = 1165 N = 256
1 General maturity certificate and university 38.5 20.3 19.1
2 Technical high-school diploma and university 7.5 6.7 7.4
3 Technical high-school diploma 12.4 16.6 16.4
4 Short vocational training course 15.6 16.7 12.1
5 Deferred vocational training course 21.4 31.7 28.5
6 Early school leaver 4.5 8.1 16.4
Total 100 100 100
Sources: Panel des élèves du second degré, 1995; DEPP; calculations by DIW Berlin. © DIW Berlin 2011
In France, only half as many descendants of immigrants as young people without a migra-tion background manage to obtain the general higher education entrance certificate and then go directly to university.
Table 2
educational trajectories between the ages of 11 and 18—Germany
Germany Turkey
Trajectory no. Brief description of the trajectory N = 2091 N = 282
1 Attendance of grammar school 22.3 5.3
2 Transfer to grammar school 12.0 6.4
3 Transfer from grammar school to intermediate school (Realschule) 4.7 0.7
4 Attendance of intermediate school 18.3 11.7
5 Transfer from general secondary school to intermediate school 14.1 9.6
6 General secondary school followed by vocational training 7.2 8.2
7 General secondary school with transitional problems 14.7 50.7
8 Attendance of comprehensive school 6.9 7.5
Total 100 100
Sources: SOEP 1984–2009; calculations by DIW Berlin.© DIW Berlin 2011
In Germany, over half of all students of Turkish origin end up in the general secondary school and subsequently struggle with transitional problems.

SOEP Wave Report 201146
system, it is difficult to catch early school leavers and to give them a second chance.
the transitions into the Labor Market of the Descendants of Immigrants also Vary
While the ethnic segregation is significantly greater in the German education system than in France, this dif-ference can surprisingly no longer be seen with regard to entry into the labor market. At least two important differences between the countries are clear from the re-sults in Tables 3 and 4.
Descendants of Immigrants in Germany are More Successful at Entering the Labor Market than in France
In France, a particularly precarious career path (Tra-jectory 6) becomes clearly evident, characterized in the long term through repeated phases of unemployment and precarious employment: around 23 percent of young adults of North African origin and 16 percent of young adults of Sub-Saharan origin end up on this path. For young adults of French origin, this figure is 14 percent. Furthermore, children of North-African and Sub-Saha-ran immigrants in France frequently end up in conti-nuously precarious employment (Trajectory 4) even af-ter a longer educational trajectory.
vocational training and the labor market (Trajectory 7): for children of Turkish migrants, the share is around 50 percent, compared to only around 15 percent among young people without a migration background. For the tracks of the Hauptschule (general secondary school) or the Gesamtschule (comprehensive school) followed by vo-cational training (Trajectories 6 and 8), young people of Turkish origin are proportionally represented. But only around 5 percent of them of them are on the Gymnasi-um (grammar school) track—for children without mig-ration background, this figure is 22 percent. Neverthel-ess, 6 percent (as opposed to 12 percent of young adults without a migration background) switch to a grammar school during the course of their education. Overall, it is apparent that children of Turkish migrants are repre-sented in educational trajectories with a move to a dif-ferent type of school (regardless of whether this is to a higher or lower level) considerably less often than child-ren without a migration background.
Overall, a high degree of ethnic segregation can be seen in the German education system. The French educa-tion system offers the chance of an academic education with the baccalauréat technologique. At the same time, in France, there is however, also a strong overrepresen-tation of young people of North African and Sub-Saha-ran origin in the trajectory “Early school leaver”1 (Tra-jectory 6), which indicates that in the French education
1 Young people in this trajectory leave school at the age of around 14 or 15, that is, without any qualifications.
Table 3
entry into the Labor Market between the ages of 18 and 25—france
Trajectory no. Brief description of the trajectoryFrance Maghreb Sub-Sahara
N = 11086 N = 854 N = 103
1 Grammar school attendance followed by university studies 26.4 24.6 16.5
2Longer educational trajectory followed by entry into the higher the labor market segment 22.6 14.7 22.3
3Short educational trajectory followed by entry into the higher labor market segment 5.7 3.9 3.9
4Longer educational trajectory followed by entry into the precarious labor market segment 9.9 9.8 12.6
5Short educational trajectory followed by entry into the precarious labor market segment 21.2 23.4 28.2
6Short educational trajectory with long periods of unemployment and posi-tions in the precarious labor market segment 14.2 23.5 16.5
Total 100 100 100
Sources: Panel des élèves du second degré, 1995, DEPP; calculations by DIW Berlin. © DIW Berlin 2011
In France, significantly more young people with Maghreb or Sub-Saharan roots end up in the precarious labor market segment or unemployed after a short educational trajectory than do young French people without a migration background.
Part II: a seLectIoN of 2011 PUBLIcatIoNs BY the soeP teaM

47SOEP Wave Report 2011
sUccess DesPIte startING oUt at a DIsaDVaNtaGe: What heLPs secoND-GeNeratIoN MIGraNts IN fraNce aND GerMaNY?
In Germany, around 40 percent of young adults of Tur-kish origin initially end up in the precarious labor mar-ket segment (Trajectory 4) after vocational training as well. For young adults without a migration background, this figure is approximately one-third. However, 15 per-cent of migrant children still manage to advance into the higher labor market segment (Trajectory 3), as oppo-sed to 22 percent of their peers of German origin. Fur-thermore, 11 percent of the second-generation migrants choose the longer educational trajectory with universi-ty studies (Trajectory 1).
Therefore, an ethnic disadvantage can be seen in both countries—albeit at different points in young people’s lives. While it does not clearly emerge in France until the transition into the labor market, ethnic segregation in Germany becomes apparent at an early point in the education system. Vocational training in Germany fa-cilitates the transition into the labor market: here, too, no precarious, significant pattern can be seen like in France. There is, however, a cluster of young adults not in employment (Trajectory 5) in Germany only, com-prising mainly of women, who neither had work nor were looking for work throughout most of the period under study.
Young Women of Turkish Origin Cannot Draw on Their Workforce Potential in Germany
In the cluster of inactive persons, women of Turkish ori-gin in particular are overrepresented. Specific gender stereotypes might play a role here, as well as individual orientations with regard to starting a family.
This result points to the particular difficulties faced by many young women of Turkish origin and to the con-sequent unused workforce potential.
The quantitative results clearly show that although suc-cessful educational and employment trajectories for the descendants of migrants in both countries are rarer than for their French or German peers, these are still not a negligible exception. The qualitative view of the biogra-phies of young adults with a migration background who have completed a relatively successful educational or la-bor market career makes it possible to identify what fac-tors in their lives have played a role here.
factors Leading to successful careers
In both the English-speaking and German-speaking worlds, a number of studies on educational climbers with a migration background have been published over
the past few years.1 These studies verify the particu-lar role of higher educational aspirations in migrant families,2 as well as the significance of social capital in the form of social control, discipline and normative ex-pectations. On the basis of the results of our qualitati-ve study conducted in Berlin and Paris (box 2), at least three factors for the successful educational and em-ployment trajectories of second-generation migrants can be named:
• support provided by “third parties” who take on the function of a mentor,
• a move associated with a change of school or change of address from the original social milieu to a more mixed milieu, and
• the prospect of a “second chance” through the re-levant institutional schemes for acquiring qualifi-cations or entering the labor market at a later stage.
1 See Portes, A. and P. Fernández-Kelly, “No Margin for Error: Educational and Occupational Achievement among Disadvantaged Children of Immigrants” The Annals of the American Academy of Political and Social Science 620 (1), (2008): 12–36; Apitzsch, U. and M.M. Jansen, (ed.), Migration, Biographie und Geschlechterverhältnisse; (Münster: 2003); Raiser, U. Erfolgreiche Migranten im deutschen Bildungssystem - Es gibt sie doch, (Münster: 2007); Koller H.C. (ed.) (2009): Adoleszenz—Migration—Bildung, Wiesbaden; Tepecik, E. Bildungser-folge mit Migrationshintergrund: Biographien bildungserfolgreicher MigrantInnen türkischer Herkunft. (Wiesbaden: 2011).
2 One study based on quantitative data verifies the high aspirations with regard to migrant families in Germany. See Becker, B., “Bildungsaspirationen von Migranten. Determinanten und Umsetzung in Bildungsergebnisse” MZES Arbeitspapiere 137 (Mannheim: 2010).
Table 4
entry into the Labor Market between the ages of 18 and 25—Germany
Trajectory no. Brief description of the trajectoryGermany Turkey
N = 1759 N = 281
1 Grammar school attendance followed by university studies
25.1 11.4
2 Grammar school attendance followed by vocational training and entry into the labor market
14.7 6.4
3 Vocational training followed by entry into the higher labor market segment
21.8 15.3
4 Vocational training followed by entry into the precarious labor market segment
32.6 42.3
5 Short educational trajectory followed by inactivity
5.8 24.6
Total 100 100
Sources: SOEP 1984–2009; calculations by DIW Berlin.© DIW Berlin 2011
Around a quarter of young adults of Turkish origin are out of work between the ages of 18 and 25.
SOEP Wave Report 201148
this is what a 30-year-old man of Algerian origin from La Goutte d’Or (Paris) says:
“I took my baccalauréat later by going to night school and at the same time I carried on doing a lot of sport […] and also suffered an injury. And then I met an extraordinary man, an incredible osteopath. Some-one with a big heart, who said to me that I had tre-mendous abilities and he thought I could make a good osteopath. As I had passed my baccalauréat, I started training to be an osteopath. It takes a very long time, five years. […] I’m sticking at it and batt-ling on, so I’ll have a better future!”
On the other hand, young people who are stuck in a pro-blematic career frequently complain that they never had a teacher who paid them any attention.
A mentor gives young people personal backing and ma-kes them more self-confident and motivated. For in-
What these three factors have in common is that they can lead to change in difficult and crucial phases in the lives of young people and prevent “negative” drifting.
Support from Third Parties Increases Motivation
Migration researchers have discovered that individual commitment and support provided by the family is of-ten not enough for success at school and professional success. It is also important for people outside their fa-mily to intervene in the life course of young people with a migration background.1 Our study confirms this re-sult: many of the young adults we interviewed who have a higher qualification mention the support provided by a mentor when they were at school, or later, when spea-king about their professional orientation. For example,
1 See Portes, A. and Fernández-Kelly, P., “No Margin for Error” (2008) and Raiser, U. Erfolgreiche Migranten im deutschen Bildungssystem (2007).
The analyses for Germany are based on the data of the German Socio-Economic Panel (SOEP). The SOEP is a longitudinal study that has been conducted annually since 1984 and carried out on behalf of DIW Berlin by the fieldwork organization TNS Infratest Sozialfor-schung in Munich. The most recent SOEP data used for the project are from 2009.
For France, the basis for analysis of educational pa-thways was the panel des élèves du second degré 1995 (DEPP1), and the Enquête Génération 1998 conducted by Céreq2 was used for processes of entering the labor market. The studies went up to 2002 and 2005, respec-tively. Second-generation migrants were either born in Germany or France and their parents migrated, or they themselves migrated before the age of 12. A qualitative survey was conducted in addition (see box 3). Respon-dents were from the same generation also observed in the quantitative studies.
While the educational trajectories take into considera-tion the sequence between the different educational
1 Direction de l’Evaluation, de la Prospective et de la Performance.
2 Centre d’Etudes et de Recherches sur les Qualifications.
pathways from the age of 11 to 18 (inclusive), for the labor market pathways a distinction is drawn between phases of education/training, time not in gainful employment, unemployment, and employment between the ages of 18 and 25 (inclusive). As far as employment is concerned, the labor market segment is taken into consideration by taking information on employment status, pay level, and qualifications required (the latter applying only to Germany) into account. The trajecto-ries were calculated on a monthly basis. The method of sequence analysis3 is used to examine the trajec-tories. This method, used for example for analyzing DNA, makes it possible to determine the similarity of individual trajectories. The resulting matrix, indicating the distance between the individual trajectories, is subsequently subject to a hierarchical cluster analysis on the basis of Ward’s algorithm. Similar patterns are grouped using this process, and thus typical trajectories identified.
3 On the method used, see Lesnard, L., “Schedules as sequences,” Electronic International Journal of Time Use Research 1 (1) (2004): 67–91; Brüderl, J. and S. Scherer, “Methoden zur Analyse von Sequenzdaten,” Kölner Zeitschrift für Soziologie und Sozialpsychologie, Sonderheft 44 (2004): 330–347; Aisenbrey S. and A. Fasang, “New life for old ideas: The “Second Wave” of Sequence Analysis Bringing the “Course” Back into the Life Course,” Sociological Methods and Research, 38 (3) (2010): 420–462.
Box 2
Quantitative analyses: Data and Methods
Part II: a seLectIoN of 2011 PUBLIcatIoNs BY the soeP teaM
49SOEP Wave Report 2011
sUccess DesPIte startING oUt at a DIsaDVaNtaGe: What heLPs secoND-GeNeratIoN MIGraNts IN fraNce aND GerMaNY?
ty.1 Although the socio-spatial segregation in France is more pronounced than in Germany, leaving their neigh-borhood is a striking experience for many of the young adults in both countries. In many cases, this just means short trips to other districts, but what is more formative is the move to schools with a higher social and cultural mix, which are also normally in the relevant districts. This change of school may be associated with a change of address or a transition to another form of school at secondary level, in France often when students deci-de to take different subjects. Here, too, the inf luence of third parties is frequently observed. This is what a young man of Lebanese origin (20 years old) from Gro-piusstadt (Berlin) says:
“[My fiancée] helped me write my applications. She always motivated me. She said to me, ‘If you go to school in Neukölln again, where there are really only foreigners, you won’t make anything of yourself.’ She was right as well because I wanted to go to one re-ally, too. What I wanted myself, was to go to a school where I didn’t know anybody, so I could do my own thing. I don’t go to school to make friends. I go to school to get a qualification. Yes. And, well, then she took me there and that was very good—very good for me. Because I’m easily distracted from school.”
Surprisingly, many of the young adults interviewed re-port a very restricted geographic mobility over a long pe-riod of time—which sometimes continues—and that it was not until later that they discovered the world out-side their neighborhood. Frequently, they did not dare to go anywhere else, it did not occur to them to do so, or they simply did not have the opportunity. This phe-nomenon of late discovery of a world outside their own environment, which is more pronounced in France, is expressed vividly as a 19-year-old Algerian man from La Goutte d’Or recalls an almost caricature-like trip to Disneyland:
“We weren’t used to it. We were just used to figh-ting or to problems, and so on. That’s why everything seemed strange to us when we got to Disney. It was like another world, a parallel world … We were ama-zed. People were so well behaved. If someone brus-hed against you by accident, they said ‘Sorry’. I don’t know … It was like another world to us. We were sur-prised and we didn’t want to go home. […] A friend of mine was there—he’s violence incarnate. For the
1 See Keller, C.: “Strategien und Faktoren der Partizipation von Jugendlichen mit Migrationshintergrund im Blickfeld von Sozialexpert(inn)en,” Revue d’Allemagne, 41 (3) (2009): 409–431.
stance, a young woman of Palestinian origin (21 years old) from Gropiusstadt (Berlin) is quoted here:
“So, I have to say, to begin with, we’re new here—so I was really on my own, isolated. But because of my teacher, who noticed, okay, so my teacher was re-ally [said with emphasis] lovely, you know. I love her [laughs]. And she noticed I had problems and then she sent me on this course, where I also made some friends […] Then when I broke my arm and my leg, too, I saw her. And I went ice skating with her, too [laughs] and I saw her there. […] She really helped me loads. Gave me a lot of personal support. She also went to the hospital with me, visited me, gave me books to read and stuff. So I felt like I was get-ting a lot of support. You know, because she was the only one who noticed, ‘Okay, this girl needs help’. But mainly she was my class teacher.”
This young woman of Turkish origin (aged 20) from Nord-Neukölln (Berlin) reports on a similar experience with a teacher:
“So, as I said, just before I left school […], at that time, I wasn’t exactly the type that teachers would like (laughs). But when I was in elementary school, there was this one teacher I had. I’m still in touch with her. I still see her. And I still use things she taught me. Still some words... so, when I use it, I think: “Ah, I got that from her!” She’s just great. […] I often argued with her. Well, not really argued but we had differences of opinion. But now I know she’s worth her weight in gold. I know how much she’s taught me. And that maybe I wouldn’t be the same person if it wasn’t for her. She taught me a lot and, um… She was a teacher and we talked a lot about my future. And she just said ‘You could do this, you could do that’. I think I’ve got it from her this, this interest in cultures. I’ve got it from her, I think, be-cause she traveled a lot. And just—she’s a very im-portant person for me. A very important teacher.”
What is particularly interesting here is that such sup-portive people frequently come from another social and geographical environment and open doors to another world for young people.
The Experience of Other Social Milieus in Districts and Schools Has a Positive Impact
The neighborhoods in which the interviews with the young adults were conducted are characterized by an above-average share of migrants and features indicative of problems such as higher unemployment and pover-
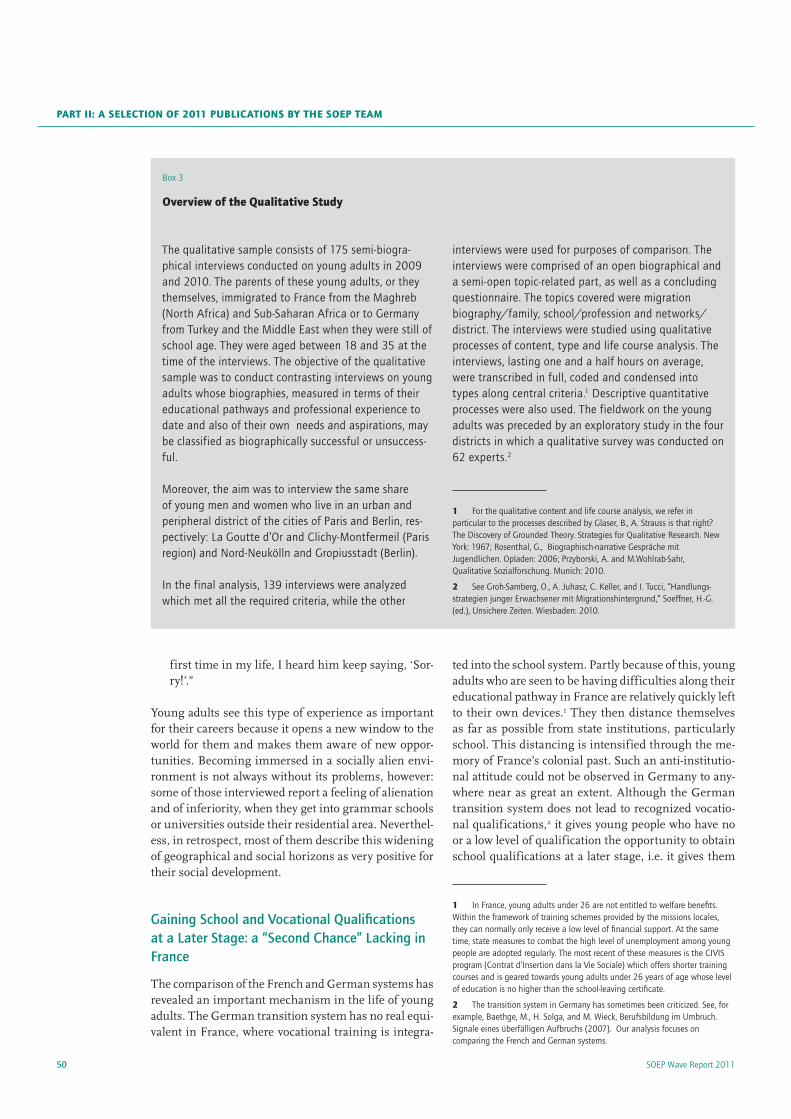
SOEP Wave Report 201150
ted into the school system. Partly because of this, young adults who are seen to be having difficulties along their educational pathway in France are relatively quickly left to their own devices.1 They then distance themselves as far as possible from state institutions, particularly school. This distancing is intensified through the me-mory of France’s colonial past. Such an anti-institutio-nal attitude could not be observed in Germany to any-where near as great an extent. Although the German transition system does not lead to recognized vocatio-nal qualifications,2 it gives young people who have no or a low level of qualification the opportunity to obtain school qualifications at a later stage, i.e. it gives them
1 In France, young adults under 26 are not entitled to welfare benefits. Within the framework of training schemes provided by the missions locales, they can normally only receive a low level of financial support. At the same time, state measures to combat the high level of unemployment among young people are adopted regularly. The most recent of these measures is the CIVIS program (Contrat d’Insertion dans la Vie Sociale) which offers shorter training courses and is geared towards young adults under 26 years of age whose level of education is no higher than the school-leaving certificate.
2 The transition system in Germany has sometimes been criticized. See, for example, Baethge, M., H. Solga, and M. Wieck, Berufsbildung im Umbruch. Signale eines überfälligen Aufbruchs (2007). Our analysis focuses on comparing the French and German systems.
first time in my life, I heard him keep saying, ‘Sor-ry!’.”
Young adults see this type of experience as important for their careers because it opens a new window to the world for them and makes them aware of new oppor-tunities. Becoming immersed in a socially alien envi-ronment is not always without its problems, however: some of those interviewed report a feeling of alienation and of inferiority, when they get into grammar schools or universities outside their residential area. Neverthel-ess, in retrospect, most of them describe this widening of geographical and social horizons as very positive for their social development.
Gaining School and Vocational Qualifications at a Later Stage: a “Second Chance” Lacking in France
The comparison of the French and German systems has revealed an important mechanism in the life of young adults. The German transition system has no real equi-valent in France, where vocational training is integra-
The qualitative sample consists of 175 semi-biogra-phical interviews conducted on young adults in 2009 and 2010. The parents of these young adults, or they themselves, immigrated to France from the Maghreb (North Africa) and Sub-Saharan Africa or to Germany from Turkey and the Middle East when they were still of school age. They were aged between 18 and 35 at the time of the interviews. The objective of the qualitative sample was to conduct contrasting interviews on young adults whose biographies, measured in terms of their educational pathways and professional experience to date and also of their own needs and aspirations, may be classified as biographically successful or unsuccess-ful.
Moreover, the aim was to interview the same share of young men and women who live in an urban and peripheral district of the cities of Paris and Berlin, res-pectively: La Goutte d’Or and Clichy-Montfermeil (Paris region) and Nord-Neukölln and Gropiusstadt (Berlin).
In the final analysis, 139 interviews were analyzed which met all the required criteria, while the other
interviews were used for purposes of comparison. The interviews were comprised of an open biographical and a semi-open topic-related part, as well as a concluding questionnaire. The topics covered were migration biography/family, school/profession and networks/district. The interviews were studied using qualitative processes of content, type and life course analysis. The interviews, lasting one and a half hours on average, were transcribed in full, coded and condensed into types along central criteria.1 Descriptive quantitative processes were also used. The fieldwork on the young adults was preceded by an exploratory study in the four districts in which a qualitative survey was conducted on 62 experts.2
1 For the qualitative content and life course analysis, we refer in particular to the processes described by Glaser, B., A. Strauss is that right? The Discovery of Grounded Theory. Strategies for Qualitative Research. New York: 1967; Rosenthal, G., Biographisch-narrative Gespräche mit Jugendlichen. Opladen: 2006; Przyborski, A. and M.Wohlrab-Sahr, Qualitative Sozialforschung. Munich: 2010.
2 See Groh-Samberg, O., A. Juhasz, C. Keller, and I. Tucci, “Handlungs-strategien junger Erwachsener mit Migrationshintergrund,” Soeffner, H.-G. (ed.), Unsichere Zeiten. Wiesbaden: 2010.
Box 3
overview of the Qualitative study
Part II: a seLectIoN of 2011 PUBLIcatIoNs BY the soeP teaM
51SOEP Wave Report 2011
sUccess DesPIte startING oUt at a DIsaDVaNtaGe: What heLPs secoND-GeNeratIoN MIGraNts IN fraNce aND GerMaNY?
a “second chance”. Thus, it stabilizes the life course in this sometimes difficult phase of self-discovery, as this example of a 19-year-old man of Lebanese origin from Berlin-Neukölln shows:
“Then I applied here. I applied to three schools, five schools, six schools, all over Berlin. Rejection, re-jection. And then here, they didn’t want to take me here, either, because of how I behave. Then I said ‘I can’t get into any school. What are you doing with me? Give me a chance!’, and so on. Then they said ‘OK. You come study here—study textiles.’ I didn’t want to do textiles. I don’t like textiles. I wanted to do social services because—it’s something I can work with better later. But it doesn’t really matter now. When I get my MSA [intermediate school-lea-ving certificate], I think it’ll be better.” (Some details changed for privacy).
The interview passage also shows the ambivalence of the transition system and the training opportunities it offers:1 although the preferences of young people are not always met and frequently they also have no clear care-er prospects, it provides a considerably better alternati-ve to them finding themselves on the street.
conclusion
In both Germany and France, young people with a mi-gration background more frequently follow precarious career paths than young adults without a migration background. Nevertheless, this report shows that the educational and employment trajectories of this popu-lation are diverse. There are advantages and disadvan-tages to be found in both education systems: it is easier for the descendants of immigrants to access academic education in France, while Germany is more success-ful at guaranteeing institutional ties for young people who are facing problems. They are given a second chan-ce through the opportunity of obtaining school quali-fications or acquiring professional skills at a later date.
The fact that—although they are pressured into the less prestigious educational pathways— young men and wo-men of Turkish and Arabic origin in Germany do not develop a distance to school institutions, as is the case in France for men and women of North African or Sub-Saharan origin, should be seen as promising. Therefore, in Germany there is an urgent need for action to allow the children of immigrants to enter higher educatio-nal trajectories or, after passing through the transition
1 In our sample, the vocational training leads to qualifications such as cook, painter/varnisher, security agent or cleaner.
system, to sandwich-course training and work experi-ence, and there is a very good chance that they will also make the most of these opportunities.
Along with the institutional infrastructures, social net-works also play a role that is not to be underestimated in setting the biographical course at an early stage of life. Through the help, for example, of a teacher or a men-tor, or also through entering another social milieu and neighborhood—for educational purposes or also due to a change of address—young people who grow up in disadvantaged and ethnically segregated districts are motivated, and encouraged to have more confidence in their own abilities. It appears that the school system and teachers can have a great impact on the life course of second-generation migrants—even outside the class-room. What is of importance here is not so much the role of educator, but the attention which a student re-ceives from a “mentor.” This attention does not neces-sarily have to come from a teacher.
Dr. Ingrid Tucci is a Research Associate at the longitudinal Socio-Economic Panel Study (SOEP) at DIW Berlin | [email protected]
Ariane Jossin is a Postdoctoral Research Fellow of Political Science at the Centre Marc Bloch, Franco-German Research Center for Social Sciences |[email protected]
Carsten Keller is a Visiting Professor of Urban and Regional Sociology at the University of Kassel; Research Associate on the Centre Marc Bloch | c.keller@ cmb.hu-berlin.de
Olaf Groh-Samberg is Junior Professor for Sociology at the University of Bremen and Scientific Coordinator of Welfare State and Social Integration at Bremen International Graduate School of Social Sciences and DIW Research Professor | [email protected]
JEL: J15, I24, J21
Keywords: Migration, integration, second generation, education, labor market, trajectories
Article first published as “Was hilft Migrantennachkommen in Frankreich und Deutschland?”, in: DIW Wochenbericht Nr. 41/2011

SOEP Wave Report 201152
Extent and Effects of Employees in Germany Forgoing Vacation Timeby Daniel D. schnitzlein
The collective pay agreement in the West German iron and steel industry of January 1979 laid the foundations for extending vacation entitlement of persons in full-time employment to 30 working days. Since January 1982, this regulation has applied to all age groups in the industry.1 Now, 30 years after the full implementa-tion of the new vacation regulation, the negotiated six weeks’ vacation entitlement is no longer an exception,2 but the norm for almost all persons in paid employment in Germany covered by collective agreements.3 What is now taken for granted by employees in Germany—six weeks of paid vacation, plus six to ten public holidays per year4—is the exception rather than the rule in interna-tional standards. Consequently, at regular intervals, we see headlines such as “Germans Take Eight Weeks Off”5 and it results in Germans being called “world champi-on vacationers” or their country an “amusement park.” Yet, although the actual vacation entitlement of Ger-man employees is high compared to international stan-dards, it does not necessarily follow that this entitlement is also in fact used.6
In order to answer the question to what extent emplo-yees in Germany take their vacation entitlement, as part
1 See Section 14, Manteltarifvertrag für die Arbeiter, Angestellten und Auszubildenden, Eisen- und Stahlindustrie Nordrhein-Westfalen (collective agreement for blue and white-collar workers and trainees in the iron and steel industry in North Rhine-Westphalia) of 6 January 1979.
2 For most employees, the number of days of paid vacation is regulated according to industry in the relevant collective agreements and it is 30 days for most industries. See Table 3.3 in: Statistisches Taschenbuch Tarifpolitik 2011, Dusseldorf: WSI-Tarifarchiv, 2011.
3 In accordance with the German Federal Vacation Act, each employee working five days a week is entitled to 20 working days of annual leave. This is the equivalent of four working weeks‘ vacation. However, this stipulation is only a minimum requirement.
4 The exact number of statutory public holidays is both calendar based and varies between different regions.
5 IW-dienst, no. 43 (October 27, 2011), 6.
6 The employer is also free to grant employees more vacation. Conversely, the employee normally decides whether to actually use the vacation entitlement.
Around 37 percent of those in paid full-time employment in Germa-ny did not claim their full vacation entitlement last year. The number of vacation days actually taken by each employee was on average three days less than the full entitlement. This equates to around twelve percent of the overall volume of vacation entitlement not being used. This figure is corroborated by data from the German Socio-Economic Panel Study (SOEP) collected by DIW Berlin together with the survey institute TNS Infratest Sozialforschung.
It has been found that younger employees use less of their vacation than older ones. Moreover, employees working for smaller compa-nies and persons who have joined a company more recently in parti-cular do not take their full vacation entitlement. Not taking vacation is linked to short-term increases in income. There is, however, also evidence that it affects quality of life.
Part II: a seLectIoN of 2011 PUBLIcatIoNs BY the soeP teaM

53SOEP Wave Report 2011
exteNt aND effects of eMPLoYees IN GerMaNY forGoING VacatIoN tIMe
of the population survey Socio-Economic Panel Study (SOEP), in the years 2000, 2005, and 2010, DIW Berlin, in cooperation with TNS Infratest, asked participants in the study detailed questions about their annual leave in the previous year (Box 1). As part of this report, detailed information about vacation entitlement and taking paid vacation in the relevant previous year is evaluated, that is, for the years 1999, 2004, and 2009.1
Vacation entitlement reported by employees below collective agreement average
The group of all persons in paid employment reported a vacation entitlement of only around 28 days for the year 2009. Approximately three percent of all emplo-yees reported they had not had any vacation entitlement at all. For full-time employees, the average vacation en-titlement was around 29 days in all three years. Since employees whose employment relationship did not be-gin until after January 1 have only pro rata entitlement to annual leave, their actual average vacation is some-what lower than the average entitlement of 30 days ac-cording to the collective agreement (Section A in Tab-le 1). Although the same legal provisions and collective
1 For a previous analysis of vacation taken by employees in Germany, see Saborowski, C., J. Schupp, and G.G. Wagner, „Urlaub in Deutschland: Erwerbstätige nutzen ihren Urlaubsanspruch oftmals nicht aus,“ Wochenbericht des DIW Berlin, no. 15 /(2004): 171–176.
labor agreement regulations formally apply to part-time employees as to full-time employees, the lower vacation entitlement of around 25 days in 1999 and 2009 and just under 24 days in 2004 can be explained by the fact that part-time employees often not only have reduced working hours, but also work fewer days per week.2 This then leads to a proportional reduction of the vacation entitlement. Apprentices report approximately 26 days vacation entitlement. Although in most cases they are employed full-time, in many collective agreements the vacation entitlement varies according to age and is nor-mally lower for younger people than for other employees.
As is to be expected, no major shifts in vacation entit-lement in the last ten years are evident from the sur-vey data. The lack of vacation entitlement is more com-mon among part-time than full-time employees. While around one percent of those working full-time report ha-ving no vacation entitlement at all, the corresponding figure for part-time employees was around eleven per-cent for 1999 and nine percent for 2009.
2 It should also be taken into account that marginally employed or temporary workers often have no entitlement to paid vacation.
Table 1
Paid Vacation by employment form
1999 2004 2009
A: Average paid vacation by employment form (in days)Full-time employees 29.1 29.0 29.0Part-time employees 24.9 23.8 25.0
Trainees, apprentices 25.8 26.1 25.8Total 28.2 27.8 28.0
B: Share of employees with no paid vacation in percentFull-time employees 1.0 1.0 0.9Part-time employees 11.4 11.9 9.0Trainees, apprentices 2.7 2.7 2.6Total 2.9 3.2 2.7
Statistics on persons in paid employment for the years 1999, 2004, and 2009. The self-employed, freelancers, teachers, and those in marginal or irregular em-ployment are not included. Data are weighted for each year using extrapolation factors.Source: SOEPv27, calculations by DIW Berlin.
© DIW Berlin 2012
Full-time employees have around 29 days of paid vacation on average.
Table 2
Vacation taken by employment form
1999 2004 2009
A: Number of days of vacation takenFull-time employees 25.9 25.7 25.9Part-time employees 21.6 20.7 22.1Trainees, apprentices 19.1 19.0 19.6Total 24.8 24.3 24.8
B: Average number of unused vacation daysFull-time employees 3.2 3.3 3.1Part-time employees 3.2 3.0 3.0Trainees, apprentices 6.8 7.1 6.2Total 3.4 3.5 3.2
C: Share of employees with unused vacation days in percentFull-time employees 33.6 36.5 36.8Part-time employees 28.7 31.2 31.6Trainees, apprentices 44.8 50.5 45.6Total 33.4 36.3 36.2
Statistics on persons in paid employment for the years 1999, 2004, and 2009. The self-employed, freelancers, teachers, and those in marginal or irregular em-ployment are not included. Data are weighted for each year using extrapolation factors. Source: SOEPv27, calculations by DIW Berlin.
© DIW Berlin 2012
Full-time and part-time employees have about three days of unused vacation per year on average.

SOEP Wave Report 201154
full Vacation entitlement Not Used
Patterns of taking vacation also remained largely cons-tant over the period observed at 25 days for all paid em-ployees in 2009. Extrapolated figures show that around twelve percent of employees’ overall vacation entitle-ment was not used.1
1 Saborowski et al., „Urlaub in Deutschland“ report that seven percent of the overall vacation entitlement for 1999 was not used. The difference in these figures is essentially explained by a stronger focus on those in paid employment (not including teachers) in the present report.
Those in full-time employment take just under 26 days of vacation on average. Part-time employees f luctuate between just under 21 and 22 days of vacation, while ap-prentices take approximately 19 days of vacation on ave-rage in all three years (Section A in Table 2). Looking at the balance of vacation entitlement and vacation ac-tually taken, it can be seen that full-time and part-time employees have just over three unused days of vacation on average per year, while apprentices have seven days of unused vacation on average by the end of the year (Section B in Table 2). Accordingly, at 45 to 50 percent, the share of apprentices with a positive balance of vaca-
As part of the longitudinal German Socio-Economic Panel Study (SOEP), in cooperation with the survey TNS Infratest Sozialforschung, DIW Berlin has collected data on the social and economic situation of private households for West Germany since 1984 and for East Germany since 1990. Currently, over 20,000 adults in over 11,000 households are surveyed annually.1 Next to a set of core questions that are repeated every year, a number of additional questions on selected topics are included each year. Within this framework, questions on vacation entitlement and use of this were asked in 2000, 2005, und 2010. The responses to these questi-ons form the basis for the present analysis. The relevant selected questions are as follows:
20002:
• How many days of vacation did you take last year? Count
work days only. If you don't know the exact number, please
estimate!
• Possible answers: number of days/Haven't taken any
vacation time
• How many vacation days can you take according to your
contract?
• Possible answers: number of days/I have no contractually
specified vacation time
1 Wagner, G.G., J. Göbel, P. Krause, R. Pischner, and I. Sieber, "Das Sozio-oekonomische Panel (SOEP): Multidisziplinäres Haushaltspanel und Kohortenstudie für Deutschland – Eine Einführung (für neue Datennutzer) mit einem Ausblick (für erfahrene Anwender)," AStA Wirtschafts- und Sozialstatistisches Archiv, no. 2, 2008.
2 For the full English version of the individual questionnaire for 2000, see http://www.diw.de/documents/dokumentenarchiv/17/diw_01.c.38991.de/fr_personen_e.409829.pdf.
2005/20103:
• How many paid vacation days do you receive per year?
• Possible answers: number of days/I don't get any paid
vacation
• How many days of paid vacation did you take last year? If
you don't know exactly, please estimate!
• Possible answers: number of days/I didn't get any paid
vacation
The unused vacation days are calculated in the report as the difference between the specified vacation entitlement and the reported number of vacation days actually taken. If this difference is greater than zero, full vacation entitlement has not been used.
Only data of persons in paid employment are evaluated in the analyses because in contrast to the self-employed and freelancers, they have a clearly defined vacation entitlement. Also, data of teachers were not considered in the analyses, since for this group we cannot rule out frequent misinterpretations of vacation entitlement or vacation time and school holidays. Moreover, teachers are not free to choose when they take vacations but are tied to the school holidays.
3 For the full English version of the individual questionnaire for 2005, see http://www.diw.de/documents/dokumentenarchiv/17/diw_01.c.42702.de/personen_en_2005.pdf. For the full English version of the individual questionnaire for 2010, see http://www.diw.de/documents/dokumentenarchiv/17/diw_01.c.369775.de/soepfrabo_personen_2010_en.pdf.
Box 1
Questions on Paid Vacation in the Previous Year
Part II: a seLectIoN of 2011 PUBLIcatIoNs BY the soeP teaM

55SOEP Wave Report 2011
exteNt aND effects of eMPLoYees IN GerMaNY forGoING VacatIoN tIMe
tion entitlement and vacation days is significantly gre-ater than in the other two groups. As regards full-time employees, 37 percent of respondents have unused va-cation days from 2009.
Vacation entitlement Increases with occupational status
Both entitlement to leave and the number of days actu-ally taken vary with occupational status. For instance, an unskilled worker has a vacation entitlement of 25.3 days in 2009, while a supervisor has a vacation entitle-ment of 29.1 days (Table 3). The highest vacation entit-lement in all three observation years is recorded by seni-or civil servants with around 31 days in 1999 and 2004, and 32 days in 2009.1 Those who have the lowest entit-lement to vacation throughout are trainees and interns with around 19 days in 2009. Since interns in particu-lar frequently only have short-term employment relati-onships, they often have no vacation entitlement at all. Overall, it can be seen for all years that a higher occu-pational status is also linked to a higher entitlement to annual leave (Table 3). Regarding the number of unused vacation days, the correlation is no longer clear, howe-ver, and there are no distinct patterns related to speci-fic occupations (Table 3).
Younger employees or those New to a company Most Likely Not to take Vacation
Table 4 shows a breakdown—according to different so-cio-demographic characteristics—of the number of days of unused vacation that can either be carried over to the next year or expire. There are clear differences between the various age groups. While 15 to 24-year-olds have the highest rate of unused vacation days, the oldest emplo-yees (group aged 55 or over) have the fewest days of un-used vacation (Table 4). These findings are confirmed by the high number of unused days of vacation in the group of apprentices. A possible explanation for this be-havior is that younger people in particular see their pre-sence at work as an investment in their human capital and consequently take less vacation than older emplo-
1 This may be, inter alia, because they are entitled to additional paid leave as well as their vacation entitlement.
yees.2 Clear differences can also be seen for the various categories of length of service with the company (Tab-le 4).3 Those who have been with a company for less than six months have the highest number of days of unused
2 For an investment decision to be made, the costs of the investment must be weighed up against the gains. In this case, the costs consist of forgoing a day of vacation, while the gains are a higher income in the future. Since the gains from the human capital investment depend on the number of years still to be worked, the overall gains from the investment are higher for younger people than for older employees. For a similar mechanism with regard to unpaid additional work/overtime, see Pannenberg, M., „Long-Term Effects of Unpaid Overtime: Evidence for West-Germany,“ Scottish Journal of Political Economy, no. 52 (2) (2005): 177–193.
3 Respondents are asked about length of service with a company at the time of interview, while questions about annual leave refer to the previous year. Therefore, it cannot be ruled out that individual respondents who have been with a company for less than one year are reporting unused vacation days from their previous employment. However, over half of the interviews take place in the first quarter of a year. (See TNS Infratest Sozialforschung, „SOEP 2010 – Me-thodenbericht zum Befragungsjahr 2010 (Welle 27) des Sozio-oekonomischen Panels,“ SOEP Survey Papers, no. 75, series B. (2011) DIW Berlin.
Table 3
Number of Days of Paid Vacation and Days taken by Profession
1999 2004 2009
Paid vacation
Unused days
Paid vacation
Unused days
Paid vacation
Unused days
Industrial/technical apprentices 26.1 7.0 26.3 7.7 25.0 6.2Commercial trainees 25.7 6.7 26.8 6.9 27.2 6.3Unpaid trainees, interns 20.2 3.6 14.2 5.3 (18.7) (4.6)
Unskilled workers 23.4 4.1 22.7 3.4 25.3 5.9Semi-skilled workers 27.6 3.7 27.9 3.3 26.8 2.5Trained and skilled workers 28.5 2.6 28.3 3.0 28.2 3.1Supervisors and team leaders 29.3 3.4 29.4 3.2 29.1 3.2Master craftsmen, site managers 28.4 3.9 28.4 5.2 26.8 3.6Industrial master craftsmen and factory supervisors
29.1 4.0 29.9 1.8 30.8 1.8
Salaried employees without qualifications 24.9 3.0 23.8 2.7 23.4 4.0Salaried employees in low-qualified positions 28.1 3.5 27.1 3.0 27.7 2.9Salaried employees in qualified positions 28.8 2.9 28.4 2.9 28.7 2.5Salaried employees in highly qualified positions, managers 29.6 3.3 29.3 4.0 29.0 3.4Salaried employees with extensive management responsibilities 30.4 7.5 27.5 5.2 28.7 4.6
Civil servants in the sub-clerical or clerical service class 29.6 2.7 29.6 2.3 29.0 2.1Civil servants in the executive or administrative class 29.8 2.3 30.1 2.9 30.2 3.4Senior civil servants 30.9 1.6 30.7 3.6 32.0 5.2
Statistics on persons in paid employment for the years 1999, 2004, and 2009. The self-employed, freelan-cers, teachers, and those in marginal or irregular employment are not included. Data are weighted for each year using extrapolation factors. Values in brackets are based on fewer than 30 observations. Source: SOEPv27, calculations by DIW Berlin.
© DIW Berlin 2012
The higher the occupational status, the higher the vacation entitlement normally is.

SOEP Wave Report 201156
vacation. This is not surprising since many companies do not allow vacation to be taken during the probatio-nary period. For employees with up to a year of service with the company, the level of unused leave is still si-milar. Here, too, it may be assumed that employees see their presence at the company as an investment in com-pany-specific human capital and by forgoing vacation want to send a message to their superiors that they are particularly highly motivated.
the Bigger the company, the More Likely It Is that Vacation Is taken
Other differences are clear for the various categories of company size. For instance, the level of leave taken in-creases in all three years in proportion to company size. On the one hand, this may be due to the fact that emplo-yees working for small companies identify more stron-gly with their company and consequently take less va-cation. In addition, it is more problematic to organize
vacation cover in small companies. Therefore, it is also possible that employees forgo their vacation so as not to jeopardize company operations.1
The information provided by respondents allows us to estimate a statistical model of vacation days taken. This regression model shows that an increase in the vacation entitlement by one extra day corresponds to an average increase of 0.73 days of vacation actually taken (column 1 in Table 5). Here, the effects of the socio-democratic characteristics of the respondents and the company at-tributes are already excluded. Using a fixed effects mo-del (Box 2), it is also possible to deduct the effect of un-observed time-invariant characteristics such as gender, age, or education of employees (column 2 in Table 5). In this specification, an increase in the vacation entitle-ment by one extra day only leads to a further 0.69 days of leave taken.
effects of Unused Vacation Days on satisfaction, absenteeism, and salary
The findings show that a large percentage of employees do not use their full entitlement of annual leave. Over-all, the share of unused days of vacation entitlement is also significantly large at twelve percent. Although in-dividual respondents are not asked directly about their motives for forgoing vacation in the SOEP, it is possib-
1 See Saborowski et al., „Urlaub in Deutschland.“
Table 4
Number of Unused Vacation Days according to socio-Demographic characteristics
1999 2004 2009
sexMen 3.4 3.7 3.3Women 3.4 3.1 3.2
age15 to 24 5.7 6.1 5.525 to 34 4.0 4.2 4.035 to 44 3.0 3.0 2.945 to 54 2.8 2.9 2.6over 55 2.4 2.5 2.6
children in householdno 3.3 3.4 3.2yes 3.6 3.5 3.4
Length of service with com-panyUp to 6 months 11.0 11.8 13.46 to 12 months 9.3 12.4 9.81 to 2 years 3.2 3.3 2.62 to 5 years 2.0 2.4 2.5Over 5 years 2.0 2.2 1.9
company sizeLess than 20 employees 4.6 4.5 4.020 to 200 employees 3.7 3.9 3.8200 to 2,000 employees 2.7 2.3 2.5Over 2,000 employees 2.3 2.7 2.6
Statistics on persons in paid employment for the years 1999, 2004, and 2009. The self-employed, freelancers, teachers, and those in marginal or irregular em-ployment are not included. Data are weighted for each year using extrapolation factors.Source: SOEPv27, calculations by DIW Berlin.
© DIW Berlin 2012
Older employees have the lowest number of unused vacation days, and younger employees the highest.
Table 5
Model of Vacation Days taken
Number of vacation days taken
OLS Fixed effects regression
Number of days of paid vacation
Coefficient 0.73 0.69
Significance 0.00*** 0.00***
Only the coefficient of the variable "number of days of paid vacation" is shown. In the models, we also controlled for days of absence due to illness in the previous year, gender, age, education, marital status, children in the household, nationali-ty, income position, number of hours worked, career change in the previous year, length of service with company, region, occupation, company size, employment status, regional unemployment rate (federal state) and industry. Individual fixed effects are also controlled for in the fixed effects model. The self-employed, freelancers, teachers and those in marginal or irregular employment are not included in the sample.*** significant at the 1 percent level; ** significant at the 5 percent level; * significant at the 10 percent level. Source: SOEPv27, calculations by DIW Berlin.
© DIW Berlin 2012
If paid vacation is increased by one day, only 0.69 percent of this is also actually taken on average.
Part II: a seLectIoN of 2011 PUBLIcatIoNs BY the soeP teaM
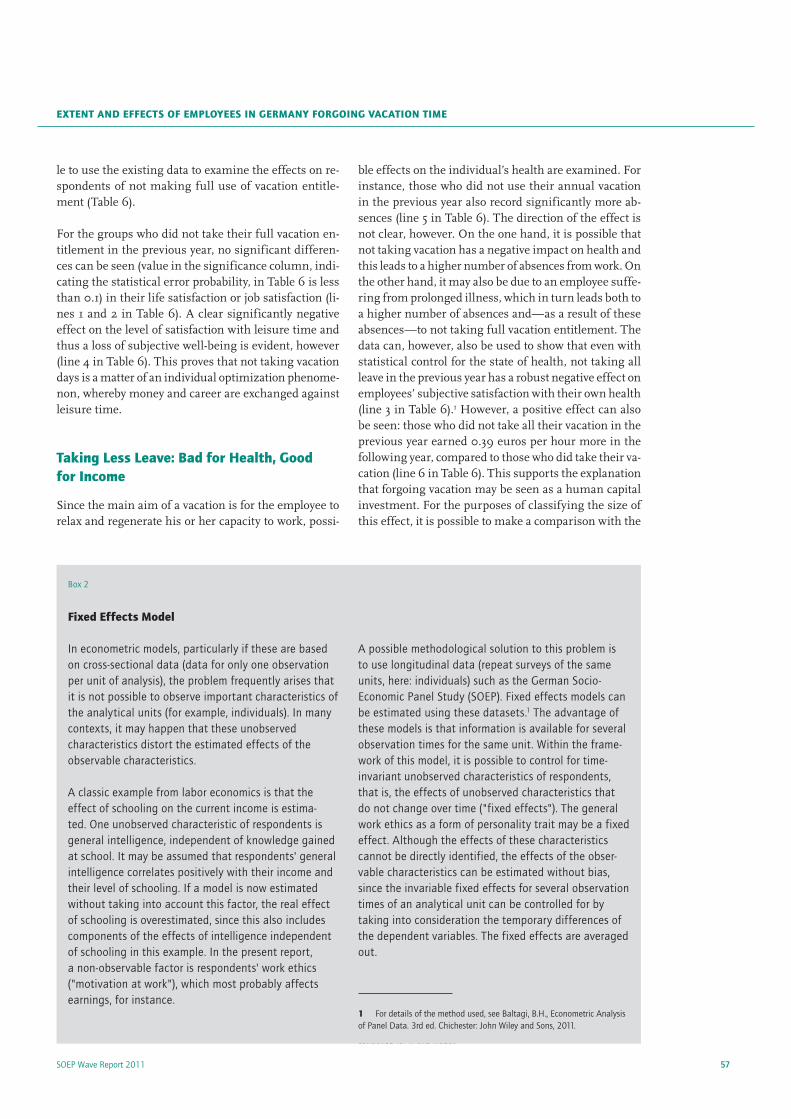
57SOEP Wave Report 2011
exteNt aND effects of eMPLoYees IN GerMaNY forGoING VacatIoN tIMe
le to use the existing data to examine the effects on re-spondents of not making full use of vacation entitle-ment (Table 6).
For the groups who did not take their full vacation en-titlement in the previous year, no significant differen-ces can be seen (value in the significance column, indi-cating the statistical error probability, in Table 6 is less than 0.1) in their life satisfaction or job satisfaction (li-nes 1 and 2 in Table 6). A clear significantly negative effect on the level of satisfaction with leisure time and thus a loss of subjective well-being is evident, however (line 4 in Table 6). This proves that not taking vacation days is a matter of an individual optimization phenome-non, whereby money and career are exchanged against leisure time.
taking Less Leave: Bad for health, Good for Income
Since the main aim of a vacation is for the employee to relax and regenerate his or her capacity to work, possi-
ble effects on the individual’s health are examined. For instance, those who did not use their annual vacation in the previous year also record significantly more ab-sences (line 5 in Table 6). The direction of the effect is not clear, however. On the one hand, it is possible that not taking vacation has a negative impact on health and this leads to a higher number of absences from work. On the other hand, it may also be due to an employee suffe-ring from prolonged illness, which in turn leads both to a higher number of absences and—as a result of these absences—to not taking full vacation entitlement. The data can, however, also be used to show that even with statistical control for the state of health, not taking all leave in the previous year has a robust negative effect on employees’ subjective satisfaction with their own health (line 3 in Table 6).1 However, a positive effect can also be seen: those who did not take all their vacation in the previous year earned 0.39 euros per hour more in the following year, compared to those who did take their va-cation (line 6 in Table 6). This supports the explanation that forgoing vacation may be seen as a human capital investment. For the purposes of classifying the size of this effect, it is possible to make a comparison with the
1 The number of days of absence in the previous year has already been controlled for in this model.
Box 2
fixed effects Model
In econometric models, particularly if these are based on cross-sectional data (data for only one observation per unit of analysis), the problem frequently arises that it is not possible to observe important characteristics of the analytical units (for example, individuals). In many contexts, it may happen that these unobserved characteristics distort the estimated effects of the observable characteristics.
A classic example from labor economics is that the effect of schooling on the current income is estima-ted. One unobserved characteristic of respondents is general intelligence, independent of knowledge gained at school. It may be assumed that respondents' general intelligence correlates positively with their income and their level of schooling. If a model is now estimated without taking into account this factor, the real effect of schooling is overestimated, since this also includes components of the effects of intelligence independent of schooling in this example. In the present report, a non-observable factor is respondents' work ethics ("motivation at work"), which most probably affects earnings, for instance.
A possible methodological solution to this problem is to use longitudinal data (repeat surveys of the same units, here: individuals) such as the German Socio-Economic Panel Study (SOEP). Fixed effects models can be estimated using these datasets.1 The advantage of these models is that information is available for several observation times for the same unit. Within the frame-work of this model, it is possible to control for time-invariant unobserved characteristics of respondents, that is, the effects of unobserved characteristics that do not change over time ("fixed effects"). The general work ethics as a form of personality trait may be a fixed effect. Although the effects of these characteristics cannot be directly identified, the effects of the obser-vable characteristics can be estimated without bias, since the invariable fixed effects for several observation times of an analytical unit can be controlled for by taking into consideration the temporary differences of the dependent variables. The fixed effects are averaged out.
1 For details of the method used, see Baltagi, B.H., Econometric Analysis of Panel Data. 3rd ed. Chichester: John Wiley and Sons, 2011.

SOEP Wave Report 201158
average gross hourly earnings of the respondents. For the group examined here, this was 14.1 euros in 2010. Thus, 0.39 euros corresponds to 2.8 percent of the ave-rage hourly earnings.1
conclusion
Analyses of the SOEP survey data confirm the gene-rally high vacation entitlement of German employees. At the same time, it has been found that up to 37 per-cent of people in full-time employment do not take their full annual leave. Particularly younger people, emplo-yees in smaller companies, and those who have joined a company more recently do not use their full vacation entitlement. The consequences of not making full use of leave are, on the one hand, a significant deterioration of satisfaction with leisure time and health, combined with an increase in absences from work due to illness and, on the other hand, a significant salary increase. The findings lead us to conclude that even if not taking va-
1 Here, too, the effects of the socio-demographic characteristics of the respondents, company attributes, and time-invariant characteristics of the respondents (for example, work ethics, skills) are already controlled for in all models (see note below Table 6).
cation in the short term is linked to better career pros-pects and higher earnings, it also has the effect of im-pairing quality of life.
Daniel D. Schnitzlein is a Research Associate at the longitudinal German Socio-Economic Panel Study (SOEP) at DIW Berlin | [email protected]
JEL: J63, J22, J24 Keywords: Vacation, SOEP, labor supply
Article first published as “Umfang und Folgen der Nichtinanspruchnahme von Urlaub in Deutschland”, in: DIW Wochenbericht Nr. 51/52/2011
Table 6
effects of Not taking VacationFindings from the Fixed Effects Regressions
Vacation not Taken in the Previous Year
Coefficient Significance
Life satisfaction –0.05 0.12
Job satisfaction –0.01 0.85
Health satisfaction –0.06 0.09*
Leisure time satisfaction –0.14 0.00***
Absence (in days) 5.82 0.00***
Hourly wage1 0.39 0.03**
Only the coefficient of the variable "vacation not taken last year" is shown. In the models, we also controlled for days of absence due to illness in the previous year, gender, age, education, marital status, children in the household, nationality, income position, number of hours worked, career change in the previous year, length of service with company, region, occupation, company size, employment status, regional unemployment rate (federal state), industry, and individual fixed effects. Exceptions: the number of days of absence is not controlled for in the model used to explain absenteeism and the income position is not controlled for in the model used to explain hourly earnings. The self-employed, free-lancers, teachers and those in marginal or irregular employment are not included in the sample.*** significant at the 1 percent level; ** significant at the 5 percent level; * significant at the 10 percent level.1 Only those with hourly earnings of over 3.5 euros (at 2010 levels) are taken into account in the income regression. Source: SOEPv27; calculations by DIW Berlin.
© DIW Berlin 2012
Not taking annual leave has a negative effect on the quality of life, but a positive effect on hourly earnings.
Part II: a seLectIoN of 2011 PUBLIcatIoNs BY the soeP teaM

59SOEP Wave Report 2011
TNS Infratest Sozialforschung already had a long his-tory of successful data collection projects in the field of (complex) social surveys even before taking on the SOEP survey. The general organization and particu-larly the institutionalization of a separate research unit for SOEP at TNS Infratest Sozialforschung further un-derscore the survey institute’s commitment to provi-ding outstanding qualitative and quantitative resources for the SOEP and ensuring a project infrastructure that is unmatched among other social surveys in Germany. This commitment is manifest for example in the provi-sion of resources by TNS Infratest for managing a total of 100 interviewers who work exclusively for the SOEP conducting face-to-face PAPI interviews.
Since its beginning in the early 1980s, the SOEP has grown not only in sample size but also in “internal” complexity. Over the years, various new refreshment samples have been added to compensate for panel mor-tality and to cover important new subpopulations, re-sulting in significant quantitative increases in samp-le size. In addition to the quantitative growth in vari-ous subsamples, the SOEP has witnessed impressive qualitative growth: new questionnaires and other sur-vey instruments (like cognitive tests and choice experi-ments) have been integrated into the SOEP, adding up to a large number of innovations, particularly over the last decade. Thanks to the quantitative and qualitative growth of the SOEP study and its strong infrastructures in Berlin and Munich, the SOEP project and its general governance structure are now being used for a variety of “sub-studies,“ including the core panel “Living in Ger-many” (the phrase commonly used in all the commu-nications with interviewers and respondents) but also “Families in Germany,“ a new longitudinal household panel survey established in 2010 as a result of a general evaluation of family polices commissioned by two fede-ral ministries. In addition, an annual “pretest survey” with approximately 1,000 respondents and various “re-lated” or at least “partly SOEP-related” studies are con-ducted by TNS Infratest on behalf of the SOEP division
foreword: soeP at tNs Infratest
TNS Infratest Sozialforschung (Social Research) has been responsible for data collection since the first wave of the German Socio-Economic Panel (SOEP) in 1984. Within a special research unit of TNS Infratest Sozialforschung in Munich, a total of 18 researchers, project mana-gers, data editing officers and support staff are currently involved in the various processes and stages of data collection and editing. In addition to the SOEP unit at TNS Infratest Sozialforschung, mem-bers of the various central service units of TNS Infratest—such as the “Face-to-face Production Line,“ “Data Processing,” and the “Applied Marketing Science” department—are involved in various special pro-ject tasks. The services provided by these central units cover tasks like CAPI scripting, fieldwork management and weighting. Finally, more than 500 of TNS Infratest’s interviewers are involved in the fieldwork for each panel wave, ensuring that sufficient face-to-face resources are available for this extensive and complex data gathe-ring process in a regionally extremely dispersed panel sample.
Part III: Summary Report SOEP Fieldwork in 2011tNs Infratest sozialforschung
Nico a. siegel simon huber anne Bohlender

SOEP Wave Report 201160
Part III: sUMMarY rePort soeP fIeLDWorK IN 2011
at the DIW Berlin using all major modes of data coll-ection and covering a wide range of innovative survey approaches for sampling and data collection (including biomarkers, central location studies, etc.).
About This ReportThis report will focus exclusively on the various aspects of fieldwork for the 2011 wave of “Living in Germany.” Hence it is restricted to the various longitudinal sub-samples and the refreshment sample of the “SOEP main sample”, and it also provides a concise summary of the third wave of sample I. Sample I was launched in 2009 and represents the “base sample” for the new “SOEP in-novation sample,“ which was officially launched in 2011 and will incorporate a mixture of various sampling me-thods over the coming years. The structure of this re-port ref lects the distinction between the main sample system (Section I) and the SOEP IS (Section II).
Overview
German socio-economic Panel survey
THE GERMAN SOCIO-ECONOMIC PANEL SURVEY: SOEP
Living in Germany Families in Germany
Special ad hoc surveys for Living in Germany
+ “SOEP related studies” + “partly SOEP associated
projects”
MAIN SAMPLE (SYSTEM) SOEP-IS
Longitudinal Samples A – H Refreshment Sample J Longitudinal Sample I
Section I Section II
Not covered in this report Not covered in this report
Chapter 1 Chapter 2
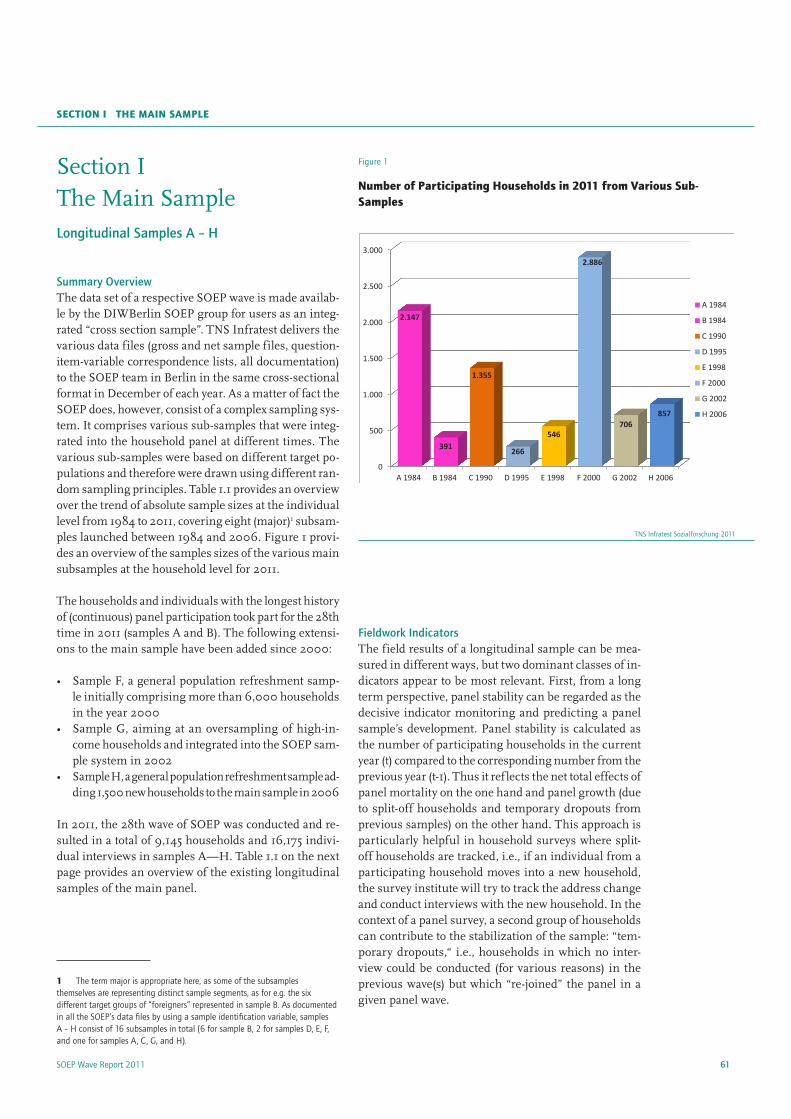
61SOEP Wave Report 2011
sectIoN I the MaIN saMPLe
Fieldwork IndicatorsThe field results of a longitudinal sample can be mea-sured in different ways, but two dominant classes of in-dicators appear to be most relevant. First, from a long term perspective, panel stability can be regarded as the decisive indicator monitoring and predicting a panel sample’s development. Panel stability is calculated as the number of participating households in the current year (t) compared to the corresponding number from the previous year (t-1). Thus it ref lects the net total effects of panel mortality on the one hand and panel growth (due to split-off households and temporary dropouts from previous samples) on the other hand. This approach is particularly helpful in household surveys where split-off households are tracked, i.e., if an individual from a participating household moves into a new household, the survey institute will try to track the address change and conduct interviews with the new household. In the context of a panel survey, a second group of households can contribute to the stabilization of the sample: “tem-porary dropouts,“ i.e., households in which no inter-view could be conducted (for various reasons) in the previous wave(s) but which “re-joined” the panel in a given panel wave.
Section I The Main SampleLongitudinal Samples A – H
Summary OverviewThe data set of a respective SOEP wave is made availab-le by the DIWBerlin SOEP group for users as an integ-rated “cross section sample”. TNS Infratest delivers the various data files (gross and net sample files, question-item-variable correspondence lists, all documentation) to the SOEP team in Berlin in the same cross-sectional format in December of each year. As a matter of fact the SOEP does, however, consist of a complex sampling sys-tem. It comprises various sub-samples that were integ-rated into the household panel at different times. The various sub-samples were based on different target po-pulations and therefore were drawn using different ran-dom sampling principles. Table 1.1 provides an overview over the trend of absolute sample sizes at the individual level from 1984 to 2011, covering eight (major)1 subsam-ples launched between 1984 and 2006. Figure 1 provi-des an overview of the samples sizes of the various main subsamples at the household level for 2011.
The households and individuals with the longest history of (continuous) panel participation took part for the 28th time in 2011 (samples A and B). The following extensi-ons to the main sample have been added since 2000:
• Sample F, a general population refreshment samp-le initially comprising more than 6,000 households in the year 2000
• Sample G, aiming at an oversampling of high-in-come households and integrated into the SOEP sam-ple system in 2002
• Sample H, a general population refreshment sample ad-ding 1,500 new households to the main sample in 2006
In 2011, the 28th wave of SOEP was conducted and re-sulted in a total of 9,145 households and 16,175 indivi-dual interviews in samples A—H. Table 1.1 on the next page provides an overview of the existing longitudinal samples of the main panel.
1 The term major is appropriate here, as some of the subsamples themselves are representing distinct sample segments, as for e.g. the six different target groups of “foreigners” represented in sample B. As documented in all the SOEP’s data files by using a sample identification variable, samples A – H consist of 16 subsamples in total (6 for sample B, 2 for samples D, E, F, and one for samples A, C, G, and H).
Figure 1
Number of Participating households in 2011 from Various sub-samples
0
500
1.000
1.500
2.000
2.500
3.000
A 1984 B 1984 C 1990 D 1995 E 1998 F 2000 G 2002 H 2006
2.147
391
1.355
266
546
2.886
706 857
A 1984
B 1984
C 1990
D 1995
E 1998
F 2000
G 2002
H 2006
TNS Infratest Sozialforschung 2011

SOEP Wave Report 201162
Part III: sUMMarY rePort soeP fIeLDWorK IN 2011
Tabl
e 1.
1
soeP
sub
sam
ples
198
4-2
011
Sam
ple
Year
’84
’90
’95
’98
’00
’02
’06
’07
’08
’09
’10
‘11
A“S
OEP
Wes
t” (g
ener
al p
opul
atio
n sa
mpl
e)1
712
1517
1923
2425
2627
28
BM
ain
grou
ps o
f for
eign
nat
iona
litie
s1
712
1517
1923
2425
2627
28
C“S
OEP
Eas
t” g
ener
al p
opul
atio
n sa
mpl
e G
DR
1990
-1
69
1113
1718
1920
2122
DIm
mig
ratio
n sa
mpl
e-
-1
46
812
1314
1516
17
ERe
fresh
men
t sam
ple
1998
(gen
eral
pop
ulat
ion)
--
-1
35
910
1112
1314
FRe
fresh
men
t sam
ple
(gen
eral
pop
ulat
ion)
--
--
13
78
910
1112
GH
igh
inco
me
sam
ple
--
--
-1
56
78
910
HRe
fresh
men
t sam
ple
2006
(gen
eral
pop
ulat
ion)
--
--
--
12
34
56
Indi
vidu
al in
terv
iew
s pe
r sam
ple
’84
’90
’95
’98
’00
’02
’06
’07
’08
’09
’10
‘11
A+B
12,2
399,
518
8,79
88,
145
7,62
37,1
756,
203
5,96
15,
626
5,19
64,
790
4,54
1
C-
4,45
33,
892
3,73
03,
687
3,46
63,
165
3,06
72,
892
2,76
92,
559
2,39
2
D-
-1,
078
885
837
780
684
658
602
565
488
461
E-
--
1,92
31,
549
1,37
31,1
991,1
451,
071
1,02
497
896
1
F-
--
-10
,886
8,42
76,
997
6,64
26,
276
5,82
45,
316
4,98
4
G-
--
--
2,22
21,
801
1,68
21,
574
1,48
71,
438
1,35
8
H-
--
--
-2,
616
2,07
71,
904
1,737
1,58
71,
478
Tota
l A –
H-
--
--
-22
,665
21,2
3219
,945
18,6
0217
,156
16,17
5
Tota
l12
,239
13,9
7113
,768
14,6
9224
,582
23,4
4322
,665
21,2
3219
,945
18,6
0217
,156
16,17
5
TNS
Infra
test
Soz
ialfo
rsch
ung
2011
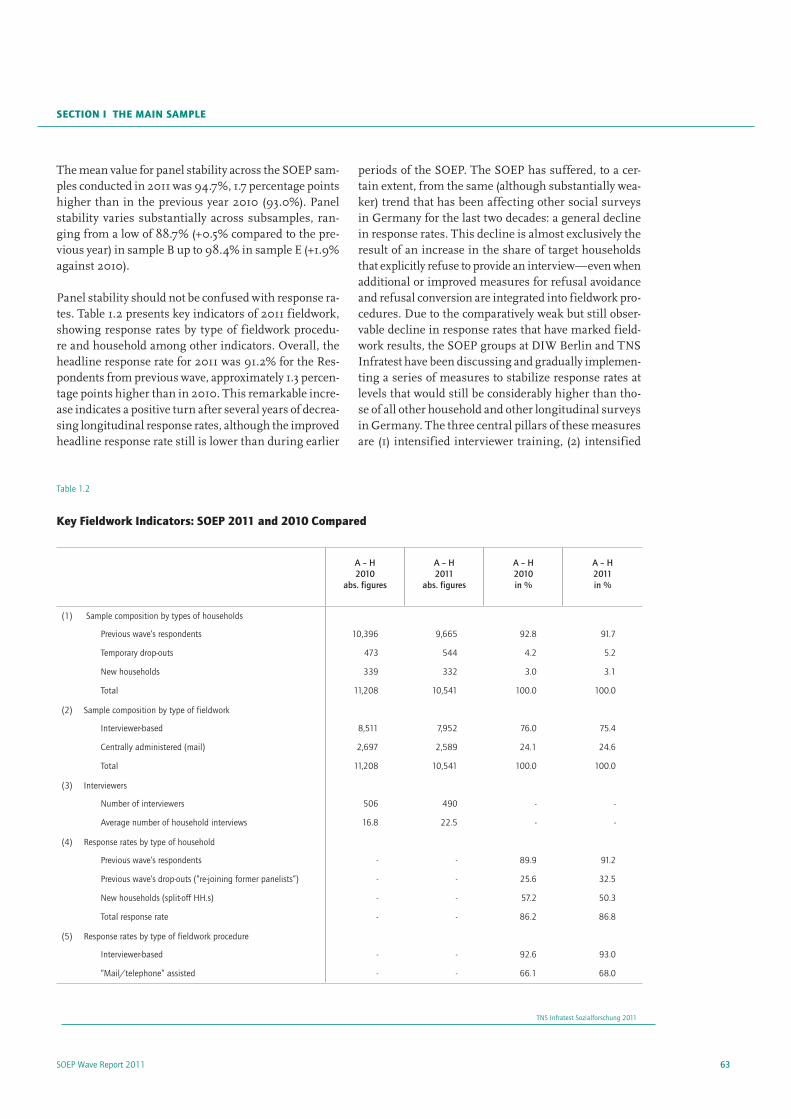
63SOEP Wave Report 2011
sectIoN I the MaIN saMPLe
periods of the SOEP. The SOEP has suffered, to a cer-tain extent, from the same (although substantially wea-ker) trend that has been affecting other social surveys in Germany for the last two decades: a general decline in response rates. This decline is almost exclusively the result of an increase in the share of target households that explicitly refuse to provide an interview—even when additional or improved measures for refusal avoidance and refusal conversion are integrated into fieldwork pro-cedures. Due to the comparatively weak but still obser-vable decline in response rates that have marked field-work results, the SOEP groups at DIW Berlin and TNS Infratest have been discussing and gradually implemen-ting a series of measures to stabilize response rates at levels that would still be considerably higher than tho-se of all other household and other longitudinal surveys in Germany. The three central pillars of these measures are (1) intensified interviewer training, (2) intensified
The mean value for panel stability across the SOEP sam-ples conducted in 2011 was 94.7%, 1.7 percentage points higher than in the previous year 2010 (93.0%). Panel stability varies substantially across subsamples, ran-ging from a low of 88.7% (+0.5% compared to the pre-vious year) in sample B up to 98.4% in sample E (+1.9% against 2010).
Panel stability should not be confused with response ra-tes. Table 1.2 presents key indicators of 2011 fieldwork, showing response rates by type of fieldwork procedu-re and household among other indicators. Overall, the headline response rate for 2011 was 91.2% for the Res-pondents from previous wave, approximately 1.3 percen-tage points higher than in 2010. This remarkable incre-ase indicates a positive turn after several years of decrea-sing longitudinal response rates, although the improved headline response rate still is lower than during earlier
Table 1.2
Key fieldwork Indicators: soeP 2011 and 2010 compared
A – H 2010
abs. figures
A – H 2011
abs. figures
A – H 2010 in %
A – H 2011 in %
(1) Sample composition by types of households
Previous wave’s respondents 10,396 9,665 92.8 91.7
Temporary drop-outs 473 544 4.2 5.2
New households 339 332 3.0 3.1
Total 11,208 10,541 100.0 100.0
(2) Sample composition by type of fieldwork
Interviewer-based 8,511 7,952 76.0 75.4
Centrally administered (mail) 2,697 2,589 24.1 24.6
Total 11,208 10,541 100.0 100.0
(3) Interviewers
Number of interviewers 506 490 - -
Average number of household interviews 16.8 22.5 - -
(4) Response rates by type of household
Previous wave’s respondents - - 89.9 91.2
Previous wave’s drop-outs (“re-joining former panelists”) - - 25.6 32.5
New households (split-off HH.s) - - 57.2 50.3
Total response rate - - 86.2 86.8
(5) Response rates by type of fieldwork procedure
Interviewer-based - - 92.6 93.0
“Mail/telephone” assisted - - 66.1 68.0
TNS Infratest Sozialforschung 2011
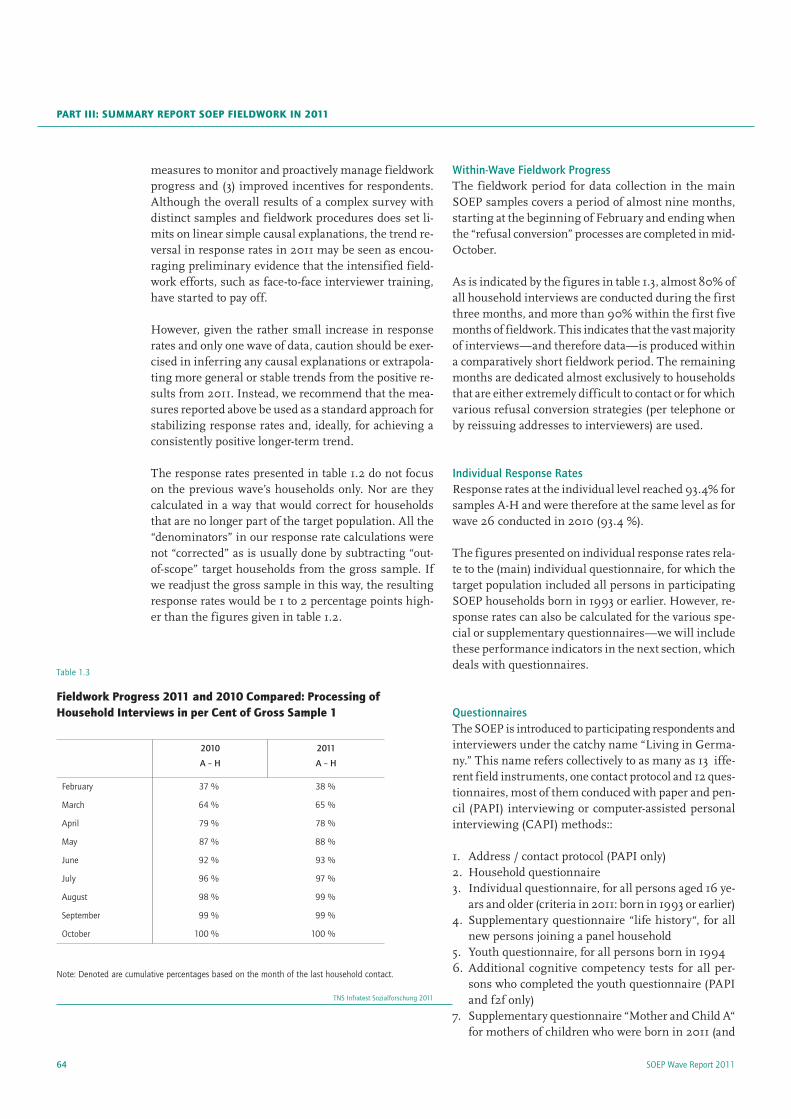
SOEP Wave Report 201164
Part III: sUMMarY rePort soeP fIeLDWorK IN 2011
Within-Wave Fieldwork Progress The fieldwork period for data collection in the main SOEP samples covers a period of almost nine months, starting at the beginning of February and ending when the “refusal conversion” processes are completed in mid-October.
As is indicated by the figures in table 1.3, almost 80% of all household interviews are conducted during the first three months, and more than 90% within the first five months of fieldwork. This indicates that the vast majority of interviews—and therefore data—is produced within a comparatively short fieldwork period. The remaining months are dedicated almost exclusively to households that are either extremely difficult to contact or for which various refusal conversion strategies (per telephone or by reissuing addresses to interviewers) are used.
Individual Response RatesResponse rates at the individual level reached 93.4% for samples A-H and were therefore at the same level as for wave 26 conducted in 2010 (93.4 %).
The figures presented on individual response rates rela-te to the (main) individual questionnaire, for which the target population included all persons in participating SOEP households born in 1993 or earlier. However, re-sponse rates can also be calculated for the various spe-cial or supplementary questionnaires—we will include these performance indicators in the next section, which deals with questionnaires.
QuestionnairesThe SOEP is introduced to participating respondents and interviewers under the catchy name “Living in Germa-ny.” This name refers collectively to as many as 13 iffe-rent field instruments, one contact protocol and 12 ques-tionnaires, most of them conduced with paper and pen-cil (PAPI) interviewing or computer-assisted personal interviewing (CAPI) methods::
1. Address / contact protocol (PAPI only)2. Household questionnaire3. Individual questionnaire, for all persons aged 16 ye-
ars and older (criteria in 2011: born in 1993 or earlier)4. Supplementary questionnaire “life history“, for all
new persons joining a panel household5. Youth questionnaire, for all persons born in 19946. Additional cognitive competency tests for all per-
sons who completed the youth questionnaire (PAPI and f2f only)
7. Supplementary questionnaire “Mother and Child A“ for mothers of children who were born in 2011 (and
measures to monitor and proactively manage fieldwork progress and (3) improved incentives for respondents. Although the overall results of a complex survey with distinct samples and fieldwork procedures does set li-mits on linear simple causal explanations, the trend re-versal in response rates in 2011 may be seen as encou-raging preliminary evidence that the intensified field-work efforts, such as face-to-face interviewer training, have started to pay off.
However, given the rather small increase in response rates and only one wave of data, caution should be exer-cised in inferring any causal explanations or extrapola-ting more general or stable trends from the positive re-sults from 2011. Instead, we recommend that the mea-sures reported above be used as a standard approach for stabilizing response rates and, ideally, for achieving a consistently positive longer-term trend.
The response rates presented in table 1.2 do not focus on the previous wave’s households only. Nor are they calculated in a way that would correct for households that are no longer part of the target population. All the “denominators” in our response rate calculations were not “corrected” as is usually done by subtracting “out-of-scope” target households from the gross sample. If we readjust the gross sample in this way, the resulting response rates would be 1 to 2 percentage points high-er than the figures given in table 1.2.
Table 1.3
fieldwork Progress 2011 and 2010 compared: Processing of household Interviews in per cent of Gross sample 1
2010
A – H
2011
A – H
February 37 % 38 %
March 64 % 65 %
April 79 % 78 %
May 87 % 88 %
June 92 % 93 %
July 96 % 97 %
August 98 % 99 %
September 99 % 99 %
October 100 % 100 %
Note: Denoted are cumulative percentages based on the month of the last household contact.
TNS Infratest Sozialforschung 2011

65SOEP Wave Report 2011
sectIoN I the MaIN saMPLe
mentary questionnaires, as well as at least 20 minutes for conversation with respondents preceding and fol-lowing the actual interview.
Interview Modes The interview mode in the SOEP is usually referred to as a mixed-mode approach. The goal of such multi-me-thod approaches is to achieve a higher overall response rates than those achieved with single-mode survey de-signs, which is particularly relevant in household sam-ples for which partial unit non-response should be kept as low as possible. In order to achieve this goal, it is cri-tical to employ a pool of various modes determined on a case-by-case basis in the individual households. As the SOEP has a long history of using exclusively PAPI
for mothers of children born in 2010 who were not gi-ven the questionnaire in 2010 because the child was born after fieldwork had been completed)
8. Supplementary questionnaire “Mother and Child B” (“Your child at the age of 2 or 3”) for mothers of children born in 2008. In households where the fa-ther takes the role of the main caregiver, fathers are asked to provide the interview.
9. Supplementary questionnaire “Mother and Child C” (“Your children at the age of 5 or 6”) for mothers of children born in 2005. In households where the fa-ther takes the role of the main caregiver, fathers are asked to provide the interview.
10. Questionnaire for parents, both for mothers and fa-thers of children born in 2003 (“Your child at the age of 7 or 8”). In contrast to the mother-and-child ques-tionnaires, both parents of the child, if living in the same SOEP household as the child, are asked to pro-vide an interview.
11. Supplementary questionnaire for temporary dropouts from the previous wave to minimize “gaps” in longi-tudinal data of panelists (therefore referred to as “Lü-ckefragebogen,“ i.e., “gap” questionnaire)
12. Supplementary questionnaire for panel members who experienced a death in their household or fami-ly in 2010 or 2011: “The deceased person”
The questionnaires do vary not only in terms of length but also of target populations.
Table 1.4 provides an overview of the number of inter-views for the various supplementary questionnaires and the respective response rates. As can be seen by these fi-gures, the range of interviews is between approximately 110 and 291. The response rates are between 80% and 90% on average and are particularly high for the vari-ous mother-and-child modules.
The integration of the new consumption module into the household questionnaire in 2010 caused average in-terview length for the household questionnaire to incre-ase by 7 minutes from 2009 to 2010. As table 1.5 indi-cates, the mean interview length dropped by 5 minutes in 2011 compared to 2010, but still is 22 minutes above the historic target value of 75 minutes. Given the trends in interview length for the core questionnaires over the last 10 years and the integration of new supplementary questionnaires for specific subgroups of respondents, it is highly unlikely that the traditional interview length can be maintained in the years to come. Rather, a new benchmark interview length for a two-person household should be set at 90 minutes—bearing in mind that the overall stay of an interviewer in a household will be ap-proximately 30 minutes longer, which includes time to check household composition and administer supple-
Table 1.4
supplementary Individual Questionnaires: Volumes and response rates, samples a – h
Interviews Response Rate
Youth 193 83.9 %
Cognitive competence tests1 144 92.9 %
Life history2 111 (178)
94.9 %
New born mother and child questionnaire A3 146 91.0 %
Mother and child questionnaire B4 173 97.2 %
Mother and child questionnaire C5 210 97.2 %
Questionnaire for parents6 291 82.2 %
Questionnaire for temporary drop-outs 2010 (and 2009)7
204 (224)
62.2 %
Supplementary questionnaire “the deceased person”8 258 –
Note: All figures refer to subsample A – H1 Test can only be implemented if fieldwork is administered by interviewer and youth questionnaire has been completed. Therefore the denominator for the respective gross sample of the target population is different to that of the youth questionnaire itself.2 Response rate refers to new panelists only (n= 111 out of 117). In addition 67 interviews were completed by established panelists who did not answer the life history questionnaire in previous waves.3 Response rate refers to mothers with completed personal interview. Another key indicator for mother and child questionnaires (as well as questionnaires for parents) is the number of children for whom (at least) one interview by a parent is completed. To this effect the coverage ratio of mother and child questionnaire A is 91.8 %.4 Coverage ratio: 97.2 %5 Coverage ratio: 96.8 %6 Coverage ratio: 90.6 %7 Response rate refers to the number of temporary drop-outs with completed personal interview in 2011 (n =204 out of 328). In addition 20 interviews were completed by respondents without personal and/or household questionnaires. Two drop-out cohorts are integrated in the figures because as a general rule households classified as drop-outs from the two previous waves are defined as part of the gross sample of a wave for whom special refusal conversion policies apply.8 Response rate calculation is not possible as actual size of target population is not defined.
TNS Infratest Sozialforschung 2011

SOEP Wave Report 201166
Part III: sUMMarY rePort soeP fIeLDWorK IN 2011
• The methods used in the SOEP are face-to-face inter-views and the self-administered interview that requi-res respondents to answer the questionnaire on their own. The latter is conducted in two different ways:
• As an alternative to the face-to-face interview, pro-cessed by the interviewer (SELF interview)
• As a mail-interview, with central processing (MAIL interview)
In general, a distinct pattern can be identified across the various SOEP samples: the “older“ the sample, the high-er the share of MAIL interviews. This is mainly the re-
(1984-1998), it was particularly important when CAPI was introduced as a “regular option”: both because re-spondents had become accustomed to PAPI over time and because some older interviewers who had worked exclusively on the SOEP for some time had a strong pre-ference for PAPI questionnaires. Finally, in multi-person households, the option of leaving a PAPI questionnaire for individuals who were unable to provide an interview during the interviewer’s stay offers a useful option, par-ticularly for younger household members and those who are difficult to catch at home.
Table 1.5
Mean Interview Length for face-to-face Interviews in samples a - h (Minutes per Interview)
Year
Household Questionnaire Individual Questionnaire
Time Occupied for a Model Household1
2010 2011 2010 2011 2010 2011
Target length 15 30 75
Actual mean length
A SOEP West 23 18 36 35 95 88
B Foreigners 23 19 38 37 99 93
C SOEP East 28 23 39 39 106 101
D Immigrants 25 21 39 38 103 97
E Refreshment sample 1998 27 19 41 42 109 103
F Refreshment 2000 27 21 38 38 103 97
G High income 25 19 35 37 95 93
H Refreshment H 28 23 38 40 104 103
Total (A – H) 26 21 38 38 102 97
1 Household with two interviewed adult individualsTNS Infratest Sozialforschung 2011
Table 1.6
Interviewing Methods by sub-samples (in per cent of all Individual Interviews)
Interviewer-Based Centrally Administered
CAPI PAPI SELF MAIL
2010 2011 2010 2011 2010 2011 2010 2011
A – D 19 17 20 21 38 39 23 24
E 36 34 22 22 27 26 16 18
F 28 27 25 25 34 34 14 14
G 31 30 13 13 43 44 13 13
H 62 54 11 13 21 25 7 7
A – H 28 26 20 21 35 36 17 18
TNS Infratest Sozialforschung 2011

67SOEP Wave Report 2011
sectIoN I the MaIN saMPLe
the sample is made up of about 53,000 areas, which con-stitute the primary sampling units. Each sampling unit contains 700 private households on average, the mini-mum number being 350.
In the second step of the ADM sampling procedure, the private households are selected randomly using a street data base from which the so-called start address for a random walk is randomly drawn. From this starting point, the interviewer proceeds by selecting/listing eve-ry third household, with clear rules for how to proceed when the end of a street or fork in the road is reached, or other when special problems arise on his or her walk through the sampled area.
Stage 1: Random Selection of Sample Points
Covering a total of approximately 53,000 spatial areas, the sample points constitute the units for the first se-lection stage. In each unit, the number of sample points is drawn with a probability that is proportional to the number of households in each sample point. The crite-ria that define the stratification layers are federal state, administrative district, and community type. A total of 307 sample points was drawn with a selection probabi-lity proportional to the share of households in the samp-ling point—with states, administrative districts (Regie-rungsbezirke), and the BIK classification system (a sett-lement structure typology) used as the layers.
The distribution of sample points in the gross sample, both in absolute and relative figures, is shown in tables 2.1 and 2.2. The relative share of sample points is pre-sented alongside the share of private households in the respective layers. The share of households in the net sample is given in the last column of tables 2.1 and 2.2, and will be discussed in the context of fieldwork results in the next sub-section. By comparing the information on net sample composition for two major regional lay-ers, it is possible to identify deviations from the “target shares” in the inference populations of the respective regional segments. There are no quotas of any kind in the SOEP that would justify adjustments in gross sam-ple size during the fieldwork period; therefore, any de-viations from the target figures can only be used to in-crease efforts in those sample points and regions where significant deviations are observed. This generally leads to an underrepresentation of households in urban are-as, due to lower response rates in the more densely po-pulated regions.
Stage 2: Random Route Walk and Address Listing
In the second stage of the selection process, the households that are supposed to participate in the stu-
sult of the transition from interviewer-based to centrally administered fieldwork, which ref lects a major pillar of the SOEP’s refusal conversion strategy: households that are no longer willing to participate in the survey-based face-to-face interviewing are offered the option of par-ticipating by MAIL interview. Thus the proportion of MAIL interviews differs substantially across samples, revealing a clear pattern of increased mail shares over a sample’s “life span”. In sample H, for instance, mail interviews account for just 7% of all interviews conduc-ted in 2011, whereas the proportion of households parti-cipating by mail was 24% for samples A-D.
The Refreshment Sample J
SamplingAs with previous general population samples, the re-freshment sample J was realized by using a multi-stage stratified sampling design. We will summarize the two main stages of sampling separately, ensuring that the most important methodological aspects are covered but foregoing a detailed “method and process description.”
Generally speaking, the sampling of a new SOEP household sample is based on the so-called ADM sam-pling system, whereby the methodological advantages are maximized to derive a best-practice design for a non-registry-based household sample frame. Thus, before starting to describe the specific sampling design of re-freshment sample J, we provide some background in-formation as to why the ADM sampling system for face-to-face interviews is used in the SOEP.
The most important background information to bear in mind is that no centralized population (let alone household) directory is available in Germany that would contain the addresses of all private households or indi-viduals. The data collected by the local authorities (at the city or municipality level) for the personal regis-ters are available to surveys that can prove to serve the “public interest”. This information is mainly useful for the sampling of individuals. Due to the lack of a cen-tral household registry, the “Arbeitsgemeinschaft ADM-Stichproben Face-to-Face” has developed the basic me-thodology and the ingredients for a random sampling frame suitable for market and social research samples. The ADM-Sampling-System (F2F) is designed as an area sample that covers all populated areas of the Federal Re-public of Germany. It is “based on Germany's topology, organized by states, counties and communities, the sta-tistical areas within communities described by public data, and the geographical data created for traffic navi-gation systems” . Based on the combination of the data,

SOEP Wave Report 201168
Part III: sUMMarY rePort soeP fIeLDWorK IN 2011
dy are chosen for each sample point. Here, a special ver-sion of the random route technique is employed. Instead of choosing the addresses and conducting the interview simultaneously, addresses are selected in a separate step (“advance listing of addresses”). This approach is more complex than the standard random walk method that is usually implemented without the advance listing of addresses. The more complex approach used for SOEP delivers significant methodological advantages over the standard random walk approach:
• Since the addresses are available before the start of fieldwork, they can be checked for plausibility and correctness. In other words: there is a precisely defi-ned list of addresses that can be prepared optimally for fieldwork.
• A different interviewer can be used to collect addres-ses from the one who conducts the interviews: This approach minimizes interviewer effects and can be used to check whether the random route has been implemented correctly by the interviewer who lis-ted the addresses.
• Address listing is a prerequisite for the fieldwork institute’s use of measures to increase response rates and decrease unit non-response, such as the mailing of an introductory informational letter and a brochu-re about the study before the start of fieldwork. Given the declining willingness to participate in populati-on surveys and selection effects that plague the stan-dard random walk approach, these measures cons-titute important features of a best-practice design.
Table 2.2
Distribution of sample Points by community type (BIK)
BIK-Type1 Number Sample Points Share Sample PointsShare Households
in Germany2
Share Households in Net Sample
0 more than 500,000 inhabitants (centre) 88 28.7 % 28.2 % 22.8 %
1 more than 500,000 inhabitants (periphery) 28 9.1 % 9.0 % 8.5 %
2 100,000 to 499,999 inhabitants (centre) 48 15.6 % 15.8 % 17.7 %
3 100,000 to 499,999 inhabitants (periphery) 42 13.7 % 14.1 % 14.1 %
4 50,000 to 99,999 inhabitants (centre) 6 2.0 % 2.4 % 1.3 %
5 50,000 to 99,999 inhabitants (periphery) 23 7.5 % 8.0 % 7.0 %
6 20,000 to 49,999 inhabitants 36 11.7 % 10.3 % 12.6 %
7 5,000 to 19,999 inhabitants 23 7.5 % 7.9 % 9.3 %
8 2,000 to 4,999 inhabitants 8 2.6 % 2.5 % 4.5 %
9 less than 2,000 inhabitants 5 1.6 % 1.7 % 2.1 %
Total 307 100.0 % 100.0 % 100.0 %
1 Community type (BIK) groups regions into categories according to the number of inhabitants and the location.
2 Gemeindedatei, last update 31.12.2010TNS Infratest Sozialforschung 2011
Table 2.1
Distribution of sample Points by federal state
Federal State Number Sample Points
Share Sample Points
Share House-holds
in Germany1
Share Households
in Net Sample
Schleswig-Holstein 10 3.3 % 3.5 % 4.6 %
Hamburg 8 2.6 % 2.5 % 1.1 %
Lower Saxony 29 9.4 % 9.6 % 8.6 %
Bremen 2 .7 % .9 % .5 %
North Rhine-Westphalia 65 21.2 % 21.6 % 18.7 %
Hesse 23 7.5 % 7.3 % 6.8 %
Rhineland-Palatinate 15 4.9 % 4.7 % 4.8 %
Saarland 4 1.3 % 1.2 % 1.1 %
Baden-Wuerttemberg 39 12.7 % 12.4 % 12.4 %
Bavaria 45 14.7 % 14.8 % 18.3 %
Berlin 15 4.9 % 5.0 % 3.7 %
Brandenburg 10 3.3 % 3.1 % 4.3 %
Mecklenburg-West Pomerania 7 2.3 % 2.1 % 2.4 %
Saxony 17 5.5 % 5.5 % 4.7 %
Saxony-Anhalt 9 2.9 % 3.0 % 3.7 %
Thuringia 9 2.9 % 2.8 % 4.2 %
Total 307 100.0 % 100.0 % 100.0 %
Mikrozensus 2010TNS Infratest Sozialforschung 2011

69SOEP Wave Report 2011
sectIoN I the MaIN saMPLe
background for the name given based on the onomas-tic method were counted. Depending on this number of households, the size of the “onomastic top-up boost sample” was defined: in each sample, the same number of addresses was added to the base sample. The goal of this top-up procedure is to boost the share of households with a high probability of a migration background by the factor two. As a sufficient number of household addres-ses with a potential migration background did not exist for all sample points, this procedure did not result in a boost factor of precisely two for some of them. But ove-rall, the onomastic method generated an additional 594 potential migration households that were in included
• For the fieldwork, the interviewer receives precise addresses and can record details on his or her con-tact with the household on contact forms (referred to as the “address protocol” in the SOEP). This enables important data to be collected on the “gross samp-le,“ regardless of whether a household participates in the survey or not. Special household context questi-ons (Wohnumfeldfragen) are answered by the inter-viewers. On the basis of this (subjective, interviewer-based) information and (objective) micro-contextual social context data from the commercial provider MI-CROM, important indicators are generated that are particularly useful for non-response analysis.
• The advance listing of addresses is a prerequisite for use in the onomastic “name-screening” process, a na-me-based procedure for estimating the likelihood that a name occurring in a particular household indica-tes a migration background. This procedure, with a hit ratio of more than 70%, allows for disproportio-nate sampling of households with an assumed mi-gration background, aiming at either proportional representation or overrepresentation of households with a migration background depending on the sub-sample in question.
For each of the 307 sample points, the goal was to list 80 addresses on a random walk with a step interval of three, i.e., every third household unit on the random walk route was to be listed by an interviewer. For the collected address material, an onomastic screening pro-cedure was run by a specialized institute.
For the definition of the target sample, the first step was to create a “base gross sample” by randomly selecting 30 addresses for each sample point. In the next step, the addresses showing a high probability of a migration
Table 2.3
Distribution of households by Migration Background
Gross Sample Net Sample
BaseOnomastic-Based
Top UpTotal Total
N % N % N % N %
Potential Immigrant Household1 673 7.3 594 100.0 1.267 12.9 323 10.3
Potential German Household 8,537 92.7 0 .0 8,537 87.1 2,813 89.7
Total 9,210 100.0 594 100.0 9,804 100.0 3,136 100.0
1 Migrant household as marked by onomastic indicatorTNS Infratest Sozialforschung 2011
Table 2.4
fieldwork Progress by Month
Gross Sample Net Sample
March .4 % 19.4 %
April 20.1 % 44.7 %
May 42.5 % 60.6 %
June 58.5 % 69.8 %
July 69.6 % 85.1 %
August 82.2 % 99.0 %
September 97.5 % 100.0 %
October 100.0 % 100.0 %
Note: Denoted are cumulative percentages based on the month of the last household contact.
TNS Infratest Sozialforschung 2011

SOEP Wave Report 201170
Part III: sUMMarY rePort soeP fIeLDWorK IN 2011
ers, and more attractive incentives for respondents. Ta-ble 2.5 on the next page gives an overview of the main fieldwork result codes.
As described in the previous chapter “Sampling,“ the onomastic boost subsample allowed a higher share of households with a migration background to be integra-ted into sample J. Given the evidence from a series of surveys that response rates among this special sub-po-pulation have been declining over the last decade , we present response rates separately for those households classified as migrant households based on the onomas-tic method and those for which this was not the case. As the onomastic method can only deliver a likelihood-based estimate with an inevitable margin of error for some households, the classification should be taken with some caution. Nevertheless, it shows that the res-ponse rate levels vary considerably between households with an assumed migration background and those wi-thout. As table 2.6 reveals the household response rate was almost 8 percentage points lower for households for which the onomastic name-screening suggested a mi-grant background. Given the proposed plans to incre-ase representation of the migrant population in SOEP through a special refreshment/top-up sample, it will be important to develop fieldwork procedures that produce
in face-to-face interviewing from the top-up sample, in-creasing the share of this special population from 7.3 to 12.9% (factor 1.8).
fieldwork results
Household Level
Table 2 shows the progress in fieldwork over the full Pe-riod of face-to-face interviewing.
Since the year 2000, declining response rates have been one of the fundamental challenges for all face-to-face so-cial surveys in Germany. Although a response rate for refreshment sample F was still over 50% in 2000, re-sponse rates declined steeply in the years 2000-2010. For refreshment sample H, conducted in 2006, a head-line response rate of 40.2% could still be achieved. Yet, in the year 2009, when sample I—now the base sam-ple for the new SOEP Innovation Sample—was pro-cessed, the headline response rate was 32%. For the refreshment sample J, the headline response rate for the adjusted gross sample was 33.1%. Thus, the gene-ral downward trend was successfully reversed through a range of measures, including centralized face-to-face interviewer training, improved payment of interview-
Table 2.5
response rates at household Level, refreshment sample J
Gross Sample Adjusted Gross Sample
Number In % Number In %
Total 9,804
QNDs 287 2.9 - -
Deceased 26 .3 - -
Expatriates 6 .1 - -
9,485
Realized 3,136 32.0 3,136 33.1
Completely 502 5.1 502 5.3
Partly 2,634 26.9 2,634 27.8
Not realized 1,343 13.7 1,343 14.2
No Contact 783 8.0 783 8.3
Interview not possible1 560 5.7 560 5.9
Refusals 4,940 50.4 4,940 52.1
Temporary 251 2.6 251 2.6
Final 4,689 47.8 4,689 49.4
Other 66 .7 66 .7
1 Due to sickness, mental disease, permanent absence during fieldwork period or other reasons etc.
TNS Infratest Sozialforschung 2011

71SOEP Wave Report 2011
sectIoN I the MaIN saMPLe
Both sets of indicators—the share of partially intervie-wed households and the response rate for the individu-al questionnaire—give clear indications that the invest-ment in intensified face-to-face interviewer training and in further intensified fieldwork monitoring have paid off. What has to be borne in mind with respect to the wave 1 share of partially interviewed households and in-dividual response rates is that for the interviewer, the process of making initial contact with a household is much different from that of re-interviewing a household that was part of the study in a previous wave. When es-tablishing the initial contact at the door in wave 1, the interviewer has no indicators at hand that would allow him or her to estimate the actual number of people li-ving in the household.
somewhat higher response rates than for the migration households in sample J. The onomastic method tends to be selective, however, in that it fails to classify “Ger-man-sounding names” of individuals with a migration background as potential migration households. Thus, immigration populations from German-speaking coun-tries like Austria and Switzerland, for instance, are pro-bably not classified as potential immigrant households, probably resulting in somewhat higher actual response rates among households with a migration background. The same is true for households from the “re-settler”-populations from Eastern Europe: Many of them kept their German names even before they arrived in Germa-ny and many of them had the names adjusted to former German etymological roots of their names.
Individual Level
As is the case for all longitudinal samples, one of the major challenges for the refreshment samples is that all household members aged 16 and older define the tar-get population for the individual questionnaires. Basi-cally, there are two key performance indicators that de-fine the extent to which the ambitious goal of intervie-wing all household members 16 years and older in every panel household has been met. The first indicator is the share of all households for which at least one person has not completed the individual interview, thereby produ-cing “gaps” in the data, which are particularly problema-tic for the household indicators that can only be gene-rated correctly if an individual interview has been con-ducted (e.g., household income, assets, etc.). The share of households for which at least one person could not be interviewed although he or she belonged to the tar-get population for the individual or youth interviews was 15.9 percent. In absolute figures: at least one individual interview is missing for approximately 500 households. Although the level of partial unit non-response for wave 1 of sample J is higher than for the longitudinal samp-les, the level of individual participation is still satisfac-tory compared to wave 1 of sample I from 2009, where the respective ratio was 20.6.
The second indicator to assess participation patterns at the individual level are the response rates for the indi-vidual and youth questionnaires. We report the figures for these two questionnaires in table 2.7 in the subse-quent subsection, but use them in this section in the context of field results for the individual response rates: the response rate for the individual questionnaire was 90.4%, indicating that 9 out of 10 respondents were interviewed successfully. This share is strikingly high and almost four percentage points higher than for the most recent refreshment sample prior to J, namely, sam-ple I of 2009, where the respective figure was 86.4%.
Table 2.7
Volumes and Mean Interview Length, samples J
Number of Interviews
Response RateMean interview length (in Min.)
Household 3,136 33.1 % 20
Individual1 5,087 90.4 % 44
Youth2 74 82.2 % 35
1 Target population: persons in participating households born in 1993 or earlier2 Target population: persons born in 1994
TNS Infratest Sozialforschung 2011
Table 2.6:
response rates by onomastics-indicator
„German Household“
„Immigrant Household“ Total
n % n % n %
Participating Households 2,813 34.1 323 26.3 3,136 33.1
Non-Participating Households
5,444 65.9 905 73.7 6,349 66.9
Total 8,257 100.0 1.228 100.0 9,485 100.0
1 Response Rate adjusted by quality neutral drop-outs (QND), deceased and expatriates
TNS Infratest Sozialforschung 2011
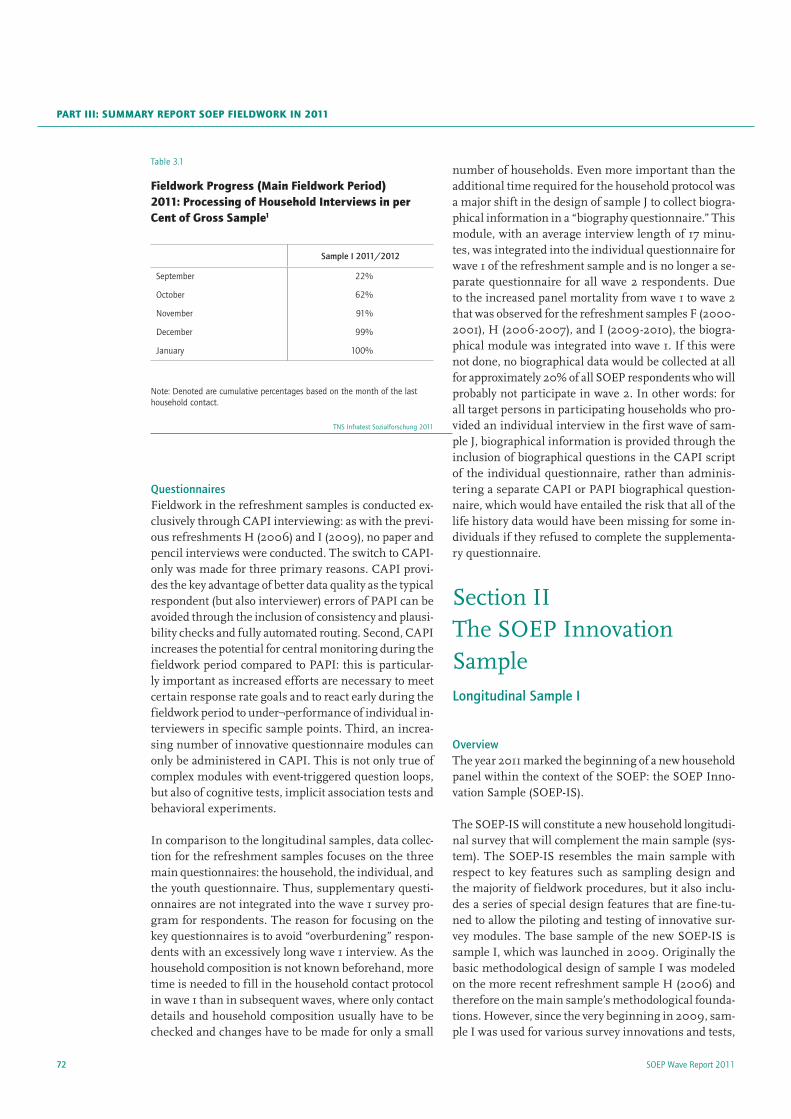
SOEP Wave Report 201172
Part III: sUMMarY rePort soeP fIeLDWorK IN 2011
number of households. Even more important than the additional time required for the household protocol was a major shift in the design of sample J to collect biogra-phical information in a “biography questionnaire.” This module, with an average interview length of 17 minu-tes, was integrated into the individual questionnaire for wave 1 of the refreshment sample and is no longer a se-parate questionnaire for all wave 2 respondents. Due to the increased panel mortality from wave 1 to wave 2 that was observed for the refreshment samples F (2000-2001), H (2006-2007), and I (2009-2010), the biogra-phical module was integrated into wave 1. If this were not done, no biographical data would be collected at all for approximately 20% of all SOEP respondents who will probably not participate in wave 2. In other words: for all target persons in participating households who pro-vided an individual interview in the first wave of sam-ple J, biographical information is provided through the inclusion of biographical questions in the CAPI script of the individual questionnaire, rather than adminis-tering a separate CAPI or PAPI biographical question-naire, which would have entailed the risk that all of the life history data would have been missing for some in-dividuals if they refused to complete the supplementa-ry questionnaire.
Section II The SOEP Innovation SampleLongitudinal Sample I
OverviewThe year 2011 marked the beginning of a new household panel within the context of the SOEP: the SOEP Inno-vation Sample (SOEP-IS).
The SOEP-IS will constitute a new household longitudi-nal survey that will complement the main sample (sys-tem). The SOEP-IS resembles the main sample with respect to key features such as sampling design and the majority of fieldwork procedures, but it also inclu-des a series of special design features that are fine-tu-ned to allow the piloting and testing of innovative sur-vey modules. The base sample of the new SOEP-IS is sample I, which was launched in 2009. Originally the basic methodological design of sample I was modeled on the more recent refreshment sample H (2006) and therefore on the main sample’s methodological founda-tions. However, since the very beginning in 2009, sam-ple I was used for various survey innovations and tests,
QuestionnairesFieldwork in the refreshment samples is conducted ex-clusively through CAPI interviewing: as with the previ-ous refreshments H (2006) and I (2009), no paper and pencil interviews were conducted. The switch to CAPI-only was made for three primary reasons. CAPI provi-des the key advantage of better data quality as the typical respondent (but also interviewer) errors of PAPI can be avoided through the inclusion of consistency and plausi-bility checks and fully automated routing. Second, CAPI increases the potential for central monitoring during the fieldwork period compared to PAPI: this is particular-ly important as increased efforts are necessary to meet certain response rate goals and to react early during the fieldwork period to under¬performance of individual in-terviewers in specific sample points. Third, an increa-sing number of innovative questionnaire modules can only be administered in CAPI. This is not only true of complex modules with event-triggered question loops, but also of cognitive tests, implicit association tests and behavioral experiments.
In comparison to the longitudinal samples, data collec-tion for the refreshment samples focuses on the three main questionnaires: the household, the individual, and the youth questionnaire. Thus, supplementary questi-onnaires are not integrated into the wave 1 survey pro-gram for respondents. The reason for focusing on the key questionnaires is to avoid “overburdening” respon-dents with an excessively long wave 1 interview. As the household composition is not known beforehand, more time is needed to fill in the household contact protocol in wave 1 than in subsequent waves, where only contact details and household composition usually have to be checked and changes have to be made for only a small
Table 3.1
fieldwork Progress (Main fieldwork Period) 2011: Processing of household Interviews in per cent of Gross sample1
Sample I 2011/2012
September 22%
October 62%
November 91%
December 99%
January 100%
Note: Denoted are cumulative percentages based on the month of the last household contact.
TNS Infratest Sozialforschung 2011

73SOEP Wave Report 2011
sectIoN II the soeP INNoVatIoN saMPLe
vel of the main fieldwork phase. The final results are not available yet.1
Fieldwork Indicators (Household Level)
Table 3.2 presents preliminary fieldwork results from the main fieldwork period at household level. The gross sample consisted of 1,362 households. This includes previous wave’s respondents as well as previous wave’s temporary drop-outs and new households (see also ta-ble 3.2). At the end of the main fieldwork period 1,008 household interviews had been realized. The share of fully completed households – where all the persons aged 16 and above living in the household provided an indi-vidual interview – was 85.9%. In 14.1% of the participa-ting households at least one target person did not provi-de an individual interview (partial unit nonresponse).
The dropouts of the wave 3 main fieldwork period divide themselves into approximately two thirds final drop-outs (definite refusals) and one third temporary drop-outs (households not contactable during fieldwork and “tem-porary” or “soft” refusals). 1.7% of the drop-outs are de-ceased households or expatriates. These are excluded for the calculation of response rates presented in table 3.3.
1 At this stage we expect about 30 further realized households and 25 personal interviews in hitherto not fully realized households. Hence, the response rate (household level) will increase slightly whereas the partial unit non response will decrease due to the postprocessing.
such as the use of an onomastic screening procedure to oversample households with a migration background and the experimental testing of incentives of different kinds and value levels.
The interview mode in the SOEP-IS base sample I is restricted to Computer Assisted Personal Interviewing (CAPI); only for the wave 2 refusal conversion process was it possible to use PAPI. In wave 3, a new integrated core questionnaire consolidated the basic elements of the SOEP household and personal questionnaires for the first time into one CAPI script for the 2011 field-work. This included core elements of the biographical questionnaire given to first-time respondents and three mother-child modules.
The rationale behind the integration of the household and individual questionnaires into a single shorter core questionnaire was to allow more interviewing time for innovative questionnaire modules and tests. Thus, on top of the core elements, various innovation modules were integrated into the questionnaire for the SOEP-IS in 2011 (see the “Questionnaire” section of this chapter). In ad-dition, an electronic household protocol specifying the composition of the participating households was tested.
Fieldwork Results
Fieldwork Progress
In order to distinguish fieldwork from other SOEP-samples the main fieldwork period for data collection of sample I lasted from September to December 2011 and therefore covered a period of roughly four months. Some appointments made by the interviewer with the panel households resulted in a few interviews in Janua-ry 2012. As is indicated by the figures in table 3.1 more than 60% of all household interviews were conducted during the first two months of the main fieldwork pe-riod and more than 90% within the first three months.
At the time of writing this report (in March 2012) an additional face-to-face fieldwork period was under way. A total of 96 households who could not be interview-ed during the main fieldwork period were re-issued for fieldwork again. In addition, 65 persons in partially re-alized households were contacted again as a means to reduce the share of households with partial unit respon-se. On that account this report covers the fieldwork re-sults and key indicators on household and personal le-
Table 3.2
Preliminary fieldwork results (households)
Absolute Number
In % Gross Sample
In % Net Sample
Gross sample 1,362 100.0 -
Interviews 1,008 74.0 100.0
Of which:
Household fully realised 866 63.6 85.9
Household partially realised 142 10.4 14.1
Drop-outs 354 26.0 100.0
Of which:
Temporary drop-outs 125 9.2 35.3
Final drop-outs 223 16.4 63.0
Deceased persons (i.e. whole household is deceased)/ Expatriates (whole household moved abroad)
6 .4 1.7
TNS Infratest Sozialforschung 2011
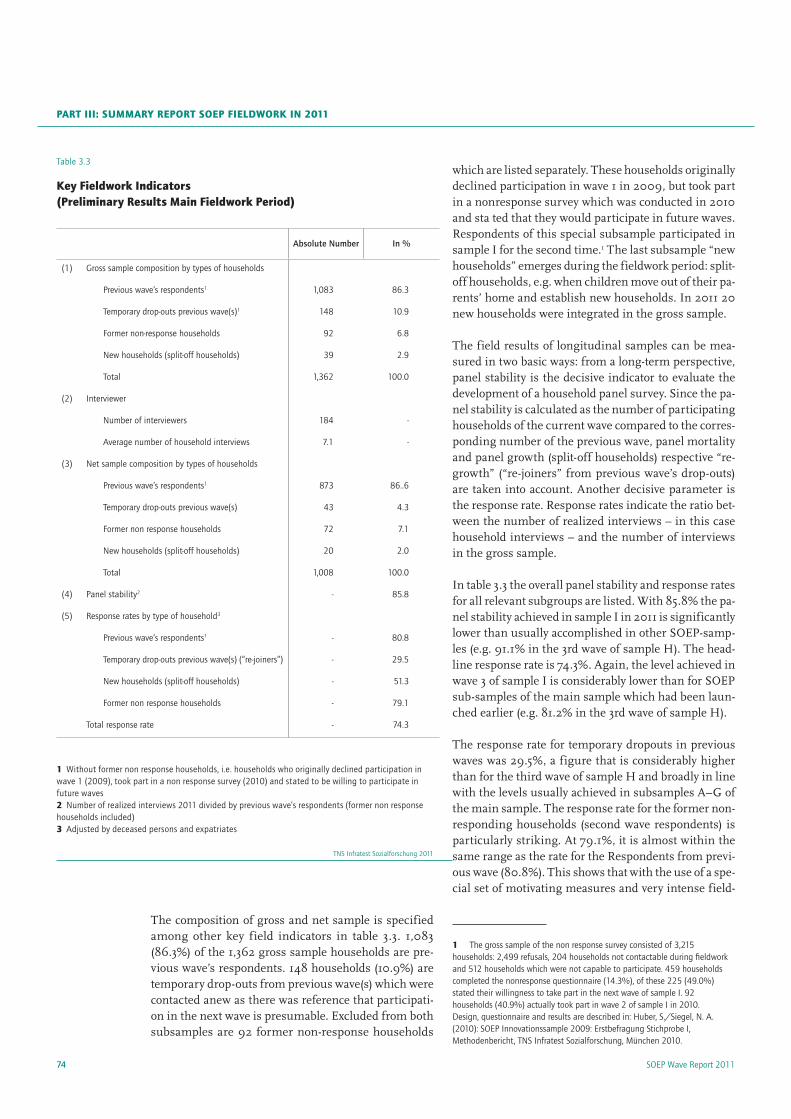
SOEP Wave Report 201174
Part III: sUMMarY rePort soeP fIeLDWorK IN 2011
which are listed separately. These households originally declined participation in wave 1 in 2009, but took part in a nonresponse survey which was conducted in 2010 and sta ted that they would participate in future waves. Respondents of this special subsample participated in sample I for the second time.1 The last subsample “new households” emerges during the fieldwork period: split-off households, e.g. when children move out of their pa-rents’ home and establish new households. In 2011 20 new households were integrated in the gross sample.
The field results of longitudinal samples can be mea-sured in two basic ways: from a long-term perspective, panel stability is the decisive indicator to evaluate the development of a household panel survey. Since the pa-nel stability is calculated as the number of participating households of the current wave compared to the corres-ponding number of the previous wave, panel mortality and panel growth (split-off households) respective “re-growth” (“re-joiners” from previous wave’s drop-outs) are taken into account. Another decisive parameter is the response rate. Response rates indicate the ratio bet-ween the number of realized interviews – in this case household interviews – and the number of interviews in the gross sample.
In table 3.3 the overall panel stability and response rates for all relevant subgroups are listed. With 85.8% the pa-nel stability achieved in sample I in 2011 is significantly lower than usually accomplished in other SOEP-samp-les (e.g. 91.1% in the 3rd wave of sample H). The head-line response rate is 74.3%. Again, the level achieved in wave 3 of sample I is considerably lower than for SOEP sub-samples of the main sample which had been laun-ched earlier (e.g. 81.2% in the 3rd wave of sample H).
The response rate for temporary dropouts in previous waves was 29.5%, a figure that is considerably higher than for the third wave of sample H and broadly in line with the levels usually achieved in subsamples A–G of the main sample. The response rate for the former non-responding households (second wave respondents) is particularly striking. At 79.1%, it is almost within the same range as the rate for the Respondents from previ-ous wave (80.8%). This shows that with the use of a spe-cial set of motivating measures and very intense field-
1 The gross sample of the non response survey consisted of 3,215 households: 2,499 refusals, 204 households not contactable during fieldwork and 512 households which were not capable to participate. 459 households completed the nonresponse questionnaire (14.3%), of these 225 (49.0%) stated their willingness to take part in the next wave of sample I. 92 households (40.9%) actually took part in wave 2 of sample I in 2010. Design, questionnaire and results are described in: Huber, S./Siegel, N. A. (2010): SOEP Innovationssample 2009: Erstbefragung Stichprobe I, Methodenbericht, TNS Infratest Sozialforschung, München 2010.
The composition of gross and net sample is specified among other key field indicators in table 3.3. 1,083 (86.3%) of the 1,362 gross sample households are pre-vious wave’s respondents. 148 households (10.9%) are temporary drop-outs from previous wave(s) which were contacted anew as there was reference that participati-on in the next wave is presumable. Excluded from both subsamples are 92 former non-response households
Table 3.3
Key fieldwork Indicators (Preliminary results Main fieldwork Period)
Absolute Number In %
(1) Gross sample composition by types of households
Previous wave’s respondents1 1,083 86.3
Temporary drop-outs previous wave(s)1 148 10.9
Former non-response households 92 6.8
New households (split-off households) 39 2.9
Total 1,362 100.0
(2) Interviewer
Number of interviewers 184 -
Average number of household interviews 7.1 -
(3) Net sample composition by types of households
Previous wave’s respondents1 873 86..6
Temporary drop-outs previous wave(s) 43 4.3
Former non response households 72 7.1
New households (split-off households) 20 2.0
Total 1,008 100.0
(4) Panel stability2 - 85.8
(5) Response rates by type of household3
Previous wave’s respondents1 - 80.8
Temporary drop-outs previous wave(s) (“re-joiners”) - 29.5
New households (split-off households) - 51.3
Former non response households - 79.1
Total response rate - 74.3
1 Without former non response households, i.e. households who originally declined participation in wave 1 (2009), took part in a non response survey (2010) and stated to be willing to participate in future waves2 Number of realized interviews 2011 divided by previous wave’s respondents (former non response households included)3 Adjusted by deceased persons and expatriates
TNS Infratest Sozialforschung 2011
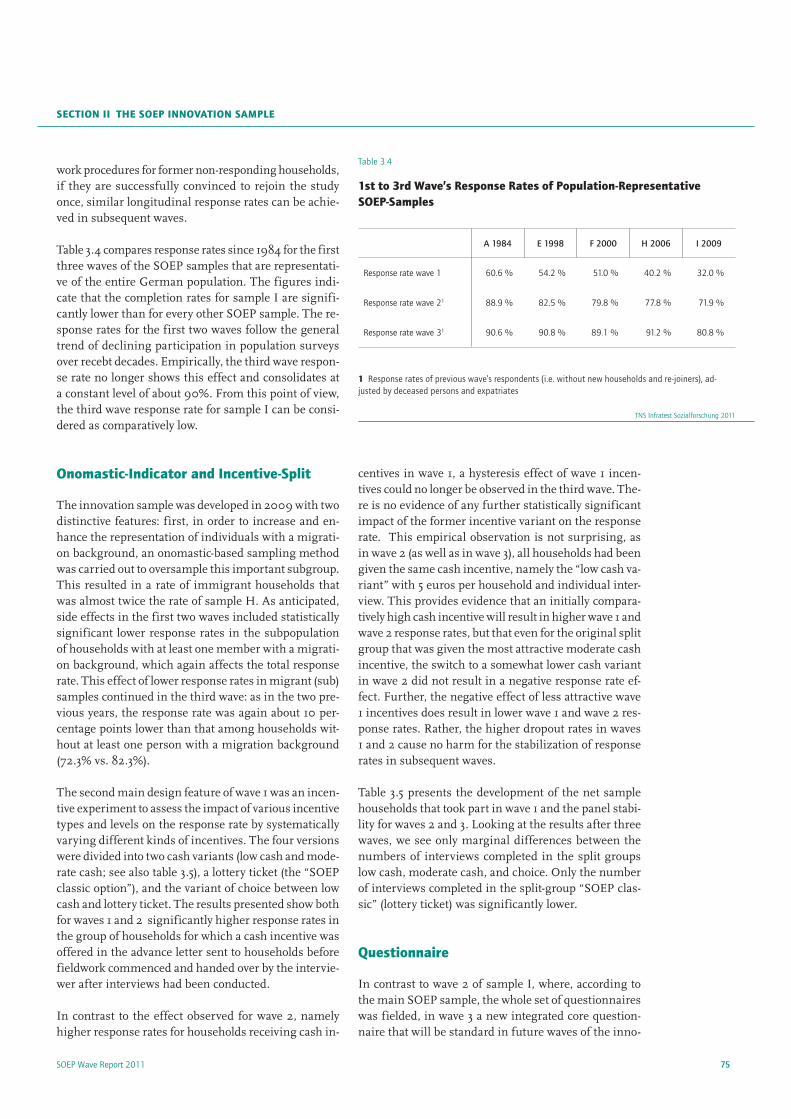
75SOEP Wave Report 2011
sectIoN II the soeP INNoVatIoN saMPLe
centives in wave 1, a hysteresis effect of wave 1 incen-tives could no longer be observed in the third wave. The-re is no evidence of any further statistically significant impact of the former incentive variant on the response rate. This empirical observation is not surprising, as in wave 2 (as well as in wave 3), all households had been given the same cash incentive, namely the “low cash va-riant” with 5 euros per household and individual inter-view. This provides evidence that an initially compara-tively high cash incentive will result in higher wave 1 and wave 2 response rates, but that even for the original split group that was given the most attractive moderate cash incentive, the switch to a somewhat lower cash variant in wave 2 did not result in a negative response rate ef-fect. Further, the negative effect of less attractive wave 1 incentives does result in lower wave 1 and wave 2 res-ponse rates. Rather, the higher dropout rates in waves 1 and 2 cause no harm for the stabilization of response rates in subsequent waves.
Table 3.5 presents the development of the net sample households that took part in wave 1 and the panel stabi-lity for waves 2 and 3. Looking at the results after three waves, we see only marginal differences between the numbers of interviews completed in the split groups low cash, moderate cash, and choice. Only the number of interviews completed in the split-group “SOEP clas-sic” (lottery ticket) was significantly lower.
Questionnaire
In contrast to wave 2 of sample I, where, according to the main SOEP sample, the whole set of questionnaires was fielded, in wave 3 a new integrated core question-naire that will be standard in future waves of the inno-
work procedures for former non-responding households, if they are successfully convinced to rejoin the study once, similar longitudinal response rates can be achie-ved in subsequent waves.
Table 3.4 compares response rates since 1984 for the first three waves of the SOEP samples that are representati-ve of the entire German population. The figures indi-cate that the completion rates for sample I are signifi-cantly lower than for every other SOEP sample. The re-sponse rates for the first two waves follow the general trend of declining participation in population surveys over recebt decades. Empirically, the third wave respon-se rate no longer shows this effect and consolidates at a constant level of about 90%. From this point of view, the third wave response rate for sample I can be consi-dered as comparatively low.
onomastic-Indicator and Incentive-split
The innovation sample was developed in 2009 with two distinctive features: first, in order to increase and en-hance the representation of individuals with a migrati-on background, an onomastic-based sampling method was carried out to oversample this important subgroup. This resulted in a rate of immigrant households that was almost twice the rate of sample H. As anticipated, side effects in the first two waves included statistically significant lower response rates in the subpopulation of households with at least one member with a migrati-on background, which again affects the total response rate. This effect of lower response rates in migrant (sub)samples continued in the third wave: as in the two pre-vious years, the response rate was again about 10 per-centage points lower than that among households wit-hout at least one person with a migration background (72.3% vs. 82.3%).
The second main design feature of wave 1 was an incen-tive experiment to assess the impact of various incentive types and levels on the response rate by systematically varying different kinds of incentives. The four versions were divided into two cash variants (low cash and mode-rate cash; see also table 3.5), a lottery ticket (the “SOEP classic option”), and the variant of choice between low cash and lottery ticket. The results presented show both for waves 1 and 2 significantly higher response rates in the group of households for which a cash incentive was offered in the advance letter sent to households before fieldwork commenced and handed over by the intervie-wer after interviews had been conducted.
In contrast to the effect observed for wave 2, namely higher response rates for households receiving cash in-
Table 3.4
1st to 3rd Wave’s response rates of Population-representative soeP-samples
A 1984 E 1998 F 2000 H 2006 I 2009
Response rate wave 1 60.6 % 54.2 % 51.0 % 40.2 % 32.0 %
Response rate wave 21 88.9 % 82.5 % 79.8 % 77.8 % 71.9 %
Response rate wave 31 90.6 % 90.8 % 89.1 % 91.2 % 80.8 %
1 Response rates of previous wave’s respondents (i.e. without new households and re-joiners), ad-justed by deceased persons and expatriates
TNS Infratest Sozialforschung 2011
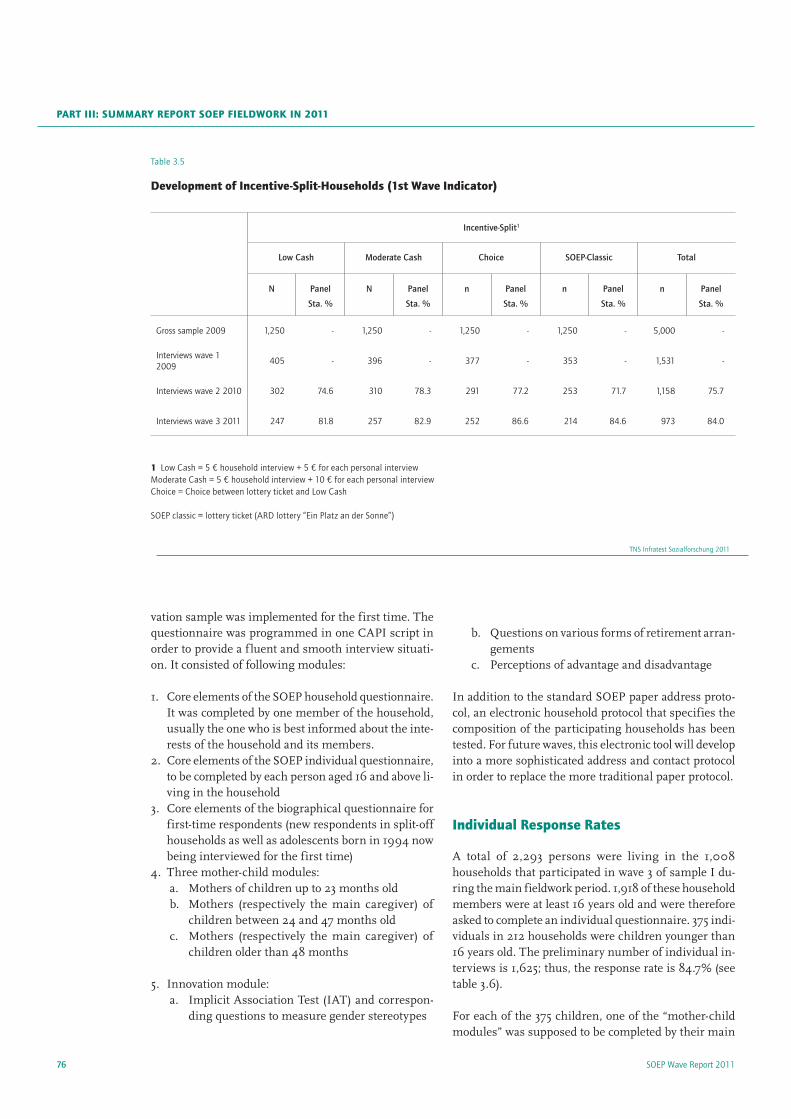
SOEP Wave Report 201176
Part III: sUMMarY rePort soeP fIeLDWorK IN 2011
vation sample was implemented for the first time. The questionnaire was programmed in one CAPI script in order to provide a f luent and smooth interview situati-on. It consisted of following modules:
1. Core elements of the SOEP household questionnaire. It was completed by one member of the household, usually the one who is best informed about the inte-rests of the household and its members.
2. Core elements of the SOEP individual questionnaire, to be completed by each person aged 16 and above li-ving in the household
3. Core elements of the biographical questionnaire for first-time respondents (new respondents in split-off households as well as adolescents born in 1994 now being interviewed for the first time)
4. Three mother-child modules:a. Mothers of children up to 23 months oldb. Mothers (respectively the main caregiver) of
children between 24 and 47 months oldc. Mothers (respectively the main caregiver) of
children older than 48 months
5. Innovation module:a. Implicit Association Test (IAT) and correspon-
ding questions to measure gender stereotypes
b. Questions on various forms of retirement arran-gements
c. Perceptions of advantage and disadvantage
In addition to the standard SOEP paper address proto-col, an electronic household protocol that specifies the composition of the participating households has been tested. For future waves, this electronic tool will develop into a more sophisticated address and contact protocol in order to replace the more traditional paper protocol.
Individual response rates
A total of 2,293 persons were living in the 1,008 households that participated in wave 3 of sample I du-ring the main fieldwork period. 1,918 of these household members were at least 16 years old and were therefore asked to complete an individual questionnaire. 375 indi-viduals in 212 households were children younger than 16 years old. The preliminary number of individual in-terviews is 1,625; thus, the response rate is 84.7% (see table 3.6).
For each of the 375 children, one of the “mother-child modules” was supposed to be completed by their main
Table 3.5
Development of Incentive-split-households (1st Wave Indicator)
Incentive-Split1
Low Cash Moderate Cash Choice SOEP-Classic Total
N Panel
Sta. %
N Panel
Sta. %
n Panel
Sta. %
n Panel
Sta. %
n Panel
Sta. %
Gross sample 2009 1,250 - 1,250 - 1,250 - 1,250 - 5,000 -
Interviews wave 1 2009
405 - 396 - 377 - 353 - 1,531 -
Interviews wave 2 2010 302 74.6 310 78.3 291 77.2 253 71.7 1,158 75.7
Interviews wave 3 2011 247 81.8 257 82.9 252 86.6 214 84.6 973 84.0
1 Low Cash = 5 € household interview + 5 € for each personal interview Moderate Cash = 5 € household interview + 10 € for each personal interview Choice = Choice between lottery ticket and Low Cash SOEP classic = lottery ticket (ARD lottery “Ein Platz an der Sonne”)
TNS Infratest Sozialforschung 2011

77SOEP Wave Report 2011
sectIoN II the soeP INNoVatIoN saMPLe
Table 3.6:
Individual Questionnaires: Preliminary Volumes and response rates of Main fieldwork Period
Interviews Response Rate
Individual questionnaire 1,625 84.7%
New born mother and child questionnaire A1 34 97.1%
Mother and child questionnaire B2 43 93.5%
Mother and child questionnaire C3 292 97.9%
1 Mothers (or main childcarer) of children up to 23 months old2 Mothers (or main childcarer) of children between 24 and 47 months old3 Mothers (or main childcarer) of children older than 48 months
TNS Infratest Sozialforschung 2011
caregiver, in most cases their mothers. Due to the fact that the “mother-child modules” were integrated into the individual questionnaire and not handed out sepa-rately, the dropout rate is quite low. For each child, each household member has been asked whether he/she is the main caregiver of the respective child. If he/she answe-red yes, he/she was given the corresponding module. Therefore, the “mother-child modules” would only fail to appear when every household member answered no to being the child’s main caregiver. The response rate for each module is presented in table 3.6.
Overall, the individual response rate for the main per-sonal questionnaire are significantly lower than for the SOEP’s main sample, including the new refreshment sample J. TNS Infratest will, together with the academic SOEP group at DIW Berlin, discuss the most important ways that can help to increase the participating ratios for individuals. One of the key components will be a sepa-rate and central interviewer training conference before the start of the fieldwork in late August.

SOEP Wave Report 201178
Part III: sUMMarY rePort soeP fIeLDWorK IN 2011
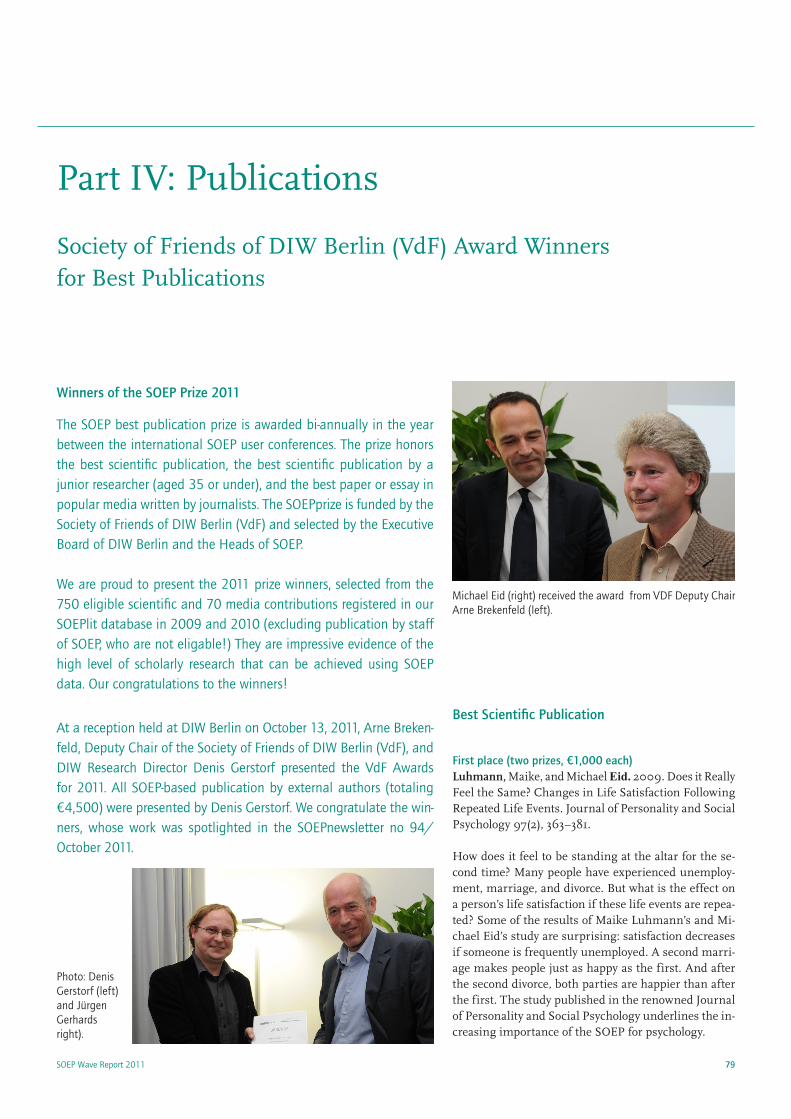
79SOEP Wave Report 2011
Part IV: Publications
Society of Friends of DIW Berlin (VdF) Award Winners for Best Publications
Winners of the SOEP Prize 2011
The SOEP best publication prize is awarded bi-annually in the year between the international SOEP user conferences. The prize honors the best scientific publication, the best scientific publication by a junior researcher (aged 35 or under), and the best paper or essay in popular media written by journalists. The SOEPprize is funded by the Society of Friends of DIW Berlin (VdF) and selected by the Executive Board of DIW Berlin and the Heads of SOEP.
We are proud to present the 2011 prize winners, selected from the 750 eligible scientific and 70 media contributions registered in our SOEPlit database in 2009 and 2010 (excluding publication by staff of SOEP, who are not eligable!) They are impressive evidence of the high level of scholarly research that can be achieved using SOEP data. Our congratulations to the winners!
At a reception held at DIW Berlin on October 13, 2011, Arne Breken-feld, Deputy Chair of the Society of Friends of DIW Berlin (VdF), and DIW Research Director Denis Gerstorf presented the VdF Awards for 2011. All SOEP-based publication by external authors (totaling €4,500) were presented by Denis Gerstorf. We congratulate the win-ners, whose work was spotlighted in the SOEPnewsletter no 94/October 2011.
Best Scientific Publication
First place (two prizes, €1,000 each) Luhmann, Maike, and Michael Eid. 2009. Does it Really Feel the Same? Changes in Life Satisfaction Following Repeated Life Events. Journal of Personality and Social Psychology 97(2), 363–381.
How does it feel to be standing at the altar for the se-cond time? Many people have experienced unemploy-ment, marriage, and divorce. But what is the effect on a person’s life satisfaction if these life events are repea-ted? Some of the results of Maike Luhmann’s and Mi-chael Eid’s study are surprising: satisfaction decreases if someone is frequently unemployed. A second marri-age makes people just as happy as the first. And after the second divorce, both parties are happier than after the first. The study published in the renowned Journal of Personality and Social Psychology underlines the in-creasing importance of the SOEP for psychology.
Michael Eid (right) received the award from VDF Deputy Chair Arne Brekenfeld (left).
Photo: Denis Gerstorf (left) and Jürgen Gerhards right).

SOEP Wave Report 201180
Part IV: PUBLIcatIoNs
Gerhards, Jürgen, and Silke Hans. 2009. From Hasan to Herbert: Name-Giving Patterns of Immigrant Parents between Acculturation and Ethnic Maintenance. Ame-rican Journal of Sociology 114(4), 1102–1128.
Should our son be called Herbert, or is it better to call him Hasan? In their study, Jürgen Gerhards and Silke Hans investigated the naming behavior of immigrants. The result: children with non-German citizenship tend to have names which are only used in the country of ori-gin. The higher the parents’ income and the more edu-cated they are, the more likely they are to choose a com-mon German name for their sons or daughters. From a striking perspective, the authors paint a varied picture of assimilation of immigrants in Germany. The naming behavior emerges as an unexpectedly sensitive and ef-ficient indicator. The extraordinary research work was quite rightly published in the renowned AJS.
Second place (two prizes, €500 each)Gutiérrez-i-Puigarnau, Eva, and Jos van Ommeren. 2010. Labour Supply and Commuting. Journal of Urban Eco-nomics 68(1), 82–89.
The further commuters live away from their place of work, the more time they spend at work. This is the re-sult of the study by Eva Gutiérrez-i-Puigarnau and Jos van Ommeren. Using the SOEP data, the economists have for the first time investigated what impact the di-stance between home and work has on working hours. The publication proves that commuters tend to work longer hours, not only on a daily basis but also calcula-ted as a total for the working week. We can assume that this finding will lead to further studies. This is how re-search should work: new answers lead to new questions.
Grund, Christian, and Dirk Sliwka. 2010. Evidence on performance pay and risk aversion. Economics Letters 106(1), 8–11.
A willingness to take risks pays off—at least in profes-sional life. This is what Christian Grund and Dirk Sliw-ka discovered from a longitudinal perspective. On the basis of the SOEP data, they were able to show that the work of employees who take risks is valued more highly by their superiors. And that leads to performance-con-tingent wages. This study thus points the way towards further, more in-depth analyses.
Best Junior Papers (two prizes, €500 each)
Traunmüller, Richard. 2009. Religion und Sozialinte-gration. Eine empirische Analyse der religiösen Grund-
lagen sozialen Kapitals. Berliner Journal für Soziologie 19(3), 435–468.
People who regularly go to church have a wider circle of friends and more contact with their neighbors than those who are not religious. Protestants are more likely to do work on a voluntary basis and in associations than Catholics and Muslims. These are the key results of the publication by Richard Traunmüller. Researching at the University of Konstanz using SOEP data, the young so-cial scientist carried out the first empirical investiga-tion on the significance of religion for social cohesion in Germany.
Pfeifer, Christian, and Thomas Cornelißen. 2010. The Impact of Participation in Sports on Educational At-tainment—New Evidence from Germany. Economics of Education Review 29(1), 94–103.
People who take part in sporting activities when they are young, particularly competitive sports, are also suc-cessful at school and in their careers. These are the fin-dings of the recent study by Christian Pfeifer and Tho-mas Cornelißen. Sports bring advantages for girls in particular, the authors discovered. Apparently, behavi-or learned through sports promotes competitive thin-king, for instance.
Best Journalistic Publication (€500)
Bernau, Patrick. 2010. Unserer Mittelschicht geht es prächtig. Frankfurter Allgemeine Sonntagszeitung, July 18, 2010.
“The middle class feel they have been squeezed by the state like a lemon. Without justification,” writes Patrick Bernau in an extensive contribution in the Frankfurter Allgemeine Sonntagszeitung. In his article, which is ca-refully researched down to the last detail as well as being entertaining and readable, the economic editor dispels the widespread myth of the disadvantaged middle class.

81SOEP Wave Report 2011
socIetY of frIeNDs of DIW BerLIN (VDf) aWarD WINNersfor Best PUBLIcatIoNs
DIW Prizes
First category for the best article in a peer-reviewed journal
Nicolas Ziebarth received the award in the first category for the best article in a peer-reviewed journal (€2,500) for his 2010 article in the Economic Journal: “Price Elas-ticities of Convalescent Care Programmes.” The paper was adapted from a chapter of his dissertation, which is entitled “Sickness Absence and Economic Incentives.” VdF Chair Arne Brekenfeld commented: “There are hy-potheses and also statistical correlations for the connec-tion between the use and price of health services. Nico-las Ziebarth goes a major step further in his work. He succeeds in showing that the 1997 increase in individual contributions to health care funds is indeed the cause of a substantial reduction in convalescent care programs.”
Second category for the best DIW Berlin Wochenbericht
The award in the second category for the best DIW Ber-lin Wochenbericht (€2,500 euros) went to Joachim R. Frick (†) and Markus Grabka for their article in Issue 3 / 2010 “Old-age pension entitlements mitigate inequa-lity—but concentration of wealth remains high” and to Stefan Bach for his article in Issue 50 / 2010: “Pub-lic debt and macroeconomic balance sheets: public po-verty and private aff luence.” In his laudatory address, Brekenfeld commented that “the researchers deal with the important issue of wealth distribution in Germany from very different perspectives. Both authors have suc-ceeded convincingly in providing a new empirical ba-sis for the debate.”
Photo: Joachim R. Frick (†) (right) together with Markus M. Grabka (middle) received the award for the best DIW Berlin Wochenbericht on October 13, 2011. This was the last time Joachim was able to attend a public event before he passed away in December 2011.
Photo: Nicolas Ziebarth (right) received the award from VDF Deputy Chair Arne Brekenfeld (left).

Part IV: PUBLIcatIoNs
SOEP Wave Report 201182
SSCI-Publications 2011
Social Sciences Citation Index (SSCI) is an interdisciplinary citation
index product of Thomson Reuters' Healthcare & Science division. It was
developed by the Institute for Scientific Information (ISI) from the Science
Citation Index.
Liebig, Stefan, Carsten Sauer, and Jürgen Schupp (2011): Die wahrge-nommene Gerechtigkeit des eigenen Erwerbseinkommens: geschlecht-stypische Muster und die Bedeutung des Haushaltskontextes. In: Köl-ner Zeitschrift für Soziologie und Sozialpsychologie, 63. Jg., Heft 1, S. 33-59 .
Lohmann, Henning (2011): Comparability of EU-SILC Survey and Re-gister Data: The Relationship among Employment, Earnings and Po-verty. In: Journal of European Social Policy, 21. Jg., Heft 1, S. 37-54.
Riediger, Michaela, Cornelia Wrzus, Florian Schmiedek, Gert G. Wag-ner, Ulman Lindenberger. 2011. Is Seeking Bad Mood Cognitively De-manding?: Contra-Hedonic Orientation and Working-Memory Capaci-ty in Everyday Life In: Emotion11,no. 3 , 656-665.
Siedler, Thomas (2011): Parental Unemployment and Young People’s Extreme Right-Wing Party Affinity: Evidence from Panel Data. In: Journal of the Royal Statistical Society, 174. Jg., Heft 3, S. 737-758.
Trzcinski, Eileen, and Elke Holst (2011): Gender Differences in Sub-jective Well-Being in and out of Management Positions. In: Social In-dicators Research [im Ersch.].
Anger, Silke (2011): The Cyclicality of Effective Wages within Emplo-yer-Employee Matches in a Rigid Labor Market. In: Labour Economic, 18. Jg., Heft 6, S. 786-797.
Anger, Silke, Michael Kvasnicka, and Thomas Siedler (2011): One Last Puff? Public Smoking Bans and Smoking Behavior. In: Journal of Health Economics, 30. Jg., Heft 3, S. 591-601.
Berger, Eva M., and C. Katharina Spieß (2011): Maternal Life Satis-faction and Child Outcomes: Are They Related? In: Journal of Econo-mic Psychology, 32. Jg., Heft 1, S. 142-158.
Coneus, Katja, and C. Katharina Spieß (2011): Pollution Exposure and Child Health: Evidence for Infants and Toddlers in Germany. In: Journal of Health Economics [im Ersch.] [online first: 2011-10-04].
D’Ambrosio, Conchita, and Joachim R. Frick (2011): Individual Well-being in a Dynamic Perspective. In: Economica [im Ersch.] [online first: 2011-08-02].
Dohmen, Thomas, Armin Falk, David Huffman, Uwe Sunde, Jürgen Schupp, and Gert G. Wagner. 2011. Individual Risk Attitudes: Measu-rement, Determinants and Behavioral Consequences. Journal of the European Economic Association 9, no. 3, 522-550.
Fräßdorf, Anna, Markus M. Grabka, and Johannes Schwarze (2011): The Impact of Household Capital Income on Income Inequality: A Factor Decomposition Analysis for the UK, Germany and the USA. In: Journal of Economic Inequality, 9. Jg., Heft 1, S. 35-56.
Infurna, Frank J., Denis Gerstorf, Nilam Ram, Jürgen Schupp, and Gert G. Wagner. 2011. Long-Term Antecedents and Outcomes of Perceived Control. Psychology and Aging 26, no. 3, 559-575.
Lang, Frieder R., Dennis John, Oliver Lüdtke, Jürgen Schupp, and Gert G. Wagner. 2011. Short assessment of the Big Five: robust across sur-vey methods except telephone interviewing. Behavior Research Me-thods 43, no. 2, 548-567.

83SOEP Wave Report 2011
SOEPpapers 2011http://www.diw.de/soeppapers
SOEPpapers is an ongoing series publishing papers based on SOEP data either directly or as part of an international comparative da-taset (for example CNEF, ECHP, LIS, LWS, CHER/PACO). Opinions expressed in SOEPpapers are those of the authors and do not neces-sarily reflect views of the DI W Berlin.
351Beyond GDP and Back: What is the Value-Added by Additional Components of Welfare Measurement?Sonja C. Kassenböhmer, Christoph M. Schmidt
352Assessing the Effectiveness of Health Care Cost Containment Measures Nicolas R. Ziebarth
353Employed but Still Unhappy?: On the Relevance of the Social Work NormAdrian Chadi
354Remittances and Gender: Theoretical Considerations and Empiri-cal EvidenceElke Holst, Andrea Schäfer, Mechthild Schrooten
355Long-Term Antecedents and Outcomes of Perceived Control Frank J. Infurna, Denis Gerstorf, Nilam Ram, Jürgen Schupp, Gert G. Wagner
356Why Men Might “Have It All” While Women Still Have to Choose between Career and Family in GermanyEileen Trzcinski, Elke Holst
357Gender-Specific Occupational Segregation, Glass Ceiling Effects, and Earnings in Managerial Positions: Results of a Fixed Effects ModelAnne Busch, Elke Holst
358Personal Bankruptcy Law, Wealth and Entrepreneurship: Theory and Evidence from the Introduction of a “Fresh Start” Frank M. Fossen
359Extending the Empirical Basis for Wealth Inequality Research Using Statistical Matching of Administrative and Survey Data Anika Rasner, Joachim R. Frick, Markus M. Grabka
360The Social Comparison Scale: Testing the Validity, Reliability, and Applicability of the Iowa-Netherlands Comparison Orientation Measure (INCOM) on the German Population Simone Schneider, Jürgen Schupp
361Does a Better Job Match Make Women Happier?: Work Orienta-tions, Work-Care Choices and Subjective Well-Being in Germany Ruud Muffels, Bauke Kemperman
362Lebenszufriedenheit und Einkommensreichtum: eine empirische Analyse mit dem SOEP André Hajek
363Gregariousness, Interactive Jobs and Wages Friedhelm Pfeiffer, Nico Johannes Schulz
364Task-Biased Changes of Employment and Remuneration: The Case of Occupations Stephan Kampelmann, Francois Rycx

SOEP Wave Report 201184
Part IV: PUBLIcatIoNs
366How Important is the Family?: Evidence from Sibling Correlations in Permanent Earnings in the US, Germany and Denmark Daniel D. Schnitzlein
367The Bigger the Children, the Bigger the Worries: Are Preschoolers and Adolescents Affected Differently by Family Instability with Regard to Non-Cognitive Skills? Frauke H. Peter, C. Katharina Spiess
368How Far Do Children Move?: Spatial Distances After Leaving the Parental Home Thomas Leopold, Ferdinand Geißler, Sebastian Pink
369Personality Characteristics and the Decision to Become and Stay Self-Employed Marco Caliendo, Frank M. Fossen, Alexander S. Kritikos
370Measuring Individual Risk Attitudes in the Lab: Task or Ask?: An Empirical Comparison Jan-Erik Lönnqvist, Markku Verkasalo, Gari Walkowitz, Philipp C. Wichardt
371Eine ökonometrische Analyse der Liquiditätsbeschränkung deut-scher Haushalte im Lichte der US-Immobilienkrise Robert Maderitsch
372Specification and Estimation of Rating Scale Models - with an Application to the Determinants of Life Satisfaction Raphael Studer, Rainer Winkelmann
373Post-Socialist Culture and Entrepreneurship Petrik Runst
374Laufbahnklassen - zur empirischen Umsetzung eines dynamisiser-ten Klassenbegriffs mithilfe von Sequenzanalysen Olaf Groh-Samberg, Florian R. Hertel
375Spillover Effects of Maternal Education on Child’s Health and Schooling Daniel Kemptner, Jan Marcus
376Are Self-Employed Really Happier than Employees?: An Approach Modelling Adaptation and Anticipation Effects to Self-Employ-
ment and General Job Changes Dominik Hanglberger, Joachim Merz
377Stability and Change of Personality across the Life Course: The Im-pact of Age and Major Life Events on Mean-Level and Rank-Order Stability of the Big Five Jule Specht, Boris Egloff, Stefan C. Schmukle
378Entwicklung der Altersarmut in Deutschland Jan Goebel, Markus M. Grabka
379Re-engaging with Survey Non-respondents: The BHPS, SOEP and HILDA Survey Experience Nicole Watson, Mark Wooden
380Cardiovascular Consequences of Unfair Pay Armin Falk, Ingo Menrath, Pablo Emilio Verde, Johannes Siegrist
381Health Effects on Children’s Willingness to Compete Björn Bartling, Ernst Fehr, Daniel Schunk 382Behind the Curtain: The Within-Household Sharing of Income Susanne Elsas
383A Behaviouristic Approach for Measuring Poverty: The Decomposi-tion Approach—Empirical Illustrations for Germany 1995-2009 Jürgen Faik
384The Effect of Subsidized Employment on Happiness Benjamin Crost
385Capabilities and Choices: Do They Make Sen’se for Understanding Objective and Subjective Well-Being?: An Empirical Test of Sen’s Capability Framework on German and British Panel Data Ruud Muffels, Bruce Headey
386Using Geographically Referenced Data on Environmental Exposu-res for Public Health Research: A Feasibility Study Based on the German Socio-Economic Panel Study (SOEP) Sven Voigtländer, Jan Goebel, Thomas Claßen, Michael Wurm, Ursula Berger, Achim Strunk, Hendrik Elbern
387Regional Unemployment and Norm-Induced Effects on Life Satisfaction Adrian Chadi
85SOEP Wave Report 2011
soePPaPers 2011
388Arbeitszufriedenheit und Persönlichkeit: »Wer schaffen will, muss fröhlich sein!« Simon Fietze
389Population Aging and Individual Attitudes toward Immigration: Disentangling Age, Cohort and Time Effects Lena Calahorrano
390Measuring Time Use in Surveys - How Valid Are Time Use Questi-ons in Surveys?: Concordance of Survey and Experience Sampling Measures Bettina Sonnenberg, Michaela Riediger, Cornelia Wrzus, Gert G. Wagner
391The Double German Transformation: Changing Male Employment Patterns in East and West Germany Julia Simonson, Laura Romeu Gordo, Nadiya Kelle
392Surfing Alone? The Internet and Social Capital: Evidence from an Unforeseen Technological Mistake Stefan Bauernschuster, Oliver Falck, Ludger Wößmann
393Does Unemployment Hurt Less if There Is More of It Around?: A Panel Analysis of Life Satisfaction in Germany and Switzerland Daniel Oesch, Oliver Lipps
394Continuous Training, Job Satisfaction and Gender: An Empirical Analysis Using German Panel Data Claudia Burgard, Katja Görlitz
395Lower and Upper Bounds of Unfair Inequality: Theory and Evi-dence for Germany and the US Judith Niehues, Andreas Peichl
396Longevity, Life-Cycle Behavior and Pension Reform Peter Haan, Victoria Prowse
397A Wealth Tax on the Rich to Bring down Public Debt?: Revenue and Distributional Effects of a Capital Levy Stefan Bach, Martin Beznoska, Viktor Steiner
398Comparing the Predicitive Power of Subjective and Objective Health Indicators: Changes in Hand Grip Strength and Overall
Satisfaction with Life as Predictors of Mortality Jens Ambrasat, Jürgen Schupp, Gert G. Wagner
399Changing Identity: Retiring from Unemployment Clemens Hetschko, Andreas Knabe, Ronnie Schöb
400Der Einfluss der Gesundheitszufriedenheit auf die Sportaktivität: eine empirische Längsschnittanalyse mit den Daten des sozio-oekonomischen Panels Simone Becker 401A New Framework of Measuring Inequality: Variable Equivalence Scales and Group-Specific Well-Being Limits: Sensitivity Findings for German Personal Income Distribution 1995-2009 Jürgen Faik
402Reciprocity and Workers’ Tastes for Representation Uwe Jirjahn, Vanessa Lange
403A Critique and Reframing of Personality in Labour Market Theory: Locus of Control and Labour Market Outcomes Eileen Trzcinski, Elke Holst 404Spite and Cognitive Skills in Preschoolers Elisabeth Bügelmayer, C. Katharina Spieß
405The Economic Impact of Social Ties: Evidence from German Reunification Konrad B. Burchardi, Tarek A. Hassan
406Wandel von Erwerbsbeteilung westdeutscher Frauen nach der Erstgeburt: Ein Vergleich der zwischen 1936 und 1965 geborenen Kohorten Nadiya Kelle
407Bestimmung der Herkunftsnationen von Teilnehmern des Sozio-oekonomischen Panels (SOEP) mit Migrationshintergrund Friedrich Scheller
408The Effect of Health and Employment Risks on Precautionary Savings Johannes Geyer 409Neighborhood Effects and Individual Unemployment Thomas K. Bauer, Michael Fertig, Matthias Vorell

SOEP Wave Report 201186
Part IV: PUBLIcatIoNs
410Residential Segregation and Immigrants’ Satisfaction with the Neighborhood in Germany Verena Dill, Uwe Jirjahn, Georgi Tsertvadze 411Intensity of Time and Income Interdependent Multidimensional Poverty: Well-Being and Minimum 2DGAP - German Evidence Joachim Merz, Tim Rathjen
412Intergenerational Transmission of Risk Attitudes: A Revealed Preference Approach Andrea Leuermann, Sarah Necker
413
Testing the ‘Residential Rootedness’: Hypothesis of Self-Employ-ment for Germany and the UK Darja Reuschke, Maarten Van Ham
414Predicting the Trend of Well-Being in Germany: How Much Do Comparisons, Adaptation and Sociability Matter? Stefano Bartolini, Ennio Bilancini, Francesco Sarracino
415So Far so Good: Age, Happiness, and Relative Income Felix R. FitzRoy, Michael A. Nolan, Max F. Steinhardt, David Ulph
416Ethnic Residential Segregation and Immigrants’ Perceptions of Discrimination in West Germany Verena Dill, Uwe Jirjahn
417Self-Employment and Geographical Mobility in Germany Darja Reuschke
418Selbständigkeit von Personen mit Migrationshintergrund in Deutschland: Ursachen ethnischer UnternehmungBella Struminskaya 419Redistribution and Insurance in the German Welfare State Charlotte Bartels
420Smoking and Returns to Education: Empirical Evidence for Germany Julia Reilich
421You Don’t Know What You’ve Got till It’s Gone! Unemployment and Intertemporal Changes in Self-Reported Life Satisfaction Marcus Klemm
422Maternal Labor Market Return, Parental Leave Policies, and Gen-der Inequality in Housework Pia S. Schober
423In Absolute or Relative Terms?: How Framing Prices Affects the Consumer Price Sensitivity of Health Plan Choice Hendrik Schmitz, Nicolas R. Ziebarth 424Work Hours Constraints and Health David Bell, Steffen Otterbach, Alfonso Sousa-Poza 425Multidimensional Well-being at the Top: Evidence for Germany Andreas Peichl, Nico Pestel 426The Effect of Relative Standing on Considerations about Self-employment Stefan Schneck
427Asymptotic Income Distribution in the German Socio-Economic Panel (SOEP): Income Inequality and Darwinian Fitness Diego Montano
428Gefühlte Unsicherheit - Deprivationsängste und Abstiegssorgen der Bevölkerung in Deutschland Nadine M. Schöneck, Steffen Mau, Jürgen Schupp
429Erwerbsverläufe und Alterseinkünfte im Paar- und Haushaltskon-text Falko Trischler, Ernst Kistler
87SOEP Wave Report 2011
SOEP Survey Papers 2011http://www.diw.de/soepsurveypapers
Running since 1984, the German Socio-Economic Panel Study (SOEP) is a wide-ranging representative longitudinal study of private households, located at the German Institute for Economic Research, DIW Berlin.
The aim of the SOEP Survey Papers Series is to thoroughly document the survey's data collection and data processing.
The SOEP Survey Papers is comprised of the following series:
Series A – Survey Instruments (Feldinstrumente) Series B – Survey Reports (Methodenberichte) Series C – Data Documentations (Datendokumentationen) Series D – Variable Description and Coding Series E – SOEPmonitors Series F – SOEP Newsletters Series G – General Issues and Teaching Materials
Editors:
Prof. Dr. Gert G. Wagner, DIW Berlin and Technische Universität Berlin Prof. Dr. Jürgen Schupp, DIW Berlin and Freie Universität Berlin
series B – survey reports (Methodenberichte)
1SOEP 1984 – Methodenbericht zum Befragungsjahr 1984 (Welle 1) des Sozio-oekonomischen Panels
2SOEP 1984 – Pretestbericht und Tabellen zum Befragungsjahr 1984 (Welle 1) des Sozio-oekonomischen Panels (vorläufige Fassung)
3SOEP 1985 – Methodenbericht zum Befragungsjahr 1985 (Welle 2) des Sozio-oekonomischen Panels
4SOEP 1985 –Pretestbericht zum Befragungsjahr 1985 (Welle 2) des Sozio-oekonomischen Panels (Zwischenbericht)
5SOEP 1986 – Methodenbericht zum Befragungsjahr 1986 (Welle 3) des Sozio-oekonomischen Panels
6SOEP 1986 – Pretestbericht zum Befragungsjahr 1986 (Welle 3) des Sozio-oekonomischen Panels (Zwischenbericht)
7SOEP 1987 – Methodenbericht zum Befragungsjahr 1987 (Welle 4) des Sozio-oekonomischen Panels
8SOEP 1984 – Erhebungsinstrumente 1984 (Welle 1) des Sozio-oekonomischen Panels
9SOEP 1988 – Methodenbericht zum Befragungsjahr 1988 (Welle 5) des Sozio-oekonomischen Panels

SOEP Wave Report 201188
Part IV: PUBLIcatIoNs
10SOEP 1988 – Pretestbericht zum Befragungsjahr 1988 (Welle 5) des Sozio-oekonomischen Panels (Zwischenbericht)
11SOEP 1988 – Pre-Pretestbericht zum Befragungsjahr 1988 (Welle 5) des Sozio-oekonomischen Panels (Erfahrungsbericht)
12SOEP 1989 – Pretestbericht zum Befragungsjahr 1989 (Welle 6) des Sozio-oekonomischen Panels (Zwischenbericht)
13SOEP 1989/90 – Methodenbericht zu den Befragungsjahren 1989/90 (Wellen 6-7) des Sozio-oekonomischen Panels
14SOEP 1990/91 – Methodenbericht Ostdeutschland zu den Befragungsjahren 1990 - 1991 (Welle 1/2 - Ost) des Sozio-oekono-mischen Panels
15SOEP 1990 – Pretestbericht zum Befragungsjahr 1990 (Welle 7) des Sozio-oekonomischen Panels
16SOEP 1985 – Erhebungsinstrumente 1985 (Welle 2) des Sozio-oekonomischen Panels
17SOEP 1990 – Pretestbericht "Zeitverwendung und -präferenzen" zum Befragungsjahr 1990 (Welle 7) des Sozio-oekonomischen Panels (Vorerhebung)
18SOEP 1991 – Methodenbericht zum Befragungsjahr 1991 (Welle 8 - West) des Sozio-oekonomischen Panels
19SOEP 1991 – Pretestbericht zum Befragungsjahr 1991 (Welle 8) des Sozio-oekonomischen Panels
20SOEP 1991 – Pretestbericht "Familie und Unterstützungsleistun-gen" zum Befragungsjahr 1991 (Welle 8) des Sozio-oekonomi-schen Panels (Fragebogentest)
21SOEP 1992 – Methodenbericht zum Befragungsjahr 1992 (Welle 9/West und Welle 3/Ost) des Sozio-oekonomischen Panels
22SOEP 1992 – Pretestbericht zum Befragungsjahr 1992 (Welle 9) des Sozio-oekonomischen Panels (Testerhebungen)
23SOEP 1993 – Methodenbericht zum Befragungsjahr 1993 (Welle 10/West und Welle 4/Ost) des Sozio-oekonomischen Panels
24SOEP 1993 – Pretestbericht zum Befragungsjahr 1993 (Welle 10) des Sozio-oekonomischen Panels
25SOEP 1994 – Methodenbericht zum Befragungsjahr 1994 (Welle 11/West und Welle 5/Ost) des Sozio-oekonomischen Panels
26SOEP 1994 – Methodenbericht Zuwanderer-Befragung (Teilstich-probe D1) zum Befragungsjahr 1994 (Welle 11) des Sozio-oekono-mischen Panels
27SOEP 1995 – Methodenbericht zum Befragungsjahr 1995 (Welle 12/West und Welle 6/Ost) des Sozio-oekonomischen Panels
28SOEP 1995 – Methodenbericht Zuwanderer-Befragung II (Zweitbe-fragung D1, Erstbefragung D2) zum Befragungsjahr 1995 (Welle 12) des Sozio-oekonomischen Panels
29SOEP 1996 – Methodenbericht zum Befragungsjahr 1996 (Wellen 13/7/2) des Sozio-oekonomischen Panels
30SOEP 1996 – Pretestbericht Personenfragebogen 1 und Personen-fragebogen 2 zum Befragungsjahr 1996 (Welle 13) des Sozio-oekonomischen Panels
31SOEP 1997 – Methodenbericht zum Befragungsjahr 1997 (Welle 14) des Sozio-oekonomischen Panels
32SOEP 1998 – Methodenbericht zum Befragungsjahr 1998 (Welle 15) des Sozio-oekonomischen Panels
33SOEP 1998 – Methodenbericht Erstbefragung der Stichprobe E zum Befragungsjahr 1998 (Welle 15) des Sozio-oekonomischen Panels
34SOEP 1999 – Methodenbericht zum Befragungsjahr 1999 (Welle 16) des Sozio-oekonomischen Panels
35SOEP 1999 – Pretestbericht zum Befragungsjahr 1999 (Welle 16) des Sozio-oekonomischen Panels

89SOEP Wave Report 2011
soeP sUrVeY PaPers 2011
36SOEP 2000 – Methodenbericht zum Befragungsjahr 2000 (Welle 17) des Sozio-oekonomischen Panels
37SOEP 2000 – Methodenbericht erste Welle der SOEP-Stichprobe F zum Befragungsjahr 2000 (Welle 17) des Sozio-oekonomischen Panels
38SOEP 2001 – Methodenbericht zum Befragungsjahr 2001 (Welle 18) des Sozio-oekonomischen Panels
39SOEP 2001 – Methodenbericht zweite Welle der SOEP-Stichprobe F zum Befragungsjahr 2001 (Welle 18) des Sozio-oekonomischen Panels
40SOEP 2001 – Pretestbericht Feasibility Study zum Befragungsjahr 2001 (Welle 18) des Sozio-oekonomischen Panels (1. Zwischenbe-richt)
41SOEP 2001 – Pretestbericht Feasibility Study zum Befragungsjahr 2001 (Welle 18) des Sozio-oekonomischen Panels (2. Zwischenbe-richt)
42SOEP 2001 – Pretestbericht Feasibility Study zum Befragungsjahr 2001 (Welle 18) des Sozio-oekonomischen Panels (3. Bericht)
43SOEP 2002 – Methodenbericht zum Befragungsjahr 2002 (Welle 19) des Sozio-oekonomischen Panels
44SOEP 2002 – Methodenbericht Sondererhebung Hocheinkom-mensstichprobe zum Befragungsjahr 2002 (Welle 19) des Sozio-oekonomischen Panels
45SOEP 2002 – Methodenbericht dritte Welle der SOEP-Stichprobe F zum Befragungsjahr 2002 (Welle 19) des Sozio-oekonomischen Panels
46SOEP 2003 – Methodenbericht zum Befragungsjahr 2003 (Welle 20) des Sozio-oekonomischen Panels)
47SOEP 2003 – Methodenbericht zweite Welle der Sondererhebung Hocheinkommensstichprobe zum Befragungsjahr 2003 (Welle 20) des Sozio-oekonomischen Panels
48SOEP 2003 – Erweiterter Pretestbericht zum Befragungsjahr 2003 (Welle 20) des Sozio-oekonomischen Panels - Fragebogen und Verhaltensexperiment
49SOEP 2004 – Methodenbericht zum Befragungsjahr 2004 (Welle 21) des Sozio-oekonomischen Panels
50SOEP 2004 – Methodenbericht SOEP Online Pilotstudie zum Befra-gungsjahr 2004 (Welle 21) des Sozio-oekonomischen Panels
51SOEP 2004 – Erweiterter Pretestbericht zum Befragungsjahr 2004 (Welle 21) des Sozio-oekonomischen Panels - Fragebogen und Verhaltensexperiment
52SOEP 2005 – Methodenbericht zum Befragungsjahr 2005 (Welle 22) des Sozio-oekonomischen Panels
53SOEP 2005 – Erweiterter Pretestbericht zum Befragungsjahr 2005 (Welle 22) des Sozio-oekonomischen Panels - „Perönlichkeit und Politik" und Verhaltensexperiment
54SOEP 2005 – Pretestbericht zum Befragungsjahr 2005 (Welle 22) des Sozio-oekonomischen Panels - „Mutter und Kind 2"
55SOEP 2006 – Methodenbericht Wiederbefragung von Panelaus-fällen zum Befragungsjahr 2006 (Welle 22) des Sozio-oekonomi-schen Panels (SOEP 2006 Innovationsprojekte)
56SOEP 2006 – Methodenbericht Interviewerbefragung zum Befra-gungsjahr 2006 (Welle 23) des Sozio-oekonomischen Panels
57SOEP 2006 – Methodenbericht Erstbefragung der Ergänzungs-stichprobe H zum Befragungsjahr 2006 (Welle 23) des Sozio-oekonomischen Panels
58SOEP 2006 – Pretestbericht zum Befragungsjahr 2006 (Welle 23) des Sozio-oekonomischen Panels - „Persönlichkeit und Alltag"
59SOEP 2006 – Pretestbericht zum Befragungsjahr 2006 (Welle 23) des Sozio-oekonomischen Panels - „Persönlichkeit und Gemein-schaft"
SOEP Wave Report 201190
Part IV: PUBLIcatIoNs
60SOEP 2006 – Pretestbericht zum Befragungsjahr 2006 (Welle 23) des Sozio-oekonomischen Panels - „Jugend"
61SOEP 2006 – Methodenbericht zum Befragungsjahr 2006 (Welle 23) des Sozio-oekonomischen Panels
62SOEP 2007 – Methodenbericht zum Befragungsjahr 2007 (Welle 24) des Sozio-oekonomischen Panels
63SOEP 2007 – Methodenbericht CAPI-Innovationsbefragung zum Befragungsjahr 2007 (Welle 24) des Sozio-oekonomischen Panels – „Persönlichkeit und Gesundheit
64SOEP 2007 – Pretestbericht zum Befragungsjahr 2007 (Welle 24) des Sozio-oekonomischen Panels - „Ihr Kind im Vorschulalter"
65SOEP 2007 – Methodenbericht Online-Befragung zum Befragungs-jahr 2007 (Welle 24) des Sozio-oekonomischen Panels - „Privatle-ben und Gemeinschaft"
66 SOEP 2008 – Methodenbericht zum Befragungsjahr 2008 (Welle 25) des Sozio-oekonomischen Panels
67SOEP 2008 – Pretestbericht zum Befragungsjahr 2008 (Welle 25) des Sozio-oekonomischen Panels – „Kompetenz- und Verhaltenstests mit Kindern im Vorschulalter in Kindertageseinrichtungen“
68SOEP 2008 – Pretestbericht zum Befragungsjahr 2008 (Welle 25) des Sozio-oekonomischen Panels – „Kompetenz- und Verhaltenstests mit Kindern im Vorschulalter unter Surveybedingungen“
69SOEP 2008 – Methodenbericht zur Testerhebung 2008 des Sozio-oekonomischen Panels - „Persönlichkeit, Gerechtigkeitsempfinden und Alltagsstimmung“
70SOEP 2009 – Methodenbericht zum Befragungsjahr 2009 (Welle 26) des Sozio-oekonomischen Panels
71SOEP 2009 – Pretestbericht zum Befragungsjahr 2009 (Welle 26) des Sozio-oekonomischen Panels –
„Kompetenz- und Verhaltenstests mit institutionell betreuten Kindern im Vorschulalter
72SOEP 2009 – Methodenbericht zur Testerhebung 2009 des Sozio-oekonomischen Panels - „Die Messung genetischer Grundlagen von Alltagsentscheidungen unter Surveybedingungen“
73SOEP 2009 – Methodenbericht Innovationssample zum Befra-gungsjahr 2009 (Welle 26) des Sozio-oekonomischen Panels (Erstbefragung Stichprobe I)
74SOEP 2009 – Pretestbericht zum Befragungsjahr 2009 (Welle 26) des Sozio-oekonomischen Panels – Haushaltsbilanz „Konsum“, „Krebsszenarien“ und sonstige Innova-tionsmodule
75SOEP 2010 – Methodenbericht zum Befragungsjahr 2010 (Welle 27) des Sozio-oekonomischen Panels
76SOEP 2010 – Methodenbericht zur Testerhebung 2010 des Sozio-oekonomischen Panels -„Soziale Netzwerke, ökonomische Suchtheorie und weitere Innova-tionsmodule“
78SOEP 2002 – Methodenbericht Verbleibstudie bei Panelausfällen im SOEP zum Befragungsjahr 2002 (Welle 19) des Sozio-oekonomischen Panels
91SOEP Wave Report 2011
soeP sUrVeY PaPers 2011
series a - survey instruments (feldinstrumente)
79SOEP 1986 – Erhebungsinstrumente 1986 (Welle 3) des Sozio-oekonomischen PanelsSOEP 1987 – Erhebungsinstrumente 1987 (Welle 4) des Sozio-oekonomischen Panels
81SOEP 1988 – Erhebungsinstrumente 1988 (Welle 5) des Sozio-oekonomischen Panels
82SOEP 1989 – Erhebungsinstrumente 1989 (Welle 6) des Sozio-oekonomischen Panels
83SOEP 1990 – Erhebungsinstrumente 1990 (Welle 7) des Sozio-oekonomischen Panels
84SOEP 1990 – Erhebungsinstrumente in der DDR 1990 (Welle 1) des Sozio-oekonomischen Panels
85SOEP 1991 – Erhebungsinstrumente 1991 (Welle 8) des Sozio-oekonomischen Panels
86SOEP 1991 – Erhebungsinstrumente Ost 1991 (Welle 2) des Sozio-oekonomischen Panels
87SOEP 1992 – Erhebungsinstrumente 1992 (Welle 9/West) des Sozio-oekonomischen Panels
88SOEP 1992 – Erhebungsinstrumente Ost 1992 (Welle 3) des Sozio-oekonomischen Panels
89SOEP 1993 – Erhebungsinstrumente 1993 (Welle 10/West) des Sozio-oekonomischen Panels
90SOEP 1993 – Erhebungsinstrumente Ost 1993 (Welle 4) des Sozio-oekonomischen Panels
91SOEP 1994 – Erhebungsinstrumente 1994 (Welle 11/West und Welle 5/Ost)des Sozio-oekonomischen Panels
92SOEP 1995 – Erhebungsinstrumente 1995 (Welle 12/West und Welle 6/Ost und Zuwanderer D1) des Sozio-oekonomischen Panels
93SOEP 1996 – Erhebungsinstrumente 1996 (Welle 13/West und Welle 7/Ost und Zuwanderer) des Sozio-oekonomischen Panels
94SOEP 1997 – Erhebungsinstrumente 1997 (Welle 14/West und Welle 8/Ost und Zuwanderer) des Sozio-oekonomischen Panels
95SOEP 1998 – Erhebungsinstrumente 1998 (Wellen 15/9/4) des Sozio-oekonomischen Panels
96SOEP 1999 – Erhebungsinstrumente 1999 (Wellen 16/10/5) des Sozio-oekonomischen Panels
97SOEP 2000 – Erhebungsinstrumente 2000 (Welle 17) des Sozio-oekonomischen Panels
98SOEP 2000 – Erhebungsinstrumente Aufstockung ISOEP 2000(1. Befragungsjahr) des Sozio-oekonomischen Panels
99SOEP 2001 – Erhebungsinstrumente 2001 (Welle 18) des Sozio-oekonomischen Panels

IN MeMorIaM JoachIM r. frIcK
SOEP Wave Report 201192
In Memoriam Joachim R. Frick
Our friend and colle-ague Joachim R. Frick passed away in Berlin on December 16, 2011, after a valiant fight with cancer. He was only 49 years old. With his death, the Socio-Econo-mic Panel at DIW Ber-lin has lost one of its most brilliant minds. It was in large part his hard work and tireless dedication that made the SOEP the interna-tionally networked re-
search infrastructure that it is today. His numerous publications made a major contribution to applied eco-nomic research, particularly in the field of distributio-nal analysis. His decades of unflagging commitment to the training of new generations of SOEP users will lea-ve behind a major void.
Joachim R. Frick was born in Trier on August 13, 1962. He studied economics, business, and sociology at the University of Trier and received an MA in Economics (Diplom-Volkswirt) in 1988. On a scholarship from the German Academic Exchange Service (DAAD), he at-tended graduate studies at Clark University in Worces-ter, MA (USA), where he gathered international experi-ence that would play an extraordinarily significant role in his subsequent work developing the SOEP study. In 1996, he received a PhD in Social Science (Dr. rer. soc.) from the Faculty of Social Sciences at the Ruhr Univer-sity Bochum with a dissertation entitled “Determinants of Regional Mobility.” In 2006, he was awarded his ha-bilitation (venia legendi) qualification in empirical eco-nomic research at the Berlin University of Technology (TU Berlin), where he served as Acting Professor of Em-pirical Economics in the Faculty of Economics and Ma-nagement (Faculty VII) from 2008 to 2009. Joachim R.
Frick began his work at DIW Berlin in January 1989. In 2004, he became Deputy Director of the Socio-Econo-mic Panel (SOEP) and Head of the SOEP Research Data Center (SOEP-RDC), where his responsibilities inclu-ded coordinating the integration of SOEP data into in-ternational comparative panel databases (CNEF, ECHP, and CHER).
Over the past ten years, Joachim R. Frick coordinated numerous externally funded projects, including many EU-financed research and infrastructural studies. He was Co-PI of a large-scale comparative analysis of social inequalities that was funded by the Russell Sage Foun-dation. His last major project, “Life Courses and Reti-rement Provisions in Transition,” which was funded by the Volkswagen Foundation, again broke new methodo-logical ground in the statistical matching of SOEP data and administrative data.
Joachim R. Frick’s research interests centered on ques-tions of social and welfare policy, and his work was con-sistently based on applied empirical analysis (focusing on issues of immigration, personal income distributi-on, housing costs, spatial mobility, and subjective well-being). Joachim R. Frick also earned international reco-gnition for his outstanding methodological work on the measurement of income (item non-response, imputati-on, and non-monetary income components).
His research papers were published in renowned scien-tific journals such as Ageing & Society, International Migration Review, Journal of Comparative Economics, Journal of European Social Policy, Journal of Ethnic and Migration Studies, Journal of Housing Economics, Jour-nal of Population Economics, Oxford Economic Papers, Population Research and Policy Review, Regional Stu-dies, Review of Income and Wealth, Sociological Me-thods and Research, Allgemeines Statistisches Archiv, Jahrbücher für Nationalökonomie und Statistik, and Kölner Zeitschrift für Soziologie und Sozialpsycholo-
Joachim R. Frick 13.08.1962 –16.12.2011
93SOEP Wave Report 2011
soeP sUrVeY PaPers 2011
gie. He also published numerous policy-oriented artic-les in the DIW-Wochenbericht series.
In fall of 2010, Joachim R. Frick was offered a full pro-fessorship (W3-Professur) at his alma mater and home-town university in Trier. He came very close to accept-ing the appointment, but after wrestling with the deci-sion at length, he declined the offer and chose instead to remain in Berlin. This decision was based on DIW Berlin’s offer to create a joint professorship (S-Profes-sur) for him that would allow him to continue in his po-sition at the SOEP while holding a full professorship at the Berlin University of Technology (TU Berlin). The TU Berlin Faculty Council had already set the official appointment procedure in motion when Joachim’s can-cer was discovered and his treatment began. It is tragic that his illness prevented him from attaining this ul-timate tribute to his outstanding achievements in re-search and teaching.
Joachim R. Frick and I shared responsibilities as De-puty Directors of the SOEP since 2004. Together with Gert G. Wagner, we formed a team that—despite our different temperaments and personalities—was united by our absolute commitment to the SOEP project. The-re is no denying that we were not above the pursuit of our own personal interests or that we each sought, to some extent, a higher formal position and more exter-nal recognition; but to my recollection, when it came to questions of loyalty to the department and to the study as a whole, we each set personal preferences aside, and it was only the best arguments that counted. After nu-merous, sometimes heated discussions behind closed doors, it was the greater good of the SOEP study that took precedence for all three of us.
Joachim and I were probably very similar in our almost fanatical commitment of both time and mental energy to this study. What he was able to do far better than I could was to foster a “corporate spirit” within the SOEP. Joachim had an extraordinary and to me almost mes-merizing ability to integrate talented young researchers into the SOEP community and to instill self-confidence in them—a “we are the champions” spirit that inspired belief in the importance of our work on the SOEP study.
It is for these reasons and many others that my colle-agues and I feel so keenly the loss of a good friend in Jo-achim R. Frick. Since 1989, when Joachim moved from Trier to Berlin and we spent several months living in a shared apartment, our friendship and my appreciati-on for his character have grown. Even then, Joachim’s affection and love for Kristine, who would later become his wife, impressed me as evidence that he is an abso-lutely reliable partner in both his personal and profes-
sional life, and someone who holds steadfastly to his commitments.
In February 2011, Joachim R. Frick and I took on joint re-sponsibility as Interim Department Directors for SOEP through the end of 2012. His terrible illness preven-ted him from carrying out this commitment. The rol-ler coaster ride of improvements and regressions in his treatment regimen, which at first appeared to offer cause for optimism, came to an abrupt halt in early Novem-ber, when we were all forced to realize that, regardless of our hopes, we would have to say goodbye to Joachim. Even during this awful phase, we could only marvel at how much affection and concern were expressed for our friend and colleague both directly and indirectly by col-leagues and friends from around the world. For weeks, they visited daily; everyone tried to give back some of the warmheartedness he had always conveyed to others.
Dear Joachim, you will be missed not only by your wife Kristine, by your two daughters Anna and Katharina, by your parents, brother, and sister, and by your many close friends, but also by all your friends and colleagues in the SOEP. The entire SOEP community will be poo-rer without you.
For the entire team of the SOEP Infrastructure at DIW Berlin,
Jürgen Schupp
IN MeMorIaM JoachIM r. frIcK


Sandra Gerstorf, Jürgen Schupp (Editors)
SOEPThe German Socio-EconomicPanel Study at DIW Berlin
DIW Berlin — Deutsches Institut für Wirtschaftsforschung e. V.Mohrenstraße 58, 10117 Berlinwww.diw.de
SOEP Wave Report2011SOEP — The German Socio-Economic Panel Study at DIW Berlin
The Socio-Economic Panel (SOEP) is the largest and longest
running multidisciplinary longitudinal study in Germany. The
SOEP is an integral part of Germany's scientific research infra-
structure and is funded by the federal and state governments
under the framework of the Leibniz Association (WGL). The
SOEP is based at DIW Berlin.


