Regional Distribution of Vulnerable Poor and Poverty Alleviation Programmes in Jammu and Kashmir
26
Fayaz Ahmad Bhat and Shazia Manzoor 187 Asia Pacific Journal of Social Sciences, Vol.IV(2), July-Dec 2012, pp.187-212 ISSN 0975 – 5942 Vol.IV(2), July-December 2012, pp.187-212 Visit: http://www.isaps-india.org/APJSS/index.htm ゥ International Society for Asia-Pacific Studies (ISAPS), www.isaps-india.org Regional Distribution of Vulnerable Poor and Poverty Alleviation Programmes in Jammu and Kashmir Fayaz Ahmad Bhat* and Shazia Manzoor** *Research Scholar, Department of Sociology and Social Work, Aligarh Muslim University, Aligarh, India **Assistant Professor, Department of Social Work, University of Kashmir Corresponding author: [email protected] Abstract Poverty is a multidimensional phenomenon. In its wider sense, it reflects the lack of access to various basic necessities, such as nutrition, health care, education, housing, security and opportunities for overall future improvement. All those whose income or expenditure is below the minimum per capita consumer expenditure and are deprived from the access to these basic necessities of life are considered to be poor or people living below the poverty line. Poverty alleviation is the national objective and the entire process of planned development has been directed towards attainment of this objective. The present paper attempts to explain the regional distribution of poor population in the state. The paper also intends to highlight the relationship between poverty and socio- demographic variables like sex ratio, household size, affiliation with particular social group and religion and level of literacy. More than twenty percent population of the State is poor and poverty is higher in the newly carved out districts of the State. Sex ratio among the poor is higher and household size is small when compared with the general population. Scheduled Tribes and Muslims report higher incidence of poverty. BPL population has more illiterates than the general population of the State. Though State government in collaboration with Central government is trying its level best to ameliorate the condition of the poor through its poverty alleviation programmes, but it has not been fully successful to do so. Keywords: Poverty, Vulnerable, Below Poverty Line, Alleviation, Jammu, Kashmir, State.
Transcript of Regional Distribution of Vulnerable Poor and Poverty Alleviation Programmes in Jammu and Kashmir

Fayaz Ahmad Bhat and Shazia Manzoor 187
Asia Pacific Journal of Social Sciences, Vol.IV(2), July-Dec 2012, pp.187-212
ISSN 0975 – 5942Vol.IV(2), July-December 2012, pp.187-212
Visit: http://www.isaps-india.org/APJSS/index.htm© International Society for Asia-Pacific Studies (ISAPS), www.isaps-india.org
Regional Distribution of Vulnerable Poor and PovertyAlleviation Programmes in Jammu and Kashmir
Fayaz Ahmad Bhat* and Shazia Manzoor***Research Scholar, Department of Sociology and Social Work, Aligarh
Muslim University, Aligarh, India**Assistant Professor, Department of Social Work, University of Kashmir
Corresponding author: [email protected]
AbstractPoverty is a multidimensional phenomenon. In its wider
sense, it reflects the lack of access to various basic necessities, suchas nutrition, health care, education, housing, security andopportunities for overall future improvement. All those whoseincome or expenditure is below the minimum per capita consumerexpenditure and are deprived from the access to these basicnecessities of life are considered to be poor or people living belowthe poverty line. Poverty alleviation is the national objective andthe entire process of planned development has been directedtowards attainment of this objective.
The present paper attempts to explain the regionaldistribution of poor population in the state. The paper also intendsto highlight the relationship between poverty and socio-demographic variables like sex ratio, household size, affiliationwith particular social group and religion and level of literacy.
More than twenty percent population of the State is poorand poverty is higher in the newly carved out districts of the State.Sex ratio among the poor is higher and household size is smallwhen compared with the general population. Scheduled Tribes andMuslims report higher incidence of poverty. BPL population hasmore illiterates than the general population of the State. ThoughState government in collaboration with Central government istrying its level best to ameliorate the condition of the poor throughits poverty alleviation programmes, but it has not been fullysuccessful to do so.Keywords: Poverty, Vulnerable, Below Poverty Line, Alleviation,Jammu, Kashmir, State.

Fayaz Ahmad Bhat and Shazia Manzoor 188
Asia Pacific Journal of Social Sciences, Vol.IV(2), July-Dec 2012, pp.187-212
IntroductionAfter the 64 years of India’s Independence, Poverty has not
only been an important social issue but has emerged as a socialproblem which has attracted the attention of researchers and policy-makers. It has occupied a central position in national economicdevelopment discourse. There has been shift in the focus on theimportant concerns such rate and pattern of growth and oninequalities in distribution of income and wealth to the extent towhich people in individual countries and the world at large aredeprived of the minimum requirements for a long, healthy andfulfilling life (Vaidyanathan, 2001: 1807). There are differences inthe incidence of poverty, factors underlying its persistence andcomposition of the poor among nations as well as in Indian stateswhich makes the subject poverty very complex and therefore itsstudy will be incomplete unless it takes note of local conditions andhistorical process of that region.
Poverty is a multidimensional phenomenon. The concept ofpoverty depends upon some absolute or relative notion of who ispoor. Poverty is interpreted as income based, consumption based,or, alternatively, entitlement based (Mabughi and Selim, 2006:181). Traditionally, the absolute poverty concept has been adoptedin India in which absolute minimum standards of living are fixed interms of income/consumption expenditure translated fromnutritional requirements measured in calories (Saggar and Pan,1994: 568). Poverty is an income level below some minimum levelnecessary to meet basic needs. This minimum level is usually calledthe “poverty line” (Hussain and Menka, 2010: 67). Poverty linerefers to “the inability of an individual or household to afford asocially perceived normative minimal basket of basic human needsthat is expected to be reflected in some normative minimal standardof living that should be assured to every indi-vidual/household”(GOI, 2009:4). Planning commission of Indiaattempted to define poverty line in much more broader ways so asto include education, health, nutrition, etc. (GOI, 1993). However,the poverty line approach treats each household independently andscales it on the basis of its average per capita expenditure level. Inthis approach, all relational dimensions go missing (Saith, 2005:4607). The conventional definition of poverty in terms of incomepoverty is being broadened with the inclusion of ‘human poverty’in terms of denial of choices and opportunities for living a tolerable

Fayaz Ahmad Bhat and Shazia Manzoor 189
Asia Pacific Journal of Social Sciences, Vol.IV(2), July-Dec 2012, pp.187-212
life (UNDP, 1997:2). Though the consumption measures representmaterial standards of living-food, clothing, shelter, transportation,fuel, education and so on- they also correlate closely with widernotions of capabilities and well being (GOJKa, 2008:10). Theconcept of poverty is defined with respect to social perception ofdeprivation of basic human needs. In Amartya Sen’s understanding,capabilities are absolute requirements for membership of society.Poverty is deprivation of basic capabilities (Sen, 2004:5). Itgenerally refers to social deprivation from descent quality of life.Poverty can be defined as a social phenomenon in which a sectionof the society is unable to fulfill even its basic necessities of life. Itreflects the lack of access to various basic necessities, such asnutrition, health care, education, housing, security and opportunitiesfor overall future improvement (GOJKa, 2008:1). Poverty is viewedas deprivation in opportunities that can result in lesser accumulationof human capabilities, which are very essential for leading atolerable life (Ushadevi, 2001: 2779). Thus concept of poverty hasbeen defined both in terms of its quantitative aspects as well as interms of its qualitative aspects.
The concept of vulnerability focuses on the variety ofdimensions of deprivation. Vulnerability means insecurity,defenselessness and exposure to risk and shocks. Poor are thepeople lacking the minimum quantities of essential goods andservices. In other words, poor are the stratum having incomesinadequate for current needs and, hence lacking resources to allotfor future need and growth (Rao, and Vivekananda, 1982:1107). Allthose people are categorized as poor who lack adequate food andshelter, who lack education and health, who face extremevulnerability to ill health, economic dislocation and naturaldisasters. One could define poor people as those who experiencemultiple deprivations (Ushadevi, 2001: 2779) which manifest itselfin the form of hunger, malnourishment, illiteracy, sickness,unemployment, alcoholism and depression; they are excluded frommoney market and social groups, and are vulnerable to naturaldisasters and predation by organized crime. Poor people are alsoexposed to ill treatment by institutions of the state and the society,who are powerless to influence the key decision affecting theirlives. Poverty limits awareness of their rights and their ability toaccess legal institutions to protect those rights. They are oftentrapped in this situation for most of their lives, with little hope for

Fayaz Ahmad Bhat and Shazia Manzoor 190
Asia Pacific Journal of Social Sciences, Vol.IV(2), July-Dec 2012, pp.187-212
themselves and their children. Therefore vulnerable poor are thosepeople who are deprived from enjoying their capabilities in variousspheres of life such as housing, education, health care, employmentand therefore prone to oppression, exploitation and marginalizationetc.
Poverty acts as a barrier between entitlement and access toincome, employment and basic necessities of life. Behind thisbarrier, the poor and weaker sections of the society are vulnerable toexclusion from mainstream society. Poverty is a tragedy not only forthe individuals concerned but also for the world at large, beingintimately linked with some of the most pressing social and politicalproblems of our time; crime, violence, broken families, loss ofcommunities, public health crisis, overpopulation, environmentaldegradation, corruption, poor governance and ethnic conflicts(GOJKa, 2008:8,9). Poverty is the root cause of the social strife,backwardness and political instability. It is multifaceted problemhaving its economics, politics, sociology and even a culture (GOJKc,2008-09: 148).
Most states recognize some formal responsibilities towards thepoor and deprived populations in the society and alleviating theirpoverty and reducing their deprivation is one among them.Eradication of poverty has become a central concern of public policyand has gained currency in current academic and public discourse ondevelopment and planning. The identification of the poor isimportant for purposes of planning in order to locate the mostdeserving of the beneficiaries of the various anti-povertyprogrammes being implemented over the years. There is a need torecognize this too and the delivery of the programmes particularly tothe economically weaker sections of the community like ScheduledCastes/Scheduled Tribes, minorities, women, children, unemployedyouth and people living in far flung areas is made both in letter andspirit. If we can remove this barrier, it will release the capabilities ofa nation, kept in leash and not allowed to flourish (GOJKa,2008:10).
ObjectivesThe present paper attempts to explain the regional
distribution of poor in the state. The paper also intends to highlightthe relationship between poverty and socio-demographic variables

Fayaz Ahmad Bhat and Shazia Manzoor 191
Asia Pacific Journal of Social Sciences, Vol.IV(2), July-Dec 2012, pp.187-212
like sex ratio, household size, affiliation with particular social groupand religion and level of literacy. Furthermore, an attempt has beenmade to highlight the role of the various Poverty AlleviationProgrammes espoused by the Government of Jammu and Kashmir todownsize poverty rate in the state.
Data Base and MethodologyThe paper is based on the secondary sources primarily Below
Poverty Line Survey, conducted by Directorate of Economics andStatistics, Government of Jammu and Kashmir in which 1.15 lakhhouseholds were interviewed thereby covering 6.84 lakh persons inboth rural and urban areas of Jammu and Kashmir State to ensurerepresentation of each and every Block and Town. For the purposesof this study, an expendable sum of Rs. 600 Per Capita Per Monthfor Urban areas (Rs. 36,000 per annum for family of five members)and Rs. 500 Per Capita Per Month for Rural areas, (Rs. 30,000 perannum for family of five members) has been fixed as the Poverty cutoff point in order to measure the incidence of poverty in the studyarea. Besides, qualitative parameters like household occupation,housing condition, asset position (land operated/owned, consumerdurables owned etc.) were also given due weightage (GOJKc, 2009:151 and GOJKb, 2008-09: 470). It is supplemented with EconomicSurvey, 2008-09; Digest of Statistics and other published workwherever necessary. It is both descriptive and analytical in nature.
Jammu and Kashmir at a GlanceThe State of Jammu and Kashmir is one of the largest States
of the Indian Union. It lies between 32o-15’ and 37o-05’ Northlatitude and 72o-35’ and 83o-20’ East longitude. The total area of thestate is about 2, 22,236 sq.km of which 78,114 sq.km. are under theillegal occupation of Pakistan and 37,555 sq.km. under China. Inaddition to this, 5,180 sq.km. of Jammu and Kashmir were illegallyhanded over by Pakistan to China. This leaves the State with anarea of 1, 01,387 sq.km (Census, 2001). The Indian state of Jammuand Kashmir comprises of three natural regions: Jammu, Kashmirand Ladakh. Administratively the state of Jammu and Kashmir isdivided into 22 districts, 82 tehsils and 142 blocks. The totalpopulation of the state is 1, 25, 48,926 persons with its densitybeing 124 and sex ratio 883 in census 2011. More than 70 percentpopulation of the state is rural. According to 2001 Census, amongvarious religious groups of the state, Muslims are the majority

Fayaz Ahmad Bhat and Shazia Manzoor 192
Asia Pacific Journal of Social Sciences, Vol.IV(2), July-Dec 2012, pp.187-212
community with 66.97 per cent of total population while Hindusconstitute the largest minority community with 29.63 per cent oftotal population. Other religious minorities are Sikhs (2.04 per cent)and Buddhist (1.12per cent), Christians and Jains. However theirshare is negligible. The state has made a substantial progress inliteracy rate. As far as 2011 census is concerned, the literacy rate ofthe state is 66.92 per cent and it still lags far behind the nationalaverage of 74.04 per cent. The male literacy rate is 77.10 per centwhereas the female literacy rate is 54.79 per cent. According to2001 census, the Scheduled Caste (SC) and Scheduled Tribe (ST)population of Jammu and Kashmir is 770155 (7.59 per cent) and1105979 (10.9 per cent) respectively. The per capita income (atcurrent prices) is 28407 per annum and BPL population in the stateas reported in 2008 was 21.63 per cent whereas unemployment rateas recorded in year 2006 was 5.2 percent (GOJKc, 2009: 148).
Situating the PoorEconomy of every country is today facing the problem of
poverty. As per the Human Development Report (2010:96), 1.75billion constituting about one-third of population of 104 countriesexperience multidimensional poverty and it exceeds the 1.44 billionpeople estimated to be living on less than $ 1.25 but it is below the2.6 billion people estimated to be living on less than $2 a day. Theglobal poverty is mostly concentrated in South Asia and Sub-Saharan Africa, where the proportion of people in extreme povertywas 40 per cent and 46 per cent, respectively (GOJKb, 2008-09:465). In Indian context, the poverty emphasizes more aminimum level of living rather than on reasonable level of livingand accordingly, it is broadly agreed that poverty can be termed as ssituation where a section of the population fails to reach a certainminimum consumption standard. Poverty line in India is defiedwith reference to consumer expenditure surveys by the NationalSample Survey Organization (NSSO). The poverty line is officiallylinked with a nutritional base line measured in calories (food-energy methods). Planning Commission is the Nodal Agency forestimation of poverty at National level which is being used forvarious purposes and it defined below poverty line in 1979 as ‘percapita consumption, which meets the average per capita dailycalorie requirement of 2400 K Calorie in Rural areas and 2100 KCalories in Urban areas along with a minimum of non foodexpenditure (GOJKc, 2009: 148 and GOJKb, 2008-09: 466).

Fayaz Ahmad Bhat and Shazia Manzoor 193
Asia Pacific Journal of Social Sciences, Vol.IV(2), July-Dec 2012, pp.187-212
Poverty imposes an oppressive weight on India. Poverty inIndia is predominantly rural where almost three out of four Indiansi.e., 77 per cent of the Indian poor live (GOJKb, 2008-09: 467).The estimated poverty line, ratio and number of persons livingBelow Poverty Line (BPL) at both National and State level, asestimated by the Planning Commission, based on ConsumerExpenditure Survey from time to time, is reviewed in the Table 1.
It is widely agreed that the magnitude of decline in poverty ofthe two decades (1970-1990) is significant but not spectacular. It isinteresting to note that population living below poverty line in Stateof Jammu and Kashmir is low as compared to India. From 1973-74to 1987-88, poverty ratio at both national and state level declinedfrom 54.88 per cent and 40.83 percent to 38.86 per cent and 23.82per cent respectively. The Poverty Indicator has undulated from1993-94 to 2004-05 with the head count ratio of 35.97 per cent and25.17 to 27.50 per cent and 5.40 per cent during the period ofreference with the corresponding total BPL Population standing at301.70 and 0.585 million persons respectively as in 2004-05. What issurprising is that in the state of Jammu and Kashmir, it hasdrastically come down with a decrease of 19.77 percentage points.This is the era in which state has remained always disturbed due toongoing violence which might have resulted in under-numeration ofpoor people especially from 1990 to 2000.
Both rural and urban poverty ratios at National and state levelhave followed the same trend. The rural poverty ratios in India andJammu and Kashmir have declined from 56.44 percent and 46.60 percent to 28.30 percent and 4.60 per cent while as urban poverty ratioshave declined from 49.01 percent and 21.32 percent to 25.70 percentand 7.90 percent respectively. At the National level, the size of BPLpopulation has decreased by 19.6 million (321.3 to 301.7 million)during the period 1973-74 to 2004-05 whereas in case of Jammu andKashmir, it has decreased by 0.975 million (1.560 to 0.585 million)during 1983 to 2004-05. The phenomenal decrease in Head CountRatio figures and subsequent increase in poverty estimates is beyondany sound reasoning where both Head count and Absolute Povertyhave been shown very low (GOJKc, 2009: 150). Similarly Rural BPLpopulation in both India and Jammu and Kashmir has decreased by40.4 million (261.3 to 220.9 million) and 0.945 million (1.311 to0.366) during the period 1973-74 to 2004-05 and 1983 to 2004-05

Fayaz Ahmad Bhat and Shazia Manzoor 194
Asia Pacific Journal of Social Sciences, Vol.IV(2), July-Dec 2012, pp.187-212
respectively. What is surprising is that Urban Absolute number ofpoor at national level have increased by 20.8 million (60.0 to 80.8million) whereas in case of Jammu and Kashmir, it first declines andthen again shows an upward trend during the period under reference.
The behaviour of indicators relating to ‘Absolute number ofpoor’ indicates that urban absolute poverty has shown phenomenalincrease at national level while as rural absolute poverty has beencontained to some extent. However, the rural poverty ratios are stillmore than urban poverty ratios though they have started converging.
Profiling Poor in Contemporary Jammu and KashmirPoor are the stratum of people having incomes inadequate for
current needs and hence lacking the minimum quantities of essentialgoods and services. The figures for Poverty thrown out by the BPLSurvey, 2007-08, are reasonably realistic and appealing. Out of everyfive persons in Jammu and Kashmir, one falls Below Poverty Line(BPL). As per the survey results as given in Table 2, the total BPLEstimated Population Ratio or Head Count Ratio of the State hasbeen found to be 21.63 percent with a distribution of 26.14 percent inrural areas and 7.96 percent living in urban areas. As far as divisionwise distribution of BPL Estimated Population Ratio is concerned,Kashmir Division (Kashmir+Ladakh) accounted 21.60 percent of itwith a dispersion of 26.58 percent in rural areas and 7.81 percent inurban areas. In Jammu Division, the total Estimated BPL Populationpercentage reported was 21.67 percent with a dispersion of 25.61percent in rural areas and 8.19 percent in urban areas. At Rural level,Kashmir Division (26.58 percent) have more BPL populationpercentage as compared to Jammu Division (25.61 percent) while asJammu Division (8.19 percent) has more Urban poverty percentageas compared to Kashmir Division (7.81 percent). Similarly, the totalBPL household ratio estimated for the state as given in the table is28.84 percent in which 10.15 and 24.02 percent is reported in ruraland urban areas respectively. Further analysis of the table shows thatthe figures for Kashmir and Jammu division are 25.58 percent and22.43 percent respectively. Dispersion of division wise distributionof Household Ratio along the rural and urban lines shows that it is30.95 and 10.78 percent in Kashmir division and 26.73 and 9.45percent respectively in Jammu division. Prevalence of high ratio ofBPL households in both rural and urban areas of Kashmir incomparison to Jammu division is a matter of concern as it depicts

Fayaz Ahmad Bhat and Shazia Manzoor 195
Asia Pacific Journal of Social Sciences, Vol.IV(2), July-Dec 2012, pp.187-212
that Kashmir division is facing the threat of economic exclusioneither due to the prevailing conflict or due to the in-differentialattitude of government agencies in proper management of funds andexecution of policies and programmes for poverty alleviation.
Having a glance at the Table shows that Srinagar has reportedlowest poverty ratio both in terms of Head Count and HouseholdCount (6.51 HCEP and 9.14 HHEP) where as it has been highest inReasi in terms of Head Count and Kishtiwar in terms of HouseholdCount. All the rural areas irrespective of Head Count or HouseholdCount have reported high incidence of poverty ratio in comparison tothe urban areas. On the basis of BPL Head Count Ratio, the sevenpoorest districts in the State are Reasi, Ramban, Kishtiwar, Poonch,Kupwara, Kargil, and Bandipora which have more than 30 per centestimated BPL Head Count Ratio ranging from 37. 93 per cent to31.09 percent where as on the basis of Household Count Ratio, theseven poorest districts in the State are Kisthwar, Kupwara,Bandipora, Reasi, Poonch, Ramban and Kargil which have more than35 percent Estimated BPL Households ranging in between 42.73 to35.87 percent. These districts are predominantly inhabited by Muslimand Scheduled Tribe population.
Poverty and Socio-Demographic CharacteristicsThe persistence of poverty is linked to its
multidimensionality. It is dynamic, complex, institutionallyembedded and a gender and location specific phenomenon. It hasimplications on socio-demographic variables like household size, sexratio, and literacy rate etc. and its pattern and shape also varies bysocio-religious group affiliation. In the present study, socio-demographic characters such as household size, sex ratio, socio-religious affiliation and level of literacy of the people living belowpoverty line are discussed.
Table 1: Comparative Trend in Incidence of Poverty in India and Jammu and Kashmir
YearPoverty Line* Poverty Ratio ** Population BPL***
Rural Urban Rural Urban Combined Rural Urban CombinedIndia J &
KIndia J &
KIndia J &
KIndia J &
KIndia J &
KIndia J &
KIndia J &
KIndia J & K
1973-74 49.6 46.6 56.8 N.A 56.4 46.6 49.0 21.3 54.9 40.8 261.3 N.A 60.0 N.A 321.3 N.A
1977-78 56.8 N.A 70.3 N.A 53.1 N.A 45.2 23.7 51.3 38.9 264.3 N.A 64.6 N.A 328.9 N.A
1983 89.5 91.8 115.7 99.6 45.7 26.0 40.8 17.8 44.5 24.2 252.0 1.31 70.9 0.249 322.9 1.560
1987-88 115.2 N.A 162.2 N.A 39.1 25.7 38.2 17.5 38.9 23.8 231.9 N.A 75.2 N.A 307.1 N.A
1993-94 205.8 213.8 281.4 253.6 37.3 30.3 32.4 9.2 36.0 25.2 244.0 1.90 76.3 0.19 320.3 2.092
1999-00 327.6 367.5 454.1 420.2 27.1 4.00 23.6 2.0 26.1 3.5 193.2 0.30 67.0 0.005 260.2 0.346

Fayaz Ahmad Bhat and Shazia Manzoor 196
Asia Pacific Journal of Social Sciences, Vol.IV(2), July-Dec 2012, pp.187-212
2004-05 356.3 391.3 458.0 475.7 28.3 4.6 25.7 7.9 27.5 5.4 220.9 0.37 80.8 0.22 301.7 0.585
2007-08 N.A 500 N.A 600 N.A 26.1 N.A 8.0 N.A 21.6 N.A2.200
#N.A 0.22# N.A 2.421#
Note: BPL-Below Poverty Line* in terms of Rupee per capita per month; ** Ratio of People BPL to Population inPer Cent; *** Absolute number of People BPL in Million; # Figures given are converted from Lakhs into Crores.Source: BPL Survey, 2008, pp.21; Economic Survey, 2009, pp. 470.
Table 2: Estimated Head Count Poverty Ratio and Household Poverty Ratio by Districts andDivisions in Jammu and Kashmir
District/ Division/StateHead Count Estimated Poverty Ratio
(HCEP)Household Estimated Poverty Ratio
(HHEP)Rural Urban Total Rank Rural Urban Total Rank
Anantnag 15.94 8.87 14.46 18 18.54 10.72 16.94 16Bandipora 33.87 12.79 31.09 7 42.6 16.21 39.2 3
Baramulla 30.52 8.69 26.49 10 33.71 11.42 29.71 11
Budgam 28.15 12.36 26.64 9 32.71 15.84 31.12 10
Ganderbal 24.94 13.87 24.23 14 29.05 15.62 28.13 12
Kulgam 22.80 15.83 22.59 15 28.05 19.16 27.76 13
Kupwara 33.33 13.35 32.55 5 43.49 19.31 42.61 2
Pulwama 27.96 14.0 26.18 11 32.33 24.88 31.34 9
Shopian 17.10 5.33 16.42 17 15.27 6.92 14.71 18
Srinagar 8.16 6.38 6.51 22 10.36 9.04 9.14 22
Kashmir Region (A) 26.34 7.87 21.37 31.12 10.88 25.67
Leh 27.47 5.37 22.07 16 17.85 9.18 15.49 17
Kargil 34.41 6.33 31.9 6 39.99 5.75 35.87 7
Ladakh Region (B) 31.29 5.63 27.03 28.07 8.36 23.95
Total KashmirDivision (A+B)
26.58 7.81 21.60 30.95 10.78 25.58
Doda 30.67 7.16 29.07 8 34.24 7.15 32.2 8
Jammu 15.32 8.23 11.97 20 17.16 8.81 13.17 20
Kathua 12.66 6.24 11.72 21 13.9 12.61 13.66 21
Kishtiwar 40.10 9.61 37.72 3 45.22 12.5 42.73 1
Poonch 35.10 12.73 33.67 4 38.29 16.19 36.72 5
Rajouri 26.14 11.24 25.1 12 27.06 11.86 25.91 14Ramban 39.30 8.47 37.73 2 37.92 10.15 36.39 6Reasi 40.15 13.08 37.93 1 40.55 14.69 38.23 4Samba 16.09 7.3 13.88 19 16.83 7.55 14.51 19Udhampur 29.25 6.81 24.56 13 30.97 8.49 25.78 15Jammu Division (C) 25.61 8.19 21.67 26.73 9.45 22.43Total (A+B+C) 26.14 7.96 21.63 28.84 10.15 24.02Source: BPL Survey, 2008, pp.64.
Poverty and Household sizeHousehold composition, in terms of the size of the household and
characteristics of its members (such as age, gender), is often quite different forpoor and non-poor households. This indicator is an important one as it showsa possible correlation between the level of poverty and householdcomposition. There is a considerable evidence of strong correlation between

Fayaz Ahmad Bhat and Shazia Manzoor 197
Asia Pacific Journal of Social Sciences, Vol.IV(2), July-Dec 2012, pp.187-212
household size and consumption (or income) per person in developingcountries (Visaria, 1980; Sundrum, 1990; Lipton and Ravallion, 1994). It isoften concluded that people living in larger and (generally) youngerhouseholds are typically poor (Lanjouw and Ravallion, 1995:1415). Thefindings of the survey starkly contrasts with this observation as the data givenin Table 3 shows that the poor tend to live in small households (except inJammu division where the household size of BPL population is 5.63 against5.56 persons per household in general population) in both rural as well asurban areas of Jammu and Kashmir as well as across rural and urban areas ofboth the divisions. Gender wise distribution of the poor population in the stateshows that males outnumber females in both rural and urban areas of Jammuand Kashmir as well in its divisions. At the state level, the average BPLhousehold size is 5.83 consisting of 3.02 males and 2.81 females. The averageBPL households in Kashmir division is 6.06 person (3.16 male and 2.90female) per household whereas in Jammu division, the average household sizeof 5.63 (2.89 male and 2.74 female) per household. The average householdsize of BPL Population living in rural areas of Jammu and Kashmir wasworked out as 5.91 persons per household with a composition of 3.06 malesand 2.85 females.
The rural BPL population in Kashmir division comprised of 6.16persons-2.61 male and 2.50 female per household while as Jammu divisionrecorded a composition of only 5.68 persons-2.92 male and 2.76 female perhousehold in rural areas. The average BPL household size of the urban areasof Jammu and Kashmir State consisted of 5.11 persons per householdcomprising of 2.61 males and 2.50 females. At urban level, Jammu Divisionhad 4.95 persons consisting of 2.49 male and 2.46 female per BPL householdwhile as in Kashmir Division there are 5.24 persons (2.70 male and 2.54female) per BPL household. Thus it can be concluded on the basis of aboveanalysis that in Kashmir division, the BPL household size is large both in ruralas well as in urban areas when compared with household size of BPLpopulation in Jammu division as well at the state level.
Table 3Division Wise Distribution of Sampled General and BPL Household Size
(Number of Persons per household) by Residence and Gender and Sex Ratio
Division/Sex and Sex ratioRural +Urban (No.) Rural (No.) Urban (No.)T J K T J K T J K
GeneralPopula-
Male 3.08 2.91 3.25 3.17 2.97 3.38 2.77 2.64 2.86Female 2.85 2.65 3.04 2.94 2.71 3.17 2.55 2.39 2.67

Fayaz Ahmad Bhat and Shazia Manzoor 198
Asia Pacific Journal of Social Sciences, Vol.IV(2), July-Dec 2012, pp.187-212
tion Male+Female 5.93 5.56 6.29 6.11 5.68 6.55 5.32 5.03 5.53Sex ratio 924 910 936 925 911 937 921 906 931
BPLPopula-tion
Male 3.02 2.89 3.16 3.06 2.92 3.21 2.61 2.49 2.70Female 2.81 2.74 2.90 2.85 2.76 2.95 2.50 2.46 2.54Male+Female 5.83 5.63 6.06 5.91 5.68 6.16 5.11 4.95 5.24Sex ratio 934 948 920 932 946 918 960 984 943
Note: Figures Under Kashmir Division includes the figures of Ladakh and Kashmir region;J-Jammu; K-Kashmir; T- Total.
Source: BPL Survey, 2008, pp.69.
Poverty and Sex RatioSex ratio i.e., number of females per one thousand females is one of
the important demographic characteristic of society. Sex ratio is a powerfulindicator of the social health of any society as it conveys a great deal about thestate of gender relations (Patel, 2004:887). Sex Ratio is an important indicatorof the social condition particularly with respect to women's status of anysociety and gender inequalities governed by gender preference (GOJKa,2008:65). It is a sensitive indicator of women’s status in society. India’s lowsex ratios are a stark indicator of the inferior position which women occupy insociety (Mayer, 1999:324). India’s low sex ratio is “the starkest index of theoppression of women,” and the higher death rate among women is becausegirls are given less food and health care (Omvedt, 1978: 382). Generallydiscrimination against female children and the neglect of females in nutritionand health (or more precisely, access to food and medical care) even at theadult ages is one of the factor underlying differential mortality (Visaria,1961:66). However, there is less discrimination against females in the poorfamilies (Krishnaji, 1987:897) and that is why sex ratio among the poor ismuch better than the non-poor people. This argument is supported by thefindings of the survey which revealed that the sex ratio among the poor isbetter than the non-poor or general population. The sex ratio of BPLPopulation of the State and across the divisions Jammu and Kashmir as givenin Table 3 was reported to be 934, 948 and 920 against 924, 910 and 936respectively in general population. In rural areas of the State, the sex ratio ofBPL Population was 932 females per thousand males which is well below thenatural average. This indicator among the poor in rural Jammu division wasslightly better with sex ratio of 946 against the Kashmir division whichrecorded 918 females per thousand males. In Urban areas, the sex ratio ofBPL population of Jammu and Kashmir State was found to be 960 which isslightly better than the ratio at other levels. The sex ratio of BPL population inurban areas of Kashmir division was 943 against the 984 in urban areas ofJammu division. Sex ratios at all the levels are well below the standard norm.The sex ratio of Kashmir division was more adverse than that of JammuDivision. This undesirable trend in sex ratio points to the possibility of widespread prevalence of Prenatal Sex Determination Diagnostic Test (PNDT) andsex selection practices existing even in today's advanced social setup. Ithighlights the impact of perverse social and cultural factors related to

Fayaz Ahmad Bhat and Shazia Manzoor 199
Asia Pacific Journal of Social Sciences, Vol.IV(2), July-Dec 2012, pp.187-212
marriage practice and dowry, as well as role of women in household leveldecisions (GOJKa, 2008:66).
Poverty among Social GroupsSocial grouping of the population reflects the composition of society
when studied in relation to consumer expenditure and various socio-economicparameters which present an outlook of their status and living conditions atground level (GOJKa, 2008:69). Incidence of poverty is alarmingly highamong SC and ST population and SCs are somewhat better off compared toSTs in terms of marginally higher monthly per capita expenditure (MPCE)and lower poverty (Saggar and Pan, 1994:574). This argument is empiricallyproved by the findings of the survey. Having a glance at Table 4 shows thatthe aggregate share of Scheduled Tribe (ST), Scheduled Caste (SC), OtherBackward Class and the category of ‘Other’ in the total sampled BPLpopulation is 20.92, 7.79 percent, 19.94 percent and 51.35 percentrespectively connoting that STs are economically poor than SCs and OBCs.As far as the division wise distribution of poor among SCs, STs, OBCs andthe category of ‘Other’ in Jammu division is concerned, the figures are 24.94,12.52, 9.02 and 50.53 percent respectively whereas their corresponding sharein Kashmir division is 16.88, 0.02, 30.92 and 52.18 percent respectively. Thisshows that Jammu division has higher ST and SC population living belowpoverty line whereas share of poor among OBCs and category of ‘Other’ arehigher in Kashmir division. What is interesting to note is that urban SCs arepoorer than urban STs and OBCs in Jammu division where as rural OBCs arepoorer than rural SCs and STs in Kashmir division. The possible reason forthis might be that these two categories viz., SC in urban Jammu and OBCs inrural Kashmir have not benefitted themselves from the reservation policyeither because of their own fault or due to governmental apathy.
Religious Affiliation and PovertyPoverty was marginally higher among Muslims as compared to
Hindus (Shariff, 2001) and face slightly higher level of deprivation in ruralareas and what is interesting is that the ‘Other’ category is found to havelower proportion of deprived both in rural and urban areas (Srinivasan andMohanty, 2004:734). The Muslims are poorer than Hindus for all India andmost States, excluding Assam and Jammu and Kashmir (Pal et. al. 1986: 149-84). The findings of the survey are in contradiction with this statement as isevident from the data given in Table 4.
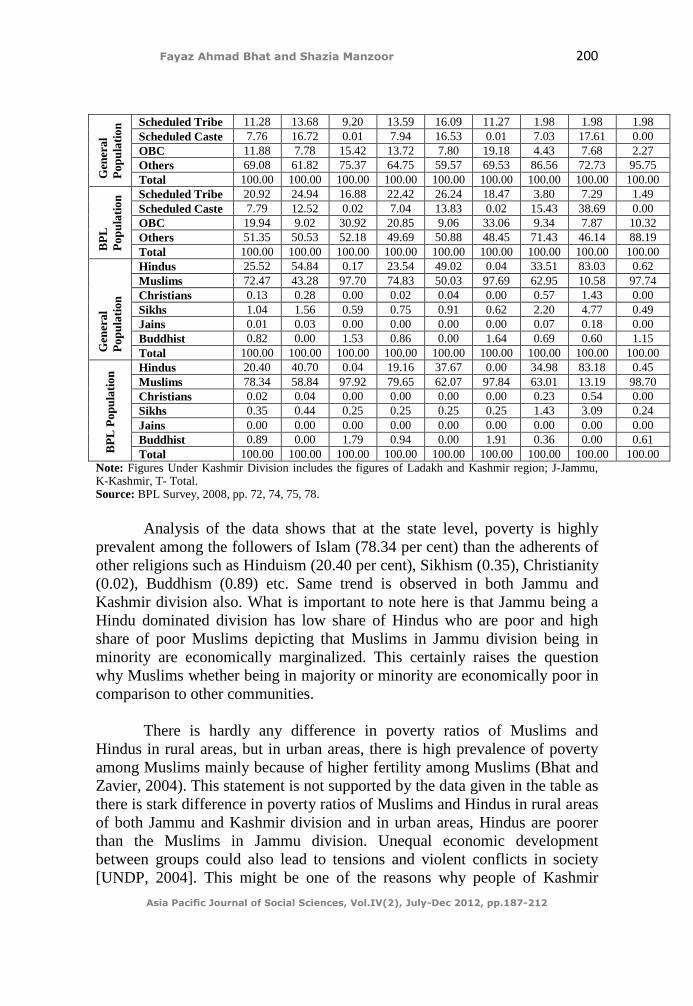
Table 4Division Wise Percentage of Internal Distribution of Sampled General and BPL
Population by Socio-Religious CategoriesDivision/Social/ Religious Group
Rural +Urban Rural UrbanT J K T J K T J K
Fayaz Ahmad Bhat and Shazia Manzoor 200
Asia Pacific Journal of Social Sciences, Vol.IV(2), July-Dec 2012, pp.187-212
Gen
eral
Pop
ulat
ion Scheduled Tribe 11.28 13.68 9.20 13.59 16.09 11.27 1.98 1.98 1.98
Scheduled Caste 7.76 16.72 0.01 7.94 16.53 0.01 7.03 17.61 0.00OBC 11.88 7.78 15.42 13.72 7.80 19.18 4.43 7.68 2.27Others 69.08 61.82 75.37 64.75 59.57 69.53 86.56 72.73 95.75Total 100.00 100.00 100.00 100.00 100.00 100.00 100.00 100.00 100.00
BP
LP
opul
atio
n Scheduled Tribe 20.92 24.94 16.88 22.42 26.24 18.47 3.80 7.29 1.49Scheduled Caste 7.79 12.52 0.02 7.04 13.83 0.02 15.43 38.69 0.00OBC 19.94 9.02 30.92 20.85 9.06 33.06 9.34 7.87 10.32Others 51.35 50.53 52.18 49.69 50.88 48.45 71.43 46.14 88.19Total 100.00 100.00 100.00 100.00 100.00 100.00 100.00 100.00 100.00
Gen
eral
Pop
ulat
ion
Hindus 25.52 54.84 0.17 23.54 49.02 0.04 33.51 83.03 0.62Muslims 72.47 43.28 97.70 74.83 50.03 97.69 62.95 10.58 97.74Christians 0.13 0.28 0.00 0.02 0.04 0.00 0.57 1.43 0.00Sikhs 1.04 1.56 0.59 0.75 0.91 0.62 2.20 4.77 0.49Jains 0.01 0.03 0.00 0.00 0.00 0.00 0.07 0.18 0.00Buddhist 0.82 0.00 1.53 0.86 0.00 1.64 0.69 0.60 1.15Total 100.00 100.00 100.00 100.00 100.00 100.00 100.00 100.00 100.00
BP
L P
opul
atio
n Hindus 20.40 40.70 0.04 19.16 37.67 0.00 34.98 83.18 0.45Muslims 78.34 58.84 97.92 79.65 62.07 97.84 63.01 13.19 98.70Christians 0.02 0.04 0.00 0.00 0.00 0.00 0.23 0.54 0.00Sikhs 0.35 0.44 0.25 0.25 0.25 0.25 1.43 3.09 0.24Jains 0.00 0.00 0.00 0.00 0.00 0.00 0.00 0.00 0.00Buddhist 0.89 0.00 1.79 0.94 0.00 1.91 0.36 0.00 0.61Total 100.00 100.00 100.00 100.00 100.00 100.00 100.00 100.00 100.00
Note: Figures Under Kashmir Division includes the figures of Ladakh and Kashmir region; J-Jammu,K-Kashmir, T- Total.Source: BPL Survey, 2008, pp. 72, 74, 75, 78.
Analysis of the data shows that at the state level, poverty is highlyprevalent among the followers of Islam (78.34 per cent) than the adherents ofother religions such as Hinduism (20.40 per cent), Sikhism (0.35), Christianity(0.02), Buddhism (0.89) etc. Same trend is observed in both Jammu andKashmir division also. What is important to note here is that Jammu being aHindu dominated division has low share of Hindus who are poor and highshare of poor Muslims depicting that Muslims in Jammu division being inminority are economically marginalized. This certainly raises the questionwhy Muslims whether being in majority or minority are economically poor incomparison to other communities.
There is hardly any difference in poverty ratios of Muslims andHindus in rural areas, but in urban areas, there is high prevalence of povertyamong Muslims mainly because of higher fertility among Muslims (Bhat andZavier, 2004). This statement is not supported by the data given in the table asthere is stark difference in poverty ratios of Muslims and Hindus in rural areasof both Jammu and Kashmir division and in urban areas, Hindus are poorerthan the Muslims in Jammu division. Unequal economic developmentbetween groups could also lead to tensions and violent conflicts in society[UNDP, 2004]. This might be one of the reasons why people of Kashmir

Fayaz Ahmad Bhat and Shazia Manzoor 201
Asia Pacific Journal of Social Sciences, Vol.IV(2), July-Dec 2012, pp.187-212
division who are predominantly Muslims sense deprivation and alienation anddemand for secession from Indian union.
Poverty and LiteracyLiteracy together with educational attainment determines the quality of
life of population and is highly related to one's employment prospectus andoverall welfare. The literacy rate of the population is arrived at by culling outthe percentage of the people whose age is 7 years and above and who can bothread and write a simple message with understanding in at least one language(GOJKa, 2008:79). Traditionally education has been viewed as a processinvolving the acquisition of skills or the inculcation of better work habitswhich increase the individual’s productivity. Since income is related toproductivity, the more education an individual has, the higher will be hisincome (Stiglitz, 1973:136). Education increases economic output and raisesproductivity levels. It is instrumental in raising earnings, and reducingpoverty. Many children cannot go to school because their parents are too poorto afford the costs of schooling. Often, children need to work, at home oroutside, to help their parents or to supplement the family income. Also, schooleducation may not be considered relevant for the future of the child. Besides,the immediate needs of the family (such as food, clothing, rent, and otherbasic necessities) take precedence over the expected benefits from educationat a future point of time. Although poverty has an adverse effect on theschooling opportunities of all children, the burden of economic constraintsfalls more heavily on the girl child (Guha and Sengupta, 2002:1621-22).Sometimes girls are forced to join the labour force early, in order to add to thefamily income. The additional income thus generated often helps to pay forthe education of younger siblings, especially brothers (Jeejebhoy, 1993:1811-21; Guha and Sengupta, 1997). The findings of the survey are in line with thearguments of scholars as the literacy rate at state as well as division levelamong the poor is found to be lower with male literacy rate being higher thanfemale literacy rate in both rural and urban areas. The literacy rate of Jammuand Kashmir State for General and BPL Population as given in the Table 5was found to be 64.18 percent and 42.15 percent respectively. Thecorresponding figures for males in both general and BPL population is 72.32percent and 48.55 percent respectively where as for females, it is 55.35percent and 35.30 for females respectively. Residence wise breakup of theliteracy rate of BPL population at state level shows that in rural areas, it is41.28 percent in which share of male and female population is 47.81 percentand 34.27 percent respectively while as in urban areas it stood at 52.30percent comprising of 57.32 percent males and 47.08 percent females.
Table 5

Fayaz Ahmad Bhat and Shazia Manzoor 202
Asia Pacific Journal of Social Sciences, Vol.IV(2), July-Dec 2012, pp.187-212
Division Wise Percentage of Internal Distribution of Sampled General and BPLLiteracy Rate by Residence and Gender
Division/Sex andliteracy rate
Rural +Urban Rural UrbanT J K T J K T J K
GeneralPopula-tion
Male 72.32 75.88 69.12 70.07 74.25 66.06 81.41 83.75 79.79Female 55.35 58.94 52.22 52.02 55.51 48.79 68.78 75.64 64.19Total 64.18 67.83 60.95 61.41 65.33 57.71 75.36 79.91 72.26
BPLPopula-tion
Male 48.56 50.81 46.27 47.81 50.09 45.44 57.32 61.21 54.52Female 35.30 37.13 33.39 34.27 36.06 32.35 47.08 51.94 43.43Total 42.15 44.15 40.10 41.28 43.27 39.18 52.30 56.61 49.14
Note: Figures Under Kashmir Division includes the figures of Ladakh and Kashmir region; J-Jammu, K-Kashmir, T- Total.Source: BPL Survey, 2008, pp.80, 82.
Division wise distribution of literacy rate among the poor in Jammuand Kashmir shows that in Kashmir division, literacy rate among the peopleliving Below the Poverty Line is 40.10 percent whereas the correspondingfigures in Jammu division stood at 44.15 percent. The literacy rate in rural andurban Below Poverty Line Population of Kashmir division was reported to be39.18 and 49.14 against 43.27 and 56.61 percent respectively in Jammudivision. It is explicit from the analysis of the data that the BPL populationhas more illiterates than the general population at the state as well at divisionlevel. Further literacy rate among the poor was higher in urban against therural areas and female literacy rate among the poor across the divisions aswell as across the rural and areas was low in comparison to their malecounterparts. The analysis of the data reveals that there is direct relationshipbetween illiteracy and incidence of poverty and therefore we can argue thathigh incidence of illiteracy among the poor diminishes their chances of gettinggainful employment and thereby raising their earnings, and reducing poverty.
Poverty Alleviation Programmes (PAPS) in Jammu and KashmirPoverty alleviation is one among the Millennium Development Goals
of United Nations Development Programme. Poverty alleviation was accordedpriority in the primary national objectives by nationalist leaders both before aswell as after independence of the country. Before independence, it became auniting force among the masses influenced by Gandhian approach whichemphasized the need to uplift the social and economic status of the poorest ofthe poor, or ‘antyodaya’ and soon after independence, Congress governmentappointed the economic programme committee to reiterate the nationalobjective of economic justice (Vyas and Bhargava, 1995: 2559). Successivegovernments first moved on with the same strategy, but later they realized thatpoor should not only be recognized as target of much focused povertyalleviation strategy but rather they should participate in the developmentalactivities like MGNREGA. Recent study conducted by World Bank on

Fayaz Ahmad Bhat and Shazia Manzoor 203
Asia Pacific Journal of Social Sciences, Vol.IV(2), July-Dec 2012, pp.187-212
Policies to reduce poverty in India, acclaims the fact that poverty, during thelast two decades, has declined at the rate of 2 per cent per annum (GOJKb,2009: 464). The Indian government has accorded great importance povertyreduction as is explicit by being a major goal of all Five Year Plans (GOJKb,2009: 467; GOJKc, 2008-09: 148).
The identification of the poor is important for the purposes of planningin order to locate the most deserving of the beneficiaries of the various anti-poverty programmes being implemented over the year. The government ofJammu and Kashmir has initiated a number of poverty alleviation schemes totone down rural as well as urban poverty. They are being implemented in theState with full financial and technical support of Central government not onlyto alleviate the poverty but also to generate employment in the State (GOJKc,2008-09: 154). To ameliorate the condition of the poor both in rural and urbanJammu and Kashmir, the State government has introduced the followingpoverty alleviation programmes:
Swaran Jayanti Gram Swarozgar Yojana (SGSY)SGSY, a Centrally Sponsored Progamme aimed to bring the poor
families above poverty line in three years by providing them incomegenerating assets through a mix of bank credit and government subsidy is oneof the rural poverty alleviation programmes (GOJKb, 2009: 481). Having aglance at Table 6 reveals that during 2003-04, financial outlay under SGSYwas Rs.8.42 Crores, out of which Rs.6.18 Crores were spent by providingemployment to 6965 persons and 2666 self help groups have been formedduring the year where as in 2008-09, the funds available under SGSY wereRs. 16.27 Crores, out of which Rs. 10.42 Crores i.e., approximately around 64percent have been spent to provide employment to 10278 persons and to assistin the formation of 4123 self help groups. There has been gradual increase inavailable funds as well in expenditure for providing assistance to the needyrural poor in the period of reference i.e., 2003-04 to 2008-09. This exemplifiesthe commitment of the state government in alleviating the poverty of ruralpeople in the Jammu and Kashmir.
Sampoorn Grameen Rozgar Yojana (SGRY)SGRY is another governmental scheme intended to alleviate the
poverty in rural areas of Jammu and Kashmir. Under this scheme, wageemployment in the form of cash and food grains is provided by givingpreference to the poorest among the poor and SC/STs families (GOJKc, 2008-09:154). The data as given in Table 7 depicts that there was increase in fundallocation as well in total expenditure from 2002-03 to 2005-06 and after thata declining trend in both has been observed. Further it has been found that in

Fayaz Ahmad Bhat and Shazia Manzoor 204
Asia Pacific Journal of Social Sciences, Vol.IV(2), July-Dec 2012, pp.187-212
the first two years of its commencement in the state; it not only generatedsubstantial number of working days i.e., 47.14 lakh and 47.89 lakh in 2002-03and 2003-04 respectively but also lead to completion of sizeable number ofworks. However what is startling is that there has been reduction in fundallocation in 2006-07 and 2007-08 which consequently has its impact onexpenditure pattern for generation of employment for the rural poor. Why thishas happened when the scheme has been successful in achieving the target ofalleviating the rural poverty?
Table 6Achievement under Swaran Jayanti Gram Swarozgar Yojana (SGSY)
Year
No. ofSHGs
assisted foreconomicactivity
No. ofindividuals
assistedfor
economic
Total CreditDisbursed
SubsidyDisbursed
Availabi-lity ofFunds(Rs. InCrores)
Expendi-ture
(Rs. InCrores)
Expendi-ture
(%age)
2003-04 2666 4299 6965 19.57 4.67 8.42 6.18 732004-05 2590 5449 8039 23.39 5.96 9.10 7.80 862005-06 2281 4904 7185 20.49 5.33 9.07 7.03 772006-07 3808 4411 8219 22.47 5.83 10.68 8.65 802007-08 4205 5243 9448 24.72 6.55 13.53 9.31 692008-07 4123 6155 10278 30.98 7.23 16.27 10.42 64Source: Economic Survey, 2009, 481
Table7Achievement under Sampoorn Grameen Rozgar Yojana (SGRY)
Year Number ofWorks
taken up
Workscompleted
Man daysgenerated
(LacNo’s)
TotalAvailability
of funds(Rs. InCrores)
Expenditure(Rs. InCrores)
Expenditure(%age)
2002-03 18760 17420 47.14 42.00 38.97 932003-04 21932 20481 47.89 43.55 41.95 962004-05 19544 18060 43.73 44.00 41.97 952005-06 18654 16603 42.09 47.50 45.71 962006-07 15408 13601 29.18 39.65 37.46 942007-08 13061 12083 21.08 38.35 33.66 882008-07 The Scheme has been replaced by NREGA after 2007-08Source: Economic Survey, 2009, 482.

Fayaz Ahmad Bhat and Shazia Manzoor 205
Asia Pacific Journal of Social Sciences, Vol.IV(2), July-Dec 2012, pp.187-212
Table 8Achievement under National Rural Employment Guarantee Scheme (NREGS)
Year EmploymentGenerated (lacs)
Number ofHousehold issue
Job Cards
Total Availability offunds
(Rs. In Crores)
TotalExpenditure
(Rs. In Crores)
Expenditure(%age)
2005-06 2.33 25000 9.02 1.69 192006-07 32.89 179133 41.54 36.70 872007-08 55.37 281842 92.79 65.26 712008-09 79.25 498022(Comm) 146.52 86.89 59Source: Economic Surey, 2009, 482
National Rural Employment Guarantee Scheme (NREGS)NREGS which is now Mahatma Gandhi National Rural Employment
Guarantee Act (MGNREGA) is the first ever law, that guarantees wageemployment at an unprecedented scale with its primary objective to augmentthe wage employment in rural areas (Hazra, 2009:7). The main aim of thisscheme is to provide 100 days of guaranteed unskilled wage employment toeach rural household opting for it. The scheme has been implemented inJammu and Kashmir from February, 2006. The scheme was initially launchedin three districts of the state viz., Doda, Poonch and Kupwara and now it hasbeen extended to two more districts namely Jammu and Anantnag from April,2007 (GOJKb, 2009: 482). While looking at the figures as given in Table 8, itbecomes aptly clear that in 2005-06, the total employment generated was 2.33lac man days, 25000 households have been issued job cards, and fundallocation as well as expenditure on the scheme was 9.02 Crore and 1.69Crore respectively. The corresponding figures for the year 2008-09 foremployment generation, households provided with job cards, funds allocatedand spent are 79.25 lacs, 498022, 1146.52 Crore and 86.89 Crore respectively.This upward trend in the various aspects of the scheme shows that it has beensuccessful though not fully in achieving its objective of increasing theopportunities for the rural poor to reap the benefits of wage employment andState government seems to sincere in allocation of funds for the sameobjective. However, what is surprising is that the funds allocated for thescheme have not been fully used up which may either be due to lack ofawareness of the poor masses about the scheme or because of the lack ofcoordination on the part of government agencies who make deliberate delay inpayments for the work and often demand commission to make the payments.
Indira Awass Yojana (IAY)IAY, a Centrally sponsored scheme is different from the first three
schemes in its way of poverty alleviation as it operates by providing housing

Fayaz Ahmad Bhat and Shazia Manzoor 206
Asia Pacific Journal of Social Sciences, Vol.IV(2), July-Dec 2012, pp.187-212
for those who are living below poverty line in rural areas particularly thosebelonging to SC/ST and freed bonded labourers. The centre and stategovernment share the allocation of funds in the ratio of 75:25 percentrespectively (GOJKc, 2008-09: 154). Analysis of the data as given in Table 9reveals that during 2008-09, the number of houses constructed and upgradedwere 13700 and 5310 respectively with an expenditure of Rs. 53.54 Croresagainst 5347 houses constructed, 1259 upgraded with an expenditure of Rs.11.74 Crores in 2002-03; thus making it clear that from the year of itsimplementation in the state of Jammu and Kashmir, it has made aconsiderable progress in achieving its target.
Table 9Achievement under Indira Awass Yojana (IAY)
Year Houses Taken Up Houses Completed
Per
cent
age
of A
chie
vem
ent
Exp
endi
ture
Incu
rred
(Rs.
In
Cro
res)
New
Con
stru
ctio
n
Up-
grad
atio
n
Tot
al
New
Con
stru
ctio
n
Up-
grad
atio
n
Tot
al
2002-03 7997 1743 9740 5347 1259 6606 67.82 11.742003-04 7367 1930 9297 6535 1877 8412 90.48 12.542004-05 5780 2420 8200 5036 2216 7252 88.44 14.052005-06 9137 2931 12068 5812 2258 8070 66.87 18.262006-07 12665 3558 16223 7773 2166 9939 61.26 23.812007-08 17359 6193 23552 11093 4229 15322 65.06 34.332008-09 19794 7010 26804 13700 5310 19010 70.92 53.54Source: Economic Survey, 2009, pp.483.
Swarna Jayanti Shahri Rozgar Yojana (SJSRY)This scheme is aimed at providing gainful employment to unemployed
and under employed urban poor youth and is funded by the Centralgovernment of India on the same sharing pattern of 75:25, i.e., Seventypercent by Centre and twenty five percent by State as in the case of IndiraAwas Yojana and Swaran Jayanti Gram Swarozgar Yojana. The implementingagencies of the scheme are Divisional and District Urban DevelopmentAgencies.The scheme has three main components:
(a) Urban Self Employment Programme (USEP)(b) Urban Wage Employment Programme (UWEP)(c) Development of Women and Children in Urban areas (DW & CUA)

Fayaz Ahmad Bhat and Shazia Manzoor 207
Asia Pacific Journal of Social Sciences, Vol.IV(2), July-Dec 2012, pp.187-212
USEP focuses on the development of skills through training and assists theurban poor in establishing income generating micro enterprises by providingthem subsidy of around fifteen percent of the project cost whereas UWEPseeks this by providing wage employment to the Urban poor and utilizingtheir labour in creation of durable assets in slum pockets (GOJKc, 2008-09:155 and GOJKb, 2009: 484). Such kind of programmes will surely assist inmaking full use of the human resource of the state.
Basic Services to Urban Poor Projects (BUSP)This is another scheme introduced for construction of dwelling units
for the urban poor. Under the Rajiv Nagar Slum Dwellers Project, 609dwelling units have been constructed for which Rs. 14.25 Crore weresanctioned. Another project namely Rehabilitation and Resettlement of SlumDwellers of Dal Lak, Srinagar has been envisaged to construct 4600 dwellingunits at a sanctioned cost of Rs.90.93 Crores. There are three more projects forconstruction of dweling units at Baghwati Nagar, Jammu, in Cluster of Jammucity and at Sumerbug, Wanganpora and Behrar (GOJKb, 2009: 485).Operation of such kind of projects in the state will not only provideemployment to the urban poor but will also help them to have residential unitsequipped with modern facilities.
Integrated Housing and Slum Development Programme (IHSDP)/Valmiki Ambedkar Awas Yojana (VAMBAY)
This scheme was launched by the State government in December,2001 to facilitate construction and upgradation of dwelling units for urbanslum dwellers. Out of twenty five projects, fifteen were sanctioned in firstphase and remaining ten in the second phase. The total cost of these projectswas estimated to be Rs. 85.20 Crores to create 5176 dwelling units, in whichonly Rs. 29.91 Crore have been received from the Centre (GOJKc, 2008-09:155 and GOJKb, 2009: 485). Such kinds of efforts truly show that governmentis concerned about the urban poor and is trying its best to alleviate theirpoverty.
Jawahar Lal Nehru National Urban Renewal Mission (JNNURM)This scheme was introduced in Jammu and Kashmir in 2005-06. It has
two main components: Basic Services to the Urban Poor Programme (BSUP)and Integrated Housing and Slum Development Programme (IHSDP). Theformer was launched to assist cities and towns in taking up housing andinfrastructural facilities for the urban poor where as the later was introducedalong with BSUP in December, 2005 to assist in construction and upgradationof urban slum dwellings. Jammu and Srinagar cities from the State have beenlisted among the 63 cities selected under JNNURM (GOJKc, 2008-09: 156 &

Fayaz Ahmad Bhat and Shazia Manzoor 208
Asia Pacific Journal of Social Sciences, Vol.IV(2), July-Dec 2012, pp.187-212
GOJKb, 2009: 485).These anti-poverty programmes and policies arecommendable effort of the state government in the direction of alleviating thepoverty.
Although the State government has left no stone unturned to bring thepoor people at par with mainstream society, however one could not deny thefact that there is any single programme or policy which does not haveshortcomings or limitations. There are some possible loopholes in the povertyalleviation strategy of Jammu and Kashmir government such as:
(a) Identification and selection of beneficiaries is not carried according tothe guidelines of any scheme.
(b) In some case BPL families might have been left out.(c) No baseline survey done for identification of poorest of poor.(d) Training of skills for gainful employment is not provided in a proper
manner.(e) There is lack of monitoring and audit in the developmental schemes.(f) Beneficiaries are at the receiving end of the development process and
finally(g) There is lack of knowledge and awareness about policies,
programmes and schemes among the masses especially the poor. Toaggravate this problem, there are official delays and most importantthe conflict because during the turmoil, there is lack of accountabilityon the part of government agencies on how they have, they are or theyhave to spend the money on developmental activities and many a timesfunds are lapsed because of late implementation of developmentalpolicies and programmes.However there is need of more frantic efforts to be taken not only by
the government but also by the civil society to eradicate the roots of thismenace and allow the poor people to make use of their capabilities toparticipate in the different spheres of life which would help them to join themainstream society.
ConclusionFrom the above analysis, it may be concluded that though the Nation
has made a considerable progress in alleviating the poverty but what issurprising that the percentage share of poor in the State of Jammu andKashmir has increased more than twenty percent as shown by the Survey in2008 though it was brought down to about eight percent and five per cent inthe year 2004-05 and 1999-00 respectively. Is this phenomenal increase inpoverty either because of the conflict prevailing in the state or because of anyother reason? This should be explored through well designed sociologicalinvestigation. Further it has been found that the newly carved districts haveshown higher percentage share of poor and the two capital cities as welldistricts of the state have shown lower share of people living Below Poverty

Fayaz Ahmad Bhat and Shazia Manzoor 209
Asia Pacific Journal of Social Sciences, Vol.IV(2), July-Dec 2012, pp.187-212
Line. Although the sex ratio of BPL population is better than the generalpopulation, it is still below the standard norm whereas the average BPLhousehold size is lower than the general population. As far as dispersion ofBPL population by social and religious status is concerned, Scheduled Tribesand Muslims show higher incidence of poverty. It is also explicit from theanalysis of data that the BPL population has more illiterates than the generalpopulation of the State. These findings have serious implications for policymakers and planners. Though State government in collaboration with Centralgovernment is trying it level best to ameliorate the condition of the poorthrough its poverty alleviation programmes, but it has not been fullysuccessful to do so and this emphasizes that there is need of more franticefforts on the part of these agencies to uproot the causes of poverty and allowthe poor to enjoy their capabilities in joining the mainstream society. Stategovernment cannot do this alone and this calls for the intervention of the civilsociety to help not only the state but also the nation to achieve its objective ofpoverty alleviation.

Fayaz Ahmad Bhat and Shazia Manzoor 210
Asia Pacific Journal of Social Sciences, Vol.IV(2), July-Dec 2012, pp.187-212
ReferencesBagchi, Jasodhara, Guha, J. and Sengupta, P. (1997): Loved and Unloved: The Girl
Child in the Family, Stree, Calcutta.
Bhat, M. P. N. and Zavier, A. J. F. (2004). ‘Religion in Demographic Transition: TheCase of Indian Muslims’ in Irudaya Rajan S and K S James (eds),Demographic Change, Health Inequality and Human Development in India,Centre for Economic and Social Studies, Hyderabad.
Census of India (2001). Census of India Jammu & Kashmir 2001, Paper-2 of 2001,Rural-Urban Distribution of Population, New Delhi.
Census of India, (2001). Census of India 2001: CD-Religion, Registrar General ofIndia, Directorate of Census Operations, Government of India, New Delhi.
Census of India, (2011). Provisional Population Totals, Jammu and Kashmir, Series-2, Registrar General of India, Directorate of Census Operations, Governmentof India, New Delhi.
Government of India (GOI) (1993). Report of the Expert Group on Estimation ofProportion and Number of Poor, Planning Commission, New Delhi.
Government of India (GOI) (2009). Report of the Expert Group to Review theMethodology for Estimation of Poverty, Planning Commission, New Delhi(http://www.planningcommission. nic.in/reports/genrep/rep_pov.pdf).
Government of Jammu and Kashmir, (GOJKa) (2008). Below Poverty Line Survey,Directorate of Economics and Statistics, Srinagar.
Government of Jammu and Kashmir, (GOJKb) (2008-09). Economic Survey,Directorate of Economics and Statistics, Srinagar.
Government of Jammu and Kashmir, (GOJKc) (2009), Performance Review ofJammu and Kashmir Economy. Direcotorate of Economics and Statistics,Srinagar.
Guha J, and Sengupta P (2002). Enrolment, Dropout and Grade Completion of GirlChildren in West Bengal, Economic and Political Weekly, Vol. 37, No. 17,pp. 1621-1637.
Hazra, A. (2009). Transforming Rural India, Kurukshetra, Vol. 58, No. 2, pp.52.
Hussain, N. and Menka (2010). Dimensions of Poverty and its Determinants: A CaseStudy of Malda District of West Bengal (India), Asia Pacific Journal ofSocial Sciences, Vol. II, No.2, pp. 67-81.
Jejeebhoy, S. J. (1993). 'Family Size, Outcomes for Children and Gender Disparities:Case of Rural Maharashtra', Economic and Political Weekly, August 28, pp.1811-21;

Fayaz Ahmad Bhat and Shazia Manzoor 211
Asia Pacific Journal of Social Sciences, Vol.IV(2), July-Dec 2012, pp.187-212
Krishnaji, N. (1987). Poverty and Sex Ratio: Some Data and Speculations, Economicand Political Weekly, Vol. 22 (23), pp, 892-897.
Lanjouw, P and Ravallion M (1995), Poverty and Household Size, The EconomicJournal, Vol. 105, No. 433, pp. 1415-1434.
Mabughi, N. and Selim, T. (2006). Poverty as social Deprivation: A Survey. Reviewof Social Economy, Vol. LXIV, No. 2, pp.181-204.
Mayer, P. (1999). India's Falling Sex Ratios, Population and Development Review,Vol. 25, No.2, p. 324.
Omvedt, G. (1978). Women and Rural Revolt in India, Journal of Peasant Studies,Vol. 5, No. 3, p. 382.
Pal, P.; Chakravarty, S. R. and Bhattacharya, N. (1986). Poverty in Rural India: ADecomposition Analysis, Indian Economic Review, Vol. 21, No 2, pp. 149-84.
Patel, T. (2004). Missing Girls in India, Economic and Political Weekly, Vol. 39,No.9, p. 887.
Rao, V. M. and Vivekananda, M. (1982). The Poor as a Social Stratum: SomeEconomic Criteria for Studying Poverty, Economic and Political Weekly,Vol. 17, No.27, pp. 1107-1112.
Saggar, M and Pan, I. (1994). SCs and STs in Eastern India: Inequality and PovertyEstimates, Economic and Political Weekly, Vol. 29, No.10, pp. 567-569+571-574
Saith, A. (2005). Poverty Lines versus the Poor- Method versus Meaning, Economicand Political Weekly, Vol. 40, No. 43, pp. 4601-4610.
Sen, A. (2004). Social Exclusion: Concept, Application, and Scrutiny, Critical Quest,New Delhi. pp. 1-48.
Shariff, A. (2001). India: Human Development Report. A Profile of Indian States inthe 1990s, Oxford University Press, New Delhi.
Srinivasan, K. and Mohanty, S. K. (2004). Deprivation of Basic Amenities by Casteand Religion: Empirical Study using NFHS Data, Economic and PoliticalWeekly, Vol. 39, No. 7, pp 728-35.
Stiglitz, J. E. (1973). Education and Inequality, Annals of the American Academy ofPolitical and Social Science, Vol. 409, Income Inequality, pp. 135-145.
UNDP (1997). Human Development Report, Oxford University Press, NewYork, pp.2.

Fayaz Ahmad Bhat and Shazia Manzoor 212
Asia Pacific Journal of Social Sciences, Vol.IV(2), July-Dec 2012, pp.187-212
UNDP (2004). Cultural Liberty in Today’s Diverse World, Human DevelopmentReport, United Nations Development Programme, New York.
UNDP (2010). Human Development Report, Palgrave Macmillan, Basingstoke, NewYork.
Ushadevi, M. D. (2001). Poverty Database in Education: Strategies for MonitoringPoverty Reduction, Economic and Political Weekly, Vol. 36, No. 29, pp.2779-2783.
Vaidyanathan, A. (2001). Poverty and Development Policy. Economic and PoliticalWeekly, Vol. 36, No. 21, pp. 1807-1822.
Visaria, P. (1980). Poverty and Living Standards in Asia. Living StandardsMeasurement Study, Working Paper No. 2, World Bank, Washington, D.C.;Sundrum, R. M. (1990). Income Distribution in Less Developed Countries,Routledge, London and Lipton, M. and Ravallion, M. (1994). ‘Poverty andPolicy’ In Handbook of Development Economies, (eds). Jere Behrman andT.N Srinivasan), Vol. 3, Amsterdam, North-Holland.
Visaria, P. M. (1961). The Sex Ratio of the Population of India, Census of India,1961, Monograph No.10, p.66.
Vyas, V.S and Bhargava, P. (1995). Public intervention for Poverty Alleviation: AnOverview, Economic and Political Weekly, Vol. 30, No.41/42, pp. 2559-2561+2563-2565+2567-2569+2571-2572.