Nutrition among Vulnerable Populations - MDPI
174
Nutrition among Vulnerable Populations Printed Edition of the Special Issue Published in Nutrients www.mdpi.com/journal/nutrients Heather Eicher-Miller and Marie Kainoa Fialkowski Revilla Edited by
-
Upload
khangminh22 -
Category
Documents
-
view
0 -
download
0
Transcript of Nutrition among Vulnerable Populations - MDPI

Nutrition among Vulnerable Populations
Printed Edition of the Special Issue Published in Nutrients
www.mdpi.com/journal/nutrients
Heather Eicher-Miller and Marie Kainoa Fialkowski RevillaEdited by
Nutrition am
ong Vulnerable Populations • Heather Eicher-M
iller and Marie Kainoa Fialkow
ski Revilla

Nutrition among Vulnerable Populations


Nutrition among Vulnerable Populations
Editors
Heather Eicher-Miller
Marie Kainoa Fialkowski Revilla
MDPI • Basel • Beijing • Wuhan • Barcelona • Belgrade • Manchester • Tokyo • Cluj • Tianjin

Editors
Heather Eicher-Miller
Purdue University
USA
Marie Kainoa Fialkowski Revilla University of Hawai‘i at Manoa USA
Editorial Office
MDPI
St. Alban-Anlage 66
4052 Basel, Switzerland
This is a reprint of articles from the Special Issue published online in the open access journal Nutrients
(ISSN 2072-6643) (available at: https://www.mdpi.com/journal/nutrients/special issues/nutrition
vulnerable population).
For citation purposes, cite each article independently as indicated on the article page online and as
indicated below:
LastName, A.A.; LastName, B.B.; LastName, C.C. Article Title. Journal Name Year, Article Number,
Page Range.
ISBN 978-3-03943-587-6 (Hbk)
ISBN 978-3-03943-588-3 (PDF)
c© 2020 by the authors. Articles in this book are Open Access and distributed under the Creative
Commons Attribution (CC BY) license, which allows users to download, copy and build upon
published articles, as long as the author and publisher are properly credited, which ensures maximum
dissemination and a wider impact of our publications.
The book as a whole is distributed by MDPI under the terms and conditions of the Creative Commons
license CC BY-NC-ND.
Contents
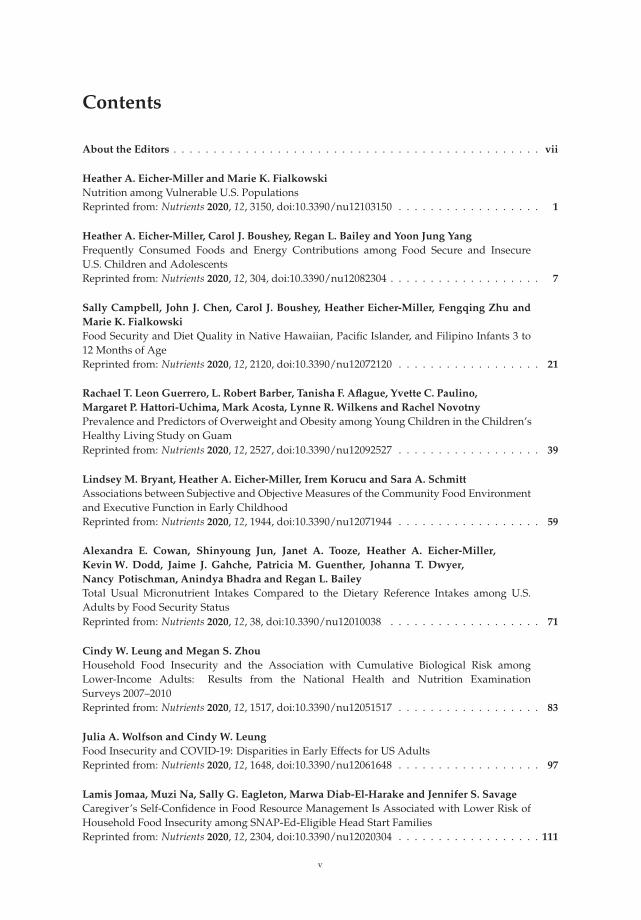
About the Editors . . . . . . . . . . . . . . . . . . . . . . . . . . . . . . . . . . . . . . . . . . . . . . vii
Heather A. Eicher-Miller and Marie K. Fialkowski
Nutrition among Vulnerable U.S. PopulationsReprinted from: Nutrients 2020, 12, 3150, doi:10.3390/nu12103150 . . . . . . . . . . . . . . . . . . 1
Heather A. Eicher-Miller, Carol J. Boushey, Regan L. Bailey and Yoon Jung Yang
Frequently Consumed Foods and Energy Contributions among Food Secure and InsecureU.S. Children and AdolescentsReprinted from: Nutrients 2020, 12, 304, doi:10.3390/nu12082304 . . . . . . . . . . . . . . . . . . . 7
Sally Campbell, John J. Chen, Carol J. Boushey, Heather Eicher-Miller, Fengqing Zhu and
Marie K. Fialkowski
Food Security and Diet Quality in Native Hawaiian, Pacific Islander, and Filipino Infants 3 to12 Months of AgeReprinted from: Nutrients 2020, 12, 2120, doi:10.3390/nu12072120 . . . . . . . . . . . . . . . . . . 21
Rachael T. Leon Guerrero, L. Robert Barber, Tanisha F. Aflague, Yvette C. Paulino, Margaret P. Hattori-Uchima, Mark Acosta, Lynne R. Wilkens and Rachel Novotny
Prevalence and Predictors of Overweight and Obesity among Young Children in the Children’s Healthy Living Study on GuamReprinted from: Nutrients 2020, 12, 2527, doi:10.3390/nu12092527 . . . . . . . . . . . . . . . . . . 39
Lindsey M. Bryant, Heather A. Eicher-Miller, Irem Korucu and Sara A. Schmitt
Associations between Subjective and Objective Measures of the Community Food Environmentand Executive Function in Early ChildhoodReprinted from: Nutrients 2020, 12, 1944, doi:10.3390/nu12071944 . . . . . . . . . . . . . . . . . . 59
Alexandra E. Cowan, Shinyoung Jun, Janet A. Tooze, Heather A. Eicher-Miller, Kevin W. Dodd, Jaime J. Gahche, Patricia M. Guenther, Johanna T. Dwyer, Nancy Potischman, Anindya Bhadra and Regan L. Bailey
Total Usual Micronutrient Intakes Compared to the Dietary Reference Intakes among U.S. Adults by Food Security StatusReprinted from: Nutrients 2020, 12, 38, doi:10.3390/nu12010038 . . . . . . . . . . . . . . . . . . . 71
Cindy W. Leung and Megan S. Zhou
Household Food Insecurity and the Association with Cumulative Biological Risk amongLower-Income Adults: Results from the National Health and Nutrition ExaminationSurveys 2007–2010Reprinted from: Nutrients 2020, 12, 1517, doi:10.3390/nu12051517 . . . . . . . . . . . . . . . . . . 83
Julia A. Wolfson and Cindy W. Leung
Food Insecurity and COVID-19: Disparities in Early Effects for US AdultsReprinted from: Nutrients 2020, 12, 1648, doi:10.3390/nu12061648 . . . . . . . . . . . . . . . . . . 97
Lamis Jomaa, Muzi Na, Sally G. Eagleton, Marwa Diab-El-Harake and Jennifer S. Savage
Caregiver’s Self-Confidence in Food Resource Management Is Associated with Lower Risk ofHousehold Food Insecurity among SNAP-Ed-Eligible Head Start FamiliesReprinted from: Nutrients 2020, 12, 2304, doi:10.3390/nu12020304 . . . . . . . . . . . . . . . . . . 111
v

Heather A. Eicher-Miller, Rebecca L. Rivera, Hanxi Sun, Yumin Zhang, Melissa K. Maulding
and Angela R. Abbott
Supplemental Nutrition Assistance Program-Education Improves Food Security Independentof Food Assistance and Program CharacteristicsReprinted from: Nutrients 2020, 12, 2636, doi:10.3390/nu12092636 . . . . . . . . . . . . . . . . . . 127
Katherine Engel and Elizabeth H. Ruder
Fruit and Vegetable Incentive Programs for Supplemental Nutrition Assistance Program(SNAP) Participants: A Scoping Review of Program StructureReprinted from: Nutrients 2020, 12, 1676, doi:10.3390/nu12061676 . . . . . . . . . . . . . . . . . . 143
vi

About the Editors
Heather Eicher-Miller, Associate Professor of Nutrition Science, Purdue University has
discovered adverse dietary and health outcomes associated with food insecurity and developed
novel interventions to improve food security. She also creates new analytical and methodological
techniques to quantify and evaluate the relationship between food insecurity, diet, and health.
Marie Kainoa Fialkowski Revilla, Associate Professor of Human Nutrition at the University
of Hawai‘i at Manoa, research focuses on gathering more comprehensive diet and health-related
information on minority and indigenous populations so that more culturally appropriate health
promotion activities may be developed.
vii


nutrients
Editorial
Nutrition among Vulnerable U.S. Populations
Heather A. Eicher-Miller 1,* and Marie K. Fialkowski 2
1 Department of Nutrition Science, College of Health and Human Science, Purdue University,West Lafayette, IN 47907, USA
2 Department of Human Nutrition, Food and Animal Sciences, College of Tropical Agriculture and HumanResources, University of Hawai’i at Manoa, Honolulu, HI 96822, USA; [email protected]
* Correspondence: [email protected]; Tel.: +1-765-494-6815
Received: 2 October 2020; Accepted: 12 October 2020; Published: 15 October 2020
Keywords: food security; food insecurity; low resource; nutrition; diet; health; food access;food environment; interventions; U.S. population
Food insecurity and low resources continue to be a burden influencing the health, well-being,growth and development of millions of U.S. children and adults [1–4]. Individuals and familiesexperiencing restrained access to food may be concentrated in certain geographic areas or distributedthroughout communities. Sometimes groups managing the situation of little or no food resourcesare even unknown because of their isolated situations. They include all ages, groups of varyingraces/ethnicities, diverse household compositions, those living in rural and urban areas and manyothers [1,2]. Many of these groups, both hidden and visible, have rates of food insecurity well above thenational average and are influenced by persistent conditions which are historically resistant to trendsof national improvement in food security [1,5,6]. Yet, even national food security estimate trends arecurrently in flux as environmental influences such as the coronavirus pandemic and economic changesshape the food landscape of the U.S. [7]. Research attention to these subsets of the population andvarying environmental influences are imperative to determine U.S. health, well-being and nutritionalstatus associated with food insecurity and to use this information to improve these conditions.
Not enough is known about the nutritional status and dietary intake in the diverse array oflow-resource and food insecure groups despite summary information regarding the broad group ofU.S. children and adults. Some of these subsets may be missed in national surveillance for reasons suchas limited samples to make robust estimates, non-response or attrition [8,9]. Nor are the environmentsand nutritional barriers of the diversity of vulnerable population groups affected by food insecurity andlow resources fully understood [10,11]. Creating interventions that effectively intervene to improvefood security and nutritional status, however, are dependent on this knowledge as broad, summaryinformation may not translate to a one-size-fits-all approach to improve food security in such a variedfood landscape. Tailored approaches to quantify access to food, the nutrition environment, dietarybehaviors and other barriers are necessary to identify the needs in diverse populations and then tobuild successful interventions that will improve dietary intake, reduce rates of chronic disease andcounter negative factors in the environment [12]. In order to begin to fill this gap, this Special Issue on“Nutrition Among Vulnerable Populations” features papers quantifying dietary intake, nutritionalstatus, access to food and food security, barriers to healthful foods and food security and environmentalinfluences experienced by vulnerable groups with a high prevalence of food insecurity. The followingsections summarize the findings of the four papers on children [13–16], three papers on adults [17–19]and three papers featuring studies of families or households (Figure 1) [20–22].
Nutrients 2020, 12, 3150; doi:10.3390/nu12103150 www.mdpi.com/journal/nutrients1

Nutrients 2020, 12, 3150
Chidren
Diet [13, 14]
Health [15]
Environment [16]
Adults
Diet [17]
Health [18]
Environment [19]
Households
Behaviors to promote in
interventions [20]
Interventions [21, 22]
Figure 1. Populations sampled and topical areas of studies included in the Special Issue “Nutritionamong Vulnerable Populations”.
The diet, health and environmental associations linked with food insecurity or low resourcesamong vulnerable child populations are featured in papers including samples drawn from rarelyinvestigated young children living in Hawai’i, Guam and the Midwestern U.S., while a sample ofchildren and adolescents included in the National Health and Nutrition Examination Survey (NHANES)provided nationally representative contrasts of the diets of food secure and insecure children. Startingwith a national scope, the foods and beverages and food groups that were most frequently consumedand contributing most to energy among U.S. children ages 6 to 11 years and 12 to 17 years who wereliving in situations of food security and food insecurity among household children were determinedand compared in a study by Eicher-Miller et al. [14] using NHANES data. Results showed that both thefrequency and energy contributions of beverages (including diet, sweetened, juice, coffee and tea) weresignificantly greater among food insecure compared with food secure children ages 12 to 17 years whohad significantly more frequent water intake, while beverage and mixed dish frequency were higheramong food insecure children ages 6 to 11 years compared to food secure children who exhibitedhigher frequency and energy from snacks [14]. Dietary differences by food security status amonginfants were also investigated by Campbell et al. [13] in a sample from Hawai’i. Surprisingly, findingsshowed that Native Hawaiian, Pacific Islander and Filipino infants ages 3 to 12 months from foodinsecure households consumed foods from more food groups and consumed fresh foods on a greaterproportion of days compared with infants from food secure households [13]. A community-basedsample of children 2 to 8 years old from Guam were the focus of another study evaluating health,lifestyle and dietary intake [15]. Approximately 80% were receiving food assistance, 51% experiencedfood insecurity and 27.4% were affected by overweight and obesity. Compared with children who had ahealthy weight, children who were overweight and obese were more likely to have educated caregiversand to have a higher intake of sugar-sweetened beverages [15]. These dietary and demographicassociations with poor health outcomes among young children are important factors to consider inhealth and food security-promoting interventions. However, broad, environmental-level influencesmay also be linked with the health and development of young children. The food environmentis conceptualized as the availability, affordability and accessibility of grocery stores or other foodretail outlets that promote a healthful diet [23]. Parent reports of the community food environmentof children ages 3 to 5 years from a Midwestern U.S. state showed that children living in higherquality community food environments had better cognitive ability, specifically executive function,compared with children living in lower quality community food environments [16]. Insights fromthese child-focused papers contribute new information on the environmental, demographic, lifestyleand behavioral factors of vulnerable groups that influence nutrition, health and development.
2

Nutrients 2020, 12, 3150
Advances in knowledge of the nutrient intake and health risks associated with food securityalong [17,18] with early effects of the coronavirus pandemic [19] among U.S. adults are featuredseparately in three articles. Total usual micronutrient intakes from foods, beverages and dietarysupplements were compared to the dietary reference intakes among U.S. adults ≥19 years by sex andfood security status using nationally representative data from the NHANES [17]. Results showedthat both male and female adults living in food insecure households had a higher risk for inadequateintakes of magnesium, potassium and vitamins A, B6, B12, C, D, E and K, while food insecure menalso had a higher risk for inadequate phosphorous, selenium and zinc. The risk of inadequacy wasnot different by food security status for nutrients, calcium, iron (determined in men only), cholineor folate. However, the risk for exceeding the tolerable upper intake level was greater among somedietary supplement users [17]. Micronutrient inadequacy may contribute to the risk for chronic diseaseand poor health, especially when experienced over years into later adulthood [23]. The association ofhousehold food insecurity among low-income adults ages 20 to 65 years with cumulative biologicalrisk, a measure of the body’s physiological response to chronic stress, was investigated, similarly usingNHANES data in a study by Leung et al. [18]. Results showed that women with food insecurity hadhigher cumulative biological risk scores and higher odds of elevated biological risk, while associationswere not observed among men. The authors hypothesized that the chronic stress of food insecurity mayfacilitate the association with chronic poor health outcomes for women [18]. Another national, althoughnot representative, sample of low-income (<250% of the federal poverty line) U.S. adults ≥18 years oldcompleted a web-based survey to determine the early impact of the COVID-19 pandemic, offeringa critical first look at how low-income families are coping with economic and lifestyle changes [19].Approximately 44% were food insecure, and were significantly more likely to report basic needschallenges compared with food secure adults, with the group experiencing very low food securityreporting the most severe difficulties. Food insecure compared with food secure adults were morevulnerable to the economic, dietary and health risks of the pandemic [19]. These current and ongoingeffects of the pandemic may compound the micronutrient and cumulative biological risk disparitiesdiscovered and documented in these Special Issue articles on U.S. adults.
Clearly, there is a need for interventions that apply knowledge of the barriers, nutrition, healthand environmental risks to improve food security and health among low-resource populations.Three studies in this Special Issue focus on interventions or behaviors that may be promoted in futureinterventions among low-resource families [20–22]. A sample of families with young children in HeadStart from a rural area of a northern U.S. state was used to investigate the association of food resourcemanagement behaviors, food resource management self-confidence and financial practices withhousehold food insecurity [20]. The participants with high food resource management self-confidencehad significantly lower odds of household food insecurity; the inclusion of food resource managementself-confidence promotion in nutrition education interventions for the low-resource population mayassist management of food dollars to improve household food insecurity [20]. Nutrition educationprograms like the Supplemental Nutrition Assistance Program Education (SNAP-Ed) have been shownto improve food security and may integrate food resource management self-confidence building topotentially increase the magnitude or sustainability of those changes. Eicher-Miller et al. investigatedthe characteristics of SNAP-Ed program delivery to determine their role in SNAP-Ed’s interventioneffect on food insecurity. In addition, the role of participant co-participation in food assistanceprograms like SNAP was also investigated as a mediator or moderator to food security change dueto SNAP-Ed as an intervention [21]. Results of this secondary analysis of data from a longitudinalrandomized controlled trial of SNAP-Ed among women ≥18 years from households with childrenin a Midwestern U.S. state showed that neither variation of program delivery characteristics norparticipation or changes in participation in food assistance programs, associated with the impact ofSNAP-Ed on change in food security over time, meaning SNAP-Ed directly improved food securityamong participants [21]. Other interventions among low-income and food insecure participantsinclude incentives to encourage improved fruit and vegetable intake. A scoping review of fruit and
3

Nutrients 2020, 12, 3150
vegetable incentive-based interventions was completed to determine structural factors that influencedprogram effectiveness [22]. Eighteen of the 19 studies reported a positive impact on either participantfruit and vegetable purchases or intake, and most were located at farmers’ markets and offered anincentive in the form of a token, coupon or voucher. The summative knowledge may further informthe design, implementation and success of future fruit and vegetable interventions targeted to improvenutrition among low-income populations [22].
In conclusion, the articles in this Special Issue address dietary intake, behaviors and healthamong low-resource and food insecure groups. Some of the studies feature populations that havenot traditionally been included in research and fill gaps, informing knowledge of the characteristics,lifestyles and environments of these groups. Others feature results representative of vulnerablegroups in the U.S. population. These contributions may inform future interventions on food securityand dietary intake to incorporate confidence-promoting aspects, an evaluation of the program andparticipation factors of nutrition education interventions, and a summary of the structural factors ofsuccessful fruit and vegetable incentive programs. This Special Issue advances knowledge to improvefood security and health among vulnerable U.S. populations.
Funding: This work is/was supported by the USDA National Institute of Food and Agriculture, Hatch project1019736, by the National Institute on Minority Health and Health Disparities of the National Institutes of Health(U54MD00760), and the HMSA Foundation Community Fund grant #CF-021803.
Conflicts of Interest: Unrelated to this submission, HAE-M has served as a consultant to Colletta Consulting,Mead Johnson, the National Dairy Council, the Indiana Dairy Association and the American Egg Board. She haspreviously received travel support to present research findings from the Institute of Food Technologists and theInternational Food Information Council. However, the funders listed above (USDA) had no role in this editorial.MKF has no conflicts of interest to report.
References
1. Coleman-Jensen, A.; Rabbitt, M.P.; Gregory, C.A.; Singh, A. Household Food Security in the United States in2018; ERR-237; U.S. Department of Agriculture, Economic Research Service: Washington, DC, USA, 2019.
2. Nord, M. Food Insecurity in Households with Children: Prevalence, Severity, and Household Characteristics; EIB-56;U.S. Dept. of Agriculture, Economic Research Service: Washington, DC, USA, 2009.
3. Gundersen, C.; Ziliak, J.P. Food insecurity and health outcomes. Health Aff. 2015, 34, 1830–1839. [CrossRef][PubMed]
4. Gregory, C.A.; Coleman-Jensen, A. Food Insecurity, Chronic Disease, and Health among Working-Age Adults;ERR-235; U.S. Department of Agriculture, Economic Research Service: Washington, DC, USA, 2017.
5. Kaufman, P.; Dicken, C.; Williams, R. Measuring Access to Healthful, Affordable Food in American Indian andAlaska Native Tribal Areas; EIB-131; U.S. Department of Agriculture, Economic Research Service: Washington,DC, USA, 2014.
6. Myers, A.M.; Painter, M.A., II. Food Insecurity in the United States of America: An Examination ofRace/Ethnicity and Nativity. Food Secur. 2017, 9, 1419–1432. [CrossRef]
7. Schanzenbach, D.W.; Pitts, A. How Much Has Food Insecurity Risen? Evidence from the Census HouseholdPulse Survey. Institute for Policy Research Rapid Research Report. 2020. Available online: https://www.ipr.northwestern.edu/documents/reports/ipr-rapid-researchreports-pulse-hh-data-10-june-2020.pdf (accessedon 30 September 2020).
8. Agency for Healthcare Research and Quality. Defining Categorization Needs for Race and Ethnicity Data; Agencyfor Healthcare Research and Quality: Rockville, MD, USA, 2018. Available online: https://www.ahrq.gov/research/findings/final-reports/iomracereport/reldata3.html (accessed on 30 September 2020).
9. Ver Ploeg, M.; Perrin, E. (Eds.) Eliminating Health Disparities: Measurement and Data Needs; U.S. NationalResearch Council; Panel on DHHS Collection of Race and Ethnic Data; National Academies Press: Washington,DC, USA, 2004.
10. Mechanic, D.; Tanner, J. Vulnerable People, Groups, and Populations: Societal View. Health Aff. 2007, 26,1220–1230. [CrossRef] [PubMed]
4
Nutrients 2020, 12, 3150
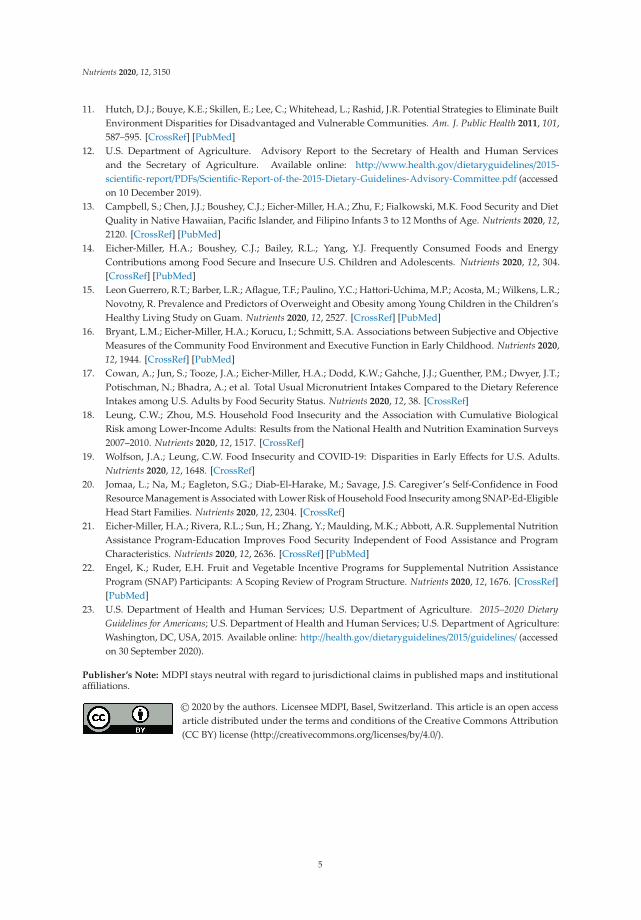
11. Hutch, D.J.; Bouye, K.E.; Skillen, E.; Lee, C.; Whitehead, L.; Rashid, J.R. Potential Strategies to Eliminate BuiltEnvironment Disparities for Disadvantaged and Vulnerable Communities. Am. J. Public Health 2011, 101,587–595. [CrossRef] [PubMed]
12. U.S. Department of Agriculture. Advisory Report to the Secretary of Health and Human Servicesand the Secretary of Agriculture. Available online: http://www.health.gov/dietaryguidelines/2015-scientific-report/PDFs/Scientific-Report-of-the-2015-Dietary-Guidelines-Advisory-Committee.pdf (accessedon 10 December 2019).
13. Campbell, S.; Chen, J.J.; Boushey, C.J.; Eicher-Miller, H.A.; Zhu, F.; Fialkowski, M.K. Food Security and DietQuality in Native Hawaiian, Pacific Islander, and Filipino Infants 3 to 12 Months of Age. Nutrients 2020, 12,2120. [CrossRef] [PubMed]
14. Eicher-Miller, H.A.; Boushey, C.J.; Bailey, R.L.; Yang, Y.J. Frequently Consumed Foods and EnergyContributions among Food Secure and Insecure U.S. Children and Adolescents. Nutrients 2020, 12, 304.[CrossRef] [PubMed]
15. Leon Guerrero, R.T.; Barber, L.R.; Aflague, T.F.; Paulino, Y.C.; Hattori-Uchima, M.P.; Acosta, M.; Wilkens, L.R.;Novotny, R. Prevalence and Predictors of Overweight and Obesity among Young Children in the Children’sHealthy Living Study on Guam. Nutrients 2020, 12, 2527. [CrossRef] [PubMed]
16. Bryant, L.M.; Eicher-Miller, H.A.; Korucu, I.; Schmitt, S.A. Associations between Subjective and ObjectiveMeasures of the Community Food Environment and Executive Function in Early Childhood. Nutrients 2020,12, 1944. [CrossRef] [PubMed]
17. Cowan, A.; Jun, S.; Tooze, J.A.; Eicher-Miller, H.A.; Dodd, K.W.; Gahche, J.J.; Guenther, P.M.; Dwyer, J.T.;Potischman, N.; Bhadra, A.; et al. Total Usual Micronutrient Intakes Compared to the Dietary ReferenceIntakes among U.S. Adults by Food Security Status. Nutrients 2020, 12, 38. [CrossRef]
18. Leung, C.W.; Zhou, M.S. Household Food Insecurity and the Association with Cumulative BiologicalRisk among Lower-Income Adults: Results from the National Health and Nutrition Examination Surveys2007–2010. Nutrients 2020, 12, 1517. [CrossRef]
19. Wolfson, J.A.; Leung, C.W. Food Insecurity and COVID-19: Disparities in Early Effects for U.S. Adults.Nutrients 2020, 12, 1648. [CrossRef]
20. Jomaa, L.; Na, M.; Eagleton, S.G.; Diab-El-Harake, M.; Savage, J.S. Caregiver’s Self-Confidence in FoodResource Management is Associated with Lower Risk of Household Food Insecurity among SNAP-Ed-EligibleHead Start Families. Nutrients 2020, 12, 2304. [CrossRef]
21. Eicher-Miller, H.A.; Rivera, R.L.; Sun, H.; Zhang, Y.; Maulding, M.K.; Abbott, A.R. Supplemental NutritionAssistance Program-Education Improves Food Security Independent of Food Assistance and ProgramCharacteristics. Nutrients 2020, 12, 2636. [CrossRef] [PubMed]
22. Engel, K.; Ruder, E.H. Fruit and Vegetable Incentive Programs for Supplemental Nutrition AssistanceProgram (SNAP) Participants: A Scoping Review of Program Structure. Nutrients 2020, 12, 1676. [CrossRef][PubMed]
23. U.S. Department of Health and Human Services; U.S. Department of Agriculture. 2015–2020 DietaryGuidelines for Americans; U.S. Department of Health and Human Services; U.S. Department of Agriculture:Washington, DC, USA, 2015. Available online: http://health.gov/dietaryguidelines/2015/guidelines/ (accessedon 30 September 2020).
Publisher’s Note: MDPI stays neutral with regard to jurisdictional claims in published maps and institutionalaffiliations.
© 2020 by the authors. Licensee MDPI, Basel, Switzerland. This article is an open accessarticle distributed under the terms and conditions of the Creative Commons Attribution(CC BY) license (http://creativecommons.org/licenses/by/4.0/).
5


nutrients
Article
Frequently Consumed Foods and EnergyContributions among Food Secure and InsecureU.S. Children and Adolescents
Heather A. Eicher-Miller 1,*, Carol J. Boushey 1,2, Regan L. Bailey 1 and Yoon Jung Yang 1,3
1 Department of Nutrition Science, Purdue University, 700 W State St, West Lafayette, IN 47907, USA;[email protected] (C.J.B.); [email protected] (R.L.B.); [email protected] (Y.J.Y.)
2 Epidemiology Program, University of Hawaii Cancer Center, 701 Ilalo St, Honolulu, HI 96813, USA3 Department of Food and Nutrition, Dongduk Women’s University, 60 Hwarang-ro 13-gil, Wolgok 2(i)-dong,
Seongbuk-gu, Seoul 136714, Korea* Correspondence: [email protected]; Tel.: +1-765-494-6815
Received: 24 December 2019; Accepted: 20 January 2020; Published: 23 January 2020
Abstract: Food insecurity is associated with nutritional risk in children. This study identified andcompared the most frequently consumed foods, beverages, and food groups and their contributions toenergy intake among U.S. children and adolescents (6–11, 12–17 years) by food security status. Dietaryintake from the day-1, 24-h dietary recall, and household child food security status were analyzed inthe 2007–2014 National Health and Nutrition Examination Survey (n = 8123). Foods and beverageswere classified into food categories, ranked, and compared by weighted proportional frequency andenergy contribution for food security groups by age. Significant differences between household childfood security groups were determined using the Rao-Scott modified chi-square statistic. The weightedproportional frequency of beverages (including diet, sweetened, juice, coffee, and tea) and their energywas significantly higher among food insecure compared with food secure while the reverse was truefor water frequency among 12–17 years. Beverage and mixed dish frequency were higher among foodinsecure compared with food secure 6–11 years while the reverse was true for frequency and energyfrom snacks. Frequency-differentiated intake patterns for beverages and snacks by food securityacross age groups may inform dietary recommendations, population-specific dietary assessmenttools, interventions, and policy for food insecure children.
Keywords: food group intake; child food security; popularly consumed foods; low-resource children;adolescents; food intake; beverage intake; dietary intake; food insecurity; US children
1. Introduction
The U.S. Dietary Guidelines for Americans Advisory Committee identified many children andadolescents as having low intakes of fruits, vegetables, whole grains, and dairy concomitant withexcessive intakes of sodium, saturated fats, added sugars, and refined grains [1]. Such dietarypatterns are linked with nutritional risk, or dietary deficiencies that endanger health, as age progressesthrough childhood. Low micronutrient intakes combined with excessive energy intakes culminate inadolescence, when growth is accelerated and nutrients are at highest demand and yet this age grouphas the most nutrient shortfalls across the lifespan [2].
Adolescents and children in food insecure households, with “limited or uncertain availability ofnutritionally adequate and safe foods or limited or uncertain ability to acquire acceptable foods insocially acceptable ways” [3], may be particularly vulnerable to nutrition risk, increasing the likelihoodof suboptimal cognitive and physical health [4–6]. Indeed, iron deficiency anemia and low bone mineralcontent were associated with food insecurity in childhood as were behavioral and mental health
Nutrients 2020, 12, 304; doi:10.3390/nu12082304 www.mdpi.com/journal/nutrients7

Nutrients 2020, 12, 304
problems, and poorer general health [7–10]. These associations may stem from disparities in dietaryintake among food insecure children [11] where the opportunity for divergence from recommendeddietary patterns is high considering limited household budget, time, and other resources. For example,a recent systematic review among U.S. children found strong and consistent evidence of higher addedsugar intake among food insecure children 6–11 years compared to those who were food secure [11].Food insecurity is particularly salient in the U.S. as 3.1 million or 8% of households with children in2016 were food insecure: 7% low food security or “reduced quality and food access problems” and 1%very low food security or “reduced food intake and disrupted eating patterns” because of inadequatefood resources [12].
However, little is known about the specific eating patterns and food and beverage exposurepatterns among U.S. children and adolescents with regard to food security status. Eating patterns,including frequency and amount of foods and beverages consumed, snacking and meal skipping,time of eating occasions and other eating behaviors, influence energy intake and contribute todietary quality [13]. Research on these patterns was a data gap in the Scientific Report of the 2015Dietary Guidelines Advisory Committee along with investigation of foods comprising the U.S. foodenvironments, particularly for food insecure households and low-income individuals [1]. Knowledgeof the specific frequently consumed foods is a novel and practical contribution to inform interventionsand policies aimed to improve dietary quality and food security among children. For example,results may inform a food package of nutrient-dense foods already known to be familiar and oftenconsumed among food insecure children. Therefore, the purposes of this study were to use the NationalHealth and Nutrition Examination Survey (NHANES) 2007–2014 data to: (1) determine the foods andbeverages and categories of foods and beverages most frequently consumed by food security status(food secure, low food secure, and very low food secure) in children (6–11 years) and adolescents(12–17 years), and (2) compare the energy contributions and frequency of reported intake of food andbeverage categories by food security status.
2. Materials and Methods
2.1. NHANES Design
NHANES is a nationally representative, cross-sectional survey of the National Center for HealthStatistics (NCHS) and Centers for Disease Control and Prevention [14,15]. The non-institutionalized,civilian U.S. population are sampled based on characteristics such as age, sex, race-ethnicity, andincome to accommodate the complex, stratified, multistage probability sampling framework [16].Oversampling of certain sub-groups allows for generation of reliable estimates. NHANES protocolwas reviewed and approved by the NCHS Research Ethics Review Board [17].
2.2. Participants
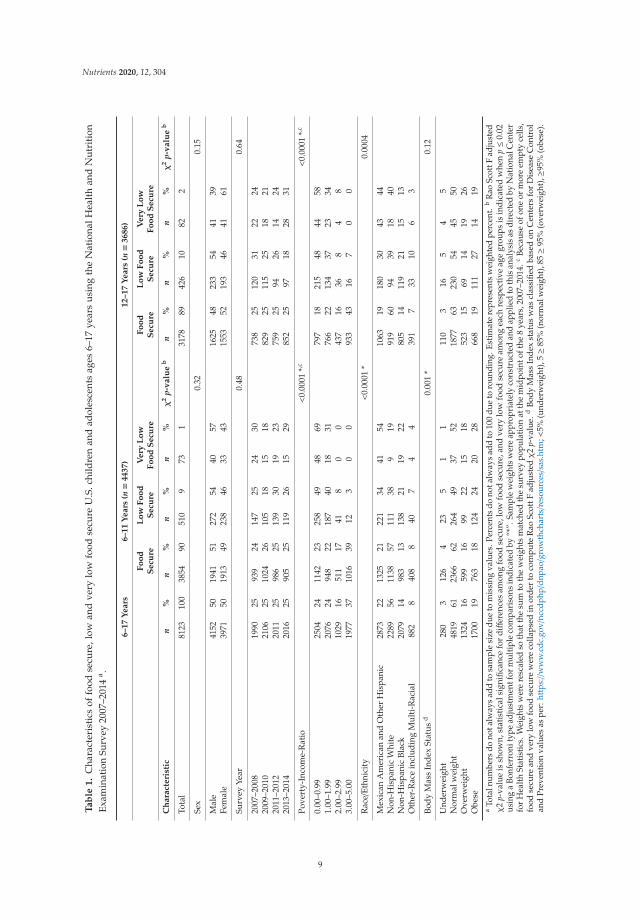
All participants of this secondary analysis completed the dietary component of What We Eatin America (WWEIA)/NHANES 2007–2008, 2009–2010, 2011–2012, and 2013–2014. Children were6–17 years (n = 8,123, Table 1), having a 24-h dietary recall, dietary weights and scores for the U.S.Household Food Security Survey Module [18]. Socioeconomic characteristics of participants wererecorded in participant homes during an in-depth interview for those 16–17 years and a proxy-assistedinterview for those 6–15 years. Age (6–11 or 12–17 years), gender (male or female), survey year(2007–2008, 2009–2010, 2011–2012, 2013–2014), poverty-income-ratio (0.00–0.99, 1.00–1.99, 2.00–2.99,3.00–5.00), race/ethnicity (non-Hispanic white, non-Hispanic black, Hispanic and Mexican American,and “other” race including multi-race), and weight status as indicated by body mass index (underweight,normal weight, overweight), characterized participants. Per NCHS analytic guidelines, “other” race isnot representative of race/ethnic population estimates.
8
Nutrients 2020, 12, 304
Ta
ble
1.
Cha
ract
eris
tics
offo
odse
cure
,low
and
very
low
food
secu
reU
.S.c
hild
ren
and
adol
esce
nts
ages
6–17
year
su
sing
the
Nat
iona
lHea
lth
and
Nu
trit
ion
Exam
inat
ion
Surv
ey20
07–2
014
a .
6–
17
Ye
ars
6–
11
Ye
ars
(n=
4437)
12–17
Years
(n=
36
86
)
Fo
od
Se
cure
Lo
wF
oo
dS
ecu
reV
ery
Lo
wF
oo
dS
ecu
reF
oo
dS
ecu
reL
ow
Fo
od
Se
cure
Ve
ryL
ow
Fo
od
Se
cure
Ch
ara
cte
rist
icn
%n
%n
%n
%χ
2p-
va
lue
bn
%n
%n
%χ
2p-
va
lue
b
Tota
l81
2310
038
5490
510
973
131
7889
426
1082
2
Sex
0.32
0.15
Mal
e41
5250
1941
5127
254
4057
1625
4823
354
4139
Fem
ale
3971
5019
1349
238
4633
4315
5352
193
4641
61
Surv
eyYe
ar0.
480.
64
2007
–200
819
9025
939
2414
725
2430
738
2512
031
2224
2009
–201
021
0625
1024
2610
518
1518
829
2511
525
1821
2011
–201
220
1125
986
2513
930
1923
759
2594
2614
2420
13–2
014
2016
2590
525
119
2615
2985
225
9718
2831
Pove
rty-
Inco
me-
Rat
io<
0.00
01*,c
<0.
0001
*,c
0.00
–0.9
925
0424
1142
2325
849
4869
797
1821
548
4458
1.00
–1.9
920
7624
948
2218
740
1831
766
2213
437
2334
2.00
–2.9
910
2916
511
1741
80
043
716
368
48
3.00
–5.0
019
7737
1016
3912
30
093
343
167
00
Rac
e/Et
hnic
ity
<0.
0001
*0.
0004
Mex
ican
Am
eric
anan
dO
ther
His
pani
c28
7322
1325
2122
134
4154
1063
1918
030
4344
Non
-His
pani
cW
hite
2289
5611
3857
111
389
1991
960
9439
1840
Non
-His
pani
cBl
ack
2079
1498
313
138
2119
2280
514
119
2115
13O
ther
-Rac
ein
clud
ing
Mul
ti-R
acia
l88
28
408
840
74
439
17
3310
63
Body
Mas
sIn
dex
Stat
usd
0.00
1*
0.12
Und
erw
eigh
t28
03
126
423
51
111
03
165
45
Nor
mal
wei
ght
4819
6123
6662
264
4937
5218
7763
230
5445
50O
verw
eigh
t13
2416
599
1699
2215
1852
315
6914
1926
Obe
se17
0019
763
1812
424
2028
668
1911
127
1419
aTo
taln
umbe
rsdo
nota
lway
sad
dto
sam
ple
size
due
tom
issi
ngva
lues
.Per
cent
sdo
nota
lway
sad
dto
100
due
toro
undi
ng.E
stim
ate
repr
esen
tsw
eigh
ted
perc
ent.
bR
aoSc
ottF
adju
sted
χ2
p-va
lue
issh
own,
stat
isti
cals
igni
fican
cefo
rdiff
eren
ces
amon
gfo
odse
cure
,low
food
secu
re,a
ndve
rylo
wfo
odse
cure
amon
gea
chre
spec
tive
age
grou
psis
indi
cate
dw
hen
p≤0
.02
usin
ga
Bonf
erro
nity
pead
just
men
tfor
mul
tiple
com
pari
sons
indi
cate
dby
“*”.
Sam
ple
wei
ghts
wer
eap
prop
riat
ely
cons
truc
ted
and
appl
ied
toth
isan
alys
isas
dire
cted
byN
atio
nalC
ente
rfo
rH
ealth
Stat
istic
s.W
eigh
tsw
ere
resc
aled
soth
atth
esu
mto
the
wei
ghts
mat
ched
the
surv
eypo
pula
tion
atth
em
idpo
into
fthe
8ye
ars,
2007
–201
4.c
Beca
use
ofon
eor
mor
eem
pty
cells
,fo
odse
cure
and
very
low
food
secu
rew
ere
colla
psed
inor
der
toco
mpu
teR
aoSc
ottF
adju
sted
χ2
p-va
lue.
dBo
dyM
ass
Inde
xst
atus
was
clas
sifie
dba
sed
onC
ente
rsfo
rD
isea
seC
ontr
olan
dPr
even
tion
valu
esas
per:
http
s://
ww
w.c
dc.g
ov/n
ccdp
hp/d
npao/g
row
thch
arts/r
esou
rces/s
as.h
tm;<
5%(u
nder
wei
ght)
,5≥8
5%(n
orm
alw
eigh
t),8
5≥9
5%(o
verw
eigh
t),≥
95%
(obe
se).
9

Nutrients 2020, 12, 304
2.3. Measures
One adult per household completed the 18-item U.S. Household Food Security Survey Modulefor households with children <18 years during the household interview. Eight child-focused itemsdetermined food security of household children and were used to classify food security, low and verylow food security; low and very low categories were also collapsed to classify food insecurity [18].Food security of household children rather than the entire household was chosen as more directly tiedto the child experience and dietary intake of household children. Measures of height and weight werecollected during a physical examination at the Mobile Examination Center. Body mass index wascalculated as body weight divided by the square of body height and categorized according to age- andsex-specific percentiles of the 2000 Centers for Disease Control and Prevention growth chart such that<5% (underweight), 5 ≥ 85% (normal weight), 85 ≥ 95% (overweight), ≥95% (obese) to indicate weightstatus [19].
The day-1 dietary recall was completed in person at the Mobile Examination Center using theUSDA Automated Multiple Pass Method, designed to enhance food recalls using a 5-step interviewprocess [20,21]. Participants were prompted to recall all types and amounts of foods and beverages(including water) consumed in the 24-h midnight to midnight time frame before the interview. Children6–11 years reported dietary intake with the assistance of a parent or guardian, those 12–17 yearsself-reported. Probes queried the time and eating occasion of foods, details about preparation andamounts eaten, and finally, any frequently forgotten foods and foods not mentioned earlier. A USDAfood code was assigned to each reported item and linked to a food or beverage in the Food and NutrientDatabase for Dietary Studies (version 4.1 released 2010, 5.0 released 2012, 6.0 released 2014, 2013–2014released 2016) [22], and further sorted and assigned a WWEIA food sub-category/group and broadfood category/group [14].
2.4. Statistical Analysis
The data of food secure and food insecure children, including low and very low food securecategories were stratified by ages: 6–11 and 12–17 years because of similar diets within age ranges,food security reporting, known differences in food security by age in the same household and theNHANES methodology of self-reported dietary recall by age groups. Despite small participant nfor the very low food secure group, hypothesis testing was included because food category reportswere the unit of analysis and n >20 for all food categories except “alcohol” and “other” includinginfant and baby formula (excluded from Table 2). Food category reports of “water” contributingenergy were also <20 but were retained for comparison with frequency. Unadjusted frequencies wereassessed for each food code or WWEIA food or beverage category code using: n
∑i = 1(Ri) where n
= the sample size, i = each participant, Ri = the number of reports of individual food codes for theith individual [23]. The weighted sum of each food code was: n
∑i = 1(Riwi) where wi = sample
weight for the ith individual was used to determine the weighted proportion of foods to the total foodsreported, or the contribution of each food category reported to the total food category reported, givenas: n
∑i = 1(Riwi)/n
∑i = 1(Tiwi) (100) where Ti = total number of reports of all food codes for the ith
individual. The weighted proportion of reported energy was similarly calculated with substitution ofenergy for frequency and total energy for total number of reports. Foods were ranked by weightedfrequency and contribution to energy individually, by food sub-category and broad category (selecteddata shown in tables). The Rao-Scott modified chi-square determined significant differences amongfood secure, low, and very low food secure groups (p < 0.05/3 or p < 0.02 using a Bonferroni adjustmentfor multiple comparisons to mitigate the probability of Type 1 error) and among food secure andinsecure groups (p < 0.05). The results of significant differences among broad food groups were used tofocus presentation of the results and discussion. All analyses were completed in SAS version 9.4 usingSAS survey procedures with adjustment for survey design elements, non-response, and interviewweights to allow inference to U.S. population.
10

Nutrients 2020, 12, 304
Ta
ble
2.
Wha
tWe
Eat
inA
mer
ica
broa
dfo
odca
tego
rya
inta
keco
mp
aris
ons
byfr
equ
ency
and
ener
gyam
ong
food
secu
rean
din
secu
re(l
owan
dve
rylo
wfo
odse
cure
)U.S
.chi
ldre
nan
dad
oles
cent
s6–
11an
d12
–17
year
sus
ing
the
Nat
iona
lHea
lth
and
Nut
riti
onEx
amin
atio
nSu
rvey
2007
–201
4b.
6–
11
Ye
ars
(n=
44
37
)
Fo
od
Secu
reF
oo
dIn
secu
reχ
2p-
Va
lue
Lo
wF
oo
dS
ecu
reV
ery
Lo
wF
oo
dS
ecu
reχ
2p-
Va
lue
WW
EIA
Bro
ad
Fo
od
Cate
go
rya
,c
Wtd
%d
of
Rep
ort
ed
Fo
od
s(S
E)
Wtd
%d
of
Rep
ort
ed
En
erg
y(S
E)
Wtd
%d
of
Rep
ort
ed
Fo
od
s(S
E)
Wtd
%d
of
Re
po
rte
dE
ne
rgy
(SE
)F
oo
ds
eE
ne
rgy
eW
td%
do
fR
ep
ort
ed
Fo
od
s(S
E)
Wtd
%d
of
Re
po
rte
dE
ne
rgy
(SE
)
Wtd
%d
of
Re
po
rte
dF
oo
ds
(SE
)
Wtd
%d
of
Re
po
rte
dE
ne
rgy
(SE
)F
oo
ds
fE
ne
rgy
f
Milk/D
airy
g12
.6(0
.2)
11.6
(0.3
)12
.0(0
.6)
11.0
(0.5
)0.
310.
3612
.0(0
.6)
10.8
(0.6
)11
.7(0
.8)
12.7
(1.2
)0.
470.
34Pr
otei
nh
9.3
(0.2
)12
.1(0
.3)
9.6
(0.5
)11
.6(0
.7)
0.59
0.57
9.3
(0.5
)11
.1(0
.9)
12.0
(0.8
)15
.4(1
.0)
0.11
0.14
Mix
edD
ish
i8.
0(0
.2)
22.1
(0.6
)9.
3(0
.6)
24.8
(1.9
)0.
04*
0.19
9.4
(0.7
)25
.3(2
.1)
8.9
(0.9
)20
.2(1
.7)
0.05
0.15
Gra
inj
11.2
(0.2
)14
.3(0
.3)
11.4
(0.4
)13
.7(0
.8)
0.72
0.49
11.4
(0.5
)13
.8(0
.8)
10.9
(0.8
)12
.8(1
.1)
0.84
0.62
Snac
k/Sw
eetk
16.1
(0.3
)21
.0(0
.5)
14.4
(0.6
)18
.3(0
.9)
0.02
*0.
02*
14.5
(0.6
)18
.1(0
.9)
13.9
(1.7
)20
.1(1
.8)
0.05
0.02
*Fr
uitl
5.8
(0.2
)2.
8(0
.1)
5.1
(0.4
)2.
7(0
.3)
0.17
0.67
4.8
(0.4
)2.
5(0
.3)
7.4
(1.1
)4.
0(0
.5)
0.07
0.24
Vege
tabl
em
6.5
(0.2
)3.
6(0
.2)
6.5
(0.7
)4.
3(0
.5)
0.98
0.26
6.4
(0.7
)4.
4(0
.6)
7.8
(0.9
)3.
3(0
.5)
0.72
0.27
Beve
rage
n11
.4(0
.2)
8.9
(0.2
)12
.7(0
.6)
9.9
(0.6
)0.
02*
0.11
12.8
(0.6
)9.
9(0
.7)
12.0
(1.1
)9.
8(1
.3)
0.04
0.22
Wat
ero
9.0
(0.2
)0.
0(0
.0)
8.9
(0.6
)0.
0(0
.0)
0.90
0.18
9.0
(0.6
)0.
0(0
.0)
8.4
(0.8
)0.
0(0
.0)
0.92
0.18
Fat/
Oil
p3.
3(0
.1)
1.5
(0.1
)3.
1(0
.3)
1.7
(0.2
)0.
560.
553.
3(0
.3)
1.8
(0.3
)1.
3(0
.2)
0.8
(0.1
)0.
030.
21C
ond
q/S
auce
r4.
2(0
.2)
0.7
(0.0
)4.
6(0
.4)
0.8
(0.2
)0.
440.
574.
7(0
.4)
0.9
(0.2
)3.
7(1
.0)
0.5
(0.2
)0.
480.
54Su
gars
s2.
4(0
.1)
1.1
(0.1
)2.
2(0
.2)
1.1
(0.2
)0.
460.
882.
2(0
.2)
1.2
(0.2
)1.
9(0
.6)
0.3
(0.1
)0.
700.
12
12
–1
7Y
ea
rs(n=
36
86
)
Fo
od
Secu
reF
oo
dIn
secu
reχ
2p-
Va
lue
Lo
wF
oo
dS
ecu
reV
ery
Lo
wF
oo
dS
ecu
reχ
2p-
Va
lue
WW
EIA
Bro
ad
Fo
od
Cate
go
rya
,c
Wtd
%d
of
Rep
ort
ed
Fo
od
s(S
E)
Wtd
%d
of
Rep
ort
ed
En
erg
y(S
E)
Wtd
%d
of
Rep
ort
ed
Fo
od
s(S
E)
Wtd
%d
of
Re
po
rte
dE
ne
rgy
(SE
)F
oo
ds
eE
ne
rgy
eW
td%
do
fR
ep
ort
ed
Fo
od
s(S
E)
Wtd
%d
of
Re
po
rte
dE
ne
rgy
(SE
)
Wtd
%d
of
Re
po
rte
dF
oo
ds
(SE
)
Wtd
%d
of
Re
po
rte
dE
ne
rgy
(SE
)F
oo
ds
fE
ne
rgy
f
Milk/D
airy
g10
.7(0
.3)
9.4
(0.3
)9.
8(0
.4)
8.3
(0.5
)0.
060.
089.
7(0
.4)
8.1
(0.6
)10
.3(0
.5)
9.5
(0.8
)0.
170.
20Pr
otei
nh
9.6
(0.3
)12
.8(0
.6)
9.8
(0.5
)12
.7(0
.9)
0.77
0.98
9.7
(0.5
)12
.2(0
.9)
10.6
(0.5
)16
.2(0
.8)
0.74
0.35
Mix
edD
ish
i8.
80.
2)24
.6(0
.7)
10.1
(0.7
)25
.3(1
.5)
0.09
0.66
10.3
(0.8
)25
.8(1
.6)
8.7
(0.3
)21
.9(0
.9)
0.08
0.55
Gra
inj
10.6
(0.2
)12
.8(0
.3)
10.8
(0.4
)12
.7(0
.7)
0.61
0.84
10.9
(0.4
)12
.9(0
.7)
10.5
(0.8
)11
.3(1
.0)
0.87
0.71
Snac
k/Sw
eetk
14.3
(0.4
)18
.7(0
.6)
13.3
(0.6
)18
.6(1
.3)
0.18
0.96
13.5
(0.6
)18
.7(1
.3)
12.4
(0.5
)18
.5(0
.9)
0.28
0.99
Frui
tl4.
3(0
.3)
2.0
(0.1
)4.
1(0
.4)
2.0
(0.3
)0.
660.
884.
1(0
.5)
2.0
(0.2
)4.
1(0
.5)
2.3
(0.3
)0.
920.
92Ve
geta
ble
m7.
9(0
.3)
4.2
(0.2
)7.
9(0
.6)
3.9
(0.4
)0.
960.
497.
6(0
.6)
3.8
(0.5
)9.
8(0
.7)
4.3
(0.3
)0.
630.
69
Beve
rage
n12
.7(0
.2)
11.2
(0.3
)15
.4(0
.6)
13.0
(0.7
)<
0.00
01*
0.03
*15
.5(0
.5)
13.1
(0.7
)14
.4(0
.7)
12.2
(0.7
)0.
0001
*0.
05
Wat
ero
10.3
(0.3
)0.
1(0
.0)
8.7
(0.5
)0.
1(0
.0)
0.00
4*
0.77
8.6
(0.6
)0.
1(0
.1)
8.8
(0.5
)0.
1(0
.1)
0.00
4*
0.92
Fat/
Oil
p3.
6(0
.2)
1.9
(0.2
)3.
5(0
.3)
1.6
(0.2
)0.
900.
183.
4(0
.3)
1.4
(0.2
)4.
0(0
.6)
2.6
(0.2
)0.
830.
10C
ond
q/S
auce
r5.
0(0
.2)
0.9
(0.1
)4.
5(0
.5)
0.7
(0.1
)0.
320.
374.
4(0
.5)
0.8
(0.1
)4.
7(0
.4)
0.6
(0.1
)0.
600.
59Su
gars
s2.
0(0
.1)
1.0
(0.1
)1.
8(0
.2)
0.7
(0.1
)0.
680.
082.
0(0
.3)
0.8
(0.1
)1.
4(0
.2)
0.5
(0.1
)0.
570.
06
aTh
eW
hatW
eEa
tin
Am
eric
a(W
WEI
A)b
road
food
cate
gori
esw
ere
appl
ied
toca
tego
rize
allf
oods
and
beve
rage
sre
port
edin
asi
ngle
day
to14
broa
dfo
odgr
oups
.bSu
rvey
wei
ghts
and
adju
stm
ents
for
the
com
plex
surv
eyde
sign
wer
eap
plie
dto
repr
esen
tthe
non-
inst
itutio
naliz
edU
.S.p
opul
atio
n.To
taln
umbe
rsan
dpe
rcen
tage
sdo
nota
lway
sad
dup
tosa
mpl
esi
zedu
eto
mis
sing
valu
esan
dro
undi
ng.c
“Alc
ohol
”an
d“O
ther
”W
WEI
Aca
tego
ryre
mov
edbe
caus
eof<
20re
port
s.d
Wtd
%st
ands
for
the
estim
ated
wei
ghte
dpe
rcen
tofa
llre
port
sof
food
sor
beve
rage
sor
ener
gyfr
omre
port
edfo
ods
orbe
vera
ges
repo
rted
ina
sing
leda
yth
atar
ein
clud
edin
afo
odgr
oup;
SE=
Stan
dard
Erro
re
Stat
istic
alsi
gnifi
canc
eat
p≤0
.05
for
com
pari
son
offo
odse
cure
vs.
food
inse
cure
usi
ngth
eR
ao–S
cott
mod
ified
chi-
squ
are
stat
isti
cf
Stat
isti
cals
igni
fica
nce
atp≤0
.02
usi
nga
Bon
ferr
onit
ype
adju
stm
entf
orm
ult
iple
com
par
ison
sin
dica
ted
by“*
”for
com
pari
son
offo
odse
cure
vs.l
owfo
odse
cure
vs.v
ery
low
food
secu
rean
dus
ing
the
Rao
–Sco
ttm
odifi
edch
i-squ
are
stat
istic
.gM
ilk,fl
avor
edm
ilk,d
airy
drin
ksan
dsu
bstit
utes
,che
ese
and
yogu
rt.h
Mea
ts,p
oultr
y,se
afoo
d,eg
gs,c
ured
mea
ts/p
oultr
y,an
dpl
ant-
base
dpr
otei
nfo
ods.
iM
ixed
dish
esco
ntai
ning
mea
t,po
ultr
yse
afoo
d;gr
ain-
base
d;A
sian
;M
exic
an;p
izza
;san
dw
iche
s,an
dso
ups.
jC
ooke
dgr
ains
,bre
ads,
rolls
,tor
tilla
s,qu
ick
brea
ds,
and
brea
dpr
oduc
ts,r
ead
y-to
-eat
cere
als,
and
cook
edce
real
s.k
Savo
rysn
acks
,cra
cker
s,sn
ack/
mea
lbar
s,sw
eetb
aker
ypr
oduc
ts,c
andy
and
othe
rde
sser
ts.l
Fres
hfr
uits
,dri
edfr
uits
,and
frui
tsal
ads.
mVe
geta
bles
and
whi
tepo
tato
es.n
100%
juic
e,di
etbe
vera
ges,
swee
tene
dbe
vera
ges,
coff
eean
dte
a.o
Plai
nw
ater
and
flavo
red
oren
hanc
edw
ater
.pBu
tter
and
anim
alfa
ts,m
arga
rine
,cre
amch
eese
s,cr
eam
,may
onna
ise,
sala
ddr
essi
ngs
and
vege
tabl
eoi
ls.q
Con
dim
ent.
rTo
mat
o-ba
sed,
soy-
base
d,m
usta
rd,o
lives
,pic
kled
vege
tabl
es,p
asta
sauc
es,d
ips,
grav
ies,
and
othe
rsa
uces
.sSu
gars
,hon
ey,j
ams,
syru
ps,a
ndto
ppin
gs.
11
Nutrients 2020, 12, 304
3. Results
Overall, ~90% of U.S. children and adolescents were food secure and 10% food insecure, withthe smallest proportion being very low food secure (1–2%). Household poverty-income-ratio andrace/ethnicity differed among 6–11 and 12–17 years by food security status (p ≤ 0.0004, Table 1) as didthe prevalence of at-risk-for-overweight and overweight only among children 6–11 years (p = 0.001).
3.1. Frequency and Energy Contribution of Broad Food Categories, Sub-Categories, and Foods
The broad food categories, energy contributions and reported frequency of consumption, werecompared by food security status for ages 6–11 and 12–17 years in Table 2. Broad food category rankingsby frequency and energy contributions were also considered. Ranking revealed broad category “snacksand sweets” as the most frequently consumed items for all children 6–11 years (Table 2). Broadcategory “beverages” were second or third most frequently consumed but ranked sixth in terms ofgroup contributing to energy. Among those 12–17 years, “snacks and sweets” shared the top rankingwith “beverages” and where ranking differed by food security status. “Beverage” contribution toenergy ranked third to fifth. “Mixed dishes” ranked lower in frequency compared with contribution toenergy ranking among both age groups and all food security categories. “Milk and dairy”, “grains”,and “protein foods” also had high rankings in both frequency and energy contribution for all ages andfood security categories. “Water” and “condiments” added little to energy but ranked higher in termsof frequency.
3.1.1. 6–11 Years
The weighted proportion of the broad category “beverages” (p = 0.02, Table 2) and “mixed dishes”(p = 0.04) reported by frequency was statistically significantly greater for food insecure comparedwith secure children 6–11 years (12.7% vs. 11.4%, Table 2). “Mixed dishes” were also more frequentlyreported among food insecure at 9.3% compared with food secure at 8.0%. In contrast, reported intakeof “snacks and sweets” by frequency (p = 0.02) and energy contribution (p = 0.02) was lower amongfood insecure compared with secure children of similar age (14.4% vs. 16.1% and 18.3% vs. 21.0%).Additional significant differences resulted among food secure, low and very low food secure groups(p = 0.02) for “snacks and sweets” (21.0%, 18.1%, 20.1%).
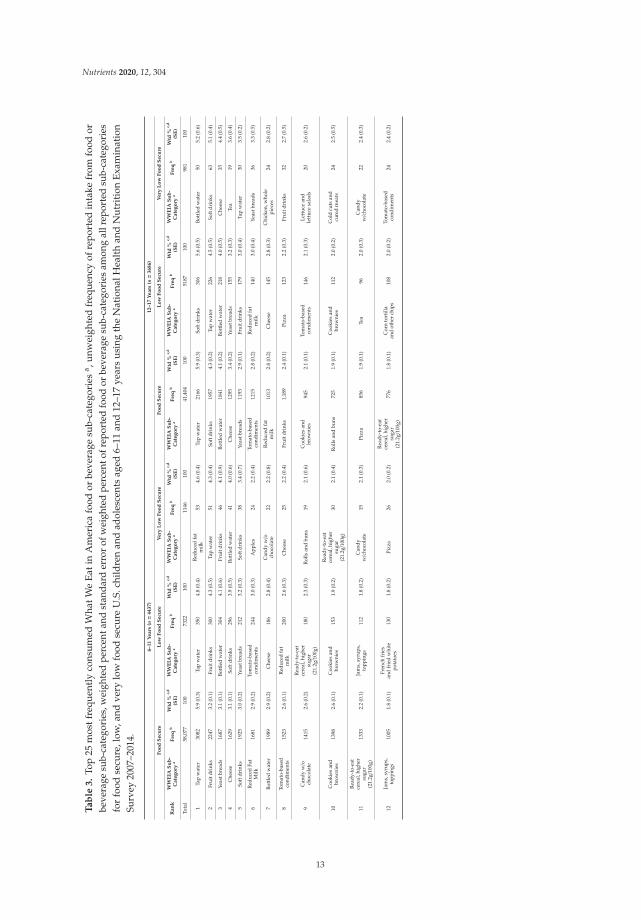
Food sub-categories contributing to the broad beverage category such as “fruit drinks” captured3.2%, 4.3%, and 4.1% of reports (Table 3) among food secure, low, and very low food secure children.The pattern was consistent with lower “soft drink” reports for food secure (3.0%) compared with low(3.9%) and very low (3.4%) food secure children. Top items in these sub-categories were “fruit flavoreddrink from powder”, “fruit-flavored caffeine-free soft drink”, “cola-type soft drink”, “apple juice”,“orange juice”, “fruit juice drink”, and “reduced sugar fruit juice drink” (Supplemental Table S1).The broad “snacks and sweets” category included sub-categories, “cookies and brownies” and “candywithout chocolate”, with a higher percentage of reports among food secure (both 2.6%) compared withlow (1.9%, 1.6%, respectively) and very low (1.5%, 2.2%, respectively) food secure children. “Corntortilla chips”, “hard candy”, “chocolate chip cookie”, “ice cream” and “snack crackers” were mostfrequently consumed items in these sub-categories.
12
Nutrients 2020, 12, 304
Ta
ble
3.
Top
25m
ostf
requ
entl
yco
nsu
med
Wha
tWe
Eat
inA
mer
ica
food
orbe
vera
gesu
b-ca
tego
ries
a ,u
nwei
ghte
dfr
equ
ency
ofre
por
ted
inta
kefr
omfo
odor
beve
rage
sub-
cate
gori
es,w
eigh
ted
perc
enta
ndst
anda
rder
ror
ofw
eigh
ted
perc
ento
frep
orte
dfo
odor
beve
rage
sub-
cate
gori
esam
ong
allr
epor
ted
sub-
cate
gori
esfo
rfo
odse
cure
,low
,and
very
low
food
secu
reU
.S.c
hild
ren
and
adol
esce
nts
aged
6–11
and
12–1
7ye
ars
usi
ngth
eN
atio
nalH
ealt
han
dN
utr
itio
nE
xam
inat
ion
Surv
ey20
07–2
014.
6–11
Years
(n=
4437)
12–17
Years
(n=
3686)
Fo
od
Secu
reL
ow
Fo
od
Secu
reV
ery
Lo
wF
oo
dS
ecu
reF
oo
dS
ecu
reL
ow
Fo
od
Secu
reV
ery
Lo
wF
oo
dS
ecu
re
Ran
kW
WE
IAS
ub
-C
ate
go
rya
Fre
qb
Wtd
%c,
d
(SE
)W
WE
IAS
ub
-C
ate
go
rya
Fre
qb
Wtd
%c,
d
(SE
)W
WE
IAS
ub
-C
ate
go
rya
Fre
qb
Wtd
%c,
d
(SE
)W
WE
IAS
ub
-C
ate
go
rya
Fre
qb
Wtd
%c,
d
(SE
)W
WE
IAS
ub
-C
ate
go
rya
Fre
qb
Wtd
%c,
d
(SE
)W
WE
IAS
ub
-C
ate
go
rya
Fre
qb
Wtd
%c,
d
(SE
)
Tota
l58
,077
100
7322
100
1146
100
41,4
0410
051
8710
098
110
0
1Ta
pw
ater
3082
5.9
(0.3
)Ta
pw
ater
350
4.8
(0.4
)R
educ
edfa
tm
ilk53
4.6
(0.4
)Ta
pw
ater
2166
5.9
(0.3
)So
ftdr
inks
306
5.6
(0.5
)Bo
ttle
dw
ater
505.
2(0
.6)
2Fr
uitd
rink
s22
473.
2(0
.1)
Frui
tdri
nks
300
4.3
(0.5
)Ta
pw
ater
514.
3(0
.4)
Soft
drin
ks19
574.
3(0
.2)
Tap
wat
er22
64.
5(0
.5)
Soft
drin
ks63
5.1
(0.4
)
3Ye
astb
read
s16
873.
1(0
.1)
Bott
led
wat
er30
44.
1(0
.6)
Frui
tdri
nks
464.
1(0
.9)
Bott
led
wat
er18
414.
1(0
.2)
Bott
led
wat
er21
84.
0(0
.5)
Che
ese
354.
4(0
.5)
4C
hees
e16
293.
1(0
.1)
Soft
drin
ks29
63.
9(0
.5)
Bott
led
wat
er41
4.0
(0.6
)C
hees
e12
953.
4(0
.2)
Yeas
tbre
ads
155
3.2
(0.3
)Te
a19
3.6
(0.4
)
5So
ftdr
inks
1925
3.0
(0.2
)Ye
astb
read
s21
23.
2(0
.3)
Soft
drin
ks38
3.4
(0.7
)Ye
astb
read
s11
932.
9(0
.1)
Frui
tdri
nks
179
3.0
(0.4
)Ta
pw
ater
303.
5(0
.2)
6R
educ
edFa
tM
ilk16
812.
9(0
.2)
Tom
ato-
base
dco
ndim
ents
244
3.0
(0.3
)A
pple
s24
2.2
(0.4
)To
mat
o-ba
sed
cond
imen
ts12
152.
8(0
.2)
Red
uced
fat
milk
140
3.0
(0.4
)Ye
astb
read
s36
3.3
(0.5
)
7Bo
ttle
dw
ater
1989
2.9
(0.2
)C
hees
e18
62.
8(0
.4)
Can
dyw/o
choc
olat
e22
2.2
(0.8
)R
educ
edfa
tm
ilk10
132.
8(0
.2)
Che
ese
145
2.8
(0.3
)C
hick
en,w
hole
piec
es24
2.8
(0.2
)
8To
mat
o-ba
sed
cond
imen
ts15
232.
6(0
.1)
Red
uced
fat
milk
200
2.6
(0.3
)C
hees
e25
2.2
(0.4
)Fr
uitd
rink
s1,
189
2.4
(0.1
)Pi
zza
123
2.2
(0.3
)Fr
uitd
rink
s32
2.7
(0.5
)
9C
andy
w/o
choc
olat
e14
152.
6(0
.2)
Rea
dy-t
o-ea
tce
real
,hig
her
suga
r(2
1.2g/1
00g)
180
2.3
(0.3
)R
olls
and
buns
192.
1(0
.6)
Coo
kies
and
brow
nies
945
2.1
(0.1
)To
mat
o-ba
sed
cond
imen
ts14
62.
1(0
.3)
Lett
uce
and
lett
uce
sala
ds20
2.6
(0.2
)
10C
ooki
esan
dbr
owni
es13
982.
6(0
.1)
Coo
kies
and
brow
nies
153
1.9
(0.2
)
Rea
dy-t
o-ea
tce
real
,hig
her
suga
r(2
1.2g/1
00g)
302.
1(0
.4)
Rol
lsan
dbu
ns72
51.
9(0
.1)
Coo
kies
and
brow
nies
112
2.0
(0.2
)C
old
cuts
and
cure
dm
eats
242.
5(0
.5)
11
Rea
dy-t
o-ea
tce
real
,hig
her
suga
r(2
1.2g/1
00g)
1333
2.2
(0.1
)Ja
ms,
syru
ps,
topp
ings
112
1.8
(0.2
)C
andy
w/c
hoco
late
152.
1(0
.3)
Pizz
a85
61.
9(0
.1)
Tea
962.
0(0
.3)
Can
dyw/c
hoco
late
222.
4(0
.3)
12Ja
ms,
syru
ps,
topp
ings
1005
1.8
(0.1
)Fr
ench
frie
san
dfr
ied
whi
tepo
tato
es13
01.
8(0
.2)
Pizz
a26
2.0
(0.2
)
Rea
dy-t
o-ea
tce
real
,hig
her
suga
r(2
1.2g/1
00g)
776
1.8
(0.1
)C
orn
tort
illa
and
othe
rch
ips
108
2.0
(0.2
)To
mat
o-ba
sed
cond
imen
ts24
2.4
(0.2
)
13

Nutrients 2020, 12, 304
Ta
ble
3.
Con
t.
6–11
Years
(n=
4437)
12–17
Years
(n=
3686)
Fo
od
Secu
reL
ow
Fo
od
Secu
reV
ery
Lo
wF
oo
dS
ecu
reF
oo
dS
ecu
reL
ow
Fo
od
Secu
reV
ery
Lo
wF
oo
dS
ecu
re
Ran
kW
WE
IAS
ub
-C
ate
go
rya
Fre
qb
Wtd
%c,
d
(SE
)W
WE
IAS
ub
-C
ate
go
rya
Fre
qb
Wtd
%c,
d
(SE
)W
WE
IAS
ub
-C
ate
go
rya
Fre
qb
Wtd
%c,
d
(SE
)W
WE
IAS
ub
-C
ate
go
rya
Fre
qb
Wtd
%c,
d
(SE
)W
WE
IAS
ub
-C
ate
go
rya
Fre
qb
Wtd
%c,
d
(SE
)W
WE
IAS
ub
-C
ate
go
rya
Fre
qb
Wtd
%c,
d
(SE
)
13Pi
zza
1117
1.8
(0.1
)C
old
cuts
and
cure
dm
eats
101
1.7
(0.2
)Ye
astb
read
s25
2.0
(0.3
)C
andy
w/o
choc
olat
e82
11.
8(0
.1)
Ice
crea
man
dfr
ozen
dair
yde
sser
ts82
1.8
(0.3
)R
olls
and
buns
122.
2(0
.2)
14C
orn
tort
illa
and
othe
rch
ips
978
1.6
(0.1
)W
hole
milk
127
1.7
(0.3
)To
mat
o-ba
sed
cond
imen
ts26
1.9
(0.5
)C
orn
tort
illa
and
othe
rch
ips
827
1.7
(0.1
)
Rea
dy-t
o-ea
tce
real
,hig
her
suga
r(2
1.2g/1
00g)
991.
8(0
.3)
Can
dyw/o
choc
olat
e19
2.0
(0.1
)
15R
olls
and
buns
873
1.6
(0.1
)C
orn
tort
illa
and
othe
rch
ips
124
1.7
(0.2
)Eg
gsan
dom
elet
s22
1.9
(0.4
)C
old
cuts
and
cure
dm
eats
680
1.6
(0.1
)C
itru
sju
ice
691.
6(0
.3)
Red
uced
fat
milk
311.
9(0
.4)
16Fr
ench
frie
san
dfr
ied
whi
tepo
tato
es93
11.
5(0
.1)
Pizz
a14
71.
6(0
.2)
Chi
cken
,who
lepi
eces
181.
9(0
.4)
Tea
589
1.6
(0.1
)C
hick
en,w
hole
piec
es97
1.6
(0.2
)
Rea
dy-t
o-ea
tce
real
,hig
her
suga
r(2
1.2g/1
00g)
191.
8(0
.2)
17Ic
ecr
eam
and
froz
enda
iry
dess
erts
861
1.5
(0.1
)C
andy
w/o
choc
olat
e14
31.
6(0
.2)
Ice
crea
man
dfr
ozen
dair
yde
sser
ts21
1.9
(0.3
)Fr
ench
frie
san
dfr
ied
whi
tepo
tato
es67
81.
5(0
.1)
Lett
uce
and
lett
uce
sala
ds77
1.5
(0.2
)W
hole
milk
121.
7(0
.1)
18A
pple
s83
81.
5(0
.1)
Ice
crea
man
dfr
ozen
dair
yde
sser
ts93
1.6
(0.2
)C
itru
sju
ice
181.
6(0
.3)
Chi
cken
,who
lepi
eces
706
1.4
(0.1
)R
olls
and
buns
951.
5(0
.2)
Mus
tard
and
othe
rco
ndim
ents
141.
7(0
.2)
19C
old
cuts
and
cure
dm
eats
775
1.4
(0.1
)A
pple
s99
1.5
(0.2
)R
educ
edfa
tfla
vore
dm
ilk12
1.6
(0.3
)Le
ttuc
ean
dle
ttuc
esa
lads
595
1.4
(0.1
)Fr
ench
frie
san
dfr
ied
whi
tepo
tato
es10
01.
5(0
.2)
Bana
nas
131.
7(0
.2)
20W
hole
milk
911
1.3
(0.1
)C
rack
ers,
excl
udes
salt
ines
621.
5(0
.3)
Ric
e15
1.6
(0.4
)Ja
ms,
syru
ps,
topp
ings
486
1.3
(0.1
)C
old
cuts
and
cure
dm
eats
761.
5(0
.2)
Cor
nto
rtill
aan
dot
her
chip
s15
1.7
(0.2
)
21Lo
wfa
tmilk
551
1.3
(0.1
)C
hick
en,w
hole
piec
es93
1.3
(0.2
)Le
ttuc
ean
dle
ttuc
esa
lads
171.
6(0
.2)
Ice
crea
man
dfr
ozen
dair
yde
sser
ts50
11.
2(0
.1)
Can
dyw/o
choc
olat
e96
1.5
(0.2
)Fr
ench
frie
san
dfr
ied
whi
tepo
tato
es13
1.6
(0.1
)
22N
uts
and
seed
s56
01.
2(0
.1)
May
onna
ise
651.
2(0
.2)
Soup
s21
1.5
(0.5
)Po
tato
chip
s52
31.
2(0
.1)
App
les
571.
3(0
.2)
Pizz
a19
1.6
(0.2
)
23C
hick
en,w
hole
piec
es80
01.
2(0
.1)
Rol
lsan
dbu
ns99
1.2
(0.2
)C
orn
tort
illa
and
othe
rch
ips
251.
5(0
.3)
App
les
485
1.2
(0.1
)C
andy
w/c
hoco
late
601.
3(0
.2)
Chi
cken
patt
ies,
nugg
ets
and
tend
ers
91.
5(0
.2)
24C
itru
sju
ice
688
1.1
(0.1
)C
itru
sju
ice
111
1.1
(0.2
)Be
ans,
peas
,le
gum
es14
1.5
(0.2
)Eg
gsan
dom
elet
s48
81.
0(0
.1)
Soup
s49
1.2
(0.4
)D
ough
nuts
,sw
eetr
olls
,pa
stri
es11
1.5
(0.1
)
25Po
tato
chip
s66
11.
1(0
.1)
Pota
toch
ips
811.
1(0
.2)
Coo
kies
and
brow
nies
201.
5(0
.2)
Cra
cker
s,ex
clud
essa
ltin
es28
61.
0(0
.1)
Suga
rsan
dho
ney
461.
2(0
.2)
Coo
kies
and
brow
nies
211.
3(0
.2)
aT
heW
hat
We
Eat
inA
mer
ica
Food
Sub-
Cat
egor
ies
wer
eap
plie
dto
cate
gori
zeal
lfoo
ds
and
beve
rage
sto
150
uni
que
sub-
cate
gori
es.
bT
hefr
equ
ency
that
afo
odor
beve
rage
ssu
b-ca
tego
ryw
asre
port
edw
ithou
tdie
tary
wei
ghts
.cSu
rvey
wei
ghts
and
adju
stm
ents
for
the
com
plex
surv
eyde
sign
wer
eap
plie
dto
repr
esen
tthe
non-
inst
itutio
naliz
edU
.S.p
opul
atio
n.d
Der
ived
from
the
wei
ghte
dfr
eque
ncy
ofth
efo
ods
orbe
vera
ges
ina
sub-
cate
gory
divi
ded
byth
eto
talw
eigh
ted
freq
uenc
yof
allf
oods
orbe
vera
ges
(n)r
epor
ted
inal
lsub
-cat
egor
ies
ina
sing
led
ay,w
here
n=
335,
995,
769
for
food
secu
re6–
11ye
ars,
n=
31,1
55,1
06fo
rlo
wfo
odse
cure
6–11
year
s,n=
4,12
6,64
1fo
rve
rylo
wfo
odse
cure
6–11
year
s,n=
290,
965,
789
for
food
secu
re12
–17
year
s,n=
28,4
44,0
12fo
rlo
wfo
odse
cure
12–1
7ye
ars,
n=
4,74
9,59
5fo
rve
rylo
wfo
odse
cure
12–1
7ye
ars.
Estim
ated
wei
ghte
dpe
rcen
thas
been
abbr
evia
ted
by“W
td%
”;SE
=St
anda
rdEr
ror.
14

Nutrients 2020, 12, 304
3.1.2. 12–17 Years
Compared with food secure adolescents 12–17 years (12.7%) “beverages” as a broad categorywere more statistically significantly frequently consumed by low (15.5%) and very low food secure(14.4%) and also combined food insecure groups (15.4%, p = 0.0001). A greater contribution of energyfrom “beverages” (p = 0.03) was also determined for food insecure compared with secure (13.0% vs.11.2%). Alternatively, significantly more frequent intake of “water” was observed among food secure(p = 0.004), compared with insecure and low and very low food secure groups (10.3%, 8.7%, 8.6%, 8.8%).
Food secure adolescents reported 4.3% intake frequency of “soft drinks” contrasting with thesimilar pattern of higher intakes for low food secure at 5.6%, the most frequently consumed sub-categoryfor this group, and 5.1% for very low food secure adolescents as in the younger age group, but with aneven greater percentage of reports. Top items were “cola-type soft drink”, “fruit-flavored, caffeinefree soft drink”, “brewed sugar-sweetened iced tea”, “orange juice”, “fruit flavored drink frompowder”, “fruit flavored soft drink”, “fruit juice drink”, and “apple juice”. “Tap water” had the reversepattern as “soft drinks” and comprised the most (5.9%) reports among food secure adolescents whileaccounting for 4.5% and 3.5% of low and very low food secure reports. “Bottled water”, however, wasless frequently consumed among food secure and low food secure groups (4.0%, 4.1% respectively)compared with very low (5.2%) food secure reports. “Tap water” and “unsweetened bottled water”were the most frequently consumed items.
4. Discussion
Both the frequency and amount of food and beverage intake are important behavioral exposurescharacterizing dietary intake. Frequency data permits consideration of the most commonly consumedfoods while amount shows the “dose”. In this analysis, U.S. children and adolescents had similarfrequency of consumption of food categories regardless of food security with the exception of beverageand snack categories. Frequency alone is often overlooked as a component of dietary patterns amongchildren and only two studies are known among adults [23,24]. Traditional dietary assessment,namely food frequency questionnaires, have relied on querying frequency to obtain results focusedon contributions to servings of foods, energy and nutrients. Yet, separation of frequency fromenergy contribution and consideration of frequency as a dietary behavior with potential links tohealth presents opportunities for behavioral interventions. “Beverages” or “snacks and sweets” werethe most frequently consumed broad food groups for all children 6–17 years yet neither ranked ashighest contributor to energy, exemplifying their potentially under-recognized importance in children’sdiets. Their ubiquitous frequency represents potentially impactful targets for intervention to improveoverall dietary quality to develop healthy habits for later life [25]. “Beverages” as a broad categoryrepresents a spectrum of product types, some without and others with added sugars and key nutrients,respectively [1,14]. However, sub-categories and individual foods ranked by frequency reveal thatbeverages with a high amount of added sugars are prominent choices [26]. Thus, particular attentionto intervention messaging and counseling to improve drink choice among children should be provided.Recommendations for specific beverages and not only broad categories, may be gleaned from thesefrequency rankings and used to educate healthful patterns. High frequency of snacks and sweets,particularly candy, cookies and brownies, and ice cream, may be targets of interventions more clearlyinterpreted to broadly limit because of their inherent added sugars [26], yet perhaps more difficult,compared with beverages, to find acceptable substitutions.
Frequency differences in “beverages” and “snacks and sweets” by food security status supportsa previous summary of the literature for children 6–11 years for higher added sugar intake [11],sourced from beverages, snacks and sweets among U.S. children [26], and are novel among the sparseevaluation for those 12–17 years [11,27]. “Beverage” intake frequency associated with food insecurityin both age groups may potentially be a manifestation of choices prioritized to satisfy hunger ratherthan health. Less frequent “water” intake among food insecure adolescents 12–17 years may be related,as a trade-off for higher intake of other beverages [28] or due to lack of potable water supply access
15

Nutrients 2020, 12, 304
among food insecure households [29]. These results support findings showing higher odds of heavy(i.e., more energy) total sweetened beverage intake among low-income compared with high-incomechildren 2–11 years [30]. Older children may be making independent dietary choices and may also beencouraged to obtain food outside the household when also food insecure.
“Soft drinks” were the highest ranking items in the “beverages” category among older foodinsecure children with caffeinated soft drinks ranking prominently. Older, prevalently low-incomechildren may be working and contributing to family income [31] and using caffeinated beveragesto maintain their schedules [32]. Intake frequency and timing of caffeinated beverages may mattermore to healthful sleep/wake habits compared with total intake. Previous observational studies havesuggested that consumption of caffeinated beverages leads to sleep dysfunction in junior high and highschool children [33], and associate with obesity among children 11 years of age [34]. High frequency ofcaffeinated soft drinks is consistent with these observational results and offers additional evidencesupporting dietary interventions to reduce caffeine intake and frequency among all children andespecially older food insecure children.
Less frequency and energy contributions of “snacks and sweets” among food insecure comparedwith secure may represent a relatively more healthful dietary pattern among food insecure 6–11-year-oldchildren. “Snacks and sweets” may be viewed as non-essential foods where budget may be conservedand include high-energy, high-sodium foods [25,35]. As such, the results are unaligned with previousexplanations of dietary differences among food insecure groups generalizing a reliance on high energy,low nutrient foods [36].
Frequently consumed foods and beverages among children and adolescents may be used toinform opportunities to promote available and familiar foods that are sources of the nutrients or dietarycomponents that are lacking [11,27], and inform efforts to build on dietary strengths by promoting foodsthat are already frequently consumed. For example, cow’s milk and raw apple were highly reportedand may be further promoted in children’s food environments. The prominence of “condiments”among frequently consumed foods was apparent. Items like catsup, mustard, mayonnaise, and salsaconsumed in relatively small amounts and with little contribution to energy may be used to enhancetaste. Their frequent use presents an opportunity to for stealth nutrition interventions to potentiallyfortify condiments with nutrients most children need more of, and to further reduce components mostchildren need less of (e.g., sodium and sugar).
4.1. Implications
While applications of stealth nutrition may help, the overall poor dietary intake of U.S. childrenregardless of food security status demand more dramatic changes to improve dietary selection. Primarycare contact or public health education among youth provide an ideal environment for education anddiscussion of dietary habits and suggestions for substitution of soft drinks, for example, with wateror low-fat dairy and promotion of fruits and vegetables. Dietary recommendations for food groupsand categories may be further translated to specify frequently consumed foods comprising groupsrecommended for increase or decrease. Federal nutrition assistance programs such as SupplementalNutrition Assistance Program; Special Supplemental Nutrition Assistance Program for Women, Infants,and Children; and the National School Lunch and Breakfast Programs may similarly apply knowledgeof the frequently consumed foods to tailor education and menu components to the 59% of 2016 U.S.food insecure households participating [12]. The National School Lunch and Breakfast Programs playkey roles in child nutrition as they represent two main eating occasions of a child’s day. Vegetablesand fruits may be further promoted through these programs in order to increase their frequencyand contributions to total energy. Frequently consumed foods may be key foods for companies toconsider nutrient profile improvement to reduce added sugars, sodium and increase calcium, vitaminD, potassium, and fiber [1]. Examination of frequently consumed foods by age group can informdietary intake questionnaires and be used to populate technology-assisted dietary assessment searchtools. Finally, foods listed by frequency may inform monitoring of population dietary intake and
16

Nutrients 2020, 12, 304
potential food environment improvements that enhance safe access to enough foods for healthy, activelifestyles [37].
4.2. Strengths and Limitations
Dietary intake and reporting are reliant on memory and prone to error [38]. Much less is knownabout the measurement error in children and adolescents self-reported diets compared with adults.Dietary recalls throughout the week allow representation of week and weekend days for U.S. childrencontributing a strength, yet this analysis is limited as it only represents one day of data for eachparticipant and does not reflect usual intake over time. Aggregation to broad and sub-food categoriesmay highlight food group differences that depend on the groups combined while dis-aggregation mayhighlight differences that are not meaningful to nutrition such as ‘tap water” vs. “bottled water”, yetuse of broad and sub-food categories aligns with the practical translation of dietary recommendations.Lastly, since food security among household children is reported by a household adult, an individualchild’s food security may be biased by the perception of the adult and the adult’s perception offood security for other children in the household [39]. Older children tend to be under-classified asfood insecure while younger children may be over-classified. While imperfect, differences by foodsecurity and age were observed in this analysis and add knowledge of the dietary patterns of foodinsecure children.
5. Conclusions
Among children and adolescents 6–17 years old, similar foods ranked among those frequentlyconsumed. However, frequency-differentiated intake patterns exist for beverages and snack foodsby food security across age groups. The main findings reported in this paper may inform dietaryrecommendations, development of population-specific dietary assessment tools, interventions, menus,and the composition of food packages, and food policy for food insecure children, and adolescents.
Supplementary Materials: The following are available online at http://www.mdpi.com/2072-6643/12/2/304/s1,Table S1: Top 25 most frequently consumed foods or beverages, unweighted frequency of reported foods orbeverages, weighted percent of reported foods or beverages, and standard error of weighted percent of reportedfoods or beverages among all reported foods or beverages for food secure, low, and very low food secure U.S.children and adolescents aged 6–11 and 12–17 years using the National Health and Nutrition ExaminationSurvey 2007–2014.
Author Contributions: Conceptualization, H.A.E.-M.; methodology, H.A.E.-M. and C.J.B.; analysis, H.A.E.-M.;writing—original draft preparation, H.A.E.-M.; writing—review and editing, H.A.E.-M., C.J.B., R.L.B., Y.J.Y.All authors have read and agreed to the published version of the manuscript.
Funding: H.A.E.-M. received support from USDA National Institute of Food and Agriculture, Hatchproject IND030489.
Conflicts of Interest: The authors declare no conflict of interest. The funders had no role in the design of thestudy; in the collection, analyses, or interpretation of data; in the writing of the manuscript, or in the decision topublish the results.
References
1. U.S. Department of Agriculture. Advisory Report to the Secretary of Health and Human Services andthe Secretary of Agriculture. Available online: http://www.health.gov/dietaryguidelines/2015-scientific-report/PDFs/Scientific-Report-of-the-2015-Dietary-Guidelines-Advisory-Committee.pdf (accessed on10 December 2019).
2. Eicher-Miller, H.A.; Park, C.Y.; Bailey, R. Identifying nutritional gaps among Americans. In DietarySupplements in Health Promotion; Wallace, T.C., Ed.; CRN Press: Boca Raton, FL, USA, 2015; pp. 17–54.
3. Anderson, S.A. Core indicators of nutritional state for difficult-to-sample populations. J. Nutr. 1990, 120(Suppl. 11), 1559–1600. [CrossRef] [PubMed]
4. Alaimo, K.; Olson, C.M.; Frongillo, E.A., Jr. Food insufficiency and American school-aged children’s cognitive,academic, and psychosocial development. Pediatrics 2001, 108, 44–53. [PubMed]
17

Nutrients 2020, 12, 304
5. Casey, P.H.; Szeto, K.L.; Robbins, J.M.; Stuff, J.E.; Connell, C.; Gossett, J.M.; Simpson, P.M. Child health-relatedquality of life and household food security. Arch. Pediatr. Adolesc. Med. 2005, 159, 51–56. [CrossRef][PubMed]
6. Slopen, N.; Fitzmaurice, G.; Williams, D.R.; Gilman, S.E. Poverty, food insecurity, and the behavior forchildhood internalizing and externalizing disorders. J. Am. Acad. Child. Adolesc. Psychiatry 2010, 49, 444–452.[PubMed]
7. Eicher-Miller, H.A.; Mason, A.C.; Weaver, C.M.; McCabe, G.P.; Boushey, C.J. Food insecurity is associatedwith iron deficiency anemia in U.S. adolescents. Am. J. Clin. Nutr. 2009, 90, 1358–1371. [CrossRef]
8. Eicher-Miller, H.A.; Mason, A.C.; Weaver, C.M.; McCabe, G.P.; Boushey, C.J. Food insecurity is associatedwith diet and bone mass disparities in early adolescent males but not females in the United States. J. Nutr.2011, 141, 1738–1751. [CrossRef]
9. Belsky, D.W.; Moffitt, T.E.; Arseneault, L.; Melchior, M.; Caspi, A. Context and sequelae of food insecurity inchildren’s development. Am. J. Epidemiol. 2010, 172, 809–818. [CrossRef]
10. Gundersen, C.; Ziliak, J.P. Food insecurity and health outcomes. Health Aff. 2015, 34, 1830–1839. [CrossRef]11. Eicher-Miller, H.A.; Zhao, Y. Evidence for the age-specific relationship of food insecurity and key dietary
outcomes among U.S. children and adolescence. Nutr. Res. Rev. 2018, 31, 98–113. [CrossRef]12. Colman-Jensen, A.; Rabbitt, R.P.; Gregory, C.A.; Singh, A. Household Food Security in the United States
in 2016. ERR-237. U.S. Department of Agriculture, Economic Research Service. 2017. Available online:https://www.ers.usda.gov/publications/pub-details/?pubid=84972 (accessed on 10 December 2019).
13. Nicklas, T.A.; Baranowski, T.; Cullen, K.W.; Berenson, G. Eating patterns, dietary quality and obesity. J. Am.Coll. Nutr. 2001, 20, 599–608. [CrossRef]
14. U.S. Department of Agriculture. Agricultural Research Service. What We Eat in America Food Categories.2016. Available online: https://www.ars.usda.gov/northeast-area/beltsville-md-bhnrc/beltsville-human-nutrition-research-center/food-surveys-research-group/docs/dmr-food-categories (accessed on10 December 2019).
15. Centers for Disease Control and Prevention (CDC); National Center for Health Statistics (NCHS). NationalHealth and Nutrition Examination Survey Dietary Data. Available online: https://wwwn.cdc.gov/Nchs/Nhanes/Search/DataPage.aspx?Component=Dietary (accessed on 10 December 2019).
16. Centers for Disease Control and Prevention (CDC), National Center for Health Statistics (NCHS). NationalHealth and Nutrition Examination Survey Questionnaire and Examination Protocol. Available online:https://wwwn.cdc.gov/nchs/nhanes/analyticguidelines.aspx (accessed on 10 December 2019).
17. National Center for Health Statistics. NCHS Research Ethics Review Board (ERB) Approval. Availableonline: https://www.cdc.gov/nchs/nhanes/irba98.htm (accessed on 10 December 2019).
18. Bickel, G.; Nord, M.; Price, C.; Hamilton, W.; Cook, J. Guide to Measuring Household Food Security, Revised2000. U.S. Department of Agriculture, Food and Nutrition Service. 2000. Available online: https://www.fns.usda.gov/guide-measuring-household-food-security-revised-2000 (accessed on 10 December 2019).
19. Centers for Disease Control and Prevention. A SAS Program for the 2000 CDC Growth Charts.Available online: https://www.cdc.gov/nccdphp/dnpao/growthcharts/resources/sas.htm (accessed on10 December 2019).
20. Agricultural Research Service USDA. USDA Automated Multiple-Pass Method. Available online:http://www.ars.usda.gov/Services/docs.htm?docid=7710 (accessed on 10 December 2019).
21. Moshfegh, A.J.; Rhodes, D.G.; Baer, D.J.; Murayi, T.; Clemens, J.C.; Rumpler, W.V.; Paul, D.R.; Sebastian, R.S.;Kuczynski, K.J.; Ingwersen, L.A.; et al. The US Department of Agriculture Automated Multiple-Pass Methodreduces bias in the collection of energy intakes. Am. J. Clin. Nutr. 2008, 88, 324–332. [CrossRef] [PubMed]
22. USDA Agricultural Research Service. Food and Nutrient Database for Dietary Studies 2013–2014.Food Surveys Research Group: Beltsville, MD. Available online: http://www.ars.usda.gov/ba/bhnrc/fsrg(accessed on 10 December 2019).
23. Eicher-Miller, H.A.; Boushey, C.J. How often and how much? Differences in dietary intake by frequencyand energy contribution vary among U.S. Adults in NHANES 2007–2012. Nutrients 2017, 9, 86. [CrossRef][PubMed]
24. Kendall, A.; Olson, C.M.; Frongillo, E.A. Relationship of hunger and food insecurity to food availability andconsumption. J. Am. Diet. Assoc. 1996, 96, 1019–1024. [CrossRef]
18

Nutrients 2020, 12, 304
25. Fiorito, L.M.; Marini, M.; Mitchell, D.C.; Smiciklas-Wright, H.; Birch, L.L. Girls’ early sweetened carbonatedbeverage intake predicts different patterns of beverage and nutrient intake across childhood and adolescence.J. Am. Diet. Assoc. 2010, 110, 543–550. [CrossRef]
26. Bailey, R.L.; Fulgoni, V.L.; Cowan, A.E.; Gaine, P.C. Sources of added sugar in young children, adolescents,and adults with low and high intakes of added sugars. Nutrients 2018, 10, 102. [CrossRef]
27. Hanson, K.L.; Connor, L.M. Food insecurity and dietary quality in U.S. adults and children: A systematicreview. Am. J. Clin. Nutr. 2014, 100, 684–692. [CrossRef]
28. Park, S.; Blanck, H.M.; Sherry, B.; Brener, N.; O’Toole, T. Factors associated with low water intake among U.S.High School Students-National Youth Physical Activity and Nutrition Study, 2010. J. Am. Nutr. Diet. 2012,112, 1421–1427. [CrossRef]
29. Pinard, C.A.; Kim, S.A.; Story, M.; Yaroch, A.L. The food and water system impacts on obesity. J. Law Med.Ethics 2013, 41, 52–60. [CrossRef]
30. Han, E.; Powell, L.M. Consumption patterns of sugar-sweetened beverages in the United States. J. Acad.Nutr. Diet. 2013, 113, 43–53. [CrossRef]
31. Johnson, D.S.; Lino, M. Teenagers: Employment and contributions to family spending. Mon. Labor. Rev.2000, 123, 15–25.
32. Miller, K.E.; Dermen, K.H.; Lucke, J.F. Caffeinated energy drink use by U.S. adolescents aged 13–17: A nationalprofile. Psychol. Addict. Behav. 2018, 32, 647–659. [CrossRef] [PubMed]
33. Orbeta, R.L.; Overpeck, M.D.; Ramcharran, D.; Kogan, M.D.; Ledsky, R. High caffeine intake in adolescents:Associations with difficulty sleeping and feeling tired in the morning. J. Adolesc. Health 2006, 38, 451–453.[CrossRef] [PubMed]
34. Ludwig, D.S.; Peterson, K.E.; Gortmaker, S.L. Relation between consumption of sugar-sweetened drinks andchildhood obesity: A prospective, observational analysis. Lancet 2001, 357, 505–508. [CrossRef]
35. Dunford, E.K.; Poti, J.M.; Popkin, B.M. Emerging disparities in dietary sodium intake from snacking in theU.S. population. Nutrients 2017, 9, 610. [CrossRef] [PubMed]
36. Drewnowski, A.; Darmon, N.; Briend, A. Replacing fats and sweets with vegetables and fruits-a question ofcost. Am. J. Public Health 2004, 94, 1555–1559. [CrossRef] [PubMed]
37. Centers for Disease Control and Prevention (CDC). The CDC Guide to Strategies for Reducingthe Consumption of Sugar-Sweetened Beverages. Available online: http://www.cdph.ca.gov/SiteCollectionDocuments/StratstoReduce_Sugar_Sweetened_Bevs.pdf (accessed on 10 December 2019).
38. Burrows, T.L.; Martin, R.J.; Collins, C.E. A systematic review of the validity of dietary assessment methods inchildren when compared with the method of doubly labeled water. J. Acad. Nutr. Diet. 2010, 110, 1501–1510.[CrossRef]
39. Nord, M.; Bickel, G. Measuring Children’s Food Security in U.S. Households, 1995–1999. Food Assistanceand Nutrition Research Report No. 25, U.S. Department of Agriculture, Food and Rural Economics Division,Economic Research Service. Available online: https://www.ers.usda.gov/publications/pub-details/?pubid=46624 (accessed on 10 December 2019).
© 2020 by the authors. Licensee MDPI, Basel, Switzerland. This article is an open accessarticle distributed under the terms and conditions of the Creative Commons Attribution(CC BY) license (http://creativecommons.org/licenses/by/4.0/).
19

nutrients
Article
Food Security and Diet Quality in Native Hawaiian,Pacific Islander, and Filipino Infants 3 to 12 Monthsof Age
Sally Campbell 1,2, John J. Chen 3, Carol J. Boushey 4, Heather Eicher-Miller 5, Fengqing Zhu 5
and Marie K. Fialkowski 3,*
1 Technological University Dublin, Kevin Street, Saint Peter’s, D08X622 Dublin 2, Ireland; [email protected] Trinity College University of Dublin, College Green, Dublin 2, Ireland3 Department of Human Nutrition, Food and Animal Sciences, College of Tropical Agriculture and Human
Resources—University of Hawai‘i at Manoa, Honolulu, HI 96822, USA; [email protected] Epidemiology Program, University of Hawaii Cancer Center, 701 Ilalo St, Honolulu, HI 96813, USA;
[email protected] Department Nutrition Science, College of Health and Human Science, Purdue University,
West Lafayette, IN 47907, USA; [email protected] (H.E.-M.); [email protected] (F.Z.)* Correspondence: [email protected]
Received: 31 May 2020; Accepted: 15 July 2020; Published: 17 July 2020
Abstract: Food insecurity and other nutritional risks in infancy pose a lifelong risk to wellbeing;however, their effect on diet quality in Native Hawaiian, Pacific Islander, and Filipino (NHPIF)infants in Hawai‘i is unknown. In this cross-sectional analysis, the association between variousindicators of food security and NHPIF infant diet quality were investigated in 70 NHPIF infants aged3–12 months residing on O‘ahu, Hawai‘i. The dietary assessments of the infants were collected usinga mobile food recordTM. Foods consumed across four days were categorized into seven food groups.Indicators for food security were examined through an adapted infant food security index and otherindicators. Data were analyzed using chi-square tests, independent sample t-tests, multinomiallogistic regression, and linear regression models. In models adjusting for age and sex, infants definedas food insecure by the adapted index were found to consume foods from more food groups andconsume flesh foods on a greater proportion of days. Of the indicators examined, the adapted indexwas shown to be the best indicator for food group consumption. Further work is needed on a morerepresentative sample of NHPIF infants to determine the impact that food security has on nutritionalstatus and other indicators of health.
Keywords: infants; minority; food security; diet diversity; diet quality
1. Introduction
Food insecurity is defined as limited or uncertain availability of nutritionally adequate foods. It isconsidered a high priority for public health stakeholders given its economic and health impacts andthe associated nutritional risks [1]. These impacts include worse developmental outcomes and chronicillness among children [2], and poorer health outcomes in infants [3]. Situations of food insecurityare linked with disrupted eating patterns, poor diet quality and nutritional inadequacy across agegroups and demographics [4]. Infants aged 0–12 months are more susceptible to the adverse effects offood insecurity given their high nutritional requirements for growth and dependence on others fornutrition [3]. Optimal nutrition during infancy protects against morbidity and mortality, reduces therisk of chronic disease, and promotes better overall development, and thus efforts to understand andmitigate nutritional risks such as infant food insecurity and improved nutrition in early life may havefar-reaching implications [5].
Nutrients 2020, 12, 2120; doi:10.3390/nu12072120 www.mdpi.com/journal/nutrients21

Nutrients 2020, 12, 2120
An eighteen-item survey known as the U.S. Household Food Security Survey Module (USHFSSM)was developed by the United States Department of Agriculture (USDA) to assess household foodsecurity; a portion of the survey questions may be used to determine the food security of a child orchildren within the household [6]. In contrast to this method, Schlichting D. et al. devised a foodsecurity index which aims to assess the food security of an infant at an individual level within ahousehold [3]. In addition to food security status, another indicator of nutritional risk is householdincome as it is theorized that some low-income households lack economic access to healthy foods [7,8].Similarly, eligibility to food assistance programs, such as the Special Supplemental Nutrition Programfor Women, Infants and Children (WIC) and the Supplemental Nutrition Assistance Program (SNAP),are based on household income criteria and may also indicate nutritional risk [8–10]. The separateassociations between each of these indicators of nutritional risk: food insecurity, household income,and food assistance program participation, with overall dietary quality, reveals disagreement acrossthe literature. These nutritional risks may have contrasting influences on the diet quality of differentdemographics, namely by age and ethnic group.
Food insecurity disproportionately influences households headed by individuals of minorityrace/ethnicity [4]. For example, the odds of food insecurity were higher among ethnic minorityinfants including Maori, Pacific Islander, and Asian infants when compared to all other infants, in arepresentative sample of the New Zealand infant population [3]. This race/ethnicity disparity in foodinsecurity extends to associations with poor dietary intake among food-insecure minority groups.Leung C et al. studied a population of 4393 adults from the National Nutrition and Health ExaminationSurvey (NHANES) and found food insecurity was associated with a lower diet quality indicatedby Healthy Eating Index (HEI) score, and this association was most pronounced among those whoidentify as American Indian or Alaska Native, Native Hawaiian or Pacific Islander or as multiracial [4].Despite their inclusion in this sample, the Native Hawaiian or Pacific Islander population representsa unique group within the US at risk of poorer health outcomes than the overall population [11].Heinrich K. and colleagues found that a combination of high living costs and low-income negativelyimpacts some low-income residents in Hawai‘i, contributing to food insecurity [12].
Minority groups such as Native Hawaiian, Pacific Islander or Filipinos (NHPIF) in Hawai‘i reporthigher levels of food insecurity than other ethnicities [13]. Yet the relationship between food insecurityand other indicators of nutritional risk, household income and food assistance participation, to dietquality among NHPIF infants in Hawai‘i is not known, nor is which indicator has a stronger relationshipto dietary quality. Therefore, the objective of this study was to determine which indicator of nutritionalrisk would have the strongest association with the diet quality of NHPIF infants 3–12 months of age.This was assessed using responses to two questions modified from the USHFSSM relating to moneyrunning out for food and utilities, participation in food assistance programs, annual household income,or an adapted infant food security index. A Minimum Dietary Diversity (MDD) score is used whenevaluating the diet quality of infants aged 6–12 months, and thus MDD was used for this analysis.The diet quality of infants aged 3–12 months was examined by food group consumption. Authorshypothesized that an adapted infant food security index, which takes into account multiple indicatorsof food insecurity, would have the strongest association with diet quality assessed using the MDD andfood group consumption [14].
2. Materials and Methods
2.1. Study Sample
The target population for this cross-sectional study was NHPIF infants between 3–12 monthsof age residing on O‘ahu, Hawai‘i. To be eligible to participate in the study, the infant’s caregiver(s)had to be 18 years of age or older, have an iOS mobile device, and have reliable access to the Internet.The infant participants had to have commenced complementary feeding prior to study onset and bereported by the caregiver as at least part Native Hawaiian, Pacific Islander or Filipino. A convenient
22

Nutrients 2020, 12, 2120
sample of NHPIF infants was primarily recruited through community-based events (e.g., Baby Expo),programs (e.g., WIC), and networking. Seventy infants and their caregivers completed the study,of which 56 of the infants were aged 6–12 months. Institutional Review Board (IRB) exemption from theUniversity of Hawai‘i was received prior to the collection of data (IRB reference number: 2017-00845).Consent was obtained in writing from the caregivers for both their participation and their infant’sparticipation prior to collecting any data. Data was collected between March 2018–February 2019.
2.2. Participant Characteristics
At study onset, caregivers completed a questionnaire using a secure on-line web application.Topics included feeding practices followed prior to enrolment in the study. Demographic informationincluded annual household income, information relating to household food security status includinghousehold participation in food assistance programs such as WIC, SNAP, free or reduced cost schoolmeals, food banks since the child was born and two questions informed from the USHFSSM [6].The two questions modified from the USHFSSM were:
1. In the past 12 months, how often did your money for food run out before the end of the month? (Never,Seldom, Sometimes, Most times, Always, Don not know, No response)
2. In the past 12 months, how often did your money for household utilities (e.g., water, fuel, oil, electricity)run out before the end of the month? (Never, Seldom, Sometimes, Most times, Always, Do not know,No response)
2.3. Dietary Assessment
Infant dietary assessment was completed through surrogate reporting via the caregiver withthe mobile food recordTM (mFRTM) [15]. The mFRTM is an application designed specifically forthe assessment of dietary intake from the Technology Assisted Dietary AssessmentTM project (http://tadaproject.org/) which uses the camera on a mobile device to capture food and beverage intake,which is then used to estimate energy, nutrients, food and beverage intakes [15–18]. The mFRTM wasloaded on to the caregiver’s mobile device and training on the mFRTM application was completedprior to data collection. Caregivers were instructed to take before and after images of all foods andbeverages the participant consumed over a 4-day collection period (Thursday–Sunday). After thecollection period concluded, a member of the research team reviewed the images with caregivers toverify content, as needed, and to probe for any forgotten foods or beverages. At the end of the datacollection period, caregivers were compensated with a $40 gift card.
2.4. Dietary Diversity Score
The global metric Minimum Dietary Diversity (MDD) score from the World Health Organisation’s(WHO) indicators for assessing infant and young child feeding practices (IYCF, 2007) [14] was used toexamine infant diet quality. Consuming a wide range of foods to meet one’s nutrient needs is one tenetof a healthy diet and, in infancy, the number of food groups consumed can predict the nutrient densityof the diet [19]. Given the absence of an HEI for children aged below 2 years [20] and the limitedselection of infant diet quality scoring metrics in the US, MDD was implemented as an indicator of themicronutrient adequacy of NHPIF infants. The WHO recommends the initiation of complementaryfeeding from 6 months onward [21]; thus, this assessment is appropriate only for infants aged 6 monthsand older. Solid foods and liquids consumed in any amount more than a condiment were enumeratedover the 4 days using the mFRTM images. Using the MDD metric, solids and liquids consumed in a daywere categorized into seven food groups: (1) grains, roots, and tubers; (2) legumes and nuts; (3) dairyproducts (milk, including formula, yogurt, cheese); (4) flesh foods (meat, fish, poultry, liver/organmeats); (5) eggs; (6) vitamin A-rich fruits and vegetables; and (7) other fruits and vegetables. Particularattention is given by the WHO to assess vitamin A intake in children aged 6–59 months. This is becausevitamin A deficiency in infancy is a public health problem in many developing countries. Furthermore,
23

Nutrients 2020, 12, 2120
vitamin A deficiency can cause visual impairment and may increase the risk of illness and deathfrom childhood infections [22]. MDD was considered met if the infant consumed four or more of theseven food groups, on average, each day and unmet if less than four food groups had been consumed,on average, each day. Human milk is not counted in a food group in the version of the WHO MDDmetric used [14].
2.5. Adapted Food Security Index
A food security index was adapted from an index developed by Schlichting D. et al. and isoutlined in Table 1 [3]. The adapted index estimates the degree of infant food security as a weightedsum of scores from two of the modified USHFSSM questions, i.e., use of defined methods to cope withfood insecurity such as using food banks, and infant breastfeeding status at 3 months. Breastfeedingstatus at this age was chosen as each participant had commenced complementary feeding prior to studyonset and the minimum participant age was 3 months. Positive points were awarded for breastfeedingto 3 months and never running out of money for food or utilities, while scoring was reversed andpoints deducted for the use of coping methods such as using food assistance programs. The range ofscores was −14 to 4. For ease of discussion, a constant equal to the lowest value (−14) was added to allscores, shifting the range upward to 0–18 where 0 represents the lowest status of food security and 18the highest. A cutoff for infant food insecurity was set at half a standard deviation below the mean(12.76). This cutoff point is consistent with other authors who claim it represents the minimum sociallyacceptable level of food insecurity prevalence. Infants were classified by this index into either extremely,highly or moderately food insecure or extremely, highly or moderately food secure (see Table 1 andTable 5) [3].
Table 1. The adapted infant food security index a components, weights, scores, and ranges applied tothis study.
Adapted Infant Food Security Index Used in this Study
Component Weight Min Max
Coping
Money for food runs out by the end of the month
Never = 1Seldom = 0
Sometimes = −1Most times = −2
Always = −3
−3 1
Money for utilities runs out by the end of the month
Never = 1Seldom = 0
Sometimes = −1Most times = −2
Always = −3
−3 1
Participation in WIC Yes = −2No = 0 −2 0
Participation in SNAP Yes = −2No = 0 −2 0
Receives reduced cost/free school meals Yes = −2No = 0 −2 0
Receives other food assistance Yes = −2No = 0 −2 0
24

Nutrients 2020, 12, 2120
Table 1. Cont.
Adapted Infant Food Security Index Used in this Study
Component Weight Min Max
BF Breastfeeding to 3 months
Exclusive = +2BF and Formula
Feeding = +1Formula only or BF< 3 month = 0
0 2
Total Score −14 4
Add constant of 14 0 18a Adapted from Schlichting D. et al. [3].
2.6. Analysis
Descriptive statistics were used to categorize the sample. Mean and standard deviations (SD)were used to describe age and food group consumption. Frequencies and percentages were used todescribe food security prevalence by the various indicators. Participation in food assistance programswas examined from the dichotomous responses: yes or no. Responses to the modified USHFSSMquestions on running out of money for food or utilities were collapsed into dichotomous variables(yes or no). The responses never or seldom to either question was reported as not experiencing (no)while the responses sometimes, most times or always were reported as experiencing it (yes). The meandaily consumption of the 7 food groups was calculated as a mean of all four mFRTM days, a methodcommonly used [3,23]. The frequency of consumption of each food group with the average number offood groups consumed was examined in all participants (i.e., 3–12 months). Quantitative variables werecompared between food-secure and food-insecure subgroups using both independent samples t-testmethods and the non-parametric Mann–Whitney U tests. Independent sample t-test p-value resultswere presented when the results from the two approaches were similar. Categorical variables werecompared using Chi-squared tests or Fisher’s exact tests [23]. Spearman’s rho correlation coefficientwas used in examining correlation between food security indicators and food groups consumed [24].The proportion meeting/not meeting the MDD (≥4 food groups) was determined in the participants6–12 months of age subgroup only, across all four days of the mFRTM. A sequence of multivariablelogistic regression and linear regression models were developed to investigate the relationships betweenMDD and individual and total food group intake, and those variables that yielded significant results inthe bivariate analysis. In logistic regression analysis, MDD was met or not, on average, across the fourdays (yes or no) was used as the dependent variable to investigate its associations with the adapted foodsecurity index score, household income or the response to running out of money for food, adjusting forage and sex. In the linear regression analysis, total and individual food group consumption was used asthe dependent variable to study its relationships with the adapted food security index score, householdincome, responses to running out of money for food and utilities or WIC and SNAP participationstatus, adjusting for age and sex as considered in similar studies [23]. Statistical significance was set atp-value < 0.05. All statistical analyses were performed using SPSS version 26 (Armonk, NY, USA).As this was a secondary analysis, a power calculation was not conducted to identify the sample size.
3. Results
3.1. Food Security Classification Using the Adapted Food Security Index
Of the 70 infants, approximately one quarter were classified as food insecure, with over 20% beingclassified as moderately or highly or extremely food insecure. Over 40% were highly food secure,while no infant was classified as extremely food secure (see Table 2).
25

Nutrients 2020, 12, 2120
Table 2. Food security classifications using an adapted food security index among infants aged3–12 months in the cross-sectional study (n = 70) a.
SD Cut Point Score Range Definition Prevalence, n (%)
<−2 SD <7.12 Extremely food insecure 4 (5.7)
−2 SD ≤ • < −1 SD 7.13–10.88 Highly food insecure 5 (7.1)
−1 SD ≤ • < −0.5 SD 10.89–12.76 Moderately food insecure 9 (12.9)
−0.5 SD ≤ • < +0.5 SD 12.77–16.52 Moderately food secure 16 (22.9)
+0.5 SD ≤ • < +1 SD 16.53–18.40 Highly food secure 31 (44.3)
≥+1 SD ≥18.41 Extremely food secure 0 (0)
SD = standard deviation. a Total number of responses = 65 as there were 5 (7.1%) incomplete responses.
3.2. Other Characteristics of Participants
Approximately half of the infants were girls and the mean age was 7.4 months. A greaterproportion of food-secure infant caregivers were married and earning higher incomes. Likewise,a greater proportion of food-secure infant caregivers attended college (see Table 3).
Table 3. Characteristics of food-secure and food-insecure infants and their caregivers included in thiscross-sectional study examining food security and Native Hawaiian, Pacific Islander, and Filipino(NHPIF) a infant diet (n = 70).
Characteristics Total SampleFood- b Secure
Subsample
Food-InsecureSubsample
p-Value c
Age
Months (mean ± SD) 7.4 ± 2.1 7.2 ± 2.1 8 ± 2.2
3–6 months, n (%) 14 (20.1) 10 (21.4) 4 (27.9)0.2
6–12 months, n (%) 56 (79.9) 37 (78.7) 14 (72.1)
SexBoy, n (%) 38 (54.3) 27 (57.4) 8 (44.4)
0.4Girl, n (%) 32 (45.7) 20 (42.6) 10 (55.6)
Marital Status
Married, n (%) 46 (61.3) 36 (76.6) 10 (55.6)0.02Single/divorced/
widowed, n (%) 24 (31.9) 11 (23.4) 8 (44.4)
Highest Level ofEducationAttended
College, n (%) 50 (66.6) 37 (78.7) 9 (50)
0.03Grade School(Elementary–High
School), n (%)20 (26.6) 10 (21.3) 9 (50)
Employed forWages
Yes, n (%) 42 (60) 28 (59.6) 10 (55.6)0.8
No, n (%) 28 (40) 19 (40.4) 8 (44.4)
Annual HouseholdIncome
>$35,000 48 (81.4) 38 (90.5) 10 (58.8)0.01
<$35,000 11 (18.6) 4 (9.5) 7 (41.2)a Native Hawaiian, Pacific Islander or Filipino ethnicity. b As categorized by the adapted infant food security indexused in this study. c p-values comparing food-secure and food-insecure subsamples.
Table 4 displays the proportion of infants classified as food secure or insecure by component onthe food security index adapted from Schlichting D. et al. [3]. Most infants classified as food insecurewere part of households who experienced running out of money for food or utilities by the end of themonth. Additionally, over 80% of food-insecure infants’ households participated in WIC and over 50%participated in SNAP.
26

Nutrients 2020, 12, 2120
Table 4. Proportion of infants aged 3–12 months enrolled in the cross-sectional study classified as foodsecure or insecure by each component of the adapted infant food security index used in this study(n = 70) a,b.
Component Food Security StatusChi-Squared
p-Value
Coping
Food Securen (%)
Food Insecuren (%)
Money for food runs out bythe end of the month
YesNo
3 (6.4)44 (93.6)
15 (83.3)3 (16.7) 0.001
Money for utilities runs out bythe end of the month
YesNo
6 (11.5)46 (88.5)
12 (92.3)1 (7.7) <0.0001
Participation in SpecialSupplemental Nutrition
Program for Women (WIC)
YesNo
7 (14.9)40 (85.1)
15 (83.3)3 (16.7) <0.0001
Participation in SupplementalNutrition Assistance
Program (SNAP)
YesNo
3 (6.4)44 (93.6)
10 (55.6)8 (44.4) <0.0001
Receives reduced cost/freeschool meals
YesNo
0 (0)47 (100)
7 (38.9)11 (61.1) 0.001
Receives food assistance(Food Bank/Food Pantries or
Commodity Foods)
YesNo
0 (0)47 (100)
2 (11.1)16 (88.9) 0.07
Breastfeeding
Exclusive breastfeeding to 3 months 30 (63.8) 14 (77.8) 0.7
Breast and formula feeding to3 months 13 (28.7) 2 (11.1) 0.2
Formula only or breastfeeding<3 months 4 (8.5) 2 (11.1) 0.1
a Adapted from Schlichting D. et al. [3]. b Total number of responses were 65. 5 (7.1%) incomplete responses.
3.3. Average Percentage Daily Food Group Consumption by Food Security Status
The seven food groups used to classify the infants’ dietary characteristics are shown in Table 5.Grains, roots or tubers were the most commonly consumed foods followed by other fruits andvegetables and dairy products. The mean total number of food groups consumed daily was a littleover 3.0 food groups with a range between 1.0–5.3. The mean consumption of food groups by infants,3–12 months, from households who experience running out of money for food or utilities at the end ofthe month was almost four food groups each day, while infants from households who do not experiencerunning out of money for food or utilities at the end of the month had, on average, three food groupseach day. Infants, 3–12 months, from households not experiencing running out of money for food orutilities at the end of the month consumed a flesh food more than half of the time, while those whodid not experience running out of money for food or utilities by the end of the month consumed aflesh food approximately 20% of the time. A marginal but statistically significant difference in theconsumption of grains, roots and tubers, between those who do and do not experience running outof money for food, was also identified. Infants, 3–12 months, from households who do experiencerunning out of money for food at the end of the month consumed a grain root or tuber almost 100% ofthe time, while those who do not experience running out of money for food by the end of the monthconsumed a grain, root or tuber approximately 80% of the time.
27

Nutrients 2020, 12, 2120
Ta
ble
5.
Mea
npe
rcen
tdai
lyfo
odgr
oup
cons
umpt
ion
byva
riou
sin
dic
ator
sof
food
secu
rity
appl
ied
inth
isan
alys
isfo
rin
fant
sag
ed3–
12m
onth
sen
rolle
din
the
cros
s-se
ctio
nals
tudy
(n=
70).
Fo
od
Se
curi
tyIn
dic
ato
r
Infa
nts
To
tal
(%)
FS
SS
Q1
aF
SS
SQ
2b
WIC
SN
AP
Ind
ex
Sco
rec
Inco
me
Fo
od
Gro
up
Ye
s(%
)N
o(%
)p
Ye
s(%
)N
o(%
)p
Ye
s(%
)N
o(%
)p
Ye
s(%
)N
o(%
)p
FIS
(%)
FS
(%)
pC
orr
pL
ow
Inco
me
(%)
Hig
hIn
com
e(%
)p
Co
rrp
Gra
ins,
roo
tsa
nd
tub
ers
8596
790.
001
9682
0.08
993
800.
023
9582
0.17
3¥
9680
0.00
2−0
.359
0.00
394
820.
030
−0.2
270.
058
Le
gu
me
sa
nd
nu
ts8
49
0.50
5¥
68
0.94
8¥
69
0.97
3¥
117
0.08
5¥
69
0.93
5¥
−0.0
420.
742
137
0.25
1−0
.132
0.27
5D
air
yp
rod
uct
s61
6560
0.65
948
630.
283
6956
0.25
268
590.
621
¥58
620.
802
−0.0
160.
902
7759
0.22
4−0
.177
0.14
3F
lesh
foo
ds
2857
170.
000
6320
0.00
033
240.
338
4025
0.20
361
160.
000
−0.3
620.
003
5024
0.08
5−0
.187
0.12
2E
gg
s8
107
0.46
96
80.
767
97
0.62
817
60.
116
126
0.14
6¥
−0.0
020.
987
205
0.06
7−0
.141
0.24
7V
ita
min
A-r
ich
fru
its
an
dv
eg
eta
ble
s
5665
540.
192
7153
0.07
161
540.
398
6355
0.57
0¥
6354
0.36
1−0
.220
0.07
867
540.
171
−0.0
950.
432
Oth
er
fru
its
an
dv
eg
eta
ble
s73
7871
0.48
785
710.
186
7472
0.68
0¥
7572
0.94
4¥
7871
0.45
0−0
.138
0.27
477
720.
666
−0.0
560.
643
To
tal
foo
dg
rou
ps
(n)
3.2
3.8
3.0
0.00
53.
83.
00.
018
3.5
3.0
0.11
03.
73.
10.
055
3.8
3.0
0.00
8−0
.317
0.01
04.
03.
00.
003
−0.2
940.
014
¥in
dic
ates
Man
n–W
hitn
eyU
test
resu
lt.S
peci
alSu
pple
men
talN
utri
tion
Prog
ram
for
Wom
en,I
nfan
tsan
dC
hild
ren
(WIC
),T
heSu
pple
men
talN
utri
tion
Ass
ista
nce
Prog
ram
(SN
AP)
,p
valu
e(p
),co
rrel
atio
n(C
orr,
Spea
rman
’srh
o),g
rain
s,ro
ots
and
tube
rs(G
rain
s),l
egu
mes
and
nuts
(Leg
um
es),
vita
min
A-r
ich
fru
its
and
vege
tabl
es(V
itam
inA
),ot
her
fru
its
and
vege
tabl
es(O
ther
),a
Ada
pted
USD
AFo
odSe
curi
tySu
rvey
Scal
eQ
uest
ion.
Mon
eyfo
rfo
odru
nsou
tby
the
end
ofth
em
onth
.No=
Nev
er/s
eldo
m.Y
es=
Som
etim
es/m
ostt
imes/a
lway
s.b
Ada
pted
USD
AFo
odSe
curi
tySu
rvey
Scal
eQ
uest
ion.
Mon
eyfo
rut
ilitie
sru
nsou
tby
the
end
ofth
em
onth
.No=
Nev
er/s
eldo
m.Y
es=
Som
etim
es/m
ostt
imes/a
lway
s.c
Ada
pted
Infa
ntFo
odSe
curi
tyIn
dex
used
inth
isst
udy.
Cla
ssifi
edas
food
secu
re(F
S).C
lass
ified
asfo
odin
secu
re(F
IS).
28

Nutrients 2020, 12, 2120
Only one marginal, but statistically significant, difference in infant daily food group consumptionwas identified between households who do and do not participate in WIC and SNAP. Infants inhouseholds who participate in WIC or SNAP consumed a grain, root or tuber over 90% of the time,while those who do not participate in WIC or SNAP consumed a grain, root or tuber approximately80% of the time. On average, infants in households who participate in WIC or SNAP consumed foodsfrom approximately 3.5 food groups each day, while infants in households who do not participate inWIC or SNAP consumed foods from approximately 3.0 food groups each day (see Table 5).
There was a significant difference in the intake of flesh foods between those infants who wereand were not defined as food insecure by the adapted food security index. Those defined as foodinsecure had a flesh food intake over 60% of the time, while those defined as food secure had a fleshfood intake more than 15% of the time. Likewise, infants defined as food insecure had a grain, root ortuber group over 95% of the time versus approximately 80% of the time by those defined as food secure.Furthermore, infants defined as food insecure had, on average, 3.76 out of seven food groups a day,while those defined as food secure had, on average, almost 3.0 food groups (see Table 5).
Weak to moderate, but statistically significant negative spearman correlations were observedbetween infant food security by the adapted index and total food group, the grain, root, and tuberfood group and the flesh food group consumption. Likewise, weak, but significant negative spearmancorrelations were found between household income and total food group consumption (see Table 5).
3.4. Proportion of Infants Aged 6–12 Months Meeting the MDD by Food Security Indicators
Table 6 presents the proportion of infants 6–12 months who did and did not meet the MDD by thevarious indicators of food security examined in this study. The highest proportion of infants to meetthe MDD were those classified as moderately food insecure by the adapted infant food security index,of whom over 70% met the MDD. Significantly more food-insecure infants met the MDD in comparisonto food-secure infants. In addition, over two-thirds of infants from households with an annual incomeof <$35,000, met the MDD whereas a little less than 30% of infants from households with an annualincome of >$35,000 met the MDD. Similarly, the income bracket with the highest proportion of infants(approximately 80%) meeting the MDD was <$10,000 while the lowest proportion of infants (over15%) meeting the MDD were from the $60,000–75,000 bracket followed by the >$75,000 bracket withover 25%.
Table 6. Proportion of infants aged 6–12 months enrolled in the cross-sectional study meeting theMinimum Dietary Diversity (MDD) score a by the various indicators of food security examined in thisstudy (n = 70) b.
Met MDDn (%)
Did notMeet MDD
n (%)
Chi Square pValues
Total 20 (35.7) 36 (64.3) -
Money for food running out by the endof the month c
No 10 (26.3) 28 (73.7)0.052
Yes 8 (57.1) 6 (42.9)
Money for utilities running out by theend of the month d
No 13 (31) 29 (69)0.173
Yes 6 (54.5) 5 (45.5)
Participation in WICNo 10 (28.6) 25 (71.4)
0.165Yes 10 (47.6) 11 (52.4)
Participation in SNAPNo 13 (29.5) 31 (70.5)
0.092Yes 7 (58.3) 5 (41.7)
29

Nutrients 2020, 12, 2120
Table 6. Cont.
Met MDDn (%)
Did notMeet MDD
n (%)
Chi Square pValues
Food Security Index Status e
Extremelyfood insecure 2 (66.7) 1 (33.3)
0.046
Highly foodinsecure 2 (50) 2 (50)
Moderatelyfood insecure 5 (71.4) 2 (28.6)
Moderatelyfood secure 2 (16.7) 10 (83.3)
Highly foodsecure 7 (28) 18 (72)
Extremelyfood secure 0 (0) 0 (0)
Food Security Index Classification eFood insecure 9 (24.3) 28 (75.7)
0.019Food secure 9 (64.3) 5 (35.7)
Annual Household Income ($)
<10,000 4 (80) 1 (20)
0.008
10,000–20,000 1 (50) 1 (50)
20,000–35,000 3 (60) 2 (40)
35,000–60,000 3 (42.9) 4 (57.1)
60,000–75,000 1 (16.7) 5 (83.3)
>75,000 7 (28) 18 (72)
<35,000 8 (66.7) 4 (33.3)0.038
>35,000 11 (28.9) 27 (71.1)
Special Supplemental Nutrition Program for Women, Infants and Children (WIC), The Supplemental NutritionAssistance Program (SNAP). a Minimum Dietary Diversity Score. b Total number of responses 65. 5 (7.1%)incomplete responses. c No = Never/seldom. Yes = Sometimes/most times/always. d No = Never/seldom.Yes = Sometimes/most times/always. e Based on the adapted Infant Food Security Index used in this study.
3.5. Infant Food Security Indicators and Food Group Consumption Examined Using Linear Regression Analysis
Presented in Table 7 are the statistically significant results of linear regression analysis between foodsecurity indicators and total food group consumption, grain, root, and tuber food group consumption,and flesh group consumption. The regression findings indicate a statistically significant associationbetween food security score and grain, root, and tuber consumption. For each unit increase in foodsecurity classification from extremely food insecure to extremely food secure by the adapted foodsecurity index, the frequency of daily grain, root, and tuber consumption decreases by approximately6% after controlling for age and sex. A similar trend is observed across the models whereby runningout of money for food or utilities by the end of the month and lower food security score results in ahigher percentage increase in either of total food group, grain, root, and tuber food group consumption,and flesh group consumption.
3.6. Infant Food Security Indicators and Meeting the MDD Examined Using Multivariable LogisticRegression Analysis
Multivariable logistic regression results, which adjusted for age and sex, did not find significantassociations between meeting the MDD and running out of money for food by the end of the month,being defined as food insecure by the adapted infant food security index and having a low householdincome (see Table A1).
30

Nutrients 2020, 12, 2120
Ta
ble
7.
The
asso
ciat
ion
betw
een
infa
ntfo
odse
curi
tyin
dic
ator
san
dto
tala
ndin
div
idua
lfoo
dgr
oup
cons
umpt
ion
inin
fant
s3–
12m
onth
sex
amin
edus
ing
linea
rre
gres
sion
(n=
70)a .
To
tal
Fo
od
Gro
up
Co
nsu
mp
tio
n
Mod
el1
Mod
el2
Mod
el3
Run
ning
outo
fmon
eyfo
rfo
odby
the
end
ofth
em
onth
BSE
p-va
lue
BSE
p-va
lue
BSE
p-va
lue
Con
stan
t2.
961
0.14
9<
0.00
011.
197
0.41
10.
010.
957
0.50
30.
1R
unni
ngou
tofm
oney
for
food
byth
een
dof
the
mon
th0.
831
0.28
50.
010.
728
0.25
10.
010.
689
0.25
60.
01A
ge0.
242
0.05
3<
0.00
010.
238
0.05
4<
0.00
01Se
x0.
190
0.22
90.
4R
-Squ
ared
0.11
70.
333
0.34
1A
djus
ted
R-S
quar
ed0.
103
0.31
20.
309
Mod
el4
Mod
el5
Mod
el6
Run
ning
outo
fmon
eyfo
rut
iliti
esby
the
end
ofth
em
onth
BSE
p-va
lue
BSE
p-va
lue
BSE
p-va
lue
Con
stan
t3.
044
0.14
6<
0.00
011.
235
0.43
40.
010.
795
0.52
80.
1R
unni
ngou
tofm
oney
for
utili
ties
byth
een
dof
the
mon
th0.
802
0.33
20.
020.
653
0.29
60.
030.
664
0.29
30.
03A
ge0.
247
0.05
7<
0.00
010.
240
0.05
6<
0.00
01Se
x0.
333
0.23
10.
2R
-Squ
ared
0.08
20.
293
0.31
6A
djus
ted
R-S
quar
ed0.
068
0.27
10.
283
Mod
el7
Mod
el8
Mod
el9
Food
Secu
rity
Scor
eb
BSE
p-va
lue
BSE
p-va
lue
BSE
p-va
lue
Con
stan
t4.
307
0.44
9<
0.00
012.
350
0.58
6<
0.00
011.
970
0.67
60.
01Fo
odSe
curi
tySc
ore
−0.2
790.
107
0.01
−0.2
470.
094
0.01
−0.2
370.
094
0.02
Age
0.24
60.
055
<0.
0001
0.24
10.
055
<0.
0001
Sex
0.25
80.
230
0.3
R-S
quar
ed0.
097
0.31
90.
333
Adj
uste
dR
-Squ
ared
0.08
30.
297
0.30
0
Gra
in,ro
ot
an
dtu
ber
con
sum
pti
on
Mod
el10
Mod
el11
Mod
el12
Food
secu
rity
scor
eb
BSE
p-va
lue
BSE
p-va
lue
BSE
p-va
lue
Con
stan
t1.
117
0.10
8<
0.00
010.
907
0.15
8<
0.00
010.
842
0.18
4<
0.00
01Fo
odSe
curi
tySc
ore
−0.0
680.
026
0.01
−0.0
640.
025
0.01
−0.0
620.
026
0.03
Age
0.02
60.
015
0.1
0.02
60.
015
0.1
Sex
0.04
40.
063
0.5
R-S
quar
ed0.
099
0.14
30.
150
Adj
uste
dR
-Squ
ared
0.08
40.
115
0.10
8
31

Nutrients 2020, 12, 2120
Ta
ble
7.
Con
t.
Fle
shfo
od
con
sum
pti
on
Mod
el13
Mod
el14
Mod
el15
Run
ning
outo
fmon
eyfo
rfo
odby
the
end
ofth
em
onth
BSE
p-va
lue
BSE
p-va
lue
BSE
p-va
lue
Con
stan
t0.
172
0.05
00.
001
−0.4
130.
139
0.00
4−0
.416
0.17
10.
02R
unni
ngou
tofm
oney
for
food
byth
een
dof
the
mon
th0.
398
0.09
6<
0.00
010.
364
0.08
5<
0.00
010.
363
0.08
7<
0.00
01A
ge0.
080
0.01
8<
0.00
010.
080
0.01
8<
0.00
01Se
x0.
002
0.07
80.
98R
-Squ
ared
0.21
10.
398
0.39
8A
djus
ted
R-S
quar
ed0.
198
0.37
90.
369
Mod
el16
Mod
el17
Mod
el18
Run
ning
outo
fmon
eyfo
rut
iliti
esby
the
end
ofth
em
onth
BSE
p-va
lue
BSE
p-va
lue
BSE
p-va
lue
Con
stan
t0.
204
0.04
8<
0.00
01−0
.376
0.14
30.
01−0
.468
0.17
60.
01R
unni
ngou
tofm
oney
for
utili
ties
byth
een
dof
the
mon
th0.
431
0.10
9<
0.00
010.
383
0.09
8<
0.00
010.
386
0.09
8<
0.00
01A
ge0.
079
0.01
9<
0.00
010.
078
0.01
9<
0.00
01Se
x0.
070
0.07
70.
4R
-Squ
ared
0.19
40.
370
0.37
8A
djus
ted
R-S
quar
ed0.
182
0.35
10.
349
Mod
el19
Mod
el20
Mod
el21
Food
secu
rity
scor
ea
BSE
p-va
lue
BSE
p-va
lue
BSE
p-va
lue
Con
stan
t0.
753
0.15
6<
0.00
010.
103
0.20
60.
60.
052
0.24
00.
8Fo
odSe
curi
tySc
ore
−0.1
170.
037
0.00
3−0
.106
0.03
30.
002
−0.1
050.
034
0.00
3A
ge0.
082
0.01
9<
0.00
010.
081
0.01
9<
0.00
01Se
x0.
035
0.08
20.
7R
-Squ
ared
0.13
50.
330
0.33
2A
djus
ted
R-S
quar
ed0.
122
0.30
90.
299
Spec
ialS
uppl
emen
talN
utri
tion
Prog
ram
for
Wom
en,I
nfan
tsan
dC
hild
ren
(WIC
),T
heSu
pple
men
talN
utri
tion
Ass
ista
nce
Prog
ram
(SN
AP)
.Mod
el1+
13:R
unni
ngou
tofm
oney
for
food
byth
een
dof
the
mon
th.M
odel
2+
14:R
unni
ngou
tofm
oney
for
food
byth
een
dof
the
mon
th+
age.
Mod
el3+
15:R
unni
ngou
tofm
oney
for
food
byth
een
dof
the
mon
th+
age
+se
x.M
odel
4+
16:R
unni
ngou
tofm
oney
for
utili
ties
byth
een
dof
the
mon
th.M
odel
5+
17:R
unni
ngou
tofm
oney
for
utili
ties
byth
een
dof
the
mon
th+
age.
Mod
el6+
18:R
unni
ngou
tofm
oney
for
utili
ties
byth
een
dof
the
mon
th+
age+
sex.
Mod
el7,
10+
19:F
ood
Secu
rity
Scor
e.M
odel
8,11+
20:F
ood
Secu
rity
Scor
e+
age.
Mod
el9,
12+
21:F
ood
Secu
rity
Scor
e+
age+
sex.
aTo
taln
umbe
rof
resp
onse
s65
.5(7
.1%
)inc
ompl
ete
resp
onse
s.b
Base
don
the
adap
ted
Infa
ntFo
odSe
curi
tyIn
dex
used
inth
isst
udy.
32

Nutrients 2020, 12, 2120
4. Discussion
As hypothesized, the indicator of nutritional risk which had the strongest association with the dietquality of NHPIF infants 3–12 months was the adapted infant food security index, which takes intoaccount multiple indicators of food insecurity. Significant associations after adjusting for infant ageand sex were only found with the adapted infant food security index and the two modified USHFSSMquestions regarding food group consumption as an indicator of dietary quality. Food-insecure NHPIFinfants classified by the adapted infant food security index used in this study consumed a greaternumber of food groups on average each day, had a greater intake of flesh foods and a greater intake ofgrains, roots and tubers compared to those classified as food secure by the index. Households whoexperienced running out of money for food or utilities by the end of the month were significantlyassociated with greater total food group and more frequent daily flesh food consumption comparedto those who did not experience running out of money for food or utilities by the end of the month.However, significant differences in the intake of legumes and nuts, dairy products, eggs, vitamin A-richfruit or vegetables or other fruit and vegetables were not apparent between infants defined as foodsecure or insecure by any of the nutritional risk indicators. Based on these findings, the adapted infantfood security index may be the better indicator to use to assess the association between food securityand food group consumption within this sample of NHPIF infants compared with the two questionsmodified from the USHFSSM, participation in food assistance programs, annual household income.
Of the infants in this study, 36% met the MDD, on average, each day. This is higher than what hasbeen reported in a cohort of infants aged 8–12 months in Cincinnati, Ohio, where only 28% of infantswere found to meet the MDD, on average, each day [25]. In the present study, none of the associationsbetween MDD and any indicators of nutritional risk remained significant in multivariable logisticregression models adjusting for infant age and sex. These findings may be attributed to the smallsample size available in this study for infants 6–12 months.
The association between total food group consumption and infant food insecurity by the adaptedfood security index found in this study was interesting but not unique among the literature. In astudy conducted in South Africa, where socioeconomic status (SES) was measured using a compositescore of assets and market access, household income, employment status, and educational attainment,MDD was higher among lower SES 6–12-month-old infants. The authors report that their resultsmay have been reflective of the small sample size when stratified by SES and age [23]. A similarjustification could be considered for this study whereby infants classified as food insecure by theindex used in this study made up only 25.7% (n = 18) of the sample. In addition, this study wasa secondary analysis and was not sampled to be representative of NHPIF food-insecure infants inHawai‘i. Thus, the food group consumption identified in this study may not be generalized for thepopulation. These results are suggestive, however, that NHPIF food-insecure infants in Hawai‘i arenot at nutritional disadvantage compared to those that are food secure. Rossen L.M et al. similarlyreported that food insecurity was largely not associated with dietary intake in a representative sampleof 5136 US children aged 2–15 years from NHANES [26]. Likewise, Shinyoung J. et al. did not find asubstantial difference in diet quality by household food security or food security among a sample of5540 children from NHANES 2011–2014 [27]. Other research from a representative sample of NewZealand infants found that food-secure infants had a more diverse diet compared to those who werefood insecure [3]. Infants defined as food insecure by the adapted index applied in this study maybe employing coping mechanisms such as participation in food assistant programs such as WIC andSNAP. Furthermore, the nutrition of these infants may be prioritized by their caregiver, providingprotection against the lack of food resources in the household, as seen in other studies [27].
Similar patterns of higher flesh food intake were identified among lower SES infants in SouthAfrica, as in the results of this study, where the most common type of flesh food consumed daily by lowSES infants was processed meat followed by red meat [23]. Processed meats are high in sodium and fatand their intake during infancy has been associated with hypertension and coronary artery diseaseduring adulthood [23,28]. While studies have shown the benefits of flesh foods on infant growth
33

Nutrients 2020, 12, 2120
and cognitive development [28,29], the effect of high flesh food consumption in food-insecure infantsfound in this study was not clear, nor was the type of flesh foods consumed. Meat as a complementaryfood in infancy is a key source of the micronutrients zinc, iron and vitamin B12 [30]. The pattern ofhigh flesh food intake may contribute to the intake of these micronutrients; however, as this studydoes not address the type and quantity of foods consumed in each food group, micronutrient intakeremains unclear. Factors such as poor maternal nutrition knowledge, delayed introduction of fleshfoods, or concerns about potentially allergenic foods [23,31] may influence flesh food consumptionpatterns during this stage of life.
While authors suggest that dietary diversity is generally associated with child nutritional statusand that the associations remain when controlling for household wealth and welfare factors [32],there are drawbacks of assessing infant diet using the global MDD score from the WHO for assessinginfant and young child feeding practices. Firstly, food is enumerated when consumed; however,there is no amount recorded. This decision by the creators of the MDD, may be a result of infantportion sizes being small and overall differences in portion sizes having a minimal impact. Secondly,the MDD does not adjust for total energy (kcal). Higher energy intakes could contribute to beingoverweight during infancy, which is consistently associated with a risk of obesity in childhood andadult life. This association is especially important in populations where the obesity risk is higher suchas those of NHPIF ancestry [11]. Thirdly, the designated food groups do not completely distinguishadded sugars, sodium and saturated fats. As an example, guidelines for the grains, roots and tubersgroup does not distinguish a French fry from a boiled wholefood sweet potato. Thus, we identified agreater diversity of foods being eaten by food-insecure infants, however, the quality and quantity ofthese foods were not assessed using the MDD score. This issue was addressed by Schlichting et al.,who added an additional grouping of energy dense nutrient poor foods, which gave an indicationof the unhealthy foods consumed [3]. Importantly, the outcome of diet diversity is a concept uniquefrom more traditional dietary quality indices. Furthermore, this dietary assessment method did notincorporate a breastfeeding assessment element. The WHO updated the MDD in 2017 to reflectinclusion of breast milk as the eighth food group [33]. In the present study, breastfeeding status wasonly considered within the adapted infant food security index.
WIC and SNAP are two important food and nutrition assistance programs conducted by USDAto improve the nutritional well-being of low-income individuals, and there is ongoing interest ininvestigating the roles of these programs in accomplishing these intentions. One study reported,from a NHANES sample of 1197 children aged 2 to 4 years from low-income households, that WICfood packages are associated with higher diet quality for low-income children [34]. Another study,which addressed the participation and effectiveness of SNAP and WIC in a multi-equation frameworkfor nutrient intakes for young children in the US, found that WIC participation increases theintakes of iron, potassium, and fiber; however, no nutritional effects were found with SNAPparticipation [35]. The results of this study demonstrate that despite residing in lower incomeWIC- and SNAP-participating households, these infants may not be at a disadvantage nutritionallycompared to those who do not participate in these programs and who are assumed to be of higherincome. These results suggest that participation in WIC and SNAP supports more healthful food groupconsumption. However, further investigation on how these programs mitigate food insecurity anddiet quality are needed to inform program implementation in the NHPIF population.
The strengths of this study include the application of an adapted infant food security index whichclassified food security at the level of the infant and incorporated various indicators of food security.However, this adapted index did not undergo any tests for validity and it did not include the complete18-item USHFSSM, nor the eight items specific to determining child food security, which would haveprovided another indicator of food security status. Another strength of the study is that it is the firstknown examination of food security in this particular population, which acts to fill the relative deficit ofsuch data and provides a base of work for further research. This collection of infant dietary intake by animage-based mFRTM served to reduce the confounding of results, which can occur due to misreporting
34
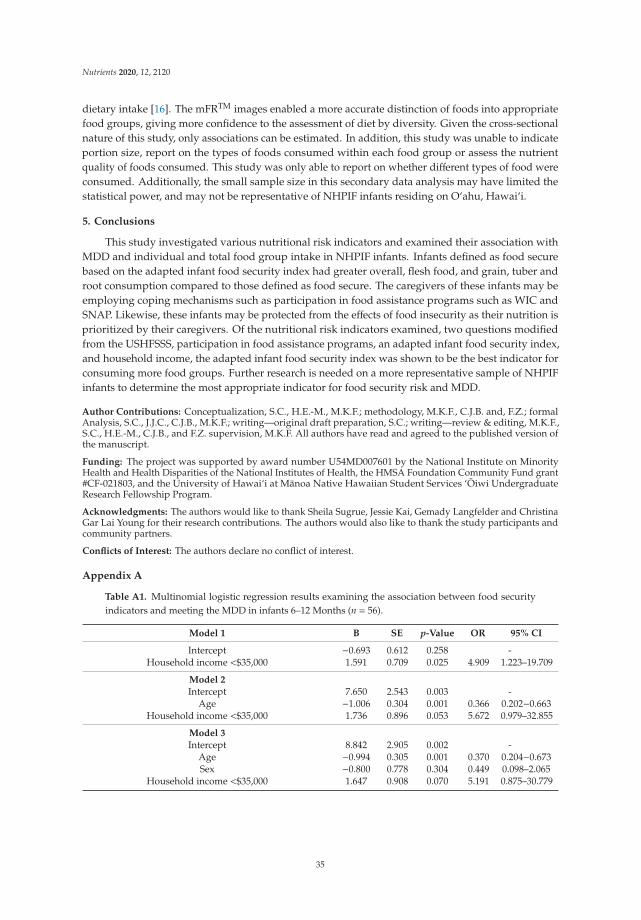
Nutrients 2020, 12, 2120
dietary intake [16]. The mFRTM images enabled a more accurate distinction of foods into appropriatefood groups, giving more confidence to the assessment of diet by diversity. Given the cross-sectionalnature of this study, only associations can be estimated. In addition, this study was unable to indicateportion size, report on the types of foods consumed within each food group or assess the nutrientquality of foods consumed. This study was only able to report on whether different types of food wereconsumed. Additionally, the small sample size in this secondary data analysis may have limited thestatistical power, and may not be representative of NHPIF infants residing on O‘ahu, Hawai‘i.
5. Conclusions
This study investigated various nutritional risk indicators and examined their association withMDD and individual and total food group intake in NHPIF infants. Infants defined as food securebased on the adapted infant food security index had greater overall, flesh food, and grain, tuber androot consumption compared to those defined as food secure. The caregivers of these infants may beemploying coping mechanisms such as participation in food assistance programs such as WIC andSNAP. Likewise, these infants may be protected from the effects of food insecurity as their nutrition isprioritized by their caregivers. Of the nutritional risk indicators examined, two questions modifiedfrom the USHFSSS, participation in food assistance programs, an adapted infant food security index,and household income, the adapted infant food security index was shown to be the best indicator forconsuming more food groups. Further research is needed on a more representative sample of NHPIFinfants to determine the most appropriate indicator for food security risk and MDD.
Author Contributions: Conceptualization, S.C., H.E.-M., M.K.F.; methodology, M.K.F., C.J.B. and, F.Z.; formalAnalysis, S.C., J.J.C., C.J.B., M.K.F.; writing—original draft preparation, S.C.; writing—review & editing, M.K.F.,S.C., H.E.-M., C.J.B., and F.Z. supervision, M.K.F. All authors have read and agreed to the published version ofthe manuscript.
Funding: The project was supported by award number U54MD007601 by the National Institute on MinorityHealth and Health Disparities of the National Institutes of Health, the HMSA Foundation Community Fund grant#CF-021803, and the University of Hawai‘i at Manoa Native Hawaiian Student Services ‘Oiwi UndergraduateResearch Fellowship Program.
Acknowledgments: The authors would like to thank Sheila Sugrue, Jessie Kai, Gemady Langfelder and ChristinaGar Lai Young for their research contributions. The authors would also like to thank the study participants andcommunity partners.
Conflicts of Interest: The authors declare no conflict of interest.
Appendix A
Table A1. Multinomial logistic regression results examining the association between food securityindicators and meeting the MDD in infants 6–12 Months (n = 56).
Model 1 B SE p-Value OR 95% CI
Intercept −0.693 0.612 0.258 -Household income <$35,000 1.591 0.709 0.025 4.909 1.223–19.709
Model 2
Intercept 7.650 2.543 0.003 -Age −1.006 0.304 0.001 0.366 0.202−0.663
Household income <$35,000 1.736 0.896 0.053 5.672 0.979–32.855
Model 3
Intercept 8.842 2.905 0.002 -Age −0.994 0.305 0.001 0.370 0.204−0.673Sex −0.800 0.778 0.304 0.449 0.098–2.065
Household income <$35,000 1.647 0.908 0.070 5.191 0.875–30.779
35

Nutrients 2020, 12, 2120
Table A1. Cont.
Model 4
Intercept −0.288 0.540 0.594 -Running out of money for food by the end of the month 1.317 0.654 0.044 3.733 1.037–13.445
Model 5
Intercept 7.751 2.585 0.003 -Age −0.923 0.290 0.001 0.397 0.225−0.701
Running out of money for food by the end of the month 1.037 0.755 0.170 2.820 0.642–12.392
Model 6
Intercept 8.810 2.905 0.002 -Age −0.908 0.289 0.002 0.404 0.229−0.711Sex −0.714 0.750 0.341 0.489 0.113–2.127
Running out of money for food by the end of the month 0.842 0.785 0.283 2.321 0.499–10.803
Model 7
Intercept −0.588 0.558 0.292 -Food security index score 1.723 0.677 0.011 5.600 1.487–21.096
Model 8
Intercept 7.081 2.587 0.006 -Age −0.873 0.288 0.002 0.418 0.238−0.734
Food security index score 1.387 0.775 0.073 4.003 0.877–18.271
Model 9
Intercept 8.039 2.898 0.006 -Age −0.862 0.288 0.003 0.422 0.240−0.743Sex −0.641 0.757 0.397 0.527 0.120–2.323
Food security index score 1.229 0.799 0.124 3.419 0.715–16.356
Model 1–3: food security indicator: Household income <$35,000. Model 4–6: food security indicator: Running outof money for food by the end of the month. Model 6–8: food security indicator: Food security index score. Model 1,4, 7: Food security indicator. Model 2, 5, 8: Food security indicator + age. Model 3, 6, 9: Food security indicator +age + sex.
References
1. Zaslow, M.; Bronte-Tinkew, J.; Capps, R.; Horowitz, A.; Moore, K.A.; Weinstein, D. Food Security DuringInfancy: Implications for Attachment and Mental Proficiency in Toddlerhood. Matern. Child Health 2009, 13,66–80. [CrossRef] [PubMed]
2. Gundersen, C.; Kreider, B. Bounding the effects of food insecurity on children’s health outcomes. J. Health Econ.2009, 28, 971–983. [CrossRef]
3. Schlichting, D.; Hashemi, L.; Grant, C. Infant Food Security in New Zealand: A Multidimensional IndexDeveloped from Cohort Data. Int. J. Environ. Res. Public Health 2019, 16, 283. [CrossRef] [PubMed]
4. Leung, C.W.; Tester, J.M. The Association between Food Insecurity and Diet Quality Varies by Race/Ethnicity:An Analysis of National Health and Nutrition Examination Survey 2011–2014 Results. J. Acad. Nutr. Diet.2019, 119, 1676–1686. [CrossRef] [PubMed]
5. McGuire, S. World Health Organization. Comprehensive Implementation Plan on Maternal, Infant, andYoung Child Nutrition. Geneva, Switzerland, 2014. Adv. Nutr. 2015, 6, 134–135. [CrossRef] [PubMed]
6. Bickel, G.; Mark, N.; Cristofer, P.; William, H.; John, C. Guide to Measuring Household Food Security, Revised2000; U.S. Department of Agriculture, Food and Nutrition Service: Alexandria, VA, USA, 2000.
7. Butcher, L.M.; O’Sullivan, T.A.; Ryan, M.M.; Lo, J.; Devine, A. Utilising a multi-item questionnaire to assesshousehold food security in Australia. Health Promot. J. Aust. 2019, 30, 9–17. [CrossRef]
8. Jones, A.D.; Ngure, F.M.; Pelto, G.; Young, S.L. What Are We Assessing When We Measure Food Security?A Compendium and Review of Current Metrics. Adv. Nutr. 2013, 4, 481–505. [CrossRef]
9. Oberholser, C.A.; Tuttle, C.R. Assessment of Household Food Security among Food Stamp Recipient Familiesin Maryland. Am. J. Public Health 2004, 94, 790–795. [CrossRef]
10. Tomayko, E.J.; Mosso, K.L.; Cronin, K.A.; Carmichael, L.; Kim, K.; Parker, T.; Yaroch, A.L.; Adams, A.K.Household food insecurity and dietary patterns in rural and urban American Indian families with youngchildren. BMC Public Health 2017, 17, 611. [CrossRef]
36

Nutrients 2020, 12, 2120
11. Galinsky, A.M.; Zelaya, C.E.; Simile, C.; Barnes, P.M. Health Conditions and Behaviors of Native Hawaiianand Pacific Islander Persons in the United States, 2014. Vital Health Stat. 2017, 40, 1–99.
12. Katie, M.H.; Laura, J.Y.H.; Courtney, B.J.; Yuka, J.; Martha, R.; Jay, E.M. Food security issues for low-incomeHawaii residents. Asia Pac. J. Public Health 2008, 20, 64–69.
13. Stupplebeen, D.A. Housing and Food Insecurity and Chronic Disease among Three Racial Groups in Hawai’i.Prev. Chronic Dis. 2019, 16, E13. [CrossRef]
14. World Health Organisation. Indicators for Assessing Infant and Young Child Feeding Practices; World HealthOrganisation: Washington, DC, USA, 2008.
15. Ahmad, Z.; Bosch, M.; Khanna, N.; Kerr, D.A.; Boushey, C.J.; Zhu, F.Q.; Delp, E.J. A Mobile Food Recordfor Integrated Dietary Assessment. In Proceedings of the 2nd International Workshop on MultimediaAssisted Dietary Management, MADiMa16 (2016), Amsterdam, The Netherland, 16 October 2016; pp. 53–62.[CrossRef]
16. Zhu, F.; Bosch, M.; Woo, I.; Kim, S.; Boushey, C.J.; Ebert, D.S.; Delp, E.J. The Use of Mobile Devices in AidingDietary Assessment and Evaluation. IEEE J. Sel. Top. Signal Process. 2010, 4, 756–766. [CrossRef]
17. Zhu, F.; Bosch, M.; Khanna, N.; Boushey, C.J.; Delp, E.J. Multiple hypotheses image segmentation andclassification with application to dietary assessment. IEEE J. Biomed. Health Inf. 2015, 19, 377–388. [CrossRef][PubMed]
18. Fang, S.; Shao, Z.; Kerr, D.A.; Boushey, C.J.; Zhu, F. An End-to-End Image-Based Automatic Food EnergyEstimation Technique Based on Learned Energy Distribution Images: Protocol and Methodology. Nutrients2019, 11, 877. [CrossRef] [PubMed]
19. Steyn, N.; Nel, J.; Nantel, G.; Kennedy, G.; Labadarios, D. Food variety and dietary diversity scores inchildren: Are they good indicators of dietary adequacy? Public Health Nutr. 2006, 9, 644–650. [CrossRef][PubMed]
20. Pérez-Escamilla, R.S.-P.S.; Lott, M. Feeding Guidelines for Infants and Young Toddlers: A Responsive ParentingApproach; Healthy Eating Research: Durham, NC, USA, 2017.
21. World Health Organization. Complementary Feeding. Available online: https://www.who.int/nutrition/topics/complementary_feeding/en/ (accessed on 17 February 2020).
22. WHO. Guideline: Vitamin A supplementation in Infants 1–5 Months of Age; World Health Organization: Geneva,Switzerland, 2011.
23. Budree, S.; Goddard, E.; Brittain, K.; Cader, S.; Myer, L.; Zar, H.J. Infant feeding practices in a South Africanbirth cohort-A longitudinal study. Matern. Child Nutr. 2017, 13, e12371. [CrossRef]
24. Peat, J.K.; Belind, B. Medical Statistics: A Guide to SPSS, Data Analysis and Critical Appraisal, 2nd ed.; BMJ Books:Chichester, UK, 2014.
25. Woo, J.G.; Herbers, P.M.; McMahon, R.J.; Davidson, B.S.; Ruiz-Palacios, G.M.; Peng, Y.-M.; Morrow, A.L.Longitudinal Development of Infant Complementary Diet Diversity in 3 International Cohorts. J. Pediatr.2015, 167, 969–974.e1. [CrossRef]
26. Rossen, L.M.; Kobernik, E.K. Food insecurity and dietary intake among US youth, 2007–2010. Pediatr. Obes.2016, 11, 187–193. [CrossRef]
27. Jun, S.; Zeh, M.J.; Eicher-Miller, H.A.; Bailey, R.L. Children’s Dietary Quality and Micronutrient Adequacyby Food Security in the Household and among Household Children. Nutrients 2019, 11, 965. [CrossRef][PubMed]
28. Mauch, C.E.; Perry, R.A.; Magarey, A.M.; Daniels, L.A. Dietary intake in Australian children aged 4–24 months:Consumption of meat and meat alternatives. Br. J. Nutr. 2015, 113, 1761–1772. [CrossRef]
29. Allen, L.H. Global dietary patterns and diets in childhood: Implications for health outcomes. Ann. Nutr. Metab.2012, 61 (Suppl. 1), 29–37. [CrossRef] [PubMed]
30. Hambidge, K.M.; Sheng, X.; Mazariegos, M.; Jiang, T.; Garces, A.; Li, D.; Westcott, J.; Tshefu, A.; Sami, N.;Pasha, O.; et al. Evaluation of meat as a first complementary food for breastfed infants: Impact on ironintake. Nutr. Rev. 2011, 69, S57–S63. [CrossRef] [PubMed]
31. Woo, J.G.; Guerrero, M.L.; Ruiz-Palacios, G.M.; Peng, Y.-m.; Herbers, P.M.; Yao, W.; Ortega, H.; Davidson, B.S.;McMahon, R.J.; Morrow, A.L. Specific infant feeding practices do not consistently explain variation inanthropometry at age 1 year in urban United States, Mexico, and China cohorts. J. Nutr. 2013, 143, 166–174.[CrossRef] [PubMed]
37

Nutrients 2020, 12, 2120
32. Arimond, M.; Ruel, M.T. Dietary Diversity Is Associated with Child Nutritional Status: Evidence from 11Demographic and Health Surveys. J. Nutr. 2004, 134, 2579–2585. [CrossRef] [PubMed]
33. World Health Organisation. Global Nutrition Monitoring Framework: Operational Guidance for Tracking Progressin Meeting Targets for 2025; World Health Organization: Geneva, Switzerland, 2017.
34. Tester, J.M.; Leung, C.W.; Crawford, P.B. Revised WIC Food Package and Childrens Diet Quality. Pediatrics2016, 137, e20153557. [CrossRef] [PubMed]
35. Yen, S.T. The effects of SNAP and WIC programs on nutrient intakes of children. Food Policy 2010, 35, 576–583.[CrossRef]
© 2020 by the authors. Licensee MDPI, Basel, Switzerland. This article is an open accessarticle distributed under the terms and conditions of the Creative Commons Attribution(CC BY) license (http://creativecommons.org/licenses/by/4.0/).
38
nutrients
Article
Prevalence and Predictors of Overweight and Obesityamong Young Children in the Children’s HealthyLiving Study on Guam
Rachael T. Leon Guerrero 1,*, L. Robert Barber 1, Tanisha F. Aflague 1, Yvette C. Paulino 1,
Margaret P. Hattori-Uchima 1, Mark Acosta 1, Lynne R. Wilkens 2 and Rachel Novotny 3
1 Office of Research & Sponsored Programs, University of Guam, Mangilao, Guam 96923, USA;[email protected] (L.R.B.); [email protected] (T.F.A.); [email protected] (Y.C.P.);[email protected] (M.P.H.-U.); [email protected] (M.A.)
2 University of Hawaii Cancer Center, Honolulu, HI 96813, USA; [email protected] College of Tropical Agriculture and Human Resources, University of Hawaii At Manoa, Honolulu, HI 96822,
USA; [email protected]* Correspondence: [email protected]; Tel.: +1-671-735-2170
Received: 12 July 2020; Accepted: 12 August 2020; Published: 20 August 2020
Abstract: This study is part of the Children’s Healthy Living program in U.S. Affiliated Pacificregion. The objectives were to estimate overweight and obesity (OWOB) prevalence and identifypossible related risk factors among ethnic groups in Guam. In 2013, 865 children (2–8 years) wererecruited via community-based sampling from select communities in Guam. Children’s demographicand health behavior information; dietary intake; and anthropometric measurements were collected.Logistic regression, odds ratio, t-tests, and chi-square tests were used to determine differences andassess covariates of OWOB. The results indicate that 58% of children were living below the povertylevel, 80% were receiving food assistance, and 51% experienced food insecurity. The majority ofchildren surveyed did not meet recommendations for: sleep duration (59.6%), sedentary screen-time(83.11%), or fruit (58.7%) and vegetable (99.1%) intake, and consumed sugar sweetened beverages(SSB) (73.7%). OWOB affected 27.4% of children. Children affected by OWOB in this study werestatistically more likely (p= 0.042) to suffer from sleep disturbances (p= 0.042) and consume marginallyhigher amounts (p value = 0.07) of SSB compared to children with healthy weight. Among OtherMicronesians, children from families who considered themselves ‘integrated’ into the culture were2.05 (CI 0.81–5.20) times more likely to be affected by OWOB. In conclusion, the OWOB prevalenceamong 2–8-year-olds in Guam was 27.4%; and compared with healthy weight children, children withOWOB were more likely to have educated caregivers and consume more SSBs. Results provide abasis for health promotion and obesity prevention guidance for children in Guam.
Keywords: child obesity; Guam; Children’s Healthy Living (CHL); islander; Pacific; Micronesia
1. Introduction
Childhood overweight and obesity (OWOB) is a global epidemic affecting many countries [1–5],including the United States (US) and the US Affiliated Pacific region (USAP). In the US a highprevalence of OWOB among racial/ethnic minority groups for children 2–19 years is reported,specifically Non-Hispanic black (19.5%) and Hispanic (21.9%), yet Native Hawaiian or Other PacificIslanders are not included [1,2]. Novotny and colleagues conducted a systematic review of childhoodOWOB in the USAP region and estimated that the prevalence of OWOB for children 2–8 years was21%, and that the prevalence increased to 39% by age 8 [6]. Similarly, the proportion of obese childrenincreased from 10% at age 2 years to 23% at age 8 years, with the highest prevalence of obesity in
Nutrients 2020, 12, 2527; doi:10.3390/nu12092527 www.mdpi.com/journal/nutrients39

Nutrients 2020, 12, 2527
both Guam and American Samoa [6]. The systematic review found that in Guam, OWOB prevalence(39%) among children ages 3 to 5 years [6] exceeded the US national average (23%) for children aged2 to 5 years [1,2].
Guam is a U.S. Territory located in the northwestern Pacific Ocean, approximately 3700 mileswest of Hawaii, 6000 miles west of California, and 1300 miles southeast of Japan. CHamorus are theoriginal inhabitants of Guam [7,8], and are typically grouped with other Pacific Islanders. However,the current population of Guam is characterized by substantial ethnic variation [9]: 37% CHamoru,26% Filipino, 12% other Pacific Islander, 11% other ethnicity, 7% White, and 7% other Asian. This ethnicdiversity evolved through centuries of colonization and migration that continues today [10] and maymodify the burden and predictors of OWOB among CHamorus. Factors related to OWOB are sleep,physical activity, psychosocial, life course exposure, SES, and diet [11,12] that for many racial/ethnicgroups in Guam is influenced by this history [12,13]. OWOB prevalence among adults is higheramong CHamorus compared to other ethnic groups on Guam [11]. In a study among adults in thetwo largest ethnic populations in Guam then (2008) and now, CHamorus and Filipinos, there wasa significant difference in energy density of diets between the two groups, where CHamorus had ahigher energy and added sugar intake [11]. In 2009 and 2010, prevalence of OWOB was highest amongCHamorus followed by Other Micronesians reported in one of the first reports to disaggregate BRFSSdata by ethnicity [14].
Children who are overweight or obese have a higher risk of being overweight or obese adults [15]with an increased risk of chronic diseases later in life [16]. However, there is limited informationabout young children in Guam, and data are needed to understand the burden of and determine theappropriate intervention for childhood OWOB. Therefore, the purpose of this study is to estimate theprevalence of OWOB among children in Guam and identify demographic or other risk factors targetedby the Children’s Healthy Living (CHL) program for overweight and obesity in CHamoru children.
2. Methods
The Children’s Healthy Living Program for Remote Underserved Minority Populations in thePacific Region (CHL) program is a partnership of universities and local organizations across the remoteUSAP (Alaska, American Samoa, Commonwealth of the Northern Marianas, Federated States ofMicronesia, Republic of Marshall Islands, Republic of Palau, Hawaii, and Guam) working to preventchildhood obesity in the Pacific. Detailed information on the study design of the CHL program can befound elsewhere [17,18]. Briefly, approximately 900 children (2–8 years) and their parents/caregiversfrom each participating USAP jurisdiction were recruited to participate in the study at both baselineand 24-month follow-up. On Guam, a total of 865 children were recruited at baseline (2013) and696 children were recruited from the same communities at 24-month follow-up. This paper will focuson baseline data of the 865 children on Guam recruited from communities (Agana Heights, Sinajana,Agat, Santa Rita, Yigo, Yona, Talafofo, and Dededo) selected due to their size, representation ofindigenous (CHamoru) residents, and isolation and cohesiveness (for purpose of intervention) [17].Behavioral targets of the CHL program were increasing sleep, water intake, fruit and vegetable intake,physical activity and decreasing sugar sweetened beverage intake and sedentary behavior [17].
Child participants were recruited primarily at early childhood education centers (e.g., Guam HeadStart program, daycares, and public elementary schools) and community-based settings(e.g., municipal centers and public housing areas) on Guam. Data collection occurred over a minimumof two visits at these recruitment sites. Further details on recruitment is described elsewhere [17,18].Child participants with parents’ consent and who provided assent were assessed.
At the first visit, parents/caregivers completed surveys on demographic information (i.e., child age,place of birth, race/ethnicity, and sex; household composition and food security; parent/caregivereducational level and income); cultural identity of the parent/caregiver; and general health status,early life feeding behaviors, and sedentary screen-time and sleep behavior germane to the child.They also received instructions for completing a two-day food and activity log at home during the
40

Nutrients 2020, 12, 2527
week. Sleep quality was measured with the Tayside Children’s Sleep Questionnaire (TCSQ) [19]and sleep duration [20] was reported by the parent/caregiver as hours asleep at night and duringnaps. Other surveys were adapted from previous studies [17] with some local terminology added forparticipant clarity.
Detailed information was collected in CHL on race/ethnic groups, allowing for multiple groupsto be selected; classification prioritized ethnic groups indigenous to the jurisdiction. On Guam,the indigenous ethnic group is CHamoru [7,8]. If more than one race/ethnicity was indicated for thechild and CHamoru was selected, the child was categorized as CHamoru. If a child identified as notCHamoru and as one of the other Micronesian Pacific Island ethnic groups, such as Chuukese, Palauan,Yapese, Carolinian, Marshallese, or Kosraean, that child was categorized as ‘Other Micronesian’,because the only other Pacific Island ethnic groups identified in the Guam sample were from Micronesiaand not Polynesia (e.g., Native Hawaiians or Samoans). These other Micronesian Pacific Islandergroups were grouped together as their numbers were small and they were all from neighboringMicronesian islands.
Food insecurity was determined by asking one question from the US Department of Agriculture’sCore Food Security Module: “In the past 12 months how often does money for food run out by the endof the month?” (never, seldom, sometimes, most times, always, don’t know, or no response [21]. In thisstudy, options of don’t know or no response were treated as missing values. Household food insecuritywas considered present if the respondent chose sometimes, most times, or always. Parent’s culturalidentity, or “acculturation,” was determined using their responses reported on a cultural affiliationquestionnaire, which assesses one of four modes of acculturation, from two cultural identity subscales(i.e., respondent’s ethnic group and the US): traditional (high ethnic and low US subscale scores),integrated (high ethnic and high US subscale scores), assimilated (low ethnic and high US subscalescores), or marginalized (low ethnic and low US scores) [22]. The same scoring system was used asdescribed by Kaholokula and others [22].
After providing assent, each child was measured for weight, height, and waist circumference (WC)by trained and standardized research staff [23] and described in detail elsewhere [17]. These measureswere used to compute Body Mass Index (BMI) [weight (kg)/height(m)2], WC (cm) to height (cm)ratios, and subsequent BMI z-score, BMI-for-age-percentiles, and waist circumference- for-agepercentiles [24,25]. BMI percentiles and z-scores were calculated according to CDC reference data [26]and BMI categories were assigned accordingly: underweight (<5th percentile), healthy weight(5th–84th percentile), overweight (85th–94th percentile), and obese (≥95th percentile). Children wereconsidered to have OWOB if their BMI percentile was greater than the 85th percentile for age andsex. Cutoff values for biologically implausible values defined as <−5 or >4 standard deviations (SD)for height-for-age z-score and <−4 or >8 SD for BMI z-score (according to CDC reference data) wereremoved from the analysis. Child participants were considered to have abdominal obesity if their WCwas greater than the International Diabetes Federation [27] cut-point.
Fruit, vegetable, and beverage intake were estimated using data recorded in the child’s two-dayfood logs reported by the child’s parent/caregiver and data collection methods are described in detailelsewhere [17]. Parents/caregivers were asked to complete the food log of everything their children ateor drank for two randomly assigned non-consecutive days, which included weekdays and weekenddays, between visit one and two, approximately 6 days apart. Assignment of recording days was basedon the day of the child’s first visit (Monday–Saturday). Parents/caregivers were instructed in recordkeeping techniques with the aid of food models, service ware, and measuring utensils. During visit two,research staff reviewed the food log with the parents/caregivers (e.g., for completeness of food entries,portion size estimation, food preparation methods, and/or accuracy of recording data). Trained staffentered the food log data into the Pacific Tracker3 (PacTrac3), which includes a food compositiondatabase developed in collaboration with the University of Hawaii Cancer Center for use in the Pacificregion [28–30]. For this study, PacTrac3 data were used to classify beverage type (i.e., sugar-sweetenedbeverages (SSB), milk, or water), fruit, and vegetable, as well as, calculate intake (e.g., cups/day,
41

Nutrients 2020, 12, 2527
grams/day). All soft drinks, fruit drinks (fruit flavored or containing less than 100% juice), sports drinks,energy drinks, sweetened tea, and sweetened coffee reported were classified as SSB. Milk intake incups was calculated for food log entries and included all fluid milk (cow and/or goat), chocolate milk,lactose-reduced milk, lactose-free milk, filled milk, dry milk, and evaporated milk. Fruit, vegetable,milk, water, and SSB intake per day was adjusted for within person variance and then averaged overthe two days of records, weighted for weekday and weekend days.
Compensation for study participation was provided at visits one and two [17]. The CHL programwas funded by the United States Department of Agriculture (USDA), Agriculture and Food ResearchInitiative. Ethical approval for this project was granted by both the University of Guam Committeeon Human Research Subjects (IRB) (CHRS#12-74) and the University of Hawaii Institutional ReviewBoard (CHS#18915); written consent was given by all parents and oral assent was given by all childparticipants prior to their inclusion, in accordance with the Declaration of Helsinki.
Statistical analyses were performed using IBM SPSS Statistics version 26 (IBM Corporation,Armonk, NY, USA). Data analysis included the calculation of percentages for ordinal and nominaldata, and means and standard errors for the interval and continuous data. t-tests and chi-square testswere used to test for differences in continuous and categorical variables, respectively, between BMIgroups and ethnic groups. Binary logistic regression models of OWOB assessed its relationship withseveral potential covariates, adjusted for sex, age, and ethnicity and with the variance correctedfor clustering of children within communities. Odds ratios and 95% CI were the primary statisticsreported from the models. ORs were calculated for each of the following child factors from allethnic groups combined and in CHamoru and Other Micronesian children separately: child age, sex,ever breastfed, sleep, sedentary screen-time, vegetable intake, fruit intake, water intake, and SSBintake; and parent/caregiver education, acculturation and marital status; and household income,food insecurity, food assistance, and household size. Does-response was assessed using a trendvariable assigned consecutive integers (1, 2, . . . ) to each ordered category. These factors were selectedamong demographic and lifestyle-related variables because they have been reported to be risk factorsfor OWOB among children [17,25,31,32] and/or were behaviors of interest for the CHL Program.p values < 0.05 were considered statistically significant, whereas p values of 0.05 to 0.10 were describedas borderline significant.
3. Results
3.1. Demographics
The descriptive characteristics of child participants at baseline are summarized by ethnicityin Table 1. The average age of child participants was 5.79 years (sem 0.062). The majority ofchild participants were male (51.7%), 2–5 years old (53.8%), CHamoru ethnicity (64.8%), born onGuam (84.5%), from households where parents were not married (60.7%) or there were 3 or morechildren (76.2%), and considered as being ‘integrated’ (79.9%) as reported by parent/caregiver.
Overall, more than half of participating children (57.9%) came from families whose annual incomewas less than $20,000, which was slightly below the poverty level for a 3-person household in 2015 [33].A significantly higher (p < 0.001) proportion of Other Micronesian children (82.9%) came from familieswhose annual income was less than $20,000 compared to CHamoru (54.2%), Filipino (43.24%) andOther (40%) children. Parents of Filipino children reported significantly higher (p < 0.001) educationattainment levels compared to both CHamoru and Other Micronesians.
3.2. OWOB Prevalence
OWOB prevalence among child participants in this study is 27.4%. A significantly (p = 0.03)higher proportion of Other Micronesian children were affected by obesity (BMI ≥ 95th percentile)compared to CHamoru children (18.3% versus 11.0%) (Table 1).
42

Nutrients 2020, 12, 2527
Ta
ble
1.
Cha
ract
eris
tics
*of
child
part
icip
ants
from
Gua
min
the
Chi
ldre
n’s
Hea
lthy
Livi
ng(C
HL)
Prog
ram
byet
hnic
ity.
To
tal
CH
am
oru
(n=
561)
Oth
er
Mic
ron
esi
an
s(n=
223)
Fil
ipin
o(n=
81)
Oth
er
(n=
10)
pV
alu
e
Ch
ild
Part
icip
an
t
Age
,yea
rs5.
79±0
.062
5.80±0
.078
5.66±0
.123
5.99±0
.062
6.24±0
.670
2–5
year
sol
d46
5(5
3.76
%)
296
(52.
76%
)12
3(5
7.76
%)
42(5
1.85
%)
4(4
0%)
0.41
86–
8ye
ars
old
400
(46.
24%
)26
5(4
7.23
%)
90(4
2.25
%)
39(4
8.14
%)
6(6
0%)
Birt
hpla
ce0.
0001
Gua
m72
3(8
4.46
%)
488
(88.
09%
)17
0(8
0.19
%)
62(7
6.54
%)
3(3
3.33
%)
U.S
.Mai
nlan
d52
(6.0
8%)
36(6
.50%
)9
(4.2
5%)
3(3
.70%
)4
(44.
44%
)Sa
ipan
,CN
MI
34(3
.97%
)28
(5.0
5%)
5(2
.36%
)1
(1.2
4%)
0(0
%)
Oth
erIs
land
sin
Mic
rone
sia
28(3
.27%
)0
(0%
)28
(13.
21%
)0
(0%
)0
(0%
)Ph
ilipp
ines
15(1
.75%
)0
(0%
)0
(0%
)15
(18.
52%
)0
(0%
)O
ther
4(0
.47%
)2
(0.3
6%)
0(0
%)
0(0
%)
2(2
2.22
%)
Ever
Brea
stfe
d?0.
0006
Yes
557
(67.
19%
)34
1(6
2.80
%)
155
(78.
68%
)53
(67.
09%
)8
(80%
)N
o27
2(3
2.81
%)
202
(37.
20%
)42
(21.
32%
)26
(32.
91%
)2
(20%
)C
hild
fed
both
brea
stm
ilk&
infa
ntfo
rmul
a0.
8223
Yes
443
(54.
23%
)29
1(5
4.09
%)
102
(53.
40%
)46
(58.
23%
)4
(44.
45%
)N
o37
4(4
5.77
%)
247
(45.
91%
)89
(46.
60%
)33
(41.
77%
)5
(55.
55%
)C
hild
age
(mon
ths)
whe
nw
eane
dfr
ombr
east
milk
9.76±0
.438
8.63±0
.519
12.4
8±0
.958
8.51
1±1
.165
18.0±3
.928
Ave
rage
Slee
pD
urat
ion
(h/d
)8.
61±0
.078
8.86±0
.086†
7.75±0
.200
8.99±0
.206†
9.05±0
.273
0.00
01TC
SQSl
eep
Scor
e6.
34±0
.205
6.58
3±0
.246
6.01
1±0
.462
15.
231±0
.554
8.00±3
.386
Met
Slee
pR
ecom
men
dati
ons
0.01
36Ye
s34
3(4
0.35
%)
240
(43.
09%
)63
(30.
58%
)35
(43.
75%
)5
(50%
)N
o50
7(5
9.65
%)
317
(56.
91%
)14
3(6
9.42
%)
45(6
5.25
%)
5(5
0%)
Ave
rage
Scre
en-t
ime
(hr/
d)5.
29±0
.132
5.13±0
.154
§5.
45±0
.308
6.24±0
.425
3.59±0
.550
Met
Scre
en-t
ime
Rec
omm
enda
tion
sΩ
0.00
69Ye
s12
4(1
6.89
%)
82(1
6.73
%)
39(2
2.54
%)
3(4
.61%
)0
(0%
)N
o61
0(8
3.11
%)
408
(83.
27%
)13
4(7
7.46
%)
62(9
5.39
%)
6(1
00%
)H
eigh
t(cm
)11
0.56±0
.46
109.
07±0
.59
111.
31±1
.71
112.
98±1
.22
114.
75±5
.03
Wei
ght(
kg)
21.0
5±0
.25
20.7
8±0
.31
21.5
0±0
.54
21.5
5±0
.72
22.4±2
.44
Body
Mas
sIn
dex
(kg/
m2 )
16.8
4±0
.11
16.7
7±0
.14
17.0
9±0
.43
16.6
5±0
.27
16.4
2±0
.61
BMIz
-sco
re0.
402±0
.039
0.35
2±0
.048†
0.54
4±0
.08
0.39
5±0
.132
0.18
9±0
.284
0.03
97BM
ICat
egor
ies
ß
Und
erw
eigh
t25
(2.9
6%)
18(3
2.91
%)
4(1
.93%
)3
(3.7
5%)
0(0
%)
0.69
45H
ealt
hyw
eigh
t59
5(7
0.49
%)
392
(71.
66%
)14
4(6
9.56
%)
51(6
3.75
%)
8(8
0%)
0.45
23O
verw
eigh
t,%
(≥85
th%
ile)
113
(13.
39%
)77
(14.
08%
)21
(10.
14%
)14
(17.
50%
)1
(10%
)0.
3385
Obe
sity
,%(≥
95th
%ile
)11
1(1
3.15
%)
60(1
0.97
%)
38(1
8.36
%)
12(1
5.0%
)1
(10%
)0.
0314
OW
OB
byA
ge2–
5ye
ars
old
107
(23.
94%
)59
(20.
85%
)32
(26.
89%
)16
(39.
02%
)0
(0%
)0.
0378
6–8
year
sol
d11
7(2
9.47
%)
78(2
9.54
%)
27(3
0.68
%)
10(2
5.64
%)
2(3
3.33
%)
0.94
41W
aist
Cir
cum
fere
nce
(cm
)55
.07±0
.30
54.7
6±0
.38
55.4
4±0
.58
56.1
04±0
.95
55.6
4±2
.50
43

Nutrients 2020, 12, 2527
Ta
ble
1.
Con
t.
To
tal
CH
am
oru
(n=
561)
Oth
er
Mic
ron
esi
an
s(n=
223)
Fil
ipin
o(n=
81)
Oth
er
(n=
10)
pV
alu
e
Ch
ild
Part
icip
an
t
Abd
omin
alO
besi
ty€
0.67
82Ye
s76
(8.9
4%)
48(8
.77%
)17
(7.9
8%)
10(1
2.50
%)
1(1
0%)
No
774
(91.
06%
)49
9(9
1.23
%)
196
(92.
02%
)70
(87.
5%)
9(9
0%)
Con
sum
edSS
B?0.
0001
Yes
497
(74.
74%
)36
1(8
1.49
%)
95(6
1.29
%)
36(5
9.01
%)
5(5
0%)
No
168
(25.
26%
)82
(18.
51%
)60
(38.
71%
)25
(40.
99%
)5
(50%
)Be
vera
geC
onsu
mpt
ion‡,¶
Wat
er(c/d
)1.
47±0
.048
1.30
6±0
.45
1.29
8±0
.66
1.40
1±0
.105
1.52
2±0
.429
Milk
(c/d
)1.
241±0
.024
1.28
0±0
.029†,§
1.02
8±0
.045
1.45
4±0
.081†
1.66
0±0
.139
Suga
r-sw
eetd
rink
s(c/d
)0.
845±0
.029
0.95
8±0
.036†,§
,‡0.
560±0
.050
Ø0.
727±0
.101
1.09
5±0
.269
Frui
tCon
sum
ptio
n‡ (
c/d)
0.88
2±0
.021
0.88±0
.025
0.84
6±0
.045
0.95
6±0
.080
1.15
3±0
.240
Vege
tabl
eC
onsu
mpt
ion‡,¶
(c/d
)0.
609±0
.013
0.64
8±0
.015
0.47
2±0
.026
0.65
1±0
.041
0.85
0±0
.139
Met
Rec
omm
enda
tion
for:
Frui
tInt
ake
257
(41.
35%
)18
2(4
1.08
%)
63(4
0.65
%)
27(4
4.26
%)
3(5
0%)
0.93
12Ve
geta
ble
Inta
ke6
(0.9
0%)
5(1
.13%
)1
(0.6
5%)
0(0
%)
0(0
%)
0.80
64
Pare
nt/
Care
giv
er/
Ho
use
ho
ld
Ann
ualF
amily
Inco
me
Leve
l0.
0001
<$2
0,00
034
8(5
7.91
%)
220
(54.
18%
)92
(82.
88%
)32
(43.
24%
)4
(40%
)$2
0,00
0–$3
4,99
918
2(1
4.81
%)
59(1
4.53
%)
9(8
.11%
)17
(22.
97%
)4
(40%
)$3
5,00
0–$5
9,99
993
(15.
47%
)71
(17.
49%
)5
(4.5
1%)
17(2
2.97
%)
0(0
%)
>$6
0,00
071
(11.
81%
)56
(13.
80%
)5
(7.2
0%)
8(1
0.82
%)
2(2
0%)
Rec
eivi
ngan
yFo
odA
ssis
tanc
e0.
0001
Yes
676
(80.
38%
)44
7(8
1.57
%)
176
(86.
70%
)47
(58.
75%
)6
(60%
)N
o16
5(1
9.62
%)
101
(18.
43%
)27
(13.
30%
)33
(41.
25%
)4
(40%
)Ty
peof
Food
Ass
ista
nce
SNA
P∂
585
(67.
85%
)40
1(7
1.61
%)
146
(69.
19%
)33
(40.
74%
)5
(50%
)0.
0001
Loca
lFoo
dBa
nk10
1(1
1.72
%)
69(1
2.32
%)
28(1
3.27
%)
4(4
.94%
)0
(0%
)0.
1319
WIC∞
274
(31.
79%
)16
2(2
8.93
%)
86(4
0.76
%)
22(2
7.16
%)
4(4
0%)
0.01
14Fr
eeSc
hool
Lunc
h/Br
eakf
ast
248
(28.
77%
)20
2(3
6.07
%)
33(1
5.64
%)
10(1
2.35
%)
3(3
0%)
0.00
01Fo
odIn
secu
rity
δ0.
0001
Alw
ays/
mos
ttim
es12
7(1
6.82
%)
86(1
7.20
%)
32(1
8.71
%)
7(9
.46%
)2
(20%
)So
met
imes
262
(34.
70%
)12
8(2
5.6%
)96
(56.
16%
)35
(47.
29%
)3
(30%
)Se
ldom/n
ever
366
(48.
48%
)28
6(5
7.20
%)
43(2
5.15
%)
32(4
3.24
%)
5(5
0%)
Pare
nt/C
areg
iver
Educ
atio
n0.
0001
<12
thG
rade
281
(32.
48%
)18
4(3
2.80
%)
79(3
7.08
%)
17(2
0.98
%)
1(1
0%)
12th
Gra
de/G
ED35
1(4
0.58
%)
237
(42.
24%
)97
(45.
54%
)13
(16.
05%
)4
(40%
)So
me
colle
geor
high
er23
3(2
6.94
%)
140
(24.
96%
)37
(17.
38%
)32
(62.
97%
)5
(50%
)Pa
rent
Mar
ital
Stat
us0.
0001
Mar
ried
340
(39.
31%
)19
0(3
3.89
%)
90(4
2.25
%)
55(6
7.90
%)
5(5
0%)
Not
Mar
ried
525
(60.
69%
)37
1(6
6.13
%)
123
(57.
75%
)26
(32.
10%
)5
(50%
)N
umbe
rC
hild
ren
inH
ouse
hold
4.19±0
.077
4.29±0
.096
§4.
35±0
.164
§3.
14±0
.151
3.4±0
.306
0.00
01
44

Nutrients 2020, 12, 2527
Ta
ble
1.
Con
t.
To
tal
CH
am
oru
(n=
561)
Oth
er
Mic
ron
esi
an
s(n=
223)
Fil
ipin
o(n=
81)
Oth
er
(n=
10)
pV
alu
e
Ch
ild
Part
icip
an
t
Hou
seho
ldSi
ze0.
008
1–2
child
ren
205
(23.
78%
)12
7(2
2.72
%)
48(2
2.64
%)
29(3
5.80
%)
1(1
%)
3–4
child
ren
341
(39.
56%
)22
0(3
9.36
%)
75(3
5.38
%)
39(4
8.15
%)
7(7
0%)
5or
mor
ech
ildre
n31
6(3
6.66
%)
212
(37.
92%
)89
(41.
98%
)13
(16.
05%
)2
(20%
)A
ccul
tura
tion
γ0.
0565
Inte
grat
ed57
2(7
9.89
%)
388
(80.
15%
)12
3(7
5.00
%)
55(8
8.71
%)
6(1
00%
)Tr
adit
iona
l10
1(1
4.11
%)
74(1
5.29
%)
24(1
4.63
%)
3(4
.84%
)0
Ass
imila
ted
17(2
.37%
)7
(1.4
5%)
7(4
.27%
)3
(4.8
3%)
0M
argi
naliz
ed26
(3.6
3%)
15(3
.10%
)10
(6.1
0%)
1(1
.61%
)0
*Fr
eque
ncy
num
ber
(%),
¶M
ean±s
tand
ard
erro
r,‡ C
onsu
mpt
ion
incu
ps/d
ay,w
eigh
ted
for
wee
kday/w
eeke
ndda
ysan
dad
just
edfo
rw
ithi
npe
rson
vari
ance
,†Si
gnifi
cant
ly(p<
0.05
)diff
eren
tfro
mO
ther
Mic
rone
sian
s§
Sign
ifica
ntly
(p<
0.05
)diff
eren
tfro
mFi
lipin
o,Ø
Sign
ifica
ntly
(p<
0.05
)diff
eren
tfro
mO
ther
,Sl
eep
Rec
omm
enda
tions
:atl
east
11h/
dfo
r2-
year
-old
s,at
leas
t10
h/d
for
3to
5ye
ar-o
lds,
and
atle
ast9
h/d
for
6to
10ye
ar-o
lds,
ΩSc
reen
-tim
eR
ecom
men
dati
onof
2h/
dor
less
,ßBM
Iper
cent
iles
calc
ulat
edac
cord
ing
toC
DC
refe
renc
eda
taan
dca
tego
ries
assi
gned
as:u
nder
wei
ght(<
5th
perc
enti
le),
heal
thy
wei
ght(
5th–
84th
perc
enti
le),
over
wei
ght(
85th
–94t
hpe
rcen
tile
),an
dob
ese
(95t
hpe
rcen
tile
),€
Abd
omin
alob
esit
yd
efine
das
wai
stci
rcum
fere
nce
grea
ter
than
the
Inte
rnat
iona
lDia
bete
sFe
der
atio
ncu
t-po
int(>
90.2
perc
enti
lefo
rag
ean
dse
x),∂
USD
ASu
pple
men
talN
utri
tion
Ass
ista
nce
Pro
gram
(SN
AP)
,∞U
SDA
Supp
lem
enta
lNut
ritio
nA
ssis
tanc
ePr
ogra
mfo
rW
omen
,Inf
ants
,and
Chi
ldre
n(W
IC),
δQ
uest
ion
from
USD
AC
ore
Food
Secu
rity
Mod
ule
“In
the
past
12m
onth
sho
wof
ten
does
mon
eyfo
rfo
odru
nou
tby
the
end
ofth
em
onth
?γ
Wha
tcat
egor
yof
accu
ltur
atio
ndo
esfa
mily
cons
ider
them
selv
es?
45

Nutrients 2020, 12, 2527
Table 2 shows child participant characteristics by weight status for all ethnic groups combined, andfor CHamorus and Other Micronesians separately. Children affected by OWOB reported statisticallyhigher body size parameters as measured by height, weight, WC, BMI, and BMI z-scores, compared tohealthy weight children. All children with abdominal obesity, as defined by the International DiabetesFederation [27], were OWOB. Among children in the OWOB weight status, 33.8% had abdominalobesity by this cut-point. It is worth noting that the International Diabetes Federation cut-point isfor older children (6–10 years old) and is limited in identifying younger children (2–5 years) withabdominal obesity.
Table 2. Characteristics of child participants from Guam in the Children’s Healthy Living (CHL)Program stratified by BMI status.
Participant & FamilyCharacteristics
Total Mean ± SEor n(%)
Healthy Weight *Mean ± SE or n (%)
OWOB * Mean ± SEor n (%)
p Value
Age 0.0692–5 years old 437 (53.2%) 329 (55.1%) 108 (48%)6–8 years old 385 (46.8%) 268 (44.9%) 117 (52%)
Sex 0.917Boys 425 (51.7%) 308 (51.6%) 117 (52.0%)Girls 397 (48.3%) 289 (48.4%) 108 (48.0%)
Child Ethnicity 0.455CHamoru 528 (64.55%) 392 (65.88%) 137 (61.16%)
Other Micronesians 203 (24.82%) 144 (24.20%) 59 (26.34%)Filipino 77 (9.41%) 51 (8.57%) 26 (11.61%)Other 10 (1.22%) 8 (1.34%) 2 (0.89%)
Annual Family Income Level 0.473<$20,000 331 (57.6%) 234 (56.9%) 97 (59.1%)
$20,000–$34,999 86 (15%) 63 (15.3%) 23 (14%)$35,000–$59,999 89 (15.5%) 60 (14.6%) 29 (17.7%)>$60,000 69 (12%) 54 (13.1%) 15 (9.1%)
Receiving any Food Assistance 0.768Yes 645 (78.5%) 470 (78.7%) 175 (77.8)No 177 (21.5%) 127 (21.3%) 50 (22.2%)
Type of Food AssistanceSNAP 556 (67.9%) 408 (68.7%) 148 (65.8%) 0.426
Local Food Bank 99 (12.15%) 72 (72.7%) 27 (27.3%) 0.977WIC 258 (31.5%) 196 (33.0%) 62 (27.6%) 0.135
Free School Lunch/Breakfast 238 (29.1%) 169 (28.5%) 69 (30.7%) 0.533Food Insecurity 0.566
Always/most times 120 (16.7%) 88 (16.8%) 32 (16.3%)Sometimes 253 (35.2%) 178 (34%) 75 (38.3%)
Seldom/never 346 (48.1%) 257 (49.1%) 89 (45.4%)Parent/Caregiver Education 0.052
<12th Grade 269 (32.7%) 207 (34.7%) 62 (27.6%)12th Grade/GED 331 (40.3%) 241 (40.4%) 90 (40%)
Some college or higher 222 (27%%) 149 (25%) 73 (32.4%)Parent Marital Status 0.06
Married 326 (39.7%) 225 (37.7%) 101 (44.9%)Not Married 496 (60.3%) 372 (62.3%) 124 (55.1%)
Number Children inHousehold 4.19 ± 0.077 4.19 ± 0.094 4.22 ± 0.152 0.838
Household Size 0.4911–2 children 197 (24.1%) 145 (24.4%) 52 (23.1%)3–4 children 319 (38.9%) 224 (37.7%) 95 (42.2%)
5 or more children 303 (37%) 225 (37.9%) 78 (34.7%)Birthplace 0.0070
Guam 685 (84.46%) 505 (85.45%) 180 (81.45%)U.S. Mainland 52 (6.41%) 37 (6.26%) 15 (6.79%)Saipan, CNMI 31 (3.82%) 20 (3.38%) 13 (5.88%)
Other Islands in Micronesia 25 (3.08%) 21 (3.55%) 4 (1.81%)Philippines 13 (1.60%) 8 (1.35%) 5 (2.26%)
Other 4 (0.49%) 1 (0.17%) 4 (1.82%)
46

Nutrients 2020, 12, 2527
Table 2. Cont.
Participant & FamilyCharacteristics
Total Mean ± SEor n(%)
Healthy Weight *Mean ± SE or n (%)
OWOB * Mean ± SEor n (%)
p Value
Acculturation 0.2913Integrated 542 (80.30%) 394 (79.60%) 148 (82.22%)Traditional 94 (13.78%) 72 (14.54%) 21 (12.14%)Assimilated 17 (2.52%) 10 (2.02%) 7 (3.89%)
Marginalized 23 (3.41%) 19 (3.84%) 4 (2.22%)Ever Breastfed? 0.2140
Yes 529 (64.59%) 373 (66.13%) 156 (70.59%)No 256 (35.41%) 191 (33.87%) 65 (29.41%)
Exclusively Breastfed? 0.5655Yes 97 (13.13%) 68 (12.69%) 29 (14.29%)No 642 (86.87%) 468 (87.13%) 174 (85.71%)
Child age (mos) when weanedfrom breastmilk
9.76 ± 0.438(n = 495) 10.22 ± 0.542 9.23 ± 0.844 0.3248
Child fed both breastmilk &infant formula 0.5135
Yes 421 (54.39%) 300 (53.67%) 121(56.28%)No 353 (45.61%) 259 (44.33%) 94 (43.72%)
Average Sleep Duration (h/d) 8.62 ± 0.08 8.64 ± 0.096 8.59 ± 0.142 0.7122TCSQ Sleep Score 6.34 ± 0.205 6.55 ± 0.257 5.59 ± 0.341 0.0421
Met Sleep Recommendations 0.725Yes 327 (40.4%) 236 (40%) 91 (41.4%)No 483 (59.6%) 354 (60%) 129 (58.6%)
Average Screen-time (h/d) 5.26 ± 0.132 5.15 ± 0.150 5.55 ± 0.270 0.1743Met Screen-time
Recommendations 0.444
Yes 117 (16.8%) 82 (16.2%) 35 (18.6%)No 578 (83.2%) 425 (83.8%) 153 (81.4%)
Height (cm) 110.52 ± 0.47 108.71 ± 0.528 115.34 ± 0.912 0.0001Weight (kg) 21.26 ± 0.26 18.77 ± 0.185 27.91 ± 0.635 0.0001BMI, kg/m2 16.95 ± 0.11 15.64 ± 0.038 20.45 ± 0.280 0.0001BMI z-score 0.485 ± 0.036 0.007 ± 0.026 1.79 ± 0.045 0.0001
Waist Circumference (cm) 55.07 ± 0.457 51.93 ±0.188 64.40 ± 0.707 0.0001Abdominal Obesity 0.0001
Yes 75 (9.2%) 0 (0%) 75 (33.60%)No 741 (90.8%) 591 (100%) 148 (66.40%)
Beverage Consumption ‡Water (c/d) 1.31 ± 0.035 1.32 ± 0.043 1.28 ± 0.070 0.5793Milk (c/d) 1.24 ± 0.24 1.25 ± 0.028 1.21 ± 0.048 0.5994
Sugar-sweetened drinks (c/d) 0.84 ± 0.03 0.81 ± 0.34 0.93 ± 0.061 0.0676Vegetable Intake ‡ (c/d) 0.61 ± 0.013 0.60 ± 0.015 0.63 ± 0.027 0.2535
Fruit Intake ‡ (c/d) 0.88 ± 0.021 0.87 ± 0.025 0.89 ± 0.040 0.7324Met Recommendation for:
Fruit Intake 257 (41.35%) 185 (39.96%) 79 (46.20%) 0.1571Vegetable Intake 6 (0.90%) 4 (0.86%) 2 (1.17%) 0.7242
* Healthy weight defined as BMI between 5th–84th percentile for age and sex; ‘OWOB’ defined as BMI greater than85th percentile for age and sex, ‡ Consumption in cups/day, weighted for weekday/weekend days and adjusted forwithin person variance.
There were no significant differences in the presence of OWOB among children by sex, ethnicity,family income, food insecurity, food assistance, acculturation, screen-time, sleep duration, or intake offruits, vegetables, water, or milk. OWOB children consumed marginally higher amounts (p value = 0.07)of SSB compared to healthy weight children. There were significant differences in the presence ofOWOB among children by certain demographic characteristics, such as parent/caregiver educationlevel, parent/caregiver marital status, and child birthplace (Table 2).
To explore further the relationship between the behavioral factors of interest and OWOB, wecalculated ORs separately for CHamorus and Other Micronesians, the two largest ethnic groups inthe study (Table 3). Among CHamoru children, those who were older (6–8 years) were 1.63 timesmore likely to be affected by OWOB than younger children (2–5 years). The highest prevalence ofOWOB was seen among Filipino children (33.8%), followed by Other Micronesian children (28.9%),and CHamoru children (26.0%). OWOB was also more likely to occur among children ages 6–8 years
47

Nutrients 2020, 12, 2527
(30.4%) versus children between the ages of 2–5 years (24.7%). No significant associations were foundexcept that association between OWOB and SSB intake, and OWOB and parent education level.
Table 3. Prevalence and Odds of OWOB among child participants from Guam in the Children’s HealthyLiving (CHL) Program.
Variable n % OWOB † (95% CI) Adjusted OR †† (95% CI)
Overall 822 27.4 (24.3–30.4)Child Characteristics
SexMales 425 27.5 (23.3–31.8) Referent
Females 397 27.2 (22.8–31.6) 1.001 (0.734–1.366)Age
2–5 years 437 24.7 (20.7–28.8) Referent6–8 years 385 30.4 (25.8–35.0) 1.337 (0.982–1.821)
EthnicityCHamoru 531 26.0 (22.3–29.7) Referent
Other Micronesians 204 28.9 (22.7–35.2) 1.186 (0.824–1.706)Filipino 77 33.8 (23.0–44.6) 1.454 (0.870–2.430)Other 10 20.0 (−10.2–50.2) 0.693 (0.144–3.329)
Child was breastfed?Yes 530 29.4 (25.5–33.3) 1.212 (0.861–1.708)No 258 25.6 (20.2–30.9) Referent
Child met sleep standard for his/her age group?Yes 327 27.8 (23.0–32.7) 0.994 (0.717–1.378)No 483 26.7 (22.8–30.7) Referent
Child met recommendation for screen-time of ≤ 2 h/day?Yes 117 29.9 (21.5–38.3) 1.184 (0.757–1.851)No 578 26.5 (22.9–30.1) Referent
Child met recommendation for vegetable intake for his/her age group?Yes 6 33.3 (−20.9–87.5) 1.342 (0.236–7.649)No 628 26.9 (23.4–30.4) Referent
Child met recommendation for fruit intake for his/her age group?Yes 264 29.9 (24.4–35.5) 1.274 (0.89–1.823)No 370 24.9 (20.4–29.3) Referent
SSB beverage intake ‡ (cups/day)(zero intake—referent) 160 21.3 (14.8–27.7) Referent
Tertile 1 (≤0.42) 54 33.3 (20.4–46.3) 2.064 (1.024–4.160)Tertile 2 (0.42–1.09) 208 26.4 (20.4–32.5) 1.495 (0.90–2.485)
Tertile 3 (≥1.09) 212 30.2 (24.0–36.4) 1.824 (1.106–3.007)p-value for trend 0.022
Water beverage intake ‡ (cups/day)(zero intake—referent) 26 30.8 (11.8–49.8) Referent
Tertile 1 (≤0.92) 195 26.2 (19.9–32.4) 0.827 (0.333–2.057)Tertile 2 (0.92–1.62) 201 28.4 (22.1–34.6) 0.965 (0.388–2.401)
Tertile 3 (≥1.62) 212 25.9 (20.0–31.9) 0.819 (0.330–2.033)p-value for trend 0.597
Parent/Caregiver/Household CharacteristicsEducation Level
Less than 12th grade (use this asreference) 269 23.1 (18.0–28.1) Referent
12th grade/GED or higher 553 29.5 (25.7–33.3) 1.415 (1.004–1.994)Marital Status
Married 326 31.0 (25.9–36.0) ReferentNot married 496 25.0 (21.2–28.8) 0.776 (0.564–1.067)
Annual household income<$20,000 331 29.3 (24.4–34.2) Referent
$20,000–$34,999 86 26.7 (17.2–36.3) 0.867 (0.501–1.502)$35,000–$59,999 89 32.6 (22.7–42.5) 1.121 (0.664–1.892)
$60,000+ 69 21.7 (11.8–31.7) 0.600 (0.315–1.143)Food Insecurity
Yes 120 26.7 (18.6–34.7) 0.982 (0.627–1.539)No 599 27.4 (23.8–31.0) Referent
48

Nutrients 2020, 12, 2527
Table 3. Cont.
Variable n % OWOB † (95% CI) Adjusted OR †† (95% CI)
Receiving any food assistanceYes 645 27.1 (23.4–30.6) 1.027 (0.699–1.509)No 177 28.3 (21.6–35.0) Referent
Number of children in household1–2 children 197 26.4 (20.2–32.6) Referent3–4 children 319 29.8 (24.7–34.8) 1.18 (0.789–1.766)
5 or more children 303 25.7 (20.8–30.7) 0.948 (0.622–1.446)Acculturation—Family considers themselves ‘integrated’ into culture
Yes 545 27.3 (23.6–31.1) 1.162 (0.747–1.81)No 134 24.6 (17.2–32.0) Referent
†‘ Underweight’ children excluded from analysis, †† Adjusted for clustering by community, age, sex, and ethnicity,‡ Consumption in cups/day, weighted for weekday/weekend days and adjusted for within person variance.
3.3. Nutrition Factors
The majority of child participants (80.4%) were receiving some sort of food assistance,including USDA Supplemental Nutrition Assistance Program (SNAP) (67.8%), USDA SupplementalNutrition Assistance Program for Women, Infants, and Children (WIC) (31.8%), free or reduced schoollunch/breakfast (28.8%), and/or assistance from a local food bank (11.7%). Food insecurity was alsoprevalent as 51.5% of participants reported that food money ran out at the end of the month eitheralways/most times (16.8%) or sometimes (34.7%). Significantly more (p < 0.001) Other Micronesianchild participants (74.9%) reported that food money ran out at least sometimes compared to CHamoru(42.8%), Filipino (53.7%) and Other (50%) children.
As for OWOB risk factors and CHL related nutrition behaviors, majority of children did not meetrecommendations for fruit (58.7%) and vegetable (99.1%) intake and consumed SSB (73.7%). Fruit andvegetable intake did not differ significantly by ethnicity (Table 1) or by the presence of OWOB (Table 2).Mean intake of vegetables was low (0.61 c/d) and only 6 children surveyed (0.09%) consumed therecommended amount of vegetables daily, which equates to ≥1 cup equivalent for children 2 years oldand ≥1.5 cup equivalent for children 3–8 years old [34–36]. Mean intake of fruits was somewhat better(0.88 c/d) and more children (41.3%) reported consuming the recommended amount of fruits daily,which equates to ≥1.5 cup equivalent for children 2–8 years old [34].
When asked if the child participant was ever breastfed as a baby, about two-thirds (67%) of allparents/caregivers responded yes. Only 13.1% of children were exclusively breastfed (not shown intable), while 54.2% of children surveyed were fed both breastmilk and infant formula as an infant.CHamoru children (21.32) reported being significantly less likely to be ever breastfed compared toOther Micronesian children (37.2%). Of those children who were ever breastfed, Other Micronesianchildren were weaned at a significantly older age (12.48 m) compared to children from other ethnicgroups. Breastfeeding during infancy, whether exclusive or mixed with infant formula feeding did notdiffer by the presence of OWOB. Age at weaning also did not differ by presence of OWOB. Among thosewho were exclusively breastfed, mean age at weaning was significantly higher compared to mixed fedinfants (19.27 ± 1.19 m versus 7.56 ± 0.04 m). Risk of OWOB increased significantly with SSB intake.The relationship between presence of OWOB and increasing SSB intake was not monotonic, the ORs(95% CI) for SSB intake for the tertile groups for consumers compared to those with zero intake of SSBwere 2.06 (1.02–4.16), 1.50 (0.90–2.48), and 1.82 (1.11–3.01). Only 25% of children surveyed consumedthe recommended amount of “zero intake” of SSB [37], and one-third of child participants consumedat least 1.1 cups of SSB per day. Correlation analysis showed that SSB intake was positively andsignificantly associated with BMI and waist circumference. Among CHamoru children, the relationshipbetween SSB intake and body size was stronger, as SSB intake among CHamoru children was positivelyand significantly associated with BMI (r = 0.18, p = 0.0002), waist circumference (r = 0.16, p = 0.0007),and BMI z-score (r = 0.11, p = 0.023). In Table 3, although SSB intake was not significantly associatedwith OWOB for Other Micronesian children, it was significant for CHamoru children. The relationship
49

Nutrients 2020, 12, 2527
again was not monotonic, the ORs (95% CI) for SSB intake for the tertile groups of consumers comparedto those with zero intake of SSB were 3.15 (1.1–9.08), 2.84 (1.28–6.30) and 3.19 (1.46–6.95).
3.4. Sleep and Screen-Time
Less than half of all children surveyed (40.4%) met the sleep duration recommendations [20];those recommendations being at least 8–11 h/day for children under the age of 5 years, and 8–10 hper day for children 5 years and older. Sleep duration did not differ by the presence of OWOB,yet we observed TCSQ sleep quality scores (Table 2) were significantly lower (p = 0.0421) amongchildren affected by OWOB compared to children with healthy weight (5.59 ± 0.34 versus 6.55 ± 0.26,respectively), meaning that children with OWOB were statistically more likely to suffer from sleepdisturbances. Only 30.58% of Other Micronesian children met sleep recommendations (Table 1),which was significantly (p = 0.014) less than children from other ethnic groups. Other Micronesianchildren reported TCSQ sleep quality scores that were lower (p = 0.056) compared to children from theother ethnic groups.
The recommended daily screen-time for children is less than 2 h per day [38]. Only one sixth of thechildren surveyed (16.9%) met this recommendation and meeting screen-time recommendations didnot differ between healthy weight children and children affected by OWOB. Average screen-time wasslightly more than 5 h per day. When comparisons were made across four ethnic groups, there was asignificant difference (p = 0.007) in the proportion of children that met the screen-time recommendation:CHamorus (16.7%), Other Micronesian (22.5%), Filipinos (4.6%), and Other (0%). There was also asignificant difference in the average daily screen-time among the ethnic groups: CHamorus (5.13 h),Other Micronesians (5.45 h), Filipinos (6.24 h), and Other (3.59 h) (Table 1).
3.5. Acculturation
The majority of study participants (80%) considered their cultural affiliation as integrated, meaninga bicultural orientation where the respondent retains their ethnic cultural identity at the same timemoving to join the dominant society (i.e., the US) [22,39]. About 15% of both CHamorus and OtherMicronesians considered their cultural affiliation traditional, where the respondent retains their ethnicidentity and does not recognize or identify with cultural characteristics of the US [22,39]. The OtherMicronesians (6.1%) were most likely of all ethnic groups represented in this study to report havingmarginalized cultural affiliation, meaning the respondent does not maintain his/her ethnic culturalcharacteristics and excludes or withdraws him/herself from the dominant society (i.e., the U.S.) [22,39].Acculturation did not differ by the presence of OWOB (Table 2). However, we observed that amongOther Micronesians, children from families who considered their cultural affiliation as integrated intothe culture were 2.05 times more likely to be affected by OWOB (CI 0.81–5.20) (Table 3).
4. Discussion
Pacific Islanders were one of the fastest growing racial/ethnic groups in the US in 2000 to2010 [40], but little is known about OWOB for young children (under 11 year) in the Pacific region [41].The current prevalence of OWOB in the US is 25% among children between 2–5 years and 32.8%among children between 6–8 years [42]. Findings in this current study on Guam were consistentwith previous reports [43] and similar to the US. Unlike previous reports, this study revealed ethnicdifferences in OWOB presence among children in Guam. Filipino and Other Micronesian had thehighest OWOB (33%) and obesity (18%) prevalence compared to other children in Guam.
Some recent studies have shown that obesity among various Pacific Islander groups, such asSamoans, may be linked to specific genes influencing adiposity [40,41,44]; and Pacific Islanders ofPolynesian, Micronesian, and Melanesian origin may all carry certain alleles associated with higherbody weight, BMI, and risk of obesity [41,45]. Waist circumference-to-height ratio (WHR) and WChave been used as markers of body adiposity in adults and, in children and adolescents (8–18 years),WHR was determined to be better at predicting adiposity [46–48]. One third of this study’s participants
50

Nutrients 2020, 12, 2527
(33.8%) were observed to have both, abdominal obesity and OWOB. On the other hand, healthy weightchildren did not have abdominal obesity (0%). This aligns with other studies that found adiposityindicators, like WC, were associated with being overweight [47]. This is alarming as the location anddistribution of body fat are associated with cardiovascular and other disease risks that is likely tocontinue into adulthood [49–51].
Given the steady rise in obesity over the past few decades on a global scale, environmental(macro and micro) factors promoting obesity are a more likely predominant explanation for racial/ethnicdisparities in childhood obesity [52], such as the increase in obesity seen on Guam and other islands inthe Pacific. A majority of children in this study exhibited several behaviors that are obesity risk factorssuch as low intake of fruits and vegetables, high intake of SSB, low sleep duration, and high amountsof sedentary screen-time [52].
From the micro-environment of children, which includes their families and households, in thisstudy, the majority of child participants came from households where their parent/caregivers wereunmarried (60.7%) and with at least three or more children (76.2%). Those two factors, compounded bythe fact that most of the parents in this study also reported low annual incomes, can lead to anunfavorable home environment. Research shows that family and home environments, whether directlyor indirectly, may contribute to the development of child OWOB [53–55], possibly through maternaldepression and stress. Further study and more specific questions regarding parent/caregiverpsychological health is needed to determine impact of family environment on the presence ofOWOB among children in Guam.
Surprisingly, 59.65% of the children surveyed did not meet the recommended sleep durationfor their age. Research indicates that short sleep duration puts children at risk for obesity and othermetabolic, cardiovascular, and behavior disorders [56–58]. This study did not find sleep durationto differ significantly between children with OWOB and those with healthy weight, possibly dueto misinterpretation of the question on sleep duration. Given some of the very low reported levelsof sleep hours per day for some of the children and limited English comprehension of the islanderparents/caregivers, it is possible that nap times during the day may have been the reported time,rather than sleep over the 24-h period. Future studies should separate questions for nap time sleep fromnight sleep in determining USAP children’s sleep duration and include more qualitative non-subjectivemeasurements for sleep duration. In terms of sleep quality, children affected by OWOB in this studywere statistically more likely to suffer from sleep disturbances. This aligns with the research linkingpoor sleep quality with OWOB and an increased risk for cognitive and behavioral problems [56–58].Research also links reduced sleep quality with high SSB intake, and in bed screen-time [59].
The proportion of children exceeding screen-time recommendation in this study (83%) wascomparable to the 87% reported among a prospective birth cohort of children born in New York ledby researchers from the NIH Eunice Kennedy Shriver National Institute of Child Health and HumanDevelopment [60]; however, the birth cohort included children below two years of age, which is an agegroup not represented in the Guam study. Additionally, while screen-time increased with preschoolage in the birth cohort, the total hours decreased to below the recommended two hours by 7–8 yearsold possibly due to school activities [60].
Screen-time has been shown to be associated with other behaviors, especially sleep. Twenge andcolleagues [61] found an inverse association, increased screen-time and reduced sleep durationamong a population-based sample of 0–17 year-olds in the United States [61]. In the current study,the order of screen-time, from highest to lowest duration, by ethnic group was Filipino (6.24 h),Other Micronesians (5.45 h), CHamorus (5.13 h), and Other (3.59 h). Interestingly, this order wasreversed with the TCSQ sleep quality score, where Filipinos reported the highest quality sleep(5.23), and Others reported the lowest quality (8.0), but the pattern was not the same with sleepduration. Researchers are beginning to better understand the impact of screen-time on sleep behaviors.For example, Guerrero and colleagues [62] found a relationship between increased screen-time andincreased social problems (e.g., rule-breaking, social problems, aggressive behavior, and thought
51

Nutrients 2020, 12, 2527
problems), and the relationship was mediated by sleep duration (every hour increase in sleep = 8.8%to 16.6% decrease in problem behaviors) among 9–10 year-old in the Adolescent Brain CognitiveDevelopment study [63]. Behavioral problems, although complex, are real issues plaguing children andshould be considered when building wellness models for healthy families and healthy communities.Further studies on screen-time among children in Guam are warranted.
Childhood behavioral problems have been linked to racial socialization and cultural resilience [64].Similarly, cultural affiliation, or low acculturation (i.e., traditional), is associated with lower rates ofobesity and sedentary behaviors in children from migrant populations [39]. Although CHamorus inthis study are not likely migrants, the long history of colonization in Guam lends to multidimensionalacculturation for CHamorus and Guamanians alike in the presence of the colonial society (i.e., the US).This considered, CHamoru children had the highest proportion of parents identifying as traditional andthe lowest rates of obesity compared to other ethnic groups in this study. Additionally, Filipino childrenidentified most as integrated had the highest average screen-time (hr/d) compared to other ethnicgroups. These findings align with previous studies that have found traditional or low acculturation to beprotective against obesity and related risk factors [39,65,66]. A greater acculturation (i.e., assimilation)has also shown to be a predictor of lower fruit and vegetable intake among adult populations [67,68].Therefore, obesity interventions or health programs in Guam should include cultural values andpractices to maintain or reinforce healthy cultural behaviors unique to each and shared acrossethnic group(s).
Both fruit and vegetable consumption among child participants in this study were low and failedto meet the recommendations set forth by the USDA Dietary Guidelines [34]. Little is known about thefood intake, particularly fruits and vegetables, of children on Guam. Pobocik and colleagues [69,70]studied the food intake of over 1000 elementary school-aged children on Guam and reported fruitand vegetable consumption was well below the recommended intake levels [69]. Leon Guerrero andWorkman [71] studied health behaviors of adolescents on Guam and reported that only 24.7% of thosesurveyed reported consumption at least one serving of fruit and/or vegetable, and none reportedconsuming the recommendations for fruit and vegetable intake set forth by the Dietary Guidelines.Children on Guam are not unlike children from the US mainland. A recent study looking at diet qualityby BMI category of US children found that in general, all children’s diets in the United States were poorand in need of improvement, regardless of BMI status, age, sex, race/ethnicity, and poverty-to-incomeratio classification [72].
CHamorus and Filipinos were less likely to exclusively breastfeed and tended to breastfeed forshorter durations, compared to other Micronesians and Other ethnic groups; mixed feeding wascommon in all ethnic groups and associated with earlier weaning as would be expected. No relationshipof feeding method with overweight and obesity was detected. Breastfeeding is the biologic norm,important for infant nutrition and healthy growth, and protective for child obesity [73–75], although notdemonstrated here. Likely other socio-economic (e.g., income) and behavioral factors (e.g., SSB intake)not controlled in this comparison confound the association in this study.
Several studies have shown an association between SSB intake and adverse health outcomesin children, particularly overweight, obesity, unhealthy weight gain, and central adiposity [76–78].Other longitudinal data indicated that children consuming as little as one SSB serving per day were55% more likely to be OWOB compared to children with limited SSB consumption [79]. Wojcicki andcolleagues looked at the effect of SSB consumption on leukocyte telomere length in preschoolchildren [80]. After adjusting for age sex, and BMI, SSB intake among the preschool children wassignificantly related to shorter leukocyte length. Shorter telomere length has been associated witha number of adverse health outcomes such as type 2 diabetes, stroke, and myocardial infarctionbecause shortened telomeres start the inflammatory cascade through increased production of cytokines,thus adversely impacting cellular health [80]. SSB consumption during early childhood may not leadimmediately to OWOB, as there may be an age effect. It may take a number of years of SSB consumptionbefore the development of OWOB or metabolic changes associated with obesity [77,80–82]. SSB intake
52

Nutrients 2020, 12, 2527
may also be a marker of a food and beverage intake pattern and other lifestyle factors that are associatedwith obesity.
High intake of SSB is common on Guam, and SSBs are readily available in food stores. In a previousstudy looking at dietary intake of CHamoru and Filipino adults living on Guam, Leon Guerrero andcolleagues [11] found that CHamoru adults reported consuming between 7–9% of food energy fromSSBs (7% for women and 9% for men). In this same study [11], SSBs were the second largest contributorto energy intake for CHamoru adults; and third largest contributor to energy intake for Filipino adults.
Like most other islands in the Pacific, Guam relies heavily on imported processed foods.A 2013 survey of processed foods available in the Pacific Islands [83] showed that Guam recorded thehighest number of available processed food products compared to the other Pacific islands surveyed,with over 2100 products available to Guam consumers. High intake of SSBs is not only a problemfor children affected by OWOB. The child participants surveyed on Guam, whether or not they wereaffected by OWOB, consumed a high amount of SSBs, putting them at risk for developing adversecardiometabolic outcomes as they grow older.
There were some limitations to this study. The small sample size of Other Micronesian andespecially Filipino children made ethnic group comparisons difficult. Some parents/caregivers,Other Micronesians in particular, spoke English as a second language and had limited Englishcomprehension; making it difficult to comprehend and respond to survey tools. This may have affectedaccuracy of results. Generalizations are limited due to non-randomized cluster sampling. However,recruitment of children at the community-based settings in Guam communities was designed to ensureappropriate representation by age, sex, ethnicity, and geographic location. Since this study reportscross-sectional data, causal association of OWOB with behavioral or demographic factors cannot beconclusively inferred; longitudinal examination is needed to confirm causality. Despite the limitations,we were able to recruit and assess a large sample of children (n = 865) from several communitiesacross the island that were representative of the major ethnic groups on Guam. Anthropometricmeasurements of children surveyed provided a reliable assessment of OWOB status among childrenon Guam.
In conclusion, the child participants surveyed on Guam, whether or not they are currently affectedby OWOB, are at a high risk for developing OWOB in adulthood, as well as other chronic diseases.Specifically, for OWOB risk factors and CHL behaviors, the majority of children surveyed did not meetrecommendations for: sleep duration (59.6%), sedentary screen-time (83.11%), or fruit (58.7%) andvegetable (99.1%) intake and consumed SSB (73.7%). The study found children affected by OWOB inthis study, were statistically more likely (p = 0.042) to suffer from sleep disturbances, and consumedmarginally higher amounts (p value = 0.07) of SSB compared to children with healthy weight. The studyidentified indicators of potentially stressful home situations among participant families that include:high prevalence of the child participants being cared for by a single parent (60.7%), families withthree or more children (76.2%), and high prevalence of some level of food insecurity (59.6%) amongparticipant families. These family stressors may also contribute to OWOB among children on Guam.With respect to OWOB prevention guidance, the study found evidence supporting previous studies’findings that traditional or low acculturation to be protective against obesity [39,59,60]. Healthy culturalbehaviors, both unique to and shared across ethnic group(s), should be incorporated in future obesityinterventions by highlighting healthy cultural values, practices and traditional foods. The obesogenicfactors identified in the children in this study provide a basis for health promotion and obesityprevention guidance for children in Guam.
Author Contributions: R.T.L.G. led study concept, acquisition, analysis, and interpretation of data, and writingof manuscript; oversaw and had primary responsibility for final manuscript. L.R.B. assisted in study concept,interpretation of data, and writing of manuscript. M.P.H.-U. assisted in acquisition of data, and providing criticalreview of manuscript. M.A. assisted in acquisition and entry of data and providing critical review of manuscript.T.F.A. assisted in acquisition, entry and analysis of data, and writing of manuscript. Y.C.P. assisted in acquisition,entry and analysis of data, and writing of manuscript. L.R.W. participated in overall study design, contributed tostatistical analysis, interpreted data, and writing of manuscript. R.N. initially assisted in the study concept,
53

Nutrients 2020, 12, 2527
participated in design, interpreted data, and writing of manuscript. All authors provided critical review of themanuscript and gave final approval. All authors have read and agreed to the published version of the manuscript.
Funding: This research was funded by the Agriculture and Food Research Initiative grant 2011-68001-30335from the U.S. Department of Agriculture, National Institute of Food and Agricultural, Science EnhancementCoordinated Agricultural Program and the CHL Center of Excellence is currently funded by the USDA NationalInstitute of Food and Agriculture, Agriculture and Food Research Institute Grant no. 2018-69001-27551.
Acknowledgments: We would like to thank the parents and children who participated in the Children’s HealthyLiving Program (CHL), as well as our many community partners who assisted.
Conflicts of Interest: The authors declare no conflict of interest.
References
1. Ogden, C.L.; Carroll, M.D.; Kit, B.K.; Flegal, K.M. Prevalence of childhood and adult obesity in theUnited States, 2011–2012. JAMA 2014, 311, 806–814. [CrossRef] [PubMed]
2. Ogden, C.L.; Carroll, M.D.; Fryar, C.D.; Flegal, K.M. Prevalence of Obesity among Adults and Youth:United States, 2011–2014. NCHS Data Brief 2015, 219, 1–8.
3. Yang, L.; Colditz, G.A. Prevalence of Overweight and Obesity in the United States, 2007–2012.JAMA Intern. Med. 2015, 175, 1412–1413. [CrossRef] [PubMed]
4. Afshin, A.; Forouzanfar, M.H.; Reitsma, M.B.; Sur, P.; Estep, K.; Lee, A.; Marczak, L.; Mokdad, A.H.;Moradi-Lakeh, M.; Naghavi, M.; et al. Health Effects of Overweight and Obesity in 195 Countries over25 Years. N. Engl. J. Med. 2017, 377, 13–27. [CrossRef]
5. Ng, M.; Fleming, T.; Robinson, M.; Thomson, B.; Graetz, N.; Margano, C.; Mullany, C.E.; Biryukov, S.;Abbafati, C.; Abera, F.S.; et al. Global, regional, and national prevalence of overweight and obesity in childrenand adults during 1980–2013: A systematic analysis for the Global Burden of Disease Study 2013. Lancet2014, 384, 766–781. [CrossRef]
6. Novotny, R.; Fialkowski, M.K.; Li, F.; Paulino, Y.S.N.; Vargo, D.; Jim, R.; Coleman, P.; Bersamin, A.; Nigg, C.R.;Leon Guerrero, R.T.; et al. Systematic review of prevalence of young child overweight and obesity in theUnited States Affiliated Pacific region compared to the 48 contiguous states: A the Children’s Health LivingProgram. Am. J. Pub. Health 2015. [CrossRef]
7. Underwood, J. The native origins of the neo-Chamorros of the Mariana Islands. Micronesia 1976, 12, 203–209.8. Vilar, M.G.; Chan, C.W.; Santos, D.R.; Lynch, D.; Spathis, R.; Garruto, R.M.; Lum, J.K. The origins and genetic
distinctiveness of the Chamorros of the Marianas Islands: An mtDNA perspective. Am. J. Hum. Biol. 2013,25, 116–122. [CrossRef]
9. Central Intelligence Agency: The World Factbook. Available online: https://www.cia.gov/library/publications/the-world-factbook/geos/gq.html (accessed on 30 June 2020).
10. Asian and Pacific Islander American Health Forum Health Briefs: Chamorros in the United States. Asian and PacificIslander American Health Forum. 2006. Available online: https://www.apiahf.org/wp-content/uploads/2011/02/APIAHF_Healthbrief08j_2006-1.pdf (accessed on 25 June 2020).
11. Guerrero, R.T.L.; Paulino, Y.C.; Novotny, R.; Murphy, S.P. Diet and obesity among Chamorro and Filipinoadults on Guam. Asia Pac. J. Clin. Nutr. 2008, 17, 216–222.
12. Hankin, J.; Reed, D.; Labarthe, D.; Nichaman, M.; Stallones, R. Dietary and Disease Patterns amongMicronesians. Am. J. Clin. Nutr. 1970, 23, 346–357. [CrossRef]
13. Pollock, N. Food habits in Guam over 500 years. Pac. Viewp. 1986, 27, 120–143. [CrossRef]14. Uncangco, A.; Badowski, G.; David, A.; Ehlert, M.; Haddock, R.; Paulino, Y. First Guam BRFSS Report
2007–2010; Guam Department of Public Health & Social Services: Mangilao, Guam, USA, 2012.15. Singh, A.S.; Mulder, C.; Twisk, J.W.; van Mechelen, W.; Chinapaw, M.J. Tracking of childhood overweight
into adulthood: A systematic review of the literature. Obes. Rev. 2008, 9, 474–488. [CrossRef] [PubMed]16. Barker, D.J.; Osmond, C.; Forsen, T.J.; Kajantie, E.; Eriksson, J.G. Trajectories of growth among children who
have coronary events as adults. N. Engl. J. Med. 2005, 353, 1802–1809. [CrossRef] [PubMed]17. Wilken, L.R.; Novotny, R.; Fialkowski, M.K.; Boushey, C.J.; Nigg, C.; Paulino, Y.; Leon Guerrero, R.;
Bersamin, A.; Vargo, D.; Kim, J.; et al. Children’s Healthy Living (CHL) Program for remote underservedminority populations in the Pacific region: Rationale and design of a community randomized trial to preventearly childhood obesity. BMC Pub. Health 2013, 13, 944. [CrossRef] [PubMed]
54

Nutrients 2020, 12, 2527
18. Novotny, R.; Fialkowski, M.K.; Areta, A.A.; Bersamin, A.; Braun, K.; DeBaryshe, B.; Deenik, J.; Dunn, M.;Hollyer, J.; Kim, J.; et al. The Pacific Way to Child Wellness: The Children’s Healthy Living Programfor Remote Underserved Minority Populations of the Pacific Region (CHL). Hawaii J. Med. Pub. Health2013, 72, 406–408.
19. McGreavey, J.A.; Donnan, P.T.; Pagliari, H.C.; Sullivan, F.M. The tayside children’s sleep questionnaire: Asimple tool to evaluate sleep problems in young children. Child Care Health Dev. 2005, 31, 539–544. [CrossRef]
20. Hirshkowitz, M.; Whiton, K.; Albert, S.M.; Alessi, C.; Bruni, O.; DonCarlos, L.; Hazen, N.; Herman, J.;Katz, E.S.; Kheirandish-Gozal, L.; et al. National Sleep Foundation’s sleep time duration recommendations:Methodology and results summary. Sleep Health 2015, 1, 40–43. [CrossRef]
21. Coleman-Jensen, A.; Gregory, C.; Singh, A. Household Food Security in the United States in 2013; US Department ofAgriculture, Economic Research Service, Ed.; USDA Economic Research Service: Washington, DC, USA, 2014.
22. Kaholokula, J.K.; Iwane, M.K.; Nacapoy, A.H. Effects of perceived racism and acculturation on hypertensionin Native Hawaiians. Hawaii Med. J. 2010, 69, 11–15.
23. Li, F.; Wilkens, L.R.; Novotny, R.; Fialkowski, M.; Paulino, Y.C.; Nelson, R.; Bersamin, A.; Martin, U.; Deenik, J.;Boushey, C. Anthropometric Measurement Standardization in the US-Affiliated Pacific: Report from theChildren’s Healthy Living Program. Am. J. Hum. Biol. 2016, 28, 364–371. [CrossRef]
24. Cook, S.; Auinger, P.; Huang, T.T. Growth curves for cardio-metabolic risk factors in children and adolescents.J. Pediatr. 2009, 155, e15–e26. [CrossRef]
25. Barlow, S. Expert committee recommendations regarding the prevention, assessment, and treatment ofchild and adolescent overweight and obesity: Summary report. Pediatrics 2007, 120 (Suppl. 4), S164–S192.[CrossRef] [PubMed]
26. Centers for Disease Control and Prevention A SAS Program for the 2000 CDC Growth Charts (Ages 0 to <20 Years);Centers for Disease Control and Prevention; 2014. Available online: https://www.cdc.gov/nccdphp/dnpao/growthcharts/resources/sas.htm (accessed on 6 April 2020).
27. Zimmet, P.; Alberti, K.G.; Kaufman, F.; Tajima, N.; Silink, M.; Arslanian, S.; Wong, G.; Bennett, P.;Shaw, J.; Caprio, S.; et al. The metabolic syndrome in children and adolescents—An IDF consensusreport. Pediatr. Diabetes 2007, 8, 299–306. [CrossRef] [PubMed]
28. Novotny, R.; Nigg, C.; McGlone, K.; Renda, G.; Jung, N.; Matsunaga, M.; Karanja, N. Pacific tracker 2—Expertsystem (PacTrac2-ES) behavioural assessment and intervention tool for the pacific kids DASH for health(PacDASH) study. Food Chem. 2013, 140, 471–477. [CrossRef] [PubMed]
29. Martin, C.L.; Murphy, S.P.; Leon Guerrero, R.T.; Davison, N.; Jung, Y.O.; Novotny, R. The Pacific Tracker(PacTrac): Development of a dietary assessment instrument for the Pacific. J. Food Compost. Anal.2008, 21, S103–S108. [CrossRef] [PubMed]
30. Murphy, S.; Blitz, C.; Novotny, R. Pacific tracker (PacTrac): An interactive dietary assessment program at theCRCH website. Hawaii Med. J. 2006, 65, 175–178. [PubMed]
31. Rolland-Cachera, M.F.; Akrout, M.; Peneau, S. Nutrient Intakes in Early Life and Risk of Obesity. Int. J.Environ. Res. Public Health 2016, 13, 564. [CrossRef]
32. Weihrauch-Blüher, S.; Wiegand, S. Risk Factors and Implications of Childhood Obesity. Curr. Obes. Rep.2018, 7, 254–259. [CrossRef]
33. 2015 Poverty Guidelines. Office of the Assistant Secretary for Planning and Evaluation. US Departmentof Public Health and Social Services. Available online: https://aspe.hhs.gov/2015-poverty-guidelines(accessed on 9 July 2020).
34. U.S. Department of Health and Human Services and U.S. Department of Agriculture. 2015–2020 DietaryGuidelines for Americans, 8th ed.; December 2015. Available online: http://health.gov/dietaryguidelines/2015/guidelines/ (accessed on 22 April 2020).
35. Bowman, S.; Friday, J.; Moshfegh, A. MyPyramid Equivalents Database, 2.0 for USDA Survey Foods, 2003–2004[Online]; Food Surveys Research Group, Beltsville Human Nutrition Research Center, Agricultural ResearchService, U.S., Ed.; Department of Agriculture: Beltsville, MD, USA, 2008.
36. Friday, J.; Bowman, S. MyPyramid Equivalents Database for USDA Survey Food Codes, 1994–2002 Version1.0. [Online]; USDA, Agricultural Research Service, Beltsville Human Nutrition Research Center, Ed.;Community Nutrition Research Group: Beltsville, MD, USA, 2006.
37. Popkin, B.M.; Armstrong, L.E.; Bray, G.M.; Caballero, B.; Frei, B.; Willett, W.C. A new proposed guidancesystem for beverage consumption in the United States. Am. J. Clin. Nutr. 2006, 83, 529–542. [CrossRef]
55

Nutrients 2020, 12, 2527
38. American Academy of Pediatrics. Children, adolescents, and television. Pediatrics 2001, 107, 423–426.[CrossRef]
39. Renzaho, A.M.; Swinburn, B.; Burns, C. Maintenance of traditional cultural orientation is associated withlower rates of obesity and sedentary behaviours among African migrant children to Australia. Int. J. Obes.2008, 32, 594–600. [CrossRef]
40. Hixson, L.; Hepler, B.B.; Kim, M.O. The Native Hawaiian and other Pacific Islander Population: 2010; US CensusBureau, Ed.; US Census Bureau: Washington, DC, USA, 2012.
41. Wate, J. Chapter 2: The Obesity Pandemic in the Pacific. In Wealthy but Unhealthy: Overweight and Obesity inAsia and the Pacific: Trends, Costs, and Policies for Better Health; Helble, M., Sato, A., Eds.; Asian DevelopmentBank Institute: Tokyo, Japan, 2018.
42. Skinner, A.C.; Ravanbakht, S.N.; Skelton, J.A.; Perrin, E.M.; Armstrong, S.C. Prevalence of obesity and severeobesity in US children, 1999–2016. Pediatrics 2018. [CrossRef] [PubMed]
43. Paulino, Y.C.; Guerrero, R.T.; Uncangco, A.A.; Rosadino, M.G.; Quinene, J.C.; Natividad, Z.N. Overweight andobesity prevalence among public school children in Guam. J. Health Care Poor Underserved 2015,26 (Suppl. 2), 53–62. [CrossRef] [PubMed]
44. Minster, R.L.; Hawley, N.L.; Su, C.T.; Sun, G.; Kershaw, E.E.; Cheng, H.; Buhule, O.D.; Lin, J.; Reupena, M.S.;Viali, S.; et al. A thrifty variant in CREBRF strongly influences body mass index in Samoans. Nat. Genet.2016, 48, 1049–1054. [CrossRef] [PubMed]
45. Furusawa, T.; Naka, I.; Yamauchi, T.; Natsuhara, K.; Kimura, R.; Nakazawa, M.; Ishida, T.; Inaoka, T.;Matsumura, Y.; Ataka, Y.; et al. The Q223R polymorphism in LEPR is associated with obesity in PacificIslanders. Hum. Genet. 2010, 127, 287–294. [CrossRef]
46. Brambilla, P.; Bedogni, G.; Heo, M.; Pietrobelli, A. Waist circumference-to-height ratio predicts adipositybetter than body mass index in children and adolescents. Int. J. Obes. 2013, 37, 943–946. [CrossRef]
47. Vieira, S.A.; Ribeiro, A.Q.; Hermsdorff, H.H.M.; Pereira, P.F.; Priore, S.E.; Franceschini, S. Waist-to-heightratio index or the prediction of overweight in children. Rev. Paul. Pediatr. 2018, 36, 7.
48. Rakic, R.; Pavlica, T.; Bjelanovic, J.; Vasiljevic, P. Predictive ability of waist-to-hip-ratio andwaist-to-height-ratio in relation to overweight/obesity in adolescents from Vojvodina (the Republic of Serbia)predictive ability of waist-to-hip-ratio and waist-to-height-ratio: Predictive Ability of Waist-to-Hip-Ratioand Waist-to-Height-Ratio. Prog. Nutr. 2019, 24, 992–998.
49. Staiano, A.E.; Gupta, A.K.; Katzmarzyk, P.T. Cardiometabolic risk factors and fat distribution in children andadolescents. J. Pediatr. 2014, 164, 560–565. [CrossRef]
50. Freedman, D.S.; Dietz, W.H.; Srinivasan, S.R.; Berenson, G.S. The relation of overweight to cardiovascularrisk factors among children and adolescents: The Bogalusa Heart Study. Pediatrics 1999, 103 Pt 1, 1175–1182.[CrossRef]
51. Kahn, H.S.; Imperatore, G.; Cheng, Y.J. A population-based comparison of BMI percentiles and waist-to-heightratio for identifying cardiovascular risk in youth. J. Pediatr. 2005, 146, 482–488. [CrossRef]
52. Dixon, B.; Peña, M.M.; Taveras, E.M. Lifecourse approach to racial/ethnic disparities in childhood obesity.Adv. Nutr. 2012, 3, 73–82. [CrossRef] [PubMed]
53. Epstein, L.H.; Myers, M.D.; Anderson, K. The association of maternal psychopathology and familysocioeconomic status with psychological problems in obese children. Obes. Res. 1996, 4, 65–74. [CrossRef][PubMed]
54. Davis, M.; Young, L.; Davis, S.P.; Moll, G. Parental depression, family functioning and obesity among AfricanAmerican children. J. Cult. Divers. 2008, 15, 61–65. [PubMed]
55. McConley, R.L.; Mrug, S.; Gilliland, M.J.; Lowry, R.; Elliott, M.N.; Schuster, M.A.; Bogart, L.M.; Franzini, L.;Escobar-Chaves, S.L.; Franklin, F.A. Mediators of maternal depression and family structure on child BMI:Parenting quality and risk factors for child overweight. Obesity 2011, 19, 345–352. [CrossRef]
56. Pacheco, S.R.; Miranda, A.M.; Coelho, R.; Monteiro, A.C.; Braganca, G.; Loureiro, H.C. Overweight in youthand sleep quality: Is there a link? Arch. Endocrinol. Metab. 2017. [CrossRef]
57. Navarro-Solera, M.; Carrasco-Luna, J.; Pin-Arboledas, G.; Gonzalez-Carrascosa, R.; Soriano, J.M.;Codoner-Franch, P. Short Sleep Duration Is Related to Emerging Cardiovascular Risk Factors in ObeseChildren. J. Pediatr. Gastroenterol. Nutr. 2015, 61, 571–576. [CrossRef]
56

Nutrients 2020, 12, 2527
58. Sakamoto, N.; Gozal, D.; Smith, D.L.; Yang, L.; Morimoto, N.; Wada, H.; Maruyama, K.; Ikeda, A.; Suzuki, Y.;Nakayama, M.; et al. Sleep duration, snoring prevalence, obesity, and behavioral problems in a large cohortof primary school students in Japan. Sleep 2017, 40. [CrossRef]
59. Morrissey, B.; Allender, S.; Strugnell, C. Dietary and activity factors influence poor sleep and the sleep-obesitynexus among children. Int. J. Environ. Res. Public Health 2019, 16, 1778. [CrossRef]
60. Trinh, M.H.; Sundaram, R.; Robinson, S.L.; Lin, T.C.; Bell, E.M.; Ghassabian, A.; Yeung, E.H. Association oftrajectory and covariates of children’s screen media time. JAMA Pediatr. 2019, 174, 71–78. [CrossRef]
61. Twenge, J.M.; Hisler, G.C.; Krizan, Z. Associations between screen time and sleep duration are primarilydriven by portable electronic devices: Evidence from a population-based study of U.S. children ages 0–17.Sleep Med. 2019, 56, 211–218. [CrossRef]
62. Guerrero, M.D.; Barnes, J.D.; Chaput, J.P.; Tremblay, M.S. Screen time and problem behaviors in children:Exploring the mediating role of sleep duration. Int. J. Behav. Nutr. Phys. Act. 2019, 16, 105. [CrossRef][PubMed]
63. Aflague, T.; Boushey, C.; Leon Guerrero, R.; Ahmad, Z.; Kerr, D.; Delp, E. Feasibility and use of the mobile foodrecord for capturing eating occasions among children ages 3–10 years in Guam. Nutrients 2015, 7, 4403–4415.[CrossRef] [PubMed]
64. Burt, C.H.; Simons, R.L.; Gibbons, F.X. Racial discrimination, ethnic-racial socialization, and crime:A micro-sociological model of risk and resilience. Am. Sociol. Rev. 2012, 77, 648–677. [CrossRef][PubMed]
65. Delavari, M.; Sønderlund, A.L.; Swinburn, B.; Mellor, D.; Renzaho, A. Acculturation and obesity amongmigrant populations in high income countries—A systematic review. BMC Public Health 2013, 13, 458.[CrossRef] [PubMed]
66. Lind, C.; Mirchandani, G.G.; Castrucci, B.C.; Chávez, N.; Handler, A.; Hoelscher, D.M. The effects ofacculturation on healthy lifestyle characteristics among Hispanic fourth-grade children in Texas publicschools, 2004–2005. J. School Health 2012, 82, 166–174. [CrossRef] [PubMed]
67. Bolstad, A.L.; Bungum, T. Diet, acculturation, and BMI in Hispanics living in southern Nevada. Am. J.Health Behav. 2013, 37, 218–226. [CrossRef]
68. Lee, S.; Sobal, J.; Frongillo, E. Acculturation, food consumption, and diet-related factors among KoreanAmericans. J. Nutr. Educ. 1999, 31, 321–330. [CrossRef]
69. Pobocik, R.S.; Richer, J.J.; Hentges, D.L. Food sources of macronutrients in the diets of fifth grade children onGuam. Asian Am. Pac. Isl. J. Health 1999, 7, 25–37.
70. Pobocik, R.S.; Richer, J.J. Estimated intake and food sources of vitamin, A.; folate, vitamin, C.; vitamin, E.;calcium, iron, and zinc for Guamanian children aged 9 to 12. Pac. Health Dialog 2002, 9, 193–202.
71. LeonGuerrero, R.T.; Workman, R.L. Physical activity and nutritional status of adolescents on Guam.Pac. Health Dialog 2002, 9, 177–185.
72. Thomson, J.L.; Landry, A.S.; Tussing-Humphreys, L.M.; Goodman, M.H. Diet quality of children in theUnited States by body mass index and sociodemographic characteristics. Obes. Sci. Pract. 2020, 6, 84–98.[CrossRef] [PubMed]
73. Koletzko, B.; Godfrey, K.M.; Poston, L.; Szajewska, H.; van Goudoever, J.B.; de Waard, M.; Brands, B.;Grivell, R.M.; Deussen, A.R.; Dodd, J.M.; et al. Nutrition during pregnancy, lactation and early childhoodand its implications for maternal and long-term child health: The early nutrition project recommendations.Ann. Nutr. Metab. 2019, 74, 93–106. [CrossRef] [PubMed]
74. Koletzko, B.; Brands, B.; Grote, V.; Kirchberg, F.F.; Prell, C.; Rzehak, P.; Uhl, O.; Weber, M. Long-term healthimpact of early nutrition: The power of programming. Ann. Nutr. Metab. 2017, 70, 161–169. [CrossRef][PubMed]
75. Horta, B.L.; Loret de Mola, C.; Victora, C.G. Long-term consequences of breastfeeding on cholesterol,obesity, systolic blood pressure and type 2 diabetes: A systematic review and meta-analysis. Acta. Paediatr.2015, 104, 30–37. [CrossRef]
76. Keller, A.; Bucher Della Torre, S. Sugar-sweetened beverages and obesity among children and adolescents:A review of systematic literature reviews. Child. Obes. 2015, 11, 338–346. [CrossRef]
77. Scharf, R.J.; DeBoer, M.D. Sugar-Sweetened Beverages and Children’s Health. Annu. Rev. Public Health2016, 37, 273–293. [CrossRef]
57

Nutrients 2020, 12, 2527
78. Frantsve-Hawley, J.; Bader, J.D.; Welsh, J.A.; Wright, J.T. A systematic review of the association betweenconsumption of sugar-containing beverages and excess weight gain among children under age 12. J. PublicHealth Dent. 2017, 77 (Suppl. 1), S43–S66. [CrossRef]
79. Laverty, A.A.; Magee, L.; Monteiro, C.A.; Saxena, S.; Millett, C. Sugar and artificially sweetened beverageconsumption and adiposity changes: National longitudinal study. Int. J. Behav. Nutr. Phys. Act. 2015, 12, 137.[CrossRef]
80. Wojcicki, J.M.; Medrano, R.; Lin, J.; Epel, E. Increased cellular aging by 3 years of age in latino, preschoolchildren who consume more sugar-sweetened beverages: A pilot study. Child. Obes. 2018, 14, 149–157.[CrossRef]
81. Macintyre, A.K.; Marryat, L.; Chambers, S. Exposure to liquid sweetness in early childhood:Artificially-sweetened and sugar-sweetened beverage consumption at 4–5 years and risk of overweight andobesity at 7–8 years. Pediatr. Obes. 2018, 13, 755–765. [CrossRef]
82. Dubois, L.; Farmer, A.; Girard, M.; Peterson, K. Regular sugar-sweetened beverage consumption betweenmeals increases risk of overweight among preschool-aged children. J. Am. Diet. Assoc. 2007, 107, 924–934.[CrossRef] [PubMed]
83. Snowdon, W.; Raj, A.; Reeve, E.; Guerrero, R.; Fesaitu, J.; Cateine, K.; Guignet, C. Processed foods availablein the Pacific Islands. Glob. Health 2013, 9, 53. [CrossRef] [PubMed]
© 2020 by the authors. Licensee MDPI, Basel, Switzerland. This article is an open accessarticle distributed under the terms and conditions of the Creative Commons Attribution(CC BY) license (http://creativecommons.org/licenses/by/4.0/).
58

nutrients
Article
Associations between Subjective and ObjectiveMeasures of the Community Food Environment andExecutive Function in Early Childhood
Lindsey M. Bryant 1,*, Heather A. Eicher-Miller 2, Irem Korucu 3 and Sara A. Schmitt 1
1 Human Development & Family Studies, Purdue University, 1202 W. State Street,West Lafayette, IN 47907, USA; [email protected]
2 Department of Nutrition Science, Purdue University, 700 W. State Street, West Lafayette, IN 47907, USA;[email protected]
3 Yale Center for Emotional Intelligence, Yale University, 350 George Street, New Haven, CT 065011.3, USA;[email protected]
* Correspondence: [email protected]
Received: 31 May 2020; Accepted: 24 June 2020; Published: 30 June 2020
Abstract: The present study utilized a cross-sectional design to assess whether two indicators ofthe community food environment, parent perceptions of the community food environment (i.e., asassessed by parent reports of access to, availability, and affordability of foods) and limited foodaccess (via census data), were related to executive function in preschool children. Children wererecruited during the 2014–2015 academic year from Head Start and community-based preschools(N = 102) and children’s executive function ability was tested using the Head–Toes–Knees–Shoulderstask. Multiple linear regression analysis was used, as well as adjusted standard errors to accountfor clustering at the classroom level. Parent reports of their food environment were significantlyrelated to children’s executive function, such that children living in higher quality community foodenvironments had better executive function. In contrast, limited food access using census data was notsignificantly related to executive function. The results suggest that parent reports of the communityfood environment in early childhood may contribute to young children’s cognitive outcomes moreso than being in a limited food access area, as these data may not represent individual behaviors orcapture the variability of the accessibility and affordability of healthy foods. Policy makers shouldconsider correlations between the food environment and early executive functioning when developingnew community health/wellness legislation.
Keywords: food access; executive function; preschool children; community food environment
1. Introduction
The consumption of foods with a low nutrient density is an important correlate of well-beingthroughout life and a modifiable risk factor for chronic disease and obesity, which may originate inchildhood [1–3]. Previous studies suggest that not eating a healthful diet, adhering to the DietaryGuidelines for Americans (DGA) recommendations, may lead to adverse health outcomes, includingiron-deficiency anemia, acute infection, chronic illness, and developmental and mental health problemsamong children [3–6]. Thus, determining the barriers to health and nutrition among United States(U.S.) children is critical to improving child nutrition and health in both the short and long term [7,8].The community food environment, conceptualized as the reported availability, affordability, andaccessibility (e.g., available transportation) of grocery stores or other entities that sell foods thatpromote a healthful diet via the DGA [3], has received consideration as a possible determinant ofdietary intake and may potentially be associated with health and nutritional outcomes [9,10]. Evidence
Nutrients 2020, 12, 1944; doi:10.3390/nu12071944 www.mdpi.com/journal/nutrients59

Nutrients 2020, 12, 1944
that U.S. children and adults with access to foods that most children do not consume enough of, suchas fruits and vegetables, fare better in terms of their physical health and development compared tothose without such access, supports recognition of the community food environment as a potentialbarrier to health and nutrition [3,11,12].
However, most of the research examining the community food environment in the context of childhealth and nutrition focuses on the consumption of fruits and vegetables and dietary intake [13–16], butdoes not consider a potential link between the community food environment and cognitive outcomes.Alternatively, the research related to cognitive outcomes has explicitly evaluated the role of nutritionand obesity (e.g., body mass index (BMI)) in older children and adults on cognition and has notexplored the association of the community food environment with cognitive development in youngchildren [16–19]. Thus, very little is known about the potential association between the community foodenvironment and cognition among children. Further, no studies have examined the relation betweenthe community food environment (as assessed both subjectively via parent reports and objectively viacensus data) and executive function in early childhood, thus warranting further exploration.
Executive function (EF) is defined as the ability to flexibly control automatic thoughts andresponses in order to remain goal oriented [20,21] and is considered to have three integrated, cognitivecomponents [22,23]: cognitive flexibility, inhibitory control, and working memory. EF in earlychildhood is considered an important predictor of short- and long-term health, social–emotional, andacademic outcomes [21,24–28]. For instance, children with stronger EF during the preschool years(3−5 years of age) have lower BMIs [25] and demonstrate better social–emotional competence, schoolreadiness, and subsequent academic achievement (e.g., literacy and math [21,26–28]). Furthermore, thepreschool years are considered a sensitive period for the development of EF due to structural changesin the prefrontal cortex [20,29]. Thus, EF in this developmental stage may be more susceptible toenvironmental influences. This may be particularly true for nutritional deficiencies during the preschoolperiod [30,31]. Nutrients provide the necessary components for developmental processes in the brainthat impact cognitive development (e.g., neuronal/glial metabolism, myelination, enzyme systems), anddeficits to these processes may have a larger impact when the brain is rapidly changing [30,31]. Thus,the community food environment, particularly the availability and affordability of healthful foods,may support EF development in preschool; however, to date, no studies have explored this association.
An Ecological Systems Perspective
The ecological systems perspective illustrates the barriers and opportunities of the communityfood environment [7,8,32,33]. This perspective posits that, although development is impacted bymultiple levels of children’s environments, proximal contexts or microsystems (including barriersto healthy food in the home and neighborhood contexts) are the most critical, and often interactto influence developmental outcomes, such as EF [32]. Afshin and colleagues use this perspectiveto explain an individual’s relationship with health and nutrition using a series of microsystemsranging from the most distal, like global impact (e.g., global food availability, international foodstandards) to sociocultural influences (e.g., social support, social class, social culture norms, socialcohesion) to characteristics of an individual (e.g., age, sex, nutritional knowledge, and skills [7]). Thisframework acknowledges the multiple factors that impact health and nutrition while specificallyfocusing on associations between individuals and their environments. Barriers to health and healthydiets within the larger ecological system can lead to nutrition risk, which may impact parts of thedeveloping brain that are associated with EF skills [30], thus impacting early EF ability. Though thesebarriers likely apply more directly to adults, children’s food consumption is influenced by parentingbehaviors, including parental fruit and vegetable, fat, and soft drink intake [34,35], as well as parentalfeeding style and eating practices [8]. If parents experience barriers related to the availability andaffordability of foods, their children may consequently be impacted when these barriers are linked withdevelopmental trajectories [11,12]. Furthermore, parent experiences and perceptions of the communityfood environment (via parent reports of access to, availability, and affordability of foods) may be
60

Nutrients 2020, 12, 1944
particularly important for evaluating access to healthful foods, relative to more distal assessments ofthe community food environment (i.e., census tract data of limited access). This may be true giventhat parents are embedded in their communities, likely understanding the nuances of their accessand affordability. In support of this hypothesis, previous literature has identified that adults are ableto accurately assess their access to healthful foods, whereas food desert status (as indicated by U.S.Department of Agriculture (USDA) and geographic information systems (GIS) data at the census tractlevel) does not predict where (e.g., nearest store) and how (e.g., shopping frequency) individuals obtainhealthful foods [36]. These discrepancies may be a result of certain assumptions made when evaluatingaccess using census tract data (e.g., assuming individuals buy from the closest stores [37]). Therefore,knowledge of how the community food environment (perceptions or limited access) is related to childdevelopment may inform public health programs and policies.
Therefore, the primary aim of this study is to assess whether two indicators of the communityfood environment, parent reports of the food environment (e.g., access to, availability, and affordabilityof foods) and limited food access (via census data), are related to EF in children who are three to fiveyears old. We included a subjective (parent reports) and objective measure (census data on limitedfood access) of the community food environment to test whether differential associations wouldemerge between these indicators and EF skills. We expected that children with better community foodenvironments across both indicators would have higher scores on an EF task compared with thosewith worse community food environments.
2. Materials and Methods
2.1. Study Design and Participants
Participants of this cross-sectional study included 102 children (52% female) and one of theirparents recruited from 25 Head Start (a federal U.S. preschool program for children from familieswith low incomes (according to federal U.S. Poverty Guidelines) that provides early child care andeducation) or center- and community-based preschools located in the central and western regions of aMidwestern state in the U.S. Children ranged from 40 to 66 months (Mean [M] = 53.57, SD = 5.42), and51% of children were enrolled in Head Start classrooms. Parents’ highest level of education rangedfrom 8th grade to doctoral degree, and approximately 50% of the sample had a high school degree orless. Refer to Table 1 for full descriptive and demographic information.
Table 1. Descriptive means and standard deviations for full sample (N = 102).
Variable Mean or % (SD) Minimum Maximum
Age (in months) 53.57 (5.42) 40 66Sex a
Male (n = 48) 48.00% — —Female (n = 52) 52.00% — —White (n = 71) b 69.61% — —
Non-white (n = 26) 25.49% — —Parent education c 4.59 (1.59) 1 9
Home learning environment d 2.41 (0.64) 0.80 3.83HTKS 8.79 (13.53) 0 50
Limited food access e
Yes limited access (n = 28) 34.15%No limited access (n = 54) 65.85%
Food environment f 2.85 (0.91) 0 4
Note. HTKS = Head–Toes–Knees–Shoulders task. Food environment was measured so that affirmative answers toeach of the four questions were scored and tallied with scores ranging from 0–4, where 0 = poor food environment.a Sex was not reported for two children. b Race/ethnicity was not reported for five children. c 1 = 8th grade or less, 2= some high school, 3 = GED, 4 = high school diploma, 5 = some college, 6 = associate’s degree, 7 = bachelor’sdegree, 8 =master’s degree, 9 = doctoral/postgraduate degree. d Home learning environment was missing for 18children (84 children). e Limited food access was missing for 20 children (82 children). f Food environment wasmissing for 23 children (79 children).
61

Nutrients 2020, 12, 1944
2.2. Procedures
Recruitment occurred during the 2014–2015 academic year after the study was approved by auniversity Institutional Review Board. Preschools were selected using convenience sampling. Parentsof all children within the target age range of 3–5 years old at participating preschools were sent aletter describing the study, inviting them and their child to participate. Written consent was obtainedfrom parents/primary caregivers prior to participation. Children in the study did not have any knownpervasive developmental disorders or have severe auditory or visual impairments that were notcorrected, and all children were English language speakers who were able to participate in assessmentsthat required an age-appropriate level of English proficiency. All data were collected in the preschoolyear at one time point. Parents self-reported demographic and family characteristics (e.g., homelearning environment) on paper surveys, and children were interviewed in a quiet space in theirclassrooms for the direct assessment of EF. All participants received a $20 gift card and childrenreceived stickers after completing assessments.
2.3. Measures
2.3.1. Food Environment
Parent reports of the food environment were assessed using a four-item survey that includedthe following items: “My family has access to a grocery store”; “There is public transportation tothe grocery store”; “Is healthy food available in your community?”; “Is healthy food affordable inyour community?” Responses were scored 0 for “no” and 1 for “yes” and scores were summed (range0–4) to create the independent variable for use in analysis. Lower scores indicated a poorer foodenvironment based on the U.S. Department of Agriculture’s (USDA) definition of food access [38].Researchers created this parent-report tool because a brief measure, quantifying perceptions of access,transportation, and healthy food availability and affordability was not available [8,11]. The simplicityof the measures (four items), which is similar to other measures that have been used in previousstudies [36,39–42], affects the moderate internal reliability for this novel measure (α = 0.50).
2.3.2. Limited Food Access
Census tract information for each residential address (parent-reported) in the sample was obtainedfrom the American Community Survey (ACS) data from the U.S. Census Bureau [43], which usesgeographical information systems (GIS) software to map addresses to a specific census tract thatcorresponds with an address. We used tracts from the 2015 data set, the year the data were collected.After identifying what tract families were in, we used a low-access tract variable from the USDA FoodAccess Research Atlas data set [44]. The Food Access Research Atlas data flagged a tract as low accessif at least 500 people within the tract, or 33% of the population, were living more than 1
2 mile (urbanareas) or 10 miles (rural areas) from the nearest supermarket, supercenter, or large grocery store. In theUSDA’s 2017 report, a directory of supermarkets, supercenters, and large grocery stores within everystate was derived by merging the 2015 Store Tracking and Redemption System (STARS) directory ofstores authorized to accept Supplemental Nutrition Assistance Program (SNAP) benefits and the 2015Trade Dimensions TDLinx directory of stores. The block-level population data were derived from the2010 Census of Population and Housing. A score of 1 indicated a tract was low access and a score of 0indicated the tract was not considered low access.
2.3.3. Executive Function
Children’s executive function was assessed using the Head–Toes–Knees–Shoulders task(HTKS) [45]. The HTKS is a behavioral measure that directly taps into all three components ofEF (cognitive flexibility, inhibitory control, working memory), and is typically used with childrenaged 3–7 [45]. In the practice round, children are first asked to respond by following the directionsnormally (e.g., “Touch your head”), and then they are asked to respond in the opposite way (e.g.,
62

Nutrients 2020, 12, 1944
children are asked to touch their heads when the research assistant says, “Touch your toes”). Thetesting portion consists of 30 items (three sections of ten), and the sections get increasingly complex asthe child progresses. In order to progress to the second section, a child has to receive a score of at least4 on the first section, and similarly, in order to progress to the third section, a child has to receive ascore of at least 4 on the second section. Each correct response is worth two points, making the range ofpossible scores 0–60. Each item is scored as 0 (incorrect), 1 (self-correct), or 2 (correct). The total scoreof the test is the sum of all the correct items. This task takes approximately 5–10 min to complete. Theinterrater reliability, scoring agreement, and test–retest reliability is high and shows strong predictivevalidity [45]. The HTKS has moderate to strong effect sizes, predicting achievement levels and gainsacross multiple studies in pre-k and kindergarten-aged children [45–47].
2.3.4. Covariates
The characteristics of children and parents, including child sex (1 = female), child age (range:40–66 months), race/ethnicity (0 =White/Caucasian, 1 = non-White/Caucasian) and parent education(1 = 8th grade or less, 2 = some high school, 3 = GED, 4 = high school diploma, 5 = some college,6 = associate’s degree, 7 = bachelor’s degree, 8 =master’s degree, 9 = doctoral/postgraduate degree)were also assessed in the participant survey. See Table 1 for details on response categories. The homelearning environment was included as a covariate in order to capture other potential confounders thatmay be related to EF development [48]. Thus, the home learning environment was assessed using 30parent-reported items that address the frequency of home learning activities that incorporated math,literacy, and general educational practices in which parents engage with their children. Sample itemsincluded “playing board games,” “using number activity books,” “identifying sounds of alphabetletters.” Parents reported on the frequency of the activities using the following response options: 0 =never; 1 = a few times per month; 2 = a few times per week; 3 = every day. An average score of all 30items was used in analyses (α = 0.89).
2.4. Analytic Strategy
Data analyses were completed using Stata 16.0 [49]. The classroom intraclass correlation (ICC) wasexamined to determine between-classroom variance in order to determine whether multilevel modelingwould be appropriate. The ICC was 0.002, and thus our models did not require multilevel modeling.However, to be conservative in our statistical approach, in our regression analyses, we adjustedstandard errors to account for clustering at the classroom level. In our analysis, we examined theassociation between the two indicators of the community food environment (parent reports of the foodenvironment and limited food access) and EF among preschool children, while controlling for thehome learning environment, child sex, age, race/ethnicity, and parent education. There were very littlemissing outcome data (< 5% for HTKS); however, full information maximum likelihood (FIML) wasemployed to handle missing data.
3. Results
Main Results
Means and standard deviations for all study variables can be found in Table 1. On average,participants scored 8.79 points on the HTKS (SD = 13.53). A summary of correlations can be foundin Table 2. The HTKS was significantly correlated with parent education (r = 0.28, p = 0.007). Racewas significantly correlated with both limited food access (r = −0.23, p = 0.040) and reports of thecommunity food environment (r = 0.30, p = 0.008).
63

Nutrients 2020, 12, 1944
Table 2. Correlation matrix for all study variables (N = 102).
Variable 1 2 3 4 5 6 7
1. Age a —2. Male −0.14 —3. White 0.08 0.19 t —
4. Parent education 0.21 * 0.05 0.06 —5. Home learning environment 0.06 −0.09 −0.10 0.17 —
6. HTKS 0.17 t −0.18 t 0.06 0.28 ** 0.12 —7. Limited food access 0.01 −0.15 −0.23 * 0.01 0.08 −0.04 —8. Food environment 0.22 t −0.00 −0.30 ** 0.22 t 0.15 0.21 0.13
Note. a Child age measured in months. HTKS = Head–Toes–Knees–Shoulders task. t p < 0.10, * p < 0.05, ** p < 0.01,*** p < 0.001.
It was hypothesized that higher ratings on both indicators of the community food environmentwould predict stronger EF skills. Partially as expected, parent reports of the food environment weresignificantly related to children’s EF (β = 0.22, p = 0.016) above and beyond limited food access, aftercontrolling for the home learning environment, child sex, child age, race/ethnicity, and parent education.Specifically, a one-unit increase in the community food environment was associated with over threeadditional points scored on the HTKS. Children normatively gain approximately 1.33 points eachmonth on the HTKS [45]. Thus, what this score indicates is that children experience a fairly substantialincrease in EF development (approximately a 3-month gain in EF) with a one-unit increase in parentreports of the food environment. However, contrary to the hypotheses, limited food access was notsignificantly related to children’s EF skills (β = −0.08, p = 0.484). Among the control variables, parenteducation was significantly and positively associated with EF (β = 0.23, p = 0.023), as well as child sex(β = 0.21, p = 0.030). See Table 3 for all regression estimates.
Table 3. Regression estimates predicting executive functioning.
Variable β (SE)
Age a 0.02 (0.10)Male −0.21 (0.10) *White 0.12 (0.10)
Parent education 0.23 (0.10) *Home learning environment 0.03 (0.08)
Limited food access −0.08 (0.11)Food environment 0.22 (0.09) *
Note. a Child age measured in months. * p < 0.05, ** p < 0.01, *** p < 0.001.
4. Discussion
The primary goal of this study was to assess whether two indicators of the community foodenvironment (subjective via parent reports of the food environment and objective via limited foodaccess) were related to EF in preschool-aged children. EF skills in preschool are robust indicators ofacademic [26,28,50], social–emotional [51], and healthy outcomes [25], and EF deficits during earlychildhood are related to hyperactivity and attention deficits [52]. Thus, identifying early predictors ofEF is critical. Results from our study indicated that, after controlling for the home learning environment,child age, race, sex, and parent education, parent reports of the food environment were significantlypositively related to stronger EF skills, whereas limited food access was not related to EF. This suggeststhat the children of parents who believe they have higher quality community food environments havebetter EF, regardless of whether families are located in census tracts that are flagged as having limitedfood access.
64

Nutrients 2020, 12, 1944
4.1. Community Food Environment and Executive Function
As expected, there was an association between the subjective measure of the community foodenvironment (i.e., parent reports of access to, availability, and affordability of foods) and EF inearly childhood. This association may be due to the measure encompassing several environmentalbarriers to healthful foods that put children at greater nutritional risk, thus affecting developmentaloutcomes like EF. This link between the community food environment and EF development is novelat the distal ecological level, and variables that only examine limited food access at the tract level,rather than the individual level, may not be able to capture these associations. Food insecurity orinsufficiency may be a potential mediating factor between the community food environment andEF. Food insufficiency is defined as inadequate food intake due to a lack of environmental resources,and similarly, food insecurity refers to the limited or uncertain availability of or inability to acquirenutritionally adequate, safe, and acceptable foods due to limited resources which may be impacted byenvironmental constraints (e.g., the community food environment) [53,54]. Food insufficient/insecurefamilies may live in poor food environments where individuals are 22–35% less likely to have a dietconforming to the DGA than those in food environments with a better availability of supermarketsand healthy foods [13]. Additionally, poverty and environmental impacts of poverty (e.g., akin tosocial class and environmental impacts), as proposed in the sociocultural layer in the larger ecologicalmodel [7], may affect nutrition, and in turn, cognitive development [55]. Food insufficiency/insecurityhas a limited but growing literature, showing a link with academic achievement in older U.S. children(e.g., poorer math scores, poorer reading scores, grade repetition [53,54,56]), and EF is closely relatedto these outcomes [26,50]. Further, previous literature that has directly assessed the concurrent andlong-term impacts of food insecurity on EF in preschool-aged (3–5) and early elementary-aged children(6–7) has found that global and domain-specific EFs are significantly negatively impacted when childrenare exposed to any degree of food insecurity [57,58]. Specifically, one of these studies found that anyexposure to any level of food insecurity (either marginally insecure or completely food insecure) ineither kindergarten or first grade resulted in worse working memory and cognitive flexibility, twocomponents of EF [57].
Alternatively, there was not an association between an objective measure of the food environment(i.e., limited food access; if at least 500 people within the tract, or 33% of the population were, livingmore than 1
2 mile (urban areas) or 10 miles (rural areas) from the nearest supermarket, supercenter,or large grocery store) and EF scores. The finding that parent reports were related to EF and anobjective measure of food access was not surprising. This may be because our objective measureof limited food access assumes that (1) full-service grocery stores are a proxy for the presence ofaffordable and nutritionally sufficient food [37], (2) households buy from the closest supermarket [37],(3) alternative store types may not have a similar selection or may not offer as many fruits or vegetablesas supermarkets [59], and (4) families are not getting food from alternative food sources like home andcommunity gardens or farmers’ markets. Moreover, there is evidence of variability within census tractsrelated to whether individuals with low incomes shop at a neighborhood store or even the nearestchain store [60]. One study found that while SNAP recipients live 1.8 miles on average from full-servicegrocery stores, most individuals travel 4.9 miles from home to shop for food [61]. Thus, whethera census tract is flagged as limited food access based on distance from a store may not accuratelyrepresent individual behaviors regarding where families are going to buy food or access to foodswithin a store. Furthermore, this measure may not capture small groceries or small general stores.
Additionally, it may be that parent reports of the food environment are more strongly related tocognitive outcomes, like EF. Indeed, parents’ perceptions can be quite powerful influencers on children’sdevelopment (e.g., reports of praise and school readiness on academic outcomes, perceptions of beingoverweight on future weight gain) [62,63]. Furthermore, parent reports of the food environment maytap into an emotional or social connectedness of the community they are in, which may then have aneffect on EF outcomes. In one study, social cohesion (sense of belonging and unity among members ofa community [64]) and reports of food availability (i.e., a large selection of fresh fruits and vegetables
65
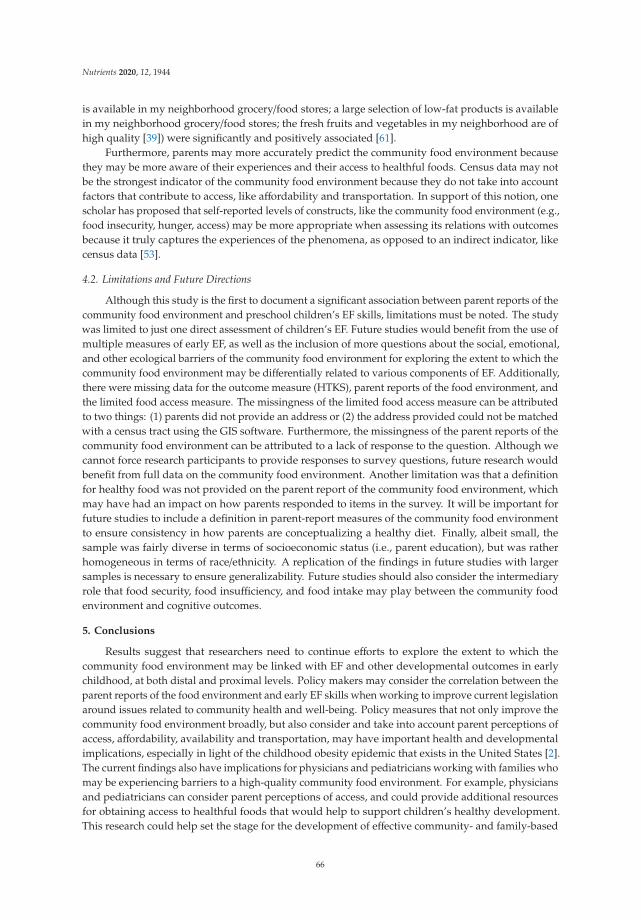
Nutrients 2020, 12, 1944
is available in my neighborhood grocery/food stores; a large selection of low-fat products is availablein my neighborhood grocery/food stores; the fresh fruits and vegetables in my neighborhood are ofhigh quality [39]) were significantly and positively associated [61].
Furthermore, parents may more accurately predict the community food environment becausethey may be more aware of their experiences and their access to healthful foods. Census data may notbe the strongest indicator of the community food environment because they do not take into accountfactors that contribute to access, like affordability and transportation. In support of this notion, onescholar has proposed that self-reported levels of constructs, like the community food environment (e.g.,food insecurity, hunger, access) may be more appropriate when assessing its relations with outcomesbecause it truly captures the experiences of the phenomena, as opposed to an indirect indicator, likecensus data [53].
4.2. Limitations and Future Directions
Although this study is the first to document a significant association between parent reports of thecommunity food environment and preschool children’s EF skills, limitations must be noted. The studywas limited to just one direct assessment of children’s EF. Future studies would benefit from the use ofmultiple measures of early EF, as well as the inclusion of more questions about the social, emotional,and other ecological barriers of the community food environment for exploring the extent to which thecommunity food environment may be differentially related to various components of EF. Additionally,there were missing data for the outcome measure (HTKS), parent reports of the food environment, andthe limited food access measure. The missingness of the limited food access measure can be attributedto two things: (1) parents did not provide an address or (2) the address provided could not be matchedwith a census tract using the GIS software. Furthermore, the missingness of the parent reports of thecommunity food environment can be attributed to a lack of response to the question. Although wecannot force research participants to provide responses to survey questions, future research wouldbenefit from full data on the community food environment. Another limitation was that a definitionfor healthy food was not provided on the parent report of the community food environment, whichmay have had an impact on how parents responded to items in the survey. It will be important forfuture studies to include a definition in parent-report measures of the community food environmentto ensure consistency in how parents are conceptualizing a healthy diet. Finally, albeit small, thesample was fairly diverse in terms of socioeconomic status (i.e., parent education), but was ratherhomogeneous in terms of race/ethnicity. A replication of the findings in future studies with largersamples is necessary to ensure generalizability. Future studies should also consider the intermediaryrole that food security, food insufficiency, and food intake may play between the community foodenvironment and cognitive outcomes.
5. Conclusions
Results suggest that researchers need to continue efforts to explore the extent to which thecommunity food environment may be linked with EF and other developmental outcomes in earlychildhood, at both distal and proximal levels. Policy makers may consider the correlation between theparent reports of the food environment and early EF skills when working to improve current legislationaround issues related to community health and well-being. Policy measures that not only improve thecommunity food environment broadly, but also consider and take into account parent perceptions ofaccess, affordability, availability and transportation, may have important health and developmentalimplications, especially in light of the childhood obesity epidemic that exists in the United States [2].The current findings also have implications for physicians and pediatricians working with families whomay be experiencing barriers to a high-quality community food environment. For example, physiciansand pediatricians can consider parent perceptions of access, and could provide additional resourcesfor obtaining access to healthful foods that would help to support children’s healthy development.This research could help set the stage for the development of effective community- and family-based
66

Nutrients 2020, 12, 1944
interventions that target improving access to healthful foods by providing a rationale to intervene incommunities by linking families with transportation, economical food access, food delivery, and otherpolicies to promote food access. This study also lays a foundation for future research examining thepotential impact of poor community food environments and children’s cognitive outcomes.
Author Contributions: Conceptualization, L.M.B. and S.A.S.; methodology, L.M.B. and S.A.S.; formal analysis,L.M.B. and S.A.S.; investigation, S.A.S.; resources, S.A.S.; data curation, S.A.S. and I.K.; writing—original draftpreparation, L.M.B. and S.A.S.; writing—review and editing, H.A.E.-M., I.K., and S.A.S.; supervision, S.A.S.;project administration, S.A.S.; funding acquisition, S.A.S. All authors have read and agreed to the publishedversion of the manuscript.
Funding: The research reported in this publication was supported by research funding from the USDA NationalInstitute of Food and Agriculture, Hatch Project (1003434).
Conflicts of Interest: The authors declare no conflict of interest.
References
1. Kawachi, I.; Berkman, L.F. Social ties and mental health. J. Urban. Health 2001, 78, 458–467. [CrossRef][PubMed]
2. Morris, A.S.; Robinson, L.R.; Hays-Grudo, J.; Claussen, A.H.; Hartwig, S.A.; Treat, A.E. Targeting parentingin early childhood: A public health approach to improve outcomes for children living in poverty. Child Dev.Perspect. 2017, 88, 388–397. [CrossRef]
3. U.S. Department of Health and Human Services; U.S. Department of Agriculture. 2015–2020 DietaryGuidelines for Americans; U.S. Department of Health and Human Services; U.S. Department of Agriculture:Washington, DC, USA, 2015. Available online: http://health.gov/dietaryguidelines/2015/guidelines/ (accessedon 26 June 2019).
4. Kursmark, M.; Weitzman, M. Recent findings concerning childhood food insecurity. Curr. Opin. Clin. Nutr.Metab. Care 2009, 12, 310–316. [CrossRef] [PubMed]
5. Slack, K.S.; Yoo, J. Food hardship and child behavior problems among low-income children. Soc. Serv. Rev.2005, 79, 511–536. [CrossRef]
6. Weinreb, L.; Wehler, C.; Perloff, J.; Scott, R.; Hosmer, D.; Sagor, L.; Gundersen, C. Hunger: Its impact onchildren’s health and mental health. Pediatrics 2002, 110, e41. [CrossRef] [PubMed]
7. Afshin, A.; Micah, R.; Khatibzadeh, S. Dietary policies to reduce noncommunicable diseases. In The Handbookof Global Health Policy; Brown, G.W., Yamey, G., Wamala, S., Eds.; John Wiley & Sons, Ltd.: West Sussex, UK,2014; pp. 175–193.
8. Story, M.; Kaphingst, K.M.; Robinson-O’Brien, R.; Glanz, K. Creating healthy food and eating anvironments:Policy and environmental approaches. Annu. Rev. Public Health 2008, 29, 253–272. [CrossRef]
9. Fitzgibbon, M.L.; Stolley, M.R. Environmental changes: May be needed for prevention of overweight inminority children. Pediatr. Ann. 2004, 33, 45–49. [CrossRef]
10. Sooman, A.; Macintyre, S.; Anderson, A. Scotland’s health—A more difficult challenge for some? The priceand availability of healthy foods in socially contrasting localities in the west of Scotland. Health Bull. 1993,51, 276–284.
11. Morland, K.; Diez Roux, A.V.; Wing, S. Supermarkets, other food stores, and obesity: The atherosclerosis riskin communities study. Am. J. Prev. Med. 2006, 30, 333–339. [CrossRef]
12. Powell, L.M.; Slater, S.; Mirtcheva, D.; Bao, Y.; Chaloupka, F.J. Food Store Availability and NeighborhoodCharacteristics in the United States. Prev. Med. 2007, 44, 189–195. [CrossRef]
13. Moore, L.V.; Diez Roux, A.V.; Nettleton, J.A.; Jacobs, D.R. Associations of the local food environment withdiet quality—A comparison of assessments based on surveys and geographic information systems. Am. J.Epidemiol. 2008, 167, 917–924. [CrossRef] [PubMed]
14. Nigg, C.R.; Ul Anwar, M.M.; Braun, K.; Mercado, J.; Kainoa Fialkowski, M.; Ropeti Areta, A.A.;Belyeu-Camacho, T.; Bersamin, A.; Guerrero, R.L.; Castro, R.; et al. A review of promising multicomponentenvironmental child obesity prevention Intervention strategies by the Children’s Healthy Living Program. J.Environ. Health 2016, 79, 18–26. [CrossRef] [PubMed]
67

Nutrients 2020, 12, 1944
15. Ritchie, L.D.; Woodward-Lopez, G.; Au, L.E.; Loria, C.M.; Collie-Akers, V.L.; Wilson, D.K.; Frongillo, E.A.;Strauss, W.J.; Landgraf, A.J.; Nagaraja, J.; et al. Associations of community programs and policies withchildren’s dietary intakes: The Healthy Communities Study. Pediatr. Obes. 2018. [CrossRef] [PubMed]
16. Woodward-Lopez, G.; Gosliner, W.; Au, L.E.; Kao, J.; Webb, K.L.; Sagatov, R.D.F.; Strauss, W.J.; Landgraf, A.J.;Nagaraja, J.; Wilson, D.K.; et al. Community characteristics modify the relationship between obesityprevention efforts and dietary intake in children: The Healthy Communities Study. Pediatr. Obes. 2018, 13,46–55. [CrossRef]
17. Khan, N.A.; Raine, L.B.; Donovan, S.M.; Hillman, C.H. The cognitive implications of obesity and nutrition inchildhood. Monogr. Soc. Res. Child Dev. 2014, 79, 51–71. [CrossRef]
18. Hildreth, K.L.; Van Pelt, R.E.; Schwartz, R.S. Obesity, insulin resistance, and Alzheimer’s disease. Obesity2012, 20, 1549–1557. [CrossRef]
19. Tascilar, M.E.; Turkkahraman, D.; Oz, O.; Yucel, M.; Taskesen, M.; Eker, I.; Abaci, A.; Dundaroz, R.; Ulas, U.H.P300 auditory event-related potentials in children with obesity: Is childhood obesity related to impairmentin cognitive functions? Pediatr. Diabetes 2011, 12, 589–595. [CrossRef]
20. Garon, N.; Bryson, S.E.; Smith, I.M. Executive function in preschoolers: A review using an integrativeframework. Psychol. Bull. 2008, 134, 31–60. [CrossRef]
21. McClelland, M.M.; Cameron, C.E.; Connor, C.M.D.; Farris, C.L.; Jewkes, A.M.; Morrison, F.J. Links betweenbehavioral regulation and preschoolers’ literacy, vocabulary, and math skills. Dev. Psychol. 2007, 43, 947–959.[CrossRef]
22. Bernier, A.; Beauchamp, M.H.; Carlson, S.M.; Lalonde, G. A secure base from which to regulate: Attachmentsecurity in toddlerhood as a predictor of executive functioning at school entry. Dev. Psychol. 2015, 51,1177–1189. [CrossRef]
23. Willoughby, M.T.; Blair, C.; Wirth, R.J.; Greenberg, M.T. The measurement of executive function at age 5:Psychometric properties and relationship to academic achievement. Psychol. Assess. 2012, 24, 226–239.[CrossRef] [PubMed]
24. Hughes, C.H.; Ensor, R.A. How do families help or hinder the emergence of early executive function? NewDir. Child Adoles. 2009, 123, 35–50. [CrossRef] [PubMed]
25. Schmitt, S.A.; Korucu, I.; Jones, B.L.; Snyder, F.J.; Evich, C.D.; Purpura, D.J. Self-regulation as a correlate ofweight status in preschool children. Early Child Dev. Care 2017, 189, 68–78. [CrossRef]
26. Blair, C.; Razza, R.P. Relating effortful control, executive function, and false belief understanding to emergingmath and literacy ability in kindergarten. Child Dev. 2007, 78, 647–663. [CrossRef]
27. Duckworth, A.L.; Seligman, M.E.P. Self-discipline outdoes IQ in predicting academic performance ofadolescents. Psychol. Sci. 2005, 16, 939–944. [CrossRef] [PubMed]
28. Morrison, F.J.; Ponitz, C.E.C.; McClelland, M.M. Self-regulation and academic achievement in the transitionto school. In Human Brain Development. Child Development at the Intersection of Emotion and Cognition;Calkings, S.D., Bell, M.A., Eds.; American Psychological Association: Washington, DC, USA, 2010; pp. 203–224.[CrossRef]
29. Carlson, S.M.; Davis, A.C.; Leach, J.G. Less is more—Executive function and symbolic representation inpreschool children. Psychol. Sci. 2005, 16, 609–616. [CrossRef] [PubMed]
30. Nyaradi, A.; Li, J.; Hickling, S.; Foster, J.; Oddy, W.H. The role of nutrition in children’s neurocognitivedevelopment, from pregnancy through childhood. Front. Hum. Neurosci. 2013, 7, 97. [CrossRef]
31. Wachs, T.D.; Georgieff, M.; Cusick, S.; Mcewen, B.S. Issues in the timing of integrated early interventions:Contributions from nutrition, neuroscience, and psychological research. In Prenatal and Childhood Nutrition:Evaluating the Neurocognitive Connections; Croft, C., Ed.; Apple Academic Press: Oakville, ON, Canada, 2015;pp. 363–397. [CrossRef]
32. Bronfenbrenner, U. Toward an experimental ecology of human development. Am. Psychol. 1977, 32, 513–531.[CrossRef]
33. Sallis, J.F.; Fisher, E.B.; Owen, N.; Fisher, E.B. Ecological models of health behavior. In Health Behavior andHealth Education; Glanz, K., Rimer, B.K., Viswanath, K., Eds.; Jossey-Bass: San Francisco, CA, USA, 2015;pp. 465–482.
34. Cook, J.T.; Frank, D.A.; Levenson, S.M.; Neault, N.B.; Heeren, T.C.; Black, M.M.; Berkowitz, C.; Casey, P.H.;Meyers, A.F.; Cutts, D.B.; et al. Child food insecurity increases risks posed by household food insecurity toyoung children’s health. J. Nutr. 2006, 136, 1073–1076. [CrossRef]
68

Nutrients 2020, 12, 1944
35. Fisher, J.O.; Mitchell, D.C.; Smiciklas-Wright, H.; Birch, L.L. Parental influences on young girls’ fruit andvegetable, micronutrient, and fat intakes. J. Am. Diet. Assoc. 2002, 102, 58–64. [CrossRef]
36. Sohi, I.; Bell, B.A.; Liu, J.; Battersby, S.E.; Liese, A.D. Differences in food environment perceptions and spatialattributes of food shopping between residents of low and high food access areas. J. Nutr. Educ. Behav. 2014,46, 241–249. [CrossRef]
37. Breyer, B.; Voss-Andreae, A. Food mirages: Geographic and economic barriers to healthful food access inPortland, Oregon. Heal. Place 2013, 24, 131–139. [CrossRef] [PubMed]
38. U.S. Department of Agriculture. Definitions: Food Access. 2005. Available online: https://www.ers.usda.gov/data-products/food-access-research-atlas/documentation/ (accessed on 26 June 2019).
39. Mujahid, M.S.; Diez Roux, A.V.; Morenoff, J.D.; Raghunathan, T. Assessing the measurement properties ofneighborhood scales: From psychometrics to ecometrics. Am. J. Epidemiol. 2007, 165, 858–867. [CrossRef]
40. Ma, X.; Barnes, T.L.; Freedman, D.A.; Bell, B.A.; Colabianchi, N.; Liese, A.D. Test-retest reliability of aquestionnaire measuring perceptions of neighborhood food environment. Health Place 2013, 21, 65–69.[CrossRef] [PubMed]
41. Co, M.C.; Bakken, S. Influence of the local food environment on Hispanics’ perceptions of healthy foodaccess in New York City. Hisp. Heal. Care Int. 2018, 16, 76–84. [CrossRef] [PubMed]
42. Jayashankar, P.; Raju, S. The effect of social cohesion and social Networks on perceptions of food availabilityamong low-income consumers. J. Bus. Res. 2020, 1, 316–323. [CrossRef]
43. U.S. Census Bureau. American Community Survey Data. 2005. Available online: https://geocoding.geo.census.gov/geocoder/geographies/addressbatch?form (accessed on 26 June 2019).
44. U.S. Department of Agriculture. Food Access Research Atlas—Download the Data. 2017. Available online:https://www.ers.usda.gov/data-products/food-access-research-atlas/download-the-data/ (accessed on 15July 2019).
45. McClelland, M.M.; Cameron, C.E.; Duncan, R.J.; Bowles, R.P.; Acock, A.C.; Miao, A.J.; Pratt, M.E. Predictorsof early growth in academic achievement: The head-toes-knees-shoulders task. Front. Psychol. 2014, 5, 599.[CrossRef] [PubMed]
46. Ponitz, C.E.C.; McClelland, M.M.; Jewkes, A.M.; Connor, C.M.D.; Farris, C.L.; Morrison, F.J. Touch your toes!Developing a direct measure of behavioral regulation in early childhood. Early Child Res. Quart. 2008, 23,141–158. [CrossRef]
47. Wanless, S.B.; McClelland, M.M.; Acock, A.C.; Ponitz, C.E.C.; Son, S.H.; Lan, X.; Morrison, F.J.; Chen, J.L.;Chen, F.M.; Lee, K.; et al. Measuring behavioral regulation in four societies. Psychol. Assess. 2011, 23, 364–378.[CrossRef]
48. Blair, C.; Cybele Raver, C.; Berry, D.J. Family Life Project Investigators. Two approaches to estimating theeffect of parenting on the development of executive function in early childhood. Dev. Psychol. 2014, 50,554–565. [CrossRef]
49. StataCorp. Stata Statistical Software: Release 16; StataCorp LLC: College Station, TX, USA, 2019.50. McClelland, M.M.; Acock, A.C.; Piccinin, A.; Rhea, S.A.; Stallings, M.C. Relations between preschool attention
span-persistence and age 25 educational outcomes. Early Child Res. Quart. 2013, 28, 314–324. [CrossRef][PubMed]
51. Denham, S.A. Social-emotional competence as support for school readiness: What is it and how do we assessit? Early Educ. Dev. 2006, 17, 57–89. [CrossRef]
52. Pauli-Pott, U.; Becker, K. Neuropsychological basic deficits in preschoolers at risk for ADHD: A meta-analysis.Clin. Psychol. Rev. 2011, 31, 626–637. [CrossRef]
53. Alaimo, K.; Olson, C.M.; Frongillo, E.A. Food insufficiency and American school-aged children’s cognitive,academic, and psychosocial development. Pediatrics 2001, 108, 44–53. [CrossRef]
54. Jyoti, D.F.; Frongillo, E.A.; Jones, S.J. Community and international nutrition food insecurity affects schoolchildren’s academic performance, weight gain, and social skills. J. Nutr. 2005, 135, 2831–2839. [CrossRef]
55. Korenman, S.; Miller, J.E.; Sjaastad, J.E. Long-term poverty and child development in the United States:Results from the NLSY. Child. Youth Serv. Rev. 1995, 17, 127–155. [CrossRef]
56. Florence, M.D.; Asbridge, M.; Veugelers, P.J. Diet quality and academic performance. J. Sch. Health 2008, 78,209–215. [CrossRef]
57. Grineski, S.E.; Morales, D.X.; Collins, T.W.; Rubio, R. Transitional dynamics of household food insecurityimpact children’s developmental outcomes. J. Dev. Behav. Pediatr. 2018, 39, 715–725. [CrossRef]
69

Nutrients 2020, 12, 1944
58. Shankar, P.; Chung, R.; Frank, D.A. Association of food insecurity with children’s behavioral, emotional, andacademic outcomes: A systematic review. J. Dev. Behav. Pediatr. 2017, 38, 135–150. [CrossRef]
59. Bodor, J.N.; Rice, J.C.; Farley, T.A.; Swalm, C.M.; Rose, D. Disparities in food access: Does aggregateavailability of key foods from other stores offset the relative lack of supermarkets in African-Americanneighborhoods? Prev. Med. 2010, 51, 63–67. [CrossRef]
60. Hillier, A.; Cannuscio, C.; Karpyn, A.; Mclaughlin, J.; Chilton, M.; Glanz, K. How far do low-income parentstravel to shop for food? Empirical evidence from two urban neighborhoods. Urban Geogr. 2011, 32, 712–729.[CrossRef]
61. U.S. Department of Agriculture. Access to Affordable and Nutritious Food-Measuring and Understanding FoodDeserts and Their Consequences: Report to Congress; U.S. Department of Agriculture: Washington, DC, USA,2009. [CrossRef]
62. Lee, H.I.; Kim, Y.H.; Kesebir, P.; Han, D.E. Understanding when parental praise leads to optimal childoutcomes: Role of perceived praise accuracy. Soc. Psychol. Personal. Sci. 2017, 8, 679–688. [CrossRef]
63. Robinson, E.; Sutin, A.R. Parents’ perceptions of their children as overweight and children’s weight concernsand weight gain. Psychol. Sci. 2017, 28, 320–329. [CrossRef] [PubMed]
64. Kawachi, I.; Berkman, L. Social cohesion, social capital, and health. In Social Epidemiology; Berkman, L.F.,Kawachi, I., Eds.; Oxford University Press: New York, NY, USA, 2000; pp. 174–190.
© 2020 by the authors. Licensee MDPI, Basel, Switzerland. This article is an open accessarticle distributed under the terms and conditions of the Creative Commons Attribution(CC BY) license (http://creativecommons.org/licenses/by/4.0/).
70

nutrients
Article
Total Usual Micronutrient Intakes Compared to theDietary Reference Intakes among U.S. Adults by FoodSecurity Status
Alexandra E. Cowan 1, Shinyoung Jun 1, Janet A. Tooze 2, Heather A. Eicher-Miller 1,
Kevin W. Dodd 3, Jaime J. Gahche 4, Patricia M. Guenther 5, Johanna T. Dwyer 4,6,
Nancy Potischman 4, Anindya Bhadra 7 and Regan L. Bailey 1,*
1 Interdepartmental Nutrition Program, Purdue University, 700 W. State Street, West Lafayette, IN 47907, USA;[email protected] (A.E.C.); [email protected] (S.J.); [email protected] (H.A.E.-M.)
2 School of Medicine, Wake Forest University, 475 Vine St, Winston-Salem, NC 27101, USA;[email protected]
3 NIH National Cancer Institute, 9609 Medical Center Drive, Rockville, MD 20850, USA; [email protected] NIH Office of Dietary Supplements, 6100 Executive Blvd., Bethesda, MD 20892, USA;
[email protected] (J.J.G.); [email protected] (J.T.D.); [email protected] (N.P.)5 Department of Nutrition and Integrative Physiology, University of Utah, 250 South 850 East, Salt Lake City,
UT 84112, USA; [email protected] Jean Mayer USDA Human Nutrition Research Center on Aging, Tufts University, 711 Washington Street,
Boston, MA 02111, USA7 Department of Statistics, Purdue University, 250 N. University St, West Lafayette, IN 47907, USA;
[email protected]* Correspondence: [email protected]; Tel.: +1-765-494-2829
Received: 11 November 2019; Accepted: 16 December 2019; Published: 22 December 2019
Abstract: This study examined total usual micronutrient intakes from foods, beverages, and dietarysupplements (DS) compared to the Dietary Reference Intakes among U.S. adults (≥19 years) by sexand food security status using NHANES 2011–2014 data (n = 9954). DS data were collected viaan in-home interview; the NCI method was used to estimate distributions of total usual intakesfrom two 24 h recalls for food and beverages, after which DS were added. Food security statuswas categorized using the USDA Household Food Security Survey Module. Adults living in foodinsecure households had a higher prevalence of risk of inadequacy among both men and womenfor magnesium, potassium, vitamins A, B6, B12, C, D, E, and K; similar findings were apparent forphosphorous, selenium, and zinc in men alone. Meanwhile, no differences in the prevalence of riskfor inadequacy were observed for calcium, iron (examined in men only), choline, or folate by foodsecurity status. Some DS users, especially food secure adults, had total usual intakes that exceeded theTolerable Upper Intake Level (UL) for folic acid, vitamin D, calcium, and iron. In conclusion, while DScan be helpful in meeting nutrient requirements for adults for some micronutrients, potential excessmay also be of concern for certain micronutrients among supplement users. In general, food insecureadults have higher risk for micronutrient inadequacy than food secure adults.
Keywords: NHANES; dietary supplement; micronutrients; DRI; food security
1. Introduction
The 2015–2020 Dietary Guidelines for Americans (DGA) reported a number shortfall nutrientsamong U.S. adults including calcium, iron, magnesium, potassium, choline, folate and vitamins A,C, D, and E [1,2]. The DGA also recognized food insecurity, defined as limited availability of foodsand an individual’s inability to access food [3], as a potential barrier to a healthy diet that warrants
Nutrients 2020, 12, 38; doi:10.3390/nu12010038 www.mdpi.com/journal/nutrients71

Nutrients 2020, 12, 38
further research [1]. Indeed, a systematic review concluded that food insecure adults have lowerintakes of vitamin A, vitamin B6, calcium, magnesium, and zinc from diet alone when comparedto those who were food secure [4]. Dietary supplement (DS) use is also lower in adults living infood insecure U.S. households than in those that are food secure [5], implying that differences inmicronutrient intakes between the food secure and food insecure population subgroups might beamplified when total nutrient intakes, inclusive of DS, are considered; however, to our knowledge,no study has compared total usual nutrient intakes by household food security status. Therefore, thepurpose of this analysis was to estimate the prevalence of risk of micronutrient inadequacy and excessby comparing total usual micronutrient intake distributions to the Dietary Reference Intakes (DRI); andto parse out the contributions of DS to the total intakes of U.S. adults (1) in the general population and(2) by household food security status, using data from the National Health and Nutrition ExaminationSurvey (NHANES), 2011–2014.
2. Methods
The NHANES is a nationally representative, continuous cross-sectional survey ofnoninstitutionalized, civilian residents of the U.S. conducted by the National Center for HealthStatistics. Complete details of the NHANES survey are publicly available [6]. Briefly, the NHANESprotocol includes an in-person household interview that queries health information and demographicsas well as a follow-up health examination in a Mobile Examination Center (MEC) for each participant.Written informed consent was obtained for all participants or their proxies, and the NHANES protocol(and publicly released de-identified data) was approved by the Research Ethics Review Board atthe CDC/National Center for Health Statistics. For the purposes of this analysis, the most recentdata on dietary and DS intakes available from the NHANES (2011–2012 and 2013–2014 cycles) werecombined to form an analytic sample of 19,151 participants. These survey years were combined inorder to increase the statistical reliability of estimates across population subgroups [6]. Participantswho were <19 years of age (n = 7939), did not complete or had incomplete 24 h dietary recall or dietarysupplement questionnaire data (n = 1088), or who were pregnant and/or lactating (n = 170) wereexcluded, yielding a final analytic sample size of 9954 adults.
All demographic data used for this analysis were collected from participants in NHANES usingthe Computer-Assisted Personal Interview system during the household interview. Household foodsecurity status was measured using the USDA’s Household Food Security Survey Module; onehousehold reference person responded to 18 items for households with children, or 10 items forhouseholds without children. The USDA’s Household Food Security Survey Module is on a continuumcomprised of four different food security classifications, ranging from full, marginal, low, to very lowhousehold food security. “Full food security” describes a household with very little trouble or anxietyregarding household members gaining access to food, while “marginal food security” refers to anxietyregarding household members gaining access to food, without a reduction in the quantity, quality, orthe variety of foods consumed [7,8]. “Low food security” defines households that reduce the quality,variety, and desirability of foods, yet the quantity of foods consumed remains adequate [7,8]. “Verylow food security” exists when the quantity of foods consumed is inadequate, and eating patternsof the household are subsequently disrupted [7,8]. Households that were considered to have full ormarginal food security were classified as food secure (<3 affirmative responses); those with low orvery low food security were classified as food insecure (≥3 affirmative responses) [9]. Household foodsecurity is reflective of conditions over the previous 12 months, that serve as the inherent referenceperiod in the USDA’s Household Food Security Survey Module [10].
DS use in the previous 30 days was collected during the household interview via an in-homeinventory and the dietary supplement questionnaire. Participants were asked to show interviewers thecontainers for all products taken in the past 30 days. For each DS reported, interviewers recorded thename, manufacturer, form of the products (e.g., tablet) and dose per serving for selected single nutrientproducts from the label. Detailed information on the consumption frequency, amount, and duration of
72

Nutrients 2020, 12, 38
DS use were also collected for each product reported. Mean daily nutrient intakes from supplementalsources for each individual were calculated using the total number of reported days, amount taken perday, and the dose per serving of each product from the label. More information on the NHANES DScomponent protocol can be found elsewhere [5,11–13]. All information from DS was obtained from thedietary supplement questionnaire in the in-home inventory.
Dietary intake was self-reported in the MEC using an in-person 24 h dietary recall. A second24 h dietary recall was completed via telephone approximately 3–10 days after the MEC exam.Both 24 h recalls were collected by trained interviewers using the USDA’s automated multiple-passmethod [14,15]. The USDA Food and Nutrient Database for Dietary Studies and the NHANES DietarySupplement Database were used to convert foods, beverages, and DS as consumed to their respectivenutrient values [16,17].
The micronutrients chosen for presentation in the main tables of this analysis were selected basedon under-consumed micronutrients identified in the 2015–2020 Dietary Guidelines for Americansamong some subgroups within the U.S. population: calcium, magnesium, iron, potassium, choline,folate and vitamins A, C, D, and E [1,2]. Micronutrients associated with lower intakes from diet aloneamong the food insecure (calcium, magnesium, zinc, and vitamins A and B6) in a systematic reviewwere also included [4]. However, vitamins A and E were not available in the NHANES 2011–2014 DSdata files; thus, total nutrient intakes could not be estimated, and intakes are reflective of food sourcesonly for these vitamins in the supplementary material provided in Tables S1 and S2. Information on allof the additional micronutrients examined are provided in the supplementary material (Tables S1 andS2). It should be noted that the UL for folate only applies to the synthetic form, folic acid, obtained fromDS and fortified foods. Thus, folic acid was the only form of folate used to estimate the proportion ofthe population exceeding the UL. Sodium was excluded since negligible amounts are found in DS [18].
An adaptation of the National Cancer Institute (NCI) method [19,20] was used to estimate (1)distributions of usual micronutrient intakes (from foods alone and total) by men and women and (2)the proportions of the subpopulations (i.e., sex, food security status) whose usual intakes were aboveor below age and sex-specific DRIs. The NCI method is used to estimate the distributions of “usual”or “long-term mean daily” intakes by accounting for random measurement error (i.e., within-personvariation). It was adapted to estimate the contributions of DS to usual micronutrient intake estimatesthrough the incorporation of reported DS intakes from the dietary supplement questionnaire, usingthe method described by Bailey et al. [18,21]. Covariates incorporated in the usual intake modelsincluded day of the week of the dietary recall (weekend/weekday), interview sequence (first or seconddietary recall), and DS use overall. Categorical variables for sex and food security status were used forsubgroup analyses. Mean daily nutrient intakes from DS and their relative contribution to total intakeswere estimated by adding nutrients from supplemental sources to the adjusted distributions of usualintake from dietary sources to estimate the distributions of total usual micronutrient intake among theadult total population (DS users and nonusers combined) [18,22]. The relative contribution of DS tototal micronutrient intakes was calculated by dividing the total usual micronutrient intake from DS bythe total usual micronutrient intake from all sources (inclusive of foods and DS) at the population level(Table 1).
Total usual micronutrient intake distributions were compared to age and sex-specific DRIsestablished by the National Academies of Science, Engineering, and Medicine in order to compare totalusual micronutrient intakes to the DRIs, including the %< Estimated Average Requirement (EAR), %>Adequate Intake (AI), and %> Tolerable Upper Intake Level (UL) using the cut-point method [23,24].The EAR cut-point method assumes that the nutrient requirement distribution is symmetric; therefore,it cannot be applied to iron, since the requirement distribution for iron is skewed in reproductive-agedwomen [25]. Therefore, iron estimates are only presented relative to the EAR for men.
All statistical analyses were performed using SAS software (version 9.4; SAS Institute Inc., Cary,NC, USA) accounting for the NHANES complex survey design and sampling weights to adjust fordifferential non-response and non-coverage, and oversampling and post-stratification. Standard errors
73

Nutrients 2020, 12, 38
(SE) for all statistics of interest were approximated using Fay’s modified Balanced Repeated Replicationtechnique [26,27]. Differences in the proportion of the population with total usual micronutrientintakes < EAR or > AI within sex groups by food security status were compared using pairwise t-tests;a Bonferroni- adjusted p-value of <0.005 was considered statistically significant (Table 2, Table S2).Multiple comparisons were conducted using a pairwise t statistic to assess differences in the proportionof U.S. adult supplement users with total usual micronutrient intakes > UL within sex groups byfood security status; a Bonferroni-adjusted p-value of <0.0125 was considered statistically significant(Figure 2).
3. Results
In general, the proportion of nutrients from dietary sources was greater than the proportionfrom DS. However, the relative contributions of DS to total intake varied by nutrient, with thelowest contributions for choline, (0.5%), potassium (0.5%), phosphorus (0.5%), vitamin K (7.0%), andmagnesium (8.2%) (Table 1, Table S1). DS contributed over half of total intake for vitamins B6 (61%),B12 (93%), C (52%), and D (71%). However, even with high intakes of vitamins C and D from DS, theproportion of adults at risk of inadequacy remains high (Table 1). Most notably, for vitamin D, 98%of women and 92% of men in the U.S. were at risk of inadequate intake from foods alone, yet, theprevalence of vitamin D inadequacy among adults ranged from 59% to 66%, depending on the sex,even when taking into account nutrient intakes from DS. Smaller differences were found for calcium,magnesium, and vitamin C in both men and women, and for zinc and vitamin B6 in women alone.Calcium DS reduced the prevalence of at-risk intakes from 26% (foods alone) to 21% (total) amongmen and from 58% (foods alone) to 41% (total) among women, although, unlike vitamin D, calciumfrom supplemental sources varied, accounting for only 4% to 21% of total intake depending on thesex/food security group considered.
DS contributed a larger proportion to total usual intakes among adults living in food securehouseholds compared with those living in food insecure households for all nutrients examined(Figure 1). A higher prevalence of inadequate intakes was observed among adults living in foodinsecure than in food secure households, especially for magnesium, vitamin C, and vitamin D (Table 2).Adults living in food insecure households also had a lower prevalence of intakes exceeding the AIfor potassium when compared with those in food secure households (Table 2). Similar patterns wereobserved for intakes of copper, niacin, riboflavin, vitamin B12, and vitamin K in men and women, andphosphorous, selenium, and zinc in men alone (Table S2).
A small proportion of supplement users had total usual intakes that exceeded the UL for folicacid, vitamin D, calcium, or iron (Figure 2); but this was only significantly different for women by foodsecurity status with regard to calcium.
74

Nutrients 2020, 12, 38
Ta
ble
1.
Rel
ativ
eco
ntri
butio
nof
diet
ary
supp
lem
ents
toto
talu
sual
nutr
ient
inta
kes
and
the
estim
ated
perc
ent(
%)o
fusu
alin
take
s(f
oods
alon
ean
dto
tal)
belo
wth
eEs
tim
ated
Ave
rage
Req
uire
men
tor
abov
eth
eA
dequ
ate
Inta
kefo
rse
lect
nutr
ient
sam
ong
adul
ts(≥
19ye
ars)
inth
eU
.S.,
2011
–201
4.1
All
Ad
ult
sM
en
Wo
men
To
tal
Usu
al
Nu
trie
nt
Inta
kes
To
tal
Usu
al
Nu
trie
nt
Inta
kes
Usu
al
Inta
ke
fro
mF
oo
ds
To
tal
Usu
al
Nu
trie
nt
Inta
kes
Usu
al
Inta
ke
fro
mF
oo
ds
%C
on
trib
uti
on
fro
mD
S%<
EA
R/>
AI
(SE
)%
Co
ntr
ibu
tio
nfr
om
DS
%<
EA
R/>
AI
(SE
)%<
EA
R/>
AI
(SE
)%
Co
ntr
ibu
tio
nfr
om
DS
%<
EA
R/>
AI
(SE
)%<
EA
R/>
AI
(SE
)
Cal
cium
(mg)
13.2
%31
.0(1
.0)
7.5%
21.0
(1.0
)26
.0(1
.2)
19.5
%41
.0(1
.3)
58.0
(1.6
)Ir
on(m
g)2
16.9
%–
8.4%
0.1
(0.1
)0.
2(0
.1)
25.3
%–
–M
agne
sium
(mg)
8.2%
45.2
(1.0
)6.
6%46
.0(1
.2)
52.0
(1.3
)10
.1%
43.6
(1.2
)50
.7(1
.3)
Pota
ssiu
m(m
g)3
0.5%
37.0
(1.0
)0.
5%36
.0(1
.3)
35.0
(1.3
)0.
5%33
.0(1
.5)
33.0
(1.6
)Z
inc
(mg)
26.0
%16
.8(0
.7)
21.0
%12
.7(1
.1)
16.3
(1.4
)32
.1%
13.2
(1.1
)17
.3(1
.2)
Cho
line
(mg)
30.
5%12
.3(0
.6)
0.3%
12.0
(1.1
)11
.7(1
.1)
0.5%
3.6
(0.7
)3.
4(0
.7)
Fola
te(D
FE,μ
g)4
27.2
%9.
0(0
.8)
21.4
%5.
0(0
.6)
6.0
(0.8
)33
.4%
12.0
(1.2
)15
.9(1
.6)
Vit
amin
B6(m
g)61
.4%
6.2
(0.6
)52
.7%
1.9
(0.5
)2.
6(0
.6)
71.2
%10
.6(0
.8)
14.4
(1.0
)V
itam
inC
(mg)
51.7
%35
.0(1
.1)
48.1
%39
.0(1
.7)
50.8
(1.7
)55
.0%
32.0
(1.2
)44
.0(1
.4)
Vit
amin
D(μ
g)70
.6%
63.1
(0.7
)59
.8%
66.4
(1.0
)91
.5(0
.9)
78.2
%59
.1(1
.2)
98.4
(0.3
)
Abb
revi
atio
ns:D
S,di
etar
ysu
pple
men
t;EA
R,E
stim
ated
Ave
rage
Req
uire
men
t;A
I,A
dequ
ate
Inta
ke;S
E,st
anda
rder
ror.
1Th
ean
alyt
icsa
mpl
ein
clud
esin
divi
dual
s≥1
9ye
ars
old
that
wer
eno
tpre
gnan
tor
lact
atin
gw
ithco
mpl
ete
info
rmat
ion
for
the
day
1an
d2,
24h
diet
ary
reca
lls.2
Prop
ortio
nof
the
popu
latio
nbe
low
the
EAR
for
iron
was
unab
leto
beas
sess
edus
ing
the
cut-
poin
tmet
hod
inw
omen
due
toa
skew
edd
istr
ibut
ion
ofnu
trie
ntre
quir
emen
ts.3
Ind
icat
es%>
AIr
athe
rth
an%<
EA
R.T
his
occu
rsw
hen
suffi
cien
tsci
enti
ficev
iden
ceis
not
avai
labl
eto
esta
blis
han
EAR
.4A
sdi
etar
yfo
late
equi
vale
nts
(DFE
s).1
DFE=
1μ
gfo
odfo
late=
0.6μ
gof
folic
acid
from
fort
ified
food
oras
asu
pple
men
tcon
sum
edw
ithfo
od=
0.5μ
gof
asu
pple
men
ttak
enon
anem
pty
stom
ach.
75

Nutrients 2020, 12, 38
Figure 1. Relative contribution of foods/beverages and dietary supplements to total usual intakesfor selected nutrients by age group among men and women by food security status (≥19 years)in the U.S., 2011–2014. 1 (1 The analytic sample includes individuals ≥19 years old that were notpregnant or lactating with complete information for food security and the day 1 and 2, 24 h dietaryrecalls. Percentages above each bar represent the relative contribution from dietary supplements).Abbreviations: M, Men; W, Women; DFE, Dietary Folate Equivalents.
76

Nutrients 2020, 12, 38
Table 2. Proportion of the population falling below the Estimated Average Requirement or above theAdequate Intake from total usual nutrient intakes of select nutrients, by food security status, amongadults (≥19 years) in the U.S., 2011–2014. 1,2
Food Security Status, % < EAR/> AI (SE)
Food Insecure Food Secure
Men (n, %) (915, 14.9%) (3993, 85.1%)Calcium (mg) 25.0 (2.2) 20.0 (1.3)
Iron (mg) 3 0.3 (0.2) 0.1 (0.1)Magnesium (mg) 57.2 (1.7) a 43.9 (1.5) b
Potassium (mg) 4 25.0 (2.5) a 37.0 (1.6) b
Zinc (mg) 20.1 (2.4) a 11.3 (1.1) b
Choline (mg) 4 12.6 (2.3) 11.8 (1.1)Folate (DFE, μg) 5 7.0 (1.8) 4.0 (0.7)Vitamin B6 (mg) 6.1 (1.3) a 1.4 (0.4) b
Vitamin C (mg) 49.0 (3.8) a 37.0 (1.7) b
Vitamin D (μg) 79.2 (1.5) a 64.1 (1.2) b
Women (n, %) (1010, 15.6%) (4034, 84.4%)Calcium (mg) 46.0 (3.0) 40.0 (1.3)
Iron (mg) 3 – –Magnesium (mg) 56.9 (2.6) a 40.9 (1.4) b
Potassium (mg) 4 24.0 (3.1) a 35.0 (1.7) b
Zinc (mg) 17.1 (2.8) 12.2 (1.3)Choline (mg) 4 4.4 (1.5) 3.5 (0.6)
Folate (DFE, μg) 5 15.0 (3.5) 11.0 (1.3)Vitamin B6 (mg) 19.0 (1.6) a 8.8 (0.9) b
Vitamin C (mg) 42.0 (2.4) a 29.0 (1.3) b
Vitamin D (μg) 74.7 (1.7) a 56.2 (1.2) b
Abbreviations: EAR, Estimated Average Requirement; AI, Adequate Intake; SE, standard error. 1 The analyticsample includes individuals ≥19 years old that were not pregnant/lactating with complete information for the day1 and 2, 24 h dietary recalls. 2 Different superscript letters denote a significant difference between food securitycategories at a p-value < 0.005. 3 Proportion of the population below the EAR for iron was unable to be assessedusing the cut-point method in women due to a skewed distribution of nutrient requirements. 4 Indicates %> AIrather than %< EAR. This occurs when sufficient scientific evidence is not available to establish an EAR. 5 As dietaryfolate equivalents (DFEs). 1 DFE = 1 μg food folate = 0.6 μg of folic acid from fortified food or as a consumed withfood = 0.5 μg of a supplement taken on an empty stomach.
77

Nutrients 2020, 12, 38
Figure 2. Estimated percent (%) of total micronutrient intakes above the Tolerable Upper Intake Level(UL) by food security status among adult (≥19 years) supplement users in the U.S., 2011–2014. 1,2 (1 Theanalytic sample includes individuals ≥19 years old that were not pregnant or lactating with completeinformation for food security and the day 1 and 2, 24 h dietary recalls. Numerical data labels within eachbar represent the estimated proportion (%) of U.S. adult supplement users with intakes greater thanthe UL. 2 Different superscript letters denote a significant difference between food security categorieswithin sex at a p-value < 0.0125.).
4. Discussion
Our findings suggest that DS aid in reducing the proportion of the population at risk for inadequateintakes, especially for vitamin D, calcium, and vitamin C. However, many Americans still have lowintakes of some micronutrients, even with the use of DS, which is especially true among U.S. adultswith food insecurity. While this study focuses on individual nutrients, the health effects of a diet,especially those related to chronic diseases, are determined by the sum and interaction of many foodconstituents in addition to nutrients. Many of these constituents are not yet fully understood and donot have DRIs. Plant products are particularly complex with many bioactive components (flavonoids,various types of fiber, etc.). The recognized health benefits of diets rich in fruits, vegetables, and wholegrains, for example, are attributable to more than their nutrient content [1]. Consequently, the DietaryGuidelines for Americans focus on the quality of the overall dietary pattern. To address the problem offood insecurity, the 2015–2020 Dietary Guidelines for Americans call for supporting individuals inmaking healthy food choices by expanding nutrition-assistance programs and creating networks andpartnerships to address the problem. One example is improving the offerings at food pantries [28].Another is expanding programs, such as the Expanded Food and Nutrition Education Program andSNAP-Ed, which teach food resource management [29].
Two studies have confirmed that total usual nutrient intakes, inclusive of DS, vary by incomealone using the family poverty-to-income ratio (PIR) [21,30]. However, as outlined by the Academyof Nutrition and Dietetics, food security results from a constellation of factors that may predisposeindividuals to nutrition risk beyond income alone, including environmental factors like transportation,
78

Nutrients 2020, 12, 38
food prices, housing costs, unemployment, and social capital, among others [31]. In a previous analysisin Canada, Kirkpatrick et al. revealed a higher prevalence of micronutrient inadequacy for severalmicronutrients among adolescents and adults living in food insecure as compared with food securehouseholds, specifically for vitamin A, thiamin, riboflavin, vitamin B6, folate, vitamin B12, magnesium,phosphorus, and zinc [32]. The present analysis extends prior foods-based work by examining totalmicronutrient intakes, inclusive of DS, by food security status. Adults living with food insecurity hada higher risk of micronutrient inadequacy for most micronutrients examined, except for calcium, iron(examined only in men), folate, or choline, when compared with food secure adults. Most notably,in addition to the micronutrients identified by Kirkpatrick et al. [32], the present analysis observed ahigher prevalence of micronutrient inadequacy among adults living with food insecurity for copper,potassium, niacin, and vitamins C, D, E, and K in both men and women, and selenium in men alone.While nutrient inadequacy was more of a concern among adults living in food insecure households, allDS users, regardless of food security status, had an increased likelihood of usual intakes above the ULfor iron, calcium, vitamin D, and folic acid, increasing risk of adverse health effects [25,33,34].
A strength of this analysis is that the models applied to examine total usual intakes adjust for theeffects of random measurement error to the extent possible, in addition to using the recommendedmethod of adding mean daily nutrient intakes from supplemental sources to the adjusted usual nutrientintakes from dietary sources [18,22]. USDA’s automated multiple-pass method is a state-of-the-artmethod for capturing dietary data, as is the Food and Nutrient Database for Dietary Studies thatsupports it. However, self-reported dietary data are prone to systematic measurement error, likeenergy underreporting, that may result in an underestimation of micronutrient intakes from the diet.Furthermore, the analysis of nutrients in DS relies on label declarations on products, rather thananalytically derived values, that are likely to result in an underestimation of micronutrients from DS [35].Furthermore, we assume that the DS intake reported for the past 30 days during the in-home interviewreflects long-term, habitual DS intake, but little is known about the measurement error structure ofDS reporting [18]. NHANES is a nationally representative survey of the U.S. noninstitutionalizedpopulation. However, the response rates for the years 2011–2012 and 2013–2014 for adults were 66%and 65%, respectively [36,37], and total usual nutrient intakes could not be estimated for vitaminsA and E, as these nutrients are not included in the current NHANES DS data files. An additionallimitation is that the bioavailability of nutrients from DS compared to the bioavailability of nutrientsfrom foods remains largely unknown.
5. Conclusions
In summary, our findings are consistent with previous reports that demonstrate that many U.S.adults have inadequate intakes of potassium, magnesium, calcium, vitamin D, and/or vitamin C, evenwith the use of DS, and that those living with food insecurity have a higher prevalence of micronutrientrisk than those not living with food insecurity. These findings suggest that, while DS can be helpful inmeeting nutrient requirements for adults for some nutrients, potential excess may also be of concernfor certain nutrients among supplement users.
Supplementary Materials: The following are available online at http://www.mdpi.com/2072-6643/12/1/38/s1,Table S1: Relative contribution of dietary supplements to total usual nutrient intakes and the estimated percent(%) of usual intakes (foods alone and total) below the Estimated Average Requirement or above the AdequateIntake for other nutrients among adults (≥19 years) in the U.S., 2011–2014, Table S2: Proportion of the populationfalling below the Estimated Average Requirement or above the Adequate Intake from total usual nutrient intakesof other nutrients, by food security status among adults (≥ 19 years) in the U.S., 2011–2014.
Author Contributions: A.E.C., S.J., and R.L.B. designed the research and concepts presented, and performed theanalysis. A.E.C., S.J., and R.L.B. wrote sections of the paper. J.A.T., H.A.E.-M., K.W.D., J.J.G., P.M.G., J.T.D., N.P.,and A.B. provided critical review and insights presented. All authors read and approved the final version of themanuscript. All authors have read and agreed to the published version of the manuscript.
Funding: This research was funded by NIH/NCI, grant number U01CA215834.
79

Nutrients 2020, 12, 38
Conflicts of Interest: A.E.C., S.J., J.A.T., K.W.D., J.J.G., H.A.E.-M., P.M.G., A.J.M., D.G.R., and A.B. have noconflicts of interest. R.L.B. is a consultant to the NIH Office of Dietary Supplements, reports grants from NationalInstitutes of Health/National Cancer Institute; in the past she has served as a consultant to Nestle/Gerber, theGeneral Mills Bell Institute, RTI International, and Nutrition Impact; Dr. Bailey is a trustee of the InternationalFood Information Council and a board member of International Life Sciences Institute- North America. In thepast she has received travel support to present her research on dietary supplements. J.T.D reports personal feesfrom McCormick Spice, The Mushroom Council, Bay State Milling, ConAgra Foods (until 2018), and Nestlé, ontopics outside the submitted work, and stock in several food and drug companies. The funders had no role in thedesign of the study; in the collection, analyses, or interpretation of data; in the writing of the manuscript; or in thedecision to publish the results.
References
1. U.S. Department of Health and Human Services and U.S. Department of Agriculture. In 2015–2020 DietaryGuidelines for Americans, 8th ed.; Skyhorse Publishing Inc.: New York, NY, USA, 2017.
2. Scientific report of the 2015 Dietary Guidelines Advisory Committee. Available online: https://health.gov/dietaryguidelines/2015-scientific-report/ (accessed on 12 December 2019).
3. Anderson, S.A. Core indicators of nutritional state for difficult-to-sample populations. J. Nutr. 1990, 120,1555–1600. [CrossRef] [PubMed]
4. Hanson, K.L.; Connor, L.M. Food insecurity and dietary quality in US adults and children: A systematicreview. Am. J. Clin. Nutr. 2014, 100, 684–692. [CrossRef] [PubMed]
5. Cowan, A.E.; Jun, S.; Gahche, J.J.; Tooze, J.A.; Dwyer, J.T.; Eicher-Miller, H.A.; Bhadra, A.; Guenther, P.M.;Potischman, N.; Dodd, K.W.; et al. Dietary supplement use differs by socioeconomic and health-relatedcharacteristics among US adults, NHANES 2011–2014. Nutrients 2018, 10, 1114. [CrossRef] [PubMed]
6. Johnson, C.L.; Dohrmann, S.M.; Burt, V.L.; Mohadjer, L.K. National Health and Nutrition ExaminationSurvey: Sample design, 2011–2014. Vital Health Stat. 2 2014, 162, 1–33.
7. National Research Council. Food Insecurity and Hunger in the United States: An Assessment of the Measure;National Academies Press: Washington, DC, USA, 2006.
8. Eicher-Miller, H.A.; Mason, A.C.; Weaver, C.M.; McCabe, G.P.; Boushey, C.J. Food insecurity is associatedwith iron deficiency anemia in US adolescents. Am. J. Clin. Nutr. 2009, 90, 1358–1371. [CrossRef]
9. Bickel, G.; Nord, M.; Price, C.; Hamilton, W.; Cook, J. Measuring Food Security in the United States: Guide toMeasuring Household Food Insecurity; United States Department of Agriculture: Washington, DC, USA, 2000.
10. U.S. Adult Food Security Survey Module: Three-Stage Design, With Screeners Economic Research Service.Available online: https://www.ers.usda.gov/media/8279/ad2012.pdf/ (accessed on 12 December 2019).
11. Bailey, R.L.; Fulgoni, V.L., 3rd; Keast, D.R.; Dwyer, J.T. Dietary supplement use is associated with higherintakes of minerals from food sources. Am. J. Clin. Nutr. 2011, 94, 1376–1381. [CrossRef]
12. Gahche, J.J.; Bailey, R.L.; Potischman, N.; Dwyer, J.T. Dietary supplement use was very high among olderadults in the United States in 2011–2014. J. Nutr. 2017, 147, 1968–1976. [CrossRef]
13. Bailey, R.L.; Gahche, J.J.; Miller, P.E.; Thomas, P.R.; Dwyer, J.T. Why US adults use dietary supplements.JAMA Intern. Med. 2013, 173, 355–361. [CrossRef]
14. Blanton, C.A.; Moshfegh, A.J.; Baer, D.J.; Kretsch, M.J. The USDA automated multiple-pass method accuratelyestimates group total energy and nutrient intake. J. Nutr. 2006, 136, 2594–2599. [CrossRef]
15. Moshfegh, A.J.; Rhodes, D.G.; Baer, D.J.; Murayi, T.; Clemens, J.C.; Rumpler, W.V.; Paul, D.R.; Sebastian, R.S.;Kuczynski, K.J.; Ingwersen, L.A.; et al. The US Department of Agriculture automated multiple-pass methodreduces bias in the collection of energy intakes. Am. J. Clin. Nutr. 2008, 88, 324–332. [CrossRef]
16. Food and Nutrient Database for Dietary Studies 2011–2012. Available online: https://www.ars.usda.gov/ARSUserFiles/80400530/pdf/fndds/fndds_2011_2012.pdf (accessed on 10 October 2019).
17. Centers for Disease Control and Prevention—National Center for Health Statistics. NHANES 2013–2014Dietary Data. Available online: https://wwwn.cdc.gov/nchs/nhanes/Search/DataPage.aspx?Component=Dietary&CycleBeginYear=2013 (accessed on 10 October 2019).
18. Bailey, R.L.; Dodd, K.W.; Gahche, J.J.; Dwyer, J.T.; Cowan, A.E.; Jun, S.; Eicher-Miller, H.A.; Guenther, P.M.;Bhadra, A.; Thomas, P.R.; et al. Best practices for dietary supplement assessment and estimation of totalusual nutrient intakes in population-level research and monitoring. J. Nutr. 2019, 149, 181–197. [CrossRef][PubMed]
80
Nutrients 2020, 12, 38
19. Dodd, K.W.; Guenther, P.M.; Freedman, L.S.; Subar, A.F.; Kipnis, V.; Midthune, D.; Tooze, J.A.;Krebs-Smith, S.M. Statistical methods for estimating usual intake of nutrients and foods: A review ofthe theory. J. Am. Diet. Assoc. 2006, 106, 1640–1650. [CrossRef] [PubMed]
20. Tooze, J.A.; Midthune, D.; Dodd, K.W.; Freedman, L.S.; Krebs-Smith, S.M.; Subar, A.F.; Guenther, P.M.;Carroll, R.J.; Kipnis, V. A new statistical method for estimating the usual intake of episodically consumedfoods with application to their distribution. J. Am. Diet. Assoc. 2006, 106, 1575–1587. [CrossRef] [PubMed]
21. Bailey, R.L.; Akabas, S.R.; Paxson, E.E.; Thuppal, S.V.; Saklani, S.; Tucker, K.L. Total usual intake of shortfallnutrients varies with poverty among US adults. J. Nutr. Educ. Behav. 2017, 49, 639–646.e3. [CrossRef]
22. Garriguet, D. Combining nutrient intake from food/beverages and vitamin/mineral supplements. Health Rep.2010, 21, 71–84.
23. Institute of Medicine. Dietary Reference Intakes: Applications in Dietary Assessment; The National AcademiesPress: Washington, DC, USA, 2000; p. 306.
24. Institute of Medicine. Dietary Reference Intakes: The Essential Guide to Nutrient Requirements (2006); NationalAcademies Press: Washington, DC, USA, 2006.
25. Institute of Medicine Panel on Micronutrients. Dietary Reference Intakes for Vitamin A, Vitamin K, Arsenic,Boron, Chromium, Copper, Iodine, Iron, Manganese, Molybdenum, Nickel, Silicon, Vanadium, and Zinc; NationalAcademies Press (US): Washington, DC, USA, 2001.
26. Burt, V.L.; Cohen, S.B. A comparison of methods to approximate standard errors for complex survey data.Rev. Public Data Use 1984, 12, 159–168.
27. Shao, J.; Rao, J. Modified balanced repeated replication for complex survey data. Biometrika 1999, 86, 403–415.28. Wright, B.N.; Bailey, R.L.; Craig, B.A.; Mattes, R.D.; McCormack, L.; Stluka, S.; Franzen-Castle, L.; Henne, B.;
Mehrle, D.; Remley, D.; et al. Daily dietary intake patterns improve after visiting a food pantry amongfood-insecure rural midwestern adults. Nutrients 2018, 10, 583. [CrossRef]
29. Rivera, R.L.; Maulding, M.K.; Eicher-Miller, H.A. Effect of supplemental nutrition assistanceprogram-education (snap-ed) on food security and dietary outcomes. Nutr. Rev. 2019, 77, 903–921.[CrossRef]
30. Blumberg, J.B.; Frei, B.; Fulgoni, V.L.; Weaver, C.M.; Zeisel, S.H. Contribution of dietary supplements tonutritional adequacy by socioeconomic subgroups in adults of the United States. Nutrients 2017, 10, 4.[CrossRef]
31. Holben, D.H.; Marshall, M.B. Position of the Academy of Nutrition and Dietetics: Food insecurity in theunited states. J. Acad. Nutr. Diet. 2017, 117, 1991–2002. [CrossRef] [PubMed]
32. Kirkpatrick, S.I.; Tarasuk, V. Food insecurity is associated with nutrient inadequacies among Canadian adultsand adolescents. J. Nutr. 2008, 138, 604–612. [CrossRef] [PubMed]
33. Institute of Medicine Standing Committee on the Scientific Evaluation of Dietary Reference Intakes. DietaryReference Intakes for Thiamin, Riboflavin, Niacin, Vitamin B6, Folate, Vitamin B12, Pantothenic Acid, Biotin, andCholine; National Academies Press (US): Washington, DC, USA, 1998.
34. Institute of Medicine Committee to Review Dietary Reference Intakes for Calcium and Vitamin D. In DietaryReference Intakes for Calcium and Vitamin D; Ross, A.C.; Taylor, C.L.; Yaktine, A.L.; Del Valle, H.B. (Eds.)National Academies Press (US) National Academy of Sciences: Washington, DC, USA, 2011.
35. Andrews, K.W.; Gusev, P.A.; McNeal, M.; Savarala, S.; Dang, P.T.V.; Oh, L.; Atkinson, R.; Pehrsson, P.R.;Dwyer, J.T.; Saldanha, L.G.; et al. Dietary Supplement Ingredient Database (DSID) and the application ofanalytically based estimates of ingredient amount to intake calculations. J. Nutr. 2018, 148, 1413S–1421S.[CrossRef] [PubMed]
36. Unweighted Response Rates for NHANES 2011–2012 by Age and Gender. Available online: https://wwwn.cdc.gov/nchs/data/nhanes3/ResponseRates/rrt1112.pdf (accessed on 12 December 2019).
37. Unweighted Response Rates for NHANES 2013–2014 by Age and Gender. Available online: https://wwwn.cdc.gov/nchs/data/nhanes3/ResponseRates/2013_2014_response_rates.pdf (accessed on 12 December 2019).
© 2019 by the authors. Licensee MDPI, Basel, Switzerland. This article is an open accessarticle distributed under the terms and conditions of the Creative Commons Attribution(CC BY) license (http://creativecommons.org/licenses/by/4.0/).
81


nutrients
Article
Household Food Insecurity and the Association withCumulative Biological Risk among Lower-IncomeAdults: Results from the National Health andNutrition Examination Surveys 2007–2010
Cindy W. Leung * and Megan S. Zhou
Department of Nutritional Sciences, School of Public Health, University of Michigan, Ann Arbor, MI 48109, USA;[email protected]* Correspondence: [email protected]; Tel.: +1-734-647-9087
Received: 10 April 2020; Accepted: 20 May 2020; Published: 23 May 2020
Abstract: Household food insecurity has been associated with adverse health outcomes; however,the mechanisms underlying these associations are not well-defined. Using data from 5005 adultsfrom the 2007–2010 National Health and Nutrition Examination Surveys (NHANES), we examinedassociations between household food insecurity and cumulative biological risk, a measure of thebody’s physiological response to chronic stress. Household food security was assessed using the18-item Household Food Security Survey Module. Marginal food security refers to 1–2 positiveresponses, and food insecurity refers to ≥3 positive responses. The cumulative biological risk scoreswere calculated based on the distributions of ten biomarkers from the cardiovascular, metabolic,and immune systems. Elevated biological risk was defined as a risk score of ≥3. Multivariableregression models were used to examine associations between food security and cumulative biologicalrisk scores, adjusting for sociodemographic characteristics. After multivariable adjustment, foodinsecurity was associated with a 0.14-unit higher cumulative biological risk score (95% CI 0.05–0.22,p-trend = 0.003) and higher odds of elevated biological risk (OR 1.20, 95% CI 1.05–1.37, p-trend =0.003). These associations differed by gender. Among women, food insecurity was associated with0.30-unit higher cumulative biological risk score (95% CI 0.14–0.45, p-trend = 0.0004) and higherodds of elevated biological risk (OR 1.61, 95% CI 1.29–2.00, p-trend < 0.0001). These associationswere not observed in men. Women experiencing food insecurity demonstrated elevated levels ofbiological risk. These findings support the hypothesis that food insecurity may be associated withwomen’s chronic health outcomes through the pathway of chronic stress. Further research is neededto understand why these associations were not observed in men.
Keywords: food insecurity; allostatic load; biological risk; chronic stress; National Health andNutrition Examination Surveys
1. Introduction
Food insecurity, defined as inadequate access and availability of food due to a lack of monetaryresources, has persisted in the United States since its routine measurement in national populationsurveys in the 1990s [1]. In 2018, it was estimated that 14.3 million households or 11.1% of U.S.households experienced food insecurity during the year [1]. Household food insecurity has beenassociated with numerous physical and mental health outcomes among low-income adults, includinghigher levels of obesity [2–4], hypertension [5], diabetes [6,7] and poorer diabetes management [8,9],metabolic syndrome [10], lower cognitive function [11,12], depression [13,14], and poorer overallhealth [15,16]. The mechanisms underlying these associations have not been fully elucidated; however,
Nutrients 2020, 12, 1517; doi:10.3390/nu12051517 www.mdpi.com/journal/nutrients83

Nutrients 2020, 12, 1517
a number of studies have demonstrated associations between household food insecurity and modifiablehealth behaviors, such as poorer diet quality [17–19], lower levels of physical activity [20], higher ratesof smoking [21–23], and poorer sleep outcomes [24,25]. Several researchers have also alluded to therole of chronic stress in explaining the observed associations [14,26–30], though none of these studieshave been able to test the association between food insecurity and chronic stress directly.
Chronic stress refers to the repeated activation of major body systems in response to externalstimuli perceived to be threatening [31]. In response to a stressor, the hypothalamic–pituitary–adrenal(HPA) axis and the sympathetic–adrenal–medullary (SAM) systems are activated, triggering a releaseof hormones and cytokines that act on multiple organ systems [31,32]. The concept of allostatic loadhas been used to describe how repeated exposure and prolonged response to stress can dysregulatethese organ systems, resulting in “wear and tear” on the body over time [32]. Operationally, there isno single, gold-standard approach for measuring allostatic load, though allostatic load scores ofteninclude a combination of biomarkers from neuroendocrine, immune, metabolic, and cardiovascularsystems—all known to be affected by the secretion of stress hormones and inflammatory markers [33].Thus, allostatic load is theorized to represent the body’s cumulative physiological response to chronicstress and to account for individual variability in the appraisal of different stress exposures, which maybe more relevant to predicting subsequent health outcomes than the perception of stress [34].
Prior research has explored the role of the allostatic load as a framework through which to understandhealth disparities. Greater socioeconomic adversity [35–38] and minority race/ethnicity [39–41] haveboth been associated with elevated allostatic load in numerous studies. Household food insecurity isboth a form of socioeconomic adversity and an issue with relatively high prevalence in low-income andminority racial/ethnic households [1]. However, its relation to allostatic load has only been exploredin one study [42]. In an analysis of 733 Puerto Rican adults residing in Boston, food insecurity wasassociated with greater dysregulation of the neuroendocrine and inflammatory systems, but not totalallostatic load [42]. In order to understand the pathways connecting food insecurity and adverse healthoutcomes, more research is needed to examine this association in a larger and more representativesample of adults.
In the present study, neuroendocrine markers are important components of allostatic loadmeasurement but were unavailable in the National Health and Nutrition Examination Surveys(NHANES). Thus, we created a score to represent a cumulative biological risk, guided by the allostaticload framework. The objective of the present study was to examine the association between householdfood insecurity and cumulative biological risk in a national sample of adults. We hypothesized thatadults who experienced more severe household food insecurity would demonstrate greater cumulativebiological risk.
2. Materials and Methods
2.1. Study Population
Administered by the National Center for Health Statistics, NHANES is an ongoing, multistagesurvey designed to be representative of the civilian, noninstitutionalized U.S. population. NHANEScollects information on demographic indicators and health outcomes through interviews, in-personexaminations, and laboratory testing. Data from 2007 to 2008 and from 2009 to 2010 were combined inthe present study, representing the most recent years in which all markers of cumulative biological riskwere routinely collected (e.g., C-reactive protein was not assessed in NHANES 2011–2012 or 2013–2014).The analytic population was further restricted to adults between the ages of 20–65 and with householdincomes ≤300% of the federal poverty level (FPL). An income threshold of 300% FPL was chosenbecause household food insecurity is relatively uncommon among households with incomes >300%FPL, and inclusion of a lower-income sample reduces the potential for confounding by socioeconomicstatus, as has been done in prior studies [6,17,43]. Pregnant women were also excluded, as body massindex (BMI) was one of the markers of biological risk. The analytic sample included 5005 adults.
84

Nutrients 2020, 12, 1517
2.2. Food Security Status
The primary exposure of interest was household food security, measured using the 18-item U.S.Household Food Security Survey Module [44]. Questions were asked in three stages and attributerelated experiences or behaviors to insufficient resources to buy food over the past 12 months. A scorewas created by summing the affirmative responses of the 18 questions, with higher scores indicatingmore severe food insecurity. Food security was defined as 0 affirmative responses, meaning thehousehold had no indicators of insufficient food access. Marginal food security was defined as1–2 affirmative responses and refers to mild indicators of insufficient food access such as anxietyover the food supply. Food insecurity was defined as three or more affirmative responses and refersto multiple indicators of insufficient food access, including reducing the quality and the variety ofthe amount of food consumed by at least one member of the household. Food insecurity refers tothe combined categories of low food security (i.e., 3–5 affirmative responses in households withoutchildren or 3–7 affirmative responses in households with children) and very low food security(i.e., 6–10 affirmative responses in households without children or 8–18 affirmative responses inhouseholds with children). Food insecurity categorizations and definitions are in accordance with theU.S. Department of Agriculture [44].
2.3. Cumulative Biological Risk
To assess cumulative biological risk, we included the following ten biomarkers: (1) systolicblood pressure, (2) diastolic blood pressure, (3) body mass index (BMI), (4) glycohemoglobin, (5) totalcholesterol, (6) high-density lipoprotein (HDL) cholesterol, (7) total/HDL cholesterol ratio, (8) C-reactiveprotein, (9) albumin, and (10) estimated glomerular filtration rate (eGFR). The selection of biomarkersfor the present study was guided by the availability of data within NHANES and on the basis ofprevious research [45–48]. Systolic blood pressure, diastolic blood pressure, total cholesterol, HDLcholesterol, and pulse represented the cardiovascular system. BMI, glycohemoglobin, albumin,and eGFR represented the metabolic system. C-reactive protein represented the immune system.
Each biomarker was categorized using clinically-relevant guidelines for low-risk, moderate-risk,and high-risk categories [47]. The cut-points used were: (1) systolic blood pressure: <120 mmHg,120–<150 mmHg, and ≥150 mmHg; (2) diastolic blood pressure: <80 mmHg, 80–<90 mmHg,and ≥90 mmHg; (3) BMI: <25 kg/m2, 25–<30 kg/m2, ≥30 kg/m2; (4) glycohemoglobin: <5.7%,5.7–<6.5%, and ≥6.5%; (5) total cholesterol: <200 mg/dL, 200–<240 mg/dL, ≥240 mg/dL; (6) HDLcholesterol: ≥60 mg/dL, 40–<60 mg/dL, and <40 mg/dL; (7) total/HDL ratio: <5; 5–<6, ≥6; (8) C-reactiveprotein: <1 mg/L, 1–<3 mg/L, and ≥3 mg/L; (9) albumin: ≥3.8, 3.0–<3.8, and <3.0; and (10) eGFR:≥60 mL/min/1.73 m2, 30–<60 mL/min/1.73 m2, and <30 mL/min/1.73 m2. Each biomarker was scoredas zero points for low risk, 0.5 points for moderate risk, and one point for high risk. Adults whoreported taking medication for high blood pressure, high cholesterol, or diabetes were also assigned tothe high-risk groups for systolic and diastolic blood pressure, total cholesterol, and glycohemoglobin,respectively. A cumulative biological risk score was then created as the sum of the risk scores acrossthe ten components, ranging from 0 (lowest) to 10 (highest). Similar to prior studies [45,46], elevatedbiological risk was defined as a score ≥3. Both continuous and dichotomous cumulative biological riskscores were examined as primary outcomes.
2.4. Study Covariates
Sociodemographic covariates were selected as variables hypothesized to be joint predictors ofthe association between food insecurity and cumulative biological risk, guided by the prior literature.These included age (continuous), gender, race/ethnicity (Non-Hispanic White, Non-Hispanic Black,Hispanic, Other), educational attainment (<12 years, high school graduate or equivalent, some college,or college graduate), household income relative to the federal poverty line (continuous), and maritalstatus (married or living with a partner, never married, or separated, widowed, or divorced).
85

Nutrients 2020, 12, 1517
2.5. Statistical Analysis
Complex sampling weights for the mobile examination center were recalculated and usedto account for different sampling probabilities and participation rates across the four-year period.Sampling weights were used in all subsequent analyses. Differences in sociodemographic characteristicsby household food security were compared using univariate regression for continuous variables andχ2 tests for categorical variables. Next, the distributions in individual biomarkers by household foodsecurity were compared using univariate regression and χ2 tests. Multivariable linear and logisticregression models were used to examine associations between food security and cumulative biologicalrisk. Differences in these associations by gender were evaluated by testing the significance of theinteraction terms between household food security and gender on the outcomes. Models were firstadjusted for age and gender, and second for all other sociodemographic covariates (race/ethnicity,educational attainment, household income, and marital status). In all models, age and householdincome were modeled as linear and quadratic terms to allow for a curvilinear relationship withcumulative biological risk. In a sensitivity analysis, we further examined the associations between thehousehold food security and cumulative biological risk using a four-category household food securityvariable. Statistical tests were two-sided, and significance was considered at p < 0.05. Statisticalanalyses were performed with SAS 9.3 (SAS Institute Inc., Cary, NC, USA).
3. Results
In the analytic population of 5005 adults, 59.3% were food-secure, 14.4% were marginally foodsecure, and 26.2% were food-insecure. Table 1 shows the differences in the sociodemographiccharacteristics by household food security. Compared to food-secure adults, marginally food-secureand food-insecure adults were more likely to be of younger age, of minority race/ethnicity background,have lower educational attainment, have lower household income, and were more likely to be nevermarried, or separated, divorced, or widowed.
Bivariate comparisons of biomarkers comprising cumulative biological risk and householdfood security are shown in Table 2. Compared to food-secure adults, marginally food-secure andfood-insecure adults were more likely to have higher mean glycohemoglobin (p = 0.01), C-reactiveprotein (p = 0.005), and albumin (p = 0.0002). Significant differences were also evident for some riskcategories. Marginally food-secure adults were more likely to be at moderate- or high-risk for systolicblood pressure (p = 0.04), and both marginally food-secure and food-insecure adults were more likelyto be at moderate- or high-risk for HDL cholesterol (p = 0.05). There were no other significant bivariateassociations between individual biomarkers and food security status.
Table 3 shows the associations between household food security and cumulative biological risk.Food insecurity was associated with a 0.22-point greater cumulative biological risk score (95% CI0.11–0.32, p-trend = 0.0002), which remained significant after multivariate adjustment (β = 0.14, 95% CI0.05–0.22, p-trend = 0.003). Although the associations between marginal food security and cumulativebiological risk and between food insecurity and cumulative biological risk both appeared stronger inwomen than in men, the interaction was not statistically significant (p-interaction = 0.09).
When examining elevated biological risk (score ≥3), food insecurity was associated with higherodds of elevated biological risk (OR 1.20, 95% CI 1.05–1.37, p-trend = 0.003), after adjusting forsociodemographic characteristics. This association was significantly modified by gender (p-interaction= 0.03). Among women, food insecurity was associated with elevated biological risk (OR 1.61, 95% CI1.29–2.00, p-trend < 0.0001). Among men, no association was observed between food insecurity andelevated biological risk (OR 0.93, 95% CI 0.72–1.20, p-trend = 0.70). A sensitivity analysis using afour-category household food security variable showed similar results with cumulative biological riskscores and elevated biological risk (Supplemental Table S1).
86

Nutrients 2020, 12, 1517
Ta
ble
1.
Hou
seho
ldfo
odse
curi
tyan
dso
ciod
emog
raph
icch
arac
teri
stic
sof
5005
adul
ts(2
0–65
year
)wit
hho
useh
old
inco
mes≤3
00%
ofth
efe
der
alpo
vert
yle
vel:
Nat
iona
lHea
lth
and
Nut
riti
onEx
amin
atio
nSu
rvey
s20
07–2
010.
Fo
od
Secu
re(n=
2599)
Marg
inal
Fo
od
Secu
re(n=
819)
Fo
od
Inse
cure
(n=
1587)
p-V
alu
e
Age
,mea
n(S
E)39
.8(0
.5)
38.2
(0.5
)37
.9(0
.5)
0.05
Wom
en,n
(%)
1336
(51.
6)44
5(5
5.1)
844
(52.
8)0.
24R
ace/
ethn
icit
y,n
(%)
<0.
0001
Non
-His
pani
cW
hite
1101
(62.
9)23
5(4
1.3)
531
(44.
0)N
on-H
ispa
nic
Blac
k51
1(1
2.4)
189
(20.
4)35
7(2
1.2)
His
pani
c83
2(1
6.9)
365
(31.
9)62
5(2
9.3)
Oth
erra
ce/e
thni
city
155
(7.8
)30
(6.4
)74
(5.5
)Ed
ucat
iona
latt
ainm
ent,
n(%
)<
0.00
01<
12ye
ars
793
(23.
1)31
3(3
2.8)
728
(40.
6)H
igh
scho
oldi
plom
aor
equi
vale
nt66
7(2
6.4)
220
(30.
3)40
2(2
7.0)
Any
colle
ge75
6(3
1.6)
202
(26.
5)39
0(2
7.6)
Col
lege
grad
uate
orhi
gher
383
(19.
0)84
(10.
4)67
(4.8
)H
ouse
hold
inco
me
(as
rati
oto
fede
ralp
over
tyle
vel)
,mea
n(S
E)1.
68(0
.02)
1.38
(0.0
3)1.
15(0
.03)
<0.
0001
Mar
ital
stat
us,n
(%)
0.00
09M
arri
edor
livin
gw
ith
part
ner
1475
(57.
4)45
7(5
3.2)
819
(51.
5)N
ever
mar
ried
637
(26.
8)19
2(2
5.2)
388
(26.
4)Se
para
ted,
divo
rced
,or
wid
owed
487
(15.
8)17
0(2
1.7)
80(2
2.0)
Ta
ble
2.
Hou
seho
ldfo
odse
curi
tyan
dbi
omar
kers
ofcu
mul
ativ
ebi
olog
ical
risk
:Nat
iona
lHea
lth
and
Nut
riti
onEx
amin
atio
nSu
rvey
s20
07–2
010.
Fo
od
-Se
cure
Ma
rgin
al
Fo
od
Se
cure
Fo
od
-In
secu
rep
Syst
olic
bloo
dpr
essu
re
Mea
n(S
E)11
8.7
(0.4
)11
8.9
(0.6
)11
8.1
(0.6
)0.
52
Low
-ris
k(<
120
mm
Hg)
,n(%
)12
12(5
2.2)
352
(51.
0)75
3(5
6.6)
0.04
Mod
erat
e-ri
sk(1
20–<
150
mm
Hg)
,n(%
)69
2(2
8.6)
238
(31.
7)38
3(2
4.3)
Hig
h-ri
sk(≥
120
mm
Hg)
,n(%
)53
5(1
9.2)
160
(17.
3)31
7(1
9.1)
Dia
stol
icbl
ood
pres
sure
Mea
n(S
E)70
.8(0
.6)
70.7
(0.5
)70
.7(0
.6)
0.99
Low
-ris
k(<
80m
mH
g),n
(%)
1597
(67.
4)50
2(6
9.6)
954
(68.
9)0.
69
87

Nutrients 2020, 12, 1517
Ta
ble
2.
Con
t.
Fo
od
-Se
cure
Ma
rgin
al
Fo
od
Se
cure
Fo
od
-In
secu
rep
Mod
erat
e-ri
sk(8
0–<
90m
mH
g),n
(%)
288
(12.
0)87
(12.
3)17
8(1
1.6)
Hig
h-ri
sk(≥
90m
mH
g),n
(%)
554
(20.
6)16
1(1
8.0)
321
(19.
5)
Body
mas
sin
dex
(kg/
m2 )
Mea
n(S
E)28
.8(0
.2)
29.6
(0.3
)29
.4(0
.3)
0.06
Low
-ris
k(<
25kg/m
2 ),n
(%)
770
(32.
8)21
6(2
9.0)
420
(29.
5)0.
19
Mod
erat
e-ri
sk(2
5–<
30kg/m
2 ),n
(%)
829
(31.
4)26
7(3
0.7)
505
(31.
7)
Hig
h-ri
sk(≥
30kg/m
2 ),n
(%)
972
(35.
7)32
8(4
0.3)
648
(38.
8)
Gly
cohe
mog
lobi
n
Mea
n(S
E)5.
53%
(0.0
3%)
5.57
%(0
.04%
)5.
66%
(0.0
3%)
0.01
Low
-ris
k(<
5.7%
),n
(%)
1664
(72.
6)49
7(6
7.7)
975
(68.
8)0.
18
Mod
erat
e-ri
sk(5
.7–<
6.5%
),n
(%)
522
(19.
2)19
8(2
3.0)
360
(21.
8)
Hig
h-ri
sk(≥
6.5%
),n
(%)
278
(8.2
)90
(9.3
)18
1(9
.4)
Tota
lcho
lest
erol
(mg/
dL)
Mea
n(S
E)19
6.3
(1.0
)19
3.1
(1.6
)19
6.5
(1.8
)0.
23
Low
-ris
k(<
200
mg/
dL),
n(%
)12
77(5
3.4)
418
(56.
9)79
2(5
4.2)
0.38
Mod
erat
e-ri
sk(2
00–<
240
mg/
dL),
n(%
)68
0(2
6.9)
222
(27.
7)42
4(2
7.3)
Hig
h-ri
sk(≥
240
mg/
dL),
n(%
)49
5(1
9.7)
139
(15.
4)29
3(1
8.5)
HD
Lch
oles
tero
l(m
g/dL
)
Mea
n(S
E)51
.0(0
.5)
50.0
(0.8
)49
.8(0
.6)
0.07
Low
-ris
k(≥
60m
g/dL
),n
(%)
628
(26.
2)17
7(2
3.0)
334
(21.
6)0.
05
Mod
erat
e-ri
sk(4
0–<
60m
g/dL
),n
(%)
1207
(48.
8)37
7(4
8.0)
775
(52.
1)
Hig
h-ri
sk(<
40m
g/dL
),n
(%)
608
(25.
0)22
1(2
9.0)
398
(26.
3)
Tota
l/HD
Lch
oles
tero
lrat
io
88

Nutrients 2020, 12, 1517
Ta
ble
2.
Con
t.
Fo
od
-Se
cure
Ma
rgin
al
Fo
od
Se
cure
Fo
od
-In
secu
rep
Mea
n(S
E)4.
21(0
.04)
4.26
(0.0
8)4.
34(0
.06)
0.1
Low
-ris
k(<
5),n
(%)
1838
(76.
0)56
7(7
3.0)
1103
(73.
1)0.
24
Mod
erat
e-ri
sk(5
–<6)
,n(%
)31
3(1
1.9)
98(1
2.7)
187
(11.
9)
Hig
h-ri
sk(≥
6),n
(%)
292
(12.
1)11
0(1
4.3)
217
(15.
0)
C-r
eact
ive
prot
ein
Mea
n(S
E)0.
37(0
.01)
0.46
(0.0
3)0.
46(0
.03)
0.00
5
Low
-ris
k(<
1m
g/L)
,n(%
)21
97(9
0.5)
691
(89.
5)13
19(8
7.8)
0.12
Mod
erat
e-ri
sk(1
–<3
mg/
L),n
(%)
232
(8.5
)81
(9.7
)16
4(1
0.5)
Hig
h-ri
sk(≥
3m
g/L)
,n(%
)25
(1.0
)8
(0.8
)29
(1.6
)
Alb
umin
Mea
n(S
E)4.
29(0
.01)
4.28
(0.0
2)4.
22(0
.02)
0.00
02
Low
-ris
k(≥
3.8
mg/
mL)
,n(%
)23
02(9
5.8)
731
(94.
1)13
80(9
2.3)
n/A
Mod
erat
e-ri
sk(3
.0–<
3.8
ug/m
L),n
(%)
129
(4.2
)41
(5.9
)11
5(7
.0)
Hig
h-ri
sk<
3.0
mg/
mL)
,n(%
)2
(0.1
)0
8(0
.7)
Esti
mat
edG
lom
erul
arFi
ltra
tion
Rat
e(m
L/m
in)
Mea
n(S
E)10
1.1
(0.6
)10
2.6
(0.9
)10
2.2
(0.8
)0.
3
Low
-ris
k(≥
60m
L/m
in/1
.73
m2 ),
n(%
)23
78(9
8.5)
751
(97.
5)14
55(9
7.4)
0.08
Mod
erat
e-ri
sk(3
0–<
60m
L/m
in/1
.73
m2 ),
n(%
)45
(1.3
)16
(2.0
)39
(2.3
)
Hig
h-ri
sk(<
30m
L/m
in/1
.73
m2 ),
n(%
)10
(0.2
)5
(0.5
)8
(0.4
)
89

Nutrients 2020, 12, 1517
Ta
ble
3.
Ass
ocia
tion
sbe
twee
nho
useh
old
food
secu
rity
and
cum
ulat
ive
biol
ogic
alri
sk:N
atio
nalH
ealt
han
dN
utri
tion
Exam
inat
ion
Surv
eys
2007
–201
0.
Cu
mu
lati
ve
Bio
log
ical
Ris
kS
core
Ele
vate
dB
iolo
gic
al
Ris
k(S
core≥3
)
Ag
e-
an
dG
en
der-
Ad
just
ed
Mu
ltiv
ari
ab
le-A
dju
sted
Ag
e-
an
dG
en
der-
Ad
just
ed
Mu
ltiv
ari
ab
le-A
dju
sted
β95%
CI
β95%
CI
OR
95%
CI
OR
95%
CI
All
adul
tsFo
odse
cure
Ref
.-
Ref
.-
Ref
.-
Ref
.-
Mar
gina
lfoo
dse
cure
0.18
−0.0
2,0.
380.
13−0
.05,
0.30
1.26
0.97
,1.6
41.
220.
97,1
.55
Food
inse
cure
0.22
0.11
,0.3
20.
140.
05,0
.22
1.27
1.10
,1.4
71.
201.
05,1
.37
p-tr
end
0.00
020.
003
0.00
030.
003
Men
Food
secu
reR
ef.
-R
ef.
-R
ef.
-R
ef.
-M
argi
nalf
ood
secu
re0.
13−0
.21,
0.47
0.07
−0.2
5,0.
391.
250.
77,2
.02
1.16
0.72
,1.8
8Fo
odin
secu
re0.
02−0
.17,
0.22
−0.0
2−0
.20,
0.15
0.98
0.75
,1.2
80.
930.
72,1
.20
p-tr
end
0.72
0.86
0.95
0.70
Wom
enFo
odse
cure
Ref
.-
Ref
.-
Ref
.-
Ref
.-
Mar
gina
lfoo
dse
cure
0.23
0.04
,0.4
20.
180.
01,0
.35
1.30
0.94
,1.8
01.
310.
95,1
.79
Food
inse
cure
0.41
0.24
,0.5
80.
300.
14,0
.45
1.71
1.39
,2.1
01.
611.
29,2
.00
p-tr
end
<0.
0001
0.00
04<
0.00
01<
0.00
01
Mul
tiva
riab
lem
odel
furt
her
adju
sted
for
race/e
thni
city
,ed
ucat
iona
latt
ainm
ent,
hous
ehol
din
com
e,an
dm
arit
alst
atus
.p-i
nter
acti
onfo
rm
ulti
vari
able
-ad
just
edm
odel
ofcu
mul
ativ
ebi
olog
ical
risk
byge
nder
was
0.09
,and
for
mul
tiva
riab
le-a
djus
ted
mod
elof
elev
ated
biol
ogic
alri
skby
gend
erw
as0.
03.
90

Nutrients 2020, 12, 1517
4. Discussion
In this national sample of lower-income adults, food insecurity was significantly associated withelevated biological risk in women. Significant associations were also observed between marginal foodsecurity and food insecurity and higher cumulative biological risk scores, supporting the notion thatmarginal food security is similar to food insecurity with respect to adverse health risks [30,49]. Thesefindings suggest that food insecurity, and potentially even experiences of marginal food security areassociated with the dysregulation of the major body systems in women [31,50].
To date, only one other study has examined the association between food insecurity and allostaticload. Among 733 Puerto Rican adults in the Boston Puerto Rican Health Study (BPHC), McClain andcolleagues found that food insecurity was associated with greater dysregulation of the neuroendocrineand immune systems over a five-year follow-up period, but not with the total allostatic load [42].The differences in these findings may be due to BPHC study participants being older and alreadyhaving higher burden of chronic disease at baseline than the general NHANES population, and thelack of neuroendocrine markers within NHANES to investigate this specific association.
The results of the present study also highlight differences in the associations between foodinsecurity and cumulative biological risk between men and women. Although it is unclear whythe associations were significant among women and not significant among men, prior researchon the connections between food insecurity and stress may provide insight into these differences.The development of the early Radimer/Cornell hunger scale drew primarily from women’s experiencesof household food insecurity and demonstrated that one of the earliest indicators was worryingabout the household food resources being depleted [51]. This item, now in the U.S. Household FoodSecurity Survey Module, is consistently endorsed by the vast majority of food-insecure households [1].Qualitative research studies exploring the lived experiences of women have also expanded ourunderstanding of the stressful experience of food insecurity. In a study of predominantly mothersfrom Quebec City, participants described the “psychological suffering” of food insecurity, as feelings ofpowerlessness, guilt, shame, feelings of inequity, and fears of being judged or labeled [29]. Mothersfrom another study in Philadelphia and Minneapolis discussed the continual trade-off between food andother basic necessities due to limited financial resources, characterizing their psychological response assadness, frustration, resignation, worry and fear, and shame [52]. In quantitative studies of pregnantwomen, food insecurity has been related to higher reported levels of perceived stress, disorderedeating behaviors, trait anxiety, and depressive symptoms, and lower self-esteem and mastery [53,54].Furthermore, a systematic review on social position, stress, and obesity-related risk factors concludedthat women not only perceive stress more strongly but also exhibit a greater physiological response tosocial stressors when compared to men [55]. At the present time, more qualitative and quantitativeresearch is needed to better understand how men’s psychological and physiological responses to foodinsecurity may differ from the responses of women and how those differences may translate intosubsequent implications for health.
Although the present study did not include dietary intake as a mediator or outcome, the inverseassociation between food insecurity and diet quality has been well-established in prior studies. In astudy of food pantry clients in Connecticut, food insecurity was associated with a lower likelihood ofconsuming fruits, vegetables, and fiber [56]. Another study in Texas found that urban and rural adultsexperiencing food-related hardship were more likely to consume sugar-sweetened beverages [57].Within NHANES, a previous analysis showed inverse associations between household food insecurityand adult’s dietary quality, as indicated by the lower scores on the Healthy Eating Index and theAlternate Healthy Eating Index [17]. The results from the present study on household food insecurityand some biomarkers of cumulative biological risk, e.g., glycohemoglobin, HDL cholesterol, and systolicblood pressure, may be driven, in part, by differences in dietary quality rather than chronic stress.However, the chronic stress and dietary pathways stemming from food insecurity are not mutuallyexclusive, and several studies have demonstrated how chronic stress could also alter eating behaviorsto negatively impact dietary quality. Chronic stress activates the hypothalamus–pituitary–adrenal
91

Nutrients 2020, 12, 1517
(HPA) axis, which triggers a cascade of hormones, leading to the release of cortisol [32,58]. Cortisolstimulates food intake, particularly foods high in fat and sugar, and can lead to excessive caloric intakeand cardiometabolic disease over time [59,60]. When food is available, food-insecure individuals mayovereat not simply in response to the physical sensation of hunger, but as physiological and behavioralcoping strategies to chronic stress. In a qualitative study by Tester and colleagues, food-insecureparents discussed disordered eating habits observed in their children, including binge eating, hidingfood, and night-time eating behaviors not discussed by food-secure parents [61]. To date, there havebeen few studies on the associations between household food insecurity and disordered eating amongadults, with most research limited to children [62,63] and pregnant women [54,63]. Further research,particularly using longitudinal study designs and robust measurement of food insecurity, chronicstress, diet quality and eating behaviors, and multiple systems comprising allostatic load, are neededto better understand the relationship between food insecurity and allostatic load and elucidate thepathways of chronic stress and dietary intake in the general population.
The results of this study have potential clinical and policy implications. The finding that evenmarginal food security was associated with higher cumulative biological risk scores among womenis consistent with research showing that children in households with marginal food security exhibitpoorer health and developmental outcomes than children in food-secure households [49]. Screening offood insecurity in health care settings using the validated Hunger Vital Sign measure can help identifyadults with marginal food security for the referral to community food programs and social services [64].Economic and nutrition programs and policies aimed at improving food security should also ensurethat they are reaching populations with marginal food security to ameliorate any adverse healthoutcomes related to anxiety over household food resources and milder indicators of food insecuritythat precede behavioral adaptations.
The primary limitation of this study is the cross-sectional design, which limits the ability tomake causal inferences about the findings. Although we restricted the analytic sample to adults withhousehold incomes ≤300% of the federal poverty level and further adjusted for household incomein statistical analyses, we cannot rule out the potential for residual confounding by income or otherproxies of socioeconomic status, which are known to have salient relationships with health behaviors,physical health, and mental health [65]. Relatedly, we cannot exclude the potential for reverse causation,where elevated biological risk might lead to increased health care costs, subsequently influencinghousehold food security. Another limitation is the assessment of household food security in NHANES,which occurs over a 12-month period. By aggregating over the past year, our understanding islimited as to whether experiences of food insecurity were episodic or chronic. Prior research suggestsfood-insecure individuals may exhibit disordered eating behaviors corresponding to a monthly cycle ofwhen food is plentiful or scarce [61,66]. How food insecurity-induced disordered eating is associatedwith cumulative biological risk is unknown given the long period over which food insecurity indicatorsare measured. Further, no information is available on the history of food insecurity in the family,as cumulative experiences of food insecurity experienced before the study window may have alsocontributed to biological risk.
Another important limitation of the NHANES dataset is that it lacks neuroendocrine markersto better measure allostatic load. Further research is needed to understand how food insecurity isassociated with neuroendocrine dysregulation and the primary system of allostatic load to betterunderstand its relationship with chronic stress.
5. Conclusions
Understanding the mechanisms underlying food insecurity and adverse health outcomes is criticalto designing effective interventions to reduce socioeconomic and health disparities. The findingsof the present study show higher cumulative biological risk scores among marginally food-secureand food-insecure women, providing additional evidence to suggest even mild experiences of foodinsecurity may affect physical and mental health outcomes through chronic stress. Further research is
92

Nutrients 2020, 12, 1517
needed to understand why these associations were not observed in men and to better elucidate the roleof food insecurity in promoting chronic stress independent of other forms of socioeconomic adversityin women.
Supplementary Materials: The following are available online at http://www.mdpi.com/2072-6643/12/5/1517/s1,Table S1: Associations between household food security (using the four-category variable) and cumulativebiological risk: National Health and Nutrition Examination Surveys 2007–2010.
Author Contributions: Conceptualization, C.W.L. and M.S.Z.; Formal analysis, C.W.L.; Writing—original draft,C.W.L. and M.S.Z.; Writing—reviewing & editing, C.W.L. and M.S.Z. All authors have read and agreed to thepublished version of the manuscript.
Funding: C.W.L. was supported by grant 4R00 HD084758 from NIH.
Conflicts of Interest: The authors have no conflict of interest to disclose.
References
1. Coleman-Jensen, A.; Rabbitt, M.P.; Gregory, C.A.; Singh, A. Household Food Security in the United States in2018, ERR-270; U.S. Department of Agriculture, Economic Research Service: Washington, DC, USA, 2019.
2. Pan, L.; Sherry, B.; Njai, R.; Blanck, H.M. Food insecurity is associated with obesity among US adults in12 states. J. Acad. Nutr. Diet. 2012, 112, 1403–1409. [CrossRef] [PubMed]
3. Franklin, B.; Jones, A.; Love, D.; Puckett, S.; Macklin, J.; White-Means, S. Exploring Mediators of FoodInsecurity and Obesity: A Review of Recent Literature. J. Community Health 2012, 37, 253–264. [CrossRef][PubMed]
4. Adams, E.J.; Grummer-Strawn, L.; Chavez, G. Food Insecurity Is Associated with Increased Risk of Obesityin California Women. J. Nutr. 2003, 133, 1070–1074. [CrossRef] [PubMed]
5. Seligman, H.K.; Laraia, B.A.; Kushel, M. Food insecurity is associated with chronic disease among low-incomeNHANES participants. J. Nutr. 2009, 140, 304–310. [CrossRef] [PubMed]
6. Seligman, H.K.; Bindman, A.B.; Vittinghoff, E.; Kanaya, A.M.; Kushel, M. Food Insecurity is Associatedwith Diabetes Mellitus: Results from the National Health Examination and Nutrition Examination Survey(NHANES) 1999–2002. J. Gen. Intern. Med. 2007, 22, 1018–1023. [CrossRef]
7. Fitzgerald, N.; Hromi-Fiedler, A.; Segura-Pérez, S.; Pérez-Escamilla, R. Food insecurity is related to increasedrisk of type 2 diabetes among Latinas. Ethn. Dis. 2011, 21, 328–334.
8. Seligman, H.K.; Davis, T.C.; Schillinger, D.; Wolf, M.S. Food insecurity is associated with hypoglycemia andpoor diabetes self-management in a low-income sample with diabetes. J. Health Care Poor Underserved 2010,21, 1227–1233.
9. Berkowitz, S.A.; Baggett, T.P.; Wexler, D.J.; Huskey, K.W.; Wee, C.C. Food Insecurity and Metabolic ControlAmong U.S. Adults with Diabetes. Diabetes Care 2013, 36, 3093–3099. [CrossRef]
10. Stuff, J.E.; Casey, P.H.; Connell, C.; Champagne, C.M.; Gossett, J.M.; Harsha, D.; McCabe-Sellers, B.; Robbins, J.;Simpson, P.M.; Szeto, K.L.; et al. Household Food Insecurity and Obesity, Chronic Disease, and ChronicDisease Risk Factors. J. Hunger. Environ. Nutr. 2007, 1, 43–62. [CrossRef]
11. Gao, X.; Scott, T.; Falcon, L.M.; Wilde, P.E.; Tucker, K.L. Food insecurity and cognitive function in PuertoRican adults. Am. J. Clin. Nutr. 2009, 89, 1197–1203. [CrossRef]
12. Portela-Parra, E.T.; Leung, C.W. Food Insecurity Is Associated with Lower Cognitive Functioning in aNational Sample of Older Adults. J. Nutr. 2019, 149, 1812–1817. [CrossRef] [PubMed]
13. Leung, C.W.; Epel, E.S.; Willett, W.C.; Rimm, E.B.; Laraia, B.A. Household Food Insecurity Is PositivelyAssociated with Depression among Low-Income Supplemental Nutrition Assistance Program Participantsand Income-Eligible Nonparticipants. J. Nutr. 2014, 145, 622–627. [CrossRef] [PubMed]
14. Whitaker, R.C.; Phillips, S.M.; Orzol, S.M. Food Insecurity and the Risks of Depression and Anxiety inMothers and Behavior Problems in their Preschool-Aged Children. Pediatrics 2006, 118, e859–e868. [CrossRef][PubMed]
15. Stuff, J.E.; Casey, P.H.; Szeto, K.L.; Gossett, J.M.; Robbins, J.; Simpson, P.M.; Connell, C.; Bogle, M.L. HouseholdFood Insecurity Is Associated with Adult Health Status. J. Nutr. 2004, 134, 2330–2335. [CrossRef] [PubMed]
16. Gucciardi, E.; Vogt, J.A.; DeMelo, M.; Stewart, D.E. Exploration of the Relationship Between Household FoodInsecurity and Diabetes in Canada. Diabetes Care 2009, 32, 2218–2224. [CrossRef]
93

Nutrients 2020, 12, 1517
17. Leung, C.W.; Epel, E.S.; Ritchie, L.D.; Crawford, P.B.; Laraia, B.A. Food Insecurity Is Inversely Associatedwith Diet Quality of Lower-Income Adults. J. Acad. Nutr. Diet. 2014, 114, 1943–1953.e2. [CrossRef]
18. Mello, J.A.; Gans, K.; Risica, P.M.; Kirtania, U.; Strolla, L.O.; Fournier, L. How Is Food Insecurity Associatedwith Dietary Behaviors? An Analysis with Low-Income, Ethnically Diverse Participants in a NutritionIntervention Study. J. Am. Diet. Assoc. 2010, 110, 1906–1911. [CrossRef]
19. Hanson, K.L.; Connor, L.M. Food insecurity and dietary quality in US adults and children: A systematicreview. Am. J. Clin. Nutr. 2014, 100, 684–692. [CrossRef]
20. To, Q.G.; Frongillo, E.A.; Gallegos, D.; Moore, J.B. Household food insecurity is associated with less physicalactivity among children and adults in the U.S. population. J. Nutr. 2014, 144, 1797–1802. [CrossRef]
21. Kim-Mozeleski, J.E.; Tsoh, J.Y. Cigarette Smoking Among Socioeconomically Disadvantaged Young Adultsin Association with Food Insecurity and Other Factors. Prev. Chronic Dis. 2016, 13, E08.
22. Kim-Mozeleski, J.E.; Seligman, H.K.; Yen, I.H.; Shaw, S.J.; Buchanan, D.R.; Tsoh, J.Y. Changes in FoodInsecurity and Smoking Status over Time: Analysis of the 2003 and 2015 Panel Study of Income Dynamics.Am. J. Health Promot. 2018, 33, 698–707. [CrossRef] [PubMed]
23. Armour, B.S.; Pitts, M.M.; Lee, C.-W. Cigarette Smoking and Food Insecurity among Low-Income Families inthe United States, 2001. Am. J. Health Promot. 2008, 22, 386–392. [CrossRef] [PubMed]
24. Ding, M.; Keiley, M.K.; Garza, K.B.; Duffy, P.A.; Zizza, C.A. Food Insecurity Is Associated with Poor SleepOutcomes among US Adults. J. Nutr. 2014, 145, 615–621. [CrossRef] [PubMed]
25. Liu, Y.; Njai, R.S.; Greenlund, K.J.; Chapman, D.P.; Croft, J.B. Relationships Between Housing and FoodInsecurity, Frequent Mental Distress, and Insufficient Sleep Among Adults in 12 US States, 2009. Prev. ChronicDis. 2014, 11, E37. [CrossRef]
26. Hromi-Fiedler, A.; Bermúdez-Millán, A.; Segura-Pérez, S.; Pérez-Escamilla, R. Household food insecurity isassociated with depressive symptoms among low-income pregnant Latinas. Matern. Child Nutr. 2010, 7,421–430. [CrossRef]
27. Lent, M.D.; Petrovic, L.E.; Swanson, J.A.; Olson, C.M. Maternal Mental Health and the Persistence of FoodInsecurity in Poor Rural Families. J. Health Care Poor Underserved 2009, 20, 645–661. [CrossRef]
28. Siefert, K.A.; Heflin, C.M.; Corcoran, M.E.; Williams, D.R. Food insufficiency and physical and mental healthin a longitudinal survey of welfare recipients. J. Health Soc. Behav. 2004, 45, 171–186. [CrossRef]
29. Hamelin, A.-M.; Beaudry, M.; Habicht, J.-P. Characterization of household food insecurity in Québec:Food and feelings. Soc. Sci. Med. 2002, 54, 119–132. [CrossRef]
30. Lee, J.S.; Gundersen, C.; Cook, J.; Laraia, B.; Johnson, M.A. Food Insecurity and Health across the Lifespan12.Adv. Nutr. 2012, 3, 744–745. [CrossRef]
31. McEwen, B.; Seeman, T.E. Available online: https://macses.ucsf.edu/research/allostatic/allostatic.php#stress(accessed on 23 May 2019).
32. McEwen, B.S. Stress, adaptation, and disease. Allostasis and allostatic load. Ann. N. Y. Acad. Sci. 1998, 840,33–44. [CrossRef]
33. Duong, M.; Bingham, B.A.; Aldana, P.C.; Chung, S.T.; E Sumner, A. Variation in the Calculation of AllostaticLoad Score: 21 Examples from NHANES. J. Racial Ethn. Health Disparities 2016, 4, 455–461. [CrossRef][PubMed]
34. Seeman, T.E.; McEwen, B.S.; Rowe, J.W.; Singer, B.H. Allostatic load as a marker of cumulative biological risk:MacArthur studies of successful aging. Proc. Natl. Acad. Sci. USA 2001, 98, 4770–4775. [CrossRef] [PubMed]
35. Merkin, S.S.; Karlamangla, A.; Roux, A.V.D.; Shrager, S.; Seeman, T.E. Life course socioeconomic status andlongitudinal accumulation of allostatic load in adulthood: Multi-ethnic study of atherosclerosis. Am. J.Public Health 2014, 104, e48–e55. [CrossRef] [PubMed]
36. McCrory, C.; Fiorito, G.; Cheallaigh, C.N.; Polidoro, S.; Karisola, P.; Alenius, H.; Layte, R.; Seeman, T.;Vineis, P.; Kenny, R.A. How does socio-economic position (SEP) get biologically embedded? A comparisonof allostatic load and the epigenetic clock(s). Psychoneuroendocrinology 2019, 104, 64–73. [CrossRef]
37. Gruenewald, T.L.; Karlamangla, A.S.; Hu, P.; Stein-Merkin, S.; Crandall, C.; Koretz, B.; Seeman, T.E. Historyof socioeconomic disadvantage and allostatic load in later life. Soc. Sci. Med. 2011, 74, 75–83. [CrossRef]
38. Seeman, T.; Epel, E.; Gruenewald, T.; Karlamangla, A.; McEwen, B.S. Socio-economic differentials inperipheral biology: Cumulative allostatic load. Ann. N. Y. Acad. Sci. 2010, 1186, 223–239. [CrossRef]
94

Nutrients 2020, 12, 1517
39. Upchurch, D.M.; Stein, J.; Greendale, G.A.; Chyu, L.; Tseng, C.-H.; Huang, M.-H.; Lewis, T.T.; Kravitz, H.M.;Seeman, T. A Longitudinal Investigation of Race, Socioeconomic Status, and Psychosocial Mediators ofAllostatic Load in Midlife Women. Psychosom. Med. 2015, 77, 402–412. [CrossRef]
40. Geronimus, A.T.; Hicken, M.; Keene, D.; Bound, J. “Weathering” and Age Patterns of Allostatic Load ScoresAmong Blacks and Whites in the United States. Am. J. Public Health 2006, 96, 826–833. [CrossRef]
41. Duru, O.K.; Harawa, N.T.; Kermah, D.; Norris, K.C. Allostatic load burden and racial disparities in mortality.J. Natl. Med Assoc. 2012, 104, 89–95. [CrossRef]
42. McClain, A.C.; Xiao, R.S.; Gao, X.; Tucker, K.L.; Falcon, L.M.; Mattei, J. Food Insecurity and Odds of HighAllostatic Load in Puerto Rican Adults. Psychosom. Med. 2018, 80, 733–741. [CrossRef]
43. Gamba, R.J.; Leung, C.W.; Guendelman, S.; Lahiff, M.; Laraia, B.A. Household Food Insecurity Is NotAssociated with Overall Diet Quality Among Pregnant Women in NHANES 1999–2008. Matern. ChildHealth J. 2016, 20, 2348–2356. [CrossRef] [PubMed]
44. U.S. Household Food Security Survey Module: Three-Stage Design, With Screeners. Available online:ers.usda.gov/media/8271/hh2012.pdf (accessed on 22 May 2020).
45. Chen, X.; Redline, S.; Shields, A.E.; Williams, D.R.; Williams, M.A. Associations of allostatic load with sleepapnea, insomnia, short sleep duration, and other sleep disturbances: Findings from the National Health andNutrition Examination Survey 2005 to 2008. Ann. Epidemiol. 2014, 24, 612–619. [CrossRef] [PubMed]
46. Parente, V.; Hale, L.; Palermo, T. Association between breast cancer and allostatic load by race: NationalHealth and Nutrition Examination Survey 1999–2008. Psycho-Oncology 2012, 22, 621–628. [CrossRef][PubMed]
47. Rodriquez, E.J.; Livaudais-Toman, J.; Gregorich, S.E.; Jackson, J.S.; Nápoles, A.M.; Perez-Stable, E.J.Relationships between allostatic load, unhealthy behaviors, and depressive disorder in U.S. adults, 2005–2012NHANES. Prev. Med. 2018, 110, 9–15. [CrossRef] [PubMed]
48. Morrison, S.; Shenassa, E.D.; Mendola, P.; Wu, T.; Schoendorf, K. Allostatic load may not be associated withchronic stress in pregnant women, NHANES 1999–2006. Ann. Epidemiol. 2013, 23, 294–297. [CrossRef]
49. Cook, J.T.; Black, M.; Chilton, M.; Cutts, D.; De Cuba, S.E.; Heeren, T.; Rose-Jacobs, R.; Sandel, M.; Casey, P.H.;Coleman, S.; et al. Are Food Insecurity’s Health Impacts Underestimated in the U.S. Population? MarginalFood Security Also Predicts Adverse Health Outcomes in Young U.S. Children and Mothers123. Adv. Nutr.2013, 4, 51–61. [CrossRef]
50. Meijer, J. Stress in the Relation between Trait and State Anxiety. Psychol. Rep. 2001, 88, 947–964. [CrossRef]51. Radimer, K.L.; Olson, C.M.; Greene, J.C.; Campbell, C.C.; Habicht, J.-P. Understanding hunger and developing
indicators to assess it in women and children. J. Nutr. Educ. 1992, 24, 36S–44S. [CrossRef]52. Knowles, M.; Rabinowich, J.; Ettinger de Cuba, S.; Cutts, D.B.; Chilton, M. “Do You Wanna Breathe or Eat?”:
Parent Perspectives on Child Health Consequences of Food Insecurity, Trade-Offs, and Toxic Stress. Matern.Child Health J. 2016, 20, 25–32. [CrossRef]
53. Laraia, B.A.; Siega-Riz, A.M.; Gundersen, C.; Dole, N. Psychosocial factors and socioeconomic indicators areassociated with household food insecurity among pregnant women. J. Nutr. 2006, 136, 177–182. [CrossRef]
54. Laraia, B.; Vinikoor-Imler, L.C.; Siega-Riz, A.M. Food insecurity during pregnancy leads to stress, disorderedeating, and greater postpartum weight among overweight women. Obesity 2015, 23, 1303–1311. [CrossRef][PubMed]
55. Moore, C.J.; Cunningham, S. Social Position, Psychological Stress, and Obesity: A Systematic Review. J. Acad.Nutr. Diet. 2012, 112, 518–526. [CrossRef] [PubMed]
56. Robaina, K.A.; Martin, K.S. Food Insecurity, Poor Diet Quality, and Obesity among Food Pantry Participantsin Hartford, CT. J. Nutr. Educ. Behav. 2013, 45, 159–164. [CrossRef] [PubMed]
57. Sharkey, J.R.; Johnson, C.M.; Dean, W.R. Less-healthy eating behaviors have a greater association with a highlevel of sugar-sweetened beverage consumption among rural adults than among urban adults. Food Nutr.Res. 2011, 55, 5819. [CrossRef] [PubMed]
58. Cohen, S.; Janicki-Deverts, D.; Miller, G.E. Psychological Stress and Disease. JAMA 2007, 298, 1685–1687.[CrossRef]
59. Adam, T.C.; Epel, E. Stress, eating and the reward system. Physiol. Behav. 2007, 91, 449–458. [CrossRef]60. Dallman, M.F. Stress-induced obesity and the emotional nervous system. Trends Endocrinol. Metab. 2009, 21,
159–165. [CrossRef]
95

Nutrients 2020, 12, 1517
61. Tester, J.; Lang, T.C.; Laraia, B.A. Disordered eating behaviours and food insecurity: A qualitative studyabout children with obesity in low-income households. Obes. Res. Clin. Pract. 2015, 10, 544–552. [CrossRef]
62. Oberle, M.M.; Willson, S.R.; Gross, A.C.; Kelly, A.S.; Fox, C.K. Relationships among Child Eating Behaviorsand Household Food Insecurity in Youth with Obesity. Child. Obes. 2019, 15, 298–305. [CrossRef]
63. Laraia, B.; Epel, E.; Siega-Riz, A.M. Food insecurity with past experience of restrained eating is a recipe forincreased gestational weight gain. Appetite 2013, 65, 178–184. [CrossRef]
64. Gundersen, C.; Engelhard, E.E.; Crumbaugh, A.S.; Seligman, H.K. Brief assessment of food insecurityaccurately identifies high-risk US adults. Public Health Nutr. 2017, 20, 1367–1371. [CrossRef] [PubMed]
65. Adler, N.E.; Boyce, T.; Chesney, M.A.; Cohen, S.; Folkman, S.; Kahn, R.L.; Syme, S.L. Socioeconomic statusand health. The challenge of the gradient. Am. Psychol. 1994, 49, 15–24. [CrossRef] [PubMed]
66. Bruening, M.; MacLehose, R.; Loth, K.A.; Story, M.; Neumark-Sztainer, D. Feeding a Family in a Recession:Food Insecurity Among Minnesota Parents. Am. J. Public Health 2012, 102, 520–526. [CrossRef] [PubMed]
© 2020 by the authors. Licensee MDPI, Basel, Switzerland. This article is an open accessarticle distributed under the terms and conditions of the Creative Commons Attribution(CC BY) license (http://creativecommons.org/licenses/by/4.0/).
96

nutrients
Article
Food Insecurity and COVID-19: Disparities in EarlyEffects for US Adults
Julia A. Wolfson 1,2,* and Cindy W. Leung 2
1 Department of Health Management and Policy, University of Michigan School of Public Health, Ann Arbor,MI 48109, USA
2 Department of Nutritional Sciences, University of Michigan School of Public Health, Ann Arbor, MI 48109,USA; [email protected]
* Correspondence: [email protected]; Tel.: +1-734-764-6036
Received: 15 May 2020; Accepted: 29 May 2020; Published: 2 June 2020
Abstract: The COVID-19 pandemic has dramatically increased food insecurity in the United States(US). The objective of this study was to understand the early effects of the COVID-19 pandemic amonglow-income adults in the US as social distancing measures began to be implemented. On 19–24 March2020 we fielded a national, web-based survey (53% response rate) among adults with <250% of thefederal poverty line in the US (N = 1478). Measures included household food security status andCOVID-19-related basic needs challenges. Overall, 36% of low-income adults in the US were foodsecure, 20% had marginal food security, and 44% were food insecure. Less than one in five (18.8%) ofadults with very low food security reported being able to comply with public health recommendationsto purchase two weeks of food at a time. For every basic needs challenge, food-insecure adults weresignificantly more likely to report facing that challenge, with a clear gradient effect based on severityof food security. The short-term effects of the COVID-19 pandemic are magnifying existing disparitiesand disproportionately affecting low-income, food-insecure households that already struggle to meetbasic needs. A robust, comprehensive policy response is needed to mitigate food insecurity as thepandemic progresses.
Keywords: covid-19; food insecurity; low-income adults; disparities; survey
1. Introduction
Food insecurity, a condition defined by limited or uncertain access to sufficient, nutritious food foran active, healthy life, disproportionately affects low-income communities and communities of color [1].Food is a core social determinant of health [2] and food insecurity is associated with numerous poorhealth outcomes in both the short and long term [3–9]. The unprecedented COVID-19 pandemic, andthe associated social and economic response [10] (e.g., school closures, stay at home orders, businessclosures, and job losses) have the potential to dramatically increase food insecurity and its relatedhealth disparities among already at-risk populations. Early evidence suggests that food insecurityis indeed rapidly rising above pre-epidemic levels [11–13]. Household food insecurity has risenfrom 11% in 2018 to 38% in March 2020; in April 2020, 35% of households with a child aged 18 andunder were food insecure [12,13]. Households already struggling with food insecurity may find theircurrent situations exacerbated by COVID-19 with fewer resources to comply with social distancingrecommendations. Food insecure individuals also may have less flexibility in their jobs to allow themto earn income while staying home, or may be at higher risk of losing their jobs completely, therebydecreasing (or eliminating) their incomes. These factors may put food insecure households both athigher risk of contracting COVID-19 and of greater food insecurity due to the economic effects ofCOVID-19 mitigation efforts.
Nutrients 2020, 12, 1648; doi:10.3390/nu12061648 www.mdpi.com/journal/nutrients97

Nutrients 2020, 12, 1648
In addition to the long-term health and economic effects of the COVID-19 pandemic, it is importantto understand the immediate impact of social distancing measures to fight COVID-19 on vulnerablepopulations who already struggle to meet their basic needs. To do so, we fielded a national surveyof low-income adults in the US on 19–24 March 2020 to understand the immediate effects of howCOVID-19 was impacting low-income Americans and any disparities in its effects based on foodsecurity status.
2. Materials and Methods
We designed a web-based (Qualtrics) survey to measure the initial effects of COVID-19 onlow-income adults in the United States (US) in mid-March 2020, just as some states were beginning toimplement school closures and “stay at home” orders. The web-based survey was formatted to beaccessible when access both via smart phones and on a personal computer or laptop. The survey wasfielded using TurkPrime, an online crowdsourcing platform that is designed to be used for academicresearch [14]. TurkPrime allows researchers to use quotas to recruit a sample that matches their specificneeds and has been used in numerous academic studies from a variety of disciplines published inthe peer-reviewed literature [15–19]. In the present study, we used a census matched panel of USadults (matched on age, gender, and race/ethnicity to the overall population) and limited the sampleto low-income adults with household incomes <250% of the federal poverty line (FPL). The FPL iscalculated based on both household size and annual household income. For example, 100% of the FPLfor a four-person household is $26,200, and 250% of the FPL for a four-person household is $655,000per year. The annual income for a two-person household at 250% FPL is $43,100.
The survey was open to participants on 19–24 March 2020. We invited 2840 eligible panel membersto participate and 1497 participants completed the survey (53% completion rate). Additional exclusionsincluded participants who completed the survey in <4 min (n = 7), indicated they did not live in theUS (n = 3), and were missing food insecurity data (n = 9) resulting in a final analytic sample size of1478. Forty-four percent of participants took the survey on a personal computer or laptop and 56%took the survey on a smart phone or mobile device. This study was determined to be exempt by theInstitutional Review Board at the University of Michigan.
2.1. Measures
Food security: Food security status over the past 30 days was measured using the 18-itemUS Household Food Security Module [20]. Questions are ordered by severity and include threelevels of screening for adults, and an additional level of questions only for households with children.Affirmative responses to questions were summed to create a total food security score (out of 10 foradults and out of 18 for households with children). Food security categories (high, marginal, low, verylow) were assigned according to US Department of Agriculture scoring guidelines [21]. The term foodinsecurity refers to the combined categories of low and very low food security.
COVID-19-related basic needs challenges: We inquired about challenges related to meeting basicneeds people may have faced in the early weeks of the US COVID-19 epidemic and response. First,we asked about participants’ ability to comply with recommendations to purchase two weeks offood (which was recommended by public health efforts to limit grocery shopping trip and facilitatesocial distancing). We also asked participants whether they had encountered any of the followingchallenges due to the coronavirus: the ability to feed their family, availability of household items suchas toilet paper, access to healthcare, access to medications, the ability to pay bills, ability to rent or paymortgages, whether they had been unable to work due to lack of childcare, and whether they had beenunable to work due to illness.
COVID-19-related workplace reactions: At the time of data collection, some, but not all, states hadbegun issuing stay at home orders and mandatory business closures. Even in states without stay athome mandates, some businesses were making adjustments to operations due to COVID-19. We askedworking adults (i.e., those with full- or part-time work outside the home) what their employer was
98

Nutrients 2020, 12, 1648
doing to adjust to the pandemic. Specifically, we asked “Workplaces in the US are adjusting to thecoronavirus situation in different ways. What is your workplace doing to adjust?” Participants weregiven the following response options: nothing, my workplace is proceeding as normal; all employeesare encouraged to work at home; all employees must work at home; essential employees must come into work but others can work from home; hours are being reduced for hourly employees; my place ofemployment has temporarily closed due to the coronavirus; my place of employment has closed andI have been laid off; work is busier and employees need to work longer hours; other.
Expected impact of COVID-19 on employment and income: We asked working adults what theyexpected would happen at their job if they or someone in their family became ill with COVID-19.Response options focused on whether they would be able to stay home, whether they had vacation orsick days they could use, and what they expected would happen if they missed work due to illness.
2.2. Analysis
All analyses were conducted in 2020 with Stata, Version 15 (StataCorp LP, College Station TX,USA). First, we describe the socio-demographic characteristics of the study sample overall and byfood security status using cross tabulations and chi-squared tests of significant differences. Next, weexamine differences in COVID-19-related basic needs and workplace challenges (among participantsworking full or part time), by food security status using cross tabulations. Missing data was treatedusing listwise deletion. Significant differences by food security status were assessed using chi-squaredtests. All tests were two tailed and significance was considered at p < 0.05.
3. Results
The characteristics of the sample of low-income adults are presented in Table 1. Overall, 36% ofthis sample was food secure, 20% had marginal food security, and 44% were food insecure (17% lowfood security; 27% very low food security). Individuals with low or very low food security were morelikely to be non-Hispanic Black or Hispanic, to have children in the home, and have less than a collegeeducation. Individuals with very low food insecurity were also more likely to rent their homes, nothave health insurance or have Medicaid, and were more likely to be receiving SNAP benefits. Thedistribution of the sample by state of residence is shown in Appendix A.
Table 1. Demographic characteristics of the study sample overall and by food security status (n = 1478).
OverallFood Security Status
p-ValueHigh Marginal Low Very Low
n (%) a n (%) b n (%) b n (%) b n (%) b
Total 1478 (100) 532 (36) 290 (20) 256 (17) 400 (27)Age
18–39 635 (43) 168 (26) 116 (18) 140 (22) 211 (33) <0.00140–59 429 (29) 152 (35) 88 (21) 62 (14) 127 (30)≥60 414 (28) 212 (51) 86 (21) 54 (13) 62 (15)Sex
Male 733 (50) 285 (39) 135 (18) 128 (17) 185 (25) 0.100Female 745 (50) 247 (33) 155 (21) 128 (17) 215 (29)
Race/ethnicityNH White 990 (67) 384 (39) 185 (19) 160 (16) 261 (26) 0.026NH Black 161 (11) 47 (29) 36 (22) 36 (22) 42 (26)Hispanic 186 (13) 55 (30) 35 (19) 39 (21) 57 (31)
Asian 73 (5) 24 (33) 23 (32) 11 (15) 15 (21)Other 68 (5) 22 (32) 11 (16) 10 (15) 25 (37)
Household Size1–3 people 1113 (75) 416 (37) 219 (20) 177 (16) 301 (27) 0.054≥4 people 365 (25) 116 (32) 71 (19) 79 (22) 99 (27)
99

Nutrients 2020, 12, 1648
Table 1. Cont.
OverallFood Security Status
p-ValueHigh Marginal Low Very Low
n (%) a n (%) b n (%) b n (%) b n (%) b
Marital StatusSingle, never married 564 (38) 199 (35) 108 (19) 118 (21) 139 (35) <0.001
Married 448 (30) 180 (40) 91 (20) 68 (15) 109 (24)Separated, divorced,
widowed 311 (21) 124 (40) 58 (19) 43 (14) 86 (28)
Living with a partner 150 (10) 27 (18) 32 (21) 26 (17) 65 (43)Children < 18 years
in homeYes 445 (30) 120 (27) 85 (19) 92 (21) 148 (33) <0.001No 1033 (70) 412 (40) 205 (20) 164 (16) 252 (24)
Income<$35,000/year 894 (60) 297 (33) 175 (20) 165 (18) 257 (29) 0.015
$35,000 ≤ $59,000/year 418 (28) 162 (39) 75 (18) 69 (17) 112 (27)≥$59,000/year 166 (11) 73 (44) 40 (24) 22 (13) 31 (19)
EducationHigh school/GED 439 (30) 122 (28) 83 (19) 91 (21) 143 (33) <0.001
Some college 524 (35) 197 (38) 104 (29) 75 (14) 148 (28)College/grad degree 515 (35) 213 (41) 103 (20) 90 (17) 109 (21)Employment statusFull time job (hourly
or salary) 408 (29) 139 (34) 68 (17) 81 (20) 120 (29) 0.002
Part time job (hourlyor salary) 239 (17) 83 (35) 51 (21) 41 (17) 64 (27)
Not working, lookingfor work 197 (14) 58 (29) 38 (19) 38 (19) 63 (32)
Not working, not lookingfor work 415 (30) 186 (45) 86 (21) 55 (13) 88 (21)
Home-maker 141 (10) 46 (33) 27 (19) 21 (15) 47 (33)Student
Yes 95 (6) 29 (31) 26 (27) 20 (21) 20 (21) 0.106No 1383 (94) 503 (36) 264 (19) 236 (17) 380 (27)
Home ownershipRent 744 (50) 201 (27) 144 (19) 154 (21) 245 (33) <0.001Own 538 (43) 287 (45) 128 (20) 89 (14) 134 (21)Other 96 (7) 44 (46) 18 (19) 13 (14) 21 (22)
Health insuranceNone 231 (16) 68 (29) 40 (17) 35 (15) 88 (38) <0.001
Yes, through work 260 (18) 97 (37) 45 (17) 57 (22) 61 (23)Yes, Medicare 437 (30) 189 (43) 83 (19) 73 (17) 92 (21)Yes, Medicaid 338 (23) 91 (27) 73 (22) 55 (16) 119 (35)
Yes, other 212 (14) 87 (41) 49 (23) 35 (17) 40 (19)Political party affiliation
Republican 396 (27) 174 (44) 76 (19) 50 (13) 96 (24) 0.004Democrat 594 (40) 190 (32) 124 (21) 115 (19) 165 (28)
Independent 488 (33) 168 (34) 90 (18) 91 (19) 139 (28)SNAP benefits
No 1065 (72) 452 (42) 207 (19) 182 (17) 224 (21) <0.001Yes 413 (28) 80 (19) 83 (20) 74 (18) 176 (43)
Region of residenceNortheast 273 (18) 90 (33) 57 (21) 59 (22) 67 (25) 0.406Midwest 332 (22) 127 (38) 69 (21) 47 (14) 89 (27)
South 542 (37) 196 (36) 95 (18) 97 (18) 154 (28)West 331 (22) 119 (36) 69 (21) 53 (16) 90 (27)
a Column percentage; b Row percentage.
100

Nutrients 2020, 12, 1648
Figure 1 shows the ability of low-income US adults to comply with public health recommendationsto stock up on two weeks of food to avoid excess grocery store trips and facilitate social distancing.Nearly 2/3 (60%) of food-secure, low-income adults reported being able to comply with thatrecommendation, compared to less than one in five (18.8%) of low-income adults with very lowfood security. Adults with very low food security were more likely to report their local stores weresold out of products, and not being able to afford to purchase an extra two weeks of food at one time.
Figure 1. Ability to comply with recommendation to stock up on two weeks of food among low-incomeUS adults, by food security status (n = 1478). Question text: “Experts have recommended stocking upon two weeks of food for your household to prepare for the coronavirus. Have you been able to do this?[Please check all that apply. One respondent was missing data for this question and was excluded fromanalysis. Differences within each response option by food security status are significant at p < 0.001based on chi-squared tests.
Potential basic needs challenges related to COVID-19 are displayed in Figure 2. For every challengeasked about, food-insecure adults were significantly more likely to report dealing with that challenge,with a clear gradient effect based on severity of food security status. Strikingly, 41.3% of adults withvery low food security reported not having enough food to feed themselves or their family comparedto 10.7% of adults with low food security, 3.1% of adults with marginal food security and 1.6% of adultswith high food security. Half (49.9%) of adults with very low food security did not have enough moneyto pay their bills compared to 36.9% of those with low food security, 23.1% of those with marginal foodsecurity and 8.8% of food secure adults.
101

Nutrients 2020, 12, 1648
Figure 2. Challenges encountered by low-income US adults as a result of COVID-19, as of 19–24 March,by food security status (n= 1478). Question text: “Have you experienced any of the following challengesdue to the coronavirus (COVID-19) so far?” [Please check all that apply] Percentages reflect the percentof respondents in each food security category that said they encountered that problem. Ten percent ofrespondents (n = 161) did not indicate any of the response options were challenges for them and arecounted as ‘missing’.
Food-secure, low-income adults working full or part time (44.3% of the overall sample) were morelikely than their food-insecure counterparts to work in jobs that were either proceeding as normal,were busier than usual, or had closed and laid off employees. In contrast, working adults with foodinsecurity were more likely to have their hours reduced (Table 2). When asked what they thoughtwould happen if they or someone in their family got sick with COVID-19, working adults with verylow food security were less likely than their food-secure counterparts to have sick days or vacation
102

Nutrients 2020, 12, 1648
days they could use, and were more likely to say they would lose their job if they missed too manydays of work (52% very low food security vs. 18% high food security, p < 0.001).
Table 2. COVID-19 effects on workplaces among low-income adults working full or part time in the USoverall and by food security status as of 19–24 March 2020 (n = 655).
Overall(n = 655)
Food Security Status
p-ValueHigh
n = 225(34%)
Marginaln = 120(18%)
Lown = 124(19%)
Very Lown = 186(28%)
n (%) a n (%) b n (%) b n (%) b n (%)b
What is your workplacedoing to adjust to
COVID-19? c
Nothing, proceedingas normal 152 (23) 64 (42) 27 (18) 25 (16) 36 (24) 0.004
Employees encouraged towork at home 69 (11) 15 (22) 17 (25) 17 (25) 20 (29)
Employees must workat home 69 (11) 17 (25) 14 (20) 16 (23) 22 (32)
Essential employees mustcome in, others work from
home58 (9) 29 (50) 5 (9) 14 (24) 10 (32)
Hours are reduced 79 (12) 20 (25) 11 (14) 17 (22) 31 (39)
Temporarily closed 131 (20) 44 (34) 27 (21) 21 (16) 39 (30)
Closed and I have beenlaid off 25 (4) 11 (44) 6 (24) 3 (12) 5 (20)
Busier, employees workingextra hours 47 (7) 21 (45) 9 (19) 8 (17) 9 (19)
If you or someone in yourfamily becomes ill withCOVID-19, what do you
expect will happenregarding your job? c
(check all that apply)
I will be able to stay homewithout using sick or
vacation days162 (26) 71 (44) 31 (19) 31 (19) 29 (18) 0.003
I will be able to use sickdays to stay home without
losing income123 (19) 55 (45) 22 (18) 23 (19) 23 (19) 0.022
I will be able to usevacation days to stay home
without losing income74 (12) 27 (36) 11 (15) 17 (23) 19 (26) 0.573
I do not have sick days so ifI am not able to work I will
lose income260 (41) 72 (28) 49 (19) 45 (17) 94 (36) 0.002
I will have to go into workeven if I am sick 33 (5) 6 (18) 6 (18) 8 (24) 13 (39) 0.180
If I miss too many days ofwork I could lose my job 61 (10) 11 (18) 9 (15) 9 (15) 32 (52) <0.001
a Column percentage; b Row percentage; c Asked among respondents who are working full or part time.
103

Nutrients 2020, 12, 1648
4. Discussion
This study presents results from a national survey of low-income adults in the US in the daysimmediately following the first major policy steps to enforce COVID-19-related social distancingmeasures on a wide scale in the US. Though large-scale school and business closures were only beginningto be implemented [22], we find that the effects of the COVID-19 pandemic were already impactinglow-income adults, with disproportionately negative effects for low-income adults experiencing foodinsecurity. This initial evidence from a time period before even greater economic effects and job lossestook place demonstrate that the COVID-19 pandemic threatens to greatly exacerbate existing healthdisparities related to food security status. Indeed, evidence from later surveys show that food insecurityin the US has dramatically increased well beyond levels seen during the Great Recession [12,13].
Results from this study illuminate the extent to which, very early in the COVID-19 trajectory in theUS, individuals with food insecurity were disproportionately vulnerable to the severe economic andhealth consequences of the crisis. Our findings show that as early as mid-March 2020, food-insecureadults currently working outside the home were at greater risk of losing their income or their jobsif they got sick from COVID-19. Regardless of whether they get sick or their employment status,food-insecure individuals were also more likely to report expecting that they will lose income duringthe pandemic. For already low-income households, loss of income puts them at high risk of severefood insecurity and an inability to meet other basic needs, both of which can lead to future physicaland mental health problems [23–26]. Compared to low-income, food-secure adults, food-insecureadults were more likely to report that they had already been laid off, and that their income wouldgo down substantially. Fifty-four percent of food secure adults reported they expected their incomewould remain the same compared to 23% of adults with very low food security (results not shown,but available upon request). Subsequent massive job losses [27] and more extensive social distancingmeasures [10] after data collection ended have likely exacerbated the trends we document in our results.
Across the lifespan, food insecurity is associated with a range of negative health outcomesover the short and long term, including poor mental health outcomes such as depression, stress,and anxiety [4,9,28], poor diet quality [7,29], high rates of chronic diseases such as diabetes andobesity [6,30,31], and lower overall health status [3,5,32]. Food insecurity is also associated withhigher healthcare expenditures, in part due to the higher burden of chronic health conditions amongfood-insecure patients and the known tradeoffs between food and medicine [24,26]. As the COVID-19pandemic and the associated economic fallout progress, it will be critical for policymakers, healthsystems, and the public health community to proactively and comprehensively address access to foodand other basic needs, particularly for populations at risk of, and already experiencing, food insecurity.Failure to do so will have long-term implications for population health, health disparities, and thehealth care system as a whole.
Food-insecure adults are more likely to be people of color, with lower social standing, whohave less flexible and secure jobs, and are more vulnerable to chronic stress and other basic needsinsecurities [1]. In 2018, 11.1% of adults in the US were food insecure; among low-income adults(<185% FPL), 29.1% were food insecure [1]. We find that, as of mid-March, 2020, 44% of adults withan income <250% of the FPL were food insecure in the past 30 days, and these individuals weremore likely to be non-Hispanic Black or Hispanic. This disparity in food security status based onrace/ethnicity is an additional way in which COVID-19 is disproportionately impacting communitiesof color in the US. Since mid-March, adult and child food insecurity rates in the US have dramaticallyrisen [12,13]. In our study, adults currently experiencing food insecurity were not able to buy foodin bulk quantities and therefore are at greater risk of exposure to the virus (due to the need for morefrequent food shopping trips) as well as being at greater risk of an acute hunger crisis (due to lack offinancial resources to purchase sufficient food). In addition, as individuals already at risk for foodinsecurity are more vulnerable to losing their jobs, rates of food insecurity will climb higher as thepandemic progresses.
104

Nutrients 2020, 12, 1648
Direct income support, expanded unemployment benefits, and additional support for federalfood assistance programs included in the CARES act (passed on 27 March 2020) and the FamiliesFirst Coronavirus Response Act (passed on 18 March 2020) are important first steps to supportinglow-income families in the US [33,34]. However, longer-term support for individuals, as well asinstitutions and organizations that provide food, is needed. Some communities are already experiencingunprecedented demand in the emergency food system [35], and the federal government, states, andcities are scrambling to ensure that families with children who depend on free or reduced price mealsat school do not go hungry [36]. Given the scale of the pandemic and the likely duration of socialdistancing measures and the associated economic impacts, more support is urgently needed to mitigatethe toll of COVID-19 on the most vulnerable members of society. In particular, in addition to directeconomic support to individuals, financial support for the emergency food system, greater flexibilityfor school systems to provide food to families, and long-term, expanded food assistance support viathe Supplemental Nutrition Assistance Program (SNAP) are all urgently needed. Expanded SNAPbenefits were critical for providing needed support for low-income families during the Great Recession,and were effective at reducing food insecurity [37]. Congress and the Trump administration shouldurgently increase SNAP benefits and expand eligibility for the program to help low-income familiesafford food during this extraordinary time.
Limitations
Results from this study should be considered in light of some limitations. First, the web-basedsurvey panel does not use probability-based sampling and is not nationally representative. However,the TurkPrime panel is national in scope, and uses census-matched quotas to achieve a sample thatclosely aligns with the demographics of the population in the US which mitigates some of this concern.However, because we limited our sample to households <250% of the FPL (based on income andhousehold size), and because the survey was only available in English, the demographics of our samplemay be more similar to the US population overall and undercount some key demographic groups,particularly non-Hispanic Blacks and Hispanics, non-English speakers, and immigrants. Relatedly,this data was collected via a web-based survey which by definition required participants to haveinternet access via a computer or a smart phone. This method of data collection could also haveundercounted some groups (e.g., those with very low income, without high school degrees, and thoseliving in rural areas without broadband internet access) [38], likely those especially vulnerable to foodinsecurity. It is important to note, however, that any bias introduced from these factors would havebiased results into the direction of undercounting, rather than overcounting, food insecurity and theother outcomes we document here. Second, respondents could choose whether or not to participate inthe survey which may introduce some selection bias. Third, all measures in the study are self-reportedand may be subject to a social-desirability bias. However, the fact that the survey was fielded onlineand was completely anonymous may mitigate this concern. Fourth, this survey is cross-sectional andwe cannot make any statements about causal relationship between the coronavirus and our measure offood insecurity in the past 30 days. Finally, data were collected very quickly after social distancingmeasures and business and school closures began to be implemented in some (but not all) states.This is a strength as we were able to capture the immediate, real-time impacts on low-income adults.However, some measures also focused on anticipated effects. It is possible that the respondents didnot accurately assess the likely effect of the coronavirus pandemic on their employment and income.However, initial evidence in the weeks after our data were collected show clearly that unemploymentand rates of food insecurity have skyrocketed. The longer-term effects on low-income adults in the US,and associated disparities based on food insecurity, may be better or worse than those expected byparticipants in this survey. It will be imperative for future research to examine the long-term effects ofthe coronavirus pandemic and associated social distancing measures on food insecurity and associatedhealth outcomes, particularly among vulnerable communities that were already struggling at the startof the pandemic.
105

Nutrients 2020, 12, 1648
The strengths of our study include the fact that we were able to collect these data so quickly aftera national emergency was declared and states began implementing policies to slow the spread ofCOVID-19. Our large national sample of low-income adults is another key strength as is our use of thegold standard 18-question USDA food security screener module.
5. Conclusions
The social and economic upheaval caused by the COVID-19 pandemic is magnifying existingdisparities and disproportionately affecting low-income, food-insecure households that already struggleto meet basic needs. The early effects documented in the present study are likely to continue to worsenas the pandemic continues unless extensive policy and economic supports are swiftly implemented.
Author Contributions: Conceptualization, J.A.W. and C.W.L.; Methodology, J.A.W.; Formal analysis, J.A.W.; Datacuration, J.A.W.; Writing—Original draft preparation, J.A.W.; Writing—Review and editing, J.A.W. and C.W.L.;project administration, J.A.W.; funding acquisition, J.A.W. All authors have read and agreed to the publishedversion of the manuscript.
Funding: Funding for this study was provided by a Faculty Research Grant from the University of MichiganPoverty Solutions. J.A.W. was also supported by the National Institutes of Diabetes and Digestive and KidneyDiseases of the National Institutes of Health (Award #K01DK119166) and C.W.L. was supported by the EuniceKennedy Shriver National Institute for Child Health and Human Development (Award #4R00HD084758).
Conflicts of Interest: The authors declare no conflict of interest. The funders had no role in the design of thestudy; in the collection, analyses, or interpretation of data; in the writing of the manuscript, or in the decision topublish the results.
Appendix A
Table A1. Distribution of the Sample by State.
State N Percent
Alabama 22 1.49Alaska 3 0.2
Arizona 35 2.37Arkansas 16 1.08California 150 10.15Colorado 19 1.29
Connecticut 10 0.68Delaware 7 0.47
District of Columbia 2 0.14Florida 102 6.9Georgia 50 3.38Hawaii 7 0.47Idaho 8 0.54Illinois 62 4.19Indiana 28 1.89
Iowa 11 0.74Kansas 19 1.29
Kentucky 27 1.83Louisiana 17 1.15
Maine 10 0.68Maryland 20 1.35
Massachusetts 26 1.76Michigan 58 3.92Minnesota 21 1.42Mississippi 14 0.95
Missouri 30 2.03Montana 4 0.27
106

Nutrients 2020, 12, 1648
Table A1. Cont.
State N Percent
Nebraska 5 0.34Nevada 26 1.76
New Hampshire 6 0.41New Jersey 37 2.5
New Mexico 13 0.88New York 100 6.77
North Carolina 52 3.52North Dakota 0 0
Ohio 68 4.6Oklahoma 25 1.69
Oregon 17 1.15Pennsylvania 72 4.87Puerto Rico 0 0
Rhode Island 3 0.2South Carolina 30 2.03South Dakota 3 0.2
Tennessee 31 2.1Texas 90 6.09Utah 21 1.42
Vermont 3 0.2Virginia 29 1.96
Washington 28 1.89West Virginia 13 0.88
Wisconsin 28 1.89Wyoming 0 0
Total 1478 100
References
1. Coleman-Jensen, A.; Rabbitt, M.; Gregory, C.; Singh, A. Household Food Security in the United States in 2018;ERR-270; USDA, Economic Research Service: Washington, DC, USA, 2019.
2. Marmot, M. Social determinants of health inequalities. Lancet 2005, 365, 1099–1104. [CrossRef]3. Gundersen, C.; Ziliak, J.P. Food Insecurity And Health Outcomes. Health Aff. (Millwood) 2015, 34, 1830–1839.
[CrossRef]4. Martinez, S.M.; Frongillo, E.A.; Leung, C.; Ritchie, L. No food for thought: Food insecurity is related to poor
mental health and lower academic performance among students in California’s public university system.J. Health Psychol. 2018. [CrossRef]
5. Pooler, J.A.; Hartline-Grafton, H.; DeBor, M.; Sudore, R.L.; Seligman, H.K. Food Insecurity: A Key SocialDeterminant of Health for Older Adults. J. Am. Geriatr. Soc. 2019, 67, 421–424. [CrossRef]
6. Cheung, H.C.; Shen, A.; Oo, S.; Tilahun, H.; Cohen, M.J.; Berkowitz, S.A. Food Insecurity and Body MassIndex: A Longitudinal Mixed Methods Study, Chelsea, Massachusetts, 2009–2013. Prev. Chronic Dis. 2015,12, E125. [CrossRef]
7. Leung, C.W.; Epel, E.S.; Ritchie, L.D.; Crawford, P.B.; Laraia, B.A. Food insecurity is inversely associatedwith diet quality of lower-income adults. J. Acad. Nutr. Diet. 2014, 114, 1943–1953.e2. [CrossRef]
8. Berkowitz, S.A.; Berkowitz, T.S.Z.; Meigs, J.B.; Wexler, D.J. Trends in food insecurity for adults withcardiometabolic disease in the United States: 2005–2012. PLoS ONE 2017, 12, e0179172. [CrossRef]
9. Bruening, M.; Dinour, L.M.; Chavez, J.B.R. Food insecurity and emotional health in the USA: A systematicnarrative review of longitudinal research. Public Health Nutr. 2017, 20, 3200–3208. [CrossRef]
10. Kaiser Family Foundation. State Data and Policy Actions to Address Coronavirus. 2020. Availableonline: https://www.kff.org/health-costs/issue-brief/state-data-and-policy-actions-to-address-coronavirus/(accessed on 12 April 2020).
107

Nutrients 2020, 12, 1648
11. Niles, M.T.; Bertmann, F.; Morgan, E.H.; Wentworth, T.; Biehl, E.; Neff, R. Food Access and Security duringCoronavirus: A Vermont Study. In College of Agriculture and Life Sciences Faculty Publications; University ofVermont: Burlington, VT, USA, 2020.
12. Fitzpatrick, K.; Harris, C.; Drawve, G. Assessing U.S. Food Insecurity in the United States duringCOVID-19 Pandemic. 2020. Available online: https://fulbright.uark.edu/departments/sociology/research-centers/community-family-institute/_resources/community-and-family-institute/revised-assessing-food-insecurity-brief.pdf (accessed on 28 April 2020).
13. Bauer, L. The COVID-19 Crisis Has Already Left Too Many Children Hungry in America. 6 May 2020.Available online: https://www.brookings.edu/blog/up-front/2020/05/06/the-covid-19-crisis-has-already-left-too-many-children-hungry-in-america/ (accessed on 7 May 2020).
14. Litman, L.; Robinson, J.; Abberbock, T. TurkPrime.com: A versatile crowdsourcing data acquisition platformfor the behavioral sciences. Behav. Res. Methods 2017, 49, 433–442. [CrossRef]
15. Zimmerman, M.; Kerr, S. How should the severity of depression be rated on self-report depression scales?Psychiatry Res. 2019, 280, 112512. [CrossRef]
16. Yap, K.; Grisham, J.R. Unpacking the construct of emotional attachment to objects and its association withhoarding symptoms. J. Behav. Addict. 2019, 8, 249–258. [CrossRef]
17. Wolfson, J.A.; Lahne, J.; Raj, M.; Insolera, N.; Lavelle, F.; Dean, M. Food Agency in the United States:Associations with Cooking Behavior and Dietary Intake. Nutrients 2020, 12, 877. [CrossRef]
18. Skrzynski, C.; Creswell, K.G.; Bachrach, R.L.; Chung, T. Social discomfort moderates the relationship betweendrinking in response to negative affect and solitary drinking in underage drinkers. Addict. Behav. 2018, 78,124–130. [CrossRef]
19. Minen, M.T.; Jalloh, A.; Begasse de Dhaem, O.; Seng, E.K. Behavioral Therapy Preferences in People withMigraine. Headache 2020, 32, 196–200. [CrossRef]
20. Bickel, G.; Nord, M.; Price, C.; Hamilton, W.; Cook, J. Guide to Measuring Household Food Security; Revised2000; U.S. Department of Agriculture: Washington, DC, USA, 2000. Available online: https://www.fns.usda.gov/guide-measuring-household-food-security-revised-2000 (accessed on 27 May 2020).
21. United States Department of Agriculture Economic Research Service. Definition of Food Insecurity.2019. Available online: https://www.ers.usda.gov/topics/food-nutrition-assistance/food-security-in-the-us/definitions-of-food-security/ (accessed on 13 April 2020).
22. Aljazeera. Lockdowns, Closures: How Is Each US State Handling Coronavirus? 2020. Availableonline: https://www.aljazeera.com/news/2020/03/emergencies-closures-states-handling-coronavirus-200317213356419.html (accessed on 14 April 2020).
23. Sachs-Ericsson, N.; Schatschneider, C.; Blazer, D.G. Perception of Unmet Basic Needs as a Predictor of PhysicalFunctioning Among Community-Dwelling Older Adults. J. Aging Health 2006, 18, 852–868. [CrossRef]
24. Berkowitz, S.A.; Seligman, H.K.; Choudhry, N.K. Treat or eat: Food insecurity, cost-related medicationunderuse, and unmet needs. Am. J. Med. 2014, 127, 303–310.e3. [CrossRef]
25. Berkowitz, S.A.; Meigs, J.B.; DeWalt, D.; Seligman, H.K.; Barnard, L.S.; Bright, O.J.; Schow, M.; Atlas, S.J.;Wexler, D.J. Material need insecurities, control of diabetes mellitus, and use of health care resources: Resultsof the Measuring Economic Insecurity in Diabetes study. JAMA Intern. Med. 2015, 175, 257–265. [CrossRef]
26. Berkowitz, S.A.; Basu, S.; Meigs, J.B.; Seligman, H.K. Food Insecurity and Health Care Expenditures in theUnited States, 2011–2013. Health Serv. Res. 2018, 53, 1600–1620. [CrossRef]
27. Long, H.; Dam, A.V. America is in a depression, the challenge now is to make it short-lived. The WashingtonPost, 9 April 2020.
28. Martin, M.S.; Maddocks, E.; Chen, Y.; Gilman, S.E.; Colman, I. Food insecurity and mental illness:Disproportionate impacts in the context of perceived stress and social isolation. Public Health 2016, 132,86–91. [CrossRef]
29. Leung, C.W.; Wolfson, J.A.; Lahne, J.; Barry, M.R.; Kasper, N.; Cohen, A.J. Associations between Food SecurityStatus and Diet-Related Outcomes among Students at a Large, Public Midwestern University. J. Acad.Nutr. Diet. 2019, 119, 1623–1631. [CrossRef]
30. Smith, T.M.; Colon-Ramos, U.; Pinard, C.A.; Yaroch, A.L. Household food insecurity as a determinant ofoverweight and obesity among low-income Hispanic subgroups: Data from the 2011–2012 California HealthInterview Survey. Appetite 2016, 97, 37–42. [CrossRef] [PubMed]
108

Nutrients 2020, 12, 1648
31. Seligman, H.K.; Laraia, B.A.; Kushel, M.B. Food insecurity is associated with chronic disease amonglow-income NHANES participants. J. Nutr. 2009, 140, 304–310. [CrossRef] [PubMed]
32. Lee, J.S.; Gundersen, C.; Cook, J.; Laraia, B.; Johnson, M.A. Food insecurity and health across the lifespan.Adv. Nutr. 2012, 3, 744–745. [CrossRef] [PubMed]
33. Coronavirus Aid, Relief, and Economic Security (CARES) Act. Public Law 116-136. 2020.34. Families First Coronavirus Response Act. Public Law 116-127. 2020.35. Kulish, N. ‘Never Seen Anything Like It’: Cars Line up for Miles at Food Banks. 2020.
Available online: https://www.nytimes.com/2020/04/08/business/economy/coronavirus-food-banks.html?referringSource=articleShare (accessed on 14 April 2020).
36. United States Department of Agriculture Food and Nutrition Service. Find Meals for Kids When Schools areClosed. 2020. Available online: https://www.fns.usda.gov/meals4kids (accessed on 14 April 2020).
37. Nord, M.; Prell, M. Food Security Improved Following the 2009 ARRA Increase in SNAP Benefits; ERR-116; ReportNo. 1477-2017-4088; US Department of Agriculture, Economic Research Service: Washington, DC, USA, 2011.
38. Anderson, M.; Perrin, A.; Jiang, J.L.; Kumar, M. 10% of Americans Don’t Use the Internet. Who AreThey? Pew Research Center. 2019. Available online: https://www.pewresearch.org/fact-tank/2019/04/22/some-americans-dont-use-the-internet-who-are-they/ (accessed on 27 May 2020).
© 2020 by the authors. Licensee MDPI, Basel, Switzerland. This article is an open accessarticle distributed under the terms and conditions of the Creative Commons Attribution(CC BY) license (http://creativecommons.org/licenses/by/4.0/).
109


nutrients
Article
Caregiver’s Self-Confidence in Food ResourceManagement Is Associated with Lower Risk ofHousehold Food Insecurity among SNAP-Ed-EligibleHead Start Families
Lamis Jomaa 1,2, Muzi Na 2, Sally G. Eagleton 2,3, Marwa Diab-El-Harake 1 and
Jennifer S. Savage 2,3,*
1 Department of Nutrition and Food Sciences, Faculty of Agricultural and Food Sciences, American Universityof Beirut, Riad El-Solh, P.O. Box 11-0236, Beirut 1107-2020, Lebanon; [email protected] (L.J.);[email protected] (M.D.-E.-H.)
2 Department of Nutritional Sciences, Penn State College of Health and Human Development,108C Chandlee Laboratory, University Park, PA 16802, USA; [email protected] (M.N.);[email protected] (S.G.E.)
3 Center for Childhood Obesity Research, Penn State College of Health and Human Development,University Park, PA 16802, USA
* Correspondence: [email protected]
Received: 26 June 2020; Accepted: 29 July 2020; Published: 31 July 2020
Abstract: Food resource management (FRM) behaviors are key components within nutrition educationprograms designed to help food insecure households maximize their food dollars. However, little isknown about the association between FRM self-confidence and financial practices with householdfood insecurity (HFI) among families with young children. Using a sample of SNAP-Ed-eligibleHead Start families, this study examined associations between FRM self-confidence, FRM behaviorsand financial practices by HFI. A needs assessment survey was conducted with caregivers of HeadStart children (n = 365). HFI was measured using the US Household Food Security Survey Module.Chi-square and logistic regression analyses were conducted to examine if FRM self-confidence,FRM behaviors, and financial practices differed by HFI. Participants with high FRM self-confidencehad lower odds of HFI (OR = 0.54, 95%CI: 0.33, 0.87), yet FRM behaviors, financial practices, and HFIwere not related after adjusting for covariates. All FRM self-confidence questions significantly differedby HFI, whereas only one of six FRM behaviors and two of three financial practices differed by HFI(all p-values < 0.05). Promoting caregivers’ self-confidence in FRM skills within nutrition educationprograms may be explored as a potential strategy to assist low-income households to stretch theirfood dollars in an attempt to address HFI.
Keywords: food resource management; food insecurity; self-confidence; nutrition education; financialpractices; SNAP-Ed; Head Start; young children
1. Introduction
Household food insecurity (HFI), defined as “the inability to provide enough food for a healthyand active lifestyle for all household members [1]”, remains a serious social and public health problemin the US [2]. Food insecurity is especially prevalent among low-income families with children. In 2018,13.9% of American households with children were food insecure, and the prevalence of HFI reached14.3% among households with children 6 years of age or younger [3]. Food insecurity is associated witha range of negative health outcomes among infants and young children, including poor physical health,increased risk of infections, micronutrient deficiencies [4,5], suboptimal sleep quality [6], adverse
Nutrients 2020, 12, 2304; doi:10.3390/nu12020304 www.mdpi.com/journal/nutrients111

Nutrients 2020, 12, 2304
behavioral, mental, and academic behaviors [5,7,8], as well as obesity and other chronic conditionsduring childhood and later in life [7,9].
Federal assistance programs that provide monetary benefits along with nutrition education tolow-income households have been shown to alleviate HFI [10]. These nutrition education programs,such as the Supplemental Nutrition Assistance Program Education (SNAP-Ed) and the ExpandedFood and Nutrition Education Program (EFNEP), provide participants with trainings on how tomaximize the use of their food dollars while providing healthy foods to their families and children [11].An integral component of these nutrition education programs is to teach individuals how to acquirefood resource management (FRM) skills and behaviors defined as “the handling of all foods and theresources that may be used to acquire foods by an individual or family [12].” In addition, FRM trainingscover topics such as meal planning, shopping strategies, food selection, budgeting, food preparation,and cooking strategies to maximize nutrition under resource constraints [12]. Previous studies indicatethat integrating FRM within nutrition education (e.g., food preparation tips, healthful food selection,and budgeting) improves the food security status of low-income households [10,13], including thosewith children [14,15].
Although food assistance programs, such as SNAP and SNAP-Ed, focus on behavioral change inFRM, less emphasis has been placed on assessing participants’ self-efficacy and confidence in their FRMskills. Few studies, to date, have reported how nutrition education interventions targeting self-efficacyand confidence in FRM can improve food security [15,16]. Perceived self-efficacy represents a keyconstruct in behavioral change theories, as it refers to an “individual’s confidence in their ability to planand follow through with a series of actions that will result in desired outcomes or achievements” [17].Research studies examining the effect of self-efficacy on behavioral change related to nutrition, exercise,and weight loss [18], as well as the prevention of chronic diseases [19], have demonstrated the pivotalrole that self-efficacy plays in improving health. Knowing that families experiencing food insecuritymay face various challenges affecting their confidence in managing their budgets to maintain foodsufficiency [20,21], it is integral to further examine the association between FRM self-confidence andHFI [16].
Food insecurity is linked to income [1]; however, food insecurity is not the outcome of incomealone. Instead, it is influenced by a myriad of other demographic, environmental, and financialfactors [22,23]. To further examine the determinants of HFI, a growing body of literature has beenexploring the association between financial management skills and food insecurity [22,24]. It waspreviously suggested that good financial management practices may safeguard certain householdsfrom food insecurity, whereas those with less effective financial skills may be at increased risk of foodinsecurity [22,25]. To our knowledge, the associations between FRM, financial practices, and HFI havenot been adequately explored in the literature, particularly among households with young children.To address this research gap, the present study aimed to first examine the associations between FRMself-confidence and FRM behaviors by HFI status using a sample of SNAP-Ed-eligible Head Startfamilies. A secondary objective of the study was to explore the association between financial practicesof caregivers and HFI status in the study sample. Head Start is a federally-funded program thatserves just over 900,000 low-income preschool children in the US to optimize their health and nutrition.The Head Start program also provides balanced snacks and meals to children through the Child andAdult Care Food Program [26]. Although previous studies have shown that Head Start programscan help alleviate HFI and improve nutrition outcomes of children [27,28], none, to our knowledge,have examined the potential associations between caregiver’s FRM self-confidence and behaviors byHFI. We hypothesized that (1) caregivers with higher self-confidence and better FRM skills would havelower risk of being food insecure; and (2) caregivers with good financial practices would report lowerlevels of food insecurity.
112

Nutrients 2020, 12, 2304
2. Materials and Methods
2.1. Sampling and Recruitment
Caregiver-child dyads in the present study were recruited from Head Start preschool classroomsin four rural counties in central Pennsylvania. Data used in the present study were drawn from a needsassessment survey that was designed to characterize the home environments of low-income familieswith young children and to better inform future nutrition education programming for the Head Startparticipants. The survey was distributed through classrooms to 1297 Head Start families. If parentshad more than one child enrolled in Head Start, they were instructed to complete the survey for theiroldest child enrolled in the program. Of the 1297 distributed surveys, 379 (30%) were returned in themail. Caregivers received a $25 gift card for their participation. Data collection spanned May 2017to May 2018. Among nine families, a survey was completed for two children in the home, thus weexcluded the survey for the younger of the two children. Four children were excluded because theywere outside the age range of Head Start eligibility, resulting in a final study sample of 365. For thepurpose of the present study, a minimum sample size of 134 participants was required to test for theassociations between our main variables of interest (FRM behavior, FRM self-confidence, and HFI)at 80% power and with 95% confidence interval. The sample size calculations were done using datafrom previous studies that examined similar associations [10,16]. Informed consent was obtainedfrom subjects prior to their participation in the study. The study was conducted in accordance withthe Declaration of Helsinki, and the protocol was approved by the Institutional Review Board at thePennsylvania State University (00007467).
2.2. Caregiver and Household Characteristics
The survey included questions related to the caregiver characteristics, such as age and sex,ethnicity, education, employment, and marital status. As for household characteristics, questionsincluded child’s age, number of children in the household, number of people supported by householdincome, participation in assistance programs in the past 12 months (e.g., Special Supplemental NutritionProgram for Women, Infants, and Children (WIC) and Supplemental Nutrition Assistance Program(SNAP)), and household income. Household income was missing in seventy-four of 365 households(20.2%). Missing income was imputed based on WIC and SNAP status, parent education, maritalstatus, and employment using PROC MI in SAS software (SAS Institute Inc., Cary, NC, USA).
2.3. Household Food Insecurity Status
Household food insecurity (HFI) experienced during the previous 12 months was measured usingthe 18-item US Household Food Security Survey Module [1]. The food security status of householdswas determined by the number of food-insecure conditions and behaviors the household reports.Households were classified as ‘food secure’ if participants responded affirmatively to two or feweritems on the 18-item scale and as ‘food insecure’ if the affirmative responses were on three or moreitems, such as “cutting the size of meals or skipping meals because there wasn’t enough money forfood during the past 12 months” or “losing weight because there wasn’t enough money for food”.
2.4. Food Resource Management (FRM) Self-Confidence and Behaviors
FRM self-confidence and FRM behaviors of caregivers were assessed in the present study usingtwo sets of questions derived from the SNAP-Ed evaluation framework guide and toolkit [11].These questions were previously used and validated in other studies assessing the impact ofnutrition education programs targeting low-income adults, including SNAP-Ed, Cooking Matters,and Expanded Food and Nutrition Education Program (EFNEP), on participants’ FRM skills [10,14,29]and confidence [16,29].
The caregivers’ self-confidence in FRM abilities (in the past 12 months) was assessed in the presentstudy using five questions. Three questions assessed caregiver confidence to “choose the best-priced
113

Nutrients 2020, 12, 2304
form of fruits and vegetables”, “buy healthy foods on a budget”, and “cook healthy foods on a budget”;and two questions were related to caregiver’s confidence in their ability to “make a shopping listand stick to it” and “compare prices of similar foods to find the best value”. Responses for thesequestions were measured using a 4-point Likert scale that ranged from 1 (not very confident) to 4 (veryconfident). An average FRM self-confidence score was calculated for each participant based on theirresponses to the five questions, and a binary score was later created for FRM self-confidence to classifyparticipants into two groups (low/high): participants with scores less than the median were categorizedas “low” FRM self-confidence, whereas participants with scores greater than or equal to the medianscore were categorized as “high” FRM self-confidence. A high FRM self-confidence indicated a greaterself-confidence in shopping, preparing foods, and managing food resources on a budget.
The FRM behaviors of participants in the present study were assessed using six questions fromthe SNAP-Ed evaluation framework and toolkit, asking how often do caregivers “plan meals beforeshopping”, “prepare shopping list”, “compare prices before buying”, “use grocery store flyers”,and “identify foods on sales or use coupons” [11]. A 5-point response scale (1 = never, 2 = rarely,3 = sometimes, 4 = usually, 5 = always) was used for each of the FRM behavior items. An average FRMbehavior score was first calculated, then a binary score was created to classify participants into twogroups: participants with scores less than the median were categorized as “low” FRM behaviors,whereas participants with scores greater than or equal to the median score were categorized as “high”FRM behaviors. A high FRM behavior indicated better practices in meal planning, shopping with agrocery list, and comparing prices.
2.5. Financial Situation, Financial Practices, and Difficulties
To assess the financial situation, respondents were asked to describe their own financial situationwith responses including: 1 = “Very comfortable and secure”, 2 = “Very comfortable and secure”,3 = “Occasionally have some difficulty making ends meet”, 4 = “Tough to make ends meet but keepinghead above water”, and 5 = “In over your head”. As for financial difficulties, these were evaluatedbased on 5 questions from the USDA national food study [30] to assess difficulties that individualshad in meeting their essential household expenses, such as mortgage or rent payments, utility bills,or important medical care during the past six months.
Financial practices of the caregivers were also assessed using 3 questions that were derived fromthe USDA national food study [30]. Caregivers were asked to report how frequently they adoptedthe following practices during the past 6 months: “review your bills for accuracy”, “pay your billson time”, and “pay more than the “minimum payment due” on your credit card bills”. Responseoptions ranged from 1 = never to 5 = always. An average financial practices score was calculatedfor each participant based on their responses to the five questions, and a binary score was latercreated (low/high): participants with scores less than the median were categorized as “low”, whereasparticipants with scores greater than or equal to the median score were categorized as “high”, referringto those with better financial practices.
2.6. Statistical Analyses
Descriptive statistics were reported in the present study as frequencies and proportions forcategorical variables and as medians and interquartile ranges (IQR) for non-normal continuousvariables. Chi-square tests and Mann-Whitney U tests were conducted to explore differences betweencategorical variables and non-normal continuous variables by HFI status (food secure vs. food insecurehouseholds), respectively. Simple and multiple logistic regression analyses were also conducted toexamine the association between FRM self-confidence, FRM behaviors, and financial practices byHFI status. Variables included in the multiple logistic regression models were those found to havea significant bivariate relationship with HFI and were statistically significant in the simple logisticmodels (p < 0.05). Sensitivity analyses were also conducted to assess the validity of findings by:(1) adjusting for significant and non-significant sociodemographic variables as potential confounders
114

Nutrients 2020, 12, 2304
in the logistic regression models, (2) running linear regression models with HFI and other variablesof interest (FRM behavior, FRM self-confidence and financial practices) as continuous variables, and(3) running models using imputed and non-imputed income data. For the models with non-imputedincome, we excluded subjects with missing income in the sensitivity analysis. Results from the logisticregression models were expressed as odds ratios with 95% confidence intervals. Statistical analyseswere conducted using Stata/MP version 15.1 (StataCorp. College Station, TX, USA). A p-value of 0.05was used to detect significance in all analyses used in the present study.
3. Results
3.1. Descriptive Characteristics of the Study Sample
The majority of caregivers in our study sample were females (96%), White non-Hispanic (98%),and completed high school education level or less (61%). The median age of caregivers was 30 (IQR = 9)years old. More than half of study participants were married or partnered (57%) and unemployed(54%). In addition, almost three quarters of participants were receiving SNAP benefits (75%) and WIC(70%). The median number of children in the household was 2, and the prevalence of HFI was 37%(see Table 1).
Caregiver and household characteristics of the study sample were also presented by HFI in Table 1.Participation in the SNAP/Food Stamps program was significantly greater among food insecurehouseholds compared to food secure ones (84% vs. 69%, p = 0.001), whereas participation in WICwas less common among food insecure households (64% vs. 74%, respectively, p = 0.041). No othersignificant associations were noted between HFI and demographic characteristics in the present study.
Table 1. Descriptive characteristics of a sample of low-income Head Start families with preschool- agedchildren from four rural counties in central Pennsylvania, USA, by household food insecurity status,(n = 365) 1,2,3.
Total Sample(n = 365)
Food Secure(n = 229)
Food Insecure 4
(n = 136)p-Value
Caregiver characteristics
Parent’s age 30 [9] 30 [9] 30 [8] 0.915
Parent ethnicityHispanic 7 (2) 4 (2) 3 (2) 0.711
Non-Hispanic 330 (98) 209 (98) 121 (98)
Parent genderFemale 346 (96) 217 (96) 129 (96) 0.831Male 15 (4) 9 (4) 6 (4)
Highest parent education completed≤High school 212 (61) 134 (63) 78 (59) 0.461>High school 135 (39) 80 (37) 55 (41)
Marital statusNot married 155 (43) 95 (42) 60 (44) 0.623
Married or partnered 210 (57) 134 (58) 76 (56)
Employment statusUnemployed 194 (54) 120 (53) 74 (55) 0.751
Employed 167 (46) 106 (47) 61 (45)
Household characteristics
Child’s age 4 [1] 4 [1] 5 [1] 0.383Number of children 2 [1] 2 [1] 2 [1] 0.860
115

Nutrients 2020, 12, 2304
Table 1. Cont.
Total Sample(n = 365)
Food Secure(n = 229)
Food Insecure 4
(n = 136)p-Value
Number of people (supported byincome) 4 [2] 4 [2] 4 [2] 0.242
Yearly household income<$20,000 176 (49) 108 (48) 68 (50) 0.635≥$20,000 185 (51) 118 (52) 67 (50)
Participation in assistance program(in the past 12 months) 5
SNAP/Food Stamps 270 (75) 156 (69) 114 (84) 0.001WIC 253 (70) 167 (74) 86 (64) 0.041
1 Categorical variables were presented as n (%) and non-normal continuous variables were presented as mediansand interquartile ranges (IQR). IQR represents the difference between the upper and lower quartiles (Q3−Q1).2 Chi-square tests were conducted to determine differences between categorical variables and binary food securitystatus. 3 Mann-Whitney U tests were used to determine differences between non-normal continuous variables andbinary food security status. 4 Households with low and very low food security status were categorized as foodinsecure and those with marginal or high food security were classified as food secure [1]. 5 SNAP, SupplementalNutrition Assistance Program; TANF, Temporary Assistance for Needy Families; WIC, The Special SupplementalNutrition Program for Women, Infants, and Children.
3.2. Food Resource Management and Household Food Insecurity
Table 2 presents FRM self-confidence and FRM behaviors of caregivers in the study sample andby HFI. Results showed that almost three-quarters of caregivers were moderately to very confident inchoosing best priced food items, comparing food prices for best values, and cooking healthy fooditems on a budget. In addition, slightly greater than two-thirds of participants were moderately orhighly confident in “buying health foods for their families on a budget” and “making a shopping listand sticking to it”. The proportion of participants reporting usually or always adopting FRM behaviorsranged between 31% and 79%. The less adopted FRM behaviors included “using grocery store flyersto plan meals” (31%), “planning of meals prior to grocery shopping” (57%), and “identifying foods onsale or using coupons to save money” (57%).
Table 2. Food resource management (FRM) self-confidence and FRM behaviors of Head Start caregiversin the study sample by household food insecurity, (n = 365) 1.
ResponsesTotal Sample
(n = 365)Food Secure
(n = 229)Food Insecure
(n = 136)p-Value
FRM self-confidence n (%)
How confident are you thatyou can choose the best-pricedform of fruits and vegetables(fresh, frozen or canned)?
Not very confident 17 (5) 9 (4) 8 (6) 0.046Somewhat confident 80 (22) 44 (19) 36 (27)Moderately confident 135 (37) 80 (35) 55 (40)
Very confident 131 (36) 94 (42) 37 (27)
How confident are you thatyou can buy healthy foods foryour family on a budget?
Not very confident 28 (8) 12 (5) 16 (12) <0.001Somewhat confident 85 (23) 44 (20) 41 (30)Moderately confident 127 (35) 78(34) 49(37)
Very confident 122 (34) 94 (41) 28 (21)
How confident are you thatyou can cook healthy foods foryour family on a budget?
Not very confident 18 (5) 10 (4) 8 (6) <0.001Somewhat confident 83 (23) 36 (16) 14 (34)Moderately confident 126 (34) 79 (35) 47 (35)
Very confident 137 (38) 103 (45) 34 (25)
How confident are you thatyou can make a shopping listand stick to it?
Not very confident 31 (8) 16 (7) 15 (11) 0.008Somewhat confident 86 (24) 50 (22) 36 (26)Moderately confident 113 (31) 63 (28) 50 (37)
Very confident 134 (37) 99 (43) 35 (26)
116

Nutrients 2020, 12, 2304
Table 2. Cont.
ResponsesTotal Sample
(n = 365)Food Secure
(n = 229)Food Insecure
(n = 136)p-Value
How confident are you thatyou can compare prices ofsimilar foods to find the bestvalue?
Not very confident 21 (6) 9 (4) 12 (9) 0.015
Somewhat confident 70 (19) 40 (18) 30 (22)Moderately confident 122 (33) 71 (31) 51 (37)
Very confident 151 (42) 108 (47) 43 (32)
FRM behaviors n (%)
How often do you compareprices before buying food?
Never 17 (5) 13 (6) 4 (3) 0.761Rarely 21 (6) 13 (6) 8 (6)
Sometimes 77 (21) 49 (21) 28 (21)Usually 122 (33) 77 (34) 45 (33)Always 127 (35) 76 (33) 51 (37)
How often do you plan mealsbefore shopping for groceries?
Never 13 (4) 8 (4) 5 (4) 0.812Rarely 30 (8) 18 (8) 12 (9)
Sometimes 112 (31) 71 (31) 41 (30)Usually 131 (36) 78 (34) 53 (39)Always 75 (21) 51 (23) 24 (18)
How often do you use ashopping list when groceryshopping?
Never 14 (4) 7 (3) 7 (5) 0.016
Rarely 25 (7) 15 (6) 10 (7)Sometimes 70 (19) 45 (20) 25 (19)
Usually 99 (27) 50 (22) 49 (36)Always 156 (43) 111 (49) 45 (33)
How often do you check foodon hand before making ashopping list? *
Never 7 (2) 3 (1) 4 (3) 0.349Rarely 15 (4) 12 (5) 3 (2)
Sometimes 55 (15) 33 (15) 22 (16)Usually 117 (32) 69 (30) 48 (35)Always 170 (47) 111 (49) 59 (44)
How often do you use grocerystore flyers to plan meals?
Never 67 (19) 42 (18) 25 (18) 0.922Rarely 63 (17) 38 (17) 25 (18)
Sometimes 121 (33) 74 (32) 47 (35)Usually 56 (15) 38 (17) 18 (13)Always 57 (16) 36 (16) 21 (16)
How often do you identifyfoods on sale or use couponsto save money? *
Never 26 (7) 14 (6) 12 (9) 0.453Rarely 21 (6) 16 (7) 5 (4)
Sometimes 108 (30) 64 (28) 44 (32)Usually 105 (29) 65 (29) 40 (29)Always 104 (28) 69 (30) 35 (26)
1 Chi-square test was conducted to determine differences between categorical variables and binary food securitystatus. * For expected cell counts less than 5, p-value from Fisher’s exact test was reported.
Significant differences were observed between food secure and food insecure households for allFRM self-confidence items (p-value < 0.05). More specifically, caregivers in food secure householdswere more likely to report being very confident in their abilities to “choose best priced fruits andvegetables” (42% vs. 27%), “buy healthy foods for their families” (41% vs. 21%), “cook healthy foodson a budget” (45% vs. 25%), “make a shopping list and stick to it” (43% vs. 26%), and “compareprices of similar foods when shopping to get the best value” (47% vs. 32%) when compared to theirfood insecure counterparts. On the other hand, only one item from the FRM behaviors was foundto be significantly different between food secure and food insecure households in our study sample.A greater proportion of caregivers in food secure households reported that they always “use a shoppinglist when grocery shopping” as compared to their food insecure counterparts (49% vs. 33%, Table 2).
3.3. Financial Situation, Practices, and Difficulties and Household Food Insecurity
When caregivers were asked to describe the household’s financial situation, 37% of the totalsample reported being “very comfortable and secure” or “able to make ends meet without muchdifficulty”, 34% “occasionally have some difficulty making ends meet”, and the remaining 29% reportedit is “tough to make ends meet but keeping your head above water” or they are “in over their heads”.In terms of financial practices, the majority of caregivers in the study sample responded they usually
117

Nutrients 2020, 12, 2304
or always “review bills for accuracy” (75%) and “pay bills on time” (79%), yet less than one-third ofparticipants responded they “pay more than the “minimum payment due” on credit card bills” asfrequently. With respect to financial difficulties, 39% of caregivers in our study reported going througha time “when they could not pay mortgage or rent, electricity or gas utilities, or important medicalexpenses”, and 44% reported going through periods when they “could not pay the full amount of gas,oil, or electricity bills” (Table 3).
Table 3. Financial situation, practices and difficulties of Head Start caregivers in the study sample andby household food insecurity (n = 365) 1.
ResponsesTotal Sample
(n = 365)Food Secure
(n = 229)Food Insecure
(n = 136)p-Value
Which of the followingbest describes yourfamily’s financialsituation? * n (%)
Very comfortable & secure 31 (9) 27 (12) 4 (3) <0.001Able to make ends meetwithout much difficulty 98 (28) 88 (40) 10 (7)
Occasionally have somedifficulty making ends meet 121 (34) 69 (31) 52 (40)
Tough to make ends meetbut keeping head above
water91 (26) 32 (14) 59 (45)
In over your head 13 (3) 7 (3) 6 (5)
Financial practices n (%)
How often do youreview your bills foraccuracy? *
Never 14 (4) 13 (6) 1 (1) 0.112Rarely 31 (8) 16 (7) 15 (11)
Sometimes 47 (13) 29 (13) 18 (13)Usually 132 (36) 85 (37) 47 (35)Always 140 (39) 85 (37) 55 (40)
How often do you payyour bills on time? *
Never 5 (1) 3 (1) 2 (1) <0.001Rarely 13 (4) 4 (2) 9 (7)
Sometimes 59 (16) 30 (13) 29 (21)Usually 140 (38) 78 (34) 62 (46)Always 148 (41) 114 (50) 34 (25)
How often do you paymore than the“minimum payment due”on your credit card bills?
Never 109 (33) 66 (32) 43 (37) 0.001Rarely 46 (14) 19 (9) 27 (23)
Sometimes 70 (22) 47 (22) 23 (20)Usually 46 (14) 35 (17) 11 (9)Always 55 (17) 42 (20) 13 (11)
Financial difficulties n (%)
Has there been a timewhen you could not payyour mortgage or rent,electricity or gas utilities,or important medicalexpenses?
Yes 141 (39) 55 (24) 86 (63) <0.001
Were you evicted from ahome or apartment fornot paying the rent ormortgage? *
Yes 6 (2) 2 (1) 4 (3) 0.201
Has there been a timewhen you could not paythe full amount of gas,oil, or electricity bills?
Yes 159 (44) 72 (32) 87 (64) <0.001
Have you used a cashadvance service on anyof your credit cards? *
Yes 15 (4) 5 (2) 40 (7) 0.013
Have you used a paydayloan or other highinterest loan?
Yes 11 (3) 4 (2) 7 (5) 0.107
* For cells with counts less than 5 in the chi-square analysis, p-value from Fisher’s exact test was reported.
118

Nutrients 2020, 12, 2304
In addition, Table 3 presents the financial situation, difficulties, and financial practices of caregiversin the study sample by HFI. Overall, food insecure households were more likely to report their financialsituation as “occasionally have some difficulty making ends meet” (40% vs. 31%) or “tough to makeends meet but keeping head above water” compared to their food secure counterparts (45% vs. 14%).In terms of financial practices, a higher proportion of caregivers in food secure households reportedthey always “pay bills on time” (50% vs. 25%) and “pay more than the minimum payment due oncredit card bills” (20% vs. 11%) compared to their food insecure counterparts. On the other hand, foodinsecure households were significantly more likely to report facing financial difficulties compared tofood secure ones: “has there been a time when you could not pay your mortgage or rent, electricity orgas utilities, or important medical expenses?” (63% vs. 24%) and “has there been a time when youcould not pay the full amount of gas, oil, or electricity bills” (64% vs. 32%), p-value < 0.001.
3.4. Food Resource Management, Financial Practices, and Household Food Insecurity
The associations between FRM self-confidence, FRM behaviors, and financial practices with HFIwere also explored in the present study (Table 4). Results from the logistic regression analyses showed thatcaregivers with high FRM self-confidence had lower odds of HFI (OR = 0.54, 95% CI: 0.33, 0.87, p = 0.012),even after adjusting for financial practices and participation in food assistance programs (SNAP and WIC).Although the association between financial practices and HFI was significant in the simple regressionanalysis, this association lost its statistical significance in the adjusted model (OR = 0.77, 95%CI: 0.46, 1.3,p = 0.338). Results from the models remained robust after conducting sensitivity analyses and adjustingfor significant and non-significant sociodemographic variables, including parent’s age, employment,household income (imputed and not imputed values), and participation in food assistance programs inthe past 12 months (Supplemental tables—Tables S1 and S2).
Table 4. Simple and multiple logistic regression analyses of food resource management (FRM)self-confidence, FRM behaviors, and financial practices of Head Start caregivers with household foodinsecurity (n = 365).
Simple Logistic Regression Multiple Logistic Regression 1
FRM self-confidenceLow 1.0 1.0High 0.50 (0.32, 0.77) 0.54 (0.33, 0.87)
p-value p = 0.002 p = 0.012
FRM behaviorsLow 1.0 -High 0.98 (0.64, 1.5) -
p-value p = 0.913
Financial practices
Low 1.0 1.0High 0.52 (0.32, 0.85) 0.77 (0.46, 1.3)
p-value p = 0.010 p = 0.3381 The model was adjusted for socio-economic characteristics found to be significant correlates of household foodinsecurity, namely participation in any assistance program (in the past 12 months) including SNAP/Food Stampsor WIC.
4. Discussion
Food insecurity remains a social and public health problem for low-income families with youngchildren in the US that has serious consequences on children’s overall health and wellbeing. To ourknowledge, the present study is the first to examine the associations between FRM self-confidence,FRM behaviors, and financial practices by HFI status in a sample of low-income households withyoung children. Using a sample of SNAP-Ed-eligible Head Start families, our study findings showedthat caregiver’s self-confidence in their FRM was associated with lower odds of HFI. Nevertheless,
119

Nutrients 2020, 12, 2304
the associations between the FRM behaviors and financial practices of Head Start caregivers by HFIwere not statistically significant in the adjusted models.
As hypothesized, caregivers with high FRM self-confidence had lower odds of HFI in the presentstudy, even after adjusting for other correlates including FRM behaviors, financial practices andparticipation in other federal assistance programs. When individual FRM questions were explored,all FRM self-confidence questions were also found to significantly differ by HFI status. More specifically,caregivers in food secure households were more likely to report being “very confident” in their abilitiesto choose the best priced fruits and vegetables, compare prices of similar foods when shopping to getthe best value, as well as buy and cook healthy foods for their families on a budget as compared totheir food insecure counterparts. These results were in concordance with those reported earlier byBegley et al. (2019) showing that food secure participants, who were assessed at the enrollment stage ofan adult food literacy program in Australia, reported being “always confident” about managing moneyfor healthy food compared to food insecure participants (41.2% vs. 9%) and “always confident” in theirability to cook a variety of healthy meals (21.9% vs. 15.4%) [31]. Our findings were also consistent witha few studies conducted to date that highlight how greater self-efficacy in shopping and preparinghealthy food, based on nutrition education programs targeting low income adults, has been associatedwith lower risk of food insecurity [16,29]. According to Martin et al. (2016), self-efficacy in managingfood resources was found to be associated with a decrease in very low food security levels amongfood pantry clients participating in the Freshplace intervention. This was an 18-month innovativefood pantry intervention that combined several strategies to boost the confidence of participants,such as motivational interviewing and serving food in client-choice format to increase their confidencein planning meals ahead of time, making a shopping list before going to the store, and makingfood money last all month [16]. Another study evaluating the impact of Cooking Matters for Adultsnutrition education program showed significant improvements in the FRM skills and self-confidencein managing food resources of low-income households up to six months after the program completion.In addition, participants in the Cooking Matters intervention were worried less that food would runout before they could get money to buy more [29]. It is worth noting that these nutrition educationprograms were focused primarily on improving the self-efficacy of low-income adults as integralcomponents for the uptake and maintenance of FRM skills to maximize the use of limited food dollars.
Although self-efficacy represents a key construct within theories of behavioral change and hasbeen shown to be effective in promoting healthy behaviors for weight loss, exercise, and chronic diseasemanagement [32,33], only a few studies to date, as described earlier, have explored the associationbetween self-confidence in FRM with food insecurity among low-income households [16,29]. To ourknowledge, the present study is the first to examine these associations in low-income households,focusing primarily on those with young children. Our study findings suggest that increased confidencein resource management skills among caregivers may be associated with lower risk of HFI. Theseresults may be promising for families with young children, who may have increased concerns aboutsmart shopping, stretching their food dollars, as well as cooking tasty and low-cost food to feed theirchildren [20,34]. Food insecure individuals may be also influenced by financial, social, and personalstressors that can further affect their confidence in their ability to shop, prepare, and plan a healthymeal on a limited budget [35,36]. Thus, federal assistance and nutrition education programs targetingfamilies with young children, such as Head Start and SNAP-Ed, may need to give particular attentionto strategies that can help improve the self-confidence and efficacy of caregivers in their resourcemanagement skills. These programs can also help participants in accessing community-level resourcesand in overcoming common misconceptions and barriers to enrolling in other federal assistanceprograms, including WIC [37].
Nevertheless, when exploring FRM behaviors, only one of the six behaviors of caregivers wereshown to differ significantly by HFI in the present study. In addition, the association between FRMbehaviors and HFI was not found to be statistically significant in the regression models. Contrary toour study findings, food secure families were previously observed to have overall better FRM skills,
120

Nutrients 2020, 12, 2304
such as shopping for sales, researching for best prices on particular products, traveling to multiplestores, and planning meals around their limited budgets [35,38]. According to Begley et al. (2019),individuals who reported at the onset of a food literacy program a low frequency of adopting certainplanning and food preparation behaviors, such as planning meals ahead of time and making a listbefore they shop, were significantly more likely to be food insecure than those who reported adoptingmore frequently these behaviors [31]. The limited differences in FRM behaviors by HFI, as observed inthe present study, can be attributed in part to the overall low proportion of caregivers who reportedplanning their meals prior to grocery shopping, using grocery store flyers to plan their meals, oridentifying foods on sale and using coupons to save money. Another reason could be differencesin questions raised when assessing caregivers’ FRM confidence and behaviors in the present study.For example, questions relevant to buying and cooking healthy foods were only present in the FRMself-confidence questionnaire, whereas questions related to using shopping lists and planning mealsprior to shopping were common among both scales. Caregivers participating in the present study mayhave also received family-centered services that cover topics related to child nutrition, growth, anddevelopment as part of the Head Start programs [39–42], which could have influenced their perceivedconfidence in providing healthy foods for their children. Nevertheless, confidence alone might beinsufficient to alleviate HFI, and households with higher confidence may not be able to adopt adequateFRM behaviors when other environmental, financial, and personal barriers exist, such as limitedavailability and/or access to food stores with healthy and nutritious food, lack of kitchen appliances, aswell as time and money constraints [31,38,43]. Poor physical and mental health can also affect the FRMskills and capabilities of food insecure individuals [38,44] and are worth further exploration whenexamining the association between resource management skills and HFI.
A growing body of evidence suggests that households facing economic hardships and withlimited knowledge of basic financial concepts (i.e., financial literacy) are also more likely to experiencefood insecurity compared to those with higher financial management skills [22,25]. In line withformer research, results from the present study showed significant differences in the financial situation,difficulties, and financial practices of caregivers by HFI status. Compared to caregivers from foodinsecure households, those from food secure households were more likely to report better financialsituation and lower financial difficulties reflected through their ability to pay their mortgages or otherbasic expenses (such as rent, electricity, gas, and medical expenses). In addition, caregivers fromfood secure households were also more likely to report frequently adopting certain financial practices,such as paying bills on time and paying more than the “minimum payment due” on credit card bills.Nevertheless, the association between higher financial practices and HFI lost its statistical significance inthe adjusted models. These results may be explained by the lower income levels of households enrolledin federal assistance programs, such as SNAP and WIC, who represent approximately three-quarters ofthe study sample, and who may be facing heightened financial hardships that could have attenuated theassociation between caregivers’ better financial management practices and their HFI status. Our studyfindings highlight the need to further explore the association between financial literacy (knowledgeand capabilities) and HFI, particularly in low-income households with children. The latter group maybe at increased risk of facing economic hardships, and thus may adopt risky coping strategies that canfurther increase their risk for HFI and its adverse health consequences [22,45].
Strengths and Limitations
To our knowledge, this study is the first to explore the associations between FRM self-confidence,FRM behaviors and financial practices by HFI among a sample of low-income Head Start householdswith young children. Nevertheless, the present study has a number of limitations worth considering.First, the study is cross-sectional in nature, thus causality cannot be determined when exploringthe associations between FRM self-confidence, FRM behaviors, and financial practices by HFI.The association between FRM self-confidence and food insecurity, as reported in the present study, mayhave been bidirectional in nature. Caregivers in food insecure households may have poor conditions
121

Nutrients 2020, 12, 2304
that affect their self-confidence in their resource management skills as compared to food securehouseholds; on the other hand, having higher self-confidence may also improve one’s capabilitiesto access and utilize food, which can influence their food security and feeling of self-sufficiency [31].Another limitation of the present study is that data were self-reported, thus we cannot rule outresponse bias. Our study findings may also have limited representativeness with a moderate surveyresponse rate (30%) and the study population limited to only four rural areas in central Pennsylvania.Thus, results cannot be generalizable and the external validity of our findings may be limited tocertain low-income families. Albeit modest, the response rate in the present study was still similar toother surveys conducted with rural Head Start families in Colorado (28.5%) and Appalachian Ohio(42%) [46,47]. Future research considering more diverse and larger samples of Head Start families arestill needed to further examine the associations explored in the present study.
5. Conclusions
Our study findings suggest that increased self-confidence in FRM among caregivers of youngchildren is associated with lower odds of HFI among low-income Head Start families. Nutritionand health education programs, such as SNAP-Ed and WIC, that are designed to assist low-incomehouseholds in alleviating their HFI status may need to give more emphasis to the self-efficacyand confidence of caregivers in stretching their food dollars and adopting adequate FRM skills.The strategies may help caregivers in offering healthy food and improve the food choices offered totheir children. Caregivers can also play a pivotal role in structuring their children’s early experienceswith food through child feeding practices, social modeling of healthy eating behaviors, and regulatingthe quality and quantity of food provided to the child [48–50]. Thus, future research should examinethe extent to which nutrition education programs that focus on improving FRM self-confidence andbehaviors can contribute (directly or indirectly) to the feeding practices of caregivers and, subsequently,to the diet quality and nutrition outcomes of young children in low-income households. It is alsoimportant to further investigate the role that financial literacy and practices of caregivers can play inimproving the food security of low-income households.
Supplementary Materials: The following are available online at http://www.mdpi.com/2072-6643/12/8/2304/s1.Table S1. Sensitivity analysis to evaluate the association between food resource management (FRM) self-confidencewith household food insecurity adjusting for significant and non-significant sociodemographic variables aspotential confounders in the logistic regression models, and using imputed and non-imputed income values.Table S2: Sensitivity analysis to evaluate the associations between food resource management (FRM) self-confidence,FRM behaviors, and financial practices of Head Start caregivers by household food insecurity using simple andmultiple linear regression analyses.
Author Contributions: Conceptualization, L.J., M.N., S.G.E., J.S.S.; methodology, L.J., M.N., S.G.E., M.D.-E.-H.,J.S.S.; software, S.G.E., M.D.-E.-H.; validation, L.J., S.G.E., M.D.-E.-H.; formal analysis, L.J. and M.D.-E.-H.;investigation, J.S.S.; resources, J.S.S.; data curation, S.G.E.; writing—original draft preparation, L.J.; writing—reviewand editing, L.J., M.N., S.G.E., M.D.-E.-H., J.S.S.; visualization, L.J. and M.D.-E.-H.; supervision, J.S.S.; projectadministration, J.S.S.; funding acquisition, J.S.S. All authors have read and agreed to the published version ofthe manuscript.
Funding: This project was funded by USDA’s Supplemental Nutrition Assistance Program (SNAP) through thePA Department of Human Services (DHS).
Conflicts of Interest: The authors declare no conflicts of interest.
References
1. Coleman-Jensen, A.; Rabbitt, M.; Gregory, C.; Singh, A. Household Food Security in the United States in 2018.Available online: https://www.ers.usda.gov/webdocs/publications/94849/err-270.pdf?v=963.1 (accessed on28 May 2020).
2. Bickel, G.; Nord, M.; Price, C.; Hamilton, W.; Cook, J. Guide to Measuring Household Food Security. Availableonline: https://fns-prod.azureedge.net/sites/default/files/FSGuide.pdf (accessed on 29 May 2020).
122

Nutrients 2020, 12, 2304
3. U.S. Department of Agriculture (USDA). Key Statistics & Graphics:Food Security Status of U.S. Householdsin 2018. Available online: https://www.ers.usda.gov/topics/food-nutrition-assistance/food-security-in-the-us/key-statistics-graphics.aspx (accessed on 13 February 2020).
4. Thomas, M.M.; Miller, D.P.; Morrissey, T.W. Food insecurity and child health. Pediatrics 2019, 144, e20190397.[CrossRef] [PubMed]
5. Gundersen, C.; Ziliak, J.P. Food insecurity and health outcomes. Health Aff. 2015, 34, 1830–1839. [CrossRef][PubMed]
6. Na, M.; Eagleton, S.G.; Jomaa, L.; Lawton, K.; Savage, J.S. Food insecurity is associated with suboptimalsleep quality, but not sleep duration, among low-income Head Start children of pre-school age. Public HealthNutr. 2020, 23, 701–710. [CrossRef] [PubMed]
7. Ke, J.; Ford-Jones, E.L. Food insecurity and hunger: A review of the effects on children’s health and behaviour.Paediatr. Child Health 2015, 20, 89–91. [CrossRef] [PubMed]
8. Shankar, P.; Chung, R.; Frank, D.A. Association of food insecurity with children’s behavioral, emotional, andacademic outcomes: A systematic review. J. Dev. Behav. Pediatr. 2017, 38, 135–150. [CrossRef] [PubMed]
9. Kirkpatrick, S.I.; McIntyre, L.; Potestio, M.L. Child hunger and long-term adverse consequences for health.Arch. Pediatr. Adolesc. Med. 2010, 164, 754–762. [CrossRef]
10. Kaiser, L.; Chaidez, V.; Algert, S.; Horowitz, M.; Martin, A.; Mendoza, C.; Neelon, M.; Ginsburg, D.C. Foodresource management education with SNAP participation improves food security. J. Nutr. Educ. Behav. 2015,47, 374–378.e1. [CrossRef]
11. U.S. Department of Agriculture (USDA). The Supplemental Nutrition Assistance Program Education(SNAP-ED) Toolkit: Obesity Interventions and Evaluation Framework. Available online: https://snapedtoolkit.org/framework/components/mt2/ (accessed on 4 February 2020).
12. U.S. Department of Agriculture (USDA). SNAP-Ed Toolkit: Glossary Terms. Available online: https://snapedtoolkit.org/glossary/#food_resource_management_frm (accessed on 10 March 2020).
13. Dollahite, J.; Olson, C.; Scott-Pierce, M. The impact of nutrition education on food insecurity amonglow-income participants in EFNEP. Fam. Consum. Sci. Res. J. 2003, 32, 127–139. [CrossRef]
14. Farrell, J.A. The Impact of Nutrition Education on Food Security Status and Food-Related Behaviors. Availableonline: https://scholarworks.umass.edu/cgi/viewcontent.cgi?article=2204&context=theses (accessed on8 May 2020).
15. Rivera, R.L.; Maulding, M.K.; Abbott, A.R.; Craig, B.A.; Eicher-Miller, H.A. SNAP-Ed (SupplementalNutrition Assistance Program–Education) increases long-term food security among Indiana householdswith children in a randomized controlled study. J. Nutr. 2016, 146, 2375–2382. [CrossRef]
16. Martin, K.S.; Colantonio, A.G.; Picho, K.; Boyle, K.E. Self-efficacy is associated with increased food securityin novel food pantry program. SSM Popul. Health 2016, 2, 62–67. [CrossRef]
17. Bandura, A. Health promotion by social cognitive means. Health Educ. Behav. 2004, 31, 143–164. [CrossRef][PubMed]
18. Nezami, B.T.; Lang, W.; Jakicic, J.M.; Davis, K.K.; Polzien, K.; Rickman, A.D.; Hatley, K.E.; Tate, D.F. The effectof self-efficacy on behavior and weight in a behavioral weight-loss intervention. Health Psychol. 2016, 35, 714.[CrossRef] [PubMed]
19. Breland, J.Y.; Wong, J.J.; McAndrew, L.M. Are Common Sense Model constructs and self-efficacysimultaneously correlated with self-management behaviors and health outcomes: A systematic review.Health Psychol. Open 2020, 7, 2055102919898846. [CrossRef] [PubMed]
20. Hoisington, A.; Shultz, J.A.; Butkus, S. Coping strategies and nutrition education needs among food pantryusers. J. Nutr. Educ. Behav. 2002, 34, 326–333. [CrossRef]
21. Kempson, K.; Keenan, D.P.; Sadani, P.S.; Adler, A. Maintaining food sufficiency: Coping strategies identifiedby limited-resource individuals versus nutrition educators. J. Nutr. Educ. Behav. 2003, 35, 179–188. [CrossRef]
22. Gundersen, C.G.; Garasky, S.B. Financial management skills are associated with food insecurity in a sampleof households with children in the United States. J. Nutr. 2012, 142, 1865–1870. [CrossRef]
23. Chang, Y.; Chatterjee, S.; Kim, J. Household finance and food insecurity. J. Fam. Econ. Issues. 2014, 35,499–515. [CrossRef]
24. Brewer, M. Household Debt and Children’s Risk of Food Insecurity. Soc. Probl. 2018, 67, 565–584. [CrossRef]25. Carman, K.G.; Zamarro, G. Does Financial Literacy Contribute to Food Security? Int. J. Food Agric. Econ.
2016, 4, 1–19.
123

Nutrients 2020, 12, 2304
26. Office of Head Start. Facts about the Child and Adult Care Food Program: Food and NutritionService. Available online: http://eclkc.ohs.acf.hhs.gov/hslc/tta-system/health/Health/Nutrition/Nutrition%20Program%20Staff/health_mul_00592_090605.html (accessed on 29 May 2020).
27. Benjamin-Neelon, S.E. Position of the Academy of Nutrition and Dietetics: Benchmarks for nutrition in childcare. J. Acad. Nutr. Diet. 2018, 118, 1291–1300. [CrossRef]
28. Fleary, S.; Heffer, R.W.; McKyer, E.L.; Taylor, A. A parent-focused pilot intervention to increase parent healthliteracy and healthy lifestyle choices for young children and families. ISRN Fam. Med. 2013, 2013. [CrossRef][PubMed]
29. Pooler, J.A.; Morgan, R.E.; Wong, K.; Wilkin, M.K.; Blitstein, J.L. Cooking matters for adults improves foodresource management skills and self-confidence among low-income participants. J. Nutr. Educ. Behav. 2017,49, 545–553.e1. [CrossRef] [PubMed]
30. U.S. Department of Agriculture (USDA). National Food Study: Final Interview. Available online: https://www.ers.usda.gov/media/8619/finalinterview.pdf (accessed on 4 February 2020).
31. Begley, A.; Paynter, E.; Butcher, L.M.; Dhaliwal, S.S. Examining the association between food literacy andfood insecurity. Nutrients 2019, 11, 445. [CrossRef] [PubMed]
32. Walpole, B.; Dettmer, E.; Morrongiello, B.A.; McCrindle, B.W.; Hamilton, J. Motivational interviewing toenhance self-efficacy and promote weight loss in overweight and obese adolescents: A randomized controlledtrial. J. Pediatr. Psychol. 2013, 38, 944–953. [CrossRef] [PubMed]
33. Lyles, C.R.; Wolf, M.S.; Schillinger, D.; Davis, T.C.; DeWalt, D.; Dahlke, A.R.; Curtis, L.; Seligman, H.K. Foodinsecurity in relation to changes in hemoglobin A1c, self-efficacy, and fruit/vegetable intake during a diabeteseducational intervention. Diabetes Care 2013, 36, 1448–1453. [CrossRef]
34. Wiig, K.; Smith, C. The art of grocery shopping on a food stamp budget: Factors influencing the food choicesof low-income women as they try to make ends meet. Public Health Nutr. 2009, 12, 1726–1734. [CrossRef]
35. Edin, K.; Boyd, M.; Mabli, J.; Ohls, J.; Worthington, J.; Greene, S.; Redel, N.; Sridharan, S. SNAP Food Securityin-Depth Interview Study: Final Report. Available online: https://www.fns.usda.gov/snap-food-security-depth-interview-study (accessed on 29 May 2020).
36. Gorman, K.S.; McCurdy, K.; Kisler, T.; Metallinos-Katsaras, E. Maternal strategies to access food differ byfood security status. J. Acad. Nutr. Diet. 2017, 117, 48–57. [CrossRef]
37. FRAC. Making WIC Work Better: Strategies to Reach More Women and Children and Strengthen Benefits Use.Available online: https://frac.org/wp-content/uploads/Making-WIC-Work-Better-Full-Report.pdf (accessedon 22 July 2020).
38. Grutzmacher, S.; Braun, B. Food security status and food resource management skills over time among rural,low-income mothers. J. Hunger Environ. Nutr. 2008, 2, 81–92. [CrossRef]
39. Early Childhood Learning & Knowledge Center. Family Engagement. Available online: https://eclkc.ohs.acf.hhs.gov/family-engagement (accessed on 17 June 2020).
40. Whiteside-Mansell, L.; Swindle, T.M. Evaluation of Together We Inspire Smart Eating: Pre-school fruit andvegetable consumption. Health Educ. Res. 2019, 34, 62–71. [CrossRef]
41. Gurajada, N.; Reed, D.B.; Taylor, A.L. Jump2Health Website™ for Head Start parents to promote a healthyhome environment: Results from formative research. J. Public Health Res. 2017, 6, 1054. [CrossRef]
42. Hindin, T.J.; Contento, I.R.; Gussow, J.D. A media literacy nutrition education curriculum for head startparents about the effects of television advertising on their children’s food requests. J. Am. Diet. Assoc. 2004,104, 192–198. [CrossRef] [PubMed]
43. Alaimo, K. Food insecurity in the United States: An overview. Top. Clin. Nutr. 2005, 20, 281–298. [CrossRef]44. Melchior, M.; Caspi, A.; Howard, L.M.; Ambler, A.P.; Bolton, H.; Mountain, N.; Moffitt, T.E. Mental health
context of food insecurity: A representative cohort of families with young children. Pediatrics 2009, 124,e564–e572. [CrossRef] [PubMed]
45. Bartfeld, J.; Collins, J.M. Food insecurity, financial shocks, and financial coping strategies among householdswith elementary school children in Wisconsin. J. Consum. Aff. 2017, 51, 519–548. [CrossRef]
46. McCloskey, M.; Johnson, S.L.; Benz, C.; Thompson, D.A.; Chamberlin, B.; Clark, L.; Bellows, L.L. Parentperceptions of mobile device use among preschool-aged children in rural head start centers. J. Nutr. Educ.Behav. 2018, 50, 83–89.e1. [CrossRef]
47. Holben, D.H.; McClincy, M.C.; Holcomb, J.P., Jr.; Dean, K.L.; Walker, C.E. Food security status of householdsin Appalachian Ohio with children in Head Start. J. Am. Diet. Assoc. 2004, 104, 238–241. [CrossRef]
124

Nutrients 2020, 12, 2304
48. Savage, J.S.; Fisher, J.O.; Birch, L.L. Parental influence on eating behavior: Conception to adolescence. J. LawMed. Ethics 2007, 35, 22–34. [CrossRef]
49. Birch, L.L.; Ventura, A.K. Preventing childhood obesity: What works? Int. J. Obes. 2009, 33, S74–S81.[CrossRef]
50. Wood, A.C.; Blissett, J.M.; Brunstrom, J.M.; Carnell, S.; Faith, M.S.; Fisher, J.O.; Hayman, L.L.; Khalsa, A.S.;Hughes, S.O.; Miller, A.L. Caregiver influences on eating behaviors in young children: A scientific statementfrom the American Heart Association. J. Am. Heart Assoc. 2019, 9, e014520. [CrossRef]
© 2020 by the authors. Licensee MDPI, Basel, Switzerland. This article is an open accessarticle distributed under the terms and conditions of the Creative Commons Attribution(CC BY) license (http://creativecommons.org/licenses/by/4.0/).
125


nutrients
Article
Supplemental Nutrition AssistanceProgram-Education Improves Food SecurityIndependent of Food Assistance andProgram Characteristics
Heather A. Eicher-Miller 1,*, Rebecca L. Rivera 1,2, Hanxi Sun 3, Yumin Zhang 3,
Melissa K. Maulding 4,5 and Angela R. Abbott 4
1 Department of Nutrition Science, Purdue University, West Lafayette, IN 47907, USA; [email protected] Richard M. Fairbanks School of Public Health and the Regenstrief Institute, Inc., Indiana University,
Indianapolis, IN 46202, USA3 Department of Statistics, Purdue University, West Lafayette, IN 47907, USA; [email protected] (H.S.);
[email protected] (Y.Z.)4 Health and Human Sciences Cooperative Extension, Purdue University, West Lafayette, IN 47907, USA;
[email protected] (M.K.M.); [email protected] (A.R.A.)5 College of Health and Human Services, Eastern Illinois University, Charleston, IL 61920, USA* Correspondence: [email protected]; Tel.: +1-765-494-6815; Fax: +1-765-494-0906
Received: 4 August 2020; Accepted: 27 August 2020; Published: 29 August 2020
Abstract: The purpose of this project was to determine whether consistent food assistance programparticipation or changes in participation over time mediated or moderated the effect of federalnutrition education through the Supplemental Nutrition Assistance Program-Education (SNAP-Ed)on food security and determine the associations of SNAP-Ed program delivery characteristics withchange in food security. This secondary analysis used data from a randomized controlled trialfrom September 2013 through April 2015. SNAP-Ed-eligible participants (n = 328; ≥18 years)in households with children were recruited from 39 counties in Indiana, USA. The dependentvariable was one year change in household food security score measured using the United StatesHousehold Food Security Survey Module. Assessment of mediation used Barron-Kenny analysis andmoderation used interactions of food assistance program use and changes over time with treatmentgroup in general linear regression modeling. Program delivery characteristics were investigatedusing mixed linear regression modeling. Results showed that neither consistent participation norchanges in food assistance program participation over time mediated nor moderated the effect ofSNAP-Ed on food security and neither were SNAP-Ed program delivery characteristics associatedwith change in food security over the one year study period. SNAP-Ed directly improved foodsecurity among SNAP-Ed-eligible Indiana households with children regardless of food assistanceprogram participation and changes over time or varying program delivery characteristics.
Keywords: supplemental nutrition assistance program-education; SNAP-Ed; nutrition education;food assistance; SNAP; food stamps; WIC; food security; food pantry; emergency food programs
1. Introduction
Members of low-income households face a high burden of food insecurity, poor nutrition,and undesirable health outcomes [1–5]. The Supplemental Nutrition Assistance Program-Education(SNAP-Ed) is a program of the United States Department of Agriculture (USDA) Food and NutritionService (FNS) that offers education on nutrition, budgeting, and resource management to low-incomehouseholds to improve dietary intake and food security [6,7]. SNAP-Ed has been shown to improve
Nutrients 2020, 12, 2636; doi:10.3390/nu12092636 www.mdpi.com/journal/nutrients127

Nutrients 2020, 12, 2636
household and adult food security in previous longitudinal randomized controlled trials [8,9].Approximately 73% of households interested in receiving SNAP-Ed also report participating inat least one of three other food assistance programs [9] directed to alleviate food insecurity in qualifyinglow-income households [10], including the Supplemental Nutrition Assistance Program (SNAP),the Special Supplemental Nutrition Program for Women, Infants, and Children (WIC), and TheEmergency Food Assistance Program (TEFAP). SNAP and WIC provide financial and food resourcesto help individuals and families obtain foods to supplement their nutritional needs [11,12] whileTEFAP provides foods to state agencies who partner with private and local organizations to distributeemergency foods to food banks and food pantries where individuals in need may access foods at nocost [13]. Mutual participation in SNAP-Ed and SNAP is not required; some SNAP-Ed participantsmay not qualify for SNAP benefits or choose not to participate in SNAP. Further, sometimes SNAP-Edlessons are used to fulfill WIC education requirements.
Previous evidence of improvement in food security because of SNAP [2], WIC [14], and associationswith emergency program use [15], taken with knowledge of the common practice of simultaneousparticipation in food assistance programs and nutrition education programs, suggests that the changesobserved in food security previously attributed to nutrition education [9] may actually be accountedfor by participation or change in participation of food assistance (mediation). It may also be likely thatthe effect of nutrition education on food security may be differential by food assistance participationor changes in food assistance (moderation). SNAP-Ed educators commonly help participants witheligibility and encourage their application for local, state, and federal food assistance as part of theresource management education offered, making salient the reality that participation status in foodassistance programs may frequently change during nutrition education participation [16]. Previousinvestigation of nutrition education program effectiveness on food insecurity has focused on singularprogram use and has not considered mediation or moderation by food assistance participation orchanges in their use, specifically regarding the three most common food assistance programs, SNAP,WIC, and TEFAP [17]. Only one previous non-experimental short-term study evaluated joint use of twoof these programs and showed that SNAP-Ed participants who were also receiving SNAP benefits andmade more improvement in resource management skills, reported the greatest decrease in running outof food (measured by only one question) compared with participants who were not receiving SNAPbenefits and who had less improvement in resource management skills [18]. Additional factors ofrelevance in SNAP-Ed effect on participant food security improvement are SNAP-Ed program deliverycharacteristics, such as the number of lessons, group or individual lessons, or SNAP-Ed educator.In Indiana, over sixty educators deliver up to ten SNAP-Ed lessons using group and individual lessondelivery. Program variability presented by these characteristics are inherent to SNAP-Ed and maypotentially be associated with an effect on food security. For example, food security improvement maybe influenced by participants receiving 10 rather than 4 lessons, individualized compared with grouplessons, or by interaction with a particular SNAP-Ed educator.
Therefore, determining the potential mediating or moderating role of food assistance participationand changes in participation over time on nutrition education program participation would clarifyknowledge of impacts to food security. Examination of the role of SNAP-Ed program characteristicsnumber of lessons, delivery format, and variability of educator to food security improvement wouldinform program and policy of important programmatic aspects of success. The objectives of this paperwere investigated among adults ≥18 years from Indiana in a dataset where a decrease of 1.2 ± 0.4 (mean± SE) units in household food security score over the one year study period, indicating a meaningfullongitudinal improvement in food security among the intervention compared to the control group,was previously discovered [9], and included:
1. Determine whether participation and changes in participation status in food assistance programsSNAP, WIC, and food pantries over one year mediated the effect of a SNAP-Ed intervention onone year change in household food security.
128

Nutrients 2020, 12, 2636
2. Determine whether participation and changes in participation status in food assistance programsSNAP, WIC, and food pantries over one year moderated the effect of a SNAP-Ed intervention onone year change in household food security.
3. Determine whether the number of SNAP-Ed lessons received as an intervention, SNAP-Ed lessondelivery format, or variability of SNAP-Ed educator was associated with one year change inhousehold food security (independent of food assistance program participation).
2. Materials and Methods
2.1. Study Population
For this secondary data analysis, all data were obtained from The Indiana SNAP-Ed Long-termStudy, a longitudinal (one year) parallel-arm randomized controlled nutrition education interventiontrial conducted between August 2013 and April 2015 [9]. Thirty-five county-level Indiana SNAP-Ednutrition education paraprofessionals (SNAP-Ed educators) recruited adult participants (n = 575) aged≥18 years from August 2013 to March 2014 and administered baseline assessments. Participants wererecruited from locations such as WIC clinics, food pantries, or Indiana Cooperative Extension countyoffices. The one year follow-up assessments were completed from September 2014 through April 2015.Data to address the hypotheses of this study are expected to maintain relevance to current program andparticipants as food insecurity in Indiana from 2013–2015 was not statistically significantly differentfrom 2016–2018 estimates [5], and the data represent a unique opportunity to comprehensively addresshypotheses using a singular sample. Only participants who completed the study (i.e., baseline andone year follow-up assessments) were included in the analysis presented here (total n = 328, controln = 163, intervention n = 165). SNAP-Ed educators were trained to determine participant studyeligibility and randomly assigned participants to either the non-active control group or interventiongroup using an allocation ratio of ~1:1. A random number allocated the first participant or grouprecruited simultaneously (to prevent knowledge of different treatment) to the intervention or controlgroup and then an alternating assignment was followed. After treatment group assignment, SNAP-Ededucators delivered lessons to the intervention group participants as per program protocol over thefollowing four to ten weeks, at approximately 1 lesson per week, and facilitated all survey assessmentsto both treatment groups. Eligible study participants included Indiana adult residents who had oneor more children living in the household, had not received a SNAP-Ed lesson in the past one year,were able to speak, read, and write in English, and were willing to wait one year to receive nutritioneducation lessons.
2.2. Intervention
The intervention consisted of the first four (out of ten) lessons in the Indiana SNAP-Edcurriculum [19] as these lessons comprise SNAP-Ed guidance and cover the USDA key behavioraloutcomes of maintaining caloric balance over time for a healthy weight and consumption ofnutrient-dense foods and beverages. Additionally, lessons included instruction on budgeting foodresources through the following lesson topics: applying USDA MyPlate to build healthy meals,using food labels to make healthy choices, identifying the importance of whole grains, and addingmore fruits and vegetables to meals [19,20]. The Purdue Institutional Review Board approved thetrial protocol and all participants provided written informed consent. The trial was registered atwww.clinicaltrials.gov as NCT03436589.
2.3. Food Security Measures
Household food security score was measured using the 18-item USDA U.S. Household FoodSecurity Survey Module (US HFSSM) with scores ranging from 0 (food secure) to 18 (very low foodsecure) and a 12-month reference period [21,22]. Categorical classification of food security at baselinewas also constructed as food secure, marginally food secure, and food insecure according to prior
129

Nutrients 2020, 12, 2636
guidance [22]. Change in food security score was the response variable in this secondary data analysisto determine a more specific change compared with using food security categories, and was quantifiedby subtracting the baseline score from the one year follow-up score for each participant.
2.4. Food Assistance Program Measures Used in Objectives 1 and 2
Study participants self-reported participation status in SNAP, WIC, and food pantries over the30 days prior to both baseline and one year follow-up assessments because the food assistance providedthrough these programs are generally distributed on a monthly basis. One month or 30 days wasconsidered the minimal amount of time that these programs may exert influence on a participanthousehold and on SNAP-Ed effectiveness. Missing values were 8% (n = 27) at baseline and 15%(n = 50) at follow-up. A sensitivity analysis was conducted where missing values were coded asparticipation and compared to coding values as non-participation. The results did not change so codingas non-participation was applied. Participation in local, state, or national food assistance programsother than SNAP, WIC, or food pantries was not recorded.
Three individual four-level categorical variables referred to as “change in one year participationstatus” were created for SNAP, WIC, and food pantries, respectively, to represent any changes or nochanges in food assistance participation status between the 30 days prior to baseline and the 30 daysprior to one year follow-up assessments. “Change in one year participation status” variables werecreated by concatenating the baseline and one year follow-up binary variables to simultaneouslyrepresent the participation status for each of the food assistance programs at baseline and at oneyear follow-up in addition to change in participation status if it occurred (00 = no participation;10 = participation at baseline only; 01 = participation at one year follow-up only; 11 = participationat both baseline and one year follow-up). These variables were used as a categorical independentvariable to address the first and second research objectives, whether change in food assistance programparticipation status or consistency mediated or moderated the impact of SNAP-Ed on one year changein food security score.
2.5. SNAP-Ed Program Characteristics Measures Used in Objective 3
The number of SNAP-Ed lessons a participant received, the lesson delivery format, and whichSNAP-Ed educator delivered the lessons were investigated as the SNAP-Ed program characteristicsamong intervention group participants who completed the required four lessons to address the thirdresearch objective. Participants assigned to the intervention group that did not complete the fourrequired intervention lessons, lost contact with SNAP-Ed educators, or did not follow the studyprotocol were considered withdrawn from the study (n = 87). The number of lessons (4–10 lessons) aparticipant received was recorded by the SNAP-Ed educator at each lesson and summed at the one yearfollow-up assessment. Lesson delivery format was a categorical variable with three levels representinghow the participant received lessons (one-to-one lessons, group lessons, combination of one-to-one andgroup lessons) and was based on the preference of the participant to attend group lessons, educatorfacilitation, and the schedule of group or individual lessons. Assignment of SNAP-Ed educator (n = 37)was determined by the participant’s county of residence at recruitment.
2.6. Other Covariates
A binary variable for treatment group (control, intervention) was used to address the first andsecond research objectives. Time was included as a binary variable in mixed regression modeling(baseline, follow-up) to address the third research objective. Self-reported baseline participantcharacteristics identified as potential confounders through Chi-square comparisons between theintervention and control groups were investigated: sex (female, male); age in years (18–30, 31–50,≥51); race/ethnicity (non-Hispanic white, other); highest level of education among the household(no high school diploma, high school diploma, or General Educational Development certificationindicating high school level skills; some college/associate’s degree; ≥bachelor’s degree); marital status
130

Nutrients 2020, 12, 2636
(living with partner/married, never married, divorced/separated/widowed); household employment(household member employed, no household member employed); household poverty status (<federalpoverty guideline, ≥federal poverty guideline); household size (two, three, four, or ≥five householdmembers); SNAP, WIC, or food pantry participation status 30 days prior to baseline (not participating,participating), and food security category at baseline (food secure, marginally food secure, foodinsecure). Two categories for race/ethnicity were used in this study because reports other thannon-Hispanic white were very few: 3 participants reported American Indian, 1 reported Asian,and 7 reported non-Hispanic black. Maintaining separate categories would threaten the robustness ofthe analysis and model fit so categories were combined to a single category.
2.7. Statistical Methods
To address the first research objective, the Baron-Kenny causal mediation approach was used toinvestigate whether the suspected mediator “change in one year participation status” in SNAP, WIC,or food pantries mediated the effect of the exposure, SNAP-Ed intervention, on the outcome, changein household food security score over the one year study period [23]. Additional covariates are notincluded in the Baron-Kenny three variable system regression approach (Figure 1, below); investigationof the role of other covariates are outside of the scope of the hypotheses of this paper.
Exposure=treatment group: SNAP-Ed or control
Outcome=change in food security score from baseline to 1-year follow-up
Suspected mediator="change in 1-year participation status” in SNAP, WIC, or food pantries: no participation, participation at baseline only, participation at 1-year follow-up only, participation at both baseline and 1-year
follow-upa b
c
Step 1. Determine c: Results described in text in Section 3.1, Step 1.Step 2. Determine a: Results described in text in Section 3.1, Step 2 and in Tables 1 and 2.Step 3. Determine b: Results described in text in Section 3.1, Step 3.Step 4. Determine c and b if there are significant relationships from Steps 1-3: Mediation is supported when the effect of the suspected mediator is significant after controlling for the exposure. Results described in text in Section 3.1, Step 4.
Figure 1. Hypothesized Baron-Kenny causal mediation model of the Supplemental Nutrition AssistanceProgram-Education (SNAP-Ed) intervention effect by the “change in one year participation status” inSupplemental Nutrition Assistance Program (SNAP), Women, Infants, and Children (WIC), or foodpantries on the change in one year food security score among Indiana SNAP-Ed Study participants.a = the relationship of the exposure on the suspected mediator using regression, b = the relationship ofthe suspected mediator on the outcome using regression, c = the relationship of the exposure on theoutcome using regression.
To address the second research objective, interactions between “change in one year participationstatus” (SNAP, WIC, and food pantries) and treatment group variables were used in general linearregression modeling to determine whether the change in food assistance program participation,consistent participation, or non-participation moderated the effect of SNAP-Ed on the change in foodsecurity score over the one year study period. SNAP, WIC, and food pantry interactions with treatmentgroup were investigated in separate models; the reference group was consistent non-participationduring the 30 days prior to baseline and one year follow-up. Other participant characteristics (sex,age, race/ethnicity, education, poverty status, employment status, marital status, household size) wereinitially included in the models as potential confounders but removed because they were not influential(p < 0.2). Statistical power to detect a difference at a significance level of α = 0.05 with power at 0.90,for a one unit improvement in food security based on previous study data [9,18,24] was confirmedusing a power analysis procedure for general linear regression models. A treatment effect of one uniton the food security scale was chosen for the power analysis because of the practical relevance and
131
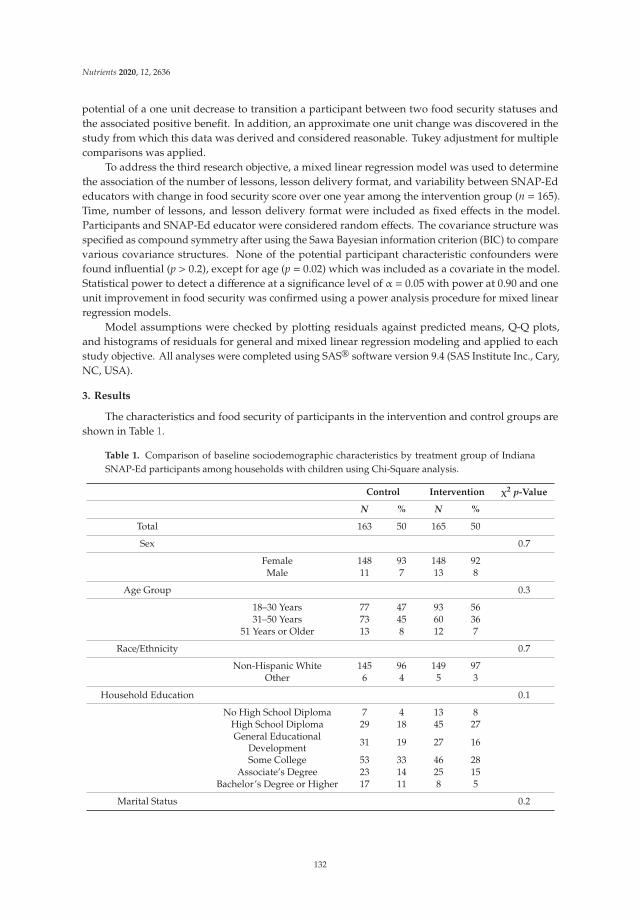
Nutrients 2020, 12, 2636
potential of a one unit decrease to transition a participant between two food security statuses andthe associated positive benefit. In addition, an approximate one unit change was discovered in thestudy from which this data was derived and considered reasonable. Tukey adjustment for multiplecomparisons was applied.
To address the third research objective, a mixed linear regression model was used to determinethe association of the number of lessons, lesson delivery format, and variability between SNAP-Ededucators with change in food security score over one year among the intervention group (n = 165).Time, number of lessons, and lesson delivery format were included as fixed effects in the model.Participants and SNAP-Ed educator were considered random effects. The covariance structure wasspecified as compound symmetry after using the Sawa Bayesian information criterion (BIC) to comparevarious covariance structures. None of the potential participant characteristic confounders werefound influential (p > 0.2), except for age (p = 0.02) which was included as a covariate in the model.Statistical power to detect a difference at a significance level of α = 0.05 with power at 0.90 and oneunit improvement in food security was confirmed using a power analysis procedure for mixed linearregression models.
Model assumptions were checked by plotting residuals against predicted means, Q-Q plots,and histograms of residuals for general and mixed linear regression modeling and applied to eachstudy objective. All analyses were completed using SAS® software version 9.4 (SAS Institute Inc., Cary,NC, USA).
3. Results
The characteristics and food security of participants in the intervention and control groups areshown in Table 1.
Table 1. Comparison of baseline sociodemographic characteristics by treatment group of IndianaSNAP-Ed participants among households with children using Chi-Square analysis.
Control Intervention χ2 p-Value
N % N %
Total 163 50 165 50
Sex 0.7
Female 148 93 148 92Male 11 7 13 8
Age Group 0.3
18–30 Years 77 47 93 5631–50 Years 73 45 60 36
51 Years or Older 13 8 12 7
Race/Ethnicity 0.7
Non-Hispanic White 145 96 149 97Other 6 4 5 3
Household Education 0.1
No High School Diploma 7 4 13 8High School Diploma 29 18 45 27General Educational
Development 31 19 27 16
Some College 53 33 46 28Associate’s Degree 23 14 25 15
Bachelor’s Degree or Higher 17 11 8 5
Marital Status 0.2
132

Nutrients 2020, 12, 2636
Table 1. Cont.
Control Intervention χ2 p-Value
N % N %
Never Married 28 17 40 24Married/with partner 94 58 94 57Separated/Divorced 41 25 31 19
Household Employment 0.01 *
Not Employed 82 50 60 36Employed 81 50 105 64
Household Poverty Status(Income to Poverty Ratio) 0.3
≥Federal Guideline 44 27 37 22<Federal Guideline 119 73 128 78
Household Size 0.5
2 12 7 6 43 38 23 38 234 42 26 47 28
5 or more 70 43 74 45
SNAP Participation(past 30 days) 0.1
No 76 47 62 38Yes 87 53 103 62
WIC Participation(past 30 days) <0.01 *
No 81 50 58 35Yes 82 50 107 65
Food Pantry Participation(past 30 days) <0.01 *
No 138 85 156 95Yes 25 15 9 5
Baseline HouseholdFood Security 0.9
Food Secure 44 27 41 25Marginal 64 39 65 39
Food Insecure 55 34 59 36
Values are counts, percentages, and p-values from Chi-square comparisons of the distributions amongsociodemographic characteristics between control and intervention group participants. Total numbers do not alwaysadd to sample size due to missing values and percentages do not always add to 100 due to rounding. * p ≤ 0.05.Abbreviations: SNAP-Ed, Supplemental Nutrition Assistance Program-Education; SNAP, Supplemental NutritionAssistance Program; WIC, Special Supplemental Nutrition Program for Women, Infants, and Children.
Participation in WIC, food pantries, and employment were the only characteristics withsignificantly different distributions among intervention and control groups at baseline.
3.1. Research Objective 1: Test for Food Assistance Program Mediation of SNAP-Ed Effect on Food Security
Step 1: Food security score did not differ between treatment groups at baseline using regression(β = −0.4, SE = 0.3, p = 0.4). The SNAP-Ed treatment group exposure had a significantly improvedfood security change from baseline to 12 months later (β = 1.2, SE = 0.4, p = 0.001).
Step 2: Participation status in WIC and food pantry use, but not for SNAP, 30 days prior tobaseline differed (p < 0.01) between the intervention and control groups in Chi-square analyses(Table 1). Additionally, “change in one year participation status” (30 days prior to baseline and one
133

Nutrients 2020, 12, 2636
year follow-up) in WIC and food pantry use differed (p = 0.03) between the intervention and controlgroups using Chi-square analysis (Table 2), but again, not for SNAP (p = 0.3). Logistic regressionshowed similar results of an association with treatment group and the potential for mediation for WIC(p = 0.04) and food pantry use (p = 0.05) but not SNAP (p = 0.3) (Table 2).
Step 3: Using general linear regression modeling, “change in one year participation status” inSNAP (p = 0.3), WIC (p = 0.4), or food pantry use (p = 0.5) were not associated with the long-termchange in food security score.
Step 4: Since significant relationships were present in steps 1 and 2, multiple linear regressionmodeling of the relationship of treatment group and “change in one year participation status” in SNAP,WIC, and food pantries on the outcome was completed. Results showed that neither SNAP (p = 0.2),WIC (p = 0.2), nor food pantries (p = 0.3) were significant after treatment group was included in themodel, yet treatment group remained significant (p ≤ 0.001).
In conclusion of research objective 1, no mediation was found between the SNAP-Ed interventionand “change in one year participation status” in SNAP, WIC, or food pantries on the change in foodsecurity score over the one year study period in the intervention compared to the control group usingthe Baron-Kenny causal mediation approach.
Table 2. Change in one year participation status comparison of SNAP, WIC, and food pantries bytreatment group among Indiana SNAP-Ed participants using Chi-Square and logistic regression.
Total Control Interventionχ2
p-ValueLogistic Regression
p-Value
n % N % n %
Total 328 100 163 50 165 50
Change in One YearParticipation Status
SNAP 0.3 0.3
No Participation 105 32 58 36 47 28Baseline Participation Only 39 12 21 13 18 11
Follow-up Participation Only 33 10 18 11 15 9Baseline and Follow-up
Participation 151 46 66 40 85 52
WIC 0.03 * 0.04 *
No Participation 122 37 73 45 49 30Baseline Participation Only 61 19 24 15 37 22
Follow-up Participation Only 17 5 8 5 9 6Baseline and Follow-up
Participation 128 39 58 35 70 42
Food Pantry 0.03 * 0.05 *
No Participation 278 85 130 80 148 90Baseline Participation Only 18 5 13 8 5 3
Follow-up Participation Only 16 5 8 5 8 5Baseline and Follow-up
Participation 16 5 12 7 4 2
Values are counts, percentages, and p-values from Chi-square and logistic regression comparisons of the distributionsamong “change in one year food assistance participation status” between control and intervention group participants.Total numbers do not always add to sample size due to missing values and percentages do not always add to100 due to rounding. Reference period for one year participation status covered the 30 days prior to baseline and30 days prior to one year follow-up. * p ≤ 0.05. Abbreviations: SNAP-Ed, Supplemental Nutrition AssistanceProgram-Education; SNAP, Supplemental Nutrition Assistance Program; WIC, Special Supplemental NutritionProgram for Women, Infants, and Children.
3.2. Research Objective 2: Test for Food Assistance Program Moderation of SNAP-Ed Effect on Food Security
The interactions of “change in one year participation status” in SNAP, WIC, or food pantries withthe treatment group did not moderate the mean difference (mean ± SEM) in food security scores in theintervention compared to the control over the one year study period using general linear regressionmodeling (SNAP −0.8 ± 0.4, p = 0.2; WIC −1.1 ± 0.5, p = 0.1; food pantries −1.2 ± 0.8, p = 0.7) (Table 3).
134

Nutrients 2020, 12, 2636
Table 3. Change in food security score over one year study period for the interaction of “change in oneyear participation status” and treatment group among Indiana SNAP-Ed participants using generallinear regression modeling.
Mean Change in Household Food Security Score
Control n = 163Intervention
n = 165Intervention-Control
Mean SE Mean SEMean
Difference ‡ SE p-Value §
SNAP SNAP × Treatment Group −0.9 0.3 −1.7 0.3 −0.8 0.4 0.2No Participation −0.8 0.4 −1.3 0.5 −0.5 0.6 1.0
Baseline Participation Only −2.1 0.7 −2.4 0.8 −0.3 1.0 1.0Follow-up Participation Only −0.8 0.8 −1.3 0.8 −0.5 1.1 1.0
Baseline and Follow-upParticipation 0 0.4 −2.0 0.3 −2.0 0.5 <0.01
WIC WIC × Treatment Group −0.9 0.4 −1.9 0.3 −1.1 0.5 0.1No Participation −0.6 0.4 −2.7 0.5 −2.1 0.6 <0.01
Baseline Participation Only −1.0 0.7 −0.8 0.5 0.2 0.8 1.0Follow-up Participation Only −1.5 1.1 −2.7 1.1 −1.2 1.6 1.0
Baseline and Follow-upParticipation −0.4 0.4 −1.5 0.4 −1.1 0.6 0.5
Food Pantry Food Pantry × Treatment Group −0.9 0.4 −2.1 0.6 −1.2 0.8 0.7No Participation −0.5 0.3 −1.8 0.3 −1.3 0.4 0.03
Baseline Participation Only −0.4 0.9 −3.2 1.5 −2.8 1.7 0.7Follow-up Participation Only −0.6 1.1 −0.9 1.1 −0.3 1.6 1.0
Baseline and Follow-upParticipation −2.3 0.9 −2.8 1.6 −0.5 1.9 1.0
Least squares means were calculated using general linear regression models with change in food security as theresponse variable. SNAP, WIC, and food pantries were investigated in separate models including interactionswith treatment group. ‡ A decrease in food security score from baseline to 1 year follow-up indicates improvedfood security. § Tukey adjustment for multiple comparisons in stratified analyses in each model. Interactions ofeach food assistance program with treatment were significant when interaction term p ≤ 0.05. Abbreviations: SE,Standard Error of the Least Squares Mean; SNAP-Ed, Supplemental Nutrition Assistance Program-Education; SNAP,Supplemental Nutrition Assistance Program; WIC Special Supplemental Nutrition Program for Women, Infants,and Children.
3.3. Research Objective 3: Test for SNAP-Ed Program Characteristics Relationship with SNAP-Ed onFood Security
The majority of intervention group participants (n = 165, 78%) received more than the minimumof four lessons with a mean of 6.8 lessons (Table 4). Approximately half of participants (n = 85,57%) received lessons in a one-to-one or individualized format, followed by group (n = 38, 26%),and combination the two types (n = 25, 17%). There was no statistical evidence of an associationbetween lesson delivery format (p = 0.3), the number of lessons received (p = 0.6), or variation betweenSNAP-Ed educators (p = 0.4) and the mean increase in food security score over time using a mixedmultiple linear regression model.
135

Nutrients 2020, 12, 2636
Table 4. Evaluation of lesson delivery format, SNAP-Ed educator, and number of lessons received byIndiana SNAP-Ed Study participants on change in food security score over one year study period usingmixed multiple linear regression modeling.
Control Group Intervention Group
Program Characteristic N % n % p-Value §
Total 163 50 165 50Lesson Delivery Format 0.3Individual - - 85 57Group - - 38 26Combination - - 25 17Number of Lessons 0.60 163 100 - -4 - - 37 225 - - 25 156 - - 25 157 - - 9 68 - - 12 79 - - 23 1410 - - 34 21SNAP-Ed Educator 0.4
Lesson delivery format was reported at baseline assessment. Number of lessons was reported at the one yearfollow-up assessment. The control group did not receive lessons. A minimum of 4 lessons was required to havecompleted the intervention. Only treatment group participants were included in the mixed multiple linear regressionmodeling. Cells do not always add to total sample size due to missing data. § p-values reported for lesson deliveryformat and number of lessons are from the type 3 test of fixed effects. The p-value reported for SNAP-Ed educatoris from the random effect covariance parameter estimate. Abbreviations: SNAP-Ed, Supplemental NutritionAssistance Program-Education.
4. Discussion
The major finding from this secondary data analysis indicated an improvement in householdfood security among the SNAP-Ed intervention group compared to the control group regardless ofparticipation and changes in participation in food assistance programs SNAP, WIC, or food pantries30 days prior to baseline and one year after the intervention. The mediation and moderation analysesaddressing research objectives one and two revealed that SNAP-Ed directly improved food securityrather than exerting or magnifying improvement through food assistance participation or changes inparticipation over one year.
One previous study found greater improvements in food security among SNAP-Ed participantswho also received SNAP [18] indicating that for certain populations and shorter time periods, SNAPmay assist SNAP-Ed to further improve food security. However, the present results using experimentaldata, determined no significant difference between the treatment groups for change in food securityacross the four types of one year SNAP participation status. Together, previous and current studyresults build evidence that SNAP-Ed is effective in directly improving food security over a one yearperiod [9].
In addition to improving food security, SNAP-Ed may have caused changes in participationstatus in food assistance programs throughout the study period for the following reasons. As part ofthe normal program delivery, SNAP-Ed educators may have encouraged and assisted interventiongroup participants who were not receiving food assistance at baseline to apply for financial benefitsthrough SNAP or WIC or to maximize nutrition resources available through food pantries or otherresources. On the other hand, improvements in food security directly from SNAP-Ed may haveled intervention group participants who reported receiving food assistance at baseline to attain andmaintain sufficient nutrition resources and withdraw participation in SNAP, WIC, or use of foodpantries by the one year follow-up. Alternatively, participation in other local, state, or federal foodassistance programs or resources that were not recorded in this study may have impacted food security.
136

Nutrients 2020, 12, 2636
For example, policy, systems, environment, and other nutrition and lifestyle related resources maybe influential in the success of SNAP-Ed and should continue to be investigated in the future [25].Investigation to the reasons for changes in food assistance participation were outside of the scopeof this research but present an opportunity for the future. Due to the observational nature of foodassistance designation in this study, the results do not provide causal evidence of SNAP-Ed influenceon changes in food assistance participation status. This limitation provides an important researchopportunity, yet ethical constraints may hinder randomization of food assistance resources and requirepragmatic study designs in future research [18].
In addition to finding no mediation or moderation of changes or consistency in food assistanceprogram participation on SNAP-Ed effectiveness on food security, nutrition education programcharacteristics such as the number of lessons, delivery format (group or individual lessons),and SNAP-Ed educator were not associated with the magnitude of SNAP-Ed effectiveness on foodsecurity. A study describing the effect of online compared to in-person SNAP-Ed lesson delivery [26],on nutrition knowledge, intentions to change behavior, and self-efficacy, is the only previouslypublished SNAP-Ed study to evaluate similar SNAP-Ed program characteristics. No previouslypublished studies have addressed the question of a dose-response effect of the number of SNAP-Edlessons on food security. In the study described herein, more than four lessons did not result ina significantly larger improvement in food security. The minimum lessons comprising SNAP-Edguidance, four in this case, were a sufficient intervention to improve food security, reinforcing thenotion that these limited lessons cover the most important behavioral recommendations for SNAP-Edset by the USDA FNS at least in regard to food security [21]. The results suggest that participation inthe minimally adherent intervention lessons is more critical to food security gains than the frequencyand amount of additional time spent in lessons. Other beneficial outcomes that were not quantifiedhere, such as sustainability of food security gains over a period longer than one year, increasednutrition knowledge, or dietary changes, may potentially be influenced by additional lessons; however,those outcomes have yet to be investigated.
The format of lesson delivery was also not significantly associated with change in food securityover the one year study period among the intervention group. A current Indiana SNAP-Ed priority setforth by the USDA FNS encourages a transition to mostly group lesson delivery format rather thanone-to-one format. This policy decision is supported by these study results in regard to food securityimprovements. Group lessons reach a greater number of participants at less cost and time, and, in thisstudy, were as effective as individual lessons. Yet, reach to participants with special needs was notevaluated here and the provision of individual lessons may remain relevant for this group.
The third program characteristic assessed in this study, variability in one year food securityscore due to different educators, was not statistically significant. Variable characteristics inherent tothe educator that may potentially influence outcomes include age, race, ethnicity, language, gender,education level, years of experience, depth of nutrition education knowledge, personality, knowledgeand connection with community resources, among many others. These characteristics may affect thedelivery and acceptance of the program to participants by potentially influencing SNAP-Ed educators’and participants’ abilities to connect and relate to each other. Investigating the educator as a randomeffect in the model did not allow for comparisons specifically based on the educator characteristicsmentioned or between specific educators yet, did allow insight to educator significance with regard toSNAP-Ed effectiveness. The study results suggest that the SNAP-Ed educators delivered a programeffective at improving participants’ household food security irrespective of educator.
A few studies have evaluated the impact of SNAP-Ed on food security; however, there is a paucityof SNAP-Ed literature specifically evaluating the impact of program delivery characteristics on foodsecurity outcomes [8,9,18]. A small body of literature has evaluated a second federally-supportednutrition education program, the Expanded Food and Nutrition Education Program (EFNEP) [27–30].Since the two programs are similar in terms of aligning program goals with the Dietary Guidelines forAmericans and target population, research results from EFNEP provide relevant background. Studies
137

Nutrients 2020, 12, 2636
evaluating EFNEP reported an increase in food security using a variety of food security measuresincluding one survey question [27] and the 6-item [28] and 18-item [30] US HFSSM. The number oflessons needed to increase food security greatly varied across the studies. In one study, programcompleters (mean number of lessons 8.5 ± 0.02) compared to drop-outs (mean number of lessons6.8 ± 0.11) showed a positive dose-response in food security with increasing number of lessons [27].Additionally, food security was higher in participants who received lessons in a one-to-one formatcompared to those who received lessons in a group format or a combination of group and individuallessons [27]. In other studies, participants improved food security after receiving seven EFNEPlessons [28] or with just two or more lessons compared to a comparison group receiving one or nolessons [30]. Lesson delivery format was not always defined in these studies. The results of the presentstudy strengthen the evidence that effectiveness of nutrition education to improve food security doesnot depend on the number of lessons exceeding the program completion criteria, nor format of lessons(group or one-to-one), despite the mixed results from the small body of EFNEP and SNAP-Ed literature.
Results from the present study provide a foundation for further research that improves uponsome limitations, but others are presented. Treatment groups were not originally designed to testparticipation in singular or concurrent food assistance programs or program characteristics as maineffects in the analysis. The implication of the simple randomization technique in conjunction with thelarge number of potential confounding characteristics presents a possibility for uneven distribution ofcharacteristics across treatment groups, which could result in overestimation their effects. Although nosignificant effect was detected in this study, designing future studies to further stratify the control andintervention groups by food assistance participation status may enhance evaluation of simultaneousfood assistance program participation and changes in participation and nutrition education on targetoutcomes. Potential for misclassification was present; however, non-response was low (baseline 8%(n = 27), follow-up 15% (n = 50)) and did not influence the results based on the sensitivity analysis,but the hesitation for some participants to answer these types of sensitive survey questions is importantto consider when calculating future study sample sizes and mitigation of bias. Specifically, responseson the HFSSM were made for the entire household by one adult in the household (as per guidance [22])and entail the reporting adult’s perceptions on the other household member’s food security. The 30-dayreference periods before baseline and one year follow-up may not have captured all changes in foodassistance. Collecting additional information on the consistency and timing of food assistance use infuture studies could elucidate the temporality of the relationship between food assistance programparticipation, SNAP-Ed, and food security improvement. Interpretation of the results should becarefully limited to the hypothesis focused on SNAP-Ed as the main independent variable and do notinform the role of SNAP as the main independent variable on food security status.
A major strength of this study was the use of longitudinal data derived from a randomizedcontrolled impact evaluation showing an improvement in one year food security due to SNAP-Ed [9].Participants included in these analyses represented the greater Indiana SNAP-Ed population except forless racial diversity (89% of Indiana SNAP-Ed participants compared to 95% of study participants werenon-Hispanic White; Chi-square p < 0.01). This difference in racial diversity is likely due to not havingSNAP-Ed educators from more racially diverse geographic areas volunteer to assist with the study.Participants who withdrew from the trial were less likely to be married or living with a partner, residedin smaller households, and reported lower incomes compared to study completers [9]. The resultsof this study may not be generalizable to SNAP-Ed participants who have similar characteristics asthe participants who withdrew from the trial and do not classify themselves as non-Hispanic white.Quantification of the change in food security score using the US HFSSM contributed a second majorstrength to the study. This tool is considered to be the gold standard that is used in national surveysand other research studies, permitting comparisons of results across other populations and enhancingexternal validity. Use of the score allows a more specific understanding of the change in food securityand relationships evaluated.
138

Nutrients 2020, 12, 2636
5. Conclusions
This study highlights nutrition education as a critical, independent component to improving foodsecurity in the US low-income population by showing SNAP-Ed directly and sustainably improvesfood security with or without the presence of food assistance. Neither group, individual or mixed typelessons nor SNAP-Ed educator were related to the effectiveness of SNAP-Ed on food security. Neitherwere provision of lessons additional to those fulfilling SNAP-Ed guidance related to the magnitude ofSNAP-Ed effectiveness. The current study results, along with previous documentation of food assistanceeffectiveness on food security, support a need for future investigation into the longitudinal effect ofparticipation in multiple food assistance programs, including SNAP-Ed, to maximize improvements infood security and other USDA FNS targeted health outcomes.
Author Contributions: Conceptualization, R.L.R. and H.A.E.-M.; methodology, R.L.R., H.A.E.-M., H.S., Y.Z.;formal analysis, R.L.R. and H.A.E.-M.; data curation, R.L.R., H.A.E.-M., M.K.M., A.R.A.; writing—original draftpreparation, R.L.R.; writing—review and editing, H.E.-M., R.L.R., H.S., Y.Z., M.K.M., A.R.A. All authors have readand agreed to the published version of the manuscript.
Funding: This research was funded by the Purdue University Frederick N. Andrews Fellowship, PurdueUniversity Nutrition Education Program, the USDA National Institute of Food and Agriculture Hatch Projectgrant (IND030489), a North Central Nutrition Education Center of Excellence grant (IND030473G), a U.S. NationalLibrary of Medicine training grant (T15LM012502), and the University of Kentucky Center for Poverty Research(UKCPR) through funding by the U.S. Department of Agriculture, Food and Nutrition Service (AG-3198-S-12-0044).The opinions and conclusions expressed herein are solely those of the author(s) and should not be construed asrepresenting the opinions or policies of the UKCPR or any agency of the Federal Government.
Acknowledgments: The authors would like to thank Bruce Craig from the Purdue Department of Statistics forproviding oversight for the analyses.
Conflicts of Interest: The authors declare no conflict of interest. The funders had no role in the design of thestudy; in the collection, analyses, or interpretation of data; in the writing of the manuscript, or in the decision topublish the results.
References
1. Hanson, K.L.; Connor, L.M. Food insecurity and dietary quality in US adults and children: A systematicreview. Am. J. Clin. Nutr. 2014, 100, 684–692. [CrossRef] [PubMed]
2. Gundersen, C.; Ziliak, J.P. Food insecurity and health outcomes. Health Aff. 2015, 34, 1830–1839. [CrossRef]3. Lee, J.S.; Gundersen, C.; Cook, J.; Laraia, B.; Johnson, M.A. Food insecurity and health across the lifespan.
Adv. Nutr. 2012, 3, 744–745. [CrossRef]4. Gundersen, C.; Kreider, B.; Pepper, J. The economics of food insecurity in the United States. Appl. Econ.
Perspect. Policy 2011, 33, 281–303. [CrossRef]5. Coleman-Jensen, A.; Rabbitt, M.P.; Gregory, C.A.; Singh, A. Household Food Security in the United States in
2018; ERR-237; U.S. Department of Agriculture, Economic Research Service: Washington, DC, USA, 2019.6. United States Department of Agriculture, National Institute of Food and Agriculture. Supplemental Nutrition
Education Program-Education (SNAP-Ed). Available online: https://nifa.usda.gov/program/supplemental-nutrition-education-program-education-snap-ed (accessed on 29 April 2020).
7. United States Department of Agriculture, Food and Nutrition Service. Supplemental Nutrition AssistanceProgram-Education (SNAP-Ed). Available online: https://www.fns.usda.gov/snap/SNAP-Ed (accessed on29 April 2020).
8. Eicher-Miller, H.A.; Mason, A.C.; Abbott, A.R.; McCabe, G.P.; Boushey, C.J. The effect of Food Stamp NutritionEducation on the food insecurity of low-income women participants. J. Nutr. Educ. Behav. 2009, 41, 161–168.[CrossRef]
9. Rivera, R.L.; Maulding, M.K.; Abbott, A.R.; Craig, B.A.; Eicher-Miller, H.A. SNAP-Ed (SupplementalNutrition Assistance Program-Education) increases long-term food security among Indiana households withchildren in a randomized controlled study. J. Nutr. 2016, 146, 2375–2382. [CrossRef]
10. United States Department of Agriculture, Food and Nutrition Service. Available online: https://www.fns.usda.gov/ (accessed on 29 April 2020).
139

Nutrients 2020, 12, 2636
11. United States Department of Agriculture, Food and Nutrition Service. Supplemental Nutrition AssistanceProgram (SNAP). Available online: https://www.fns.usda.gov/snap/supplemental-nutrition-assistance-program (accessed on 29 April 2020).
12. United States Department of Agriculture, Food and Nutrition Service. Special Supplemental NutritionProgram for Women, Infants, and Children (WIC). Available online: https://www.fns.usda.gov/wic (accessedon 29 April 2020).
13. United States Department of Agriculture, Food and Nutrition Service. The Emergency Food AssistanceProgram (TEFAP). Available online: https://www.fns.usda.gov/tefap/emergency-food-assistance-program-tefap. (accessed on 29 April 2020).
14. Kreider, B.; Pepper, J.V.; Roy, M. Identifying the effects of WIC on food insecurity among infants and children.South. Econ. J. 2016, 82, 1106–1122. [CrossRef]
15. Wright, B.N.; Bailey, R.L.; Craig, B.A.; Mattes, R.D.; McCormack, L.; Stluka, S.; Franzen-Castle, L.; Henne, B.;Mehrle, D.; Remley, D.; et al. Daily dietary intake patterns improve after visiting a food pantry amongfood-insecure rural Midwestern adults. Nutrients 2018, 10, 583. [CrossRef]
16. United States Department of Agriculture, Food and Nutrition Service, Office of Research and Analysis.Building a healthy America: A Profile of the Supplemental Nutrition Assistance Program. Washington, DC.2012. Available online: http://www.fns.usda.gov/sites/default/files/BuildingHealthyAmerica.pdf (accessedon 29 April 2020).
17. United States Department of Agriculture, Food and Nutrition Service. Assessing the Food Security and DietQuality Impacts of FNS Program Participation: Final Report; Report No. 53-3198-2-0262007; United StatesDepartment of Agriculture, Food and Nutrition Service: Washington, DC, USA, 2007. Available online: https://www.fns.usda.gov/assessing-food-security-and-diet-quality-impacts-fns-program-participation (accessedon 29 April 2020).
18. Kaiser, L.; Chaidez, V.; Algert, S.; Horowitz, H.; Martin, A.; Mendoza, C.; Neelon, M.; Ginsburg, D.C. Foodresource management education with SNAP participation improves food security. J. Nutr. Educ. Behav. 2015,47, 374–378. [CrossRef]
19. Maulding, M.K. Family Nutrition Program. In Small Steps to Health Curriculum; Purdue University Healthand Human Sciences Cooperative Extension. Purdue Agricultural Communication Media DistributionCenter: West Lafayette, IN, USA, 2013.
20. United States Department of Agriculture, Food and Nutrition Service. Supplemental Nutrition AssistanceProgram Education Plan Guidance FY 2018: Nutrition Education and Obesity Prevention Program. PublishedMarch 2018. Available online: https://snaped.fns.usda.gov/snap/Guidance/FY2018SNAP-EdPlanGuidance.pdf (accessed on 29 April 2020).
21. United States Department of Agriculture, Economic Research Service. Measurement. Published2017. Available online: https://www.ers.usda.gov/topics/food-nutrition-assistance/food-security-in-the-us/measurement/ (accessed on 29 April 2020).
22. Bickel, G.; Nord, M.; Price, C.; Hamilton, W.; Cook, J. Guide to Measuring Household Food Security; UnitedStates Department of Agriculture, Food and Nutrition Service: Alexandria, VA, USA, 2000. Available online:https://fns-prod.azureedge.net/sites/default/files/FSGuide.pdf (accessed on 29 April 2020).
23. Baron, R.M.; Kenny, D.A. The moderator–mediator variable distinction in social psychological research:Conceptual, strategic, and statistical considerations. J. Personal. Soc. Psychol. 1986, 51, 1173–1182. [CrossRef]
24. Leung, C.W.; Cluggish, S.; Villamor, E.; Catalano, P.J.; Willett, W.C.; Rimm, E.B. Few changes in food securityand dietary intake from short-term participation in the Supplemental Nutrition Assistance Program amonglow-income Massachusetts adults. J. Nutr. Educ. Behav. 2014, 46, 68–74. [CrossRef]
25. Rivera, R.; Dune, J.; Maulding, M.K.; Wang, Q.; Savaiano, D.A.; Nickols-Richardson, S.M.; Eicher-Miller, H.A.Exploring the association of urban or rural county status and environmental, nutrition and lifestyle-relatedresources with the efficacy of SNAP-Ed (Supplemental Nutrition Assistance Program-Education) to improvefood security. Public Health Nutr. 2018, 21, 957–966. [CrossRef] [PubMed]
26. Neuenschwander, L.M.; Abbott, A.; Mobley, A.R. Comparison of a web-based vs in-person nutritioneducation program for low-income adults. J. Acad. Nutr. Diet. 2013, 113, 120–126. [CrossRef] [PubMed]
27. Dollahite, J.; Olson, C.; Scott-Pierce, M. The impact of nutrition education on food insecurity amonglow-income participants in EFNEP. Fam. Consum. Sci. 2003, 32, 127–139. [CrossRef]
140

Nutrients 2020, 12, 2636
28. Farrell, J.A.; Cordeiro, L.S.; Qian, J.; Sullivan-Werner, L.; Nelson-Peterman, J.L. Food affordability, foodsecurity, and the Expanded Food and Nutrition Education Program. J. Hunger Environ. Nutr. 2017, 13, 1–12.[CrossRef]
29. Crouch, E.L.; Dickes, L.A. Evaluating a nutrition education program in an era of food insecurity. J. HungerEnviron. Nutr. 2017, 12, 101–111. [CrossRef]
30. Greer, B.; Poling, R. Impact of Participating in the Expanded Food and Nutrition Education Program on FoodInsecurity; Mississippi State University: Starkville, MS, USA, 2001; Available online: http://srdc.msstate.edu/ridge/projects/recipients/00_greer_final.pdf (accessed on 29 April 2020).
© 2020 by the authors. Licensee MDPI, Basel, Switzerland. This article is an open accessarticle distributed under the terms and conditions of the Creative Commons Attribution(CC BY) license (http://creativecommons.org/licenses/by/4.0/).
141


nutrients
Review
Fruit and Vegetable Incentive Programs forSupplemental Nutrition Assistance Program (SNAP)Participants: A Scoping Review of Program Structure
Katherine Engel and Elizabeth H. Ruder *
Rochester Institute of Technology; Rochester, NY 14620, USA; [email protected]* Correspondence: [email protected]; Tel.: +1-585-475-2402
Received: 29 April 2020; Accepted: 1 June 2020; Published: 4 June 2020
Abstract: The low intake of fruits/vegetables (FV) by Supplemental Nutrition Assistance Program(SNAP) participants is a persistent public health challenge. Fruit and vegetable incentive programs useinducements to encourage FV purchases. The purpose of this scoping review is to identify structuralfactors in FV incentive programs that may impact program effectiveness, including (i.) differences inrecruitment/eligibility, (ii.) incentive delivery and timing, (iii.) incentive value, (iv.) eligible foods, and (v.)retail venue. Additionally, the FV incentive program impact on FV purchase and/or consumption issummarized. Using the Preferred Reporting Items for Systematic Reviews and Meta-Analyses (PRISMA)guidelines for scoping reviews, a search of four bibliographic databases resulted in the identification of45 publications for consideration; 19 of which met the pre-determined inclusion criteria for full-lengthpublications employing a quasi-experimental design and focused on verified, current SNAP participants.The data capturing study objective, study design, sample size, incentive program structure characteristics(participant eligibility and recruitment, delivery and timing of incentive, foods eligible for incentiveredemption, type of retail venue), and study outcomes related to FV purchases/consumption were enteredin a standardized chart. Eleven of the 19 studies had enrollment processes to receive the incentive,and most studies (17/19) provided the incentive in the form of a token, coupon, or voucher. The value ofthe incentives varied, but was usually offered as a match. Incentives were typically redeemable onlyfor FV, although three studies required an FV purchase to trigger the delivery of an incentive for anySNAP-eligible food. Finally, most studies (16/19) were conducted at farmers’ markets. Eighteen ofthe 19 studies reported a positive impact on participant purchase and/or consumption of FV. Overall,this scoping review provides insights intended to inform the design, implementation, and evaluation offuture FV incentive programs targeting SNAP participants; and demonstrates the potential effectivenessof FV incentive programs for increasing FV purchase and consumption among vulnerable populations.
Keywords: incentive programs; Supplemental Nutrition Assistance Program (SNAP); fruits and vegetables;low-income; farmers’ markets; dietary quality; produce intake; produce purchasing
1. Introduction
Eating sufficient amounts of fruits/vegetables (FV) is vital for a healthy dietary pattern associated witha lower risk of cardiovascular disease and certain cancers [1]. However, Americans do not consume enoughFV; only 12.2% and 9.3% of US adults meet the 2015–2020 Dietary Guidelines for Americans’ recommendationsfor daily fruit and vegetable consumption, respectively [2]. Among Americans, lower income groupsconsume less FV than higher income groups, and this is a key socioeconomic disparity in overall dietary
Nutrients 2020, 12, 1676; doi:10.3390/nu12061676 www.mdpi.com/journal/nutrients
143

Nutrients 2020, 12, 1676
quality [2–4]. Thus, it is important that low-income participants in federal food assistance programs in theUnited States, such as the Supplemental Nutrition Assistance Program (SNAP), have access to these foods.
SNAP is the largest federal food assistance program in the United States. It functions by providingparticipants with food purchasing resources in the form of an electronic benefit transfer (EBT, an electronicsystem that allows a recipient to authorize transfer of their government benefits from a federal account to aretailer) on a monthly cycle. Although SNAP eligibility requirements vary from state to state, householdsthat are SNAP eligible have gross incomes of less than 130% of the federal poverty line [5]. Unlike otherU.S. food assistance programs, like the Supplemental Nutrition Assistance Program for Women, Infants,and Children (WIC), SNAP benefits can be used for most food products with few exceptions (such ashot foods and foods that are intended to be eaten in stores) [6,7]. In contrast to SNAP, WIC benefitsare limited to foods such as milk, cheese, yogurt, FV, canned fish, tofu, breakfast and infant cereal,whole wheat breads and grains, eggs, peanut butter, infant formula, and jarred baby foods [8]. Thus,although SNAP plays an integral role in ensuring that millions of people have the resources they need toaccess sufficient amounts of food, it lacks specific restrictions that dictate the nutritional quality of foodsthat participants can purchase. Importantly, it has been shown that individuals who receive SNAP benefitshave poor diets relative to the overall population and other income-eligible non-participants [3]. In somecases, SNAP participation has been associated with negative health outcomes and inversely correlatedto self-assessed health status [9]. Given the evidence that WIC participation is associated with healthbenefits [10], one proposed alteration to the SNAP program is creating restrictions around which foodscan be purchased with benefits. However, key constituencies, ranging from members of U.S. Congress tohunger relief organizations, have rejected these proposals for reasons including concerns about limitingparticipants’ ability to exercise autonomy in food choice and administrative burdens [11]. Moreover,restrictions on the types of food eligible for SNAP could contribute to worsening food security in areaswhere a variety of healthful foods is not sold by food retailers. Another alteration to the SNAP programthat has been suggested is FV incentives, which provide participants with considerable autonomy indeciding what foods to purchase [12].
FV incentives include a variety of inducements to offer low-income participants funds to purchasethese foods. They are potentially appropriate for improving dietary quality, because they are a toolfor facilitating behavior change. The theory that incentives serve as a strategy for inducing changesin behavior centers on the standard direct price effect [13]. The standard direct price effect makes theincetivzed behavior more attractive by providing a financial reward. As a result, incentives have thecapacity to instill new, positive habits, as well as end pre-existing, negative habits. Thus, when appliedon a large enough scale, incentives may have the ability to shift cultural norms [13]. Incentives may beparticularly useful for promoting healthy behaviors, such as consuming more FV, because the benefitsof healthy behaviors are often uncertain and delayed, while the cost of these behaviors is immediate.Consumers tend to value current costs and benefits more than future costs and benefits, which in turncan lead to choosing not to engage in healthy behaviors, since the present value of these behaviors islow. Incentives create an immediate benefit because they lower the cost of healthy foods for consumers.By creating short-term rewards for healthy behaviors, incentives serve to make these behaviors moreappealing by increasing their present value [14]. In general, the cost of food plays a critical role in howpeople make food choices [15,16]. Glanz and colleagues [17] found that behind taste, price is the secondmost important influence on food choice. For SNAP participants specifically, it has been demonstrated thatthe cost of healthy foods is a barrier for improving dietary quality [18,19]. Incentives expand the financialresources participants have available to purchase healthy foods, and thus address the barrier that the costof these food poses to dietary quality [18–20].
FV incentive programs have been designed and implemented for a number of different populations,including WIC and SNAP participants, and venues, such as farmers’ markets and grocery stores. In addition,
144

Nutrients 2020, 12, 1676
the types and value of incentives that have been developed vary widely from point-of-sale (POS) discountsto coupons, vouchers, and tokens. A preliminary search for existing scoping reviews on this topic wasconducted by searching the Cochrane Database of Systematic Reviews, Google Scholar, ProQuest, PubMed,and Sage Journals Online. No scoping reviews on this topic were identified. Given the emerging evidencerelated to FV incentive programs among SNAP participants and the diversity of structural factors withinthese programs, a scoping review was selected as the appropriate method. The objective of this scopingreview is to characterize the factors in program structure which may impact the effectiveness of incentiveprograms. The scoping review research question is, “What are the differences in structural factors, includingrecruitment and eligibility criteria, delivery and timing of incentives, financial value of incentives, foodseligible for incentive redemption, and type of retail venue reported among FV incentive programs?” Finally,this review summarizes the outcomes of existing FV incentive programs with respect to the purchase and/orconsumption of FV among SNAP participants, with specific attention to the quality of the assessmentmethods for FV purchase and/or consumption. This work provides insight intended to inform the design,implementation, and evaluation of future FV incentive programs targeting SNAP participants.
2. Materials and Methods
A scoping review was undertaken to systematically synthesize factors in program structure whichmay impact the effectiveness of FV incentive programs. This review was conducted as per the Arkseyand O’Malley framework for scoping reviews [21] and integrated with the guidance from the JoannaBriggs Institute (JBI) [22] and the Preferred Reporting Items for Systematic Reviews and Meta-Analyses(PRISMA) guidelines for scoping reviews [23]. A protocol document is publically available online at:https://figshare.com/articles/Protocol_Document_pdf/12380669, and a completed PRISMA ScR checklist isincluded as Supplementary Table S1.
2.1. Search Strategy
Focused searches were conducted by one author (K.E.) using Google Scholar, ProQuest, PubMed,and Sage Journals Online. The search terms that were used include “SNAP incentives,” “WIC incentive,”“food benefits incentive,” and “food assistance incentive.” Results were limited to English languagepublications and indexed up to 7 November 2019. In addition to the use of these search terms, papers wereidentified by examining the articles cited by the papers found in the preliminary search.
2.2. Study Selection
Full-text articles identified in the search were imported into Mendeley reference management softwareand duplicates were manually removed. In total, 45 unique publications were identified and bothauthors independently reviewed the full-text documents for pre-determined inclusion/exclusion criteria.The inclusion criteria included: full-length publication in a peer-reviewed journal or government report,quasi-experimental design, and targeted focus on verified, current SNAP participants studies that solelyexamined the use of FV vouchers as part of the WIC foods package were excluded for the following reasons:(1.) FV vouchers became a standard part of the WIC Food Package following a final rule published inMay 2014 [24] and (2.) WIC FV vouchers can only be used for FV and therefore are not used to incentivizethe purchase of FV over other foods within the WIC Food Package. The authors conferenced regularly toensure agreement and talked through any inconsistencies. Due to the relative lack of research on this topic,papers were not excluded based on their publication date.
145

Nutrients 2020, 12, 1676
2.3. Data Charting
Data were extracted from eligible papers into a standardized Google Doc chart developed byboth authors. The two authors independently charted the data, discussed the results and continuouslyupdated the data collection chart. The data ultimately collected included: study authors, year ofpublication, study objective, population and sample size, methodology, incentive program structurecharacteristics (participant eligibility and recruitment, delivery and timing of incentive, foods eligiblefor incentive redemption, type of retail venue), and study outcomes related to FV purchases and FVconsumption. In addition, study methods for the assessment of FV purchase and/or consumptionwere charted. The charted data were summarized as counts where applicable.
3. Results and Discussion
Of the 45 publications initially reviewed, n = 6 were excluded for not falling within the scope ofthe review, n = 8 were excluded for not employing a quasi-experimental design, n = 6 were excludedbecause participation was not focused on current, verified SNAP participants, and n = 2 were excludedfor being solely related to WIC FV vouchers prior to the implementation of the 2014 WIC Food Package.In addition, two poster presentations were excluded and two publications were excluded because theypresented preliminary data that was included in a subsequent publication. In total, 19 publications wereincluded in the final review (Table 1).
3.1. Incentive Program Structure
A variety of types of incentive programs have explored approaches for increasing the purchase andconsumption of FV by SNAP participants. The following section details ways in which eligible individualsbecome participants in incentive programs, the delivery and timing of incentives, and differences in thefinancial value of incentives to participants.
146

Nutrients 2020, 12, 1676
Tab
le1.
Sum
mar
yof
stu
die
son
fru
itan
dve
geta
ble
ince
ntiv
esas
anap
pro
ach
for
enco
ura
ging
and
enab
ling
Sup
ple
men
talN
utr
itio
nA
ssis
tanc
ePr
ogra
m(S
NA
P)pa
rtic
ipan
tsin
the
Uni
ted
Stat
esto
incr
ease
the
purc
hase
and/
orco
nsum
ptio
nof
heal
thy
food
s.
Au
tho
rS
tud
yO
bje
ctiv
eIn
cen
tiv
eB
en
efi
tF
oo
dE
lig
ible
for
Ince
nti
ve
Red
em
pti
on
Ven
ue
Ty
pe
Pro
gra
mS
cale
Sam
ple
Siz
eR
ele
van
tF
ind
ing
s
Ala
ofè
etal
.201
7[2
5]
Exam
ine
the
impa
ctof
the
Dou
ble
Up
SNA
P(D
USP
)far
mer
s’m
arke
tin
cent
ive
prog
ram
onaw
aren
ess
and
acce
ssto
farm
er’s
mar
kets
,and
FVpu
rcha
sean
dco
nsum
ptio
nin
Pim
aC
ount
y,A
Z.
Toke
n/Vo
uche
r/C
oupo
nU
nspe
cifie
dFV
Farm
ers’
Mar
ket
One
farm
ers’
mar
ket
353
part
icip
ants
DU
SPcu
stom
ers
repo
rted
grea
ter
cons
umpt
ion
ofFV
com
pare
dto
non-
DU
SPsh
oppe
rs.
Am
aro
and
Rob
erts
2017
[26]
Exam
ine
char
acte
rist
ics
(e.g
.,de
mog
raph
ics,
hous
ehol
dfo
odse
curi
ty)a
ndne
eds
offa
mili
esus
ing
SNA
Pin
cent
ive
prog
ram
and
eval
uate
ince
ntiv
epr
ogra
mus
age
inte
rms
ofsh
oppi
ngha
bits
,foo
dco
nsum
ptio
npa
tter
ns,a
ndho
useh
old
food
secu
rity
.
Toke
n/C
oupo
n/Vo
uche
rU
nspe
cifie
dFV
Farm
ers’
Mar
ket
One
farm
ers’
mar
ket
143
pare
nts
Part
icip
ants
repo
rted
apo
siti
veim
pact
ofin
cent
ive
prog
ram
use
and
appe
ared
tova
lue
fres
hfr
uits
and
vege
tabl
es.T
hem
ajor
ity
ofpa
rtic
ipan
tsre
port
edth
atth
ein
cent
ive
enab
led
them
toaff
ord
tosh
opat
the
farm
ers’
mar
kets
usin
gth
eir
SNA
Pfu
nds.
Bart
lett
etal
.201
4[7
]
Ass
ess
the
caus
alim
pact
ofin
cent
ive
onFV
cons
umpt
ion,
and
othe
rke
ym
easu
res
ofdi
etar
yin
take
,by
SNA
Ppa
rtic
ipan
ts.
POS
Any
SNA
Pel
igib
leit
emFa
rmer
s’M
arke
tan
dG
roce
rySt
ores
130
reta
ilers
ina
sing
lem
etro
polit
anar
ea75
00ho
useh
olds
Part
icip
ants
repo
rted
high
erco
nsum
ptio
nof
dark
gree
nve
geta
bles
,red/o
rang
eve
geta
bles
,an
dot
her
vege
tabl
es,a
sw
ella
sfr
uits
othe
rth
anci
trus
,mel
ons,
and
berr
ies
than
non-
Hea
lthy
Ince
ntiv
esPr
ogra
m(H
IP)p
arti
cipa
nts.
Part
icip
ants
incr
ease
dth
eir
cons
umpt
ion
ofve
geta
bles
mor
eth
anth
eir
cons
umpt
ion
offr
uit.
Incr
ease
dfr
uita
ndve
geta
ble
cons
umpt
ion
drov
ean
incr
ease
dsc
ore
onth
e20
10H
ealt
hyEa
ting
Inde
x.
Bow
ling
etal
.201
6[2
7]
Exam
ine
effec
tsof
prog
ram
part
icip
atio
non
part
icip
ants
’FV
and
soda
cons
umpt
ion;
inve
stig
ate
the
prog
ram
’seff
ecto
nW
IC/S
NA
Pbu
dget
FVex
pend
itur
epa
tter
nsan
dus
eof
food
assi
stan
ceat
part
icip
atin
gfa
rmer
s’m
arke
ts,a
ndex
plor
eth
ere
lati
veim
port
ance
offin
anci
al(a
cces
s)in
cent
ives
and
expo
sure
inte
rven
tions
asdr
iver
sof
part
icip
ant
enro
llmen
tand
rete
ntio
n,as
wel
las
part
icip
ants
’per
cept
ions
ofba
rrie
rs,
supp
ort,
and
bene
fits
from
part
icip
atio
n.
POS
and
Toke
n/C
oupo
n/Vo
uche
rFr
esh
FVFa
rmer
s’M
arke
tSi
xfa
rmer
s’m
arke
tsin
asi
ngle
met
ropo
litan
area
146
hous
ehol
ds
Part
icip
ants
repo
rted
sign
ifica
ntly
high
erve
geta
ble
cons
umpt
ion
and
low
erso
daco
nsum
ptio
npo
stim
plem
enta
tion
ofth
ein
cent
ive
prog
ram
.
147

Nutrients 2020, 12, 1676
Tab
le1.
Con
t.
Au
tho
rS
tud
yO
bje
ctiv
eIn
cen
tiv
eB
en
efi
tF
oo
dE
lig
ible
for
Ince
nti
ve
Red
em
pti
on
Ven
ue
Ty
pe
Pro
gra
mS
cale
Sam
ple
Siz
eR
ele
van
tF
ind
ing
s
Dim
itri
etal
.201
3[2
8]
Exam
ine
the
asso
ciat
ion
betw
een
mon
etar
yin
cent
ives
give
nfo
rth
epu
rcha
seof
fres
hFV
and
fres
hpr
oduc
eco
nsum
ptio
nam
ong
fede
ral
food
assi
stan
cepa
rtic
ipan
ts,
incl
udin
gSN
AP.
Toke
n/Vo
uche
r/C
oupo
nFr
esh
FVFa
rmer
s’M
arke
t73
farm
ers’
mar
kets
1227
part
icip
ants
Part
icip
ants
perc
eive
din
crea
sed
cons
umpt
ion
offr
esh
FVbe
caus
eth
eysh
oppe
dat
the
mar
ketw
hen
offer
edfin
anci
alin
cent
ives
.Pa
rtic
ipan
tsliv
ing
inar
eas
wit
hlo
wFV
acce
ss,a
ndw
how
ere
also
inco
me
cons
trai
ned,
wer
eth
em
ostl
ikel
yto
perc
eive
high
erFV
cons
umpt
ion.
Dim
itri
etal
.201
5[2
9]
Ass
ess
the
effec
tive
ness
ofin
cent
ives
onth
ein
take
offr
esh
vege
tabl
esam
ong
fede
ralf
ood
assi
stan
cepr
ogra
mpa
rtic
ipan
ts.
Toke
n/Vo
uche
r/C
oupo
nFr
esh
FVFa
rmer
s’M
arke
tFi
vefa
rmer
s’m
arke
tsin
thre
em
etro
polit
anar
eas
138
hous
ehol
ds
Ince
ntiv
esin
crea
sed
FVco
nsum
ptio
nov
eral
l.G
roup
sre
spon
ded
toin
cent
ives
diff
eren
tly
base
don
leve
lof
food
inse
curi
tyan
ded
ucat
ion.
Dur
war
det
al.
2019
[30]
Eval
uate
the
effec
tofU
tah
Dou
ble
Up
Food
Buck
s(D
UFB
)pro
gram
onFV
inta
kean
dfo
odse
curi
tyst
atus
amon
gSN
AP
part
icip
ants
.
Toke
n/Vo
uche
r/C
oupo
nFr
esh
FVFa
rmer
s’M
arke
t
17fa
rmer
s’m
arke
tsin
Uta
h;ev
alua
tion
data
colle
cted
from
asa
mpl
eof
eigh
tm
arke
ts
138
part
icip
ants
Incr
ease
inm
edia
nFV
cons
umpt
ion
and
perc
enta
geof
part
icip
ants
inth
ein
cent
ive
prog
ram
who
wer
efo
odse
cure
incr
ease
d.
Free
dman
etal
.201
4[3
1]
Exam
ine
the
influ
ence
ofFV
ince
ntiv
eon
inte
rven
tion
prog
ram
onfa
rmer
s’m
arke
trev
enue
.The
inte
rven
tion
incl
uded
afe
dera
lm
onet
ary
ince
ntiv
eto
incr
ease
frui
tan
dve
geta
ble
purc
hase
sat
farm
ers’
mar
kets
for
food
assi
stan
cere
cipi
ents
.
POS
Uns
peci
fied
FVFa
rmer
s’M
arke
tO
nefa
rmer
s’m
arke
t33
6pa
rtic
ipan
tsIn
cent
ives
incr
ease
dfa
rmer
s’m
arke
tre
venu
ean
dim
prov
edac
cess
toFV
.
Lind
say
etal
.201
3[3
2]
Exam
ine
patt
erns
ofen
rollm
enta
ndm
arke
tvis
its,
part
icip
ants
’se
lf-r
epor
ted
diet
ary
chan
ges
whi
lepa
rtic
ipat
ing
inth
epr
ogra
m,a
ndth
eec
onom
icbe
nefit
sof
the
prog
ram
.
Toke
n/Vo
uche
r/C
oupo
nFres
hFV
,egg
s,br
ead,
and
mea
tFa
rmer
s’M
arke
tFi
vefa
rmer
s’m
arke
tsin
asi
ngle
met
ropo
litan
area
252
part
icip
ants
Ince
ntiv
esin
crea
sed
daily
FVco
nsum
ptio
nan
dw
eekl
yFV
spen
ding
.
Mar
cink
evag
eet
al.2
019
[33]
Exam
ine
stre
ngth
san
dw
eakn
esse
sof
the
FVpr
escr
ipti
onpr
ogra
mim
plem
enta
tion
;gai
nin
sigh
tint
osu
cces
sful
prog
ram
min
gac
tiviti
esfo
rFV
pres
crip
tion
s;as
sess
over
all
effec
tive
ness
ofth
epr
ogra
min
impr
ovin
gaff
orda
bilit
yof
heal
thy
food
sam
ong
low
-inc
ome
pati
ents
;an
das
sess
pati
ents
atis
fact
ion
wit
hth
epr
ogra
m.
Toke
n/Vo
uche
r/C
oupo
nFres
h,Fr
ozen
,Can
ned,
and/
orD
ried
FVG
roce
rySt
ore
169
groc
ery
stor
esin
asi
ngle
stat
e14
4pa
rtic
ipan
ts
Ince
ntiv
esin
crea
sed
FVpu
rcha
sean
dco
nsum
ptio
n,pa
rtic
ipan
tsre
port
edm
anag
ing
thei
rhe
alth
cond
itio
nsbe
tter
,and
anim
prov
emen
tin
mee
ting
nutr
itio
n,di
et-r
elat
ed,o
rm
ealp
lan
goal
s.
148

Nutrients 2020, 12, 1676
Tab
le1.
Con
t.
Au
tho
rS
tud
yO
bje
ctiv
eIn
cen
tiv
eB
en
efi
tF
oo
dE
lig
ible
for
Ince
nti
ve
Red
em
pti
on
Ven
ue
Ty
pe
Pro
gra
mS
cale
Sam
ple
Siz
eR
ele
van
tF
ind
ing
s
Ols
hoet
al.2
015
[34]
Ass
ess
the
effec
tive
ness
ofin
cent
ive
prog
ram
inin
crea
sing
acce
ssto
and
awar
enes
sof
farm
ers’
mar
kets
,and
incr
easi
ngpu
rcha
sean
dco
nsum
ptio
nof
frui
tsan
dve
geta
bles
.
Toke
n/Vo
uche
r/C
oupo
nFr
esh
FVFa
rmer
s’M
arke
t86
farm
ers’
mar
kets
ina
sing
lem
etro
polit
anar
ea22
87pa
rtic
ipan
ts
Hea
lth
Buck
sin
crea
sed
awar
enes
sof
farm
ers’
mar
kets
and
FVpu
rcha
ses.
No
sign
ifica
ntch
ange
inFV
cons
umpt
ion
was
dete
cted
.
Pelle
grin
oet
al.2
018
[35]
Det
erm
ine
FVco
nsum
ptio
nam
ong
ince
ntiv
epr
ogra
mpa
rtic
ipan
tsan
did
entif
yde
mog
raph
ican
dbe
havi
oral
fact
ors
asso
ciat
edw
ith
high
erco
nsum
ptio
n.
Toke
n/Vo
uche
r/C
oupo
nFr
esh
FVFa
rmer
s’M
arke
tSi
xfa
rmer
s’m
arke
tsin
asi
ngle
met
ropo
litan
area
228
part
icip
ants
Part
icip
ants
repo
rted
high
erm
edia
nFV
cons
umpt
ion
than
peop
lew
ith
sim
ilar
inco
me
leve
ls,b
utst
illbe
low
reco
mm
ende
dle
vels
.
Rat
igan
etal
.201
7[3
6]
Exam
ine
the
fact
ors
asso
ciat
edw
ith
the
ongo
ing
utili
zati
onof
afa
rmer
s’m
arke
tinc
enti
vepr
ogra
mam
ong
fede
ralf
ood
assi
stan
cepa
rtic
ipan
ts.
Toke
n/Vo
uche
r/C
oupo
n
SNA
Ppa
rtic
ipan
tsco
uld
use
the
ince
ntiv
efo
ran
ySN
AP-
elig
ible
food
,WIC
part
icip
ants
coul
dus
eth
ein
cent
ive
for
fres
hpr
oduc
eon
ly.
Farm
ers’
Mar
ket
Five
farm
ers’
mar
kets
ina
sing
lem
etro
polit
anar
ea72
98pa
rtic
ipan
ts
Incr
ease
sin
FVco
nsum
ptio
nan
dsp
endi
ngan
dim
prov
emen
tin
perc
epti
onof
over
alld
ietq
ualit
y.Fa
ctor
s,in
clud
ing
ethn
icit
y,ty
peof
gove
rnm
enta
ssis
tanc
e,ag
e,di
sabi
lity
stat
us,e
nrol
men
tmar
ket,
seas
onof
enro
lmen
t,ba
selin
eFV
serv
ing,
and
perc
eive
ddi
etqu
alit
y,aff
ecte
dpr
ogra
mut
iliza
tion
and
rete
ntio
n.
Rum
mo
etal
.201
9[3
7]Ev
alua
teth
eeff
ecti
vene
ssan
dfe
asib
ility
ofin
cent
ive
prog
ram
ingr
ocer
yst
ores
.To
ken/
Vouc
her/
Cou
pon
Fres
hFV
Gro
cery
Stor
e16
groc
ery
stor
esin
asi
ngle
met
ropo
litan
area
Uns
peci
fied
num
ber
ofpa
rtic
ipan
ts
Ince
ntiv
esha
da
posi
tive
effec
ton
FVsa
les
butd
idno
taff
ects
pend
ing
onsu
gar-
swee
tene
dbe
vera
ges.
Savo
ie-R
osko
etal
.201
6[3
8]
Det
erm
ine
whe
ther
part
icip
atio
nin
afa
rmer
s’m
arke
tinc
enti
vepi
lot
prog
ram
had
anim
pact
onfo
odse
curi
tyan
dFV
inta
keof
part
icip
ants
.
Toke
n/Vo
uche
r/C
oupo
nU
nspe
cifie
dFV
Farm
ers’
Mar
ket
One
farm
ers’
mar
ket
54pa
rtic
ipan
tsIn
cent
ives
decr
ease
dfo
odin
secu
rity
-rel
ated
beha
vior
san
din
crea
sed
inta
keof
sele
ctFV
.
Savo
ieR
osko
set
al.2
017
[39]
Iden
tify
bene
fits
and
barr
iers
tous
ing
afa
rmer
s’m
arke
tinc
entiv
epr
ogra
m.
Toke
n/Vo
uche
r/C
oupo
nAny
SNA
Pel
igib
leit
emFa
rmer
s’M
arke
tO
nefa
rmer
s’m
arke
t28
part
icip
ants
Ince
ntiv
esre
duce
dba
rrie
rsas
soci
ated
wit
hfa
rmer
s’m
arke
tuse
,in
clud
ing
cost
and
acce
ssib
ility
,and
prov
ided
mor
esp
endi
ngfle
xibi
lity,
asw
ella
sen
able
dth
epu
rcha
seof
FVth
atpr
evio
usly
did
notfi
tint
obu
dget
.
Stee
le-A
djog
non
etal
.201
7[4
0]
Ana
lyze
how
FVex
pend
itur
es,
expe
ndit
ure
shar
es,v
arie
ty,a
ndpu
rcha
sede
cisi
ons
wer
eaff
ecte
dby
the
initi
atio
nan
dco
nclu
sion
ofan
FVin
cent
ive
prog
ram
,as
wel
las
anal
yze
any
pers
iste
nteff
ects
ofth
epr
ogra
m.
Toke
n/Vo
uche
r/C
oupo
nFr
esh
FVG
roce
rySt
ore
One
groc
ery
stor
e15
6pa
rtic
ipan
ts
Ince
ntiv
esw
ere
asso
ciat
edw
ith
incr
ease
dve
geta
ble
spen
ding
,FV
expe
nditu
resh
ares
,and
vari
ety
ofFV
purc
hase
d,bu
tthe
effec
tsw
ere
min
imal
and
unsu
stai
nabl
ew
itho
utth
eco
ntin
uati
onof
the
prog
ram
.Fr
uits
pend
ing
and
FVpu
rcha
sede
cisi
ons
wer
eno
tim
pact
edby
the
prog
ram
.
149

Nutrients 2020, 12, 1676
Tab
le1.
Con
t.
Au
tho
rS
tud
yO
bje
ctiv
eIn
cen
tiv
eB
en
efi
tF
oo
dE
lig
ible
for
Ince
nti
ve
Red
em
pti
on
Ven
ue
Ty
pe
Pro
gra
mS
cale
Sam
ple
Siz
eR
ele
van
tF
ind
ing
s
Wet
heri
llet
al.2
017
[41]
Des
crib
eth
ede
sign
,im
plem
enta
tion
,an
dco
nsum
erre
spon
seto
aco
upon
-sty
lein
terv
enti
onai
med
toin
crea
seSN
AP
use
ata
farm
ers’
mar
keta
mon
gTe
mpo
rary
Ass
ista
nce
for
Nee
dyFa
mili
es(T
AN
F)pa
rtic
ipan
ts.
Toke
n/Vo
uche
r/C
oupo
nU
nspe
cifie
dFV
Farm
ers’
Mar
ket
One
farm
ers’
mar
ket
254
part
icip
ants
Very
few
part
icip
ants
(6.3
%)
rede
emed
the
ince
ntiv
eco
upon
s.St
and-
alon
eco
upon
ince
ntiv
epr
ogra
ms
may
notb
esuffi
cien
tfor
enco
urag
ing
farm
ers’
mar
ketu
seam
ong
the
popu
lati
onus
ing
TAN
F.C
ompl
emen
tary
stra
tegi
es,s
uch
ased
ucat
ion,
tobu
ildve
geta
ble
prep
arat
ion
know
ledg
ean
dsk
ills
are
need
ed.
Youn
get
al.2
013
[42]
Det
erm
ine
ifFV
ince
ntiv
epr
ogra
mw
asas
soci
ated
wit
hin
crea
sed
FVco
nsum
ptio
nan
dSN
AP
sale
sat
farm
ers’
mar
kets
inlo
w-i
ncom
ear
eas.
Toke
n/Vo
uche
r/C
oupo
nFr
esh
FVFa
rmer
s’M
arke
t22
farm
ers’
mar
kets
ina
sing
lem
etro
polit
anar
ea66
2pa
rtic
ipan
tsIn
cent
ives
wer
eti
edto
incr
ease
sin
FVco
nsum
ptio
nan
dsa
les.
FV:f
ruit
san
dve
geta
bles
,WIC
:Spe
cial
Supp
lem
enta
lNut
riti
onPr
ogra
mfo
rW
omen
,Inf
ants
,and
Chi
ldre
n,PO
S:po
into
fsal
e.
150

Nutrients 2020, 12, 1676
3.1.1. Recruitment and Eligibility of Incentive Program Participants
In the studies under review, individuals became incentive program participants in a multitude of ways.Eleven programs had an enrollment process through which individuals had to complete some type ofinformal or formal sign-up process for the program to receive the incentive [7,26–28,31–33,36,38,40,41],while eight studies had no enrollment process and provided the incentive when participants visited and/ormade a purchase at a retailer and provided evidence of their SNAP participation [25,28,30,34,35,37,39,42].Bowling et al. provided all SNAP participants shopping at participating markets with an incentiveand provided an additional incentive to a subset of this population that had specifically enrolled in theprogram [27]. It is important to note that the inclusion of an enrollment process may create additionaladministrative challenges, as well as barriers for participation. However, as enrollment processesoften included a pre-test survey and/or a method of tracking participants’ transactions throughout theimplementation period, these programs may provide opportunities for more rigorous evaluation andtherefore greater insight regarding the impact of incentive programs of FV purchases and consumption.One study assessed programs in which participants were given the incentive after visiting a health clinic [33].Similar to the challenges with enrollment processes, this requirement may create a participation barrier,but may have a greater impact on dietary quality and health, as it is part of a broader focus on the healthstatus of federal food assistance program participants.
3.1.2. Delivery and Timing of Incentive Benefits
Table 1 summarizes the types of incentive benefits that have been granted to participants. Two programswere structured such that the incentive was provided at the point-of-sale (POS) [7,31]. For the purposes ofthis review, POS incentives are defined as those that immediately discount participants’ FV purchasesat checkout. In contrast to this model, 17 programs provided participants with coupons, vouchers,or tokens [25–30,32–42]. The delivery of coupons, vouchers, or tokens (hereafter referred to as incentives)varied by program. Some programs provided the incentives when the participant enrolled in the programor following their enrollment, such as when they visited a farmers’ market [28,32,35,41]. Other programsprovided the incentives following or in conjunction with the purchase of FV [7,25,26,28,30,31,33,36–38,40].Moreover, some programs required incentives to be redeemed immediately upon receipt [7,31], butothers allowed the incentive to be used for a future transaction. Importantly, allowing participants tosave the incentive and choose when they use it may be beneficial, due to the monthly “SNAP-cycle”spending pattern, where the majority of recipients spend most of their monthly benefits within two weeksafter receiving them [43,44]. In all cases, the intent of these benefits is to induce participants to increasetheir FV purchases by providing them with financial rewards for these purchases and/or resources thatenable them to purchase these foods at a lower price.
Most incentive programs included in this review required participants to make an FV purchase inorder to “trigger” the delivery of the incentive benefit [7,25,26,28,30,31,33,36–38,40]. However, the types ofFV that qualify as trigger foods differ. For example, the Healthy Incentives Pilot, a federally funded FVincentive program administered in Hampden County, MA, distributed incentive benefits after participantspurchased targeted FV, which were defined as any fresh, canned, frozen, and dried fruit or vegetable FVwithout any added sugars, fats, oils, or sodium. In addition, the pilot excluded fruit juice, mature legumes,and white potatoes. These specifications were selected to mirror the restrictions of WIC-eligible produceitems [7]. In contrast, for programs held at farmers’ markets, participants often had to purchase fresh FVin order to receive the incentive.
A few programs had multiple points and locations at which incentive benefits were distributedto participants. In the program evaluated by Young et al. [42], a $2 bonus incentive coupon was provided forevery $5 in SNAP benefits used at a farmers’ market. Additionally, coupons were distributed at community
151

Nutrients 2020, 12, 1676
organizations that serve SNAP-eligible populations, absent of any initial purchase by the participant.The program examined by Olsho et al. [34], was structured similarly, in that some participants receivedthe incentive through a match after they made a purchase, while others received the incentive fromcommunity-based organizations absent of any purchase, usually after they attended a nutrition workshopor other health and fitness program. Similarly, two incentive distribution methods were employed inthe program examined by Savoie-Roskos et al. [39]; participants received either “regular incentives”,which were distributed at regular intervals without any purchase requirement, or matched incentives.Bowling et al. [27] employed both POS incentives and tokens; all SNAP recipients shopping at participatingmarkets received a matched incentive when they used their EBT card at these markets, which could not besaved for future use, but at every third market, participants also received $20 in “Bonus Buck” tokens.
3.1.3. Financial Value of Incentive to Participants
The value of incentive benefits to participants differed widely. As stated previously, most programsrequired a purchase to receive the incentive [7,25–27,30–32,34,36–38,40,42]. In these programs, the valueof the benefit was either pre-determined or determined by the value of the participants’ purchases.For example, in the incentive program studied by Freedman et al. [31], participants received benefitsvalued at $5 regardless of the cost of their initial purchases. However, many incentive programsfunctioned such that the value of the benefit was determined by the magnitude of the participants’spending [7,25–27,29,30,32,34,36–40,42]. In these cases, the value of the benefit was either equal to theparticipants’ spending or a percentage of their spending. In many instances, 100% of the participants’spending was matched, meaning that the value of the benefits was equal to the amount of money spent byparticipants [25,26,30,32,36–40]. In some cases, the value of the benefit was adjusted based on the size ofparticipating families, as families with children were given additional value [38].
Among incentive programs that provided a match to participant spending, there was frequentlya ceiling on the value of the match. In all, 11 of the studies [7,25–28,30,32,36–38,41] reviewed hadsome type of ceiling. For instance, in a Utah-based farmers’ market incentive program, participantsreceived $1 in incentives for every $1 they spent in SNAP benefits, with individuals and couples receiving$10 worth of incentives each week and families receiving an additional $5 per child, up to $30 eachweek [39]. Another type of ceiling was demonstrated, where participants could receive an extra $20 inbonus tokens every third farmers’ market visit but were limited to receiving $120 of these bonus tokensduring the program’s implementation [27]. Other programs provided benefits that were valued as apercentage of the participants’ spending. For instance, the Health Bucks and Philly Food Bucks programsprovided $2 vouchers for every $5 participants spent, and thus acted as a 40% match of the participants’spending [32,42,45]. Notably, incentives that are granted in proportion to the participants’ spending aredesigned to encourage participants to purchase more fruits and vegetables, because with these programs,the more participants spend on these foods, the more they are rewarded.
Some programs implemented multiple forms of incentives. For example, Savoie-Roskos et al. [39]provided one group of participants with incentive benefits that did not require them to make a purchase andanother group with benefits, in the form of spending matches, that augmented the incentive. A comparisonof the outcomes between the groups was not reported.
Overall, programs that match participants’ spending may provide incentive benefits that have greaterfinancial value than those that provide a benefit of a fixed value. In addition, programs with ceilings maycreate less value for participants than those without ceilings. Thus, certain programs may be more effectivein inducing participants to purchase and consume more FV, because they expand participants’ purchasingpower to a greater degree. Differences in value may also be important, given that program retention is achallenge across the literature, and programs that provide less value may be less effective in encouraging
152

Nutrients 2020, 12, 1676
ongoing participation. Notably, Wetherill et al. [41] posited that low incentive redemption rates may betied to perceived differences in the value of different kinds of incentives, as incentives that function asdiscounts and expand buying power may be less valuable to participants than incentives that providefree products.
3.1.4. Eligible Foods
The foods that were eligible for purchase using incentive benefits also differed. While some of theprograms provided benefits that could be utilized to purchase only FV, others were triggered by an FVpurchase, but provided benefits redeemable for a diverse range of foods, such as any SNAP-eligiblefood [7,36,39]. A drawback of awarding incentives that can be used for any SNAP-eligible food is thepossibility that incentive benefits are used to purchase foods with low nutrient density. For example, inthe Healthy Incentives Pilot, an additional $0.30 was added to participants’ EBT cards for every $1 ofSNAP benefits spent on FV. There are few limitations on the types of foods and beverages that can bepurchased with EBT, and some evidence suggests that reducing the price of healthful foods may result inthe increased purchase of energy, which could contribute to obesity [46].
In contrast, other FV incentive benefits could be used only to purchase locally grown FV [27,29,31,32,34,37,40,47]. In some cases, the foods included in the incentive program varied based on participanteligibility. For example, in the Fresh Funds program [36], participants could use the tokens they purchasedwith their SNAP benefits, and the tokens that they received as a match, to purchase fresh produce orpackaged foods, such as jams/spreads, breads, eggs, pasta, cheese, and fish; however, the tokens theypurchased using WIC benefits could only be spent at vendors selling fresh produce.
The characteristics and needs of the recipients must be considered when designing incentive programsand the types of FV eligible for incentive redemption. For example, FV may not be an appealingincentive to people with limited facilities and equipment for food preparation. However, for participantswith access to food preparation facilities, frozen, canned, and dried FV have a longer shelf-life thanfresh FV and may be useful for prolonging food security throughout the month and between monthlySNAP benefit distributions. Likewise, the capacity of the retail environment must also be considered.SNAP vendor eligibility implemented in January 2018 requires vendors to stock FV, but does not requirethose FV to be fresh if other perishable foods are stocked (i.e., meat or dairy), and only one type of perishablefood needs to be offered (i.e., selling just one type of fruit would fulfill the fresh FV requirement) [48].Low income communities tend to have more convenience stores and small markets [49,50] where theavailability of FV tends to be lower [51–53]. Therefore, the retail capacity, including the availability offreezers/refrigeration, must be considered when designing fresh FV incentive programs.
3.1.5. Retail Venue
Table 1 illustrates that the majority (16/19) of the reviewed studies were implemented in part or inentirety at farmers’ markets. Farmers’ market incentive programs have the advantage of supportinglocal farmers and food vendors. Additionally, the literature indicates that shopping at farmers’ marketspositively impacts FV purchases and that by drawing participants to shop at these venues, incentiveprograms implemented at farmers’ markets may positively impact FV purchase and consumption behaviorsand attitudes beyond the time period in which the program is implemented [31,32,54].
Several studies indicate that farmers’ market incentive programs attract SNAP participants whootherwise might not shop at these venues [30–32,35]. One incentive program study found that 57% ofparticipants in a farmers’ market incentive program had never been to a farmers’ market [31]. Similarly,another study noted that SNAP participants’ awareness of farmers’ markets rose in relation to their exposureto the Health Bucks incentive program [35]. In addition, these researchers found that 54% of Health
153

Nutrients 2020, 12, 1676
Bucks participants who used their benefits at farmers’ markets strongly agreed that “I shop at farmers’markets more often because of Health Bucks”, and a Utah-based incentive program reported that 98% ofbaseline participants reported that the incentive made it more likely that they would shop at the farmers’market [30]. In the Farmers’ Market Fresh Fund Incentive Program, 82% of participants had never attendeda farmer’s market prior to participating in the program, and 93% of participants reported that incentiveswere “important” or “very important” in their decision to shop at farmers’ markets [32]. In addition todrawing more SNAP participants to farmers’ markets, the Farmers’ Market Fresh Fund Incentive Programdemonstrated the potential to impact participants’ long-term shopping behavior. In particular, the majorityof participants reported that they would be “somewhat likely” or “completely likely” to shop at farmers’markets even without the continuation of the incentive program [32]. Increased awareness that EBTis accepted at many farmers’ markets has also been noted among incentive program participants [39].Accordingly, there is evidence that farmers’ market incentive programs increase participants’ exposure tomarkets as venues offering affordable, healthy food, and in turn have the potential to positively influencetheir long-term food purchasing behavior.
Another potential benefit of implementing incentive programs at farmers’ markets is the potential forthe increased consumption of FV. Shopping at farmers’ markets is linked to increased FV consumption,and thus offering incentives at farmers’ markets has the capacity to improve dietary quality beyond merelyincreasing the financial resources participants have to purchase FV [55]. Specifically, Olsho et al. [34]found that both incentive program participants and farmers’ market shoppers who were not enrolledin the program reported higher FV consumption than other residents in their neighborhoods. However,incentive program participation per se was not related to an increase in daily FV servings.
Despite the potential benefits of implementing incentive programs at farmers’ markets, it is importantto consider access issues in this context. Specifically, farmers’ markets are not as abundant as other typesof food retailers, such as grocery stores, and may not exist in certain communities. Driving distancefrom residence to market has been inversely correlated with repeat use of farmer’s market incentives [56].However, other research suggests that the distance from food retailers does not significantly affect theextent to which incentives impact SNAP participants’ FV spending [7,32]. Moreover, many markets arenot open year-round and have limited hours of operation.
3.2. Outcome Assessment
All of the studies included in this review considered the impact of incentives on FV purchasesand/or consumption. Four of the studies reviewed focused exclusively on FV purchases [25,30,36,39,41],five focused exclusively on FV consumption [28,29,34,37,40], and nine examined both FV purchaseand consumption [7,24,26,27,31–33,35,38]. As explored later in this section, only one of the reviewedstudies [41] did not report some positive impact on FV purchases and/or consumption in conjunction withincentive programs.
Studies employed a variety of approaches for measuring these outcomes, as shown in Tables 2 and 3.The majority of studies assessed FV purchase and/or consumption using a pre-/post-test design,where participants’ FV purchase and consumption behaviors and attitudes were assessed prior to theimplementation of the incentive program and then again at the program’s conclusion [25–28,30–36,38,39,42].In addition, the Healthy Incentives Program also assessed the program impact at various points throughoutthe implementation phase [7]. A few studies also used control or quasi-control groups to assess programimpact [7,34,37,41,47]. The merits of quasi-control groups are somewhat limited if the comparison groups donot share important characteristics with the incentive program participants. For example, Olsho et al. [34],compared the FV purchase and consumption of incentive program participants with that of othernon-participant neighborhood residents, but these residents were not necessarily federal food assistance
154

Nutrients 2020, 12, 1676
program participants. Although the groups may have shared relevant demographic characteristics,the comparison is problematic because federal food assistance program participants have uniquecircumstances that may make incentive programs particularly salient, such as the challenge of managingfood-purchasing resources in conjunction with the monthly SNAP distribution cycle. Another studycompared SNAP transaction data from participating grocery stores to that of nonparticipating storesto determine whether the percentage of dollars spent on fresh produce in total SNAP transactions ishigher in stores that implement incentives than in stores that do not [37]. Control stores were selectedusing a coarsened exact matching and linear probability match to match on store characteristics andsociodemographics. While this approach is not as rigorous as randomizing stores to the incentive orcontrol condition, the use of matched controls is preferred to non-matched controls. Wetherill et al. [41]employed a quasi-experimental design to compare two coupon interventions: basic information and plaincoupon distribution compared to tailored, targeted marketing coupon intervention. However, low couponredemption by either group made comparisons difficult.
Table 2. Assessment of fruit and vegetable purchases in nutrition incentive programs.
Author Assessment Method
Survey Assessment of FV Purchases
Alaofè et al. (2017) [25]
Frequency of farmer’s market shopping, purchasing amount, and types of purchases wereassessed by the questions: 1. “Because of Double-Up SNAP Pilot (DUSP) program rebates, isyour family buying a larger amount of . . . ?” 2. “Because of DUSP program rebates, is yourfamily eating a greater amount of . . . ?”, and 3. “Because of DUSP program rebates, have you
or your family tried any new or unfamiliar fruits or vegetables?”
Amaro and Roberts (2017) [26]
Open-ended survey responses demonstrated that participants purchased FV at the farmers’market because the incentive program made it affordable for them to do so. Additionally,
they were asked to indicate the degree to which they agreed or disagreed with “I can affordto buy fresh fruits and vegetables”.
Bartlett et al. (2014) [7] Specific survey items not provided but questions sought to discern general food shoppingpatterns and food expenditures.
Bowling et al. (2016) [27] “How much of your family’s weekly WIC/SNAP budget is spent on FVs?”
Dimitri et al. (2013) [28]
Survey assessed questions covering five aspects: (1) frequency of shopping at farmers’markets and the number of years receiving incentives, (2) perception of how much incentives
influenced the decision to shop at the farmers’ market, (3) perception of the impact thatshopping at the market with incentives had on fresh FV consumption, (4) importance of
farmers’ market characteristics on the decision to shop at that market, and (5) access to themarket and use of the market for fresh FV.
Lindsay et al. (2013) [32] “How much on average do you spend on fresh fruits and vegetables per week?”Marcinkevage et al. (2019) [33] Perceptions of affordability, purchase of FV not previously tried.
Olsho et al. (2015) [34] Specific survey items not provided but questions sought to discern changes in farmers’market spending, including whether FV were purchased each visit.
Ratigan et al. (2017) [36] Perceptions of food purchasing behavior and affordability of FV, weekly spending on FV(<$10, $10–19, $20–29, $30–39, ≥$40.)
Interviews or Focus Groups to Assess FV purchases
Bartlett et al. (2014) [7] Experiences with the program, including financial impact on the household and changes inwillingness to purchase FV.
Savoie-Roskos et al. (2017) [39]Cost and budgeting as barriers to FV purchases prior to the incentive program emerged asthemes and participants noted that the program helped them overcome these barriers, citing
greater spending flexibility and decreased anxiety over the cost of food.
Bartlett et al. (2014) [7]
EBT transaction data to determine Healthy Incentive Program (HIP) incentive earnings bypilot participants, focusing on HIP-eligible purchases, the amount of incentives earned, and
the percent of SNAP benefits spent on HIP-eligible purchases. Analysis of spending indifferent types of store, focusing on spending on targeted FV in supermarkets and
superstores.
155

Nutrients 2020, 12, 1676
Table 2. Cont.
Author Assessment Method
Sales Tracking to Assess FV Purchases
Freedman et al. (2014) [31]
Sales tracking using unique identifier for each participant; transaction data, including date oftransaction, customer type (patient, staff, or community member), total cost, and payment
type; comparing venue revenue trends from the previous year with those during theimplementation period.
Lindsay et al. (2013) [32] Data were collected from vendors regarding total sales each day from incentive tokens as apercentage of total sales.
Marcinkevage et al. (2019) [33] Quarterly and yearly redemption rates, dollar amount spent on FV per incentive redeemed.
Olsho et al. (2015) [34] Comparison of average daily SNAP sales from farmers’ markets accepting incentives withthose not accepting incentives.
Ratigan et al. (2017) [36] Records of market attendance and frequency of visits to booths where participantsreceived incentives.
Rummo et al. (2019) [37] FV spending as a percentage of total spending from individual transactions at grocery storesthat implemented programs and that did not implement programs.
Steele-Adjognon et al. (2017) [40]Loyalty card scanner data was acquired to assess: “FV expenditure; fruit expenditure;
vegetable expenditure; FV expenditure share; FV variety; and FV purchase decision. FVexpenditure is the aggregate dollar amount spent during the month on all fresh FV.”
Wetherill et al. (2017) [41] Differences in baseline sociodemographic, predisposing, enabling, and reinforcing factorsrelated to FV attitudes and behaviors by incentive redemption.
Young et al. (2013) [42] Comparison of market SNAP sales from implementation period to those from previous years;incentive redemption rates.
Table 3. Assessment of fruit and vegetable consumption in nutrition incentive programs.
Author Description of Assessment Method
Alaofè et al. (2017) [25] FV consumption frequency measured using Behavioral Risk Factor Surveillance System FV module.
Bartlett et al. (2014) [7]24-h dietary recall interviews at multiple points in implementation period and followed up by focus
groups, which included discussion of impact on FV consumption. Surveys on FV consumption(frequency and quantity) using Eating at America’s Table Study (EATS) Fruit and Vegetable Screener.
Bowling et al. (2016) [27] Survey questions including “On an average day, how many times do you have a vegetable to eat?”and “On an average day, how many times do you have a fruit to eat?”
Dimitri et al. (2015) [29] National Health and Nutrition Examination Survey food frequencyquestionnaire: Number of timesvegetables were consumed in the last six months, daily and weekly serving of FV.
Dimitri et al. (2013) [28] Specific survey items not provided, but assessed participant perception that fresh FV consumptionincreased or did not increase.
Durward et al. (2019) [30] FV consumption frequency measured using Behavioral Risk Factor Surveillance System FV module.
Lindsay et al. (2013) [32] “On average, how many servings of fruits and/or vegetables do you usually eat each day?” and “Ingeneral, how healthy would you say your overall diet is?”
Marcinkevage et al. (2019) [33]Survey included questions related to participant perceived improvement in the consumption of
healthy foods, including FV, and perceived health benefit prescriptions (trying new FV, eating moreFV, increases in FV consumption by family members.)
Olsho et al. (2015) [34]New York City Community Health Survey: “total servings of fruits and vegetables eaten on the
previous day” and “consumption today vs. consumption one year ago”; interviews includedquestions about the consumption of FV from farmers’ markets.
Pellegrino et al. (2018) [35] FV consumption frequency measured using Behavioral Risk Factor Surveillance System FV module.
Ratigan et al. (2017) [36] Survey regarding number of servings of FV consumed daily, rank overall dietary quality (veryhealthy, healthy, average, unhealthy, very unhealthy.)
Savoie-Roskos et al. (2016) [38] FV consumption frequency measured using Behavioral Risk Factor Surveillance System FV module.Savoie-Roskos et al. (2017) [39] Interview: “How does your diet now compare to your diet before the study?”
Young et al. (2013) [42] “Since becoming a customer at this market, do you eat more, less, or the same amount of fruitsand vegetables?”
Assessment of FV consumption varied in the quality of methods used for dietary assessment. Of the15 studies which assessed the change in FV consumption (Table 3), five studies employed the validatedBehavioral Risk Factor Surveillance System FV module [57], and two other studies used other validatedassessment tools [7,29]. The validity of the dietary assessment methods for the remaining eight studieswas not clear.
156
Nutrients 2020, 12, 1676
All studies under review noted some degree of positive impact, with the exception of Wetherill et al. [41].In that study, participants were all recipients of Temporary Assistance for Needy Families (TANF),a cash-assistance program in the United States for very low-income families with children. Generally,TANF participation automatically qualifies a household for SNAP. Given the severe income restrictionof TANF households, these participants may not be representative of the general SNAP population.Moreover, few participants in this study (n = 16, 6.3%) redeemed the incentive coupons; making outcomeassessment difficult, although the authors did note that that education surrounding food preparationskills may be necessary, in conjunction with incentives to alter food purchasing behaviors at farmers’markets. Among the remaining studies that reported some positive impact, limitations in the impact of theincentive programs were identified. Conclusions from the Michigan farmers’ market-based Double UpFood Bucks program included that the impact of incentive programs was unsustainable and minimal [40],and a Washington, DC-based farmers’ market evaluation noted that although participants reported higherFV consumption, their intake still fell below recommended levels [35]. Olsho et al. [34], reported anincrease in purchases but concluded that there was no observable difference in consumption betweenincentive program participants and non-participants, and similarly, Bowling et al. [27] observed that whileparticipants reported increased fruit and vegetable consumption, they did not change the amount of theirWIC/SNAP budget spent on these foods.
Several demographic factors have been linked to incentive program retention and use frequency andthus may be important when considering outcome assessment. Specifically, Dimitri et al. [29] noted thatparticipants who were more reliant on food banks, very income restrained, and lived in areas where accessto food was limited were more likely to drop out of the incentive program they studied [29]. These findingssuggest that the presence of these factors may impact the effectiveness of incentive programs, as participantretention is essential for incentives to influence FV purchases and consumption. Ratigan et al. found thatparticipants who had unhealthier diets at the beginning of the program were more likely to use incentivesa greater number of times in the short term, but incentive use waned after six months [36]. In addition,Ratigan et al. noted that elderly and disabled individuals were more likely to use incentive programs inthe long term than those who were younger and noted that ethnicity, type of government food assistanceprogram participation, income, season of incentive program enrollment, and baseline FV consumptionwere related to the frequency of incentive utilization and total duration of their retention in the incentiveprograms [36]. They also noted that ethnicity, type of government food assistance program participation,income, season of incentive program enrollment, and baseline FV consumption correlate with both thenumber of times participants utilize incentives in a given period of time, as well as the total duration oftheir retention in incentive programs. Together, these results suggest that additional work is needed toidentify the characteristics of subgroups who are most responsive to incentive programs in order to targetincentive programs.
4. Conclusions and Recommendations
This scoping review highlights the wide range of FV incentive program structures and demonstrates that,in general, these programs may be an effective approach for increasing FV purchase and consumptionby SNAP participants, while preserving autonomy in food choice. However, it is unclear whether thepotential positive effects of these programs are substantial and sustainable. Moreover, the assessmentmethods employed to evaluate these programs have often relied on self-reports and lack sufficient rigorto assess program impact. Specifically, dietary assessment, when performed, frequently failed to utilizevalidated methods, such as the 24-h recall. Additionally, there are limitations to the scoping reviewprocess itself. Namely, a professional librarian was not consulted to assist with developing the searchstrategy and the protocol was not published early enough in the process to allow input from the greater
157

Nutrients 2020, 12, 1676
scientific community. These factors, in conjunction with the significant variation in program structure,makes it difficult to elucidate which programmatic elements may be most critical for designing andimplementing effective programs.
Although the literature indicates that incentive programs may positively impact FV purchasesand consumption by SNAP participants, several areas that require additional research in order tounderstand how to create effective programs are revealed. For instance, other interventions, suchas nutrition education, cooking demonstrations, and food tastings, are often deployed in conjunctionwith incentives. These interventions not only equip participants with the knowledge they need to makehealthy eating decisions and integrate healthy foods into their diets but may also contribute to participantuse and retention. Participant use of available incentives and retention is a key determinant of programeffectiveness, and additional research is needed to understand how to maximize participation and retention.Additional work is needed to elucidate how participant characteristics, such as food security status anddemographics, may be associated with the use of incentives. Another area for future research is the impactof incentive program participation on objective measures of health. The studies reviewed in this scopingreview demonstrated an improvement in program participants’ perceptions of their health [7,32,33,36]and one study demonstrated an improvement in food security status [30], but none of the studies underreview measured BMI or other health measures. Consequently, the actual impact of incentives on healthremains unclear, and identifying the point at which incentives create a tangible difference in health outcomesis key for creating programs that promote participants’ well-being. Lastly, more research is needed tounderstand the long-term effects of incentives. Some evidence suggests that the increases in FV purchasesresulting from incentive program participation are not sustained following program termination [40].Additionally, few studies have investigated the capacity of incentive programs to influence long-termfood consumption and purchasing behavior. Thus, the long-term efficacy of incentives is uncertain [38,58].Moreover, the research that has considered the long-term impacts of incentive programs has relied onself-reported predictions of future food purchasing behavior [32]. As no longitudinal studies of the impactof incentive programs have been performed, additional research is required to determine the long-termimpact of these programs.
Overall, studies of FV incentive programs reveal a positive impact on both FV purchases andconsumption. This scoping review provides insights intended to inform the design, implementation,and evaluation of future FV incentive programs targeting SNAP participants. Exploring these factors iscritical for understanding how to effectively design and implement effective, sustainable incentive programs.
Supplementary Materials: The following are available online at http://www.mdpi.com/2072-6643/12/6/1676/s1,Table S1: Preferred Reporting Items for Systematic reviews and Meta-Analyses extension for Scoping Reviews(PRSIMA-ScR) Checklist.
Author Contributions: Conceptualization, K.E. and E.H.R.; methodology, K.E. and E.H.R., formal analysis, K.E. andE.H.R.; writing—original draft preparation, K.E. and E.H.R.; writing—review and editing, K.E. and E.H.R. All authorshave read and agreed to the published version of the manuscript.
Funding: This research received no external funding.
Acknowledgments: This manuscript grew from Katherine Engel’s Thesis in Science, Technology and Public Policyat the Rochester Institute of Technology. The authors would like to thank Kathryn Faulring and Claire Cook foradministrative support.
Conflicts of Interest: The authors declare no conflict of interest.
158

Nutrients 2020, 12, 1676
References
1. U.S. Department of Health and Human Services; U.S. Department of Agriculture. 2015–2020 Dietary Guidelinesfor Americans, 8th ed.; U.S. Department of Health and Human Services: Washington, DC, USA; U.S. Departmentof Agriculture: Washington, DC, USA, 2015. Available online: https://health.gov/our-work/food-nutrition/2015-2020-dietary-guidelines/guidelines/ (accessed on 3 June 2020).
2. Lee-Kwan, S.H.; Moore, L.V.; Blanck, H.M.; Harris, D.M.; Galuska, D. Disparities in State-Specific Adult Fruitand Vegetable Consumption—United States, 2015. Morb. Mortal. Wkly. Rep. 2017, 66, 1241–1247. [CrossRef][PubMed]
3. Zhang, F.; Liu, J.; Rehm, C.D.; Wilde, P.; Mande, J.R.; Mozaffarian, D. Trends and Disparities in Diet QualityAmong US Adults by Supplemental Nutrition Assistance Program Participation Status. JAMA Netw. Open 2018,1, e180237. [CrossRef] [PubMed]
4. Rehm, C.D.; Peñalvo, J.L.; Afshin, A.; Mozaffarian, D. Dietary intake among US Adults, 1999–2012. J. Am.Med. Assoc. 2016, 315, 2542–2553. [CrossRef] [PubMed]
5. USDA Food and Nutrition Services Cost of Living Adjustment (COLA). Available online: https://www.fns.usda.gov/snap/allotment/COLA (accessed on 19 May 2020).
6. What Can SNAP Buy? USDA-FNS. Available online: https://www.fns.usda.gov/snap/eligible-food%20items(accessed on 5 March 2020).
7. Bartlett, S.; Klerman, J.; Olsho, L.; Logan, C.; Blocklin, M.; Beauregard, M.; Enver, A. Evaluation of the HealthyIncentives Pilot (HIP) Final Report; Food and Nutrition Service: Alexandria, VA, USA, 2014.
8. USDA. WIC Food Packages-Regulatory Requirements for WIC-Eligible Foods. Available online: https://www.fns.usda.gov/wic/wic-food-packages-regulatory-requirements-wic-eligible-foods (accessed on 21 May 2020).
9. Yen, S.T.; Bruce, D.J.; Jahns, L. Supplemental Nutrition Assistance Program participation and health: Evidencefrom low-income individuals in Tennessee. Contemp. Econ. Policy 2012, 30, 1–12. [CrossRef]
10. About WIC-How WIC Helps. USDA-FNS. Available online: https://www.fns.usda.gov/wic/about-wic-how-wic-helps (accessed on 5 March 2020).
11. Pros and Cons of restricting SNAP Purchases. Available online: https://www.govinfo.gov/content/pkg/CHRG-115hhrg24325/html/CHRG-115hhrg24325.htm (accessed on 3 June 2020).
12. United States Government Accountability Office. FOOD STAMP PROGRAM Options for Delivering FinancialIncentives to Participants for Purchasing Targeted Foods 2008. Available online: https://www.gao.gov/new.items/d08415.pdf (accessed on 3 June 2020).
13. Gneezy, U.; Meier, S.; Rey-biel, P. When and Why Incentives (Don’t) Work to Modify Behavior. J. Econ. Perspect.2011, 25, 191–209. [CrossRef]
14. Loewenstein, G.; Brennan, T.; Volpp, K.G. Asymmetric paternalism to improve health behaviors. J. Am. Med. Assoc.2007, 298, 2415–2417. [CrossRef] [PubMed]
15. Steenhuis, I.H.M.; Waterlander, W.E.; de Mul, A. Consumer food choices: The role of price and pricing strategies.Public Health Nutr. 2011, 14, 2220–2226. [CrossRef]
16. Andreyeva, T.; Long, M.W.; Brownell, K.D. The Impact of Food Prices on Consumption: A Systematic Review ofResearch on the Price Elasticity of Demand for Food. Am. J. Public Health 2010, 100, 216–222. [CrossRef]
17. Glanz, K.; Basil, M.; Maibach, E.; Goldberg, J.; Snyder, D. Taste Nutrition Cost Convenience and Weight ControlInfluence Food Consumption. J. Am. Diet. Assoc. 1998, 98, 1118–1126. [CrossRef]
18. Leung, C.W.; Hoffnagle, E.E.; Lindsay, A.C.; Lofink, H.E.; Hoffman, V.A.; Turrell, S.; Willett, W.C.; Blumenthal, S.J.A qualitative study of diverse experts’ views about barriers and strategies to improve the diets and healthof Supplemental Nutrition Assistance Program (SNAP) beneficiaries. J. Acad. Nutr. Diet. 2013, 113, 70–76.[CrossRef]
19. Blumenthal, S.J.; Hoffnagle, E.E.; Leung, C.W.; Lofink, H.; Jensen, H.H.; Foerster, S.B.; Cheung, L.W.Y.; Nestle, M.;Willett, W.C. Strategies to improve the dietary quality of Supplemental Nutrition Assistance Program (SNAP)beneficiaries: An assessment of stakeholder opinions. Public Health Nutr. 2013, 17, 2824–2833. [CrossRef][PubMed]
159

Nutrients 2020, 12, 1676
20. Richards, M.R.; Sindelar, J.L. Rewarding healthy food choices in SNAP: Behavioral economic applications.Milbank Q. 2013, 91, 395–412. [CrossRef] [PubMed]
21. Arksey, H.; O’Malley, L. Scoping studies: Towards a methodological framework. Int. J. Soc. Res. Methodol.Theory Pract. 2005, 8, 19–32. [CrossRef]
22. Peters, M.D.J.; Godfrey, C.; McInerney, P.; Munn, Z.; Tricco, A.C.; Khalil, H. Chapter 11: Scoping Reviews.(2020 Version); In Joanna Briggs Institute Reviewer’s Manual; Aromataris, E., Munn, Z., Eds.; The JoannaBriggs Institute: Adelaide, Australia, 2020; Available online: https://reviewersmanual.joannabriggs.org/ (accessedon 3 June 2020).
23. Tricco, A.C.; Lillie, E.; Zarin, W.; O’Brien, K.K.; Colquhoun, H.; Levac, D.; Moher, D.; Peters, M.D.J.;Horsley, T.; Weeks, L.; et al. PRISMA extension for scoping reviews (PRISMA-ScR): Checklist and explanation.Ann. Intern. Med. 2018, 169, 467–473. [CrossRef] [PubMed]
24. Federal Register: Special Supplemental Nutrition Program for Women, Infants and Children (WIC): Revisions inthe WIC Food Packages. Available online: https://www.federalregister.gov/documents/2014/03/04/2014-04105/special-supplemental-nutrition-program-for-women-infants-and-children-wic-revisions-in-the-wic-food(accessed on 4 March 2020).
25. Alaofè, H.; Freed, N.; Jones, K.; Plano, A.; Taren, D. Impacts of Double Up SNAP Farmers’ Market IncentiveProgram on Fruit and Vegetable Access, Purchase and Consumption. J. Nutr. Health Sci. 2017, 4, 304. [CrossRef]
26. Amaro, C.M.; Roberts, M.C. An Evaluation of a Dollar-for-Dollar Match Program at Farmers’ Markets for FamiliesUsing Supplemental Nutrition Assistance Program Benefits. J. Child Fam. Stud. 2017, 26, 2790–2796. [CrossRef]
27. Bowling, A.B.; Moretti, M.; Ringelheim, K.; Tran, A.; Davison, K. Healthy Foods, Healthy Families: Combiningincentives and exposure interventions at urban farmers’ markets to improve nutrition among recipients of USfederal food assistance. Health Promot. Perspect. 2016, 6, 10–16. [CrossRef]
28. Dimitri, C.; Oberholtzer, L.; Nischan, M. Reducing the Geographic and Financial Barriers to Food Access:Perceived Benefits of Farmers’ Markets and Monetary Incentives. J. Hunger Environ. Nutr. 2013, 8, 429–444.[CrossRef]
29. Dimitri, C.; Oberholtzer, L.; Zive, M.; Sandolo, C. Enhancing food security of low-income consumers:An investigation of financial incentives for use at farmers markets. Food Policy 2015, 52, 64–70. [CrossRef]
30. Durward, C.M.; Savoie-Roskos, M.; Atoloye, A.; Isabella, P.; Jewkes, M.D.; Ralls, B.; Riggs, K.; LeBlanc, H. DoubleUp Food Bucks Participation is Associated with Increased Fruit and Vegetable Consumption and Food SecurityAmong Low-Income Adults. J. Nutr. Educ Behav. 2019, 51, 342–347. [CrossRef]
31. Freedman, D.A.; Mattison-Faye, A.; Alia, K.; Guest, M.A.; Hébert, J.R. Comparing farmers’ market revenue trendsbefore and after the implementation of a monetary incentive for recipients of food assistance. Prev. Chronic Dis.2014, 11, E87. [CrossRef] [PubMed]
32. Lindsay, S.; Lambert, J.; Penn, T.; Hedges, S.; Ortwine, K.; Mei, A.; Delaney, T.; Wooten, W.J. Monetary matchedincentives to encourage the purchase of fresh fruits and vegetables at farmers markets in underserved communities.Prev. Chronic Dis. 2013, 10, E188. [CrossRef] [PubMed]
33. Marcinkevage, J.; Auvinen, A.; Nambuthiri, S. Washington State’s Fruit and Vegetable Prescription Program:Improving Affordability of Healthy Foods for Low-Income Patients. Prev. Chronic Dis. 2019, 16. [CrossRef][PubMed]
34. Olsho, L.E.; Holmes Payne, G.; Klein Walker, D.; Baronberg, S.; Jernigan, J.; Abrami, A. Impacts of a farmers’market incentive programme on fruit and vegetable access, purchase and consumption. Public Health Nutr. 2015,18, 2712–2721. [CrossRef] [PubMed]
35. Pellegrino, S.; Bost, A.; McGonigle, M.; Rosen, L.; Peterson-Kosecki, A.; Colon-Ramos, U.; Robien, K. Fruitand vegetable intake among participants in a District of Columbia farmers’ market incentive programme.Public Health Nutr. 2018, 21, 601–606. [CrossRef]
36. Ratigan, A.R.; Lindsay, S.; Lemus, H.; Chambers, C.D.; Anderson, C.A.M.; Cronan, T.A.; Browner, D.K.;Wooten, W.J. Factors associated with continued participation in a matched monetary incentive programme atlocal farmers’ markets in low-income neighbourhoods in San Diego, California. Public Health Nutr. 2017, 20,2786–2795. [CrossRef]
160

Nutrients 2020, 12, 1676
37. Rummo, P.E.; Noriega, D.; Parret, A.; Harding, M.; Hesterman, O.; Elbel, B.E. Evaluating A USDA ProgramThat Gives SNAP Participants Financial Incentives To Buy Fresh Produce In Supermarkets. Health Aff. 2019, 38,1816–1823. [CrossRef]
38. Savoie-Roskos, M.; Durward, C.; Jeweks, M.; LeBlanc, H. Reducing Food Insecurity and Improving Fruit andVegetable Intake Among Farmers’ Market Incentive Program Participants. J. Nutr. Educ. Behav. 2016, 48, 70–76.[CrossRef]
39. Savoie Roskos, M.R.; Wengreen, H.; Gast, J.; LeBlanc, H.; Durward, C. Understanding the Experiences ofLow-Income Individuals Receiving Farmers’ Market Incentives in the United States: A Qualitative Study.Health Promot. Pract. 2017, 18, 869–878. [CrossRef]
40. Steele-Adjognon, M.; Weatherspoon, D. Double Up Food Bucks program effects on SNAP recipients’ fruit andvegetable purchases. BMC Public Health 2017, 17, 946. [CrossRef]
41. Wetherill, M.S.; Williams, M.B.; Gray, K.A. SNAP-Based Incentive Programs at Farmers’ Markets: AdaptationConsiderations for Temporary Assistance for Needy Families (TANF) Recipients. J. Nutr. Educ. Behav. 2017, 49,743–751. [CrossRef] [PubMed]
42. Young, C.R.; Aquilante, J.L.; Solomon, S.; Colby, L.; Kawinzi, M.A.; Uy, N.; Mallya, G. Improving fruit andvegetable consumption among low-income customers at farmers markets: Philly food bucks, Philadelphia,Pennsylvania, 2011. Prev. Chronic Dis. 2013, 10, E166. [CrossRef] [PubMed]
43. Wilde, P.E.; Ranney, C.K. The Monthly Food Stamp Cycle: Shopping Frequency and Food Intake Decisions in anEndogenous Switching Regression Framework. Am. J. Agric. Econ. 2000, 82, 200–213. [CrossRef]
44. Whiteman, E.D.; Chrisinger, B.W.; Hillier, A. Diet Quality Over the Monthly Supplemental Nutrition AssistanceProgram Cycle. Am. J. Prev. Med. 2018, 55, 205–212. [CrossRef] [PubMed]
45. Payne, G.H.; Wethington, H.; Olsho, L.; Jernigan, J.; Farris, R.; Walker, D.K. Implementing a farmers’ marketincentive program: Perspectives on the New York City Health Bucks Program. Prev. Chronic Dis. 2013, 10, E145.[CrossRef] [PubMed]
46. Epstein, L.H.; Dearing, K.K.; Roba, L.G.; Finkelstein, E. The influence of taxes and subsidies on energy purchasedin an experimental purchasing study. Psychol. Sci. 2010, 21, 406–414. [CrossRef]
47. Herman, D.R.; Harrison, G.G.; Afifi, A.A.; Jenks, E. Effect of a targeted subsidy on intake of fruits and vegetablesamong low-income women in the Special Supplemental Nutrition Program for Women, Infants, and Children.Am. J. Public Health 2008, 98, 98–105. [CrossRef]
48. Retailer Eligibility-Clarification of Criterion A and Criterion B Requirements. USDA-FNS. Available online:https://www.fns.usda.gov/snap/retailer-eligibility-clarification-of-criterion (accessed on 2 February 2020).
49. Laska, M.N.; Caspi, C.E.; Pelletier, J.E.; Friebur, R.; Harnack, L.J. Lack of healthy food in small-size to mid-sizeretailers participating in the Supplemental Nutrition Assistance Program, Minneapolis-St. Paul, Minnesota, 2014.Prev. Chronic Dis. 2015, 12, E135. [CrossRef]
50. Rigby, S.; Leone, A.F.; Kim, H.; Betterley, C.; Johnson, M.A.; Kurtz, H.; Lee, J.S. Food Deserts in Leon County,FL: Disparate Distribution of Supplemental Nutrition Assistance Program-Accepting Stores by NeighborhoodCharacteristics. J. Nutr. Educ. Behav. 2012, 44, 539–547. [CrossRef]
51. Racine, E.F.; Kennedy, A.; Batada, A.; Story, M. Foods and Beverages Available at SNAP-Authorized Drugstoresin Sections of North Carolina. J. Nutr. Educ. Behav. 2017, 49, 674–683. [CrossRef]
52. Racine, E.F.; Batada, A.; Solomon, C.A.; Story, M. Availability of Foods and Beverages in Supplemental NutritionAssistance Program−Authorized Dollar Stores in a Region of North Carolina. J. Acad. Nutr. Diet. 2016, 116,1613–1620. [CrossRef] [PubMed]
53. Hosler, A.S.; Cong, X. Effect of change in the supplemental nutrition assistance program guidelines on vendorparticipation and availability of fresh produce. Prev. Chronic Dis. 2019, 16, E115. [CrossRef] [PubMed]
54. Oberholtzer, L.; Dimitri, C.; Schumacher, G. Linking Farmers, Healthy Foods, and Underserved Consumers:Exploring the Impact of Nutrition Incentive Programs on Farmers and Farmers’ Markets. J Agric. Food Syst.Community Dev. 2012, 2, 63–77. [CrossRef]
161
Nutrients 2020, 12, 1676
55. Jilcott Pitts, S.B.; Gustafson, A.; Wu, Q.; Mayo, M.L.; Ward, R.K.; McGuirt, J.T.; Rafferty, A.P.; Lancaster, M.F.;Evenson, K.R.; Keyserling, T.C.; et al. Farmers’ market use is associated with fruit and vegetable consumption indiverse southern rural communities. Nutr. J. 2014, 13, 1. [CrossRef]
56. Cohen, A.J.; Lachance, L.L.; Richardson, C.R.; Mahmoudi, E.; Buxbaum, J.D.; Noonan, G.K.; Murphy, E.C.;Roberson, D.N.; Hesterman, O.B.; Heisler, M.; et al. “Doubling Up” on Produce at Detroit Farmers Markets:Patterns and Correlates of Use of a Healthy Food Incentive. Am. J. Prev. Med. 2018, 54, 181–189. [CrossRef]
57. Surveillance of Fruit and Vegetable Intake Using the Behavioral Risk Factor Surveillance System. Availableonline: https://www.cdc.gov/brfss/pdf/fruits_vegetables.pdf (accessed on 23 April 2020).
58. Olsho, L.E.W.; Klerman, J.A.; Wilde, P.E.; Bartlett, S. Financial incentives increase fruit and vegetable intakeamong Supplemental Nutrition Assistance Program participants: A randomized controlled trial of the USDAHealthy Incentives Pilot. Am. J. Clin. Nutr. 2016, 104, 423–435. [CrossRef]
© 2020 by the authors. Licensee MDPI, Basel, Switzerland. This article is an open access articledistributed under the terms and conditions of the Creative Commons Attribution (CC BY)license (http://creativecommons.org/licenses/by/4.0/).
162

MDPISt. Alban-Anlage 66
4052 BaselSwitzerland
Tel. +41 61 683 77 34Fax +41 61 302 89 18
www.mdpi.com
Nutrients Editorial OfficeE-mail: [email protected]
www.mdpi.com/journal/nutrients


MDPI St. Alban-Anlage 66 4052 Basel Switzerland
Tel: +41 61 683 77 34 Fax: +41 61 302 89 18
www.mdpi.com ISBN 978-3-03943-588-3